Maynardville, TN Map & Demographics
Maynardville Map
Maynardville Overview
$23,160
PER CAPITA INCOME
$45,063
AVG FAMILY INCOME
$43,773
AVG HOUSEHOLD INCOME
21.0%
WAGE / INCOME GAP [ % ]
79.0¢/ $1
WAGE / INCOME GAP [ $ ]
$13,721
FAMILY INCOME DEFICIT
0.44
INEQUALITY / GINI INDEX
2,455
TOTAL POPULATION
1,167
MALE POPULATION
1,288
FEMALE POPULATION
90.61
MALES / 100 FEMALES
110.37
FEMALES / 100 MALES
37.3
MEDIAN AGE
2.6
AVG FAMILY SIZE
2.2
AVG HOUSEHOLD SIZE
1,076
LABOR FORCE [ PEOPLE ]
54.5%
PERCENT IN LABOR FORCE
8.4%
UNEMPLOYMENT RATE
Maynardville Zip Codes
Maynardville Area Codes
Income in Maynardville
Income Overview in Maynardville
Per Capita Income in Maynardville is $23,160, while median incomes of families and households are $45,063 and $43,773 respectively.
| Characteristic | Number | Measure |
| Per Capita Income | 2,455 | $23,160 |
| Median Family Income | 654 | $45,063 |
| Mean Family Income | 654 | $58,084 |
| Median Household Income | 1,038 | $43,773 |
| Mean Household Income | 1,038 | $55,120 |
| Income Deficit | 654 | $13,721 |
| Wage / Income Gap (%) | 2,455 | 20.98% |
| Wage / Income Gap ($) | 2,455 | 79.02¢ per $1 |
| Gini / Inequality Index | 2,455 | 0.44 |
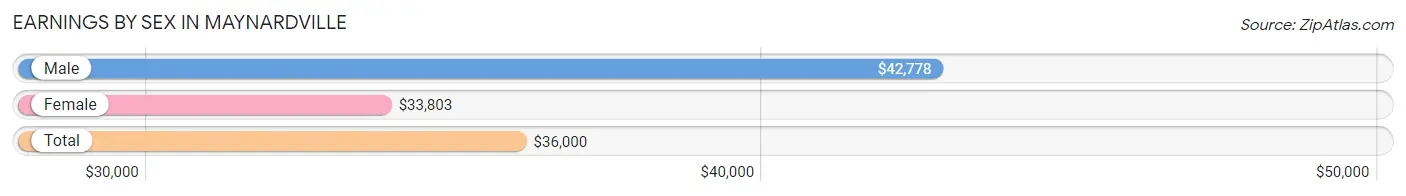
Earnings by Sex in Maynardville
Average Earnings in Maynardville are $36,000, $42,778 for men and $33,803 for women, a difference of 21.0%.
| Sex | Number | Average Earnings |
| Male | 598 (52.8%) | $42,778 |
| Female | 534 (47.2%) | $33,803 |
| Total | 1,132 (100.0%) | $36,000 |
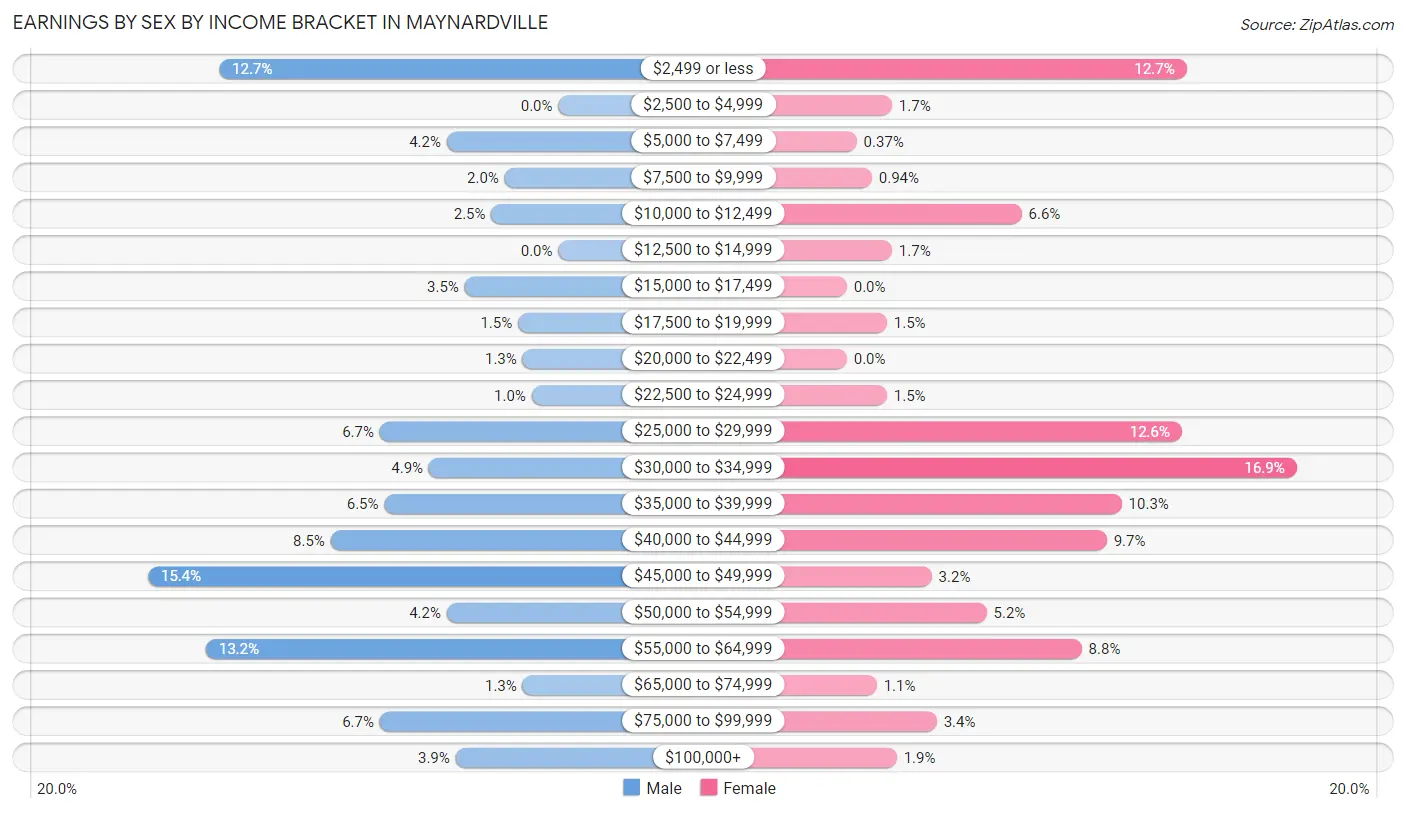
Earnings by Sex by Income Bracket in Maynardville
The most common earnings brackets in Maynardville are $45,000 to $49,999 for men (92 | 15.4%) and $30,000 to $34,999 for women (90 | 16.9%).
| Income | Male | Female |
| $2,499 or less | 76 (12.7%) | 68 (12.7%) |
| $2,500 to $4,999 | 0 (0.0%) | 9 (1.7%) |
| $5,000 to $7,499 | 25 (4.2%) | 2 (0.4%) |
| $7,500 to $9,999 | 12 (2.0%) | 5 (0.9%) |
| $10,000 to $12,499 | 15 (2.5%) | 35 (6.6%) |
| $12,500 to $14,999 | 0 (0.0%) | 9 (1.7%) |
| $15,000 to $17,499 | 21 (3.5%) | 0 (0.0%) |
| $17,500 to $19,999 | 9 (1.5%) | 8 (1.5%) |
| $20,000 to $22,499 | 8 (1.3%) | 0 (0.0%) |
| $22,500 to $24,999 | 6 (1.0%) | 8 (1.5%) |
| $25,000 to $29,999 | 40 (6.7%) | 67 (12.6%) |
| $30,000 to $34,999 | 29 (4.9%) | 90 (16.9%) |
| $35,000 to $39,999 | 39 (6.5%) | 55 (10.3%) |
| $40,000 to $44,999 | 51 (8.5%) | 52 (9.7%) |
| $45,000 to $49,999 | 92 (15.4%) | 17 (3.2%) |
| $50,000 to $54,999 | 25 (4.2%) | 28 (5.2%) |
| $55,000 to $64,999 | 79 (13.2%) | 47 (8.8%) |
| $65,000 to $74,999 | 8 (1.3%) | 6 (1.1%) |
| $75,000 to $99,999 | 40 (6.7%) | 18 (3.4%) |
| $100,000+ | 23 (3.8%) | 10 (1.9%) |
| Total | 598 (100.0%) | 534 (100.0%) |
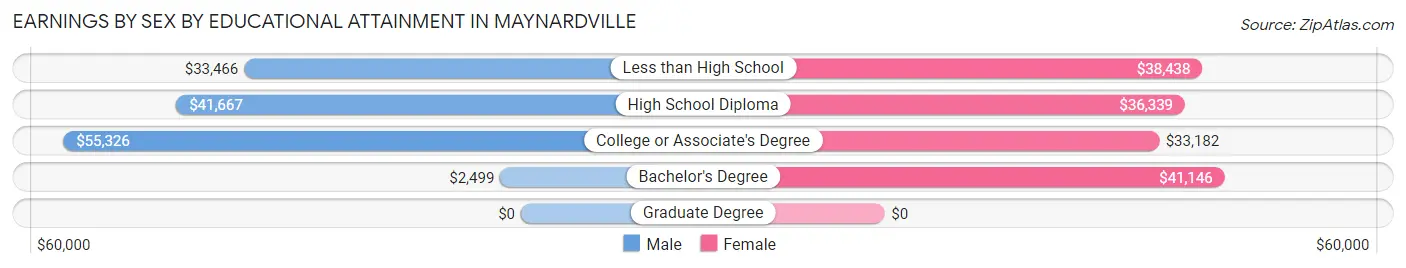
Earnings by Sex by Educational Attainment in Maynardville
Average earnings in Maynardville are $43,900 for men and $35,417 for women, a difference of 19.3%. Men with an educational attainment of college or associate's degree enjoy the highest average annual earnings of $55,326, while those with bachelor's degree education earn the least with $2,499. Women with an educational attainment of bachelor's degree earn the most with the average annual earnings of $41,146, while those with college or associate's degree education have the smallest earnings of $33,182.
| Educational Attainment | Male Income | Female Income |
| Less than High School | $33,466 | $38,438 |
| High School Diploma | $41,667 | $36,339 |
| College or Associate's Degree | $55,326 | $33,182 |
| Bachelor's Degree | $2,499 | $41,146 |
| Graduate Degree | - | - |
| Total | $43,900 | $35,417 |
Family Income in Maynardville
Family Income Brackets in Maynardville
According to the Maynardville family income data, there are 172 families falling into the $35,000 to $49,999 income range, which is the most common income bracket and makes up 26.3% of all families. Conversely, the $150,000 to $199,999 income bracket is the least frequent group with only 11 families (1.7%) belonging to this category.
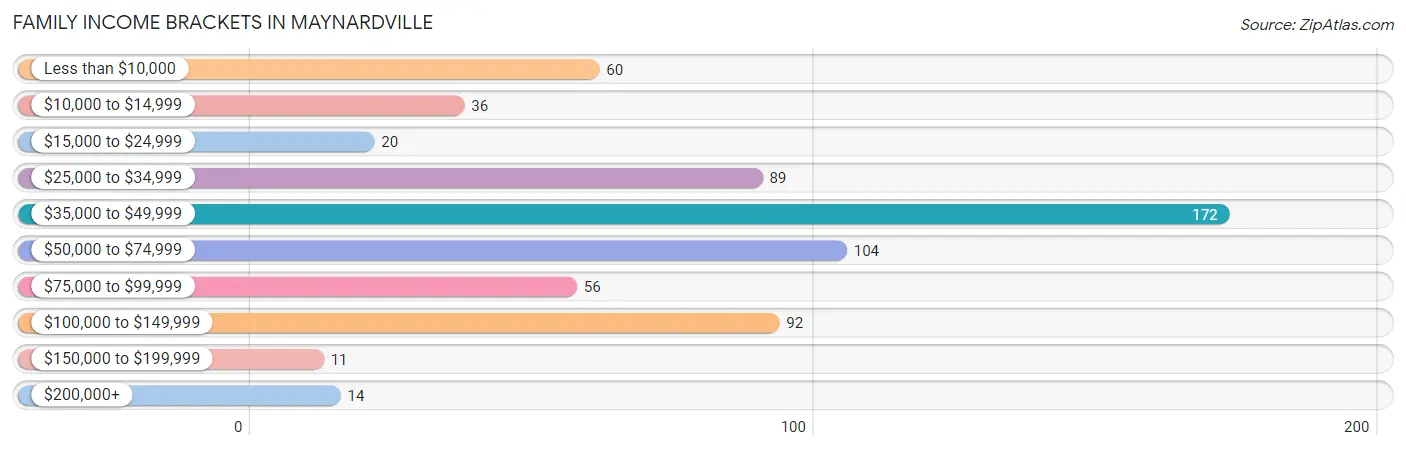
| Income Bracket | # Families | % Families |
| Less than $10,000 | 60 | 9.2% |
| $10,000 to $14,999 | 36 | 5.5% |
| $15,000 to $24,999 | 20 | 3.1% |
| $25,000 to $34,999 | 89 | 13.6% |
| $35,000 to $49,999 | 172 | 26.3% |
| $50,000 to $74,999 | 104 | 15.9% |
| $75,000 to $99,999 | 56 | 8.6% |
| $100,000 to $149,999 | 92 | 14.1% |
| $150,000 to $199,999 | 11 | 1.7% |
| $200,000+ | 14 | 2.1% |
Family Income by Famaliy Size in Maynardville
5-person families (45 | 6.9%) account for the highest median family income in Maynardville with $123,795 per family, while 5-person families (45 | 6.9%) have the highest median income of $24,759 per family member.
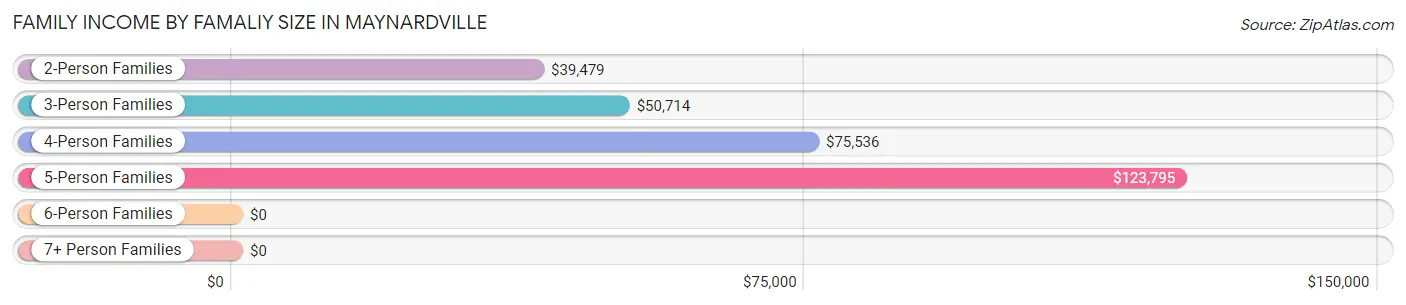
| Income Bracket | # Families | Median Income |
| 2-Person Families | 398 (60.9%) | $39,479 |
| 3-Person Families | 84 (12.8%) | $50,714 |
| 4-Person Families | 117 (17.9%) | $75,536 |
| 5-Person Families | 45 (6.9%) | $123,795 |
| 6-Person Families | 10 (1.5%) | $0 |
| 7+ Person Families | 0 (0.0%) | $0 |
| Total | 654 (100.0%) | $45,063 |
Family Income by Number of Earners in Maynardville
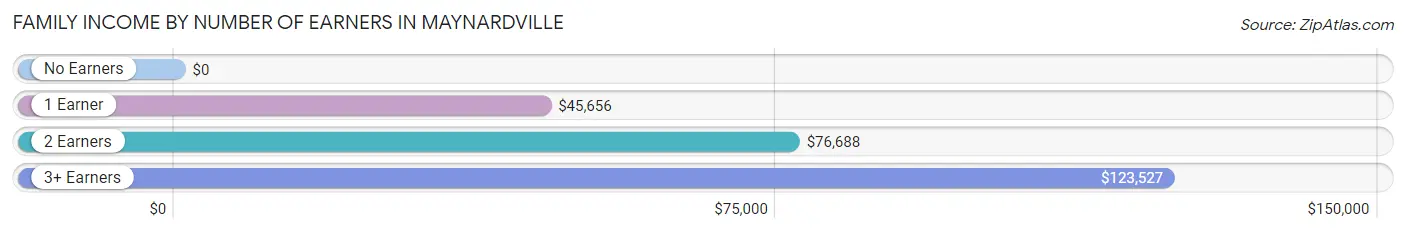
| Number of Earners | # Families | Median Income |
| No Earners | 141 (21.6%) | $0 |
| 1 Earner | 291 (44.5%) | $45,656 |
| 2 Earners | 169 (25.8%) | $76,688 |
| 3+ Earners | 53 (8.1%) | $123,527 |
| Total | 654 (100.0%) | $45,063 |
Household Income in Maynardville
Household Income Brackets in Maynardville
With 230 households falling in the category, the $35,000 to $49,999 income range is the most frequent in Maynardville, accounting for 22.2% of all households. In contrast, only 20 households (1.9%) fall into the $200,000+ income bracket, making it the least populous group.
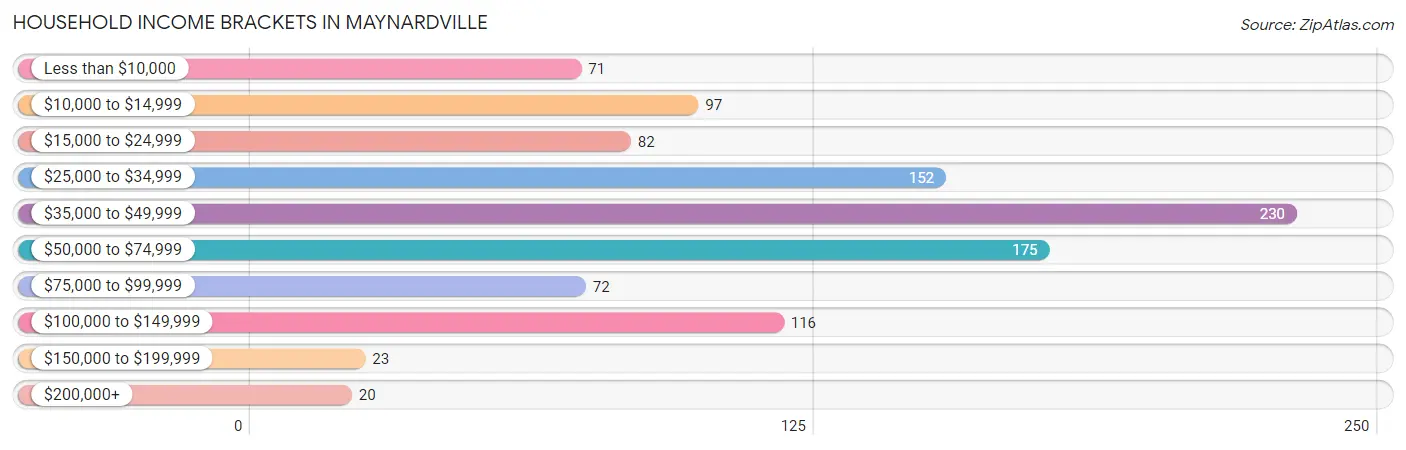
| Income Bracket | # Households | % Households |
| Less than $10,000 | 71 | 6.8% |
| $10,000 to $14,999 | 97 | 9.3% |
| $15,000 to $24,999 | 82 | 7.9% |
| $25,000 to $34,999 | 152 | 14.6% |
| $35,000 to $49,999 | 230 | 22.2% |
| $50,000 to $74,999 | 175 | 16.9% |
| $75,000 to $99,999 | 72 | 6.9% |
| $100,000 to $149,999 | 116 | 11.2% |
| $150,000 to $199,999 | 23 | 2.2% |
| $200,000+ | 20 | 1.9% |
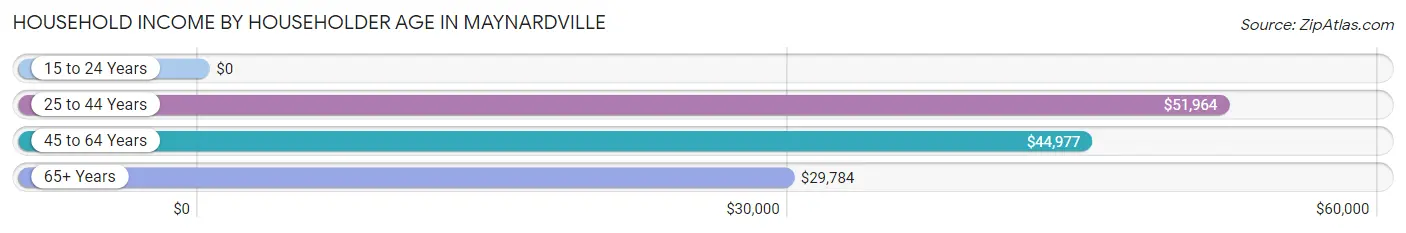
Household Income by Householder Age in Maynardville
The median household income in Maynardville is $43,773, with the highest median household income of $51,964 found in the 25 to 44 years age bracket for the primary householder. A total of 367 households (35.4%) fall into this category. Meanwhile, the 15 to 24 years age bracket for the primary householder has the lowest median household income of $0, with 45 households (4.3%) in this group.
| Income Bracket | # Households | Median Income |
| 15 to 24 Years | 45 (4.3%) | $0 |
| 25 to 44 Years | 367 (35.4%) | $51,964 |
| 45 to 64 Years | 427 (41.1%) | $44,977 |
| 65+ Years | 199 (19.2%) | $29,784 |
| Total | 1,038 (100.0%) | $43,773 |
Poverty in Maynardville
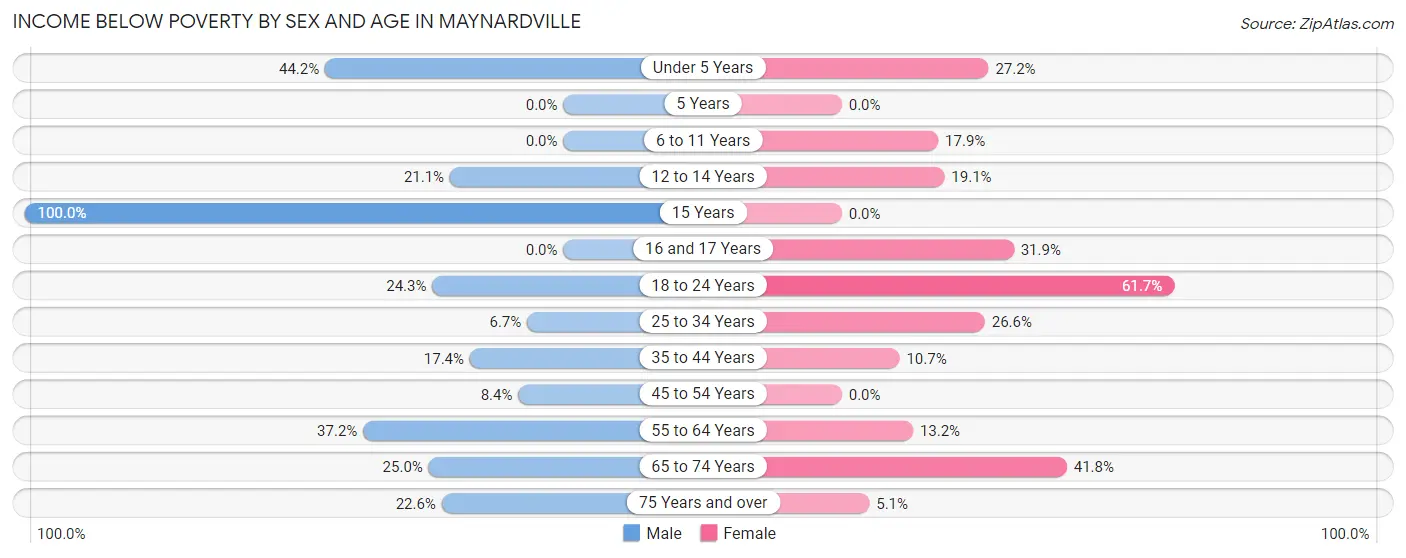
Income Below Poverty by Sex and Age in Maynardville
With 20.1% poverty level for males and 21.3% for females among the residents of Maynardville, 15 year old males and 18 to 24 year old females are the most vulnerable to poverty, with 10 males (100.0%) and 37 females (61.7%) in their respective age groups living below the poverty level.
| Age Bracket | Male | Female |
| Under 5 Years | 23 (44.2%) | 43 (27.2%) |
| 5 Years | 0 (0.0%) | 0 (0.0%) |
| 6 to 11 Years | 0 (0.0%) | 17 (17.9%) |
| 12 to 14 Years | 4 (21.0%) | 4 (19.1%) |
| 15 Years | 10 (100.0%) | 0 (0.0%) |
| 16 and 17 Years | 0 (0.0%) | 15 (31.9%) |
| 18 to 24 Years | 18 (24.3%) | 37 (61.7%) |
| 25 to 34 Years | 15 (6.7%) | 73 (26.6%) |
| 35 to 44 Years | 17 (17.3%) | 9 (10.7%) |
| 45 to 54 Years | 18 (8.4%) | 0 (0.0%) |
| 55 to 64 Years | 81 (37.2%) | 21 (13.2%) |
| 65 to 74 Years | 9 (25.0%) | 33 (41.8%) |
| 75 Years and over | 7 (22.6%) | 5 (5.1%) |
| Total | 202 (20.1%) | 257 (21.3%) |
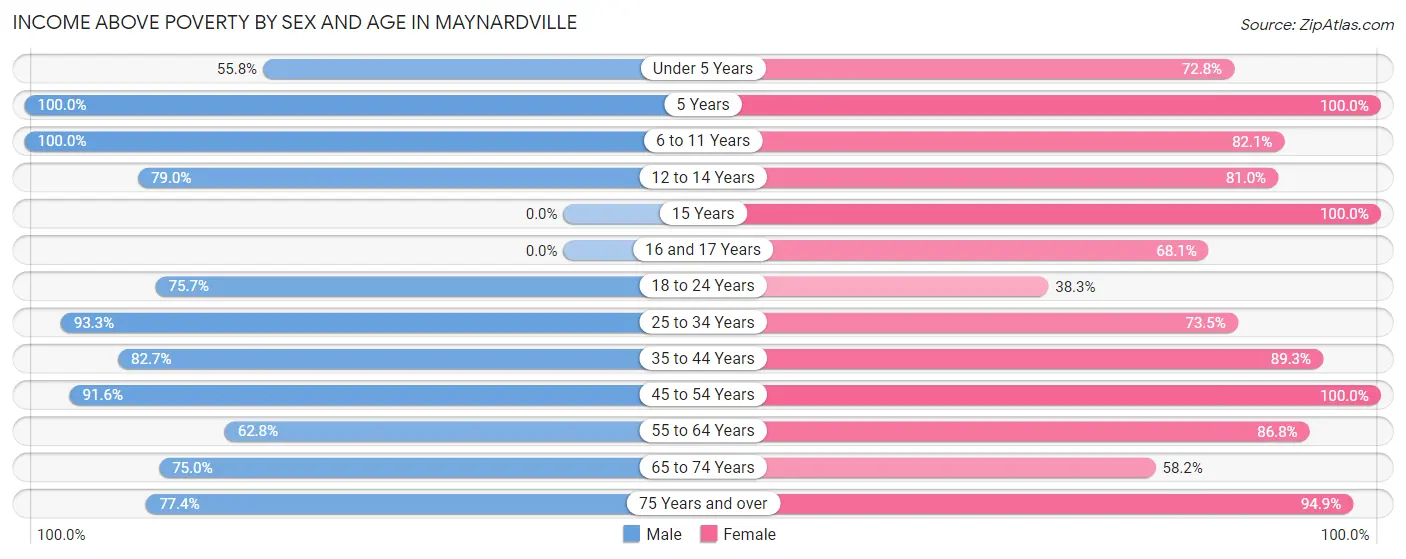
Income Above Poverty by Sex and Age in Maynardville
According to the poverty statistics in Maynardville, males aged 5 years and females aged 5 years are the age groups that are most secure financially, with 100.0% of males and 100.0% of females in these age groups living above the poverty line.
| Age Bracket | Male | Female |
| Under 5 Years | 29 (55.8%) | 115 (72.8%) |
| 5 Years | 6 (100.0%) | 17 (100.0%) |
| 6 to 11 Years | 24 (100.0%) | 78 (82.1%) |
| 12 to 14 Years | 15 (78.9%) | 17 (80.9%) |
| 15 Years | 0 (0.0%) | 9 (100.0%) |
| 16 and 17 Years | 0 (0.0%) | 32 (68.1%) |
| 18 to 24 Years | 56 (75.7%) | 23 (38.3%) |
| 25 to 34 Years | 208 (93.3%) | 202 (73.5%) |
| 35 to 44 Years | 81 (82.7%) | 75 (89.3%) |
| 45 to 54 Years | 197 (91.6%) | 107 (100.0%) |
| 55 to 64 Years | 137 (62.8%) | 138 (86.8%) |
| 65 to 74 Years | 27 (75.0%) | 46 (58.2%) |
| 75 Years and over | 24 (77.4%) | 93 (94.9%) |
| Total | 804 (79.9%) | 952 (78.7%) |
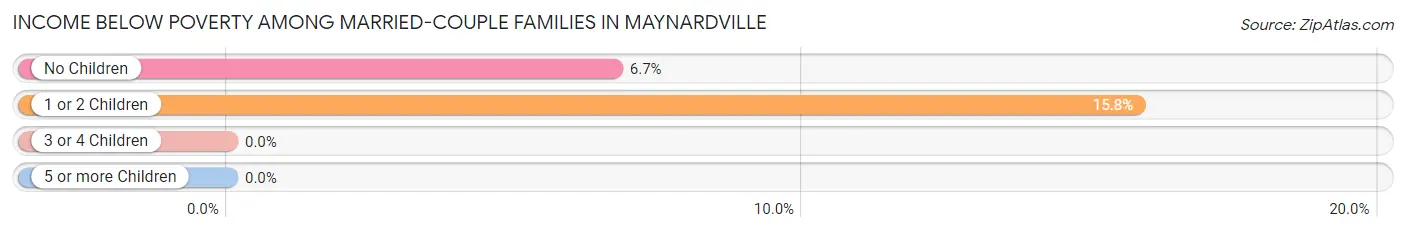
Income Below Poverty Among Married-Couple Families in Maynardville
The poverty statistics for married-couple families in Maynardville show that 9.5% or 39 of the total 412 families live below the poverty line. Families with 1 or 2 children have the highest poverty rate of 15.8%, comprising of 24 families. On the other hand, families with 3 or 4 children have the lowest poverty rate of 0.0%, which includes 0 families.
| Children | Above Poverty | Below Poverty |
| No Children | 209 (93.3%) | 15 (6.7%) |
| 1 or 2 Children | 128 (84.2%) | 24 (15.8%) |
| 3 or 4 Children | 36 (100.0%) | 0 (0.0%) |
| 5 or more Children | 0 (0.0%) | 0 (0.0%) |
| Total | 373 (90.5%) | 39 (9.5%) |
Income Below Poverty Among Single-Parent Households in Maynardville
According to the poverty data in Maynardville, 39.2% or 40 single-father households and 32.1% or 45 single-mother households are living below the poverty line. Among single-father households, those with 1 or 2 children have the highest poverty rate, with 24 households (50.0%) experiencing poverty. Likewise, among single-mother households, those with 3 or 4 children have the highest poverty rate, with 33 households (100.0%) falling below the poverty line.
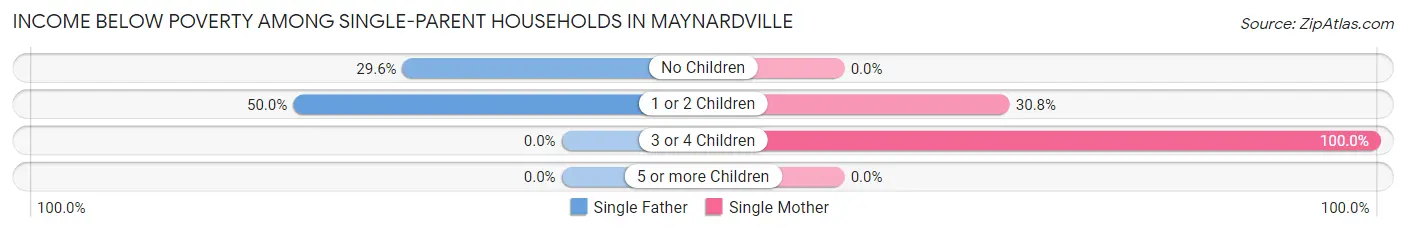
| Children | Single Father | Single Mother |
| No Children | 16 (29.6%) | 0 (0.0%) |
| 1 or 2 Children | 24 (50.0%) | 12 (30.8%) |
| 3 or 4 Children | 0 (0.0%) | 33 (100.0%) |
| 5 or more Children | 0 (0.0%) | 0 (0.0%) |
| Total | 40 (39.2%) | 45 (32.1%) |
Income Below Poverty Among Married-Couple vs Single-Parent Households in Maynardville
The poverty data for Maynardville shows that 39 of the married-couple family households (9.5%) and 85 of the single-parent households (35.1%) are living below the poverty level. Within the married-couple family households, those with 1 or 2 children have the highest poverty rate, with 24 households (15.8%) falling below the poverty line. Among the single-parent households, those with 3 or 4 children have the highest poverty rate, with 33 household (100.0%) living below poverty.
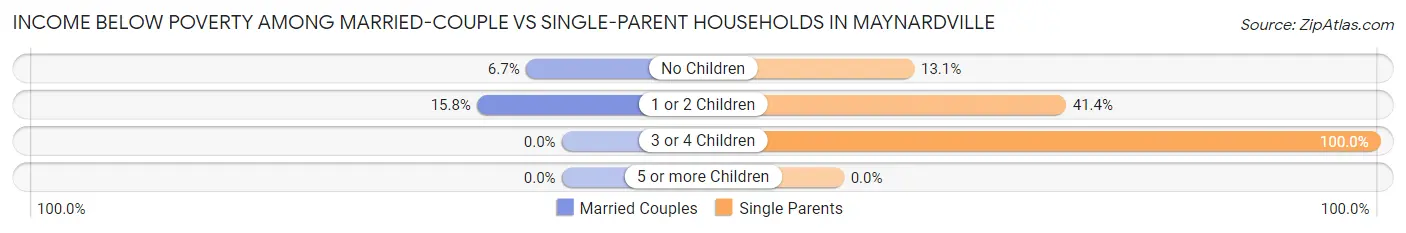
| Children | Married-Couple Families | Single-Parent Households |
| No Children | 15 (6.7%) | 16 (13.1%) |
| 1 or 2 Children | 24 (15.8%) | 36 (41.4%) |
| 3 or 4 Children | 0 (0.0%) | 33 (100.0%) |
| 5 or more Children | 0 (0.0%) | 0 (0.0%) |
| Total | 39 (9.5%) | 85 (35.1%) |
Race in Maynardville
The most populous races in Maynardville are White / Caucasian (2,387 | 97.2%), Two or more Races (36 | 1.5%), and Black / African American (31 | 1.3%).
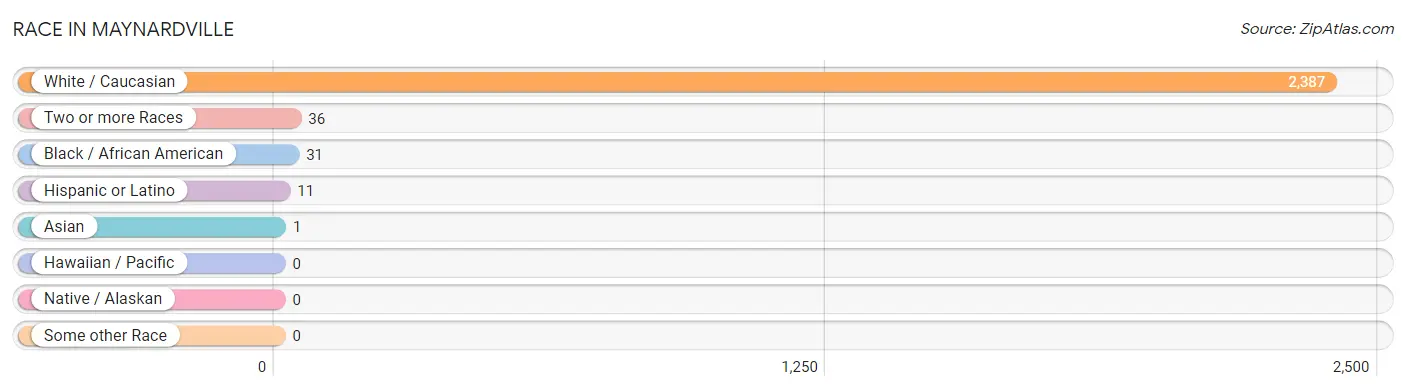
| Race | # Population | % Population |
| Asian | 1 | 0.0% |
| Black / African American | 31 | 1.3% |
| Hawaiian / Pacific | 0 | 0.0% |
| Hispanic or Latino | 11 | 0.4% |
| Native / Alaskan | 0 | 0.0% |
| White / Caucasian | 2,387 | 97.2% |
| Two or more Races | 36 | 1.5% |
| Some other Race | 0 | 0.0% |
| Total | 2,455 | 100.0% |
Ancestry in Maynardville
The most populous ancestries reported in Maynardville are American (317 | 12.9%), Irish (219 | 8.9%), English (213 | 8.7%), German (196 | 8.0%), and Scottish (96 | 3.9%), together accounting for 42.4% of all Maynardville residents.
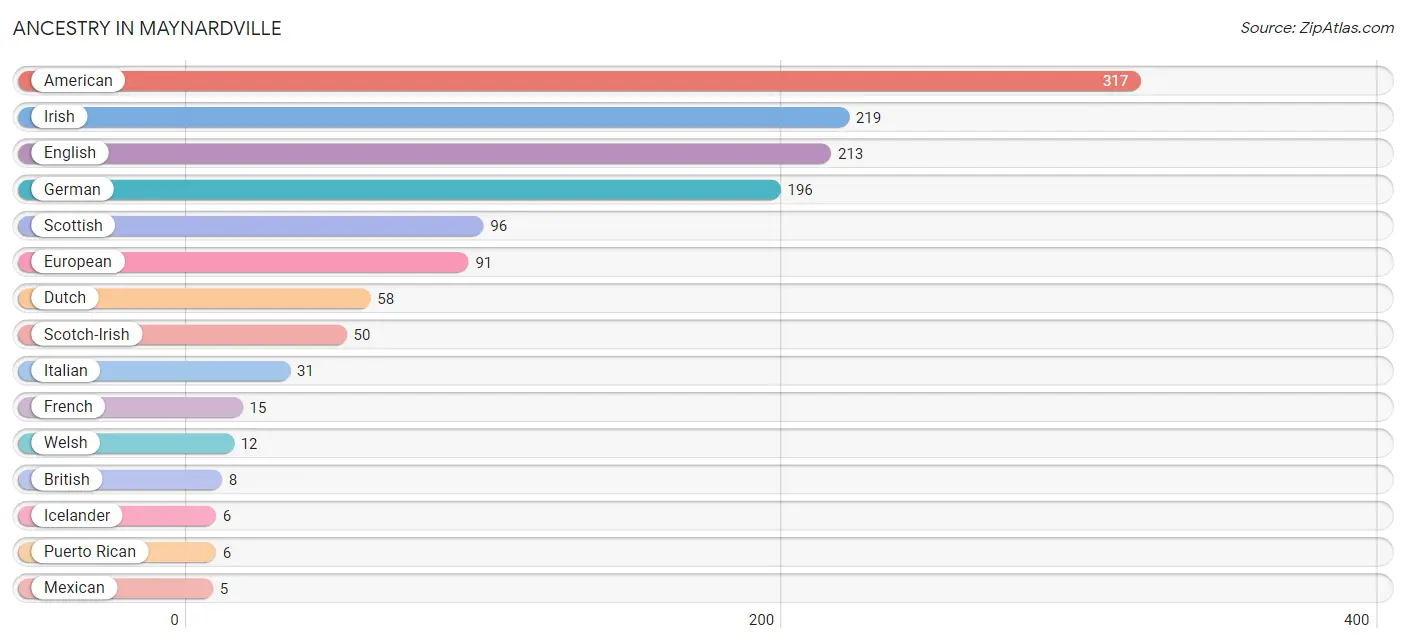
| Ancestry | # Population | % Population |
| African | 4 | 0.2% |
| American | 317 | 12.9% |
| British | 8 | 0.3% |
| Dutch | 58 | 2.4% |
| English | 213 | 8.7% |
| European | 91 | 3.7% |
| French | 15 | 0.6% |
| German | 196 | 8.0% |
| Icelander | 6 | 0.2% |
| Irish | 219 | 8.9% |
| Italian | 31 | 1.3% |
| Mexican | 5 | 0.2% |
| Puerto Rican | 6 | 0.2% |
| Scotch-Irish | 50 | 2.0% |
| Scottish | 96 | 3.9% |
| Subsaharan African | 4 | 0.2% |
| Thai | 1 | 0.0% |
| Welsh | 12 | 0.5% | View All 18 Rows |
Immigrants in Maynardville
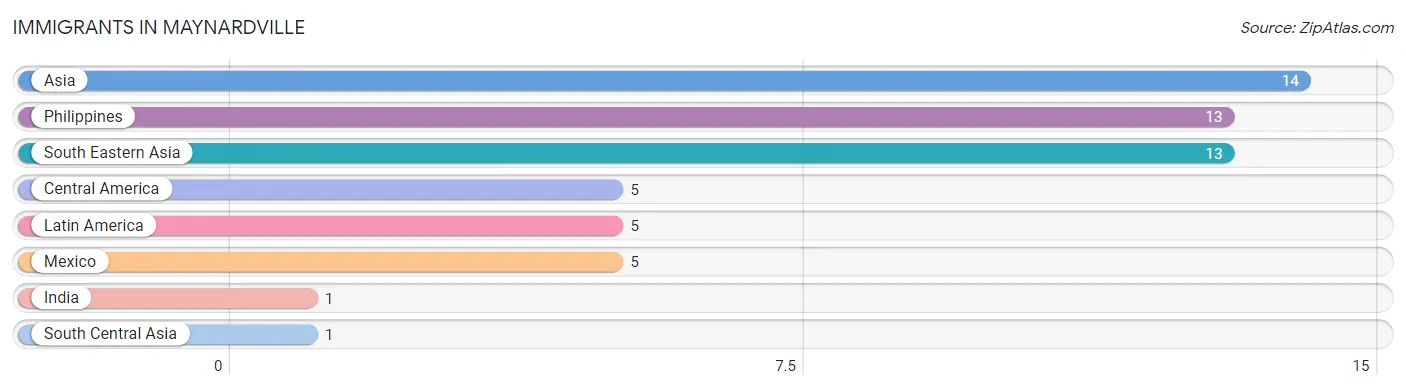
The most numerous immigrant groups reported in Maynardville came from Asia (14 | 0.6%), Philippines (13 | 0.5%), South Eastern Asia (13 | 0.5%), Central America (5 | 0.2%), and Latin America (5 | 0.2%), together accounting for 2.0% of all Maynardville residents.
| Immigration Origin | # Population | % Population |
| Asia | 14 | 0.6% |
| Central America | 5 | 0.2% |
| India | 1 | 0.0% |
| Latin America | 5 | 0.2% |
| Mexico | 5 | 0.2% |
| Philippines | 13 | 0.5% |
| South Central Asia | 1 | 0.0% |
| South Eastern Asia | 13 | 0.5% | View All 8 Rows |
Sex and Age in Maynardville
Sex and Age in Maynardville
The most populous age groups in Maynardville are 25 to 29 Years (160 | 13.7%) for men and Under 5 Years (172 | 13.4%) for women.
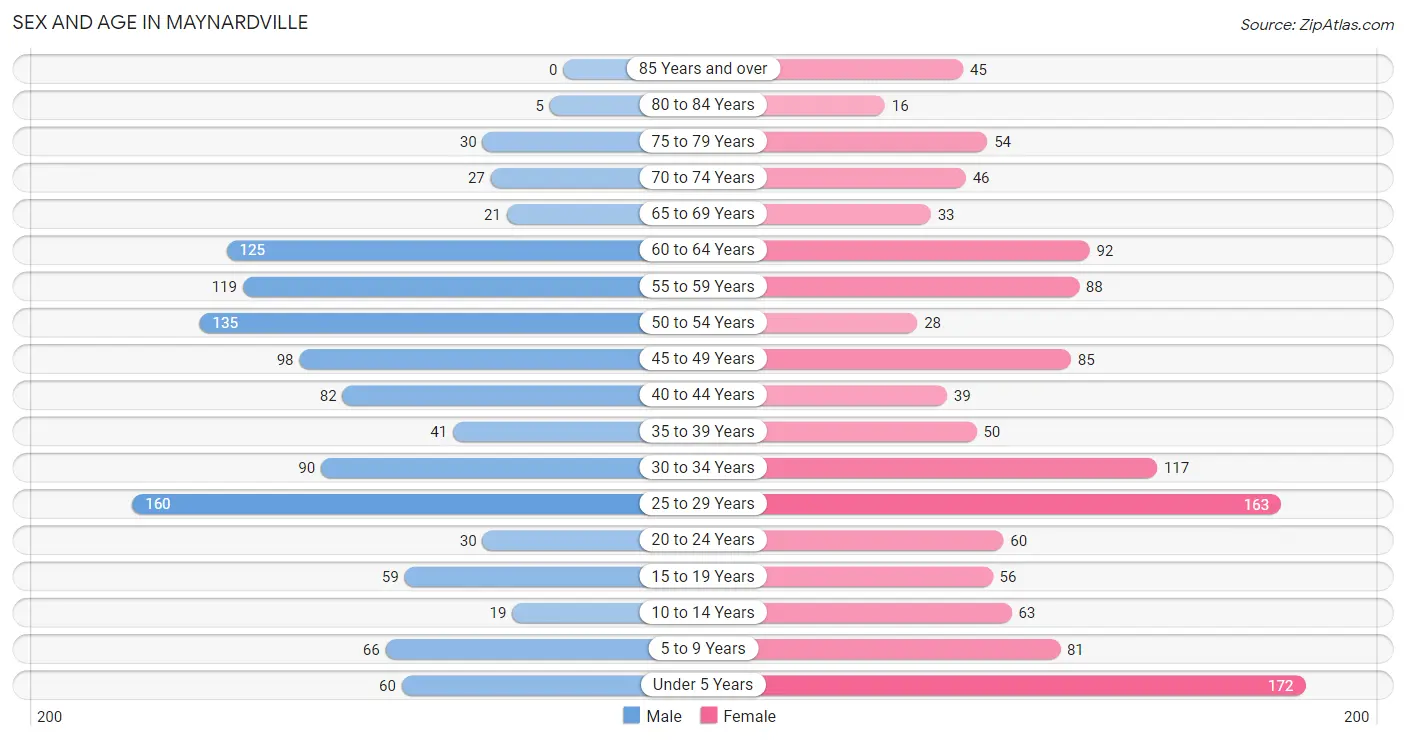
| Age Bracket | Male | Female |
| Under 5 Years | 60 (5.1%) | 172 (13.4%) |
| 5 to 9 Years | 66 (5.7%) | 81 (6.3%) |
| 10 to 14 Years | 19 (1.6%) | 63 (4.9%) |
| 15 to 19 Years | 59 (5.1%) | 56 (4.3%) |
| 20 to 24 Years | 30 (2.6%) | 60 (4.7%) |
| 25 to 29 Years | 160 (13.7%) | 163 (12.7%) |
| 30 to 34 Years | 90 (7.7%) | 117 (9.1%) |
| 35 to 39 Years | 41 (3.5%) | 50 (3.9%) |
| 40 to 44 Years | 82 (7.0%) | 39 (3.0%) |
| 45 to 49 Years | 98 (8.4%) | 85 (6.6%) |
| 50 to 54 Years | 135 (11.6%) | 28 (2.2%) |
| 55 to 59 Years | 119 (10.2%) | 88 (6.8%) |
| 60 to 64 Years | 125 (10.7%) | 92 (7.1%) |
| 65 to 69 Years | 21 (1.8%) | 33 (2.6%) |
| 70 to 74 Years | 27 (2.3%) | 46 (3.6%) |
| 75 to 79 Years | 30 (2.6%) | 54 (4.2%) |
| 80 to 84 Years | 5 (0.4%) | 16 (1.2%) |
| 85 Years and over | 0 (0.0%) | 45 (3.5%) |
| Total | 1,167 (100.0%) | 1,288 (100.0%) |
Families and Households in Maynardville
Median Family Size in Maynardville
The median family size in Maynardville is 2.64 persons per family, with married-couple families (412 | 63.0%) accounting for the largest median family size of 3.03 persons per family. On the other hand, single male/father families (102 | 15.6%) represent the smallest median family size with 1.80 persons per family.
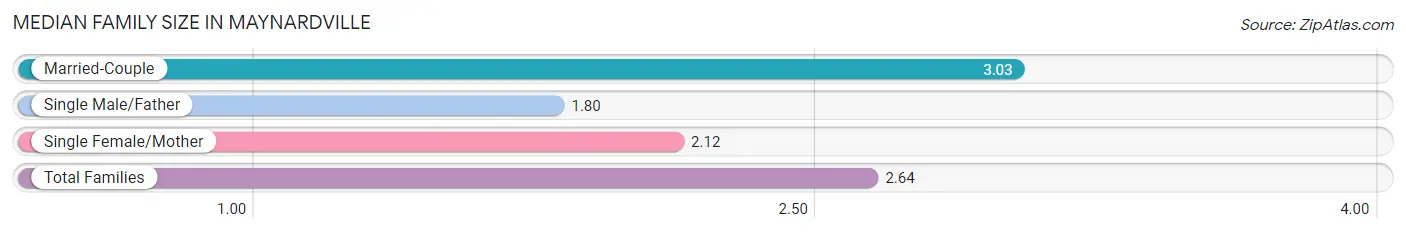
| Family Type | # Families | Family Size |
| Married-Couple | 412 (63.0%) | 3.03 |
| Single Male/Father | 102 (15.6%) | 1.80 |
| Single Female/Mother | 140 (21.4%) | 2.12 |
| Total Families | 654 (100.0%) | 2.64 |
Median Household Size in Maynardville
The median household size in Maynardville is 2.20 persons per household, with married-couple households (412 | 39.7%) accounting for the largest median household size of 3.03 persons per household. non-family households (384 | 37.0%) represent the smallest median household size with 1.34 persons per household.
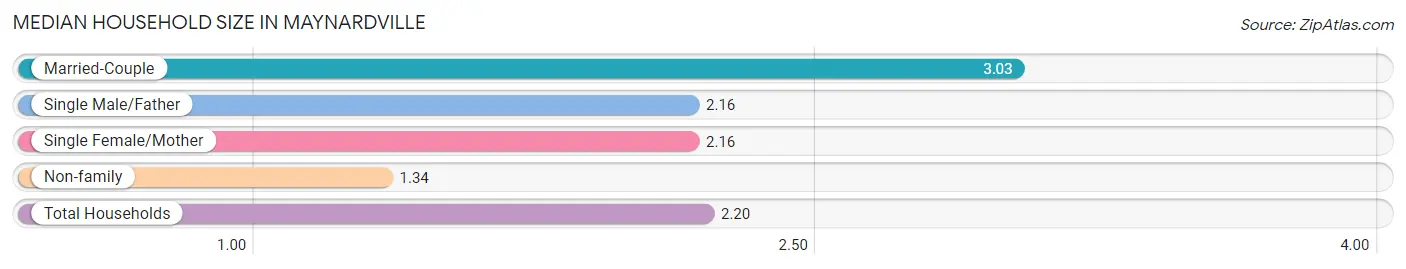
| Household Type | # Households | Household Size |
| Married-Couple | 412 (39.7%) | 3.03 |
| Single Male/Father | 102 (9.8%) | 2.16 |
| Single Female/Mother | 140 (13.5%) | 2.16 |
| Non-family | 384 (37.0%) | 1.34 |
| Total Households | 1,038 (100.0%) | 2.20 |
Household Size by Marriage Status in Maynardville
Out of a total of 1,038 households in Maynardville, 654 (63.0%) are family households, while 384 (37.0%) are nonfamily households. The most numerous type of family households are 2-person households, comprising 374, and the most common type of nonfamily households are 1-person households, comprising 297.
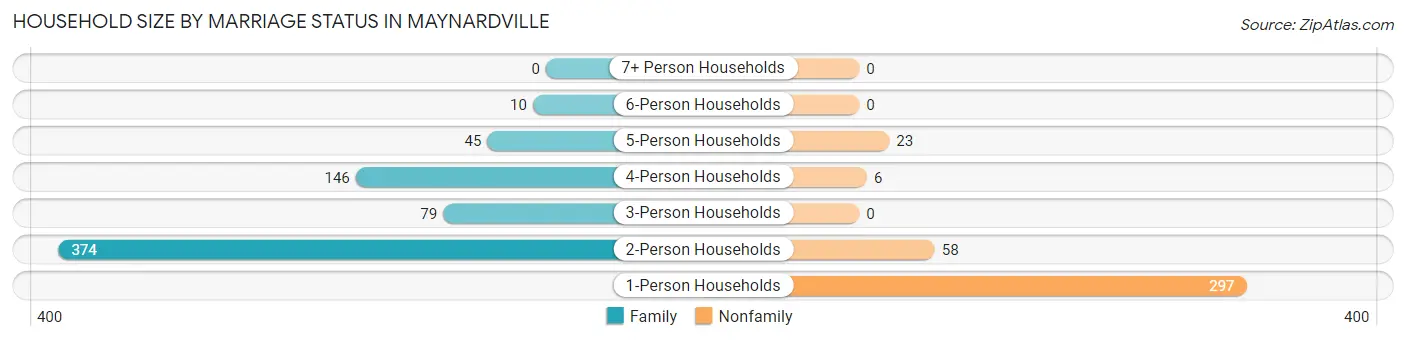
| Household Size | Family Households | Nonfamily Households |
| 1-Person Households | - | 297 (28.6%) |
| 2-Person Households | 374 (36.0%) | 58 (5.6%) |
| 3-Person Households | 79 (7.6%) | 0 (0.0%) |
| 4-Person Households | 146 (14.1%) | 6 (0.6%) |
| 5-Person Households | 45 (4.3%) | 23 (2.2%) |
| 6-Person Households | 10 (1.0%) | 0 (0.0%) |
| 7+ Person Households | 0 (0.0%) | 0 (0.0%) |
| Total | 654 (63.0%) | 384 (37.0%) |
Female Fertility in Maynardville
Fertility by Age in Maynardville
Average fertility rate in Maynardville is 151.0 births per 1,000 women. Women in the age bracket of 20 to 34 years have the highest fertility rate with 253.0 births per 1,000 women. Women in the age bracket of 20 to 34 years acount for 100.0% of all women with births.
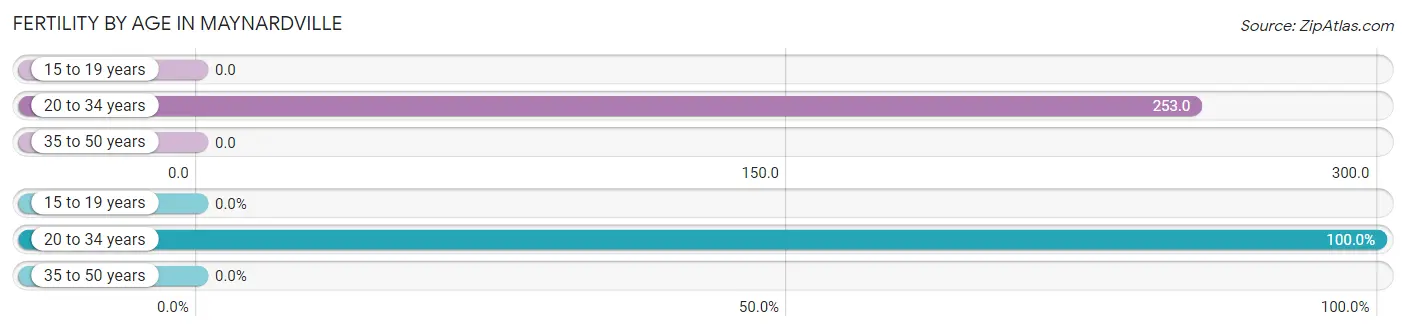
| Age Bracket | Women with Births | Births / 1,000 Women |
| 15 to 19 years | 0 (0.0%) | 0.0 |
| 20 to 34 years | 86 (100.0%) | 253.0 |
| 35 to 50 years | 0 (0.0%) | 0.0 |
| Total | 86 (100.0%) | 151.0 |
Fertility by Age by Marriage Status in Maynardville
50.0% of women with births (86) in Maynardville are married. The highest percentage of unmarried women with births falls into 20 to 34 years age bracket with 50.0% of them unmarried at the time of birth, while the lowest percentage of unmarried women with births belong to 20 to 34 years age bracket with 50.0% of them unmarried.
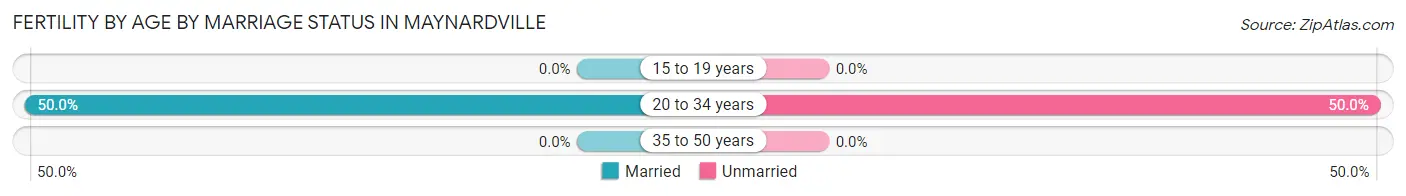
| Age Bracket | Married | Unmarried |
| 15 to 19 years | 0 (0.0%) | 0 (0.0%) |
| 20 to 34 years | 43 (50.0%) | 43 (50.0%) |
| 35 to 50 years | 0 (0.0%) | 0 (0.0%) |
| Total | 43 (50.0%) | 43 (50.0%) |
Fertility by Education in Maynardville
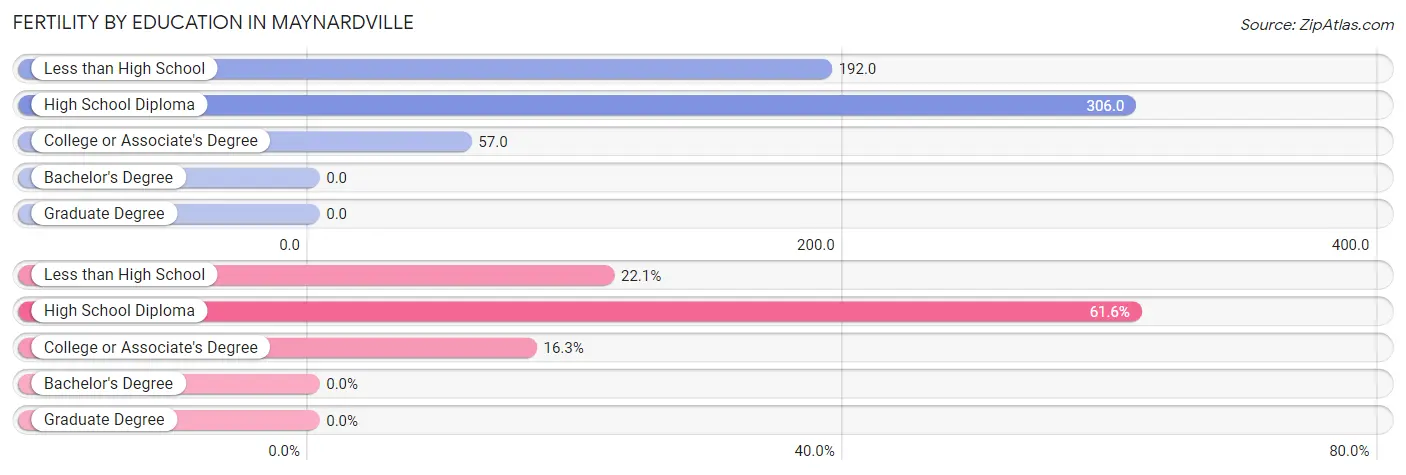
| Educational Attainment | Women with Births | Births / 1,000 Women |
| Less than High School | 19 (22.1%) | 192.0 |
| High School Diploma | 53 (61.6%) | 306.0 |
| College or Associate's Degree | 14 (16.3%) | 57.0 |
| Bachelor's Degree | 0 (0.0%) | 0.0 |
| Graduate Degree | 0 (0.0%) | 0.0 |
| Total | 86 (100.0%) | 151.0 |
Fertility by Education by Marriage Status in Maynardville
50.0% of women with births in Maynardville are unmarried. Women with the educational attainment of college or associate's degree are most likely to be married with 100.0% of them married at childbirth, while women with the educational attainment of less than high school are least likely to be married with 100.0% of them unmarried at childbirth.
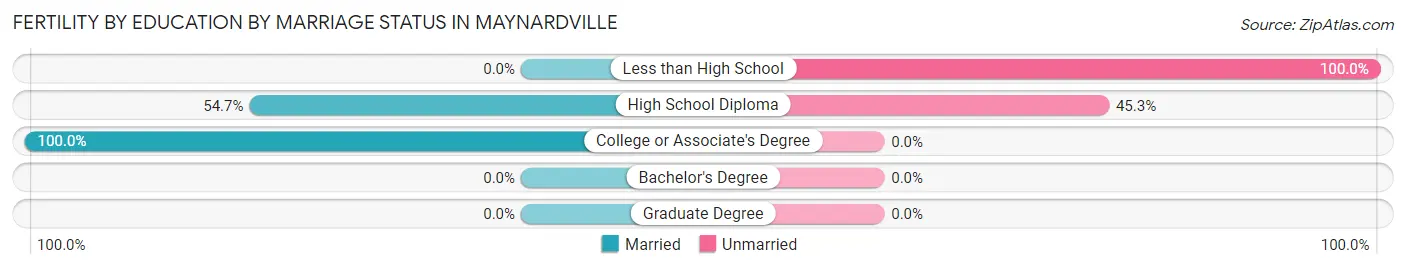
| Educational Attainment | Married | Unmarried |
| Less than High School | 0 (0.0%) | 19 (100.0%) |
| High School Diploma | 29 (54.7%) | 24 (45.3%) |
| College or Associate's Degree | 14 (100.0%) | 0 (0.0%) |
| Bachelor's Degree | 0 (0.0%) | 0 (0.0%) |
| Graduate Degree | 0 (0.0%) | 0 (0.0%) |
| Total | 43 (50.0%) | 43 (50.0%) |
Employment Characteristics in Maynardville
Employment by Class of Employer in Maynardville
Among the 981 employed individuals in Maynardville, private company employees (780 | 79.5%), self-employed (not incorporated) (77 | 7.9%), and local government employees (54 | 5.5%) make up the most common classes of employment.
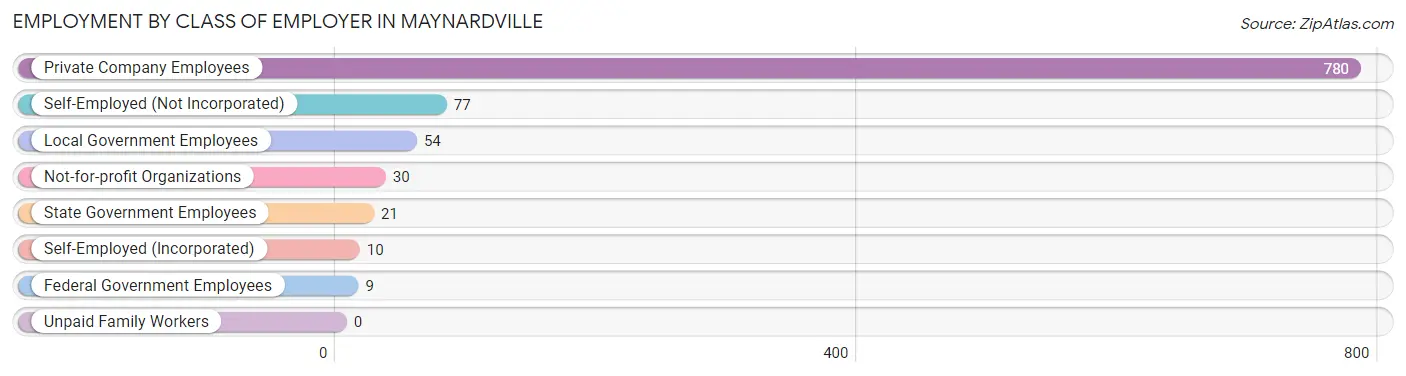
| Employer Class | # Employees | % Employees |
| Private Company Employees | 780 | 79.5% |
| Self-Employed (Incorporated) | 10 | 1.0% |
| Self-Employed (Not Incorporated) | 77 | 7.9% |
| Not-for-profit Organizations | 30 | 3.1% |
| Local Government Employees | 54 | 5.5% |
| State Government Employees | 21 | 2.1% |
| Federal Government Employees | 9 | 0.9% |
| Unpaid Family Workers | 0 | 0.0% |
| Total | 981 | 100.0% |
Employment Status by Age in Maynardville
According to the labor force statistics for Maynardville, out of the total population over 16 years of age (1,975), 54.5% or 1,076 individuals are in the labor force, with 8.4% or 90 of them unemployed. The age group with the highest labor force participation rate is 25 to 29 years, with 83.3% or 269 individuals in the labor force. Within the labor force, the 75 years and over age range has the highest percentage of unemployed individuals, with 48.0% or 12 of them being unemployed.
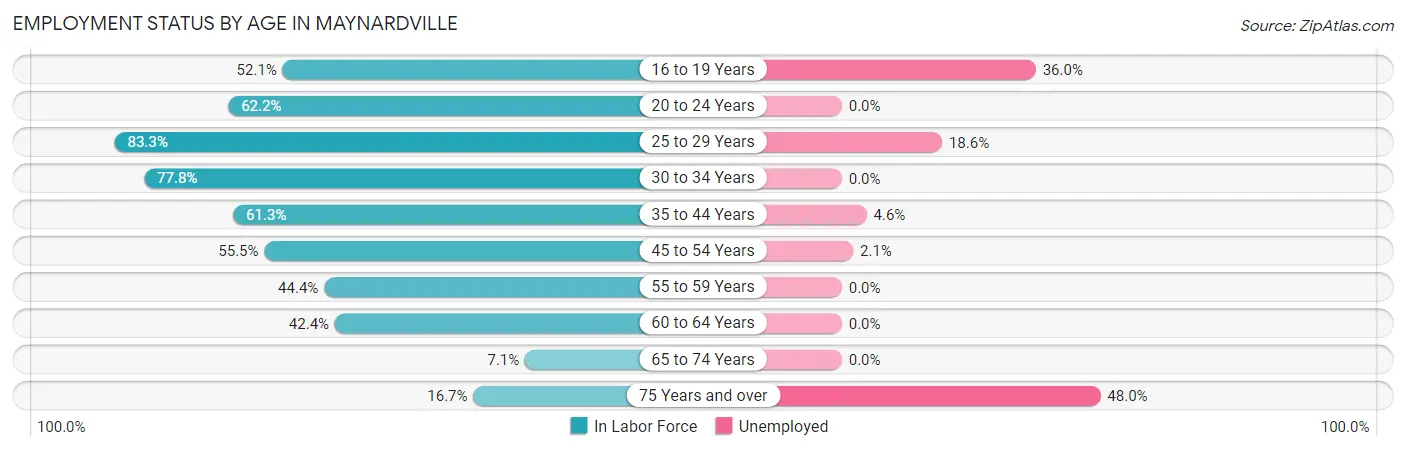
| Age Bracket | In Labor Force | Unemployed |
| 16 to 19 Years | 50 (52.1%) | 18 (36.0%) |
| 20 to 24 Years | 56 (62.2%) | 0 (0.0%) |
| 25 to 29 Years | 269 (83.3%) | 50 (18.6%) |
| 30 to 34 Years | 161 (77.8%) | 0 (0.0%) |
| 35 to 44 Years | 130 (61.3%) | 6 (4.6%) |
| 45 to 54 Years | 192 (55.5%) | 4 (2.1%) |
| 55 to 59 Years | 92 (44.4%) | 0 (0.0%) |
| 60 to 64 Years | 92 (42.4%) | 0 (0.0%) |
| 65 to 74 Years | 9 (7.1%) | 0 (0.0%) |
| 75 Years and over | 25 (16.7%) | 12 (48.0%) |
| Total | 1,076 (54.5%) | 90 (8.4%) |
Employment Status by Educational Attainment in Maynardville
According to labor force statistics for Maynardville, 61.9% of individuals (936) out of the total population between 25 and 64 years of age (1,512) are in the labor force, with 6.4% or 60 of them being unemployed. The group with the highest labor force participation rate are those with the educational attainment of bachelor's degree or higher, with 83.9% or 120 individuals in the labor force. Within the labor force, individuals with college / associate degree education have the highest percentage of unemployment, with 13.5% or 44 of them being unemployed.
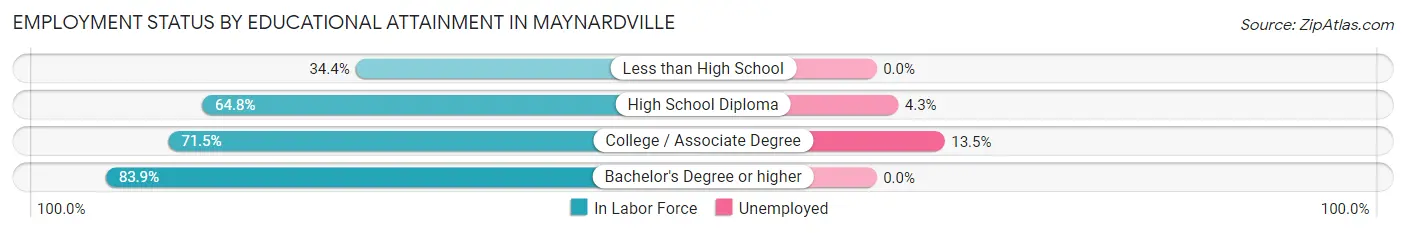
| Educational Attainment | In Labor Force | Unemployed |
| Less than High School | 115 (34.4%) | 0 (0.0%) |
| High School Diploma | 375 (64.8%) | 25 (4.3%) |
| College / Associate Degree | 326 (71.5%) | 62 (13.5%) |
| Bachelor's Degree or higher | 120 (83.9%) | 0 (0.0%) |
| Total | 936 (61.9%) | 97 (6.4%) |
Employment Occupations by Sex in Maynardville
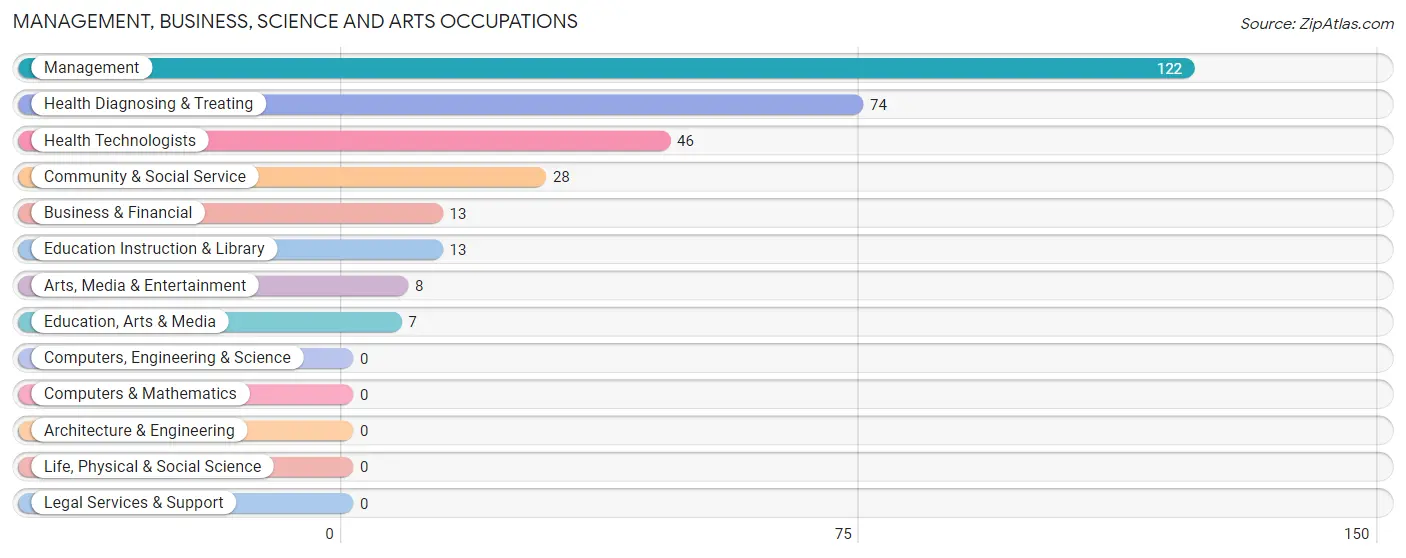
Management, Business, Science and Arts Occupations
The most common Management, Business, Science and Arts occupations in Maynardville are Management (122 | 12.4%), Health Diagnosing & Treating (74 | 7.5%), Health Technologists (46 | 4.7%), Community & Social Service (28 | 2.8%), and Business & Financial (13 | 1.3%).
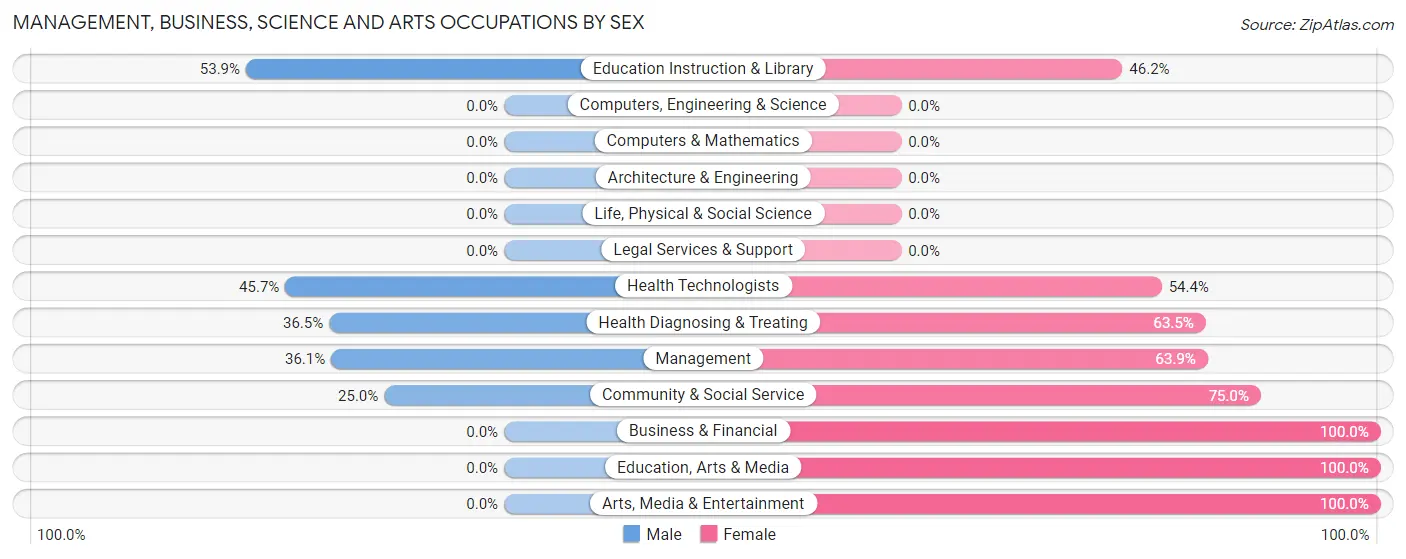
Management, Business, Science and Arts Occupations by Sex
Within the Management, Business, Science and Arts occupations in Maynardville, the most male-oriented occupations are Education Instruction & Library (53.8%), Health Technologists (45.7%), and Health Diagnosing & Treating (36.5%), while the most female-oriented occupations are Business & Financial (100.0%), Education, Arts & Media (100.0%), and Arts, Media & Entertainment (100.0%).
| Occupation | Male | Female |
| Management | 44 (36.1%) | 78 (63.9%) |
| Business & Financial | 0 (0.0%) | 13 (100.0%) |
| Computers, Engineering & Science | 0 (0.0%) | 0 (0.0%) |
| Computers & Mathematics | 0 (0.0%) | 0 (0.0%) |
| Architecture & Engineering | 0 (0.0%) | 0 (0.0%) |
| Life, Physical & Social Science | 0 (0.0%) | 0 (0.0%) |
| Community & Social Service | 7 (25.0%) | 21 (75.0%) |
| Education, Arts & Media | 0 (0.0%) | 7 (100.0%) |
| Legal Services & Support | 0 (0.0%) | 0 (0.0%) |
| Education Instruction & Library | 7 (53.8%) | 6 (46.2%) |
| Arts, Media & Entertainment | 0 (0.0%) | 8 (100.0%) |
| Health Diagnosing & Treating | 27 (36.5%) | 47 (63.5%) |
| Health Technologists | 21 (45.7%) | 25 (54.3%) |
| Total (Category) | 78 (32.9%) | 159 (67.1%) |
| Total (Overall) | 538 (54.6%) | 448 (45.4%) |
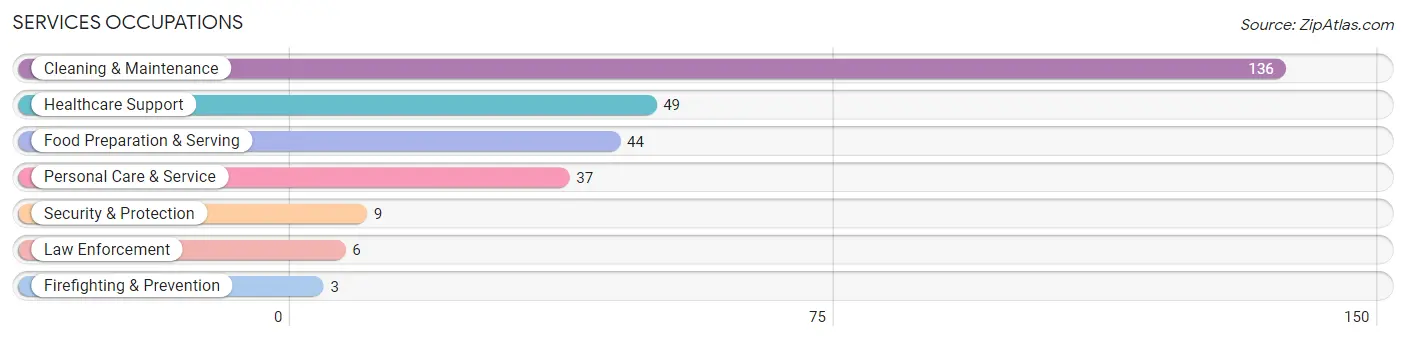
Services Occupations
The most common Services occupations in Maynardville are Cleaning & Maintenance (136 | 13.8%), Healthcare Support (49 | 5.0%), Food Preparation & Serving (44 | 4.5%), Personal Care & Service (37 | 3.7%), and Security & Protection (9 | 0.9%).
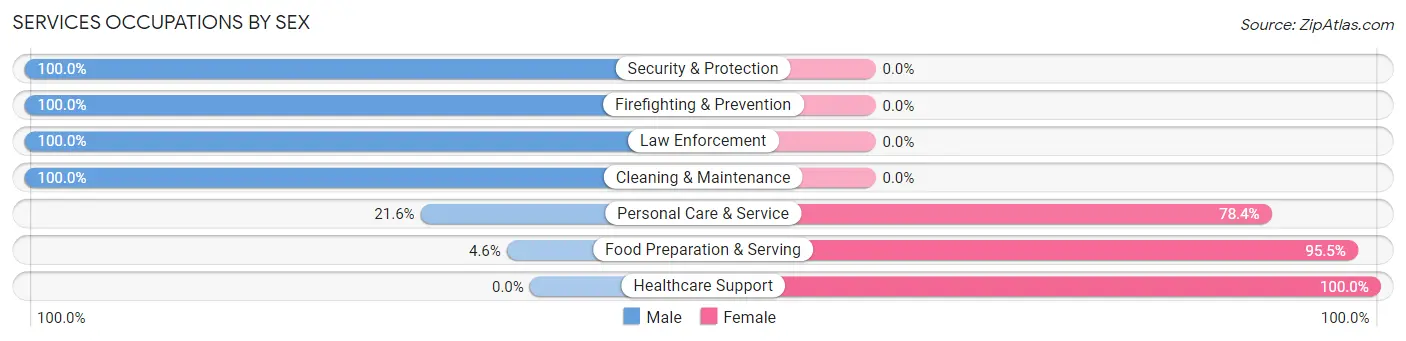
Services Occupations by Sex
Within the Services occupations in Maynardville, the most male-oriented occupations are Security & Protection (100.0%), Firefighting & Prevention (100.0%), and Law Enforcement (100.0%), while the most female-oriented occupations are Healthcare Support (100.0%), Food Preparation & Serving (95.5%), and Personal Care & Service (78.4%).
| Occupation | Male | Female |
| Healthcare Support | 0 (0.0%) | 49 (100.0%) |
| Security & Protection | 9 (100.0%) | 0 (0.0%) |
| Firefighting & Prevention | 3 (100.0%) | 0 (0.0%) |
| Law Enforcement | 6 (100.0%) | 0 (0.0%) |
| Food Preparation & Serving | 2 (4.5%) | 42 (95.5%) |
| Cleaning & Maintenance | 136 (100.0%) | 0 (0.0%) |
| Personal Care & Service | 8 (21.6%) | 29 (78.4%) |
| Total (Category) | 155 (56.4%) | 120 (43.6%) |
| Total (Overall) | 538 (54.6%) | 448 (45.4%) |
Sales and Office Occupations
The most common Sales and Office occupations in Maynardville are Office & Administration (86 | 8.7%), and Sales & Related (70 | 7.1%).
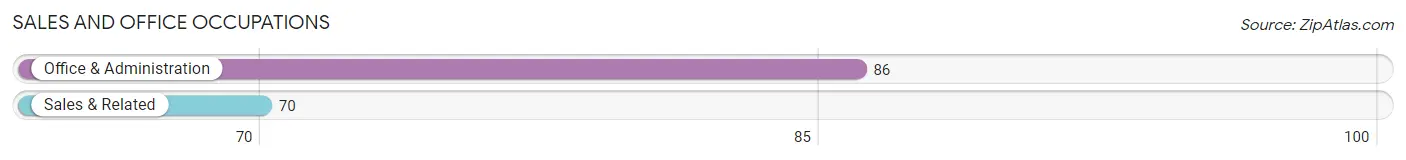
Sales and Office Occupations by Sex
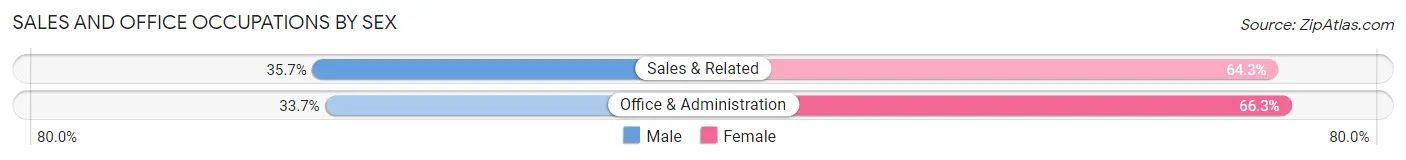
| Occupation | Male | Female |
| Sales & Related | 25 (35.7%) | 45 (64.3%) |
| Office & Administration | 29 (33.7%) | 57 (66.3%) |
| Total (Category) | 54 (34.6%) | 102 (65.4%) |
| Total (Overall) | 538 (54.6%) | 448 (45.4%) |
Natural Resources, Construction and Maintenance Occupations
The most common Natural Resources, Construction and Maintenance occupations in Maynardville are Construction & Extraction (56 | 5.7%), Installation, Maintenance & Repair (38 | 3.8%), and Farming, Fishing & Forestry (1 | 0.1%).
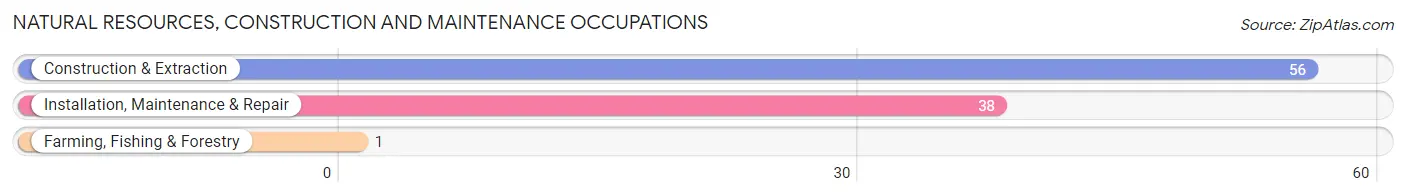
Natural Resources, Construction and Maintenance Occupations by Sex
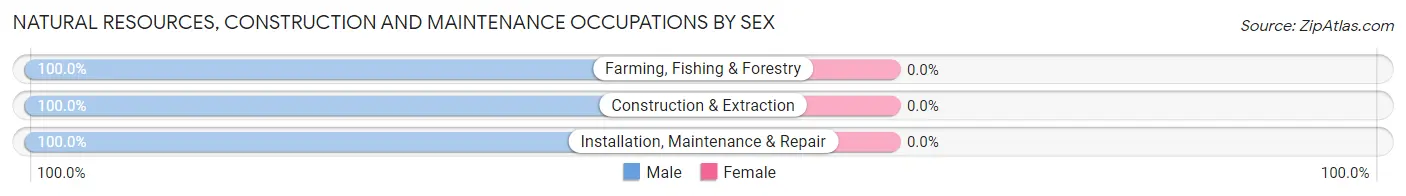
| Occupation | Male | Female |
| Farming, Fishing & Forestry | 1 (100.0%) | 0 (0.0%) |
| Construction & Extraction | 56 (100.0%) | 0 (0.0%) |
| Installation, Maintenance & Repair | 38 (100.0%) | 0 (0.0%) |
| Total (Category) | 95 (100.0%) | 0 (0.0%) |
| Total (Overall) | 538 (54.6%) | 448 (45.4%) |
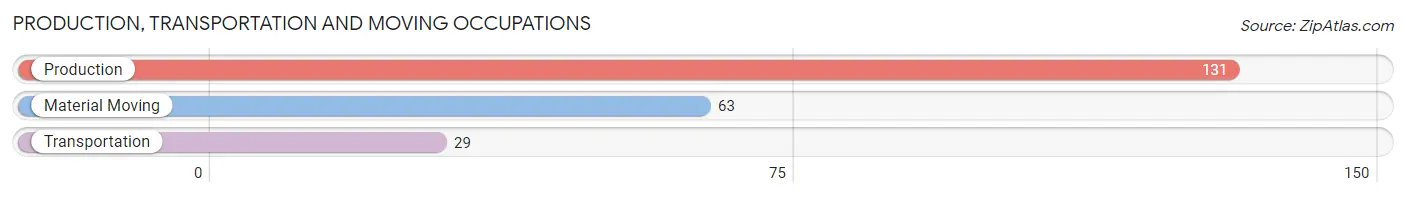
Production, Transportation and Moving Occupations
The most common Production, Transportation and Moving occupations in Maynardville are Production (131 | 13.3%), Material Moving (63 | 6.4%), and Transportation (29 | 2.9%).
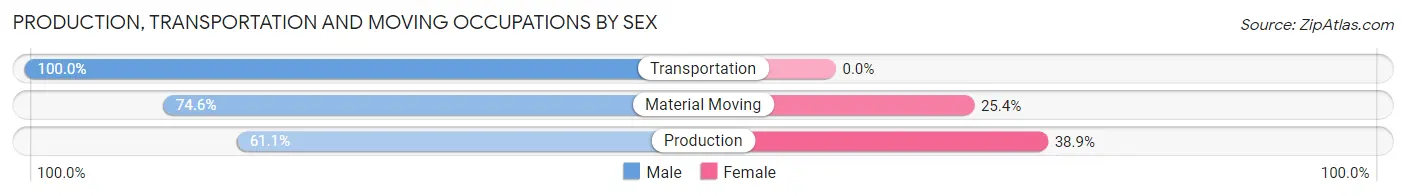
Production, Transportation and Moving Occupations by Sex
| Occupation | Male | Female |
| Production | 80 (61.1%) | 51 (38.9%) |
| Transportation | 29 (100.0%) | 0 (0.0%) |
| Material Moving | 47 (74.6%) | 16 (25.4%) |
| Total (Category) | 156 (70.0%) | 67 (30.0%) |
| Total (Overall) | 538 (54.6%) | 448 (45.4%) |
Employment Industries by Sex in Maynardville
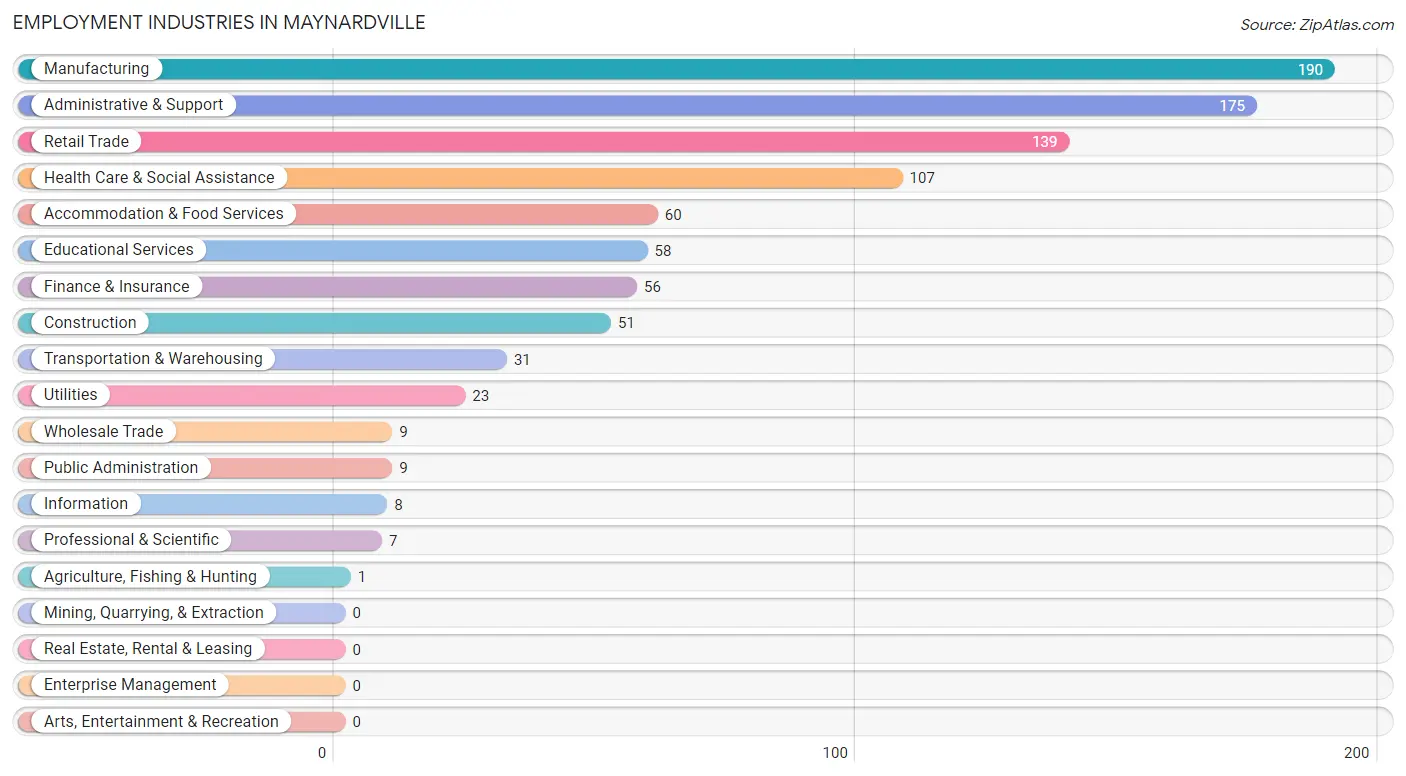
Employment Industries in Maynardville
The major employment industries in Maynardville include Manufacturing (190 | 19.3%), Administrative & Support (175 | 17.7%), Retail Trade (139 | 14.1%), Health Care & Social Assistance (107 | 10.8%), and Accommodation & Food Services (60 | 6.1%).
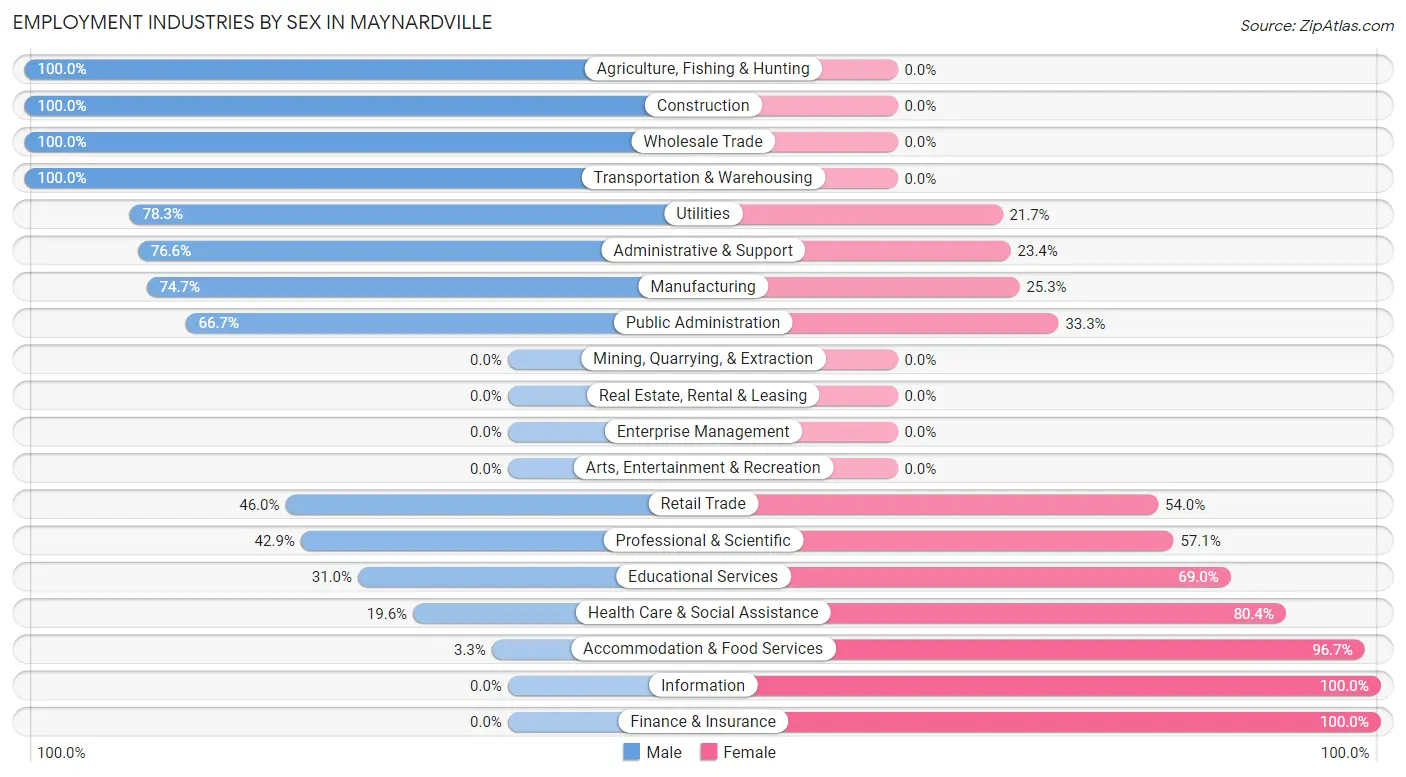
Employment Industries by Sex in Maynardville
The Maynardville industries that see more men than women are Agriculture, Fishing & Hunting (100.0%), Construction (100.0%), and Wholesale Trade (100.0%), whereas the industries that tend to have a higher number of women are Information (100.0%), Finance & Insurance (100.0%), and Accommodation & Food Services (96.7%).
| Industry | Male | Female |
| Agriculture, Fishing & Hunting | 1 (100.0%) | 0 (0.0%) |
| Mining, Quarrying, & Extraction | 0 (0.0%) | 0 (0.0%) |
| Construction | 51 (100.0%) | 0 (0.0%) |
| Manufacturing | 142 (74.7%) | 48 (25.3%) |
| Wholesale Trade | 9 (100.0%) | 0 (0.0%) |
| Retail Trade | 64 (46.0%) | 75 (54.0%) |
| Transportation & Warehousing | 31 (100.0%) | 0 (0.0%) |
| Utilities | 18 (78.3%) | 5 (21.7%) |
| Information | 0 (0.0%) | 8 (100.0%) |
| Finance & Insurance | 0 (0.0%) | 56 (100.0%) |
| Real Estate, Rental & Leasing | 0 (0.0%) | 0 (0.0%) |
| Professional & Scientific | 3 (42.9%) | 4 (57.1%) |
| Enterprise Management | 0 (0.0%) | 0 (0.0%) |
| Administrative & Support | 134 (76.6%) | 41 (23.4%) |
| Educational Services | 18 (31.0%) | 40 (69.0%) |
| Health Care & Social Assistance | 21 (19.6%) | 86 (80.4%) |
| Arts, Entertainment & Recreation | 0 (0.0%) | 0 (0.0%) |
| Accommodation & Food Services | 2 (3.3%) | 58 (96.7%) |
| Public Administration | 6 (66.7%) | 3 (33.3%) |
| Total | 538 (54.6%) | 448 (45.4%) |
Education in Maynardville
School Enrollment in Maynardville
The most common levels of schooling among the 375 students in Maynardville are elementary school (115 | 30.7%), high school (97 | 25.9%), and middle school (82 | 21.9%).
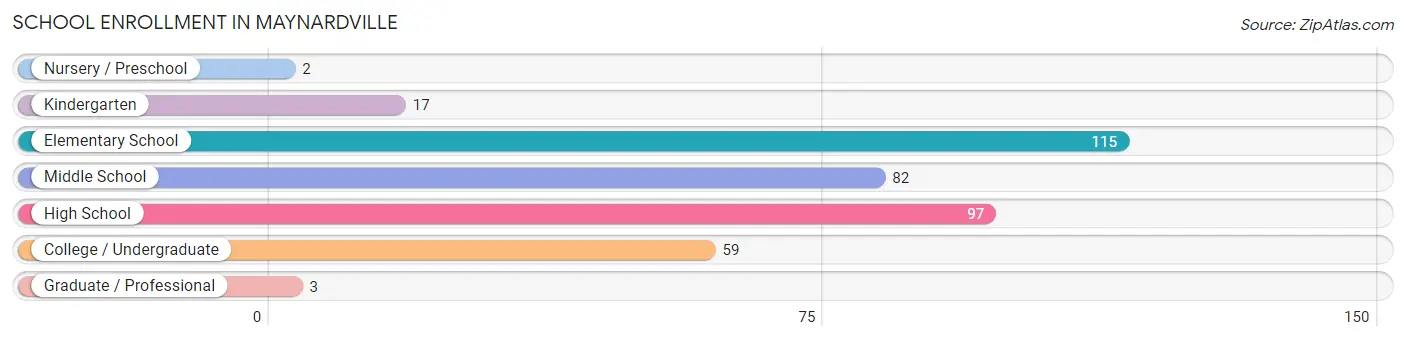
| School Level | # Students | % Students |
| Nursery / Preschool | 2 | 0.5% |
| Kindergarten | 17 | 4.5% |
| Elementary School | 115 | 30.7% |
| Middle School | 82 | 21.9% |
| High School | 97 | 25.9% |
| College / Undergraduate | 59 | 15.7% |
| Graduate / Professional | 3 | 0.8% |
| Total | 375 | 100.0% |
School Enrollment by Age by Funding Source in Maynardville
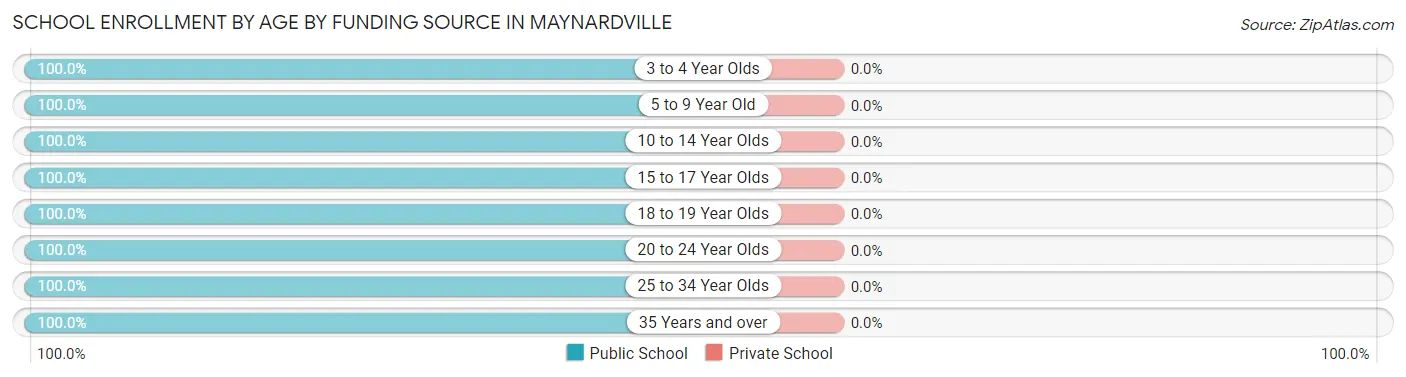
| Age Bracket | Public School | Private School |
| 3 to 4 Year Olds | 2 (100.0%) | 0 (0.0%) |
| 5 to 9 Year Old | 132 (100.0%) | 0 (0.0%) |
| 10 to 14 Year Olds | 82 (100.0%) | 0 (0.0%) |
| 15 to 17 Year Olds | 66 (100.0%) | 0 (0.0%) |
| 18 to 19 Year Olds | 31 (100.0%) | 0 (0.0%) |
| 20 to 24 Year Olds | 15 (100.0%) | 0 (0.0%) |
| 25 to 34 Year Olds | 44 (100.0%) | 0 (0.0%) |
| 35 Years and over | 3 (100.0%) | 0 (0.0%) |
| Total | 375 (100.0%) | 0 (0.0%) |
Educational Attainment by Field of Study in Maynardville
Bio, nature & agricultural (47 | 29.0%), business (26 | 16.1%), visual & performing arts (20 | 12.3%), science & technology (19 | 11.7%), and arts & humanities (18 | 11.1%) are the most common fields of study among 162 individuals in Maynardville who have obtained a bachelor's degree or higher.
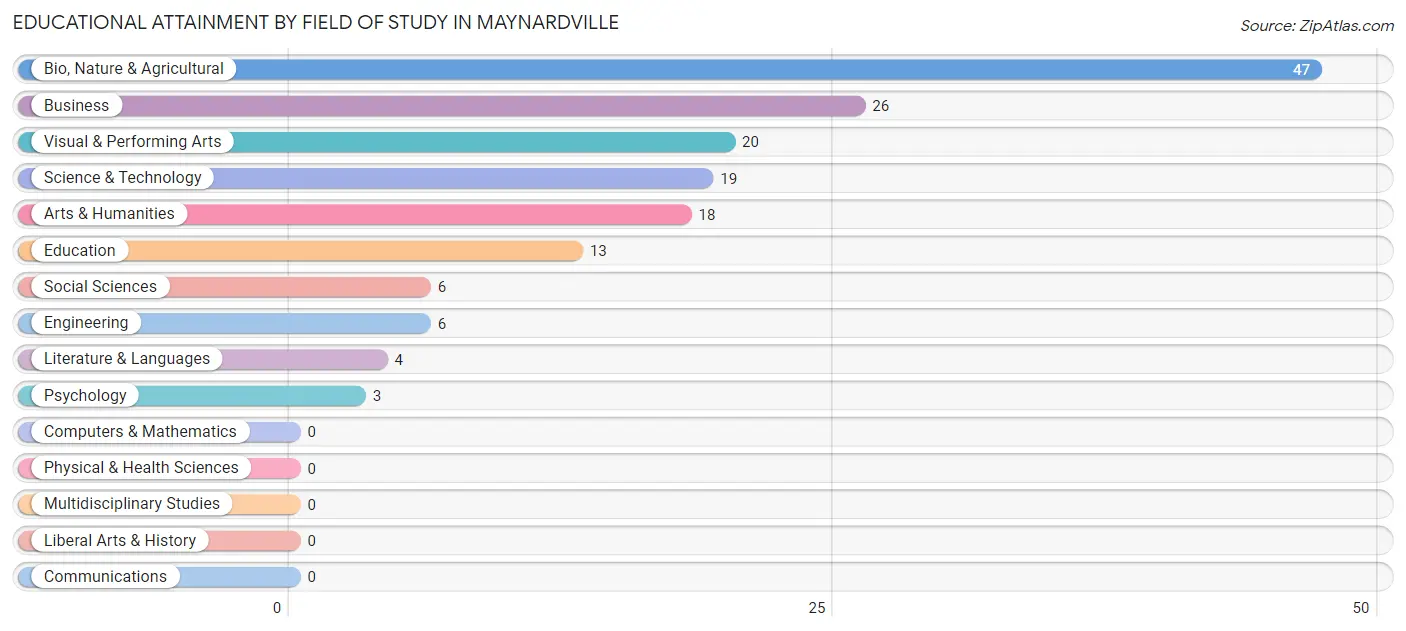
| Field of Study | # Graduates | % Graduates |
| Computers & Mathematics | 0 | 0.0% |
| Bio, Nature & Agricultural | 47 | 29.0% |
| Physical & Health Sciences | 0 | 0.0% |
| Psychology | 3 | 1.8% |
| Social Sciences | 6 | 3.7% |
| Engineering | 6 | 3.7% |
| Multidisciplinary Studies | 0 | 0.0% |
| Science & Technology | 19 | 11.7% |
| Business | 26 | 16.1% |
| Education | 13 | 8.0% |
| Literature & Languages | 4 | 2.5% |
| Liberal Arts & History | 0 | 0.0% |
| Visual & Performing Arts | 20 | 12.3% |
| Communications | 0 | 0.0% |
| Arts & Humanities | 18 | 11.1% |
| Total | 162 | 100.0% |
Transportation & Commute in Maynardville
Vehicle Availability by Sex in Maynardville
The most prevalent vehicle ownership categories in Maynardville are males with 2 vehicles (274, accounting for 51.4%) and females with 2 vehicles (172, making up 61.2%).
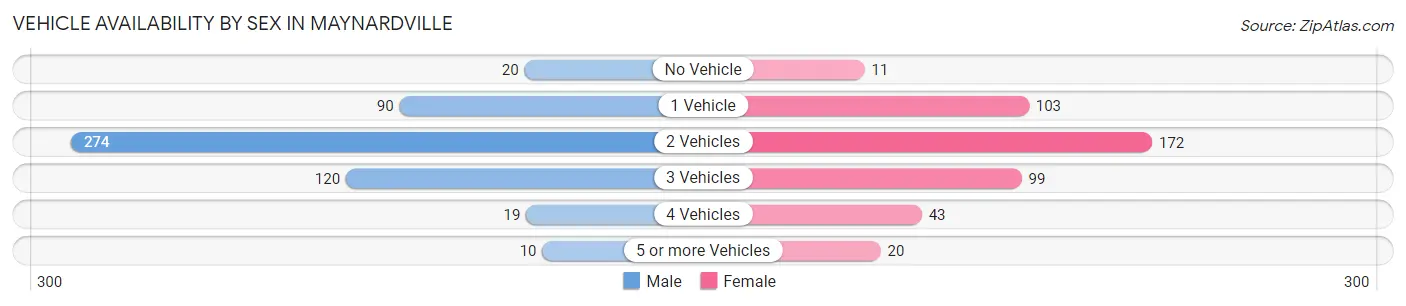
| Vehicles Available | Male | Female |
| No Vehicle | 20 (3.7%) | 11 (2.5%) |
| 1 Vehicle | 90 (16.9%) | 103 (23.0%) |
| 2 Vehicles | 274 (51.4%) | 172 (38.4%) |
| 3 Vehicles | 120 (22.5%) | 99 (22.1%) |
| 4 Vehicles | 19 (3.6%) | 43 (9.6%) |
| 5 or more Vehicles | 10 (1.9%) | 20 (4.5%) |
| Total | 533 (100.0%) | 448 (100.0%) |
Commute Time in Maynardville
The most frequently occuring commute durations in Maynardville are 45 to 59 minutes (155 commuters, 17.2%), 10 to 14 minutes (142 commuters, 15.8%), and 20 to 24 minutes (111 commuters, 12.3%).
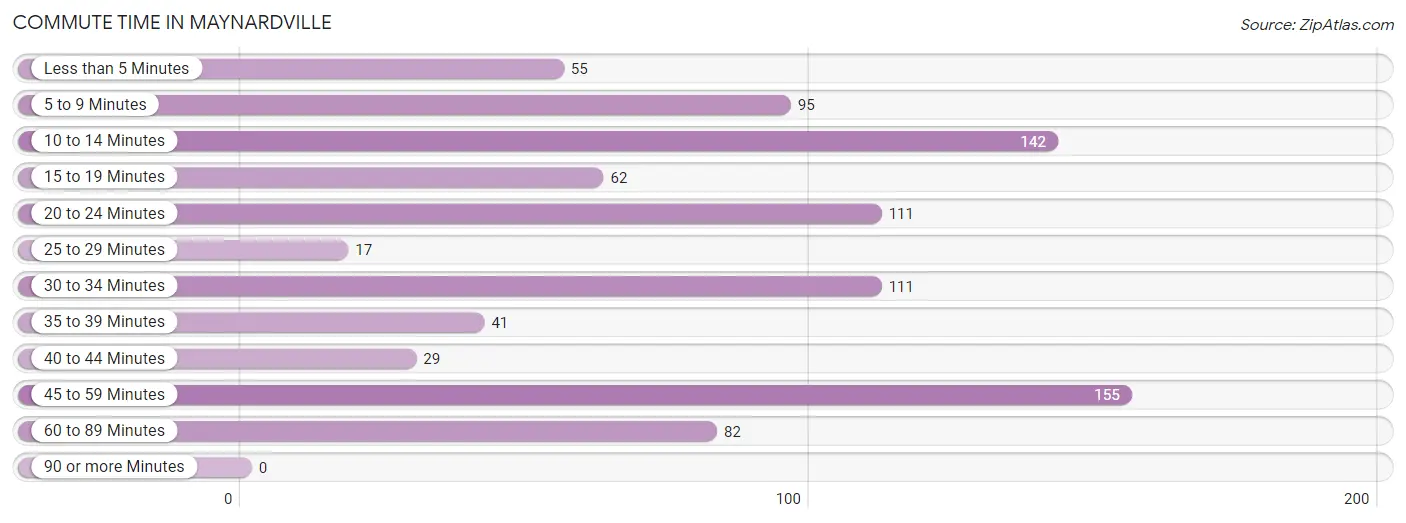
| Commute Time | # Commuters | % Commuters |
| Less than 5 Minutes | 55 | 6.1% |
| 5 to 9 Minutes | 95 | 10.6% |
| 10 to 14 Minutes | 142 | 15.8% |
| 15 to 19 Minutes | 62 | 6.9% |
| 20 to 24 Minutes | 111 | 12.3% |
| 25 to 29 Minutes | 17 | 1.9% |
| 30 to 34 Minutes | 111 | 12.3% |
| 35 to 39 Minutes | 41 | 4.6% |
| 40 to 44 Minutes | 29 | 3.2% |
| 45 to 59 Minutes | 155 | 17.2% |
| 60 to 89 Minutes | 82 | 9.1% |
| 90 or more Minutes | 0 | 0.0% |
Commute Time by Sex in Maynardville
The most common commute times in Maynardville are 20 to 24 minutes (102 commuters, 20.6%) for males and 45 to 59 minutes (82 commuters, 20.2%) for females.
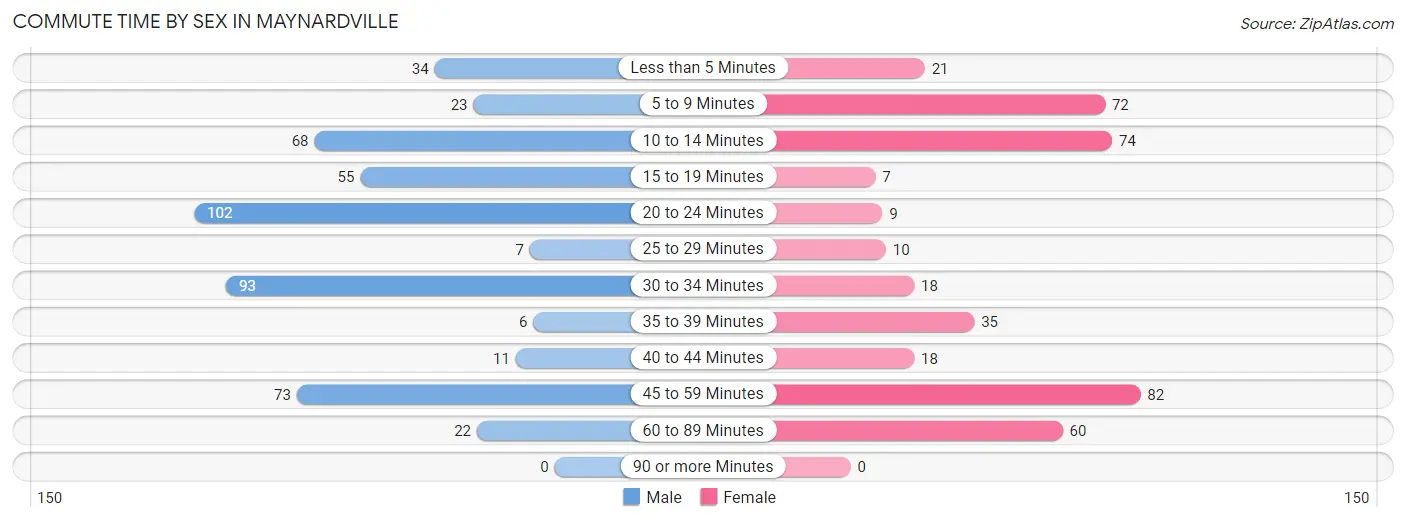
| Commute Time | Male | Female |
| Less than 5 Minutes | 34 (6.9%) | 21 (5.2%) |
| 5 to 9 Minutes | 23 (4.7%) | 72 (17.7%) |
| 10 to 14 Minutes | 68 (13.8%) | 74 (18.2%) |
| 15 to 19 Minutes | 55 (11.1%) | 7 (1.7%) |
| 20 to 24 Minutes | 102 (20.6%) | 9 (2.2%) |
| 25 to 29 Minutes | 7 (1.4%) | 10 (2.5%) |
| 30 to 34 Minutes | 93 (18.8%) | 18 (4.4%) |
| 35 to 39 Minutes | 6 (1.2%) | 35 (8.6%) |
| 40 to 44 Minutes | 11 (2.2%) | 18 (4.4%) |
| 45 to 59 Minutes | 73 (14.8%) | 82 (20.2%) |
| 60 to 89 Minutes | 22 (4.4%) | 60 (14.8%) |
| 90 or more Minutes | 0 (0.0%) | 0 (0.0%) |
Time of Departure to Work by Sex in Maynardville
The most frequent times of departure to work in Maynardville are 7:00 AM to 7:29 AM (98, 19.8%) for males and 4:00 PM to 11:59 PM (81, 20.0%) for females.
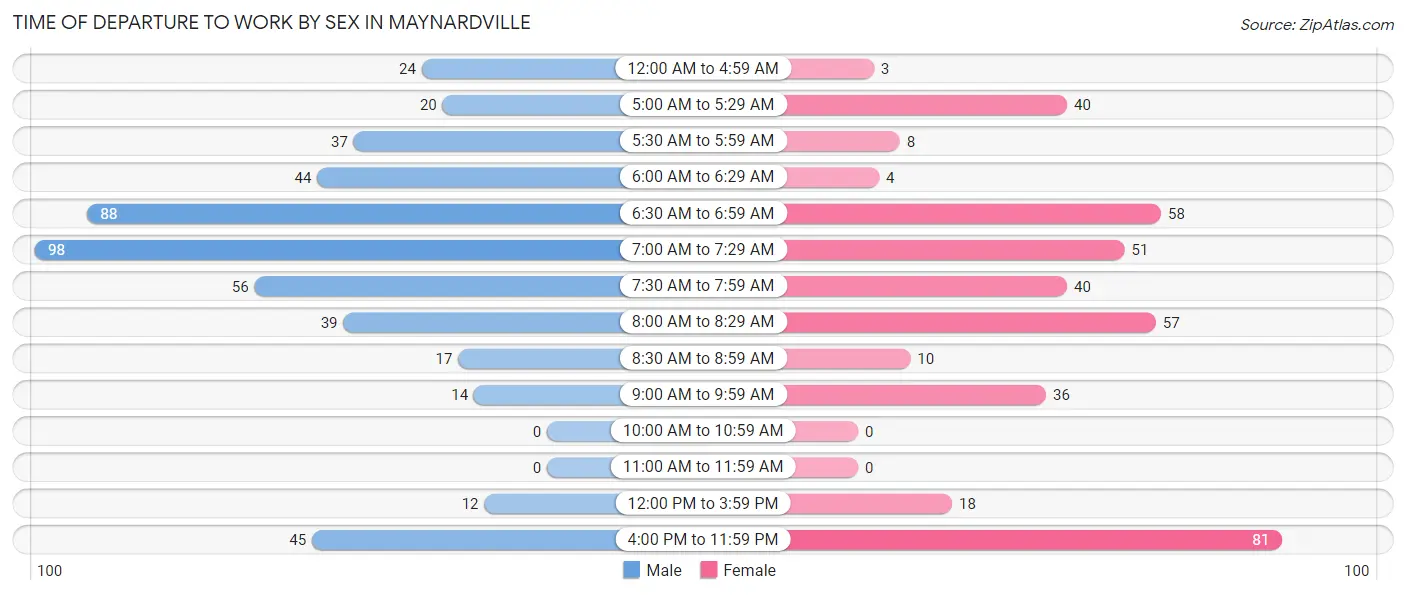
| Time of Departure | Male | Female |
| 12:00 AM to 4:59 AM | 24 (4.9%) | 3 (0.7%) |
| 5:00 AM to 5:29 AM | 20 (4.1%) | 40 (9.9%) |
| 5:30 AM to 5:59 AM | 37 (7.5%) | 8 (2.0%) |
| 6:00 AM to 6:29 AM | 44 (8.9%) | 4 (1.0%) |
| 6:30 AM to 6:59 AM | 88 (17.8%) | 58 (14.3%) |
| 7:00 AM to 7:29 AM | 98 (19.8%) | 51 (12.6%) |
| 7:30 AM to 7:59 AM | 56 (11.3%) | 40 (9.9%) |
| 8:00 AM to 8:29 AM | 39 (7.9%) | 57 (14.0%) |
| 8:30 AM to 8:59 AM | 17 (3.4%) | 10 (2.5%) |
| 9:00 AM to 9:59 AM | 14 (2.8%) | 36 (8.9%) |
| 10:00 AM to 10:59 AM | 0 (0.0%) | 0 (0.0%) |
| 11:00 AM to 11:59 AM | 0 (0.0%) | 0 (0.0%) |
| 12:00 PM to 3:59 PM | 12 (2.4%) | 18 (4.4%) |
| 4:00 PM to 11:59 PM | 45 (9.1%) | 81 (20.0%) |
| Total | 494 (100.0%) | 406 (100.0%) |
Housing Occupancy in Maynardville
Occupancy by Ownership in Maynardville
Of the total 1,038 dwellings in Maynardville, owner-occupied units account for 664 (64.0%), while renter-occupied units make up 374 (36.0%).
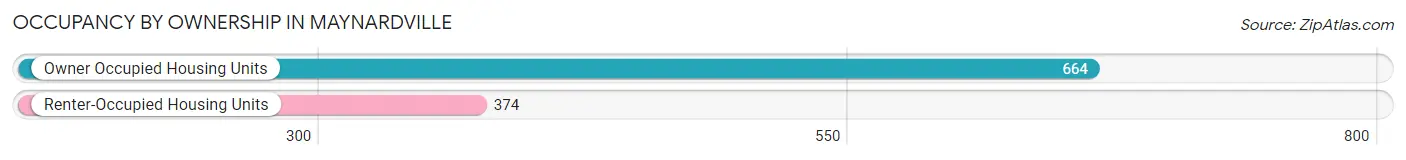
| Occupancy | # Housing Units | % Housing Units |
| Owner Occupied Housing Units | 664 | 64.0% |
| Renter-Occupied Housing Units | 374 | 36.0% |
| Total Occupied Housing Units | 1,038 | 100.0% |
Occupancy by Household Size in Maynardville
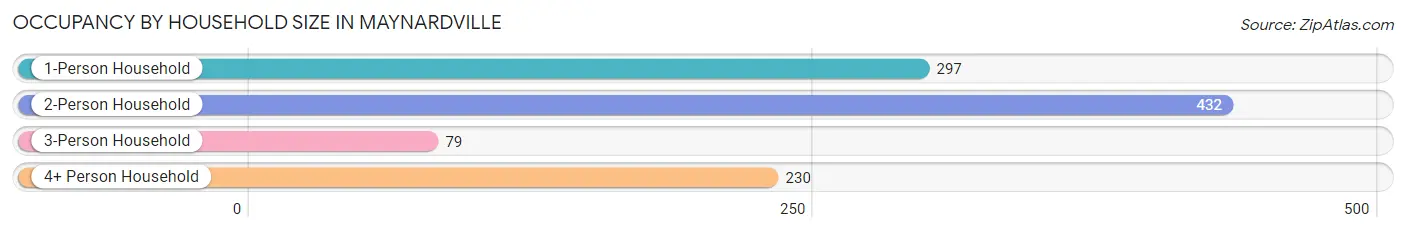
| Household Size | # Housing Units | % Housing Units |
| 1-Person Household | 297 | 28.6% |
| 2-Person Household | 432 | 41.6% |
| 3-Person Household | 79 | 7.6% |
| 4+ Person Household | 230 | 22.2% |
| Total Housing Units | 1,038 | 100.0% |
Occupancy by Ownership by Household Size in Maynardville
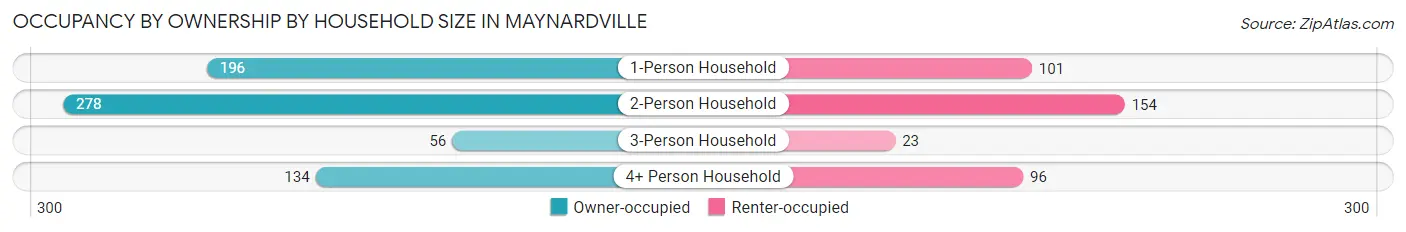
| Household Size | Owner-occupied | Renter-occupied |
| 1-Person Household | 196 (66.0%) | 101 (34.0%) |
| 2-Person Household | 278 (64.3%) | 154 (35.6%) |
| 3-Person Household | 56 (70.9%) | 23 (29.1%) |
| 4+ Person Household | 134 (58.3%) | 96 (41.7%) |
| Total Housing Units | 664 (64.0%) | 374 (36.0%) |
Occupancy by Educational Attainment in Maynardville
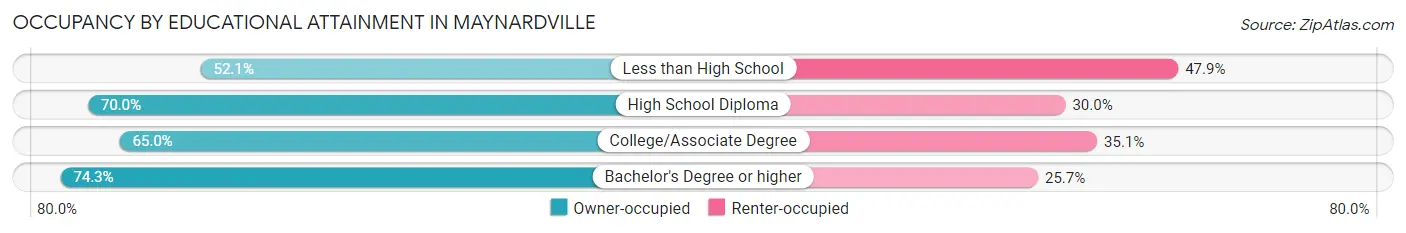
| Household Size | Owner-occupied | Renter-occupied |
| Less than High School | 137 (52.1%) | 126 (47.9%) |
| High School Diploma | 233 (70.0%) | 100 (30.0%) |
| College/Associate Degree | 239 (64.9%) | 129 (35.0%) |
| Bachelor's Degree or higher | 55 (74.3%) | 19 (25.7%) |
Occupancy by Age of Householder in Maynardville
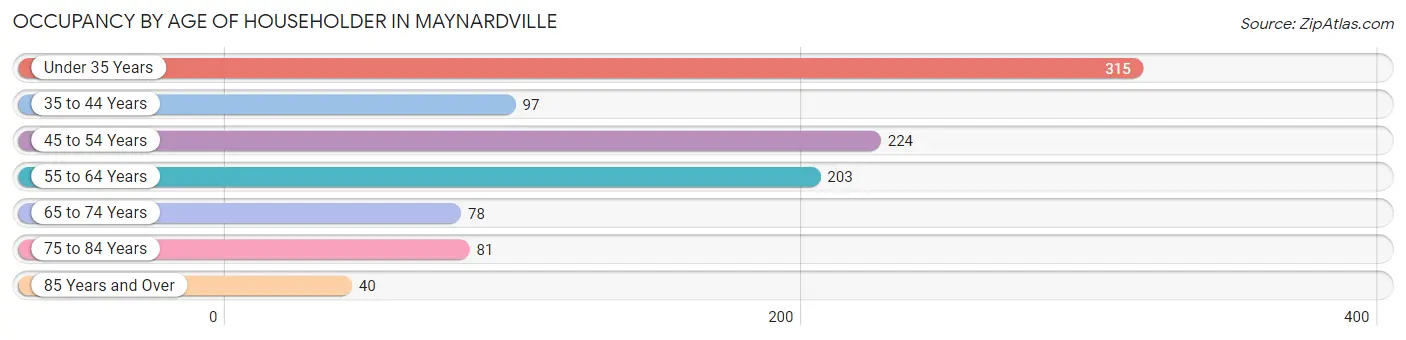
| Age Bracket | # Households | % Households |
| Under 35 Years | 315 | 30.3% |
| 35 to 44 Years | 97 | 9.3% |
| 45 to 54 Years | 224 | 21.6% |
| 55 to 64 Years | 203 | 19.6% |
| 65 to 74 Years | 78 | 7.5% |
| 75 to 84 Years | 81 | 7.8% |
| 85 Years and Over | 40 | 3.8% |
| Total | 1,038 | 100.0% |
Housing Finances in Maynardville
Median Income by Occupancy in Maynardville
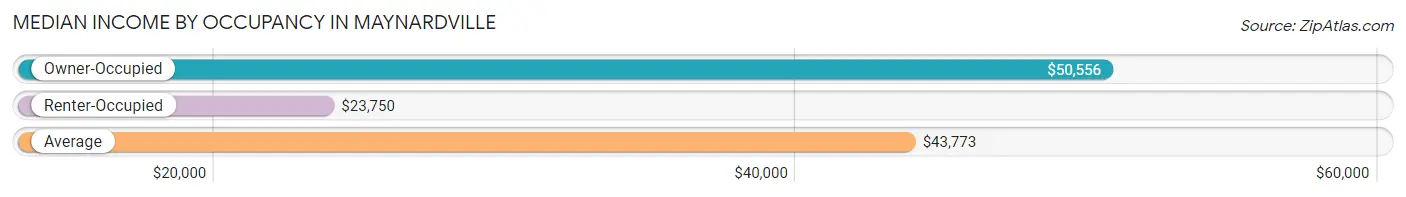
| Occupancy Type | # Households | Median Income |
| Owner-Occupied | 664 (64.0%) | $50,556 |
| Renter-Occupied | 374 (36.0%) | $23,750 |
| Average | 1,038 (100.0%) | $43,773 |
Occupancy by Householder Income Bracket in Maynardville
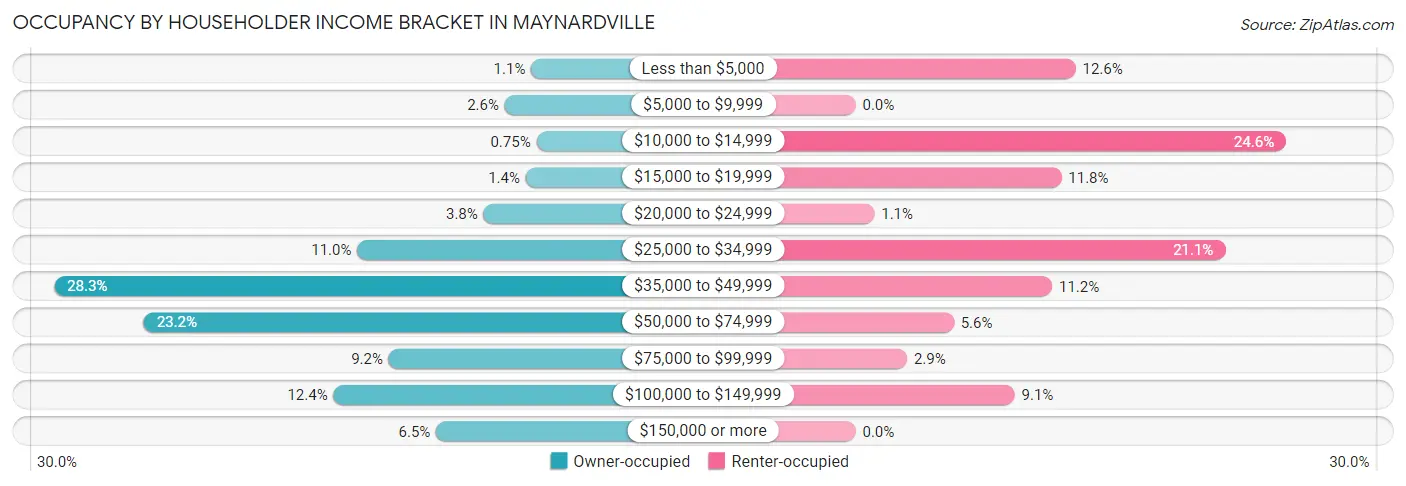
| Income Bracket | Owner-occupied | Renter-occupied |
| Less than $5,000 | 7 (1.1%) | 47 (12.6%) |
| $5,000 to $9,999 | 17 (2.6%) | 0 (0.0%) |
| $10,000 to $14,999 | 5 (0.7%) | 92 (24.6%) |
| $15,000 to $19,999 | 9 (1.4%) | 44 (11.8%) |
| $20,000 to $24,999 | 25 (3.8%) | 4 (1.1%) |
| $25,000 to $34,999 | 73 (11.0%) | 79 (21.1%) |
| $35,000 to $49,999 | 188 (28.3%) | 42 (11.2%) |
| $50,000 to $74,999 | 154 (23.2%) | 21 (5.6%) |
| $75,000 to $99,999 | 61 (9.2%) | 11 (2.9%) |
| $100,000 to $149,999 | 82 (12.3%) | 34 (9.1%) |
| $150,000 or more | 43 (6.5%) | 0 (0.0%) |
| Total | 664 (100.0%) | 374 (100.0%) |
Monthly Housing Cost Tiers in Maynardville
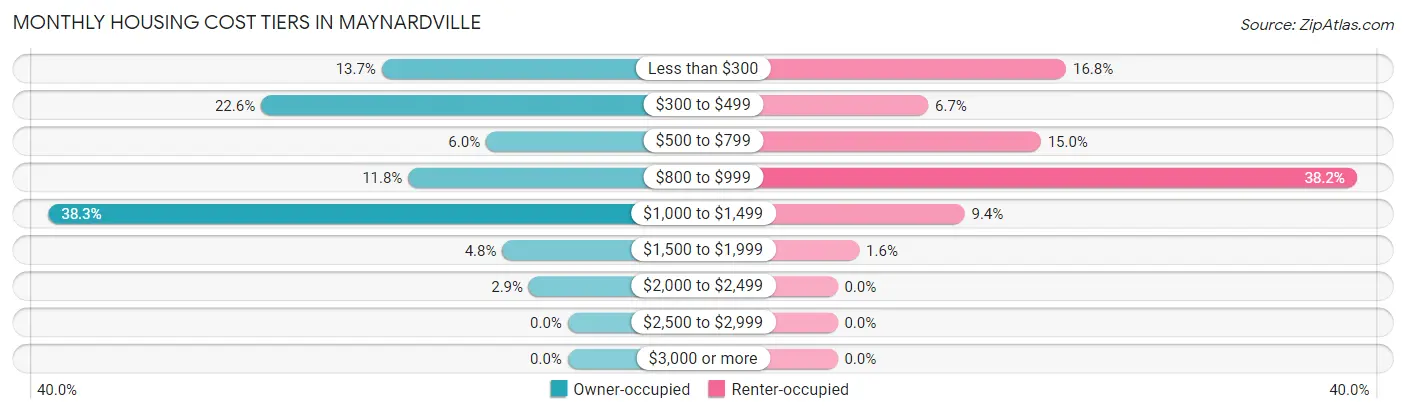
| Monthly Cost | Owner-occupied | Renter-occupied |
| Less than $300 | 91 (13.7%) | 63 (16.8%) |
| $300 to $499 | 150 (22.6%) | 25 (6.7%) |
| $500 to $799 | 40 (6.0%) | 56 (15.0%) |
| $800 to $999 | 78 (11.7%) | 143 (38.2%) |
| $1,000 to $1,499 | 254 (38.3%) | 35 (9.4%) |
| $1,500 to $1,999 | 32 (4.8%) | 6 (1.6%) |
| $2,000 to $2,499 | 19 (2.9%) | 0 (0.0%) |
| $2,500 to $2,999 | 0 (0.0%) | 0 (0.0%) |
| $3,000 or more | 0 (0.0%) | 0 (0.0%) |
| Total | 664 (100.0%) | 374 (100.0%) |
Physical Housing Characteristics in Maynardville
Housing Structures in Maynardville
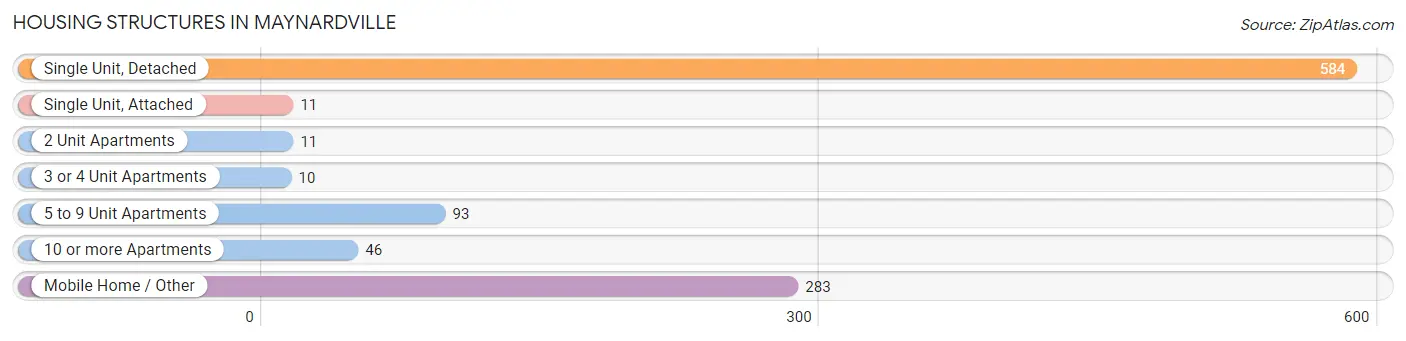
| Structure Type | # Housing Units | % Housing Units |
| Single Unit, Detached | 584 | 56.3% |
| Single Unit, Attached | 11 | 1.1% |
| 2 Unit Apartments | 11 | 1.1% |
| 3 or 4 Unit Apartments | 10 | 1.0% |
| 5 to 9 Unit Apartments | 93 | 9.0% |
| 10 or more Apartments | 46 | 4.4% |
| Mobile Home / Other | 283 | 27.3% |
| Total | 1,038 | 100.0% |
Housing Structures by Occupancy in Maynardville
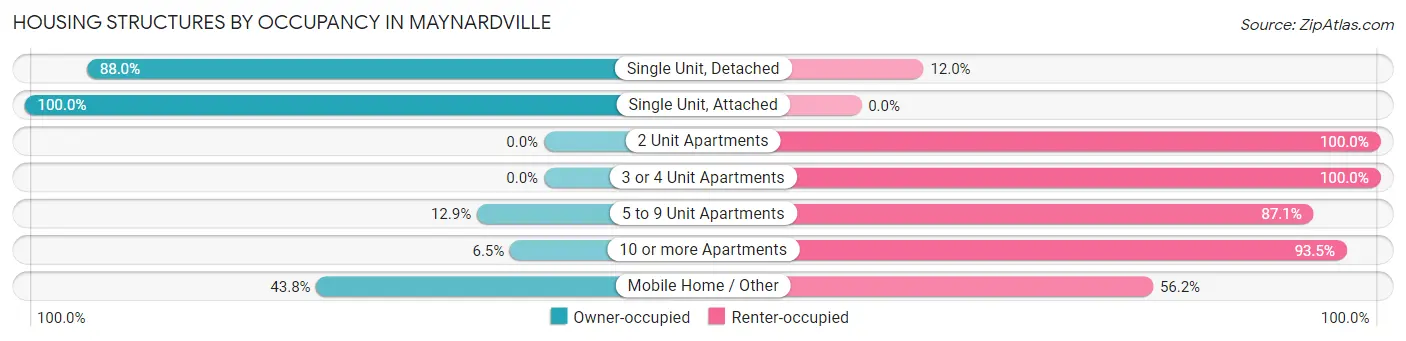
| Structure Type | Owner-occupied | Renter-occupied |
| Single Unit, Detached | 514 (88.0%) | 70 (12.0%) |
| Single Unit, Attached | 11 (100.0%) | 0 (0.0%) |
| 2 Unit Apartments | 0 (0.0%) | 11 (100.0%) |
| 3 or 4 Unit Apartments | 0 (0.0%) | 10 (100.0%) |
| 5 to 9 Unit Apartments | 12 (12.9%) | 81 (87.1%) |
| 10 or more Apartments | 3 (6.5%) | 43 (93.5%) |
| Mobile Home / Other | 124 (43.8%) | 159 (56.2%) |
| Total | 664 (64.0%) | 374 (36.0%) |
Housing Structures by Number of Rooms in Maynardville
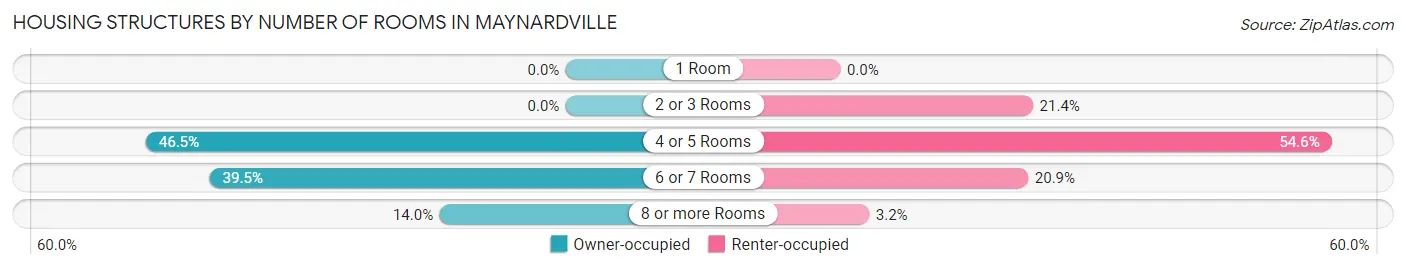
| Number of Rooms | Owner-occupied | Renter-occupied |
| 1 Room | 0 (0.0%) | 0 (0.0%) |
| 2 or 3 Rooms | 0 (0.0%) | 80 (21.4%) |
| 4 or 5 Rooms | 309 (46.5%) | 204 (54.5%) |
| 6 or 7 Rooms | 262 (39.5%) | 78 (20.9%) |
| 8 or more Rooms | 93 (14.0%) | 12 (3.2%) |
| Total | 664 (100.0%) | 374 (100.0%) |
Housing Structure by Heating Type in Maynardville
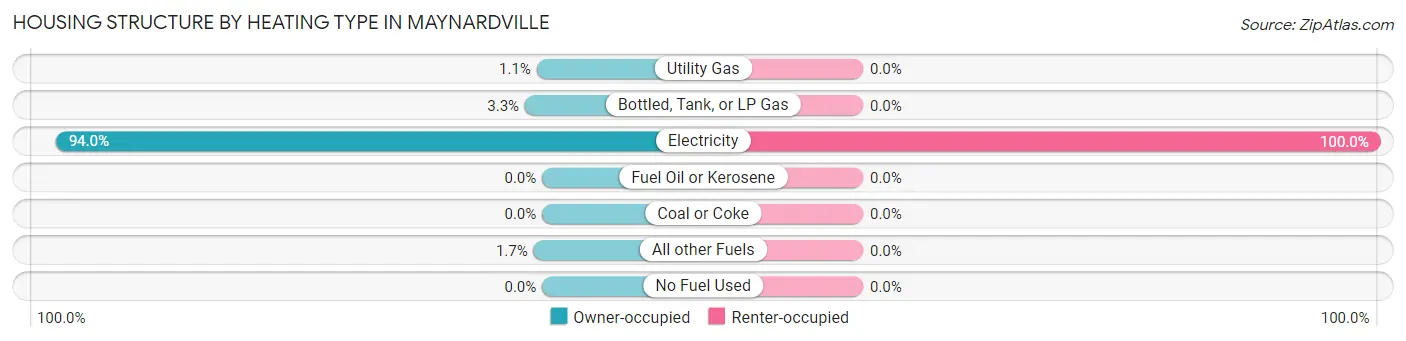
| Heating Type | Owner-occupied | Renter-occupied |
| Utility Gas | 7 (1.1%) | 0 (0.0%) |
| Bottled, Tank, or LP Gas | 22 (3.3%) | 0 (0.0%) |
| Electricity | 624 (94.0%) | 374 (100.0%) |
| Fuel Oil or Kerosene | 0 (0.0%) | 0 (0.0%) |
| Coal or Coke | 0 (0.0%) | 0 (0.0%) |
| All other Fuels | 11 (1.7%) | 0 (0.0%) |
| No Fuel Used | 0 (0.0%) | 0 (0.0%) |
| Total | 664 (100.0%) | 374 (100.0%) |
Household Vehicle Usage in Maynardville
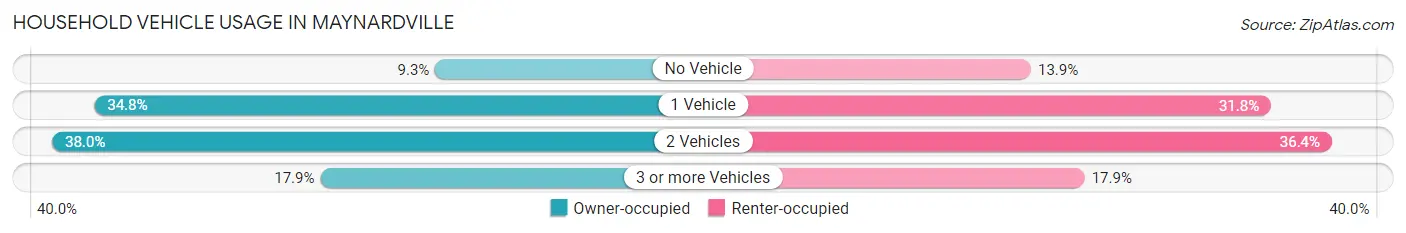
| Vehicles per Household | Owner-occupied | Renter-occupied |
| No Vehicle | 62 (9.3%) | 52 (13.9%) |
| 1 Vehicle | 231 (34.8%) | 119 (31.8%) |
| 2 Vehicles | 252 (38.0%) | 136 (36.4%) |
| 3 or more Vehicles | 119 (17.9%) | 67 (17.9%) |
| Total | 664 (100.0%) | 374 (100.0%) |
Real Estate & Mortgages in Maynardville
Real Estate and Mortgage Overview in Maynardville
| Characteristic | Without Mortgage | With Mortgage |
| Housing Units | 261 | 403 |
| Median Property Value | $145,700 | $162,500 |
| Median Household Income | $38,682 | $17 |
| Monthly Housing Costs | $378 | $0 |
| Real Estate Taxes | $585 | $52 |
Property Value by Mortgage Status in Maynardville
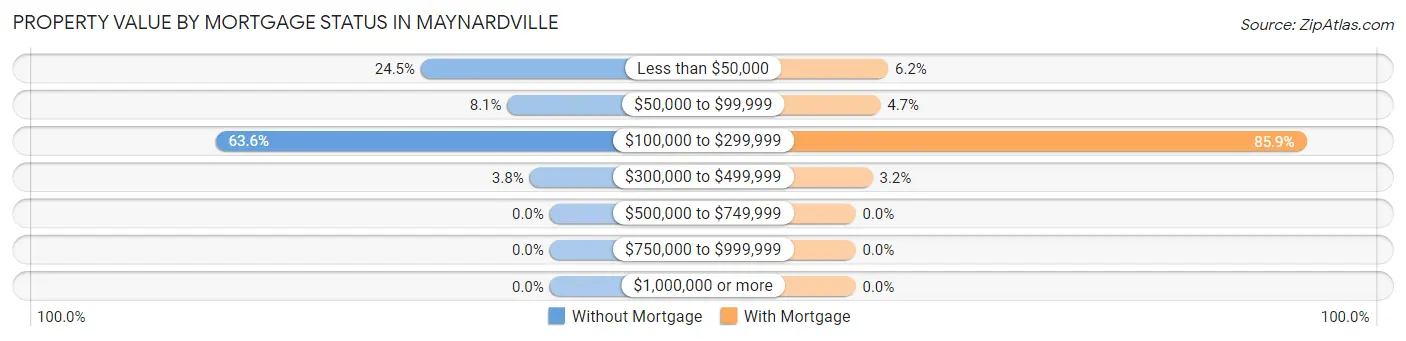
| Property Value | Without Mortgage | With Mortgage |
| Less than $50,000 | 64 (24.5%) | 25 (6.2%) |
| $50,000 to $99,999 | 21 (8.1%) | 19 (4.7%) |
| $100,000 to $299,999 | 166 (63.6%) | 346 (85.9%) |
| $300,000 to $499,999 | 10 (3.8%) | 13 (3.2%) |
| $500,000 to $749,999 | 0 (0.0%) | 0 (0.0%) |
| $750,000 to $999,999 | 0 (0.0%) | 0 (0.0%) |
| $1,000,000 or more | 0 (0.0%) | 0 (0.0%) |
| Total | 261 (100.0%) | 403 (100.0%) |
Household Income by Mortgage Status in Maynardville
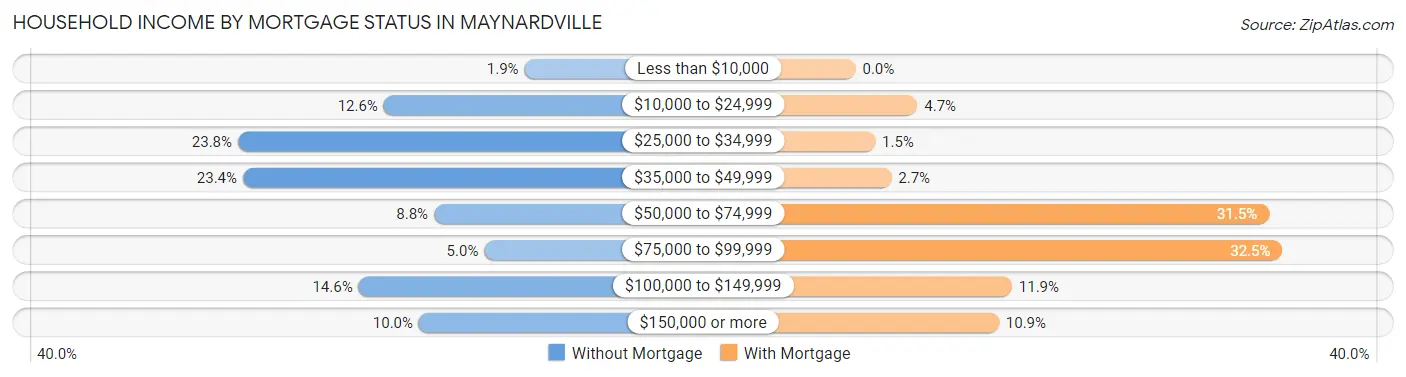
| Household Income | Without Mortgage | With Mortgage |
| Less than $10,000 | 5 (1.9%) | 0 (0.0%) |
| $10,000 to $24,999 | 33 (12.6%) | 19 (4.7%) |
| $25,000 to $34,999 | 62 (23.7%) | 6 (1.5%) |
| $35,000 to $49,999 | 61 (23.4%) | 11 (2.7%) |
| $50,000 to $74,999 | 23 (8.8%) | 127 (31.5%) |
| $75,000 to $99,999 | 13 (5.0%) | 131 (32.5%) |
| $100,000 to $149,999 | 38 (14.6%) | 48 (11.9%) |
| $150,000 or more | 26 (10.0%) | 44 (10.9%) |
| Total | 261 (100.0%) | 403 (100.0%) |
Property Value to Household Income Ratio in Maynardville
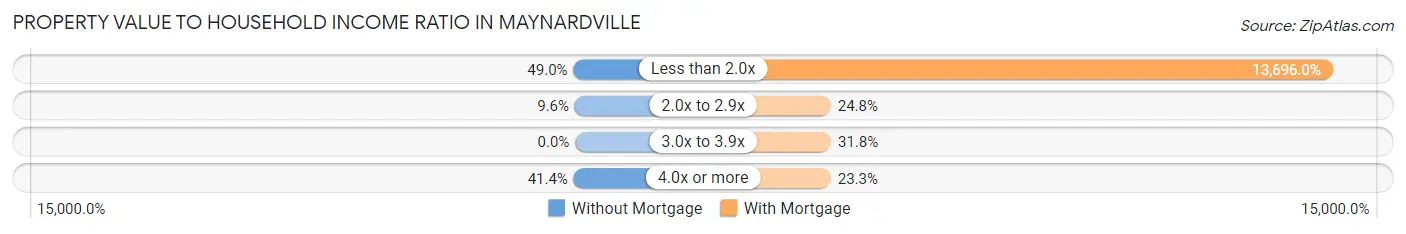
| Value-to-Income Ratio | Without Mortgage | With Mortgage |
| Less than 2.0x | 128 (49.0%) | 55,195 (13,696.0%) |
| 2.0x to 2.9x | 25 (9.6%) | 100 (24.8%) |
| 3.0x to 3.9x | 0 (0.0%) | 128 (31.8%) |
| 4.0x or more | 108 (41.4%) | 94 (23.3%) |
| Total | 261 (100.0%) | 403 (100.0%) |
Real Estate Taxes by Mortgage Status in Maynardville
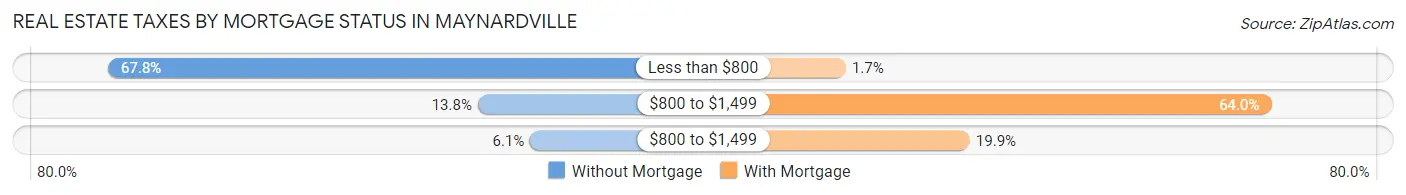
| Property Taxes | Without Mortgage | With Mortgage |
| Less than $800 | 177 (67.8%) | 7 (1.7%) |
| $800 to $1,499 | 36 (13.8%) | 258 (64.0%) |
| $800 to $1,499 | 16 (6.1%) | 80 (19.9%) |
| Total | 261 (100.0%) | 403 (100.0%) |
Health & Disability in Maynardville
Health Insurance Coverage by Age in Maynardville
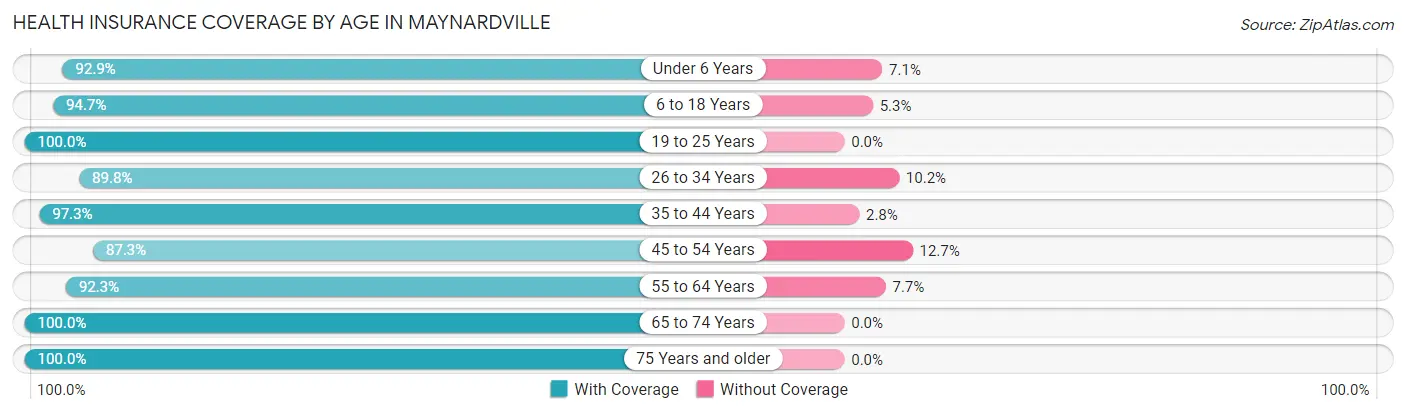
| Age Bracket | With Coverage | Without Coverage |
| Under 6 Years | 237 (92.9%) | 18 (7.1%) |
| 6 to 18 Years | 304 (94.7%) | 17 (5.3%) |
| 19 to 25 Years | 190 (100.0%) | 0 (0.0%) |
| 26 to 34 Years | 353 (89.8%) | 40 (10.2%) |
| 35 to 44 Years | 177 (97.3%) | 5 (2.8%) |
| 45 to 54 Years | 281 (87.3%) | 41 (12.7%) |
| 55 to 64 Years | 348 (92.3%) | 29 (7.7%) |
| 65 to 74 Years | 115 (100.0%) | 0 (0.0%) |
| 75 Years and older | 129 (100.0%) | 0 (0.0%) |
| Total | 2,134 (93.4%) | 150 (6.6%) |
Health Insurance Coverage by Citizenship Status in Maynardville
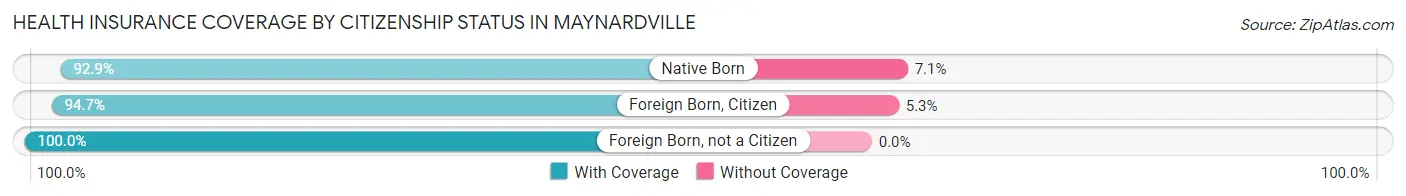
| Citizenship Status | With Coverage | Without Coverage |
| Native Born | 237 (92.9%) | 18 (7.1%) |
| Foreign Born, Citizen | 304 (94.7%) | 17 (5.3%) |
| Foreign Born, not a Citizen | 190 (100.0%) | 0 (0.0%) |
Health Insurance Coverage by Household Income in Maynardville
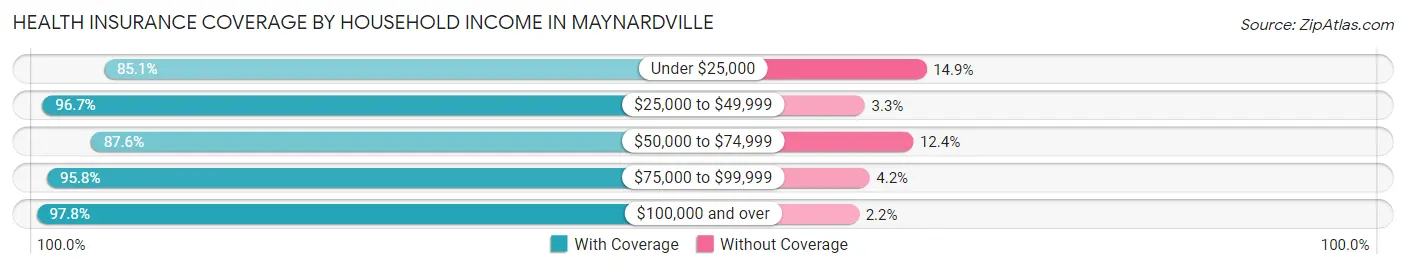
| Household Income | With Coverage | Without Coverage |
| Under $25,000 | 326 (85.1%) | 57 (14.9%) |
| $25,000 to $49,999 | 752 (96.7%) | 26 (3.3%) |
| $50,000 to $74,999 | 325 (87.6%) | 46 (12.4%) |
| $75,000 to $99,999 | 204 (95.8%) | 9 (4.2%) |
| $100,000 and over | 527 (97.8%) | 12 (2.2%) |
Public vs Private Health Insurance Coverage by Age in Maynardville
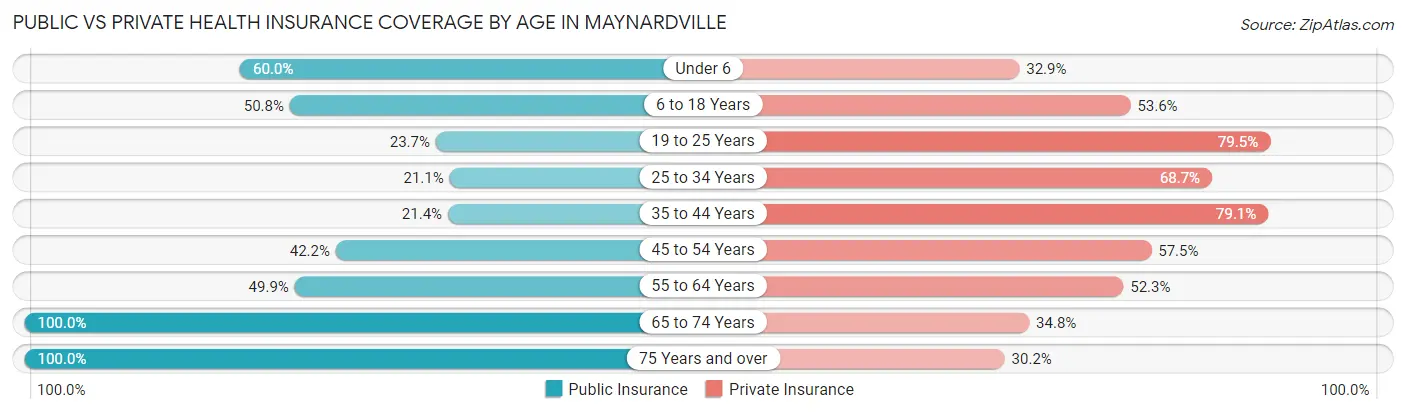
| Age Bracket | Public Insurance | Private Insurance |
| Under 6 | 153 (60.0%) | 84 (32.9%) |
| 6 to 18 Years | 163 (50.8%) | 172 (53.6%) |
| 19 to 25 Years | 45 (23.7%) | 151 (79.5%) |
| 25 to 34 Years | 83 (21.1%) | 270 (68.7%) |
| 35 to 44 Years | 39 (21.4%) | 144 (79.1%) |
| 45 to 54 Years | 136 (42.2%) | 185 (57.5%) |
| 55 to 64 Years | 188 (49.9%) | 197 (52.2%) |
| 65 to 74 Years | 115 (100.0%) | 40 (34.8%) |
| 75 Years and over | 129 (100.0%) | 39 (30.2%) |
| Total | 1,051 (46.0%) | 1,282 (56.1%) |
Disability Status by Sex by Age in Maynardville
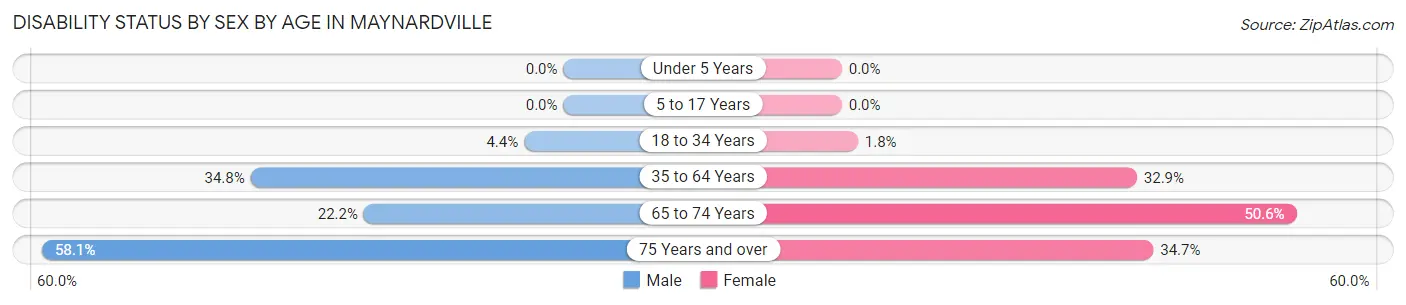
| Age Bracket | Male | Female |
| Under 5 Years | 0 (0.0%) | 0 (0.0%) |
| 5 to 17 Years | 0 (0.0%) | 0 (0.0%) |
| 18 to 34 Years | 13 (4.4%) | 6 (1.8%) |
| 35 to 64 Years | 185 (34.8%) | 115 (32.9%) |
| 65 to 74 Years | 8 (22.2%) | 40 (50.6%) |
| 75 Years and over | 18 (58.1%) | 34 (34.7%) |
Disability Class by Sex by Age in Maynardville
Disability Class: Hearing Difficulty
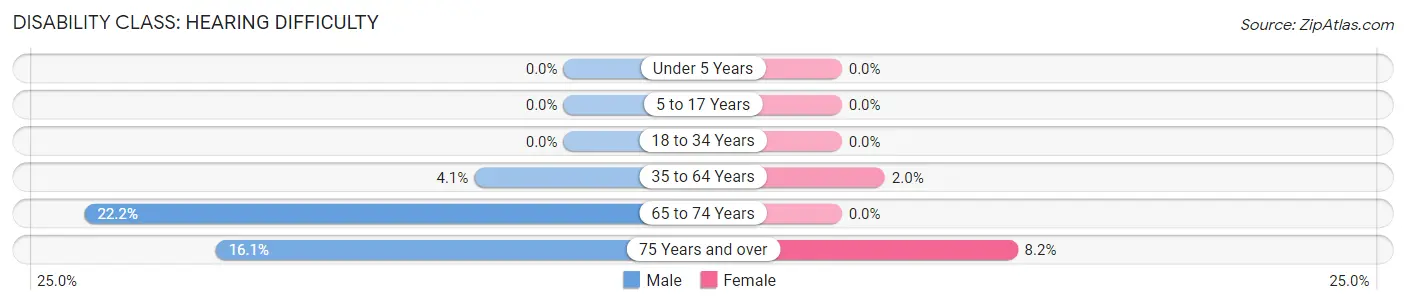
| Age Bracket | Male | Female |
| Under 5 Years | 0 (0.0%) | 0 (0.0%) |
| 5 to 17 Years | 0 (0.0%) | 0 (0.0%) |
| 18 to 34 Years | 0 (0.0%) | 0 (0.0%) |
| 35 to 64 Years | 22 (4.1%) | 7 (2.0%) |
| 65 to 74 Years | 8 (22.2%) | 0 (0.0%) |
| 75 Years and over | 5 (16.1%) | 8 (8.2%) |
Disability Class: Vision Difficulty
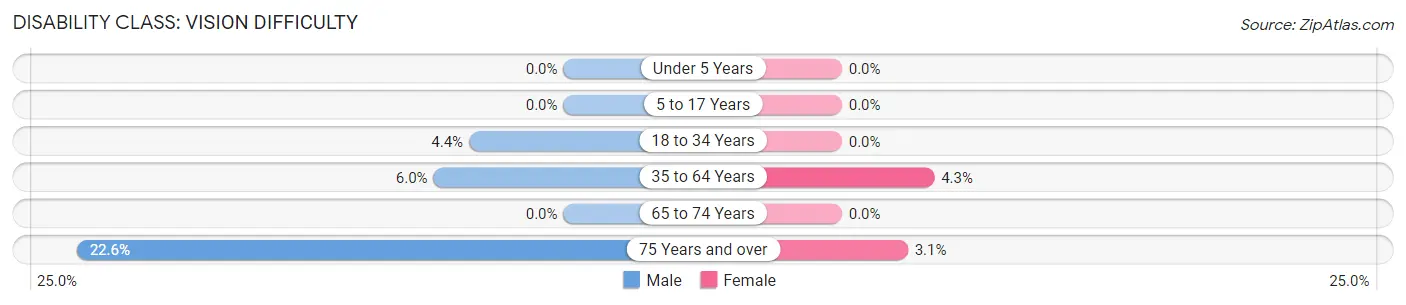
| Age Bracket | Male | Female |
| Under 5 Years | 0 (0.0%) | 0 (0.0%) |
| 5 to 17 Years | 0 (0.0%) | 0 (0.0%) |
| 18 to 34 Years | 13 (4.4%) | 0 (0.0%) |
| 35 to 64 Years | 32 (6.0%) | 15 (4.3%) |
| 65 to 74 Years | 0 (0.0%) | 0 (0.0%) |
| 75 Years and over | 7 (22.6%) | 3 (3.1%) |
Disability Class: Cognitive Difficulty
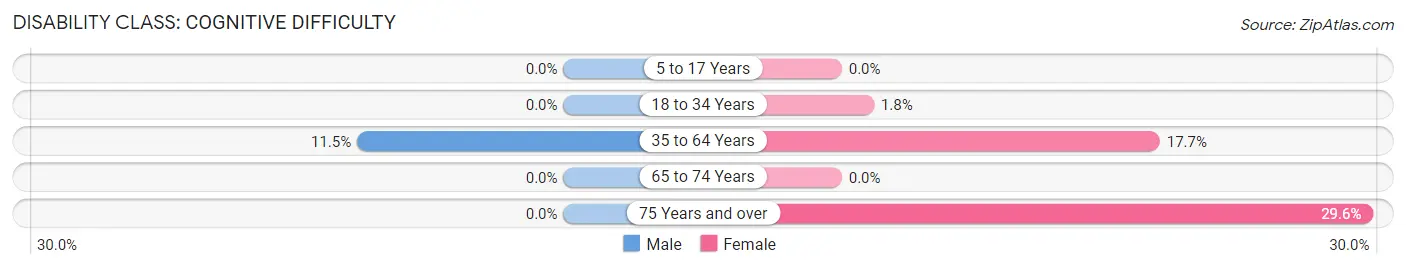
| Age Bracket | Male | Female |
| 5 to 17 Years | 0 (0.0%) | 0 (0.0%) |
| 18 to 34 Years | 0 (0.0%) | 6 (1.8%) |
| 35 to 64 Years | 61 (11.5%) | 62 (17.7%) |
| 65 to 74 Years | 0 (0.0%) | 0 (0.0%) |
| 75 Years and over | 0 (0.0%) | 29 (29.6%) |
Disability Class: Ambulatory Difficulty
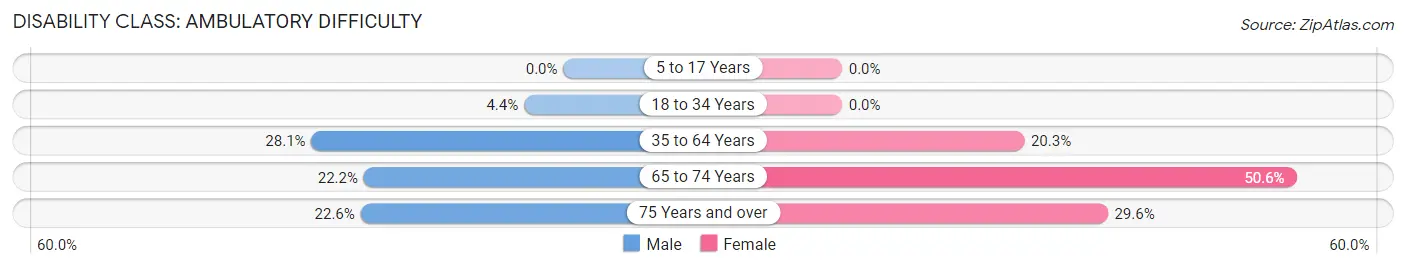
| Age Bracket | Male | Female |
| 5 to 17 Years | 0 (0.0%) | 0 (0.0%) |
| 18 to 34 Years | 13 (4.4%) | 0 (0.0%) |
| 35 to 64 Years | 149 (28.1%) | 71 (20.3%) |
| 65 to 74 Years | 8 (22.2%) | 40 (50.6%) |
| 75 Years and over | 7 (22.6%) | 29 (29.6%) |
Disability Class: Self-Care Difficulty
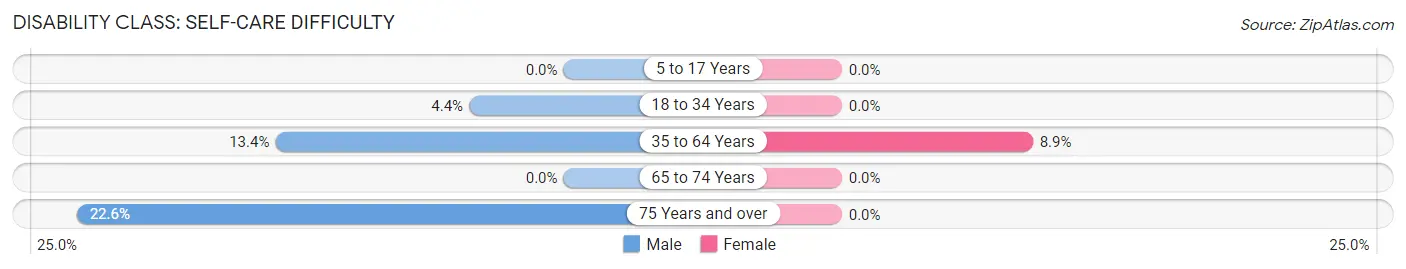
| Age Bracket | Male | Female |
| 5 to 17 Years | 0 (0.0%) | 0 (0.0%) |
| 18 to 34 Years | 13 (4.4%) | 0 (0.0%) |
| 35 to 64 Years | 71 (13.4%) | 31 (8.9%) |
| 65 to 74 Years | 0 (0.0%) | 0 (0.0%) |
| 75 Years and over | 7 (22.6%) | 0 (0.0%) |
Technology Access in Maynardville
Computing Device Access in Maynardville
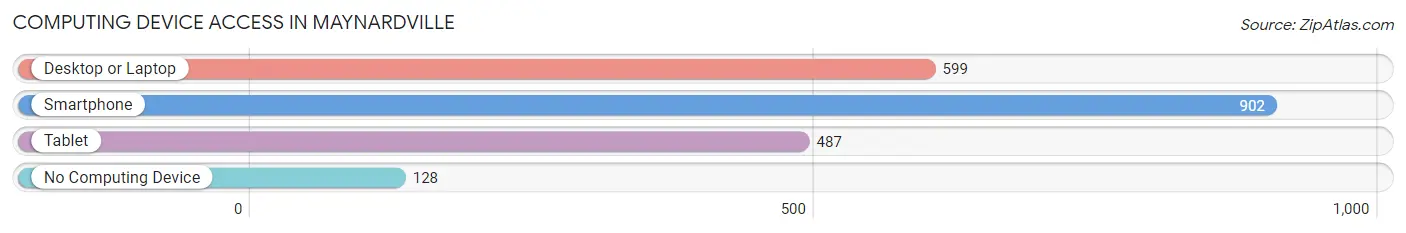
| Device Type | # Households | % Households |
| Desktop or Laptop | 599 | 57.7% |
| Smartphone | 902 | 86.9% |
| Tablet | 487 | 46.9% |
| No Computing Device | 128 | 12.3% |
| Total | 1,038 | 100.0% |
Internet Access in Maynardville
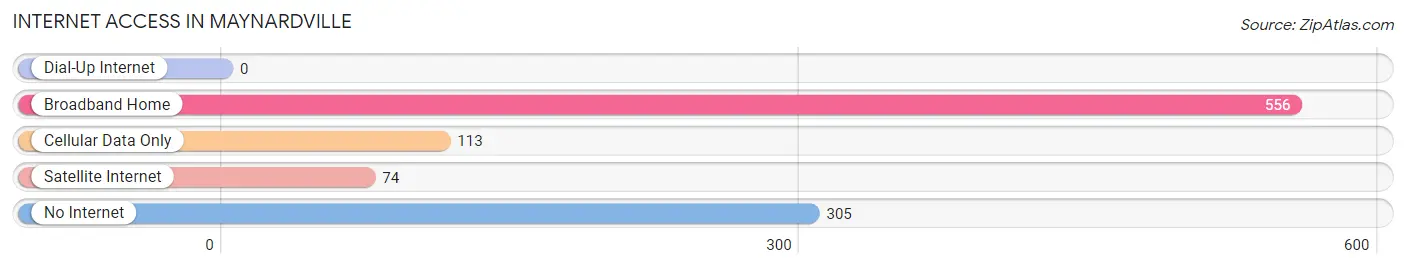
| Internet Type | # Households | % Households |
| Dial-Up Internet | 0 | 0.0% |
| Broadband Home | 556 | 53.6% |
| Cellular Data Only | 113 | 10.9% |
| Satellite Internet | 74 | 7.1% |
| No Internet | 305 | 29.4% |
| Total | 1,038 | 100.0% |
Maynardville Summary
Maynardville is a small town located in Union County, Tennessee. It is situated in the foothills of the Great Smoky Mountains, about 25 miles north of Knoxville. The town was founded in 1820 and named after the Maynard family, who were among the first settlers in the area. The population of Maynardville was 1,845 at the 2000 census.
Geography
Maynardville is located at 35°45'45" North, 84°2'45" West (35.7625, -84.0458). It is situated in the foothills of the Great Smoky Mountains, about 25 miles north of Knoxville. The town is located in the valley of the Clinch River, which flows through the town. The terrain is mostly hilly, with some flat areas. The town is surrounded by forests and farmland.
Climate
Maynardville has a humid subtropical climate, with hot, humid summers and mild winters. The average annual temperature is around 60°F (15°C). The average annual precipitation is around 45 inches (114 cm).
Demographics
At the 2000 census, there were 1,845 people, 745 households, and 517 families residing in the town. The population density was 545.2 people per square mile (210.7/km2). There were 817 housing units at an average density of 241.2 per square mile (93.1/km2). The racial makeup of the town was 97.2% White, 0.9% African American, 0.2% Native American, 0.2% Asian, 0.2% from other races, and 1.3% from two or more races. Hispanic or Latino of any race were 0.7% of the population.
There were 745 households, out of which 28.3% had children under the age of 18 living with them, 51.2% were married couples living together, 12.7% had a female householder with no husband present, and 32.2% were non-families. 28.3% of all households were made up of individuals, and 13.2% had someone living alone who was 65 years of age or older. The average household size was 2.45 and the average family size was 2.98.
The age distribution was 24.2% under the age of 18, 8.2% from 18 to 24, 28.2% from 25 to 44, 24.2% from 45 to 64, and 15.2% who were 65 years of age or older. The median age was 38 years. For every 100 females, there were 91.2 males. For every 100 females age 18 and over, there were 87.2 males.
The median income for a household in the town was $27,917, and the median income for a family was $32,917. Males had a median income of $27,917 versus $20,000 for females. The per capita income for the town was $14,917. About 13.2% of families and 16.2% of the population were below the poverty line, including 22.2% of those under age 18 and 14.2% of those age 65 or over.
Economy
Maynardville’s economy is largely based on agriculture and tourism. The town is home to several farms, which produce a variety of crops, including corn, soybeans, wheat, and hay. The town is also home to several small businesses, including restaurants, shops, and a few manufacturing plants. Tourism is also an important part of the local economy, as the town is located near several popular attractions, including the Great Smoky Mountains National Park and the Norris Dam State Park.
Common Questions
What is Per Capita Income in Maynardville?
Per Capita income in Maynardville is $23,160.
What is the Median Family Income in Maynardville?
Median Family Income in Maynardville is $45,063.
What is the Median Household income in Maynardville?
Median Household Income in Maynardville is $43,773.
What is Income or Wage Gap in Maynardville?
Income or Wage Gap in Maynardville is 21.0%.
Women in Maynardville earn 79.0 cents for every dollar earned by a man.
What is Family Income Deficit in Maynardville?
Family Income Deficit in Maynardville is $13,721.
Families that are below poverty line in Maynardville earn $13,721 less on average than the poverty threshold level.
What is Inequality or Gini Index in Maynardville?
Inequality or Gini Index in Maynardville is 0.44.
What is the Total Population of Maynardville?
Total Population of Maynardville is 2,455.
What is the Total Male Population of Maynardville?
Total Male Population of Maynardville is 1,167.
What is the Total Female Population of Maynardville?
Total Female Population of Maynardville is 1,288.
What is the Ratio of Males per 100 Females in Maynardville?
There are 90.61 Males per 100 Females in Maynardville.
What is the Ratio of Females per 100 Males in Maynardville?
There are 110.37 Females per 100 Males in Maynardville.
What is the Median Population Age in Maynardville?
Median Population Age in Maynardville is 37.3 Years.
What is the Average Family Size in Maynardville
Average Family Size in Maynardville is 2.6 People.
What is the Average Household Size in Maynardville
Average Household Size in Maynardville is 2.2 People.
How Large is the Labor Force in Maynardville?
There are 1,076 People in the Labor Forcein in Maynardville.
What is the Percentage of People in the Labor Force in Maynardville?
54.5% of People are in the Labor Force in Maynardville.
What is the Unemployment Rate in Maynardville?
Unemployment Rate in Maynardville is 8.4%.