Gallatin, TN Map & Demographics
Gallatin Map
Gallatin Overview
$36,996
PER CAPITA INCOME
$84,571
AVG FAMILY INCOME
$68,548
AVG HOUSEHOLD INCOME
20.4%
WAGE / INCOME GAP [ % ]
79.6¢/ $1
WAGE / INCOME GAP [ $ ]
$11,549
FAMILY INCOME DEFICIT
0.46
INEQUALITY / GINI INDEX
44,947
TOTAL POPULATION
22,397
MALE POPULATION
22,550
FEMALE POPULATION
99.32
MALES / 100 FEMALES
100.68
FEMALES / 100 MALES
37.8
MEDIAN AGE
3.0
AVG FAMILY SIZE
2.5
AVG HOUSEHOLD SIZE
22,571
LABOR FORCE [ PEOPLE ]
63.1%
PERCENT IN LABOR FORCE
3.2%
UNEMPLOYMENT RATE
Gallatin Zip Codes
Gallatin Area Codes
Income in Gallatin
Income Overview in Gallatin
Per Capita Income in Gallatin is $36,996, while median incomes of families and households are $84,571 and $68,548 respectively.
| Characteristic | Number | Measure |
| Per Capita Income | 44,947 | $36,996 |
| Median Family Income | 11,657 | $84,571 |
| Mean Family Income | 11,657 | $110,225 |
| Median Household Income | 17,908 | $68,548 |
| Mean Household Income | 17,908 | $90,104 |
| Income Deficit | 11,657 | $11,549 |
| Wage / Income Gap (%) | 44,947 | 20.44% |
| Wage / Income Gap ($) | 44,947 | 79.56¢ per $1 |
| Gini / Inequality Index | 44,947 | 0.46 |
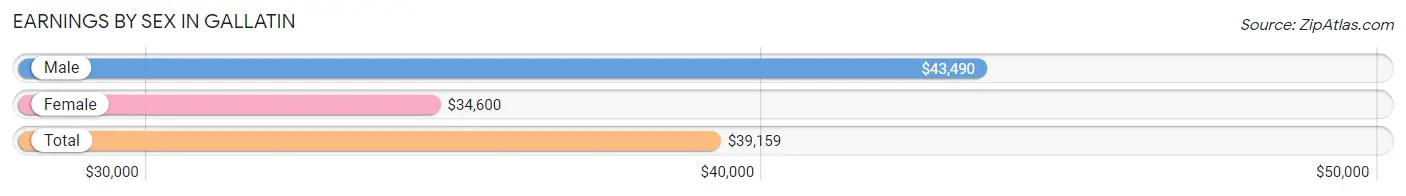
Earnings by Sex in Gallatin
Average Earnings in Gallatin are $39,159, $43,490 for men and $34,600 for women, a difference of 20.4%.
| Sex | Number | Average Earnings |
| Male | 12,594 (53.0%) | $43,490 |
| Female | 11,171 (47.0%) | $34,600 |
| Total | 23,765 (100.0%) | $39,159 |
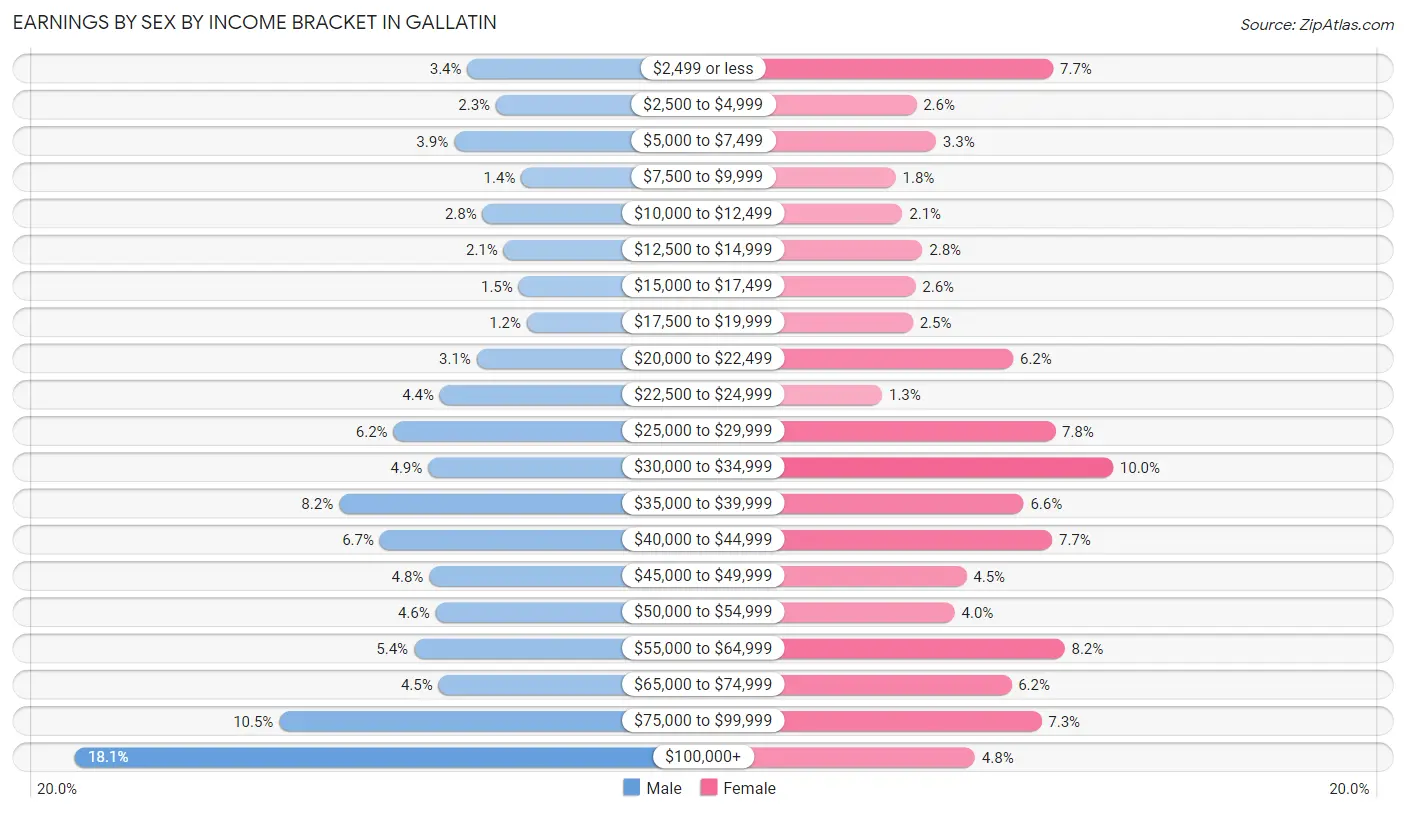
Earnings by Sex by Income Bracket in Gallatin
The most common earnings brackets in Gallatin are $100,000+ for men (2,281 | 18.1%) and $30,000 to $34,999 for women (1,114 | 10.0%).
| Income | Male | Female |
| $2,499 or less | 430 (3.4%) | 864 (7.7%) |
| $2,500 to $4,999 | 295 (2.3%) | 291 (2.6%) |
| $5,000 to $7,499 | 493 (3.9%) | 373 (3.3%) |
| $7,500 to $9,999 | 175 (1.4%) | 204 (1.8%) |
| $10,000 to $12,499 | 358 (2.8%) | 232 (2.1%) |
| $12,500 to $14,999 | 258 (2.1%) | 316 (2.8%) |
| $15,000 to $17,499 | 188 (1.5%) | 287 (2.6%) |
| $17,500 to $19,999 | 149 (1.2%) | 276 (2.5%) |
| $20,000 to $22,499 | 386 (3.1%) | 696 (6.2%) |
| $22,500 to $24,999 | 559 (4.4%) | 148 (1.3%) |
| $25,000 to $29,999 | 778 (6.2%) | 871 (7.8%) |
| $30,000 to $34,999 | 615 (4.9%) | 1,114 (10.0%) |
| $35,000 to $39,999 | 1,035 (8.2%) | 739 (6.6%) |
| $40,000 to $44,999 | 842 (6.7%) | 859 (7.7%) |
| $45,000 to $49,999 | 610 (4.8%) | 501 (4.5%) |
| $50,000 to $54,999 | 579 (4.6%) | 451 (4.0%) |
| $55,000 to $64,999 | 681 (5.4%) | 911 (8.2%) |
| $65,000 to $74,999 | 565 (4.5%) | 688 (6.2%) |
| $75,000 to $99,999 | 1,317 (10.5%) | 814 (7.3%) |
| $100,000+ | 2,281 (18.1%) | 536 (4.8%) |
| Total | 12,594 (100.0%) | 11,171 (100.0%) |
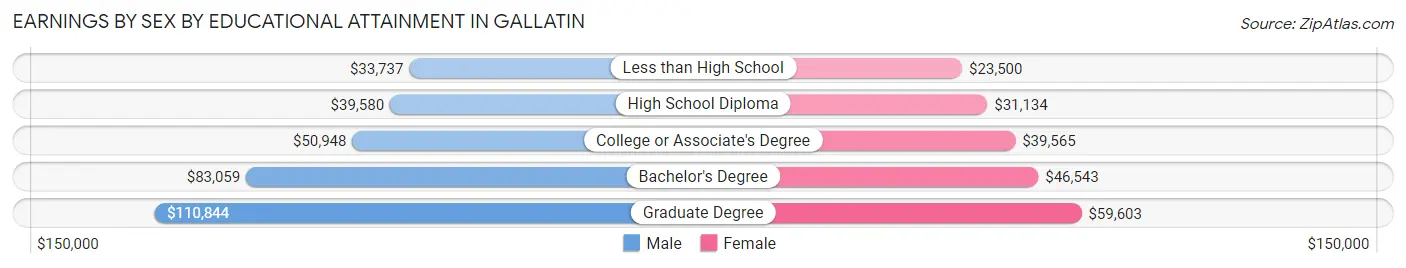
Earnings by Sex by Educational Attainment in Gallatin
Average earnings in Gallatin are $49,531 for men and $39,623 for women, a difference of 20.0%. Men with an educational attainment of graduate degree enjoy the highest average annual earnings of $110,844, while those with less than high school education earn the least with $33,737. Women with an educational attainment of graduate degree earn the most with the average annual earnings of $59,603, while those with less than high school education have the smallest earnings of $23,500.
| Educational Attainment | Male Income | Female Income |
| Less than High School | $33,737 | $23,500 |
| High School Diploma | $39,580 | $31,134 |
| College or Associate's Degree | $50,948 | $39,565 |
| Bachelor's Degree | $83,059 | $46,543 |
| Graduate Degree | $110,844 | $59,603 |
| Total | $49,531 | $39,623 |
Family Income in Gallatin
Family Income Brackets in Gallatin
According to the Gallatin family income data, there are 2,588 families falling into the $100,000 to $149,999 income range, which is the most common income bracket and makes up 22.2% of all families. Conversely, the $15,000 to $24,999 income bracket is the least frequent group with only 210 families (1.8%) belonging to this category.
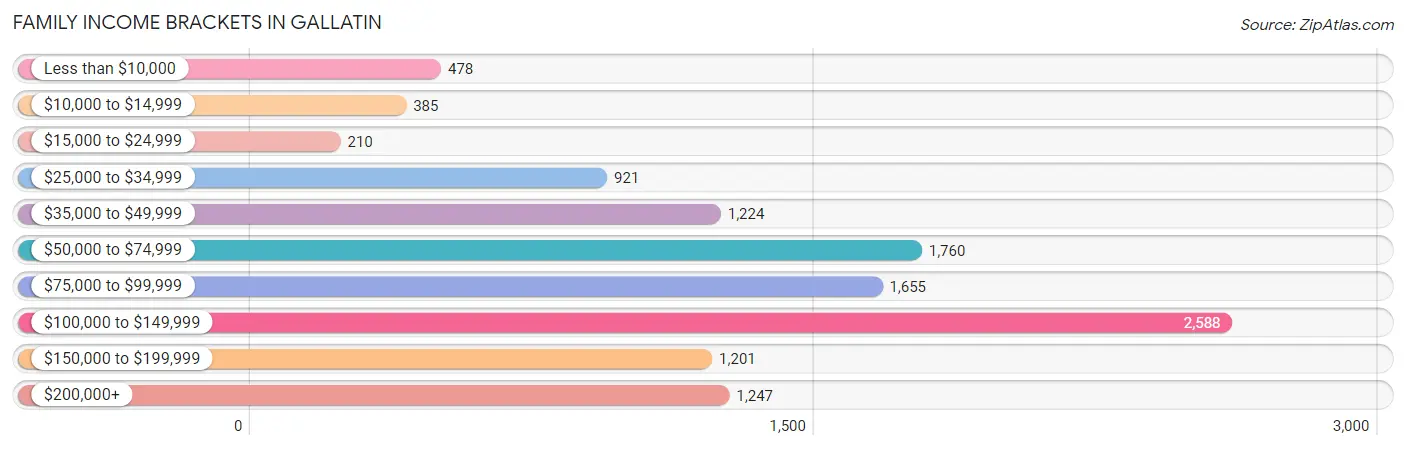
| Income Bracket | # Families | % Families |
| Less than $10,000 | 478 | 4.1% |
| $10,000 to $14,999 | 385 | 3.3% |
| $15,000 to $24,999 | 210 | 1.8% |
| $25,000 to $34,999 | 921 | 7.9% |
| $35,000 to $49,999 | 1,224 | 10.5% |
| $50,000 to $74,999 | 1,760 | 15.1% |
| $75,000 to $99,999 | 1,655 | 14.2% |
| $100,000 to $149,999 | 2,588 | 22.2% |
| $150,000 to $199,999 | 1,201 | 10.3% |
| $200,000+ | 1,247 | 10.7% |
Family Income by Famaliy Size in Gallatin
7+ person families (141 | 1.2%) account for the highest median family income in Gallatin with $107,330 per family, while 2-person families (5,723 | 49.1%) have the highest median income of $38,972 per family member.

| Income Bracket | # Families | Median Income |
| 2-Person Families | 5,723 (49.1%) | $77,943 |
| 3-Person Families | 2,682 (23.0%) | $98,000 |
| 4-Person Families | 2,182 (18.7%) | $95,263 |
| 5-Person Families | 767 (6.6%) | $81,051 |
| 6-Person Families | 162 (1.4%) | $0 |
| 7+ Person Families | 141 (1.2%) | $107,330 |
| Total | 11,657 (100.0%) | $84,571 |
Family Income by Number of Earners in Gallatin
The median family income in Gallatin is $84,571, with families comprising 3+ earners (1,118) having the highest median family income of $129,500, while families with no earners (1,834) have the lowest median family income of $53,493, accounting for 9.6% and 15.7% of families, respectively.
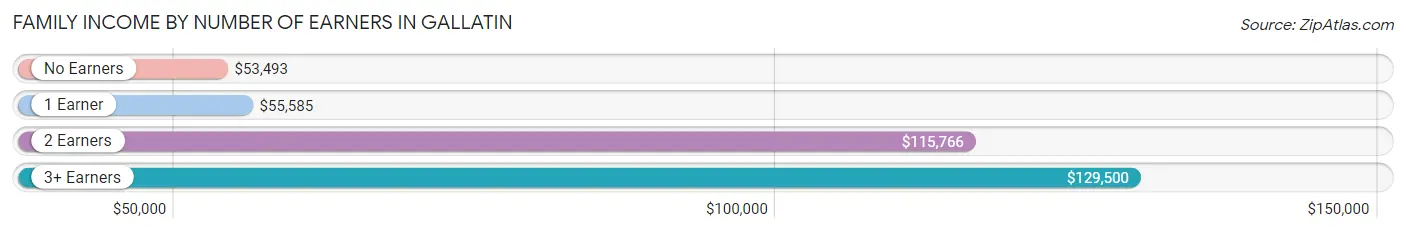
| Number of Earners | # Families | Median Income |
| No Earners | 1,834 (15.7%) | $53,493 |
| 1 Earner | 3,912 (33.6%) | $55,585 |
| 2 Earners | 4,793 (41.1%) | $115,766 |
| 3+ Earners | 1,118 (9.6%) | $129,500 |
| Total | 11,657 (100.0%) | $84,571 |
Household Income in Gallatin
Household Income Brackets in Gallatin
With 3,188 households falling in the category, the $100,000 to $149,999 income range is the most frequent in Gallatin, accounting for 17.8% of all households. In contrast, only 698 households (3.9%) fall into the $10,000 to $14,999 income bracket, making it the least populous group.
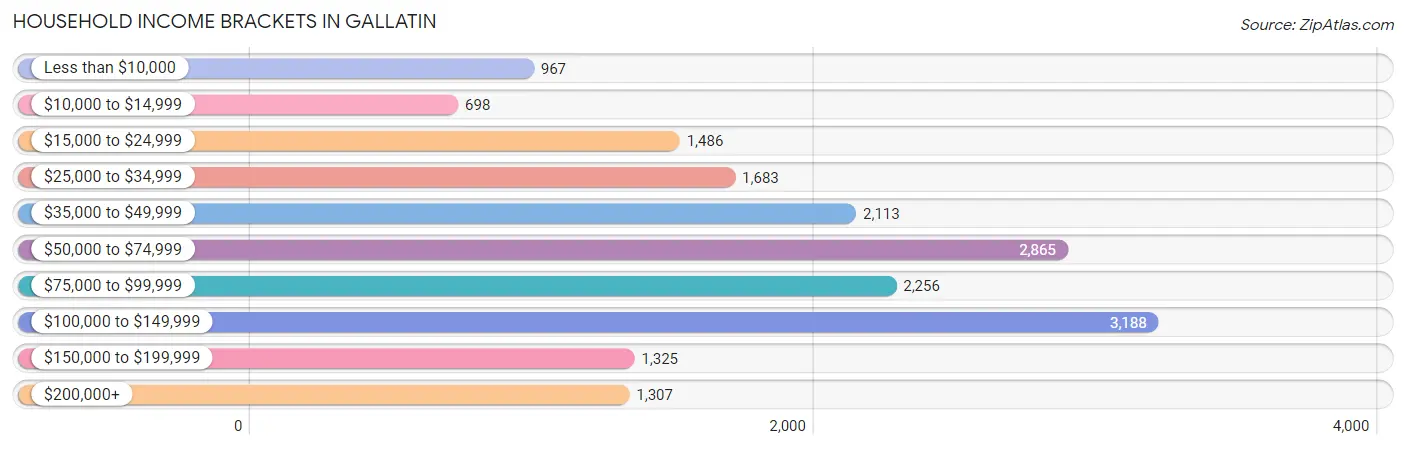
| Income Bracket | # Households | % Households |
| Less than $10,000 | 967 | 5.4% |
| $10,000 to $14,999 | 698 | 3.9% |
| $15,000 to $24,999 | 1,486 | 8.3% |
| $25,000 to $34,999 | 1,683 | 9.4% |
| $35,000 to $49,999 | 2,113 | 11.8% |
| $50,000 to $74,999 | 2,865 | 16.0% |
| $75,000 to $99,999 | 2,256 | 12.6% |
| $100,000 to $149,999 | 3,188 | 17.8% |
| $150,000 to $199,999 | 1,325 | 7.4% |
| $200,000+ | 1,307 | 7.3% |
Household Income by Householder Age in Gallatin
The median household income in Gallatin is $68,548, with the highest median household income of $81,546 found in the 45 to 64 years age bracket for the primary householder. A total of 6,206 households (34.6%) fall into this category. Meanwhile, the 15 to 24 years age bracket for the primary householder has the lowest median household income of $29,699, with 1,040 households (5.8%) in this group.
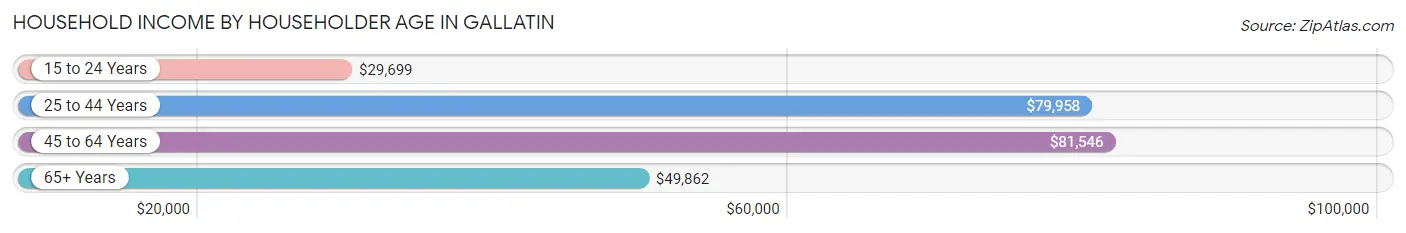
| Income Bracket | # Households | Median Income |
| 15 to 24 Years | 1,040 (5.8%) | $29,699 |
| 25 to 44 Years | 5,894 (32.9%) | $79,958 |
| 45 to 64 Years | 6,206 (34.6%) | $81,546 |
| 65+ Years | 4,768 (26.6%) | $49,862 |
| Total | 17,908 (100.0%) | $68,548 |
Poverty in Gallatin
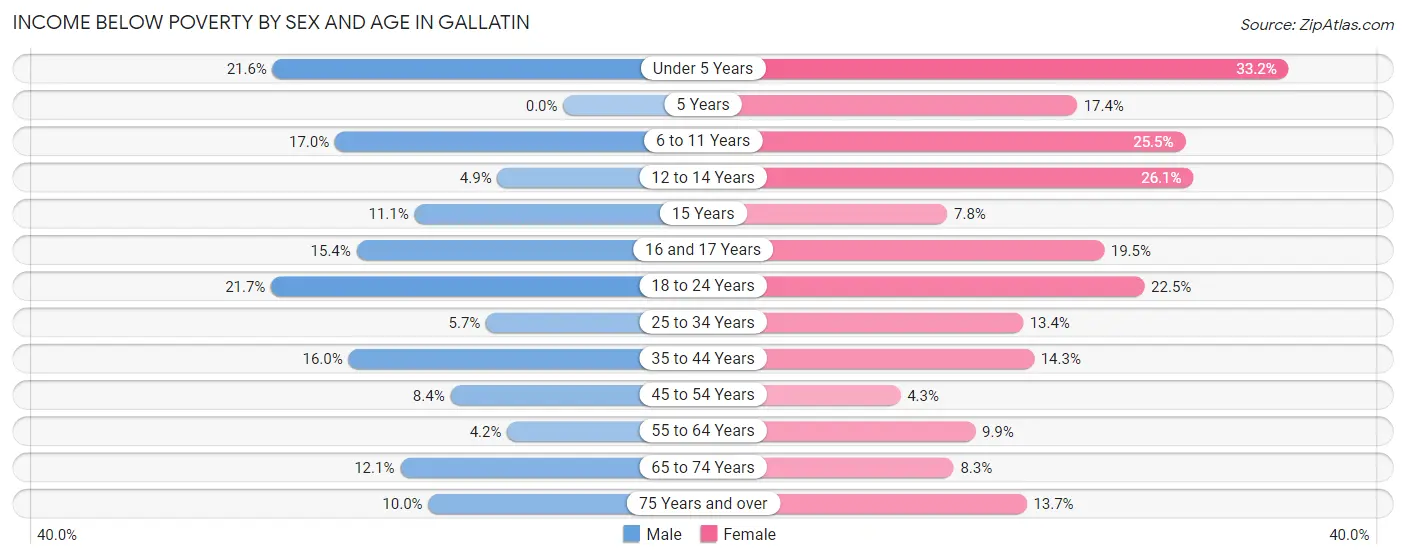
Income Below Poverty by Sex and Age in Gallatin
With 11.7% poverty level for males and 14.9% for females among the residents of Gallatin, 18 to 24 year old males and under 5 year old females are the most vulnerable to poverty, with 443 males (21.7%) and 405 females (33.2%) in their respective age groups living below the poverty level.
| Age Bracket | Male | Female |
| Under 5 Years | 312 (21.6%) | 405 (33.2%) |
| 5 Years | 0 (0.0%) | 45 (17.4%) |
| 6 to 11 Years | 323 (17.0%) | 532 (25.5%) |
| 12 to 14 Years | 43 (4.9%) | 125 (26.1%) |
| 15 Years | 20 (11.1%) | 29 (7.8%) |
| 16 and 17 Years | 68 (15.3%) | 71 (19.5%) |
| 18 to 24 Years | 443 (21.7%) | 476 (22.5%) |
| 25 to 34 Years | 178 (5.7%) | 448 (13.4%) |
| 35 to 44 Years | 428 (16.0%) | 368 (14.2%) |
| 45 to 54 Years | 233 (8.4%) | 119 (4.3%) |
| 55 to 64 Years | 104 (4.2%) | 258 (9.9%) |
| 65 to 74 Years | 264 (12.1%) | 172 (8.3%) |
| 75 Years and over | 134 (10.0%) | 262 (13.7%) |
| Total | 2,550 (11.7%) | 3,310 (14.9%) |
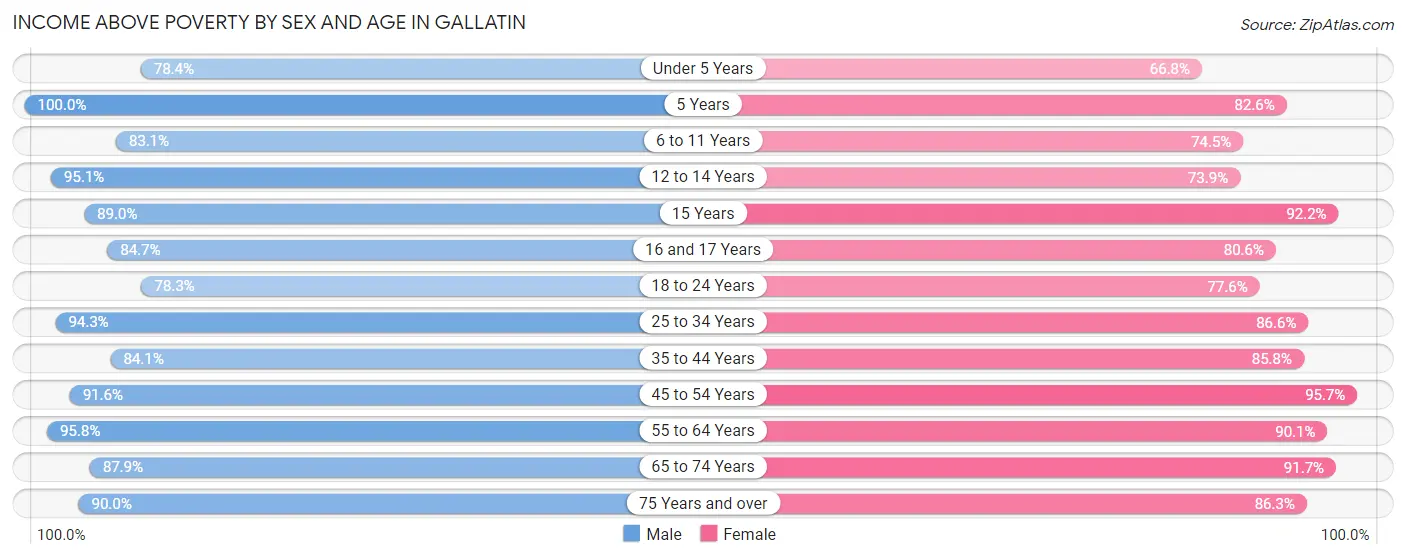
Income Above Poverty by Sex and Age in Gallatin
According to the poverty statistics in Gallatin, males aged 5 years and females aged 45 to 54 years are the age groups that are most secure financially, with 100.0% of males and 95.7% of females in these age groups living above the poverty line.
| Age Bracket | Male | Female |
| Under 5 Years | 1,134 (78.4%) | 816 (66.8%) |
| 5 Years | 236 (100.0%) | 213 (82.6%) |
| 6 to 11 Years | 1,583 (83.1%) | 1,554 (74.5%) |
| 12 to 14 Years | 836 (95.1%) | 354 (73.9%) |
| 15 Years | 161 (88.9%) | 342 (92.2%) |
| 16 and 17 Years | 375 (84.7%) | 294 (80.5%) |
| 18 to 24 Years | 1,599 (78.3%) | 1,644 (77.5%) |
| 25 to 34 Years | 2,927 (94.3%) | 2,887 (86.6%) |
| 35 to 44 Years | 2,255 (84.1%) | 2,215 (85.8%) |
| 45 to 54 Years | 2,546 (91.6%) | 2,625 (95.7%) |
| 55 to 64 Years | 2,396 (95.8%) | 2,350 (90.1%) |
| 65 to 74 Years | 1,916 (87.9%) | 1,903 (91.7%) |
| 75 Years and over | 1,203 (90.0%) | 1,649 (86.3%) |
| Total | 19,167 (88.3%) | 18,846 (85.1%) |
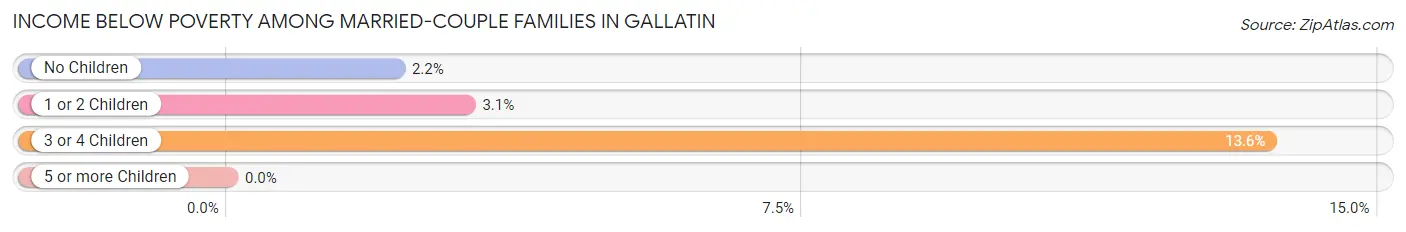
Income Below Poverty Among Married-Couple Families in Gallatin
The poverty statistics for married-couple families in Gallatin show that 3.2% or 271 of the total 8,442 families live below the poverty line. Families with 3 or 4 children have the highest poverty rate of 13.6%, comprising of 78 families. On the other hand, families with 5 or more children have the lowest poverty rate of 0.0%, which includes 0 families.
| Children | Above Poverty | Below Poverty |
| No Children | 5,164 (97.8%) | 115 (2.2%) |
| 1 or 2 Children | 2,436 (96.9%) | 78 (3.1%) |
| 3 or 4 Children | 497 (86.4%) | 78 (13.6%) |
| 5 or more Children | 74 (100.0%) | 0 (0.0%) |
| Total | 8,171 (96.8%) | 271 (3.2%) |
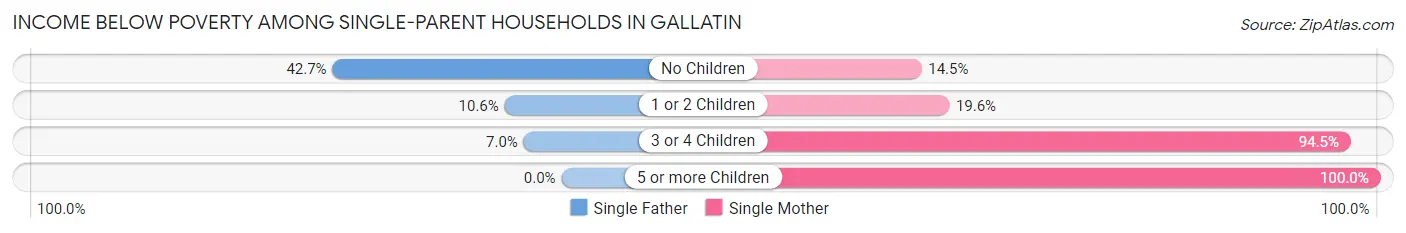
Income Below Poverty Among Single-Parent Households in Gallatin
According to the poverty data in Gallatin, 20.9% or 220 single-father households and 30.9% or 669 single-mother households are living below the poverty line. Among single-father households, those with no children have the highest poverty rate, with 151 households (42.7%) experiencing poverty. Likewise, among single-mother households, those with 5 or more children have the highest poverty rate, with 27 households (100.0%) falling below the poverty line.
| Children | Single Father | Single Mother |
| No Children | 151 (42.7%) | 94 (14.5%) |
| 1 or 2 Children | 59 (10.6%) | 224 (19.6%) |
| 3 or 4 Children | 10 (7.0%) | 324 (94.5%) |
| 5 or more Children | 0 (0.0%) | 27 (100.0%) |
| Total | 220 (20.9%) | 669 (30.9%) |
Income Below Poverty Among Married-Couple vs Single-Parent Households in Gallatin
The poverty data for Gallatin shows that 271 of the married-couple family households (3.2%) and 889 of the single-parent households (27.7%) are living below the poverty level. Within the married-couple family households, those with 3 or 4 children have the highest poverty rate, with 78 households (13.6%) falling below the poverty line. Among the single-parent households, those with 5 or more children have the highest poverty rate, with 27 household (100.0%) living below poverty.
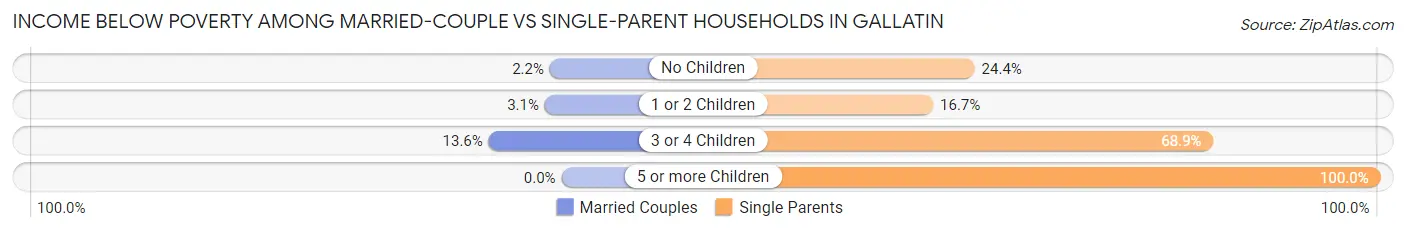
| Children | Married-Couple Families | Single-Parent Households |
| No Children | 115 (2.2%) | 245 (24.4%) |
| 1 or 2 Children | 78 (3.1%) | 283 (16.7%) |
| 3 or 4 Children | 78 (13.6%) | 334 (68.9%) |
| 5 or more Children | 0 (0.0%) | 27 (100.0%) |
| Total | 271 (3.2%) | 889 (27.7%) |
Race in Gallatin
The most populous races in Gallatin are White / Caucasian (31,203 | 69.4%), Black / African American (7,018 | 15.6%), and Hispanic or Latino (4,211 | 9.4%).
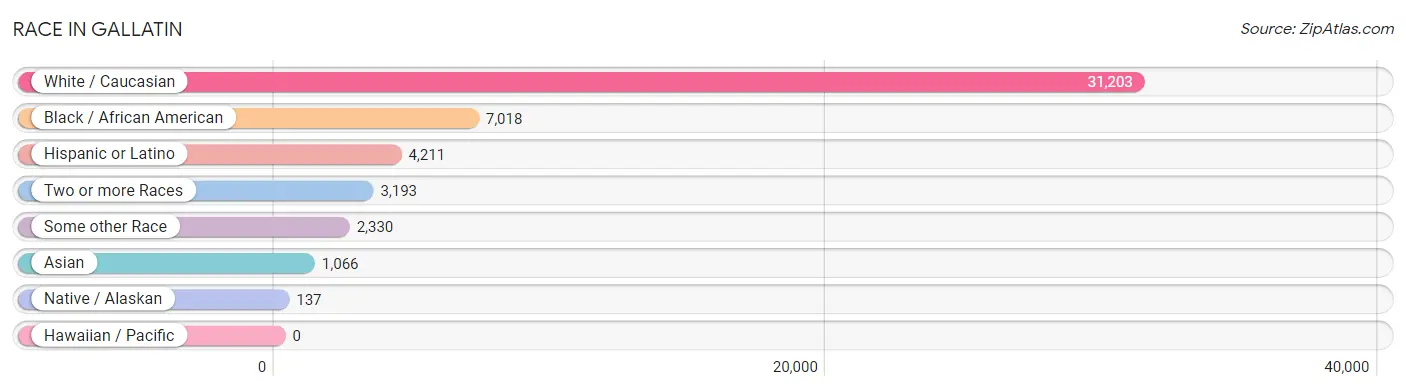
| Race | # Population | % Population |
| Asian | 1,066 | 2.4% |
| Black / African American | 7,018 | 15.6% |
| Hawaiian / Pacific | 0 | 0.0% |
| Hispanic or Latino | 4,211 | 9.4% |
| Native / Alaskan | 137 | 0.3% |
| White / Caucasian | 31,203 | 69.4% |
| Two or more Races | 3,193 | 7.1% |
| Some other Race | 2,330 | 5.2% |
| Total | 44,947 | 100.0% |
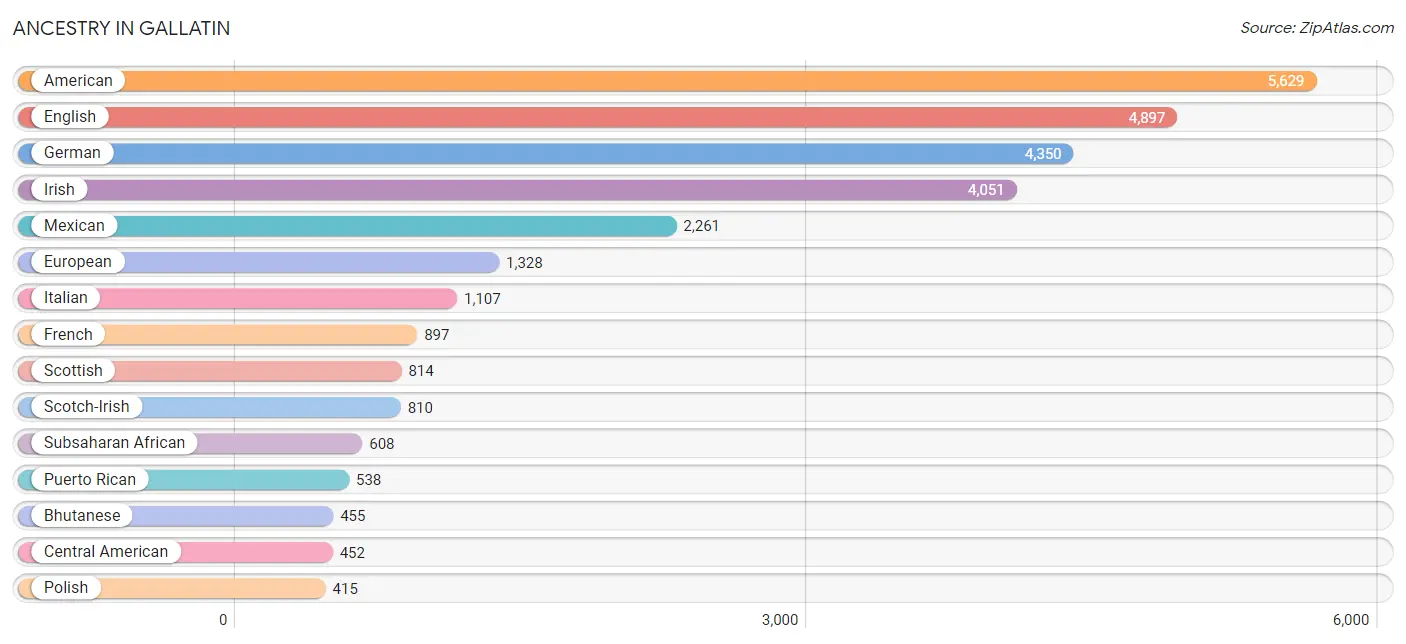
Ancestry in Gallatin
The most populous ancestries reported in Gallatin are American (5,629 | 12.5%), English (4,897 | 10.9%), German (4,350 | 9.7%), Irish (4,051 | 9.0%), and Mexican (2,261 | 5.0%), together accounting for 47.1% of all Gallatin residents.
| Ancestry | # Population | % Population |
| African | 356 | 0.8% |
| Albanian | 55 | 0.1% |
| American | 5,629 | 12.5% |
| Arab | 85 | 0.2% |
| Argentinean | 45 | 0.1% |
| Austrian | 25 | 0.1% |
| Belgian | 12 | 0.0% |
| Belizean | 68 | 0.2% |
| Bhutanese | 455 | 1.0% |
| Blackfeet | 29 | 0.1% |
| British | 206 | 0.5% |
| Burmese | 43 | 0.1% |
| Canadian | 17 | 0.0% |
| Celtic | 16 | 0.0% |
| Central American | 452 | 1.0% |
| Cherokee | 186 | 0.4% |
| Choctaw | 6 | 0.0% |
| Colombian | 23 | 0.1% |
| Creek | 63 | 0.1% |
| Croatian | 22 | 0.1% |
| Cuban | 126 | 0.3% |
| Czech | 60 | 0.1% |
| Danish | 64 | 0.1% |
| Dutch | 355 | 0.8% |
| Eastern European | 114 | 0.3% |
| Ecuadorian | 195 | 0.4% |
| English | 4,897 | 10.9% |
| European | 1,328 | 2.9% |
| Finnish | 14 | 0.0% |
| French | 897 | 2.0% |
| French Canadian | 97 | 0.2% |
| German | 4,350 | 9.7% |
| Ghanaian | 231 | 0.5% |
| Greek | 208 | 0.5% |
| Guatemalan | 9 | 0.0% |
| Honduran | 39 | 0.1% |
| Hungarian | 83 | 0.2% |
| Indian (Asian) | 221 | 0.5% |
| Irish | 4,051 | 9.0% |
| Israeli | 49 | 0.1% |
| Italian | 1,107 | 2.5% |
| Jamaican | 46 | 0.1% |
| Japanese | 135 | 0.3% |
| Korean | 221 | 0.5% |
| Lebanese | 23 | 0.1% |
| Lithuanian | 30 | 0.1% |
| Malaysian | 153 | 0.3% |
| Mexican | 2,261 | 5.0% |
| Native Hawaiian | 70 | 0.2% |
| Navajo | 40 | 0.1% |
| Nigerian | 7 | 0.0% |
| Northern European | 27 | 0.1% |
| Norwegian | 194 | 0.4% |
| Pakistani | 29 | 0.1% |
| Palestinian | 12 | 0.0% |
| Panamanian | 20 | 0.0% |
| Pennsylvania German | 39 | 0.1% |
| Polish | 415 | 0.9% |
| Portuguese | 24 | 0.1% |
| Puerto Rican | 538 | 1.2% |
| Romanian | 15 | 0.0% |
| Russian | 154 | 0.3% |
| Salvadoran | 384 | 0.9% |
| Samoan | 25 | 0.1% |
| Scandinavian | 118 | 0.3% |
| Scotch-Irish | 810 | 1.8% |
| Scottish | 814 | 1.8% |
| Serbian | 22 | 0.1% |
| Slovak | 28 | 0.1% |
| South American | 311 | 0.7% |
| Spaniard | 86 | 0.2% |
| Sri Lankan | 93 | 0.2% |
| Subsaharan African | 608 | 1.3% |
| Swedish | 201 | 0.4% |
| Swiss | 59 | 0.1% |
| Thai | 373 | 0.8% |
| Ukrainian | 54 | 0.1% |
| Venezuelan | 48 | 0.1% |
| Welsh | 158 | 0.4% | View All 79 Rows |
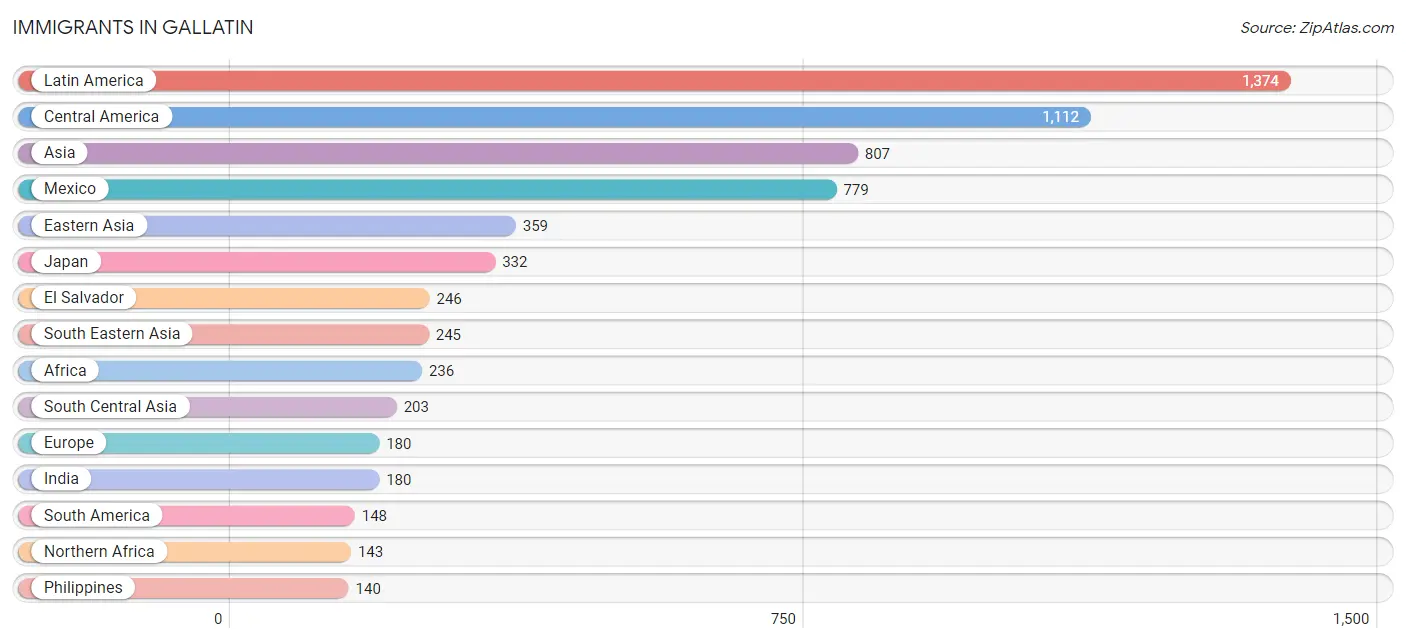
Immigrants in Gallatin
The most numerous immigrant groups reported in Gallatin came from Latin America (1,374 | 3.1%), Central America (1,112 | 2.5%), Asia (807 | 1.8%), Mexico (779 | 1.7%), and Eastern Asia (359 | 0.8%), together accounting for 9.9% of all Gallatin residents.
| Immigration Origin | # Population | % Population |
| Africa | 236 | 0.5% |
| Argentina | 45 | 0.1% |
| Asia | 807 | 1.8% |
| Australia | 40 | 0.1% |
| Belize | 34 | 0.1% |
| Bosnia and Herzegovina | 22 | 0.1% |
| Brazil | 23 | 0.1% |
| Cambodia | 30 | 0.1% |
| Canada | 64 | 0.1% |
| Caribbean | 114 | 0.3% |
| Central America | 1,112 | 2.5% |
| China | 3 | 0.0% |
| Colombia | 8 | 0.0% |
| Cuba | 95 | 0.2% |
| Denmark | 6 | 0.0% |
| Eastern Asia | 359 | 0.8% |
| Eastern Europe | 86 | 0.2% |
| Ecuador | 49 | 0.1% |
| El Salvador | 246 | 0.5% |
| England | 36 | 0.1% |
| Europe | 180 | 0.4% |
| Germany | 15 | 0.0% |
| Ghana | 93 | 0.2% |
| Greece | 15 | 0.0% |
| Guatemala | 9 | 0.0% |
| Honduras | 39 | 0.1% |
| India | 180 | 0.4% |
| Jamaica | 19 | 0.0% |
| Japan | 332 | 0.7% |
| Korea | 24 | 0.1% |
| Latin America | 1,374 | 3.1% |
| Mexico | 779 | 1.7% |
| Northern Africa | 143 | 0.3% |
| Northern Europe | 64 | 0.1% |
| Oceania | 40 | 0.1% |
| Panama | 5 | 0.0% |
| Philippines | 140 | 0.3% |
| Russia | 9 | 0.0% |
| South America | 148 | 0.3% |
| South Central Asia | 203 | 0.4% |
| South Eastern Asia | 245 | 0.5% |
| Southern Europe | 15 | 0.0% |
| Sri Lanka | 23 | 0.1% |
| Sudan | 128 | 0.3% |
| Thailand | 6 | 0.0% |
| Venezuela | 23 | 0.1% |
| Vietnam | 69 | 0.2% |
| Western Africa | 93 | 0.2% |
| Western Europe | 15 | 0.0% | View All 49 Rows |
Sex and Age in Gallatin
Sex and Age in Gallatin
The most populous age groups in Gallatin are 25 to 29 Years (1,954 | 8.7%) for men and 5 to 9 Years (1,923 | 8.5%) for women.
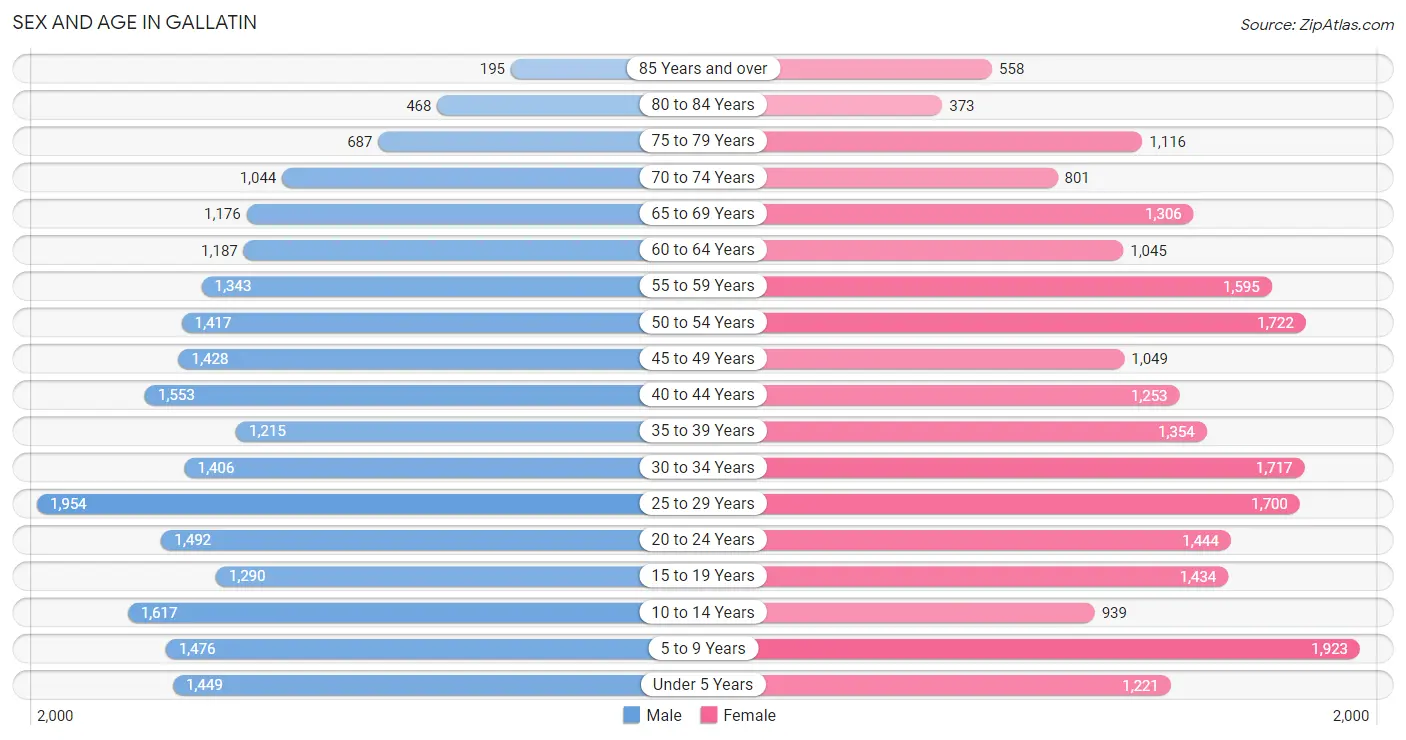
| Age Bracket | Male | Female |
| Under 5 Years | 1,449 (6.5%) | 1,221 (5.4%) |
| 5 to 9 Years | 1,476 (6.6%) | 1,923 (8.5%) |
| 10 to 14 Years | 1,617 (7.2%) | 939 (4.2%) |
| 15 to 19 Years | 1,290 (5.8%) | 1,434 (6.4%) |
| 20 to 24 Years | 1,492 (6.7%) | 1,444 (6.4%) |
| 25 to 29 Years | 1,954 (8.7%) | 1,700 (7.5%) |
| 30 to 34 Years | 1,406 (6.3%) | 1,717 (7.6%) |
| 35 to 39 Years | 1,215 (5.4%) | 1,354 (6.0%) |
| 40 to 44 Years | 1,553 (6.9%) | 1,253 (5.6%) |
| 45 to 49 Years | 1,428 (6.4%) | 1,049 (4.6%) |
| 50 to 54 Years | 1,417 (6.3%) | 1,722 (7.6%) |
| 55 to 59 Years | 1,343 (6.0%) | 1,595 (7.1%) |
| 60 to 64 Years | 1,187 (5.3%) | 1,045 (4.6%) |
| 65 to 69 Years | 1,176 (5.2%) | 1,306 (5.8%) |
| 70 to 74 Years | 1,044 (4.7%) | 801 (3.5%) |
| 75 to 79 Years | 687 (3.1%) | 1,116 (5.0%) |
| 80 to 84 Years | 468 (2.1%) | 373 (1.7%) |
| 85 Years and over | 195 (0.9%) | 558 (2.5%) |
| Total | 22,397 (100.0%) | 22,550 (100.0%) |
Families and Households in Gallatin
Median Family Size in Gallatin
The median family size in Gallatin is 3.03 persons per family, with single female/mother families (2,162 | 18.5%) accounting for the largest median family size of 3.25 persons per family. On the other hand, single male/father families (1,053 | 9.0%) represent the smallest median family size with 2.40 persons per family.
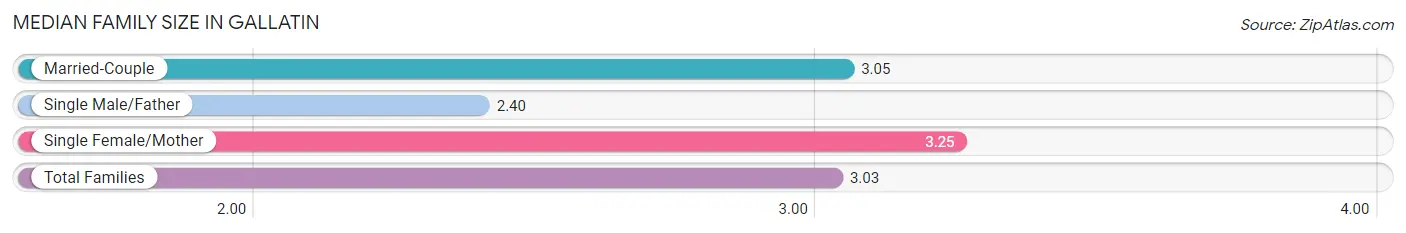
| Family Type | # Families | Family Size |
| Married-Couple | 8,442 (72.4%) | 3.05 |
| Single Male/Father | 1,053 (9.0%) | 2.40 |
| Single Female/Mother | 2,162 (18.5%) | 3.25 |
| Total Families | 11,657 (100.0%) | 3.03 |
Median Household Size in Gallatin
The median household size in Gallatin is 2.46 persons per household, with single female/mother households (2,162 | 12.1%) accounting for the largest median household size of 3.37 persons per household. non-family households (6,251 | 34.9%) represent the smallest median household size with 1.22 persons per household.
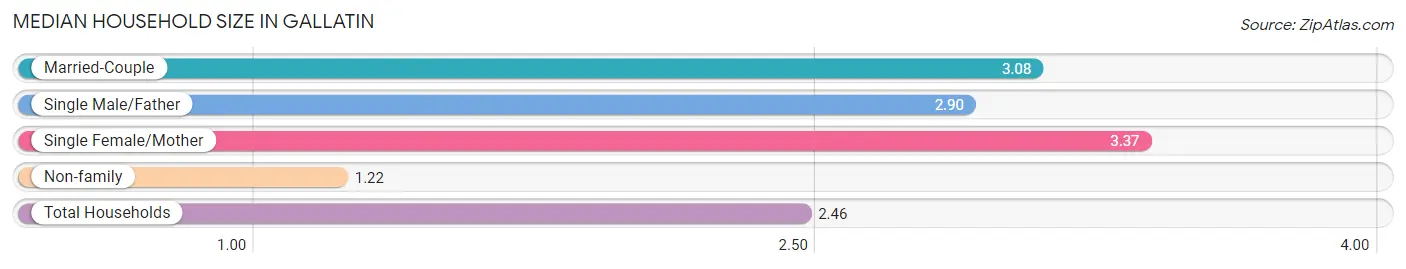
| Household Type | # Households | Household Size |
| Married-Couple | 8,442 (47.1%) | 3.08 |
| Single Male/Father | 1,053 (5.9%) | 2.90 |
| Single Female/Mother | 2,162 (12.1%) | 3.37 |
| Non-family | 6,251 (34.9%) | 1.22 |
| Total Households | 17,908 (100.0%) | 2.46 |
Household Size by Marriage Status in Gallatin
Out of a total of 17,908 households in Gallatin, 11,657 (65.1%) are family households, while 6,251 (34.9%) are nonfamily households. The most numerous type of family households are 2-person households, comprising 5,295, and the most common type of nonfamily households are 1-person households, comprising 5,088.
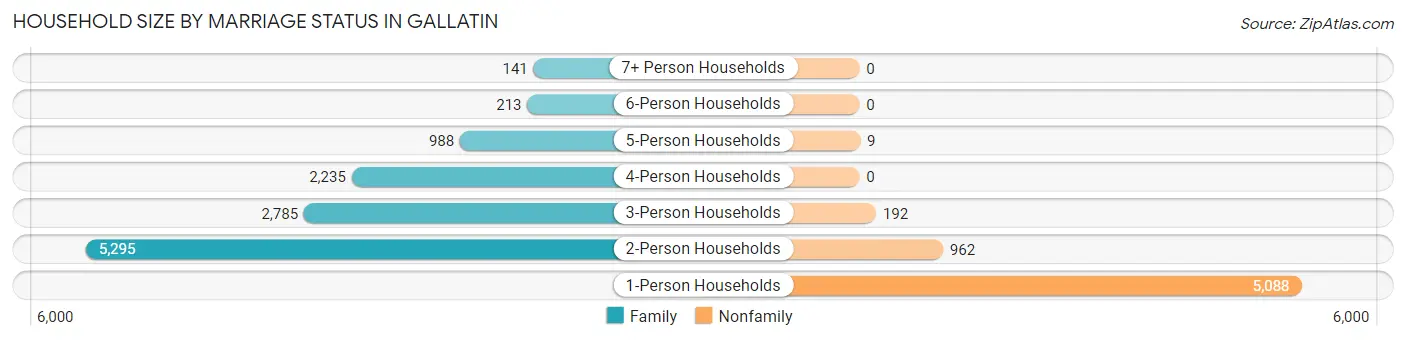
| Household Size | Family Households | Nonfamily Households |
| 1-Person Households | - | 5,088 (28.4%) |
| 2-Person Households | 5,295 (29.6%) | 962 (5.4%) |
| 3-Person Households | 2,785 (15.5%) | 192 (1.1%) |
| 4-Person Households | 2,235 (12.5%) | 0 (0.0%) |
| 5-Person Households | 988 (5.5%) | 9 (0.1%) |
| 6-Person Households | 213 (1.2%) | 0 (0.0%) |
| 7+ Person Households | 141 (0.8%) | 0 (0.0%) |
| Total | 11,657 (65.1%) | 6,251 (34.9%) |
Female Fertility in Gallatin
Fertility by Age in Gallatin
Average fertility rate in Gallatin is 66.0 births per 1,000 women. Women in the age bracket of 20 to 34 years have the highest fertility rate with 134.0 births per 1,000 women. Women in the age bracket of 20 to 34 years acount for 96.6% of all women with births.
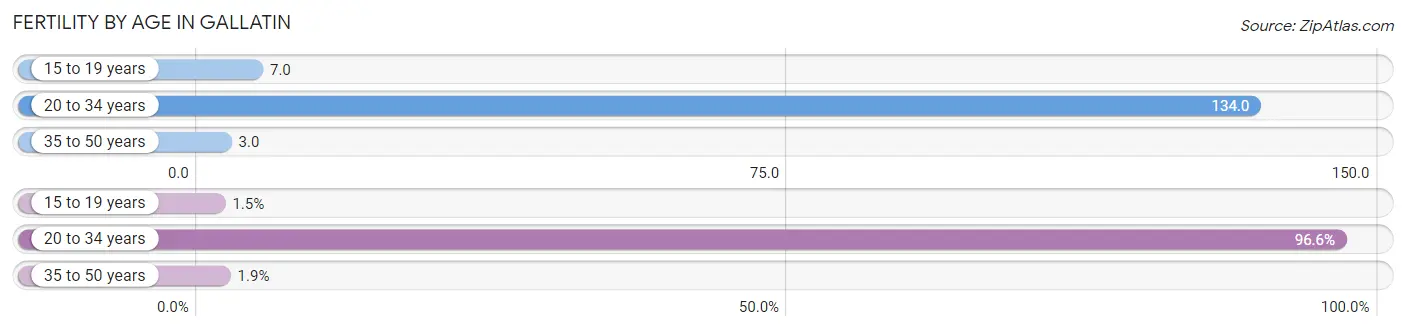
| Age Bracket | Women with Births | Births / 1,000 Women |
| 15 to 19 years | 10 (1.5%) | 7.0 |
| 20 to 34 years | 653 (96.6%) | 134.0 |
| 35 to 50 years | 13 (1.9%) | 3.0 |
| Total | 676 (100.0%) | 66.0 |
Fertility by Age by Marriage Status in Gallatin
50.1% of women with births (676) in Gallatin are married. The highest percentage of unmarried women with births falls into 15 to 19 years age bracket with 100.0% of them unmarried at the time of birth, while the lowest percentage of unmarried women with births belong to 20 to 34 years age bracket with 48.7% of them unmarried.
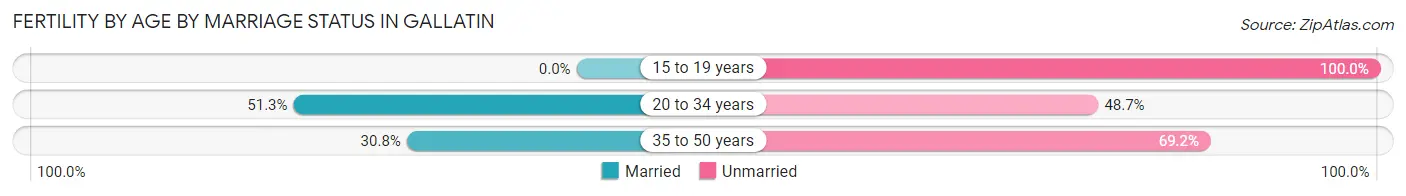
| Age Bracket | Married | Unmarried |
| 15 to 19 years | 0 (0.0%) | 10 (100.0%) |
| 20 to 34 years | 335 (51.3%) | 318 (48.7%) |
| 35 to 50 years | 4 (30.8%) | 9 (69.2%) |
| Total | 339 (50.1%) | 337 (49.8%) |
Fertility by Education in Gallatin
Average fertility rate in Gallatin is 66.0 births per 1,000 women. Women with the education attainment of high school diploma have the highest fertility rate of 121.0 births per 1,000 women, while women with the education attainment of graduate degree have the lowest fertility at 19.0 births per 1,000 women. Women with the education attainment of college or associate's degree represent 41.0% of all women with births.
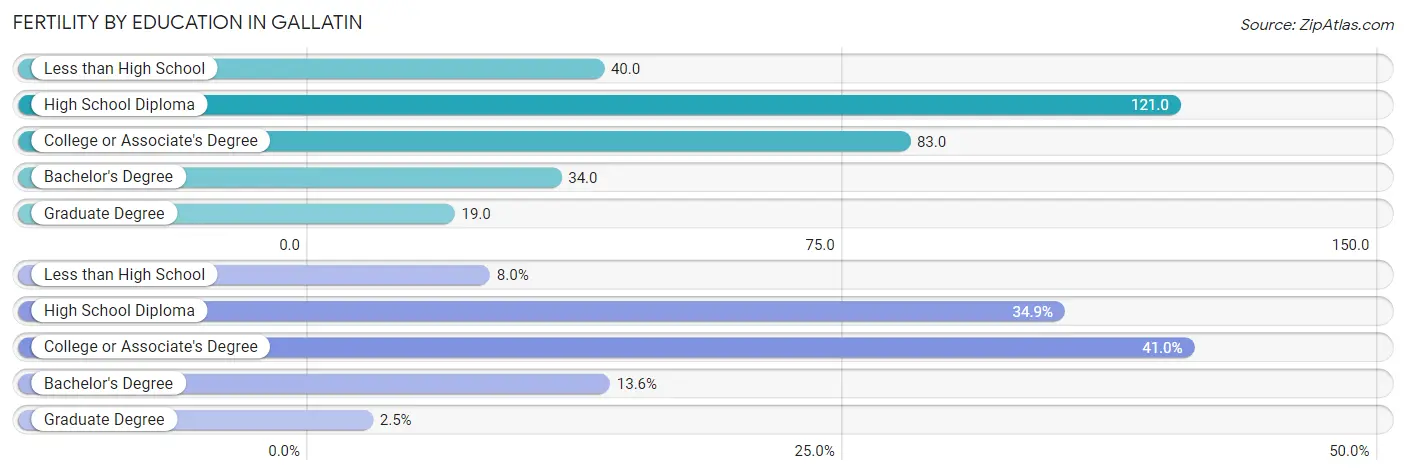
| Educational Attainment | Women with Births | Births / 1,000 Women |
| Less than High School | 54 (8.0%) | 40.0 |
| High School Diploma | 236 (34.9%) | 121.0 |
| College or Associate's Degree | 277 (41.0%) | 83.0 |
| Bachelor's Degree | 92 (13.6%) | 34.0 |
| Graduate Degree | 17 (2.5%) | 19.0 |
| Total | 676 (100.0%) | 66.0 |
Fertility by Education by Marriage Status in Gallatin
49.8% of women with births in Gallatin are unmarried. Women with the educational attainment of graduate degree are most likely to be married with 100.0% of them married at childbirth, while women with the educational attainment of less than high school are least likely to be married with 100.0% of them unmarried at childbirth.
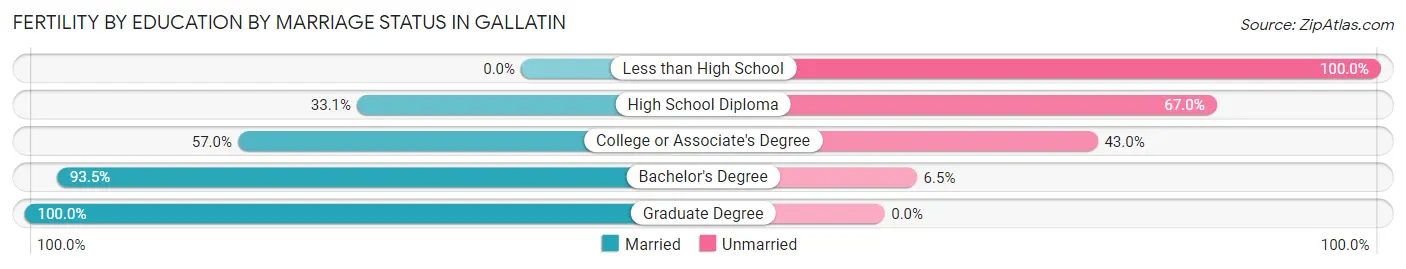
| Educational Attainment | Married | Unmarried |
| Less than High School | 0 (0.0%) | 54 (100.0%) |
| High School Diploma | 78 (33.1%) | 158 (66.9%) |
| College or Associate's Degree | 158 (57.0%) | 119 (43.0%) |
| Bachelor's Degree | 86 (93.5%) | 6 (6.5%) |
| Graduate Degree | 17 (100.0%) | 0 (0.0%) |
| Total | 339 (50.1%) | 337 (49.8%) |
Employment Characteristics in Gallatin
Employment by Class of Employer in Gallatin
Among the 21,364 employed individuals in Gallatin, private company employees (16,059 | 75.2%), not-for-profit organizations (1,490 | 7.0%), and local government employees (1,393 | 6.5%) make up the most common classes of employment.
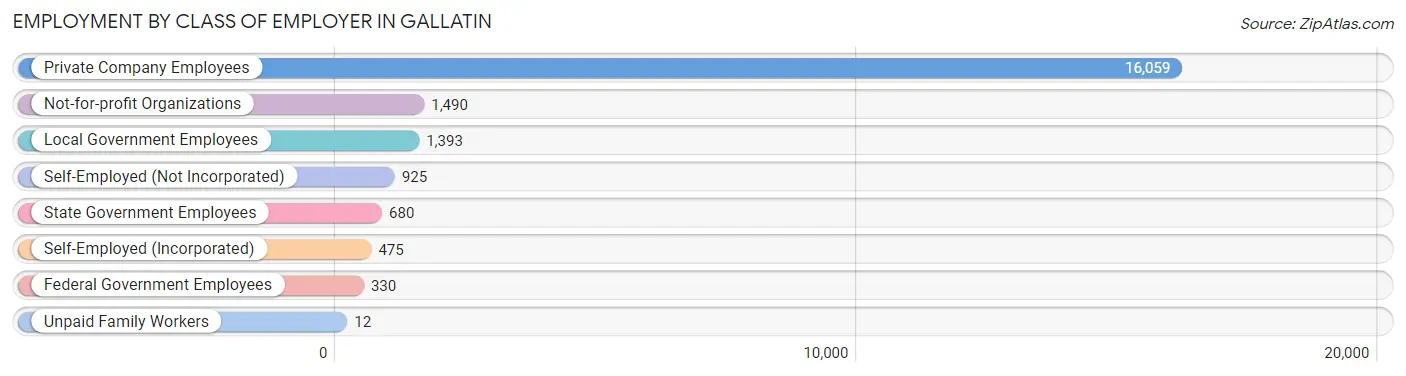
| Employer Class | # Employees | % Employees |
| Private Company Employees | 16,059 | 75.2% |
| Self-Employed (Incorporated) | 475 | 2.2% |
| Self-Employed (Not Incorporated) | 925 | 4.3% |
| Not-for-profit Organizations | 1,490 | 7.0% |
| Local Government Employees | 1,393 | 6.5% |
| State Government Employees | 680 | 3.2% |
| Federal Government Employees | 330 | 1.5% |
| Unpaid Family Workers | 12 | 0.1% |
| Total | 21,364 | 100.0% |
Employment Status by Age in Gallatin
According to the labor force statistics for Gallatin, out of the total population over 16 years of age (35,770), 63.1% or 22,571 individuals are in the labor force, with 3.2% or 722 of them unemployed. The age group with the highest labor force participation rate is 45 to 54 years, with 85.2% or 4,785 individuals in the labor force. Within the labor force, the 55 to 59 years age range has the highest percentage of unemployed individuals, with 8.3% or 186 of them being unemployed.
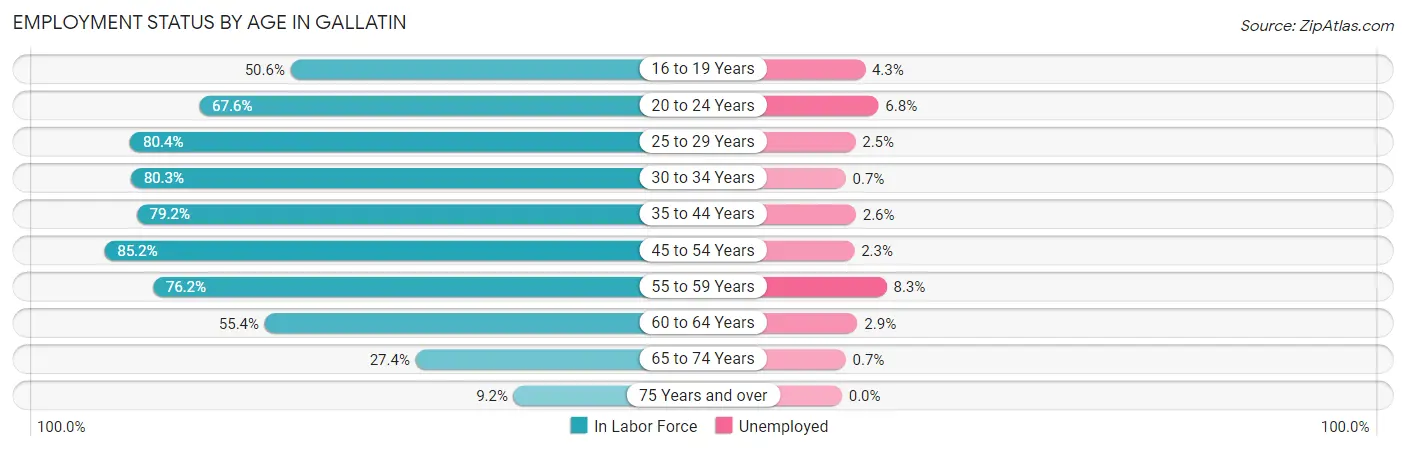
| Age Bracket | In Labor Force | Unemployed |
| 16 to 19 Years | 1,099 (50.6%) | 47 (4.3%) |
| 20 to 24 Years | 1,985 (67.6%) | 135 (6.8%) |
| 25 to 29 Years | 2,938 (80.4%) | 73 (2.5%) |
| 30 to 34 Years | 2,508 (80.3%) | 18 (0.7%) |
| 35 to 44 Years | 4,257 (79.2%) | 111 (2.6%) |
| 45 to 54 Years | 4,785 (85.2%) | 110 (2.3%) |
| 55 to 59 Years | 2,239 (76.2%) | 186 (8.3%) |
| 60 to 64 Years | 1,237 (55.4%) | 36 (2.9%) |
| 65 to 74 Years | 1,186 (27.4%) | 8 (0.7%) |
| 75 Years and over | 313 (9.2%) | 0 (0.0%) |
| Total | 22,571 (63.1%) | 722 (3.2%) |
Employment Status by Educational Attainment in Gallatin
According to labor force statistics for Gallatin, 78.3% of individuals (17,960) out of the total population between 25 and 64 years of age (22,938) are in the labor force, with 3.0% or 539 of them being unemployed. The group with the highest labor force participation rate are those with the educational attainment of bachelor's degree or higher, with 87.1% or 6,625 individuals in the labor force. Within the labor force, individuals with less than high school education have the highest percentage of unemployment, with 12.6% or 185 of them being unemployed.
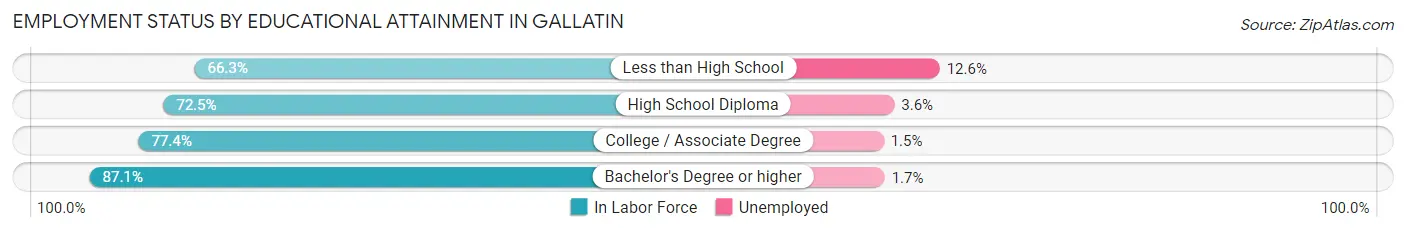
| Educational Attainment | In Labor Force | Unemployed |
| Less than High School | 1,470 (66.3%) | 279 (12.6%) |
| High School Diploma | 4,126 (72.5%) | 205 (3.6%) |
| College / Associate Degree | 5,746 (77.4%) | 111 (1.5%) |
| Bachelor's Degree or higher | 6,625 (87.1%) | 129 (1.7%) |
| Total | 17,960 (78.3%) | 688 (3.0%) |
Employment Occupations by Sex in Gallatin
Management, Business, Science and Arts Occupations
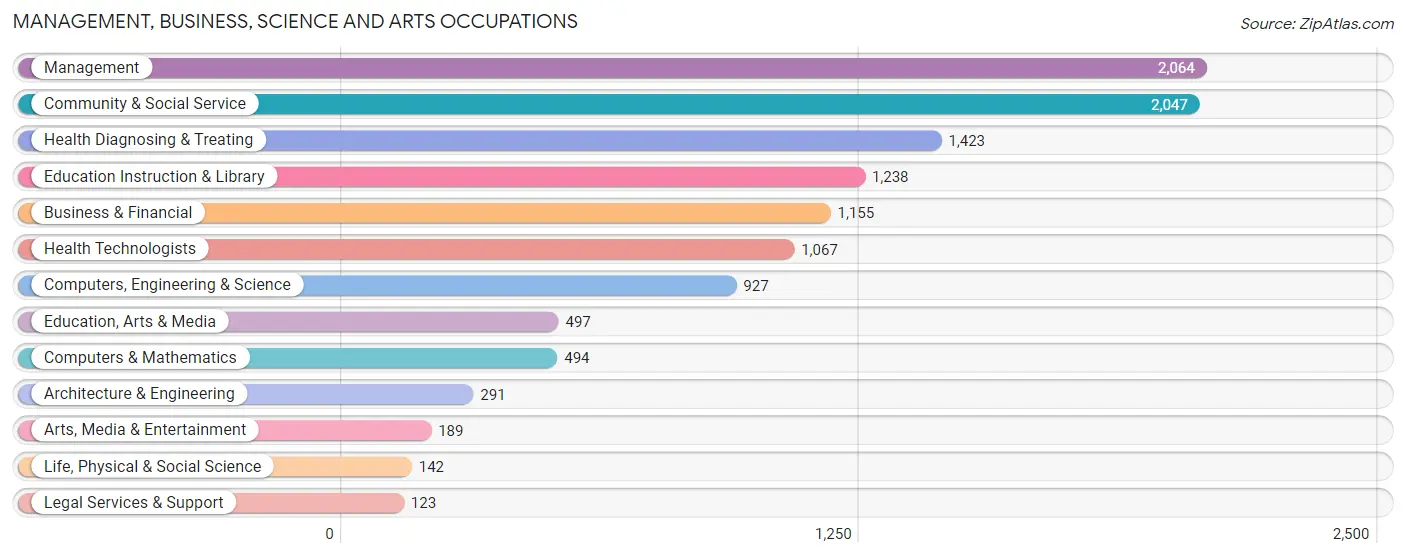
The most common Management, Business, Science and Arts occupations in Gallatin are Management (2,064 | 9.5%), Community & Social Service (2,047 | 9.4%), Health Diagnosing & Treating (1,423 | 6.5%), Education Instruction & Library (1,238 | 5.7%), and Business & Financial (1,155 | 5.3%).
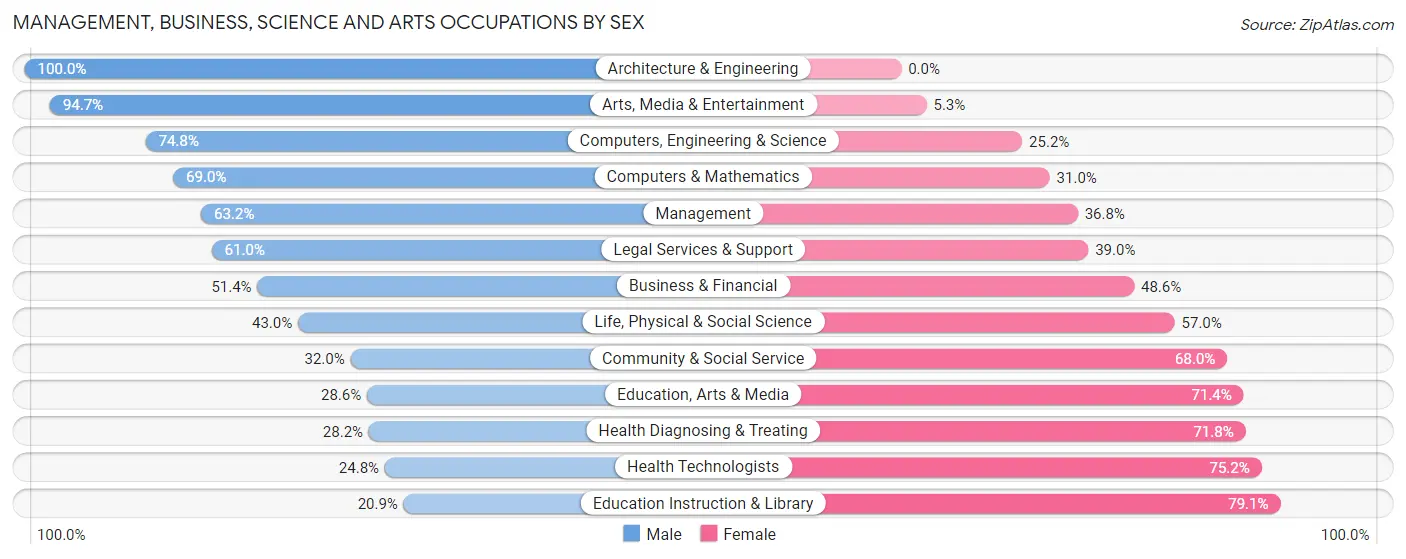
Management, Business, Science and Arts Occupations by Sex
Within the Management, Business, Science and Arts occupations in Gallatin, the most male-oriented occupations are Architecture & Engineering (100.0%), Arts, Media & Entertainment (94.7%), and Computers, Engineering & Science (74.8%), while the most female-oriented occupations are Education Instruction & Library (79.1%), Health Technologists (75.2%), and Health Diagnosing & Treating (71.8%).
| Occupation | Male | Female |
| Management | 1,304 (63.2%) | 760 (36.8%) |
| Business & Financial | 594 (51.4%) | 561 (48.6%) |
| Computers, Engineering & Science | 693 (74.8%) | 234 (25.2%) |
| Computers & Mathematics | 341 (69.0%) | 153 (31.0%) |
| Architecture & Engineering | 291 (100.0%) | 0 (0.0%) |
| Life, Physical & Social Science | 61 (43.0%) | 81 (57.0%) |
| Community & Social Service | 655 (32.0%) | 1,392 (68.0%) |
| Education, Arts & Media | 142 (28.6%) | 355 (71.4%) |
| Legal Services & Support | 75 (61.0%) | 48 (39.0%) |
| Education Instruction & Library | 259 (20.9%) | 979 (79.1%) |
| Arts, Media & Entertainment | 179 (94.7%) | 10 (5.3%) |
| Health Diagnosing & Treating | 401 (28.2%) | 1,022 (71.8%) |
| Health Technologists | 265 (24.8%) | 802 (75.2%) |
| Total (Category) | 3,647 (47.9%) | 3,969 (52.1%) |
| Total (Overall) | 11,511 (52.8%) | 10,277 (47.2%) |
Services Occupations
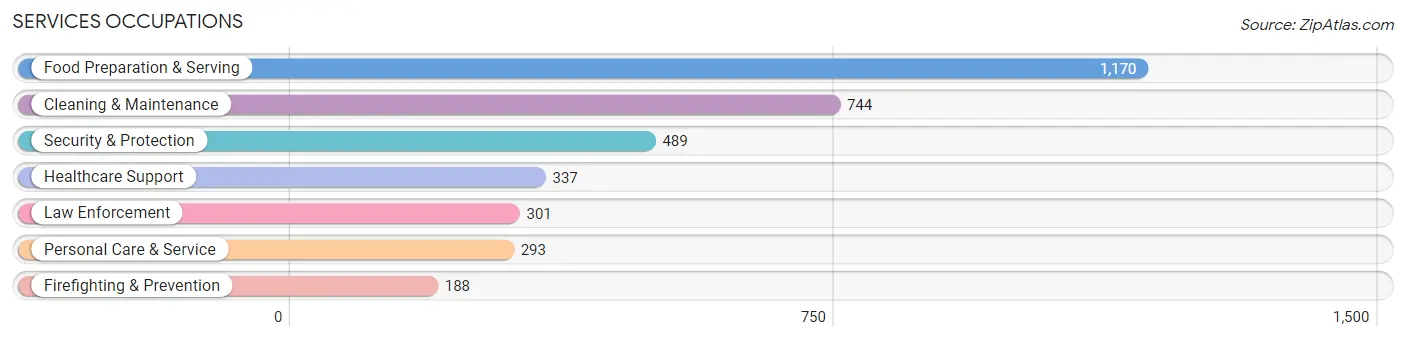
The most common Services occupations in Gallatin are Food Preparation & Serving (1,170 | 5.4%), Cleaning & Maintenance (744 | 3.4%), Security & Protection (489 | 2.2%), Healthcare Support (337 | 1.5%), and Law Enforcement (301 | 1.4%).
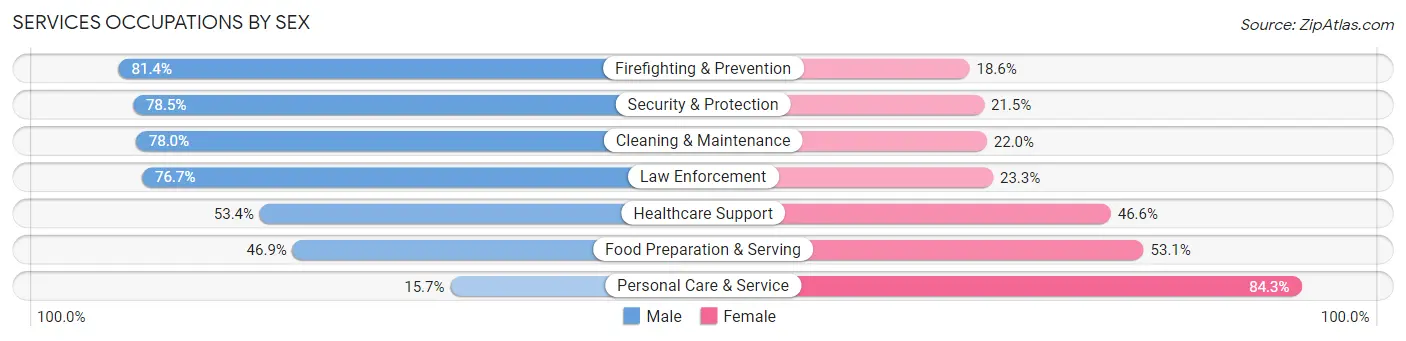
Services Occupations by Sex
Within the Services occupations in Gallatin, the most male-oriented occupations are Firefighting & Prevention (81.4%), Security & Protection (78.5%), and Cleaning & Maintenance (78.0%), while the most female-oriented occupations are Personal Care & Service (84.3%), Food Preparation & Serving (53.1%), and Healthcare Support (46.6%).
| Occupation | Male | Female |
| Healthcare Support | 180 (53.4%) | 157 (46.6%) |
| Security & Protection | 384 (78.5%) | 105 (21.5%) |
| Firefighting & Prevention | 153 (81.4%) | 35 (18.6%) |
| Law Enforcement | 231 (76.7%) | 70 (23.3%) |
| Food Preparation & Serving | 549 (46.9%) | 621 (53.1%) |
| Cleaning & Maintenance | 580 (78.0%) | 164 (22.0%) |
| Personal Care & Service | 46 (15.7%) | 247 (84.3%) |
| Total (Category) | 1,739 (57.3%) | 1,294 (42.7%) |
| Total (Overall) | 11,511 (52.8%) | 10,277 (47.2%) |
Sales and Office Occupations
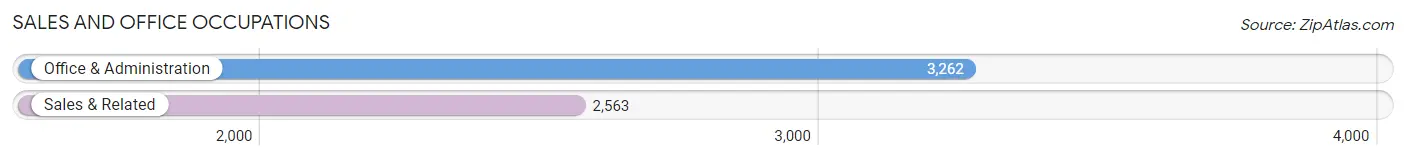
The most common Sales and Office occupations in Gallatin are Office & Administration (3,262 | 15.0%), and Sales & Related (2,563 | 11.8%).
Sales and Office Occupations by Sex
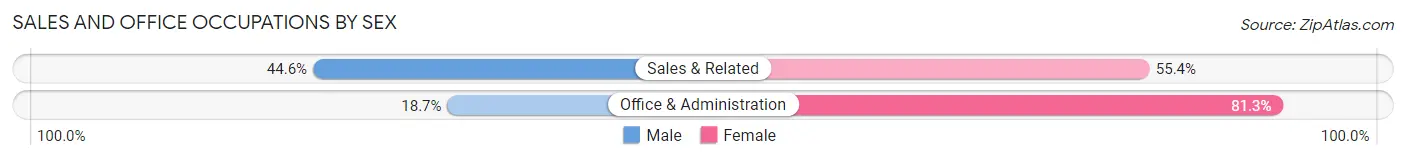
| Occupation | Male | Female |
| Sales & Related | 1,142 (44.6%) | 1,421 (55.4%) |
| Office & Administration | 610 (18.7%) | 2,652 (81.3%) |
| Total (Category) | 1,752 (30.1%) | 4,073 (69.9%) |
| Total (Overall) | 11,511 (52.8%) | 10,277 (47.2%) |
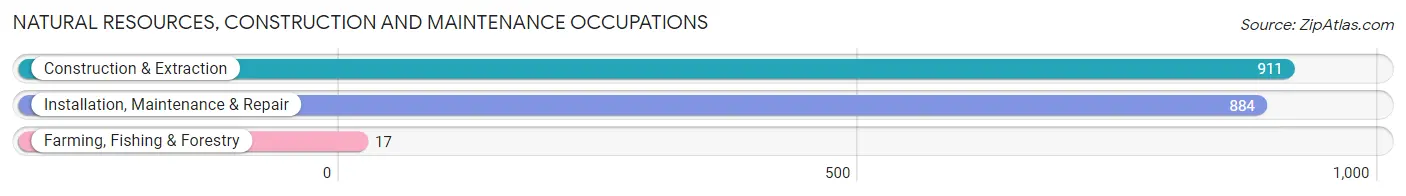
Natural Resources, Construction and Maintenance Occupations
The most common Natural Resources, Construction and Maintenance occupations in Gallatin are Construction & Extraction (911 | 4.2%), Installation, Maintenance & Repair (884 | 4.1%), and Farming, Fishing & Forestry (17 | 0.1%).
Natural Resources, Construction and Maintenance Occupations by Sex
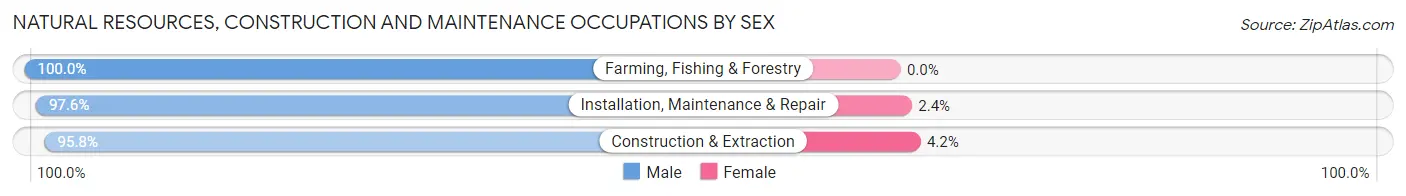
| Occupation | Male | Female |
| Farming, Fishing & Forestry | 17 (100.0%) | 0 (0.0%) |
| Construction & Extraction | 873 (95.8%) | 38 (4.2%) |
| Installation, Maintenance & Repair | 863 (97.6%) | 21 (2.4%) |
| Total (Category) | 1,753 (96.7%) | 59 (3.3%) |
| Total (Overall) | 11,511 (52.8%) | 10,277 (47.2%) |
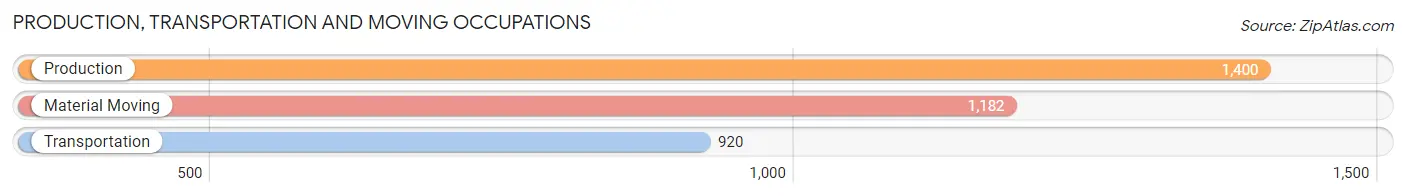
Production, Transportation and Moving Occupations
The most common Production, Transportation and Moving occupations in Gallatin are Production (1,400 | 6.4%), Material Moving (1,182 | 5.4%), and Transportation (920 | 4.2%).
Production, Transportation and Moving Occupations by Sex
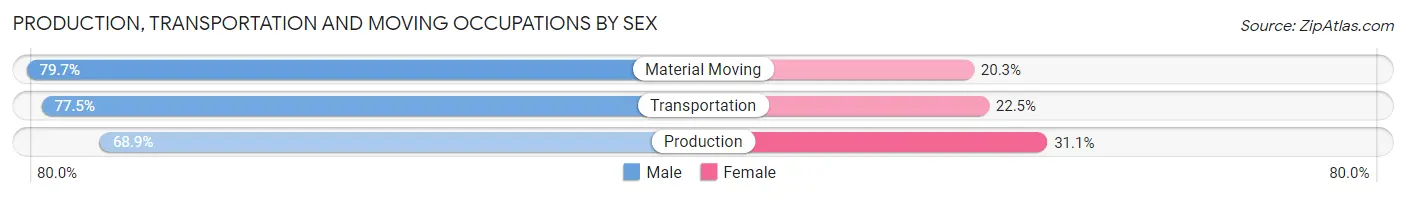
| Occupation | Male | Female |
| Production | 965 (68.9%) | 435 (31.1%) |
| Transportation | 713 (77.5%) | 207 (22.5%) |
| Material Moving | 942 (79.7%) | 240 (20.3%) |
| Total (Category) | 2,620 (74.8%) | 882 (25.2%) |
| Total (Overall) | 11,511 (52.8%) | 10,277 (47.2%) |
Employment Industries by Sex in Gallatin
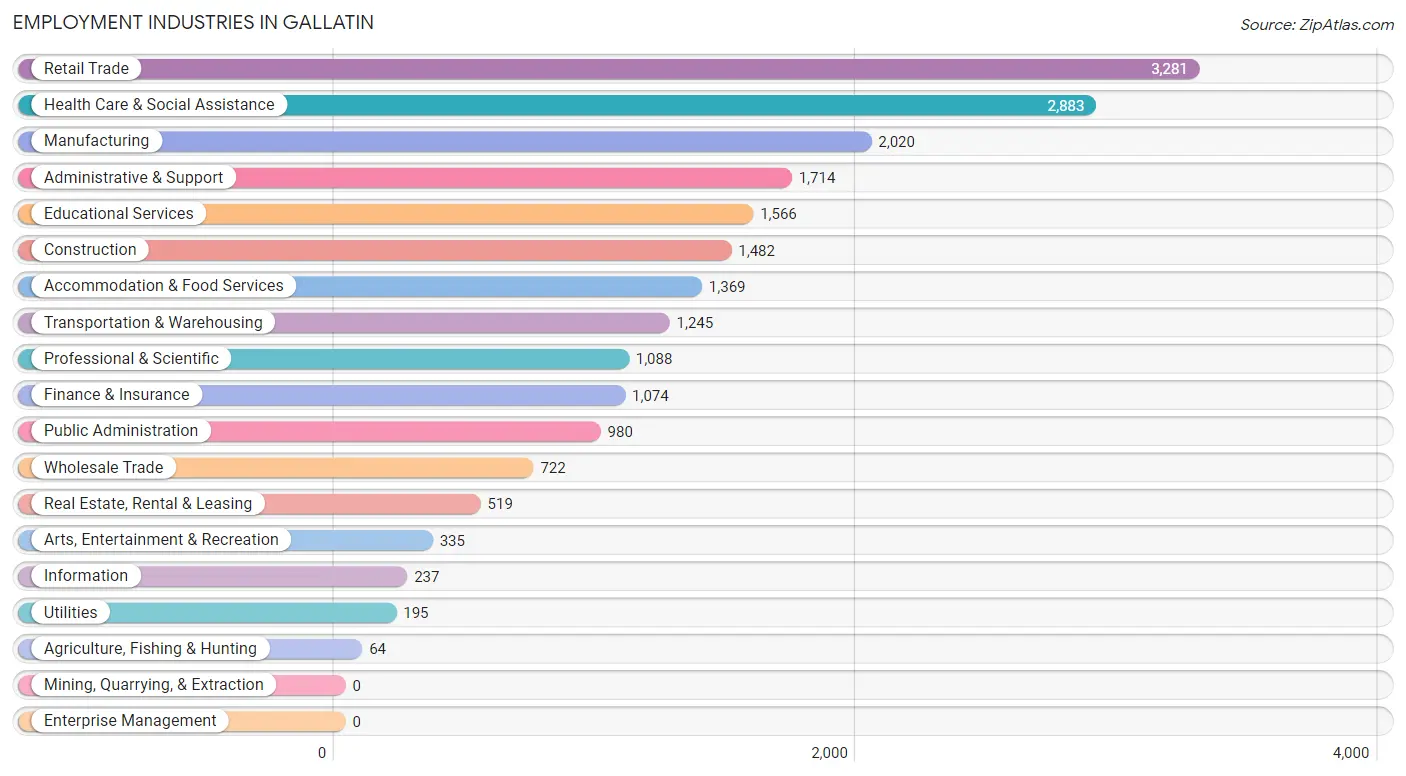
Employment Industries in Gallatin
The major employment industries in Gallatin include Retail Trade (3,281 | 15.1%), Health Care & Social Assistance (2,883 | 13.2%), Manufacturing (2,020 | 9.3%), Administrative & Support (1,714 | 7.9%), and Educational Services (1,566 | 7.2%).
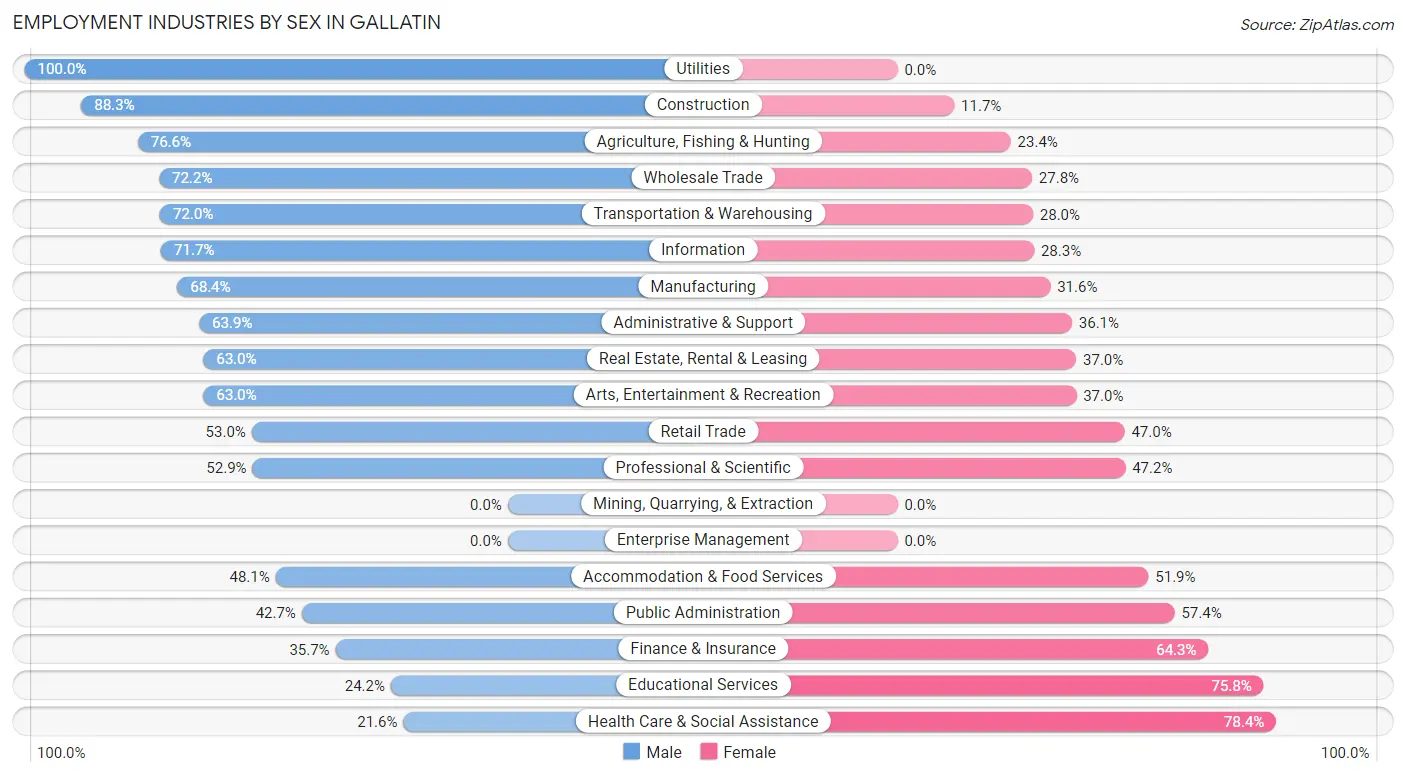
Employment Industries by Sex in Gallatin
The Gallatin industries that see more men than women are Utilities (100.0%), Construction (88.3%), and Agriculture, Fishing & Hunting (76.6%), whereas the industries that tend to have a higher number of women are Health Care & Social Assistance (78.4%), Educational Services (75.8%), and Finance & Insurance (64.3%).
| Industry | Male | Female |
| Agriculture, Fishing & Hunting | 49 (76.6%) | 15 (23.4%) |
| Mining, Quarrying, & Extraction | 0 (0.0%) | 0 (0.0%) |
| Construction | 1,308 (88.3%) | 174 (11.7%) |
| Manufacturing | 1,381 (68.4%) | 639 (31.6%) |
| Wholesale Trade | 521 (72.2%) | 201 (27.8%) |
| Retail Trade | 1,739 (53.0%) | 1,542 (47.0%) |
| Transportation & Warehousing | 896 (72.0%) | 349 (28.0%) |
| Utilities | 195 (100.0%) | 0 (0.0%) |
| Information | 170 (71.7%) | 67 (28.3%) |
| Finance & Insurance | 383 (35.7%) | 691 (64.3%) |
| Real Estate, Rental & Leasing | 327 (63.0%) | 192 (37.0%) |
| Professional & Scientific | 575 (52.8%) | 513 (47.1%) |
| Enterprise Management | 0 (0.0%) | 0 (0.0%) |
| Administrative & Support | 1,095 (63.9%) | 619 (36.1%) |
| Educational Services | 379 (24.2%) | 1,187 (75.8%) |
| Health Care & Social Assistance | 623 (21.6%) | 2,260 (78.4%) |
| Arts, Entertainment & Recreation | 211 (63.0%) | 124 (37.0%) |
| Accommodation & Food Services | 658 (48.1%) | 711 (51.9%) |
| Public Administration | 418 (42.6%) | 562 (57.4%) |
| Total | 11,511 (52.8%) | 10,277 (47.2%) |
Education in Gallatin
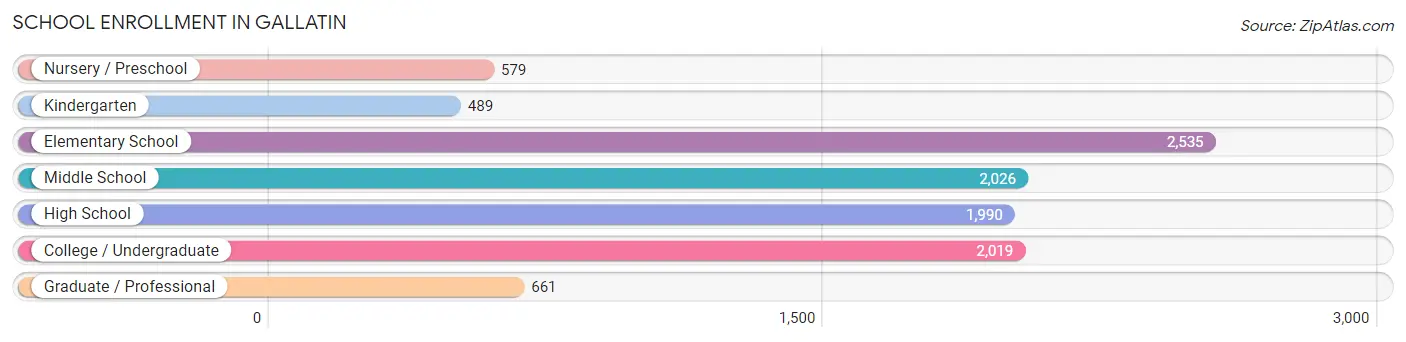
School Enrollment in Gallatin
The most common levels of schooling among the 10,299 students in Gallatin are elementary school (2,535 | 24.6%), middle school (2,026 | 19.7%), and college / undergraduate (2,019 | 19.6%).
| School Level | # Students | % Students |
| Nursery / Preschool | 579 | 5.6% |
| Kindergarten | 489 | 4.8% |
| Elementary School | 2,535 | 24.6% |
| Middle School | 2,026 | 19.7% |
| High School | 1,990 | 19.3% |
| College / Undergraduate | 2,019 | 19.6% |
| Graduate / Professional | 661 | 6.4% |
| Total | 10,299 | 100.0% |
School Enrollment by Age by Funding Source in Gallatin
Out of a total of 10,299 students who are enrolled in schools in Gallatin, 2,225 (21.6%) attend a private institution, while the remaining 8,074 (78.4%) are enrolled in public schools. The age group of 20 to 24 year olds has the highest likelihood of being enrolled in private schools, with 452 (46.9% in the age bracket) enrolled. Conversely, the age group of 5 to 9 year old has the lowest likelihood of being enrolled in a private school, with 2,710 (90.8% in the age bracket) attending a public institution.
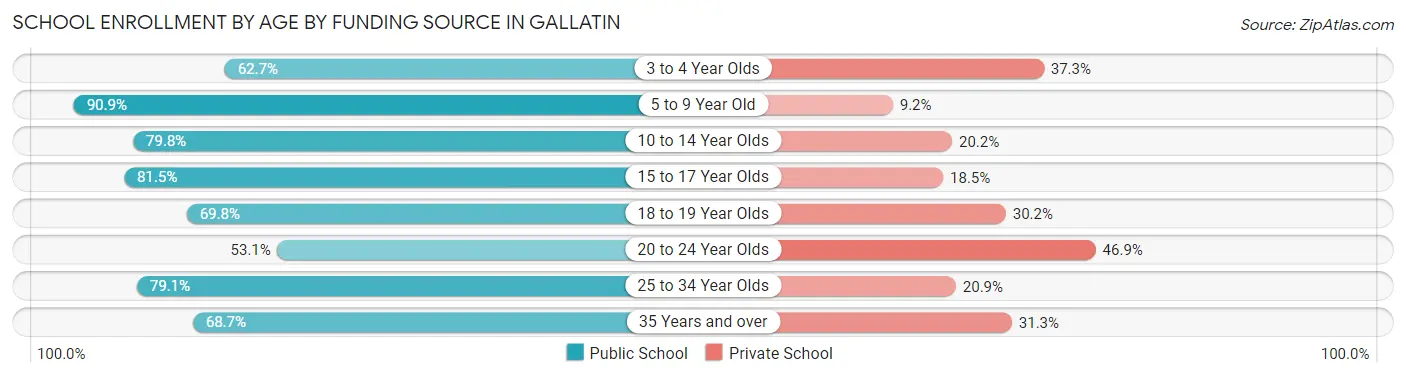
| Age Bracket | Public School | Private School |
| 3 to 4 Year Olds | 244 (62.7%) | 145 (37.3%) |
| 5 to 9 Year Old | 2,710 (90.8%) | 273 (9.1%) |
| 10 to 14 Year Olds | 1,974 (79.8%) | 499 (20.2%) |
| 15 to 17 Year Olds | 1,100 (81.5%) | 250 (18.5%) |
| 18 to 19 Year Olds | 705 (69.8%) | 305 (30.2%) |
| 20 to 24 Year Olds | 511 (53.1%) | 452 (46.9%) |
| 25 to 34 Year Olds | 420 (79.1%) | 111 (20.9%) |
| 35 Years and over | 412 (68.7%) | 188 (31.3%) |
| Total | 8,074 (78.4%) | 2,225 (21.6%) |
Educational Attainment by Field of Study in Gallatin
Business (2,185 | 21.8%), science & technology (1,526 | 15.2%), education (1,246 | 12.4%), engineering (744 | 7.4%), and arts & humanities (661 | 6.6%) are the most common fields of study among 10,034 individuals in Gallatin who have obtained a bachelor's degree or higher.
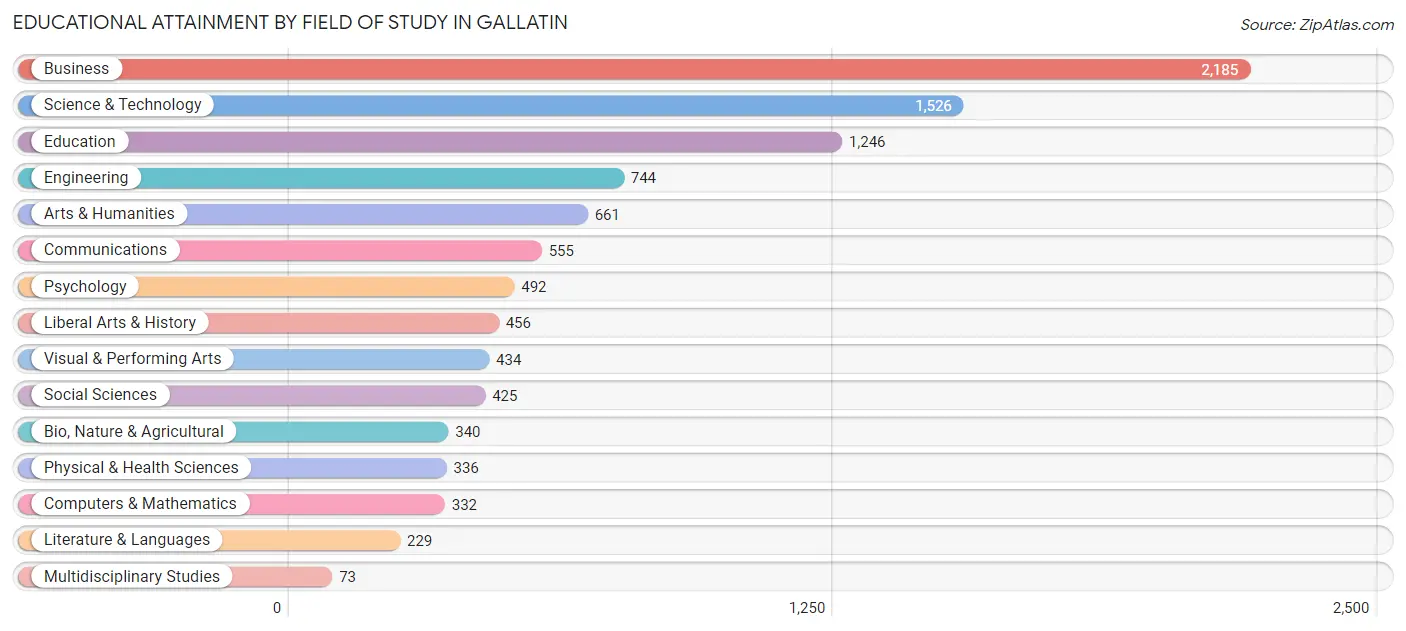
| Field of Study | # Graduates | % Graduates |
| Computers & Mathematics | 332 | 3.3% |
| Bio, Nature & Agricultural | 340 | 3.4% |
| Physical & Health Sciences | 336 | 3.4% |
| Psychology | 492 | 4.9% |
| Social Sciences | 425 | 4.2% |
| Engineering | 744 | 7.4% |
| Multidisciplinary Studies | 73 | 0.7% |
| Science & Technology | 1,526 | 15.2% |
| Business | 2,185 | 21.8% |
| Education | 1,246 | 12.4% |
| Literature & Languages | 229 | 2.3% |
| Liberal Arts & History | 456 | 4.5% |
| Visual & Performing Arts | 434 | 4.3% |
| Communications | 555 | 5.5% |
| Arts & Humanities | 661 | 6.6% |
| Total | 10,034 | 100.0% |
Transportation & Commute in Gallatin
Vehicle Availability by Sex in Gallatin
The most prevalent vehicle ownership categories in Gallatin are males with 2 vehicles (5,018, accounting for 44.0%) and females with 2 vehicles (4,473, making up 50.4%).
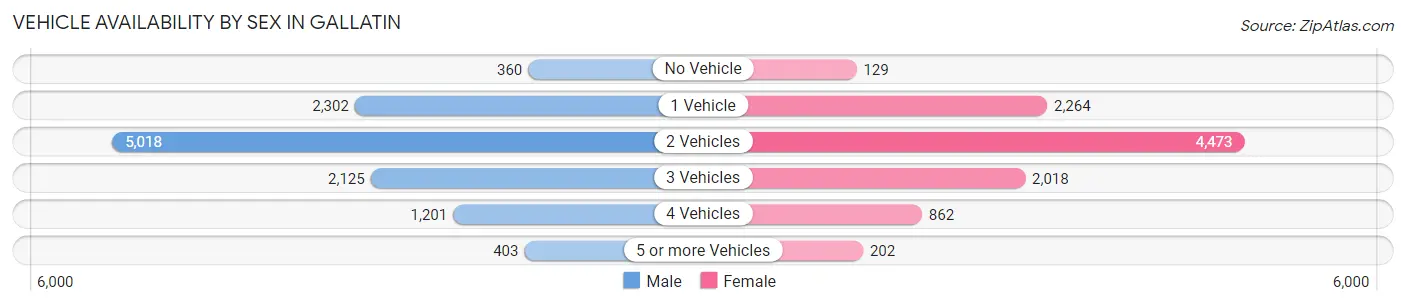
| Vehicles Available | Male | Female |
| No Vehicle | 360 (3.2%) | 129 (1.3%) |
| 1 Vehicle | 2,302 (20.2%) | 2,264 (22.8%) |
| 2 Vehicles | 5,018 (44.0%) | 4,473 (45.0%) |
| 3 Vehicles | 2,125 (18.6%) | 2,018 (20.3%) |
| 4 Vehicles | 1,201 (10.5%) | 862 (8.7%) |
| 5 or more Vehicles | 403 (3.5%) | 202 (2.0%) |
| Total | 11,409 (100.0%) | 9,948 (100.0%) |
Commute Time in Gallatin
The most frequently occuring commute durations in Gallatin are 10 to 14 minutes (3,486 commuters, 18.7%), 30 to 34 minutes (2,504 commuters, 13.4%), and 15 to 19 minutes (2,315 commuters, 12.4%).
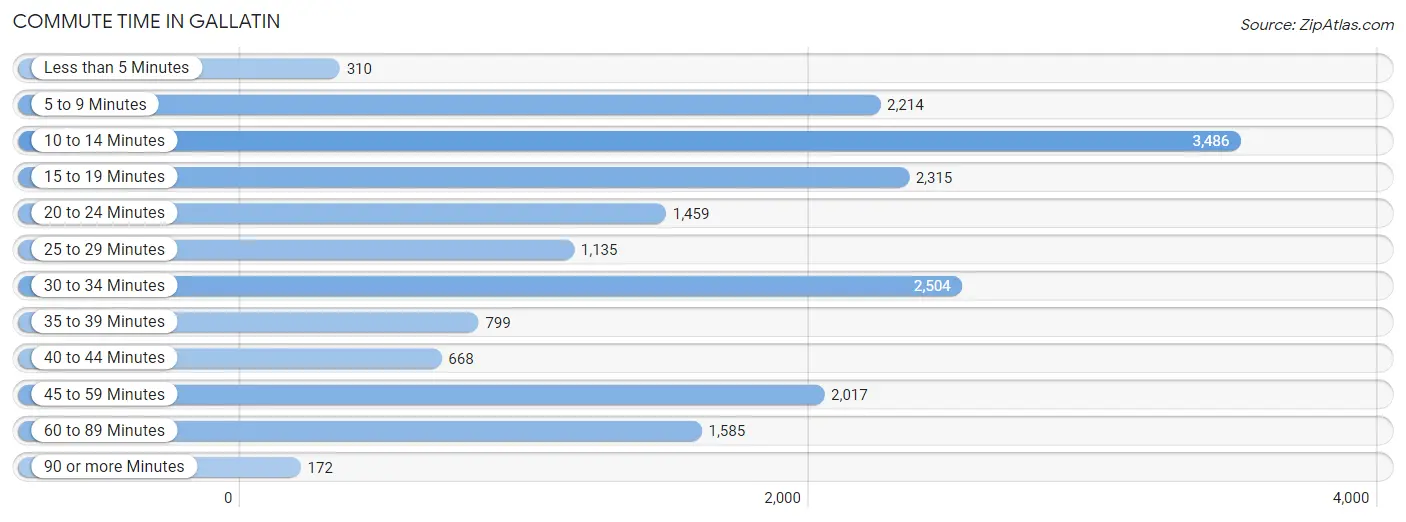
| Commute Time | # Commuters | % Commuters |
| Less than 5 Minutes | 310 | 1.7% |
| 5 to 9 Minutes | 2,214 | 11.9% |
| 10 to 14 Minutes | 3,486 | 18.7% |
| 15 to 19 Minutes | 2,315 | 12.4% |
| 20 to 24 Minutes | 1,459 | 7.8% |
| 25 to 29 Minutes | 1,135 | 6.1% |
| 30 to 34 Minutes | 2,504 | 13.4% |
| 35 to 39 Minutes | 799 | 4.3% |
| 40 to 44 Minutes | 668 | 3.6% |
| 45 to 59 Minutes | 2,017 | 10.8% |
| 60 to 89 Minutes | 1,585 | 8.5% |
| 90 or more Minutes | 172 | 0.9% |
Commute Time by Sex in Gallatin
The most common commute times in Gallatin are 10 to 14 minutes (2,059 commuters, 20.0%) for males and 10 to 14 minutes (1,427 commuters, 17.1%) for females.
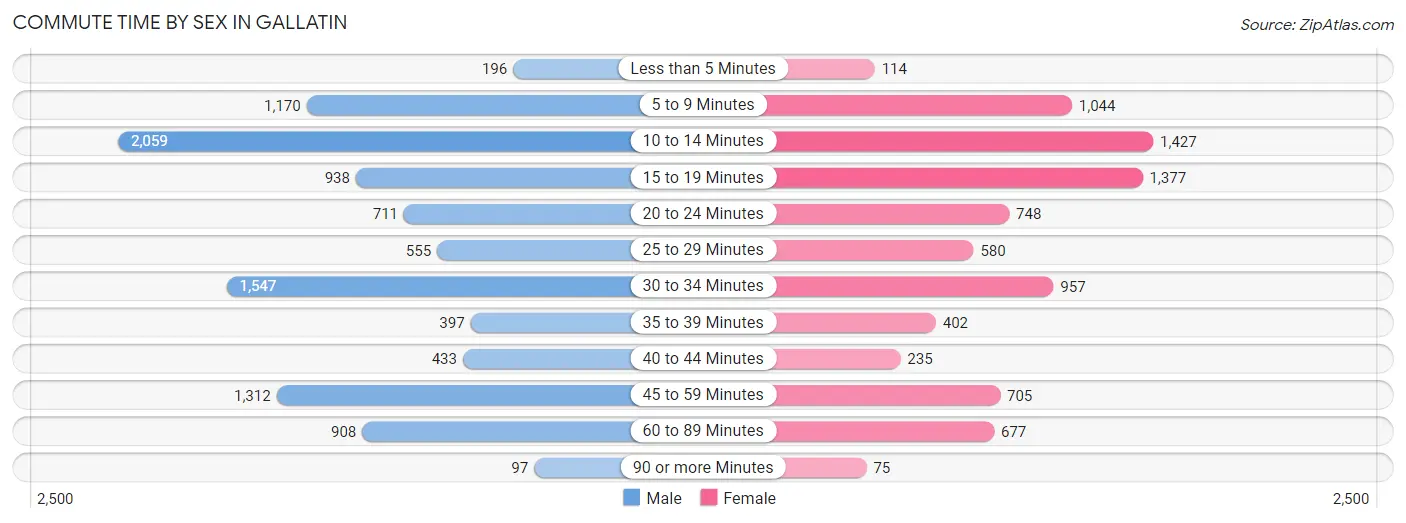
| Commute Time | Male | Female |
| Less than 5 Minutes | 196 (1.9%) | 114 (1.4%) |
| 5 to 9 Minutes | 1,170 (11.3%) | 1,044 (12.5%) |
| 10 to 14 Minutes | 2,059 (20.0%) | 1,427 (17.1%) |
| 15 to 19 Minutes | 938 (9.1%) | 1,377 (16.5%) |
| 20 to 24 Minutes | 711 (6.9%) | 748 (9.0%) |
| 25 to 29 Minutes | 555 (5.4%) | 580 (7.0%) |
| 30 to 34 Minutes | 1,547 (15.0%) | 957 (11.5%) |
| 35 to 39 Minutes | 397 (3.8%) | 402 (4.8%) |
| 40 to 44 Minutes | 433 (4.2%) | 235 (2.8%) |
| 45 to 59 Minutes | 1,312 (12.7%) | 705 (8.5%) |
| 60 to 89 Minutes | 908 (8.8%) | 677 (8.1%) |
| 90 or more Minutes | 97 (0.9%) | 75 (0.9%) |
Time of Departure to Work by Sex in Gallatin
The most frequent times of departure to work in Gallatin are 6:00 AM to 6:29 AM (1,880, 18.2%) for males and 7:00 AM to 7:29 AM (1,362, 16.3%) for females.
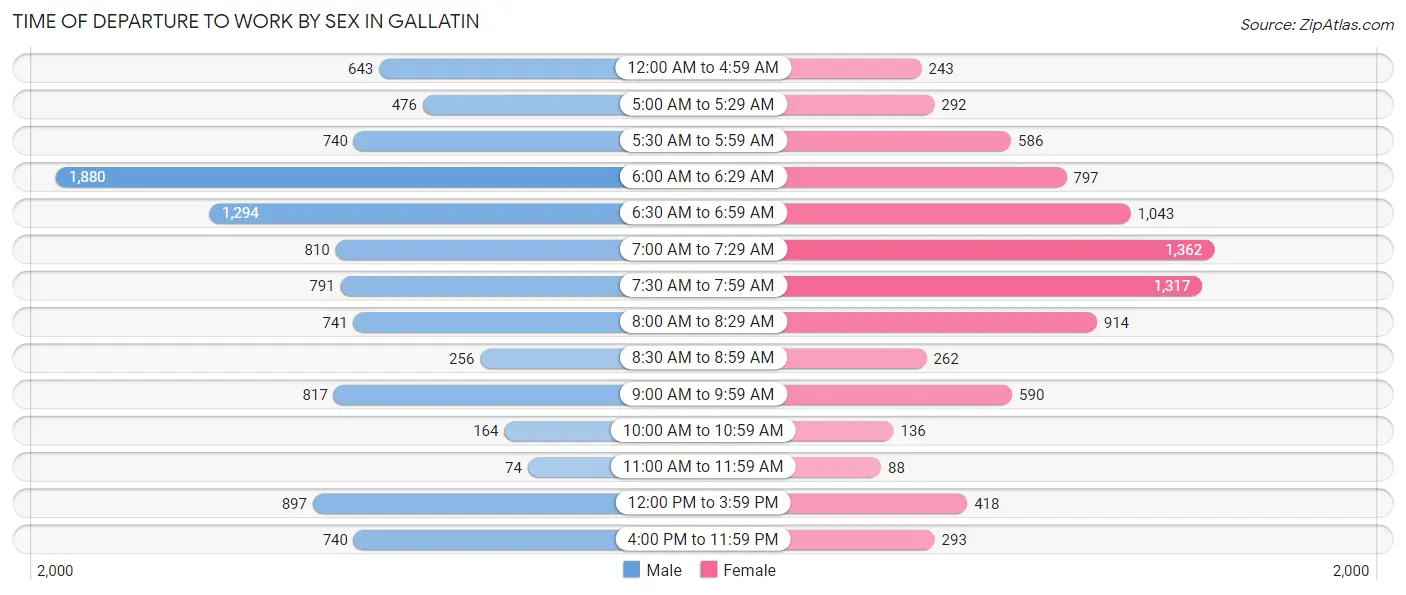
| Time of Departure | Male | Female |
| 12:00 AM to 4:59 AM | 643 (6.2%) | 243 (2.9%) |
| 5:00 AM to 5:29 AM | 476 (4.6%) | 292 (3.5%) |
| 5:30 AM to 5:59 AM | 740 (7.2%) | 586 (7.0%) |
| 6:00 AM to 6:29 AM | 1,880 (18.2%) | 797 (9.6%) |
| 6:30 AM to 6:59 AM | 1,294 (12.5%) | 1,043 (12.5%) |
| 7:00 AM to 7:29 AM | 810 (7.9%) | 1,362 (16.3%) |
| 7:30 AM to 7:59 AM | 791 (7.7%) | 1,317 (15.8%) |
| 8:00 AM to 8:29 AM | 741 (7.2%) | 914 (11.0%) |
| 8:30 AM to 8:59 AM | 256 (2.5%) | 262 (3.1%) |
| 9:00 AM to 9:59 AM | 817 (7.9%) | 590 (7.1%) |
| 10:00 AM to 10:59 AM | 164 (1.6%) | 136 (1.6%) |
| 11:00 AM to 11:59 AM | 74 (0.7%) | 88 (1.1%) |
| 12:00 PM to 3:59 PM | 897 (8.7%) | 418 (5.0%) |
| 4:00 PM to 11:59 PM | 740 (7.2%) | 293 (3.5%) |
| Total | 10,323 (100.0%) | 8,341 (100.0%) |
Housing Occupancy in Gallatin
Occupancy by Ownership in Gallatin
Of the total 17,908 dwellings in Gallatin, owner-occupied units account for 10,733 (59.9%), while renter-occupied units make up 7,175 (40.1%).
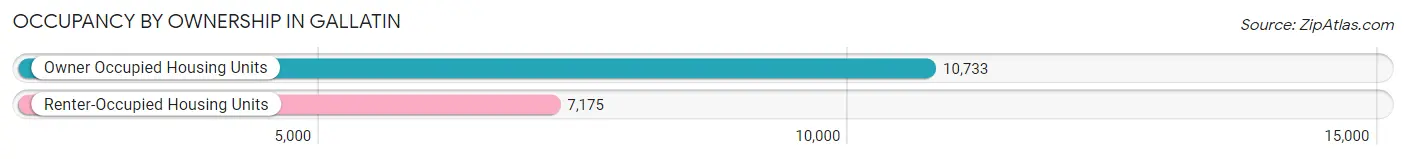
| Occupancy | # Housing Units | % Housing Units |
| Owner Occupied Housing Units | 10,733 | 59.9% |
| Renter-Occupied Housing Units | 7,175 | 40.1% |
| Total Occupied Housing Units | 17,908 | 100.0% |
Occupancy by Household Size in Gallatin
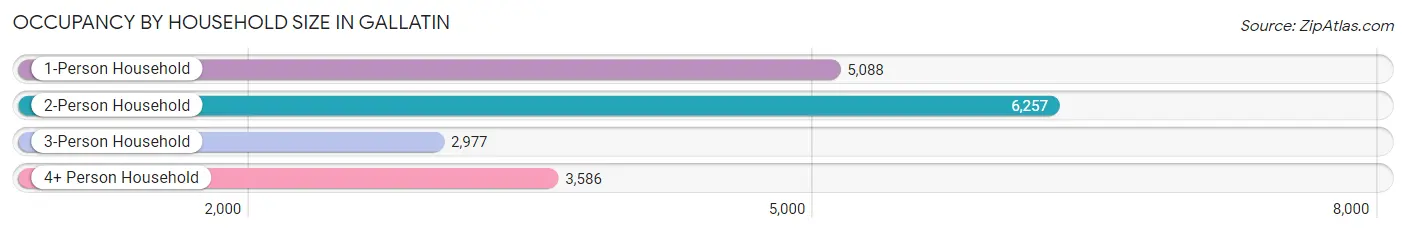
| Household Size | # Housing Units | % Housing Units |
| 1-Person Household | 5,088 | 28.4% |
| 2-Person Household | 6,257 | 34.9% |
| 3-Person Household | 2,977 | 16.6% |
| 4+ Person Household | 3,586 | 20.0% |
| Total Housing Units | 17,908 | 100.0% |
Occupancy by Ownership by Household Size in Gallatin
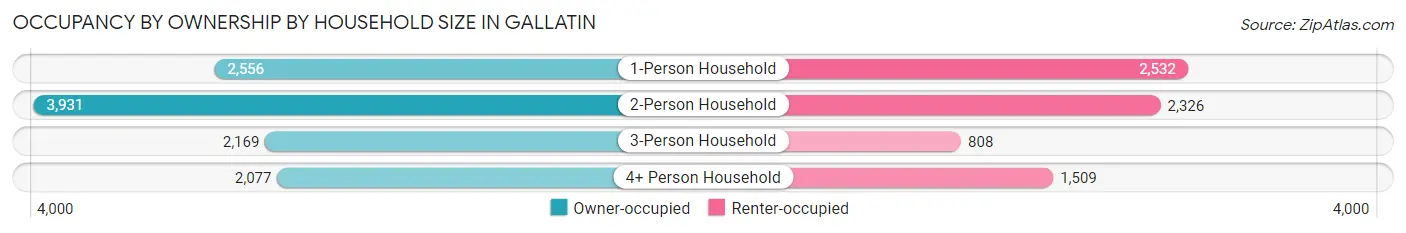
| Household Size | Owner-occupied | Renter-occupied |
| 1-Person Household | 2,556 (50.2%) | 2,532 (49.8%) |
| 2-Person Household | 3,931 (62.8%) | 2,326 (37.2%) |
| 3-Person Household | 2,169 (72.9%) | 808 (27.1%) |
| 4+ Person Household | 2,077 (57.9%) | 1,509 (42.1%) |
| Total Housing Units | 10,733 (59.9%) | 7,175 (40.1%) |
Occupancy by Educational Attainment in Gallatin
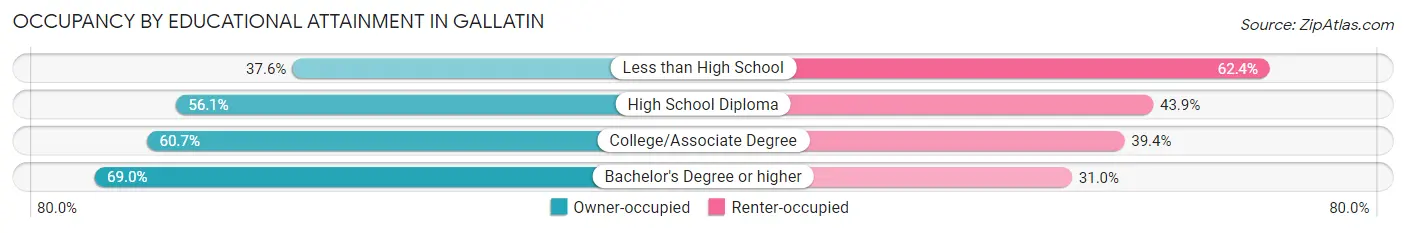
| Household Size | Owner-occupied | Renter-occupied |
| Less than High School | 663 (37.6%) | 1,102 (62.4%) |
| High School Diploma | 2,611 (56.1%) | 2,045 (43.9%) |
| College/Associate Degree | 3,376 (60.7%) | 2,190 (39.4%) |
| Bachelor's Degree or higher | 4,083 (69.0%) | 1,838 (31.0%) |
Occupancy by Age of Householder in Gallatin
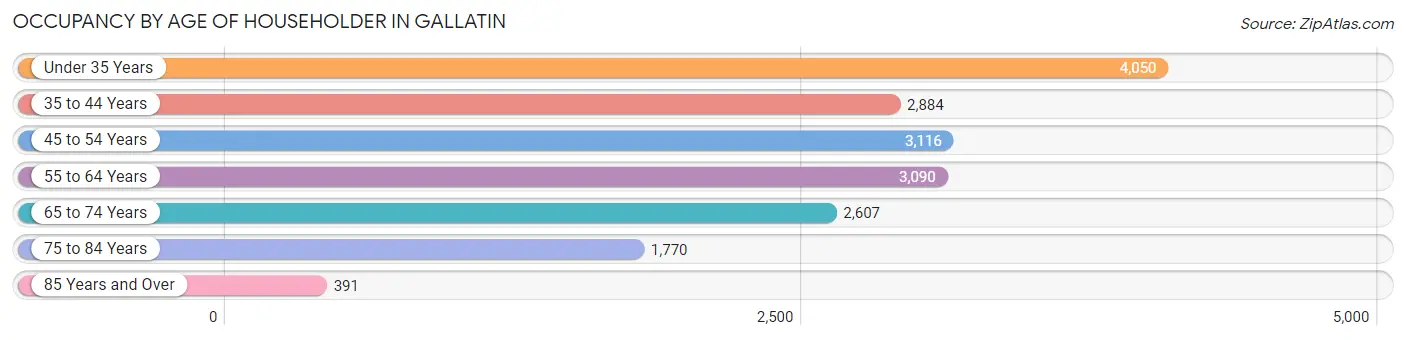
| Age Bracket | # Households | % Households |
| Under 35 Years | 4,050 | 22.6% |
| 35 to 44 Years | 2,884 | 16.1% |
| 45 to 54 Years | 3,116 | 17.4% |
| 55 to 64 Years | 3,090 | 17.2% |
| 65 to 74 Years | 2,607 | 14.6% |
| 75 to 84 Years | 1,770 | 9.9% |
| 85 Years and Over | 391 | 2.2% |
| Total | 17,908 | 100.0% |
Housing Finances in Gallatin
Median Income by Occupancy in Gallatin
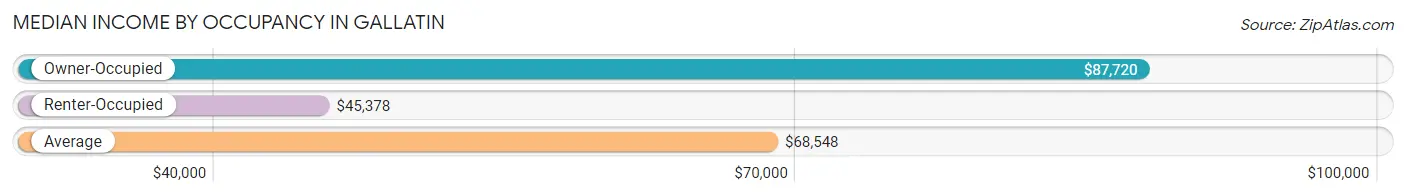
| Occupancy Type | # Households | Median Income |
| Owner-Occupied | 10,733 (59.9%) | $87,720 |
| Renter-Occupied | 7,175 (40.1%) | $45,378 |
| Average | 17,908 (100.0%) | $68,548 |
Occupancy by Householder Income Bracket in Gallatin
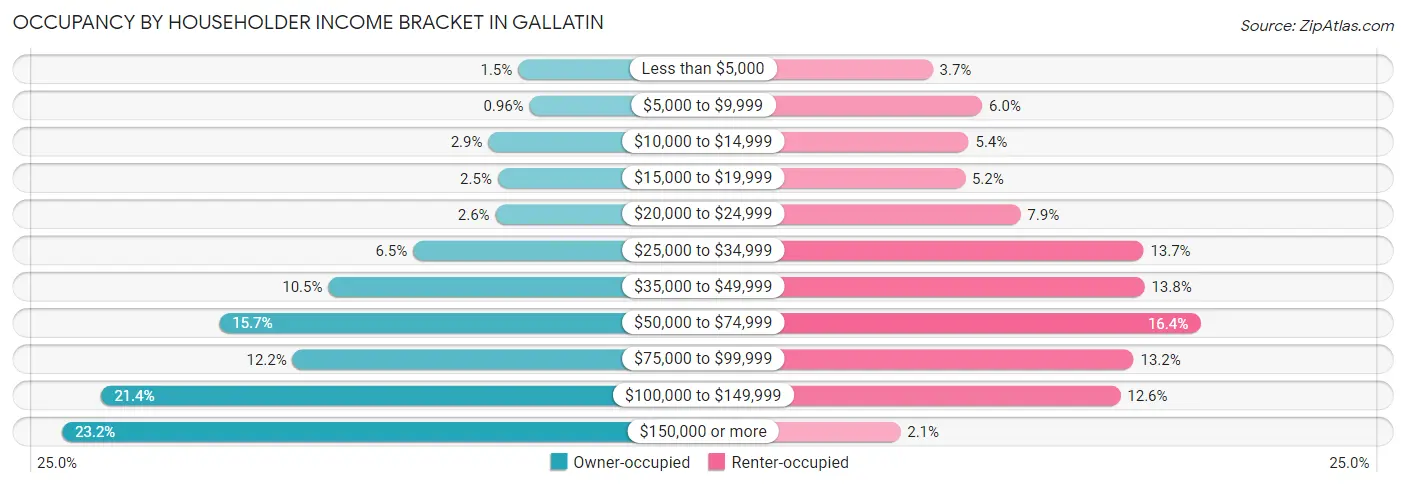
| Income Bracket | Owner-occupied | Renter-occupied |
| Less than $5,000 | 161 (1.5%) | 263 (3.7%) |
| $5,000 to $9,999 | 103 (1.0%) | 433 (6.0%) |
| $10,000 to $14,999 | 313 (2.9%) | 386 (5.4%) |
| $15,000 to $19,999 | 265 (2.5%) | 374 (5.2%) |
| $20,000 to $24,999 | 277 (2.6%) | 563 (7.9%) |
| $25,000 to $34,999 | 698 (6.5%) | 984 (13.7%) |
| $35,000 to $49,999 | 1,131 (10.5%) | 987 (13.8%) |
| $50,000 to $74,999 | 1,688 (15.7%) | 1,177 (16.4%) |
| $75,000 to $99,999 | 1,314 (12.2%) | 950 (13.2%) |
| $100,000 to $149,999 | 2,291 (21.3%) | 905 (12.6%) |
| $150,000 or more | 2,492 (23.2%) | 153 (2.1%) |
| Total | 10,733 (100.0%) | 7,175 (100.0%) |
Monthly Housing Cost Tiers in Gallatin
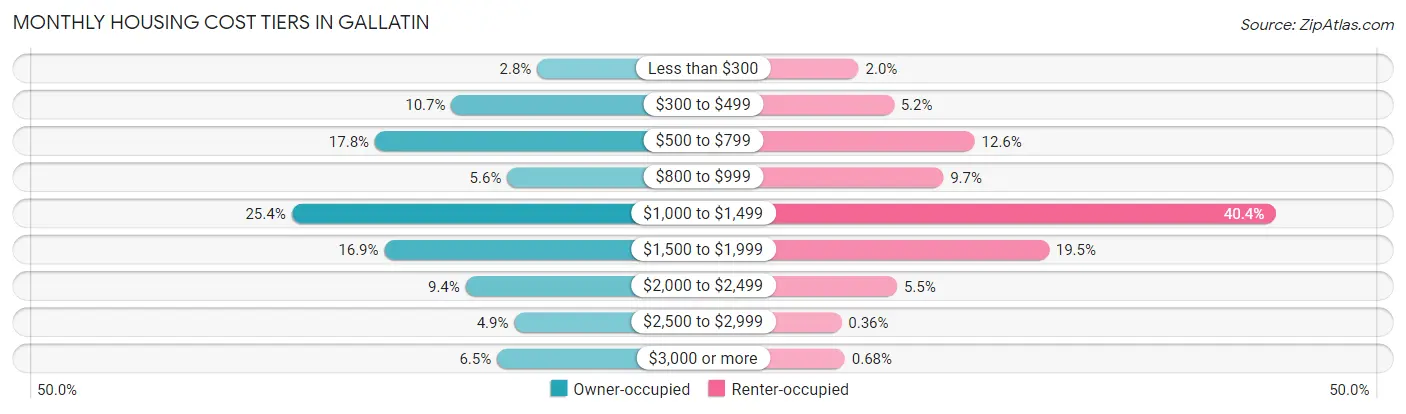
| Monthly Cost | Owner-occupied | Renter-occupied |
| Less than $300 | 302 (2.8%) | 140 (1.9%) |
| $300 to $499 | 1,151 (10.7%) | 372 (5.2%) |
| $500 to $799 | 1,905 (17.7%) | 906 (12.6%) |
| $800 to $999 | 598 (5.6%) | 699 (9.7%) |
| $1,000 to $1,499 | 2,729 (25.4%) | 2,897 (40.4%) |
| $1,500 to $1,999 | 1,812 (16.9%) | 1,396 (19.5%) |
| $2,000 to $2,499 | 1,009 (9.4%) | 393 (5.5%) |
| $2,500 to $2,999 | 528 (4.9%) | 26 (0.4%) |
| $3,000 or more | 699 (6.5%) | 49 (0.7%) |
| Total | 10,733 (100.0%) | 7,175 (100.0%) |
Physical Housing Characteristics in Gallatin
Housing Structures in Gallatin
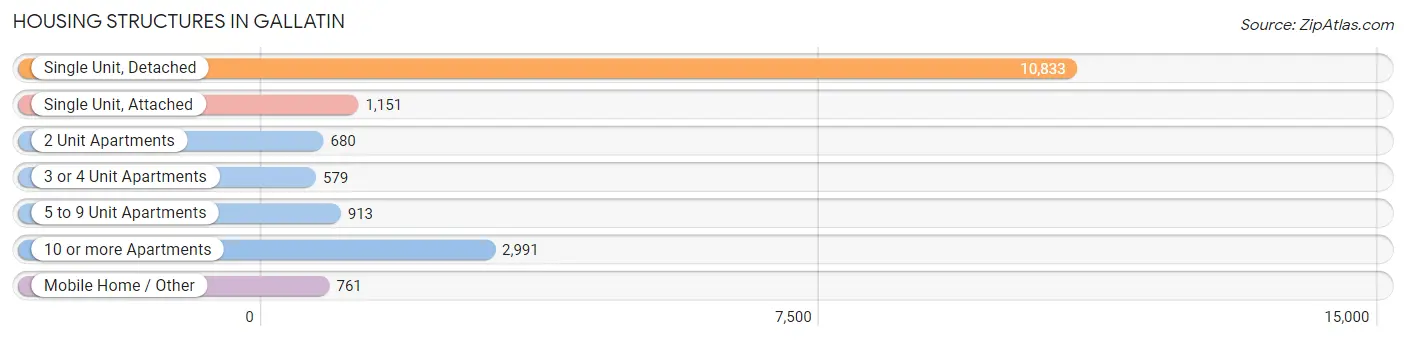
| Structure Type | # Housing Units | % Housing Units |
| Single Unit, Detached | 10,833 | 60.5% |
| Single Unit, Attached | 1,151 | 6.4% |
| 2 Unit Apartments | 680 | 3.8% |
| 3 or 4 Unit Apartments | 579 | 3.2% |
| 5 to 9 Unit Apartments | 913 | 5.1% |
| 10 or more Apartments | 2,991 | 16.7% |
| Mobile Home / Other | 761 | 4.3% |
| Total | 17,908 | 100.0% |
Housing Structures by Occupancy in Gallatin
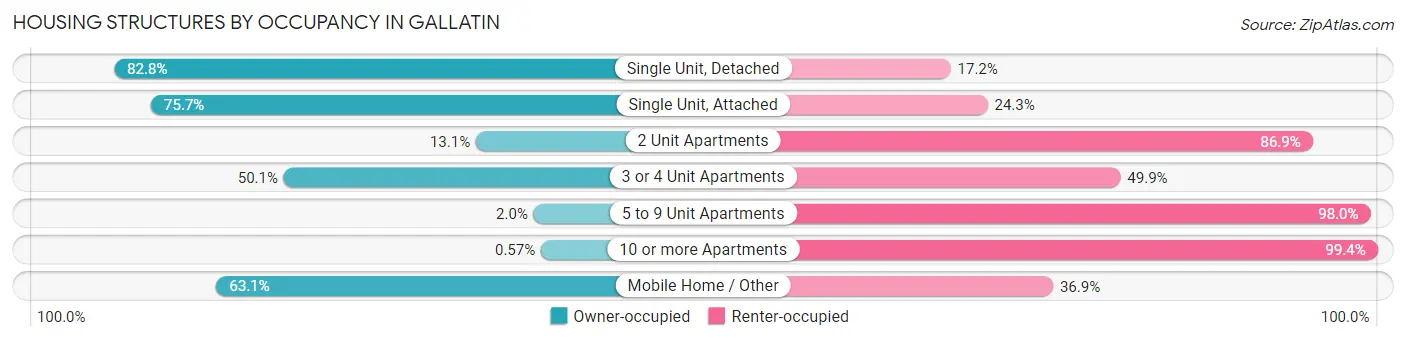
| Structure Type | Owner-occupied | Renter-occupied |
| Single Unit, Detached | 8,968 (82.8%) | 1,865 (17.2%) |
| Single Unit, Attached | 871 (75.7%) | 280 (24.3%) |
| 2 Unit Apartments | 89 (13.1%) | 591 (86.9%) |
| 3 or 4 Unit Apartments | 290 (50.1%) | 289 (49.9%) |
| 5 to 9 Unit Apartments | 18 (2.0%) | 895 (98.0%) |
| 10 or more Apartments | 17 (0.6%) | 2,974 (99.4%) |
| Mobile Home / Other | 480 (63.1%) | 281 (36.9%) |
| Total | 10,733 (59.9%) | 7,175 (40.1%) |
Housing Structures by Number of Rooms in Gallatin
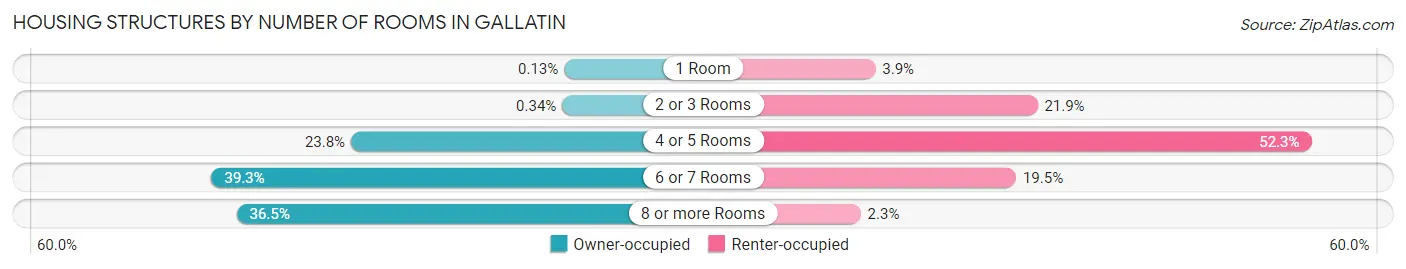
| Number of Rooms | Owner-occupied | Renter-occupied |
| 1 Room | 14 (0.1%) | 282 (3.9%) |
| 2 or 3 Rooms | 37 (0.3%) | 1,573 (21.9%) |
| 4 or 5 Rooms | 2,552 (23.8%) | 3,753 (52.3%) |
| 6 or 7 Rooms | 4,215 (39.3%) | 1,402 (19.5%) |
| 8 or more Rooms | 3,915 (36.5%) | 165 (2.3%) |
| Total | 10,733 (100.0%) | 7,175 (100.0%) |
Housing Structure by Heating Type in Gallatin
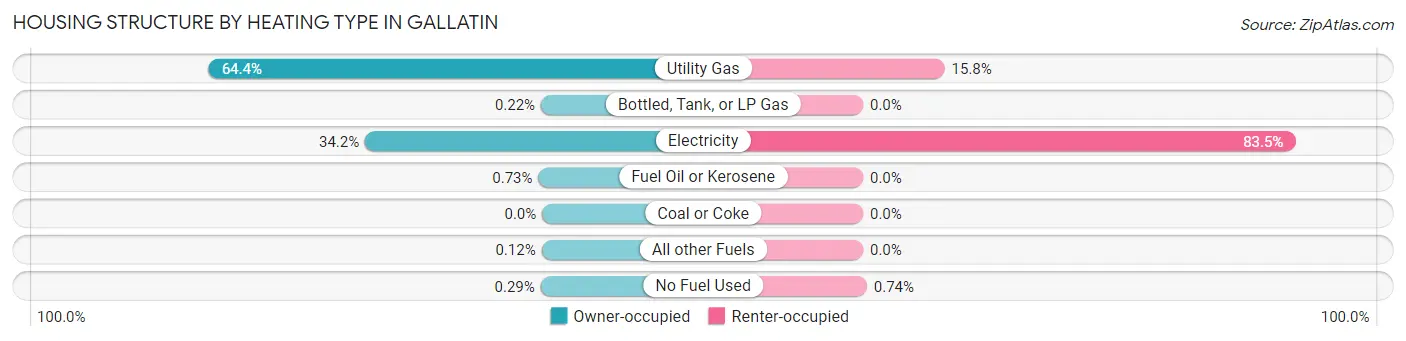
| Heating Type | Owner-occupied | Renter-occupied |
| Utility Gas | 6,914 (64.4%) | 1,131 (15.8%) |
| Bottled, Tank, or LP Gas | 24 (0.2%) | 0 (0.0%) |
| Electricity | 3,673 (34.2%) | 5,991 (83.5%) |
| Fuel Oil or Kerosene | 78 (0.7%) | 0 (0.0%) |
| Coal or Coke | 0 (0.0%) | 0 (0.0%) |
| All other Fuels | 13 (0.1%) | 0 (0.0%) |
| No Fuel Used | 31 (0.3%) | 53 (0.7%) |
| Total | 10,733 (100.0%) | 7,175 (100.0%) |
Household Vehicle Usage in Gallatin
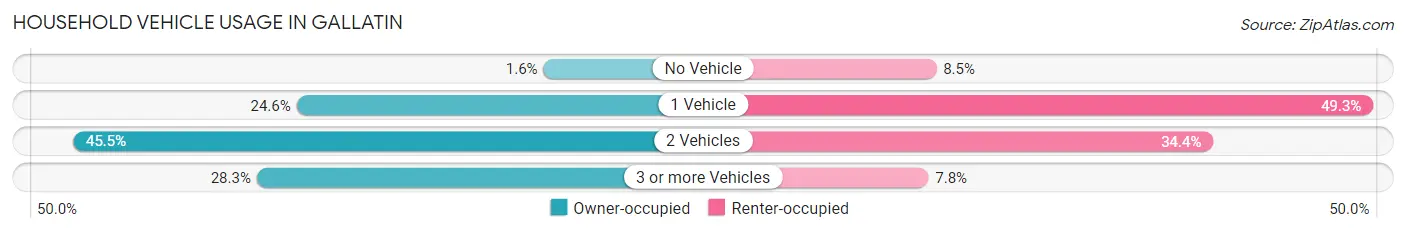
| Vehicles per Household | Owner-occupied | Renter-occupied |
| No Vehicle | 168 (1.6%) | 611 (8.5%) |
| 1 Vehicle | 2,641 (24.6%) | 3,538 (49.3%) |
| 2 Vehicles | 4,883 (45.5%) | 2,467 (34.4%) |
| 3 or more Vehicles | 3,041 (28.3%) | 559 (7.8%) |
| Total | 10,733 (100.0%) | 7,175 (100.0%) |
Real Estate & Mortgages in Gallatin
Real Estate and Mortgage Overview in Gallatin
| Characteristic | Without Mortgage | With Mortgage |
| Housing Units | 3,488 | 7,245 |
| Median Property Value | $300,500 | $308,500 |
| Median Household Income | $68,598 | $1,863 |
| Monthly Housing Costs | $538 | $665 |
| Real Estate Taxes | $1,851 | $225 |
Property Value by Mortgage Status in Gallatin
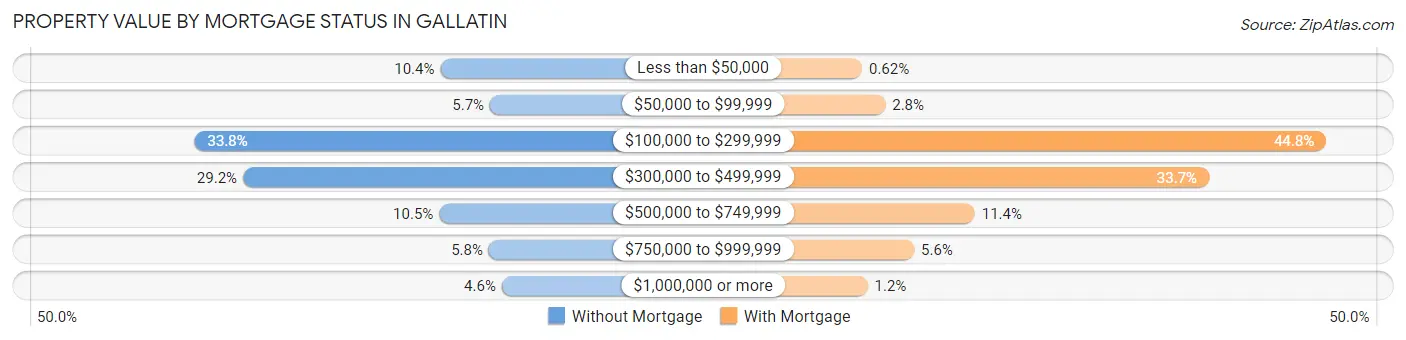
| Property Value | Without Mortgage | With Mortgage |
| Less than $50,000 | 363 (10.4%) | 45 (0.6%) |
| $50,000 to $99,999 | 198 (5.7%) | 205 (2.8%) |
| $100,000 to $299,999 | 1,180 (33.8%) | 3,247 (44.8%) |
| $300,000 to $499,999 | 1,019 (29.2%) | 2,438 (33.7%) |
| $500,000 to $749,999 | 367 (10.5%) | 823 (11.4%) |
| $750,000 to $999,999 | 202 (5.8%) | 404 (5.6%) |
| $1,000,000 or more | 159 (4.6%) | 83 (1.1%) |
| Total | 3,488 (100.0%) | 7,245 (100.0%) |
Household Income by Mortgage Status in Gallatin
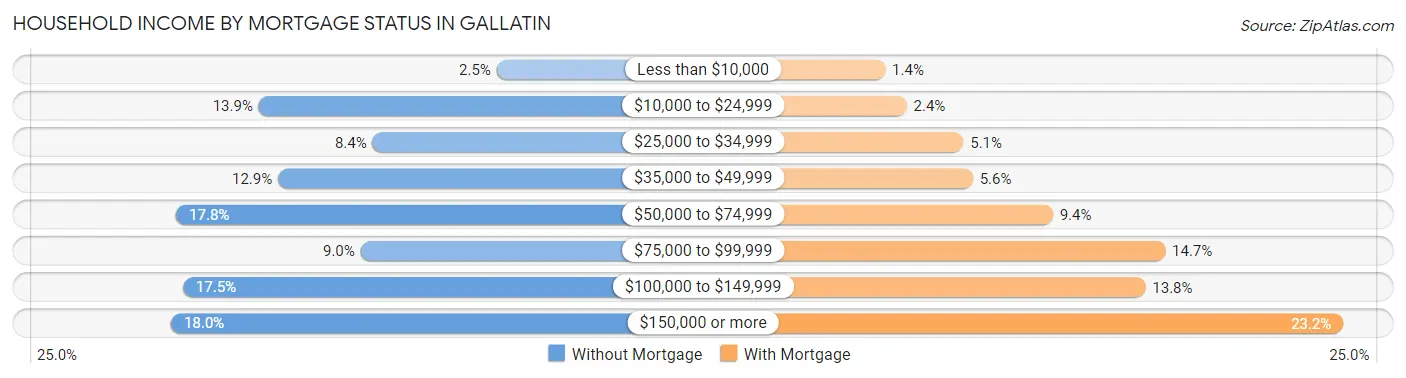
| Household Income | Without Mortgage | With Mortgage |
| Less than $10,000 | 88 (2.5%) | 102 (1.4%) |
| $10,000 to $24,999 | 483 (13.9%) | 176 (2.4%) |
| $25,000 to $34,999 | 294 (8.4%) | 372 (5.1%) |
| $35,000 to $49,999 | 451 (12.9%) | 404 (5.6%) |
| $50,000 to $74,999 | 620 (17.8%) | 680 (9.4%) |
| $75,000 to $99,999 | 314 (9.0%) | 1,068 (14.7%) |
| $100,000 to $149,999 | 609 (17.5%) | 1,000 (13.8%) |
| $150,000 or more | 629 (18.0%) | 1,682 (23.2%) |
| Total | 3,488 (100.0%) | 7,245 (100.0%) |
Property Value to Household Income Ratio in Gallatin
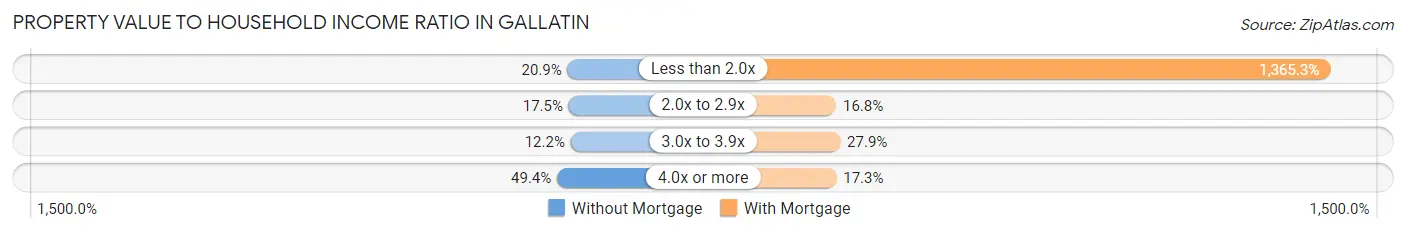
| Value-to-Income Ratio | Without Mortgage | With Mortgage |
| Less than 2.0x | 729 (20.9%) | 98,918 (1,365.3%) |
| 2.0x to 2.9x | 609 (17.5%) | 1,216 (16.8%) |
| 3.0x to 3.9x | 427 (12.2%) | 2,019 (27.9%) |
| 4.0x or more | 1,723 (49.4%) | 1,254 (17.3%) |
| Total | 3,488 (100.0%) | 7,245 (100.0%) |
Real Estate Taxes by Mortgage Status in Gallatin
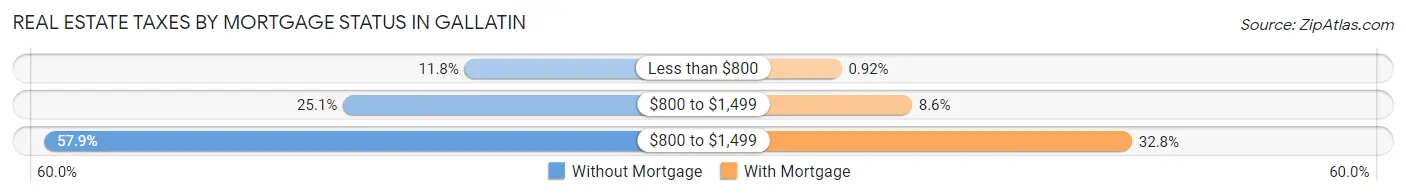
| Property Taxes | Without Mortgage | With Mortgage |
| Less than $800 | 411 (11.8%) | 67 (0.9%) |
| $800 to $1,499 | 875 (25.1%) | 625 (8.6%) |
| $800 to $1,499 | 2,018 (57.9%) | 2,373 (32.8%) |
| Total | 3,488 (100.0%) | 7,245 (100.0%) |
Health & Disability in Gallatin
Health Insurance Coverage by Age in Gallatin
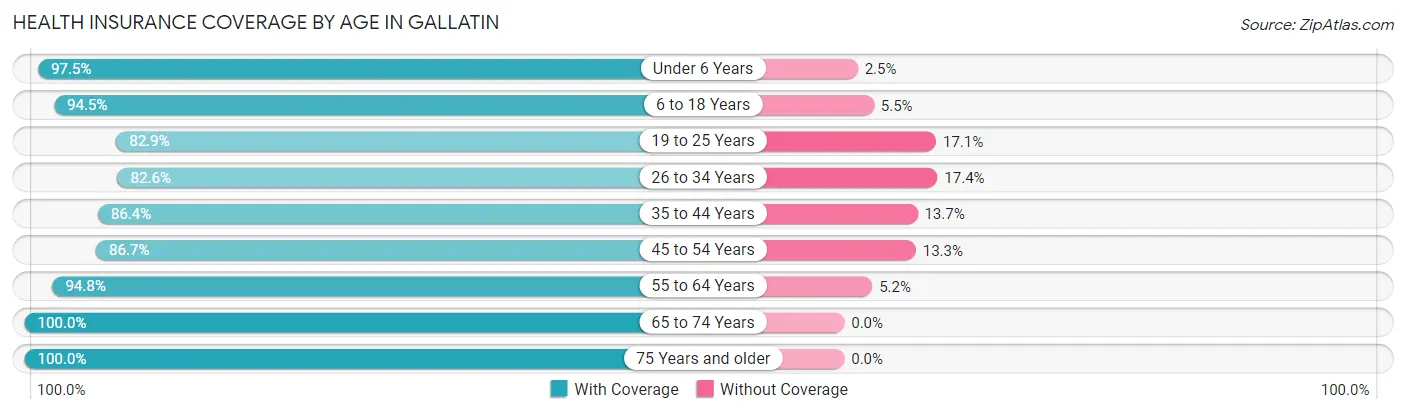
| Age Bracket | With Coverage | Without Coverage |
| Under 6 Years | 3,082 (97.5%) | 79 (2.5%) |
| 6 to 18 Years | 7,100 (94.5%) | 414 (5.5%) |
| 19 to 25 Years | 3,696 (82.9%) | 763 (17.1%) |
| 26 to 34 Years | 4,469 (82.6%) | 939 (17.4%) |
| 35 to 44 Years | 4,547 (86.4%) | 719 (13.7%) |
| 45 to 54 Years | 4,787 (86.7%) | 736 (13.3%) |
| 55 to 64 Years | 4,842 (94.8%) | 266 (5.2%) |
| 65 to 74 Years | 4,255 (100.0%) | 0 (0.0%) |
| 75 Years and older | 3,248 (100.0%) | 0 (0.0%) |
| Total | 40,026 (91.1%) | 3,916 (8.9%) |
Health Insurance Coverage by Citizenship Status in Gallatin
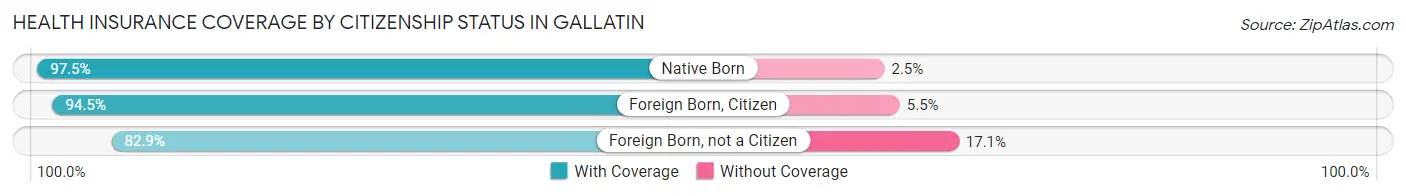
| Citizenship Status | With Coverage | Without Coverage |
| Native Born | 3,082 (97.5%) | 79 (2.5%) |
| Foreign Born, Citizen | 7,100 (94.5%) | 414 (5.5%) |
| Foreign Born, not a Citizen | 3,696 (82.9%) | 763 (17.1%) |
Health Insurance Coverage by Household Income in Gallatin
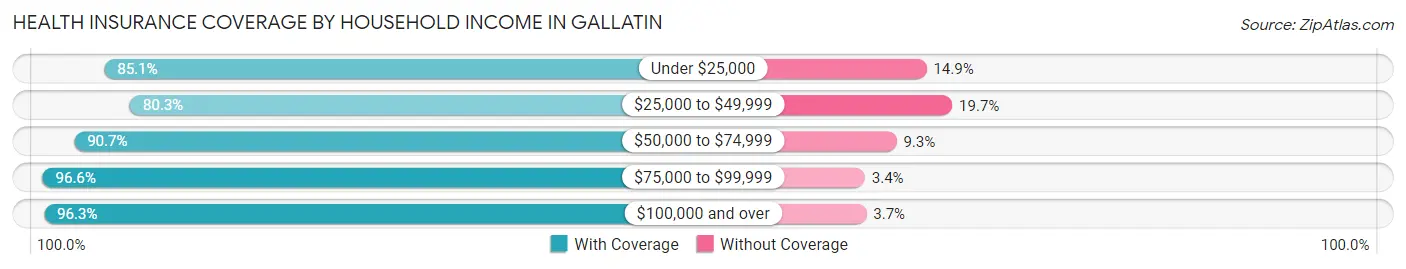
| Household Income | With Coverage | Without Coverage |
| Under $25,000 | 4,580 (85.1%) | 804 (14.9%) |
| $25,000 to $49,999 | 6,700 (80.3%) | 1,648 (19.7%) |
| $50,000 to $74,999 | 6,040 (90.7%) | 619 (9.3%) |
| $75,000 to $99,999 | 5,630 (96.6%) | 197 (3.4%) |
| $100,000 and over | 17,063 (96.3%) | 648 (3.7%) |
Public vs Private Health Insurance Coverage by Age in Gallatin
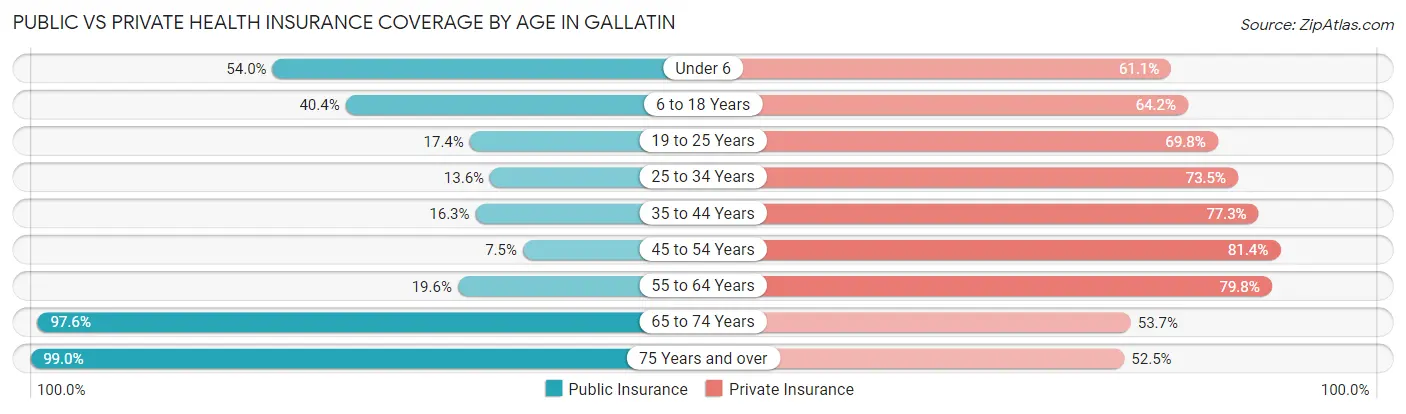
| Age Bracket | Public Insurance | Private Insurance |
| Under 6 | 1,707 (54.0%) | 1,932 (61.1%) |
| 6 to 18 Years | 3,039 (40.4%) | 4,825 (64.2%) |
| 19 to 25 Years | 776 (17.4%) | 3,110 (69.8%) |
| 25 to 34 Years | 737 (13.6%) | 3,975 (73.5%) |
| 35 to 44 Years | 860 (16.3%) | 4,072 (77.3%) |
| 45 to 54 Years | 416 (7.5%) | 4,493 (81.4%) |
| 55 to 64 Years | 1,001 (19.6%) | 4,074 (79.8%) |
| 65 to 74 Years | 4,153 (97.6%) | 2,283 (53.6%) |
| 75 Years and over | 3,214 (99.0%) | 1,704 (52.5%) |
| Total | 15,903 (36.2%) | 30,468 (69.3%) |
Disability Status by Sex by Age in Gallatin
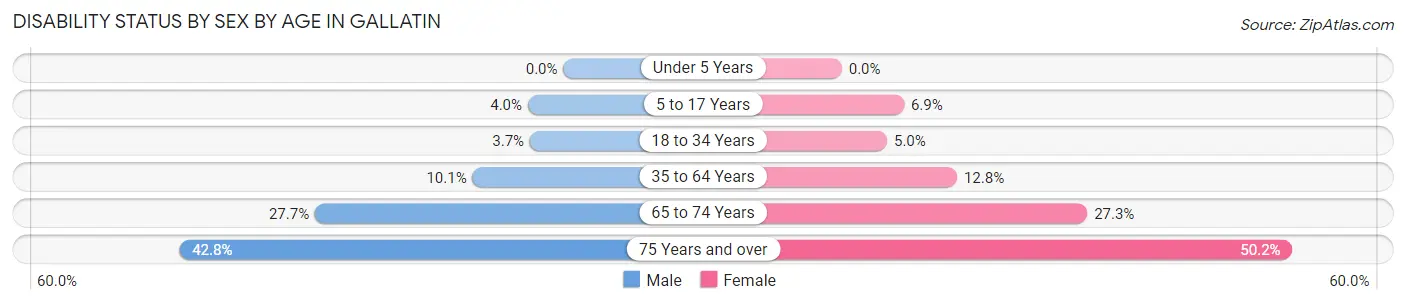
| Age Bracket | Male | Female |
| Under 5 Years | 0 (0.0%) | 0 (0.0%) |
| 5 to 17 Years | 147 (4.0%) | 249 (6.9%) |
| 18 to 34 Years | 191 (3.7%) | 274 (5.0%) |
| 35 to 64 Years | 806 (10.1%) | 1,018 (12.8%) |
| 65 to 74 Years | 603 (27.7%) | 567 (27.3%) |
| 75 Years and over | 572 (42.8%) | 959 (50.2%) |
Disability Class by Sex by Age in Gallatin
Disability Class: Hearing Difficulty
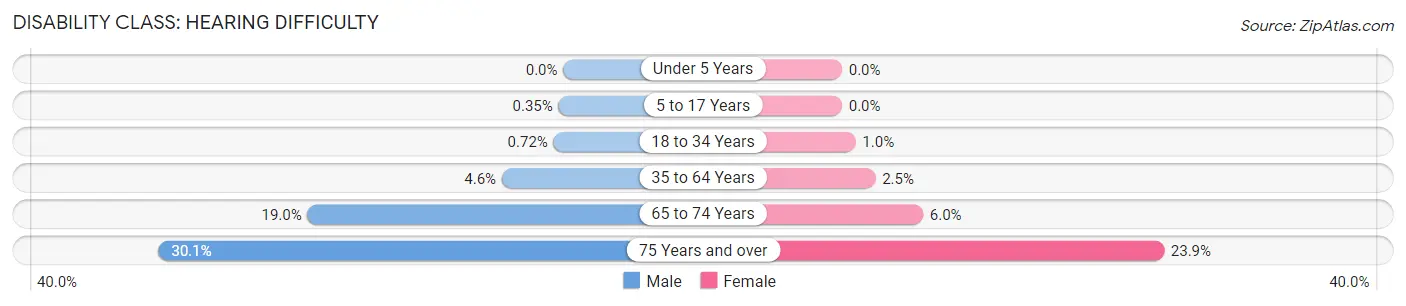
| Age Bracket | Male | Female |
| Under 5 Years | 0 (0.0%) | 0 (0.0%) |
| 5 to 17 Years | 13 (0.4%) | 0 (0.0%) |
| 18 to 34 Years | 37 (0.7%) | 55 (1.0%) |
| 35 to 64 Years | 363 (4.6%) | 197 (2.5%) |
| 65 to 74 Years | 414 (19.0%) | 125 (6.0%) |
| 75 Years and over | 402 (30.1%) | 457 (23.9%) |
Disability Class: Vision Difficulty
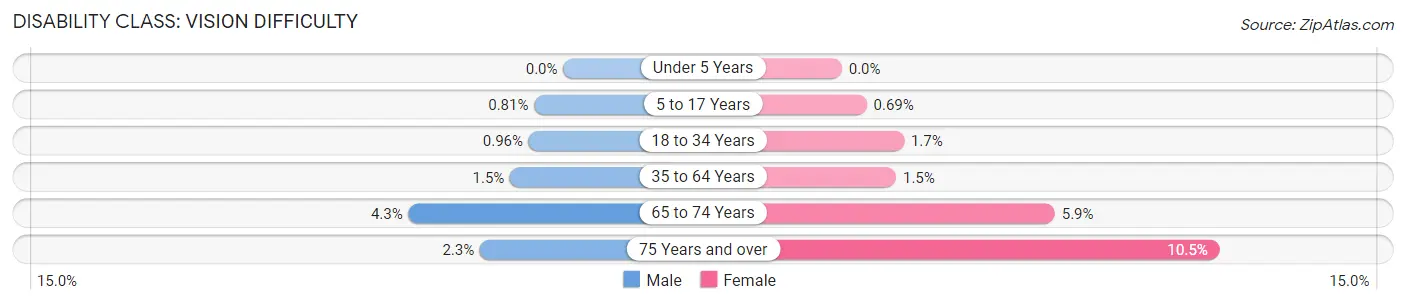
| Age Bracket | Male | Female |
| Under 5 Years | 0 (0.0%) | 0 (0.0%) |
| 5 to 17 Years | 30 (0.8%) | 25 (0.7%) |
| 18 to 34 Years | 49 (1.0%) | 94 (1.7%) |
| 35 to 64 Years | 118 (1.5%) | 120 (1.5%) |
| 65 to 74 Years | 94 (4.3%) | 123 (5.9%) |
| 75 Years and over | 31 (2.3%) | 201 (10.5%) |
Disability Class: Cognitive Difficulty
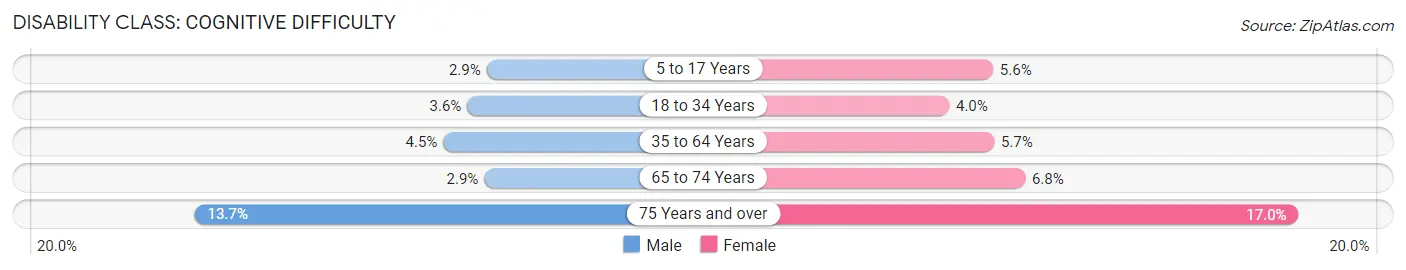
| Age Bracket | Male | Female |
| 5 to 17 Years | 106 (2.9%) | 202 (5.6%) |
| 18 to 34 Years | 183 (3.6%) | 216 (4.0%) |
| 35 to 64 Years | 355 (4.5%) | 448 (5.7%) |
| 65 to 74 Years | 64 (2.9%) | 141 (6.8%) |
| 75 Years and over | 183 (13.7%) | 324 (17.0%) |
Disability Class: Ambulatory Difficulty
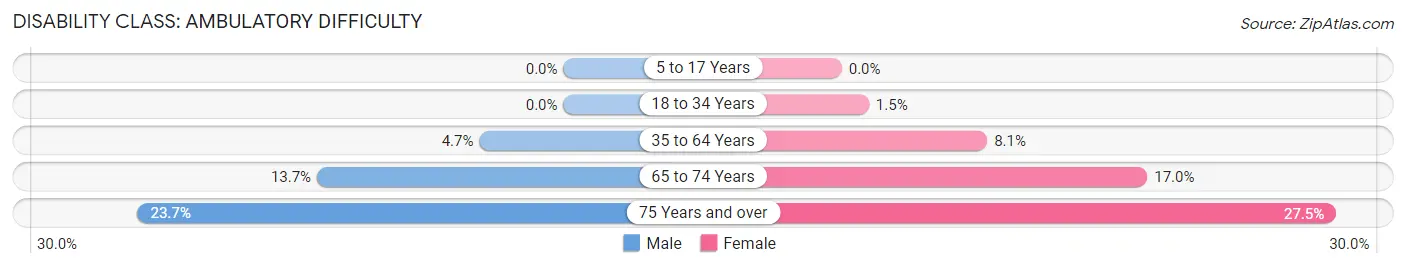
| Age Bracket | Male | Female |
| 5 to 17 Years | 0 (0.0%) | 0 (0.0%) |
| 18 to 34 Years | 0 (0.0%) | 82 (1.5%) |
| 35 to 64 Years | 373 (4.7%) | 643 (8.1%) |
| 65 to 74 Years | 299 (13.7%) | 353 (17.0%) |
| 75 Years and over | 317 (23.7%) | 526 (27.5%) |
Disability Class: Self-Care Difficulty
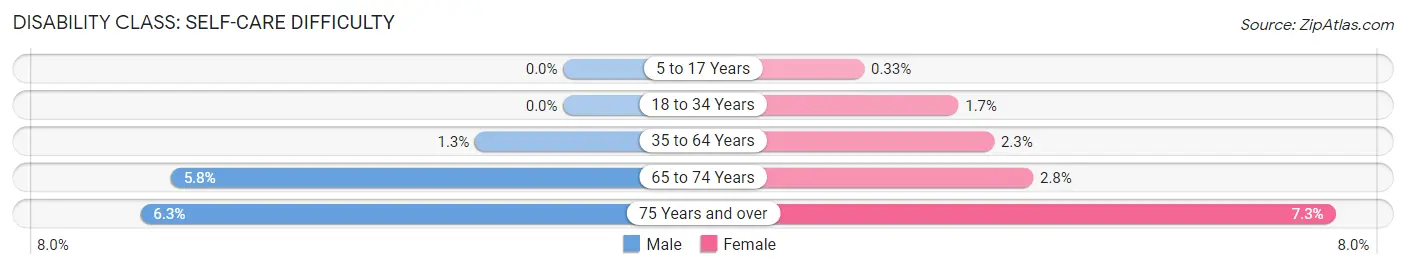
| Age Bracket | Male | Female |
| 5 to 17 Years | 0 (0.0%) | 12 (0.3%) |
| 18 to 34 Years | 0 (0.0%) | 94 (1.7%) |
| 35 to 64 Years | 104 (1.3%) | 179 (2.3%) |
| 65 to 74 Years | 127 (5.8%) | 59 (2.8%) |
| 75 Years and over | 84 (6.3%) | 140 (7.3%) |
Technology Access in Gallatin
Computing Device Access in Gallatin
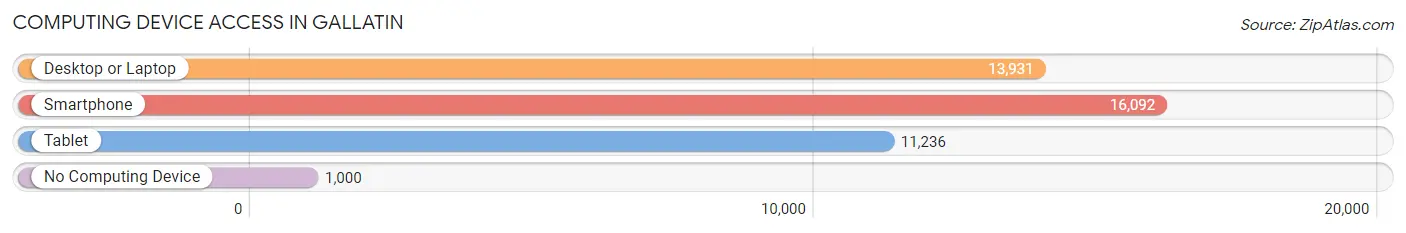
| Device Type | # Households | % Households |
| Desktop or Laptop | 13,931 | 77.8% |
| Smartphone | 16,092 | 89.9% |
| Tablet | 11,236 | 62.7% |
| No Computing Device | 1,000 | 5.6% |
| Total | 17,908 | 100.0% |
Internet Access in Gallatin
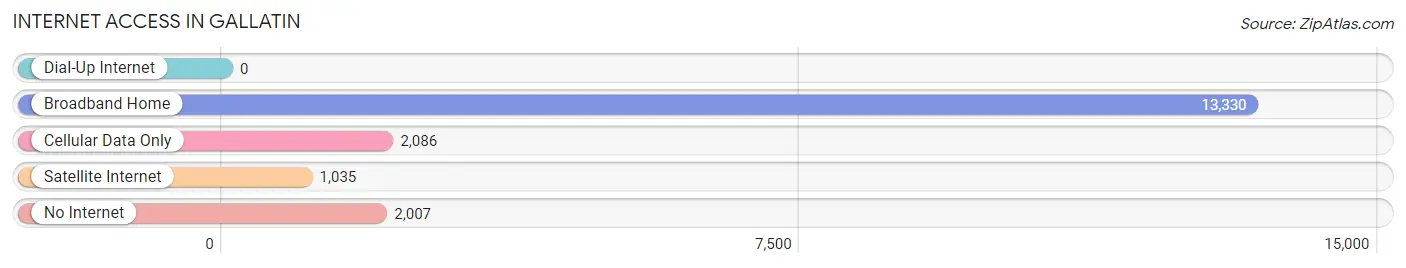
| Internet Type | # Households | % Households |
| Dial-Up Internet | 0 | 0.0% |
| Broadband Home | 13,330 | 74.4% |
| Cellular Data Only | 2,086 | 11.7% |
| Satellite Internet | 1,035 | 5.8% |
| No Internet | 2,007 | 11.2% |
| Total | 17,908 | 100.0% |
Gallatin Summary
History
The city of Gallatin, Tennessee is located in Sumner County, approximately 30 miles northeast of Nashville. It is the county seat and the largest city in the county. The city was founded in 1802 and named after Albert Gallatin, the fourth United States Secretary of the Treasury. The city was originally a small farming community, but it has grown significantly over the years.
Gallatin was an important stop on the Nashville and Northwestern Railroad, which was completed in 1854. This railroad connected Nashville to the Midwest and allowed for the growth of the city. The railroad also allowed for the development of the city’s manufacturing industry, which included the production of furniture, textiles, and other goods.
During the Civil War, Gallatin was an important supply center for the Confederate Army. The city was also the site of a major battle in 1862, when Union forces attempted to capture the city. The Union forces were unsuccessful, and the city remained in Confederate hands until the end of the war.
In the late 19th century, Gallatin experienced a period of growth and prosperity. The city was home to several large manufacturing companies, including the Gallatin Chair Company, the Gallatin Cotton Mill, and the Gallatin Woolen Mill. These companies provided employment for many of the city’s residents.
In the early 20th century, Gallatin continued to grow and prosper. The city was home to several large businesses, including the Gallatin Chair Company, the Gallatin Cotton Mill, and the Gallatin Woolen Mill. The city also had a thriving downtown area, which included several banks, stores, and other businesses.
Geography
Gallatin is located in Sumner County, Tennessee, approximately 30 miles northeast of Nashville. The city is situated on the banks of the Cumberland River, which flows through the city. The city is surrounded by rolling hills and is located in the Central Basin of Tennessee.
The city has a total area of 16.2 square miles, of which 16.1 square miles is land and 0.1 square miles is water. The city is located at an elevation of 590 feet above sea level.
Economy
Gallatin’s economy is largely based on manufacturing and retail. The city is home to several large manufacturing companies, including the Gallatin Chair Company, the Gallatin Cotton Mill, and the Gallatin Woolen Mill. These companies provide employment for many of the city’s residents.
The city is also home to several large retail stores, including Walmart, Target, and Lowe’s. These stores provide employment for many of the city’s residents.
The city is also home to several large healthcare providers, including Sumner Regional Medical Center and the Gallatin Medical Center. These healthcare providers provide employment for many of the city’s residents.
Demographics
As of the 2010 census, the city of Gallatin had a population of 30,678. The racial makeup of the city was 79.2% White, 15.7% African American, 0.4% Native American, 1.2% Asian, 0.1% Pacific Islander, 1.7% from other races, and 1.7% from two or more races. Hispanic or Latino of any race were 4.2% of the population.
The median household income in Gallatin was $45,837, and the median family income was $54,837. The per capita income in Gallatin was $22,837. About 11.2% of families and 14.2% of the population were below the poverty line, including 19.2% of those under age 18 and 10.2% of those age 65 or over.
Common Questions
What is Per Capita Income in Gallatin?
Per Capita income in Gallatin is $36,996.
What is the Median Family Income in Gallatin?
Median Family Income in Gallatin is $84,571.
What is the Median Household income in Gallatin?
Median Household Income in Gallatin is $68,548.
What is Income or Wage Gap in Gallatin?
Income or Wage Gap in Gallatin is 20.4%.
Women in Gallatin earn 79.6 cents for every dollar earned by a man.
What is Family Income Deficit in Gallatin?
Family Income Deficit in Gallatin is $11,549.
Families that are below poverty line in Gallatin earn $11,549 less on average than the poverty threshold level.
What is Inequality or Gini Index in Gallatin?
Inequality or Gini Index in Gallatin is 0.46.
What is the Total Population of Gallatin?
Total Population of Gallatin is 44,947.
What is the Total Male Population of Gallatin?
Total Male Population of Gallatin is 22,397.
What is the Total Female Population of Gallatin?
Total Female Population of Gallatin is 22,550.
What is the Ratio of Males per 100 Females in Gallatin?
There are 99.32 Males per 100 Females in Gallatin.
What is the Ratio of Females per 100 Males in Gallatin?
There are 100.68 Females per 100 Males in Gallatin.
What is the Median Population Age in Gallatin?
Median Population Age in Gallatin is 37.8 Years.
What is the Average Family Size in Gallatin
Average Family Size in Gallatin is 3.0 People.
What is the Average Household Size in Gallatin
Average Household Size in Gallatin is 2.5 People.
How Large is the Labor Force in Gallatin?
There are 22,571 People in the Labor Forcein in Gallatin.
What is the Percentage of People in the Labor Force in Gallatin?
63.1% of People are in the Labor Force in Gallatin.
What is the Unemployment Rate in Gallatin?
Unemployment Rate in Gallatin is 3.2%.