Ardmore, TN Map & Demographics
Ardmore Map
Ardmore Overview
$29,489
PER CAPITA INCOME
$61,827
AVG FAMILY INCOME
$45,750
AVG HOUSEHOLD INCOME
3.2%
WAGE / INCOME GAP [ % ]
96.8¢/ $1
WAGE / INCOME GAP [ $ ]
0.52
INEQUALITY / GINI INDEX
1,354
TOTAL POPULATION
673
MALE POPULATION
681
FEMALE POPULATION
98.83
MALES / 100 FEMALES
101.19
FEMALES / 100 MALES
46.9
MEDIAN AGE
3.3
AVG FAMILY SIZE
2.6
AVG HOUSEHOLD SIZE
585
LABOR FORCE [ PEOPLE ]
50.9%
PERCENT IN LABOR FORCE
7.3%
UNEMPLOYMENT RATE
Ardmore Zip Codes
Ardmore Area Codes
Income in Ardmore
Income Overview in Ardmore
Per Capita Income in Ardmore is $29,489, while median incomes of families and households are $61,827 and $45,750 respectively.
| Characteristic | Number | Measure |
| Per Capita Income | 1,354 | $29,489 |
| Median Family Income | 321 | $61,827 |
| Mean Family Income | 321 | $90,286 |
| Median Household Income | 502 | $45,750 |
| Mean Household Income | 502 | $73,438 |
| Income Deficit | 321 | $0 |
| Wage / Income Gap (%) | 1,354 | 3.20% |
| Wage / Income Gap ($) | 1,354 | 96.80¢ per $1 |
| Gini / Inequality Index | 1,354 | 0.52 |
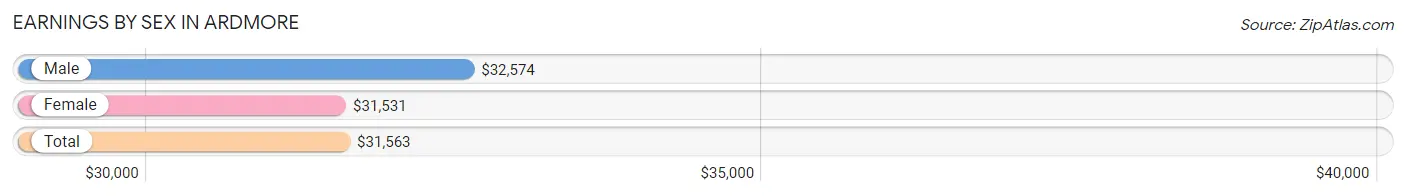
Earnings by Sex in Ardmore
Average Earnings in Ardmore are $31,563, $32,574 for men and $31,531 for women, a difference of 3.2%.
| Sex | Number | Average Earnings |
| Male | 337 (56.2%) | $32,574 |
| Female | 263 (43.8%) | $31,531 |
| Total | 600 (100.0%) | $31,563 |
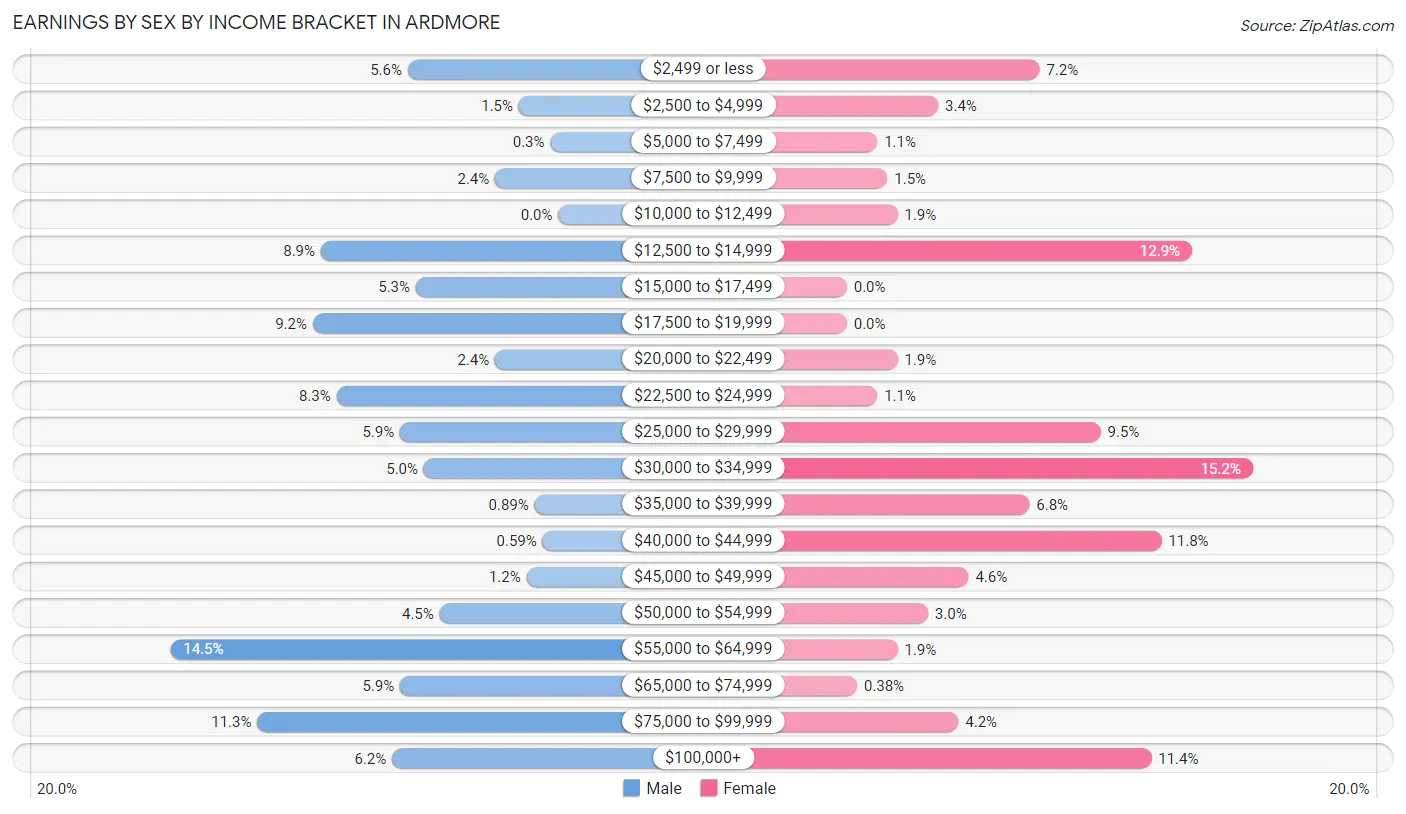
Earnings by Sex by Income Bracket in Ardmore
The most common earnings brackets in Ardmore are $55,000 to $64,999 for men (49 | 14.5%) and $30,000 to $34,999 for women (40 | 15.2%).
| Income | Male | Female |
| $2,499 or less | 19 (5.6%) | 19 (7.2%) |
| $2,500 to $4,999 | 5 (1.5%) | 9 (3.4%) |
| $5,000 to $7,499 | 1 (0.3%) | 3 (1.1%) |
| $7,500 to $9,999 | 8 (2.4%) | 4 (1.5%) |
| $10,000 to $12,499 | 0 (0.0%) | 5 (1.9%) |
| $12,500 to $14,999 | 30 (8.9%) | 34 (12.9%) |
| $15,000 to $17,499 | 18 (5.3%) | 0 (0.0%) |
| $17,500 to $19,999 | 31 (9.2%) | 0 (0.0%) |
| $20,000 to $22,499 | 8 (2.4%) | 5 (1.9%) |
| $22,500 to $24,999 | 28 (8.3%) | 3 (1.1%) |
| $25,000 to $29,999 | 20 (5.9%) | 25 (9.5%) |
| $30,000 to $34,999 | 17 (5.0%) | 40 (15.2%) |
| $35,000 to $39,999 | 3 (0.9%) | 18 (6.8%) |
| $40,000 to $44,999 | 2 (0.6%) | 31 (11.8%) |
| $45,000 to $49,999 | 4 (1.2%) | 12 (4.6%) |
| $50,000 to $54,999 | 15 (4.4%) | 8 (3.0%) |
| $55,000 to $64,999 | 49 (14.5%) | 5 (1.9%) |
| $65,000 to $74,999 | 20 (5.9%) | 1 (0.4%) |
| $75,000 to $99,999 | 38 (11.3%) | 11 (4.2%) |
| $100,000+ | 21 (6.2%) | 30 (11.4%) |
| Total | 337 (100.0%) | 263 (100.0%) |
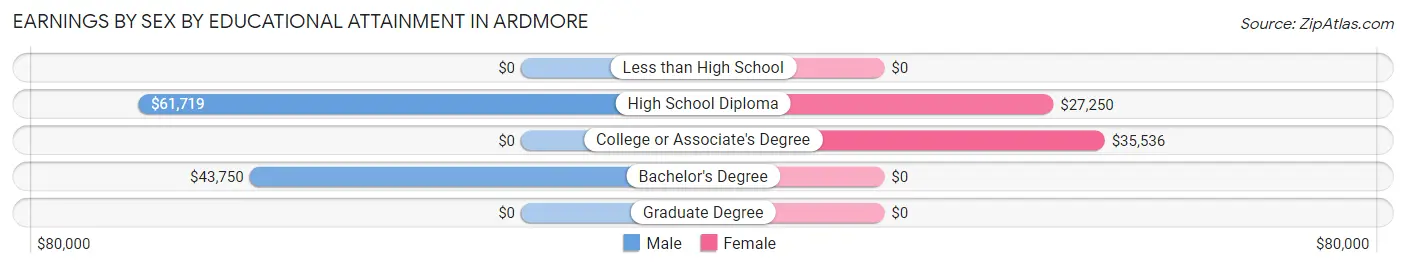
Earnings by Sex by Educational Attainment in Ardmore
Average earnings in Ardmore are $54,250 for men and $32,219 for women, a difference of 40.6%. Men with an educational attainment of high school diploma enjoy the highest average annual earnings of $61,719, while those with bachelor's degree education earn the least with $43,750. Women with an educational attainment of college or associate's degree earn the most with the average annual earnings of $35,536, while those with high school diploma education have the smallest earnings of $27,250.
| Educational Attainment | Male Income | Female Income |
| Less than High School | - | - |
| High School Diploma | $61,719 | $27,250 |
| College or Associate's Degree | - | - |
| Bachelor's Degree | $43,750 | $0 |
| Graduate Degree | - | - |
| Total | $54,250 | $32,219 |
Family Income in Ardmore
Family Income Brackets in Ardmore
According to the Ardmore family income data, there are 61 families falling into the $50,000 to $74,999 income range, which is the most common income bracket and makes up 19.0% of all families. Conversely, the $25,000 to $34,999 income bracket is the least frequent group with only 12 families (3.7%) belonging to this category.
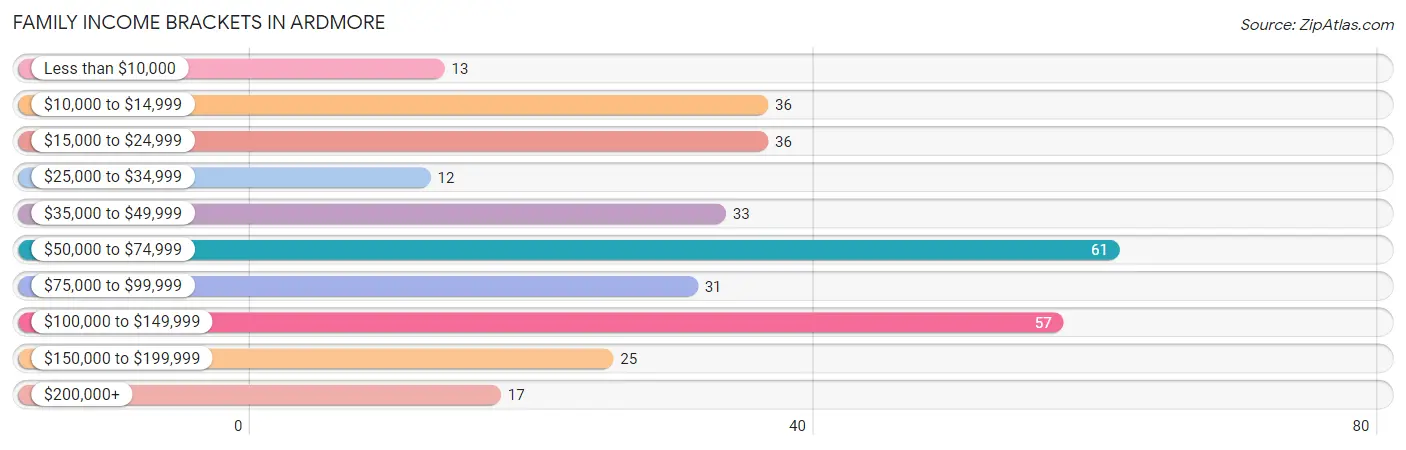
| Income Bracket | # Families | % Families |
| Less than $10,000 | 13 | 4.0% |
| $10,000 to $14,999 | 36 | 11.2% |
| $15,000 to $24,999 | 36 | 11.2% |
| $25,000 to $34,999 | 12 | 3.7% |
| $35,000 to $49,999 | 33 | 10.3% |
| $50,000 to $74,999 | 61 | 19.0% |
| $75,000 to $99,999 | 31 | 9.7% |
| $100,000 to $149,999 | 57 | 17.8% |
| $150,000 to $199,999 | 25 | 7.8% |
| $200,000+ | 17 | 5.3% |
Family Income by Famaliy Size in Ardmore
5-person families (13 | 4.1%) account for the highest median family income in Ardmore with $117,083 per family, while 3-person families (84 | 26.2%) have the highest median income of $33,529 per family member.
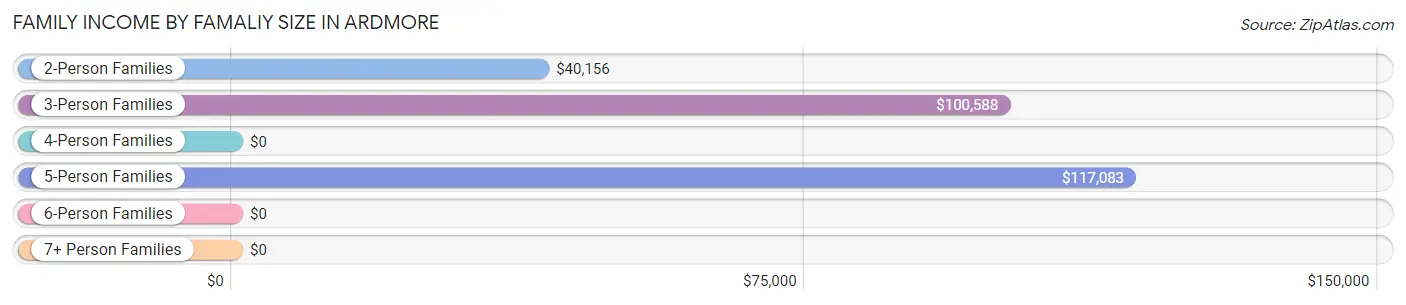
| Income Bracket | # Families | Median Income |
| 2-Person Families | 153 (47.7%) | $40,156 |
| 3-Person Families | 84 (26.2%) | $100,588 |
| 4-Person Families | 60 (18.7%) | $0 |
| 5-Person Families | 13 (4.1%) | $117,083 |
| 6-Person Families | 11 (3.4%) | $0 |
| 7+ Person Families | 0 (0.0%) | $0 |
| Total | 321 (100.0%) | $61,827 |
Family Income by Number of Earners in Ardmore
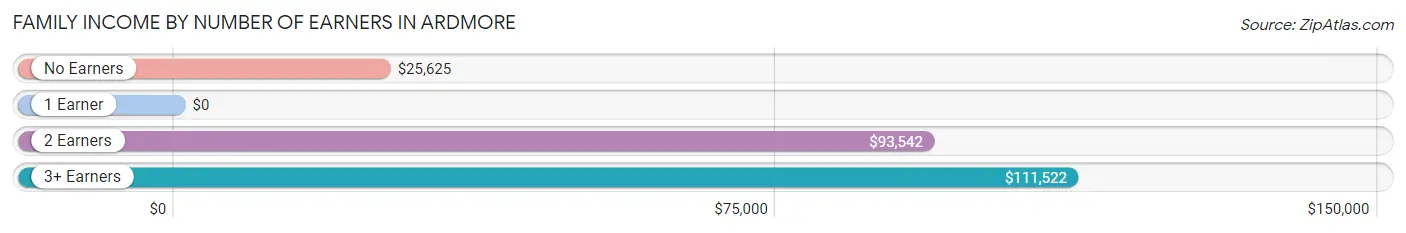
| Number of Earners | # Families | Median Income |
| No Earners | 97 (30.2%) | $25,625 |
| 1 Earner | 60 (18.7%) | $0 |
| 2 Earners | 118 (36.8%) | $93,542 |
| 3+ Earners | 46 (14.3%) | $111,522 |
| Total | 321 (100.0%) | $61,827 |
Household Income in Ardmore
Household Income Brackets in Ardmore
With 93 households falling in the category, the $15,000 to $24,999 income range is the most frequent in Ardmore, accounting for 18.5% of all households. In contrast, only 13 households (2.6%) fall into the less than $10,000 income bracket, making it the least populous group.
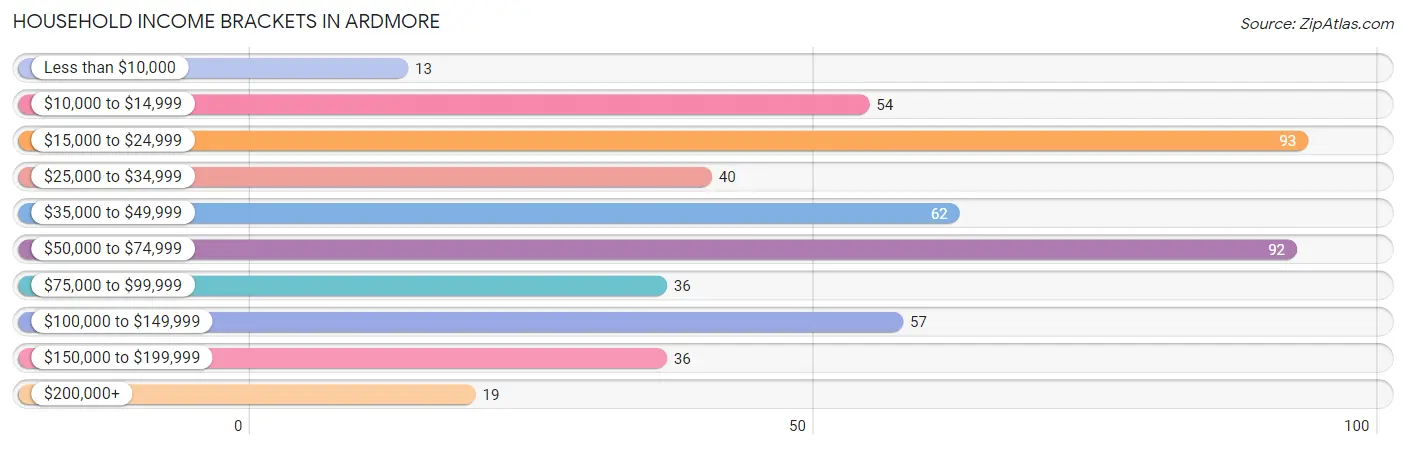
| Income Bracket | # Households | % Households |
| Less than $10,000 | 13 | 2.6% |
| $10,000 to $14,999 | 54 | 10.8% |
| $15,000 to $24,999 | 93 | 18.5% |
| $25,000 to $34,999 | 40 | 8.0% |
| $35,000 to $49,999 | 62 | 12.4% |
| $50,000 to $74,999 | 92 | 18.3% |
| $75,000 to $99,999 | 36 | 7.2% |
| $100,000 to $149,999 | 57 | 11.4% |
| $150,000 to $199,999 | 36 | 7.2% |
| $200,000+ | 19 | 3.8% |
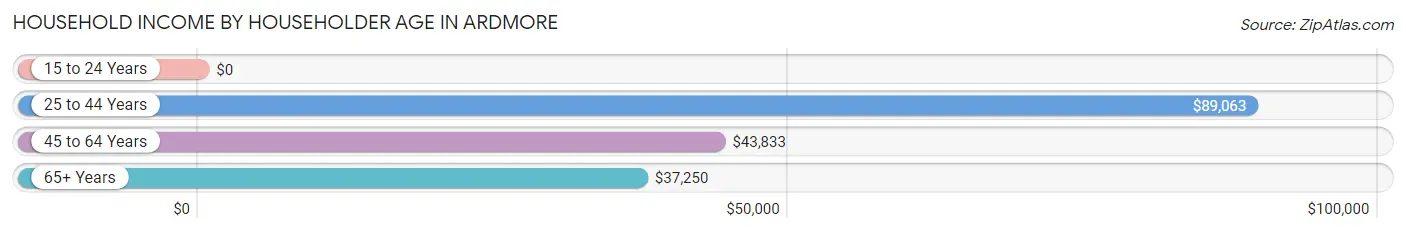
Household Income by Householder Age in Ardmore
The median household income in Ardmore is $45,750, with the highest median household income of $89,063 found in the 25 to 44 years age bracket for the primary householder. A total of 107 households (21.3%) fall into this category. Meanwhile, the 15 to 24 years age bracket for the primary householder has the lowest median household income of $0, with 18 households (3.6%) in this group.
| Income Bracket | # Households | Median Income |
| 15 to 24 Years | 18 (3.6%) | $0 |
| 25 to 44 Years | 107 (21.3%) | $89,063 |
| 45 to 64 Years | 222 (44.2%) | $43,833 |
| 65+ Years | 155 (30.9%) | $37,250 |
| Total | 502 (100.0%) | $45,750 |
Poverty in Ardmore
Income Below Poverty by Sex and Age in Ardmore
With 19.1% poverty level for males and 22.2% for females among the residents of Ardmore, 15 year old males and 5 year old females are the most vulnerable to poverty, with 3 males (100.0%) and 1 females (100.0%) in their respective age groups living below the poverty level.
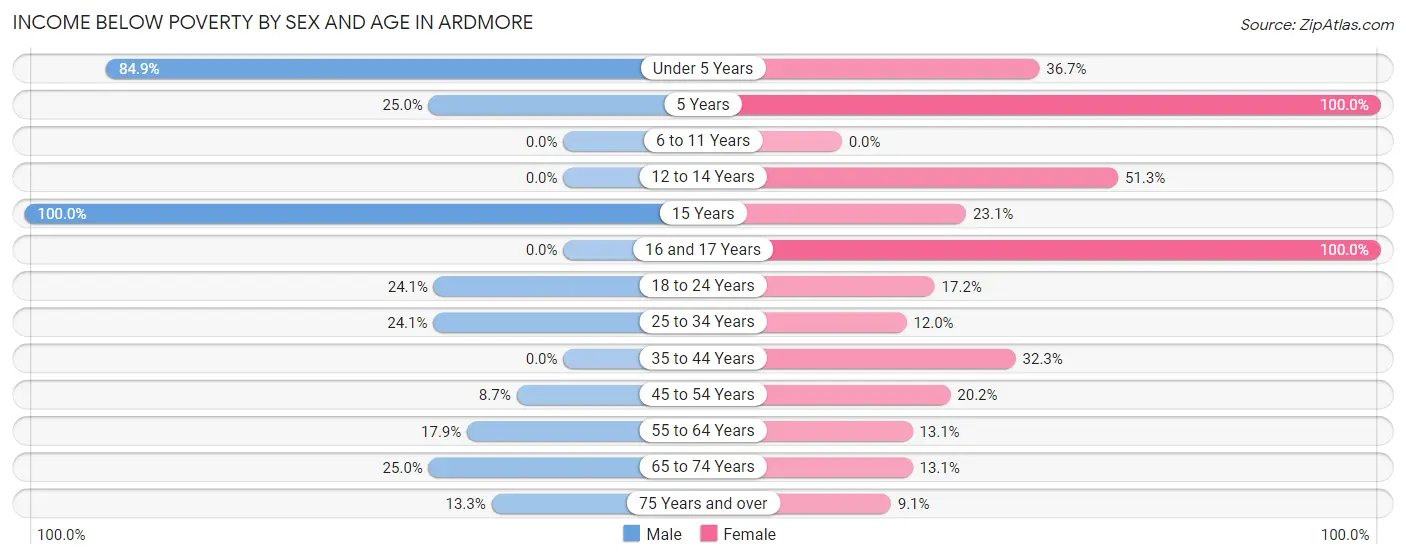
| Age Bracket | Male | Female |
| Under 5 Years | 28 (84.9%) | 11 (36.7%) |
| 5 Years | 3 (25.0%) | 1 (100.0%) |
| 6 to 11 Years | 0 (0.0%) | 0 (0.0%) |
| 12 to 14 Years | 0 (0.0%) | 20 (51.3%) |
| 15 Years | 3 (100.0%) | 6 (23.1%) |
| 16 and 17 Years | 0 (0.0%) | 19 (100.0%) |
| 18 to 24 Years | 19 (24.0%) | 5 (17.2%) |
| 25 to 34 Years | 21 (24.1%) | 9 (12.0%) |
| 35 to 44 Years | 0 (0.0%) | 20 (32.3%) |
| 45 to 54 Years | 10 (8.7%) | 27 (20.2%) |
| 55 to 64 Years | 20 (17.9%) | 8 (13.1%) |
| 65 to 74 Years | 17 (25.0%) | 13 (13.1%) |
| 75 Years and over | 4 (13.3%) | 5 (9.1%) |
| Total | 125 (19.1%) | 144 (22.2%) |
Income Above Poverty by Sex and Age in Ardmore
According to the poverty statistics in Ardmore, males aged 6 to 11 years and females aged 6 to 11 years are the age groups that are most secure financially, with 100.0% of males and 100.0% of females in these age groups living above the poverty line.
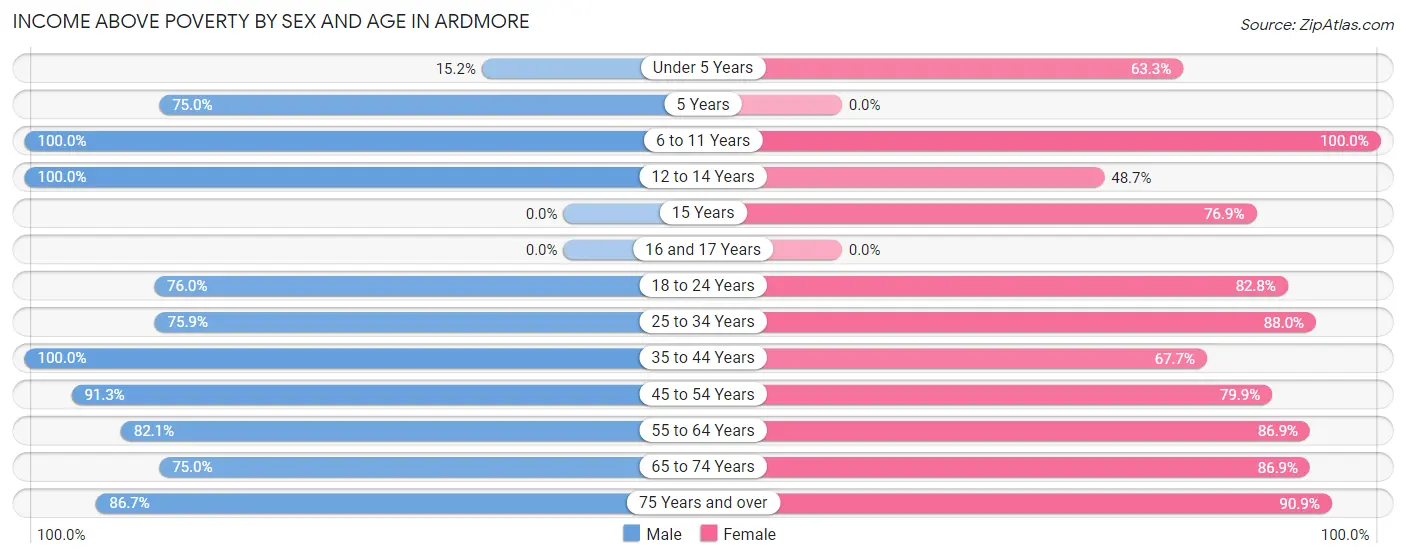
| Age Bracket | Male | Female |
| Under 5 Years | 5 (15.1%) | 19 (63.3%) |
| 5 Years | 9 (75.0%) | 0 (0.0%) |
| 6 to 11 Years | 23 (100.0%) | 20 (100.0%) |
| 12 to 14 Years | 18 (100.0%) | 19 (48.7%) |
| 15 Years | 0 (0.0%) | 20 (76.9%) |
| 16 and 17 Years | 0 (0.0%) | 0 (0.0%) |
| 18 to 24 Years | 60 (75.9%) | 24 (82.8%) |
| 25 to 34 Years | 66 (75.9%) | 66 (88.0%) |
| 35 to 44 Years | 73 (100.0%) | 42 (67.7%) |
| 45 to 54 Years | 105 (91.3%) | 107 (79.8%) |
| 55 to 64 Years | 92 (82.1%) | 53 (86.9%) |
| 65 to 74 Years | 51 (75.0%) | 86 (86.9%) |
| 75 Years and over | 26 (86.7%) | 50 (90.9%) |
| Total | 528 (80.9%) | 506 (77.8%) |
Income Below Poverty Among Married-Couple Families in Ardmore
The poverty statistics for married-couple families in Ardmore show that 13.4% or 29 of the total 217 families live below the poverty line. Families with no children have the highest poverty rate of 15.6%, comprising of 21 families. On the other hand, families with 3 or 4 children have the lowest poverty rate of 0.0%, which includes 0 families.
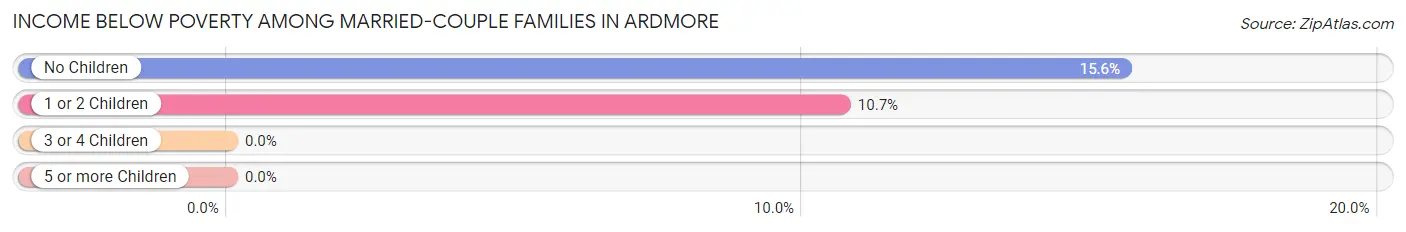
| Children | Above Poverty | Below Poverty |
| No Children | 114 (84.4%) | 21 (15.6%) |
| 1 or 2 Children | 67 (89.3%) | 8 (10.7%) |
| 3 or 4 Children | 7 (100.0%) | 0 (0.0%) |
| 5 or more Children | 0 (0.0%) | 0 (0.0%) |
| Total | 188 (86.6%) | 29 (13.4%) |
Income Below Poverty Among Single-Parent Households in Ardmore
According to the poverty data in Ardmore, 19.4% or 7 single-father households and 36.8% or 25 single-mother households are living below the poverty line. Among single-father households, those with 1 or 2 children have the highest poverty rate, with 7 households (70.0%) experiencing poverty. Likewise, among single-mother households, those with 1 or 2 children have the highest poverty rate, with 25 households (89.3%) falling below the poverty line.
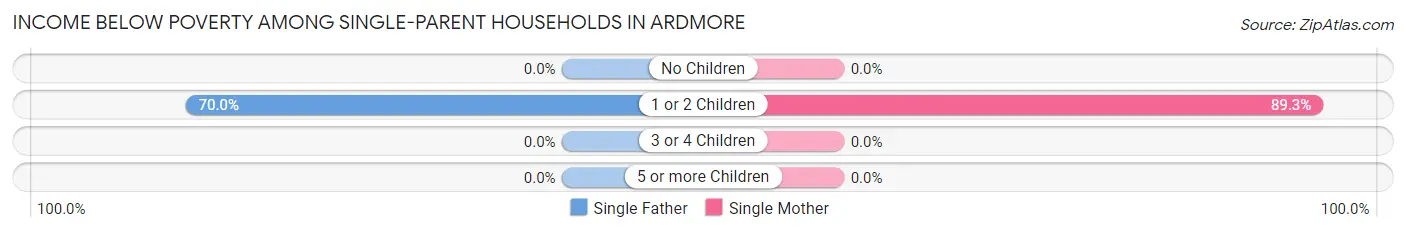
| Children | Single Father | Single Mother |
| No Children | 0 (0.0%) | 0 (0.0%) |
| 1 or 2 Children | 7 (70.0%) | 25 (89.3%) |
| 3 or 4 Children | 0 (0.0%) | 0 (0.0%) |
| 5 or more Children | 0 (0.0%) | 0 (0.0%) |
| Total | 7 (19.4%) | 25 (36.8%) |
Income Below Poverty Among Married-Couple vs Single-Parent Households in Ardmore
The poverty data for Ardmore shows that 29 of the married-couple family households (13.4%) and 32 of the single-parent households (30.8%) are living below the poverty level. Within the married-couple family households, those with no children have the highest poverty rate, with 21 households (15.6%) falling below the poverty line. Among the single-parent households, those with 1 or 2 children have the highest poverty rate, with 32 household (84.2%) living below poverty.
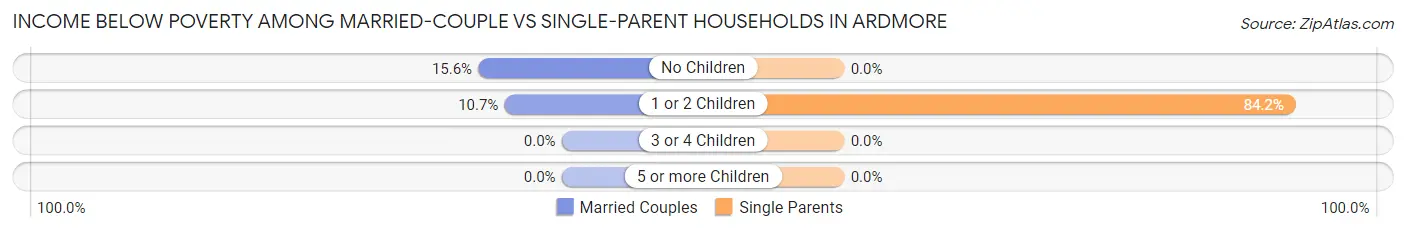
| Children | Married-Couple Families | Single-Parent Households |
| No Children | 21 (15.6%) | 0 (0.0%) |
| 1 or 2 Children | 8 (10.7%) | 32 (84.2%) |
| 3 or 4 Children | 0 (0.0%) | 0 (0.0%) |
| 5 or more Children | 0 (0.0%) | 0 (0.0%) |
| Total | 29 (13.4%) | 32 (30.8%) |
Race in Ardmore
The most populous races in Ardmore are White / Caucasian (1,264 | 93.3%), Hispanic or Latino (83 | 6.1%), and Black / African American (55 | 4.1%).
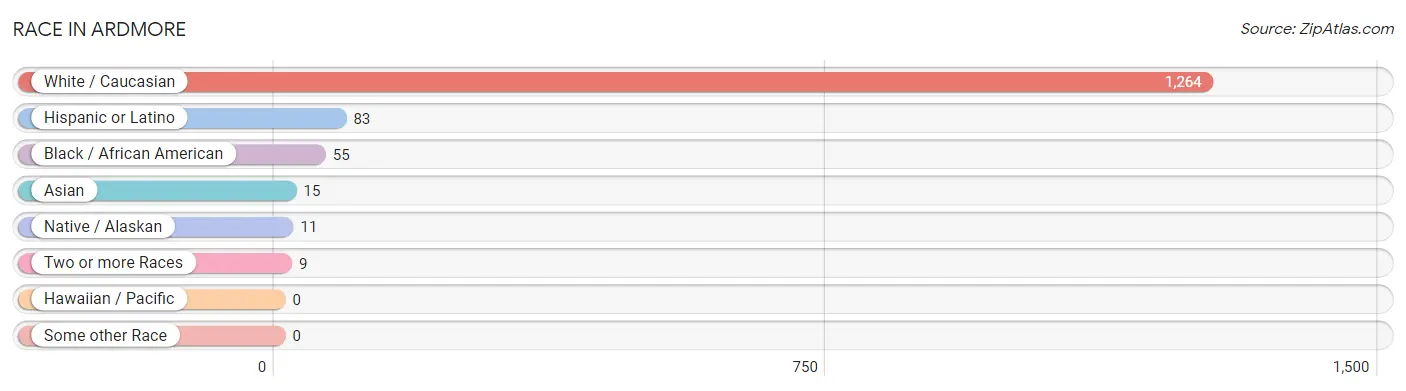
| Race | # Population | % Population |
| Asian | 15 | 1.1% |
| Black / African American | 55 | 4.1% |
| Hawaiian / Pacific | 0 | 0.0% |
| Hispanic or Latino | 83 | 6.1% |
| Native / Alaskan | 11 | 0.8% |
| White / Caucasian | 1,264 | 93.3% |
| Two or more Races | 9 | 0.7% |
| Some other Race | 0 | 0.0% |
| Total | 1,354 | 100.0% |
Ancestry in Ardmore
The most populous ancestries reported in Ardmore are American (243 | 17.9%), German (93 | 6.9%), English (81 | 6.0%), Mexican (78 | 5.8%), and Irish (76 | 5.6%), together accounting for 42.2% of all Ardmore residents.
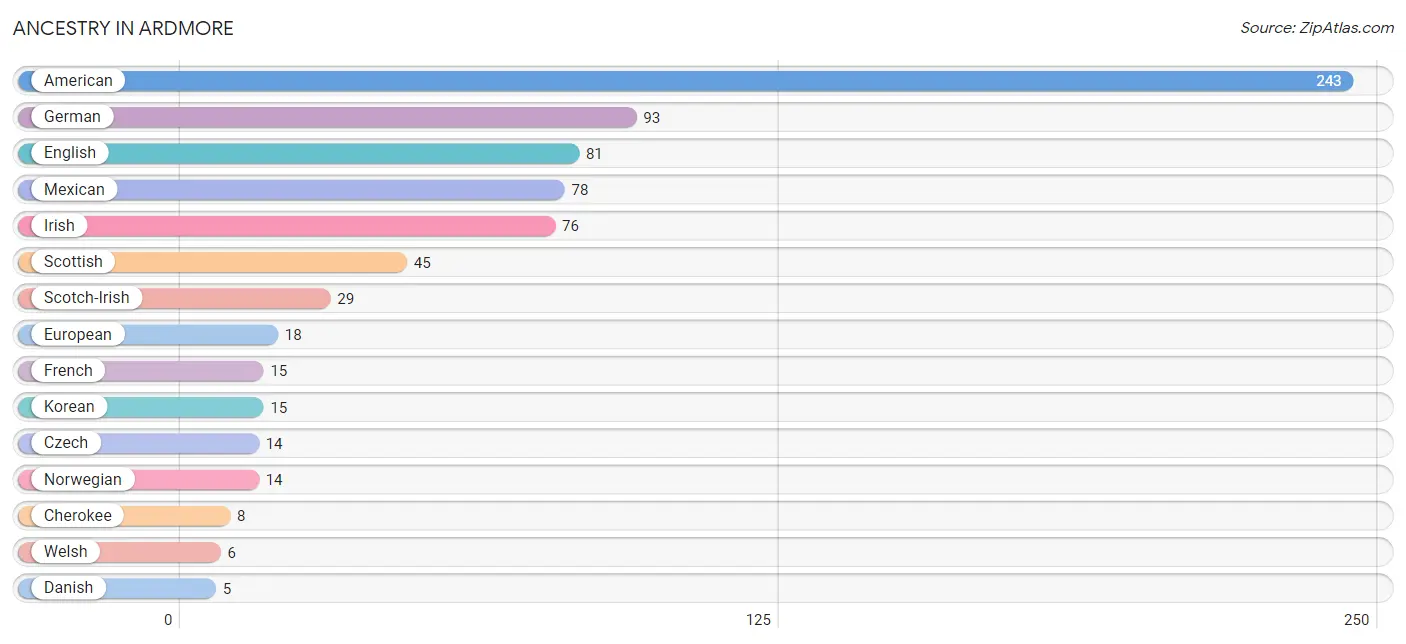
| Ancestry | # Population | % Population |
| American | 243 | 17.9% |
| Austrian | 2 | 0.2% |
| Blackfeet | 3 | 0.2% |
| British | 1 | 0.1% |
| Cherokee | 8 | 0.6% |
| Czech | 14 | 1.0% |
| Danish | 5 | 0.4% |
| English | 81 | 6.0% |
| European | 18 | 1.3% |
| French | 15 | 1.1% |
| German | 93 | 6.9% |
| Irish | 76 | 5.6% |
| Korean | 15 | 1.1% |
| Mexican | 78 | 5.8% |
| Norwegian | 14 | 1.0% |
| Ottawa | 5 | 0.4% |
| Polish | 2 | 0.2% |
| Scandinavian | 3 | 0.2% |
| Scotch-Irish | 29 | 2.1% |
| Scottish | 45 | 3.3% |
| Welsh | 6 | 0.4% | View All 21 Rows |
Immigrants in Ardmore
The most numerous immigrant groups reported in Ardmore came from Central America (16 | 1.2%), Latin America (16 | 1.2%), Mexico (16 | 1.2%), Asia (15 | 1.1%), and Philippines (15 | 1.1%), together accounting for 5.8% of all Ardmore residents.
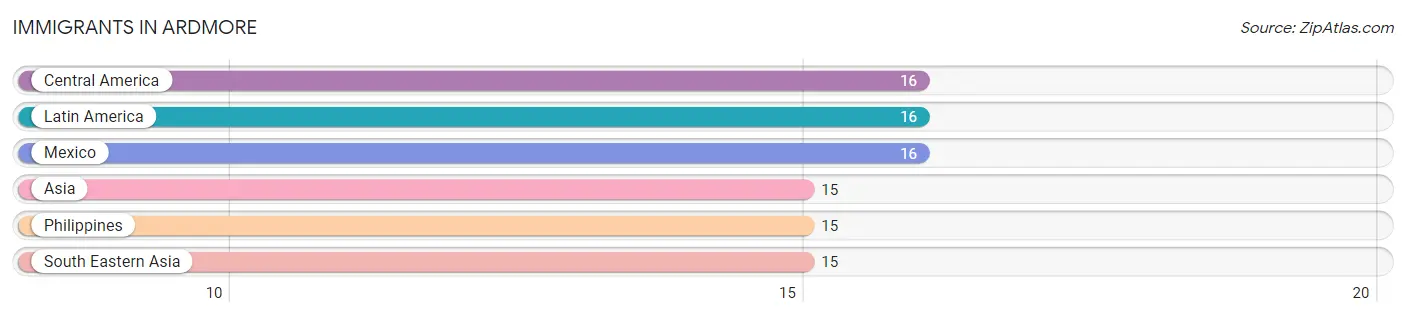
| Immigration Origin | # Population | % Population |
| Asia | 15 | 1.1% |
| Central America | 16 | 1.2% |
| Latin America | 16 | 1.2% |
| Mexico | 16 | 1.2% |
| Philippines | 15 | 1.1% |
| South Eastern Asia | 15 | 1.1% | View All 6 Rows |
Sex and Age in Ardmore
Sex and Age in Ardmore
The most populous age groups in Ardmore are 45 to 49 Years (68 | 10.1%) for men and 45 to 49 Years (76 | 11.2%) for women.
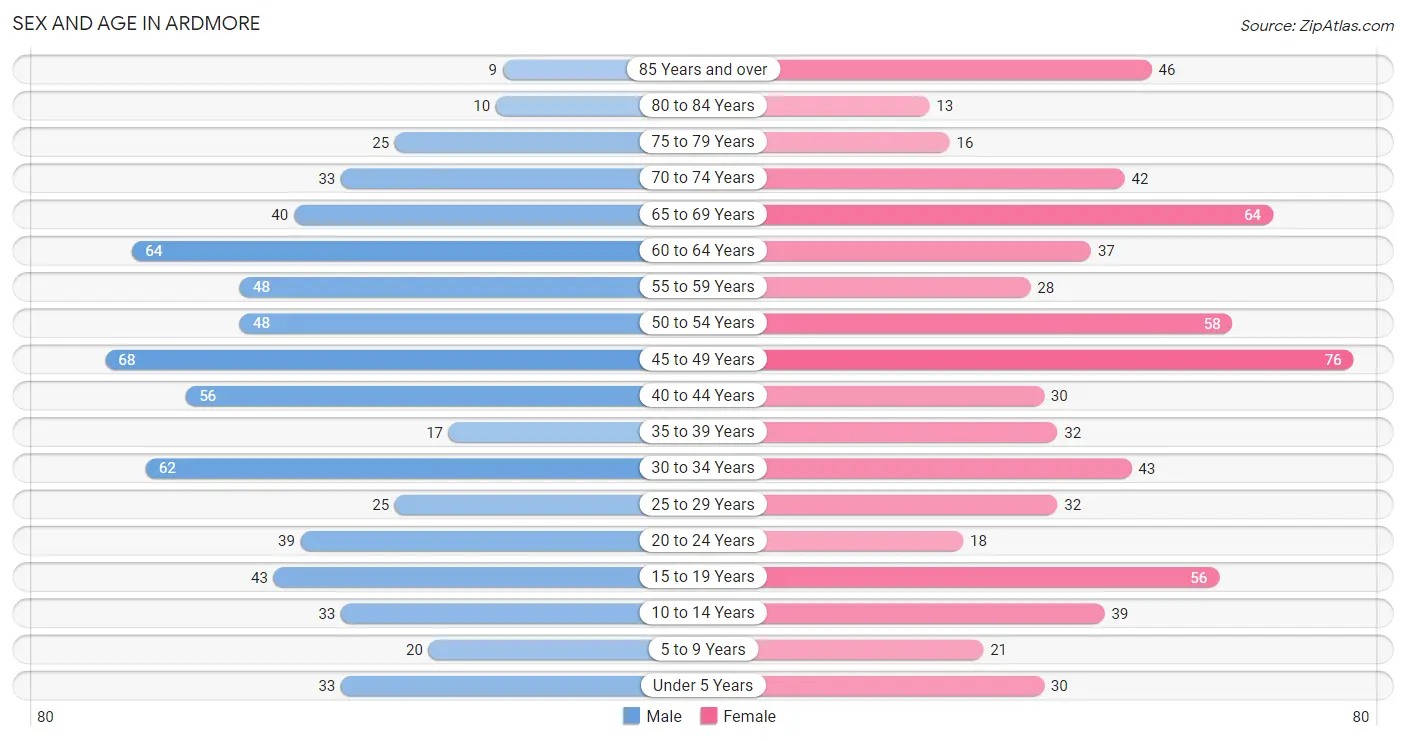
| Age Bracket | Male | Female |
| Under 5 Years | 33 (4.9%) | 30 (4.4%) |
| 5 to 9 Years | 20 (3.0%) | 21 (3.1%) |
| 10 to 14 Years | 33 (4.9%) | 39 (5.7%) |
| 15 to 19 Years | 43 (6.4%) | 56 (8.2%) |
| 20 to 24 Years | 39 (5.8%) | 18 (2.6%) |
| 25 to 29 Years | 25 (3.7%) | 32 (4.7%) |
| 30 to 34 Years | 62 (9.2%) | 43 (6.3%) |
| 35 to 39 Years | 17 (2.5%) | 32 (4.7%) |
| 40 to 44 Years | 56 (8.3%) | 30 (4.4%) |
| 45 to 49 Years | 68 (10.1%) | 76 (11.2%) |
| 50 to 54 Years | 48 (7.1%) | 58 (8.5%) |
| 55 to 59 Years | 48 (7.1%) | 28 (4.1%) |
| 60 to 64 Years | 64 (9.5%) | 37 (5.4%) |
| 65 to 69 Years | 40 (5.9%) | 64 (9.4%) |
| 70 to 74 Years | 33 (4.9%) | 42 (6.2%) |
| 75 to 79 Years | 25 (3.7%) | 16 (2.4%) |
| 80 to 84 Years | 10 (1.5%) | 13 (1.9%) |
| 85 Years and over | 9 (1.3%) | 46 (6.8%) |
| Total | 673 (100.0%) | 681 (100.0%) |
Families and Households in Ardmore
Median Family Size in Ardmore
The median family size in Ardmore is 3.29 persons per family, with single female/mother families (68 | 21.2%) accounting for the largest median family size of 3.75 persons per family. On the other hand, single male/father families (36 | 11.2%) represent the smallest median family size with 2.58 persons per family.
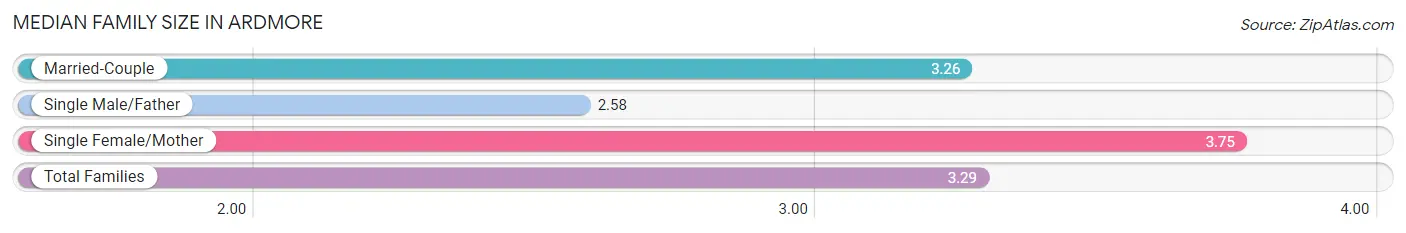
| Family Type | # Families | Family Size |
| Married-Couple | 217 (67.6%) | 3.26 |
| Single Male/Father | 36 (11.2%) | 2.58 |
| Single Female/Mother | 68 (21.2%) | 3.75 |
| Total Families | 321 (100.0%) | 3.29 |
Median Household Size in Ardmore
The median household size in Ardmore is 2.60 persons per household, with single female/mother households (68 | 13.6%) accounting for the largest median household size of 4.19 persons per household. non-family households (181 | 36.1%) represent the smallest median household size with 1.18 persons per household.
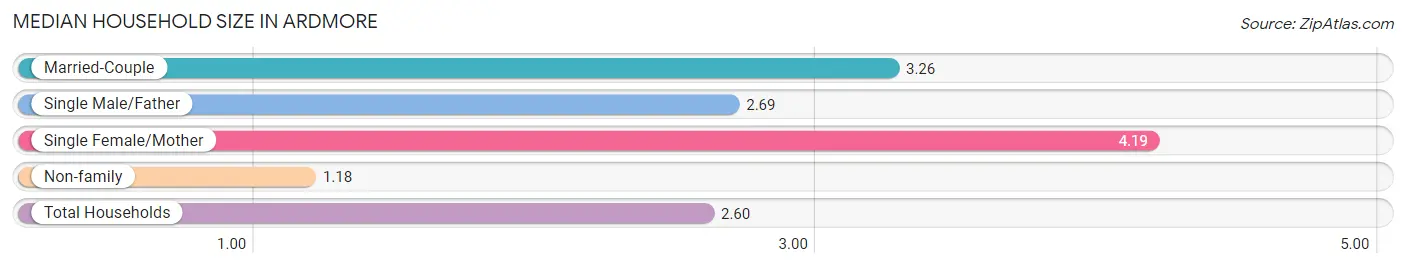
| Household Type | # Households | Household Size |
| Married-Couple | 217 (43.2%) | 3.26 |
| Single Male/Father | 36 (7.2%) | 2.69 |
| Single Female/Mother | 68 (13.6%) | 4.19 |
| Non-family | 181 (36.1%) | 1.18 |
| Total Households | 502 (100.0%) | 2.60 |
Household Size by Marriage Status in Ardmore
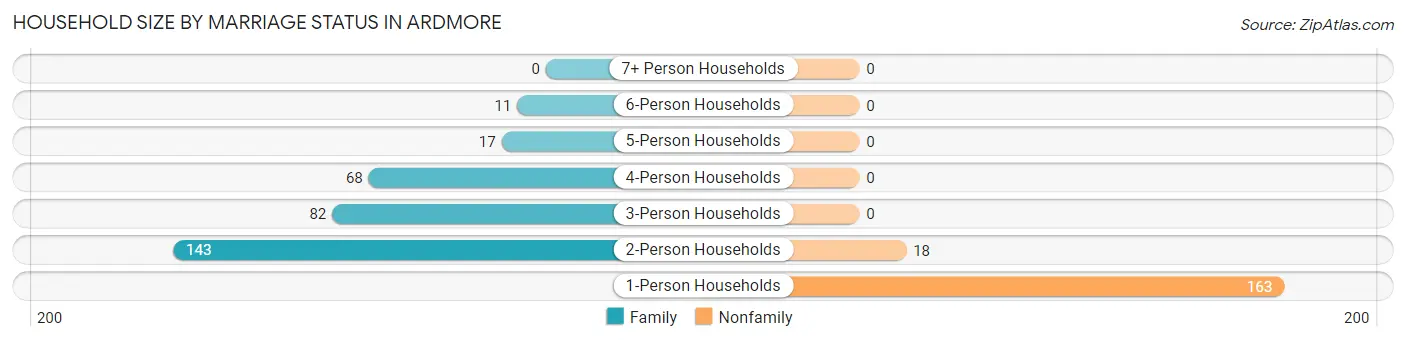
Out of a total of 502 households in Ardmore, 321 (63.9%) are family households, while 181 (36.1%) are nonfamily households. The most numerous type of family households are 2-person households, comprising 143, and the most common type of nonfamily households are 1-person households, comprising 163.
| Household Size | Family Households | Nonfamily Households |
| 1-Person Households | - | 163 (32.5%) |
| 2-Person Households | 143 (28.5%) | 18 (3.6%) |
| 3-Person Households | 82 (16.3%) | 0 (0.0%) |
| 4-Person Households | 68 (13.6%) | 0 (0.0%) |
| 5-Person Households | 17 (3.4%) | 0 (0.0%) |
| 6-Person Households | 11 (2.2%) | 0 (0.0%) |
| 7+ Person Households | 0 (0.0%) | 0 (0.0%) |
| Total | 321 (63.9%) | 181 (36.1%) |
Female Fertility in Ardmore
Fertility by Age in Ardmore
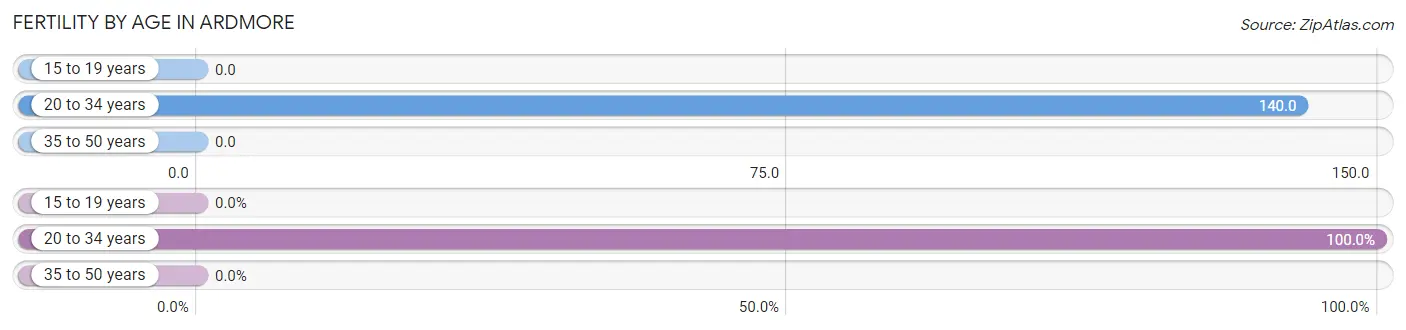
Average fertility rate in Ardmore is 44.0 births per 1,000 women. Women in the age bracket of 20 to 34 years have the highest fertility rate with 140.0 births per 1,000 women. Women in the age bracket of 20 to 34 years acount for 100.0% of all women with births.
| Age Bracket | Women with Births | Births / 1,000 Women |
| 15 to 19 years | 0 (0.0%) | 0.0 |
| 20 to 34 years | 13 (100.0%) | 140.0 |
| 35 to 50 years | 0 (0.0%) | 0.0 |
| Total | 13 (100.0%) | 44.0 |
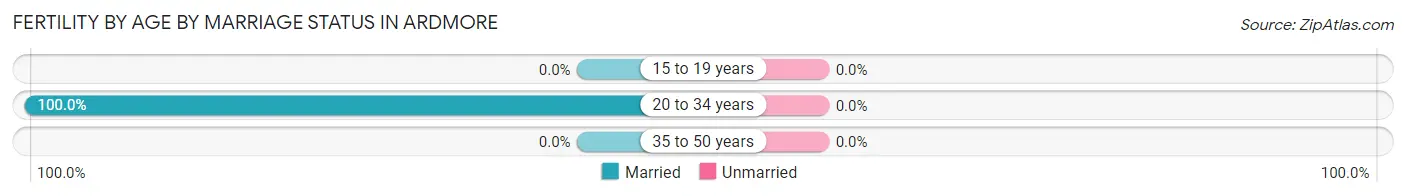
Fertility by Age by Marriage Status in Ardmore
| Age Bracket | Married | Unmarried |
| 15 to 19 years | 0 (0.0%) | 0 (0.0%) |
| 20 to 34 years | 13 (100.0%) | 0 (0.0%) |
| 35 to 50 years | 0 (0.0%) | 0 (0.0%) |
| Total | 13 (100.0%) | 0 (0.0%) |
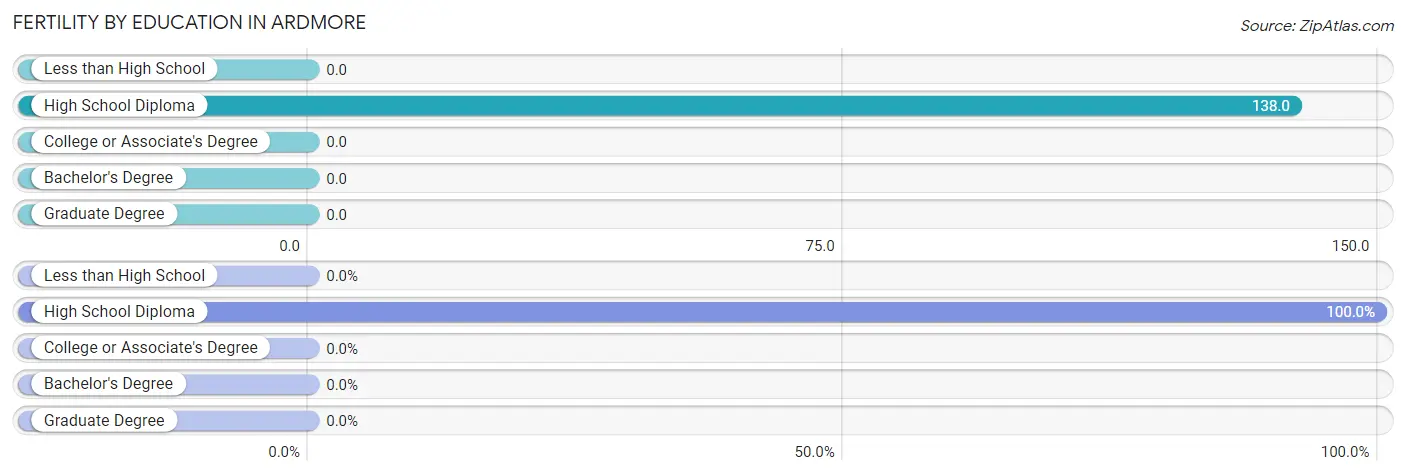
Fertility by Education in Ardmore
| Educational Attainment | Women with Births | Births / 1,000 Women |
| Less than High School | 0 (0.0%) | 0.0 |
| High School Diploma | 13 (100.0%) | 138.0 |
| College or Associate's Degree | 0 (0.0%) | 0.0 |
| Bachelor's Degree | 0 (0.0%) | 0.0 |
| Graduate Degree | 0 (0.0%) | 0.0 |
| Total | 13 (100.0%) | 44.0 |
Fertility by Education by Marriage Status in Ardmore
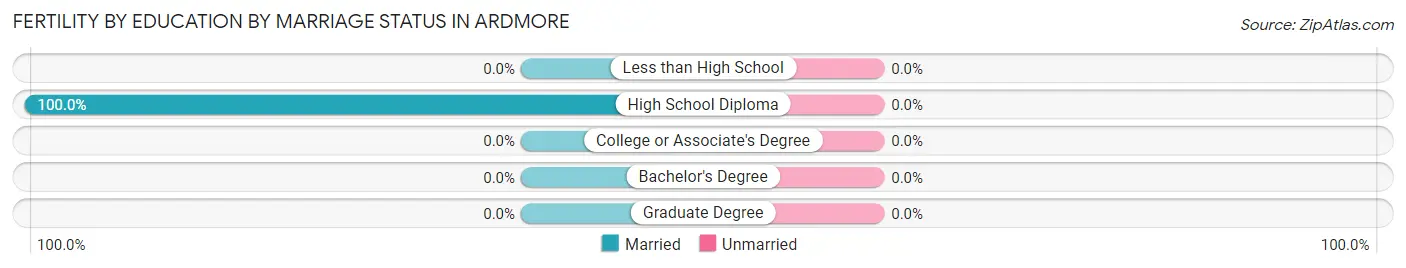
| Educational Attainment | Married | Unmarried |
| Less than High School | 0 (0.0%) | 0 (0.0%) |
| High School Diploma | 13 (100.0%) | 0 (0.0%) |
| College or Associate's Degree | 0 (0.0%) | 0 (0.0%) |
| Bachelor's Degree | 0 (0.0%) | 0 (0.0%) |
| Graduate Degree | 0 (0.0%) | 0 (0.0%) |
| Total | 13 (100.0%) | 0 (0.0%) |
Employment Characteristics in Ardmore
Employment by Class of Employer in Ardmore
Among the 536 employed individuals in Ardmore, private company employees (419 | 78.2%), local government employees (43 | 8.0%), and self-employed (not incorporated) (29 | 5.4%) make up the most common classes of employment.
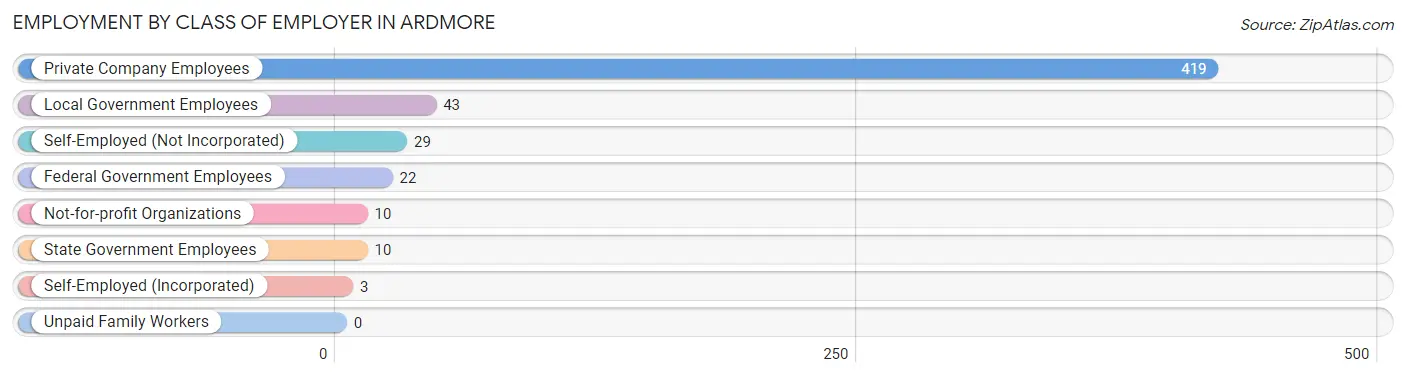
| Employer Class | # Employees | % Employees |
| Private Company Employees | 419 | 78.2% |
| Self-Employed (Incorporated) | 3 | 0.6% |
| Self-Employed (Not Incorporated) | 29 | 5.4% |
| Not-for-profit Organizations | 10 | 1.9% |
| Local Government Employees | 43 | 8.0% |
| State Government Employees | 10 | 1.9% |
| Federal Government Employees | 22 | 4.1% |
| Unpaid Family Workers | 0 | 0.0% |
| Total | 536 | 100.0% |
Employment Status by Age in Ardmore
According to the labor force statistics for Ardmore, out of the total population over 16 years of age (1,149), 50.9% or 585 individuals are in the labor force, with 7.3% or 43 of them unemployed. The age group with the highest labor force participation rate is 20 to 24 years, with 91.2% or 52 individuals in the labor force. Within the labor force, the 20 to 24 years age range has the highest percentage of unemployed individuals, with 36.5% or 19 of them being unemployed.
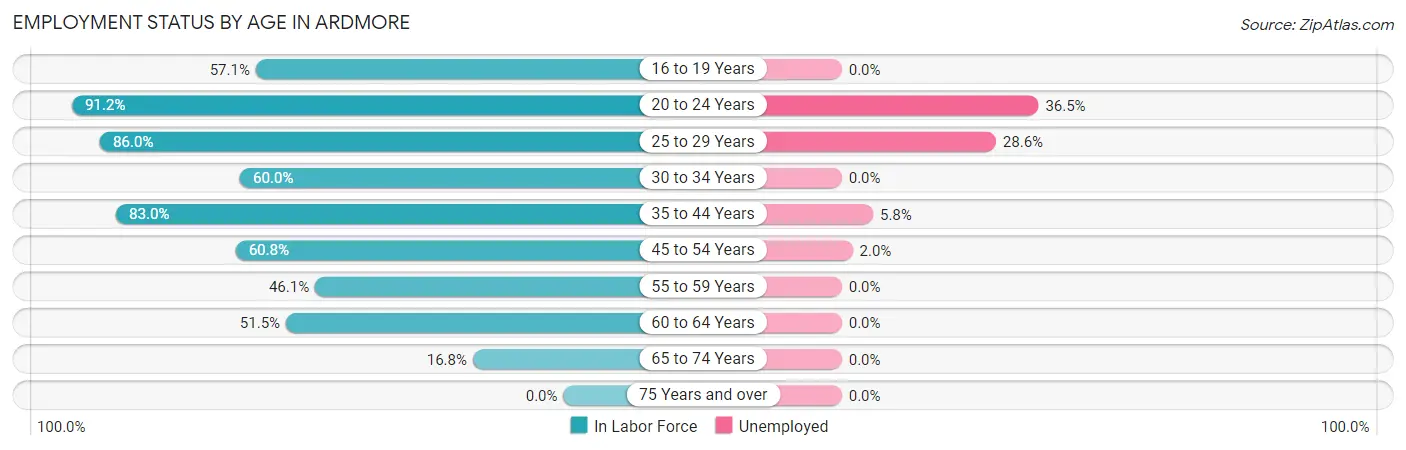
| Age Bracket | In Labor Force | Unemployed |
| 16 to 19 Years | 40 (57.1%) | 0 (0.0%) |
| 20 to 24 Years | 52 (91.2%) | 19 (36.5%) |
| 25 to 29 Years | 49 (86.0%) | 14 (28.6%) |
| 30 to 34 Years | 63 (60.0%) | 0 (0.0%) |
| 35 to 44 Years | 112 (83.0%) | 6 (5.8%) |
| 45 to 54 Years | 152 (60.8%) | 3 (2.0%) |
| 55 to 59 Years | 35 (46.1%) | 0 (0.0%) |
| 60 to 64 Years | 52 (51.5%) | 0 (0.0%) |
| 65 to 74 Years | 30 (16.8%) | 0 (0.0%) |
| 75 Years and over | 0 (0.0%) | 0 (0.0%) |
| Total | 585 (50.9%) | 43 (7.3%) |
Employment Status by Educational Attainment in Ardmore
According to labor force statistics for Ardmore, 64.0% of individuals (463) out of the total population between 25 and 64 years of age (724) are in the labor force, with 5.1% or 24 of them being unemployed. The group with the highest labor force participation rate are those with the educational attainment of bachelor's degree or higher, with 91.5% or 86 individuals in the labor force. Within the labor force, individuals with less than high school education have the highest percentage of unemployment, with 17.3% or 9 of them being unemployed.
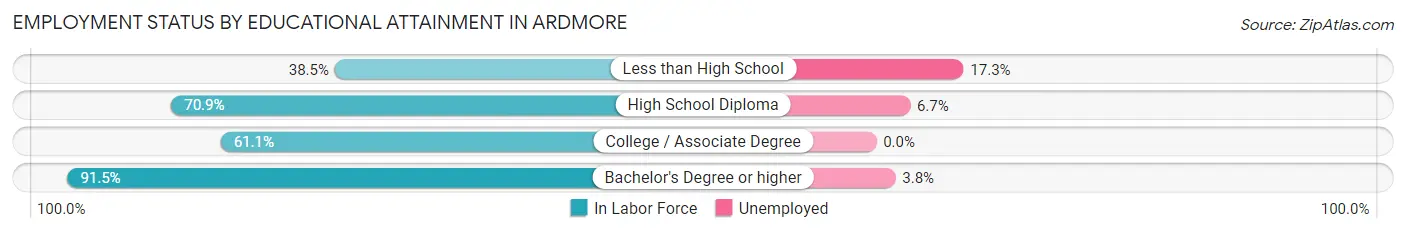
| Educational Attainment | In Labor Force | Unemployed |
| Less than High School | 52 (38.5%) | 23 (17.3%) |
| High School Diploma | 163 (70.9%) | 15 (6.7%) |
| College / Associate Degree | 162 (61.1%) | 0 (0.0%) |
| Bachelor's Degree or higher | 86 (91.5%) | 4 (3.8%) |
| Total | 463 (64.0%) | 37 (5.1%) |
Employment Occupations by Sex in Ardmore
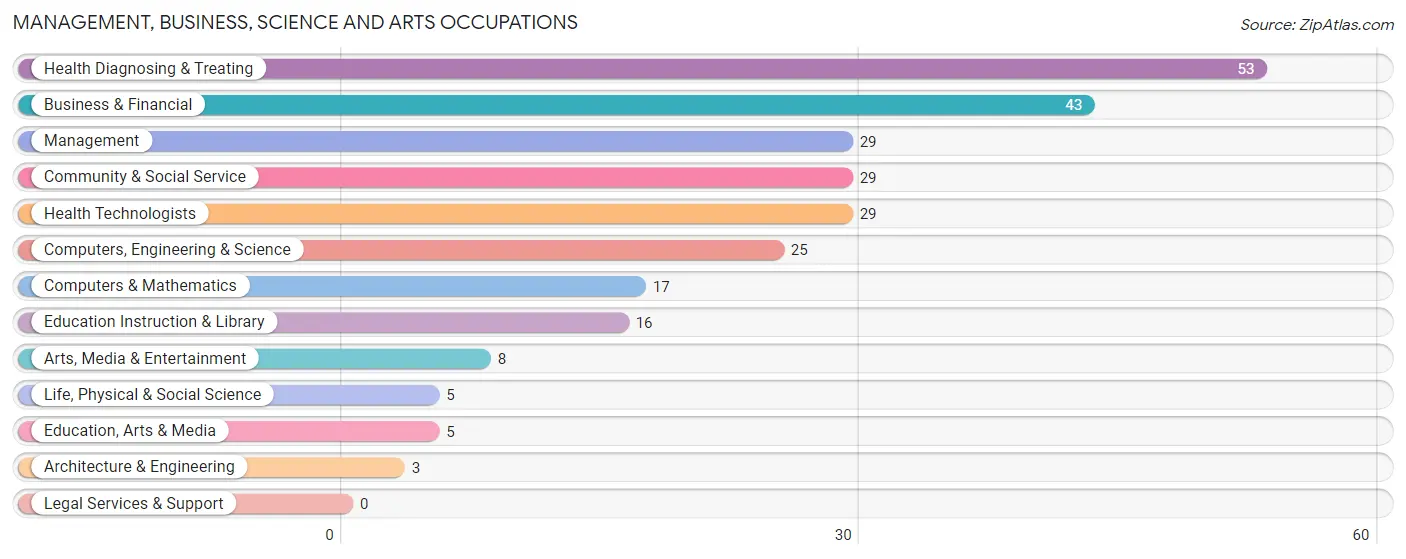
Management, Business, Science and Arts Occupations
The most common Management, Business, Science and Arts occupations in Ardmore are Health Diagnosing & Treating (53 | 9.9%), Business & Financial (43 | 8.0%), Management (29 | 5.4%), Community & Social Service (29 | 5.4%), and Health Technologists (29 | 5.4%).
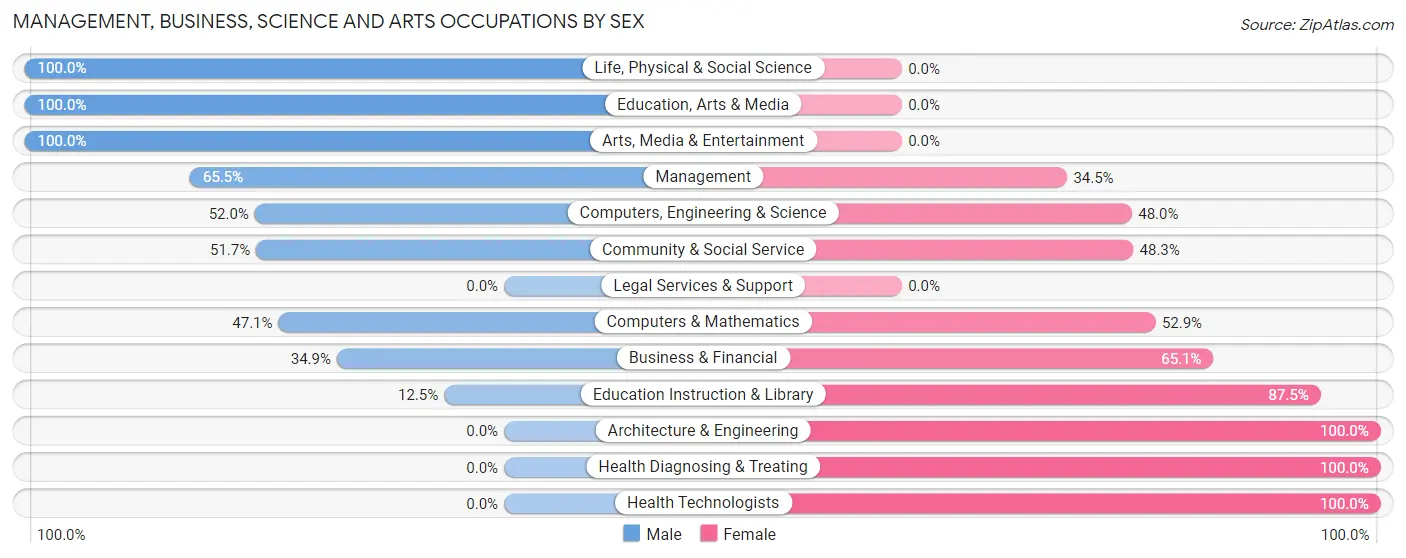
Management, Business, Science and Arts Occupations by Sex
Within the Management, Business, Science and Arts occupations in Ardmore, the most male-oriented occupations are Life, Physical & Social Science (100.0%), Education, Arts & Media (100.0%), and Arts, Media & Entertainment (100.0%), while the most female-oriented occupations are Architecture & Engineering (100.0%), Health Diagnosing & Treating (100.0%), and Health Technologists (100.0%).
| Occupation | Male | Female |
| Management | 19 (65.5%) | 10 (34.5%) |
| Business & Financial | 15 (34.9%) | 28 (65.1%) |
| Computers, Engineering & Science | 13 (52.0%) | 12 (48.0%) |
| Computers & Mathematics | 8 (47.1%) | 9 (52.9%) |
| Architecture & Engineering | 0 (0.0%) | 3 (100.0%) |
| Life, Physical & Social Science | 5 (100.0%) | 0 (0.0%) |
| Community & Social Service | 15 (51.7%) | 14 (48.3%) |
| Education, Arts & Media | 5 (100.0%) | 0 (0.0%) |
| Legal Services & Support | 0 (0.0%) | 0 (0.0%) |
| Education Instruction & Library | 2 (12.5%) | 14 (87.5%) |
| Arts, Media & Entertainment | 8 (100.0%) | 0 (0.0%) |
| Health Diagnosing & Treating | 0 (0.0%) | 53 (100.0%) |
| Health Technologists | 0 (0.0%) | 29 (100.0%) |
| Total (Category) | 62 (34.6%) | 117 (65.4%) |
| Total (Overall) | 301 (56.3%) | 234 (43.7%) |
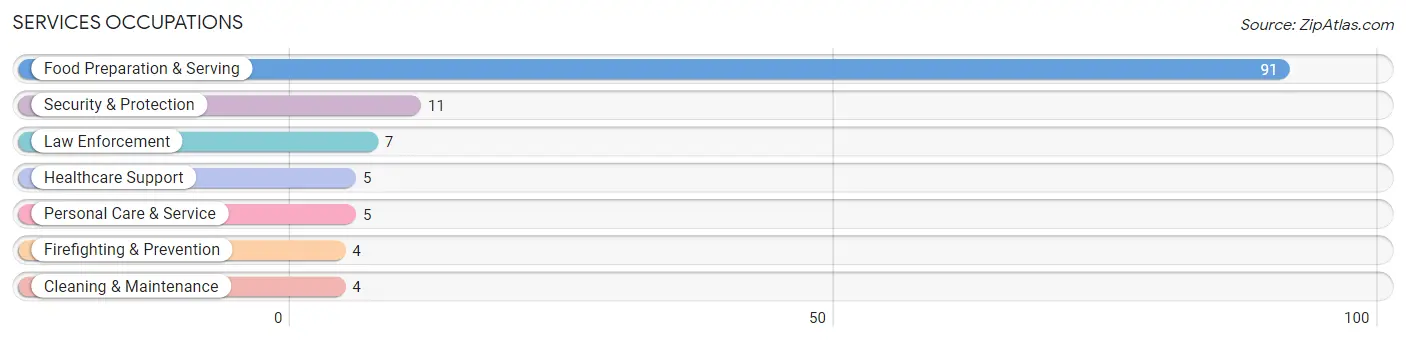
Services Occupations
The most common Services occupations in Ardmore are Food Preparation & Serving (91 | 17.0%), Security & Protection (11 | 2.1%), Law Enforcement (7 | 1.3%), Healthcare Support (5 | 0.9%), and Personal Care & Service (5 | 0.9%).
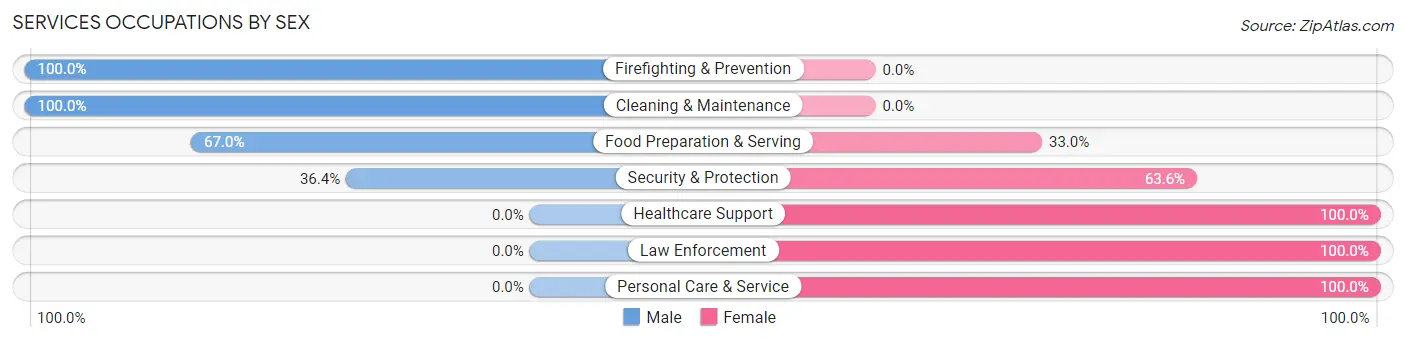
Services Occupations by Sex
Within the Services occupations in Ardmore, the most male-oriented occupations are Firefighting & Prevention (100.0%), Cleaning & Maintenance (100.0%), and Food Preparation & Serving (67.0%), while the most female-oriented occupations are Healthcare Support (100.0%), Law Enforcement (100.0%), and Personal Care & Service (100.0%).
| Occupation | Male | Female |
| Healthcare Support | 0 (0.0%) | 5 (100.0%) |
| Security & Protection | 4 (36.4%) | 7 (63.6%) |
| Firefighting & Prevention | 4 (100.0%) | 0 (0.0%) |
| Law Enforcement | 0 (0.0%) | 7 (100.0%) |
| Food Preparation & Serving | 61 (67.0%) | 30 (33.0%) |
| Cleaning & Maintenance | 4 (100.0%) | 0 (0.0%) |
| Personal Care & Service | 0 (0.0%) | 5 (100.0%) |
| Total (Category) | 69 (59.5%) | 47 (40.5%) |
| Total (Overall) | 301 (56.3%) | 234 (43.7%) |
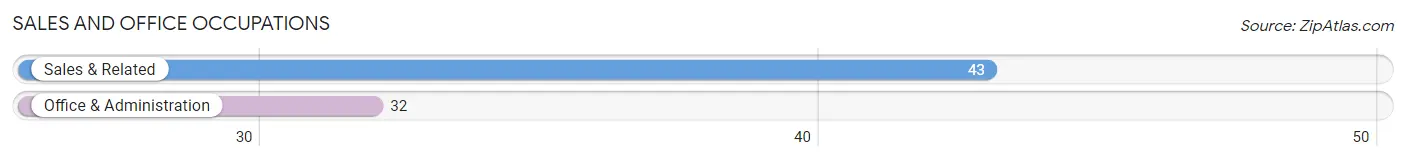
Sales and Office Occupations
The most common Sales and Office occupations in Ardmore are Sales & Related (43 | 8.0%), and Office & Administration (32 | 6.0%).
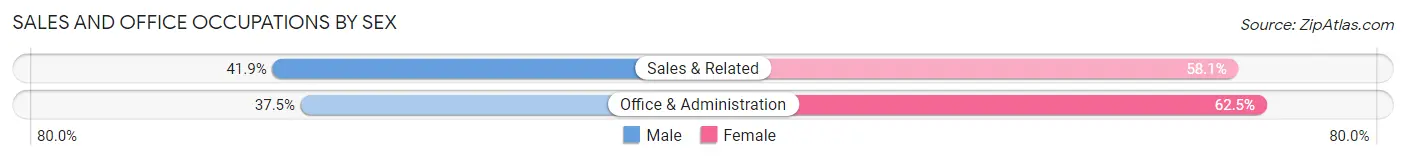
Sales and Office Occupations by Sex
| Occupation | Male | Female |
| Sales & Related | 18 (41.9%) | 25 (58.1%) |
| Office & Administration | 12 (37.5%) | 20 (62.5%) |
| Total (Category) | 30 (40.0%) | 45 (60.0%) |
| Total (Overall) | 301 (56.3%) | 234 (43.7%) |
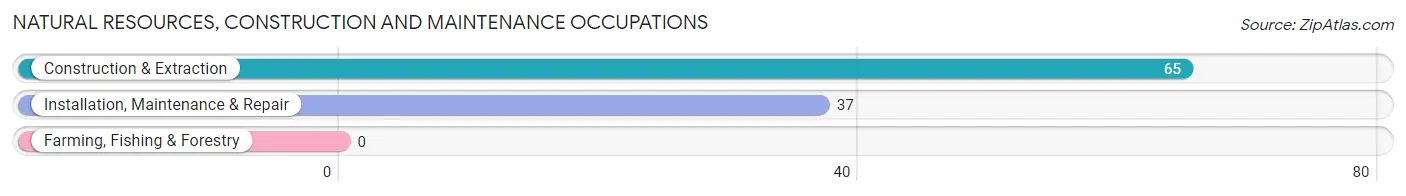
Natural Resources, Construction and Maintenance Occupations
The most common Natural Resources, Construction and Maintenance occupations in Ardmore are Construction & Extraction (65 | 12.1%), and Installation, Maintenance & Repair (37 | 6.9%).
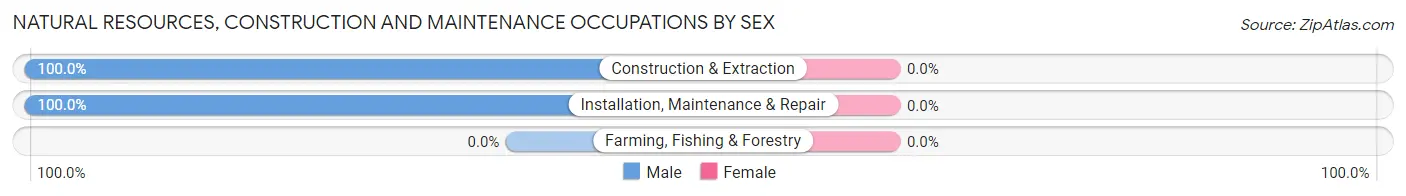
Natural Resources, Construction and Maintenance Occupations by Sex
| Occupation | Male | Female |
| Farming, Fishing & Forestry | 0 (0.0%) | 0 (0.0%) |
| Construction & Extraction | 65 (100.0%) | 0 (0.0%) |
| Installation, Maintenance & Repair | 37 (100.0%) | 0 (0.0%) |
| Total (Category) | 102 (100.0%) | 0 (0.0%) |
| Total (Overall) | 301 (56.3%) | 234 (43.7%) |
Production, Transportation and Moving Occupations
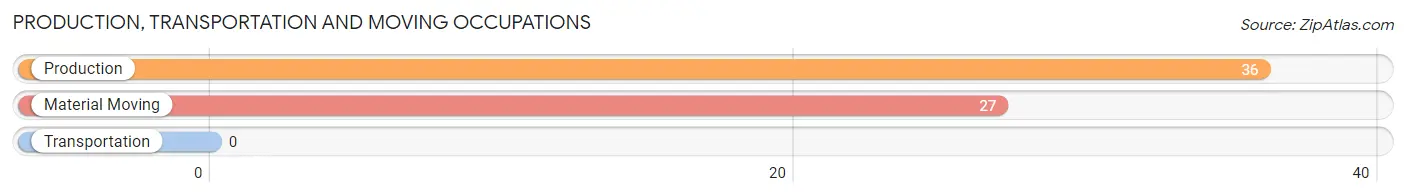
The most common Production, Transportation and Moving occupations in Ardmore are Production (36 | 6.7%), and Material Moving (27 | 5.1%).
Production, Transportation and Moving Occupations by Sex
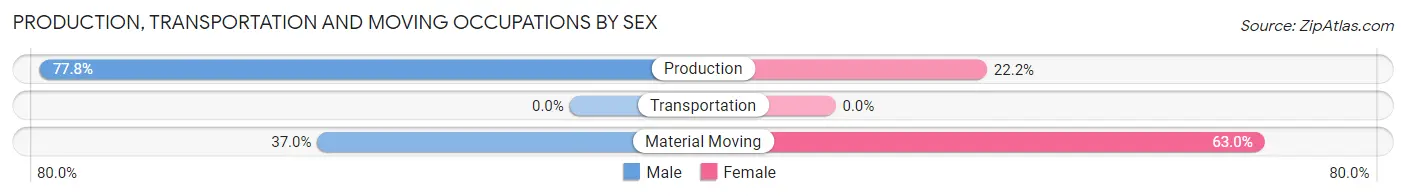
| Occupation | Male | Female |
| Production | 28 (77.8%) | 8 (22.2%) |
| Transportation | 0 (0.0%) | 0 (0.0%) |
| Material Moving | 10 (37.0%) | 17 (63.0%) |
| Total (Category) | 38 (60.3%) | 25 (39.7%) |
| Total (Overall) | 301 (56.3%) | 234 (43.7%) |
Employment Industries by Sex in Ardmore
Employment Industries in Ardmore
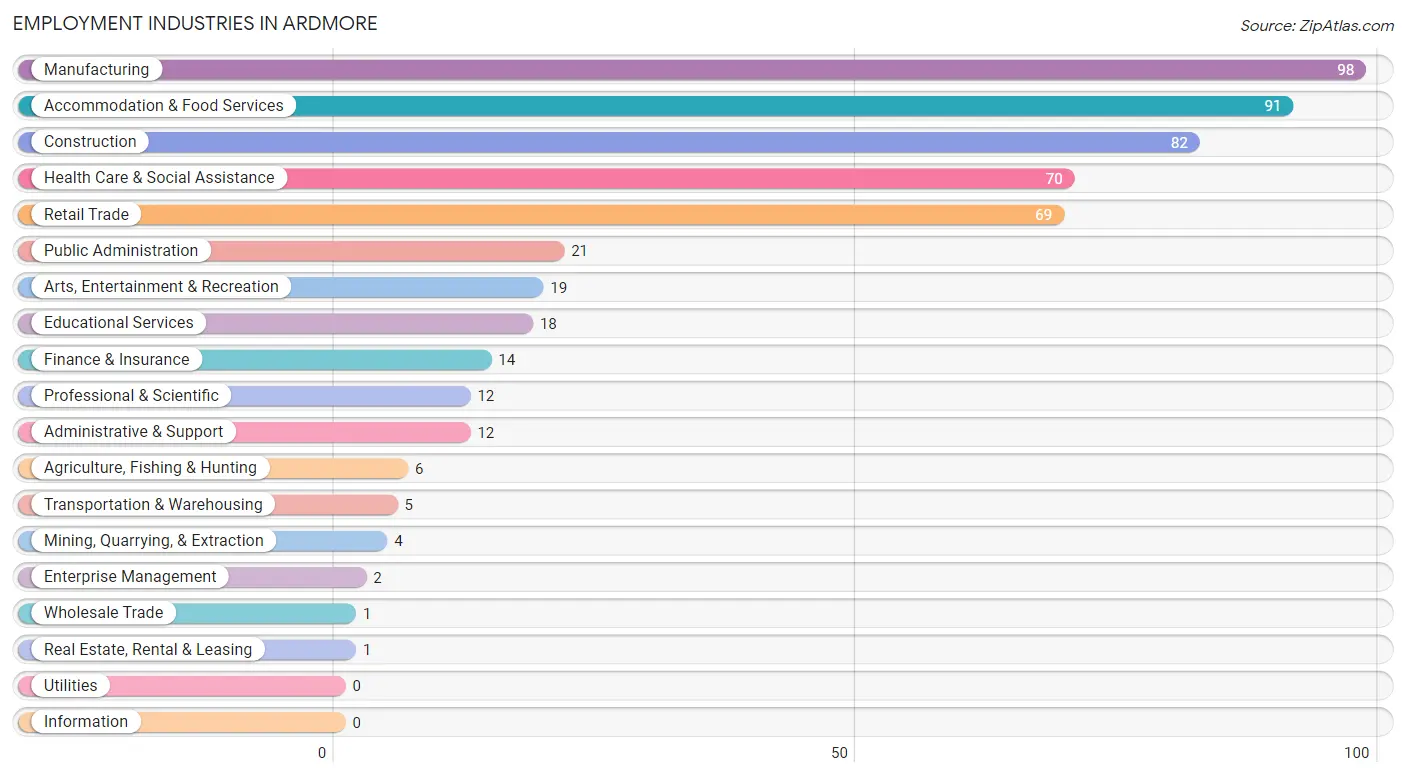
The major employment industries in Ardmore include Manufacturing (98 | 18.3%), Accommodation & Food Services (91 | 17.0%), Construction (82 | 15.3%), Health Care & Social Assistance (70 | 13.1%), and Retail Trade (69 | 12.9%).
Employment Industries by Sex in Ardmore
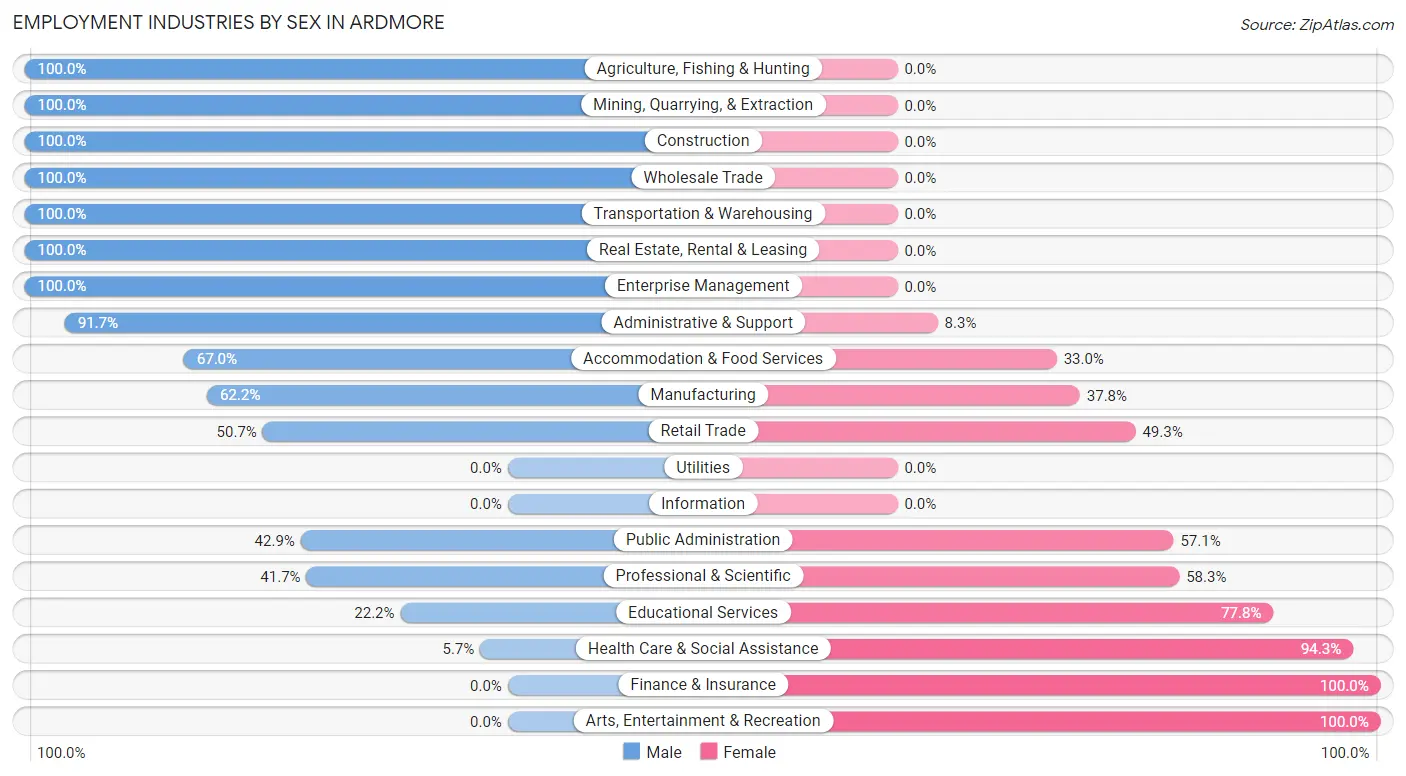
The Ardmore industries that see more men than women are Agriculture, Fishing & Hunting (100.0%), Mining, Quarrying, & Extraction (100.0%), and Construction (100.0%), whereas the industries that tend to have a higher number of women are Finance & Insurance (100.0%), Arts, Entertainment & Recreation (100.0%), and Health Care & Social Assistance (94.3%).
| Industry | Male | Female |
| Agriculture, Fishing & Hunting | 6 (100.0%) | 0 (0.0%) |
| Mining, Quarrying, & Extraction | 4 (100.0%) | 0 (0.0%) |
| Construction | 82 (100.0%) | 0 (0.0%) |
| Manufacturing | 61 (62.2%) | 37 (37.8%) |
| Wholesale Trade | 1 (100.0%) | 0 (0.0%) |
| Retail Trade | 35 (50.7%) | 34 (49.3%) |
| Transportation & Warehousing | 5 (100.0%) | 0 (0.0%) |
| Utilities | 0 (0.0%) | 0 (0.0%) |
| Information | 0 (0.0%) | 0 (0.0%) |
| Finance & Insurance | 0 (0.0%) | 14 (100.0%) |
| Real Estate, Rental & Leasing | 1 (100.0%) | 0 (0.0%) |
| Professional & Scientific | 5 (41.7%) | 7 (58.3%) |
| Enterprise Management | 2 (100.0%) | 0 (0.0%) |
| Administrative & Support | 11 (91.7%) | 1 (8.3%) |
| Educational Services | 4 (22.2%) | 14 (77.8%) |
| Health Care & Social Assistance | 4 (5.7%) | 66 (94.3%) |
| Arts, Entertainment & Recreation | 0 (0.0%) | 19 (100.0%) |
| Accommodation & Food Services | 61 (67.0%) | 30 (33.0%) |
| Public Administration | 9 (42.9%) | 12 (57.1%) |
| Total | 301 (56.3%) | 234 (43.7%) |
Education in Ardmore
School Enrollment in Ardmore
The most common levels of schooling among the 210 students in Ardmore are high school (91 | 43.3%), middle school (55 | 26.2%), and kindergarten (23 | 11.0%).
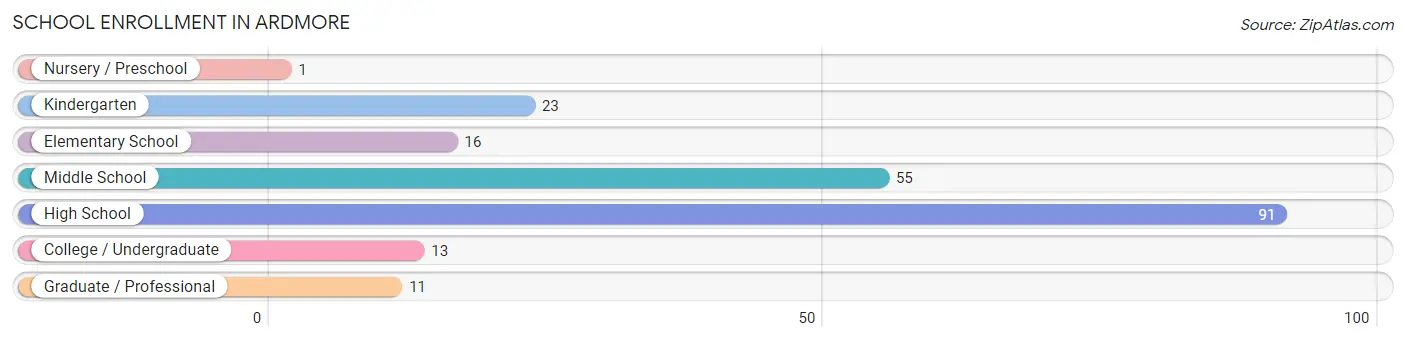
| School Level | # Students | % Students |
| Nursery / Preschool | 1 | 0.5% |
| Kindergarten | 23 | 11.0% |
| Elementary School | 16 | 7.6% |
| Middle School | 55 | 26.2% |
| High School | 91 | 43.3% |
| College / Undergraduate | 13 | 6.2% |
| Graduate / Professional | 11 | 5.2% |
| Total | 210 | 100.0% |
School Enrollment by Age by Funding Source in Ardmore
Out of a total of 210 students who are enrolled in schools in Ardmore, 35 (16.7%) attend a private institution, while the remaining 175 (83.3%) are enrolled in public schools. The age group of 10 to 14 year olds has the highest likelihood of being enrolled in private schools, with 18 (25.0% in the age bracket) enrolled. Conversely, the age group of 25 to 34 year olds has the lowest likelihood of being enrolled in a private school, with 4 (100.0% in the age bracket) attending a public institution.
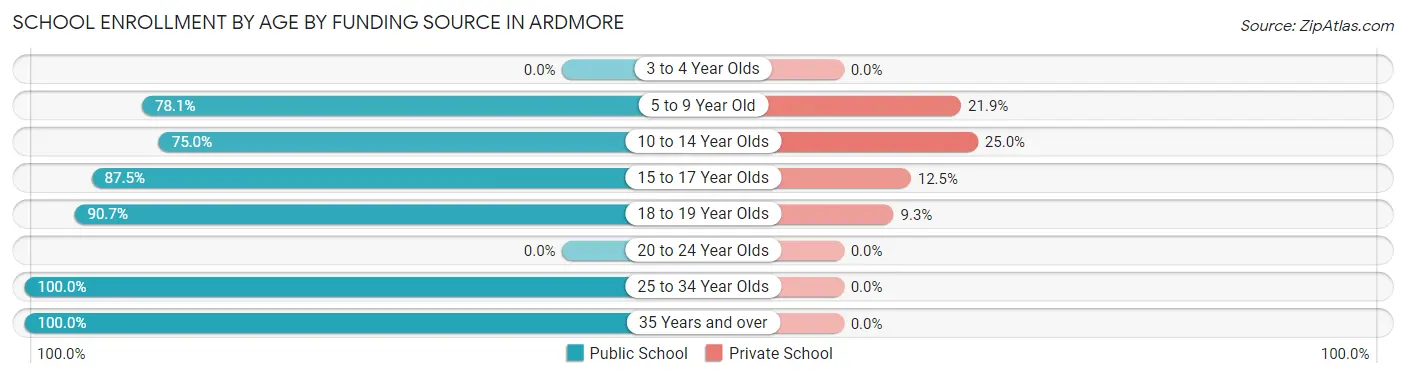
| Age Bracket | Public School | Private School |
| 3 to 4 Year Olds | 0 (0.0%) | 0 (0.0%) |
| 5 to 9 Year Old | 25 (78.1%) | 7 (21.9%) |
| 10 to 14 Year Olds | 54 (75.0%) | 18 (25.0%) |
| 15 to 17 Year Olds | 42 (87.5%) | 6 (12.5%) |
| 18 to 19 Year Olds | 39 (90.7%) | 4 (9.3%) |
| 20 to 24 Year Olds | 0 (0.0%) | 0 (0.0%) |
| 25 to 34 Year Olds | 4 (100.0%) | 0 (0.0%) |
| 35 Years and over | 11 (100.0%) | 0 (0.0%) |
| Total | 175 (83.3%) | 35 (16.7%) |
Educational Attainment by Field of Study in Ardmore
Education (23 | 16.9%), science & technology (21 | 15.4%), business (19 | 14.0%), physical & health sciences (13 | 9.6%), and communications (10 | 7.3%) are the most common fields of study among 136 individuals in Ardmore who have obtained a bachelor's degree or higher.
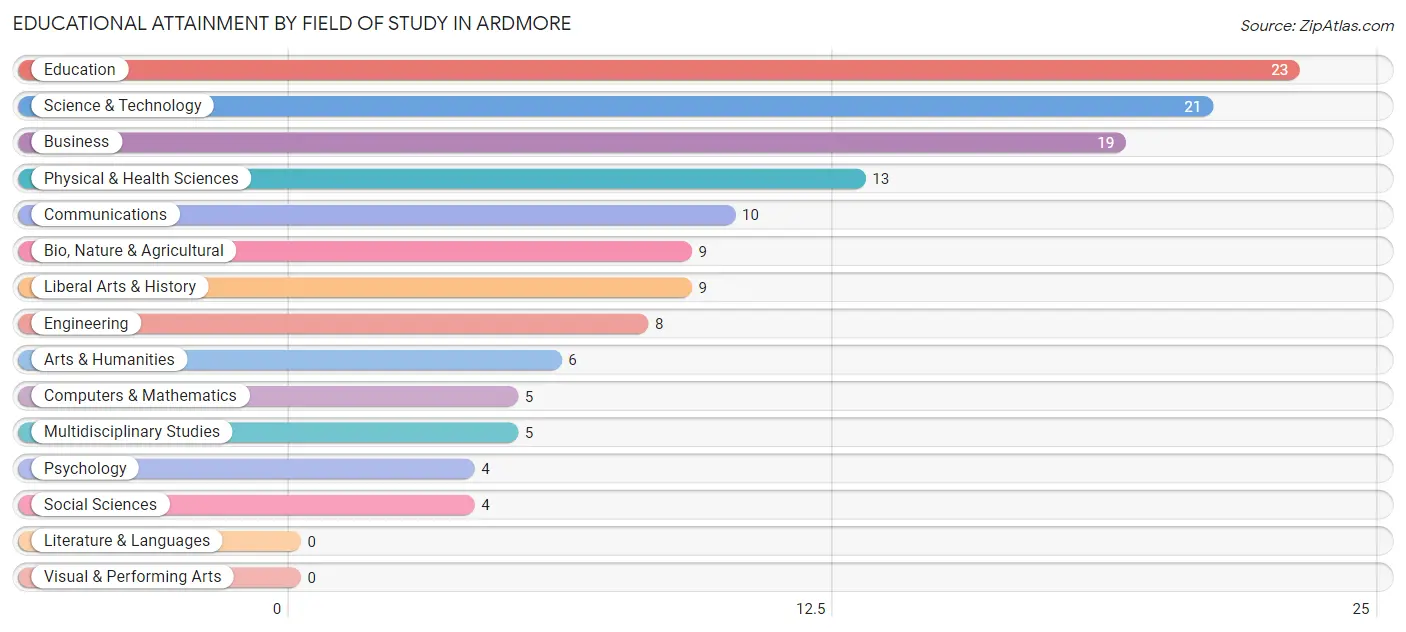
| Field of Study | # Graduates | % Graduates |
| Computers & Mathematics | 5 | 3.7% |
| Bio, Nature & Agricultural | 9 | 6.6% |
| Physical & Health Sciences | 13 | 9.6% |
| Psychology | 4 | 2.9% |
| Social Sciences | 4 | 2.9% |
| Engineering | 8 | 5.9% |
| Multidisciplinary Studies | 5 | 3.7% |
| Science & Technology | 21 | 15.4% |
| Business | 19 | 14.0% |
| Education | 23 | 16.9% |
| Literature & Languages | 0 | 0.0% |
| Liberal Arts & History | 9 | 6.6% |
| Visual & Performing Arts | 0 | 0.0% |
| Communications | 10 | 7.3% |
| Arts & Humanities | 6 | 4.4% |
| Total | 136 | 100.0% |
Transportation & Commute in Ardmore
Vehicle Availability by Sex in Ardmore
The most prevalent vehicle ownership categories in Ardmore are males with 2 vehicles (167, accounting for 55.3%) and females with 2 vehicles (107, making up 71.4%).
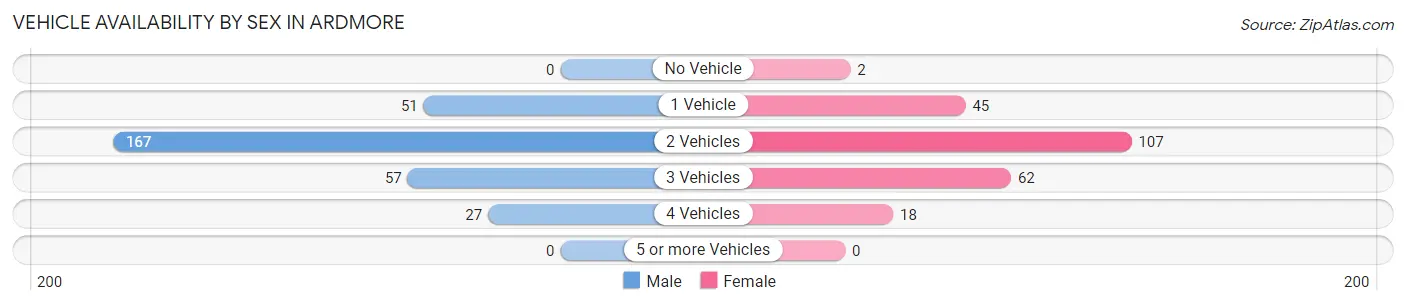
| Vehicles Available | Male | Female |
| No Vehicle | 0 (0.0%) | 2 (0.9%) |
| 1 Vehicle | 51 (16.9%) | 45 (19.2%) |
| 2 Vehicles | 167 (55.3%) | 107 (45.7%) |
| 3 Vehicles | 57 (18.9%) | 62 (26.5%) |
| 4 Vehicles | 27 (8.9%) | 18 (7.7%) |
| 5 or more Vehicles | 0 (0.0%) | 0 (0.0%) |
| Total | 302 (100.0%) | 234 (100.0%) |
Commute Time in Ardmore
The most frequently occuring commute durations in Ardmore are 45 to 59 minutes (105 commuters, 20.9%), 30 to 34 minutes (77 commuters, 15.3%), and 5 to 9 minutes (75 commuters, 14.9%).
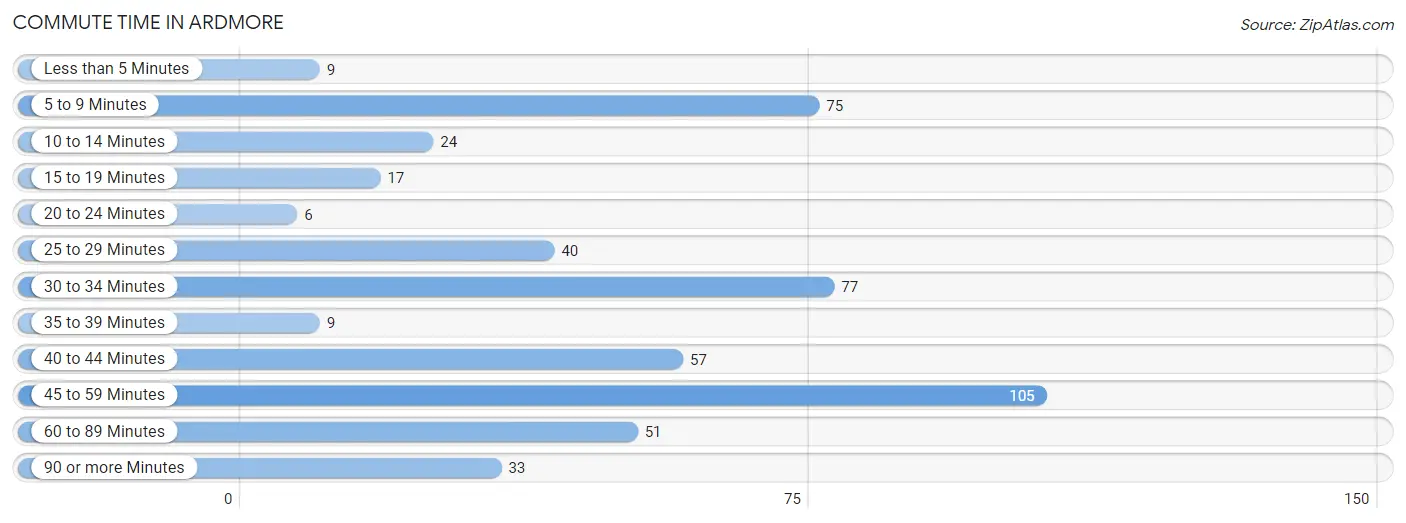
| Commute Time | # Commuters | % Commuters |
| Less than 5 Minutes | 9 | 1.8% |
| 5 to 9 Minutes | 75 | 14.9% |
| 10 to 14 Minutes | 24 | 4.8% |
| 15 to 19 Minutes | 17 | 3.4% |
| 20 to 24 Minutes | 6 | 1.2% |
| 25 to 29 Minutes | 40 | 8.0% |
| 30 to 34 Minutes | 77 | 15.3% |
| 35 to 39 Minutes | 9 | 1.8% |
| 40 to 44 Minutes | 57 | 11.3% |
| 45 to 59 Minutes | 105 | 20.9% |
| 60 to 89 Minutes | 51 | 10.1% |
| 90 or more Minutes | 33 | 6.6% |
Commute Time by Sex in Ardmore
The most common commute times in Ardmore are 30 to 34 minutes (54 commuters, 18.9%) for males and 45 to 59 minutes (73 commuters, 33.6%) for females.
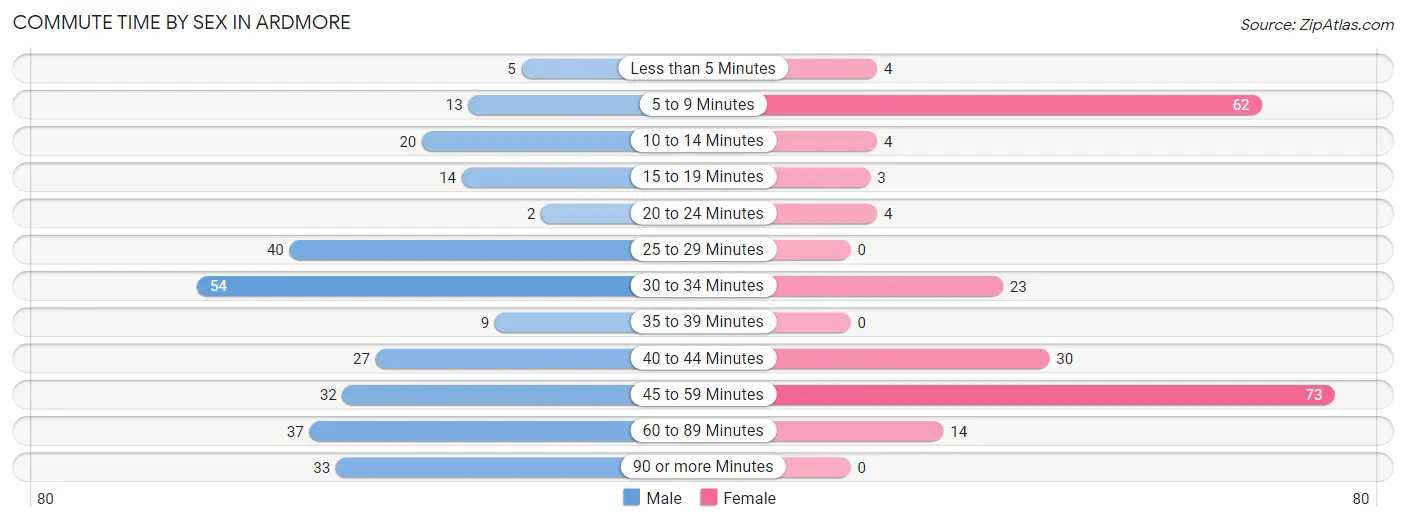
| Commute Time | Male | Female |
| Less than 5 Minutes | 5 (1.8%) | 4 (1.8%) |
| 5 to 9 Minutes | 13 (4.5%) | 62 (28.6%) |
| 10 to 14 Minutes | 20 (7.0%) | 4 (1.8%) |
| 15 to 19 Minutes | 14 (4.9%) | 3 (1.4%) |
| 20 to 24 Minutes | 2 (0.7%) | 4 (1.8%) |
| 25 to 29 Minutes | 40 (14.0%) | 0 (0.0%) |
| 30 to 34 Minutes | 54 (18.9%) | 23 (10.6%) |
| 35 to 39 Minutes | 9 (3.2%) | 0 (0.0%) |
| 40 to 44 Minutes | 27 (9.4%) | 30 (13.8%) |
| 45 to 59 Minutes | 32 (11.2%) | 73 (33.6%) |
| 60 to 89 Minutes | 37 (12.9%) | 14 (6.5%) |
| 90 or more Minutes | 33 (11.5%) | 0 (0.0%) |
Time of Departure to Work by Sex in Ardmore
The most frequent times of departure to work in Ardmore are 7:30 AM to 7:59 AM (68, 23.8%) for males and 5:00 AM to 5:29 AM (52, 24.0%) for females.
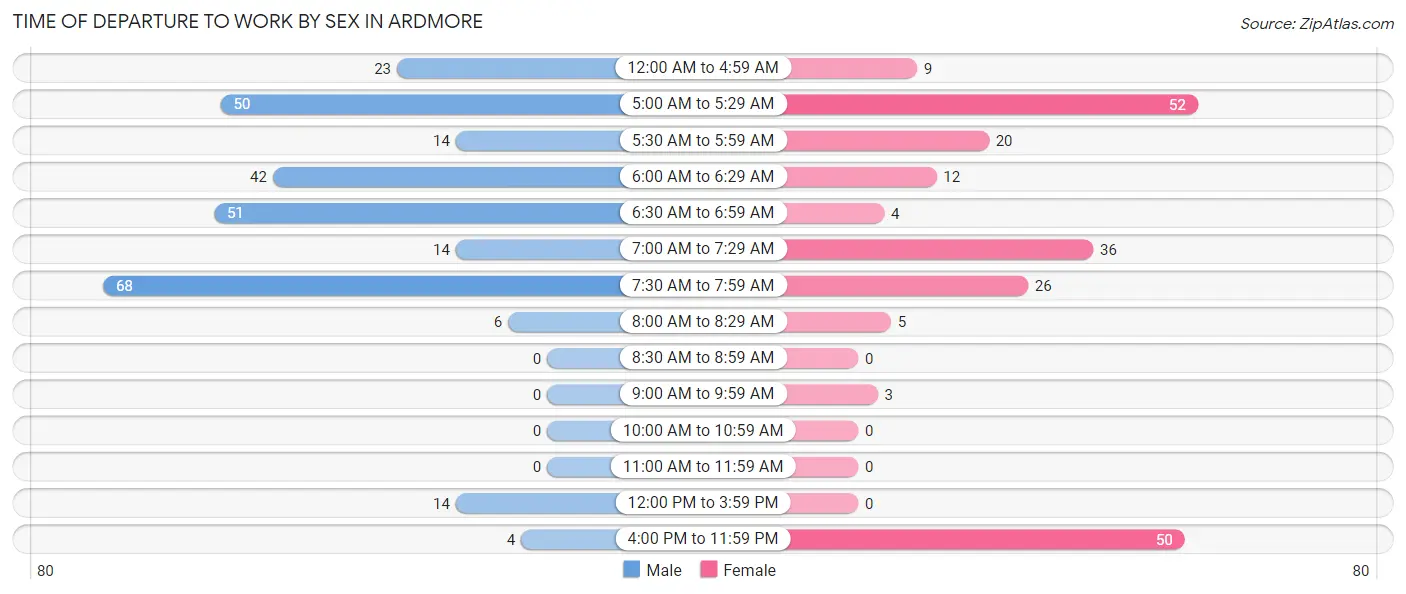
| Time of Departure | Male | Female |
| 12:00 AM to 4:59 AM | 23 (8.0%) | 9 (4.2%) |
| 5:00 AM to 5:29 AM | 50 (17.5%) | 52 (24.0%) |
| 5:30 AM to 5:59 AM | 14 (4.9%) | 20 (9.2%) |
| 6:00 AM to 6:29 AM | 42 (14.7%) | 12 (5.5%) |
| 6:30 AM to 6:59 AM | 51 (17.8%) | 4 (1.8%) |
| 7:00 AM to 7:29 AM | 14 (4.9%) | 36 (16.6%) |
| 7:30 AM to 7:59 AM | 68 (23.8%) | 26 (12.0%) |
| 8:00 AM to 8:29 AM | 6 (2.1%) | 5 (2.3%) |
| 8:30 AM to 8:59 AM | 0 (0.0%) | 0 (0.0%) |
| 9:00 AM to 9:59 AM | 0 (0.0%) | 3 (1.4%) |
| 10:00 AM to 10:59 AM | 0 (0.0%) | 0 (0.0%) |
| 11:00 AM to 11:59 AM | 0 (0.0%) | 0 (0.0%) |
| 12:00 PM to 3:59 PM | 14 (4.9%) | 0 (0.0%) |
| 4:00 PM to 11:59 PM | 4 (1.4%) | 50 (23.0%) |
| Total | 286 (100.0%) | 217 (100.0%) |
Housing Occupancy in Ardmore
Occupancy by Ownership in Ardmore
Of the total 502 dwellings in Ardmore, owner-occupied units account for 347 (69.1%), while renter-occupied units make up 155 (30.9%).
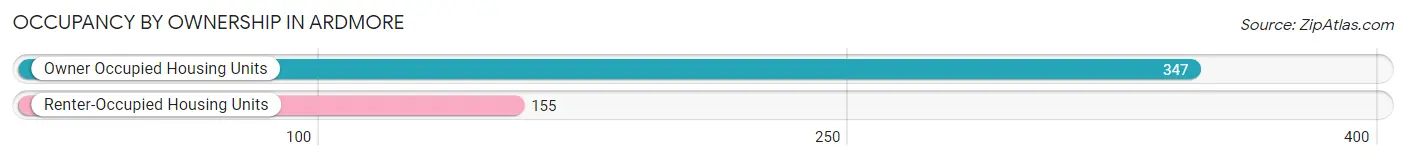
| Occupancy | # Housing Units | % Housing Units |
| Owner Occupied Housing Units | 347 | 69.1% |
| Renter-Occupied Housing Units | 155 | 30.9% |
| Total Occupied Housing Units | 502 | 100.0% |
Occupancy by Household Size in Ardmore
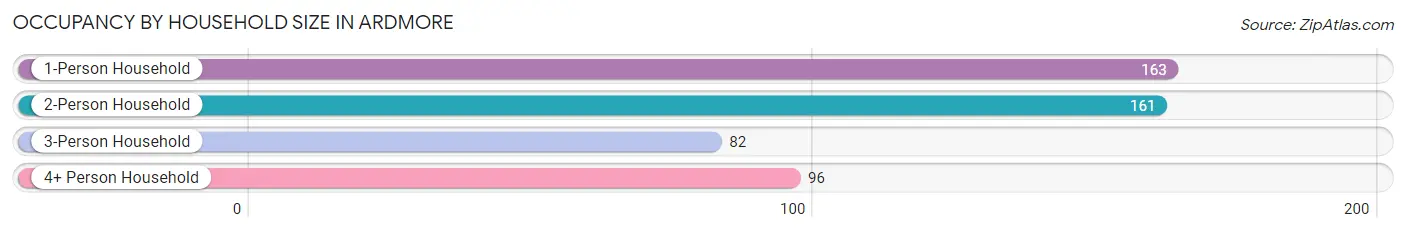
| Household Size | # Housing Units | % Housing Units |
| 1-Person Household | 163 | 32.5% |
| 2-Person Household | 161 | 32.1% |
| 3-Person Household | 82 | 16.3% |
| 4+ Person Household | 96 | 19.1% |
| Total Housing Units | 502 | 100.0% |
Occupancy by Ownership by Household Size in Ardmore
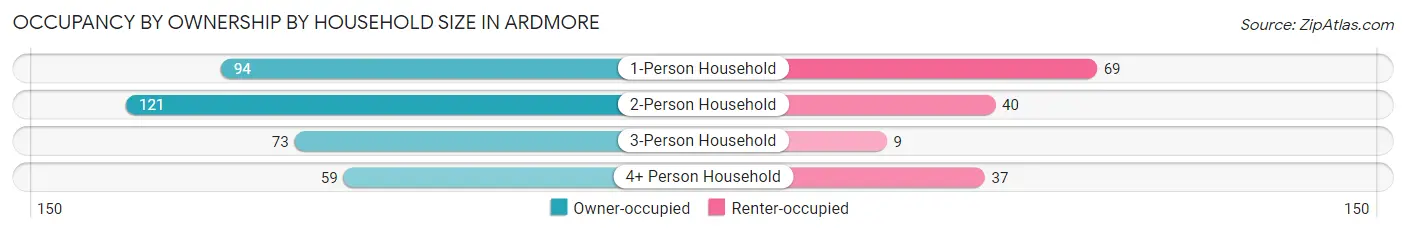
| Household Size | Owner-occupied | Renter-occupied |
| 1-Person Household | 94 (57.7%) | 69 (42.3%) |
| 2-Person Household | 121 (75.2%) | 40 (24.8%) |
| 3-Person Household | 73 (89.0%) | 9 (11.0%) |
| 4+ Person Household | 59 (61.5%) | 37 (38.5%) |
| Total Housing Units | 347 (69.1%) | 155 (30.9%) |
Occupancy by Educational Attainment in Ardmore
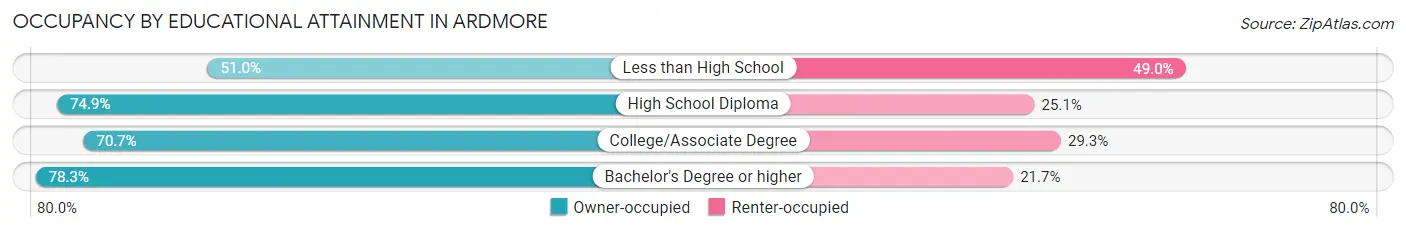
| Household Size | Owner-occupied | Renter-occupied |
| Less than High School | 53 (51.0%) | 51 (49.0%) |
| High School Diploma | 134 (74.9%) | 45 (25.1%) |
| College/Associate Degree | 106 (70.7%) | 44 (29.3%) |
| Bachelor's Degree or higher | 54 (78.3%) | 15 (21.7%) |
Occupancy by Age of Householder in Ardmore
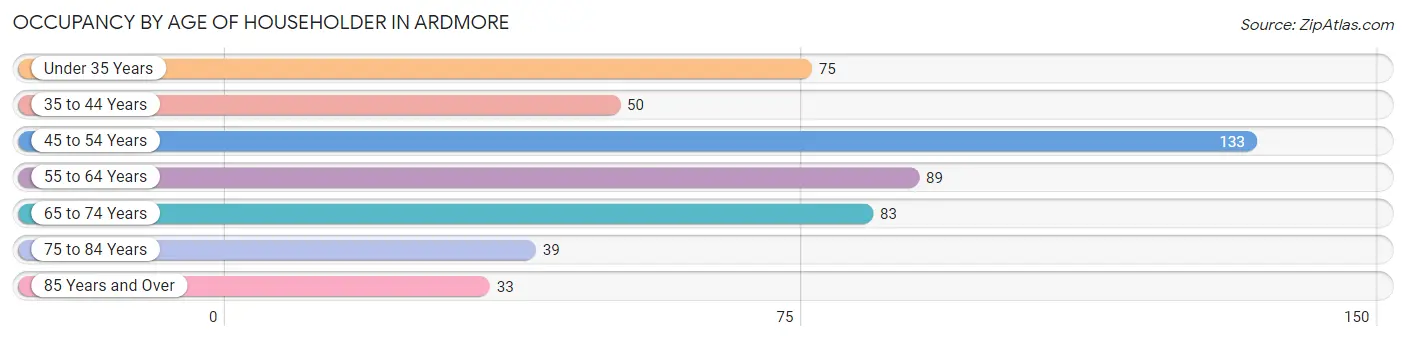
| Age Bracket | # Households | % Households |
| Under 35 Years | 75 | 14.9% |
| 35 to 44 Years | 50 | 10.0% |
| 45 to 54 Years | 133 | 26.5% |
| 55 to 64 Years | 89 | 17.7% |
| 65 to 74 Years | 83 | 16.5% |
| 75 to 84 Years | 39 | 7.8% |
| 85 Years and Over | 33 | 6.6% |
| Total | 502 | 100.0% |
Housing Finances in Ardmore
Median Income by Occupancy in Ardmore
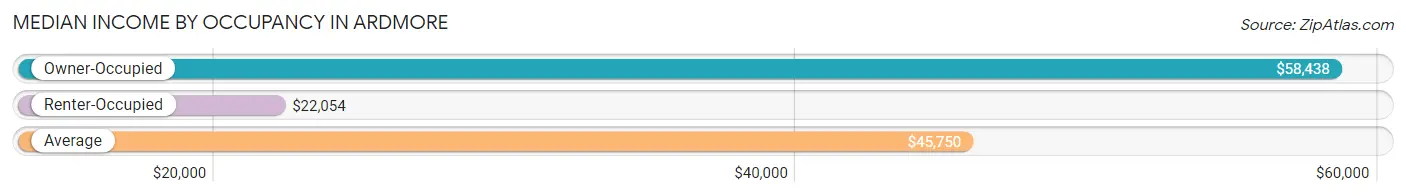
| Occupancy Type | # Households | Median Income |
| Owner-Occupied | 347 (69.1%) | $58,438 |
| Renter-Occupied | 155 (30.9%) | $22,054 |
| Average | 502 (100.0%) | $45,750 |
Occupancy by Householder Income Bracket in Ardmore
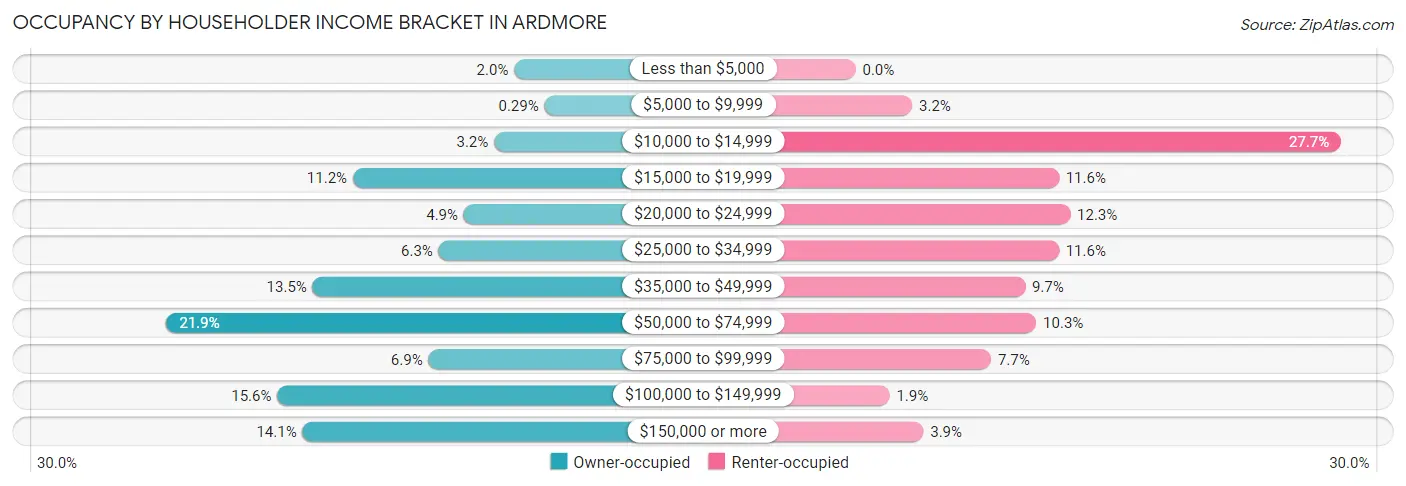
| Income Bracket | Owner-occupied | Renter-occupied |
| Less than $5,000 | 7 (2.0%) | 0 (0.0%) |
| $5,000 to $9,999 | 1 (0.3%) | 5 (3.2%) |
| $10,000 to $14,999 | 11 (3.2%) | 43 (27.7%) |
| $15,000 to $19,999 | 39 (11.2%) | 18 (11.6%) |
| $20,000 to $24,999 | 17 (4.9%) | 19 (12.3%) |
| $25,000 to $34,999 | 22 (6.3%) | 18 (11.6%) |
| $35,000 to $49,999 | 47 (13.5%) | 15 (9.7%) |
| $50,000 to $74,999 | 76 (21.9%) | 16 (10.3%) |
| $75,000 to $99,999 | 24 (6.9%) | 12 (7.7%) |
| $100,000 to $149,999 | 54 (15.6%) | 3 (1.9%) |
| $150,000 or more | 49 (14.1%) | 6 (3.9%) |
| Total | 347 (100.0%) | 155 (100.0%) |
Monthly Housing Cost Tiers in Ardmore
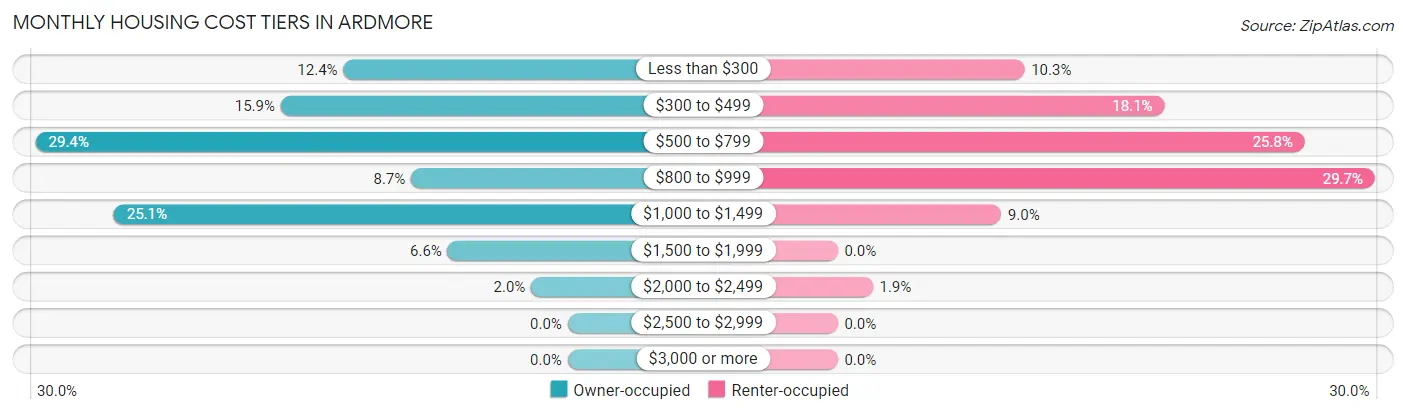
| Monthly Cost | Owner-occupied | Renter-occupied |
| Less than $300 | 43 (12.4%) | 16 (10.3%) |
| $300 to $499 | 55 (15.9%) | 28 (18.1%) |
| $500 to $799 | 102 (29.4%) | 40 (25.8%) |
| $800 to $999 | 30 (8.6%) | 46 (29.7%) |
| $1,000 to $1,499 | 87 (25.1%) | 14 (9.0%) |
| $1,500 to $1,999 | 23 (6.6%) | 0 (0.0%) |
| $2,000 to $2,499 | 7 (2.0%) | 3 (1.9%) |
| $2,500 to $2,999 | 0 (0.0%) | 0 (0.0%) |
| $3,000 or more | 0 (0.0%) | 0 (0.0%) |
| Total | 347 (100.0%) | 155 (100.0%) |
Physical Housing Characteristics in Ardmore
Housing Structures in Ardmore
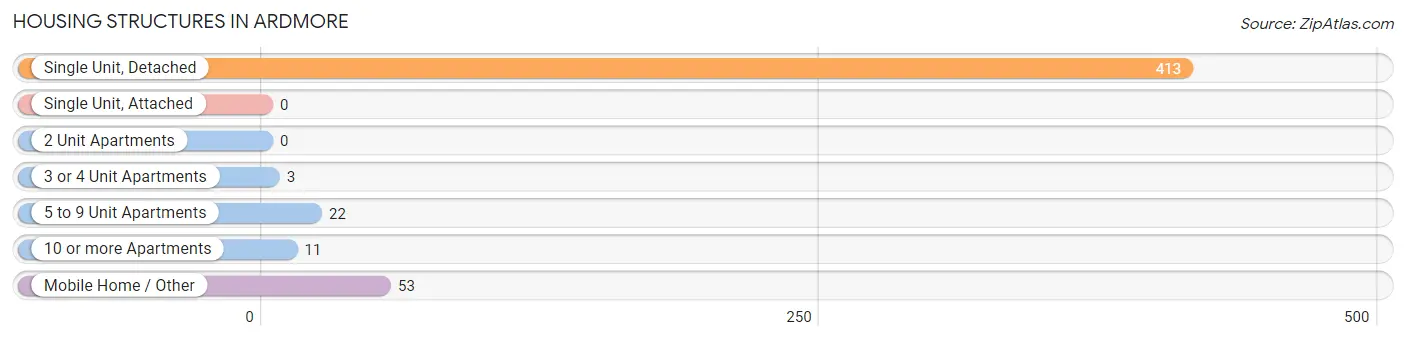
| Structure Type | # Housing Units | % Housing Units |
| Single Unit, Detached | 413 | 82.3% |
| Single Unit, Attached | 0 | 0.0% |
| 2 Unit Apartments | 0 | 0.0% |
| 3 or 4 Unit Apartments | 3 | 0.6% |
| 5 to 9 Unit Apartments | 22 | 4.4% |
| 10 or more Apartments | 11 | 2.2% |
| Mobile Home / Other | 53 | 10.6% |
| Total | 502 | 100.0% |
Housing Structures by Occupancy in Ardmore
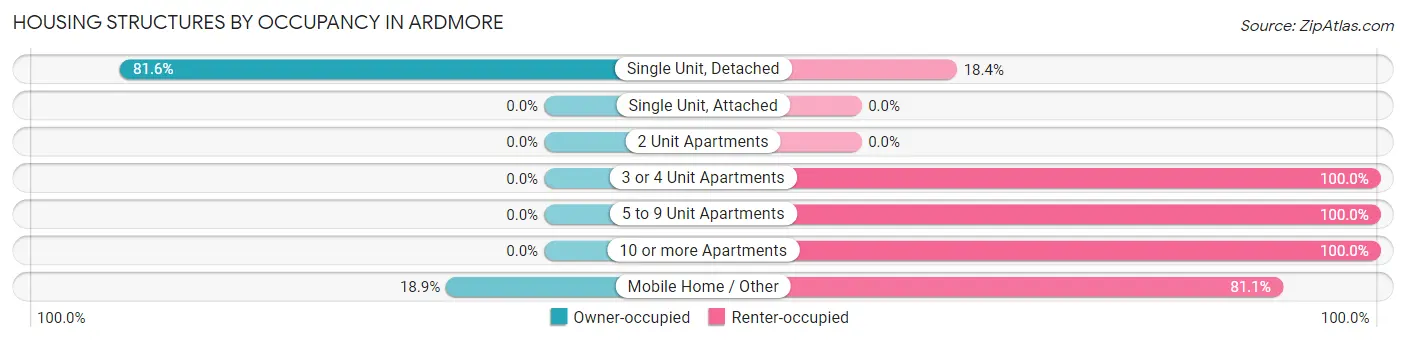
| Structure Type | Owner-occupied | Renter-occupied |
| Single Unit, Detached | 337 (81.6%) | 76 (18.4%) |
| Single Unit, Attached | 0 (0.0%) | 0 (0.0%) |
| 2 Unit Apartments | 0 (0.0%) | 0 (0.0%) |
| 3 or 4 Unit Apartments | 0 (0.0%) | 3 (100.0%) |
| 5 to 9 Unit Apartments | 0 (0.0%) | 22 (100.0%) |
| 10 or more Apartments | 0 (0.0%) | 11 (100.0%) |
| Mobile Home / Other | 10 (18.9%) | 43 (81.1%) |
| Total | 347 (69.1%) | 155 (30.9%) |
Housing Structures by Number of Rooms in Ardmore
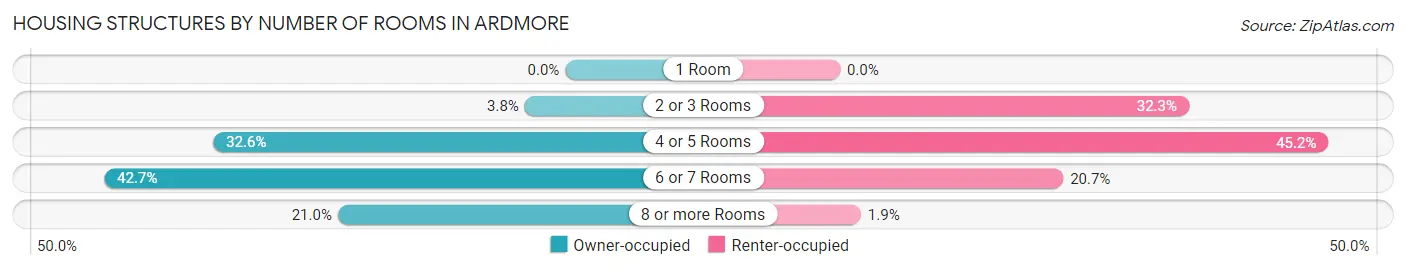
| Number of Rooms | Owner-occupied | Renter-occupied |
| 1 Room | 0 (0.0%) | 0 (0.0%) |
| 2 or 3 Rooms | 13 (3.7%) | 50 (32.3%) |
| 4 or 5 Rooms | 113 (32.6%) | 70 (45.2%) |
| 6 or 7 Rooms | 148 (42.6%) | 32 (20.6%) |
| 8 or more Rooms | 73 (21.0%) | 3 (1.9%) |
| Total | 347 (100.0%) | 155 (100.0%) |
Housing Structure by Heating Type in Ardmore
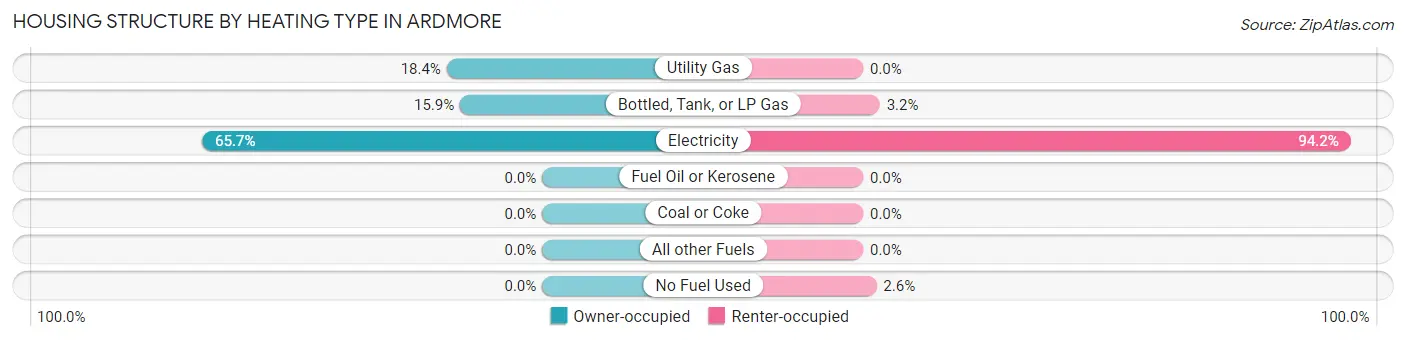
| Heating Type | Owner-occupied | Renter-occupied |
| Utility Gas | 64 (18.4%) | 0 (0.0%) |
| Bottled, Tank, or LP Gas | 55 (15.9%) | 5 (3.2%) |
| Electricity | 228 (65.7%) | 146 (94.2%) |
| Fuel Oil or Kerosene | 0 (0.0%) | 0 (0.0%) |
| Coal or Coke | 0 (0.0%) | 0 (0.0%) |
| All other Fuels | 0 (0.0%) | 0 (0.0%) |
| No Fuel Used | 0 (0.0%) | 4 (2.6%) |
| Total | 347 (100.0%) | 155 (100.0%) |
Household Vehicle Usage in Ardmore
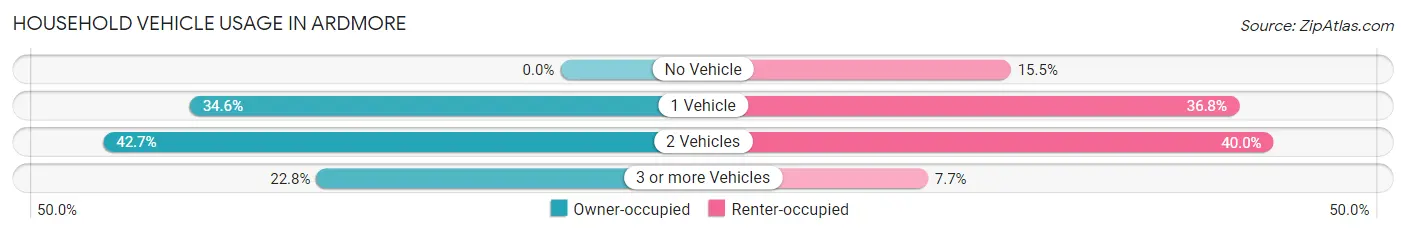
| Vehicles per Household | Owner-occupied | Renter-occupied |
| No Vehicle | 0 (0.0%) | 24 (15.5%) |
| 1 Vehicle | 120 (34.6%) | 57 (36.8%) |
| 2 Vehicles | 148 (42.6%) | 62 (40.0%) |
| 3 or more Vehicles | 79 (22.8%) | 12 (7.7%) |
| Total | 347 (100.0%) | 155 (100.0%) |
Real Estate & Mortgages in Ardmore
Real Estate and Mortgage Overview in Ardmore
| Characteristic | Without Mortgage | With Mortgage |
| Housing Units | 167 | 180 |
| Median Property Value | $108,900 | $159,800 |
| Median Household Income | $46,250 | $45 |
| Monthly Housing Costs | $448 | $0 |
| Real Estate Taxes | $647 | $3 |
Property Value by Mortgage Status in Ardmore
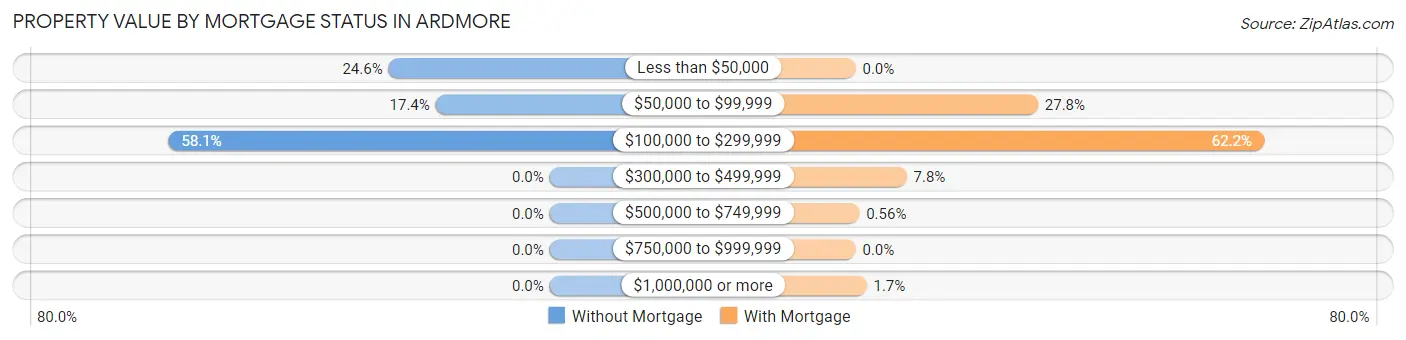
| Property Value | Without Mortgage | With Mortgage |
| Less than $50,000 | 41 (24.5%) | 0 (0.0%) |
| $50,000 to $99,999 | 29 (17.4%) | 50 (27.8%) |
| $100,000 to $299,999 | 97 (58.1%) | 112 (62.2%) |
| $300,000 to $499,999 | 0 (0.0%) | 14 (7.8%) |
| $500,000 to $749,999 | 0 (0.0%) | 1 (0.6%) |
| $750,000 to $999,999 | 0 (0.0%) | 0 (0.0%) |
| $1,000,000 or more | 0 (0.0%) | 3 (1.7%) |
| Total | 167 (100.0%) | 180 (100.0%) |
Household Income by Mortgage Status in Ardmore
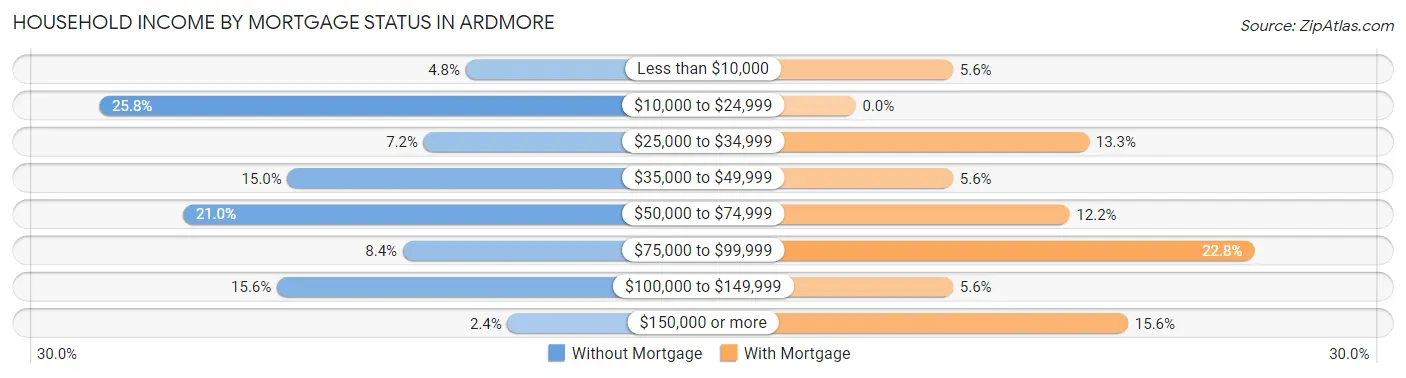
| Household Income | Without Mortgage | With Mortgage |
| Less than $10,000 | 8 (4.8%) | 10 (5.6%) |
| $10,000 to $24,999 | 43 (25.8%) | 0 (0.0%) |
| $25,000 to $34,999 | 12 (7.2%) | 24 (13.3%) |
| $35,000 to $49,999 | 25 (15.0%) | 10 (5.6%) |
| $50,000 to $74,999 | 35 (21.0%) | 22 (12.2%) |
| $75,000 to $99,999 | 14 (8.4%) | 41 (22.8%) |
| $100,000 to $149,999 | 26 (15.6%) | 10 (5.6%) |
| $150,000 or more | 4 (2.4%) | 28 (15.6%) |
| Total | 167 (100.0%) | 180 (100.0%) |
Property Value to Household Income Ratio in Ardmore
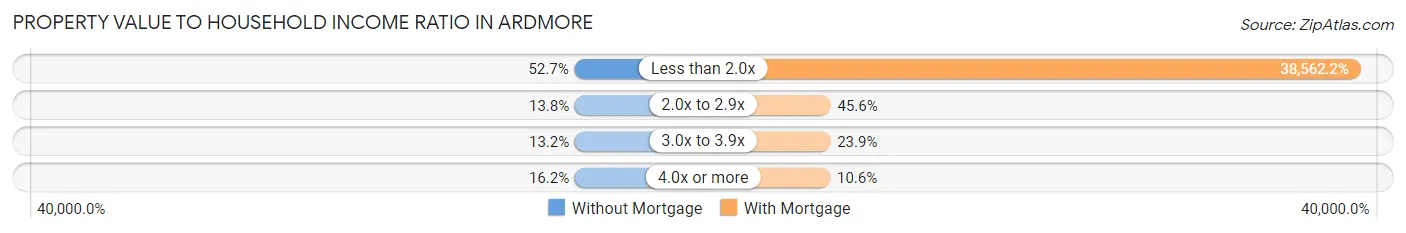
| Value-to-Income Ratio | Without Mortgage | With Mortgage |
| Less than 2.0x | 88 (52.7%) | 69,412 (38,562.2%) |
| 2.0x to 2.9x | 23 (13.8%) | 82 (45.6%) |
| 3.0x to 3.9x | 22 (13.2%) | 43 (23.9%) |
| 4.0x or more | 27 (16.2%) | 19 (10.6%) |
| Total | 167 (100.0%) | 180 (100.0%) |
Real Estate Taxes by Mortgage Status in Ardmore
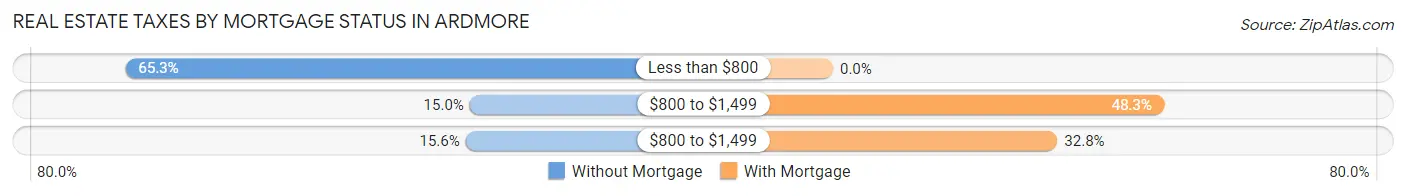
| Property Taxes | Without Mortgage | With Mortgage |
| Less than $800 | 109 (65.3%) | 0 (0.0%) |
| $800 to $1,499 | 25 (15.0%) | 87 (48.3%) |
| $800 to $1,499 | 26 (15.6%) | 59 (32.8%) |
| Total | 167 (100.0%) | 180 (100.0%) |
Health & Disability in Ardmore
Health Insurance Coverage by Age in Ardmore
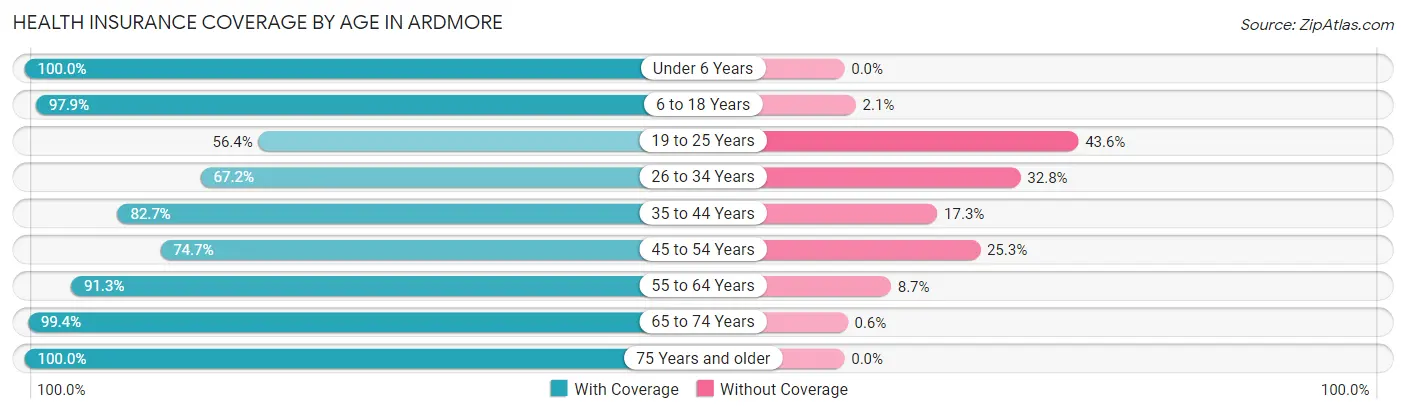
| Age Bracket | With Coverage | Without Coverage |
| Under 6 Years | 76 (100.0%) | 0 (0.0%) |
| 6 to 18 Years | 186 (97.9%) | 4 (2.1%) |
| 19 to 25 Years | 53 (56.4%) | 41 (43.6%) |
| 26 to 34 Years | 90 (67.2%) | 44 (32.8%) |
| 35 to 44 Years | 105 (82.7%) | 22 (17.3%) |
| 45 to 54 Years | 186 (74.7%) | 63 (25.3%) |
| 55 to 64 Years | 158 (91.3%) | 15 (8.7%) |
| 65 to 74 Years | 166 (99.4%) | 1 (0.6%) |
| 75 Years and older | 85 (100.0%) | 0 (0.0%) |
| Total | 1,105 (85.3%) | 190 (14.7%) |
Health Insurance Coverage by Citizenship Status in Ardmore
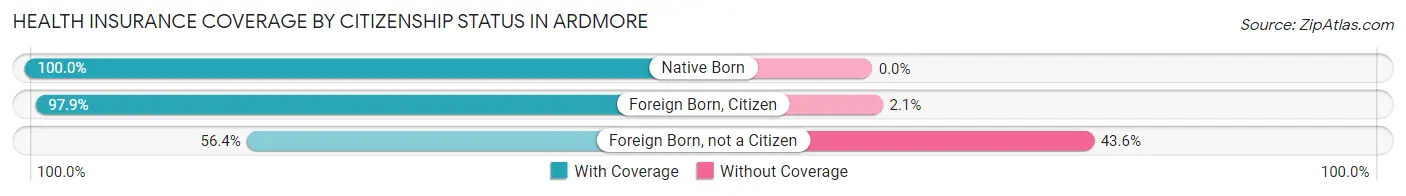
| Citizenship Status | With Coverage | Without Coverage |
| Native Born | 76 (100.0%) | 0 (0.0%) |
| Foreign Born, Citizen | 186 (97.9%) | 4 (2.1%) |
| Foreign Born, not a Citizen | 53 (56.4%) | 41 (43.6%) |
Health Insurance Coverage by Household Income in Ardmore
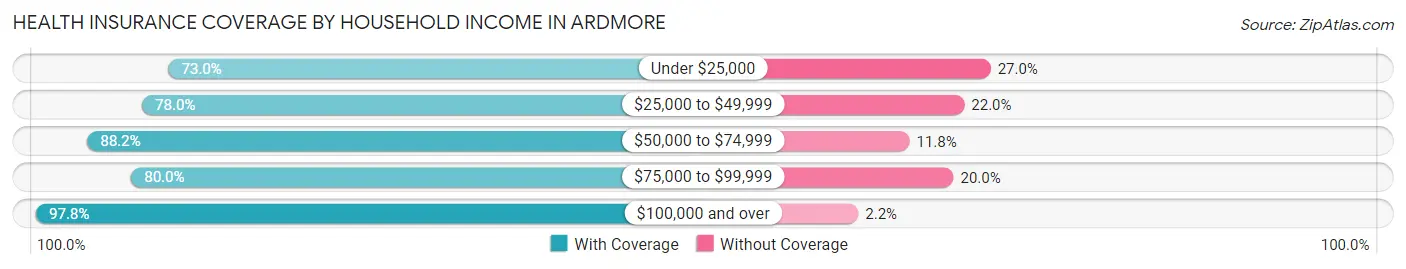
| Household Income | With Coverage | Without Coverage |
| Under $25,000 | 214 (73.0%) | 79 (27.0%) |
| $25,000 to $49,999 | 177 (78.0%) | 50 (22.0%) |
| $50,000 to $74,999 | 210 (88.2%) | 28 (11.8%) |
| $75,000 to $99,999 | 96 (80.0%) | 24 (20.0%) |
| $100,000 and over | 408 (97.8%) | 9 (2.2%) |
Public vs Private Health Insurance Coverage by Age in Ardmore
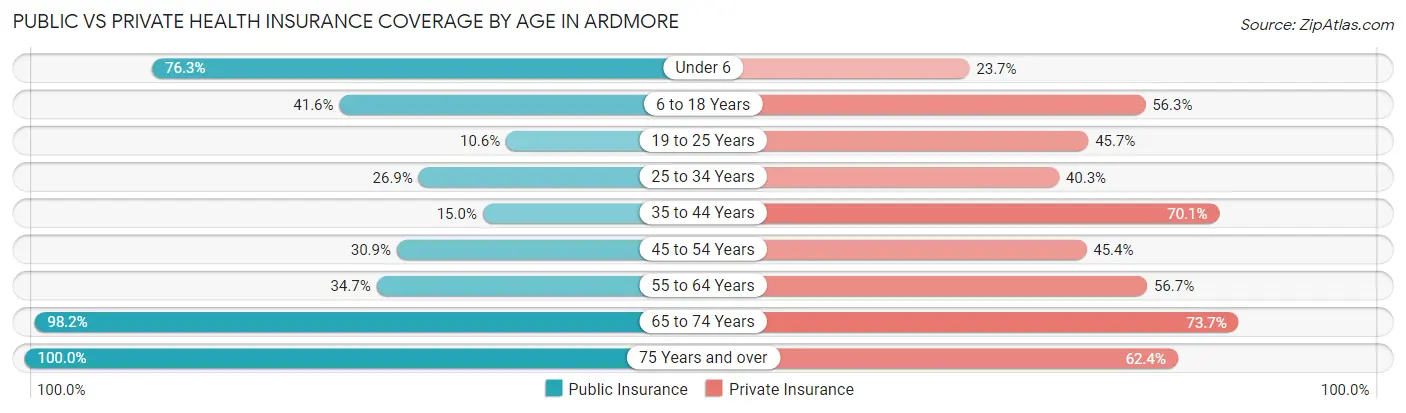
| Age Bracket | Public Insurance | Private Insurance |
| Under 6 | 58 (76.3%) | 18 (23.7%) |
| 6 to 18 Years | 79 (41.6%) | 107 (56.3%) |
| 19 to 25 Years | 10 (10.6%) | 43 (45.7%) |
| 25 to 34 Years | 36 (26.9%) | 54 (40.3%) |
| 35 to 44 Years | 19 (15.0%) | 89 (70.1%) |
| 45 to 54 Years | 77 (30.9%) | 113 (45.4%) |
| 55 to 64 Years | 60 (34.7%) | 98 (56.7%) |
| 65 to 74 Years | 164 (98.2%) | 123 (73.7%) |
| 75 Years and over | 85 (100.0%) | 53 (62.4%) |
| Total | 588 (45.4%) | 698 (53.9%) |
Disability Status by Sex by Age in Ardmore
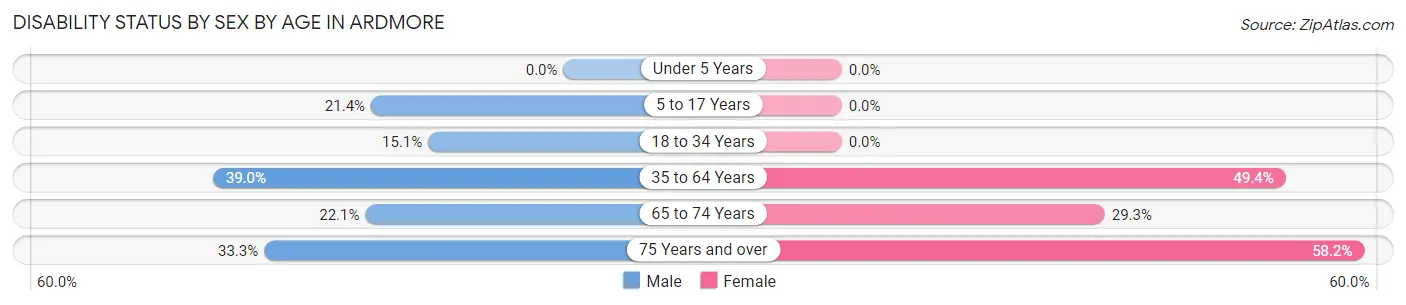
| Age Bracket | Male | Female |
| Under 5 Years | 0 (0.0%) | 0 (0.0%) |
| 5 to 17 Years | 12 (21.4%) | 0 (0.0%) |
| 18 to 34 Years | 25 (15.1%) | 0 (0.0%) |
| 35 to 64 Years | 114 (39.0%) | 127 (49.4%) |
| 65 to 74 Years | 15 (22.1%) | 29 (29.3%) |
| 75 Years and over | 10 (33.3%) | 32 (58.2%) |
Disability Class by Sex by Age in Ardmore
Disability Class: Hearing Difficulty
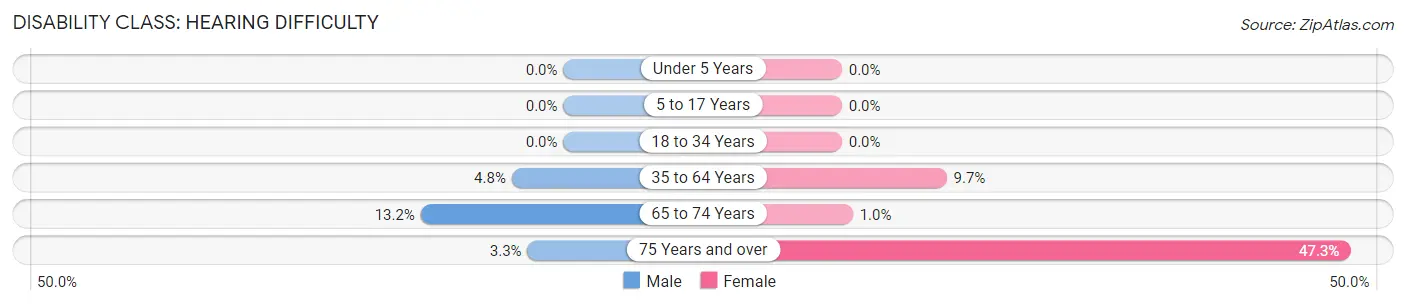
| Age Bracket | Male | Female |
| Under 5 Years | 0 (0.0%) | 0 (0.0%) |
| 5 to 17 Years | 0 (0.0%) | 0 (0.0%) |
| 18 to 34 Years | 0 (0.0%) | 0 (0.0%) |
| 35 to 64 Years | 14 (4.8%) | 25 (9.7%) |
| 65 to 74 Years | 9 (13.2%) | 1 (1.0%) |
| 75 Years and over | 1 (3.3%) | 26 (47.3%) |
Disability Class: Vision Difficulty
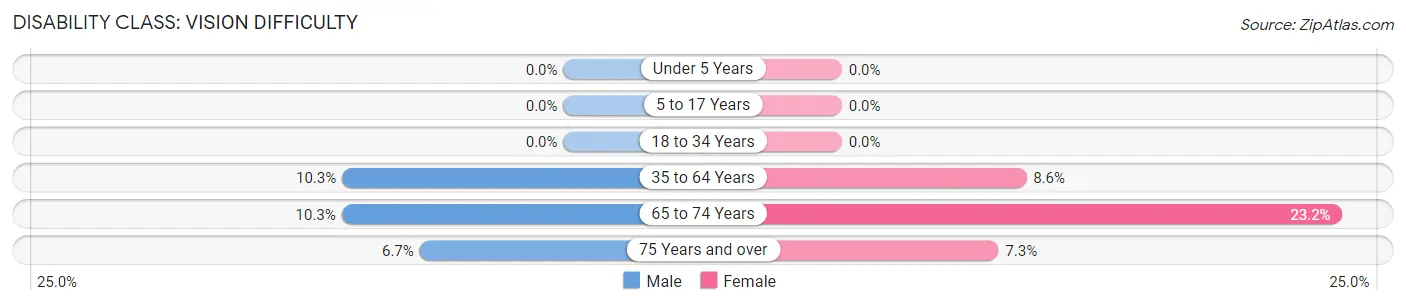
| Age Bracket | Male | Female |
| Under 5 Years | 0 (0.0%) | 0 (0.0%) |
| 5 to 17 Years | 0 (0.0%) | 0 (0.0%) |
| 18 to 34 Years | 0 (0.0%) | 0 (0.0%) |
| 35 to 64 Years | 30 (10.3%) | 22 (8.6%) |
| 65 to 74 Years | 7 (10.3%) | 23 (23.2%) |
| 75 Years and over | 2 (6.7%) | 4 (7.3%) |
Disability Class: Cognitive Difficulty
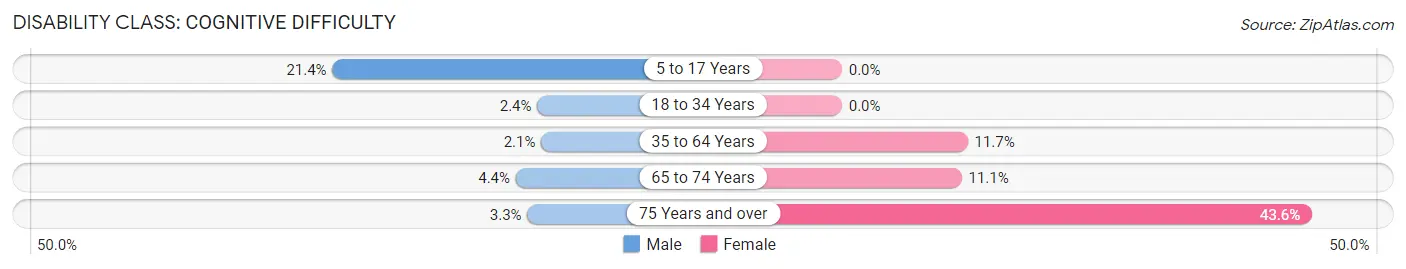
| Age Bracket | Male | Female |
| 5 to 17 Years | 12 (21.4%) | 0 (0.0%) |
| 18 to 34 Years | 4 (2.4%) | 0 (0.0%) |
| 35 to 64 Years | 6 (2.1%) | 30 (11.7%) |
| 65 to 74 Years | 3 (4.4%) | 11 (11.1%) |
| 75 Years and over | 1 (3.3%) | 24 (43.6%) |
Disability Class: Ambulatory Difficulty
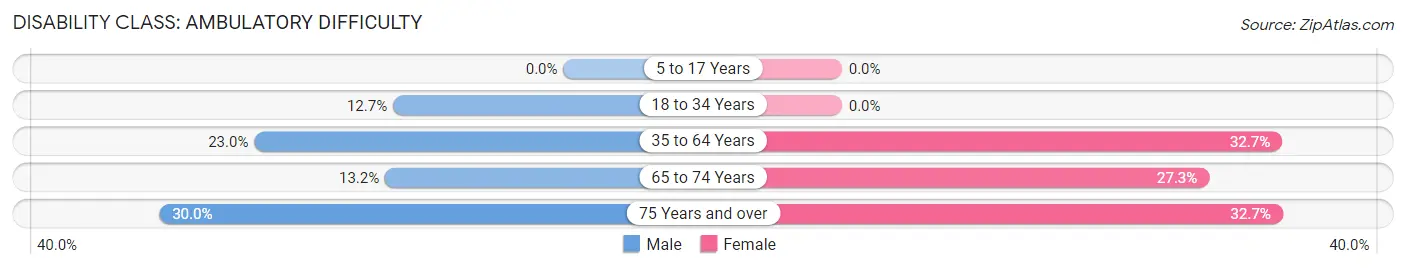
| Age Bracket | Male | Female |
| 5 to 17 Years | 0 (0.0%) | 0 (0.0%) |
| 18 to 34 Years | 21 (12.7%) | 0 (0.0%) |
| 35 to 64 Years | 67 (23.0%) | 84 (32.7%) |
| 65 to 74 Years | 9 (13.2%) | 27 (27.3%) |
| 75 Years and over | 9 (30.0%) | 18 (32.7%) |
Disability Class: Self-Care Difficulty
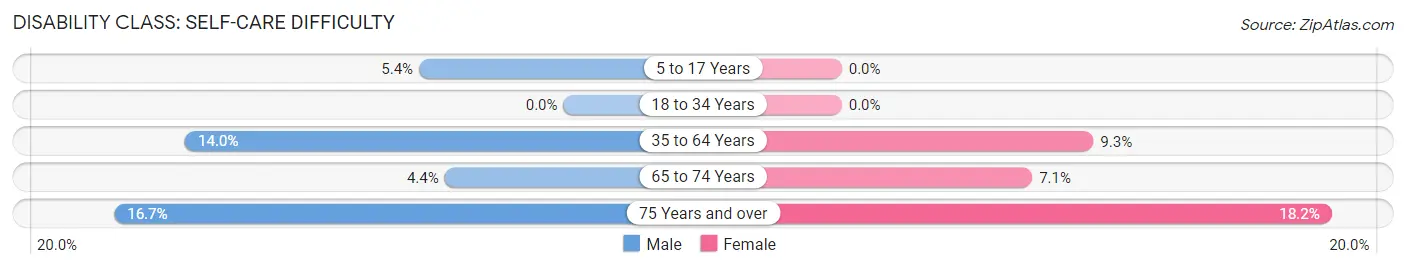
| Age Bracket | Male | Female |
| 5 to 17 Years | 3 (5.4%) | 0 (0.0%) |
| 18 to 34 Years | 0 (0.0%) | 0 (0.0%) |
| 35 to 64 Years | 41 (14.0%) | 24 (9.3%) |
| 65 to 74 Years | 3 (4.4%) | 7 (7.1%) |
| 75 Years and over | 5 (16.7%) | 10 (18.2%) |
Technology Access in Ardmore
Computing Device Access in Ardmore
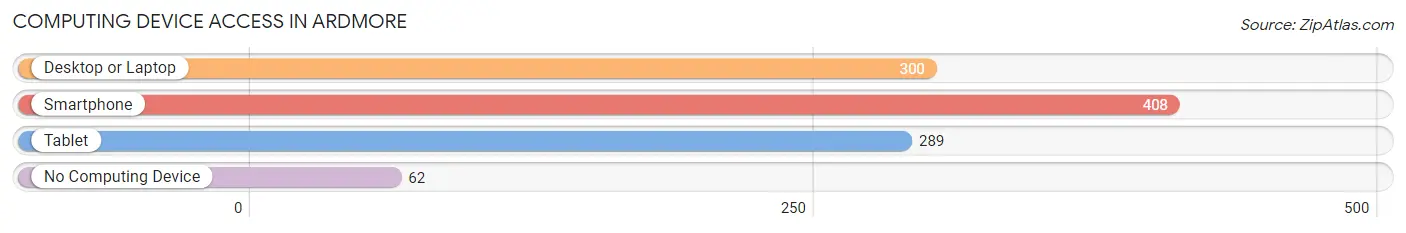
| Device Type | # Households | % Households |
| Desktop or Laptop | 300 | 59.8% |
| Smartphone | 408 | 81.3% |
| Tablet | 289 | 57.6% |
| No Computing Device | 62 | 12.3% |
| Total | 502 | 100.0% |
Internet Access in Ardmore
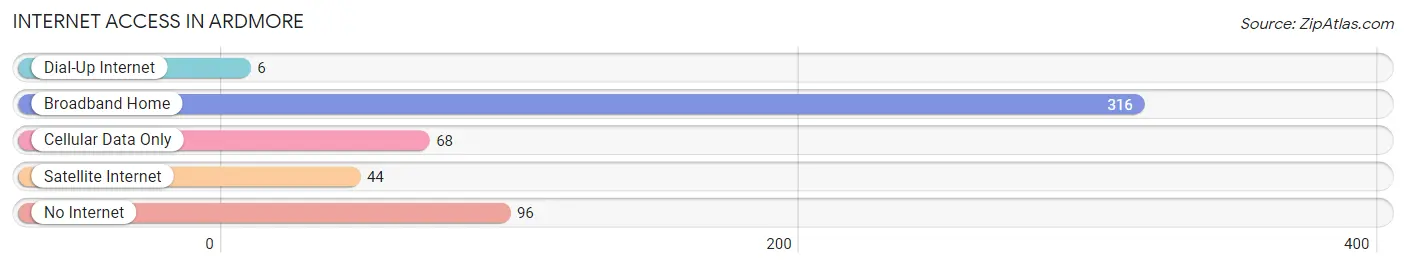
| Internet Type | # Households | % Households |
| Dial-Up Internet | 6 | 1.2% |
| Broadband Home | 316 | 62.9% |
| Cellular Data Only | 68 | 13.6% |
| Satellite Internet | 44 | 8.8% |
| No Internet | 96 | 19.1% |
| Total | 502 | 100.0% |
Ardmore Summary
Ardmore, Tennessee is a small town located in the northern part of the state, just south of the Tennessee-Alabama border. It is part of the larger metropolitan area of Huntsville, Alabama, and is located in both Lincoln and Giles counties. The town has a population of just over 2,000 people, and is known for its rural charm and small-town atmosphere.
History
Ardmore was first settled in the early 1800s by a group of settlers from North Carolina. The town was originally known as “Ardmore Station”, and was a stop on the Nashville and Chattanooga Railroad. The town was officially incorporated in 1887, and the name was changed to Ardmore.
The town was a major agricultural center in the early 1900s, and was home to several cotton gins and other agricultural businesses. The town also had a thriving lumber industry, and was home to several sawmills.
In the 1950s, the town began to experience a decline in population as many of the businesses closed or moved away. The town was also affected by the construction of Interstate 65, which bypassed the town and caused many businesses to move away.
Geography
Ardmore is located in the northern part of Tennessee, just south of the Tennessee-Alabama border. The town is situated in both Lincoln and Giles counties, and is located about 25 miles south of Huntsville, Alabama.
The town is located in a rural area, and is surrounded by rolling hills and farmland. The town is located near several small lakes, including Lake Ardmore and Lake Lincoln.
The climate in Ardmore is mild, with hot summers and cool winters. The average temperature in the summer is around 80 degrees Fahrenheit, and the average temperature in the winter is around 40 degrees Fahrenheit.
Economy
The economy of Ardmore is largely based on agriculture and tourism. The town is home to several farms, and is known for its production of cotton, corn, soybeans, and other crops. The town is also home to several small businesses, including restaurants, shops, and other services.
The town is also a popular tourist destination, and is home to several attractions, including the Ardmore Historic District, the Ardmore Museum, and the Ardmore Country Club.
Demographics
As of the 2010 census, the population of Ardmore was 2,072. The racial makeup of the town was 95.3% White, 1.2% African American, 0.3% Native American, 0.3% Asian, 0.1% Pacific Islander, 1.2% from other races, and 1.7% from two or more races. Hispanic or Latino of any race were 2.3% of the population.
The median household income in Ardmore was $37,917, and the median family income was $45,938. The per capita income in the town was $19,945. About 11.3% of families and 14.2% of the population were below the poverty line, including 18.2% of those under age 18 and 8.3% of those age 65 or over.
Common Questions
What is Per Capita Income in Ardmore?
Per Capita income in Ardmore is $29,489.
What is the Median Family Income in Ardmore?
Median Family Income in Ardmore is $61,827.
What is the Median Household income in Ardmore?
Median Household Income in Ardmore is $45,750.
What is Income or Wage Gap in Ardmore?
Income or Wage Gap in Ardmore is 3.2%.
Women in Ardmore earn 96.8 cents for every dollar earned by a man.
What is Inequality or Gini Index in Ardmore?
Inequality or Gini Index in Ardmore is 0.52.
What is the Total Population of Ardmore?
Total Population of Ardmore is 1,354.
What is the Total Male Population of Ardmore?
Total Male Population of Ardmore is 673.
What is the Total Female Population of Ardmore?
Total Female Population of Ardmore is 681.
What is the Ratio of Males per 100 Females in Ardmore?
There are 98.83 Males per 100 Females in Ardmore.
What is the Ratio of Females per 100 Males in Ardmore?
There are 101.19 Females per 100 Males in Ardmore.
What is the Median Population Age in Ardmore?
Median Population Age in Ardmore is 46.9 Years.
What is the Average Family Size in Ardmore
Average Family Size in Ardmore is 3.3 People.
What is the Average Household Size in Ardmore
Average Household Size in Ardmore is 2.6 People.
How Large is the Labor Force in Ardmore?
There are 585 People in the Labor Forcein in Ardmore.
What is the Percentage of People in the Labor Force in Ardmore?
50.9% of People are in the Labor Force in Ardmore.
What is the Unemployment Rate in Ardmore?
Unemployment Rate in Ardmore is 7.3%.