White Pine, TN Map & Demographics
White Pine Map
White Pine Overview
$29,718
PER CAPITA INCOME
$73,456
AVG FAMILY INCOME
$57,463
AVG HOUSEHOLD INCOME
7.7%
WAGE / INCOME GAP [ % ]
92.3¢/ $1
WAGE / INCOME GAP [ $ ]
0.40
INEQUALITY / GINI INDEX
2,527
TOTAL POPULATION
1,341
MALE POPULATION
1,186
FEMALE POPULATION
113.07
MALES / 100 FEMALES
88.44
FEMALES / 100 MALES
38.9
MEDIAN AGE
2.9
AVG FAMILY SIZE
2.3
AVG HOUSEHOLD SIZE
1,335
LABOR FORCE [ PEOPLE ]
65.1%
PERCENT IN LABOR FORCE
6.1%
UNEMPLOYMENT RATE
White Pine Zip Codes
White Pine Area Codes
Income in White Pine
Income Overview in White Pine
Per Capita Income in White Pine is $29,718, while median incomes of families and households are $73,456 and $57,463 respectively.
| Characteristic | Number | Measure |
| Per Capita Income | 2,527 | $29,718 |
| Median Family Income | 687 | $73,456 |
| Mean Family Income | 687 | $81,026 |
| Median Household Income | 1,083 | $57,463 |
| Mean Household Income | 1,083 | $66,584 |
| Income Deficit | 687 | $0 |
| Wage / Income Gap (%) | 2,527 | 7.70% |
| Wage / Income Gap ($) | 2,527 | 92.30¢ per $1 |
| Gini / Inequality Index | 2,527 | 0.40 |
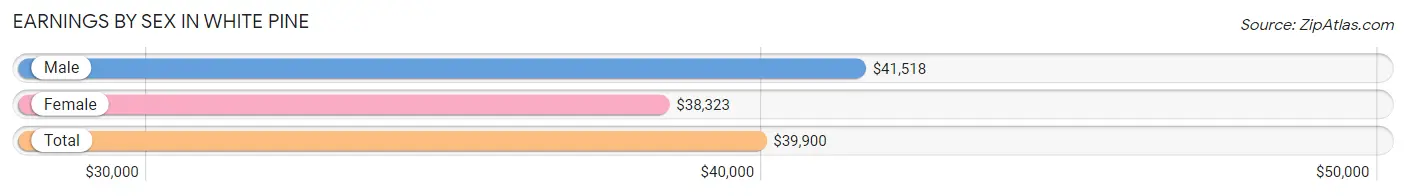
Earnings by Sex in White Pine
Average Earnings in White Pine are $39,900, $41,518 for men and $38,323 for women, a difference of 7.7%.
| Sex | Number | Average Earnings |
| Male | 779 (59.3%) | $41,518 |
| Female | 535 (40.7%) | $38,323 |
| Total | 1,314 (100.0%) | $39,900 |
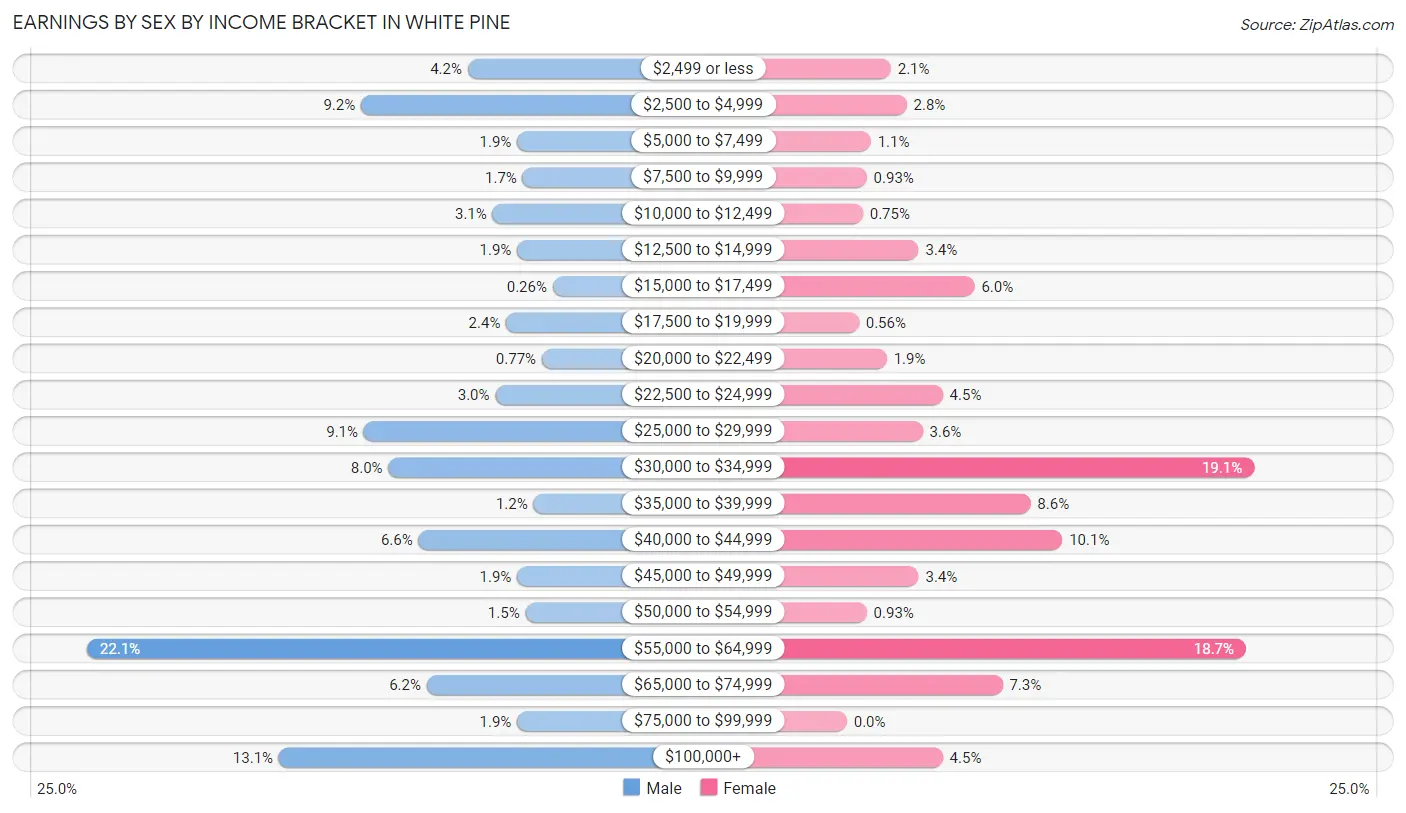
Earnings by Sex by Income Bracket in White Pine
The most common earnings brackets in White Pine are $55,000 to $64,999 for men (172 | 22.1%) and $30,000 to $34,999 for women (102 | 19.1%).
| Income | Male | Female |
| $2,499 or less | 33 (4.2%) | 11 (2.1%) |
| $2,500 to $4,999 | 72 (9.2%) | 15 (2.8%) |
| $5,000 to $7,499 | 15 (1.9%) | 6 (1.1%) |
| $7,500 to $9,999 | 13 (1.7%) | 5 (0.9%) |
| $10,000 to $12,499 | 24 (3.1%) | 4 (0.7%) |
| $12,500 to $14,999 | 15 (1.9%) | 18 (3.4%) |
| $15,000 to $17,499 | 2 (0.3%) | 32 (6.0%) |
| $17,500 to $19,999 | 19 (2.4%) | 3 (0.6%) |
| $20,000 to $22,499 | 6 (0.8%) | 10 (1.9%) |
| $22,500 to $24,999 | 23 (2.9%) | 24 (4.5%) |
| $25,000 to $29,999 | 71 (9.1%) | 19 (3.5%) |
| $30,000 to $34,999 | 62 (8.0%) | 102 (19.1%) |
| $35,000 to $39,999 | 9 (1.2%) | 46 (8.6%) |
| $40,000 to $44,999 | 51 (6.6%) | 54 (10.1%) |
| $45,000 to $49,999 | 15 (1.9%) | 18 (3.4%) |
| $50,000 to $54,999 | 12 (1.5%) | 5 (0.9%) |
| $55,000 to $64,999 | 172 (22.1%) | 100 (18.7%) |
| $65,000 to $74,999 | 48 (6.2%) | 39 (7.3%) |
| $75,000 to $99,999 | 15 (1.9%) | 0 (0.0%) |
| $100,000+ | 102 (13.1%) | 24 (4.5%) |
| Total | 779 (100.0%) | 535 (100.0%) |
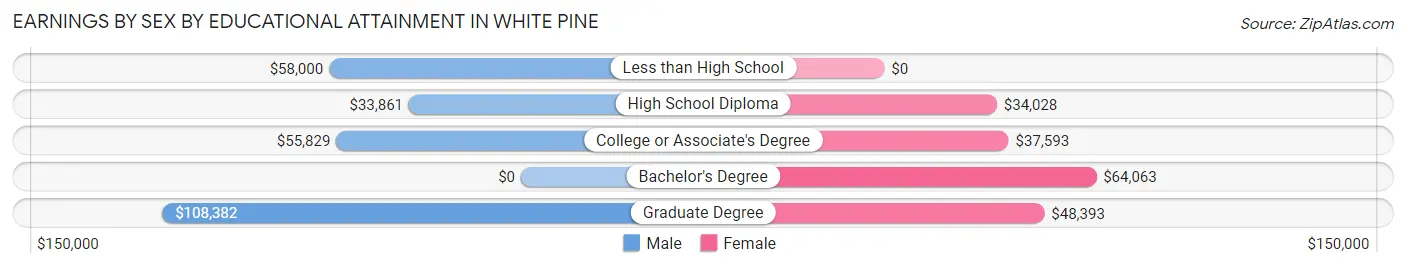
Earnings by Sex by Educational Attainment in White Pine
Average earnings in White Pine are $52,708 for men and $39,792 for women, a difference of 24.5%. Men with an educational attainment of graduate degree enjoy the highest average annual earnings of $108,382, while those with high school diploma education earn the least with $33,861. Women with an educational attainment of bachelor's degree earn the most with the average annual earnings of $64,063, while those with high school diploma education have the smallest earnings of $34,028.
| Educational Attainment | Male Income | Female Income |
| Less than High School | $58,000 | $0 |
| High School Diploma | $33,861 | $34,028 |
| College or Associate's Degree | $55,829 | $37,593 |
| Bachelor's Degree | - | - |
| Graduate Degree | $108,382 | $48,393 |
| Total | $52,708 | $39,792 |
Family Income in White Pine
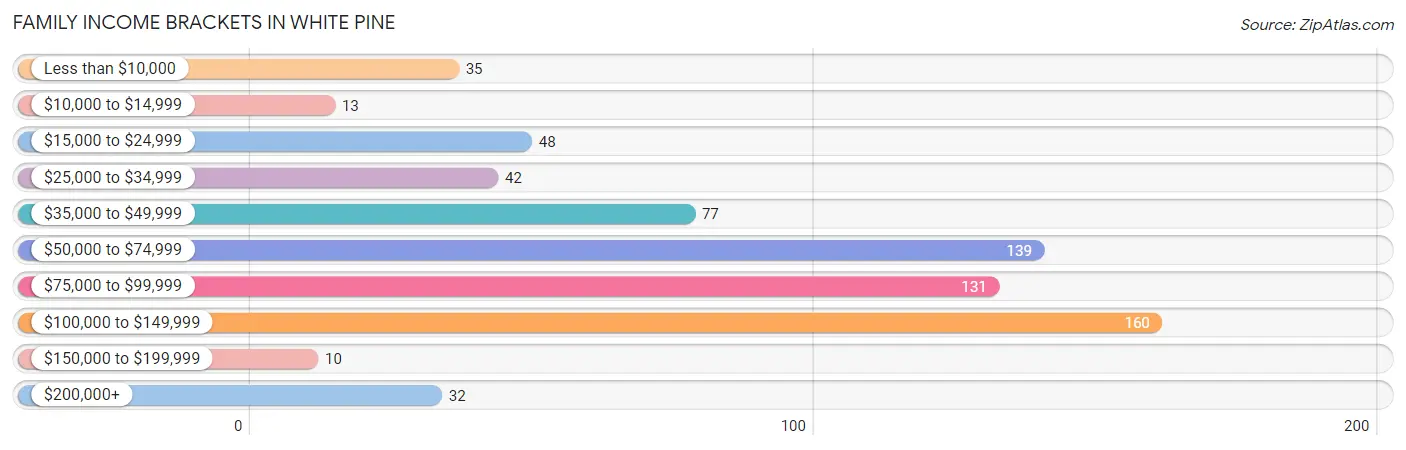
Family Income Brackets in White Pine
According to the White Pine family income data, there are 160 families falling into the $100,000 to $149,999 income range, which is the most common income bracket and makes up 23.3% of all families. Conversely, the $150,000 to $199,999 income bracket is the least frequent group with only 10 families (1.5%) belonging to this category.
| Income Bracket | # Families | % Families |
| Less than $10,000 | 35 | 5.1% |
| $10,000 to $14,999 | 13 | 1.9% |
| $15,000 to $24,999 | 48 | 7.0% |
| $25,000 to $34,999 | 42 | 6.1% |
| $35,000 to $49,999 | 77 | 11.2% |
| $50,000 to $74,999 | 139 | 20.2% |
| $75,000 to $99,999 | 131 | 19.1% |
| $100,000 to $149,999 | 160 | 23.3% |
| $150,000 to $199,999 | 10 | 1.5% |
| $200,000+ | 32 | 4.7% |
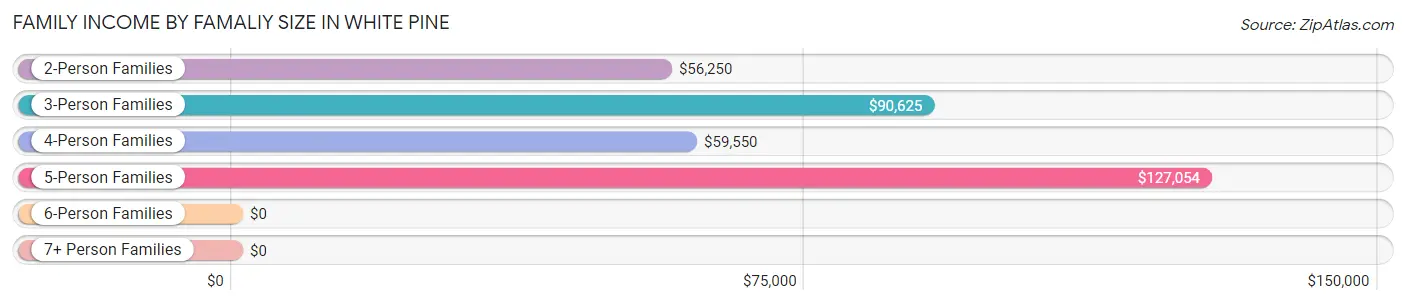
Family Income by Famaliy Size in White Pine
5-person families (111 | 16.2%) account for the highest median family income in White Pine with $127,054 per family, while 3-person families (165 | 24.0%) have the highest median income of $30,208 per family member.
| Income Bracket | # Families | Median Income |
| 2-Person Families | 283 (41.2%) | $56,250 |
| 3-Person Families | 165 (24.0%) | $90,625 |
| 4-Person Families | 105 (15.3%) | $59,550 |
| 5-Person Families | 111 (16.2%) | $127,054 |
| 6-Person Families | 0 (0.0%) | $0 |
| 7+ Person Families | 23 (3.4%) | $0 |
| Total | 687 (100.0%) | $73,456 |
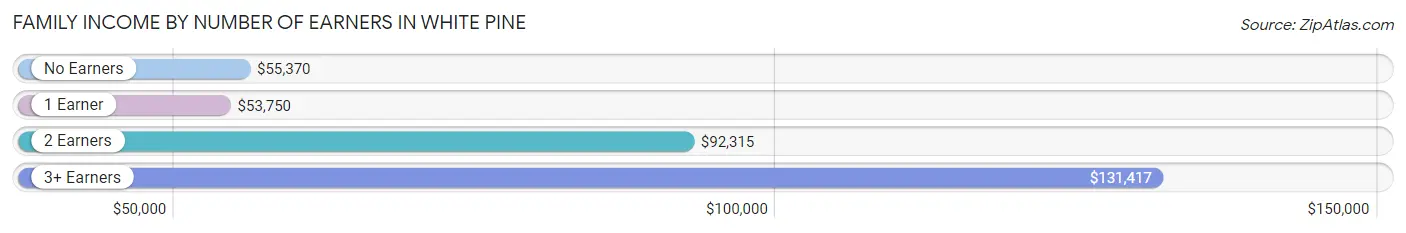
Family Income by Number of Earners in White Pine
The median family income in White Pine is $73,456, with families comprising 3+ earners (57) having the highest median family income of $131,417, while families with 1 earner (222) have the lowest median family income of $53,750, accounting for 8.3% and 32.3% of families, respectively.
| Number of Earners | # Families | Median Income |
| No Earners | 112 (16.3%) | $55,370 |
| 1 Earner | 222 (32.3%) | $53,750 |
| 2 Earners | 296 (43.1%) | $92,315 |
| 3+ Earners | 57 (8.3%) | $131,417 |
| Total | 687 (100.0%) | $73,456 |
Household Income in White Pine
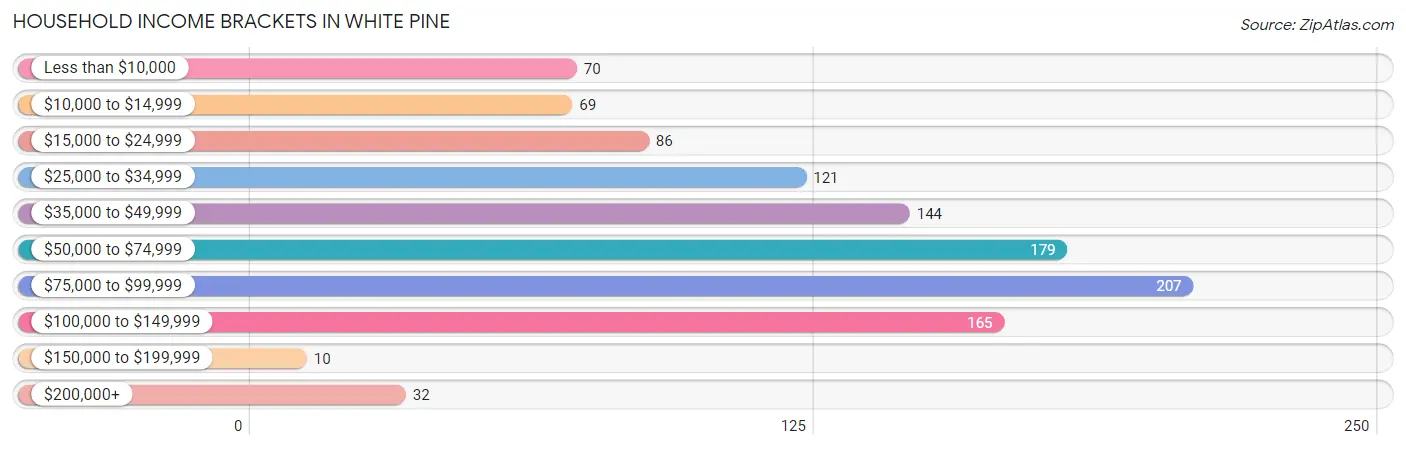
Household Income Brackets in White Pine
With 207 households falling in the category, the $75,000 to $99,999 income range is the most frequent in White Pine, accounting for 19.1% of all households. In contrast, only 10 households (0.9%) fall into the $150,000 to $199,999 income bracket, making it the least populous group.
| Income Bracket | # Households | % Households |
| Less than $10,000 | 70 | 6.5% |
| $10,000 to $14,999 | 69 | 6.4% |
| $15,000 to $24,999 | 86 | 7.9% |
| $25,000 to $34,999 | 121 | 11.2% |
| $35,000 to $49,999 | 144 | 13.3% |
| $50,000 to $74,999 | 179 | 16.5% |
| $75,000 to $99,999 | 207 | 19.1% |
| $100,000 to $149,999 | 165 | 15.2% |
| $150,000 to $199,999 | 10 | 0.9% |
| $200,000+ | 32 | 3.0% |
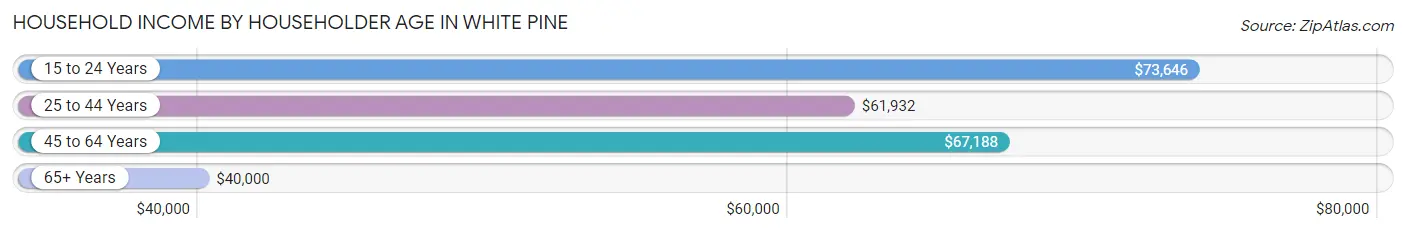
Household Income by Householder Age in White Pine
The median household income in White Pine is $57,463, with the highest median household income of $73,646 found in the 15 to 24 years age bracket for the primary householder. A total of 25 households (2.3%) fall into this category. Meanwhile, the 65+ years age bracket for the primary householder has the lowest median household income of $40,000, with 306 households (28.2%) in this group.
| Income Bracket | # Households | Median Income |
| 15 to 24 Years | 25 (2.3%) | $73,646 |
| 25 to 44 Years | 344 (31.8%) | $61,932 |
| 45 to 64 Years | 408 (37.7%) | $67,188 |
| 65+ Years | 306 (28.2%) | $40,000 |
| Total | 1,083 (100.0%) | $57,463 |
Poverty in White Pine
Income Below Poverty by Sex and Age in White Pine
With 18.3% poverty level for males and 17.2% for females among the residents of White Pine, 18 to 24 year old males and 55 to 64 year old females are the most vulnerable to poverty, with 59 males (39.1%) and 78 females (56.9%) in their respective age groups living below the poverty level.
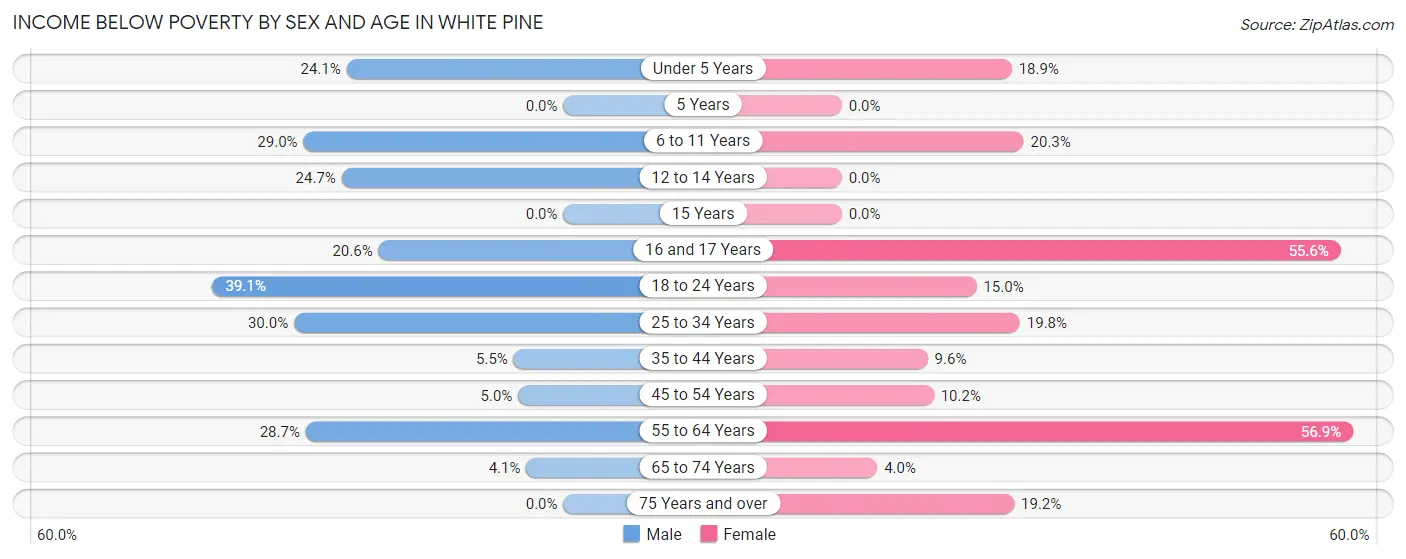
| Age Bracket | Male | Female |
| Under 5 Years | 21 (24.1%) | 7 (18.9%) |
| 5 Years | 0 (0.0%) | 0 (0.0%) |
| 6 to 11 Years | 22 (28.9%) | 16 (20.3%) |
| 12 to 14 Years | 20 (24.7%) | 0 (0.0%) |
| 15 Years | 0 (0.0%) | 0 (0.0%) |
| 16 and 17 Years | 7 (20.6%) | 5 (55.6%) |
| 18 to 24 Years | 59 (39.1%) | 12 (15.0%) |
| 25 to 34 Years | 54 (30.0%) | 23 (19.8%) |
| 35 to 44 Years | 12 (5.5%) | 24 (9.6%) |
| 45 to 54 Years | 9 (5.0%) | 13 (10.2%) |
| 55 to 64 Years | 35 (28.7%) | 78 (56.9%) |
| 65 to 74 Years | 5 (4.1%) | 7 (4.0%) |
| 75 Years and over | 0 (0.0%) | 19 (19.2%) |
| Total | 244 (18.3%) | 204 (17.2%) |
Income Above Poverty by Sex and Age in White Pine
According to the poverty statistics in White Pine, males aged 5 years and females aged 5 years are the age groups that are most secure financially, with 100.0% of males and 100.0% of females in these age groups living above the poverty line.
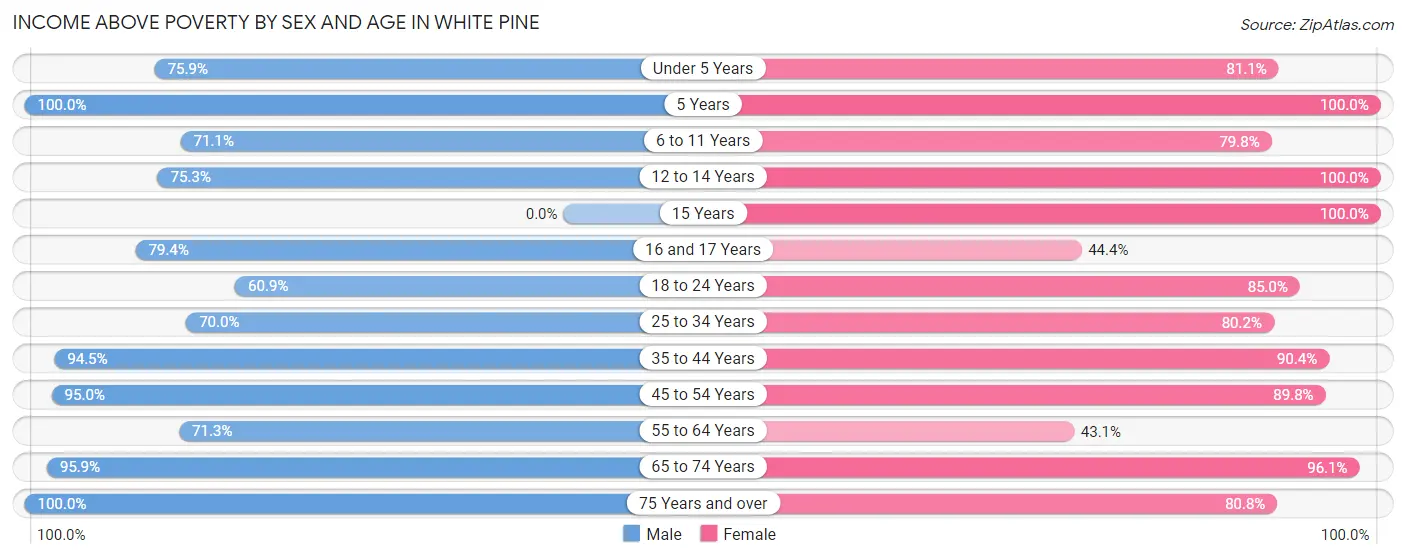
| Age Bracket | Male | Female |
| Under 5 Years | 66 (75.9%) | 30 (81.1%) |
| 5 Years | 34 (100.0%) | 11 (100.0%) |
| 6 to 11 Years | 54 (71.1%) | 63 (79.7%) |
| 12 to 14 Years | 61 (75.3%) | 48 (100.0%) |
| 15 Years | 0 (0.0%) | 13 (100.0%) |
| 16 and 17 Years | 27 (79.4%) | 4 (44.4%) |
| 18 to 24 Years | 92 (60.9%) | 68 (85.0%) |
| 25 to 34 Years | 126 (70.0%) | 93 (80.2%) |
| 35 to 44 Years | 205 (94.5%) | 227 (90.4%) |
| 45 to 54 Years | 170 (95.0%) | 114 (89.8%) |
| 55 to 64 Years | 87 (71.3%) | 59 (43.1%) |
| 65 to 74 Years | 116 (95.9%) | 170 (96.1%) |
| 75 Years and over | 50 (100.0%) | 80 (80.8%) |
| Total | 1,088 (81.7%) | 980 (82.8%) |
Income Below Poverty Among Married-Couple Families in White Pine
The poverty statistics for married-couple families in White Pine show that 8.4% or 43 of the total 511 families live below the poverty line. Families with 3 or 4 children have the highest poverty rate of 15.4%, comprising of 18 families. On the other hand, families with 1 or 2 children have the lowest poverty rate of 0.0%, which includes 0 families.
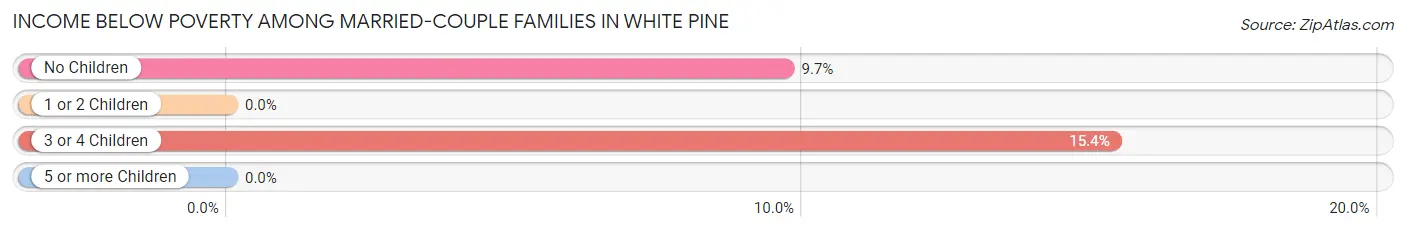
| Children | Above Poverty | Below Poverty |
| No Children | 233 (90.3%) | 25 (9.7%) |
| 1 or 2 Children | 136 (100.0%) | 0 (0.0%) |
| 3 or 4 Children | 99 (84.6%) | 18 (15.4%) |
| 5 or more Children | 0 (0.0%) | 0 (0.0%) |
| Total | 468 (91.6%) | 43 (8.4%) |
Income Below Poverty Among Single-Parent Households in White Pine
According to the poverty data in White Pine, 23.5% or 16 single-father households and 20.4% or 22 single-mother households are living below the poverty line. Among single-father households, those with no children have the highest poverty rate, with 16 households (44.4%) experiencing poverty. Likewise, among single-mother households, those with 3 or 4 children have the highest poverty rate, with 12 households (100.0%) falling below the poverty line.
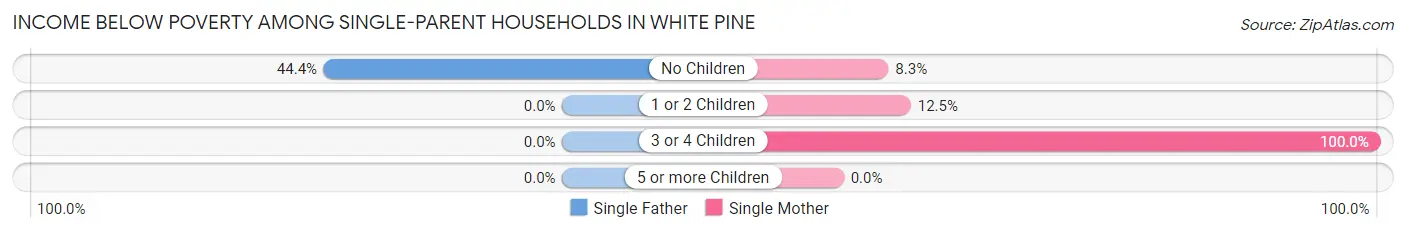
| Children | Single Father | Single Mother |
| No Children | 16 (44.4%) | 4 (8.3%) |
| 1 or 2 Children | 0 (0.0%) | 6 (12.5%) |
| 3 or 4 Children | 0 (0.0%) | 12 (100.0%) |
| 5 or more Children | 0 (0.0%) | 0 (0.0%) |
| Total | 16 (23.5%) | 22 (20.4%) |
Income Below Poverty Among Married-Couple vs Single-Parent Households in White Pine
The poverty data for White Pine shows that 43 of the married-couple family households (8.4%) and 38 of the single-parent households (21.6%) are living below the poverty level. Within the married-couple family households, those with 3 or 4 children have the highest poverty rate, with 18 households (15.4%) falling below the poverty line. Among the single-parent households, those with 3 or 4 children have the highest poverty rate, with 12 household (100.0%) living below poverty.
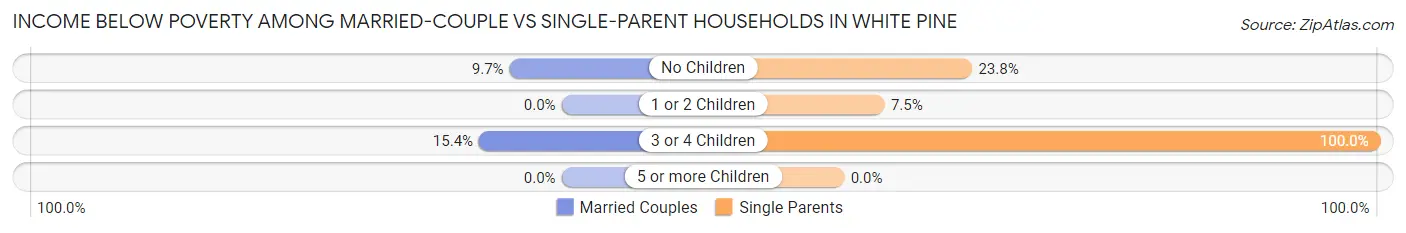
| Children | Married-Couple Families | Single-Parent Households |
| No Children | 25 (9.7%) | 20 (23.8%) |
| 1 or 2 Children | 0 (0.0%) | 6 (7.5%) |
| 3 or 4 Children | 18 (15.4%) | 12 (100.0%) |
| 5 or more Children | 0 (0.0%) | 0 (0.0%) |
| Total | 43 (8.4%) | 38 (21.6%) |
Race in White Pine
The most populous races in White Pine are White / Caucasian (2,335 | 92.4%), Hispanic or Latino (209 | 8.3%), and Two or more Races (133 | 5.3%).
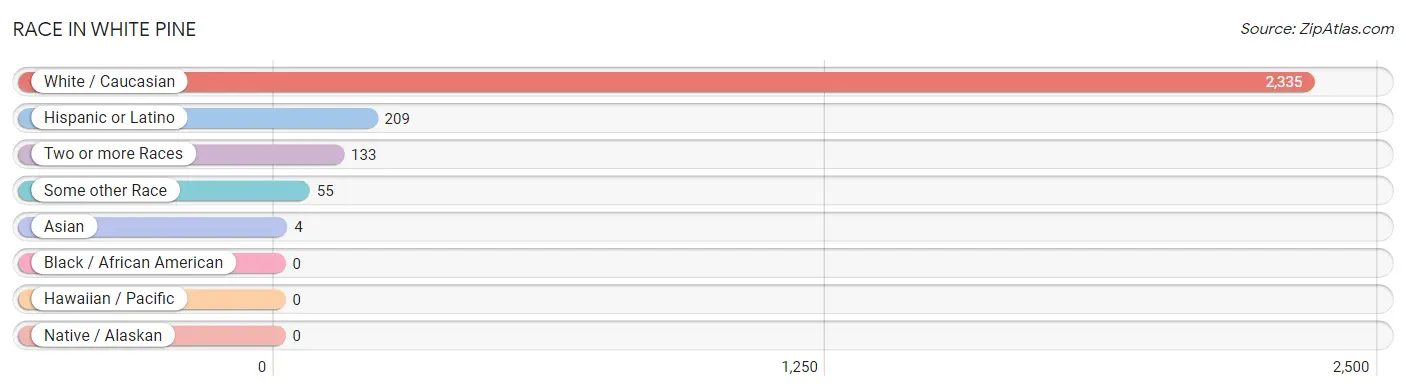
| Race | # Population | % Population |
| Asian | 4 | 0.2% |
| Black / African American | 0 | 0.0% |
| Hawaiian / Pacific | 0 | 0.0% |
| Hispanic or Latino | 209 | 8.3% |
| Native / Alaskan | 0 | 0.0% |
| White / Caucasian | 2,335 | 92.4% |
| Two or more Races | 133 | 5.3% |
| Some other Race | 55 | 2.2% |
| Total | 2,527 | 100.0% |
Ancestry in White Pine
The most populous ancestries reported in White Pine are American (544 | 21.5%), English (534 | 21.1%), German (202 | 8.0%), Scottish (192 | 7.6%), and Irish (191 | 7.6%), together accounting for 65.8% of all White Pine residents.
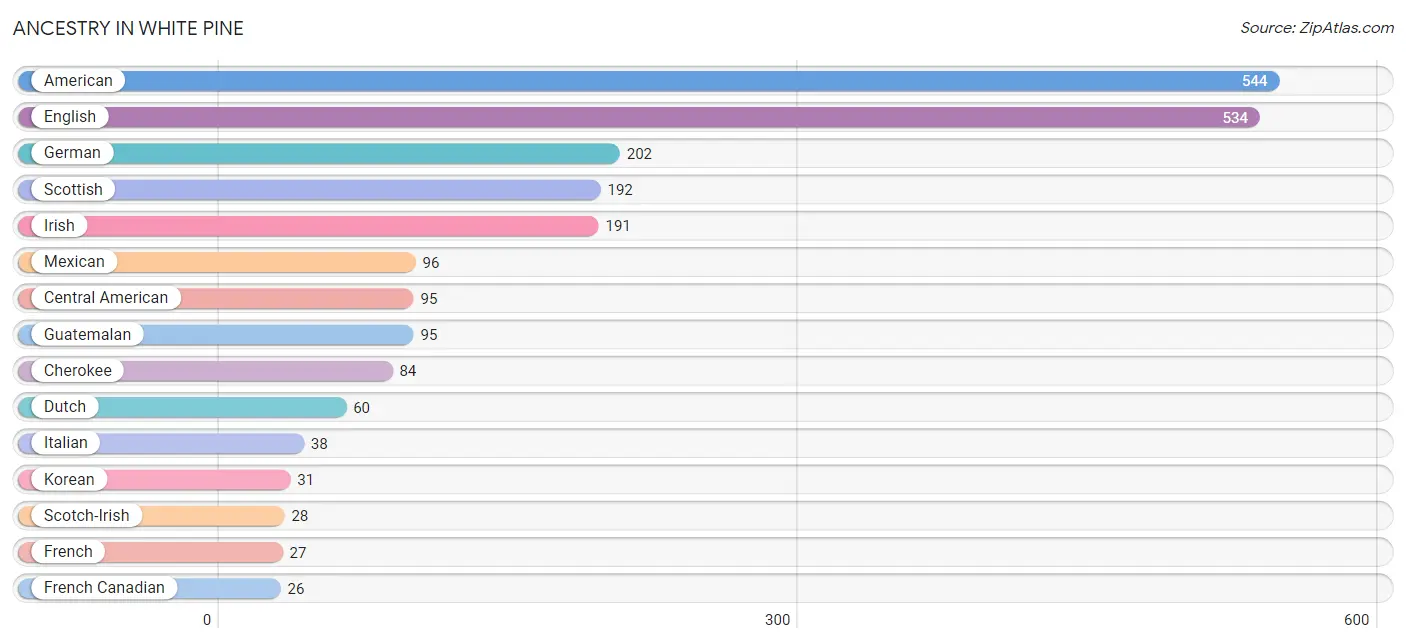
| Ancestry | # Population | % Population |
| American | 544 | 21.5% |
| Bhutanese | 10 | 0.4% |
| British | 3 | 0.1% |
| Central American | 95 | 3.8% |
| Cherokee | 84 | 3.3% |
| Cuban | 12 | 0.5% |
| Dutch | 60 | 2.4% |
| English | 534 | 21.1% |
| European | 18 | 0.7% |
| French | 27 | 1.1% |
| French Canadian | 26 | 1.0% |
| German | 202 | 8.0% |
| Guatemalan | 95 | 3.8% |
| Hungarian | 6 | 0.2% |
| Irish | 191 | 7.6% |
| Italian | 38 | 1.5% |
| Korean | 31 | 1.2% |
| Mexican | 96 | 3.8% |
| Puerto Rican | 6 | 0.2% |
| Russian | 4 | 0.2% |
| Scotch-Irish | 28 | 1.1% |
| Scottish | 192 | 7.6% |
| Welsh | 3 | 0.1% | View All 23 Rows |
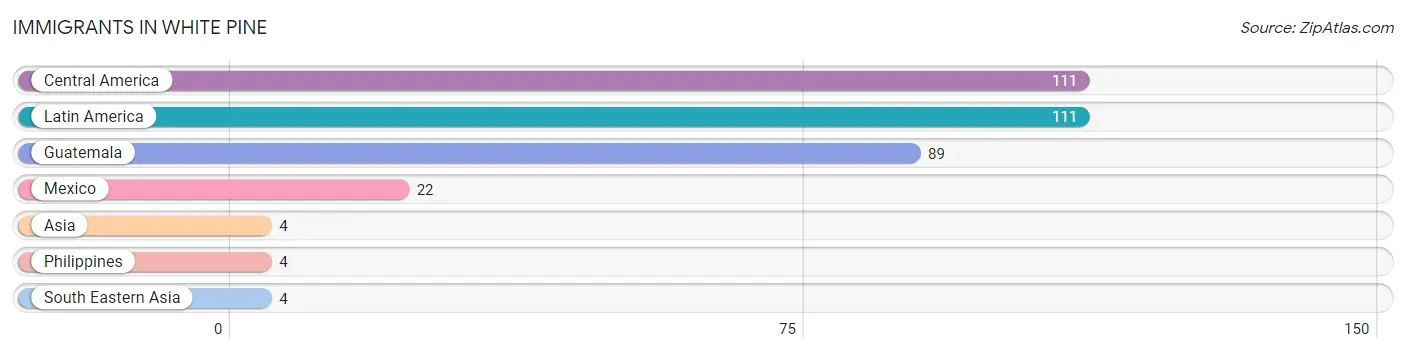
Immigrants in White Pine
The most numerous immigrant groups reported in White Pine came from Central America (111 | 4.4%), Latin America (111 | 4.4%), Guatemala (89 | 3.5%), Mexico (22 | 0.9%), and Asia (4 | 0.2%), together accounting for 13.3% of all White Pine residents.
| Immigration Origin | # Population | % Population |
| Asia | 4 | 0.2% |
| Central America | 111 | 4.4% |
| Guatemala | 89 | 3.5% |
| Latin America | 111 | 4.4% |
| Mexico | 22 | 0.9% |
| Philippines | 4 | 0.2% |
| South Eastern Asia | 4 | 0.2% | View All 7 Rows |
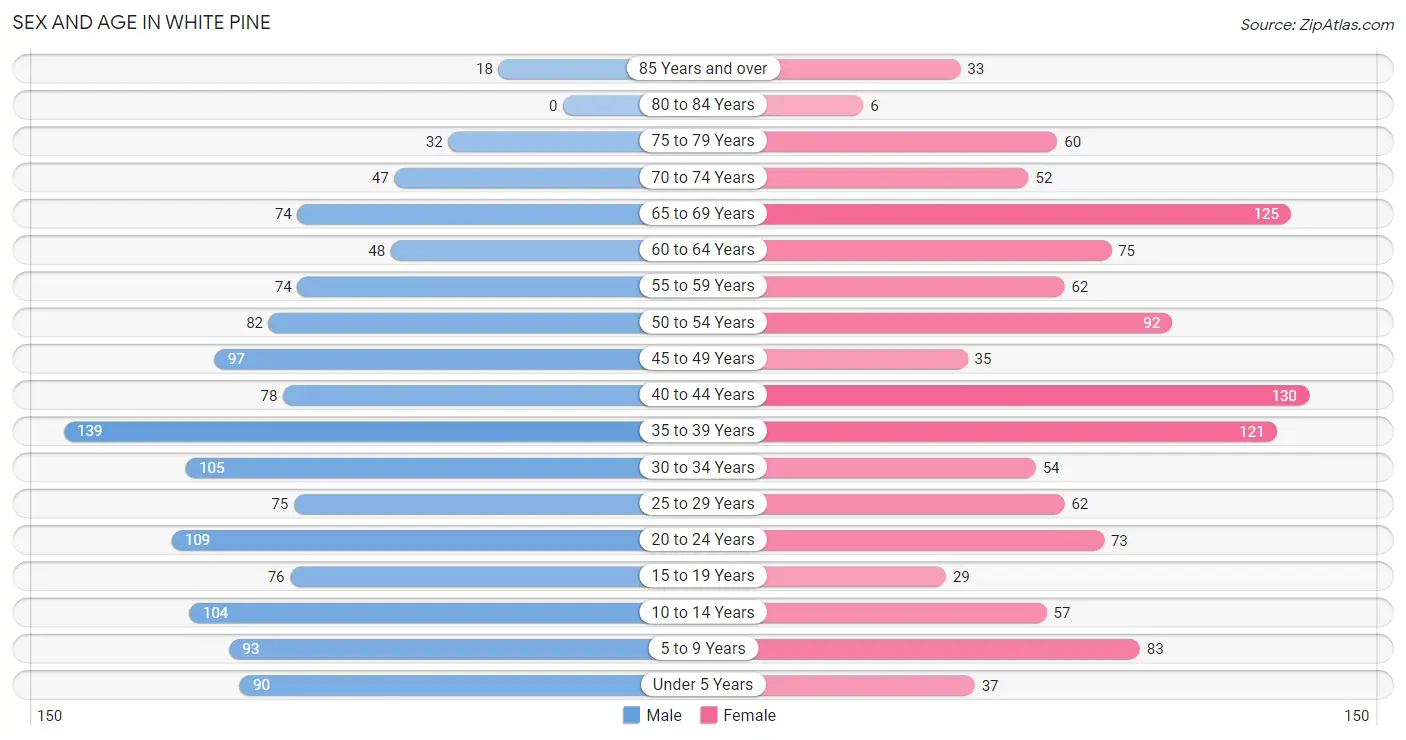
Sex and Age in White Pine
Sex and Age in White Pine
The most populous age groups in White Pine are 35 to 39 Years (139 | 10.4%) for men and 40 to 44 Years (130 | 11.0%) for women.
| Age Bracket | Male | Female |
| Under 5 Years | 90 (6.7%) | 37 (3.1%) |
| 5 to 9 Years | 93 (6.9%) | 83 (7.0%) |
| 10 to 14 Years | 104 (7.8%) | 57 (4.8%) |
| 15 to 19 Years | 76 (5.7%) | 29 (2.5%) |
| 20 to 24 Years | 109 (8.1%) | 73 (6.2%) |
| 25 to 29 Years | 75 (5.6%) | 62 (5.2%) |
| 30 to 34 Years | 105 (7.8%) | 54 (4.5%) |
| 35 to 39 Years | 139 (10.4%) | 121 (10.2%) |
| 40 to 44 Years | 78 (5.8%) | 130 (11.0%) |
| 45 to 49 Years | 97 (7.2%) | 35 (2.9%) |
| 50 to 54 Years | 82 (6.1%) | 92 (7.8%) |
| 55 to 59 Years | 74 (5.5%) | 62 (5.2%) |
| 60 to 64 Years | 48 (3.6%) | 75 (6.3%) |
| 65 to 69 Years | 74 (5.5%) | 125 (10.5%) |
| 70 to 74 Years | 47 (3.5%) | 52 (4.4%) |
| 75 to 79 Years | 32 (2.4%) | 60 (5.1%) |
| 80 to 84 Years | 0 (0.0%) | 6 (0.5%) |
| 85 Years and over | 18 (1.3%) | 33 (2.8%) |
| Total | 1,341 (100.0%) | 1,186 (100.0%) |
Families and Households in White Pine
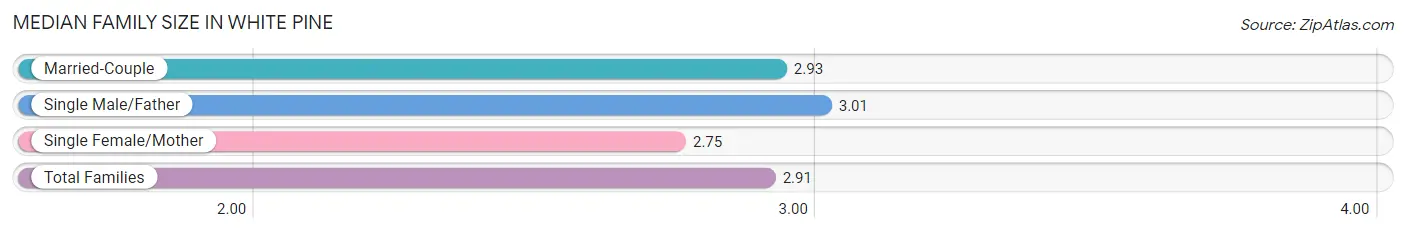
Median Family Size in White Pine
The median family size in White Pine is 2.91 persons per family, with single male/father families (68 | 9.9%) accounting for the largest median family size of 3.01 persons per family. On the other hand, single female/mother families (108 | 15.7%) represent the smallest median family size with 2.75 persons per family.
| Family Type | # Families | Family Size |
| Married-Couple | 511 (74.4%) | 2.93 |
| Single Male/Father | 68 (9.9%) | 3.01 |
| Single Female/Mother | 108 (15.7%) | 2.75 |
| Total Families | 687 (100.0%) | 2.91 |
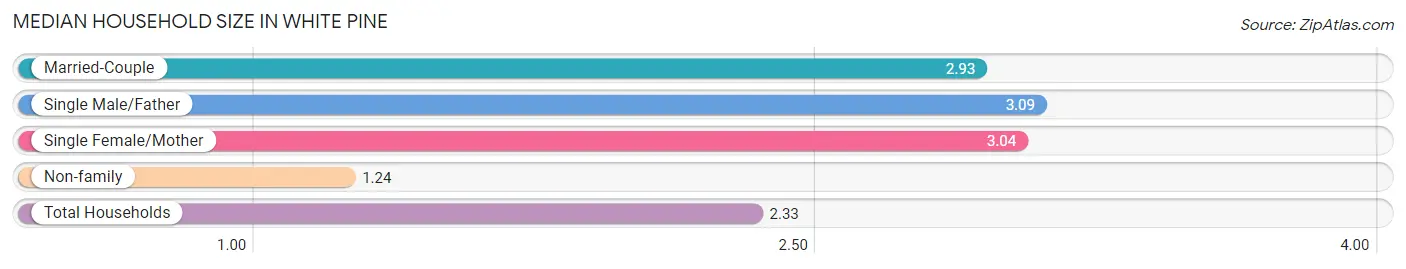
Median Household Size in White Pine
The median household size in White Pine is 2.33 persons per household, with single male/father households (68 | 6.3%) accounting for the largest median household size of 3.09 persons per household. non-family households (396 | 36.6%) represent the smallest median household size with 1.24 persons per household.
| Household Type | # Households | Household Size |
| Married-Couple | 511 (47.2%) | 2.93 |
| Single Male/Father | 68 (6.3%) | 3.09 |
| Single Female/Mother | 108 (10.0%) | 3.04 |
| Non-family | 396 (36.6%) | 1.24 |
| Total Households | 1,083 (100.0%) | 2.33 |
Household Size by Marriage Status in White Pine
Out of a total of 1,083 households in White Pine, 687 (63.4%) are family households, while 396 (36.6%) are nonfamily households. The most numerous type of family households are 2-person households, comprising 277, and the most common type of nonfamily households are 1-person households, comprising 350.
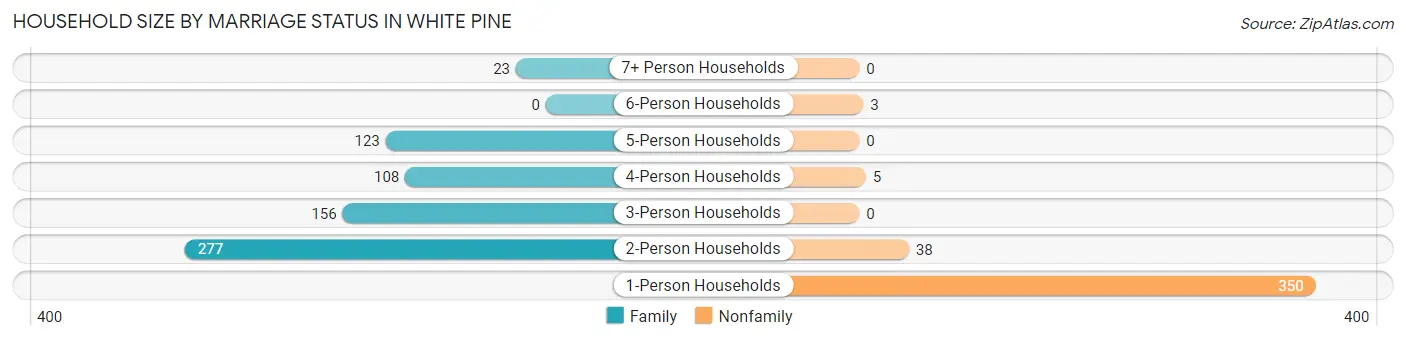
| Household Size | Family Households | Nonfamily Households |
| 1-Person Households | - | 350 (32.3%) |
| 2-Person Households | 277 (25.6%) | 38 (3.5%) |
| 3-Person Households | 156 (14.4%) | 0 (0.0%) |
| 4-Person Households | 108 (10.0%) | 5 (0.5%) |
| 5-Person Households | 123 (11.4%) | 0 (0.0%) |
| 6-Person Households | 0 (0.0%) | 3 (0.3%) |
| 7+ Person Households | 23 (2.1%) | 0 (0.0%) |
| Total | 687 (63.4%) | 396 (36.6%) |
Female Fertility in White Pine
Fertility by Age in White Pine
Average fertility rate in White Pine is 51.0 births per 1,000 women. Women in the age bracket of 20 to 34 years have the highest fertility rate with 95.0 births per 1,000 women. Women in the age bracket of 20 to 34 years acount for 69.2% of all women with births.
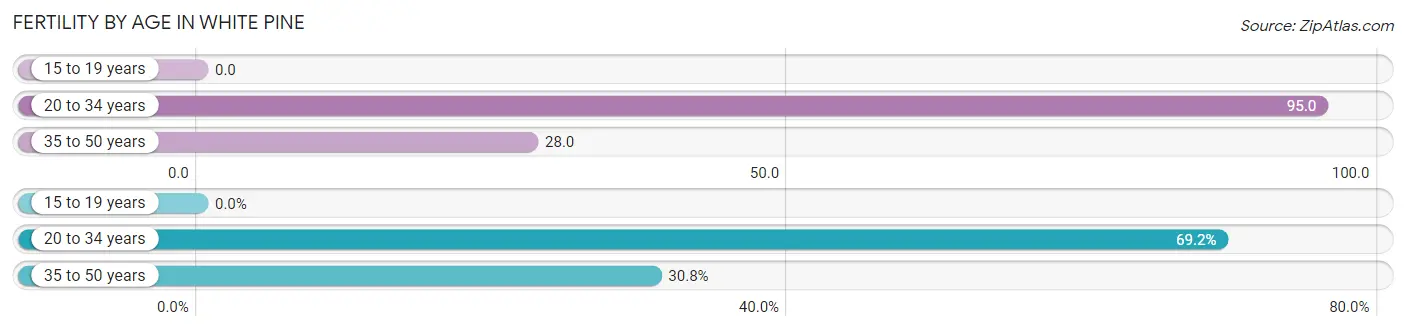
| Age Bracket | Women with Births | Births / 1,000 Women |
| 15 to 19 years | 0 (0.0%) | 0.0 |
| 20 to 34 years | 18 (69.2%) | 95.0 |
| 35 to 50 years | 8 (30.8%) | 28.0 |
| Total | 26 (100.0%) | 51.0 |
Fertility by Age by Marriage Status in White Pine
73.1% of women with births (26) in White Pine are married. The highest percentage of unmarried women with births falls into 20 to 34 years age bracket with 38.9% of them unmarried at the time of birth, while the lowest percentage of unmarried women with births belong to 35 to 50 years age bracket with 0.0% of them unmarried.
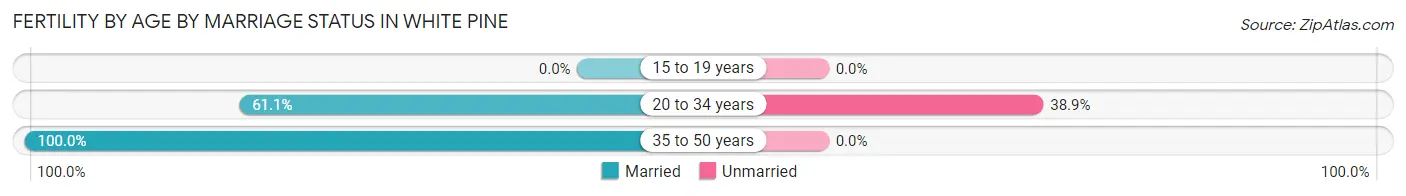
| Age Bracket | Married | Unmarried |
| 15 to 19 years | 0 (0.0%) | 0 (0.0%) |
| 20 to 34 years | 11 (61.1%) | 7 (38.9%) |
| 35 to 50 years | 8 (100.0%) | 0 (0.0%) |
| Total | 19 (73.1%) | 7 (26.9%) |
Fertility by Education in White Pine
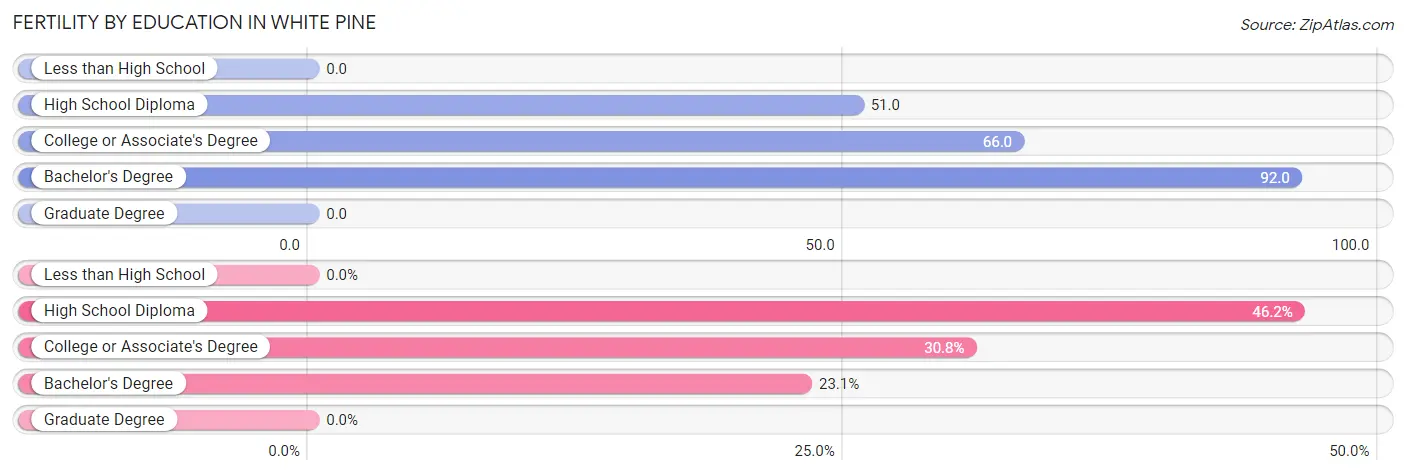
| Educational Attainment | Women with Births | Births / 1,000 Women |
| Less than High School | 0 (0.0%) | 0.0 |
| High School Diploma | 12 (46.2%) | 51.0 |
| College or Associate's Degree | 8 (30.8%) | 66.0 |
| Bachelor's Degree | 6 (23.1%) | 92.0 |
| Graduate Degree | 0 (0.0%) | 0.0 |
| Total | 26 (100.0%) | 51.0 |
Fertility by Education by Marriage Status in White Pine
26.9% of women with births in White Pine are unmarried. Women with the educational attainment of college or associate's degree are most likely to be married with 100.0% of them married at childbirth, while women with the educational attainment of high school diploma are least likely to be married with 58.3% of them unmarried at childbirth.
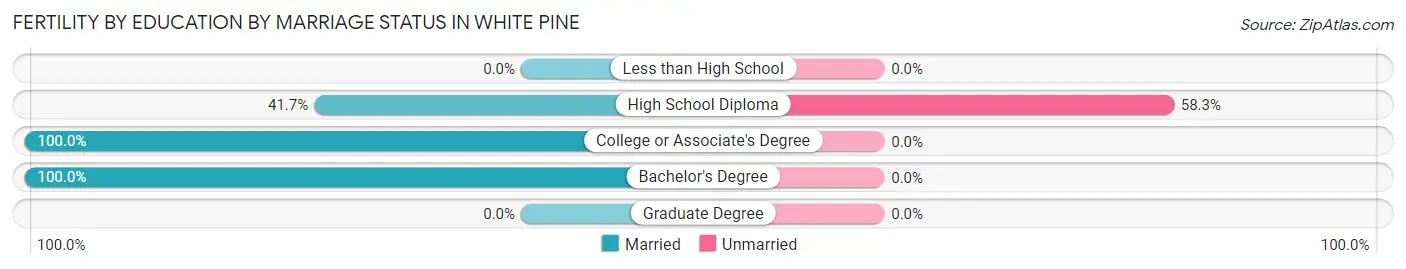
| Educational Attainment | Married | Unmarried |
| Less than High School | 0 (0.0%) | 0 (0.0%) |
| High School Diploma | 5 (41.7%) | 7 (58.3%) |
| College or Associate's Degree | 8 (100.0%) | 0 (0.0%) |
| Bachelor's Degree | 6 (100.0%) | 0 (0.0%) |
| Graduate Degree | 0 (0.0%) | 0 (0.0%) |
| Total | 19 (73.1%) | 7 (26.9%) |
Employment Characteristics in White Pine
Employment by Class of Employer in White Pine
Among the 1,150 employed individuals in White Pine, private company employees (872 | 75.8%), local government employees (101 | 8.8%), and not-for-profit organizations (76 | 6.6%) make up the most common classes of employment.
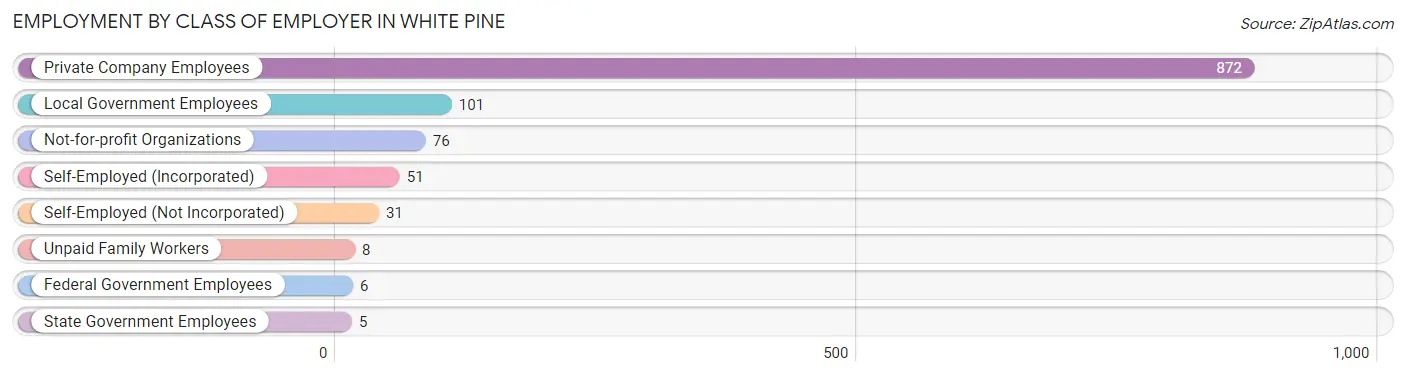
| Employer Class | # Employees | % Employees |
| Private Company Employees | 872 | 75.8% |
| Self-Employed (Incorporated) | 51 | 4.4% |
| Self-Employed (Not Incorporated) | 31 | 2.7% |
| Not-for-profit Organizations | 76 | 6.6% |
| Local Government Employees | 101 | 8.8% |
| State Government Employees | 5 | 0.4% |
| Federal Government Employees | 6 | 0.5% |
| Unpaid Family Workers | 8 | 0.7% |
| Total | 1,150 | 100.0% |
Employment Status by Age in White Pine
According to the labor force statistics for White Pine, out of the total population over 16 years of age (2,050), 65.1% or 1,335 individuals are in the labor force, with 6.1% or 81 of them unemployed. The age group with the highest labor force participation rate is 45 to 54 years, with 95.4% or 292 individuals in the labor force. Within the labor force, the 20 to 24 years age range has the highest percentage of unemployed individuals, with 10.7% or 17 of them being unemployed.
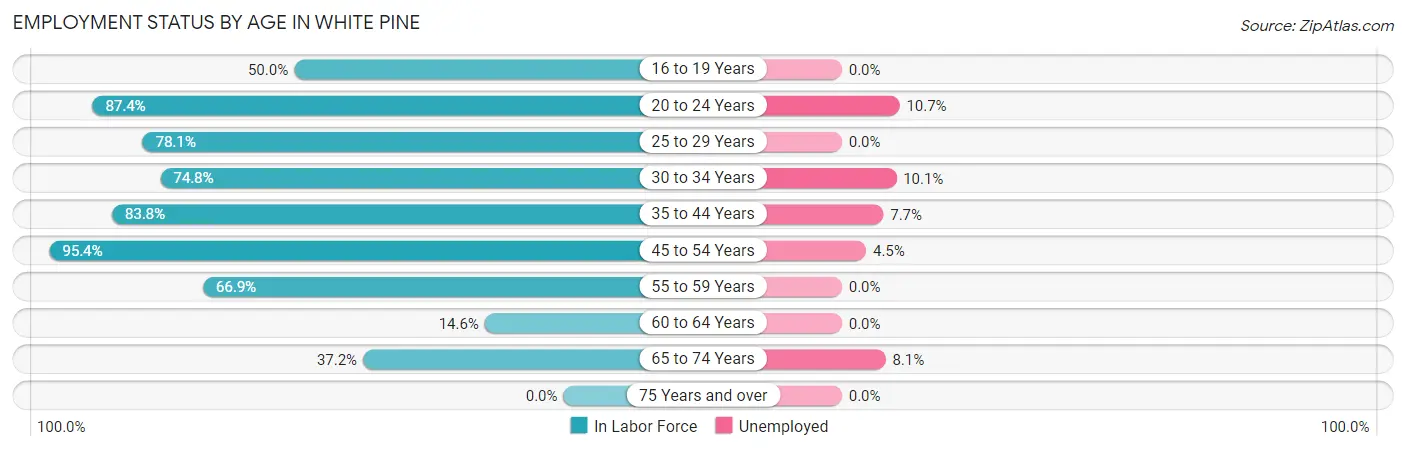
| Age Bracket | In Labor Force | Unemployed |
| 16 to 19 Years | 46 (50.0%) | 0 (0.0%) |
| 20 to 24 Years | 159 (87.4%) | 17 (10.7%) |
| 25 to 29 Years | 107 (78.1%) | 0 (0.0%) |
| 30 to 34 Years | 119 (74.8%) | 12 (10.1%) |
| 35 to 44 Years | 392 (83.8%) | 30 (7.7%) |
| 45 to 54 Years | 292 (95.4%) | 13 (4.5%) |
| 55 to 59 Years | 91 (66.9%) | 0 (0.0%) |
| 60 to 64 Years | 18 (14.6%) | 0 (0.0%) |
| 65 to 74 Years | 111 (37.2%) | 9 (8.1%) |
| 75 Years and over | 0 (0.0%) | 0 (0.0%) |
| Total | 1,335 (65.1%) | 81 (6.1%) |
Employment Status by Educational Attainment in White Pine
According to labor force statistics for White Pine, 76.7% of individuals (1,019) out of the total population between 25 and 64 years of age (1,329) are in the labor force, with 5.4% or 55 of them being unemployed. The group with the highest labor force participation rate are those with the educational attainment of bachelor's degree or higher, with 97.5% or 232 individuals in the labor force. Within the labor force, individuals with less than high school education have the highest percentage of unemployment, with 21.4% or 12 of them being unemployed.
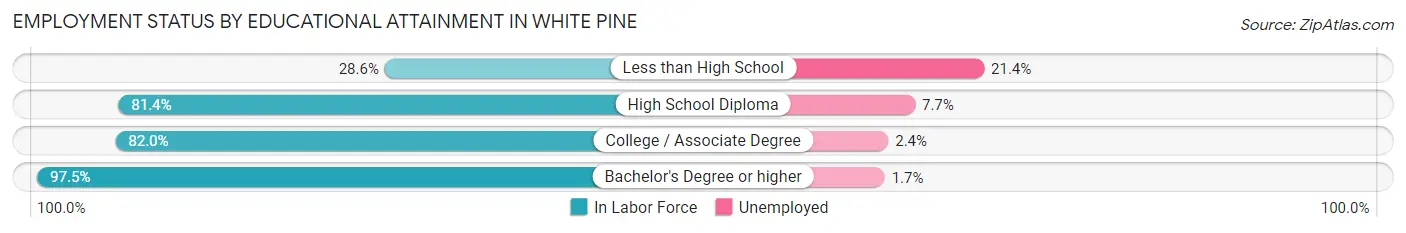
| Educational Attainment | In Labor Force | Unemployed |
| Less than High School | 56 (28.6%) | 42 (21.4%) |
| High School Diploma | 402 (81.4%) | 38 (7.7%) |
| College / Associate Degree | 329 (82.0%) | 10 (2.4%) |
| Bachelor's Degree or higher | 232 (97.5%) | 4 (1.7%) |
| Total | 1,019 (76.7%) | 72 (5.4%) |
Employment Occupations by Sex in White Pine
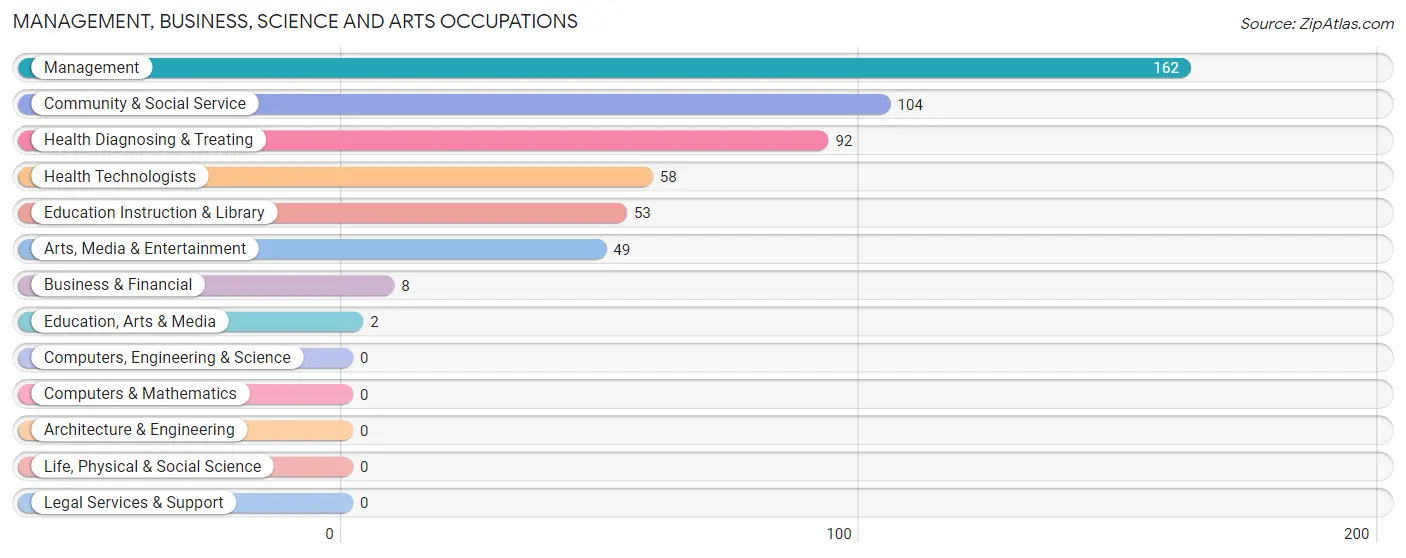
Management, Business, Science and Arts Occupations
The most common Management, Business, Science and Arts occupations in White Pine are Management (162 | 12.9%), Community & Social Service (104 | 8.3%), Health Diagnosing & Treating (92 | 7.3%), Health Technologists (58 | 4.6%), and Education Instruction & Library (53 | 4.2%).
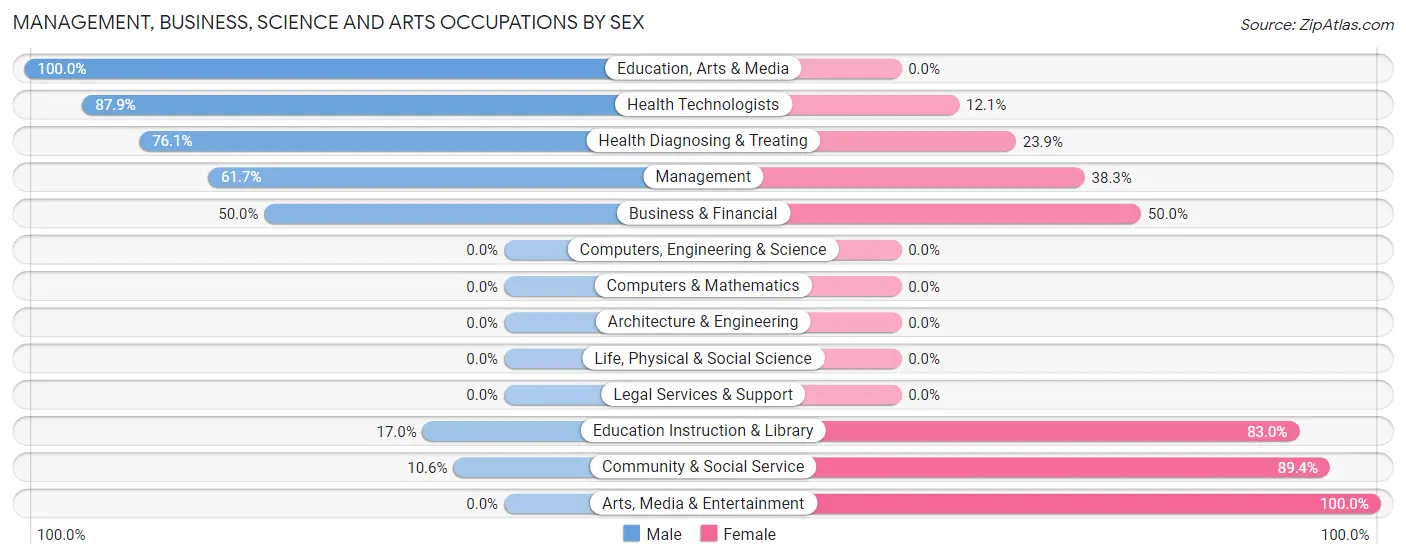
Management, Business, Science and Arts Occupations by Sex
Within the Management, Business, Science and Arts occupations in White Pine, the most male-oriented occupations are Education, Arts & Media (100.0%), Health Technologists (87.9%), and Health Diagnosing & Treating (76.1%), while the most female-oriented occupations are Arts, Media & Entertainment (100.0%), Community & Social Service (89.4%), and Education Instruction & Library (83.0%).
| Occupation | Male | Female |
| Management | 100 (61.7%) | 62 (38.3%) |
| Business & Financial | 4 (50.0%) | 4 (50.0%) |
| Computers, Engineering & Science | 0 (0.0%) | 0 (0.0%) |
| Computers & Mathematics | 0 (0.0%) | 0 (0.0%) |
| Architecture & Engineering | 0 (0.0%) | 0 (0.0%) |
| Life, Physical & Social Science | 0 (0.0%) | 0 (0.0%) |
| Community & Social Service | 11 (10.6%) | 93 (89.4%) |
| Education, Arts & Media | 2 (100.0%) | 0 (0.0%) |
| Legal Services & Support | 0 (0.0%) | 0 (0.0%) |
| Education Instruction & Library | 9 (17.0%) | 44 (83.0%) |
| Arts, Media & Entertainment | 0 (0.0%) | 49 (100.0%) |
| Health Diagnosing & Treating | 70 (76.1%) | 22 (23.9%) |
| Health Technologists | 51 (87.9%) | 7 (12.1%) |
| Total (Category) | 185 (50.5%) | 181 (49.4%) |
| Total (Overall) | 754 (60.1%) | 500 (39.9%) |
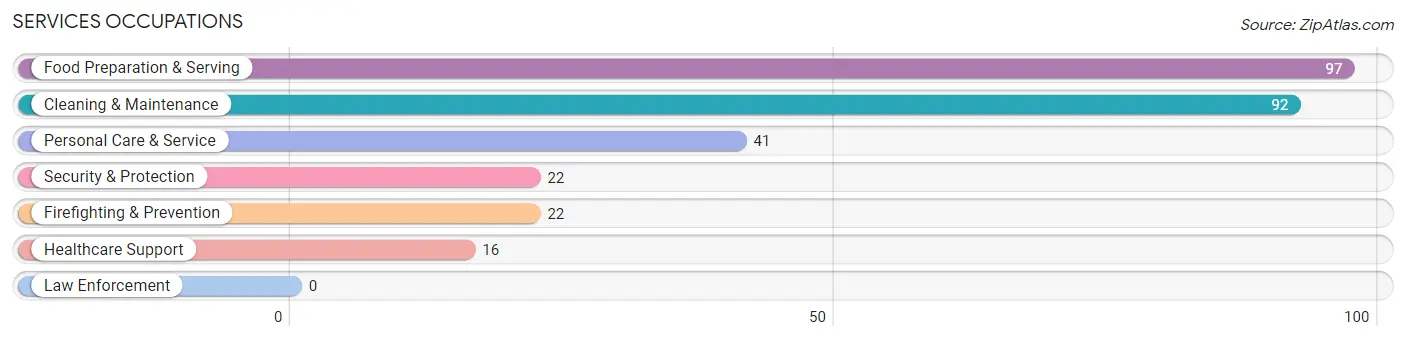
Services Occupations
The most common Services occupations in White Pine are Food Preparation & Serving (97 | 7.7%), Cleaning & Maintenance (92 | 7.3%), Personal Care & Service (41 | 3.3%), Security & Protection (22 | 1.8%), and Firefighting & Prevention (22 | 1.8%).
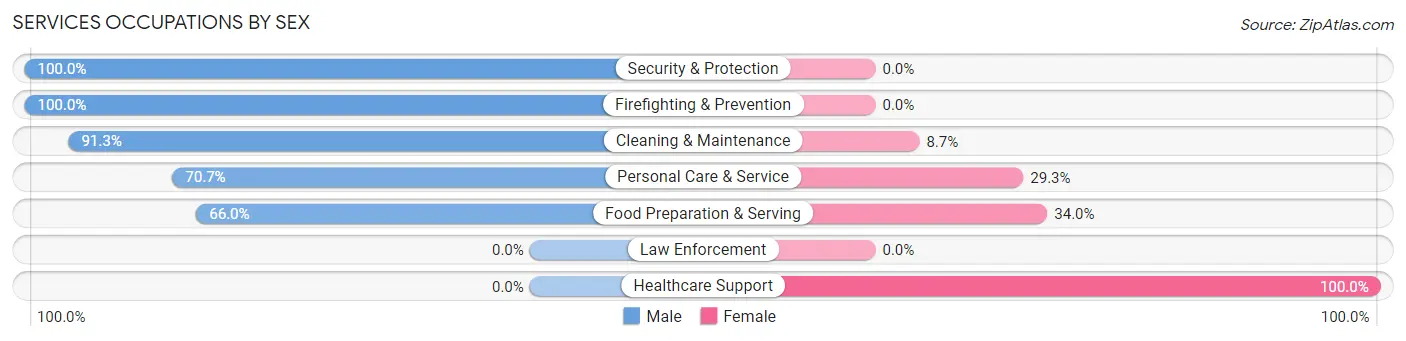
Services Occupations by Sex
Within the Services occupations in White Pine, the most male-oriented occupations are Security & Protection (100.0%), Firefighting & Prevention (100.0%), and Cleaning & Maintenance (91.3%), while the most female-oriented occupations are Healthcare Support (100.0%), Food Preparation & Serving (34.0%), and Personal Care & Service (29.3%).
| Occupation | Male | Female |
| Healthcare Support | 0 (0.0%) | 16 (100.0%) |
| Security & Protection | 22 (100.0%) | 0 (0.0%) |
| Firefighting & Prevention | 22 (100.0%) | 0 (0.0%) |
| Law Enforcement | 0 (0.0%) | 0 (0.0%) |
| Food Preparation & Serving | 64 (66.0%) | 33 (34.0%) |
| Cleaning & Maintenance | 84 (91.3%) | 8 (8.7%) |
| Personal Care & Service | 29 (70.7%) | 12 (29.3%) |
| Total (Category) | 199 (74.3%) | 69 (25.8%) |
| Total (Overall) | 754 (60.1%) | 500 (39.9%) |
Sales and Office Occupations
The most common Sales and Office occupations in White Pine are Sales & Related (68 | 5.4%), and Office & Administration (53 | 4.2%).
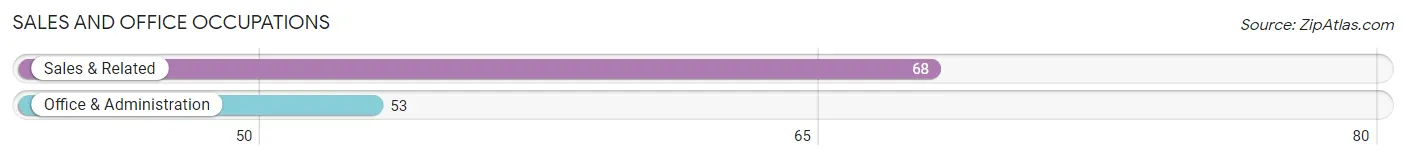
Sales and Office Occupations by Sex
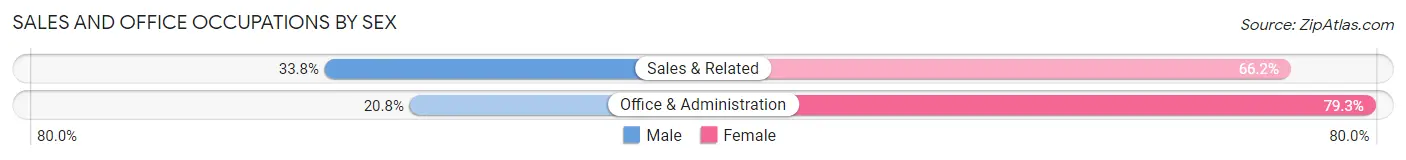
| Occupation | Male | Female |
| Sales & Related | 23 (33.8%) | 45 (66.2%) |
| Office & Administration | 11 (20.7%) | 42 (79.2%) |
| Total (Category) | 34 (28.1%) | 87 (71.9%) |
| Total (Overall) | 754 (60.1%) | 500 (39.9%) |
Natural Resources, Construction and Maintenance Occupations
The most common Natural Resources, Construction and Maintenance occupations in White Pine are Construction & Extraction (73 | 5.8%), and Installation, Maintenance & Repair (71 | 5.7%).
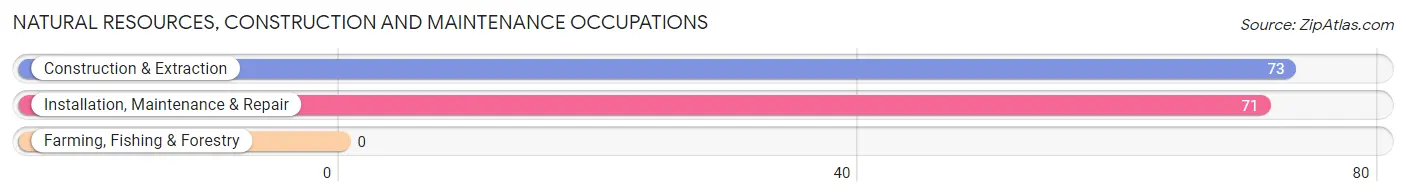
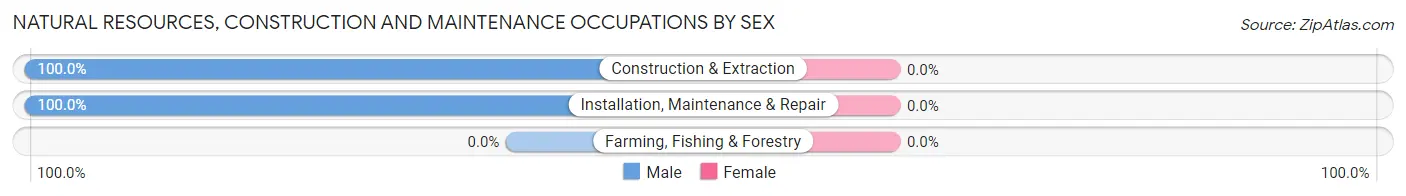
Natural Resources, Construction and Maintenance Occupations by Sex
| Occupation | Male | Female |
| Farming, Fishing & Forestry | 0 (0.0%) | 0 (0.0%) |
| Construction & Extraction | 73 (100.0%) | 0 (0.0%) |
| Installation, Maintenance & Repair | 71 (100.0%) | 0 (0.0%) |
| Total (Category) | 144 (100.0%) | 0 (0.0%) |
| Total (Overall) | 754 (60.1%) | 500 (39.9%) |
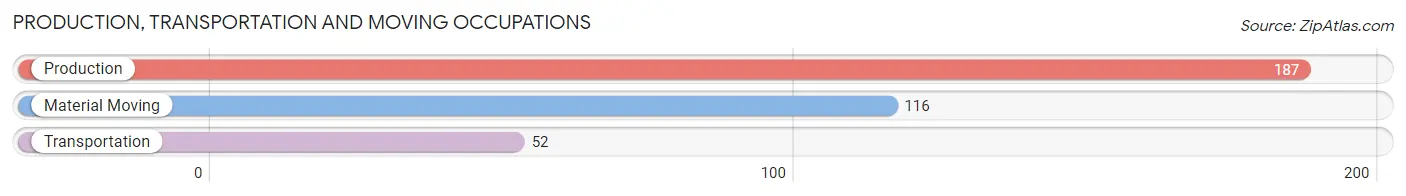
Production, Transportation and Moving Occupations
The most common Production, Transportation and Moving occupations in White Pine are Production (187 | 14.9%), Material Moving (116 | 9.2%), and Transportation (52 | 4.2%).
Production, Transportation and Moving Occupations by Sex
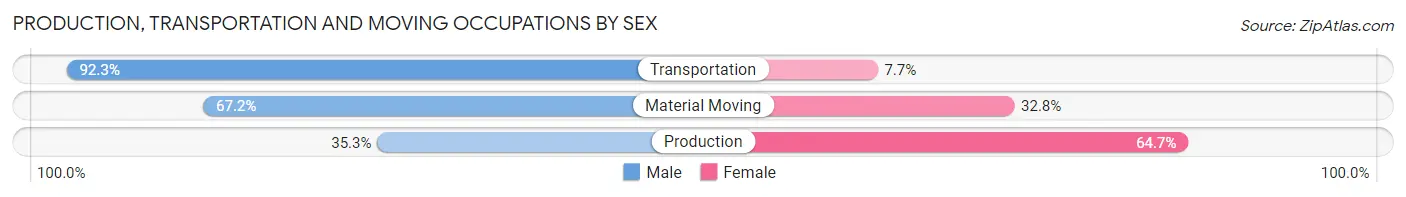
| Occupation | Male | Female |
| Production | 66 (35.3%) | 121 (64.7%) |
| Transportation | 48 (92.3%) | 4 (7.7%) |
| Material Moving | 78 (67.2%) | 38 (32.8%) |
| Total (Category) | 192 (54.1%) | 163 (45.9%) |
| Total (Overall) | 754 (60.1%) | 500 (39.9%) |
Employment Industries by Sex in White Pine
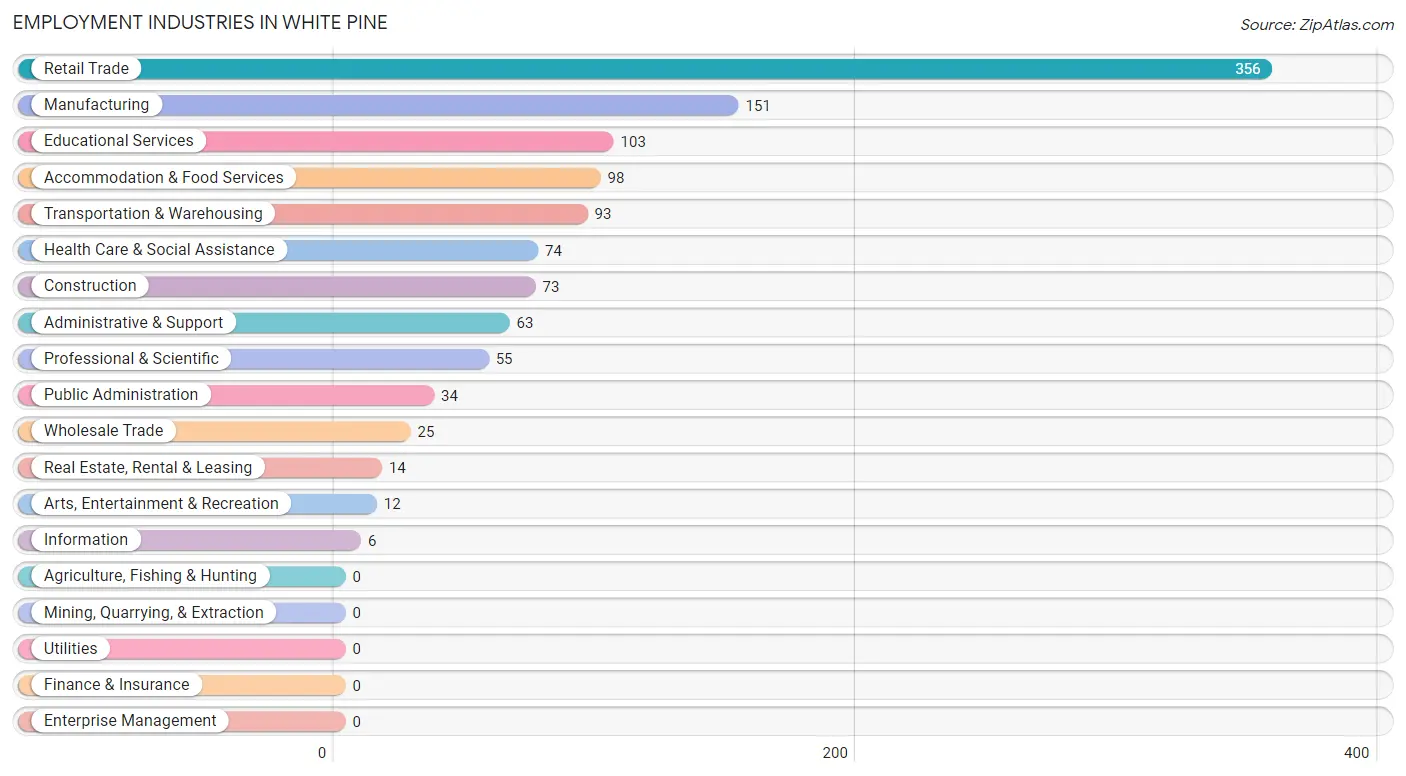
Employment Industries in White Pine
The major employment industries in White Pine include Retail Trade (356 | 28.4%), Manufacturing (151 | 12.0%), Educational Services (103 | 8.2%), Accommodation & Food Services (98 | 7.8%), and Transportation & Warehousing (93 | 7.4%).
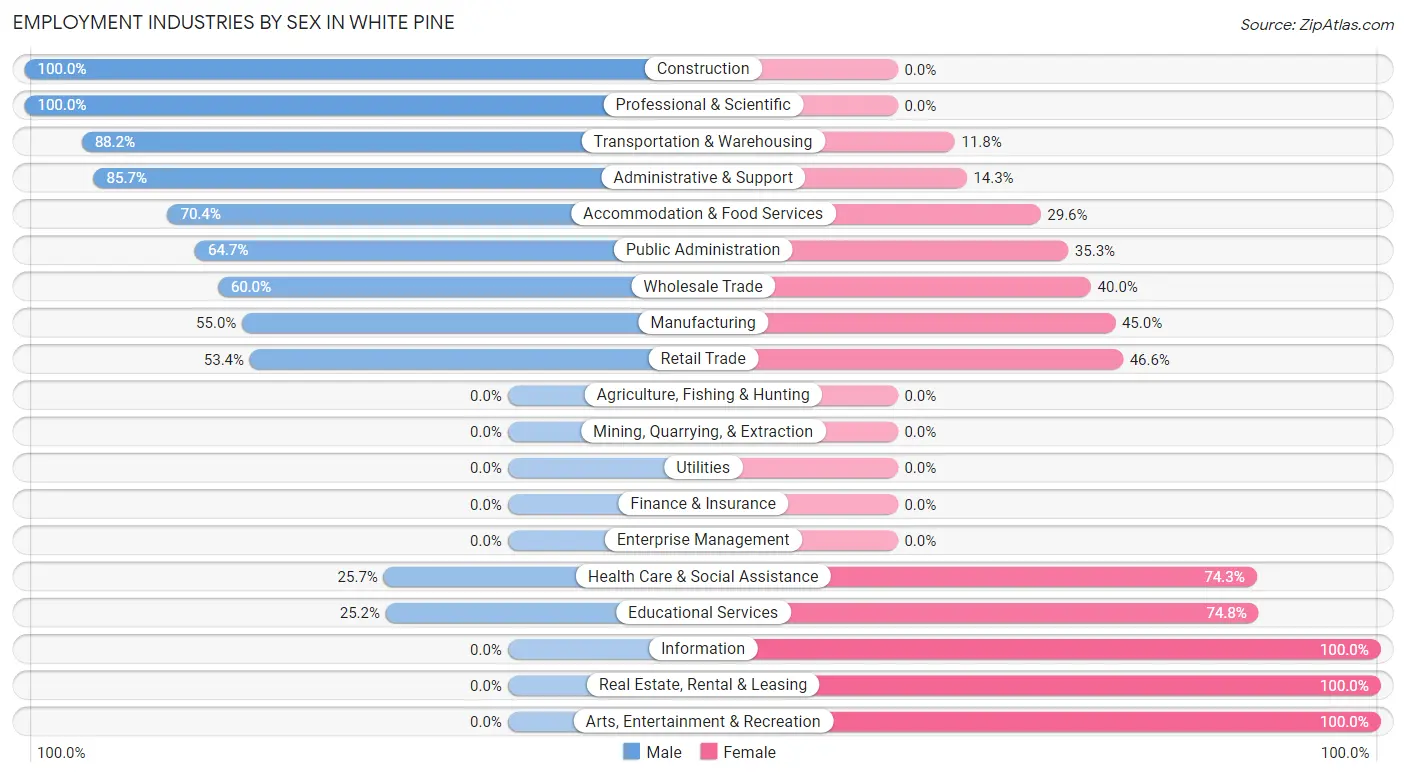
Employment Industries by Sex in White Pine
The White Pine industries that see more men than women are Construction (100.0%), Professional & Scientific (100.0%), and Transportation & Warehousing (88.2%), whereas the industries that tend to have a higher number of women are Information (100.0%), Real Estate, Rental & Leasing (100.0%), and Arts, Entertainment & Recreation (100.0%).
| Industry | Male | Female |
| Agriculture, Fishing & Hunting | 0 (0.0%) | 0 (0.0%) |
| Mining, Quarrying, & Extraction | 0 (0.0%) | 0 (0.0%) |
| Construction | 73 (100.0%) | 0 (0.0%) |
| Manufacturing | 83 (55.0%) | 68 (45.0%) |
| Wholesale Trade | 15 (60.0%) | 10 (40.0%) |
| Retail Trade | 190 (53.4%) | 166 (46.6%) |
| Transportation & Warehousing | 82 (88.2%) | 11 (11.8%) |
| Utilities | 0 (0.0%) | 0 (0.0%) |
| Information | 0 (0.0%) | 6 (100.0%) |
| Finance & Insurance | 0 (0.0%) | 0 (0.0%) |
| Real Estate, Rental & Leasing | 0 (0.0%) | 14 (100.0%) |
| Professional & Scientific | 55 (100.0%) | 0 (0.0%) |
| Enterprise Management | 0 (0.0%) | 0 (0.0%) |
| Administrative & Support | 54 (85.7%) | 9 (14.3%) |
| Educational Services | 26 (25.2%) | 77 (74.8%) |
| Health Care & Social Assistance | 19 (25.7%) | 55 (74.3%) |
| Arts, Entertainment & Recreation | 0 (0.0%) | 12 (100.0%) |
| Accommodation & Food Services | 69 (70.4%) | 29 (29.6%) |
| Public Administration | 22 (64.7%) | 12 (35.3%) |
| Total | 754 (60.1%) | 500 (39.9%) |
Education in White Pine
School Enrollment in White Pine
The most common levels of schooling among the 490 students in White Pine are middle school (132 | 26.9%), elementary school (125 | 25.5%), and high school (104 | 21.2%).
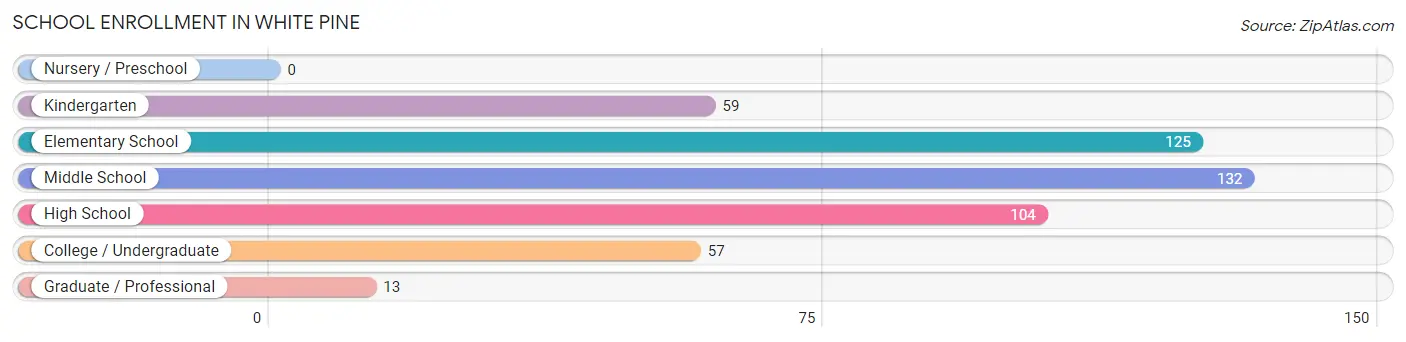
| School Level | # Students | % Students |
| Nursery / Preschool | 0 | 0.0% |
| Kindergarten | 59 | 12.0% |
| Elementary School | 125 | 25.5% |
| Middle School | 132 | 26.9% |
| High School | 104 | 21.2% |
| College / Undergraduate | 57 | 11.6% |
| Graduate / Professional | 13 | 2.6% |
| Total | 490 | 100.0% |
School Enrollment by Age by Funding Source in White Pine
Out of a total of 490 students who are enrolled in schools in White Pine, 74 (15.1%) attend a private institution, while the remaining 416 (84.9%) are enrolled in public schools. The age group of 20 to 24 year olds has the highest likelihood of being enrolled in private schools, with 22 (68.8% in the age bracket) enrolled. Conversely, the age group of 18 to 19 year olds has the lowest likelihood of being enrolled in a private school, with 44 (100.0% in the age bracket) attending a public institution.
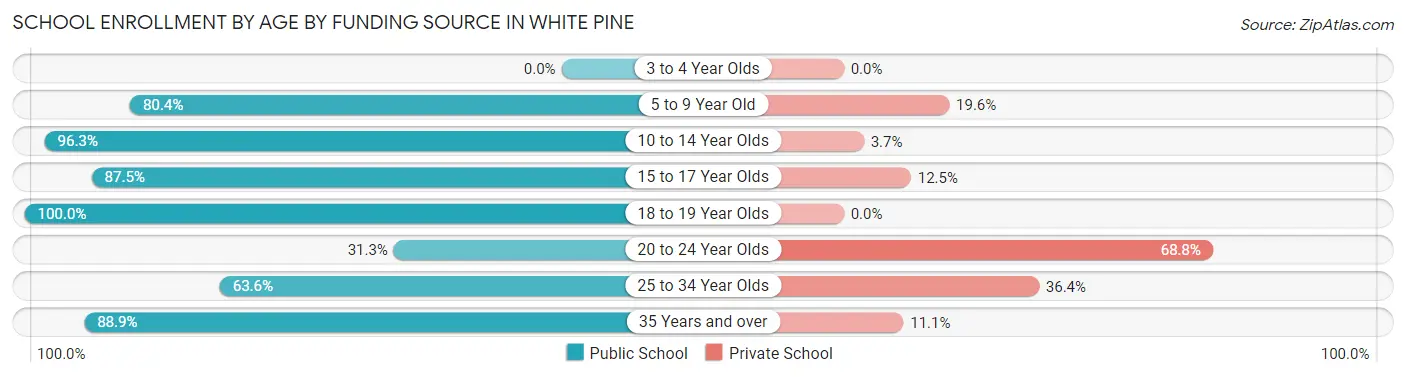
| Age Bracket | Public School | Private School |
| 3 to 4 Year Olds | 0 (0.0%) | 0 (0.0%) |
| 5 to 9 Year Old | 135 (80.4%) | 33 (19.6%) |
| 10 to 14 Year Olds | 155 (96.3%) | 6 (3.7%) |
| 15 to 17 Year Olds | 49 (87.5%) | 7 (12.5%) |
| 18 to 19 Year Olds | 44 (100.0%) | 0 (0.0%) |
| 20 to 24 Year Olds | 10 (31.2%) | 22 (68.8%) |
| 25 to 34 Year Olds | 7 (63.6%) | 4 (36.4%) |
| 35 Years and over | 16 (88.9%) | 2 (11.1%) |
| Total | 416 (84.9%) | 74 (15.1%) |
Educational Attainment by Field of Study in White Pine
Computers & mathematics (71 | 25.8%), bio, nature & agricultural (60 | 21.8%), science & technology (34 | 12.4%), business (32 | 11.6%), and arts & humanities (29 | 10.5%) are the most common fields of study among 275 individuals in White Pine who have obtained a bachelor's degree or higher.
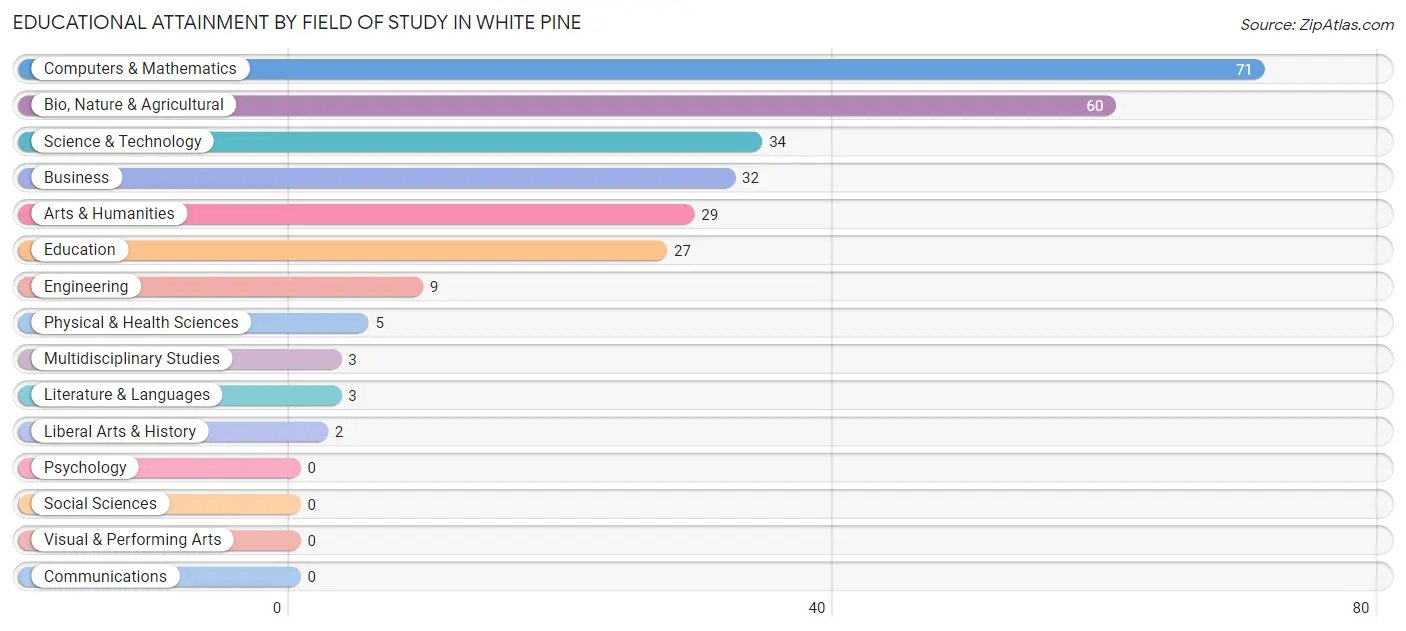
| Field of Study | # Graduates | % Graduates |
| Computers & Mathematics | 71 | 25.8% |
| Bio, Nature & Agricultural | 60 | 21.8% |
| Physical & Health Sciences | 5 | 1.8% |
| Psychology | 0 | 0.0% |
| Social Sciences | 0 | 0.0% |
| Engineering | 9 | 3.3% |
| Multidisciplinary Studies | 3 | 1.1% |
| Science & Technology | 34 | 12.4% |
| Business | 32 | 11.6% |
| Education | 27 | 9.8% |
| Literature & Languages | 3 | 1.1% |
| Liberal Arts & History | 2 | 0.7% |
| Visual & Performing Arts | 0 | 0.0% |
| Communications | 0 | 0.0% |
| Arts & Humanities | 29 | 10.5% |
| Total | 275 | 100.0% |
Transportation & Commute in White Pine
Vehicle Availability by Sex in White Pine
The most prevalent vehicle ownership categories in White Pine are males with 2 vehicles (349, accounting for 53.7%) and females with 2 vehicles (204, making up 69.8%).
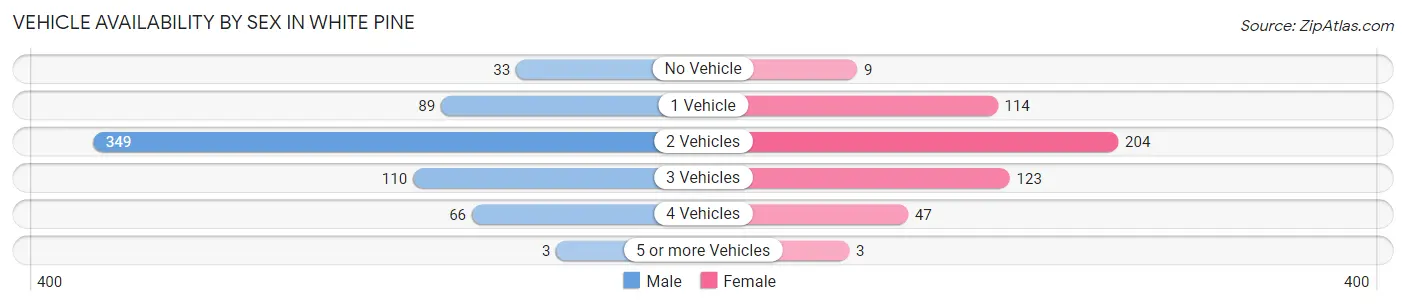
| Vehicles Available | Male | Female |
| No Vehicle | 33 (5.1%) | 9 (1.8%) |
| 1 Vehicle | 89 (13.7%) | 114 (22.8%) |
| 2 Vehicles | 349 (53.7%) | 204 (40.8%) |
| 3 Vehicles | 110 (16.9%) | 123 (24.6%) |
| 4 Vehicles | 66 (10.2%) | 47 (9.4%) |
| 5 or more Vehicles | 3 (0.5%) | 3 (0.6%) |
| Total | 650 (100.0%) | 500 (100.0%) |
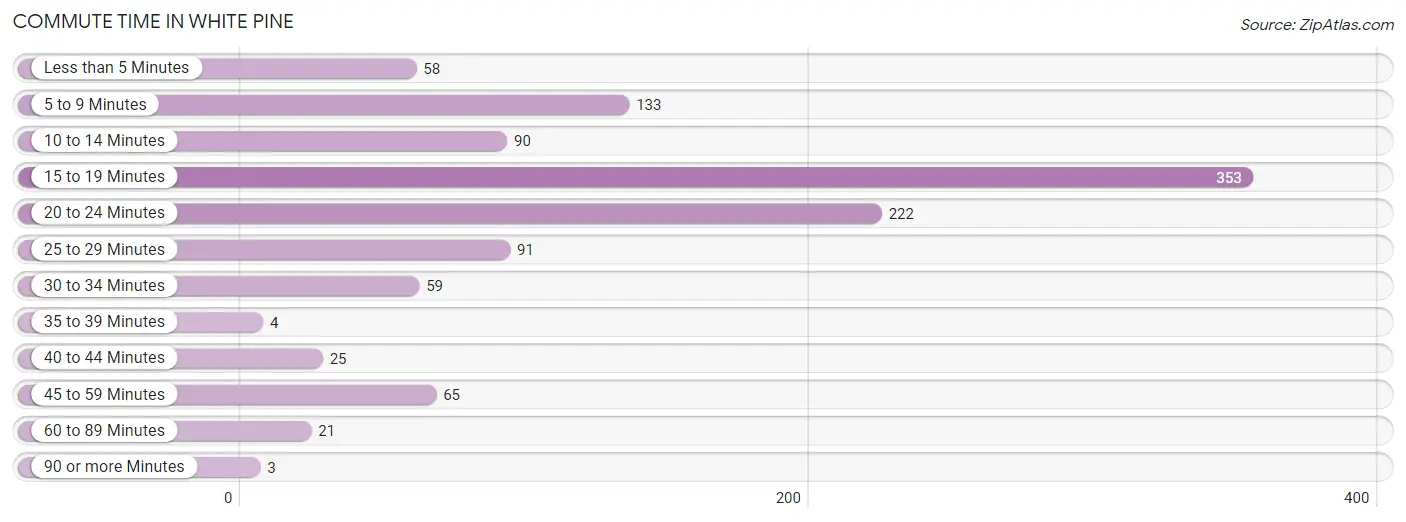
Commute Time in White Pine
The most frequently occuring commute durations in White Pine are 15 to 19 minutes (353 commuters, 31.4%), 20 to 24 minutes (222 commuters, 19.8%), and 5 to 9 minutes (133 commuters, 11.8%).
| Commute Time | # Commuters | % Commuters |
| Less than 5 Minutes | 58 | 5.2% |
| 5 to 9 Minutes | 133 | 11.8% |
| 10 to 14 Minutes | 90 | 8.0% |
| 15 to 19 Minutes | 353 | 31.4% |
| 20 to 24 Minutes | 222 | 19.8% |
| 25 to 29 Minutes | 91 | 8.1% |
| 30 to 34 Minutes | 59 | 5.2% |
| 35 to 39 Minutes | 4 | 0.4% |
| 40 to 44 Minutes | 25 | 2.2% |
| 45 to 59 Minutes | 65 | 5.8% |
| 60 to 89 Minutes | 21 | 1.9% |
| 90 or more Minutes | 3 | 0.3% |
Commute Time by Sex in White Pine
The most common commute times in White Pine are 15 to 19 minutes (185 commuters, 28.6%) for males and 15 to 19 minutes (168 commuters, 35.1%) for females.
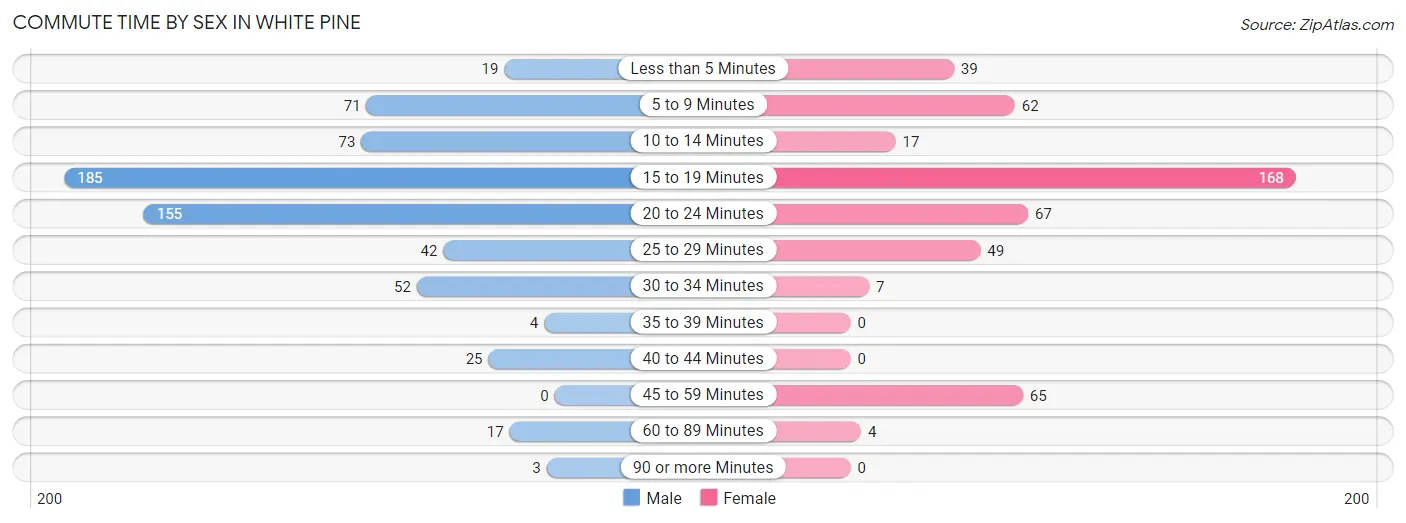
| Commute Time | Male | Female |
| Less than 5 Minutes | 19 (2.9%) | 39 (8.2%) |
| 5 to 9 Minutes | 71 (11.0%) | 62 (13.0%) |
| 10 to 14 Minutes | 73 (11.3%) | 17 (3.6%) |
| 15 to 19 Minutes | 185 (28.6%) | 168 (35.1%) |
| 20 to 24 Minutes | 155 (24.0%) | 67 (14.0%) |
| 25 to 29 Minutes | 42 (6.5%) | 49 (10.2%) |
| 30 to 34 Minutes | 52 (8.1%) | 7 (1.5%) |
| 35 to 39 Minutes | 4 (0.6%) | 0 (0.0%) |
| 40 to 44 Minutes | 25 (3.9%) | 0 (0.0%) |
| 45 to 59 Minutes | 0 (0.0%) | 65 (13.6%) |
| 60 to 89 Minutes | 17 (2.6%) | 4 (0.8%) |
| 90 or more Minutes | 3 (0.5%) | 0 (0.0%) |
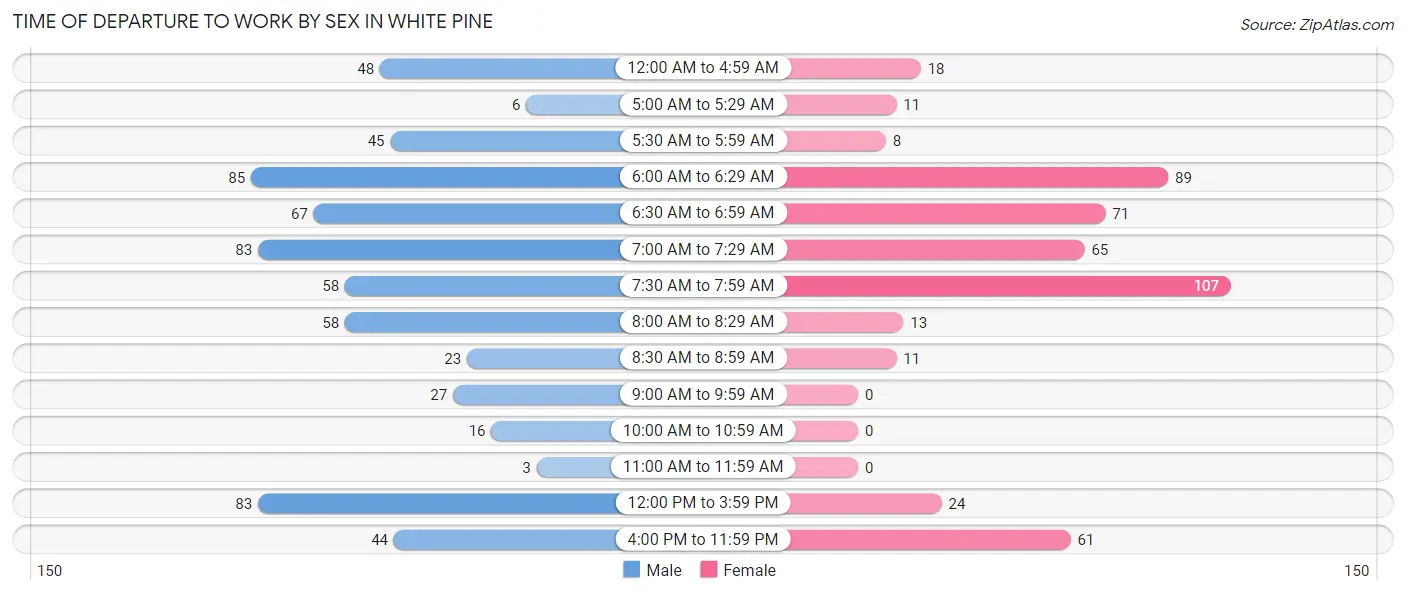
Time of Departure to Work by Sex in White Pine
The most frequent times of departure to work in White Pine are 6:00 AM to 6:29 AM (85, 13.2%) for males and 7:30 AM to 7:59 AM (107, 22.4%) for females.
| Time of Departure | Male | Female |
| 12:00 AM to 4:59 AM | 48 (7.4%) | 18 (3.8%) |
| 5:00 AM to 5:29 AM | 6 (0.9%) | 11 (2.3%) |
| 5:30 AM to 5:59 AM | 45 (7.0%) | 8 (1.7%) |
| 6:00 AM to 6:29 AM | 85 (13.2%) | 89 (18.6%) |
| 6:30 AM to 6:59 AM | 67 (10.4%) | 71 (14.8%) |
| 7:00 AM to 7:29 AM | 83 (12.9%) | 65 (13.6%) |
| 7:30 AM to 7:59 AM | 58 (9.0%) | 107 (22.4%) |
| 8:00 AM to 8:29 AM | 58 (9.0%) | 13 (2.7%) |
| 8:30 AM to 8:59 AM | 23 (3.6%) | 11 (2.3%) |
| 9:00 AM to 9:59 AM | 27 (4.2%) | 0 (0.0%) |
| 10:00 AM to 10:59 AM | 16 (2.5%) | 0 (0.0%) |
| 11:00 AM to 11:59 AM | 3 (0.5%) | 0 (0.0%) |
| 12:00 PM to 3:59 PM | 83 (12.9%) | 24 (5.0%) |
| 4:00 PM to 11:59 PM | 44 (6.8%) | 61 (12.8%) |
| Total | 646 (100.0%) | 478 (100.0%) |
Housing Occupancy in White Pine
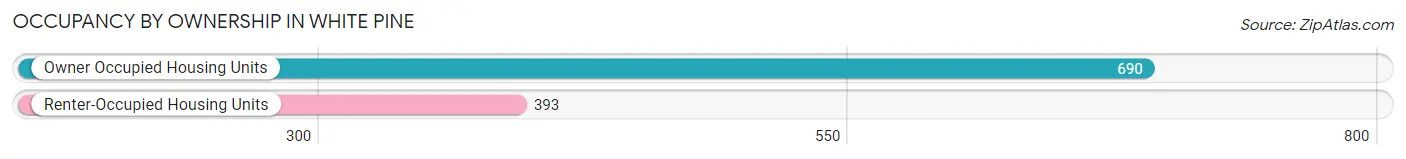
Occupancy by Ownership in White Pine
Of the total 1,083 dwellings in White Pine, owner-occupied units account for 690 (63.7%), while renter-occupied units make up 393 (36.3%).
| Occupancy | # Housing Units | % Housing Units |
| Owner Occupied Housing Units | 690 | 63.7% |
| Renter-Occupied Housing Units | 393 | 36.3% |
| Total Occupied Housing Units | 1,083 | 100.0% |
Occupancy by Household Size in White Pine
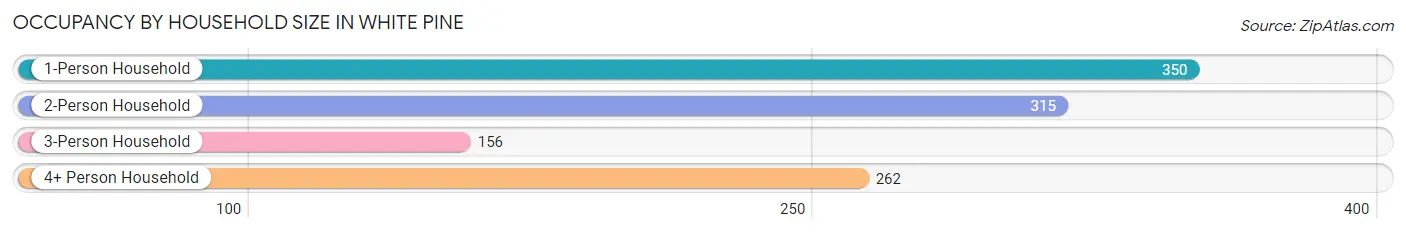
| Household Size | # Housing Units | % Housing Units |
| 1-Person Household | 350 | 32.3% |
| 2-Person Household | 315 | 29.1% |
| 3-Person Household | 156 | 14.4% |
| 4+ Person Household | 262 | 24.2% |
| Total Housing Units | 1,083 | 100.0% |
Occupancy by Ownership by Household Size in White Pine
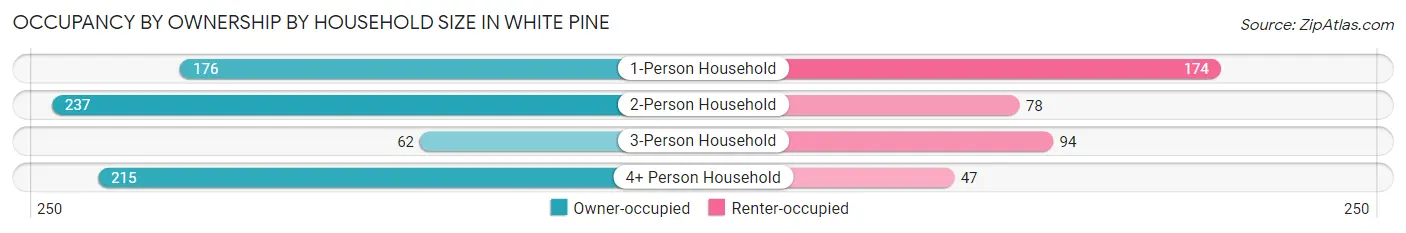
| Household Size | Owner-occupied | Renter-occupied |
| 1-Person Household | 176 (50.3%) | 174 (49.7%) |
| 2-Person Household | 237 (75.2%) | 78 (24.8%) |
| 3-Person Household | 62 (39.7%) | 94 (60.3%) |
| 4+ Person Household | 215 (82.1%) | 47 (17.9%) |
| Total Housing Units | 690 (63.7%) | 393 (36.3%) |
Occupancy by Educational Attainment in White Pine
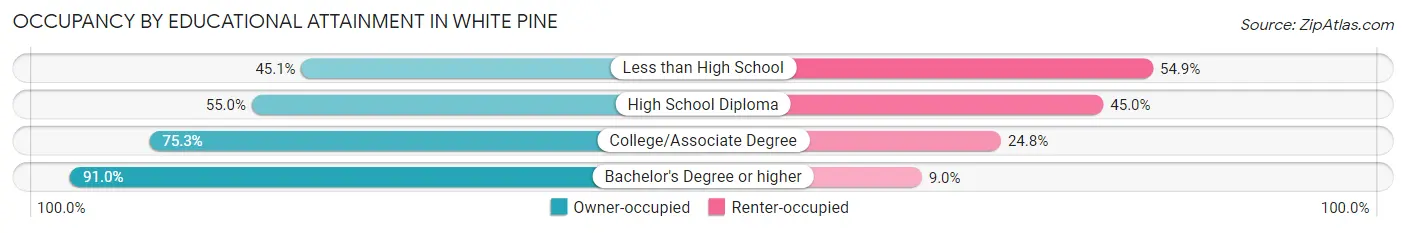
| Household Size | Owner-occupied | Renter-occupied |
| Less than High School | 60 (45.1%) | 73 (54.9%) |
| High School Diploma | 310 (55.0%) | 254 (45.0%) |
| College/Associate Degree | 149 (75.2%) | 49 (24.7%) |
| Bachelor's Degree or higher | 171 (91.0%) | 17 (9.0%) |
Occupancy by Age of Householder in White Pine
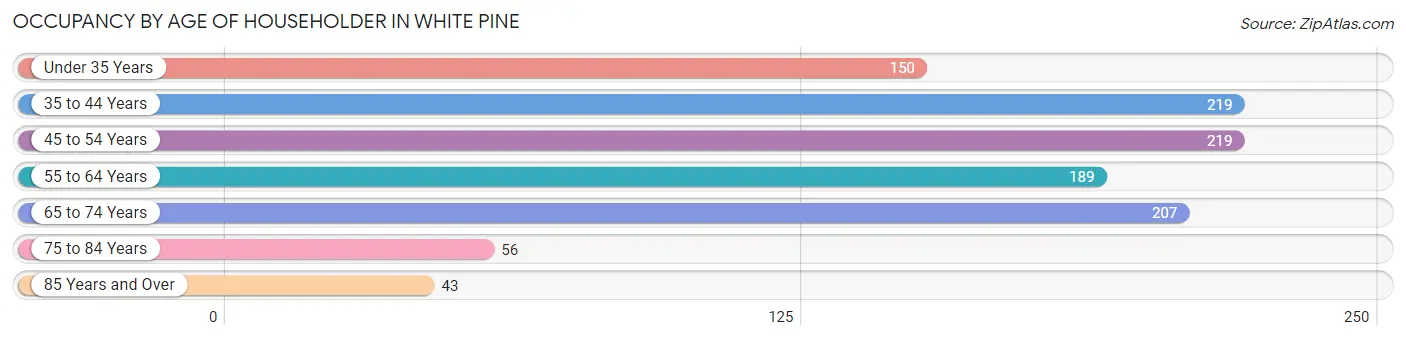
| Age Bracket | # Households | % Households |
| Under 35 Years | 150 | 13.9% |
| 35 to 44 Years | 219 | 20.2% |
| 45 to 54 Years | 219 | 20.2% |
| 55 to 64 Years | 189 | 17.4% |
| 65 to 74 Years | 207 | 19.1% |
| 75 to 84 Years | 56 | 5.2% |
| 85 Years and Over | 43 | 4.0% |
| Total | 1,083 | 100.0% |
Housing Finances in White Pine
Median Income by Occupancy in White Pine
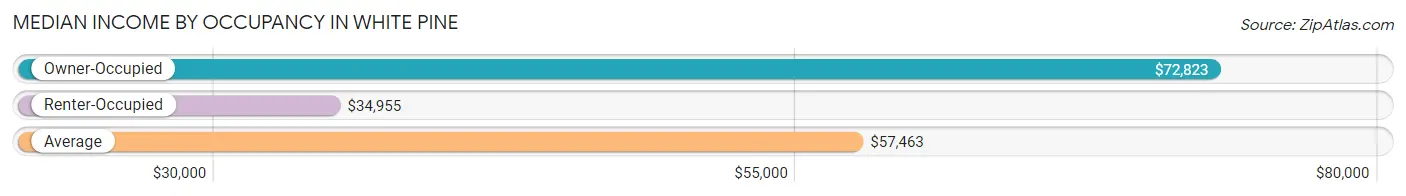
| Occupancy Type | # Households | Median Income |
| Owner-Occupied | 690 (63.7%) | $72,823 |
| Renter-Occupied | 393 (36.3%) | $34,955 |
| Average | 1,083 (100.0%) | $57,463 |
Occupancy by Householder Income Bracket in White Pine
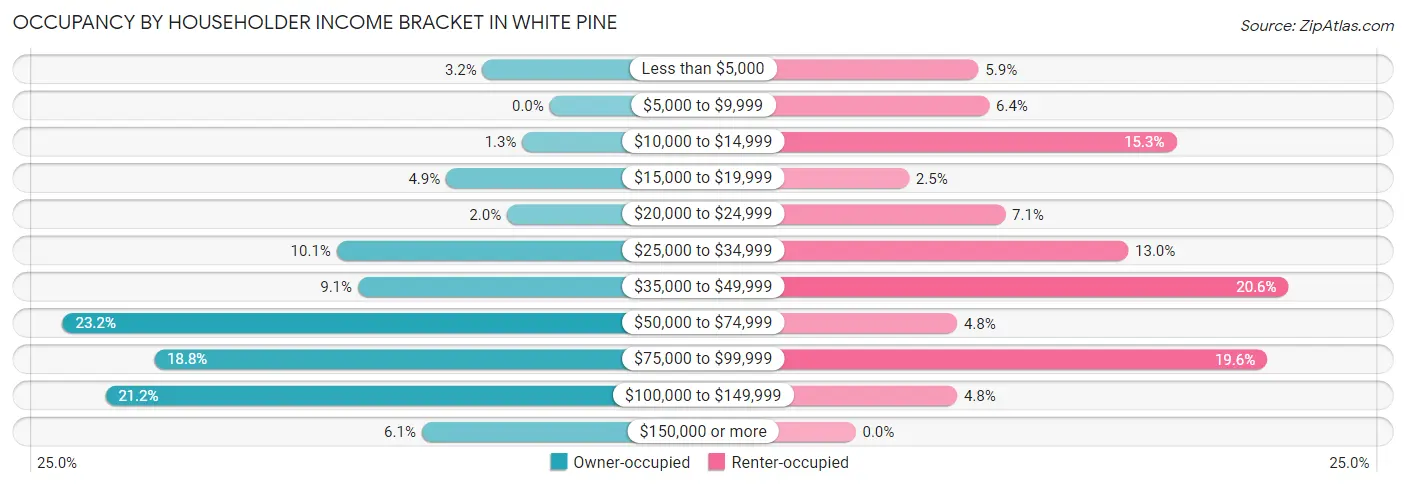
| Income Bracket | Owner-occupied | Renter-occupied |
| Less than $5,000 | 22 (3.2%) | 23 (5.9%) |
| $5,000 to $9,999 | 0 (0.0%) | 25 (6.4%) |
| $10,000 to $14,999 | 9 (1.3%) | 60 (15.3%) |
| $15,000 to $19,999 | 34 (4.9%) | 10 (2.5%) |
| $20,000 to $24,999 | 14 (2.0%) | 28 (7.1%) |
| $25,000 to $34,999 | 70 (10.1%) | 51 (13.0%) |
| $35,000 to $49,999 | 63 (9.1%) | 81 (20.6%) |
| $50,000 to $74,999 | 160 (23.2%) | 19 (4.8%) |
| $75,000 to $99,999 | 130 (18.8%) | 77 (19.6%) |
| $100,000 to $149,999 | 146 (21.2%) | 19 (4.8%) |
| $150,000 or more | 42 (6.1%) | 0 (0.0%) |
| Total | 690 (100.0%) | 393 (100.0%) |
Monthly Housing Cost Tiers in White Pine
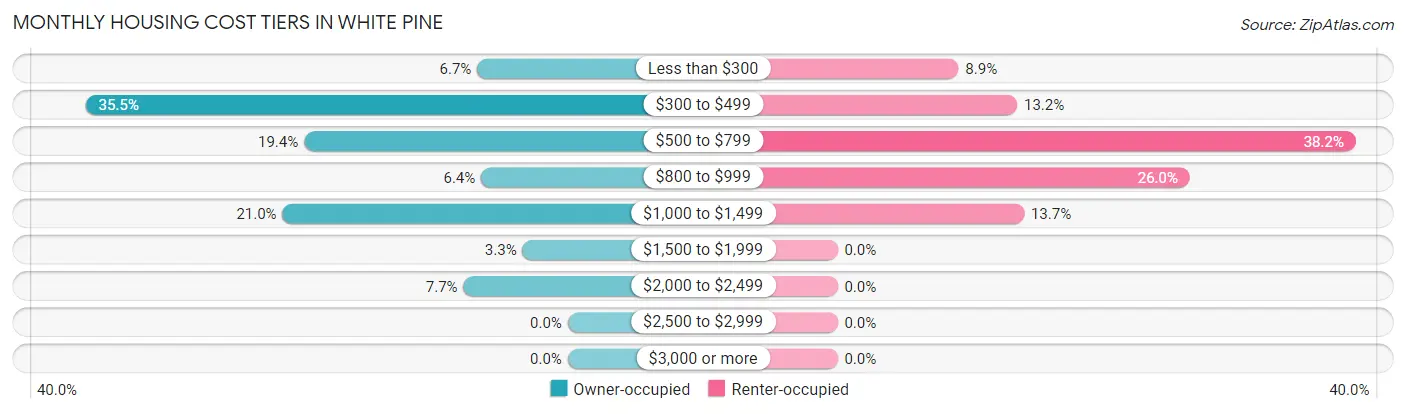
| Monthly Cost | Owner-occupied | Renter-occupied |
| Less than $300 | 46 (6.7%) | 35 (8.9%) |
| $300 to $499 | 245 (35.5%) | 52 (13.2%) |
| $500 to $799 | 134 (19.4%) | 150 (38.2%) |
| $800 to $999 | 44 (6.4%) | 102 (26.0%) |
| $1,000 to $1,499 | 145 (21.0%) | 54 (13.7%) |
| $1,500 to $1,999 | 23 (3.3%) | 0 (0.0%) |
| $2,000 to $2,499 | 53 (7.7%) | 0 (0.0%) |
| $2,500 to $2,999 | 0 (0.0%) | 0 (0.0%) |
| $3,000 or more | 0 (0.0%) | 0 (0.0%) |
| Total | 690 (100.0%) | 393 (100.0%) |
Physical Housing Characteristics in White Pine
Housing Structures in White Pine
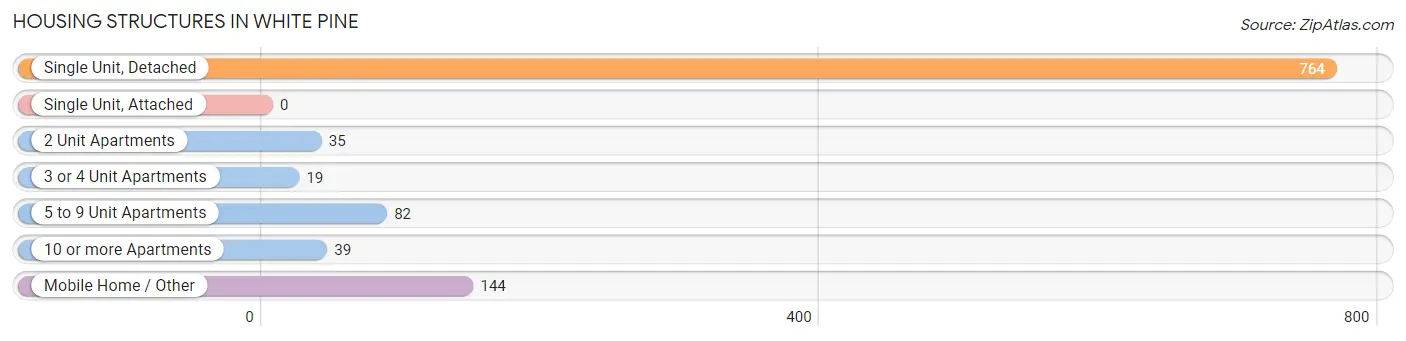
| Structure Type | # Housing Units | % Housing Units |
| Single Unit, Detached | 764 | 70.5% |
| Single Unit, Attached | 0 | 0.0% |
| 2 Unit Apartments | 35 | 3.2% |
| 3 or 4 Unit Apartments | 19 | 1.8% |
| 5 to 9 Unit Apartments | 82 | 7.6% |
| 10 or more Apartments | 39 | 3.6% |
| Mobile Home / Other | 144 | 13.3% |
| Total | 1,083 | 100.0% |
Housing Structures by Occupancy in White Pine
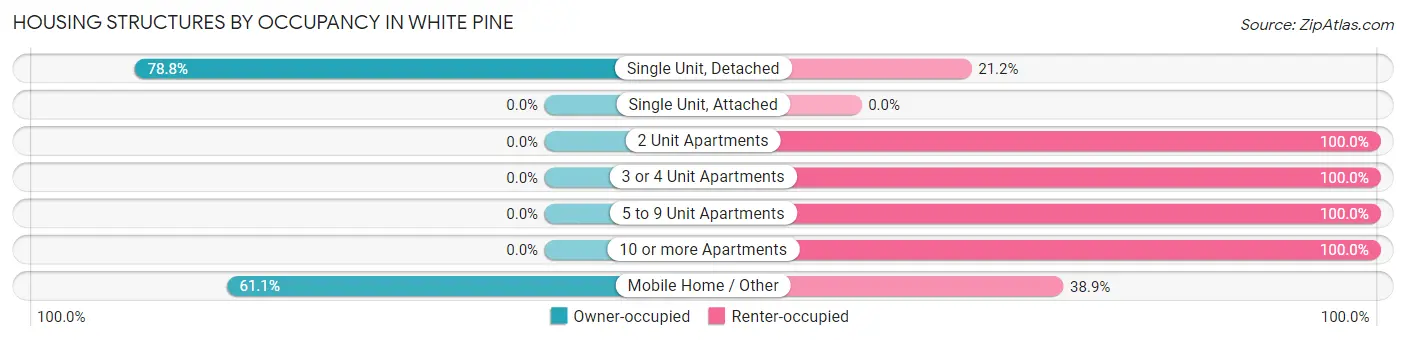
| Structure Type | Owner-occupied | Renter-occupied |
| Single Unit, Detached | 602 (78.8%) | 162 (21.2%) |
| Single Unit, Attached | 0 (0.0%) | 0 (0.0%) |
| 2 Unit Apartments | 0 (0.0%) | 35 (100.0%) |
| 3 or 4 Unit Apartments | 0 (0.0%) | 19 (100.0%) |
| 5 to 9 Unit Apartments | 0 (0.0%) | 82 (100.0%) |
| 10 or more Apartments | 0 (0.0%) | 39 (100.0%) |
| Mobile Home / Other | 88 (61.1%) | 56 (38.9%) |
| Total | 690 (63.7%) | 393 (36.3%) |
Housing Structures by Number of Rooms in White Pine
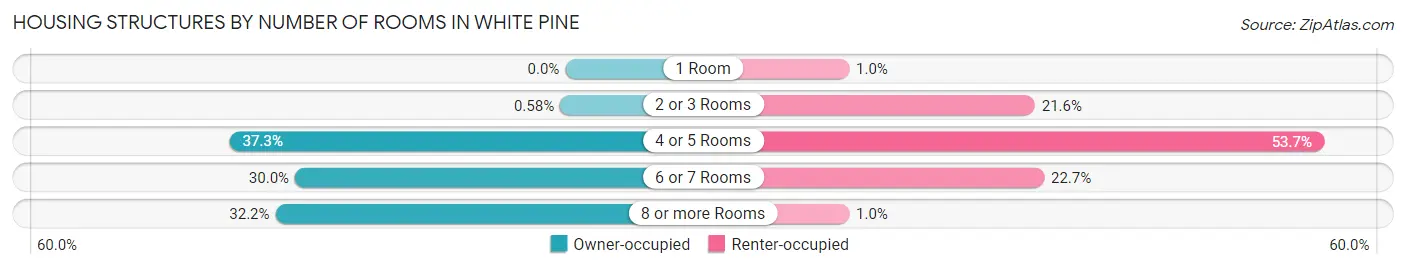
| Number of Rooms | Owner-occupied | Renter-occupied |
| 1 Room | 0 (0.0%) | 4 (1.0%) |
| 2 or 3 Rooms | 4 (0.6%) | 85 (21.6%) |
| 4 or 5 Rooms | 257 (37.2%) | 211 (53.7%) |
| 6 or 7 Rooms | 207 (30.0%) | 89 (22.7%) |
| 8 or more Rooms | 222 (32.2%) | 4 (1.0%) |
| Total | 690 (100.0%) | 393 (100.0%) |
Housing Structure by Heating Type in White Pine
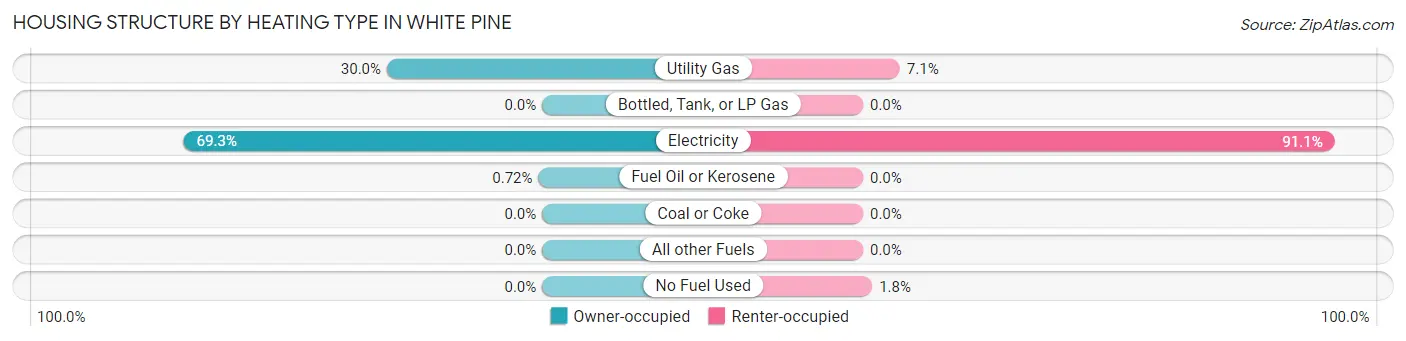
| Heating Type | Owner-occupied | Renter-occupied |
| Utility Gas | 207 (30.0%) | 28 (7.1%) |
| Bottled, Tank, or LP Gas | 0 (0.0%) | 0 (0.0%) |
| Electricity | 478 (69.3%) | 358 (91.1%) |
| Fuel Oil or Kerosene | 5 (0.7%) | 0 (0.0%) |
| Coal or Coke | 0 (0.0%) | 0 (0.0%) |
| All other Fuels | 0 (0.0%) | 0 (0.0%) |
| No Fuel Used | 0 (0.0%) | 7 (1.8%) |
| Total | 690 (100.0%) | 393 (100.0%) |
Household Vehicle Usage in White Pine
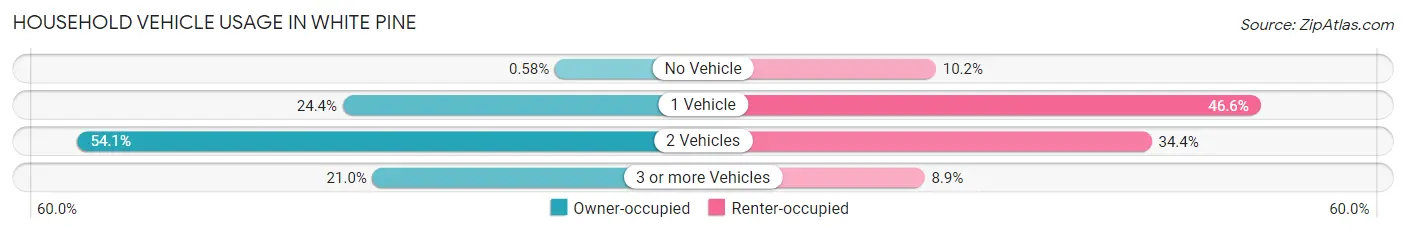
| Vehicles per Household | Owner-occupied | Renter-occupied |
| No Vehicle | 4 (0.6%) | 40 (10.2%) |
| 1 Vehicle | 168 (24.3%) | 183 (46.6%) |
| 2 Vehicles | 373 (54.1%) | 135 (34.4%) |
| 3 or more Vehicles | 145 (21.0%) | 35 (8.9%) |
| Total | 690 (100.0%) | 393 (100.0%) |
Real Estate & Mortgages in White Pine
Real Estate and Mortgage Overview in White Pine
| Characteristic | Without Mortgage | With Mortgage |
| Housing Units | 348 | 342 |
| Median Property Value | $163,000 | $154,700 |
| Median Household Income | $57,222 | $10 |
| Monthly Housing Costs | $389 | $0 |
| Real Estate Taxes | $931 | $13 |
Property Value by Mortgage Status in White Pine
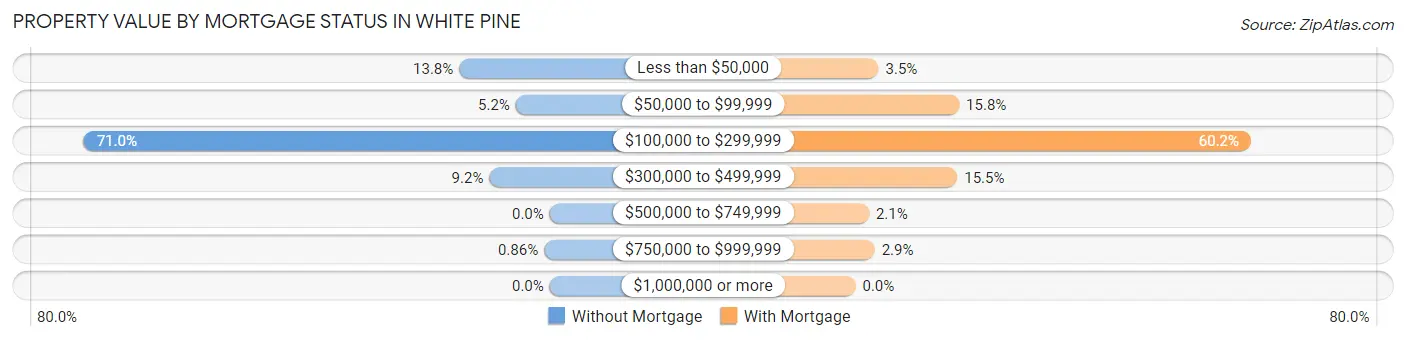
| Property Value | Without Mortgage | With Mortgage |
| Less than $50,000 | 48 (13.8%) | 12 (3.5%) |
| $50,000 to $99,999 | 18 (5.2%) | 54 (15.8%) |
| $100,000 to $299,999 | 247 (71.0%) | 206 (60.2%) |
| $300,000 to $499,999 | 32 (9.2%) | 53 (15.5%) |
| $500,000 to $749,999 | 0 (0.0%) | 7 (2.1%) |
| $750,000 to $999,999 | 3 (0.9%) | 10 (2.9%) |
| $1,000,000 or more | 0 (0.0%) | 0 (0.0%) |
| Total | 348 (100.0%) | 342 (100.0%) |
Household Income by Mortgage Status in White Pine
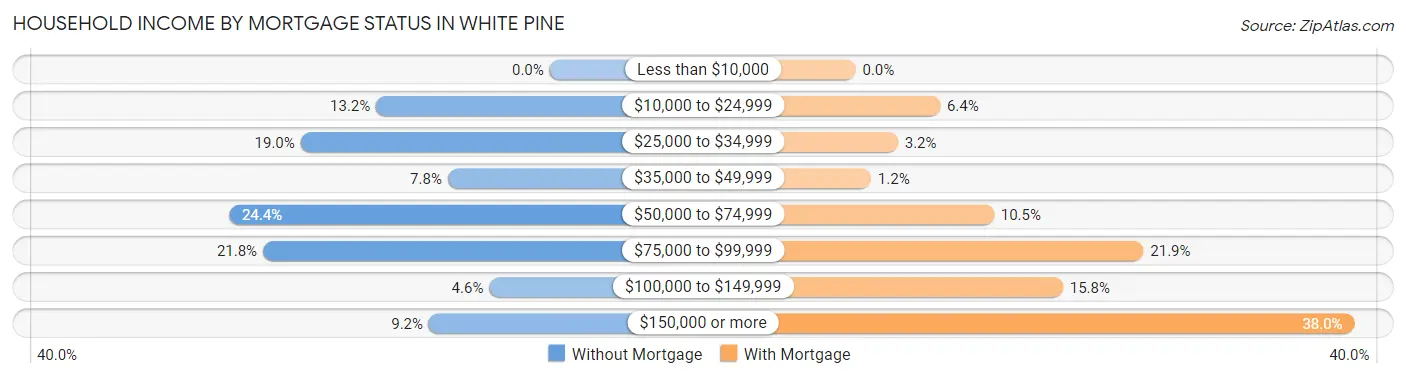
| Household Income | Without Mortgage | With Mortgage |
| Less than $10,000 | 0 (0.0%) | 0 (0.0%) |
| $10,000 to $24,999 | 46 (13.2%) | 22 (6.4%) |
| $25,000 to $34,999 | 66 (19.0%) | 11 (3.2%) |
| $35,000 to $49,999 | 27 (7.8%) | 4 (1.2%) |
| $50,000 to $74,999 | 85 (24.4%) | 36 (10.5%) |
| $75,000 to $99,999 | 76 (21.8%) | 75 (21.9%) |
| $100,000 to $149,999 | 16 (4.6%) | 54 (15.8%) |
| $150,000 or more | 32 (9.2%) | 130 (38.0%) |
| Total | 348 (100.0%) | 342 (100.0%) |
Property Value to Household Income Ratio in White Pine
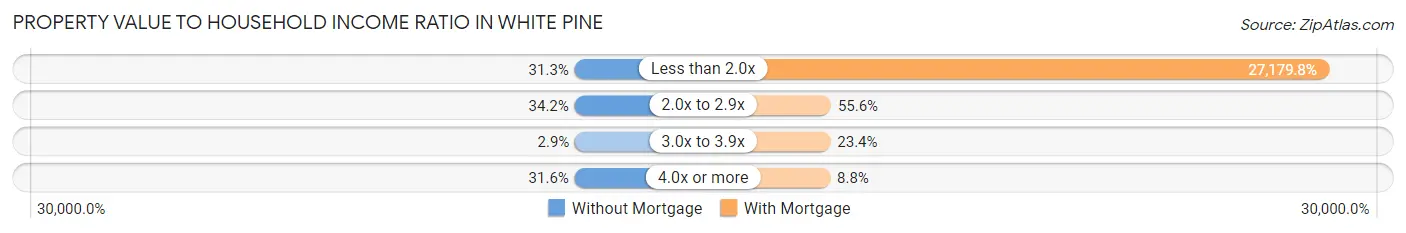
| Value-to-Income Ratio | Without Mortgage | With Mortgage |
| Less than 2.0x | 109 (31.3%) | 92,955 (27,179.8%) |
| 2.0x to 2.9x | 119 (34.2%) | 190 (55.6%) |
| 3.0x to 3.9x | 10 (2.9%) | 80 (23.4%) |
| 4.0x or more | 110 (31.6%) | 30 (8.8%) |
| Total | 348 (100.0%) | 342 (100.0%) |
Real Estate Taxes by Mortgage Status in White Pine
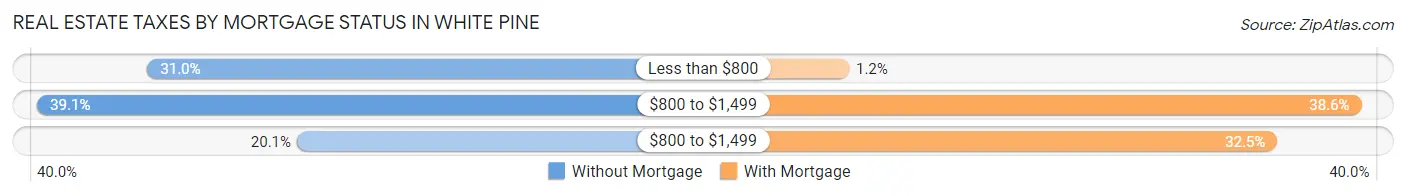
| Property Taxes | Without Mortgage | With Mortgage |
| Less than $800 | 108 (31.0%) | 4 (1.2%) |
| $800 to $1,499 | 136 (39.1%) | 132 (38.6%) |
| $800 to $1,499 | 70 (20.1%) | 111 (32.5%) |
| Total | 348 (100.0%) | 342 (100.0%) |
Health & Disability in White Pine
Health Insurance Coverage by Age in White Pine
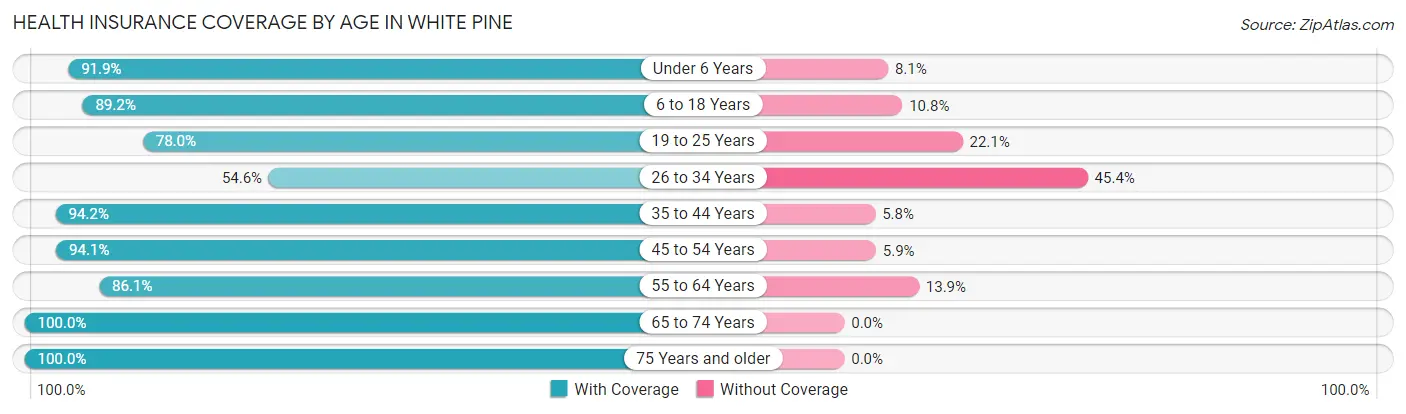
| Age Bracket | With Coverage | Without Coverage |
| Under 6 Years | 158 (91.9%) | 14 (8.1%) |
| 6 to 18 Years | 322 (89.2%) | 39 (10.8%) |
| 19 to 25 Years | 198 (77.9%) | 56 (22.1%) |
| 26 to 34 Years | 142 (54.6%) | 118 (45.4%) |
| 35 to 44 Years | 441 (94.2%) | 27 (5.8%) |
| 45 to 54 Years | 288 (94.1%) | 18 (5.9%) |
| 55 to 64 Years | 223 (86.1%) | 36 (13.9%) |
| 65 to 74 Years | 298 (100.0%) | 0 (0.0%) |
| 75 Years and older | 149 (100.0%) | 0 (0.0%) |
| Total | 2,219 (87.8%) | 308 (12.2%) |
Health Insurance Coverage by Citizenship Status in White Pine
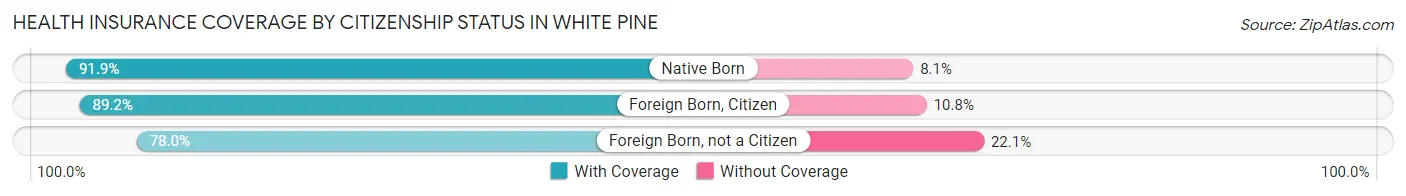
| Citizenship Status | With Coverage | Without Coverage |
| Native Born | 158 (91.9%) | 14 (8.1%) |
| Foreign Born, Citizen | 322 (89.2%) | 39 (10.8%) |
| Foreign Born, not a Citizen | 198 (77.9%) | 56 (22.1%) |
Health Insurance Coverage by Household Income in White Pine
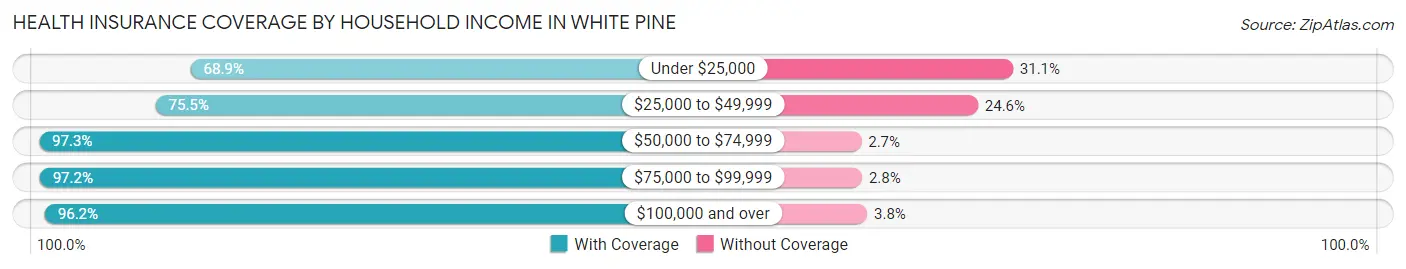
| Household Income | With Coverage | Without Coverage |
| Under $25,000 | 268 (68.9%) | 121 (31.1%) |
| $25,000 to $49,999 | 418 (75.4%) | 136 (24.5%) |
| $50,000 to $74,999 | 430 (97.3%) | 12 (2.7%) |
| $75,000 to $99,999 | 444 (97.2%) | 13 (2.8%) |
| $100,000 and over | 659 (96.2%) | 26 (3.8%) |
Public vs Private Health Insurance Coverage by Age in White Pine
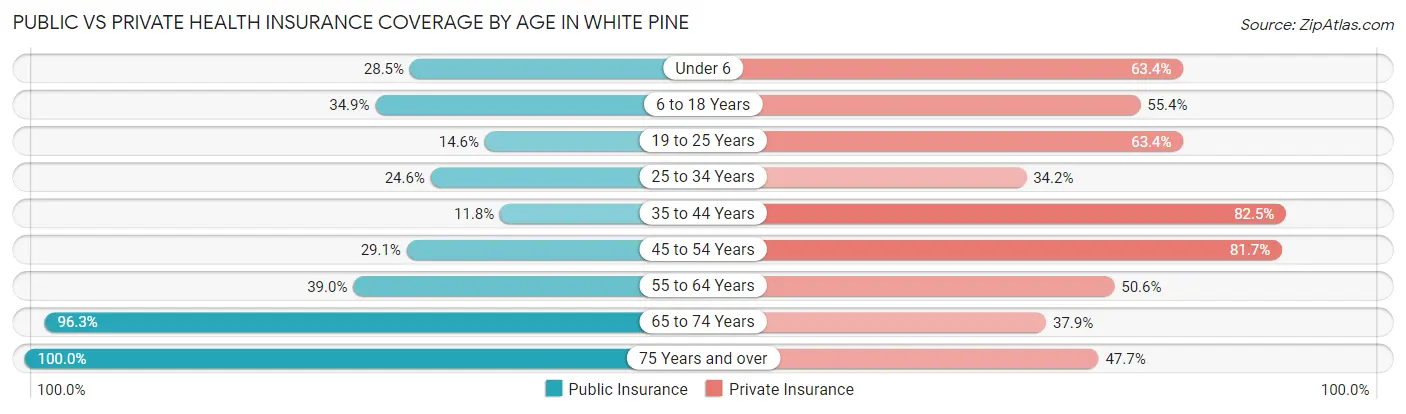
| Age Bracket | Public Insurance | Private Insurance |
| Under 6 | 49 (28.5%) | 109 (63.4%) |
| 6 to 18 Years | 126 (34.9%) | 200 (55.4%) |
| 19 to 25 Years | 37 (14.6%) | 161 (63.4%) |
| 25 to 34 Years | 64 (24.6%) | 89 (34.2%) |
| 35 to 44 Years | 55 (11.7%) | 386 (82.5%) |
| 45 to 54 Years | 89 (29.1%) | 250 (81.7%) |
| 55 to 64 Years | 101 (39.0%) | 131 (50.6%) |
| 65 to 74 Years | 287 (96.3%) | 113 (37.9%) |
| 75 Years and over | 149 (100.0%) | 71 (47.6%) |
| Total | 957 (37.9%) | 1,510 (59.8%) |
Disability Status by Sex by Age in White Pine
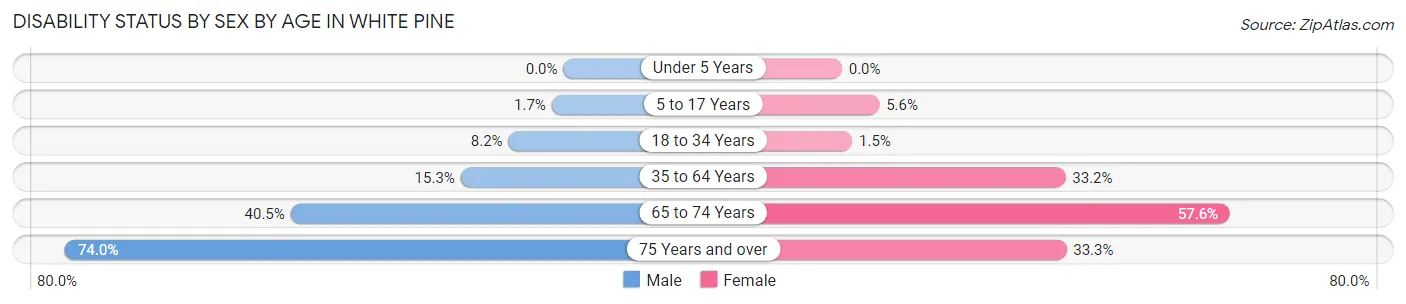
| Age Bracket | Male | Female |
| Under 5 Years | 0 (0.0%) | 0 (0.0%) |
| 5 to 17 Years | 4 (1.7%) | 9 (5.6%) |
| 18 to 34 Years | 27 (8.2%) | 3 (1.5%) |
| 35 to 64 Years | 79 (15.2%) | 171 (33.2%) |
| 65 to 74 Years | 49 (40.5%) | 102 (57.6%) |
| 75 Years and over | 37 (74.0%) | 33 (33.3%) |
Disability Class by Sex by Age in White Pine
Disability Class: Hearing Difficulty
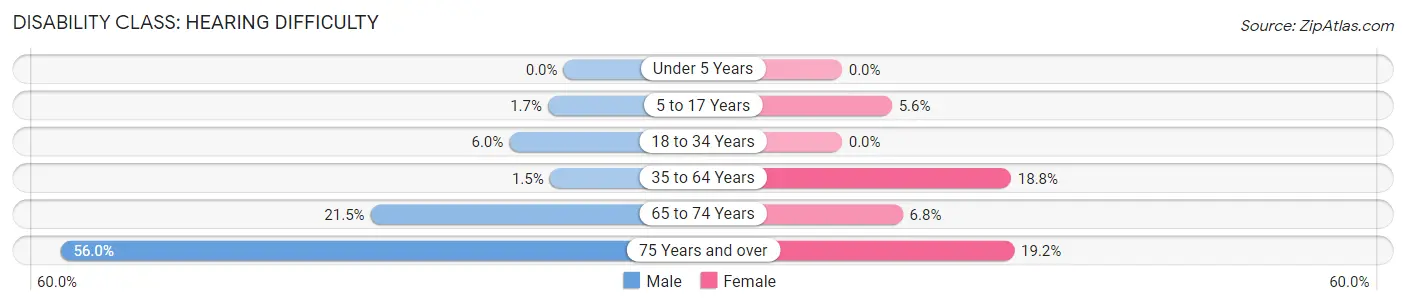
| Age Bracket | Male | Female |
| Under 5 Years | 0 (0.0%) | 0 (0.0%) |
| 5 to 17 Years | 4 (1.7%) | 9 (5.6%) |
| 18 to 34 Years | 20 (6.0%) | 0 (0.0%) |
| 35 to 64 Years | 8 (1.5%) | 97 (18.8%) |
| 65 to 74 Years | 26 (21.5%) | 12 (6.8%) |
| 75 Years and over | 28 (56.0%) | 19 (19.2%) |
Disability Class: Vision Difficulty
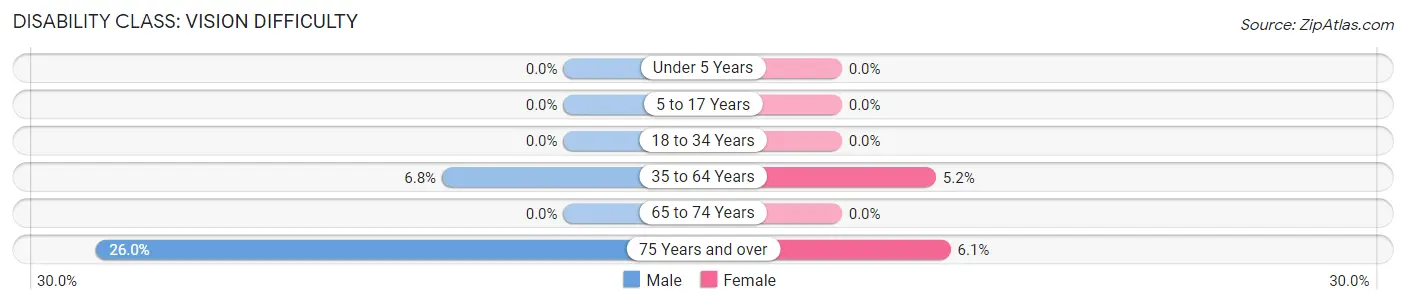
| Age Bracket | Male | Female |
| Under 5 Years | 0 (0.0%) | 0 (0.0%) |
| 5 to 17 Years | 0 (0.0%) | 0 (0.0%) |
| 18 to 34 Years | 0 (0.0%) | 0 (0.0%) |
| 35 to 64 Years | 35 (6.8%) | 27 (5.2%) |
| 65 to 74 Years | 0 (0.0%) | 0 (0.0%) |
| 75 Years and over | 13 (26.0%) | 6 (6.1%) |
Disability Class: Cognitive Difficulty
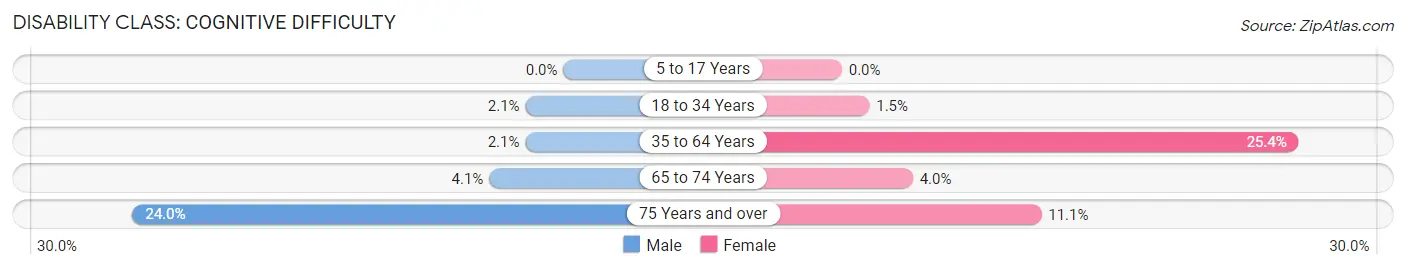
| Age Bracket | Male | Female |
| 5 to 17 Years | 0 (0.0%) | 0 (0.0%) |
| 18 to 34 Years | 7 (2.1%) | 3 (1.5%) |
| 35 to 64 Years | 11 (2.1%) | 131 (25.4%) |
| 65 to 74 Years | 5 (4.1%) | 7 (4.0%) |
| 75 Years and over | 12 (24.0%) | 11 (11.1%) |
Disability Class: Ambulatory Difficulty
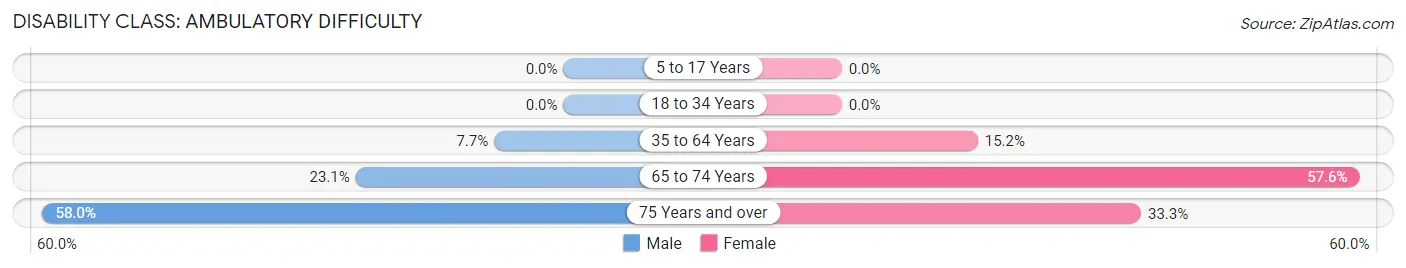
| Age Bracket | Male | Female |
| 5 to 17 Years | 0 (0.0%) | 0 (0.0%) |
| 18 to 34 Years | 0 (0.0%) | 0 (0.0%) |
| 35 to 64 Years | 40 (7.7%) | 78 (15.1%) |
| 65 to 74 Years | 28 (23.1%) | 102 (57.6%) |
| 75 Years and over | 29 (58.0%) | 33 (33.3%) |
Disability Class: Self-Care Difficulty
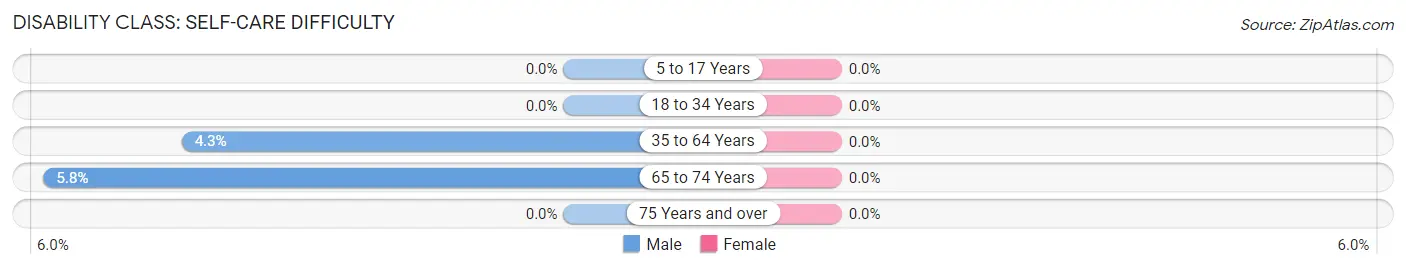
| Age Bracket | Male | Female |
| 5 to 17 Years | 0 (0.0%) | 0 (0.0%) |
| 18 to 34 Years | 0 (0.0%) | 0 (0.0%) |
| 35 to 64 Years | 22 (4.3%) | 0 (0.0%) |
| 65 to 74 Years | 7 (5.8%) | 0 (0.0%) |
| 75 Years and over | 0 (0.0%) | 0 (0.0%) |
Technology Access in White Pine
Computing Device Access in White Pine
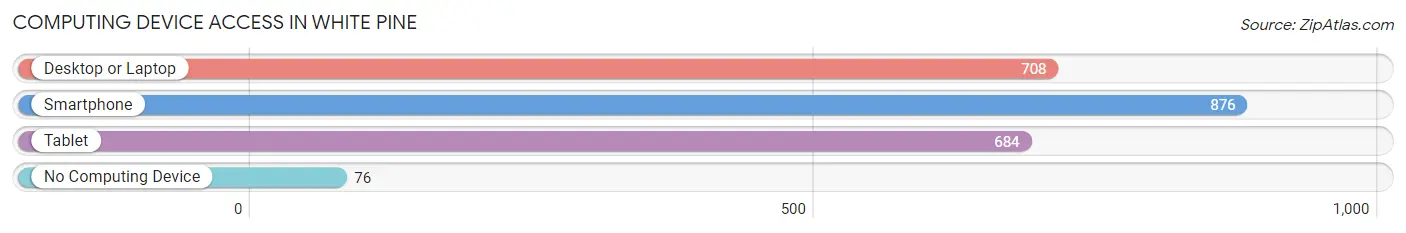
| Device Type | # Households | % Households |
| Desktop or Laptop | 708 | 65.4% |
| Smartphone | 876 | 80.9% |
| Tablet | 684 | 63.2% |
| No Computing Device | 76 | 7.0% |
| Total | 1,083 | 100.0% |
Internet Access in White Pine
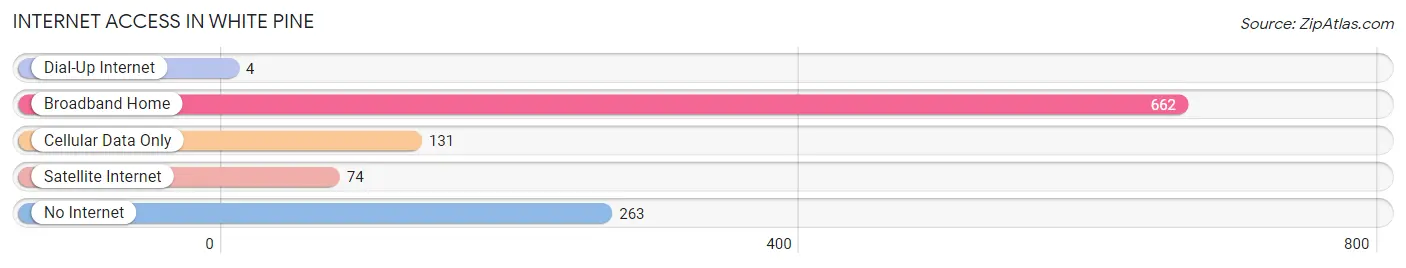
| Internet Type | # Households | % Households |
| Dial-Up Internet | 4 | 0.4% |
| Broadband Home | 662 | 61.1% |
| Cellular Data Only | 131 | 12.1% |
| Satellite Internet | 74 | 6.8% |
| No Internet | 263 | 24.3% |
| Total | 1,083 | 100.0% |
White Pine Summary
History
White Pine is a small town located in Jefferson County, Tennessee. It is situated in the foothills of the Great Smoky Mountains, and is part of the Knoxville metropolitan area. The town was founded in 1820 by settlers from North Carolina, and was originally known as White Pine Flats. The town was named after the white pine trees that grew in the area.
The town was initially a farming community, and the main crops were corn, wheat, and tobacco. The town also had a sawmill and a gristmill. In the late 19th century, the town began to grow as a result of the railroad. The railroad brought new businesses and industries to the area, and the town began to prosper.
In the early 20th century, White Pine became a popular tourist destination. The town was known for its scenic beauty and its proximity to the Great Smoky Mountains National Park. The town also had a number of resorts and hotels, which attracted visitors from all over the country.
Geography
White Pine is located in the foothills of the Great Smoky Mountains, in the eastern part of Jefferson County. The town is situated at an elevation of 1,000 feet above sea level. The town is located near the French Broad River, and is surrounded by the Cherokee National Forest.
The town has a total area of 2.2 square miles, all of which is land. The town is located about 25 miles east of Knoxville, and about 50 miles west of Asheville, North Carolina.
Economy
White Pine has a diverse economy, with a mix of agriculture, manufacturing, and tourism. The town is home to several small businesses, including a sawmill, a gristmill, and a number of restaurants and shops.
The town is also home to a number of tourist attractions, including the Great Smoky Mountains National Park, the Appalachian Trail, and the White Pine Scenic Byway. The town is also home to a number of resorts and hotels, which attract visitors from all over the country.
Demographics
As of the 2010 census, White Pine had a population of 1,845. The racial makeup of the town was 95.3% White, 0.9% African American, 0.3% Native American, 0.2% Asian, 0.1% Pacific Islander, and 2.2% from other races. Hispanic or Latino of any race were 1.7% of the population.
The median household income in White Pine was $35,938, and the median family income was $41,250. The per capita income for the town was $17,845. About 15.3% of families and 18.2% of the population were below the poverty line, including 25.2% of those under age 18 and 11.2% of those age 65 or over.
Common Questions
What is Per Capita Income in White Pine?
Per Capita income in White Pine is $29,718.
What is the Median Family Income in White Pine?
Median Family Income in White Pine is $73,456.
What is the Median Household income in White Pine?
Median Household Income in White Pine is $57,463.
What is Income or Wage Gap in White Pine?
Income or Wage Gap in White Pine is 7.7%.
Women in White Pine earn 92.3 cents for every dollar earned by a man.
What is Inequality or Gini Index in White Pine?
Inequality or Gini Index in White Pine is 0.40.
What is the Total Population of White Pine?
Total Population of White Pine is 2,527.
What is the Total Male Population of White Pine?
Total Male Population of White Pine is 1,341.
What is the Total Female Population of White Pine?
Total Female Population of White Pine is 1,186.
What is the Ratio of Males per 100 Females in White Pine?
There are 113.07 Males per 100 Females in White Pine.
What is the Ratio of Females per 100 Males in White Pine?
There are 88.44 Females per 100 Males in White Pine.
What is the Median Population Age in White Pine?
Median Population Age in White Pine is 38.9 Years.
What is the Average Family Size in White Pine
Average Family Size in White Pine is 2.9 People.
What is the Average Household Size in White Pine
Average Household Size in White Pine is 2.3 People.
How Large is the Labor Force in White Pine?
There are 1,335 People in the Labor Forcein in White Pine.
What is the Percentage of People in the Labor Force in White Pine?
65.1% of People are in the Labor Force in White Pine.
What is the Unemployment Rate in White Pine?
Unemployment Rate in White Pine is 6.1%.