Lynchburg, TN Map & Demographics
Lynchburg Overview
$35,178
PER CAPITA INCOME
$82,391
AVG FAMILY INCOME
$69,250
AVG HOUSEHOLD INCOME
30.8%
WAGE / INCOME GAP [ % ]
69.2¢/ $1
WAGE / INCOME GAP [ $ ]
0.43
INEQUALITY / GINI INDEX
6,558
TOTAL POPULATION
3,270
MALE POPULATION
3,288
FEMALE POPULATION
99.45
MALES / 100 FEMALES
100.55
FEMALES / 100 MALES
46.4
MEDIAN AGE
3.0
AVG FAMILY SIZE
2.5
AVG HOUSEHOLD SIZE
3,097
LABOR FORCE [ PEOPLE ]
56.7%
PERCENT IN LABOR FORCE
4.2%
UNEMPLOYMENT RATE
Lynchburg Zip Codes
Lynchburg Area Codes
Income in Lynchburg
Income Overview in Lynchburg
Per Capita Income in Lynchburg is $35,178, while median incomes of families and households are $82,391 and $69,250 respectively.
| Characteristic | Number | Measure |
| Per Capita Income | 6,558 | $35,178 |
| Median Family Income | 1,810 | $82,391 |
| Mean Family Income | 1,810 | $100,901 |
| Median Household Income | 2,558 | $69,250 |
| Mean Household Income | 2,558 | $86,601 |
| Income Deficit | 1,810 | $0 |
| Wage / Income Gap (%) | 6,558 | 30.79% |
| Wage / Income Gap ($) | 6,558 | 69.21¢ per $1 |
| Gini / Inequality Index | 6,558 | 0.43 |
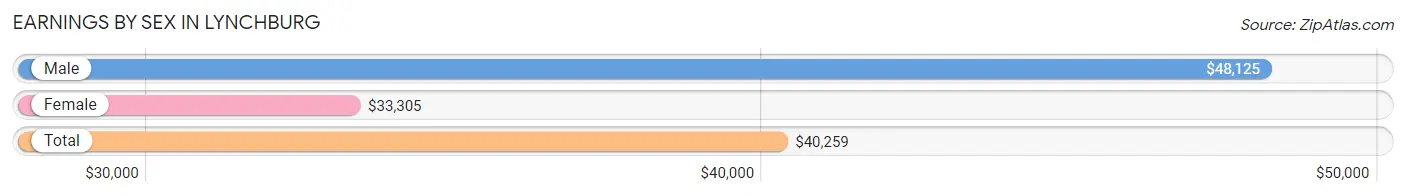
Earnings by Sex in Lynchburg
Average Earnings in Lynchburg are $40,259, $48,125 for men and $33,305 for women, a difference of 30.8%.
| Sex | Number | Average Earnings |
| Male | 1,773 (54.0%) | $48,125 |
| Female | 1,512 (46.0%) | $33,305 |
| Total | 3,285 (100.0%) | $40,259 |
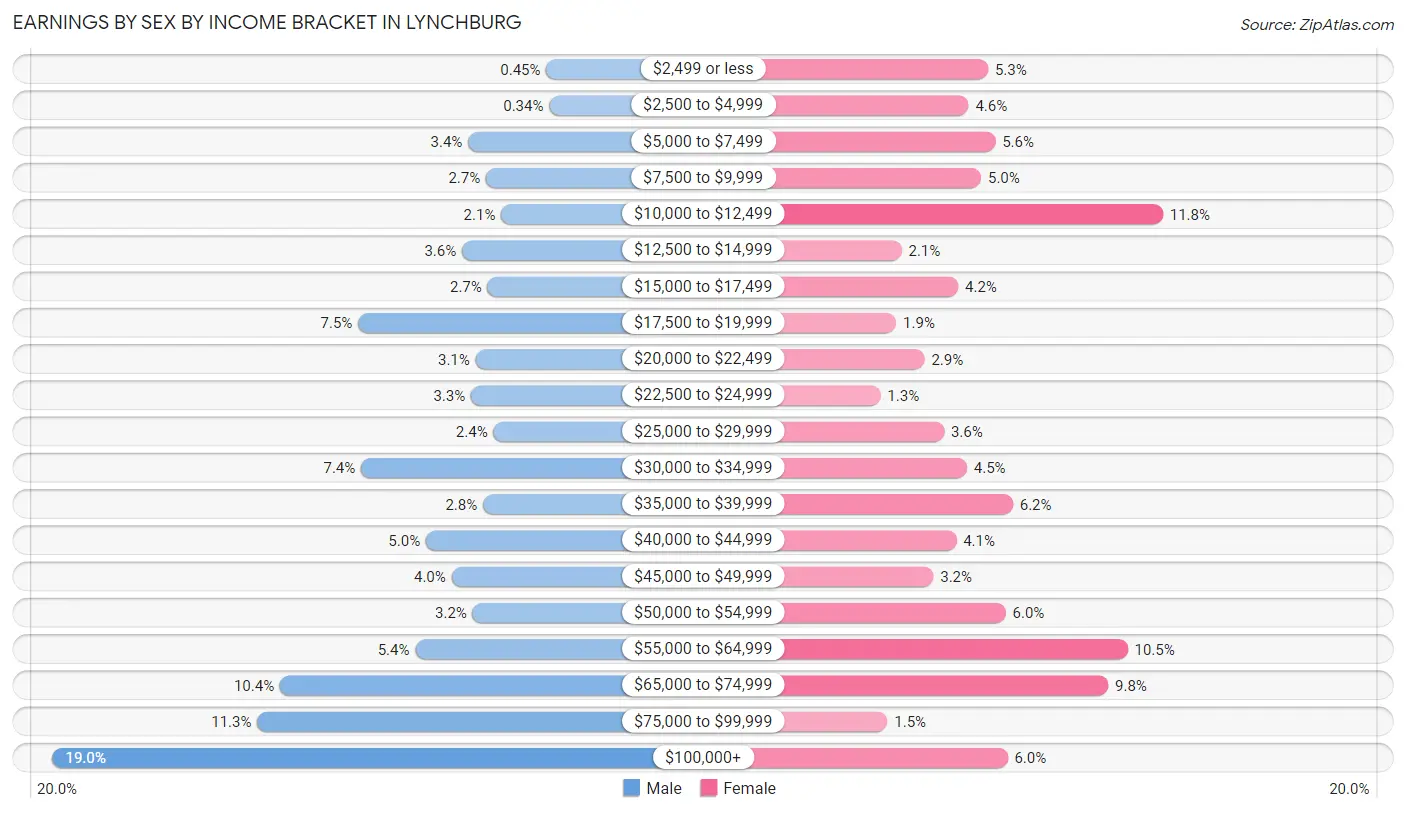
Earnings by Sex by Income Bracket in Lynchburg
The most common earnings brackets in Lynchburg are $100,000+ for men (336 | 19.0%) and $10,000 to $12,499 for women (179 | 11.8%).
| Income | Male | Female |
| $2,499 or less | 8 (0.4%) | 80 (5.3%) |
| $2,500 to $4,999 | 6 (0.3%) | 69 (4.6%) |
| $5,000 to $7,499 | 60 (3.4%) | 84 (5.6%) |
| $7,500 to $9,999 | 48 (2.7%) | 76 (5.0%) |
| $10,000 to $12,499 | 38 (2.1%) | 179 (11.8%) |
| $12,500 to $14,999 | 64 (3.6%) | 31 (2.1%) |
| $15,000 to $17,499 | 47 (2.6%) | 63 (4.2%) |
| $17,500 to $19,999 | 133 (7.5%) | 28 (1.8%) |
| $20,000 to $22,499 | 55 (3.1%) | 44 (2.9%) |
| $22,500 to $24,999 | 58 (3.3%) | 19 (1.3%) |
| $25,000 to $29,999 | 43 (2.4%) | 55 (3.6%) |
| $30,000 to $34,999 | 131 (7.4%) | 68 (4.5%) |
| $35,000 to $39,999 | 50 (2.8%) | 94 (6.2%) |
| $40,000 to $44,999 | 88 (5.0%) | 62 (4.1%) |
| $45,000 to $49,999 | 71 (4.0%) | 49 (3.2%) |
| $50,000 to $54,999 | 57 (3.2%) | 90 (5.9%) |
| $55,000 to $64,999 | 95 (5.4%) | 159 (10.5%) |
| $65,000 to $74,999 | 185 (10.4%) | 148 (9.8%) |
| $75,000 to $99,999 | 200 (11.3%) | 23 (1.5%) |
| $100,000+ | 336 (19.0%) | 91 (6.0%) |
| Total | 1,773 (100.0%) | 1,512 (100.0%) |
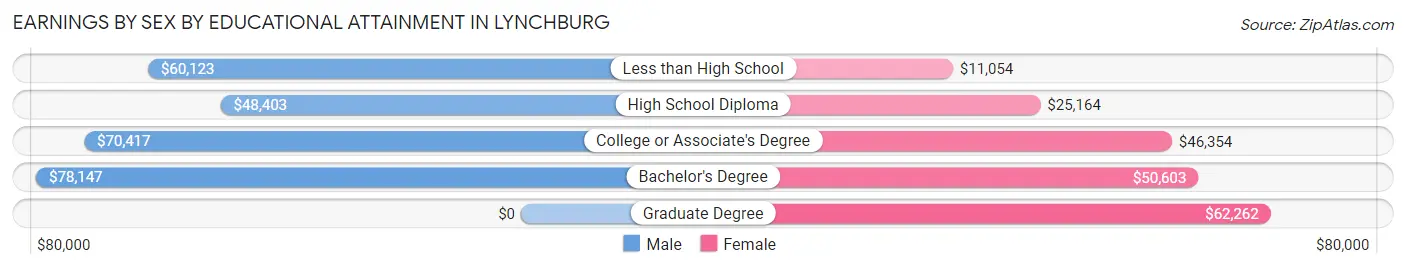
Earnings by Sex by Educational Attainment in Lynchburg
Average earnings in Lynchburg are $61,885 for men and $38,273 for women, a difference of 38.2%. Men with an educational attainment of bachelor's degree enjoy the highest average annual earnings of $78,147, while those with high school diploma education earn the least with $48,403. Women with an educational attainment of graduate degree earn the most with the average annual earnings of $62,262, while those with less than high school education have the smallest earnings of $11,054.
| Educational Attainment | Male Income | Female Income |
| Less than High School | $60,123 | $11,054 |
| High School Diploma | $48,403 | $25,164 |
| College or Associate's Degree | $70,417 | $46,354 |
| Bachelor's Degree | $78,147 | $50,603 |
| Graduate Degree | - | - |
| Total | $61,885 | $38,273 |
Family Income in Lynchburg
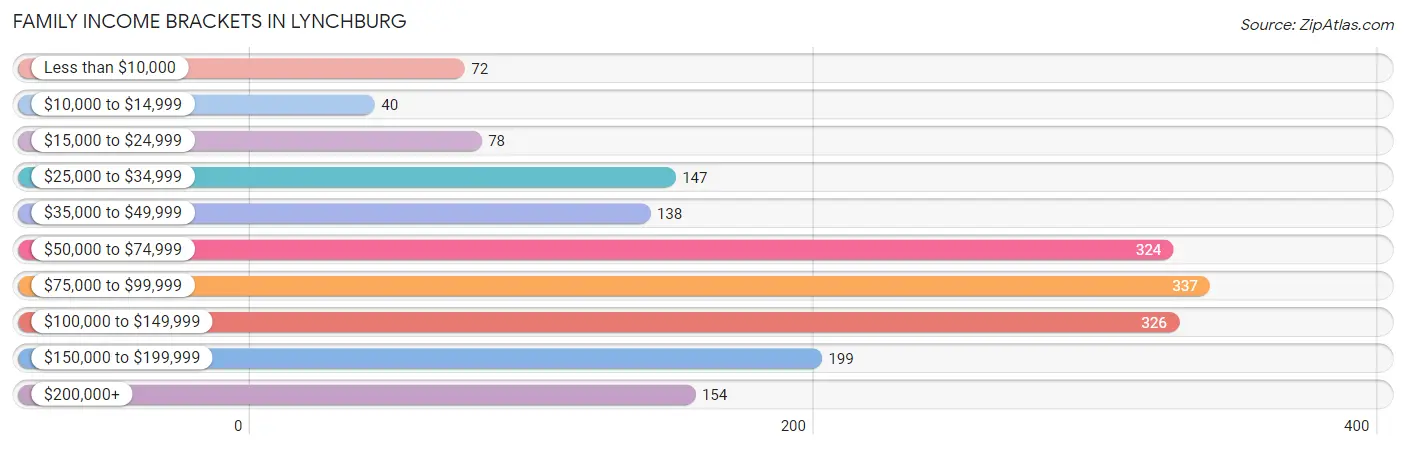
Family Income Brackets in Lynchburg
According to the Lynchburg family income data, there are 337 families falling into the $75,000 to $99,999 income range, which is the most common income bracket and makes up 18.6% of all families. Conversely, the $10,000 to $14,999 income bracket is the least frequent group with only 40 families (2.2%) belonging to this category.
| Income Bracket | # Families | % Families |
| Less than $10,000 | 72 | 4.0% |
| $10,000 to $14,999 | 40 | 2.2% |
| $15,000 to $24,999 | 78 | 4.3% |
| $25,000 to $34,999 | 147 | 8.1% |
| $35,000 to $49,999 | 138 | 7.6% |
| $50,000 to $74,999 | 324 | 17.9% |
| $75,000 to $99,999 | 337 | 18.6% |
| $100,000 to $149,999 | 326 | 18.0% |
| $150,000 to $199,999 | 199 | 11.0% |
| $200,000+ | 154 | 8.5% |
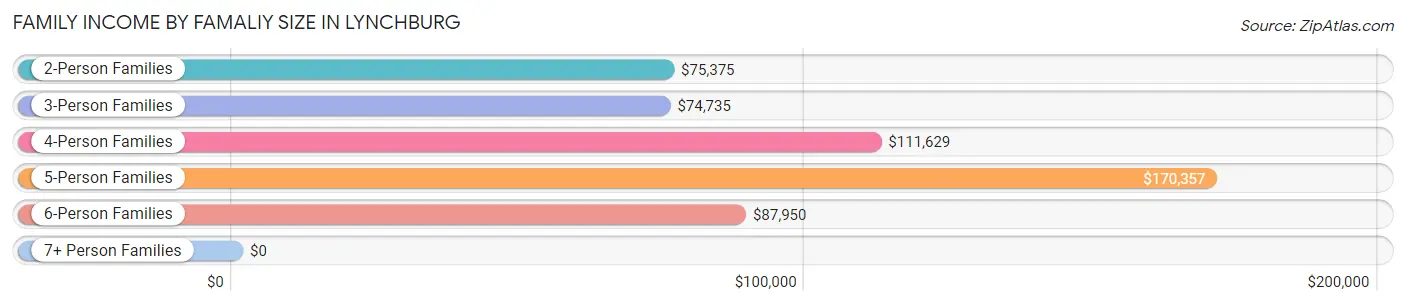
Family Income by Famaliy Size in Lynchburg
5-person families (46 | 2.5%) account for the highest median family income in Lynchburg with $170,357 per family, while 2-person families (994 | 54.9%) have the highest median income of $37,688 per family member.
| Income Bracket | # Families | Median Income |
| 2-Person Families | 994 (54.9%) | $75,375 |
| 3-Person Families | 375 (20.7%) | $74,735 |
| 4-Person Families | 299 (16.5%) | $111,629 |
| 5-Person Families | 46 (2.5%) | $170,357 |
| 6-Person Families | 69 (3.8%) | $87,950 |
| 7+ Person Families | 27 (1.5%) | $0 |
| Total | 1,810 (100.0%) | $82,391 |
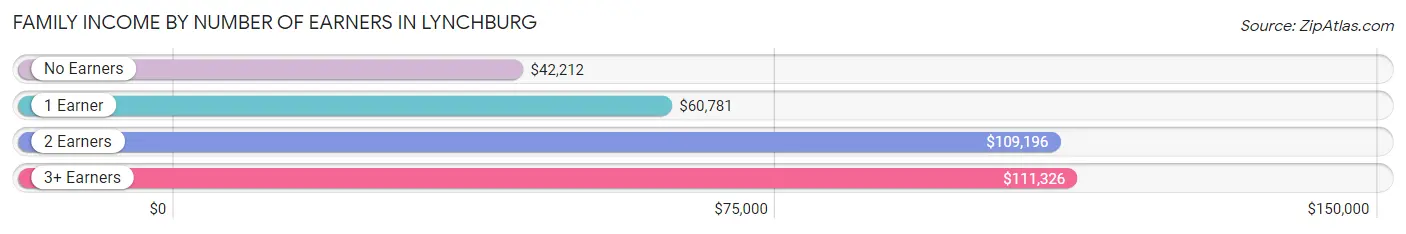
Family Income by Number of Earners in Lynchburg
The median family income in Lynchburg is $82,391, with families comprising 3+ earners (115) having the highest median family income of $111,326, while families with no earners (407) have the lowest median family income of $42,212, accounting for 6.4% and 22.5% of families, respectively.
| Number of Earners | # Families | Median Income |
| No Earners | 407 (22.5%) | $42,212 |
| 1 Earner | 474 (26.2%) | $60,781 |
| 2 Earners | 814 (45.0%) | $109,196 |
| 3+ Earners | 115 (6.4%) | $111,326 |
| Total | 1,810 (100.0%) | $82,391 |
Household Income in Lynchburg
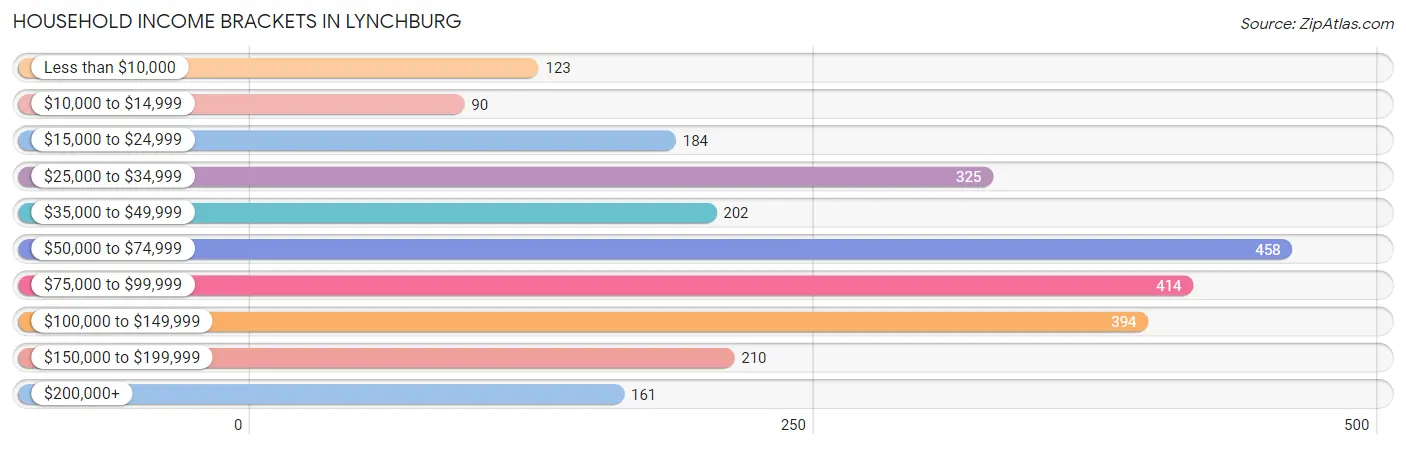
Household Income Brackets in Lynchburg
With 458 households falling in the category, the $50,000 to $74,999 income range is the most frequent in Lynchburg, accounting for 17.9% of all households. In contrast, only 90 households (3.5%) fall into the $10,000 to $14,999 income bracket, making it the least populous group.
| Income Bracket | # Households | % Households |
| Less than $10,000 | 123 | 4.8% |
| $10,000 to $14,999 | 90 | 3.5% |
| $15,000 to $24,999 | 184 | 7.2% |
| $25,000 to $34,999 | 325 | 12.7% |
| $35,000 to $49,999 | 202 | 7.9% |
| $50,000 to $74,999 | 458 | 17.9% |
| $75,000 to $99,999 | 414 | 16.2% |
| $100,000 to $149,999 | 394 | 15.4% |
| $150,000 to $199,999 | 210 | 8.2% |
| $200,000+ | 161 | 6.3% |
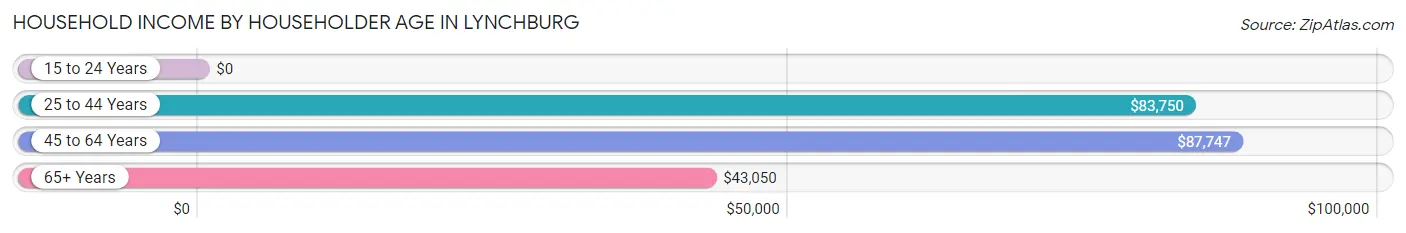
Household Income by Householder Age in Lynchburg
The median household income in Lynchburg is $69,250, with the highest median household income of $87,747 found in the 45 to 64 years age bracket for the primary householder. A total of 1,085 households (42.4%) fall into this category. Meanwhile, the 15 to 24 years age bracket for the primary householder has the lowest median household income of $0, with 66 households (2.6%) in this group.
| Income Bracket | # Households | Median Income |
| 15 to 24 Years | 66 (2.6%) | $0 |
| 25 to 44 Years | 556 (21.7%) | $83,750 |
| 45 to 64 Years | 1,085 (42.4%) | $87,747 |
| 65+ Years | 851 (33.3%) | $43,050 |
| Total | 2,558 (100.0%) | $69,250 |
Poverty in Lynchburg
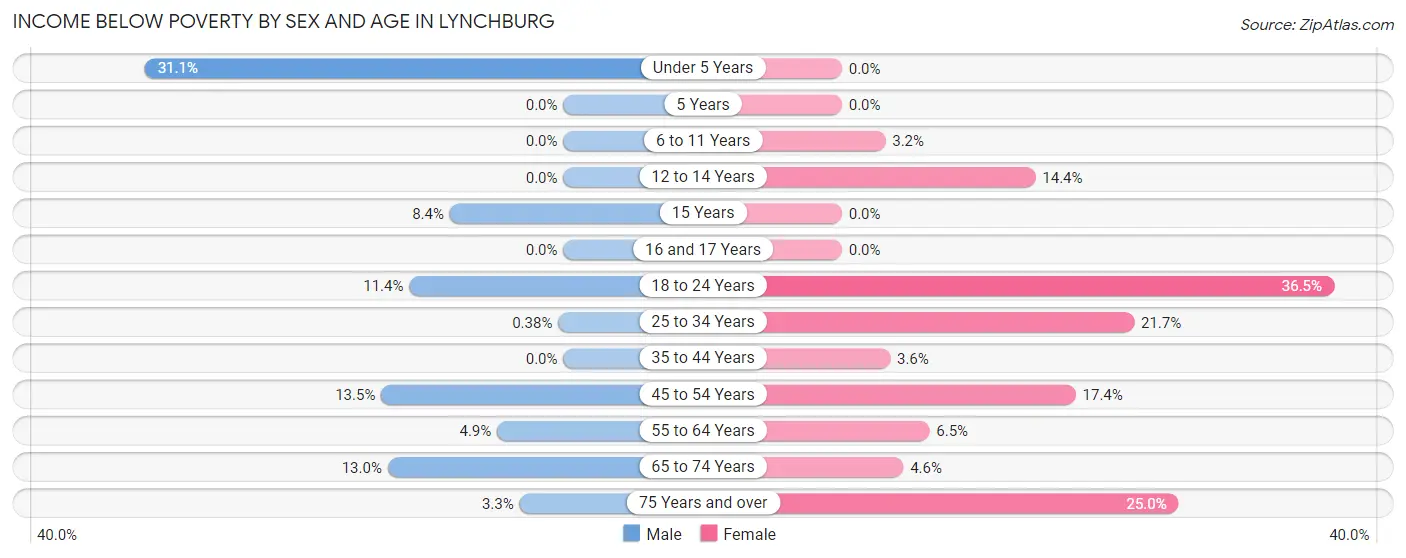
Income Below Poverty by Sex and Age in Lynchburg
With 7.3% poverty level for males and 12.5% for females among the residents of Lynchburg, under 5 year old males and 18 to 24 year old females are the most vulnerable to poverty, with 46 males (31.1%) and 80 females (36.5%) in their respective age groups living below the poverty level.
| Age Bracket | Male | Female |
| Under 5 Years | 46 (31.1%) | 0 (0.0%) |
| 5 Years | 0 (0.0%) | 0 (0.0%) |
| 6 to 11 Years | 0 (0.0%) | 6 (3.2%) |
| 12 to 14 Years | 0 (0.0%) | 24 (14.4%) |
| 15 Years | 7 (8.4%) | 0 (0.0%) |
| 16 and 17 Years | 0 (0.0%) | 0 (0.0%) |
| 18 to 24 Years | 31 (11.4%) | 80 (36.5%) |
| 25 to 34 Years | 1 (0.4%) | 79 (21.7%) |
| 35 to 44 Years | 0 (0.0%) | 11 (3.6%) |
| 45 to 54 Years | 66 (13.5%) | 71 (17.4%) |
| 55 to 64 Years | 24 (4.9%) | 42 (6.5%) |
| 65 to 74 Years | 51 (13.0%) | 18 (4.6%) |
| 75 Years and over | 8 (3.3%) | 75 (25.0%) |
| Total | 234 (7.3%) | 406 (12.5%) |
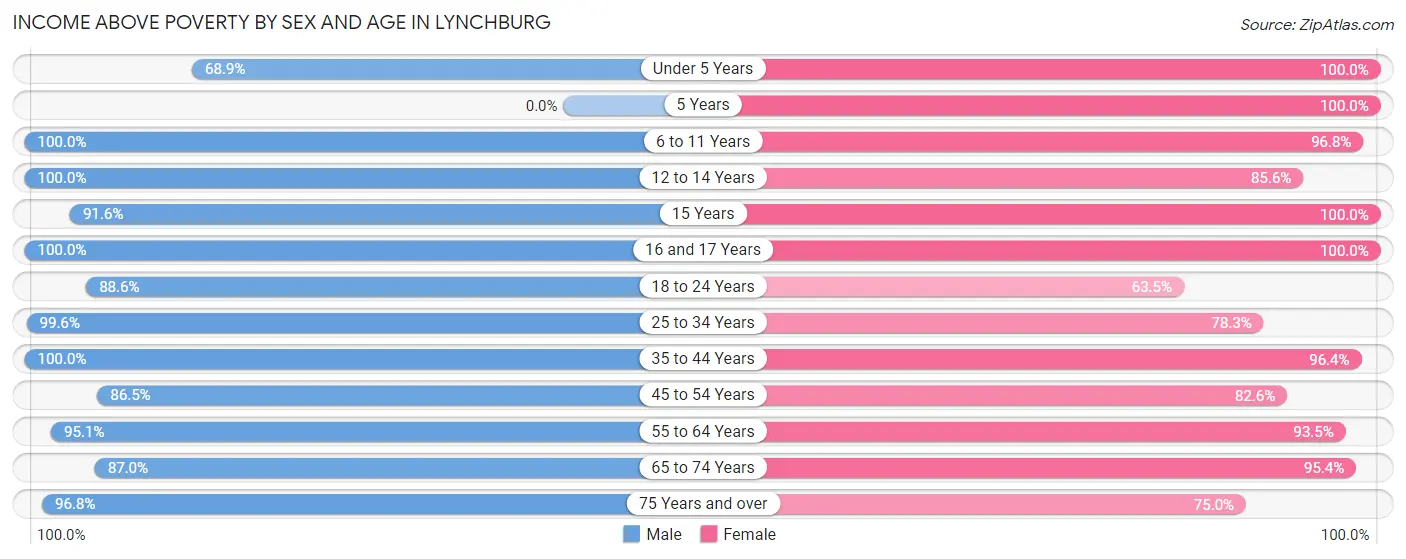
Income Above Poverty by Sex and Age in Lynchburg
According to the poverty statistics in Lynchburg, males aged 6 to 11 years and females aged under 5 years are the age groups that are most secure financially, with 100.0% of males and 100.0% of females in these age groups living above the poverty line.
| Age Bracket | Male | Female |
| Under 5 Years | 102 (68.9%) | 134 (100.0%) |
| 5 Years | 0 (0.0%) | 21 (100.0%) |
| 6 to 11 Years | 244 (100.0%) | 180 (96.8%) |
| 12 to 14 Years | 61 (100.0%) | 143 (85.6%) |
| 15 Years | 76 (91.6%) | 29 (100.0%) |
| 16 and 17 Years | 96 (100.0%) | 80 (100.0%) |
| 18 to 24 Years | 240 (88.6%) | 139 (63.5%) |
| 25 to 34 Years | 260 (99.6%) | 285 (78.3%) |
| 35 to 44 Years | 414 (100.0%) | 296 (96.4%) |
| 45 to 54 Years | 422 (86.5%) | 338 (82.6%) |
| 55 to 64 Years | 464 (95.1%) | 604 (93.5%) |
| 65 to 74 Years | 340 (87.0%) | 377 (95.4%) |
| 75 Years and over | 238 (96.8%) | 225 (75.0%) |
| Total | 2,957 (92.7%) | 2,851 (87.5%) |
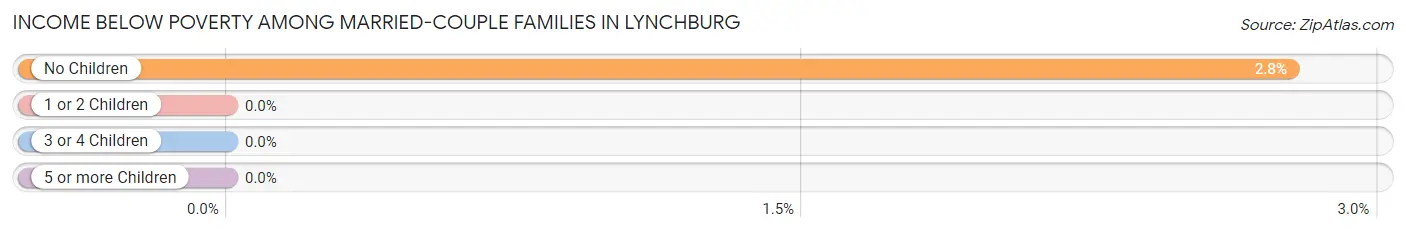
Income Below Poverty Among Married-Couple Families in Lynchburg
The poverty statistics for married-couple families in Lynchburg show that 1.9% or 29 of the total 1,532 families live below the poverty line. Families with no children have the highest poverty rate of 2.8%, comprising of 29 families. On the other hand, families with 1 or 2 children have the lowest poverty rate of 0.0%, which includes 0 families.
| Children | Above Poverty | Below Poverty |
| No Children | 1,019 (97.2%) | 29 (2.8%) |
| 1 or 2 Children | 377 (100.0%) | 0 (0.0%) |
| 3 or 4 Children | 80 (100.0%) | 0 (0.0%) |
| 5 or more Children | 27 (100.0%) | 0 (0.0%) |
| Total | 1,503 (98.1%) | 29 (1.9%) |
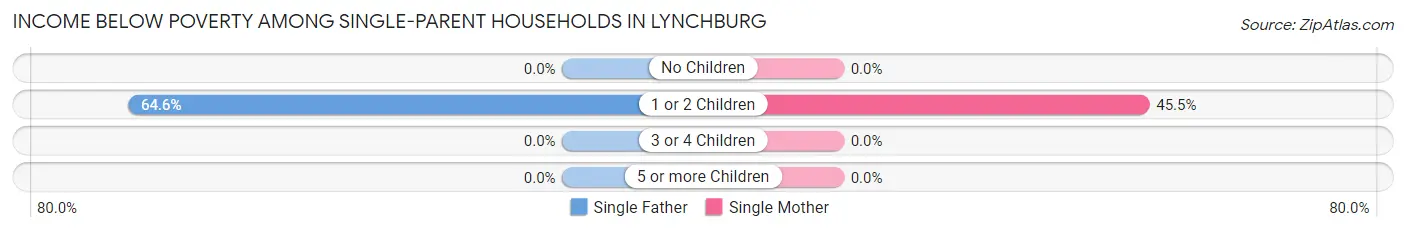
Income Below Poverty Among Single-Parent Households in Lynchburg
According to the poverty data in Lynchburg, 38.8% or 31 single-father households and 25.8% or 51 single-mother households are living below the poverty line. Among single-father households, those with 1 or 2 children have the highest poverty rate, with 31 households (64.6%) experiencing poverty. Likewise, among single-mother households, those with 1 or 2 children have the highest poverty rate, with 51 households (45.5%) falling below the poverty line.
| Children | Single Father | Single Mother |
| No Children | 0 (0.0%) | 0 (0.0%) |
| 1 or 2 Children | 31 (64.6%) | 51 (45.5%) |
| 3 or 4 Children | 0 (0.0%) | 0 (0.0%) |
| 5 or more Children | 0 (0.0%) | 0 (0.0%) |
| Total | 31 (38.8%) | 51 (25.8%) |
Income Below Poverty Among Married-Couple vs Single-Parent Households in Lynchburg
The poverty data for Lynchburg shows that 29 of the married-couple family households (1.9%) and 82 of the single-parent households (29.5%) are living below the poverty level. Within the married-couple family households, those with no children have the highest poverty rate, with 29 households (2.8%) falling below the poverty line. Among the single-parent households, those with 1 or 2 children have the highest poverty rate, with 82 household (51.2%) living below poverty.
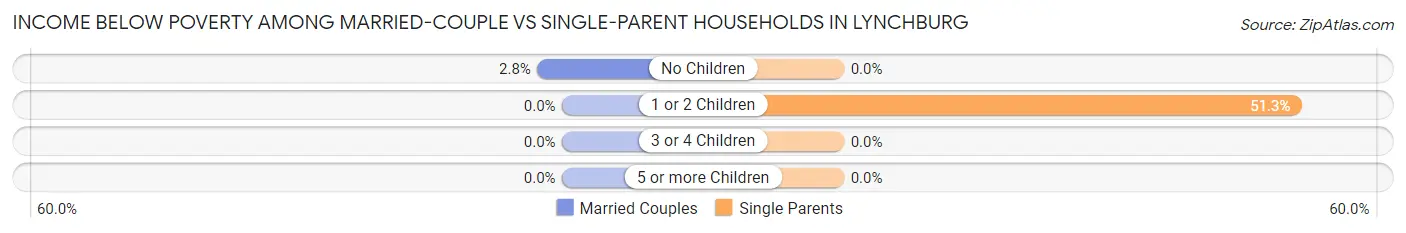
| Children | Married-Couple Families | Single-Parent Households |
| No Children | 29 (2.8%) | 0 (0.0%) |
| 1 or 2 Children | 0 (0.0%) | 82 (51.2%) |
| 3 or 4 Children | 0 (0.0%) | 0 (0.0%) |
| 5 or more Children | 0 (0.0%) | 0 (0.0%) |
| Total | 29 (1.9%) | 82 (29.5%) |
Race in Lynchburg
The most populous races in Lynchburg are White / Caucasian (6,065 | 92.5%), Black / African American (240 | 3.7%), and Two or more Races (138 | 2.1%).
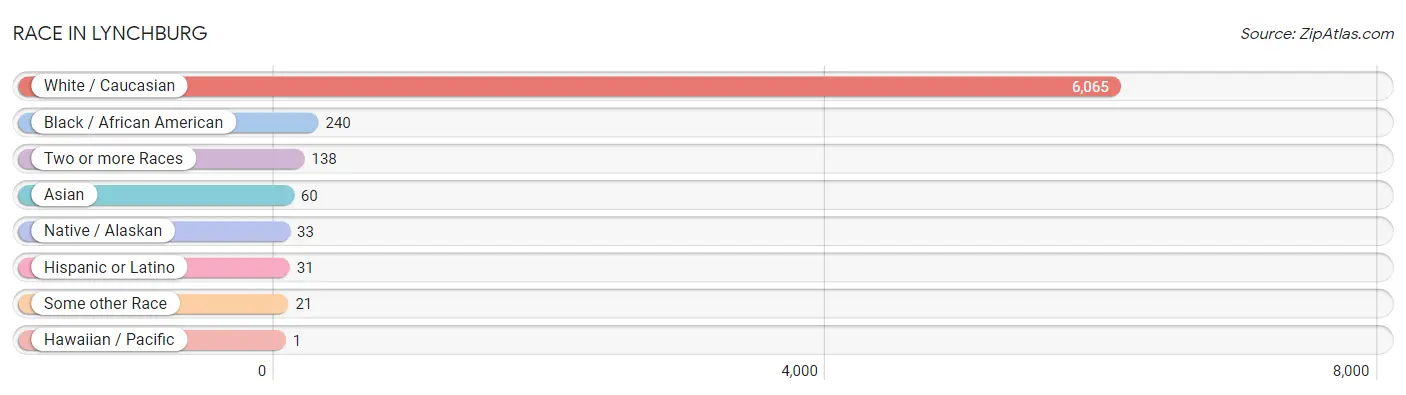
| Race | # Population | % Population |
| Asian | 60 | 0.9% |
| Black / African American | 240 | 3.7% |
| Hawaiian / Pacific | 1 | 0.0% |
| Hispanic or Latino | 31 | 0.5% |
| Native / Alaskan | 33 | 0.5% |
| White / Caucasian | 6,065 | 92.5% |
| Two or more Races | 138 | 2.1% |
| Some other Race | 21 | 0.3% |
| Total | 6,558 | 100.0% |
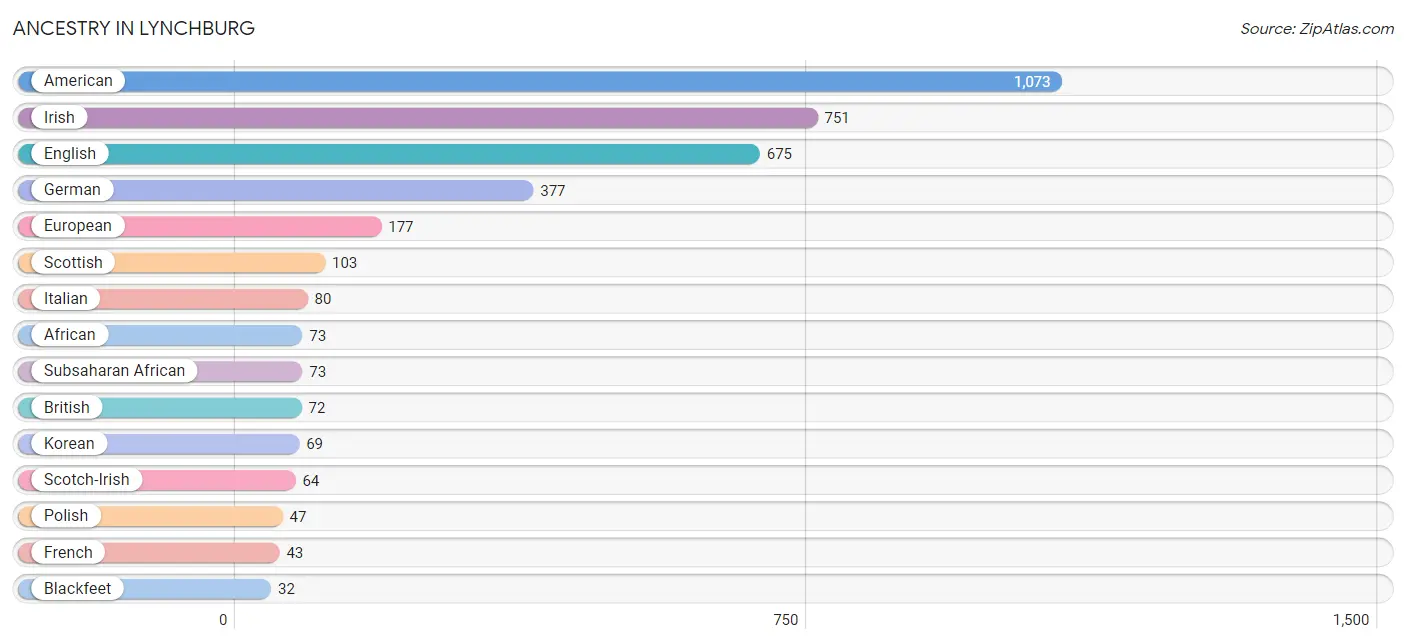
Ancestry in Lynchburg
The most populous ancestries reported in Lynchburg are American (1,073 | 16.4%), Irish (751 | 11.5%), English (675 | 10.3%), German (377 | 5.8%), and European (177 | 2.7%), together accounting for 46.6% of all Lynchburg residents.
| Ancestry | # Population | % Population |
| African | 73 | 1.1% |
| American | 1,073 | 16.4% |
| Blackfeet | 32 | 0.5% |
| British | 72 | 1.1% |
| Central American | 10 | 0.2% |
| Cherokee | 19 | 0.3% |
| Czech | 13 | 0.2% |
| Dutch | 5 | 0.1% |
| Eastern European | 6 | 0.1% |
| English | 675 | 10.3% |
| Estonian | 16 | 0.2% |
| European | 177 | 2.7% |
| Finnish | 5 | 0.1% |
| French | 43 | 0.7% |
| German | 377 | 5.8% |
| Guatemalan | 10 | 0.2% |
| Hungarian | 6 | 0.1% |
| Irish | 751 | 11.5% |
| Italian | 80 | 1.2% |
| Korean | 69 | 1.1% |
| Mexican | 21 | 0.3% |
| Native Hawaiian | 1 | 0.0% |
| Norwegian | 6 | 0.1% |
| Polish | 47 | 0.7% |
| Russian | 2 | 0.0% |
| Scotch-Irish | 64 | 1.0% |
| Scottish | 103 | 1.6% |
| Sri Lankan | 11 | 0.2% |
| Subsaharan African | 73 | 1.1% |
| Swiss | 19 | 0.3% |
| Welsh | 27 | 0.4% | View All 31 Rows |
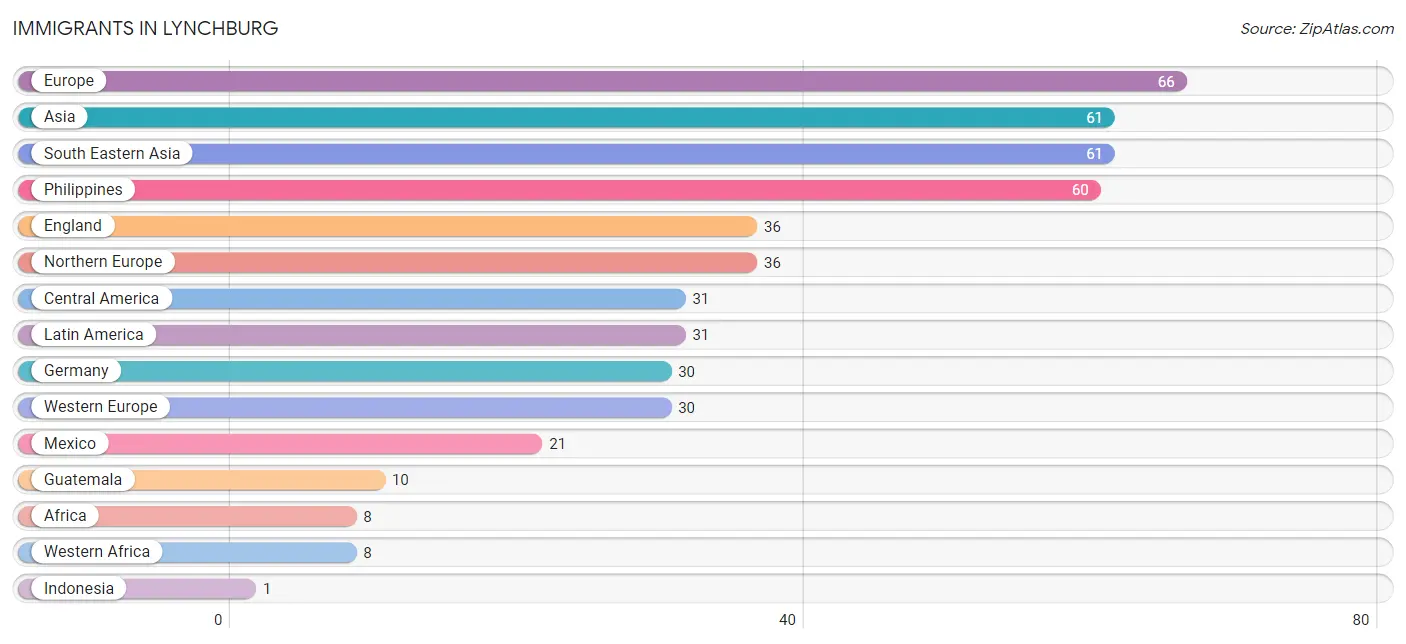
Immigrants in Lynchburg
The most numerous immigrant groups reported in Lynchburg came from Europe (66 | 1.0%), Asia (61 | 0.9%), South Eastern Asia (61 | 0.9%), Philippines (60 | 0.9%), and England (36 | 0.5%), together accounting for 4.3% of all Lynchburg residents.
| Immigration Origin | # Population | % Population |
| Africa | 8 | 0.1% |
| Asia | 61 | 0.9% |
| Central America | 31 | 0.5% |
| England | 36 | 0.5% |
| Europe | 66 | 1.0% |
| Germany | 30 | 0.5% |
| Guatemala | 10 | 0.2% |
| Indonesia | 1 | 0.0% |
| Latin America | 31 | 0.5% |
| Mexico | 21 | 0.3% |
| Northern Europe | 36 | 0.5% |
| Philippines | 60 | 0.9% |
| South Eastern Asia | 61 | 0.9% |
| Western Africa | 8 | 0.1% |
| Western Europe | 30 | 0.5% | View All 15 Rows |
Sex and Age in Lynchburg
Sex and Age in Lynchburg
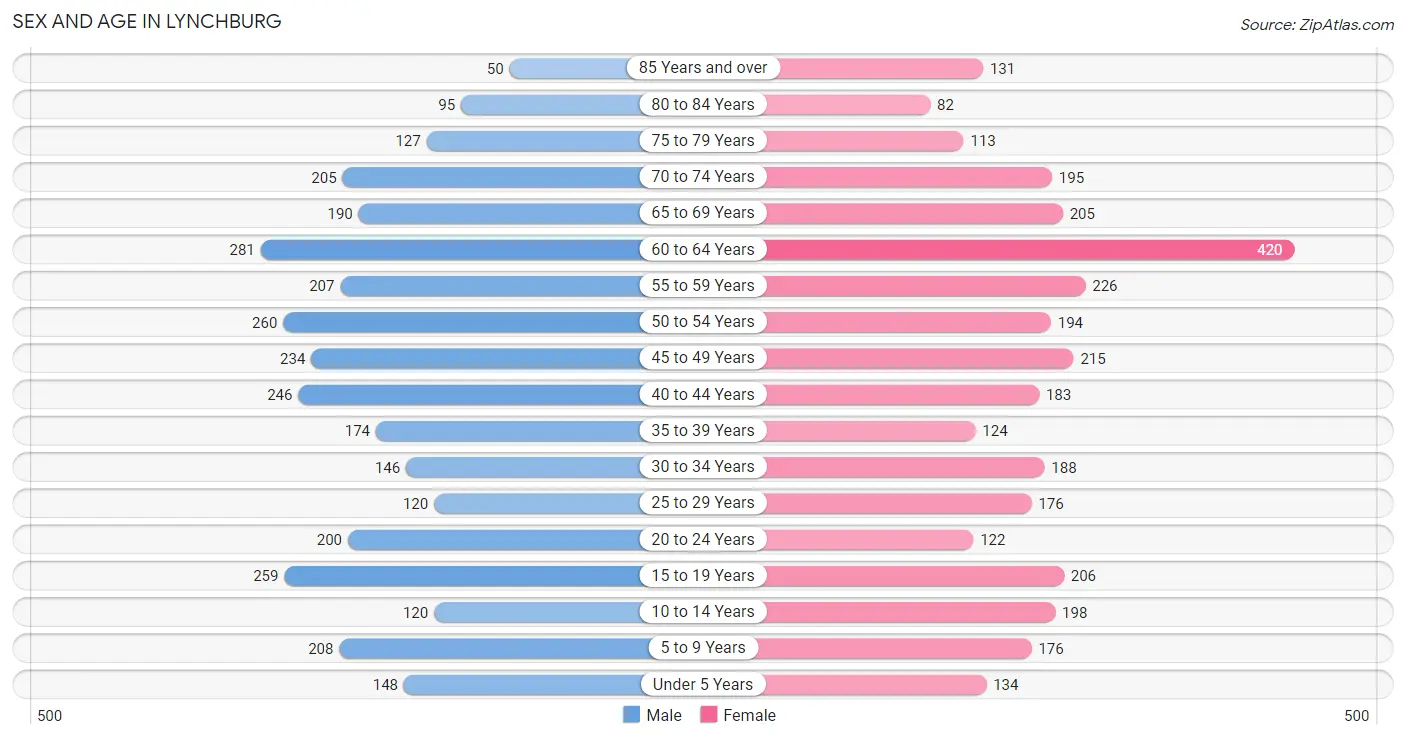
The most populous age groups in Lynchburg are 60 to 64 Years (281 | 8.6%) for men and 60 to 64 Years (420 | 12.8%) for women.
| Age Bracket | Male | Female |
| Under 5 Years | 148 (4.5%) | 134 (4.1%) |
| 5 to 9 Years | 208 (6.4%) | 176 (5.3%) |
| 10 to 14 Years | 120 (3.7%) | 198 (6.0%) |
| 15 to 19 Years | 259 (7.9%) | 206 (6.3%) |
| 20 to 24 Years | 200 (6.1%) | 122 (3.7%) |
| 25 to 29 Years | 120 (3.7%) | 176 (5.3%) |
| 30 to 34 Years | 146 (4.5%) | 188 (5.7%) |
| 35 to 39 Years | 174 (5.3%) | 124 (3.8%) |
| 40 to 44 Years | 246 (7.5%) | 183 (5.6%) |
| 45 to 49 Years | 234 (7.2%) | 215 (6.5%) |
| 50 to 54 Years | 260 (8.0%) | 194 (5.9%) |
| 55 to 59 Years | 207 (6.3%) | 226 (6.9%) |
| 60 to 64 Years | 281 (8.6%) | 420 (12.8%) |
| 65 to 69 Years | 190 (5.8%) | 205 (6.2%) |
| 70 to 74 Years | 205 (6.3%) | 195 (5.9%) |
| 75 to 79 Years | 127 (3.9%) | 113 (3.4%) |
| 80 to 84 Years | 95 (2.9%) | 82 (2.5%) |
| 85 Years and over | 50 (1.5%) | 131 (4.0%) |
| Total | 3,270 (100.0%) | 3,288 (100.0%) |
Families and Households in Lynchburg
Median Family Size in Lynchburg
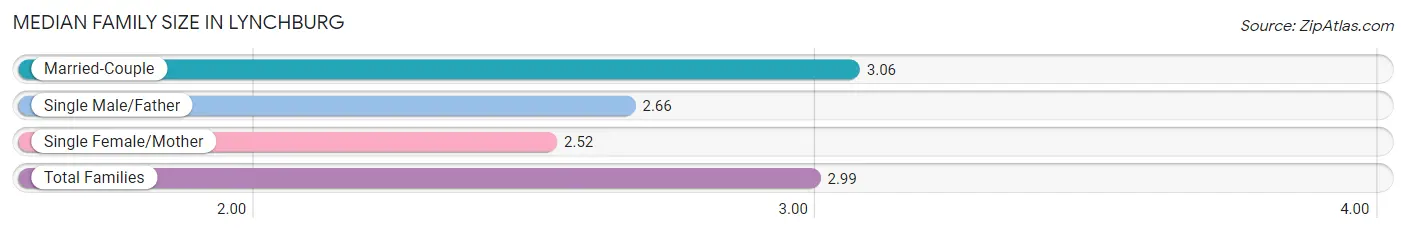
The median family size in Lynchburg is 2.99 persons per family, with married-couple families (1,532 | 84.6%) accounting for the largest median family size of 3.06 persons per family. On the other hand, single female/mother families (198 | 10.9%) represent the smallest median family size with 2.52 persons per family.
| Family Type | # Families | Family Size |
| Married-Couple | 1,532 (84.6%) | 3.06 |
| Single Male/Father | 80 (4.4%) | 2.66 |
| Single Female/Mother | 198 (10.9%) | 2.52 |
| Total Families | 1,810 (100.0%) | 2.99 |
Median Household Size in Lynchburg
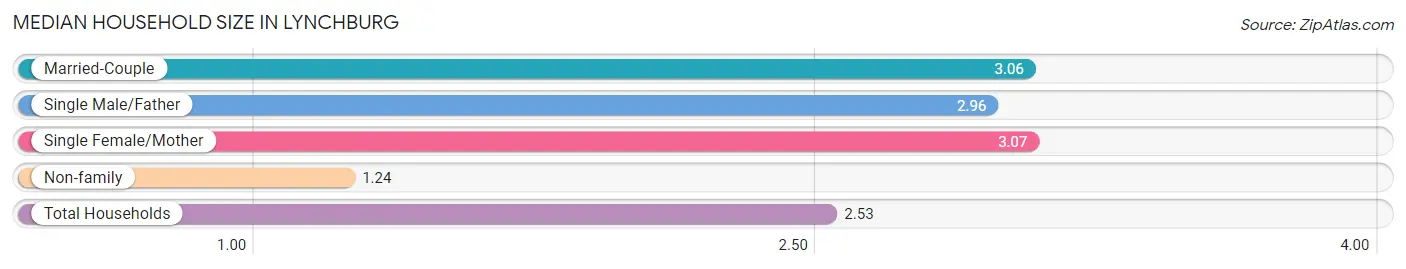
The median household size in Lynchburg is 2.53 persons per household, with single female/mother households (198 | 7.7%) accounting for the largest median household size of 3.07 persons per household. non-family households (748 | 29.2%) represent the smallest median household size with 1.24 persons per household.
| Household Type | # Households | Household Size |
| Married-Couple | 1,532 (59.9%) | 3.06 |
| Single Male/Father | 80 (3.1%) | 2.96 |
| Single Female/Mother | 198 (7.7%) | 3.07 |
| Non-family | 748 (29.2%) | 1.24 |
| Total Households | 2,558 (100.0%) | 2.53 |
Household Size by Marriage Status in Lynchburg
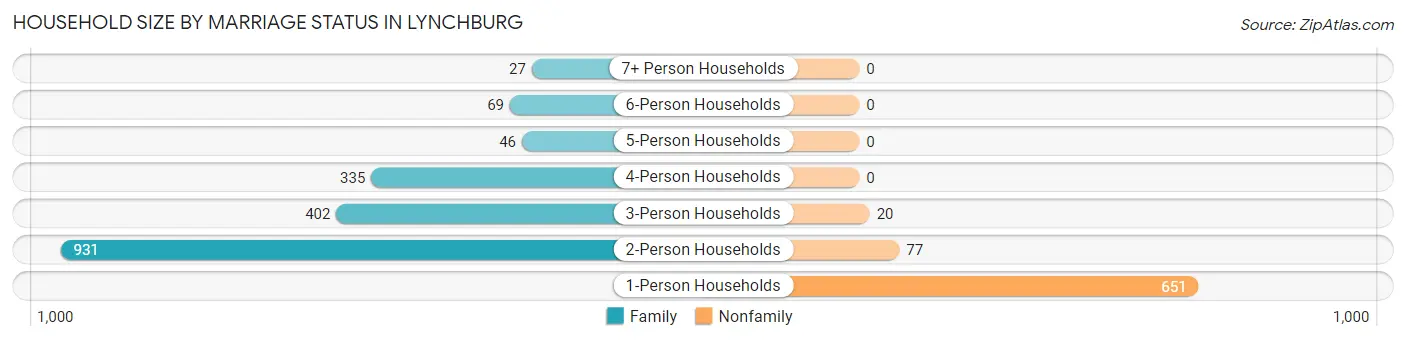
Out of a total of 2,558 households in Lynchburg, 1,810 (70.8%) are family households, while 748 (29.2%) are nonfamily households. The most numerous type of family households are 2-person households, comprising 931, and the most common type of nonfamily households are 1-person households, comprising 651.
| Household Size | Family Households | Nonfamily Households |
| 1-Person Households | - | 651 (25.5%) |
| 2-Person Households | 931 (36.4%) | 77 (3.0%) |
| 3-Person Households | 402 (15.7%) | 20 (0.8%) |
| 4-Person Households | 335 (13.1%) | 0 (0.0%) |
| 5-Person Households | 46 (1.8%) | 0 (0.0%) |
| 6-Person Households | 69 (2.7%) | 0 (0.0%) |
| 7+ Person Households | 27 (1.1%) | 0 (0.0%) |
| Total | 1,810 (70.8%) | 748 (29.2%) |
Female Fertility in Lynchburg
Fertility by Age in Lynchburg
Average fertility rate in Lynchburg is 50.0 births per 1,000 women. Women in the age bracket of 20 to 34 years have the highest fertility rate with 134.0 births per 1,000 women. Women in the age bracket of 20 to 34 years acount for 100.0% of all women with births.
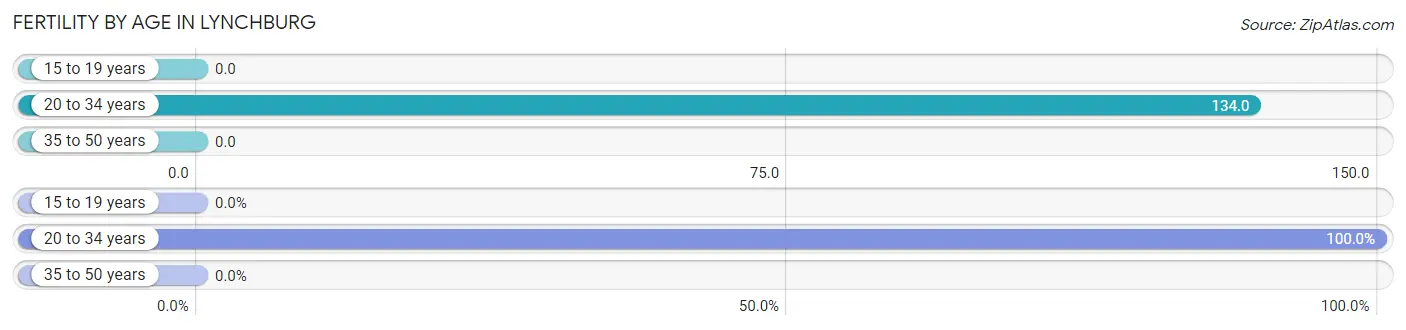
| Age Bracket | Women with Births | Births / 1,000 Women |
| 15 to 19 years | 0 (0.0%) | 0.0 |
| 20 to 34 years | 65 (100.0%) | 134.0 |
| 35 to 50 years | 0 (0.0%) | 0.0 |
| Total | 65 (100.0%) | 50.0 |
Fertility by Age by Marriage Status in Lynchburg
63.1% of women with births (65) in Lynchburg are married. The highest percentage of unmarried women with births falls into 20 to 34 years age bracket with 36.9% of them unmarried at the time of birth, while the lowest percentage of unmarried women with births belong to 20 to 34 years age bracket with 36.9% of them unmarried.
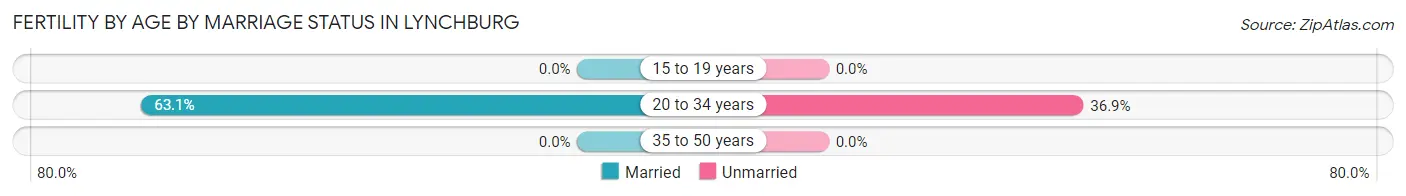
| Age Bracket | Married | Unmarried |
| 15 to 19 years | 0 (0.0%) | 0 (0.0%) |
| 20 to 34 years | 41 (63.1%) | 24 (36.9%) |
| 35 to 50 years | 0 (0.0%) | 0 (0.0%) |
| Total | 41 (63.1%) | 24 (36.9%) |
Fertility by Education in Lynchburg
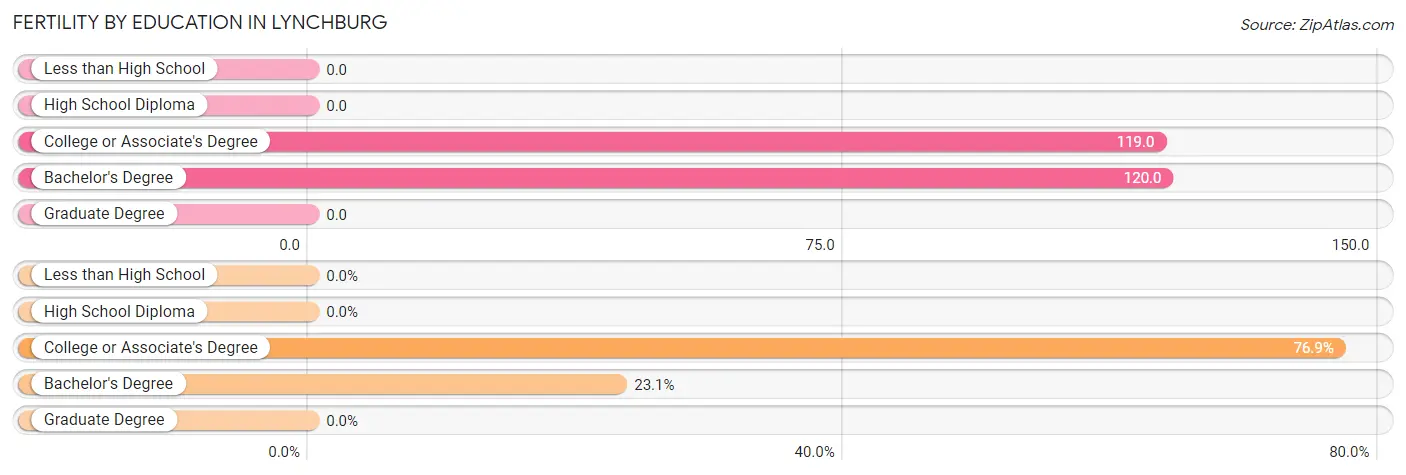
| Educational Attainment | Women with Births | Births / 1,000 Women |
| Less than High School | 0 (0.0%) | 0.0 |
| High School Diploma | 0 (0.0%) | 0.0 |
| College or Associate's Degree | 50 (76.9%) | 119.0 |
| Bachelor's Degree | 15 (23.1%) | 120.0 |
| Graduate Degree | 0 (0.0%) | 0.0 |
| Total | 65 (100.0%) | 50.0 |
Fertility by Education by Marriage Status in Lynchburg
36.9% of women with births in Lynchburg are unmarried. Women with the educational attainment of bachelor's degree are most likely to be married with 100.0% of them married at childbirth, while women with the educational attainment of college or associate's degree are least likely to be married with 48.0% of them unmarried at childbirth.
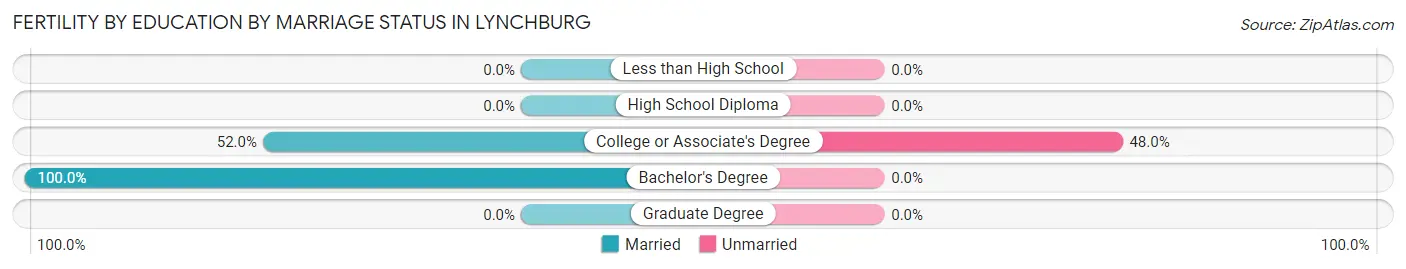
| Educational Attainment | Married | Unmarried |
| Less than High School | 0 (0.0%) | 0 (0.0%) |
| High School Diploma | 0 (0.0%) | 0 (0.0%) |
| College or Associate's Degree | 26 (52.0%) | 24 (48.0%) |
| Bachelor's Degree | 15 (100.0%) | 0 (0.0%) |
| Graduate Degree | 0 (0.0%) | 0 (0.0%) |
| Total | 41 (63.1%) | 24 (36.9%) |
Employment Characteristics in Lynchburg
Employment by Class of Employer in Lynchburg
Among the 2,865 employed individuals in Lynchburg, private company employees (2,094 | 73.1%), self-employed (not incorporated) (272 | 9.5%), and local government employees (167 | 5.8%) make up the most common classes of employment.
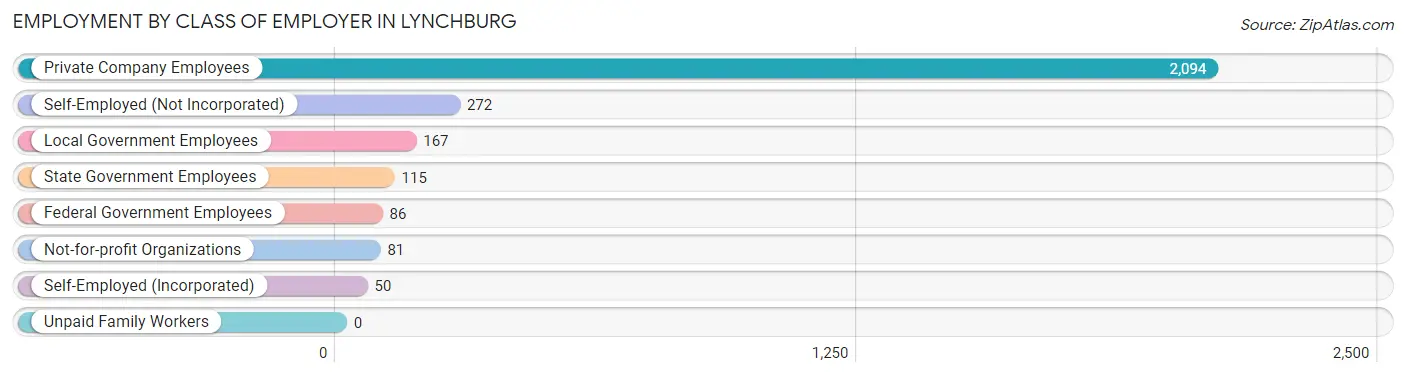
| Employer Class | # Employees | % Employees |
| Private Company Employees | 2,094 | 73.1% |
| Self-Employed (Incorporated) | 50 | 1.8% |
| Self-Employed (Not Incorporated) | 272 | 9.5% |
| Not-for-profit Organizations | 81 | 2.8% |
| Local Government Employees | 167 | 5.8% |
| State Government Employees | 115 | 4.0% |
| Federal Government Employees | 86 | 3.0% |
| Unpaid Family Workers | 0 | 0.0% |
| Total | 2,865 | 100.0% |
Employment Status by Age in Lynchburg
According to the labor force statistics for Lynchburg, out of the total population over 16 years of age (5,462), 56.7% or 3,097 individuals are in the labor force, with 4.2% or 130 of them unemployed. The age group with the highest labor force participation rate is 35 to 44 years, with 90.0% or 654 individuals in the labor force. Within the labor force, the 20 to 24 years age range has the highest percentage of unemployed individuals, with 12.3% or 26 of them being unemployed.
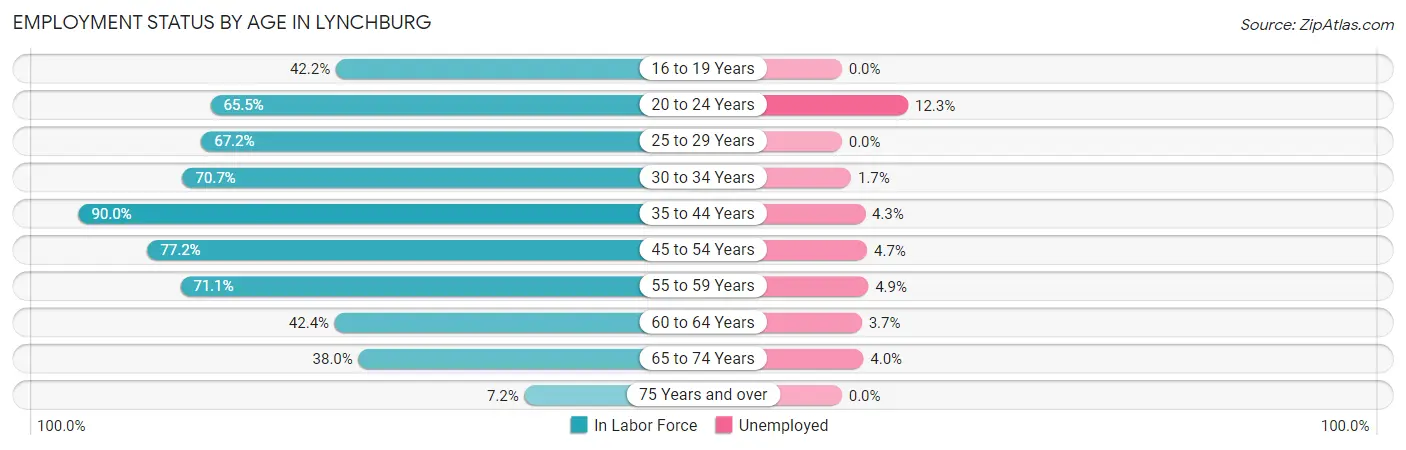
| Age Bracket | In Labor Force | Unemployed |
| 16 to 19 Years | 149 (42.2%) | 0 (0.0%) |
| 20 to 24 Years | 211 (65.5%) | 26 (12.3%) |
| 25 to 29 Years | 199 (67.2%) | 0 (0.0%) |
| 30 to 34 Years | 236 (70.7%) | 4 (1.7%) |
| 35 to 44 Years | 654 (90.0%) | 28 (4.3%) |
| 45 to 54 Years | 697 (77.2%) | 33 (4.7%) |
| 55 to 59 Years | 308 (71.1%) | 15 (4.9%) |
| 60 to 64 Years | 297 (42.4%) | 11 (3.7%) |
| 65 to 74 Years | 302 (38.0%) | 12 (4.0%) |
| 75 Years and over | 43 (7.2%) | 0 (0.0%) |
| Total | 3,097 (56.7%) | 130 (4.2%) |
Employment Status by Educational Attainment in Lynchburg
According to labor force statistics for Lynchburg, 70.4% of individuals (2,389) out of the total population between 25 and 64 years of age (3,394) are in the labor force, with 3.8% or 91 of them being unemployed. The group with the highest labor force participation rate are those with the educational attainment of bachelor's degree or higher, with 75.8% or 604 individuals in the labor force. Within the labor force, individuals with college / associate degree education have the highest percentage of unemployment, with 5.7% or 33 of them being unemployed.
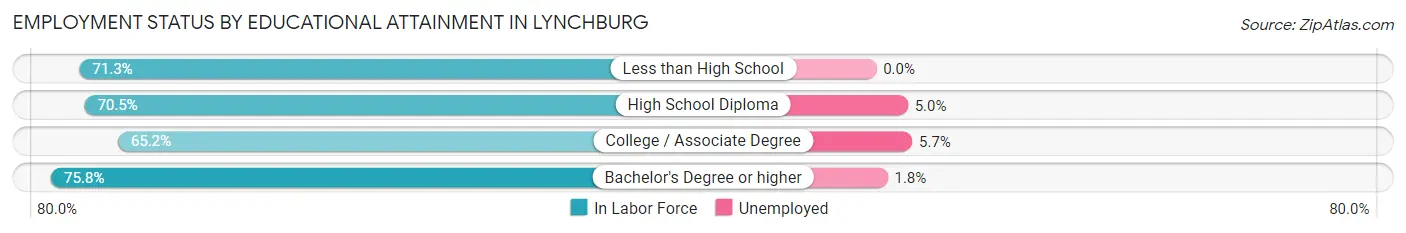
| Educational Attainment | In Labor Force | Unemployed |
| Less than High School | 273 (71.3%) | 0 (0.0%) |
| High School Diploma | 935 (70.5%) | 66 (5.0%) |
| College / Associate Degree | 579 (65.2%) | 51 (5.7%) |
| Bachelor's Degree or higher | 604 (75.8%) | 14 (1.8%) |
| Total | 2,389 (70.4%) | 129 (3.8%) |
Employment Occupations by Sex in Lynchburg
Management, Business, Science and Arts Occupations
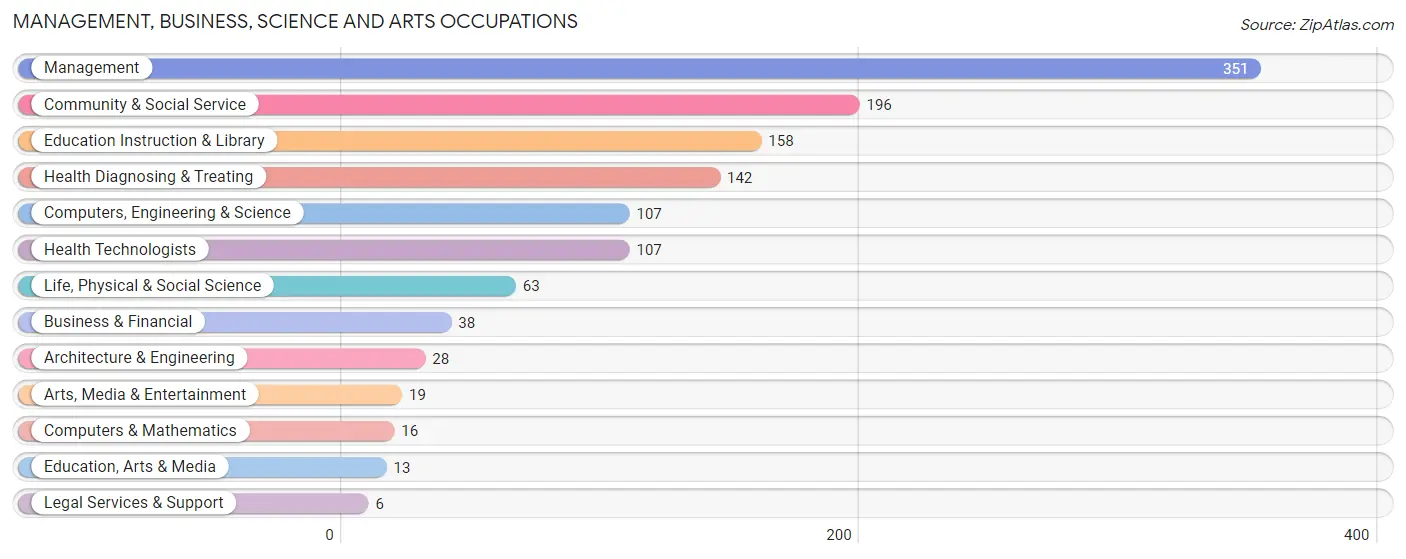
The most common Management, Business, Science and Arts occupations in Lynchburg are Management (351 | 11.8%), Community & Social Service (196 | 6.6%), Education Instruction & Library (158 | 5.3%), Health Diagnosing & Treating (142 | 4.8%), and Computers, Engineering & Science (107 | 3.6%).
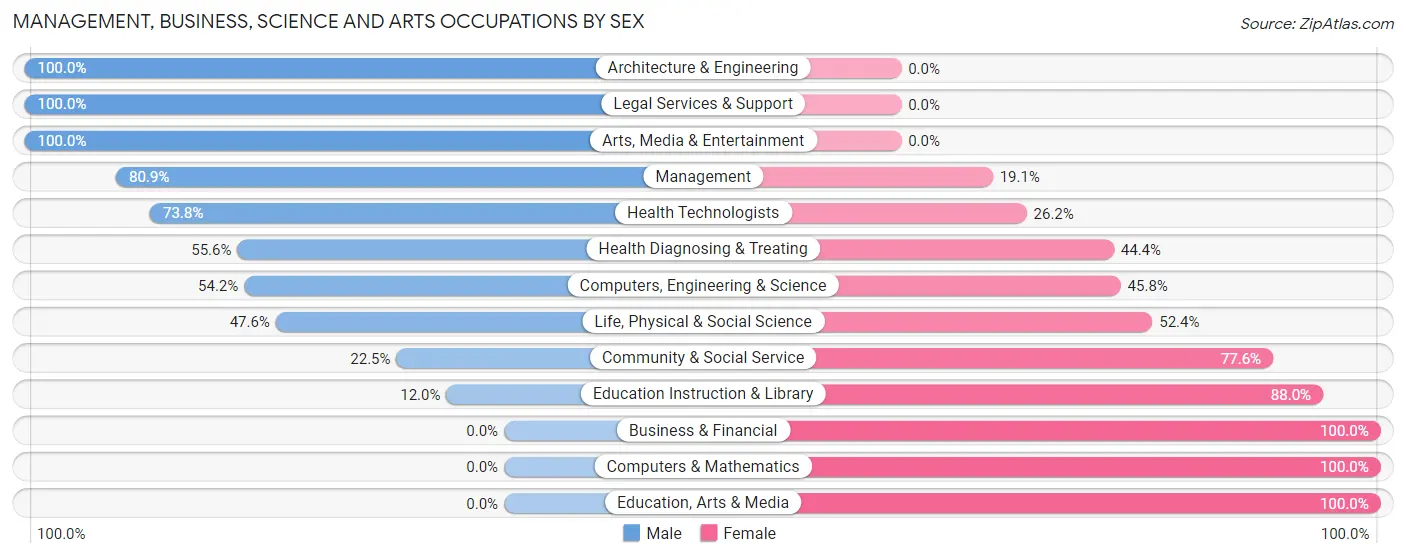
Management, Business, Science and Arts Occupations by Sex
Within the Management, Business, Science and Arts occupations in Lynchburg, the most male-oriented occupations are Architecture & Engineering (100.0%), Legal Services & Support (100.0%), and Arts, Media & Entertainment (100.0%), while the most female-oriented occupations are Business & Financial (100.0%), Computers & Mathematics (100.0%), and Education, Arts & Media (100.0%).
| Occupation | Male | Female |
| Management | 284 (80.9%) | 67 (19.1%) |
| Business & Financial | 0 (0.0%) | 38 (100.0%) |
| Computers, Engineering & Science | 58 (54.2%) | 49 (45.8%) |
| Computers & Mathematics | 0 (0.0%) | 16 (100.0%) |
| Architecture & Engineering | 28 (100.0%) | 0 (0.0%) |
| Life, Physical & Social Science | 30 (47.6%) | 33 (52.4%) |
| Community & Social Service | 44 (22.5%) | 152 (77.5%) |
| Education, Arts & Media | 0 (0.0%) | 13 (100.0%) |
| Legal Services & Support | 6 (100.0%) | 0 (0.0%) |
| Education Instruction & Library | 19 (12.0%) | 139 (88.0%) |
| Arts, Media & Entertainment | 19 (100.0%) | 0 (0.0%) |
| Health Diagnosing & Treating | 79 (55.6%) | 63 (44.4%) |
| Health Technologists | 79 (73.8%) | 28 (26.2%) |
| Total (Category) | 465 (55.8%) | 369 (44.2%) |
| Total (Overall) | 1,679 (56.6%) | 1,288 (43.4%) |
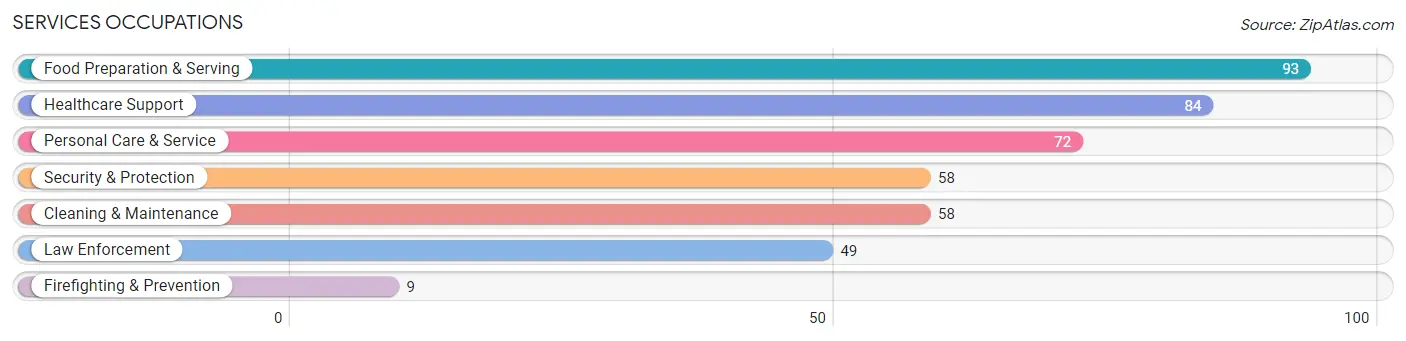
Services Occupations
The most common Services occupations in Lynchburg are Food Preparation & Serving (93 | 3.1%), Healthcare Support (84 | 2.8%), Personal Care & Service (72 | 2.4%), Security & Protection (58 | 1.9%), and Cleaning & Maintenance (58 | 1.9%).
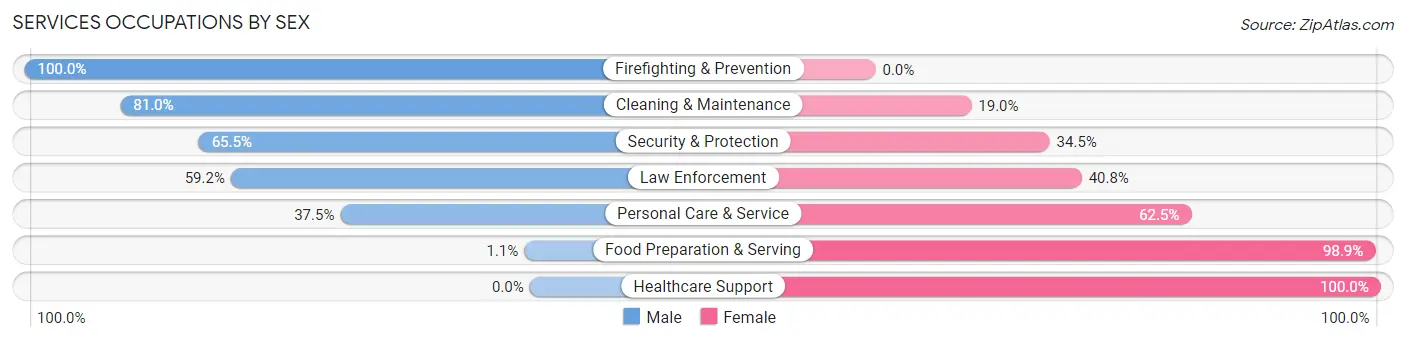
Services Occupations by Sex
Within the Services occupations in Lynchburg, the most male-oriented occupations are Firefighting & Prevention (100.0%), Cleaning & Maintenance (81.0%), and Security & Protection (65.5%), while the most female-oriented occupations are Healthcare Support (100.0%), Food Preparation & Serving (98.9%), and Personal Care & Service (62.5%).
| Occupation | Male | Female |
| Healthcare Support | 0 (0.0%) | 84 (100.0%) |
| Security & Protection | 38 (65.5%) | 20 (34.5%) |
| Firefighting & Prevention | 9 (100.0%) | 0 (0.0%) |
| Law Enforcement | 29 (59.2%) | 20 (40.8%) |
| Food Preparation & Serving | 1 (1.1%) | 92 (98.9%) |
| Cleaning & Maintenance | 47 (81.0%) | 11 (19.0%) |
| Personal Care & Service | 27 (37.5%) | 45 (62.5%) |
| Total (Category) | 113 (31.0%) | 252 (69.0%) |
| Total (Overall) | 1,679 (56.6%) | 1,288 (43.4%) |
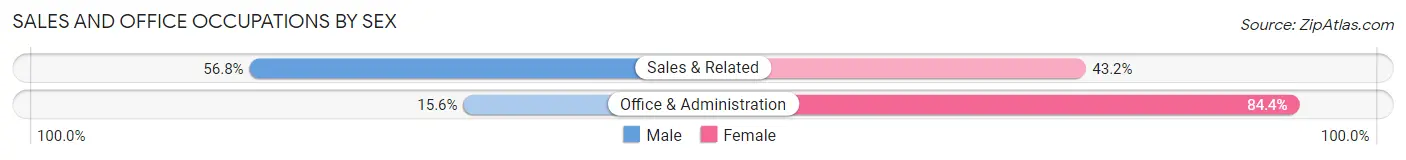
Sales and Office Occupations
The most common Sales and Office occupations in Lynchburg are Sales & Related (347 | 11.7%), and Office & Administration (288 | 9.7%).

Sales and Office Occupations by Sex
| Occupation | Male | Female |
| Sales & Related | 197 (56.8%) | 150 (43.2%) |
| Office & Administration | 45 (15.6%) | 243 (84.4%) |
| Total (Category) | 242 (38.1%) | 393 (61.9%) |
| Total (Overall) | 1,679 (56.6%) | 1,288 (43.4%) |
Natural Resources, Construction and Maintenance Occupations
The most common Natural Resources, Construction and Maintenance occupations in Lynchburg are Installation, Maintenance & Repair (208 | 7.0%), Construction & Extraction (170 | 5.7%), and Farming, Fishing & Forestry (4 | 0.1%).
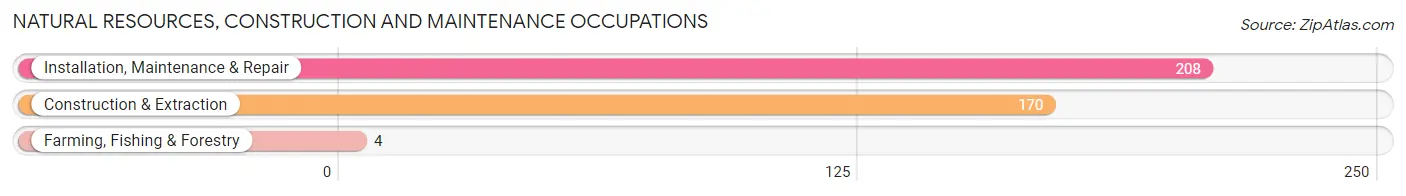
Natural Resources, Construction and Maintenance Occupations by Sex
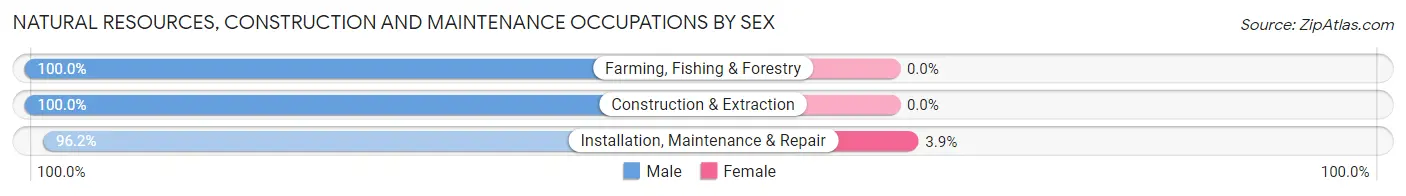
| Occupation | Male | Female |
| Farming, Fishing & Forestry | 4 (100.0%) | 0 (0.0%) |
| Construction & Extraction | 170 (100.0%) | 0 (0.0%) |
| Installation, Maintenance & Repair | 200 (96.2%) | 8 (3.8%) |
| Total (Category) | 374 (97.9%) | 8 (2.1%) |
| Total (Overall) | 1,679 (56.6%) | 1,288 (43.4%) |
Production, Transportation and Moving Occupations
The most common Production, Transportation and Moving occupations in Lynchburg are Production (428 | 14.4%), Transportation (189 | 6.4%), and Material Moving (134 | 4.5%).
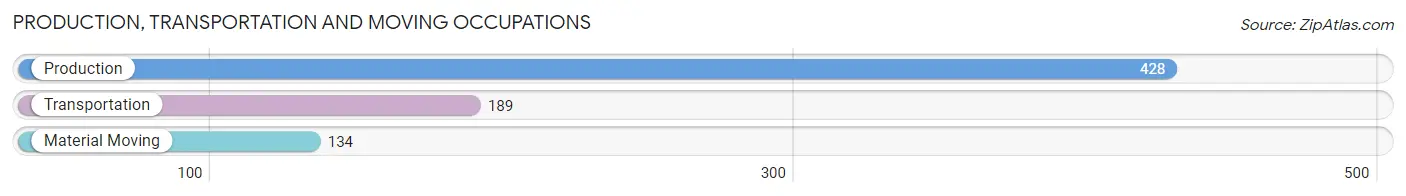
Production, Transportation and Moving Occupations by Sex
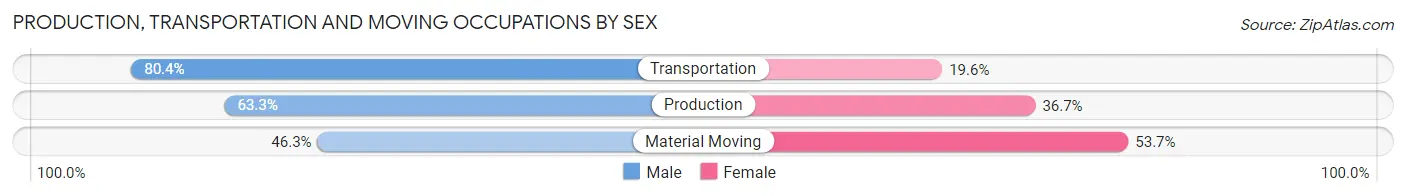
| Occupation | Male | Female |
| Production | 271 (63.3%) | 157 (36.7%) |
| Transportation | 152 (80.4%) | 37 (19.6%) |
| Material Moving | 62 (46.3%) | 72 (53.7%) |
| Total (Category) | 485 (64.6%) | 266 (35.4%) |
| Total (Overall) | 1,679 (56.6%) | 1,288 (43.4%) |
Employment Industries by Sex in Lynchburg
Employment Industries in Lynchburg
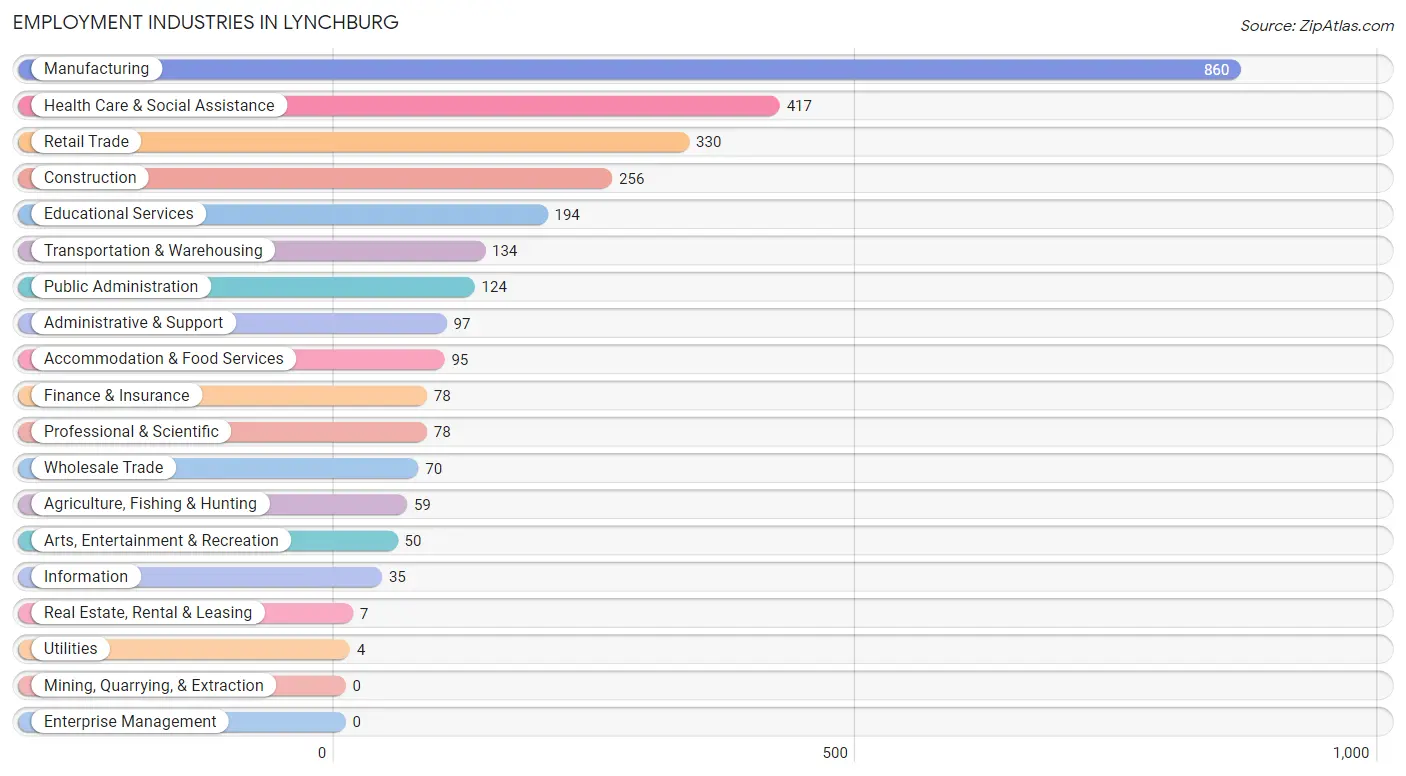
The major employment industries in Lynchburg include Manufacturing (860 | 29.0%), Health Care & Social Assistance (417 | 14.1%), Retail Trade (330 | 11.1%), Construction (256 | 8.6%), and Educational Services (194 | 6.5%).
Employment Industries by Sex in Lynchburg
The Lynchburg industries that see more men than women are Agriculture, Fishing & Hunting (100.0%), Information (100.0%), and Arts, Entertainment & Recreation (90.0%), whereas the industries that tend to have a higher number of women are Utilities (100.0%), Real Estate, Rental & Leasing (100.0%), and Finance & Insurance (87.2%).
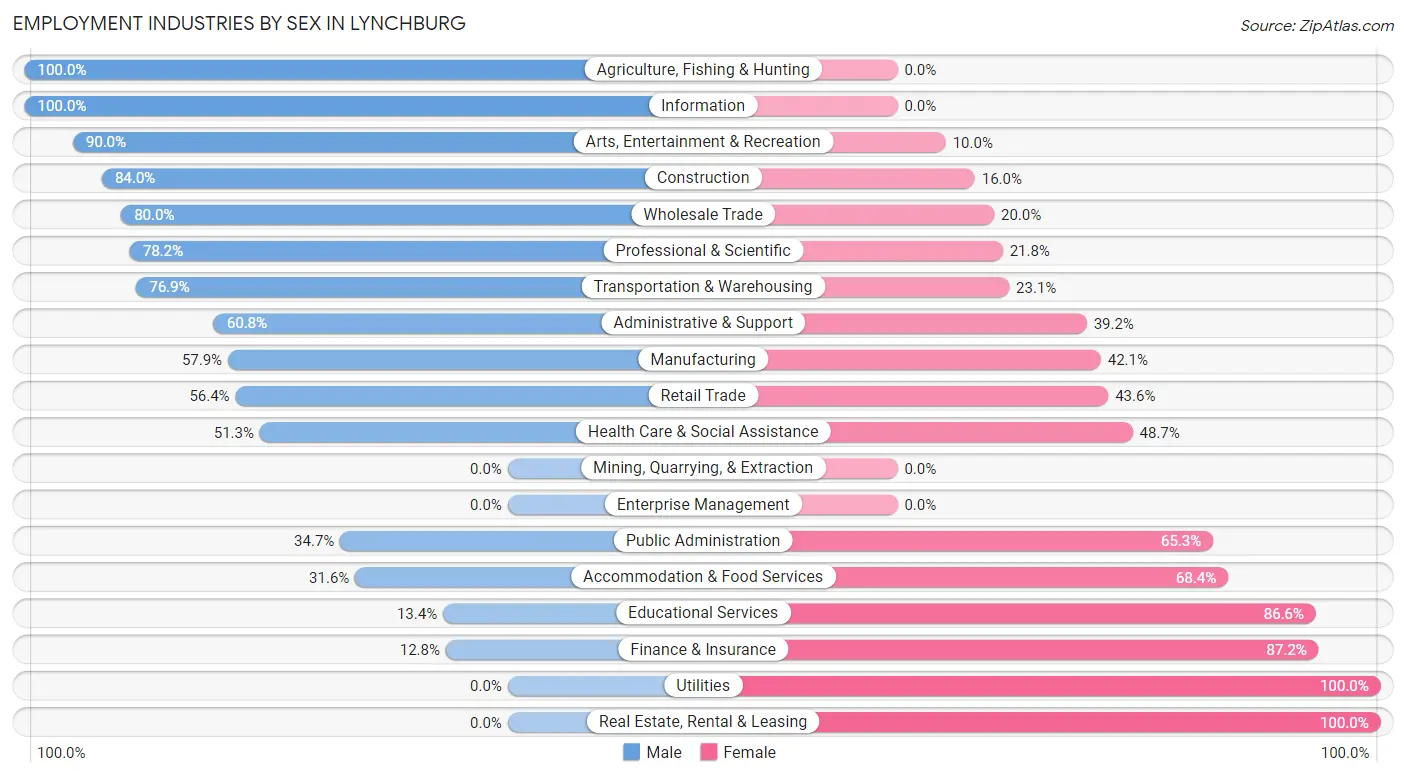
| Industry | Male | Female |
| Agriculture, Fishing & Hunting | 59 (100.0%) | 0 (0.0%) |
| Mining, Quarrying, & Extraction | 0 (0.0%) | 0 (0.0%) |
| Construction | 215 (84.0%) | 41 (16.0%) |
| Manufacturing | 498 (57.9%) | 362 (42.1%) |
| Wholesale Trade | 56 (80.0%) | 14 (20.0%) |
| Retail Trade | 186 (56.4%) | 144 (43.6%) |
| Transportation & Warehousing | 103 (76.9%) | 31 (23.1%) |
| Utilities | 0 (0.0%) | 4 (100.0%) |
| Information | 35 (100.0%) | 0 (0.0%) |
| Finance & Insurance | 10 (12.8%) | 68 (87.2%) |
| Real Estate, Rental & Leasing | 0 (0.0%) | 7 (100.0%) |
| Professional & Scientific | 61 (78.2%) | 17 (21.8%) |
| Enterprise Management | 0 (0.0%) | 0 (0.0%) |
| Administrative & Support | 59 (60.8%) | 38 (39.2%) |
| Educational Services | 26 (13.4%) | 168 (86.6%) |
| Health Care & Social Assistance | 214 (51.3%) | 203 (48.7%) |
| Arts, Entertainment & Recreation | 45 (90.0%) | 5 (10.0%) |
| Accommodation & Food Services | 30 (31.6%) | 65 (68.4%) |
| Public Administration | 43 (34.7%) | 81 (65.3%) |
| Total | 1,679 (56.6%) | 1,288 (43.4%) |
Education in Lynchburg
School Enrollment in Lynchburg
The most common levels of schooling among the 1,248 students in Lynchburg are high school (366 | 29.3%), elementary school (356 | 28.5%), and middle school (269 | 21.5%).
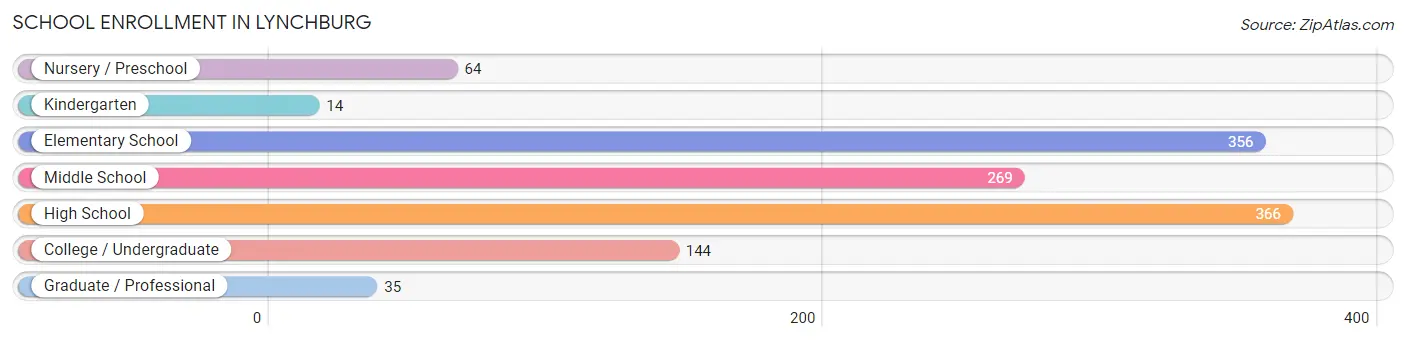
| School Level | # Students | % Students |
| Nursery / Preschool | 64 | 5.1% |
| Kindergarten | 14 | 1.1% |
| Elementary School | 356 | 28.5% |
| Middle School | 269 | 21.5% |
| High School | 366 | 29.3% |
| College / Undergraduate | 144 | 11.5% |
| Graduate / Professional | 35 | 2.8% |
| Total | 1,248 | 100.0% |
School Enrollment by Age by Funding Source in Lynchburg
Out of a total of 1,248 students who are enrolled in schools in Lynchburg, 150 (12.0%) attend a private institution, while the remaining 1,098 (88.0%) are enrolled in public schools. The age group of 18 to 19 year olds has the highest likelihood of being enrolled in private schools, with 18 (28.6% in the age bracket) enrolled. Conversely, the age group of 3 to 4 year olds has the lowest likelihood of being enrolled in a private school, with 43 (100.0% in the age bracket) attending a public institution.
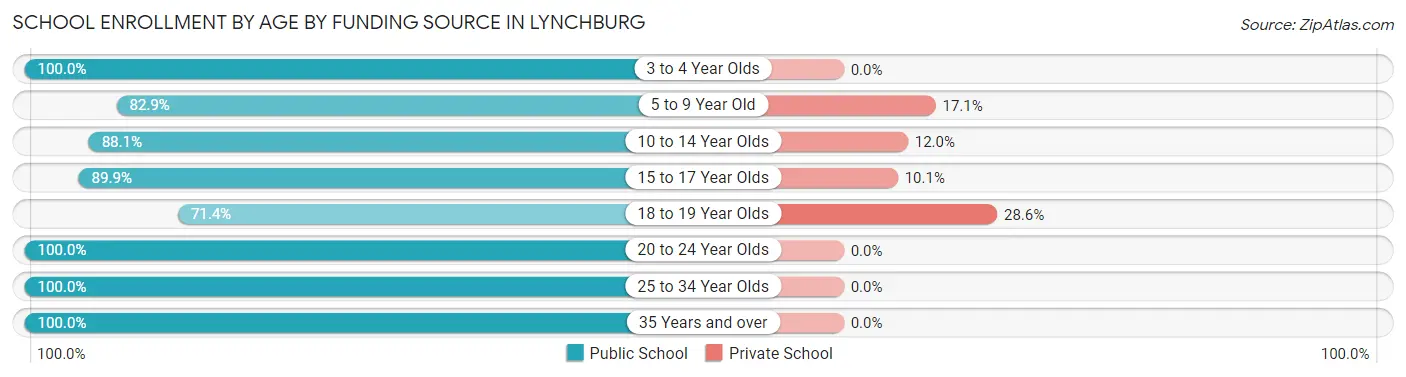
| Age Bracket | Public School | Private School |
| 3 to 4 Year Olds | 43 (100.0%) | 0 (0.0%) |
| 5 to 9 Year Old | 315 (82.9%) | 65 (17.1%) |
| 10 to 14 Year Olds | 280 (88.0%) | 38 (11.9%) |
| 15 to 17 Year Olds | 259 (89.9%) | 29 (10.1%) |
| 18 to 19 Year Olds | 45 (71.4%) | 18 (28.6%) |
| 20 to 24 Year Olds | 53 (100.0%) | 0 (0.0%) |
| 25 to 34 Year Olds | 55 (100.0%) | 0 (0.0%) |
| 35 Years and over | 48 (100.0%) | 0 (0.0%) |
| Total | 1,098 (88.0%) | 150 (12.0%) |
Educational Attainment by Field of Study in Lynchburg
Business (226 | 18.9%), education (198 | 16.6%), engineering (197 | 16.5%), science & technology (124 | 10.4%), and psychology (81 | 6.8%) are the most common fields of study among 1,193 individuals in Lynchburg who have obtained a bachelor's degree or higher.
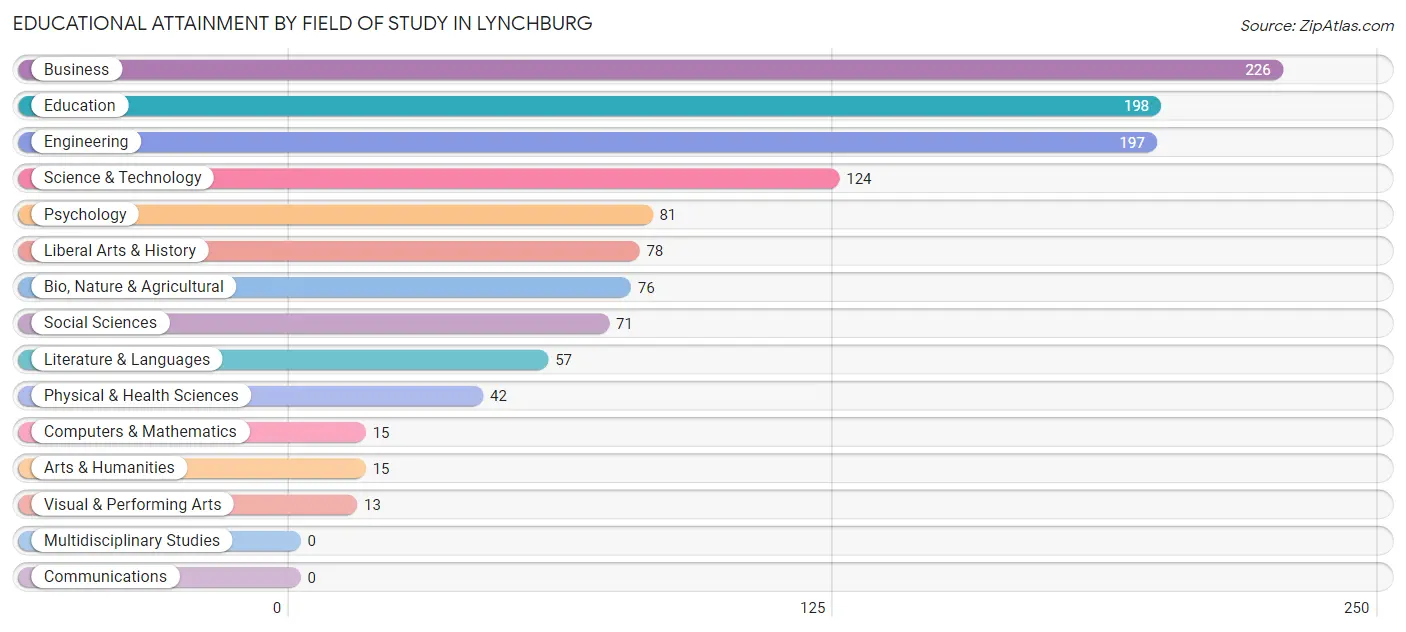
| Field of Study | # Graduates | % Graduates |
| Computers & Mathematics | 15 | 1.3% |
| Bio, Nature & Agricultural | 76 | 6.4% |
| Physical & Health Sciences | 42 | 3.5% |
| Psychology | 81 | 6.8% |
| Social Sciences | 71 | 5.9% |
| Engineering | 197 | 16.5% |
| Multidisciplinary Studies | 0 | 0.0% |
| Science & Technology | 124 | 10.4% |
| Business | 226 | 18.9% |
| Education | 198 | 16.6% |
| Literature & Languages | 57 | 4.8% |
| Liberal Arts & History | 78 | 6.5% |
| Visual & Performing Arts | 13 | 1.1% |
| Communications | 0 | 0.0% |
| Arts & Humanities | 15 | 1.3% |
| Total | 1,193 | 100.0% |
Transportation & Commute in Lynchburg
Vehicle Availability by Sex in Lynchburg
The most prevalent vehicle ownership categories in Lynchburg are males with 2 vehicles (782, accounting for 48.1%) and females with 2 vehicles (408, making up 63.4%).
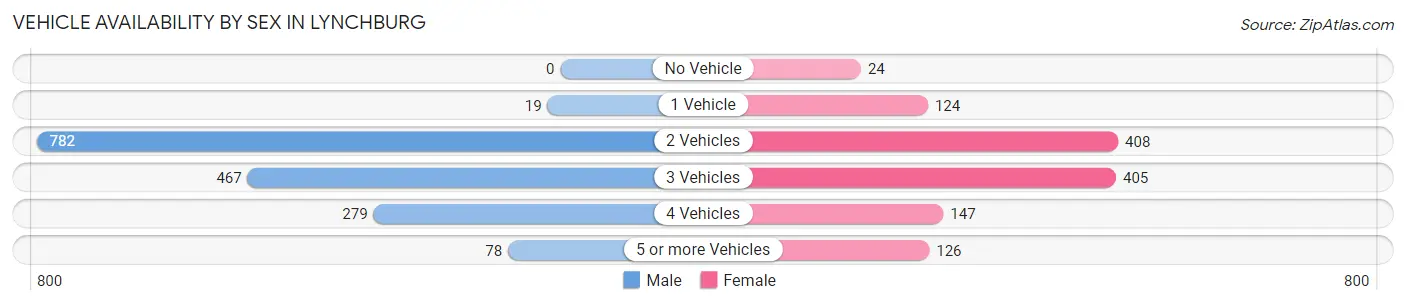
| Vehicles Available | Male | Female |
| No Vehicle | 0 (0.0%) | 24 (1.9%) |
| 1 Vehicle | 19 (1.2%) | 124 (10.1%) |
| 2 Vehicles | 782 (48.1%) | 408 (33.1%) |
| 3 Vehicles | 467 (28.7%) | 405 (32.8%) |
| 4 Vehicles | 279 (17.2%) | 147 (11.9%) |
| 5 or more Vehicles | 78 (4.8%) | 126 (10.2%) |
| Total | 1,625 (100.0%) | 1,234 (100.0%) |
Commute Time in Lynchburg
The most frequently occuring commute durations in Lynchburg are 30 to 34 minutes (596 commuters, 22.0%), 10 to 14 minutes (529 commuters, 19.5%), and 20 to 24 minutes (434 commuters, 16.0%).
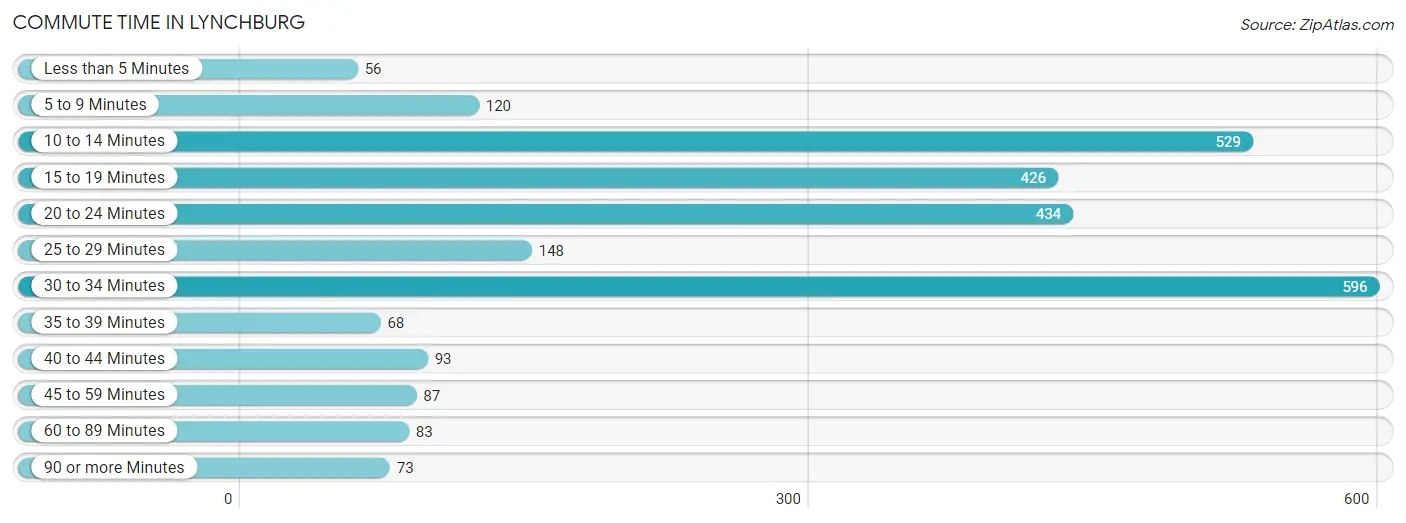
| Commute Time | # Commuters | % Commuters |
| Less than 5 Minutes | 56 | 2.1% |
| 5 to 9 Minutes | 120 | 4.4% |
| 10 to 14 Minutes | 529 | 19.5% |
| 15 to 19 Minutes | 426 | 15.7% |
| 20 to 24 Minutes | 434 | 16.0% |
| 25 to 29 Minutes | 148 | 5.5% |
| 30 to 34 Minutes | 596 | 22.0% |
| 35 to 39 Minutes | 68 | 2.5% |
| 40 to 44 Minutes | 93 | 3.4% |
| 45 to 59 Minutes | 87 | 3.2% |
| 60 to 89 Minutes | 83 | 3.1% |
| 90 or more Minutes | 73 | 2.7% |
Commute Time by Sex in Lynchburg
The most common commute times in Lynchburg are 30 to 34 minutes (411 commuters, 26.9%) for males and 10 to 14 minutes (343 commuters, 29.0%) for females.
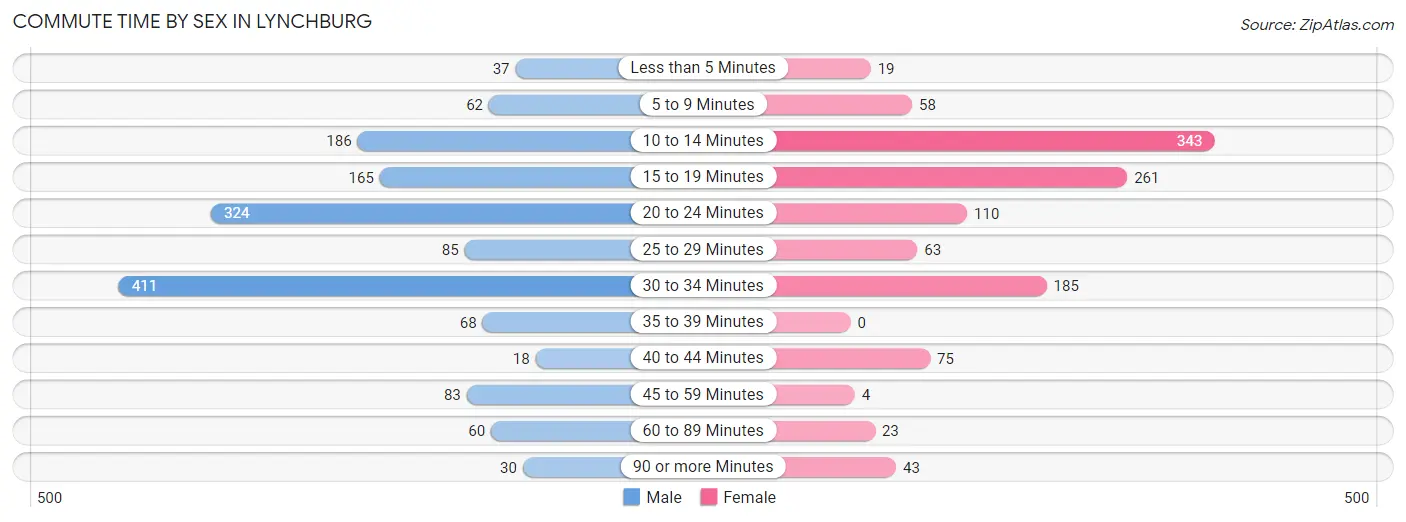
| Commute Time | Male | Female |
| Less than 5 Minutes | 37 (2.4%) | 19 (1.6%) |
| 5 to 9 Minutes | 62 (4.1%) | 58 (4.9%) |
| 10 to 14 Minutes | 186 (12.2%) | 343 (29.0%) |
| 15 to 19 Minutes | 165 (10.8%) | 261 (22.0%) |
| 20 to 24 Minutes | 324 (21.2%) | 110 (9.3%) |
| 25 to 29 Minutes | 85 (5.6%) | 63 (5.3%) |
| 30 to 34 Minutes | 411 (26.9%) | 185 (15.6%) |
| 35 to 39 Minutes | 68 (4.4%) | 0 (0.0%) |
| 40 to 44 Minutes | 18 (1.2%) | 75 (6.3%) |
| 45 to 59 Minutes | 83 (5.4%) | 4 (0.3%) |
| 60 to 89 Minutes | 60 (3.9%) | 23 (1.9%) |
| 90 or more Minutes | 30 (2.0%) | 43 (3.6%) |
Time of Departure to Work by Sex in Lynchburg
The most frequent times of departure to work in Lynchburg are 6:30 AM to 6:59 AM (223, 14.6%) for males and 6:30 AM to 6:59 AM (326, 27.5%) for females.
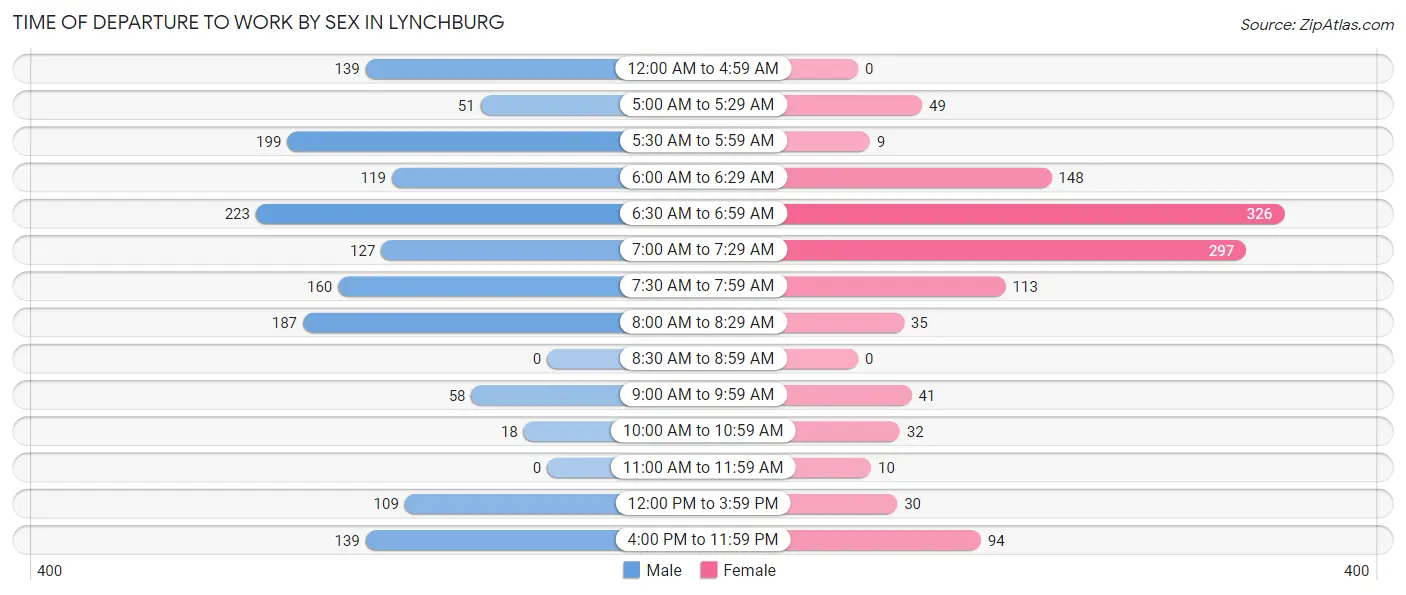
| Time of Departure | Male | Female |
| 12:00 AM to 4:59 AM | 139 (9.1%) | 0 (0.0%) |
| 5:00 AM to 5:29 AM | 51 (3.3%) | 49 (4.1%) |
| 5:30 AM to 5:59 AM | 199 (13.0%) | 9 (0.8%) |
| 6:00 AM to 6:29 AM | 119 (7.8%) | 148 (12.5%) |
| 6:30 AM to 6:59 AM | 223 (14.6%) | 326 (27.5%) |
| 7:00 AM to 7:29 AM | 127 (8.3%) | 297 (25.1%) |
| 7:30 AM to 7:59 AM | 160 (10.5%) | 113 (9.5%) |
| 8:00 AM to 8:29 AM | 187 (12.2%) | 35 (3.0%) |
| 8:30 AM to 8:59 AM | 0 (0.0%) | 0 (0.0%) |
| 9:00 AM to 9:59 AM | 58 (3.8%) | 41 (3.5%) |
| 10:00 AM to 10:59 AM | 18 (1.2%) | 32 (2.7%) |
| 11:00 AM to 11:59 AM | 0 (0.0%) | 10 (0.8%) |
| 12:00 PM to 3:59 PM | 109 (7.1%) | 30 (2.5%) |
| 4:00 PM to 11:59 PM | 139 (9.1%) | 94 (7.9%) |
| Total | 1,529 (100.0%) | 1,184 (100.0%) |
Housing Occupancy in Lynchburg
Occupancy by Ownership in Lynchburg
Of the total 2,558 dwellings in Lynchburg, owner-occupied units account for 2,159 (84.4%), while renter-occupied units make up 399 (15.6%).
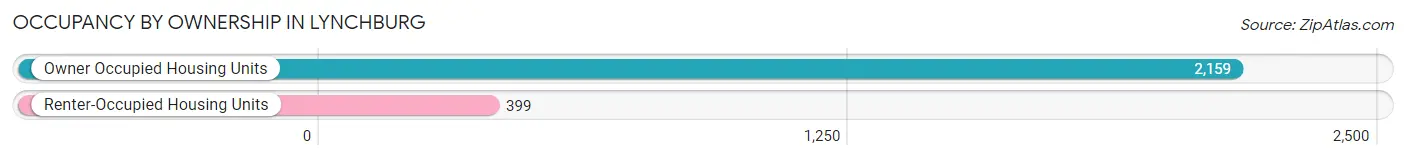
| Occupancy | # Housing Units | % Housing Units |
| Owner Occupied Housing Units | 2,159 | 84.4% |
| Renter-Occupied Housing Units | 399 | 15.6% |
| Total Occupied Housing Units | 2,558 | 100.0% |
Occupancy by Household Size in Lynchburg
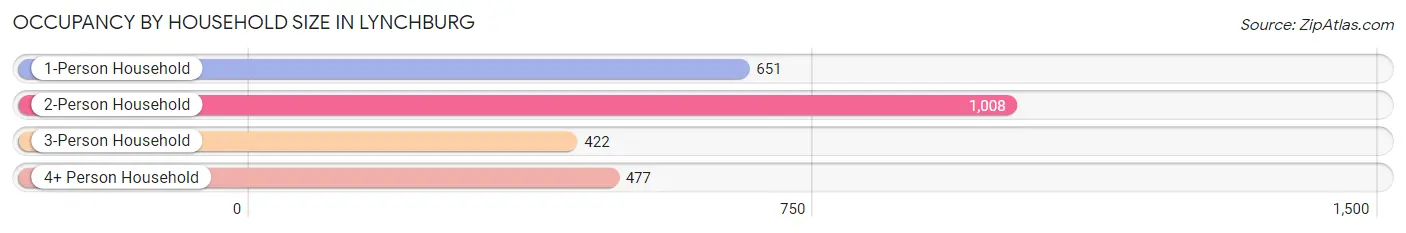
| Household Size | # Housing Units | % Housing Units |
| 1-Person Household | 651 | 25.5% |
| 2-Person Household | 1,008 | 39.4% |
| 3-Person Household | 422 | 16.5% |
| 4+ Person Household | 477 | 18.6% |
| Total Housing Units | 2,558 | 100.0% |
Occupancy by Ownership by Household Size in Lynchburg
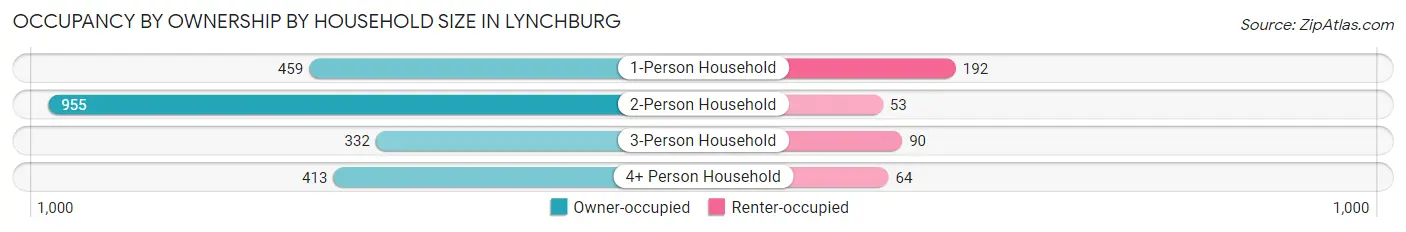
| Household Size | Owner-occupied | Renter-occupied |
| 1-Person Household | 459 (70.5%) | 192 (29.5%) |
| 2-Person Household | 955 (94.7%) | 53 (5.3%) |
| 3-Person Household | 332 (78.7%) | 90 (21.3%) |
| 4+ Person Household | 413 (86.6%) | 64 (13.4%) |
| Total Housing Units | 2,159 (84.4%) | 399 (15.6%) |
Occupancy by Educational Attainment in Lynchburg
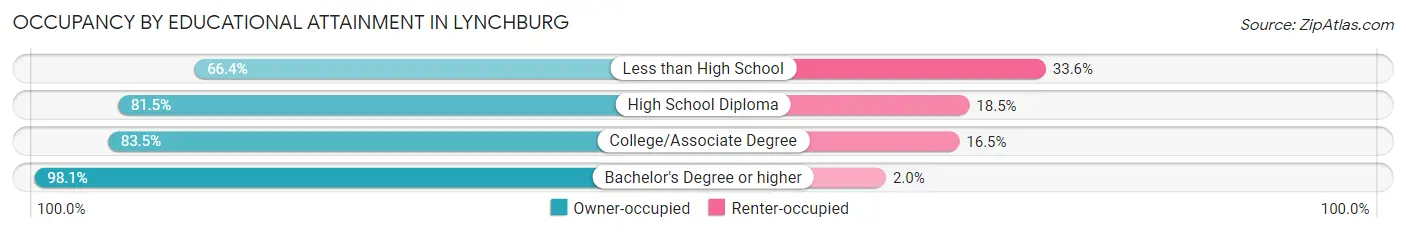
| Household Size | Owner-occupied | Renter-occupied |
| Less than High School | 213 (66.4%) | 108 (33.6%) |
| High School Diploma | 776 (81.5%) | 176 (18.5%) |
| College/Associate Degree | 516 (83.5%) | 102 (16.5%) |
| Bachelor's Degree or higher | 654 (98.1%) | 13 (1.9%) |
Occupancy by Age of Householder in Lynchburg
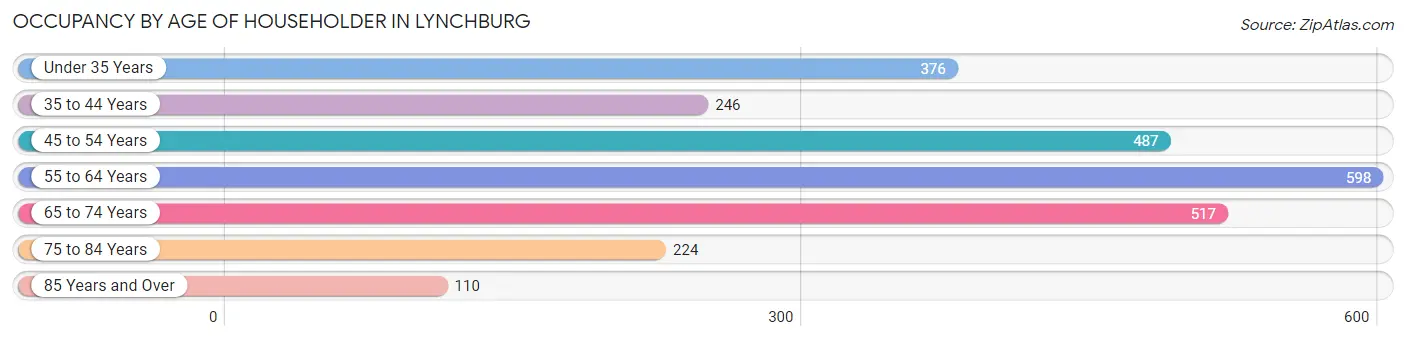
| Age Bracket | # Households | % Households |
| Under 35 Years | 376 | 14.7% |
| 35 to 44 Years | 246 | 9.6% |
| 45 to 54 Years | 487 | 19.0% |
| 55 to 64 Years | 598 | 23.4% |
| 65 to 74 Years | 517 | 20.2% |
| 75 to 84 Years | 224 | 8.8% |
| 85 Years and Over | 110 | 4.3% |
| Total | 2,558 | 100.0% |
Housing Finances in Lynchburg
Median Income by Occupancy in Lynchburg
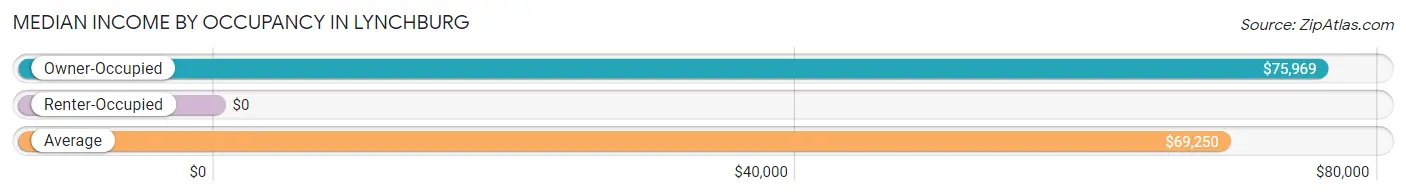
| Occupancy Type | # Households | Median Income |
| Owner-Occupied | 2,159 (84.4%) | $75,969 |
| Renter-Occupied | 399 (15.6%) | $0 |
| Average | 2,558 (100.0%) | $69,250 |
Occupancy by Householder Income Bracket in Lynchburg
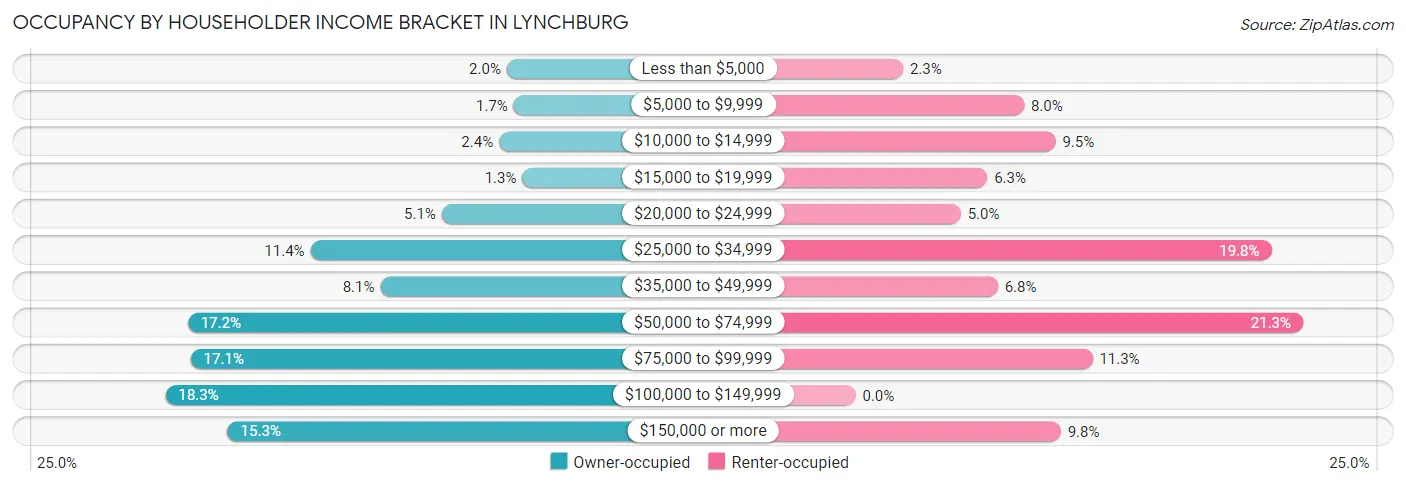
| Income Bracket | Owner-occupied | Renter-occupied |
| Less than $5,000 | 44 (2.0%) | 9 (2.3%) |
| $5,000 to $9,999 | 37 (1.7%) | 32 (8.0%) |
| $10,000 to $14,999 | 52 (2.4%) | 38 (9.5%) |
| $15,000 to $19,999 | 28 (1.3%) | 25 (6.3%) |
| $20,000 to $24,999 | 111 (5.1%) | 20 (5.0%) |
| $25,000 to $34,999 | 246 (11.4%) | 79 (19.8%) |
| $35,000 to $49,999 | 174 (8.1%) | 27 (6.8%) |
| $50,000 to $74,999 | 372 (17.2%) | 85 (21.3%) |
| $75,000 to $99,999 | 369 (17.1%) | 45 (11.3%) |
| $100,000 to $149,999 | 395 (18.3%) | 0 (0.0%) |
| $150,000 or more | 331 (15.3%) | 39 (9.8%) |
| Total | 2,159 (100.0%) | 399 (100.0%) |
Monthly Housing Cost Tiers in Lynchburg
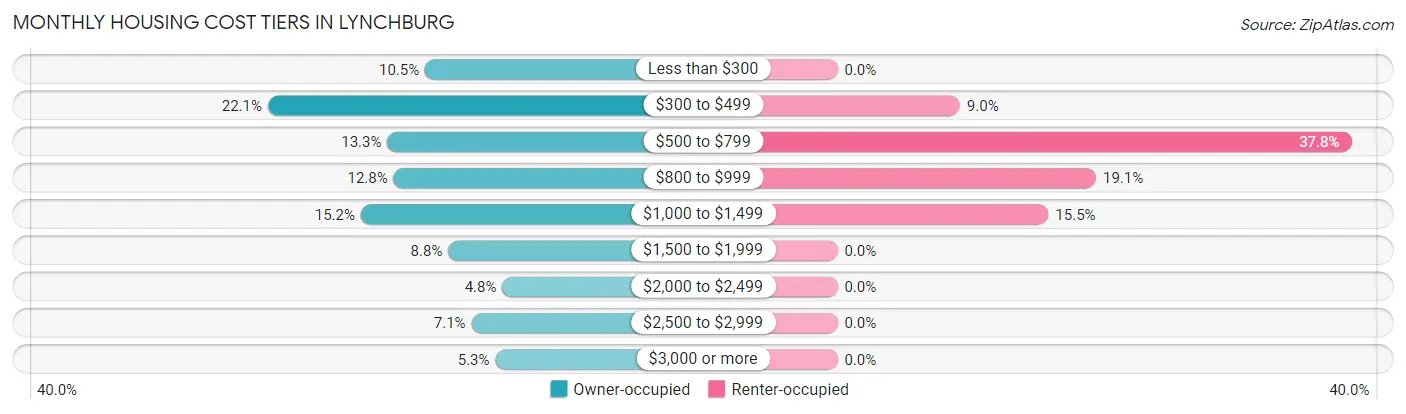
| Monthly Cost | Owner-occupied | Renter-occupied |
| Less than $300 | 227 (10.5%) | 0 (0.0%) |
| $300 to $499 | 477 (22.1%) | 36 (9.0%) |
| $500 to $799 | 287 (13.3%) | 151 (37.8%) |
| $800 to $999 | 277 (12.8%) | 76 (19.1%) |
| $1,000 to $1,499 | 329 (15.2%) | 62 (15.5%) |
| $1,500 to $1,999 | 190 (8.8%) | 0 (0.0%) |
| $2,000 to $2,499 | 104 (4.8%) | 0 (0.0%) |
| $2,500 to $2,999 | 153 (7.1%) | 0 (0.0%) |
| $3,000 or more | 115 (5.3%) | 0 (0.0%) |
| Total | 2,159 (100.0%) | 399 (100.0%) |
Physical Housing Characteristics in Lynchburg
Housing Structures in Lynchburg
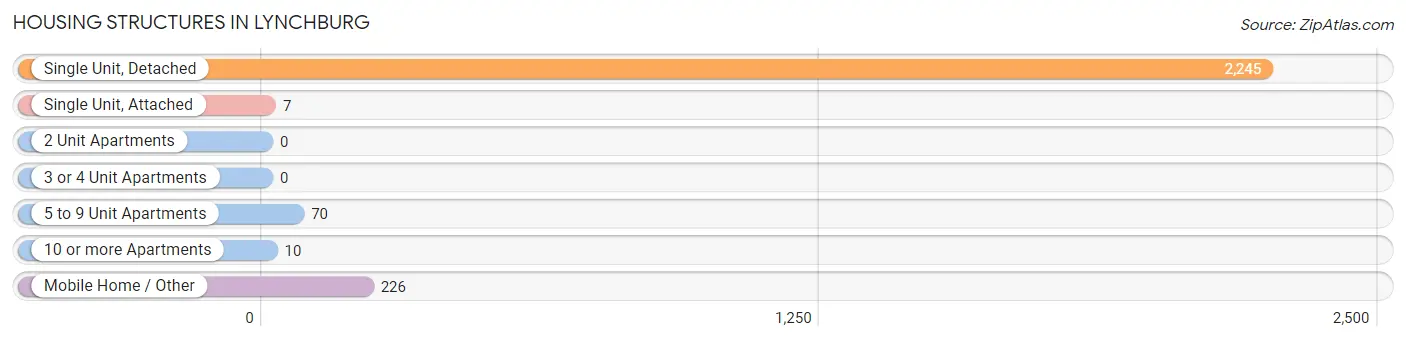
| Structure Type | # Housing Units | % Housing Units |
| Single Unit, Detached | 2,245 | 87.8% |
| Single Unit, Attached | 7 | 0.3% |
| 2 Unit Apartments | 0 | 0.0% |
| 3 or 4 Unit Apartments | 0 | 0.0% |
| 5 to 9 Unit Apartments | 70 | 2.7% |
| 10 or more Apartments | 10 | 0.4% |
| Mobile Home / Other | 226 | 8.8% |
| Total | 2,558 | 100.0% |
Housing Structures by Occupancy in Lynchburg
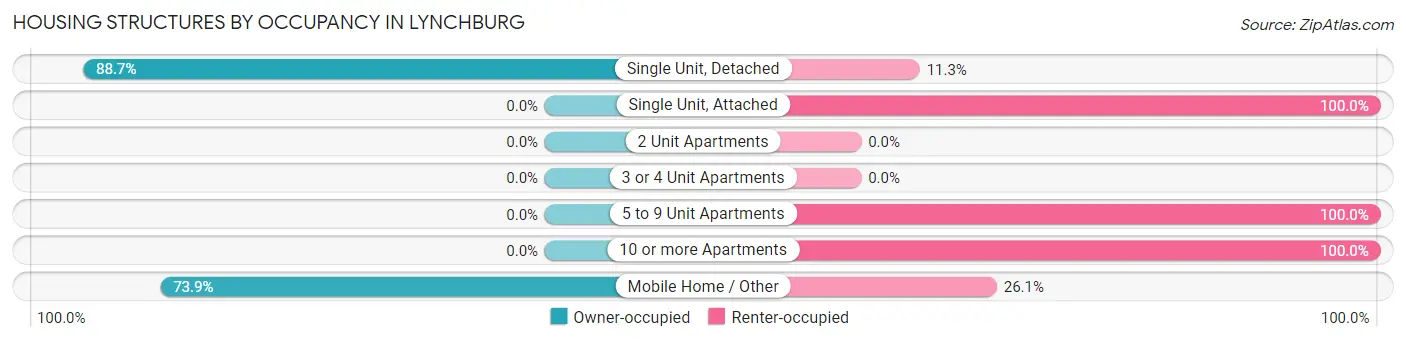
| Structure Type | Owner-occupied | Renter-occupied |
| Single Unit, Detached | 1,992 (88.7%) | 253 (11.3%) |
| Single Unit, Attached | 0 (0.0%) | 7 (100.0%) |
| 2 Unit Apartments | 0 (0.0%) | 0 (0.0%) |
| 3 or 4 Unit Apartments | 0 (0.0%) | 0 (0.0%) |
| 5 to 9 Unit Apartments | 0 (0.0%) | 70 (100.0%) |
| 10 or more Apartments | 0 (0.0%) | 10 (100.0%) |
| Mobile Home / Other | 167 (73.9%) | 59 (26.1%) |
| Total | 2,159 (84.4%) | 399 (15.6%) |
Housing Structures by Number of Rooms in Lynchburg
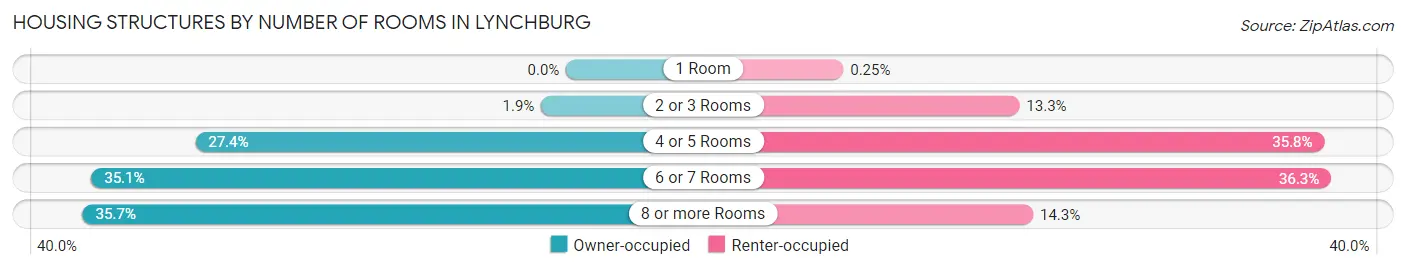
| Number of Rooms | Owner-occupied | Renter-occupied |
| 1 Room | 0 (0.0%) | 1 (0.3%) |
| 2 or 3 Rooms | 40 (1.8%) | 53 (13.3%) |
| 4 or 5 Rooms | 591 (27.4%) | 143 (35.8%) |
| 6 or 7 Rooms | 757 (35.1%) | 145 (36.3%) |
| 8 or more Rooms | 771 (35.7%) | 57 (14.3%) |
| Total | 2,159 (100.0%) | 399 (100.0%) |
Housing Structure by Heating Type in Lynchburg
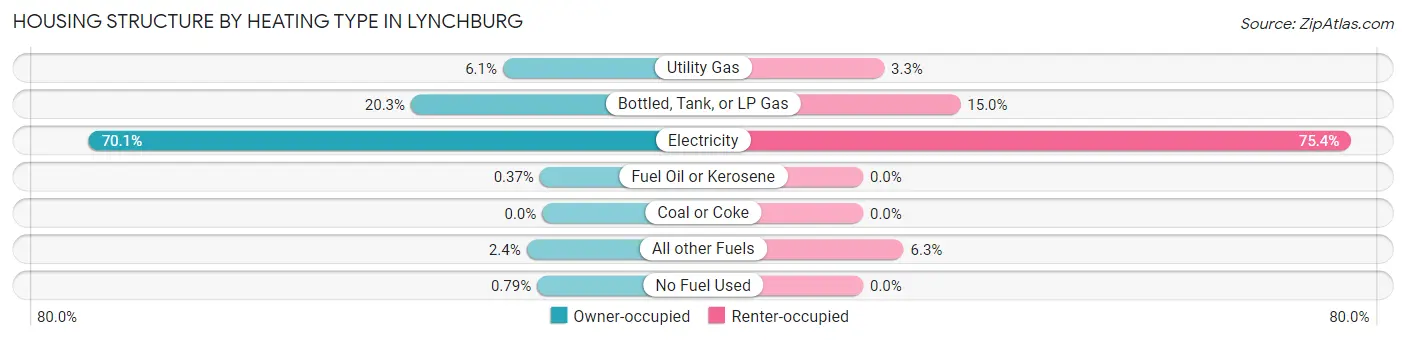
| Heating Type | Owner-occupied | Renter-occupied |
| Utility Gas | 131 (6.1%) | 13 (3.3%) |
| Bottled, Tank, or LP Gas | 438 (20.3%) | 60 (15.0%) |
| Electricity | 1,513 (70.1%) | 301 (75.4%) |
| Fuel Oil or Kerosene | 8 (0.4%) | 0 (0.0%) |
| Coal or Coke | 0 (0.0%) | 0 (0.0%) |
| All other Fuels | 52 (2.4%) | 25 (6.3%) |
| No Fuel Used | 17 (0.8%) | 0 (0.0%) |
| Total | 2,159 (100.0%) | 399 (100.0%) |
Household Vehicle Usage in Lynchburg
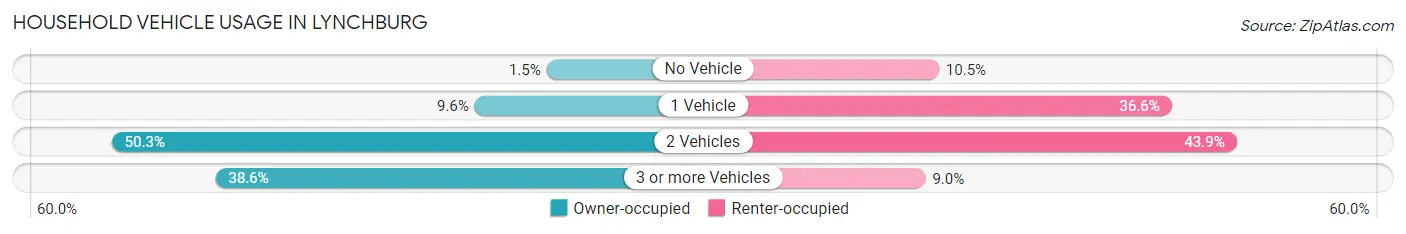
| Vehicles per Household | Owner-occupied | Renter-occupied |
| No Vehicle | 33 (1.5%) | 42 (10.5%) |
| 1 Vehicle | 207 (9.6%) | 146 (36.6%) |
| 2 Vehicles | 1,085 (50.2%) | 175 (43.9%) |
| 3 or more Vehicles | 834 (38.6%) | 36 (9.0%) |
| Total | 2,159 (100.0%) | 399 (100.0%) |
Real Estate & Mortgages in Lynchburg
Real Estate and Mortgage Overview in Lynchburg
| Characteristic | Without Mortgage | With Mortgage |
| Housing Units | 997 | 1,162 |
| Median Property Value | $202,100 | $330,100 |
| Median Household Income | $62,862 | $223 |
| Monthly Housing Costs | $397 | $115 |
| Real Estate Taxes | $1,072 | $46 |
Property Value by Mortgage Status in Lynchburg
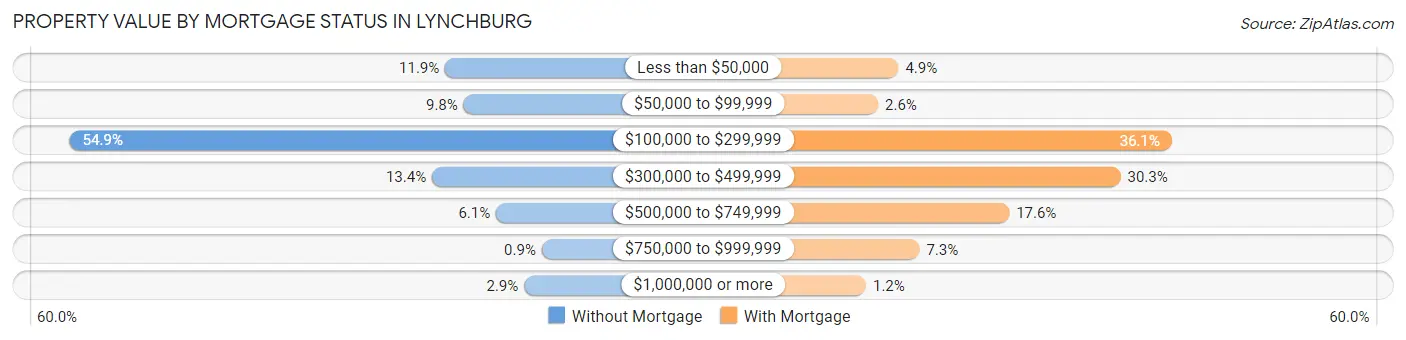
| Property Value | Without Mortgage | With Mortgage |
| Less than $50,000 | 119 (11.9%) | 57 (4.9%) |
| $50,000 to $99,999 | 98 (9.8%) | 30 (2.6%) |
| $100,000 to $299,999 | 547 (54.9%) | 420 (36.1%) |
| $300,000 to $499,999 | 134 (13.4%) | 352 (30.3%) |
| $500,000 to $749,999 | 61 (6.1%) | 204 (17.6%) |
| $750,000 to $999,999 | 9 (0.9%) | 85 (7.3%) |
| $1,000,000 or more | 29 (2.9%) | 14 (1.2%) |
| Total | 997 (100.0%) | 1,162 (100.0%) |
Household Income by Mortgage Status in Lynchburg
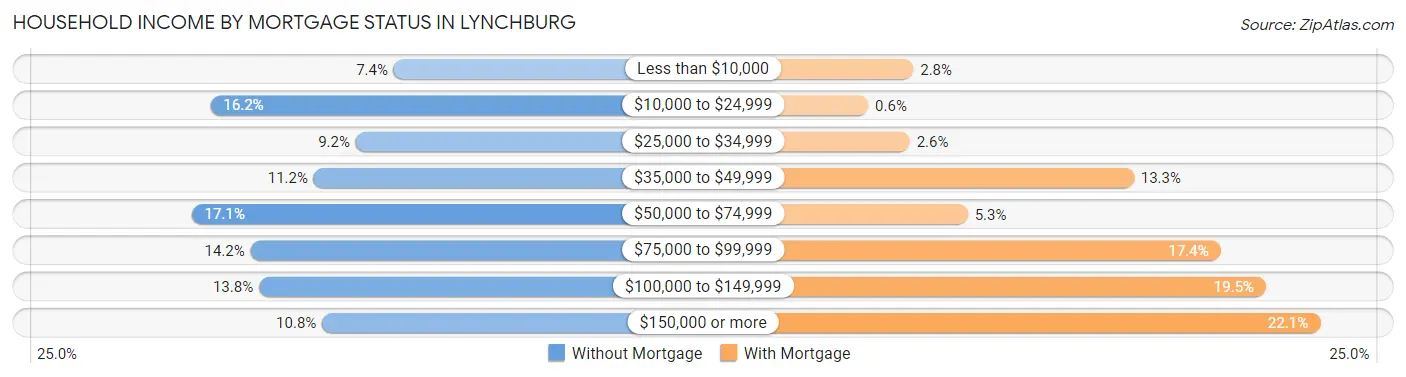
| Household Income | Without Mortgage | With Mortgage |
| Less than $10,000 | 74 (7.4%) | 32 (2.8%) |
| $10,000 to $24,999 | 161 (16.2%) | 7 (0.6%) |
| $25,000 to $34,999 | 92 (9.2%) | 30 (2.6%) |
| $35,000 to $49,999 | 112 (11.2%) | 154 (13.3%) |
| $50,000 to $74,999 | 170 (17.1%) | 62 (5.3%) |
| $75,000 to $99,999 | 142 (14.2%) | 202 (17.4%) |
| $100,000 to $149,999 | 138 (13.8%) | 227 (19.5%) |
| $150,000 or more | 108 (10.8%) | 257 (22.1%) |
| Total | 997 (100.0%) | 1,162 (100.0%) |
Property Value to Household Income Ratio in Lynchburg
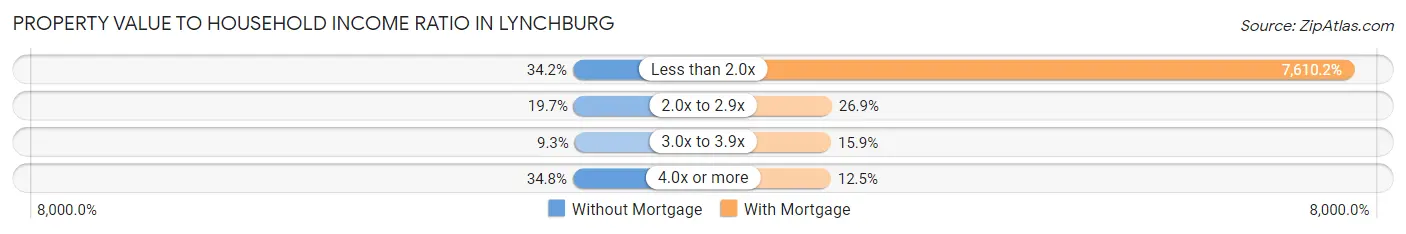
| Value-to-Income Ratio | Without Mortgage | With Mortgage |
| Less than 2.0x | 341 (34.2%) | 88,430 (7,610.2%) |
| 2.0x to 2.9x | 196 (19.7%) | 312 (26.9%) |
| 3.0x to 3.9x | 93 (9.3%) | 185 (15.9%) |
| 4.0x or more | 347 (34.8%) | 145 (12.5%) |
| Total | 997 (100.0%) | 1,162 (100.0%) |
Real Estate Taxes by Mortgage Status in Lynchburg
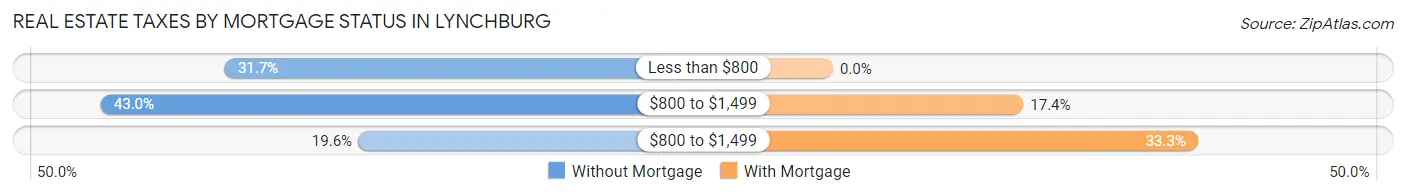
| Property Taxes | Without Mortgage | With Mortgage |
| Less than $800 | 316 (31.7%) | 0 (0.0%) |
| $800 to $1,499 | 429 (43.0%) | 202 (17.4%) |
| $800 to $1,499 | 195 (19.6%) | 387 (33.3%) |
| Total | 997 (100.0%) | 1,162 (100.0%) |
Health & Disability in Lynchburg
Health Insurance Coverage by Age in Lynchburg
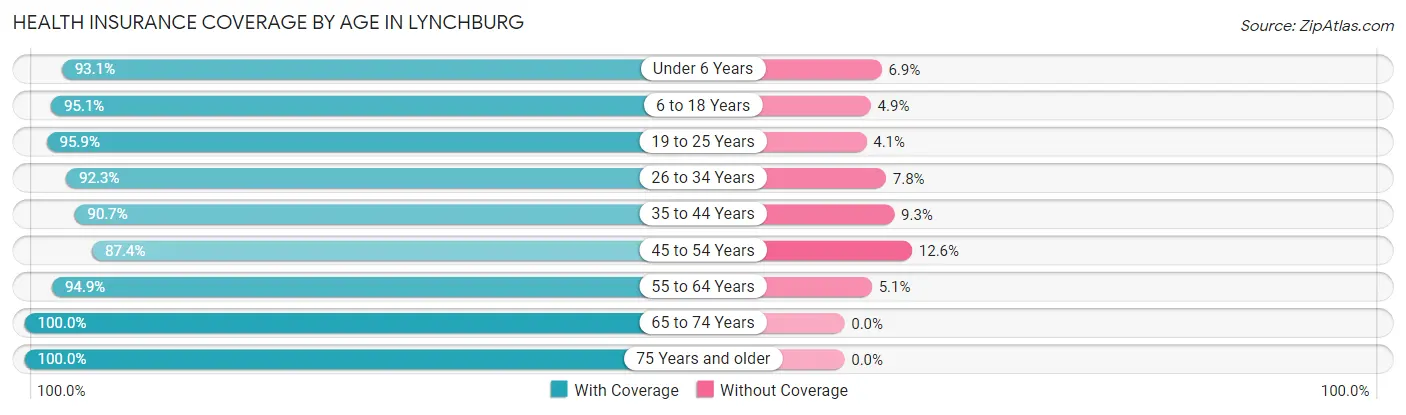
| Age Bracket | With Coverage | Without Coverage |
| Under 6 Years | 282 (93.1%) | 21 (6.9%) |
| 6 to 18 Years | 1,024 (95.1%) | 53 (4.9%) |
| 19 to 25 Years | 421 (95.9%) | 18 (4.1%) |
| 26 to 34 Years | 524 (92.2%) | 44 (7.7%) |
| 35 to 44 Years | 654 (90.7%) | 67 (9.3%) |
| 45 to 54 Years | 784 (87.4%) | 113 (12.6%) |
| 55 to 64 Years | 1,076 (94.9%) | 58 (5.1%) |
| 65 to 74 Years | 786 (100.0%) | 0 (0.0%) |
| 75 Years and older | 546 (100.0%) | 0 (0.0%) |
| Total | 6,097 (94.2%) | 374 (5.8%) |
Health Insurance Coverage by Citizenship Status in Lynchburg
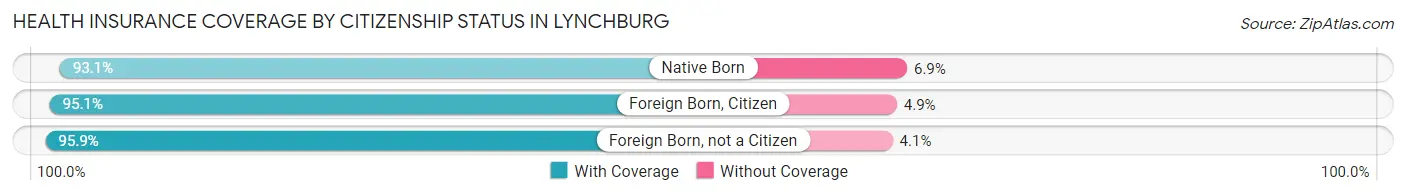
| Citizenship Status | With Coverage | Without Coverage |
| Native Born | 282 (93.1%) | 21 (6.9%) |
| Foreign Born, Citizen | 1,024 (95.1%) | 53 (4.9%) |
| Foreign Born, not a Citizen | 421 (95.9%) | 18 (4.1%) |
Health Insurance Coverage by Household Income in Lynchburg
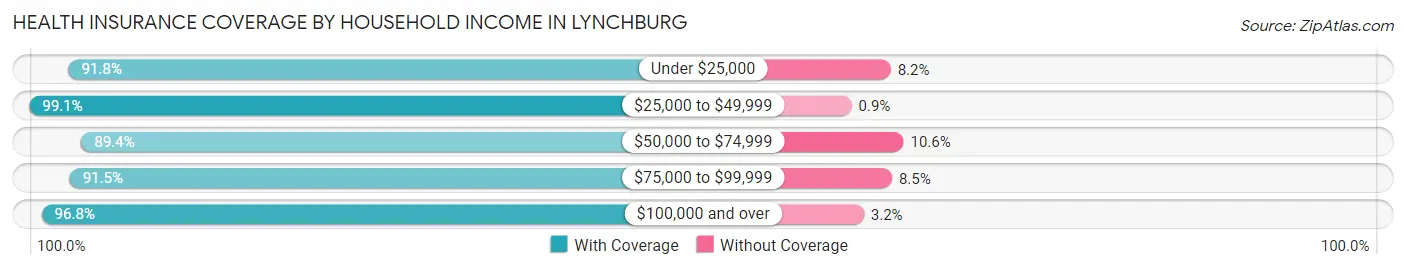
| Household Income | With Coverage | Without Coverage |
| Under $25,000 | 647 (91.8%) | 58 (8.2%) |
| $25,000 to $49,999 | 1,099 (99.1%) | 10 (0.9%) |
| $50,000 to $74,999 | 958 (89.4%) | 114 (10.6%) |
| $75,000 to $99,999 | 1,244 (91.5%) | 115 (8.5%) |
| $100,000 and over | 2,147 (96.8%) | 71 (3.2%) |
Public vs Private Health Insurance Coverage by Age in Lynchburg
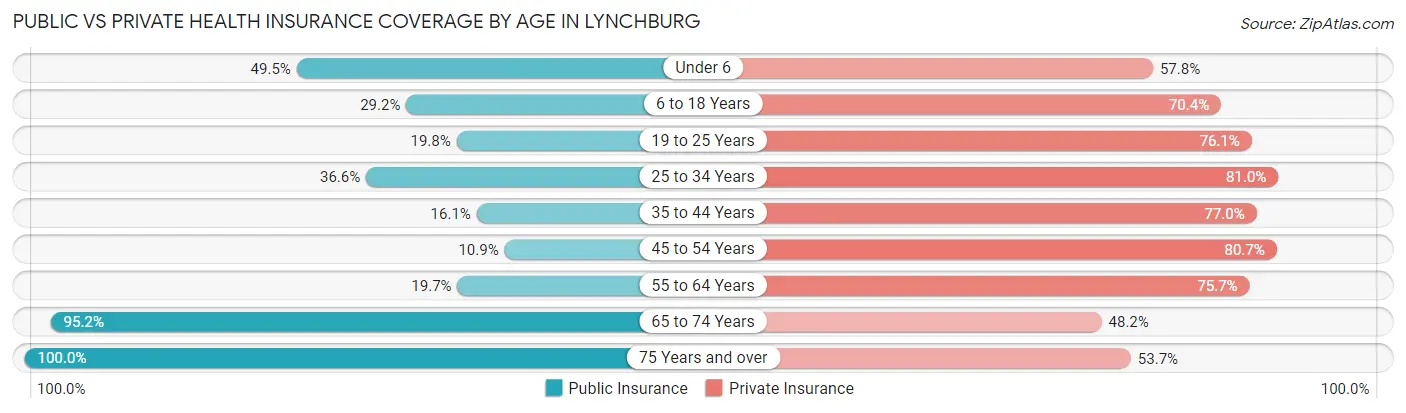
| Age Bracket | Public Insurance | Private Insurance |
| Under 6 | 150 (49.5%) | 175 (57.8%) |
| 6 to 18 Years | 314 (29.2%) | 758 (70.4%) |
| 19 to 25 Years | 87 (19.8%) | 334 (76.1%) |
| 25 to 34 Years | 208 (36.6%) | 460 (81.0%) |
| 35 to 44 Years | 116 (16.1%) | 555 (77.0%) |
| 45 to 54 Years | 98 (10.9%) | 724 (80.7%) |
| 55 to 64 Years | 223 (19.7%) | 858 (75.7%) |
| 65 to 74 Years | 748 (95.2%) | 379 (48.2%) |
| 75 Years and over | 546 (100.0%) | 293 (53.7%) |
| Total | 2,490 (38.5%) | 4,536 (70.1%) |
Disability Status by Sex by Age in Lynchburg
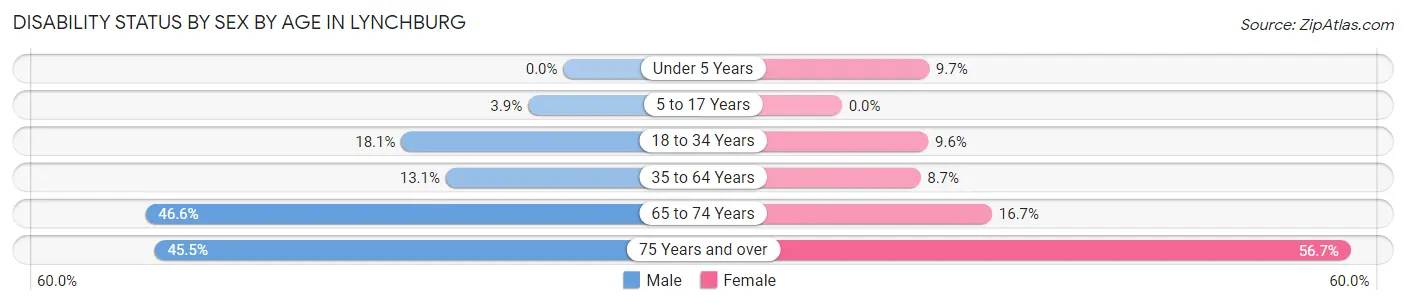
| Age Bracket | Male | Female |
| Under 5 Years | 0 (0.0%) | 13 (9.7%) |
| 5 to 17 Years | 20 (3.9%) | 0 (0.0%) |
| 18 to 34 Years | 96 (18.0%) | 56 (9.6%) |
| 35 to 64 Years | 182 (13.1%) | 119 (8.7%) |
| 65 to 74 Years | 182 (46.6%) | 66 (16.7%) |
| 75 Years and over | 112 (45.5%) | 170 (56.7%) |
Disability Class by Sex by Age in Lynchburg
Disability Class: Hearing Difficulty
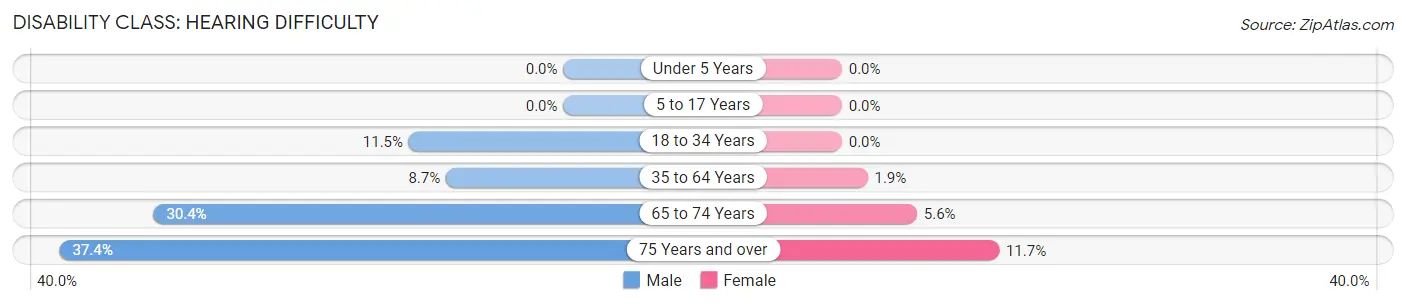
| Age Bracket | Male | Female |
| Under 5 Years | 0 (0.0%) | 0 (0.0%) |
| 5 to 17 Years | 0 (0.0%) | 0 (0.0%) |
| 18 to 34 Years | 61 (11.5%) | 0 (0.0%) |
| 35 to 64 Years | 121 (8.7%) | 26 (1.9%) |
| 65 to 74 Years | 119 (30.4%) | 22 (5.6%) |
| 75 Years and over | 92 (37.4%) | 35 (11.7%) |
Disability Class: Vision Difficulty
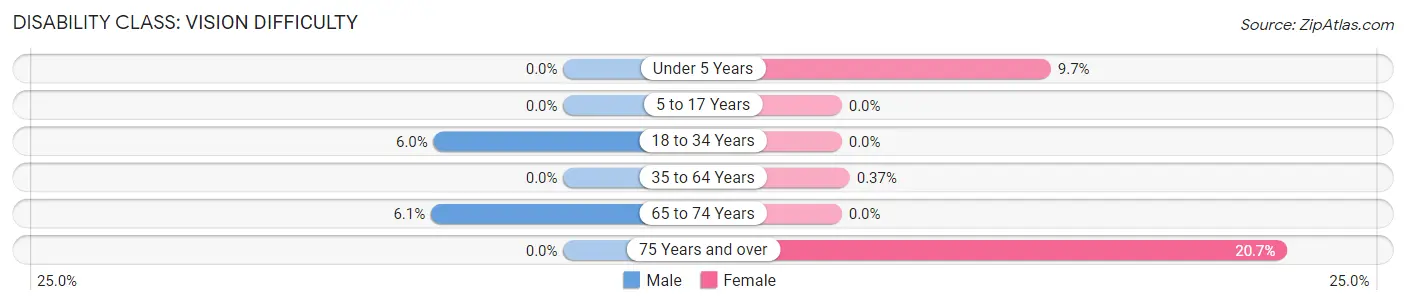
| Age Bracket | Male | Female |
| Under 5 Years | 0 (0.0%) | 13 (9.7%) |
| 5 to 17 Years | 0 (0.0%) | 0 (0.0%) |
| 18 to 34 Years | 32 (6.0%) | 0 (0.0%) |
| 35 to 64 Years | 0 (0.0%) | 5 (0.4%) |
| 65 to 74 Years | 24 (6.1%) | 0 (0.0%) |
| 75 Years and over | 0 (0.0%) | 62 (20.7%) |
Disability Class: Cognitive Difficulty
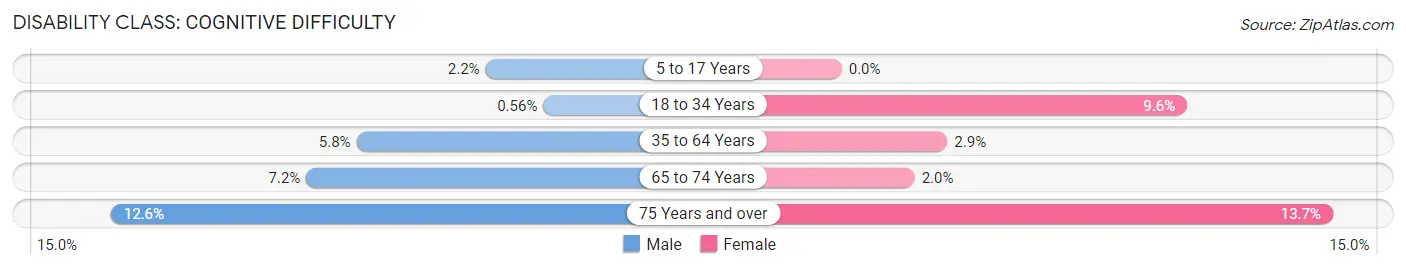
| Age Bracket | Male | Female |
| 5 to 17 Years | 11 (2.2%) | 0 (0.0%) |
| 18 to 34 Years | 3 (0.6%) | 56 (9.6%) |
| 35 to 64 Years | 80 (5.8%) | 40 (2.9%) |
| 65 to 74 Years | 28 (7.2%) | 8 (2.0%) |
| 75 Years and over | 31 (12.6%) | 41 (13.7%) |
Disability Class: Ambulatory Difficulty
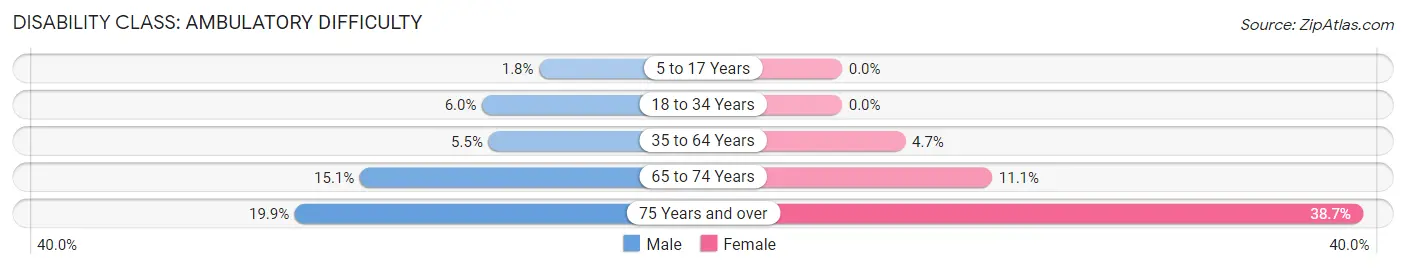
| Age Bracket | Male | Female |
| 5 to 17 Years | 9 (1.8%) | 0 (0.0%) |
| 18 to 34 Years | 32 (6.0%) | 0 (0.0%) |
| 35 to 64 Years | 77 (5.5%) | 64 (4.7%) |
| 65 to 74 Years | 59 (15.1%) | 44 (11.1%) |
| 75 Years and over | 49 (19.9%) | 116 (38.7%) |
Disability Class: Self-Care Difficulty
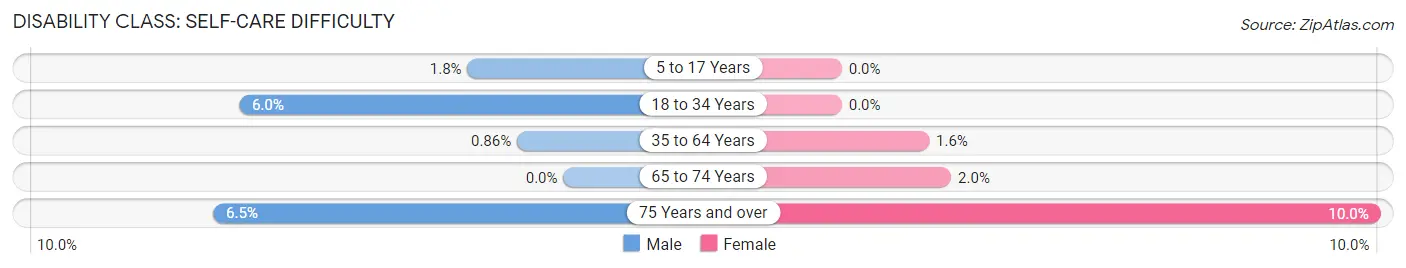
| Age Bracket | Male | Female |
| 5 to 17 Years | 9 (1.8%) | 0 (0.0%) |
| 18 to 34 Years | 32 (6.0%) | 0 (0.0%) |
| 35 to 64 Years | 12 (0.9%) | 22 (1.6%) |
| 65 to 74 Years | 0 (0.0%) | 8 (2.0%) |
| 75 Years and over | 16 (6.5%) | 30 (10.0%) |
Technology Access in Lynchburg
Computing Device Access in Lynchburg
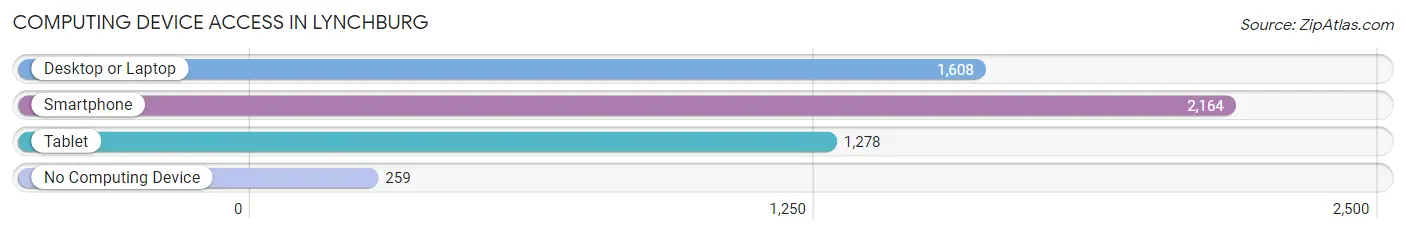
| Device Type | # Households | % Households |
| Desktop or Laptop | 1,608 | 62.9% |
| Smartphone | 2,164 | 84.6% |
| Tablet | 1,278 | 50.0% |
| No Computing Device | 259 | 10.1% |
| Total | 2,558 | 100.0% |
Internet Access in Lynchburg
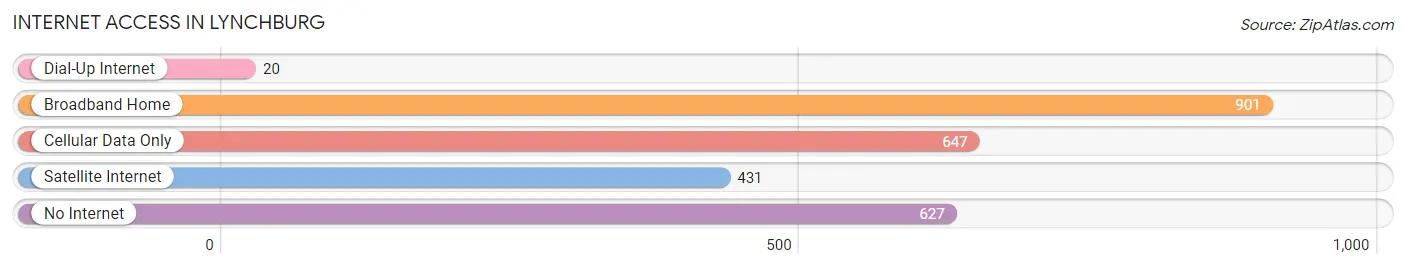
| Internet Type | # Households | % Households |
| Dial-Up Internet | 20 | 0.8% |
| Broadband Home | 901 | 35.2% |
| Cellular Data Only | 647 | 25.3% |
| Satellite Internet | 431 | 16.9% |
| No Internet | 627 | 24.5% |
| Total | 2,558 | 100.0% |
Lynchburg Summary
Lynchburg, Tennessee is a small town located in Moore County, Tennessee. It is the county seat of Moore County and is located in the south-central part of the state. The town was founded in 1836 and is named after its founder, John Lynch. The population of Lynchburg was 6,362 as of the 2010 census.
Geography
Lynchburg is located at 35°25'N 86°25'W. It is situated in the Highland Rim region of Tennessee, which is characterized by rolling hills and limestone outcroppings. The town is located on the banks of the Duck River, which is a major tributary of the Tennessee River. The Duck River is the longest river in Tennessee and is known for its scenic beauty and abundant wildlife. The town is surrounded by several small towns and rural communities, including Fayetteville, Petersburg, and Huntland.
Climate
Lynchburg has a humid subtropical climate, with hot summers and mild winters. The average annual temperature is around 62°F (17°C). The average annual precipitation is around 45 inches (114 cm).
Demographics
As of the 2010 census, Lynchburg had a population of 6,362. The racial makeup of the town was 87.3% White, 8.7% African American, 0.3% Native American, 0.3% Asian, 0.1% Pacific Islander, 1.2% from other races, and 2.3% from two or more races. Hispanic or Latino of any race were 2.7% of the population.
Economy
The economy of Lynchburg is largely based on agriculture and manufacturing. The town is home to several large farms, as well as several small businesses. The town is also home to several manufacturing plants, including a paper mill, a furniture factory, and a plastics plant.
The town is also home to several tourist attractions, including the Jack Daniel's Distillery, which is the oldest registered distillery in the United States. The distillery is a popular tourist destination and is the source of the famous Jack Daniel's whiskey.
Education
Lynchburg is served by the Moore County School District. The district operates several elementary, middle, and high schools, as well as a vocational school. The town is also home to Motlow State Community College, which offers associate degrees and certificate programs.
Conclusion
Lynchburg, Tennessee is a small town located in Moore County, Tennessee. It is the county seat of Moore County and is located in the south-central part of the state. The town was founded in 1836 and is named after its founder, John Lynch. The population of Lynchburg was 6,362 as of the 2010 census. The town is situated in the Highland Rim region of Tennessee and is surrounded by several small towns and rural communities. The economy of Lynchburg is largely based on agriculture and manufacturing, and the town is home to several tourist attractions, including the Jack Daniel's Distillery. The town is served by the Moore County School District, which operates several elementary, middle, and high schools, as well as a vocational school.
Common Questions
What is Per Capita Income in Lynchburg?
Per Capita income in Lynchburg is $35,178.
What is the Median Family Income in Lynchburg?
Median Family Income in Lynchburg is $82,391.
What is the Median Household income in Lynchburg?
Median Household Income in Lynchburg is $69,250.
What is Income or Wage Gap in Lynchburg?
Income or Wage Gap in Lynchburg is 30.8%.
Women in Lynchburg earn 69.2 cents for every dollar earned by a man.
What is Inequality or Gini Index in Lynchburg?
Inequality or Gini Index in Lynchburg is 0.43.
What is the Total Population of Lynchburg?
Total Population of Lynchburg is 6,558.
What is the Total Male Population of Lynchburg?
Total Male Population of Lynchburg is 3,270.
What is the Total Female Population of Lynchburg?
Total Female Population of Lynchburg is 3,288.
What is the Ratio of Males per 100 Females in Lynchburg?
There are 99.45 Males per 100 Females in Lynchburg.
What is the Ratio of Females per 100 Males in Lynchburg?
There are 100.55 Females per 100 Males in Lynchburg.
What is the Median Population Age in Lynchburg?
Median Population Age in Lynchburg is 46.4 Years.
What is the Average Family Size in Lynchburg
Average Family Size in Lynchburg is 3.0 People.
What is the Average Household Size in Lynchburg
Average Household Size in Lynchburg is 2.5 People.
How Large is the Labor Force in Lynchburg?
There are 3,097 People in the Labor Forcein in Lynchburg.
What is the Percentage of People in the Labor Force in Lynchburg?
56.7% of People are in the Labor Force in Lynchburg.
What is the Unemployment Rate in Lynchburg?
Unemployment Rate in Lynchburg is 4.2%.