Sparta, TN Map & Demographics
Sparta Map
Sparta Overview
$23,912
PER CAPITA INCOME
$70,638
AVG FAMILY INCOME
$42,670
AVG HOUSEHOLD INCOME
1.7%
WAGE / INCOME GAP [ % ]
98.3¢/ $1
WAGE / INCOME GAP [ $ ]
$7,440
FAMILY INCOME DEFICIT
0.47
INEQUALITY / GINI INDEX
4,950
TOTAL POPULATION
2,368
MALE POPULATION
2,582
FEMALE POPULATION
91.71
MALES / 100 FEMALES
109.04
FEMALES / 100 MALES
38.7
MEDIAN AGE
2.9
AVG FAMILY SIZE
2.3
AVG HOUSEHOLD SIZE
2,183
LABOR FORCE [ PEOPLE ]
55.4%
PERCENT IN LABOR FORCE
10.9%
UNEMPLOYMENT RATE
Sparta Zip Codes
Sparta Area Codes
Income in Sparta
Income Overview in Sparta
Per Capita Income in Sparta is $23,912, while median incomes of families and households are $70,638 and $42,670 respectively.
| Characteristic | Number | Measure |
| Per Capita Income | 4,950 | $23,912 |
| Median Family Income | 1,293 | $70,638 |
| Mean Family Income | 1,293 | $67,363 |
| Median Household Income | 1,988 | $42,670 |
| Mean Household Income | 1,988 | $57,522 |
| Income Deficit | 1,293 | $7,440 |
| Wage / Income Gap (%) | 4,950 | 1.68% |
| Wage / Income Gap ($) | 4,950 | 98.32¢ per $1 |
| Gini / Inequality Index | 4,950 | 0.47 |
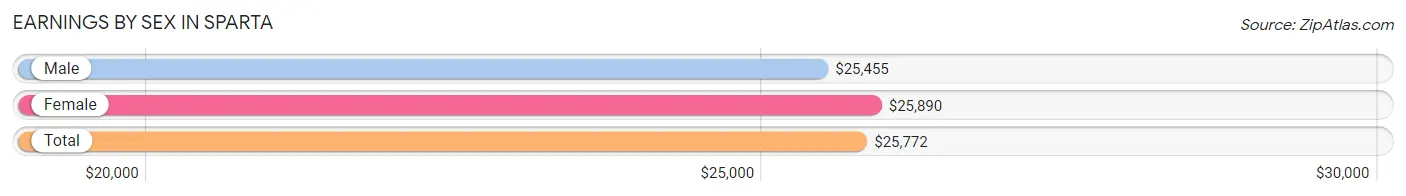
Earnings by Sex in Sparta
Average Earnings in Sparta are $25,772, $25,455 for men and $25,890 for women, a difference of 1.7%.
| Sex | Number | Average Earnings |
| Male | 1,154 (48.5%) | $25,455 |
| Female | 1,224 (51.5%) | $25,890 |
| Total | 2,378 (100.0%) | $25,772 |
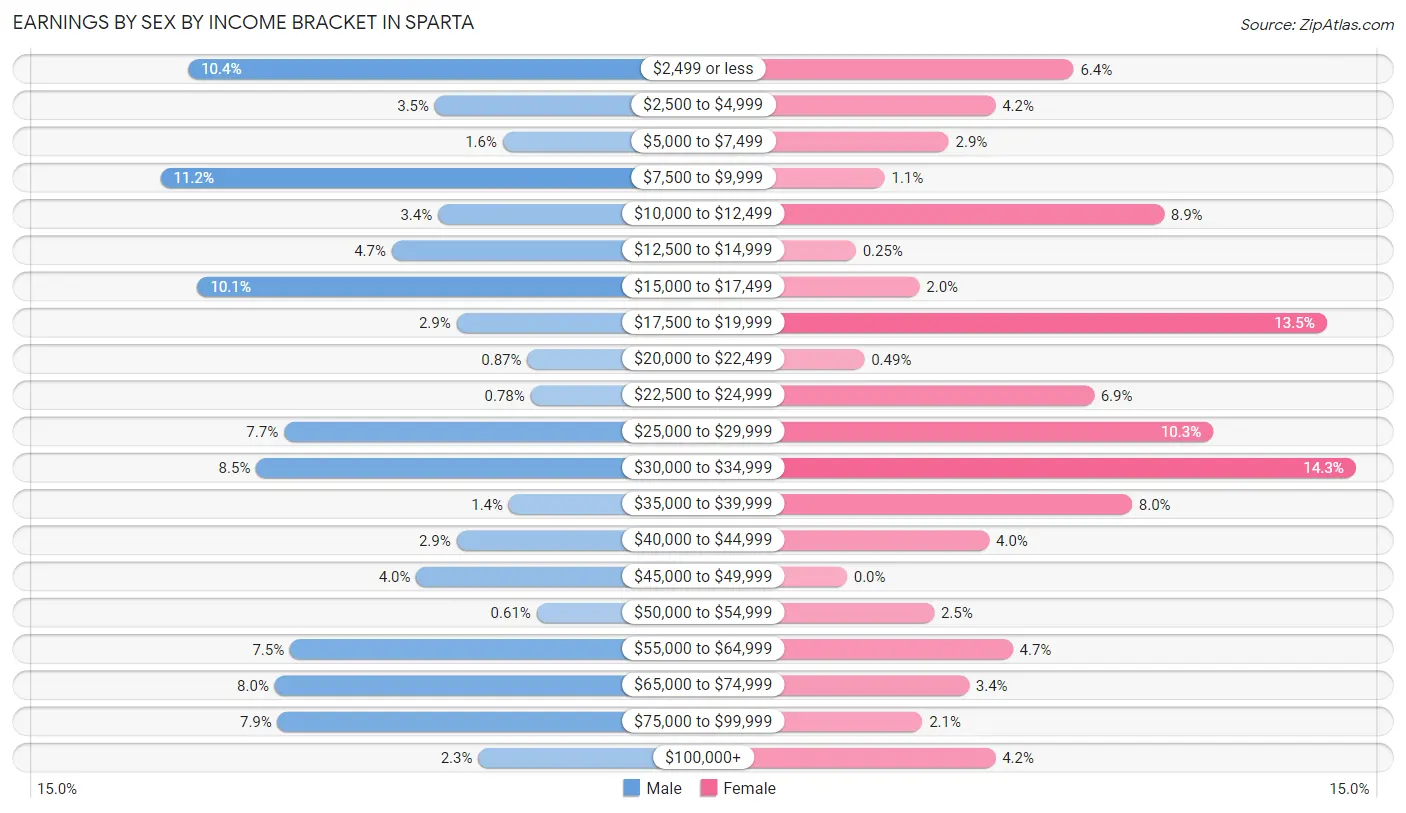
Earnings by Sex by Income Bracket in Sparta
The most common earnings brackets in Sparta are $7,500 to $9,999 for men (129 | 11.2%) and $30,000 to $34,999 for women (175 | 14.3%).
| Income | Male | Female |
| $2,499 or less | 120 (10.4%) | 78 (6.4%) |
| $2,500 to $4,999 | 40 (3.5%) | 51 (4.2%) |
| $5,000 to $7,499 | 18 (1.6%) | 35 (2.9%) |
| $7,500 to $9,999 | 129 (11.2%) | 13 (1.1%) |
| $10,000 to $12,499 | 39 (3.4%) | 109 (8.9%) |
| $12,500 to $14,999 | 54 (4.7%) | 3 (0.3%) |
| $15,000 to $17,499 | 117 (10.1%) | 25 (2.0%) |
| $17,500 to $19,999 | 33 (2.9%) | 165 (13.5%) |
| $20,000 to $22,499 | 10 (0.9%) | 6 (0.5%) |
| $22,500 to $24,999 | 9 (0.8%) | 85 (6.9%) |
| $25,000 to $29,999 | 89 (7.7%) | 126 (10.3%) |
| $30,000 to $34,999 | 98 (8.5%) | 175 (14.3%) |
| $35,000 to $39,999 | 16 (1.4%) | 98 (8.0%) |
| $40,000 to $44,999 | 33 (2.9%) | 49 (4.0%) |
| $45,000 to $49,999 | 46 (4.0%) | 0 (0.0%) |
| $50,000 to $54,999 | 7 (0.6%) | 30 (2.5%) |
| $55,000 to $64,999 | 87 (7.5%) | 57 (4.7%) |
| $65,000 to $74,999 | 92 (8.0%) | 42 (3.4%) |
| $75,000 to $99,999 | 91 (7.9%) | 26 (2.1%) |
| $100,000+ | 26 (2.2%) | 51 (4.2%) |
| Total | 1,154 (100.0%) | 1,224 (100.0%) |
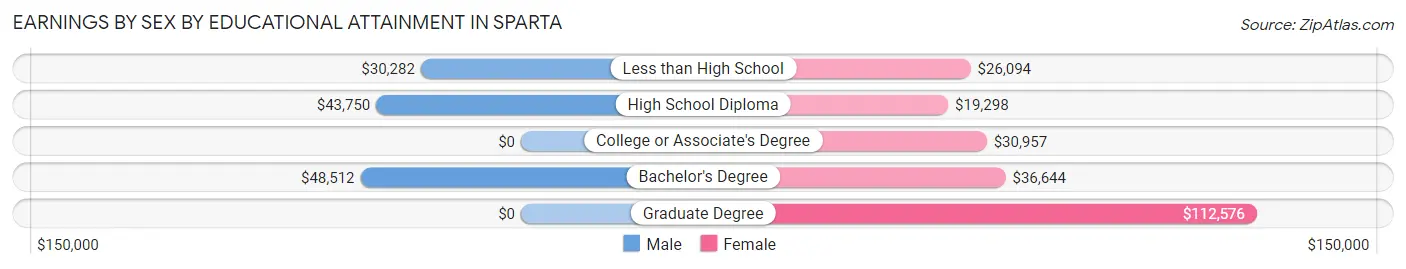
Earnings by Sex by Educational Attainment in Sparta
Average earnings in Sparta are $30,827 for men and $26,335 for women, a difference of 14.6%. Men with an educational attainment of bachelor's degree enjoy the highest average annual earnings of $48,512, while those with less than high school education earn the least with $30,282. Women with an educational attainment of graduate degree earn the most with the average annual earnings of $112,576, while those with high school diploma education have the smallest earnings of $19,298.
| Educational Attainment | Male Income | Female Income |
| Less than High School | $30,282 | $26,094 |
| High School Diploma | $43,750 | $19,298 |
| College or Associate's Degree | - | - |
| Bachelor's Degree | $48,512 | $36,644 |
| Graduate Degree | - | - |
| Total | $30,827 | $26,335 |
Family Income in Sparta
Family Income Brackets in Sparta
According to the Sparta family income data, there are 352 families falling into the $75,000 to $99,999 income range, which is the most common income bracket and makes up 27.2% of all families. Conversely, the less than $10,000 income bracket is the least frequent group with only 13 families (1.0%) belonging to this category.
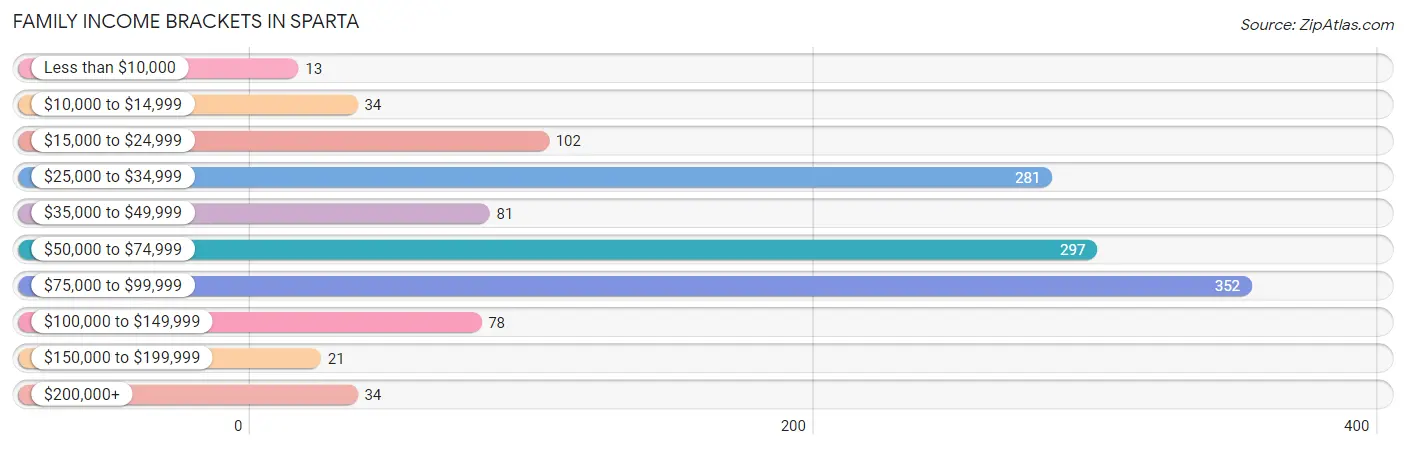
| Income Bracket | # Families | % Families |
| Less than $10,000 | 13 | 1.0% |
| $10,000 to $14,999 | 34 | 2.6% |
| $15,000 to $24,999 | 102 | 7.9% |
| $25,000 to $34,999 | 281 | 21.7% |
| $35,000 to $49,999 | 81 | 6.3% |
| $50,000 to $74,999 | 297 | 23.0% |
| $75,000 to $99,999 | 352 | 27.2% |
| $100,000 to $149,999 | 78 | 6.0% |
| $150,000 to $199,999 | 21 | 1.6% |
| $200,000+ | 34 | 2.6% |
Family Income by Famaliy Size in Sparta
4-person families (196 | 15.2%) account for the highest median family income in Sparta with $71,725 per family, while 2-person families (697 | 53.9%) have the highest median income of $30,090 per family member.
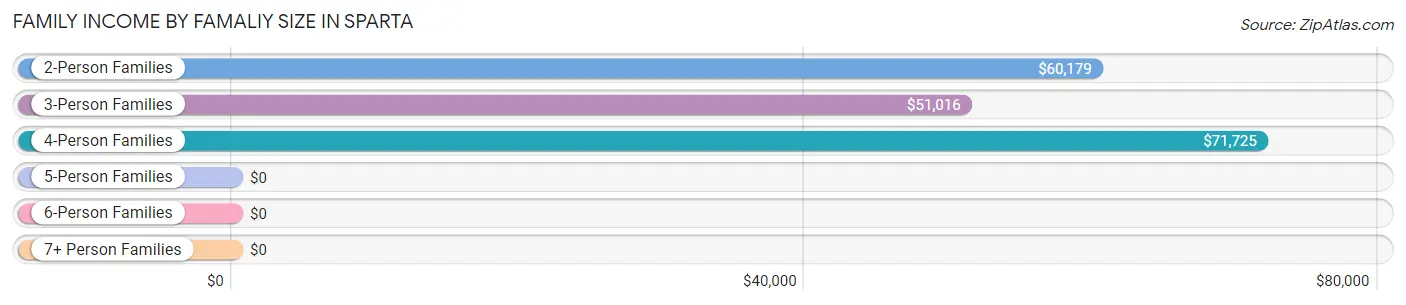
| Income Bracket | # Families | Median Income |
| 2-Person Families | 697 (53.9%) | $60,179 |
| 3-Person Families | 275 (21.3%) | $51,016 |
| 4-Person Families | 196 (15.2%) | $71,725 |
| 5-Person Families | 39 (3.0%) | $0 |
| 6-Person Families | 5 (0.4%) | $0 |
| 7+ Person Families | 81 (6.3%) | $0 |
| Total | 1,293 (100.0%) | $70,638 |
Family Income by Number of Earners in Sparta
The median family income in Sparta is $70,638, with families comprising 3+ earners (143) having the highest median family income of $92,917, while families with no earners (154) have the lowest median family income of $31,532, accounting for 11.1% and 11.9% of families, respectively.
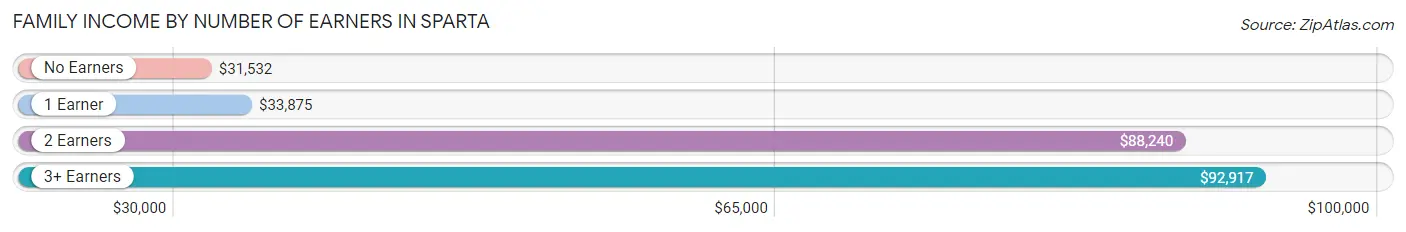
| Number of Earners | # Families | Median Income |
| No Earners | 154 (11.9%) | $31,532 |
| 1 Earner | 520 (40.2%) | $33,875 |
| 2 Earners | 476 (36.8%) | $88,240 |
| 3+ Earners | 143 (11.1%) | $92,917 |
| Total | 1,293 (100.0%) | $70,638 |
Household Income in Sparta
Household Income Brackets in Sparta
With 366 households falling in the category, the $75,000 to $99,999 income range is the most frequent in Sparta, accounting for 18.4% of all households. In contrast, only 22 households (1.1%) fall into the $150,000 to $199,999 income bracket, making it the least populous group.
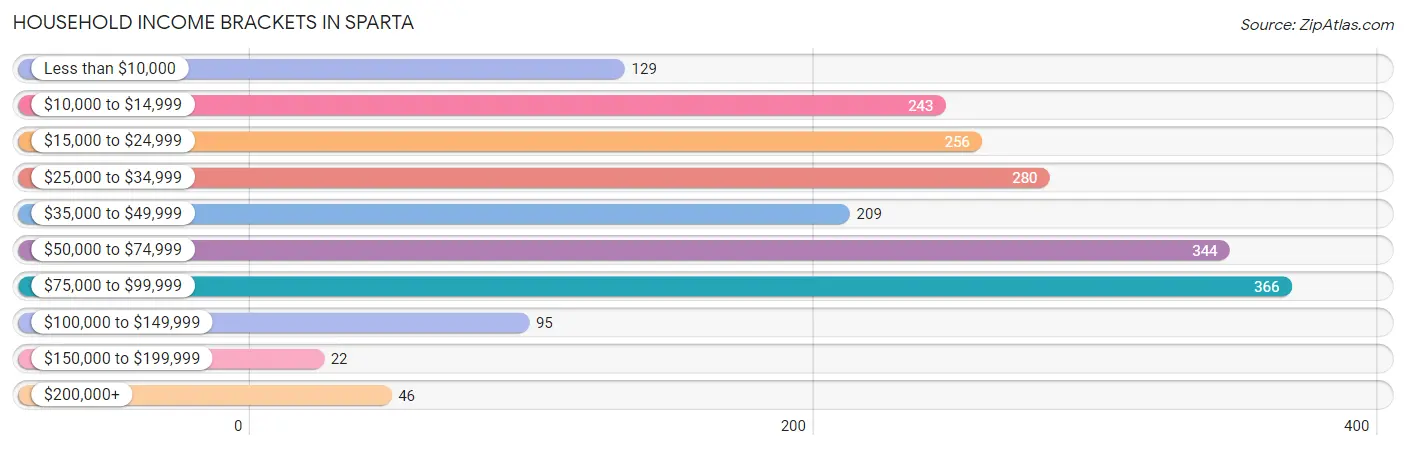
| Income Bracket | # Households | % Households |
| Less than $10,000 | 129 | 6.5% |
| $10,000 to $14,999 | 243 | 12.2% |
| $15,000 to $24,999 | 256 | 12.9% |
| $25,000 to $34,999 | 280 | 14.1% |
| $35,000 to $49,999 | 209 | 10.5% |
| $50,000 to $74,999 | 344 | 17.3% |
| $75,000 to $99,999 | 366 | 18.4% |
| $100,000 to $149,999 | 95 | 4.8% |
| $150,000 to $199,999 | 22 | 1.1% |
| $200,000+ | 46 | 2.3% |
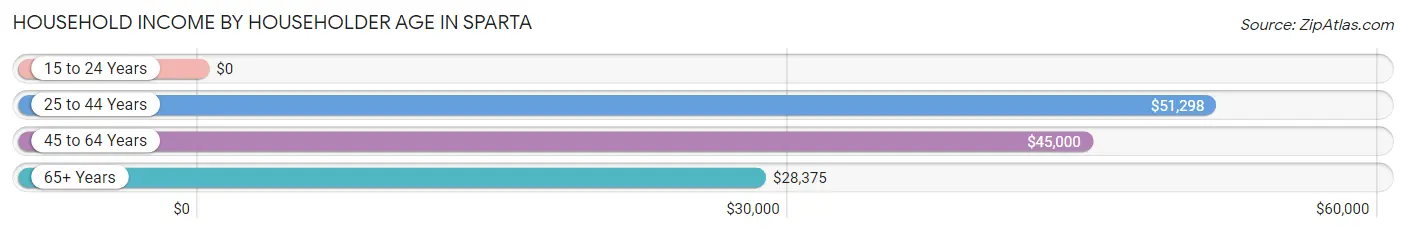
Household Income by Householder Age in Sparta
The median household income in Sparta is $42,670, with the highest median household income of $51,298 found in the 25 to 44 years age bracket for the primary householder. A total of 681 households (34.3%) fall into this category. Meanwhile, the 15 to 24 years age bracket for the primary householder has the lowest median household income of $0, with 20 households (1.0%) in this group.
| Income Bracket | # Households | Median Income |
| 15 to 24 Years | 20 (1.0%) | $0 |
| 25 to 44 Years | 681 (34.3%) | $51,298 |
| 45 to 64 Years | 584 (29.4%) | $45,000 |
| 65+ Years | 703 (35.4%) | $28,375 |
| Total | 1,988 (100.0%) | $42,670 |
Poverty in Sparta
Income Below Poverty by Sex and Age in Sparta
With 16.9% poverty level for males and 18.5% for females among the residents of Sparta, 5 year old males and 55 to 64 year old females are the most vulnerable to poverty, with 22 males (71.0%) and 110 females (37.7%) in their respective age groups living below the poverty level.
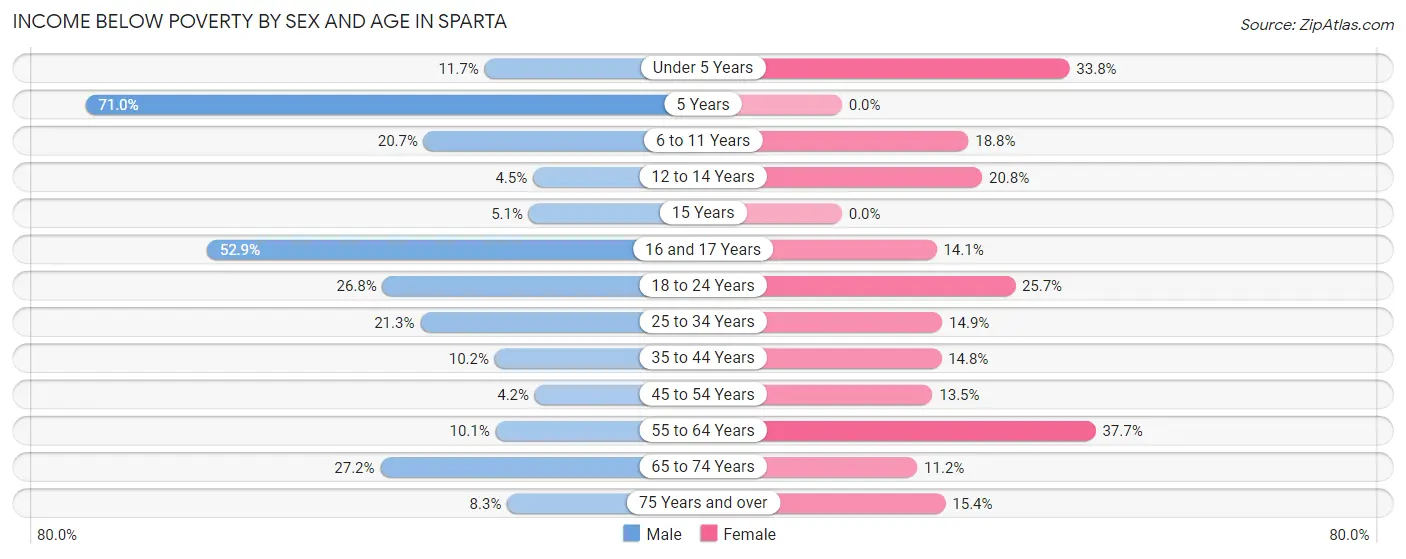
| Age Bracket | Male | Female |
| Under 5 Years | 26 (11.7%) | 24 (33.8%) |
| 5 Years | 22 (71.0%) | 0 (0.0%) |
| 6 to 11 Years | 23 (20.7%) | 59 (18.8%) |
| 12 to 14 Years | 5 (4.5%) | 15 (20.8%) |
| 15 Years | 4 (5.1%) | 0 (0.0%) |
| 16 and 17 Years | 9 (52.9%) | 9 (14.1%) |
| 18 to 24 Years | 62 (26.8%) | 27 (25.7%) |
| 25 to 34 Years | 51 (21.2%) | 59 (14.9%) |
| 35 to 44 Years | 29 (10.2%) | 53 (14.8%) |
| 45 to 54 Years | 9 (4.2%) | 32 (13.5%) |
| 55 to 64 Years | 14 (10.1%) | 110 (37.7%) |
| 65 to 74 Years | 100 (27.2%) | 46 (11.2%) |
| 75 Years and over | 9 (8.3%) | 20 (15.4%) |
| Total | 363 (16.9%) | 454 (18.5%) |
Income Above Poverty by Sex and Age in Sparta
According to the poverty statistics in Sparta, males aged 45 to 54 years and females aged 65 to 74 years are the age groups that are most secure financially, with 95.8% of males and 88.8% of females in these age groups living above the poverty line.
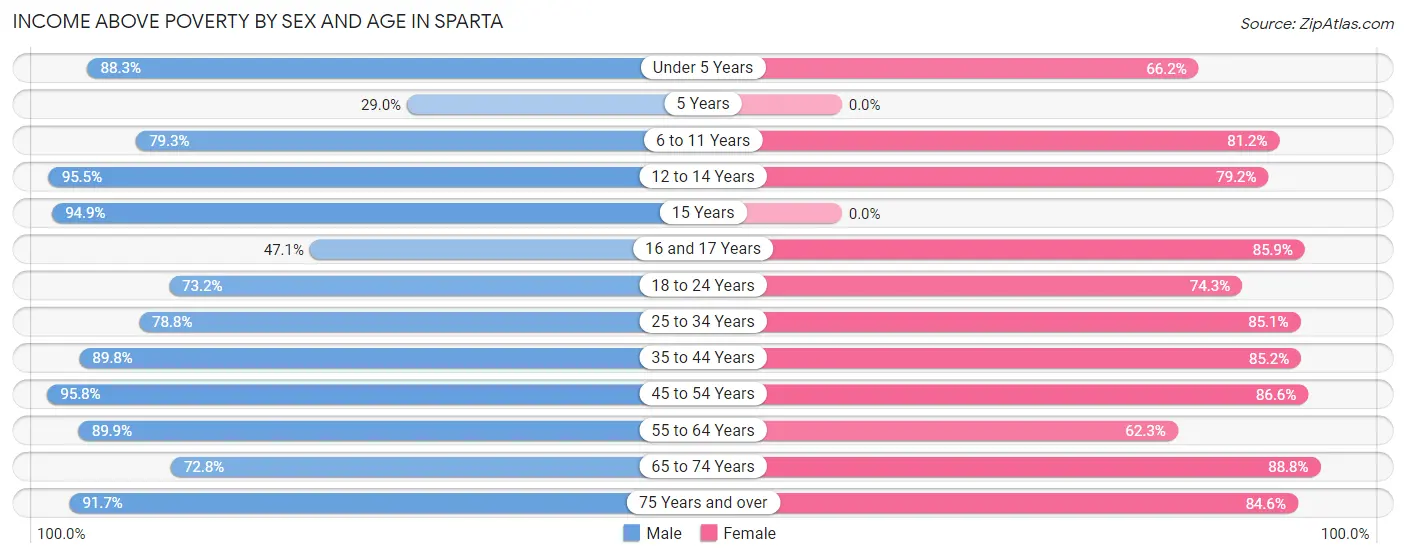
| Age Bracket | Male | Female |
| Under 5 Years | 196 (88.3%) | 47 (66.2%) |
| 5 Years | 9 (29.0%) | 0 (0.0%) |
| 6 to 11 Years | 88 (79.3%) | 255 (81.2%) |
| 12 to 14 Years | 106 (95.5%) | 57 (79.2%) |
| 15 Years | 74 (94.9%) | 0 (0.0%) |
| 16 and 17 Years | 8 (47.1%) | 55 (85.9%) |
| 18 to 24 Years | 169 (73.2%) | 78 (74.3%) |
| 25 to 34 Years | 189 (78.7%) | 337 (85.1%) |
| 35 to 44 Years | 256 (89.8%) | 306 (85.2%) |
| 45 to 54 Years | 204 (95.8%) | 206 (86.6%) |
| 55 to 64 Years | 125 (89.9%) | 182 (62.3%) |
| 65 to 74 Years | 268 (72.8%) | 365 (88.8%) |
| 75 Years and over | 99 (91.7%) | 110 (84.6%) |
| Total | 1,791 (83.2%) | 1,998 (81.5%) |
Income Below Poverty Among Married-Couple Families in Sparta
The poverty statistics for married-couple families in Sparta show that 7.4% or 65 of the total 877 families live below the poverty line. Families with 3 or 4 children have the highest poverty rate of 21.5%, comprising of 26 families. On the other hand, families with no children have the lowest poverty rate of 2.7%, which includes 14 families.
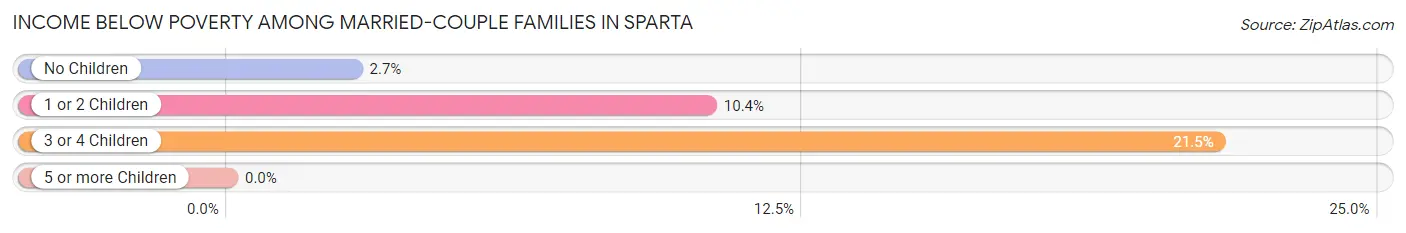
| Children | Above Poverty | Below Poverty |
| No Children | 502 (97.3%) | 14 (2.7%) |
| 1 or 2 Children | 215 (89.6%) | 25 (10.4%) |
| 3 or 4 Children | 95 (78.5%) | 26 (21.5%) |
| 5 or more Children | 0 (0.0%) | 0 (0.0%) |
| Total | 812 (92.6%) | 65 (7.4%) |
Income Below Poverty Among Single-Parent Households in Sparta
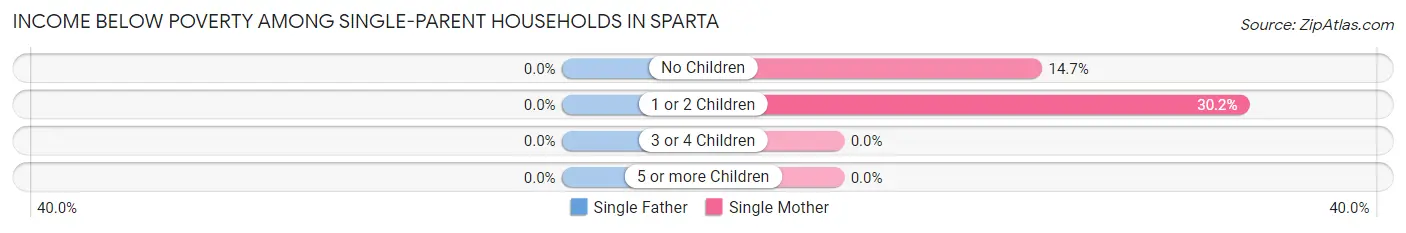
| Children | Single Father | Single Mother |
| No Children | 0 (0.0%) | 28 (14.7%) |
| 1 or 2 Children | 0 (0.0%) | 42 (30.2%) |
| 3 or 4 Children | 0 (0.0%) | 0 (0.0%) |
| 5 or more Children | 0 (0.0%) | 0 (0.0%) |
| Total | 0 (0.0%) | 70 (19.9%) |
Income Below Poverty Among Married-Couple vs Single-Parent Households in Sparta
The poverty data for Sparta shows that 65 of the married-couple family households (7.4%) and 70 of the single-parent households (16.8%) are living below the poverty level. Within the married-couple family households, those with 3 or 4 children have the highest poverty rate, with 26 households (21.5%) falling below the poverty line. Among the single-parent households, those with 1 or 2 children have the highest poverty rate, with 42 household (24.7%) living below poverty.
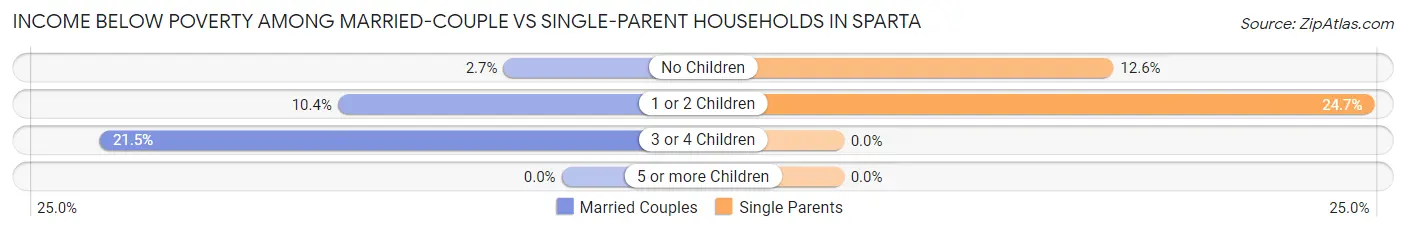
| Children | Married-Couple Families | Single-Parent Households |
| No Children | 14 (2.7%) | 28 (12.6%) |
| 1 or 2 Children | 25 (10.4%) | 42 (24.7%) |
| 3 or 4 Children | 26 (21.5%) | 0 (0.0%) |
| 5 or more Children | 0 (0.0%) | 0 (0.0%) |
| Total | 65 (7.4%) | 70 (16.8%) |
Race in Sparta
The most populous races in Sparta are White / Caucasian (4,257 | 86.0%), Two or more Races (307 | 6.2%), and Black / African American (292 | 5.9%).
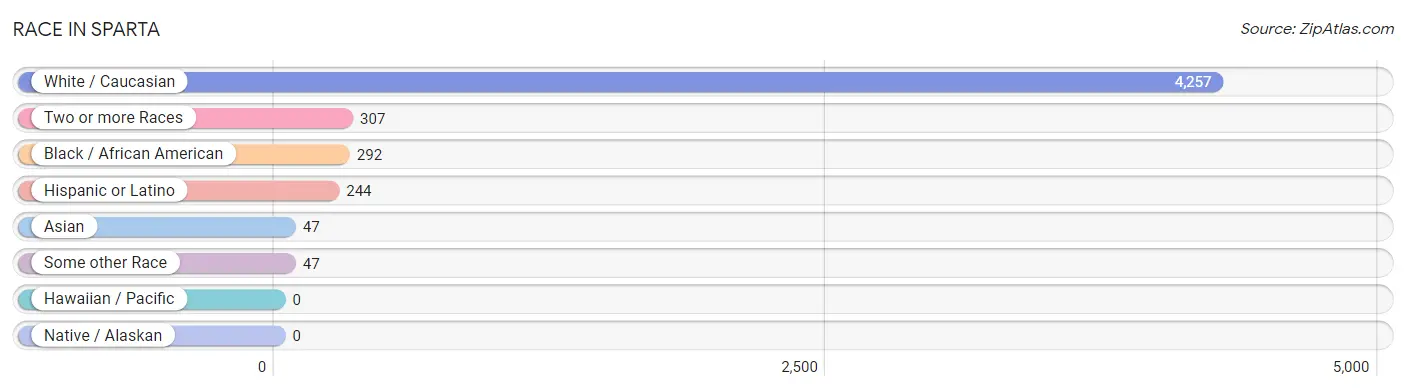
| Race | # Population | % Population |
| Asian | 47 | 0.9% |
| Black / African American | 292 | 5.9% |
| Hawaiian / Pacific | 0 | 0.0% |
| Hispanic or Latino | 244 | 4.9% |
| Native / Alaskan | 0 | 0.0% |
| White / Caucasian | 4,257 | 86.0% |
| Two or more Races | 307 | 6.2% |
| Some other Race | 47 | 0.9% |
| Total | 4,950 | 100.0% |
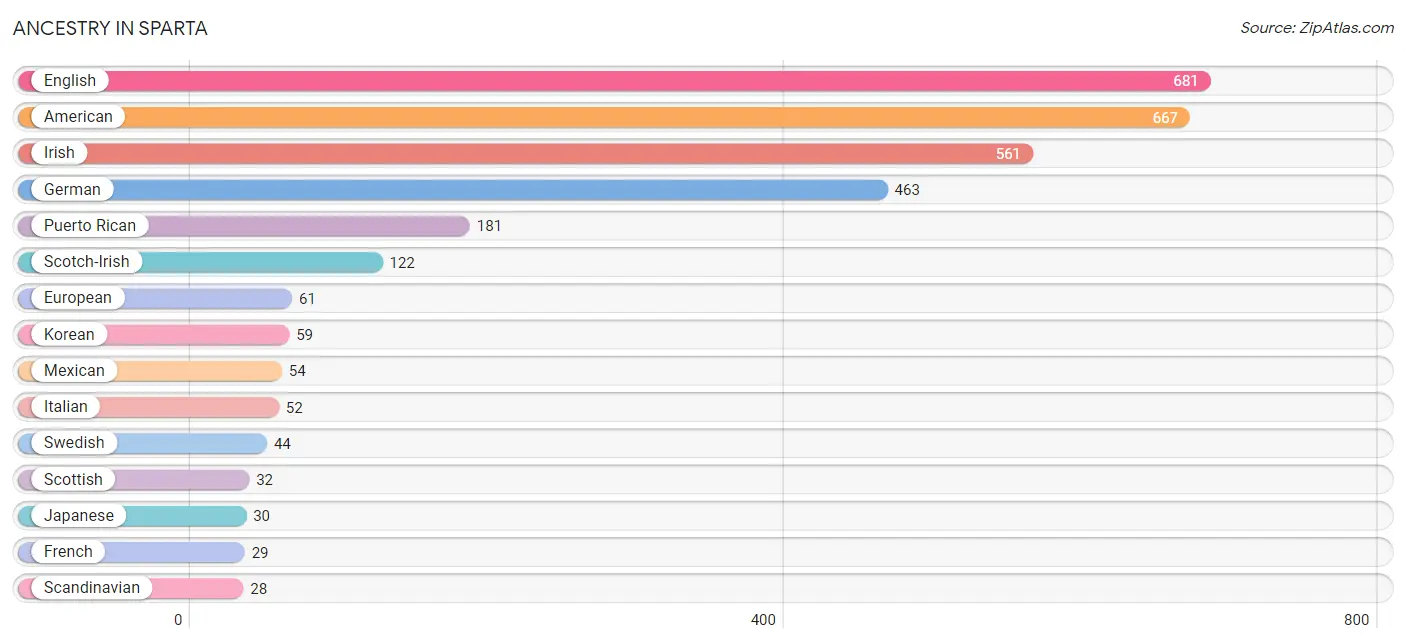
Ancestry in Sparta
The most populous ancestries reported in Sparta are English (681 | 13.8%), American (667 | 13.5%), Irish (561 | 11.3%), German (463 | 9.3%), and Puerto Rican (181 | 3.7%), together accounting for 51.6% of all Sparta residents.
| Ancestry | # Population | % Population |
| American | 667 | 13.5% |
| Arab | 13 | 0.3% |
| Blackfeet | 25 | 0.5% |
| British | 10 | 0.2% |
| Central American | 9 | 0.2% |
| Dutch | 25 | 0.5% |
| English | 681 | 13.8% |
| European | 61 | 1.2% |
| French | 29 | 0.6% |
| German | 463 | 9.3% |
| Irish | 561 | 11.3% |
| Italian | 52 | 1.1% |
| Japanese | 30 | 0.6% |
| Korean | 59 | 1.2% |
| Lebanese | 13 | 0.3% |
| Mexican | 54 | 1.1% |
| Pennsylvania German | 14 | 0.3% |
| Polish | 16 | 0.3% |
| Puerto Rican | 181 | 3.7% |
| Salvadoran | 9 | 0.2% |
| Scandinavian | 28 | 0.6% |
| Scotch-Irish | 122 | 2.5% |
| Scottish | 32 | 0.6% |
| Swedish | 44 | 0.9% |
| Swiss | 11 | 0.2% |
| Welsh | 7 | 0.1% | View All 26 Rows |
Immigrants in Sparta
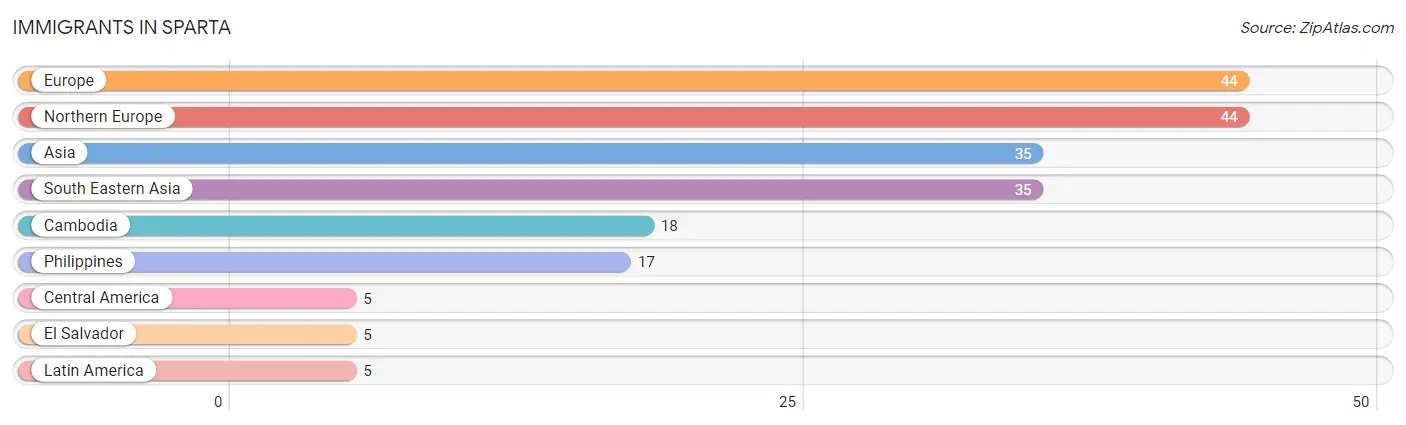
The most numerous immigrant groups reported in Sparta came from Europe (44 | 0.9%), Northern Europe (44 | 0.9%), Asia (35 | 0.7%), South Eastern Asia (35 | 0.7%), and Cambodia (18 | 0.4%), together accounting for 3.6% of all Sparta residents.
| Immigration Origin | # Population | % Population |
| Asia | 35 | 0.7% |
| Cambodia | 18 | 0.4% |
| Central America | 5 | 0.1% |
| El Salvador | 5 | 0.1% |
| Europe | 44 | 0.9% |
| Latin America | 5 | 0.1% |
| Northern Europe | 44 | 0.9% |
| Philippines | 17 | 0.3% |
| South Eastern Asia | 35 | 0.7% | View All 9 Rows |
Sex and Age in Sparta
Sex and Age in Sparta
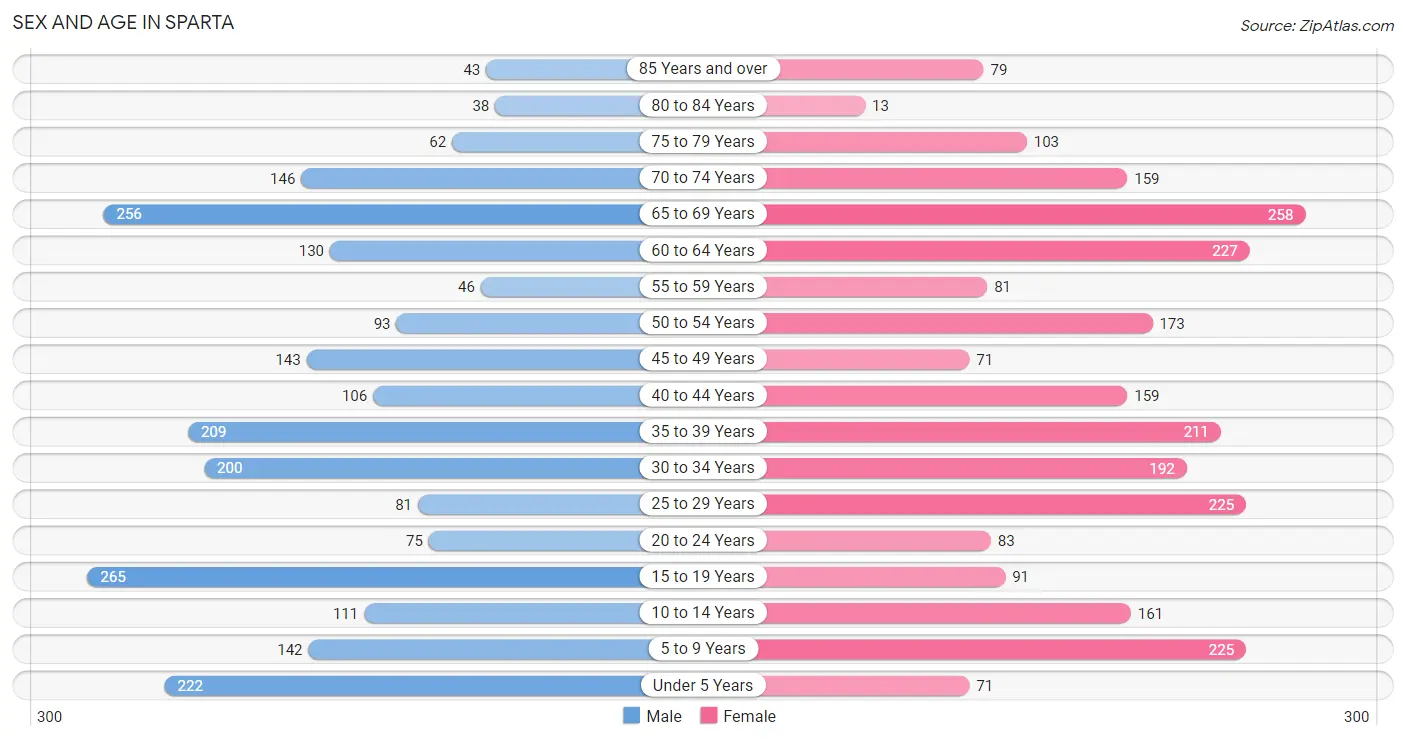
The most populous age groups in Sparta are 15 to 19 Years (265 | 11.2%) for men and 65 to 69 Years (258 | 10.0%) for women.
| Age Bracket | Male | Female |
| Under 5 Years | 222 (9.4%) | 71 (2.8%) |
| 5 to 9 Years | 142 (6.0%) | 225 (8.7%) |
| 10 to 14 Years | 111 (4.7%) | 161 (6.2%) |
| 15 to 19 Years | 265 (11.2%) | 91 (3.5%) |
| 20 to 24 Years | 75 (3.2%) | 83 (3.2%) |
| 25 to 29 Years | 81 (3.4%) | 225 (8.7%) |
| 30 to 34 Years | 200 (8.5%) | 192 (7.4%) |
| 35 to 39 Years | 209 (8.8%) | 211 (8.2%) |
| 40 to 44 Years | 106 (4.5%) | 159 (6.2%) |
| 45 to 49 Years | 143 (6.0%) | 71 (2.8%) |
| 50 to 54 Years | 93 (3.9%) | 173 (6.7%) |
| 55 to 59 Years | 46 (1.9%) | 81 (3.1%) |
| 60 to 64 Years | 130 (5.5%) | 227 (8.8%) |
| 65 to 69 Years | 256 (10.8%) | 258 (10.0%) |
| 70 to 74 Years | 146 (6.2%) | 159 (6.2%) |
| 75 to 79 Years | 62 (2.6%) | 103 (4.0%) |
| 80 to 84 Years | 38 (1.6%) | 13 (0.5%) |
| 85 Years and over | 43 (1.8%) | 79 (3.1%) |
| Total | 2,368 (100.0%) | 2,582 (100.0%) |
Families and Households in Sparta
Median Family Size in Sparta
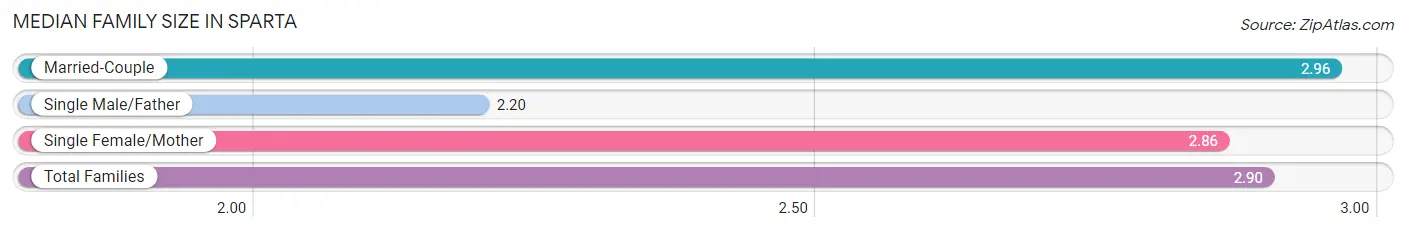
The median family size in Sparta is 2.90 persons per family, with married-couple families (877 | 67.8%) accounting for the largest median family size of 2.96 persons per family. On the other hand, single male/father families (64 | 5.0%) represent the smallest median family size with 2.20 persons per family.
| Family Type | # Families | Family Size |
| Married-Couple | 877 (67.8%) | 2.96 |
| Single Male/Father | 64 (5.0%) | 2.20 |
| Single Female/Mother | 352 (27.2%) | 2.86 |
| Total Families | 1,293 (100.0%) | 2.90 |
Median Household Size in Sparta
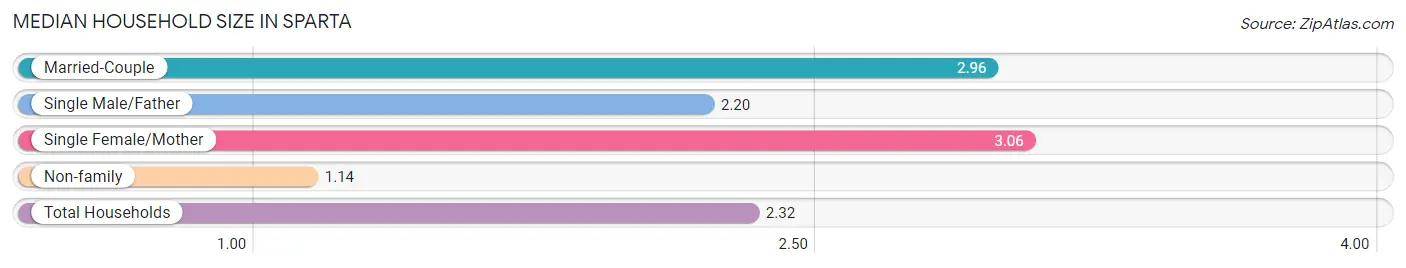
The median household size in Sparta is 2.32 persons per household, with single female/mother households (352 | 17.7%) accounting for the largest median household size of 3.06 persons per household. non-family households (695 | 35.0%) represent the smallest median household size with 1.14 persons per household.
| Household Type | # Households | Household Size |
| Married-Couple | 877 (44.1%) | 2.96 |
| Single Male/Father | 64 (3.2%) | 2.20 |
| Single Female/Mother | 352 (17.7%) | 3.06 |
| Non-family | 695 (35.0%) | 1.14 |
| Total Households | 1,988 (100.0%) | 2.32 |
Household Size by Marriage Status in Sparta
Out of a total of 1,988 households in Sparta, 1,293 (65.0%) are family households, while 695 (35.0%) are nonfamily households. The most numerous type of family households are 2-person households, comprising 623, and the most common type of nonfamily households are 1-person households, comprising 652.
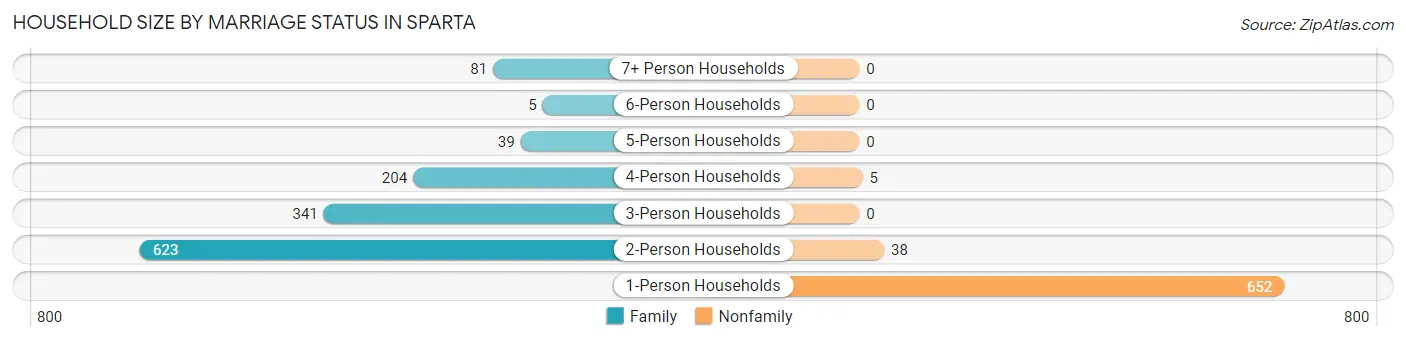
| Household Size | Family Households | Nonfamily Households |
| 1-Person Households | - | 652 (32.8%) |
| 2-Person Households | 623 (31.3%) | 38 (1.9%) |
| 3-Person Households | 341 (17.2%) | 0 (0.0%) |
| 4-Person Households | 204 (10.3%) | 5 (0.3%) |
| 5-Person Households | 39 (2.0%) | 0 (0.0%) |
| 6-Person Households | 5 (0.3%) | 0 (0.0%) |
| 7+ Person Households | 81 (4.1%) | 0 (0.0%) |
| Total | 1,293 (65.0%) | 695 (35.0%) |
Female Fertility in Sparta
Fertility by Age in Sparta
Average fertility rate in Sparta is 24.0 births per 1,000 women. Women in the age bracket of 15 to 19 years have the highest fertility rate with 110.0 births per 1,000 women. Women in the age bracket of 20 to 34 years acount for 61.5% of all women with births.
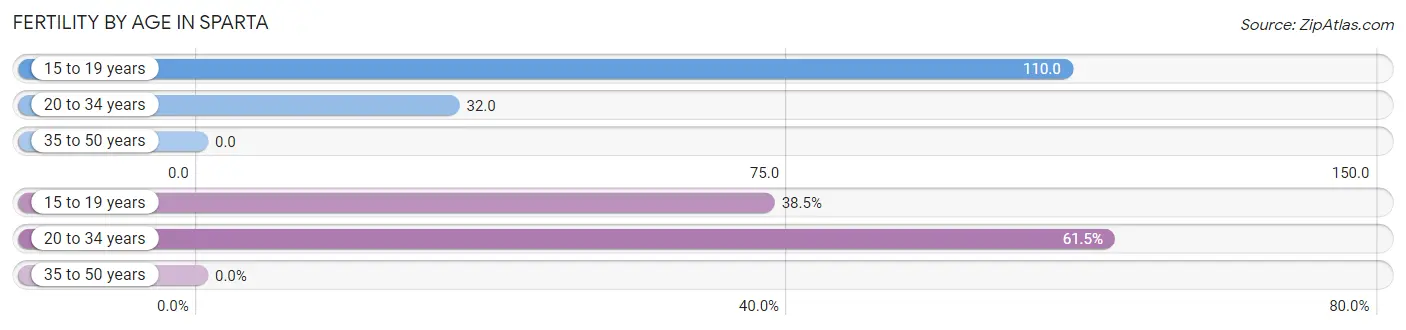
| Age Bracket | Women with Births | Births / 1,000 Women |
| 15 to 19 years | 10 (38.5%) | 110.0 |
| 20 to 34 years | 16 (61.5%) | 32.0 |
| 35 to 50 years | 0 (0.0%) | 0.0 |
| Total | 26 (100.0%) | 24.0 |
Fertility by Age by Marriage Status in Sparta
61.5% of women with births (26) in Sparta are married. The highest percentage of unmarried women with births falls into 15 to 19 years age bracket with 100.0% of them unmarried at the time of birth, while the lowest percentage of unmarried women with births belong to 20 to 34 years age bracket with 0.0% of them unmarried.
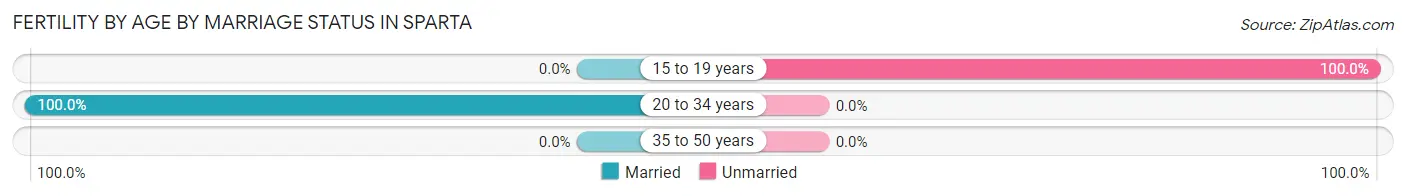
| Age Bracket | Married | Unmarried |
| 15 to 19 years | 0 (0.0%) | 10 (100.0%) |
| 20 to 34 years | 16 (100.0%) | 0 (0.0%) |
| 35 to 50 years | 0 (0.0%) | 0 (0.0%) |
| Total | 16 (61.5%) | 10 (38.5%) |
Fertility by Education in Sparta
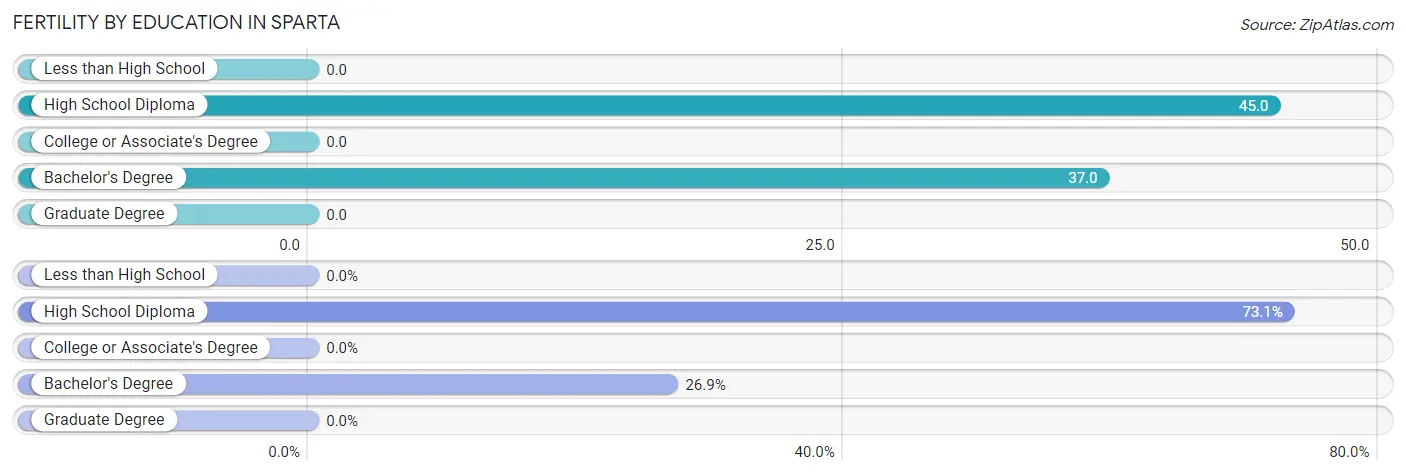
| Educational Attainment | Women with Births | Births / 1,000 Women |
| Less than High School | 0 (0.0%) | 0.0 |
| High School Diploma | 19 (73.1%) | 45.0 |
| College or Associate's Degree | 0 (0.0%) | 0.0 |
| Bachelor's Degree | 7 (26.9%) | 37.0 |
| Graduate Degree | 0 (0.0%) | 0.0 |
| Total | 26 (100.0%) | 24.0 |
Fertility by Education by Marriage Status in Sparta
38.5% of women with births in Sparta are unmarried. Women with the educational attainment of bachelor's degree are most likely to be married with 100.0% of them married at childbirth, while women with the educational attainment of high school diploma are least likely to be married with 52.6% of them unmarried at childbirth.
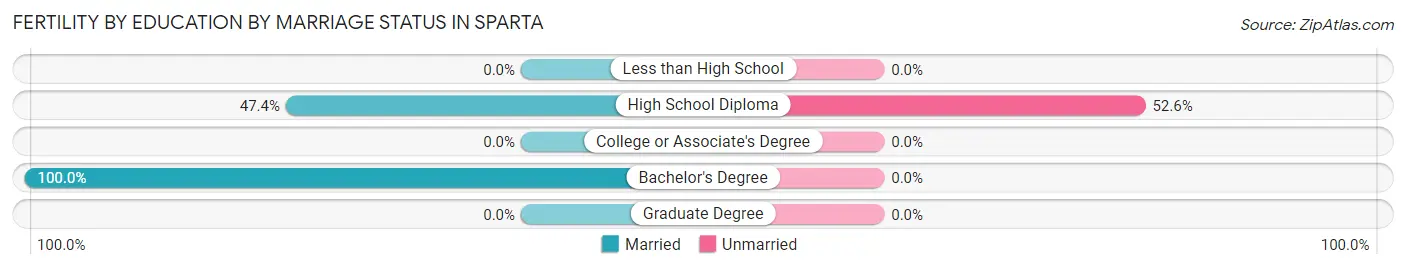
| Educational Attainment | Married | Unmarried |
| Less than High School | 0 (0.0%) | 0 (0.0%) |
| High School Diploma | 9 (47.4%) | 10 (52.6%) |
| College or Associate's Degree | 0 (0.0%) | 0 (0.0%) |
| Bachelor's Degree | 7 (100.0%) | 0 (0.0%) |
| Graduate Degree | 0 (0.0%) | 0 (0.0%) |
| Total | 16 (61.5%) | 10 (38.5%) |
Employment Characteristics in Sparta
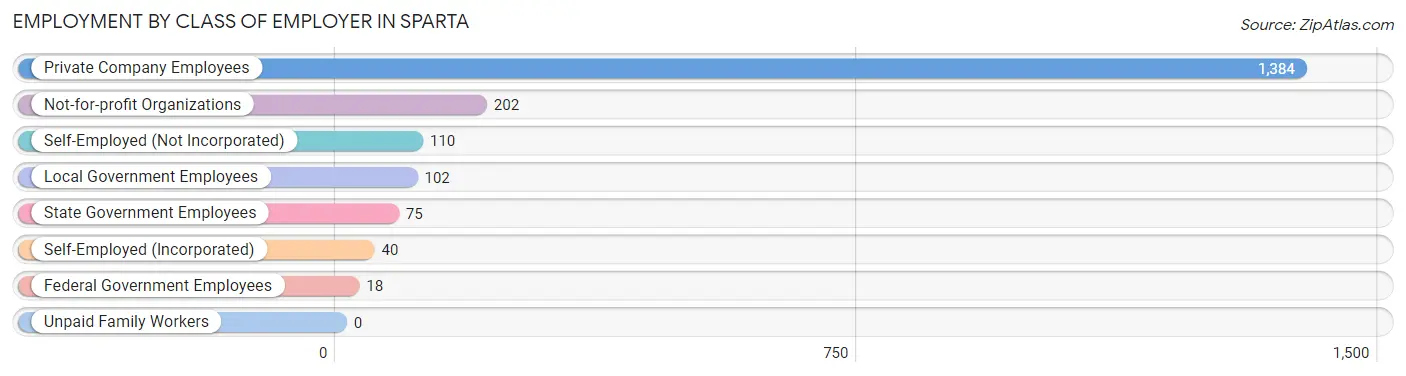
Employment by Class of Employer in Sparta
Among the 1,931 employed individuals in Sparta, private company employees (1,384 | 71.7%), not-for-profit organizations (202 | 10.5%), and self-employed (not incorporated) (110 | 5.7%) make up the most common classes of employment.
| Employer Class | # Employees | % Employees |
| Private Company Employees | 1,384 | 71.7% |
| Self-Employed (Incorporated) | 40 | 2.1% |
| Self-Employed (Not Incorporated) | 110 | 5.7% |
| Not-for-profit Organizations | 202 | 10.5% |
| Local Government Employees | 102 | 5.3% |
| State Government Employees | 75 | 3.9% |
| Federal Government Employees | 18 | 0.9% |
| Unpaid Family Workers | 0 | 0.0% |
| Total | 1,931 | 100.0% |
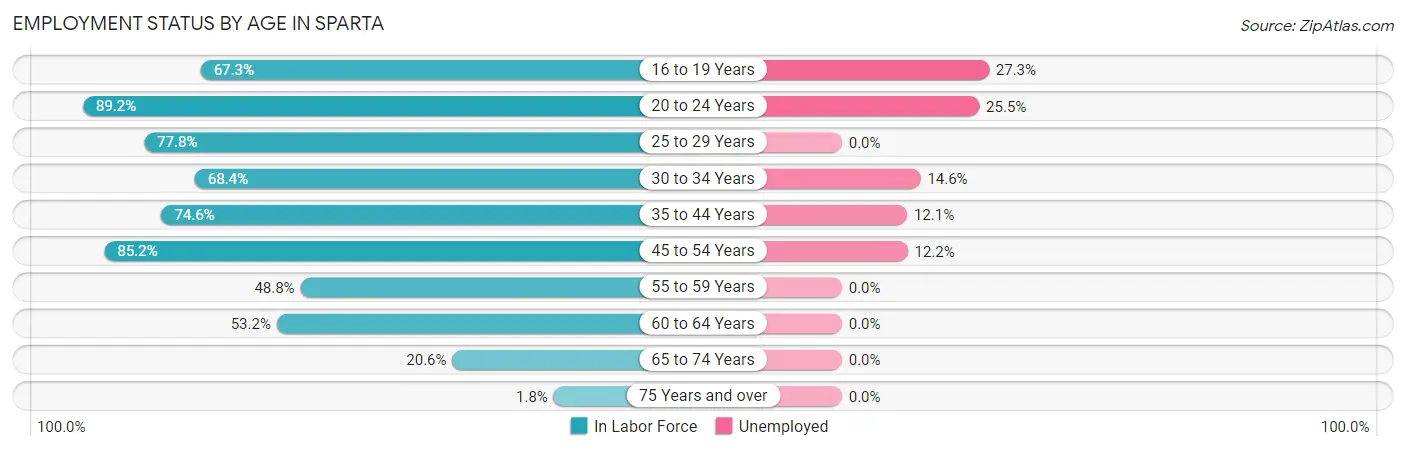
Employment Status by Age in Sparta
According to the labor force statistics for Sparta, out of the total population over 16 years of age (3,940), 55.4% or 2,183 individuals are in the labor force, with 10.9% or 238 of them unemployed. The age group with the highest labor force participation rate is 20 to 24 years, with 89.2% or 141 individuals in the labor force. Within the labor force, the 16 to 19 years age range has the highest percentage of unemployed individuals, with 27.3% or 51 of them being unemployed.
| Age Bracket | In Labor Force | Unemployed |
| 16 to 19 Years | 187 (67.3%) | 51 (27.3%) |
| 20 to 24 Years | 141 (89.2%) | 36 (25.5%) |
| 25 to 29 Years | 238 (77.8%) | 0 (0.0%) |
| 30 to 34 Years | 268 (68.4%) | 39 (14.6%) |
| 35 to 44 Years | 511 (74.6%) | 62 (12.1%) |
| 45 to 54 Years | 409 (85.2%) | 50 (12.2%) |
| 55 to 59 Years | 62 (48.8%) | 0 (0.0%) |
| 60 to 64 Years | 190 (53.2%) | 0 (0.0%) |
| 65 to 74 Years | 169 (20.6%) | 0 (0.0%) |
| 75 Years and over | 6 (1.8%) | 0 (0.0%) |
| Total | 2,183 (55.4%) | 238 (10.9%) |
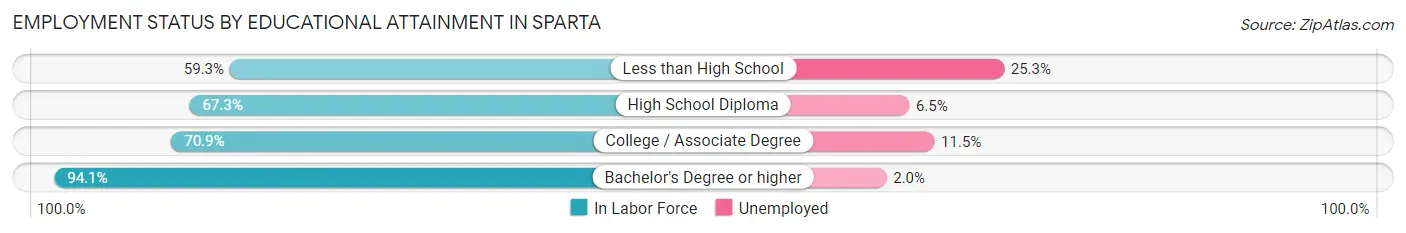
Employment Status by Educational Attainment in Sparta
According to labor force statistics for Sparta, 71.5% of individuals (1,678) out of the total population between 25 and 64 years of age (2,347) are in the labor force, with 9.0% or 151 of them being unemployed. The group with the highest labor force participation rate are those with the educational attainment of bachelor's degree or higher, with 94.1% or 348 individuals in the labor force. Within the labor force, individuals with less than high school education have the highest percentage of unemployment, with 25.3% or 46 of them being unemployed.
| Educational Attainment | In Labor Force | Unemployed |
| Less than High School | 182 (59.3%) | 78 (25.3%) |
| High School Diploma | 678 (67.3%) | 65 (6.5%) |
| College / Associate Degree | 470 (70.9%) | 76 (11.5%) |
| Bachelor's Degree or higher | 348 (94.1%) | 7 (2.0%) |
| Total | 1,678 (71.5%) | 211 (9.0%) |
Employment Occupations by Sex in Sparta
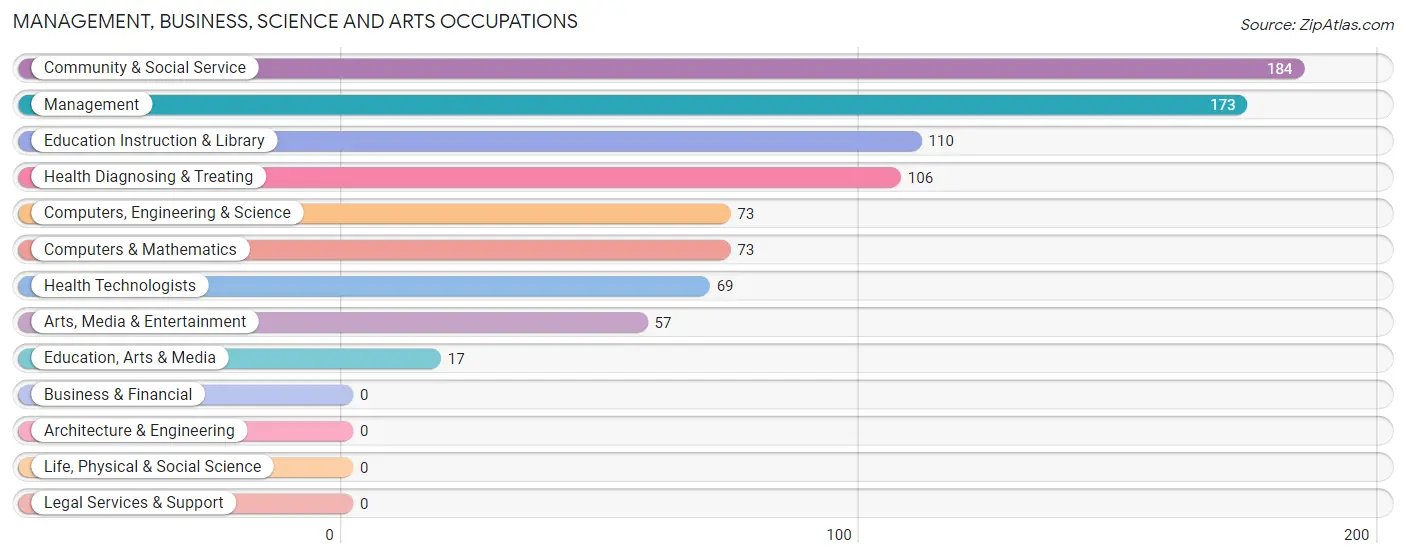
Management, Business, Science and Arts Occupations
The most common Management, Business, Science and Arts occupations in Sparta are Community & Social Service (184 | 9.5%), Management (173 | 8.9%), Education Instruction & Library (110 | 5.7%), Health Diagnosing & Treating (106 | 5.5%), and Computers, Engineering & Science (73 | 3.8%).
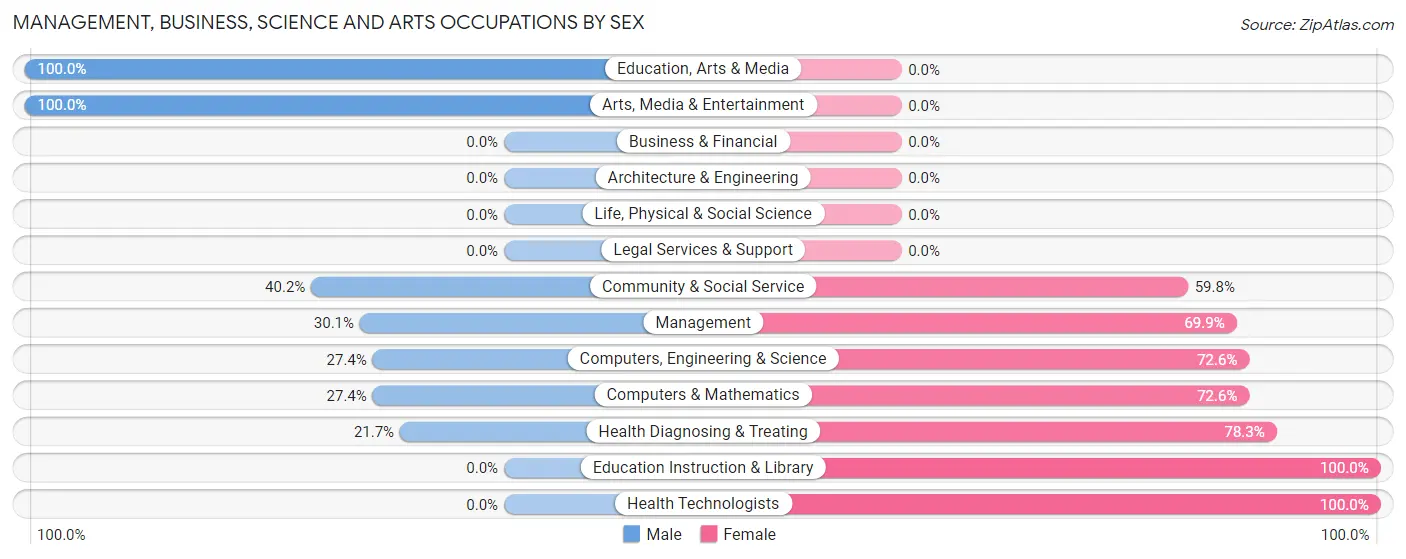
Management, Business, Science and Arts Occupations by Sex
Within the Management, Business, Science and Arts occupations in Sparta, the most male-oriented occupations are Education, Arts & Media (100.0%), Arts, Media & Entertainment (100.0%), and Community & Social Service (40.2%), while the most female-oriented occupations are Education Instruction & Library (100.0%), Health Technologists (100.0%), and Health Diagnosing & Treating (78.3%).
| Occupation | Male | Female |
| Management | 52 (30.1%) | 121 (69.9%) |
| Business & Financial | 0 (0.0%) | 0 (0.0%) |
| Computers, Engineering & Science | 20 (27.4%) | 53 (72.6%) |
| Computers & Mathematics | 20 (27.4%) | 53 (72.6%) |
| Architecture & Engineering | 0 (0.0%) | 0 (0.0%) |
| Life, Physical & Social Science | 0 (0.0%) | 0 (0.0%) |
| Community & Social Service | 74 (40.2%) | 110 (59.8%) |
| Education, Arts & Media | 17 (100.0%) | 0 (0.0%) |
| Legal Services & Support | 0 (0.0%) | 0 (0.0%) |
| Education Instruction & Library | 0 (0.0%) | 110 (100.0%) |
| Arts, Media & Entertainment | 57 (100.0%) | 0 (0.0%) |
| Health Diagnosing & Treating | 23 (21.7%) | 83 (78.3%) |
| Health Technologists | 0 (0.0%) | 69 (100.0%) |
| Total (Category) | 169 (31.5%) | 367 (68.5%) |
| Total (Overall) | 891 (45.9%) | 1,052 (54.1%) |
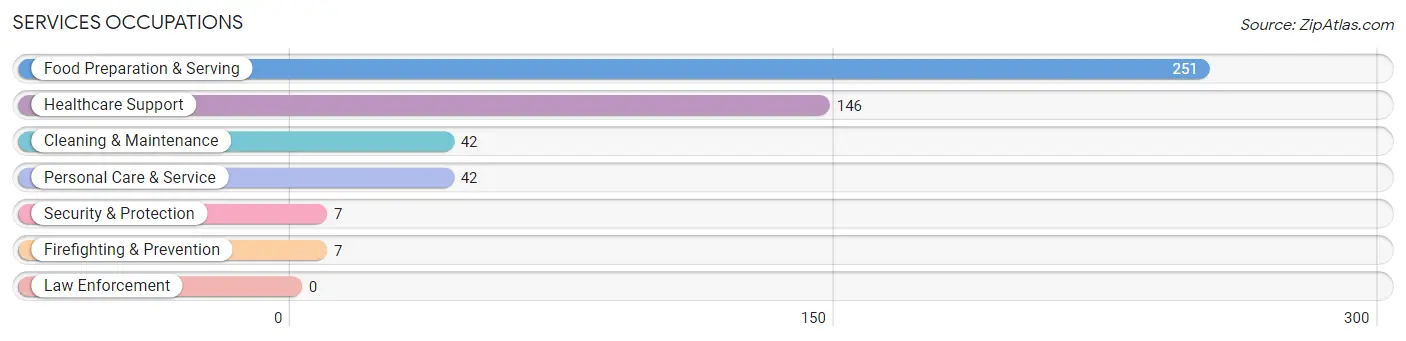
Services Occupations
The most common Services occupations in Sparta are Food Preparation & Serving (251 | 12.9%), Healthcare Support (146 | 7.5%), Cleaning & Maintenance (42 | 2.2%), Personal Care & Service (42 | 2.2%), and Security & Protection (7 | 0.4%).
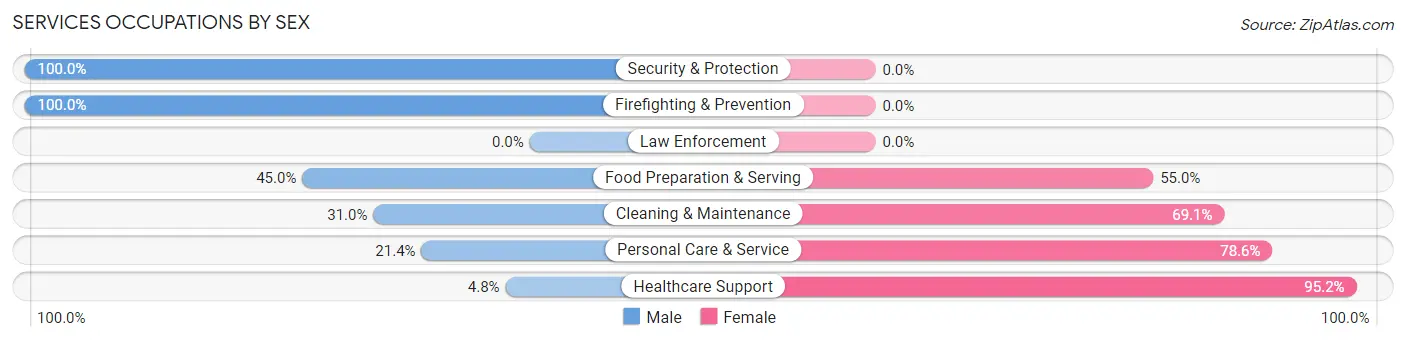
Services Occupations by Sex
Within the Services occupations in Sparta, the most male-oriented occupations are Security & Protection (100.0%), Firefighting & Prevention (100.0%), and Food Preparation & Serving (45.0%), while the most female-oriented occupations are Healthcare Support (95.2%), Personal Care & Service (78.6%), and Cleaning & Maintenance (69.1%).
| Occupation | Male | Female |
| Healthcare Support | 7 (4.8%) | 139 (95.2%) |
| Security & Protection | 7 (100.0%) | 0 (0.0%) |
| Firefighting & Prevention | 7 (100.0%) | 0 (0.0%) |
| Law Enforcement | 0 (0.0%) | 0 (0.0%) |
| Food Preparation & Serving | 113 (45.0%) | 138 (55.0%) |
| Cleaning & Maintenance | 13 (30.9%) | 29 (69.1%) |
| Personal Care & Service | 9 (21.4%) | 33 (78.6%) |
| Total (Category) | 149 (30.5%) | 339 (69.5%) |
| Total (Overall) | 891 (45.9%) | 1,052 (54.1%) |
Sales and Office Occupations
The most common Sales and Office occupations in Sparta are Office & Administration (201 | 10.3%), and Sales & Related (107 | 5.5%).
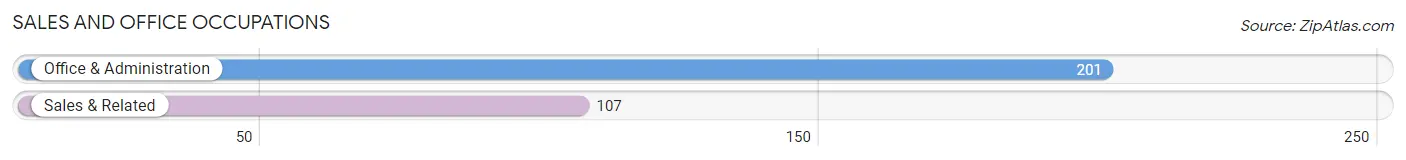
Sales and Office Occupations by Sex

| Occupation | Male | Female |
| Sales & Related | 0 (0.0%) | 107 (100.0%) |
| Office & Administration | 38 (18.9%) | 163 (81.1%) |
| Total (Category) | 38 (12.3%) | 270 (87.7%) |
| Total (Overall) | 891 (45.9%) | 1,052 (54.1%) |
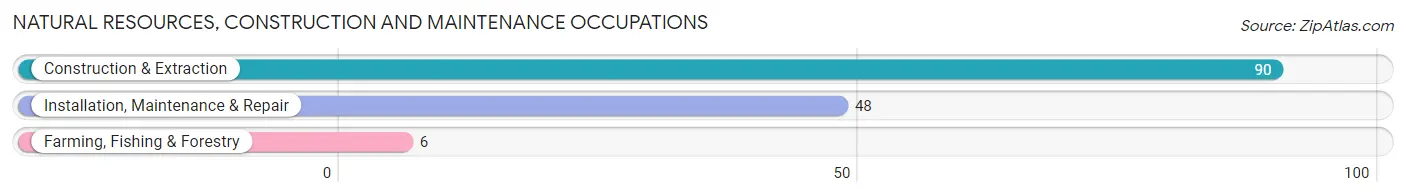
Natural Resources, Construction and Maintenance Occupations
The most common Natural Resources, Construction and Maintenance occupations in Sparta are Construction & Extraction (90 | 4.6%), Installation, Maintenance & Repair (48 | 2.5%), and Farming, Fishing & Forestry (6 | 0.3%).
Natural Resources, Construction and Maintenance Occupations by Sex
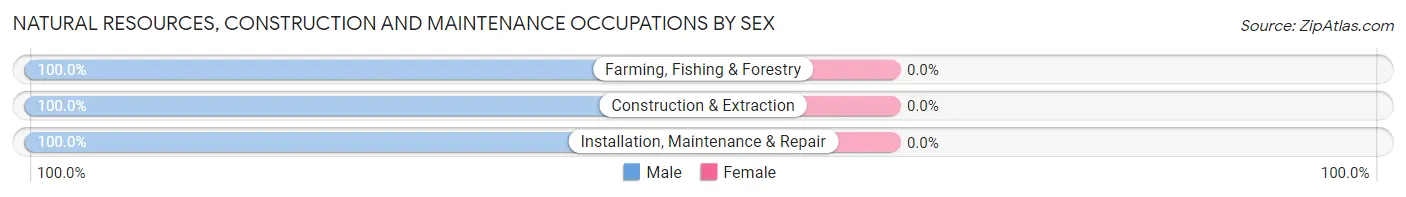
| Occupation | Male | Female |
| Farming, Fishing & Forestry | 6 (100.0%) | 0 (0.0%) |
| Construction & Extraction | 90 (100.0%) | 0 (0.0%) |
| Installation, Maintenance & Repair | 48 (100.0%) | 0 (0.0%) |
| Total (Category) | 144 (100.0%) | 0 (0.0%) |
| Total (Overall) | 891 (45.9%) | 1,052 (54.1%) |
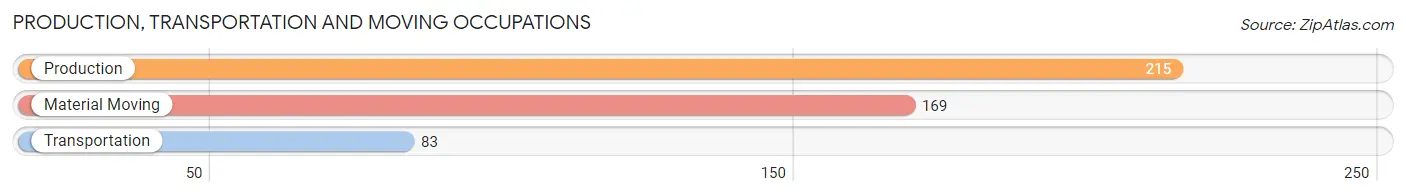
Production, Transportation and Moving Occupations
The most common Production, Transportation and Moving occupations in Sparta are Production (215 | 11.1%), Material Moving (169 | 8.7%), and Transportation (83 | 4.3%).
Production, Transportation and Moving Occupations by Sex
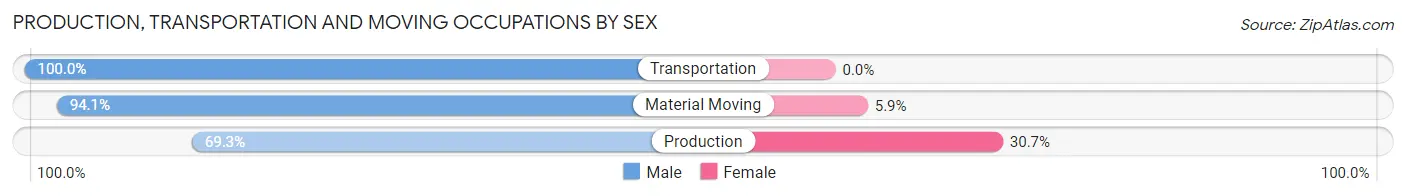
| Occupation | Male | Female |
| Production | 149 (69.3%) | 66 (30.7%) |
| Transportation | 83 (100.0%) | 0 (0.0%) |
| Material Moving | 159 (94.1%) | 10 (5.9%) |
| Total (Category) | 391 (83.7%) | 76 (16.3%) |
| Total (Overall) | 891 (45.9%) | 1,052 (54.1%) |
Employment Industries by Sex in Sparta
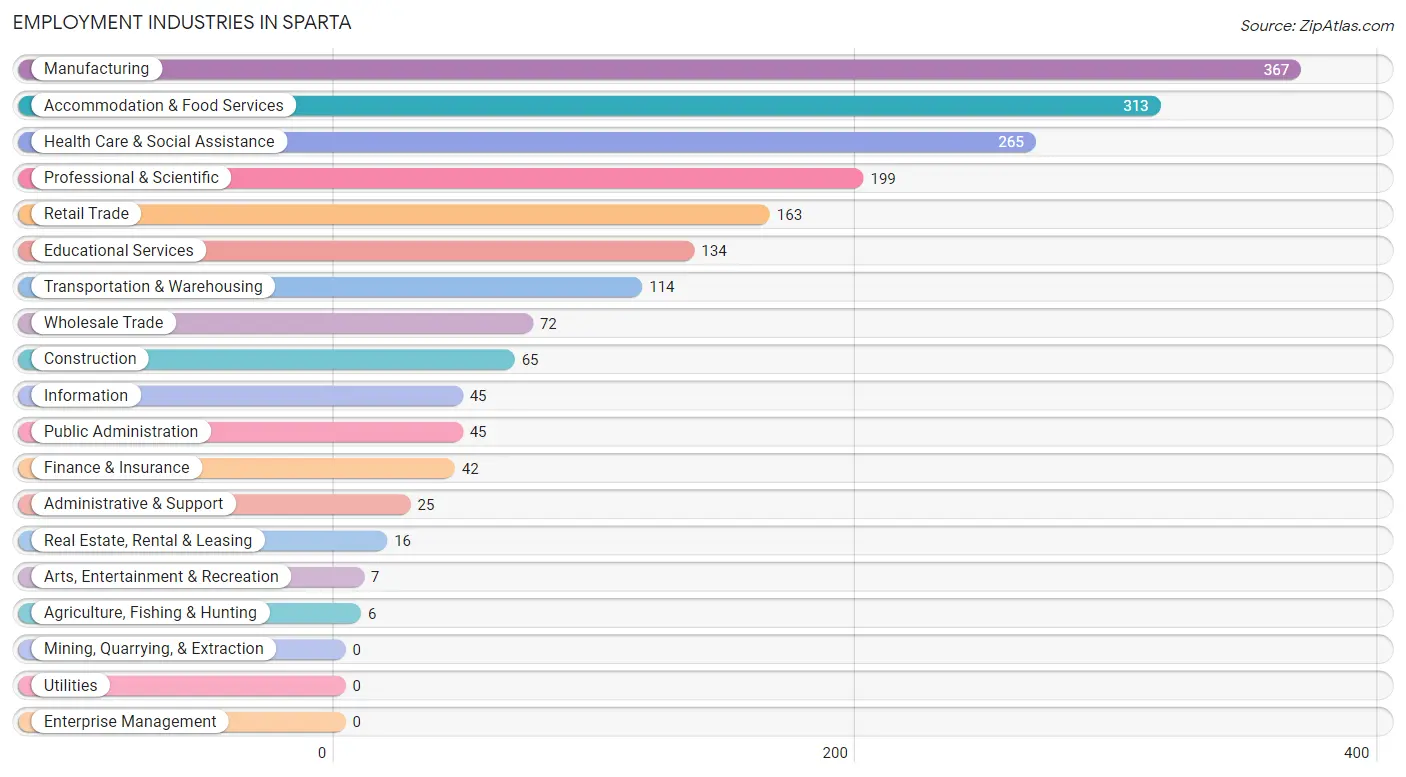
Employment Industries in Sparta
The major employment industries in Sparta include Manufacturing (367 | 18.9%), Accommodation & Food Services (313 | 16.1%), Health Care & Social Assistance (265 | 13.6%), Professional & Scientific (199 | 10.2%), and Retail Trade (163 | 8.4%).
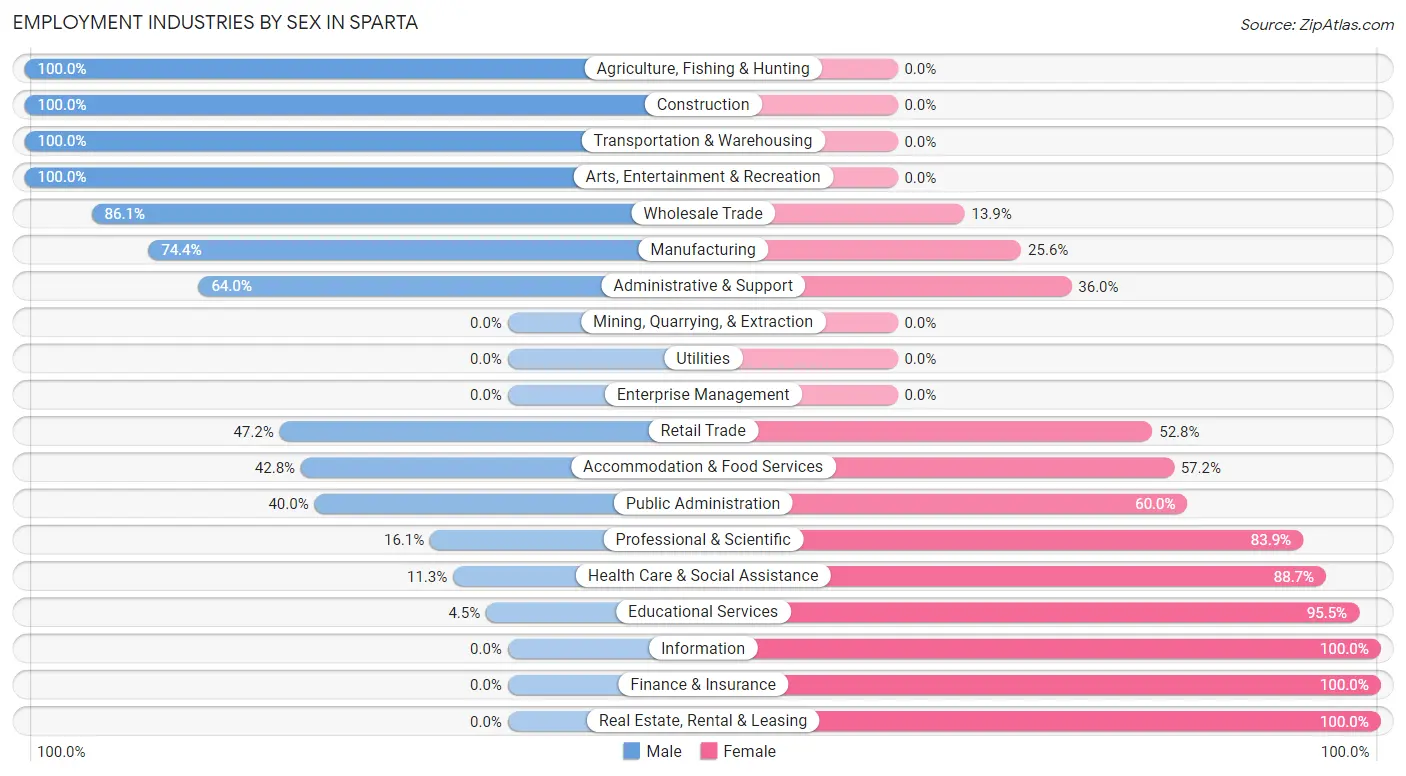
Employment Industries by Sex in Sparta
The Sparta industries that see more men than women are Agriculture, Fishing & Hunting (100.0%), Construction (100.0%), and Transportation & Warehousing (100.0%), whereas the industries that tend to have a higher number of women are Information (100.0%), Finance & Insurance (100.0%), and Real Estate, Rental & Leasing (100.0%).
| Industry | Male | Female |
| Agriculture, Fishing & Hunting | 6 (100.0%) | 0 (0.0%) |
| Mining, Quarrying, & Extraction | 0 (0.0%) | 0 (0.0%) |
| Construction | 65 (100.0%) | 0 (0.0%) |
| Manufacturing | 273 (74.4%) | 94 (25.6%) |
| Wholesale Trade | 62 (86.1%) | 10 (13.9%) |
| Retail Trade | 77 (47.2%) | 86 (52.8%) |
| Transportation & Warehousing | 114 (100.0%) | 0 (0.0%) |
| Utilities | 0 (0.0%) | 0 (0.0%) |
| Information | 0 (0.0%) | 45 (100.0%) |
| Finance & Insurance | 0 (0.0%) | 42 (100.0%) |
| Real Estate, Rental & Leasing | 0 (0.0%) | 16 (100.0%) |
| Professional & Scientific | 32 (16.1%) | 167 (83.9%) |
| Enterprise Management | 0 (0.0%) | 0 (0.0%) |
| Administrative & Support | 16 (64.0%) | 9 (36.0%) |
| Educational Services | 6 (4.5%) | 128 (95.5%) |
| Health Care & Social Assistance | 30 (11.3%) | 235 (88.7%) |
| Arts, Entertainment & Recreation | 7 (100.0%) | 0 (0.0%) |
| Accommodation & Food Services | 134 (42.8%) | 179 (57.2%) |
| Public Administration | 18 (40.0%) | 27 (60.0%) |
| Total | 891 (45.9%) | 1,052 (54.1%) |
Education in Sparta
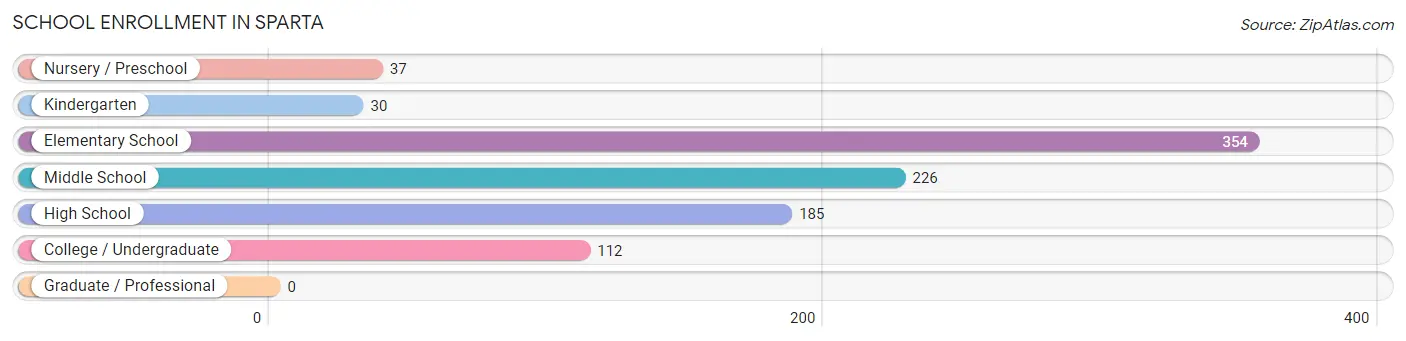
School Enrollment in Sparta
The most common levels of schooling among the 944 students in Sparta are elementary school (354 | 37.5%), middle school (226 | 23.9%), and high school (185 | 19.6%).
| School Level | # Students | % Students |
| Nursery / Preschool | 37 | 3.9% |
| Kindergarten | 30 | 3.2% |
| Elementary School | 354 | 37.5% |
| Middle School | 226 | 23.9% |
| High School | 185 | 19.6% |
| College / Undergraduate | 112 | 11.9% |
| Graduate / Professional | 0 | 0.0% |
| Total | 944 | 100.0% |
School Enrollment by Age by Funding Source in Sparta
Out of a total of 944 students who are enrolled in schools in Sparta, 62 (6.6%) attend a private institution, while the remaining 882 (93.4%) are enrolled in public schools. The age group of 5 to 9 year old has the highest likelihood of being enrolled in private schools, with 46 (13.8% in the age bracket) enrolled. Conversely, the age group of 3 to 4 year olds has the lowest likelihood of being enrolled in a private school, with 45 (100.0% in the age bracket) attending a public institution.
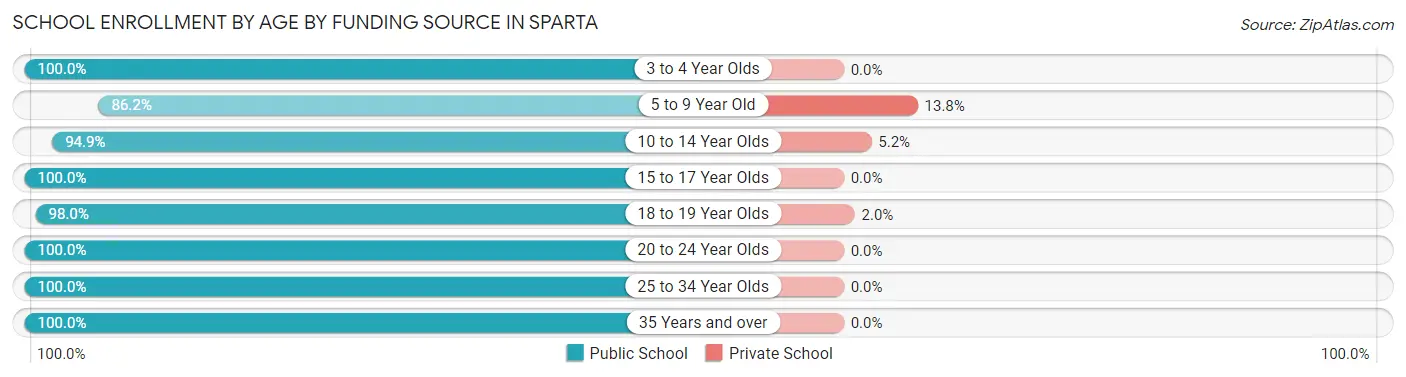
| Age Bracket | Public School | Private School |
| 3 to 4 Year Olds | 45 (100.0%) | 0 (0.0%) |
| 5 to 9 Year Old | 288 (86.2%) | 46 (13.8%) |
| 10 to 14 Year Olds | 258 (94.9%) | 14 (5.1%) |
| 15 to 17 Year Olds | 149 (100.0%) | 0 (0.0%) |
| 18 to 19 Year Olds | 96 (98.0%) | 2 (2.0%) |
| 20 to 24 Year Olds | 21 (100.0%) | 0 (0.0%) |
| 25 to 34 Year Olds | 10 (100.0%) | 0 (0.0%) |
| 35 Years and over | 15 (100.0%) | 0 (0.0%) |
| Total | 882 (93.4%) | 62 (6.6%) |
Educational Attainment by Field of Study in Sparta
Science & technology (146 | 24.5%), business (116 | 19.5%), education (82 | 13.8%), visual & performing arts (75 | 12.6%), and communications (67 | 11.2%) are the most common fields of study among 596 individuals in Sparta who have obtained a bachelor's degree or higher.
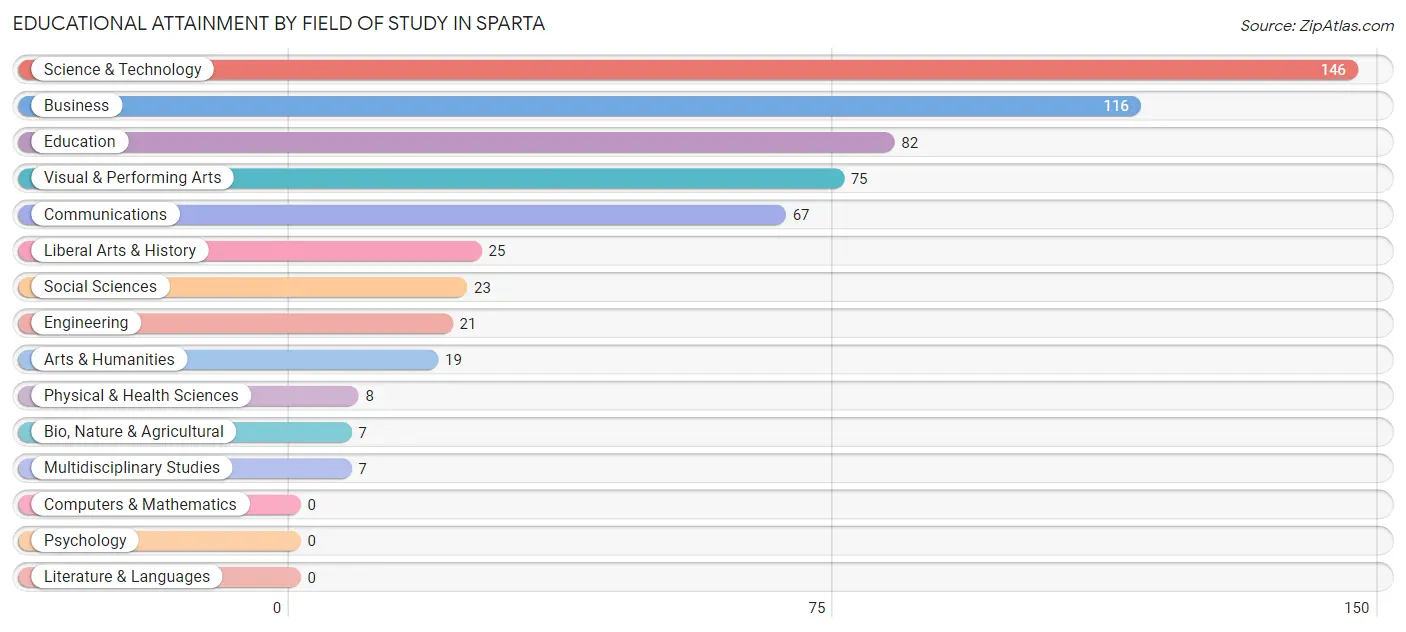
| Field of Study | # Graduates | % Graduates |
| Computers & Mathematics | 0 | 0.0% |
| Bio, Nature & Agricultural | 7 | 1.2% |
| Physical & Health Sciences | 8 | 1.3% |
| Psychology | 0 | 0.0% |
| Social Sciences | 23 | 3.9% |
| Engineering | 21 | 3.5% |
| Multidisciplinary Studies | 7 | 1.2% |
| Science & Technology | 146 | 24.5% |
| Business | 116 | 19.5% |
| Education | 82 | 13.8% |
| Literature & Languages | 0 | 0.0% |
| Liberal Arts & History | 25 | 4.2% |
| Visual & Performing Arts | 75 | 12.6% |
| Communications | 67 | 11.2% |
| Arts & Humanities | 19 | 3.2% |
| Total | 596 | 100.0% |
Transportation & Commute in Sparta
Vehicle Availability by Sex in Sparta
The most prevalent vehicle ownership categories in Sparta are males with 2 vehicles (316, accounting for 35.9%) and females with 2 vehicles (570, making up 30.0%).
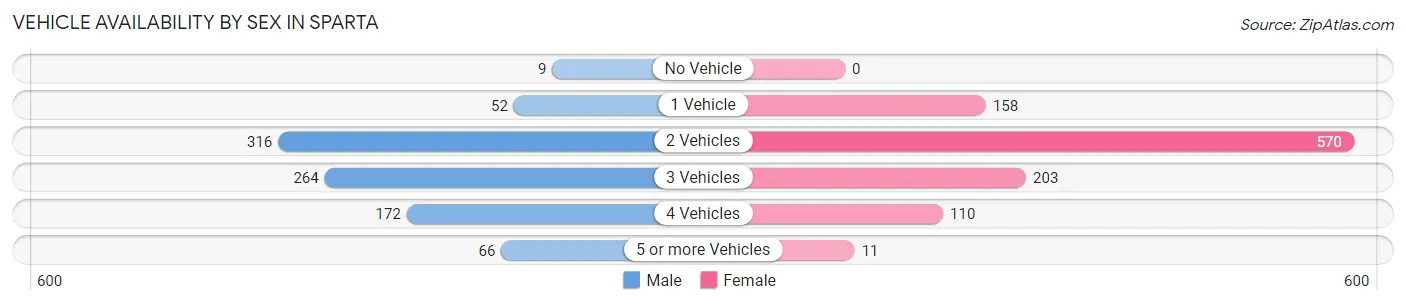
| Vehicles Available | Male | Female |
| No Vehicle | 9 (1.0%) | 0 (0.0%) |
| 1 Vehicle | 52 (5.9%) | 158 (15.0%) |
| 2 Vehicles | 316 (35.9%) | 570 (54.2%) |
| 3 Vehicles | 264 (30.0%) | 203 (19.3%) |
| 4 Vehicles | 172 (19.6%) | 110 (10.5%) |
| 5 or more Vehicles | 66 (7.5%) | 11 (1.1%) |
| Total | 879 (100.0%) | 1,052 (100.0%) |
Commute Time in Sparta
The most frequently occuring commute durations in Sparta are 5 to 9 minutes (630 commuters, 33.3%), 30 to 34 minutes (264 commuters, 13.9%), and 10 to 14 minutes (196 commuters, 10.3%).
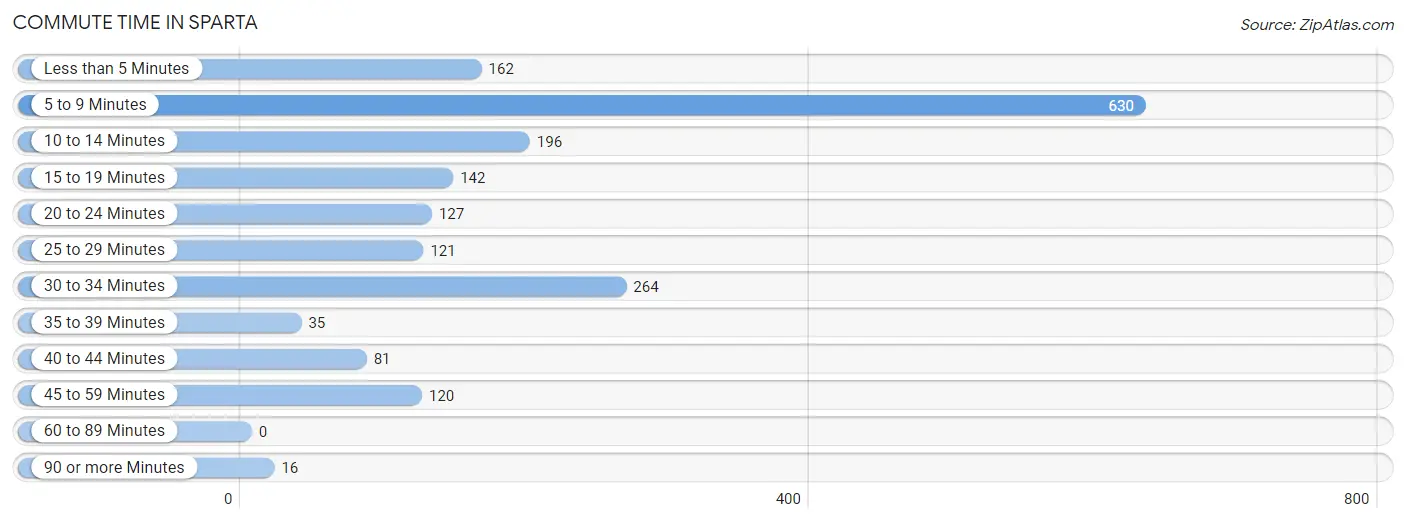
| Commute Time | # Commuters | % Commuters |
| Less than 5 Minutes | 162 | 8.6% |
| 5 to 9 Minutes | 630 | 33.3% |
| 10 to 14 Minutes | 196 | 10.3% |
| 15 to 19 Minutes | 142 | 7.5% |
| 20 to 24 Minutes | 127 | 6.7% |
| 25 to 29 Minutes | 121 | 6.4% |
| 30 to 34 Minutes | 264 | 13.9% |
| 35 to 39 Minutes | 35 | 1.8% |
| 40 to 44 Minutes | 81 | 4.3% |
| 45 to 59 Minutes | 120 | 6.3% |
| 60 to 89 Minutes | 0 | 0.0% |
| 90 or more Minutes | 16 | 0.8% |
Commute Time by Sex in Sparta
The most common commute times in Sparta are 30 to 34 minutes (211 commuters, 24.9%) for males and 5 to 9 minutes (510 commuters, 48.7%) for females.
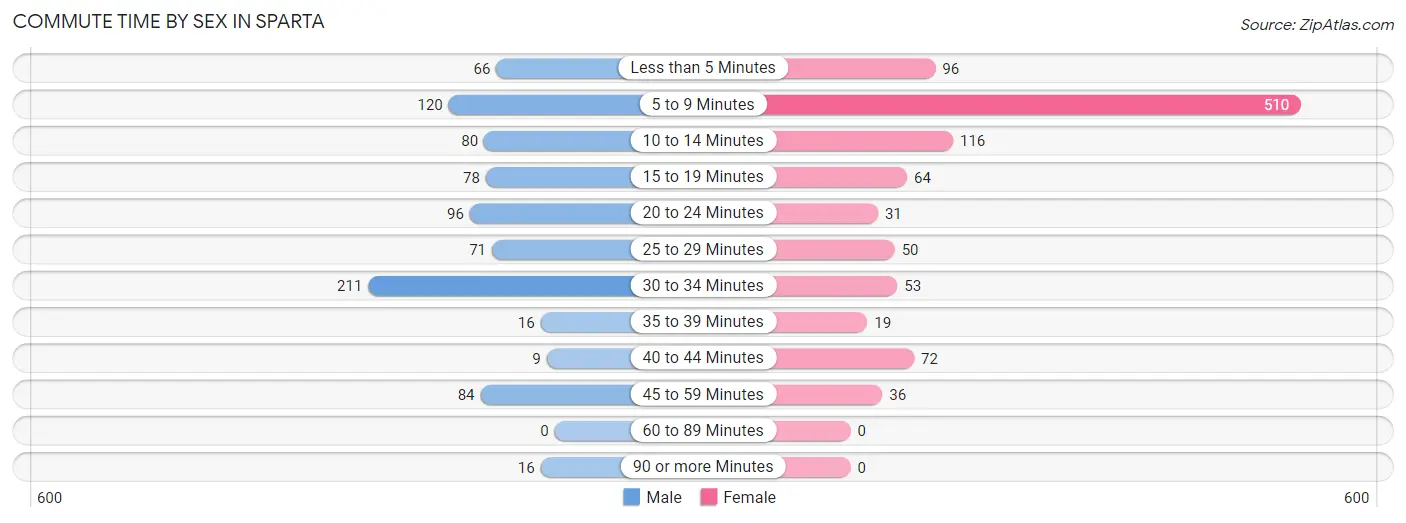
| Commute Time | Male | Female |
| Less than 5 Minutes | 66 (7.8%) | 96 (9.2%) |
| 5 to 9 Minutes | 120 (14.2%) | 510 (48.7%) |
| 10 to 14 Minutes | 80 (9.5%) | 116 (11.1%) |
| 15 to 19 Minutes | 78 (9.2%) | 64 (6.1%) |
| 20 to 24 Minutes | 96 (11.3%) | 31 (3.0%) |
| 25 to 29 Minutes | 71 (8.4%) | 50 (4.8%) |
| 30 to 34 Minutes | 211 (24.9%) | 53 (5.1%) |
| 35 to 39 Minutes | 16 (1.9%) | 19 (1.8%) |
| 40 to 44 Minutes | 9 (1.1%) | 72 (6.9%) |
| 45 to 59 Minutes | 84 (9.9%) | 36 (3.4%) |
| 60 to 89 Minutes | 0 (0.0%) | 0 (0.0%) |
| 90 or more Minutes | 16 (1.9%) | 0 (0.0%) |
Time of Departure to Work by Sex in Sparta
The most frequent times of departure to work in Sparta are 5:00 AM to 5:29 AM (205, 24.2%) for males and 7:00 AM to 7:29 AM (224, 21.4%) for females.
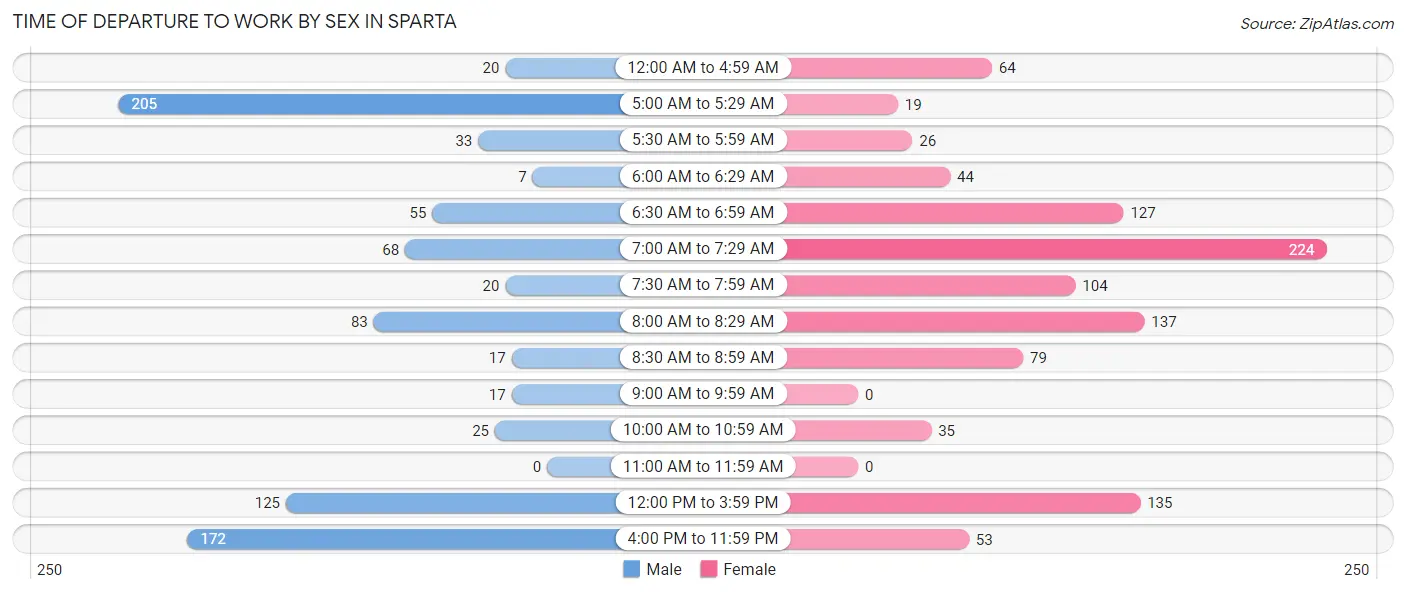
| Time of Departure | Male | Female |
| 12:00 AM to 4:59 AM | 20 (2.4%) | 64 (6.1%) |
| 5:00 AM to 5:29 AM | 205 (24.2%) | 19 (1.8%) |
| 5:30 AM to 5:59 AM | 33 (3.9%) | 26 (2.5%) |
| 6:00 AM to 6:29 AM | 7 (0.8%) | 44 (4.2%) |
| 6:30 AM to 6:59 AM | 55 (6.5%) | 127 (12.1%) |
| 7:00 AM to 7:29 AM | 68 (8.0%) | 224 (21.4%) |
| 7:30 AM to 7:59 AM | 20 (2.4%) | 104 (9.9%) |
| 8:00 AM to 8:29 AM | 83 (9.8%) | 137 (13.1%) |
| 8:30 AM to 8:59 AM | 17 (2.0%) | 79 (7.5%) |
| 9:00 AM to 9:59 AM | 17 (2.0%) | 0 (0.0%) |
| 10:00 AM to 10:59 AM | 25 (2.9%) | 35 (3.3%) |
| 11:00 AM to 11:59 AM | 0 (0.0%) | 0 (0.0%) |
| 12:00 PM to 3:59 PM | 125 (14.8%) | 135 (12.9%) |
| 4:00 PM to 11:59 PM | 172 (20.3%) | 53 (5.1%) |
| Total | 847 (100.0%) | 1,047 (100.0%) |
Housing Occupancy in Sparta
Occupancy by Ownership in Sparta
Of the total 1,988 dwellings in Sparta, owner-occupied units account for 1,242 (62.5%), while renter-occupied units make up 746 (37.5%).
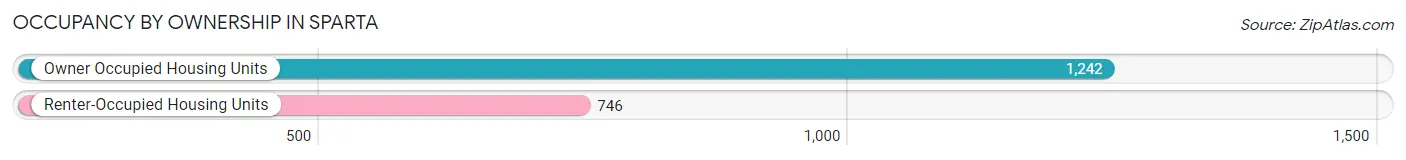
| Occupancy | # Housing Units | % Housing Units |
| Owner Occupied Housing Units | 1,242 | 62.5% |
| Renter-Occupied Housing Units | 746 | 37.5% |
| Total Occupied Housing Units | 1,988 | 100.0% |
Occupancy by Household Size in Sparta
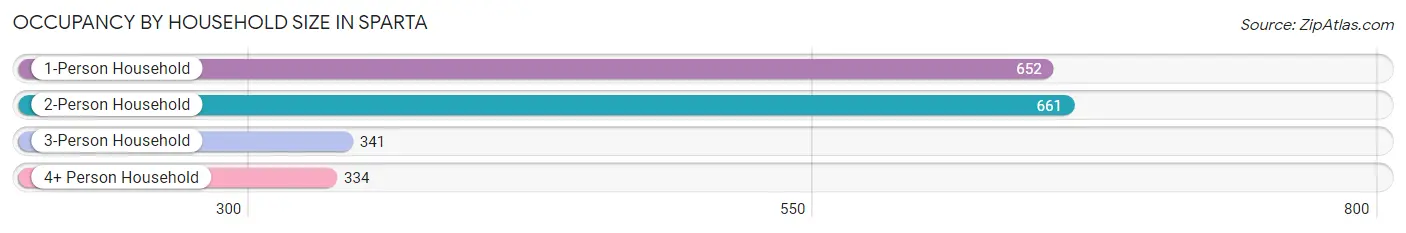
| Household Size | # Housing Units | % Housing Units |
| 1-Person Household | 652 | 32.8% |
| 2-Person Household | 661 | 33.3% |
| 3-Person Household | 341 | 17.2% |
| 4+ Person Household | 334 | 16.8% |
| Total Housing Units | 1,988 | 100.0% |
Occupancy by Ownership by Household Size in Sparta
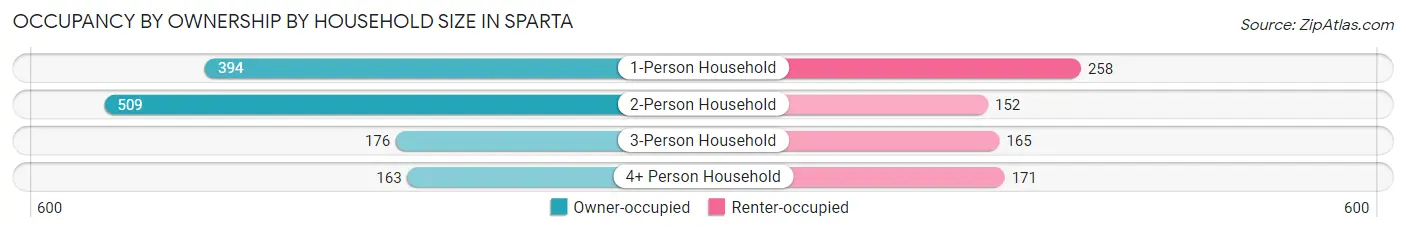
| Household Size | Owner-occupied | Renter-occupied |
| 1-Person Household | 394 (60.4%) | 258 (39.6%) |
| 2-Person Household | 509 (77.0%) | 152 (23.0%) |
| 3-Person Household | 176 (51.6%) | 165 (48.4%) |
| 4+ Person Household | 163 (48.8%) | 171 (51.2%) |
| Total Housing Units | 1,242 (62.5%) | 746 (37.5%) |
Occupancy by Educational Attainment in Sparta
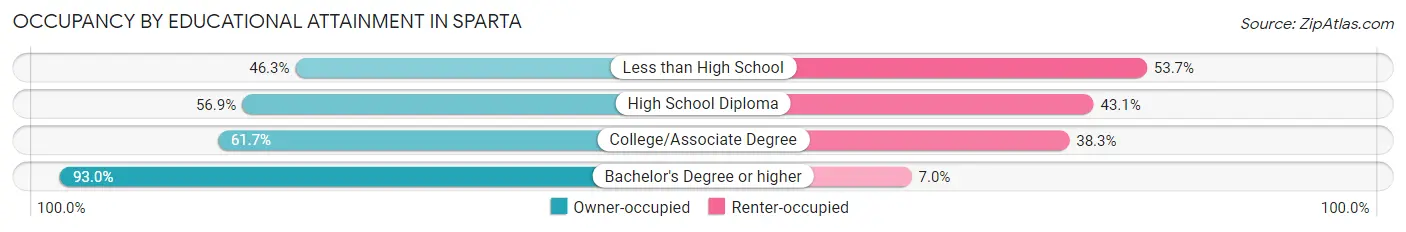
| Household Size | Owner-occupied | Renter-occupied |
| Less than High School | 101 (46.3%) | 117 (53.7%) |
| High School Diploma | 478 (56.9%) | 362 (43.1%) |
| College/Associate Degree | 398 (61.7%) | 247 (38.3%) |
| Bachelor's Degree or higher | 265 (93.0%) | 20 (7.0%) |
Occupancy by Age of Householder in Sparta
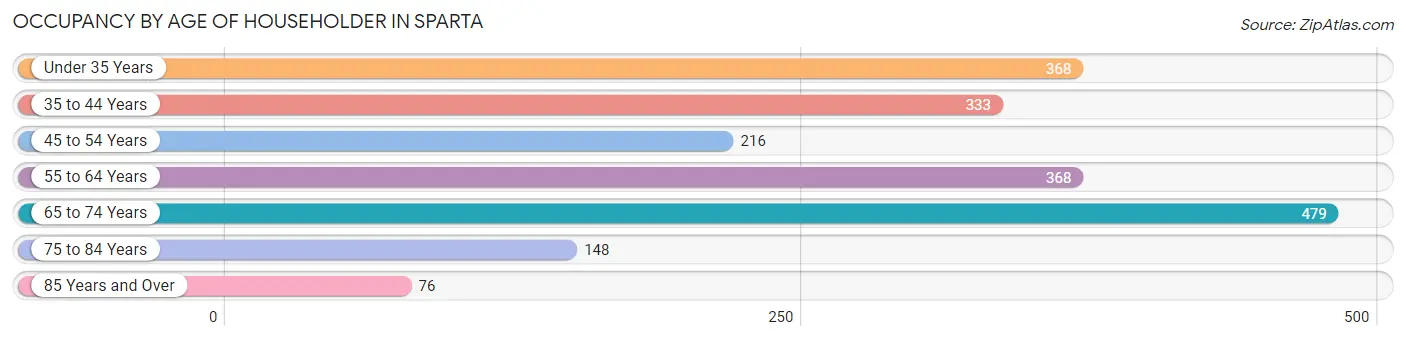
| Age Bracket | # Households | % Households |
| Under 35 Years | 368 | 18.5% |
| 35 to 44 Years | 333 | 16.8% |
| 45 to 54 Years | 216 | 10.9% |
| 55 to 64 Years | 368 | 18.5% |
| 65 to 74 Years | 479 | 24.1% |
| 75 to 84 Years | 148 | 7.4% |
| 85 Years and Over | 76 | 3.8% |
| Total | 1,988 | 100.0% |
Housing Finances in Sparta
Median Income by Occupancy in Sparta
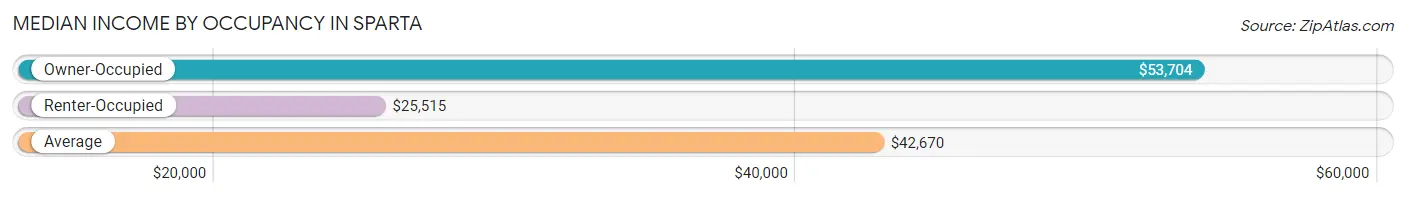
| Occupancy Type | # Households | Median Income |
| Owner-Occupied | 1,242 (62.5%) | $53,704 |
| Renter-Occupied | 746 (37.5%) | $25,515 |
| Average | 1,988 (100.0%) | $42,670 |
Occupancy by Householder Income Bracket in Sparta
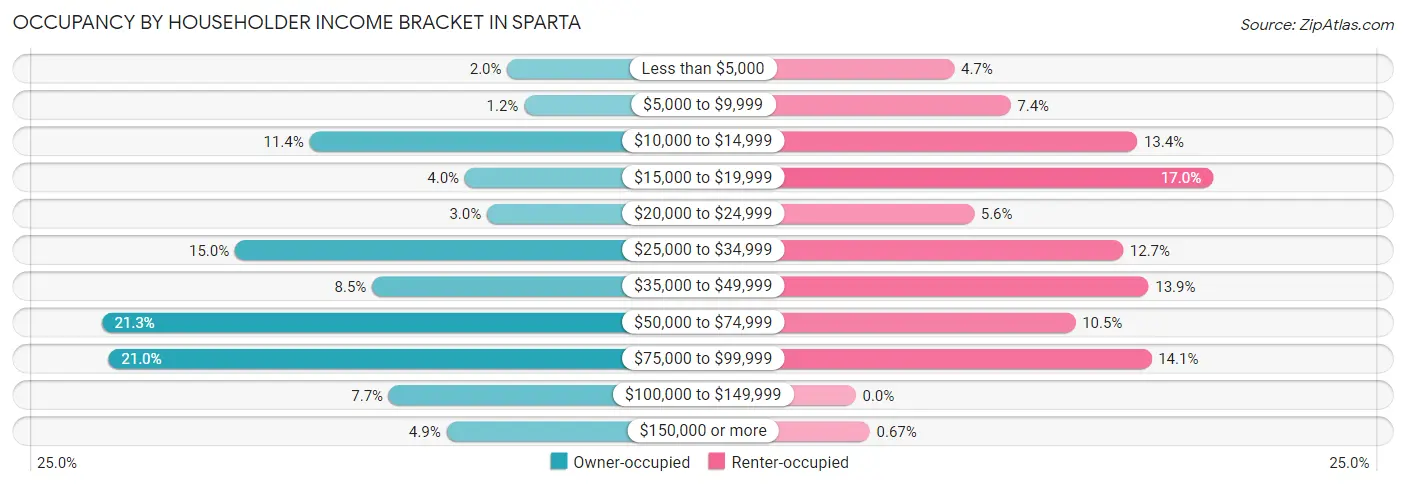
| Income Bracket | Owner-occupied | Renter-occupied |
| Less than $5,000 | 25 (2.0%) | 35 (4.7%) |
| $5,000 to $9,999 | 15 (1.2%) | 55 (7.4%) |
| $10,000 to $14,999 | 142 (11.4%) | 100 (13.4%) |
| $15,000 to $19,999 | 50 (4.0%) | 127 (17.0%) |
| $20,000 to $24,999 | 37 (3.0%) | 42 (5.6%) |
| $25,000 to $34,999 | 186 (15.0%) | 95 (12.7%) |
| $35,000 to $49,999 | 105 (8.5%) | 104 (13.9%) |
| $50,000 to $74,999 | 265 (21.3%) | 78 (10.5%) |
| $75,000 to $99,999 | 261 (21.0%) | 105 (14.1%) |
| $100,000 to $149,999 | 95 (7.6%) | 0 (0.0%) |
| $150,000 or more | 61 (4.9%) | 5 (0.7%) |
| Total | 1,242 (100.0%) | 746 (100.0%) |
Monthly Housing Cost Tiers in Sparta
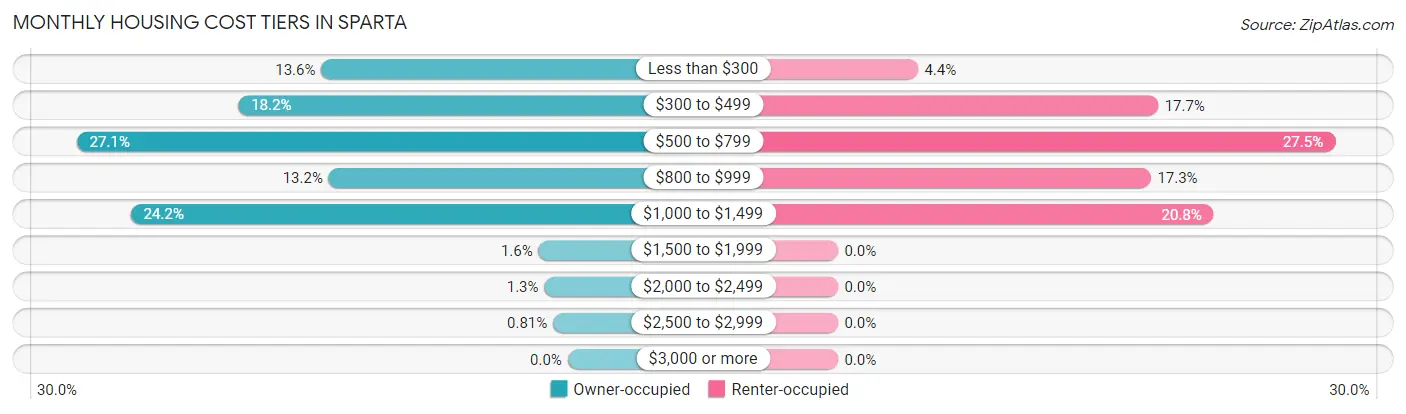
| Monthly Cost | Owner-occupied | Renter-occupied |
| Less than $300 | 169 (13.6%) | 33 (4.4%) |
| $300 to $499 | 226 (18.2%) | 132 (17.7%) |
| $500 to $799 | 337 (27.1%) | 205 (27.5%) |
| $800 to $999 | 164 (13.2%) | 129 (17.3%) |
| $1,000 to $1,499 | 300 (24.1%) | 155 (20.8%) |
| $1,500 to $1,999 | 20 (1.6%) | 0 (0.0%) |
| $2,000 to $2,499 | 16 (1.3%) | 0 (0.0%) |
| $2,500 to $2,999 | 10 (0.8%) | 0 (0.0%) |
| $3,000 or more | 0 (0.0%) | 0 (0.0%) |
| Total | 1,242 (100.0%) | 746 (100.0%) |
Physical Housing Characteristics in Sparta
Housing Structures in Sparta
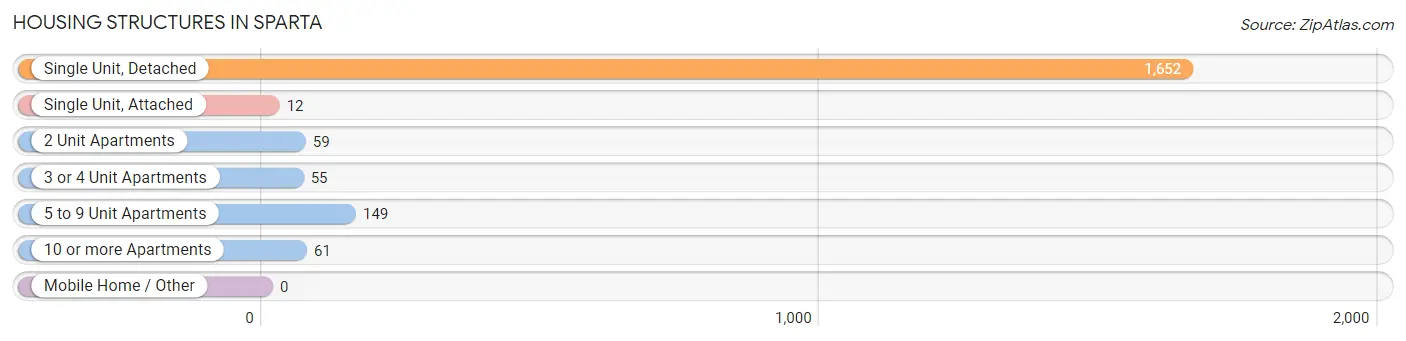
| Structure Type | # Housing Units | % Housing Units |
| Single Unit, Detached | 1,652 | 83.1% |
| Single Unit, Attached | 12 | 0.6% |
| 2 Unit Apartments | 59 | 3.0% |
| 3 or 4 Unit Apartments | 55 | 2.8% |
| 5 to 9 Unit Apartments | 149 | 7.5% |
| 10 or more Apartments | 61 | 3.1% |
| Mobile Home / Other | 0 | 0.0% |
| Total | 1,988 | 100.0% |
Housing Structures by Occupancy in Sparta
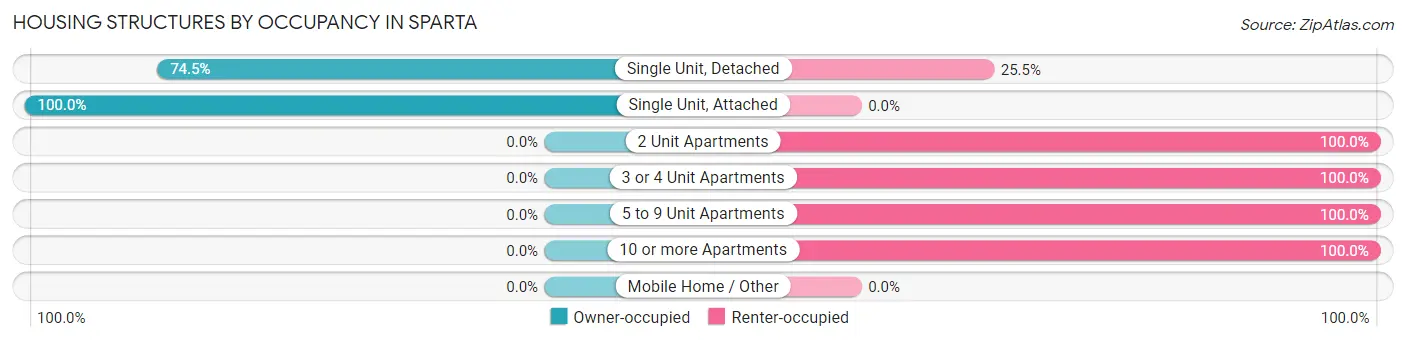
| Structure Type | Owner-occupied | Renter-occupied |
| Single Unit, Detached | 1,230 (74.5%) | 422 (25.5%) |
| Single Unit, Attached | 12 (100.0%) | 0 (0.0%) |
| 2 Unit Apartments | 0 (0.0%) | 59 (100.0%) |
| 3 or 4 Unit Apartments | 0 (0.0%) | 55 (100.0%) |
| 5 to 9 Unit Apartments | 0 (0.0%) | 149 (100.0%) |
| 10 or more Apartments | 0 (0.0%) | 61 (100.0%) |
| Mobile Home / Other | 0 (0.0%) | 0 (0.0%) |
| Total | 1,242 (62.5%) | 746 (37.5%) |
Housing Structures by Number of Rooms in Sparta
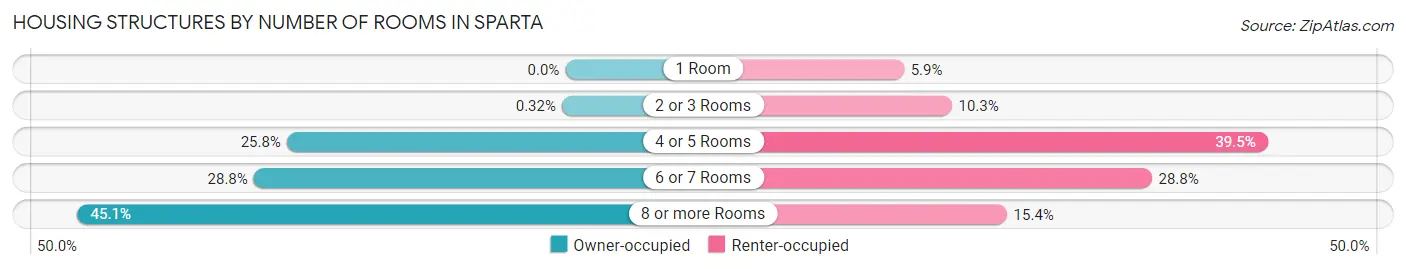
| Number of Rooms | Owner-occupied | Renter-occupied |
| 1 Room | 0 (0.0%) | 44 (5.9%) |
| 2 or 3 Rooms | 4 (0.3%) | 77 (10.3%) |
| 4 or 5 Rooms | 320 (25.8%) | 295 (39.5%) |
| 6 or 7 Rooms | 358 (28.8%) | 215 (28.8%) |
| 8 or more Rooms | 560 (45.1%) | 115 (15.4%) |
| Total | 1,242 (100.0%) | 746 (100.0%) |
Housing Structure by Heating Type in Sparta
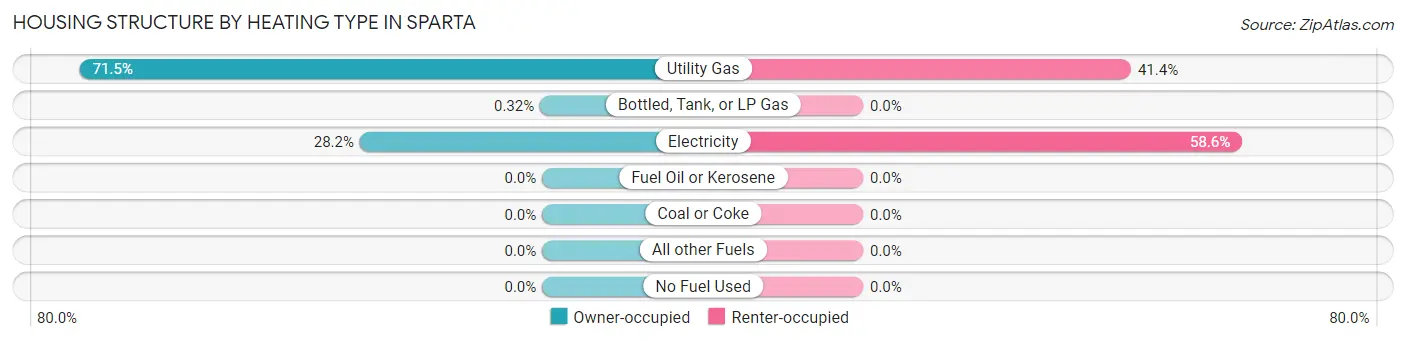
| Heating Type | Owner-occupied | Renter-occupied |
| Utility Gas | 888 (71.5%) | 309 (41.4%) |
| Bottled, Tank, or LP Gas | 4 (0.3%) | 0 (0.0%) |
| Electricity | 350 (28.2%) | 437 (58.6%) |
| Fuel Oil or Kerosene | 0 (0.0%) | 0 (0.0%) |
| Coal or Coke | 0 (0.0%) | 0 (0.0%) |
| All other Fuels | 0 (0.0%) | 0 (0.0%) |
| No Fuel Used | 0 (0.0%) | 0 (0.0%) |
| Total | 1,242 (100.0%) | 746 (100.0%) |
Household Vehicle Usage in Sparta
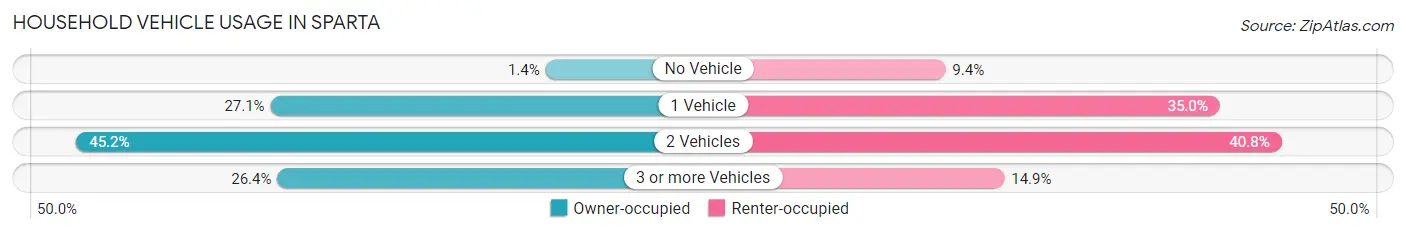
| Vehicles per Household | Owner-occupied | Renter-occupied |
| No Vehicle | 17 (1.4%) | 70 (9.4%) |
| 1 Vehicle | 336 (27.1%) | 261 (35.0%) |
| 2 Vehicles | 561 (45.2%) | 304 (40.7%) |
| 3 or more Vehicles | 328 (26.4%) | 111 (14.9%) |
| Total | 1,242 (100.0%) | 746 (100.0%) |
Real Estate & Mortgages in Sparta
Real Estate and Mortgage Overview in Sparta
| Characteristic | Without Mortgage | With Mortgage |
| Housing Units | 681 | 561 |
| Median Property Value | $182,800 | $183,800 |
| Median Household Income | $50,260 | $28 |
| Monthly Housing Costs | $443 | $0 |
| Real Estate Taxes | $882 | $0 |
Property Value by Mortgage Status in Sparta
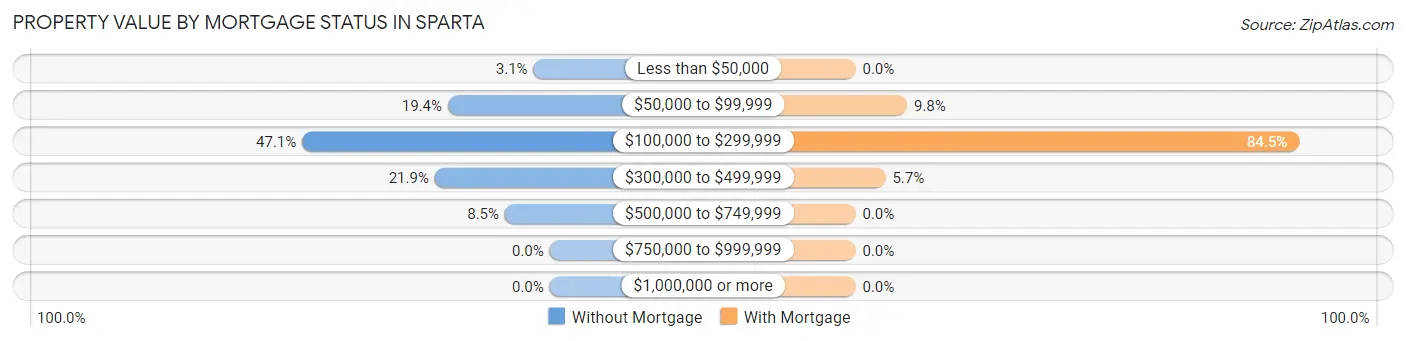
| Property Value | Without Mortgage | With Mortgage |
| Less than $50,000 | 21 (3.1%) | 0 (0.0%) |
| $50,000 to $99,999 | 132 (19.4%) | 55 (9.8%) |
| $100,000 to $299,999 | 321 (47.1%) | 474 (84.5%) |
| $300,000 to $499,999 | 149 (21.9%) | 32 (5.7%) |
| $500,000 to $749,999 | 58 (8.5%) | 0 (0.0%) |
| $750,000 to $999,999 | 0 (0.0%) | 0 (0.0%) |
| $1,000,000 or more | 0 (0.0%) | 0 (0.0%) |
| Total | 681 (100.0%) | 561 (100.0%) |
Household Income by Mortgage Status in Sparta
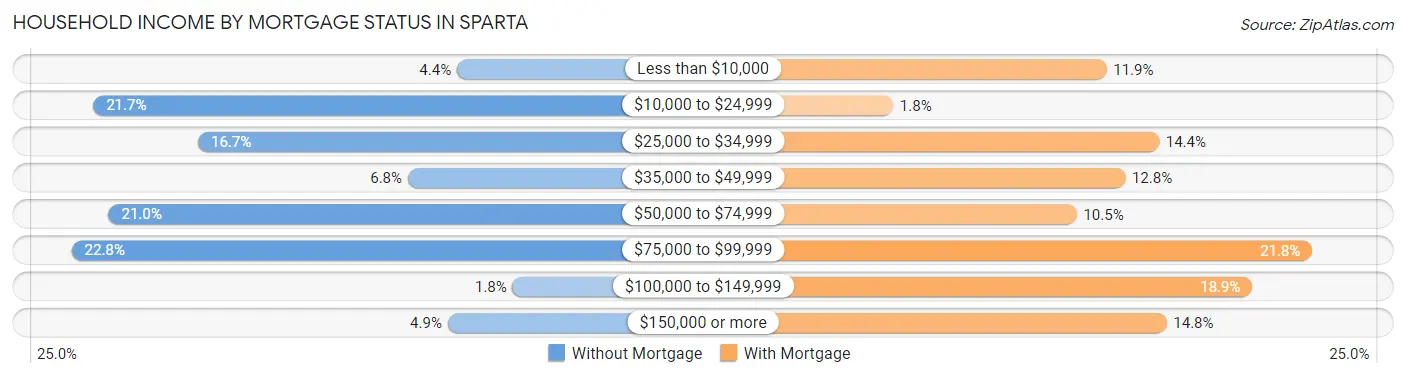
| Household Income | Without Mortgage | With Mortgage |
| Less than $10,000 | 30 (4.4%) | 67 (11.9%) |
| $10,000 to $24,999 | 148 (21.7%) | 10 (1.8%) |
| $25,000 to $34,999 | 114 (16.7%) | 81 (14.4%) |
| $35,000 to $49,999 | 46 (6.8%) | 72 (12.8%) |
| $50,000 to $74,999 | 143 (21.0%) | 59 (10.5%) |
| $75,000 to $99,999 | 155 (22.8%) | 122 (21.7%) |
| $100,000 to $149,999 | 12 (1.8%) | 106 (18.9%) |
| $150,000 or more | 33 (4.9%) | 83 (14.8%) |
| Total | 681 (100.0%) | 561 (100.0%) |
Property Value to Household Income Ratio in Sparta
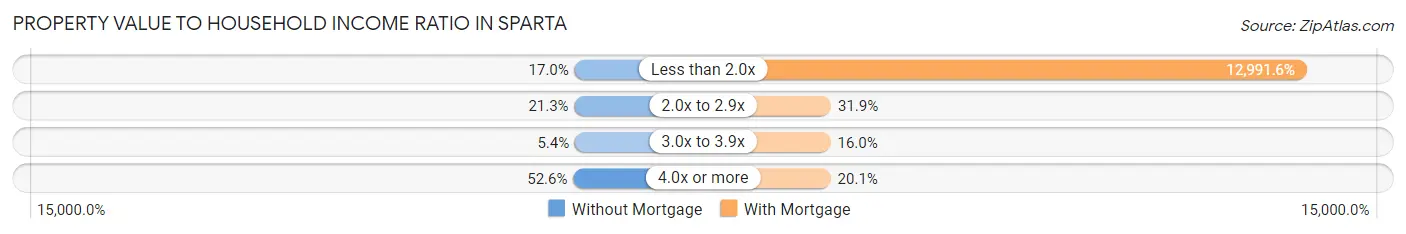
| Value-to-Income Ratio | Without Mortgage | With Mortgage |
| Less than 2.0x | 116 (17.0%) | 72,883 (12,991.6%) |
| 2.0x to 2.9x | 145 (21.3%) | 179 (31.9%) |
| 3.0x to 3.9x | 37 (5.4%) | 90 (16.0%) |
| 4.0x or more | 358 (52.6%) | 113 (20.1%) |
| Total | 681 (100.0%) | 561 (100.0%) |
Real Estate Taxes by Mortgage Status in Sparta
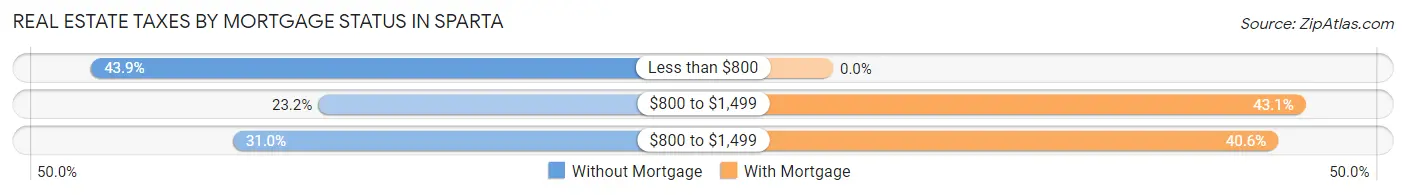
| Property Taxes | Without Mortgage | With Mortgage |
| Less than $800 | 299 (43.9%) | 0 (0.0%) |
| $800 to $1,499 | 158 (23.2%) | 242 (43.1%) |
| $800 to $1,499 | 211 (31.0%) | 228 (40.6%) |
| Total | 681 (100.0%) | 561 (100.0%) |
Health & Disability in Sparta
Health Insurance Coverage by Age in Sparta
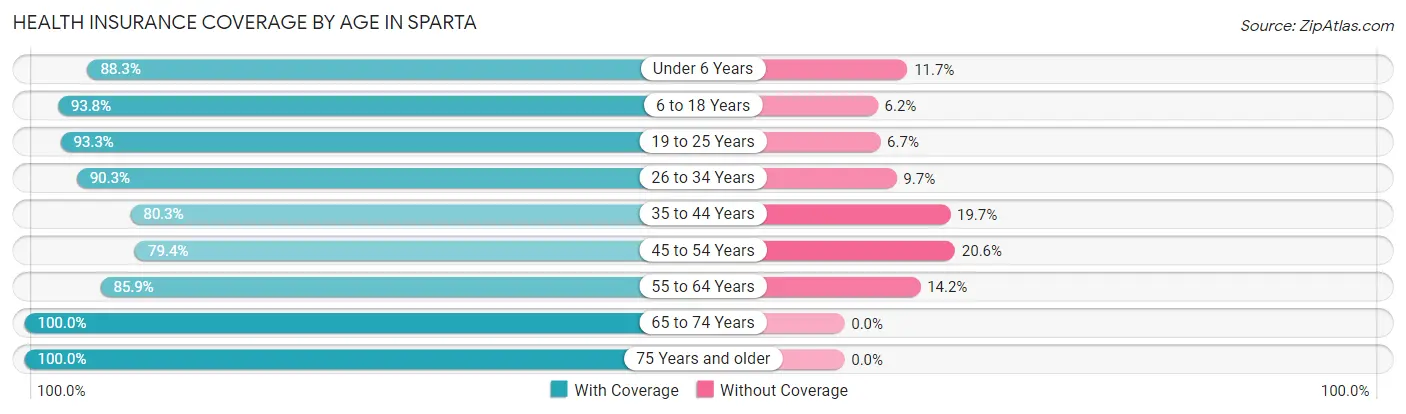
| Age Bracket | With Coverage | Without Coverage |
| Under 6 Years | 286 (88.3%) | 38 (11.7%) |
| 6 to 18 Years | 800 (93.8%) | 53 (6.2%) |
| 19 to 25 Years | 251 (93.3%) | 18 (6.7%) |
| 26 to 34 Years | 557 (90.3%) | 60 (9.7%) |
| 35 to 44 Years | 517 (80.3%) | 127 (19.7%) |
| 45 to 54 Years | 358 (79.4%) | 93 (20.6%) |
| 55 to 64 Years | 370 (85.9%) | 61 (14.1%) |
| 65 to 74 Years | 779 (100.0%) | 0 (0.0%) |
| 75 Years and older | 238 (100.0%) | 0 (0.0%) |
| Total | 4,156 (90.2%) | 450 (9.8%) |
Health Insurance Coverage by Citizenship Status in Sparta
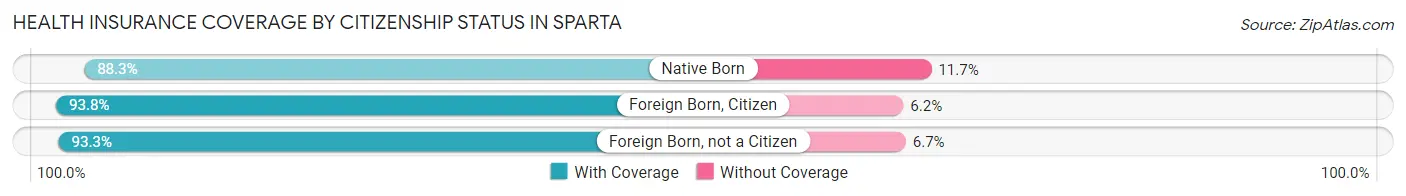
| Citizenship Status | With Coverage | Without Coverage |
| Native Born | 286 (88.3%) | 38 (11.7%) |
| Foreign Born, Citizen | 800 (93.8%) | 53 (6.2%) |
| Foreign Born, not a Citizen | 251 (93.3%) | 18 (6.7%) |
Health Insurance Coverage by Household Income in Sparta
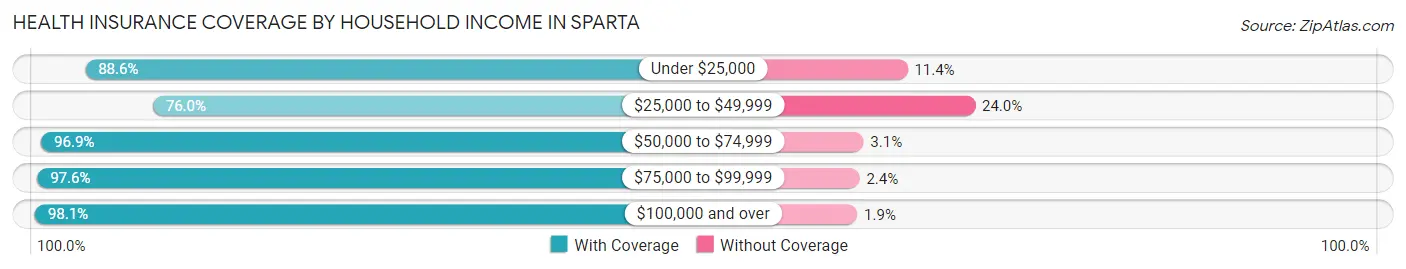
| Household Income | With Coverage | Without Coverage |
| Under $25,000 | 866 (88.6%) | 111 (11.4%) |
| $25,000 to $49,999 | 873 (76.0%) | 276 (24.0%) |
| $50,000 to $74,999 | 810 (96.9%) | 26 (3.1%) |
| $75,000 to $99,999 | 1,153 (97.6%) | 28 (2.4%) |
| $100,000 and over | 454 (98.1%) | 9 (1.9%) |
Public vs Private Health Insurance Coverage by Age in Sparta
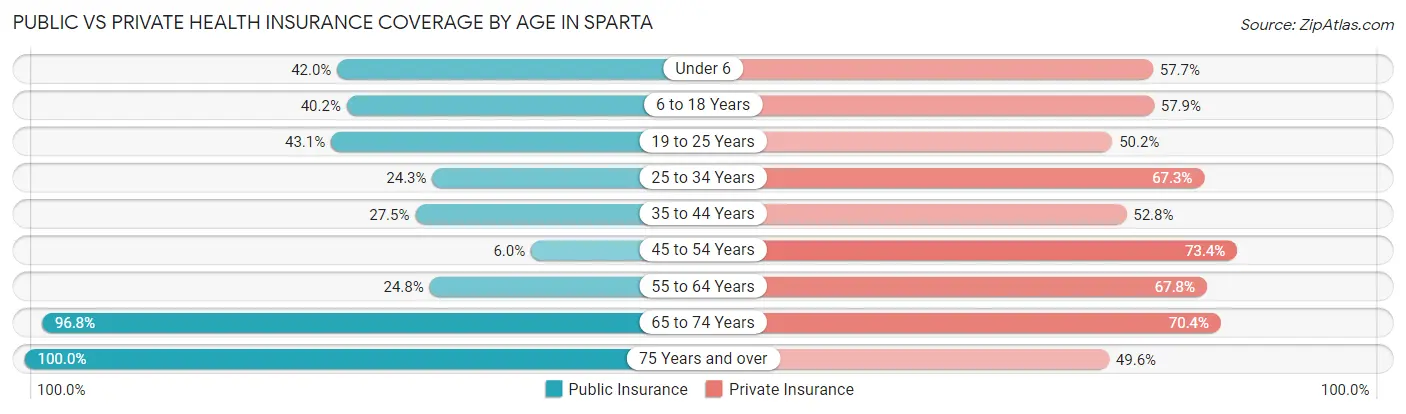
| Age Bracket | Public Insurance | Private Insurance |
| Under 6 | 136 (42.0%) | 187 (57.7%) |
| 6 to 18 Years | 343 (40.2%) | 494 (57.9%) |
| 19 to 25 Years | 116 (43.1%) | 135 (50.2%) |
| 25 to 34 Years | 150 (24.3%) | 415 (67.3%) |
| 35 to 44 Years | 177 (27.5%) | 340 (52.8%) |
| 45 to 54 Years | 27 (6.0%) | 331 (73.4%) |
| 55 to 64 Years | 107 (24.8%) | 292 (67.7%) |
| 65 to 74 Years | 754 (96.8%) | 548 (70.4%) |
| 75 Years and over | 238 (100.0%) | 118 (49.6%) |
| Total | 2,048 (44.5%) | 2,860 (62.1%) |
Disability Status by Sex by Age in Sparta
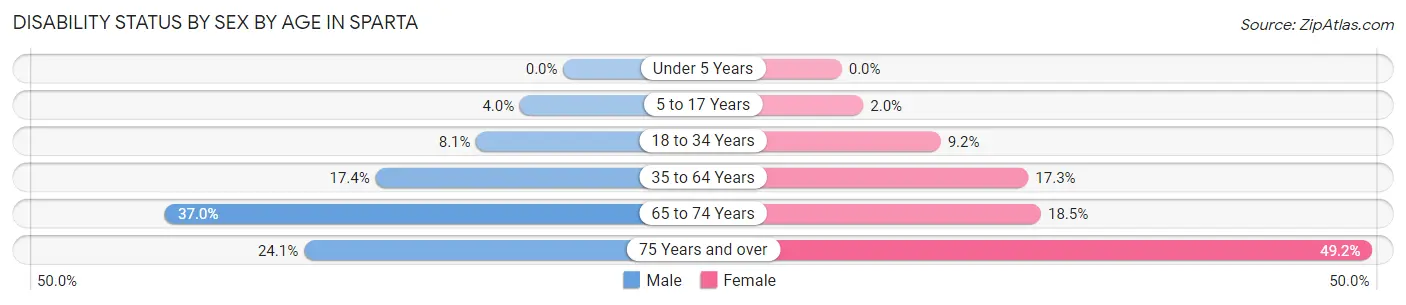
| Age Bracket | Male | Female |
| Under 5 Years | 0 (0.0%) | 0 (0.0%) |
| 5 to 17 Years | 14 (4.0%) | 9 (2.0%) |
| 18 to 34 Years | 38 (8.1%) | 46 (9.2%) |
| 35 to 64 Years | 111 (17.4%) | 154 (17.3%) |
| 65 to 74 Years | 136 (37.0%) | 76 (18.5%) |
| 75 Years and over | 26 (24.1%) | 64 (49.2%) |
Disability Class by Sex by Age in Sparta
Disability Class: Hearing Difficulty
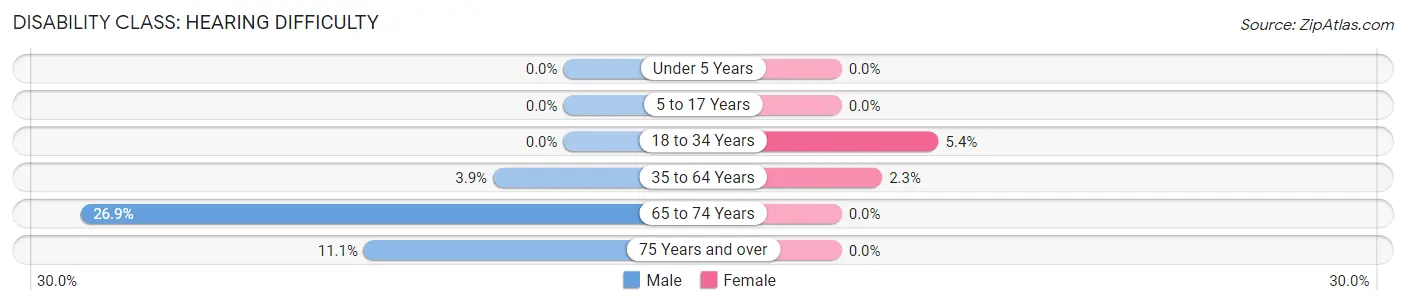
| Age Bracket | Male | Female |
| Under 5 Years | 0 (0.0%) | 0 (0.0%) |
| 5 to 17 Years | 0 (0.0%) | 0 (0.0%) |
| 18 to 34 Years | 0 (0.0%) | 27 (5.4%) |
| 35 to 64 Years | 25 (3.9%) | 20 (2.2%) |
| 65 to 74 Years | 99 (26.9%) | 0 (0.0%) |
| 75 Years and over | 12 (11.1%) | 0 (0.0%) |
Disability Class: Vision Difficulty
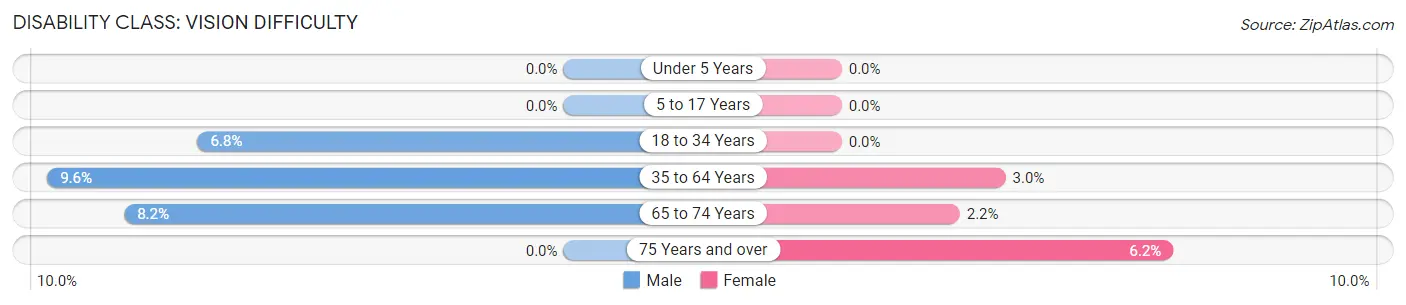
| Age Bracket | Male | Female |
| Under 5 Years | 0 (0.0%) | 0 (0.0%) |
| 5 to 17 Years | 0 (0.0%) | 0 (0.0%) |
| 18 to 34 Years | 32 (6.8%) | 0 (0.0%) |
| 35 to 64 Years | 61 (9.6%) | 27 (3.0%) |
| 65 to 74 Years | 30 (8.2%) | 9 (2.2%) |
| 75 Years and over | 0 (0.0%) | 8 (6.1%) |
Disability Class: Cognitive Difficulty
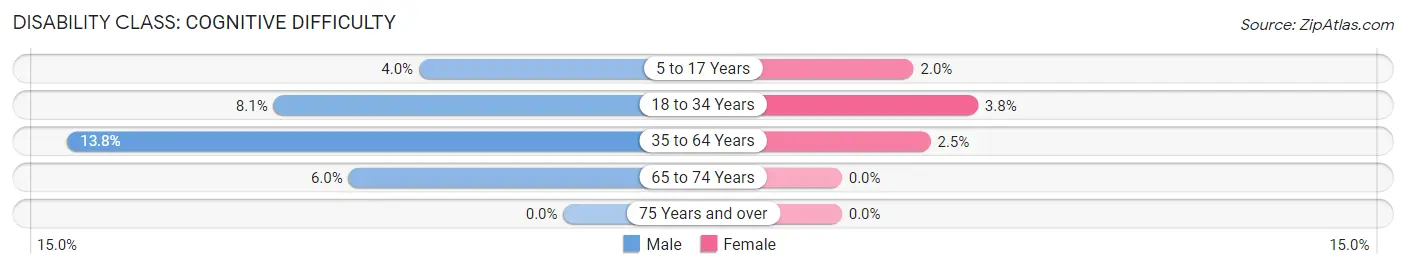
| Age Bracket | Male | Female |
| 5 to 17 Years | 14 (4.0%) | 9 (2.0%) |
| 18 to 34 Years | 38 (8.1%) | 19 (3.8%) |
| 35 to 64 Years | 88 (13.8%) | 22 (2.5%) |
| 65 to 74 Years | 22 (6.0%) | 0 (0.0%) |
| 75 Years and over | 0 (0.0%) | 0 (0.0%) |
Disability Class: Ambulatory Difficulty
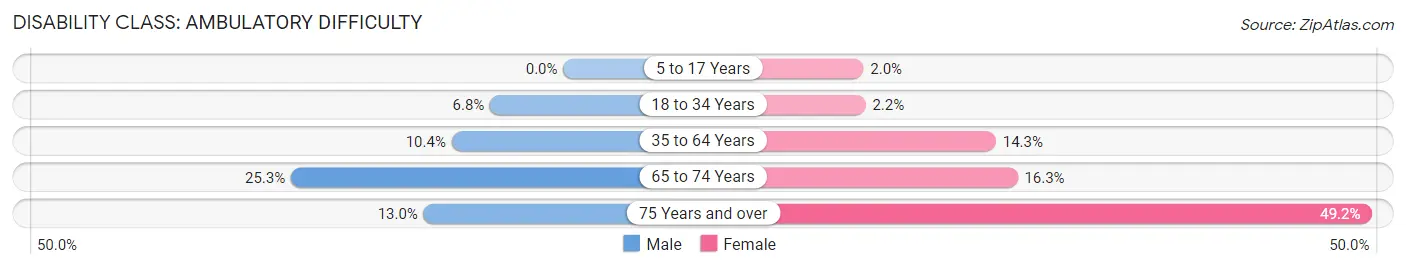
| Age Bracket | Male | Female |
| 5 to 17 Years | 0 (0.0%) | 9 (2.0%) |
| 18 to 34 Years | 32 (6.8%) | 11 (2.2%) |
| 35 to 64 Years | 66 (10.4%) | 127 (14.3%) |
| 65 to 74 Years | 93 (25.3%) | 67 (16.3%) |
| 75 Years and over | 14 (13.0%) | 64 (49.2%) |
Disability Class: Self-Care Difficulty
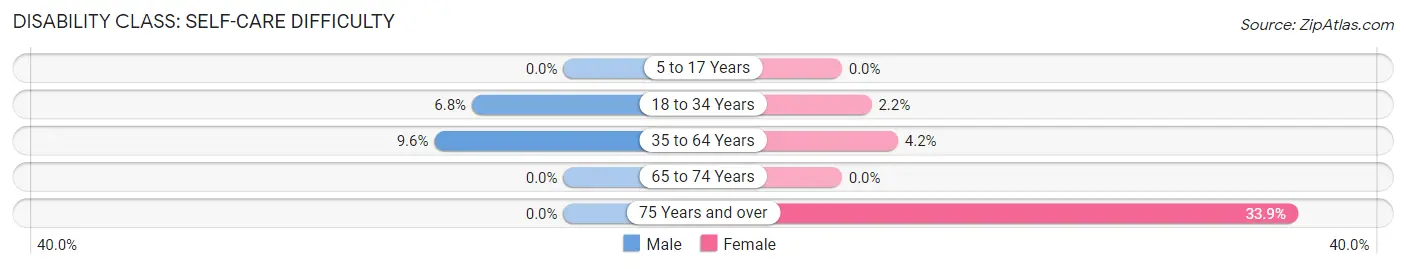
| Age Bracket | Male | Female |
| 5 to 17 Years | 0 (0.0%) | 0 (0.0%) |
| 18 to 34 Years | 32 (6.8%) | 11 (2.2%) |
| 35 to 64 Years | 61 (9.6%) | 37 (4.2%) |
| 65 to 74 Years | 0 (0.0%) | 0 (0.0%) |
| 75 Years and over | 0 (0.0%) | 44 (33.9%) |
Technology Access in Sparta
Computing Device Access in Sparta
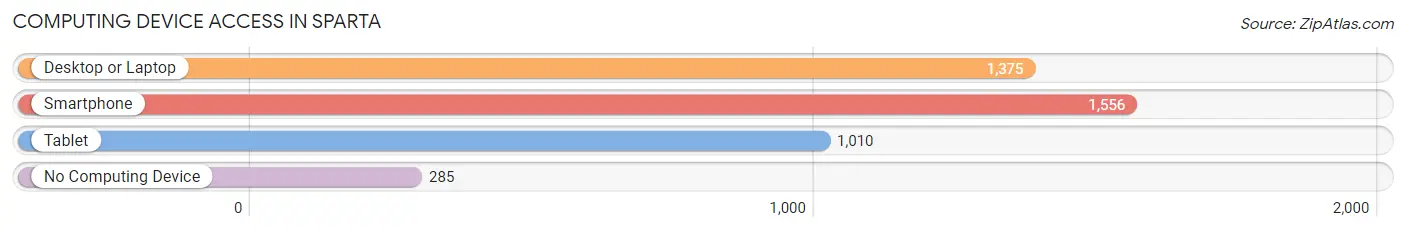
| Device Type | # Households | % Households |
| Desktop or Laptop | 1,375 | 69.2% |
| Smartphone | 1,556 | 78.3% |
| Tablet | 1,010 | 50.8% |
| No Computing Device | 285 | 14.3% |
| Total | 1,988 | 100.0% |
Internet Access in Sparta
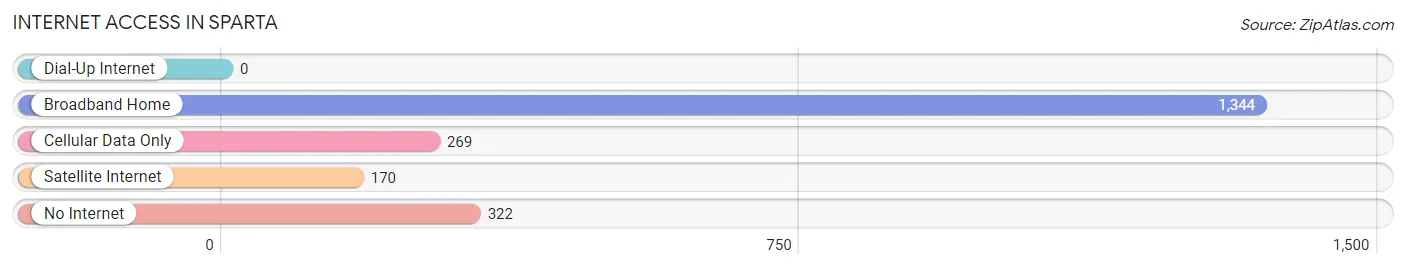
| Internet Type | # Households | % Households |
| Dial-Up Internet | 0 | 0.0% |
| Broadband Home | 1,344 | 67.6% |
| Cellular Data Only | 269 | 13.5% |
| Satellite Internet | 170 | 8.6% |
| No Internet | 322 | 16.2% |
| Total | 1,988 | 100.0% |
Sparta Summary
Sparta, Tennessee is a small city located in White County, Tennessee. It is situated in the foothills of the Cumberland Mountains and is the county seat of White County. The city has a population of approximately 4,800 people and is located about 90 miles east of Nashville.
History
Sparta was founded in 1809 and was originally known as “Sparta Courthouse”. The city was named after the ancient Greek city-state of Sparta. The city was incorporated in 1819 and was the first county seat of White County. The city was an important center of commerce and transportation in the early 19th century. The city was also the site of a major Civil War battle in 1863.
Geography
Sparta is located in the foothills of the Cumberland Mountains in Middle Tennessee. The city is situated at an elevation of 1,000 feet above sea level. The city is located about 90 miles east of Nashville and is bordered by the Caney Fork River to the north and the Calfkiller River to the south. The city is located in a humid subtropical climate zone and experiences hot summers and mild winters.
Economy
Sparta’s economy is largely based on agriculture and manufacturing. The city is home to several large manufacturing companies, including Sparta Manufacturing, which produces automotive parts, and Sparta Plastics, which produces plastic products. The city is also home to several small businesses, including restaurants, retail stores, and service providers.
Demographics
As of the 2010 census, the population of Sparta was 4,800. The racial makeup of the city was 95.3% White, 1.2% African American, 0.3% Native American, 0.3% Asian, 0.1% Pacific Islander, 1.2% from other races, and 1.7% from two or more races. The median household income in Sparta was $30,938, and the median family income was $37,813. The per capita income in Sparta was $17,845.
Sparta is a small city with a rich history and a diverse economy. The city is home to several large manufacturing companies and small businesses, and the population is largely white. The city is located in the foothills of the Cumberland Mountains and experiences hot summers and mild winters. Sparta is an important center of commerce and transportation in Middle Tennessee and is a great place to live and work.
Common Questions
What is Per Capita Income in Sparta?
Per Capita income in Sparta is $23,912.
What is the Median Family Income in Sparta?
Median Family Income in Sparta is $70,638.
What is the Median Household income in Sparta?
Median Household Income in Sparta is $42,670.
What is Income or Wage Gap in Sparta?
Income or Wage Gap in Sparta is 1.7%.
Women in Sparta earn 98.3 cents for every dollar earned by a man.
What is Family Income Deficit in Sparta?
Family Income Deficit in Sparta is $7,440.
Families that are below poverty line in Sparta earn $7,440 less on average than the poverty threshold level.
What is Inequality or Gini Index in Sparta?
Inequality or Gini Index in Sparta is 0.47.
What is the Total Population of Sparta?
Total Population of Sparta is 4,950.
What is the Total Male Population of Sparta?
Total Male Population of Sparta is 2,368.
What is the Total Female Population of Sparta?
Total Female Population of Sparta is 2,582.
What is the Ratio of Males per 100 Females in Sparta?
There are 91.71 Males per 100 Females in Sparta.
What is the Ratio of Females per 100 Males in Sparta?
There are 109.04 Females per 100 Males in Sparta.
What is the Median Population Age in Sparta?
Median Population Age in Sparta is 38.7 Years.
What is the Average Family Size in Sparta
Average Family Size in Sparta is 2.9 People.
What is the Average Household Size in Sparta
Average Household Size in Sparta is 2.3 People.
How Large is the Labor Force in Sparta?
There are 2,183 People in the Labor Forcein in Sparta.
What is the Percentage of People in the Labor Force in Sparta?
55.4% of People are in the Labor Force in Sparta.
What is the Unemployment Rate in Sparta?
Unemployment Rate in Sparta is 10.9%.