New Market, TN Map & Demographics
New Market Map
New Market Overview
$29,120
PER CAPITA INCOME
$74,097
AVG FAMILY INCOME
$66,324
AVG HOUSEHOLD INCOME
28.7%
WAGE / INCOME GAP [ % ]
71.3¢/ $1
WAGE / INCOME GAP [ $ ]
0.35
INEQUALITY / GINI INDEX
1,786
TOTAL POPULATION
887
MALE POPULATION
899
FEMALE POPULATION
98.67
MALES / 100 FEMALES
101.35
FEMALES / 100 MALES
41.4
MEDIAN AGE
3.5
AVG FAMILY SIZE
3.0
AVG HOUSEHOLD SIZE
958
LABOR FORCE [ PEOPLE ]
67.9%
PERCENT IN LABOR FORCE
2.5%
UNEMPLOYMENT RATE
New Market Zip Codes
New Market Area Codes
Income in New Market
Income Overview in New Market
Per Capita Income in New Market is $29,120, while median incomes of families and households are $74,097 and $66,324 respectively.
| Characteristic | Number | Measure |
| Per Capita Income | 1,786 | $29,120 |
| Median Family Income | 457 | $74,097 |
| Mean Family Income | 457 | $86,261 |
| Median Household Income | 604 | $66,324 |
| Mean Household Income | 604 | $77,470 |
| Income Deficit | 457 | $0 |
| Wage / Income Gap (%) | 1,786 | 28.73% |
| Wage / Income Gap ($) | 1,786 | 71.27¢ per $1 |
| Gini / Inequality Index | 1,786 | 0.35 |
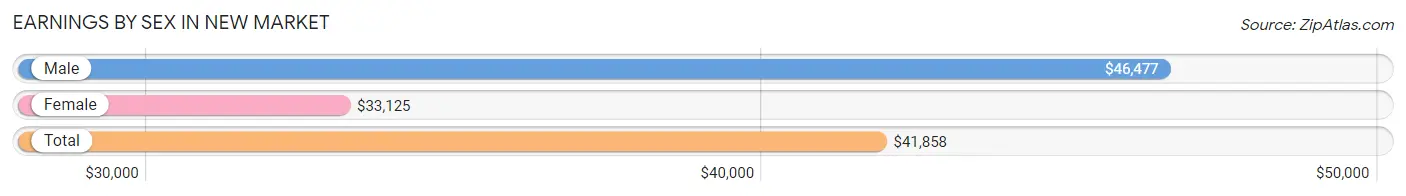
Earnings by Sex in New Market
Average Earnings in New Market are $41,858, $46,477 for men and $33,125 for women, a difference of 28.7%.
| Sex | Number | Average Earnings |
| Male | 548 (55.1%) | $46,477 |
| Female | 447 (44.9%) | $33,125 |
| Total | 995 (100.0%) | $41,858 |
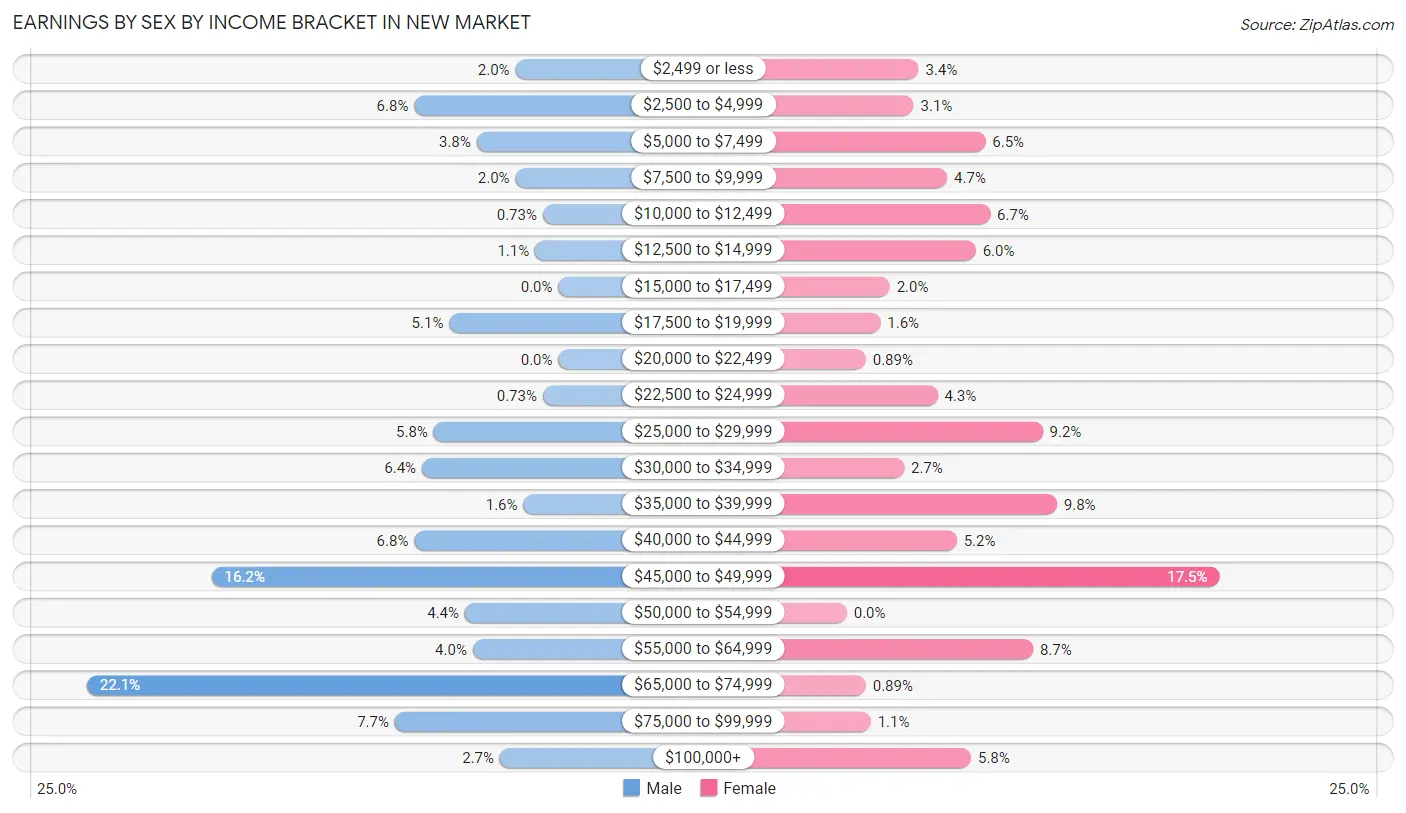
Earnings by Sex by Income Bracket in New Market
The most common earnings brackets in New Market are $65,000 to $74,999 for men (121 | 22.1%) and $45,000 to $49,999 for women (78 | 17.4%).
| Income | Male | Female |
| $2,499 or less | 11 (2.0%) | 15 (3.4%) |
| $2,500 to $4,999 | 37 (6.8%) | 14 (3.1%) |
| $5,000 to $7,499 | 21 (3.8%) | 29 (6.5%) |
| $7,500 to $9,999 | 11 (2.0%) | 21 (4.7%) |
| $10,000 to $12,499 | 4 (0.7%) | 30 (6.7%) |
| $12,500 to $14,999 | 6 (1.1%) | 27 (6.0%) |
| $15,000 to $17,499 | 0 (0.0%) | 9 (2.0%) |
| $17,500 to $19,999 | 28 (5.1%) | 7 (1.6%) |
| $20,000 to $22,499 | 0 (0.0%) | 4 (0.9%) |
| $22,500 to $24,999 | 4 (0.7%) | 19 (4.3%) |
| $25,000 to $29,999 | 32 (5.8%) | 41 (9.2%) |
| $30,000 to $34,999 | 35 (6.4%) | 12 (2.7%) |
| $35,000 to $39,999 | 9 (1.6%) | 44 (9.8%) |
| $40,000 to $44,999 | 37 (6.8%) | 23 (5.1%) |
| $45,000 to $49,999 | 89 (16.2%) | 78 (17.4%) |
| $50,000 to $54,999 | 24 (4.4%) | 0 (0.0%) |
| $55,000 to $64,999 | 22 (4.0%) | 39 (8.7%) |
| $65,000 to $74,999 | 121 (22.1%) | 4 (0.9%) |
| $75,000 to $99,999 | 42 (7.7%) | 5 (1.1%) |
| $100,000+ | 15 (2.7%) | 26 (5.8%) |
| Total | 548 (100.0%) | 447 (100.0%) |
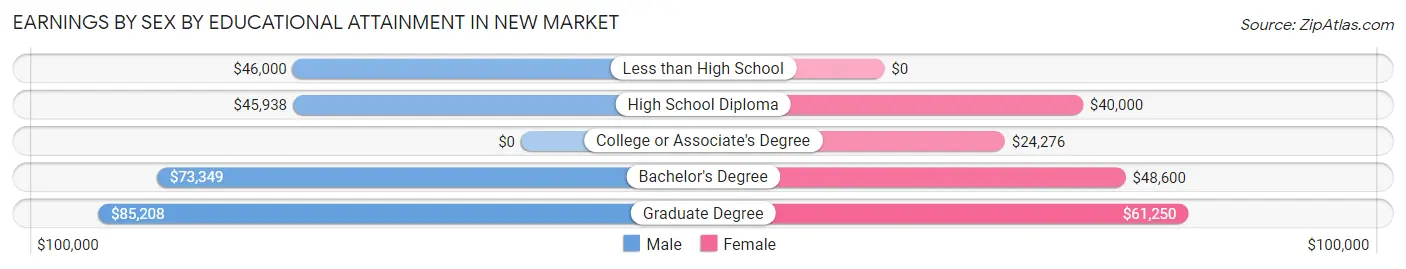
Earnings by Sex by Educational Attainment in New Market
Average earnings in New Market are $47,826 for men and $40,263 for women, a difference of 15.8%. Men with an educational attainment of graduate degree enjoy the highest average annual earnings of $85,208, while those with high school diploma education earn the least with $45,938. Women with an educational attainment of graduate degree earn the most with the average annual earnings of $61,250, while those with college or associate's degree education have the smallest earnings of $24,276.
| Educational Attainment | Male Income | Female Income |
| Less than High School | $46,000 | $0 |
| High School Diploma | $45,938 | $40,000 |
| College or Associate's Degree | - | - |
| Bachelor's Degree | $73,349 | $48,600 |
| Graduate Degree | $85,208 | $61,250 |
| Total | $47,826 | $40,263 |
Family Income in New Market
Family Income Brackets in New Market
According to the New Market family income data, there are 134 families falling into the $100,000 to $149,999 income range, which is the most common income bracket and makes up 29.3% of all families.
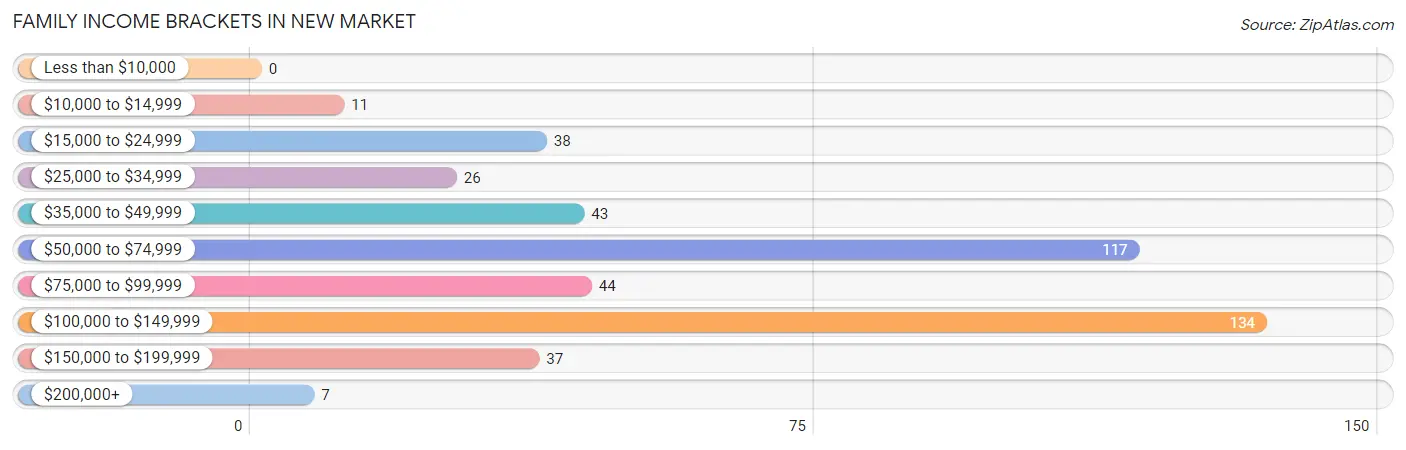
| Income Bracket | # Families | % Families |
| Less than $10,000 | 0 | 0.0% |
| $10,000 to $14,999 | 11 | 2.4% |
| $15,000 to $24,999 | 38 | 8.3% |
| $25,000 to $34,999 | 26 | 5.7% |
| $35,000 to $49,999 | 43 | 9.4% |
| $50,000 to $74,999 | 117 | 25.6% |
| $75,000 to $99,999 | 44 | 9.6% |
| $100,000 to $149,999 | 134 | 29.3% |
| $150,000 to $199,999 | 37 | 8.1% |
| $200,000+ | 7 | 1.5% |
Family Income by Famaliy Size in New Market
7+ person families (29 | 6.4%) account for the highest median family income in New Market with $106,328 per family, while 2-person families (162 | 35.4%) have the highest median income of $27,000 per family member.
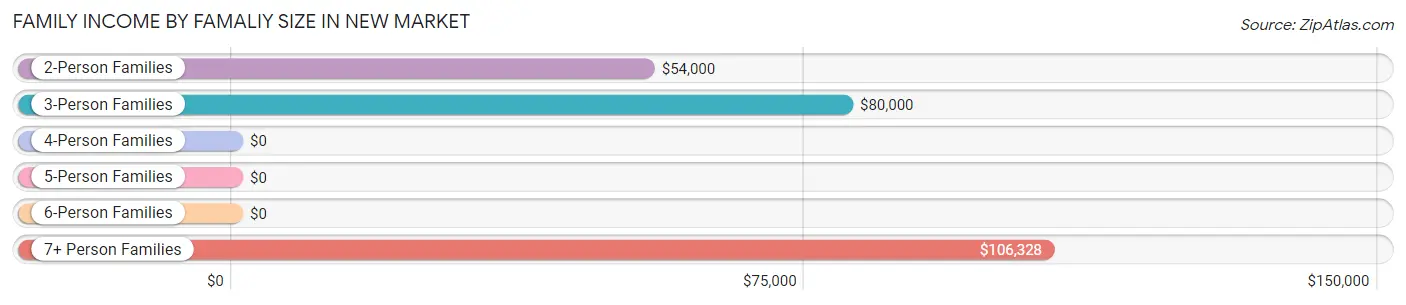
| Income Bracket | # Families | Median Income |
| 2-Person Families | 162 (35.4%) | $54,000 |
| 3-Person Families | 136 (29.8%) | $80,000 |
| 4-Person Families | 73 (16.0%) | $0 |
| 5-Person Families | 50 (10.9%) | $0 |
| 6-Person Families | 7 (1.5%) | $0 |
| 7+ Person Families | 29 (6.4%) | $106,328 |
| Total | 457 (100.0%) | $74,097 |
Family Income by Number of Earners in New Market
The median family income in New Market is $74,097, with families comprising 3+ earners (86) having the highest median family income of $124,500, while families with no earners (55) have the lowest median family income of $30,938, accounting for 18.8% and 12.0% of families, respectively.
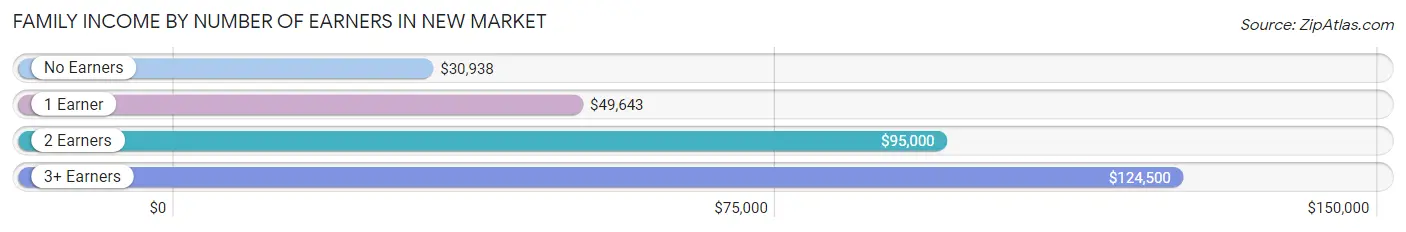
| Number of Earners | # Families | Median Income |
| No Earners | 55 (12.0%) | $30,938 |
| 1 Earner | 144 (31.5%) | $49,643 |
| 2 Earners | 172 (37.6%) | $95,000 |
| 3+ Earners | 86 (18.8%) | $124,500 |
| Total | 457 (100.0%) | $74,097 |
Household Income in New Market
Household Income Brackets in New Market
With 172 households falling in the category, the $50,000 to $74,999 income range is the most frequent in New Market, accounting for 28.5% of all households. In contrast, only 7 households (1.2%) fall into the $200,000+ income bracket, making it the least populous group.
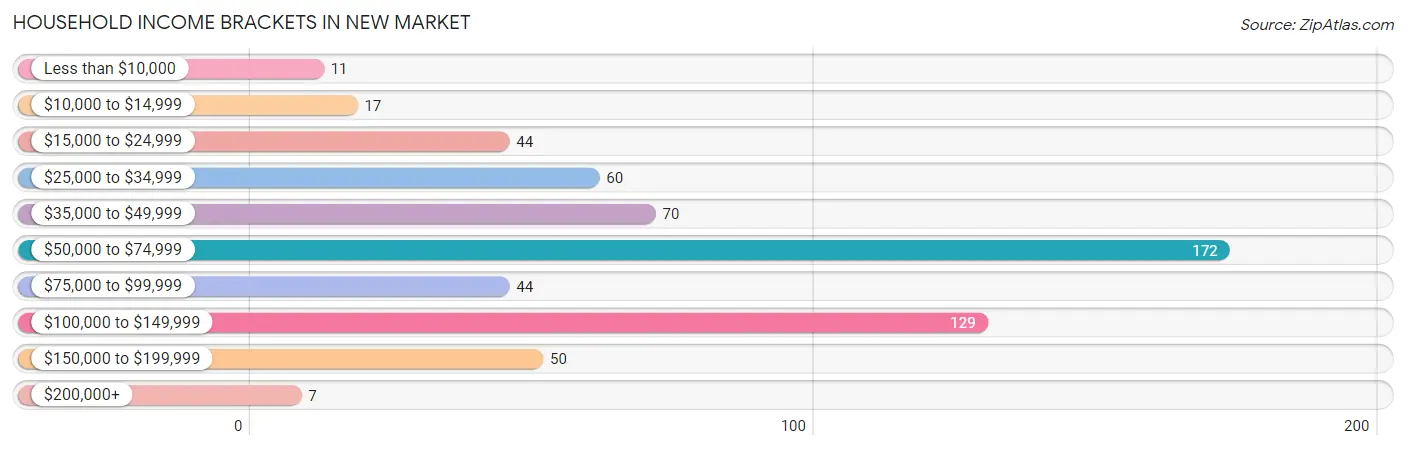
| Income Bracket | # Households | % Households |
| Less than $10,000 | 11 | 1.8% |
| $10,000 to $14,999 | 17 | 2.8% |
| $15,000 to $24,999 | 44 | 7.3% |
| $25,000 to $34,999 | 60 | 9.9% |
| $35,000 to $49,999 | 70 | 11.6% |
| $50,000 to $74,999 | 172 | 28.5% |
| $75,000 to $99,999 | 44 | 7.3% |
| $100,000 to $149,999 | 129 | 21.4% |
| $150,000 to $199,999 | 50 | 8.3% |
| $200,000+ | 7 | 1.2% |
Household Income by Householder Age in New Market
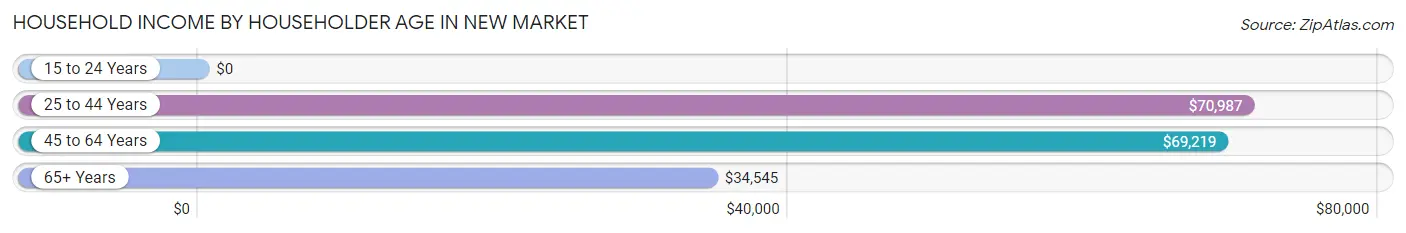
The median household income in New Market is $66,324, with the highest median household income of $70,987 found in the 25 to 44 years age bracket for the primary householder. A total of 203 households (33.6%) fall into this category. Meanwhile, the 15 to 24 years age bracket for the primary householder has the lowest median household income of $0, with 4 households (0.7%) in this group.
| Income Bracket | # Households | Median Income |
| 15 to 24 Years | 4 (0.7%) | $0 |
| 25 to 44 Years | 203 (33.6%) | $70,987 |
| 45 to 64 Years | 243 (40.2%) | $69,219 |
| 65+ Years | 154 (25.5%) | $34,545 |
| Total | 604 (100.0%) | $66,324 |
Poverty in New Market
Income Below Poverty by Sex and Age in New Market
With 5.2% poverty level for males and 12.5% for females among the residents of New Market, 15 year old males and 15 year old females are the most vulnerable to poverty, with 6 males (42.9%) and 9 females (100.0%) in their respective age groups living below the poverty level.
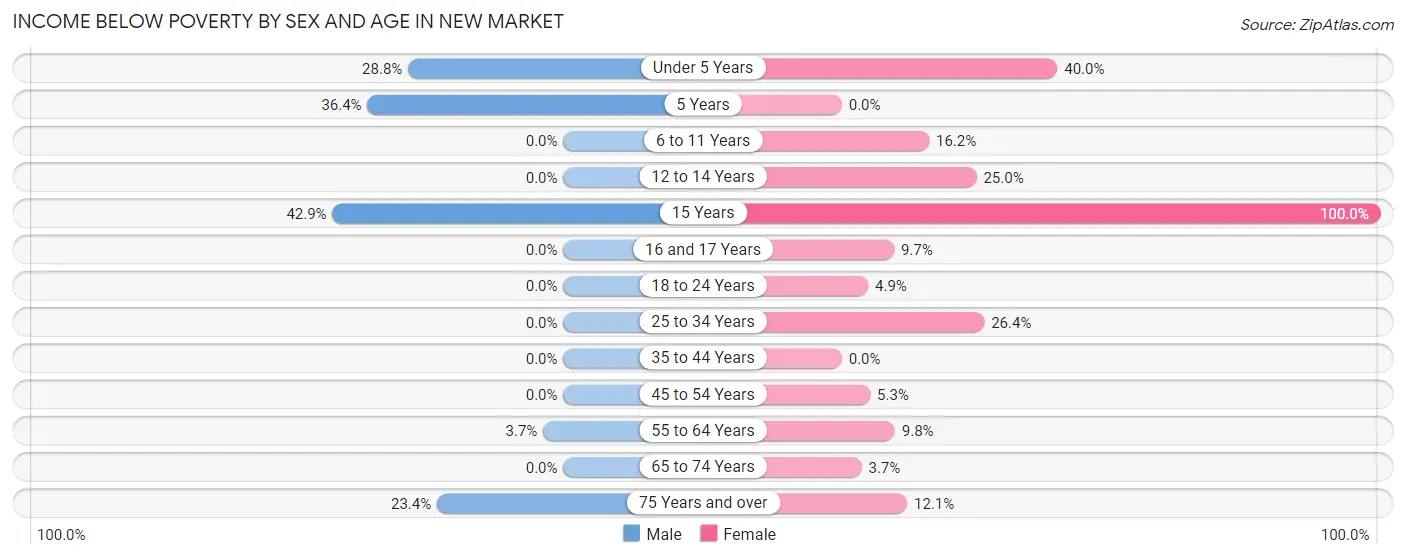
| Age Bracket | Male | Female |
| Under 5 Years | 17 (28.8%) | 18 (40.0%) |
| 5 Years | 4 (36.4%) | 0 (0.0%) |
| 6 to 11 Years | 0 (0.0%) | 17 (16.2%) |
| 12 to 14 Years | 0 (0.0%) | 4 (25.0%) |
| 15 Years | 6 (42.9%) | 9 (100.0%) |
| 16 and 17 Years | 0 (0.0%) | 6 (9.7%) |
| 18 to 24 Years | 0 (0.0%) | 4 (4.9%) |
| 25 to 34 Years | 0 (0.0%) | 23 (26.4%) |
| 35 to 44 Years | 0 (0.0%) | 0 (0.0%) |
| 45 to 54 Years | 0 (0.0%) | 4 (5.3%) |
| 55 to 64 Years | 4 (3.7%) | 12 (9.8%) |
| 65 to 74 Years | 0 (0.0%) | 3 (3.7%) |
| 75 Years and over | 15 (23.4%) | 12 (12.1%) |
| Total | 46 (5.2%) | 112 (12.5%) |
Income Above Poverty by Sex and Age in New Market
According to the poverty statistics in New Market, males aged 6 to 11 years and females aged 35 to 44 years are the age groups that are most secure financially, with 100.0% of males and 100.0% of females in these age groups living above the poverty line.
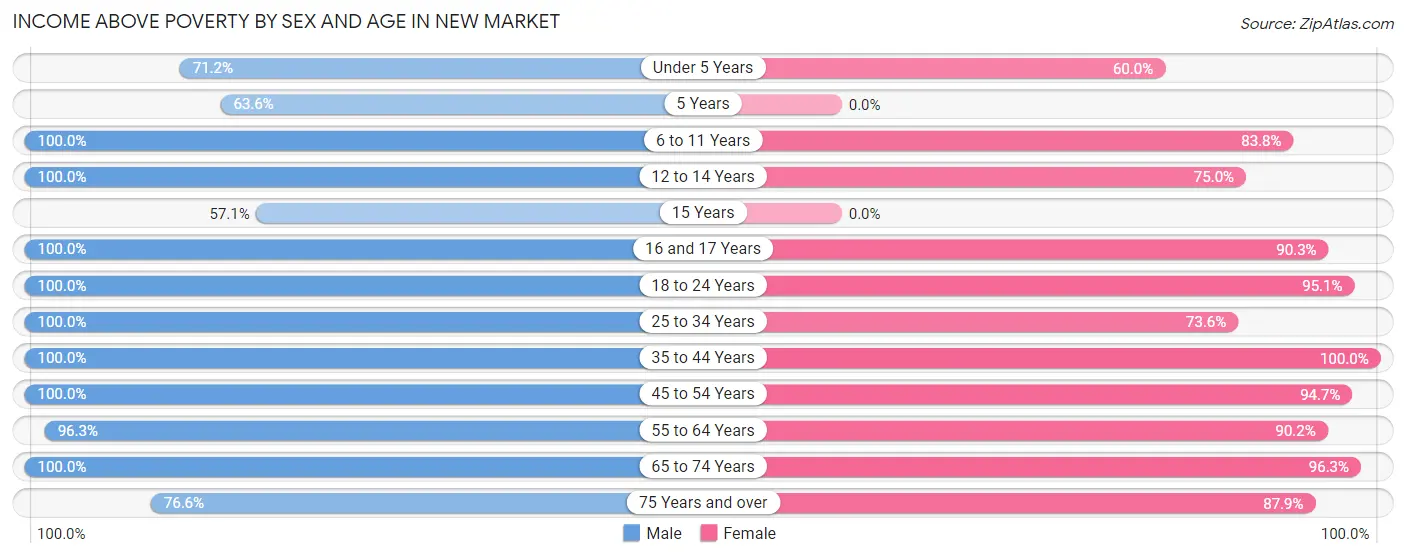
| Age Bracket | Male | Female |
| Under 5 Years | 42 (71.2%) | 27 (60.0%) |
| 5 Years | 7 (63.6%) | 0 (0.0%) |
| 6 to 11 Years | 76 (100.0%) | 88 (83.8%) |
| 12 to 14 Years | 34 (100.0%) | 12 (75.0%) |
| 15 Years | 8 (57.1%) | 0 (0.0%) |
| 16 and 17 Years | 23 (100.0%) | 56 (90.3%) |
| 18 to 24 Years | 45 (100.0%) | 78 (95.1%) |
| 25 to 34 Years | 115 (100.0%) | 64 (73.6%) |
| 35 to 44 Years | 93 (100.0%) | 114 (100.0%) |
| 45 to 54 Years | 175 (100.0%) | 72 (94.7%) |
| 55 to 64 Years | 103 (96.3%) | 110 (90.2%) |
| 65 to 74 Years | 65 (100.0%) | 79 (96.3%) |
| 75 Years and over | 49 (76.6%) | 87 (87.9%) |
| Total | 835 (94.8%) | 787 (87.5%) |
Income Below Poverty Among Married-Couple Families in New Market
The poverty statistics for married-couple families in New Market show that 3.3% or 11 of the total 336 families live below the poverty line. Families with no children have the highest poverty rate of 6.3%, comprising of 11 families. On the other hand, families with 1 or 2 children have the lowest poverty rate of 0.0%, which includes 0 families.
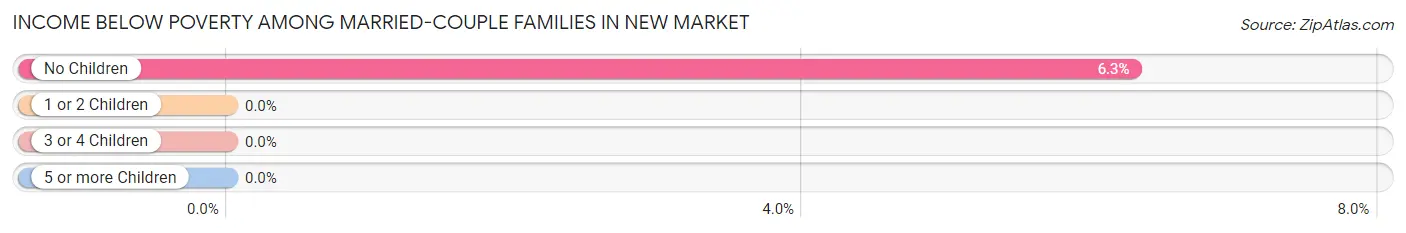
| Children | Above Poverty | Below Poverty |
| No Children | 164 (93.7%) | 11 (6.3%) |
| 1 or 2 Children | 88 (100.0%) | 0 (0.0%) |
| 3 or 4 Children | 67 (100.0%) | 0 (0.0%) |
| 5 or more Children | 6 (100.0%) | 0 (0.0%) |
| Total | 325 (96.7%) | 11 (3.3%) |
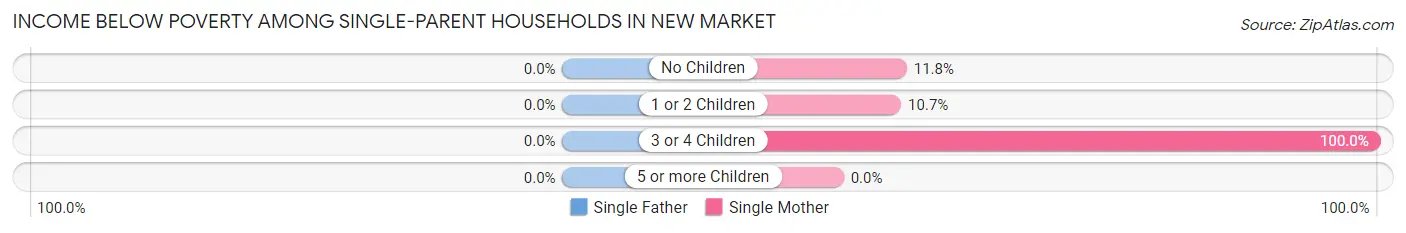
Income Below Poverty Among Single-Parent Households in New Market
| Children | Single Father | Single Mother |
| No Children | 0 (0.0%) | 4 (11.8%) |
| 1 or 2 Children | 0 (0.0%) | 3 (10.7%) |
| 3 or 4 Children | 0 (0.0%) | 25 (100.0%) |
| 5 or more Children | 0 (0.0%) | 0 (0.0%) |
| Total | 0 (0.0%) | 32 (36.8%) |
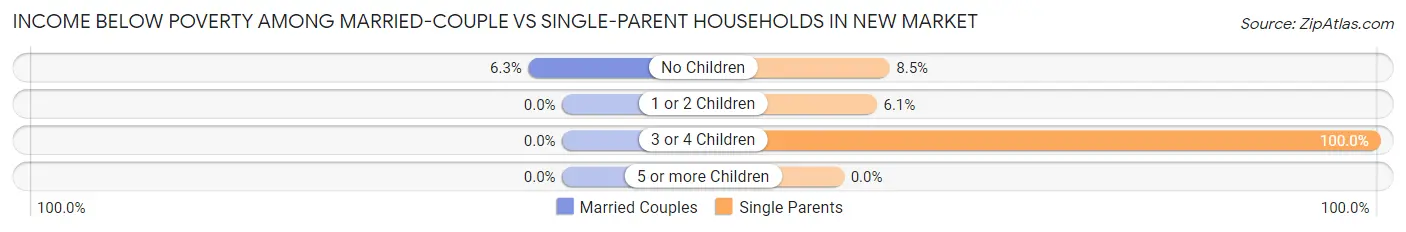
Income Below Poverty Among Married-Couple vs Single-Parent Households in New Market
The poverty data for New Market shows that 11 of the married-couple family households (3.3%) and 32 of the single-parent households (26.5%) are living below the poverty level. Within the married-couple family households, those with no children have the highest poverty rate, with 11 households (6.3%) falling below the poverty line. Among the single-parent households, those with 3 or 4 children have the highest poverty rate, with 25 household (100.0%) living below poverty.
| Children | Married-Couple Families | Single-Parent Households |
| No Children | 11 (6.3%) | 4 (8.5%) |
| 1 or 2 Children | 0 (0.0%) | 3 (6.1%) |
| 3 or 4 Children | 0 (0.0%) | 25 (100.0%) |
| 5 or more Children | 0 (0.0%) | 0 (0.0%) |
| Total | 11 (3.3%) | 32 (26.5%) |
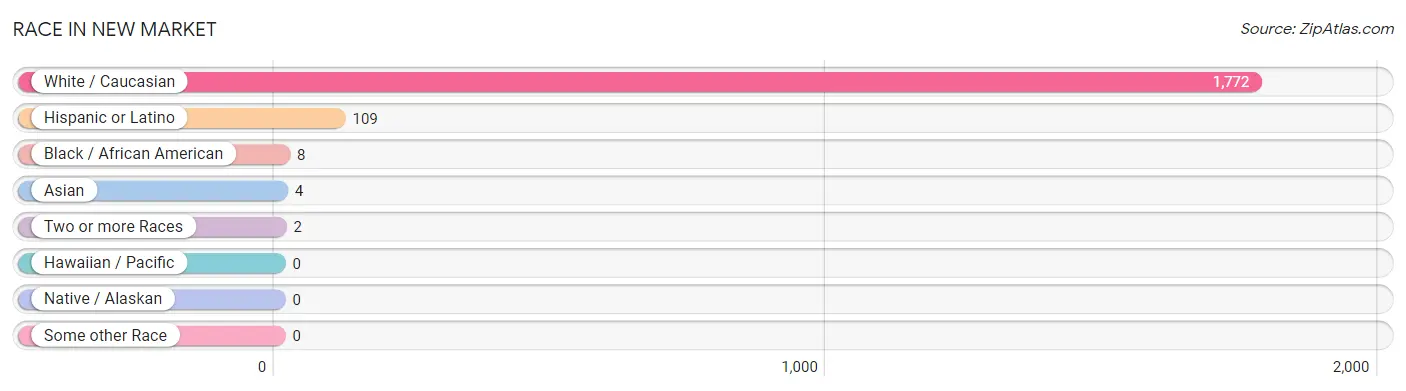
Race in New Market
The most populous races in New Market are White / Caucasian (1,772 | 99.2%), Hispanic or Latino (109 | 6.1%), and Black / African American (8 | 0.4%).
| Race | # Population | % Population |
| Asian | 4 | 0.2% |
| Black / African American | 8 | 0.4% |
| Hawaiian / Pacific | 0 | 0.0% |
| Hispanic or Latino | 109 | 6.1% |
| Native / Alaskan | 0 | 0.0% |
| White / Caucasian | 1,772 | 99.2% |
| Two or more Races | 2 | 0.1% |
| Some other Race | 0 | 0.0% |
| Total | 1,786 | 100.0% |
Ancestry in New Market
The most populous ancestries reported in New Market are English (400 | 22.4%), American (281 | 15.7%), German (261 | 14.6%), Mexican (109 | 6.1%), and Irish (74 | 4.1%), together accounting for 63.0% of all New Market residents.
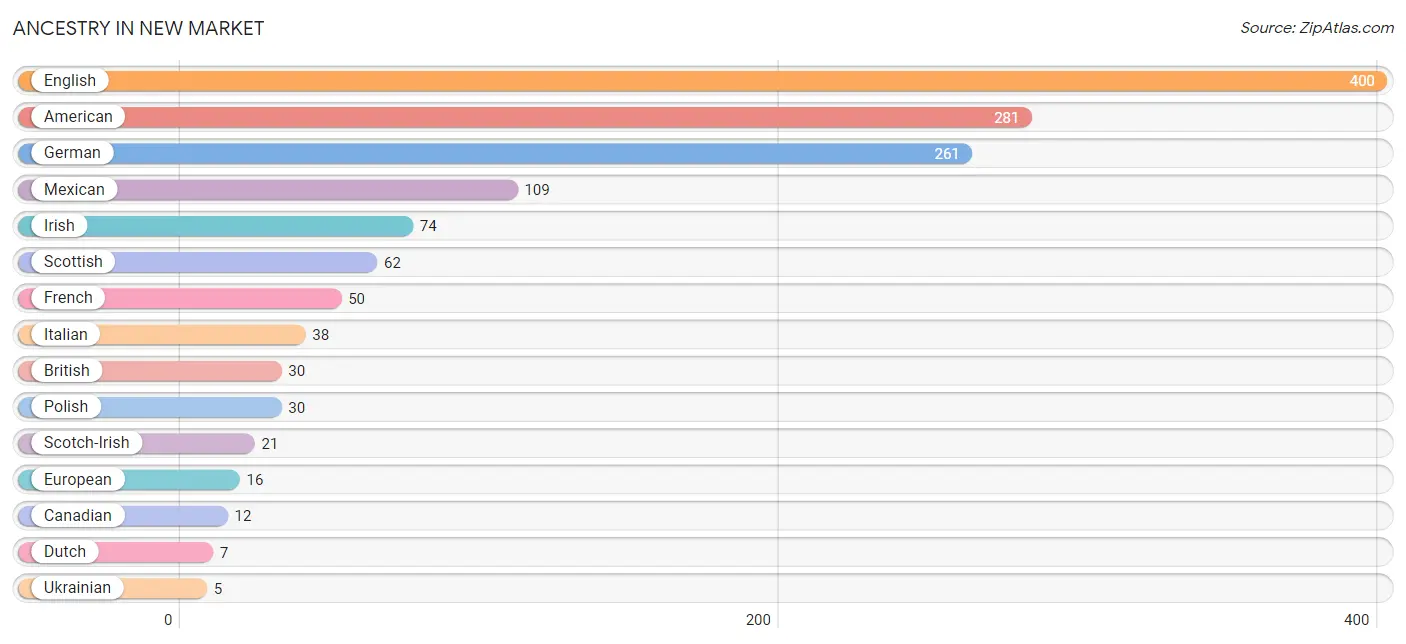
| Ancestry | # Population | % Population |
| American | 281 | 15.7% |
| British | 30 | 1.7% |
| Canadian | 12 | 0.7% |
| Czech | 4 | 0.2% |
| Dutch | 7 | 0.4% |
| English | 400 | 22.4% |
| European | 16 | 0.9% |
| Finnish | 4 | 0.2% |
| French | 50 | 2.8% |
| German | 261 | 14.6% |
| Irish | 74 | 4.1% |
| Italian | 38 | 2.1% |
| Korean | 4 | 0.2% |
| Mexican | 109 | 6.1% |
| Polish | 30 | 1.7% |
| Russian | 2 | 0.1% |
| Scotch-Irish | 21 | 1.2% |
| Scottish | 62 | 3.5% |
| Slavic | 4 | 0.2% |
| Ukrainian | 5 | 0.3% | View All 20 Rows |
Immigrants in New Market
The most numerous immigrant groups reported in New Market came from Central America (62 | 3.5%), Latin America (62 | 3.5%), Mexico (62 | 3.5%), Asia (4 | 0.2%), and Philippines (4 | 0.2%), together accounting for 10.8% of all New Market residents.
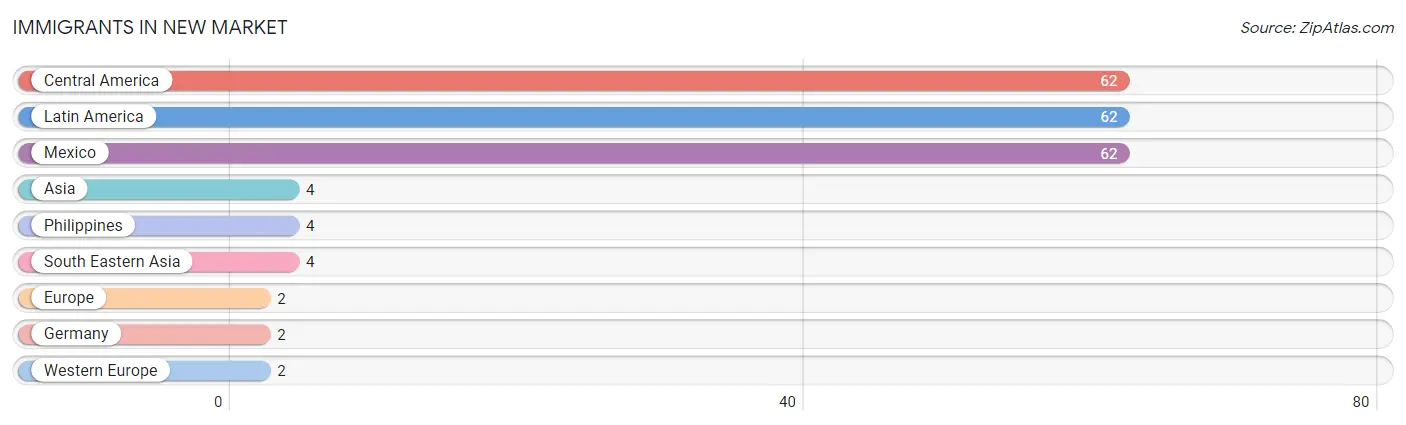
| Immigration Origin | # Population | % Population |
| Asia | 4 | 0.2% |
| Central America | 62 | 3.5% |
| Europe | 2 | 0.1% |
| Germany | 2 | 0.1% |
| Latin America | 62 | 3.5% |
| Mexico | 62 | 3.5% |
| Philippines | 4 | 0.2% |
| South Eastern Asia | 4 | 0.2% |
| Western Europe | 2 | 0.1% | View All 9 Rows |
Sex and Age in New Market
Sex and Age in New Market
The most populous age groups in New Market are 45 to 49 Years (143 | 16.1%) for men and 15 to 19 Years (104 | 11.6%) for women.
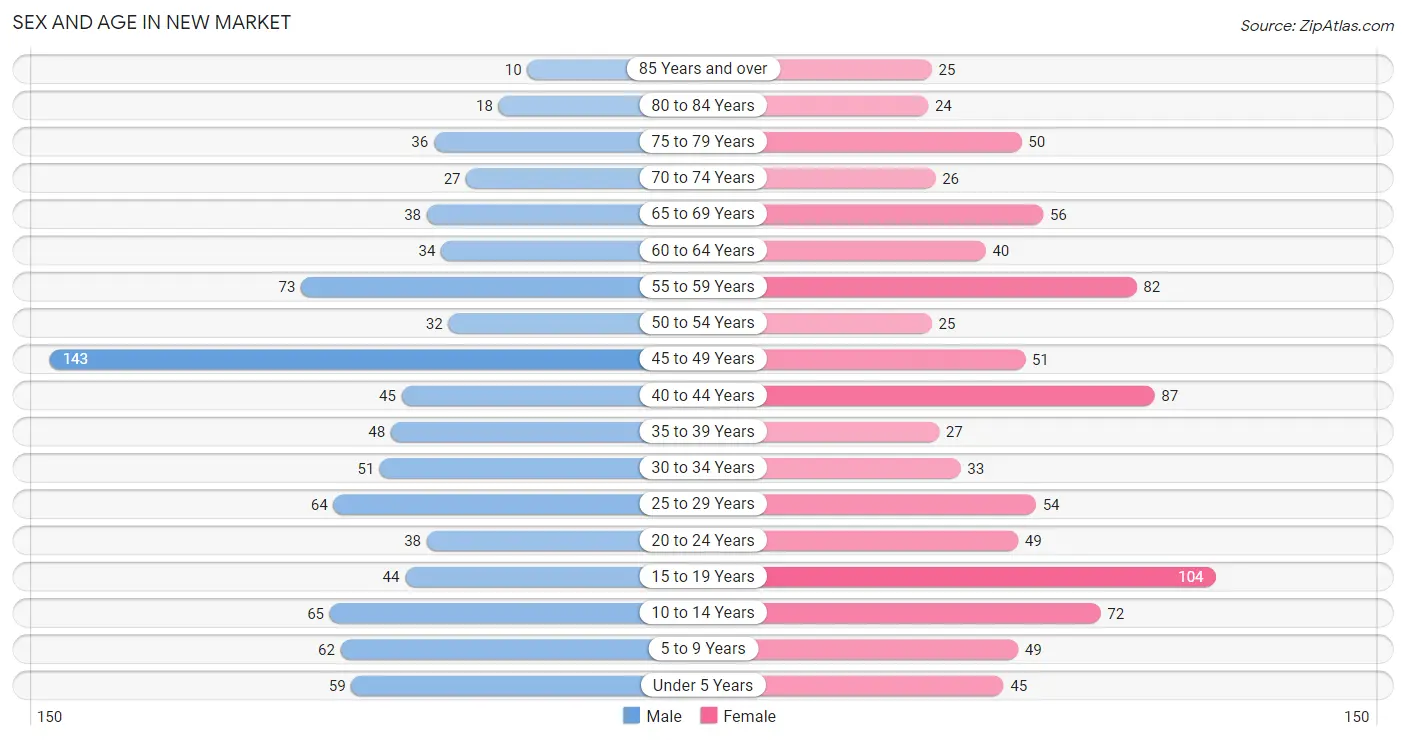
| Age Bracket | Male | Female |
| Under 5 Years | 59 (6.7%) | 45 (5.0%) |
| 5 to 9 Years | 62 (7.0%) | 49 (5.4%) |
| 10 to 14 Years | 65 (7.3%) | 72 (8.0%) |
| 15 to 19 Years | 44 (5.0%) | 104 (11.6%) |
| 20 to 24 Years | 38 (4.3%) | 49 (5.4%) |
| 25 to 29 Years | 64 (7.2%) | 54 (6.0%) |
| 30 to 34 Years | 51 (5.8%) | 33 (3.7%) |
| 35 to 39 Years | 48 (5.4%) | 27 (3.0%) |
| 40 to 44 Years | 45 (5.1%) | 87 (9.7%) |
| 45 to 49 Years | 143 (16.1%) | 51 (5.7%) |
| 50 to 54 Years | 32 (3.6%) | 25 (2.8%) |
| 55 to 59 Years | 73 (8.2%) | 82 (9.1%) |
| 60 to 64 Years | 34 (3.8%) | 40 (4.4%) |
| 65 to 69 Years | 38 (4.3%) | 56 (6.2%) |
| 70 to 74 Years | 27 (3.0%) | 26 (2.9%) |
| 75 to 79 Years | 36 (4.1%) | 50 (5.6%) |
| 80 to 84 Years | 18 (2.0%) | 24 (2.7%) |
| 85 Years and over | 10 (1.1%) | 25 (2.8%) |
| Total | 887 (100.0%) | 899 (100.0%) |
Families and Households in New Market
Median Family Size in New Market
The median family size in New Market is 3.45 persons per family, with married-couple families (336 | 73.5%) accounting for the largest median family size of 3.63 persons per family. On the other hand, single male/father families (34 | 7.4%) represent the smallest median family size with 2.76 persons per family.
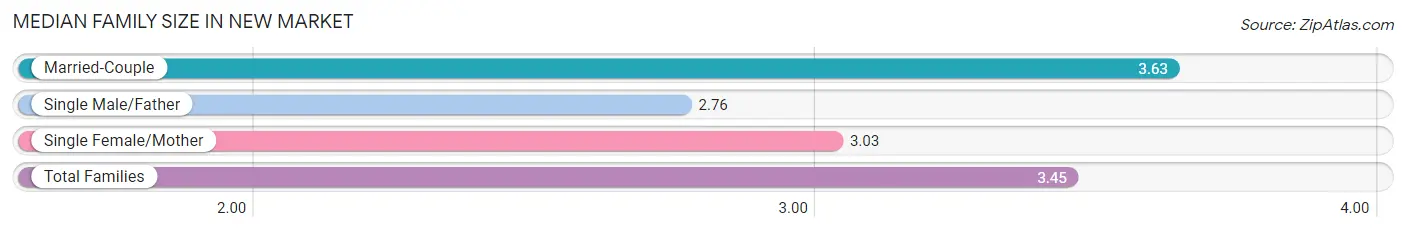
| Family Type | # Families | Family Size |
| Married-Couple | 336 (73.5%) | 3.63 |
| Single Male/Father | 34 (7.4%) | 2.76 |
| Single Female/Mother | 87 (19.0%) | 3.03 |
| Total Families | 457 (100.0%) | 3.45 |
Median Household Size in New Market
The median household size in New Market is 2.96 persons per household, with married-couple households (336 | 55.6%) accounting for the largest median household size of 3.68 persons per household. non-family households (147 | 24.3%) represent the smallest median household size with 1.03 persons per household.
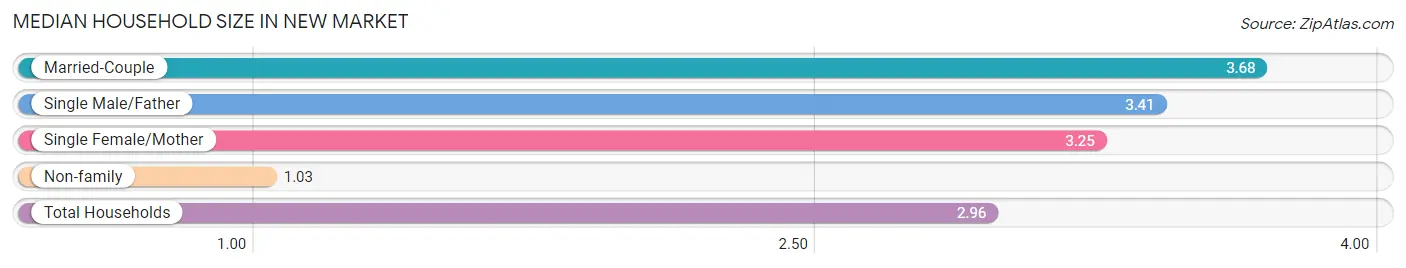
| Household Type | # Households | Household Size |
| Married-Couple | 336 (55.6%) | 3.68 |
| Single Male/Father | 34 (5.6%) | 3.41 |
| Single Female/Mother | 87 (14.4%) | 3.25 |
| Non-family | 147 (24.3%) | 1.03 |
| Total Households | 604 (100.0%) | 2.96 |
Household Size by Marriage Status in New Market
Out of a total of 604 households in New Market, 457 (75.7%) are family households, while 147 (24.3%) are nonfamily households. The most numerous type of family households are 2-person households, comprising 162, and the most common type of nonfamily households are 1-person households, comprising 143.
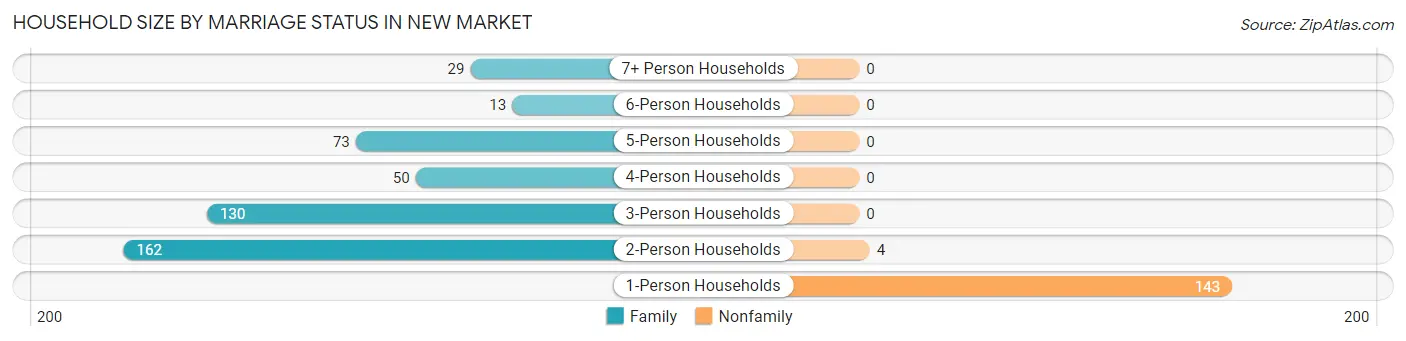
| Household Size | Family Households | Nonfamily Households |
| 1-Person Households | - | 143 (23.7%) |
| 2-Person Households | 162 (26.8%) | 4 (0.7%) |
| 3-Person Households | 130 (21.5%) | 0 (0.0%) |
| 4-Person Households | 50 (8.3%) | 0 (0.0%) |
| 5-Person Households | 73 (12.1%) | 0 (0.0%) |
| 6-Person Households | 13 (2.1%) | 0 (0.0%) |
| 7+ Person Households | 29 (4.8%) | 0 (0.0%) |
| Total | 457 (75.7%) | 147 (24.3%) |
Female Fertility in New Market
Fertility by Age in New Market
Average fertility rate in New Market is 37.0 births per 1,000 women. Women in the age bracket of 20 to 34 years have the highest fertility rate with 110.0 births per 1,000 women. Women in the age bracket of 20 to 34 years acount for 100.0% of all women with births.
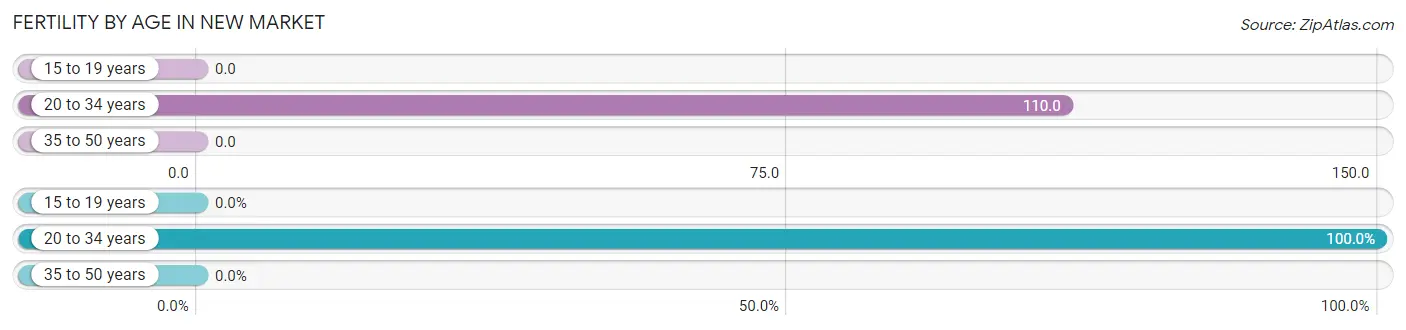
| Age Bracket | Women with Births | Births / 1,000 Women |
| 15 to 19 years | 0 (0.0%) | 0.0 |
| 20 to 34 years | 15 (100.0%) | 110.0 |
| 35 to 50 years | 0 (0.0%) | 0.0 |
| Total | 15 (100.0%) | 37.0 |
Fertility by Age by Marriage Status in New Market
73.3% of women with births (15) in New Market are married. The highest percentage of unmarried women with births falls into 20 to 34 years age bracket with 26.7% of them unmarried at the time of birth, while the lowest percentage of unmarried women with births belong to 20 to 34 years age bracket with 26.7% of them unmarried.
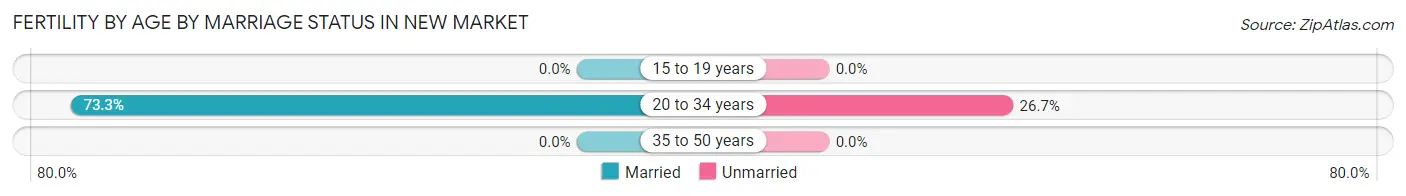
| Age Bracket | Married | Unmarried |
| 15 to 19 years | 0 (0.0%) | 0 (0.0%) |
| 20 to 34 years | 11 (73.3%) | 4 (26.7%) |
| 35 to 50 years | 0 (0.0%) | 0 (0.0%) |
| Total | 11 (73.3%) | 4 (26.7%) |
Fertility by Education in New Market
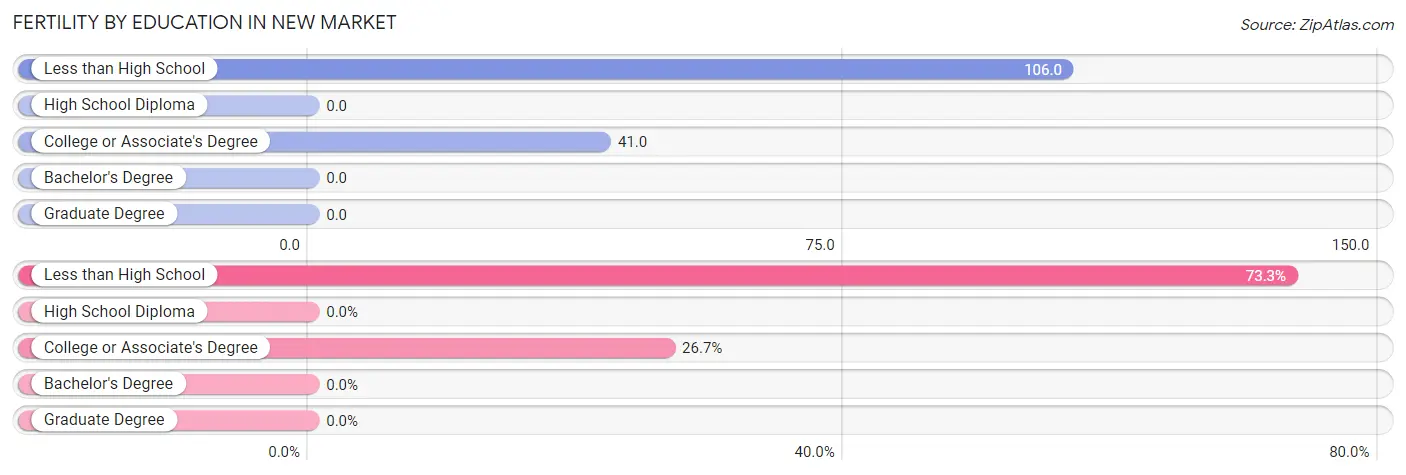
| Educational Attainment | Women with Births | Births / 1,000 Women |
| Less than High School | 11 (73.3%) | 106.0 |
| High School Diploma | 0 (0.0%) | 0.0 |
| College or Associate's Degree | 4 (26.7%) | 41.0 |
| Bachelor's Degree | 0 (0.0%) | 0.0 |
| Graduate Degree | 0 (0.0%) | 0.0 |
| Total | 15 (100.0%) | 37.0 |
Fertility by Education by Marriage Status in New Market
26.7% of women with births in New Market are unmarried. Women with the educational attainment of less than high school are most likely to be married with 100.0% of them married at childbirth, while women with the educational attainment of college or associate's degree are least likely to be married with 100.0% of them unmarried at childbirth.
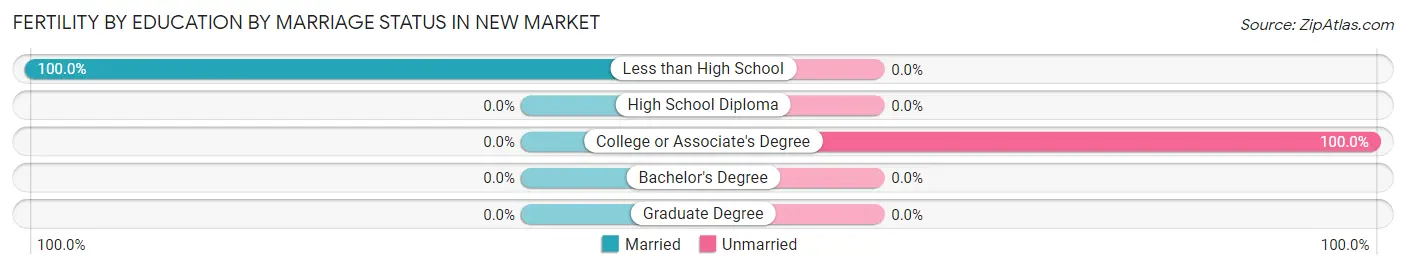
| Educational Attainment | Married | Unmarried |
| Less than High School | 11 (100.0%) | 0 (0.0%) |
| High School Diploma | 0 (0.0%) | 0 (0.0%) |
| College or Associate's Degree | 0 (0.0%) | 4 (100.0%) |
| Bachelor's Degree | 0 (0.0%) | 0 (0.0%) |
| Graduate Degree | 0 (0.0%) | 0 (0.0%) |
| Total | 11 (73.3%) | 4 (26.7%) |
Employment Characteristics in New Market
Employment by Class of Employer in New Market
Among the 934 employed individuals in New Market, private company employees (641 | 68.6%), local government employees (148 | 15.9%), and self-employed (not incorporated) (56 | 6.0%) make up the most common classes of employment.
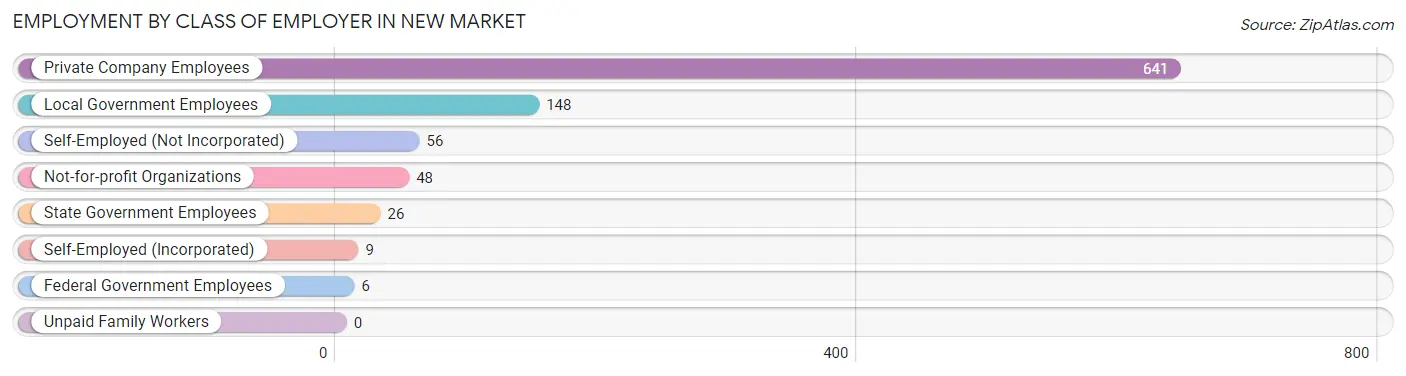
| Employer Class | # Employees | % Employees |
| Private Company Employees | 641 | 68.6% |
| Self-Employed (Incorporated) | 9 | 1.0% |
| Self-Employed (Not Incorporated) | 56 | 6.0% |
| Not-for-profit Organizations | 48 | 5.1% |
| Local Government Employees | 148 | 15.9% |
| State Government Employees | 26 | 2.8% |
| Federal Government Employees | 6 | 0.6% |
| Unpaid Family Workers | 0 | 0.0% |
| Total | 934 | 100.0% |
Employment Status by Age in New Market
According to the labor force statistics for New Market, out of the total population over 16 years of age (1,411), 67.9% or 958 individuals are in the labor force, with 2.5% or 24 of them unemployed. The age group with the highest labor force participation rate is 35 to 44 years, with 97.6% or 202 individuals in the labor force. Within the labor force, the 20 to 24 years age range has the highest percentage of unemployed individuals, with 11.4% or 8 of them being unemployed.
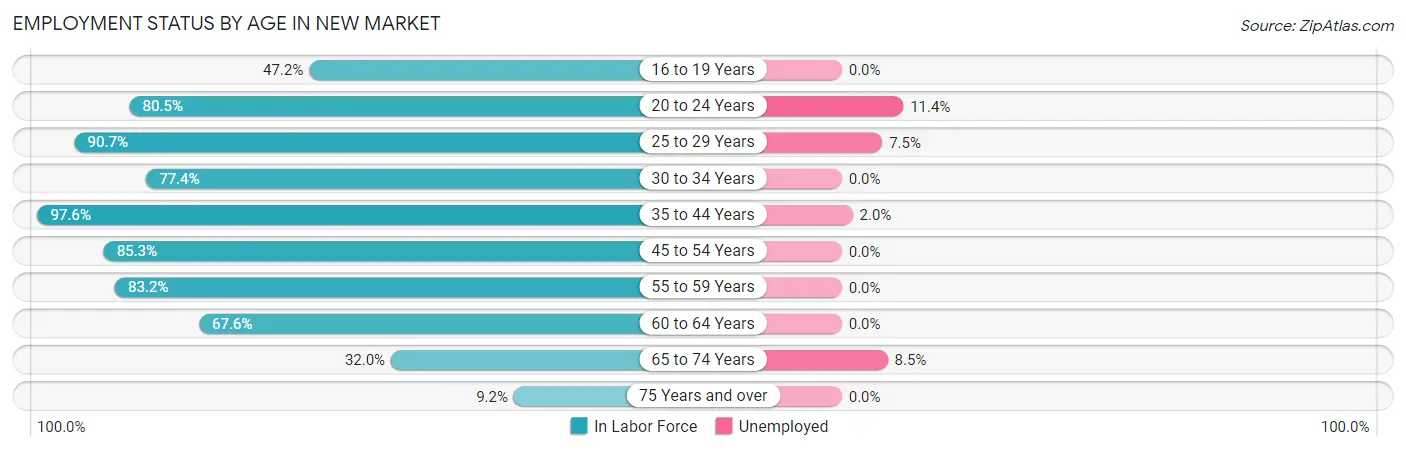
| Age Bracket | In Labor Force | Unemployed |
| 16 to 19 Years | 59 (47.2%) | 0 (0.0%) |
| 20 to 24 Years | 70 (80.5%) | 8 (11.4%) |
| 25 to 29 Years | 107 (90.7%) | 8 (7.5%) |
| 30 to 34 Years | 65 (77.4%) | 0 (0.0%) |
| 35 to 44 Years | 202 (97.6%) | 4 (2.0%) |
| 45 to 54 Years | 214 (85.3%) | 0 (0.0%) |
| 55 to 59 Years | 129 (83.2%) | 0 (0.0%) |
| 60 to 64 Years | 50 (67.6%) | 0 (0.0%) |
| 65 to 74 Years | 47 (32.0%) | 4 (8.5%) |
| 75 Years and over | 15 (9.2%) | 0 (0.0%) |
| Total | 958 (67.9%) | 24 (2.5%) |
Employment Status by Educational Attainment in New Market
According to labor force statistics for New Market, 86.3% of individuals (767) out of the total population between 25 and 64 years of age (889) are in the labor force, with 1.6% or 12 of them being unemployed. The group with the highest labor force participation rate are those with the educational attainment of bachelor's degree or higher, with 100.0% or 243 individuals in the labor force. Within the labor force, individuals with high school diploma education have the highest percentage of unemployment, with 4.2% or 12 of them being unemployed.
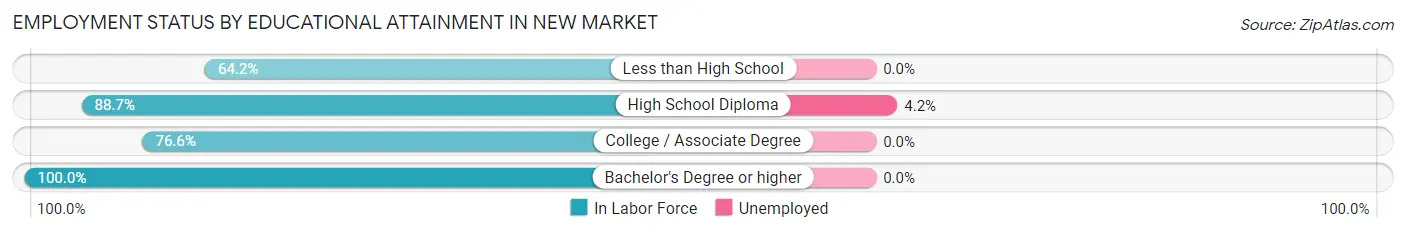
| Educational Attainment | In Labor Force | Unemployed |
| Less than High School | 52 (64.2%) | 0 (0.0%) |
| High School Diploma | 289 (88.7%) | 14 (4.2%) |
| College / Associate Degree | 183 (76.6%) | 0 (0.0%) |
| Bachelor's Degree or higher | 243 (100.0%) | 0 (0.0%) |
| Total | 767 (86.3%) | 14 (1.6%) |
Employment Occupations by Sex in New Market
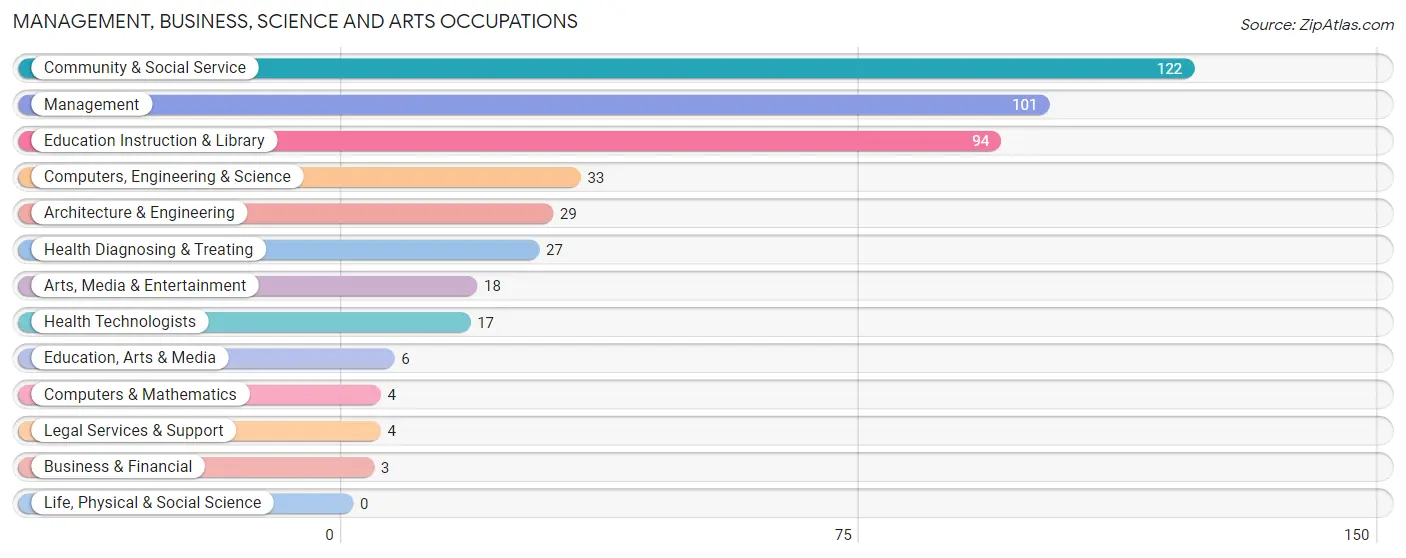
Management, Business, Science and Arts Occupations
The most common Management, Business, Science and Arts occupations in New Market are Community & Social Service (122 | 13.1%), Management (101 | 10.8%), Education Instruction & Library (94 | 10.1%), Computers, Engineering & Science (33 | 3.5%), and Architecture & Engineering (29 | 3.1%).
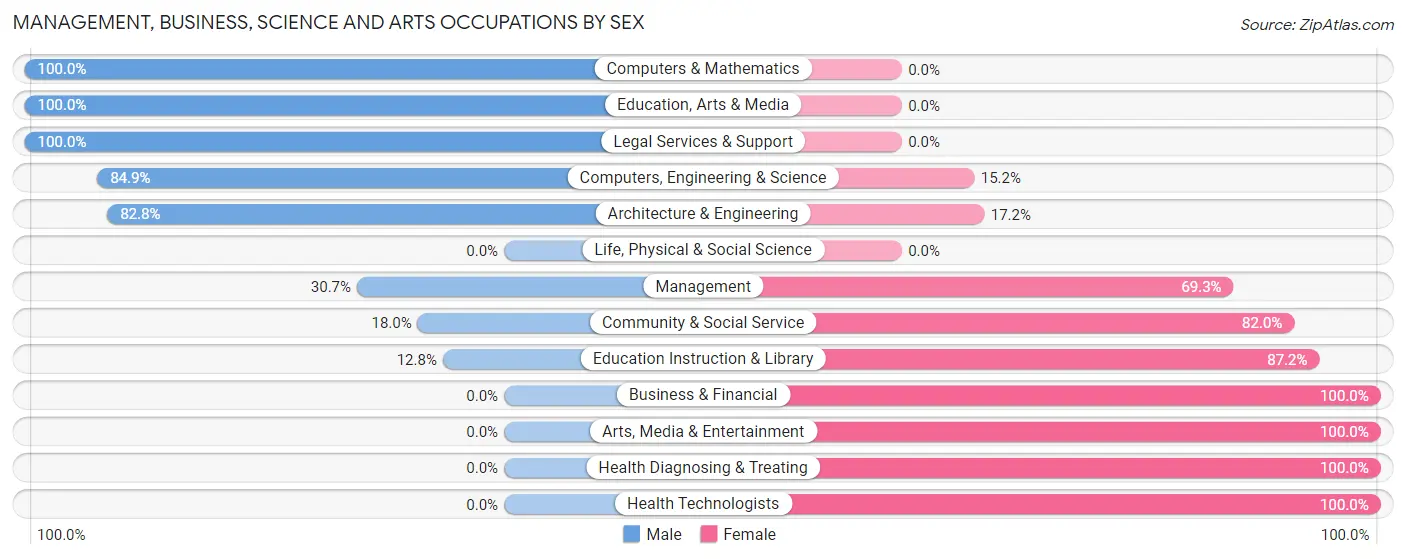
Management, Business, Science and Arts Occupations by Sex
Within the Management, Business, Science and Arts occupations in New Market, the most male-oriented occupations are Computers & Mathematics (100.0%), Education, Arts & Media (100.0%), and Legal Services & Support (100.0%), while the most female-oriented occupations are Business & Financial (100.0%), Arts, Media & Entertainment (100.0%), and Health Diagnosing & Treating (100.0%).
| Occupation | Male | Female |
| Management | 31 (30.7%) | 70 (69.3%) |
| Business & Financial | 0 (0.0%) | 3 (100.0%) |
| Computers, Engineering & Science | 28 (84.9%) | 5 (15.1%) |
| Computers & Mathematics | 4 (100.0%) | 0 (0.0%) |
| Architecture & Engineering | 24 (82.8%) | 5 (17.2%) |
| Life, Physical & Social Science | 0 (0.0%) | 0 (0.0%) |
| Community & Social Service | 22 (18.0%) | 100 (82.0%) |
| Education, Arts & Media | 6 (100.0%) | 0 (0.0%) |
| Legal Services & Support | 4 (100.0%) | 0 (0.0%) |
| Education Instruction & Library | 12 (12.8%) | 82 (87.2%) |
| Arts, Media & Entertainment | 0 (0.0%) | 18 (100.0%) |
| Health Diagnosing & Treating | 0 (0.0%) | 27 (100.0%) |
| Health Technologists | 0 (0.0%) | 17 (100.0%) |
| Total (Category) | 81 (28.3%) | 205 (71.7%) |
| Total (Overall) | 512 (54.8%) | 422 (45.2%) |
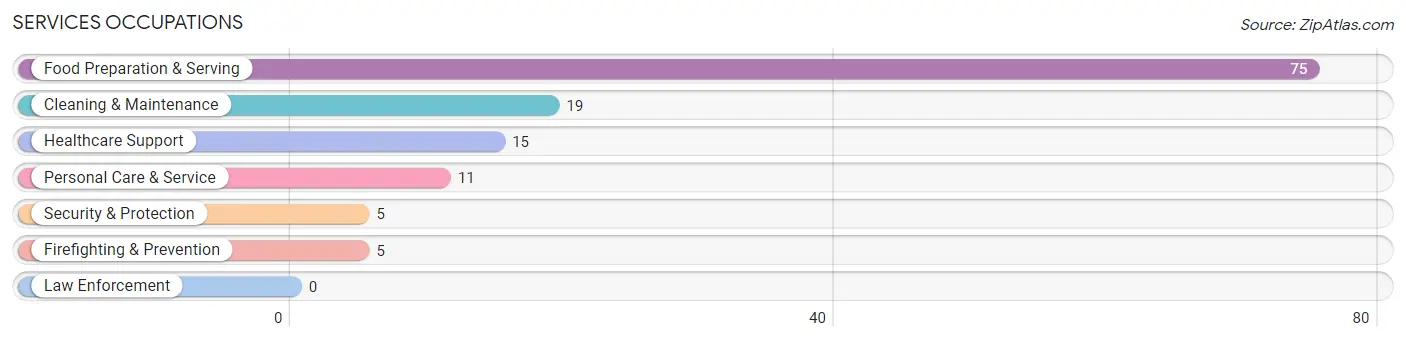
Services Occupations
The most common Services occupations in New Market are Food Preparation & Serving (75 | 8.0%), Cleaning & Maintenance (19 | 2.0%), Healthcare Support (15 | 1.6%), Personal Care & Service (11 | 1.2%), and Security & Protection (5 | 0.5%).
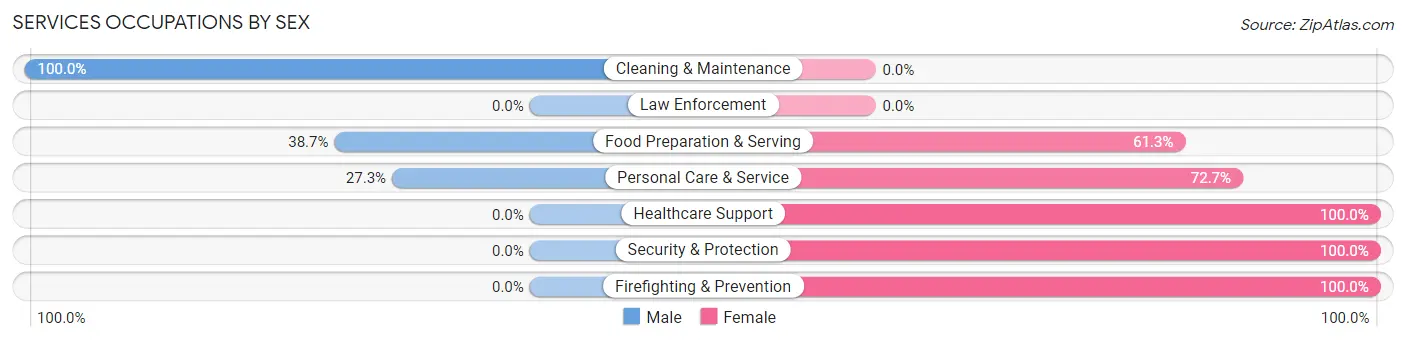
Services Occupations by Sex
Within the Services occupations in New Market, the most male-oriented occupations are Cleaning & Maintenance (100.0%), Food Preparation & Serving (38.7%), and Personal Care & Service (27.3%), while the most female-oriented occupations are Healthcare Support (100.0%), Security & Protection (100.0%), and Firefighting & Prevention (100.0%).
| Occupation | Male | Female |
| Healthcare Support | 0 (0.0%) | 15 (100.0%) |
| Security & Protection | 0 (0.0%) | 5 (100.0%) |
| Firefighting & Prevention | 0 (0.0%) | 5 (100.0%) |
| Law Enforcement | 0 (0.0%) | 0 (0.0%) |
| Food Preparation & Serving | 29 (38.7%) | 46 (61.3%) |
| Cleaning & Maintenance | 19 (100.0%) | 0 (0.0%) |
| Personal Care & Service | 3 (27.3%) | 8 (72.7%) |
| Total (Category) | 51 (40.8%) | 74 (59.2%) |
| Total (Overall) | 512 (54.8%) | 422 (45.2%) |
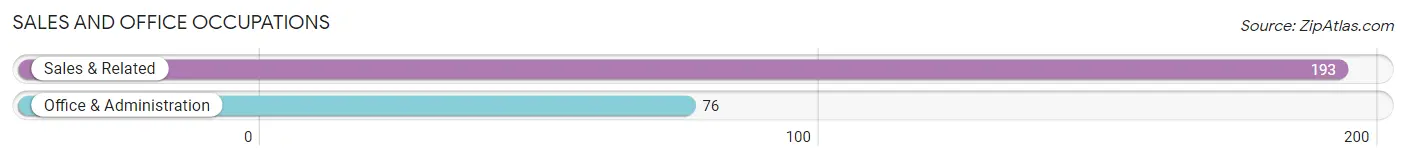
Sales and Office Occupations
The most common Sales and Office occupations in New Market are Sales & Related (193 | 20.7%), and Office & Administration (76 | 8.1%).
Sales and Office Occupations by Sex
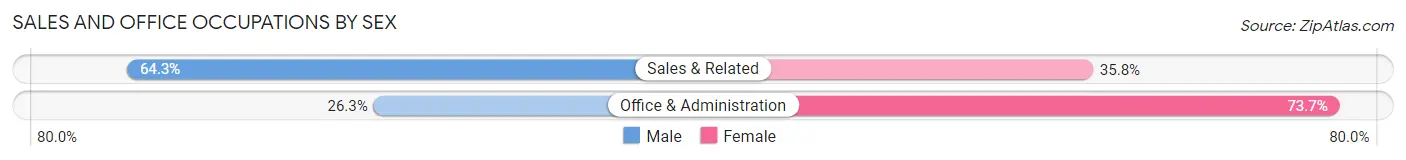
| Occupation | Male | Female |
| Sales & Related | 124 (64.2%) | 69 (35.7%) |
| Office & Administration | 20 (26.3%) | 56 (73.7%) |
| Total (Category) | 144 (53.5%) | 125 (46.5%) |
| Total (Overall) | 512 (54.8%) | 422 (45.2%) |
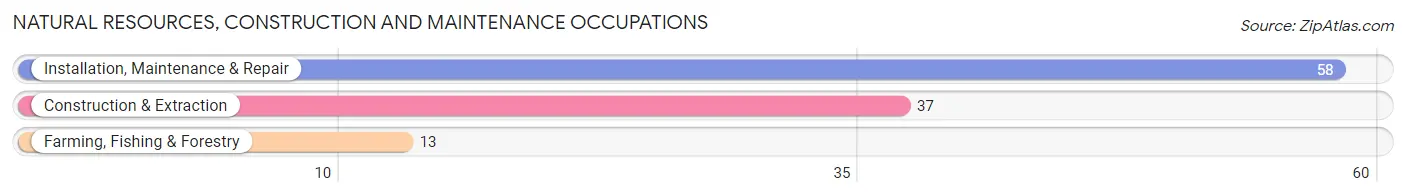
Natural Resources, Construction and Maintenance Occupations
The most common Natural Resources, Construction and Maintenance occupations in New Market are Installation, Maintenance & Repair (58 | 6.2%), Construction & Extraction (37 | 4.0%), and Farming, Fishing & Forestry (13 | 1.4%).
Natural Resources, Construction and Maintenance Occupations by Sex
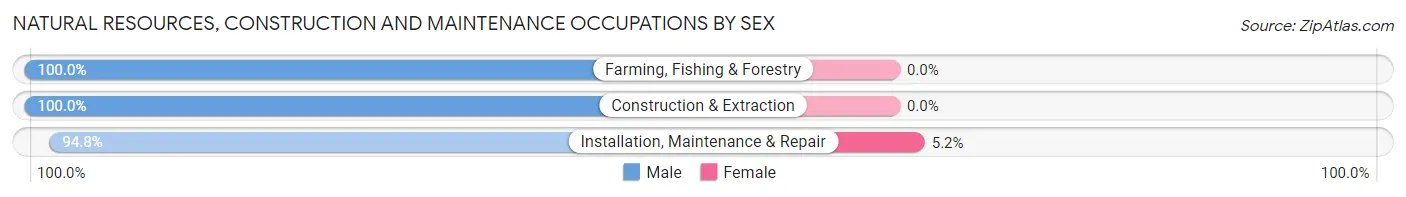
| Occupation | Male | Female |
| Farming, Fishing & Forestry | 13 (100.0%) | 0 (0.0%) |
| Construction & Extraction | 37 (100.0%) | 0 (0.0%) |
| Installation, Maintenance & Repair | 55 (94.8%) | 3 (5.2%) |
| Total (Category) | 105 (97.2%) | 3 (2.8%) |
| Total (Overall) | 512 (54.8%) | 422 (45.2%) |
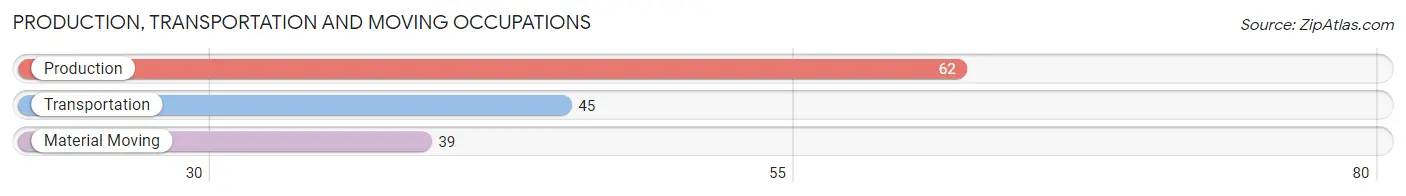
Production, Transportation and Moving Occupations
The most common Production, Transportation and Moving occupations in New Market are Production (62 | 6.6%), Transportation (45 | 4.8%), and Material Moving (39 | 4.2%).
Production, Transportation and Moving Occupations by Sex
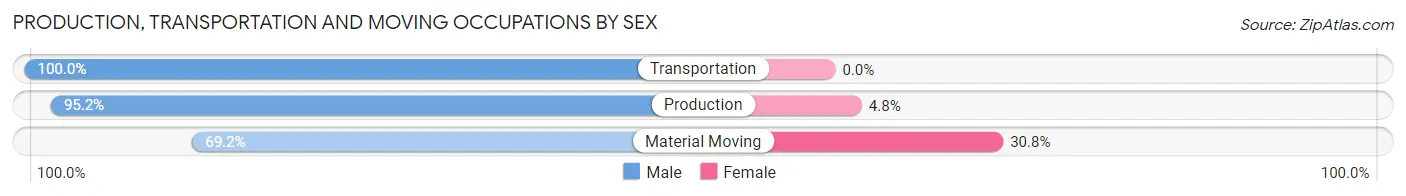
| Occupation | Male | Female |
| Production | 59 (95.2%) | 3 (4.8%) |
| Transportation | 45 (100.0%) | 0 (0.0%) |
| Material Moving | 27 (69.2%) | 12 (30.8%) |
| Total (Category) | 131 (89.7%) | 15 (10.3%) |
| Total (Overall) | 512 (54.8%) | 422 (45.2%) |
Employment Industries by Sex in New Market
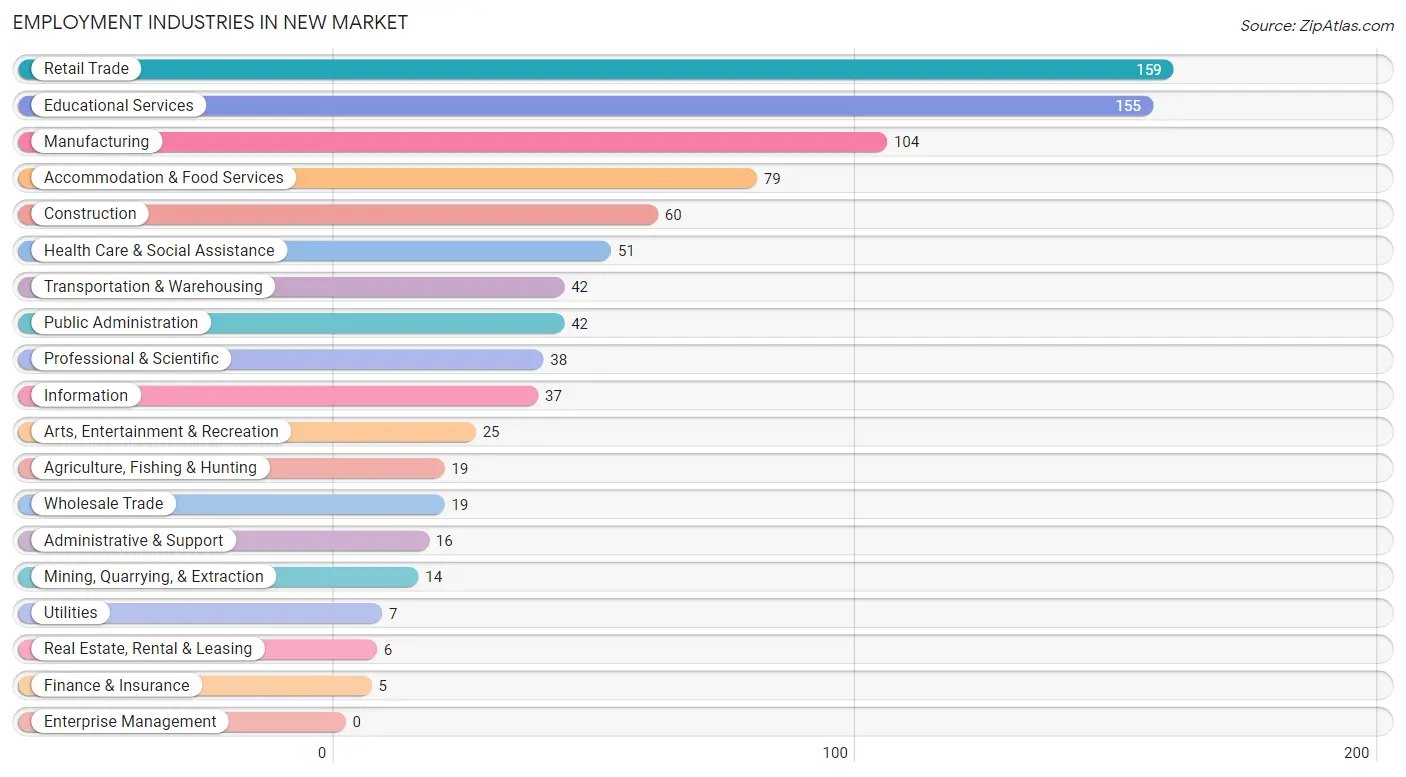
Employment Industries in New Market
The major employment industries in New Market include Retail Trade (159 | 17.0%), Educational Services (155 | 16.6%), Manufacturing (104 | 11.1%), Accommodation & Food Services (79 | 8.5%), and Construction (60 | 6.4%).
Employment Industries by Sex in New Market
The New Market industries that see more men than women are Manufacturing (100.0%), Wholesale Trade (100.0%), and Administrative & Support (100.0%), whereas the industries that tend to have a higher number of women are Utilities (100.0%), Information (100.0%), and Finance & Insurance (100.0%).
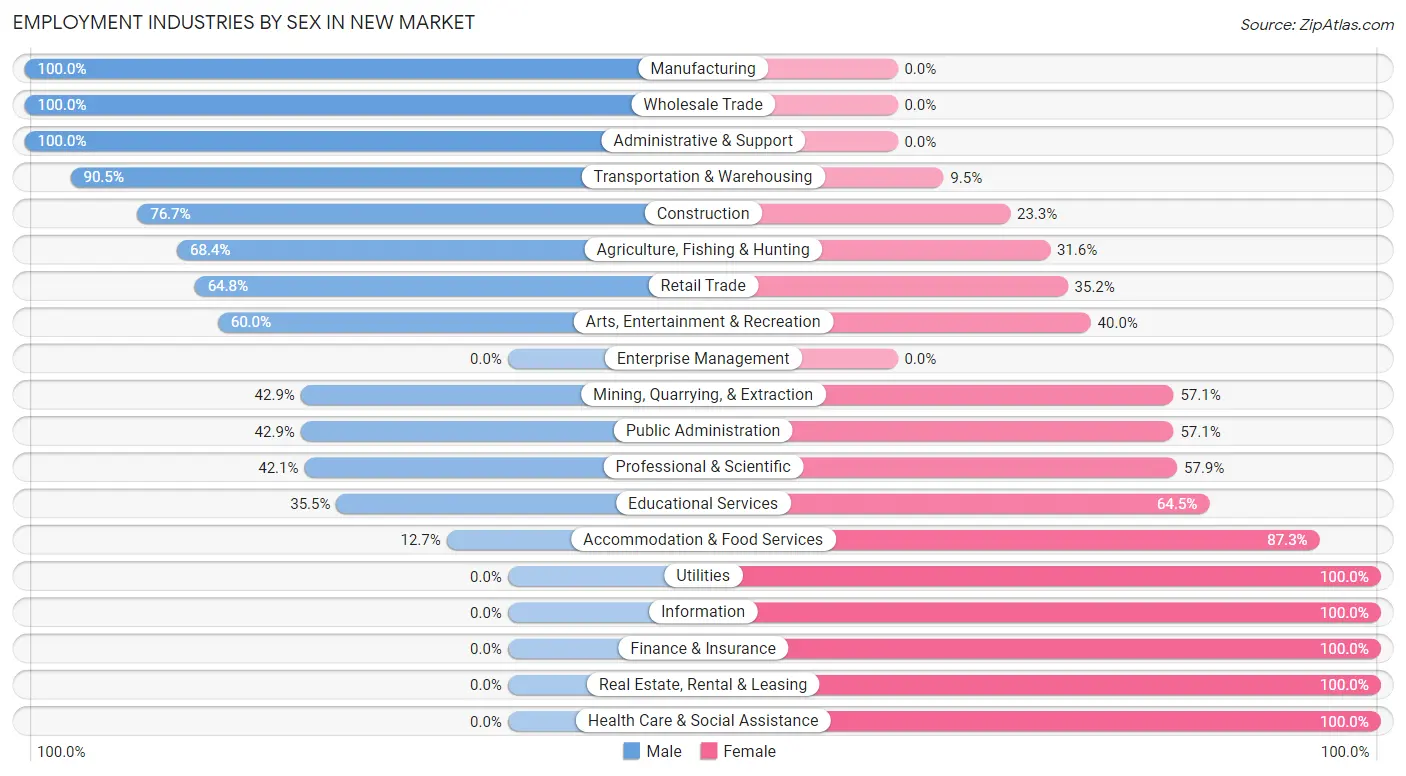
| Industry | Male | Female |
| Agriculture, Fishing & Hunting | 13 (68.4%) | 6 (31.6%) |
| Mining, Quarrying, & Extraction | 6 (42.9%) | 8 (57.1%) |
| Construction | 46 (76.7%) | 14 (23.3%) |
| Manufacturing | 104 (100.0%) | 0 (0.0%) |
| Wholesale Trade | 19 (100.0%) | 0 (0.0%) |
| Retail Trade | 103 (64.8%) | 56 (35.2%) |
| Transportation & Warehousing | 38 (90.5%) | 4 (9.5%) |
| Utilities | 0 (0.0%) | 7 (100.0%) |
| Information | 0 (0.0%) | 37 (100.0%) |
| Finance & Insurance | 0 (0.0%) | 5 (100.0%) |
| Real Estate, Rental & Leasing | 0 (0.0%) | 6 (100.0%) |
| Professional & Scientific | 16 (42.1%) | 22 (57.9%) |
| Enterprise Management | 0 (0.0%) | 0 (0.0%) |
| Administrative & Support | 16 (100.0%) | 0 (0.0%) |
| Educational Services | 55 (35.5%) | 100 (64.5%) |
| Health Care & Social Assistance | 0 (0.0%) | 51 (100.0%) |
| Arts, Entertainment & Recreation | 15 (60.0%) | 10 (40.0%) |
| Accommodation & Food Services | 10 (12.7%) | 69 (87.3%) |
| Public Administration | 18 (42.9%) | 24 (57.1%) |
| Total | 512 (54.8%) | 422 (45.2%) |
Education in New Market
School Enrollment in New Market
The most common levels of schooling among the 433 students in New Market are elementary school (138 | 31.9%), high school (116 | 26.8%), and middle school (75 | 17.3%).
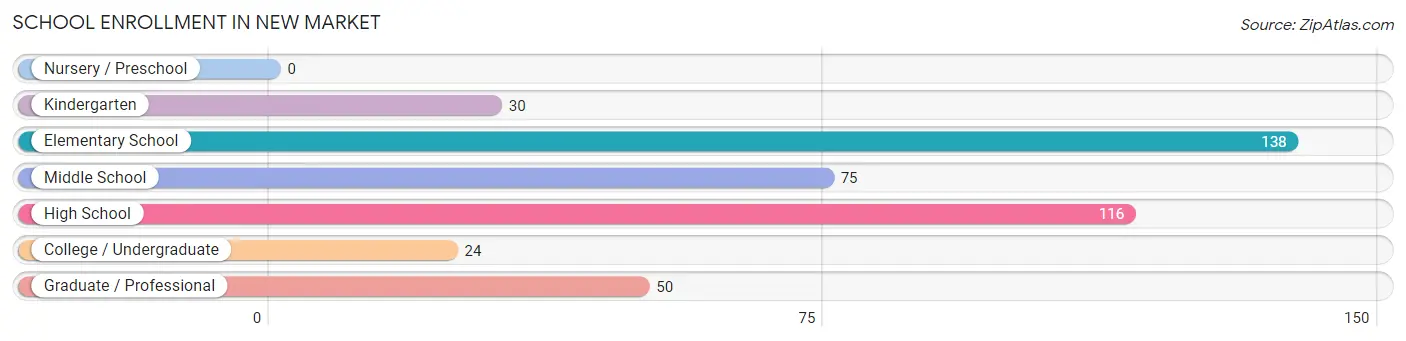
| School Level | # Students | % Students |
| Nursery / Preschool | 0 | 0.0% |
| Kindergarten | 30 | 6.9% |
| Elementary School | 138 | 31.9% |
| Middle School | 75 | 17.3% |
| High School | 116 | 26.8% |
| College / Undergraduate | 24 | 5.5% |
| Graduate / Professional | 50 | 11.6% |
| Total | 433 | 100.0% |
School Enrollment by Age by Funding Source in New Market
Out of a total of 433 students who are enrolled in schools in New Market, 17 (3.9%) attend a private institution, while the remaining 416 (96.1%) are enrolled in public schools. The age group of 15 to 17 year olds has the highest likelihood of being enrolled in private schools, with 11 (10.2% in the age bracket) enrolled. Conversely, the age group of 10 to 14 year olds has the lowest likelihood of being enrolled in a private school, with 137 (100.0% in the age bracket) attending a public institution.
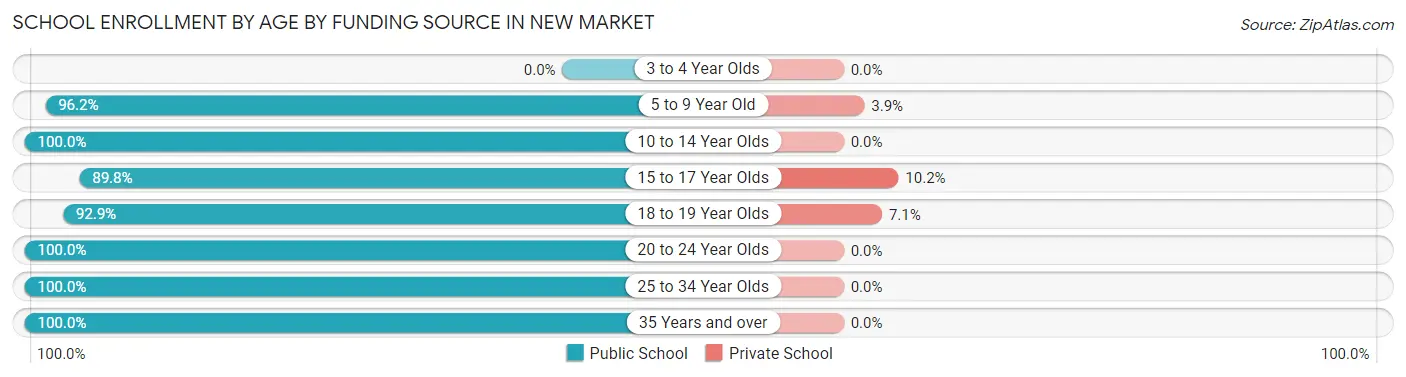
| Age Bracket | Public School | Private School |
| 3 to 4 Year Olds | 0 (0.0%) | 0 (0.0%) |
| 5 to 9 Year Old | 100 (96.2%) | 4 (3.8%) |
| 10 to 14 Year Olds | 137 (100.0%) | 0 (0.0%) |
| 15 to 17 Year Olds | 97 (89.8%) | 11 (10.2%) |
| 18 to 19 Year Olds | 26 (92.9%) | 2 (7.1%) |
| 20 to 24 Year Olds | 6 (100.0%) | 0 (0.0%) |
| 25 to 34 Year Olds | 6 (100.0%) | 0 (0.0%) |
| 35 Years and over | 44 (100.0%) | 0 (0.0%) |
| Total | 416 (96.1%) | 17 (3.9%) |
Educational Attainment by Field of Study in New Market
Arts & humanities (95 | 30.5%), education (90 | 28.9%), science & technology (26 | 8.4%), bio, nature & agricultural (23 | 7.4%), and business (23 | 7.4%) are the most common fields of study among 311 individuals in New Market who have obtained a bachelor's degree or higher.
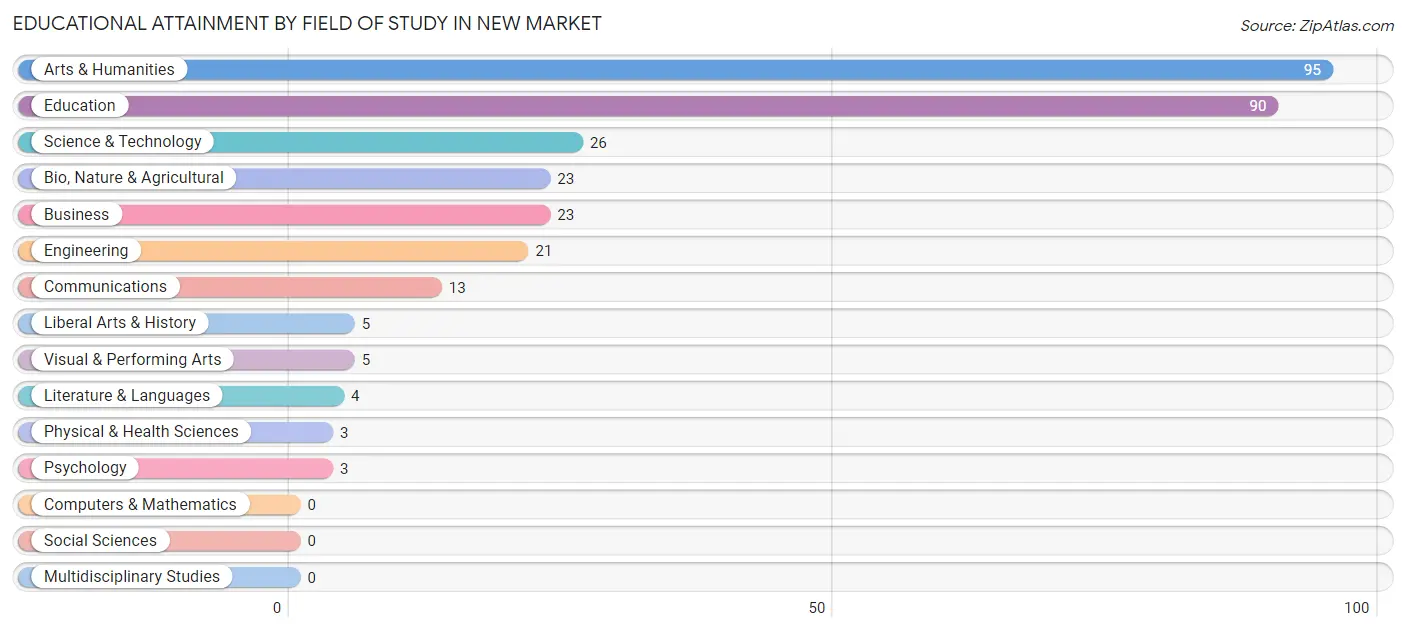
| Field of Study | # Graduates | % Graduates |
| Computers & Mathematics | 0 | 0.0% |
| Bio, Nature & Agricultural | 23 | 7.4% |
| Physical & Health Sciences | 3 | 1.0% |
| Psychology | 3 | 1.0% |
| Social Sciences | 0 | 0.0% |
| Engineering | 21 | 6.8% |
| Multidisciplinary Studies | 0 | 0.0% |
| Science & Technology | 26 | 8.4% |
| Business | 23 | 7.4% |
| Education | 90 | 28.9% |
| Literature & Languages | 4 | 1.3% |
| Liberal Arts & History | 5 | 1.6% |
| Visual & Performing Arts | 5 | 1.6% |
| Communications | 13 | 4.2% |
| Arts & Humanities | 95 | 30.5% |
| Total | 311 | 100.0% |
Transportation & Commute in New Market
Vehicle Availability by Sex in New Market
The most prevalent vehicle ownership categories in New Market are males with 2 vehicles (219, accounting for 42.8%) and females with 2 vehicles (177, making up 51.9%).
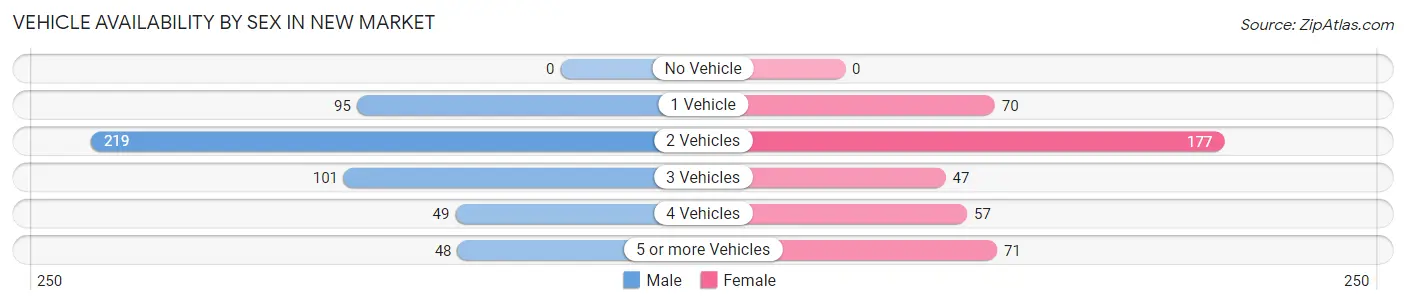
| Vehicles Available | Male | Female |
| No Vehicle | 0 (0.0%) | 0 (0.0%) |
| 1 Vehicle | 95 (18.5%) | 70 (16.6%) |
| 2 Vehicles | 219 (42.8%) | 177 (41.9%) |
| 3 Vehicles | 101 (19.7%) | 47 (11.1%) |
| 4 Vehicles | 49 (9.6%) | 57 (13.5%) |
| 5 or more Vehicles | 48 (9.4%) | 71 (16.8%) |
| Total | 512 (100.0%) | 422 (100.0%) |
Commute Time in New Market
The most frequently occuring commute durations in New Market are 5 to 9 minutes (167 commuters, 18.5%), 10 to 14 minutes (167 commuters, 18.5%), and 60 to 89 minutes (146 commuters, 16.2%).
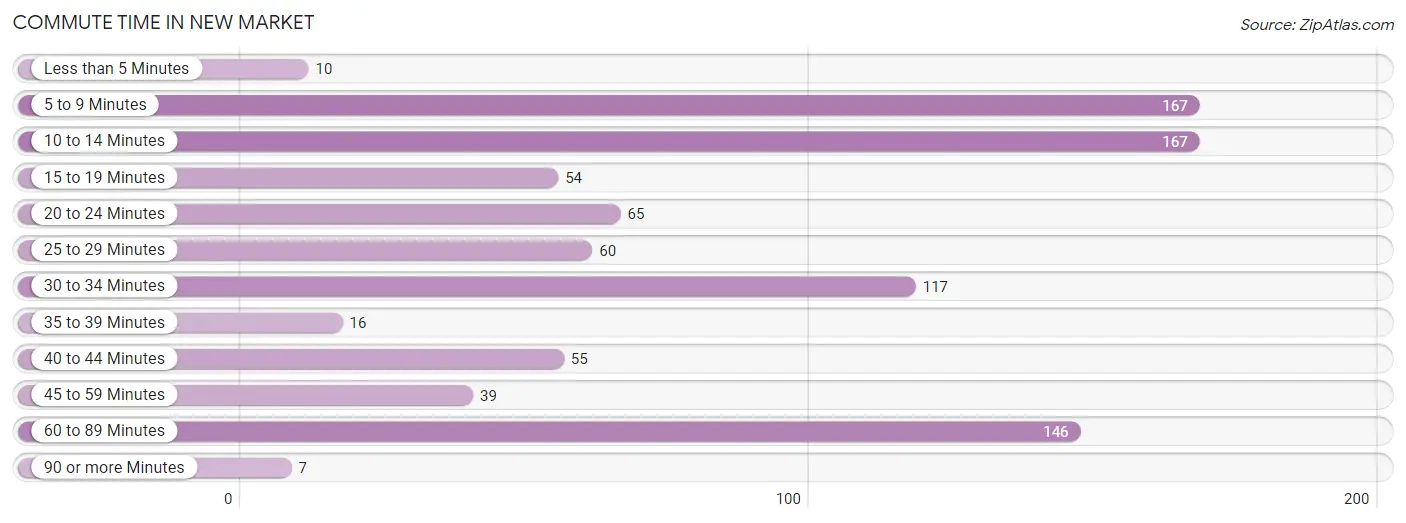
| Commute Time | # Commuters | % Commuters |
| Less than 5 Minutes | 10 | 1.1% |
| 5 to 9 Minutes | 167 | 18.5% |
| 10 to 14 Minutes | 167 | 18.5% |
| 15 to 19 Minutes | 54 | 6.0% |
| 20 to 24 Minutes | 65 | 7.2% |
| 25 to 29 Minutes | 60 | 6.6% |
| 30 to 34 Minutes | 117 | 13.0% |
| 35 to 39 Minutes | 16 | 1.8% |
| 40 to 44 Minutes | 55 | 6.1% |
| 45 to 59 Minutes | 39 | 4.3% |
| 60 to 89 Minutes | 146 | 16.2% |
| 90 or more Minutes | 7 | 0.8% |
Commute Time by Sex in New Market
The most common commute times in New Market are 5 to 9 minutes (113 commuters, 23.2%) for males and 10 to 14 minutes (103 commuters, 24.8%) for females.
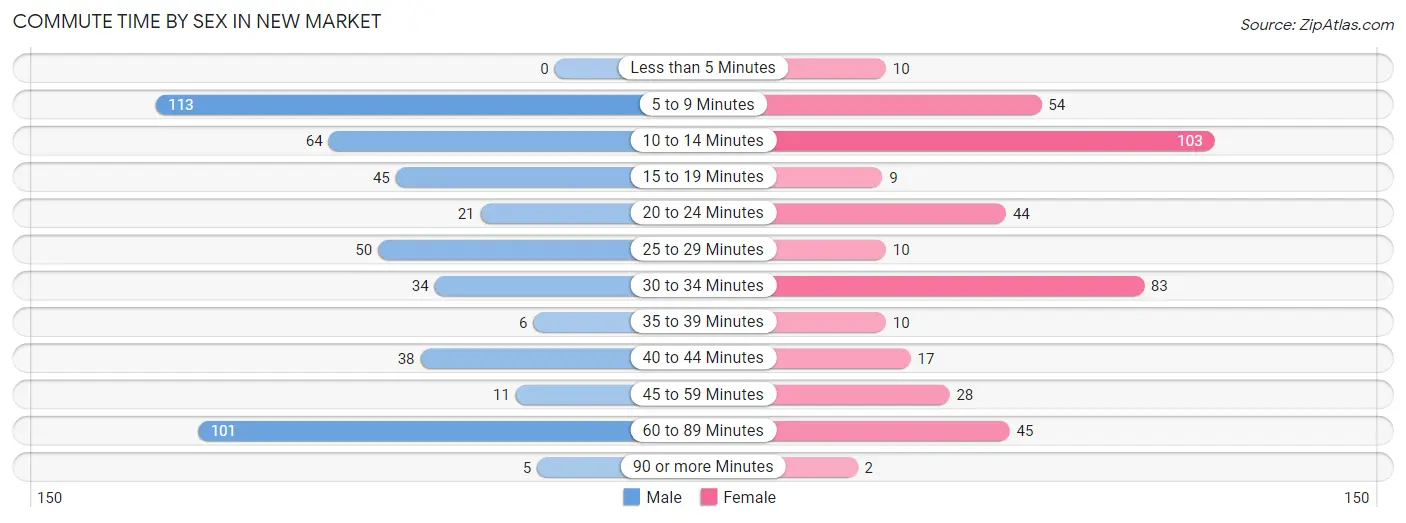
| Commute Time | Male | Female |
| Less than 5 Minutes | 0 (0.0%) | 10 (2.4%) |
| 5 to 9 Minutes | 113 (23.2%) | 54 (13.0%) |
| 10 to 14 Minutes | 64 (13.1%) | 103 (24.8%) |
| 15 to 19 Minutes | 45 (9.2%) | 9 (2.2%) |
| 20 to 24 Minutes | 21 (4.3%) | 44 (10.6%) |
| 25 to 29 Minutes | 50 (10.2%) | 10 (2.4%) |
| 30 to 34 Minutes | 34 (7.0%) | 83 (20.0%) |
| 35 to 39 Minutes | 6 (1.2%) | 10 (2.4%) |
| 40 to 44 Minutes | 38 (7.8%) | 17 (4.1%) |
| 45 to 59 Minutes | 11 (2.2%) | 28 (6.8%) |
| 60 to 89 Minutes | 101 (20.7%) | 45 (10.8%) |
| 90 or more Minutes | 5 (1.0%) | 2 (0.5%) |
Time of Departure to Work by Sex in New Market
The most frequent times of departure to work in New Market are 9:00 AM to 9:59 AM (81, 16.6%) for males and 7:30 AM to 7:59 AM (116, 28.0%) for females.
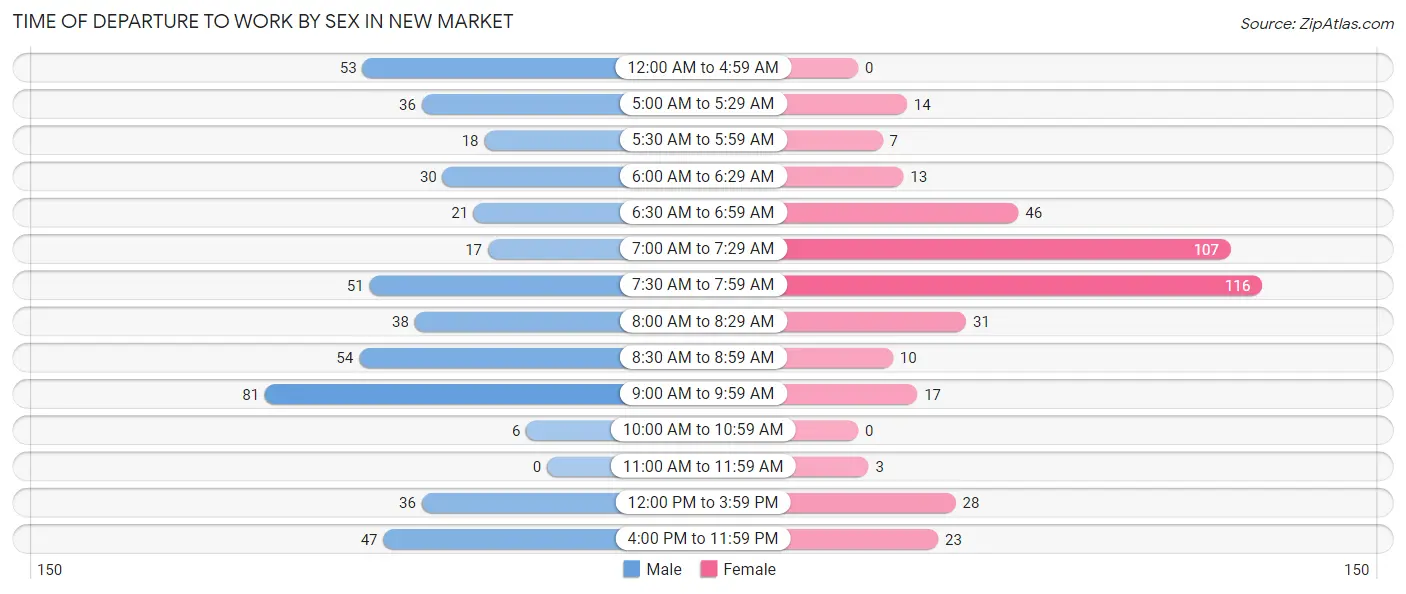
| Time of Departure | Male | Female |
| 12:00 AM to 4:59 AM | 53 (10.9%) | 0 (0.0%) |
| 5:00 AM to 5:29 AM | 36 (7.4%) | 14 (3.4%) |
| 5:30 AM to 5:59 AM | 18 (3.7%) | 7 (1.7%) |
| 6:00 AM to 6:29 AM | 30 (6.1%) | 13 (3.1%) |
| 6:30 AM to 6:59 AM | 21 (4.3%) | 46 (11.1%) |
| 7:00 AM to 7:29 AM | 17 (3.5%) | 107 (25.8%) |
| 7:30 AM to 7:59 AM | 51 (10.4%) | 116 (28.0%) |
| 8:00 AM to 8:29 AM | 38 (7.8%) | 31 (7.5%) |
| 8:30 AM to 8:59 AM | 54 (11.1%) | 10 (2.4%) |
| 9:00 AM to 9:59 AM | 81 (16.6%) | 17 (4.1%) |
| 10:00 AM to 10:59 AM | 6 (1.2%) | 0 (0.0%) |
| 11:00 AM to 11:59 AM | 0 (0.0%) | 3 (0.7%) |
| 12:00 PM to 3:59 PM | 36 (7.4%) | 28 (6.8%) |
| 4:00 PM to 11:59 PM | 47 (9.6%) | 23 (5.5%) |
| Total | 488 (100.0%) | 415 (100.0%) |
Housing Occupancy in New Market
Occupancy by Ownership in New Market
Of the total 604 dwellings in New Market, owner-occupied units account for 466 (77.1%), while renter-occupied units make up 138 (22.9%).
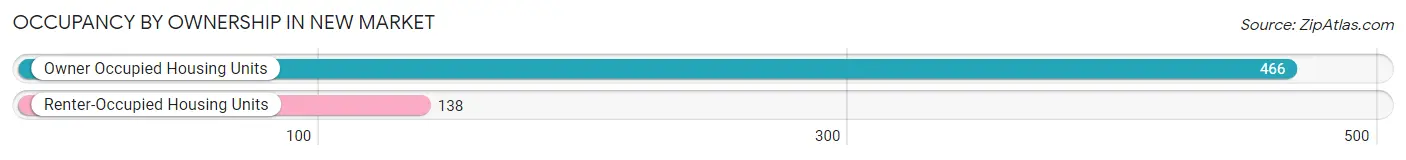
| Occupancy | # Housing Units | % Housing Units |
| Owner Occupied Housing Units | 466 | 77.1% |
| Renter-Occupied Housing Units | 138 | 22.9% |
| Total Occupied Housing Units | 604 | 100.0% |
Occupancy by Household Size in New Market
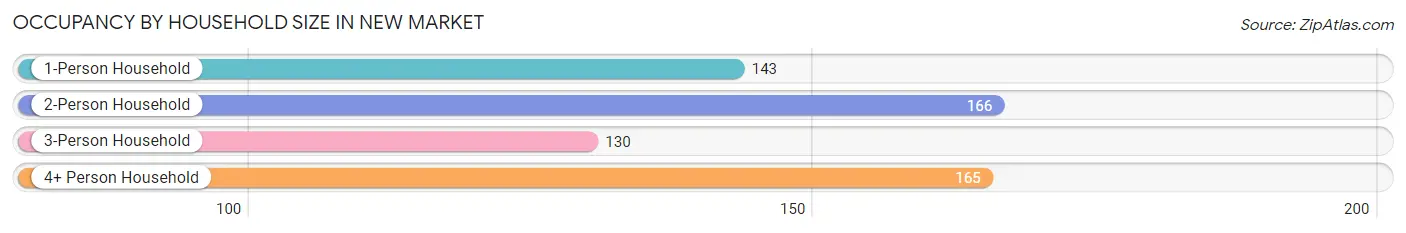
| Household Size | # Housing Units | % Housing Units |
| 1-Person Household | 143 | 23.7% |
| 2-Person Household | 166 | 27.5% |
| 3-Person Household | 130 | 21.5% |
| 4+ Person Household | 165 | 27.3% |
| Total Housing Units | 604 | 100.0% |
Occupancy by Ownership by Household Size in New Market
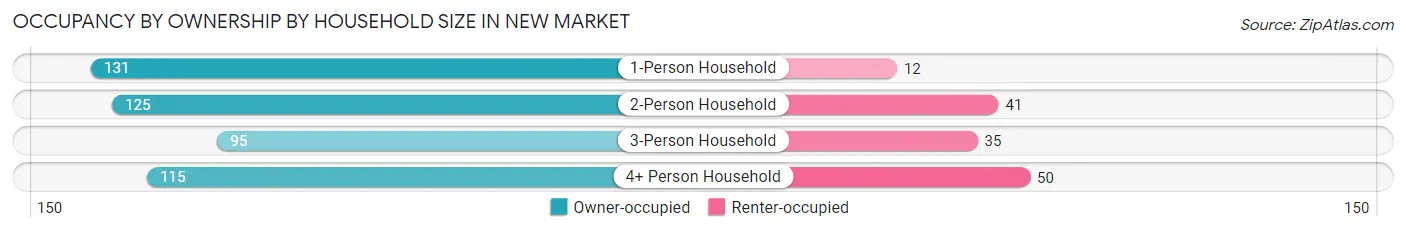
| Household Size | Owner-occupied | Renter-occupied |
| 1-Person Household | 131 (91.6%) | 12 (8.4%) |
| 2-Person Household | 125 (75.3%) | 41 (24.7%) |
| 3-Person Household | 95 (73.1%) | 35 (26.9%) |
| 4+ Person Household | 115 (69.7%) | 50 (30.3%) |
| Total Housing Units | 466 (77.1%) | 138 (22.9%) |
Occupancy by Educational Attainment in New Market
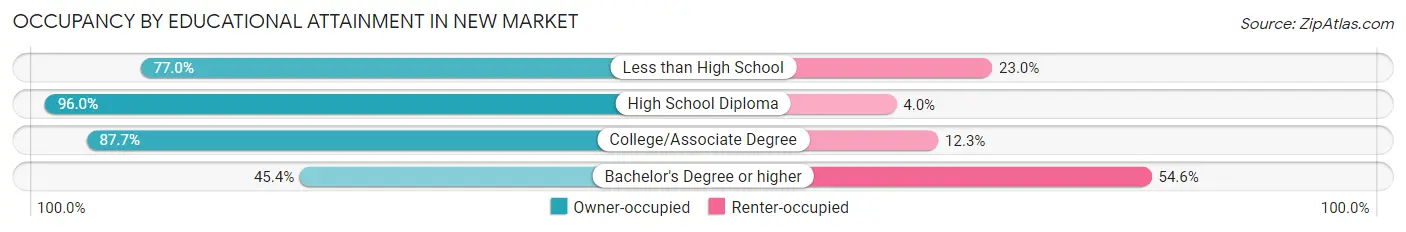
| Household Size | Owner-occupied | Renter-occupied |
| Less than High School | 67 (77.0%) | 20 (23.0%) |
| High School Diploma | 168 (96.0%) | 7 (4.0%) |
| College/Associate Degree | 157 (87.7%) | 22 (12.3%) |
| Bachelor's Degree or higher | 74 (45.4%) | 89 (54.6%) |
Occupancy by Age of Householder in New Market
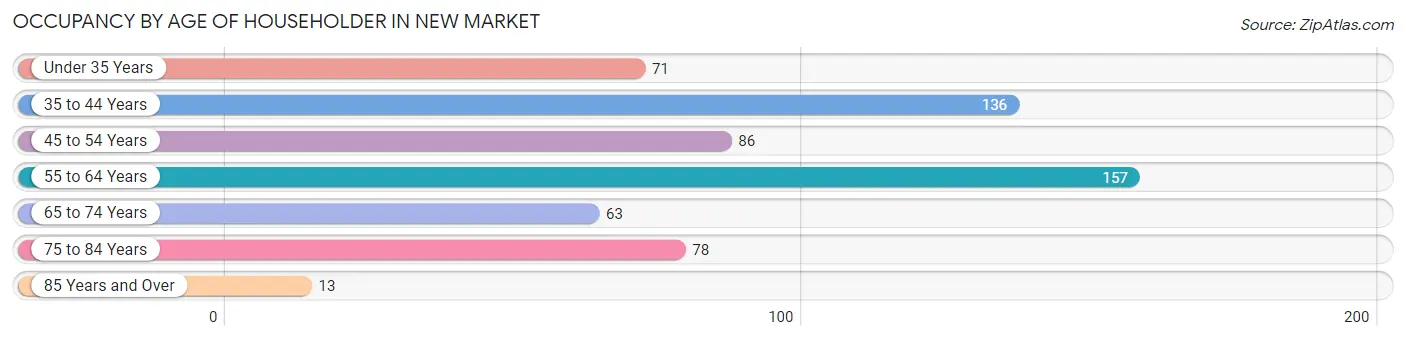
| Age Bracket | # Households | % Households |
| Under 35 Years | 71 | 11.7% |
| 35 to 44 Years | 136 | 22.5% |
| 45 to 54 Years | 86 | 14.2% |
| 55 to 64 Years | 157 | 26.0% |
| 65 to 74 Years | 63 | 10.4% |
| 75 to 84 Years | 78 | 12.9% |
| 85 Years and Over | 13 | 2.1% |
| Total | 604 | 100.0% |
Housing Finances in New Market
Median Income by Occupancy in New Market
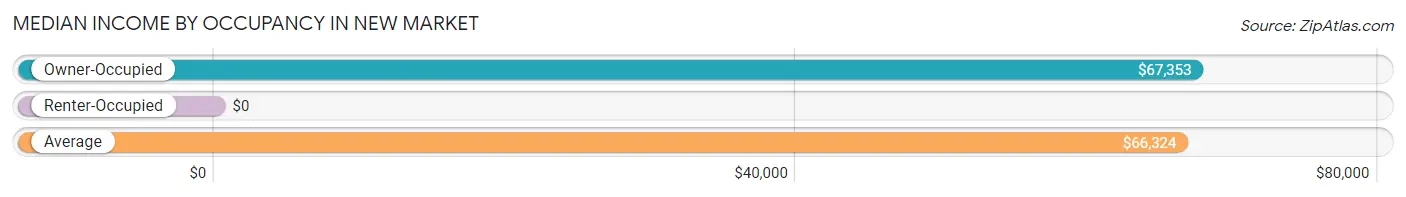
| Occupancy Type | # Households | Median Income |
| Owner-Occupied | 466 (77.1%) | $67,353 |
| Renter-Occupied | 138 (22.9%) | $0 |
| Average | 604 (100.0%) | $66,324 |
Occupancy by Householder Income Bracket in New Market
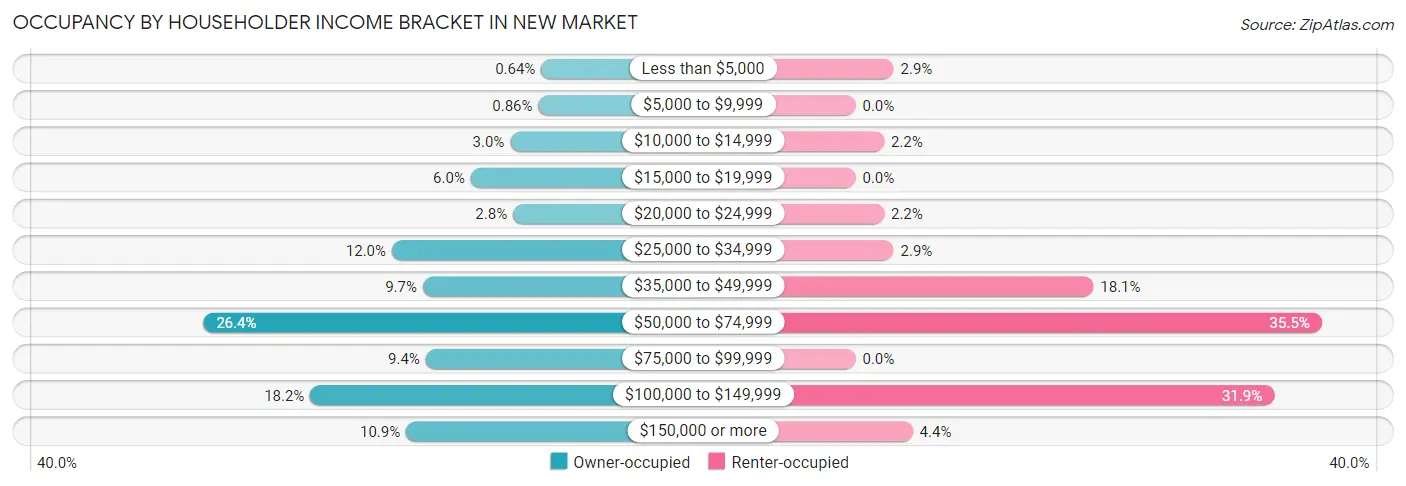
| Income Bracket | Owner-occupied | Renter-occupied |
| Less than $5,000 | 3 (0.6%) | 4 (2.9%) |
| $5,000 to $9,999 | 4 (0.9%) | 0 (0.0%) |
| $10,000 to $14,999 | 14 (3.0%) | 3 (2.2%) |
| $15,000 to $19,999 | 28 (6.0%) | 0 (0.0%) |
| $20,000 to $24,999 | 13 (2.8%) | 3 (2.2%) |
| $25,000 to $34,999 | 56 (12.0%) | 4 (2.9%) |
| $35,000 to $49,999 | 45 (9.7%) | 25 (18.1%) |
| $50,000 to $74,999 | 123 (26.4%) | 49 (35.5%) |
| $75,000 to $99,999 | 44 (9.4%) | 0 (0.0%) |
| $100,000 to $149,999 | 85 (18.2%) | 44 (31.9%) |
| $150,000 or more | 51 (10.9%) | 6 (4.3%) |
| Total | 466 (100.0%) | 138 (100.0%) |
Monthly Housing Cost Tiers in New Market
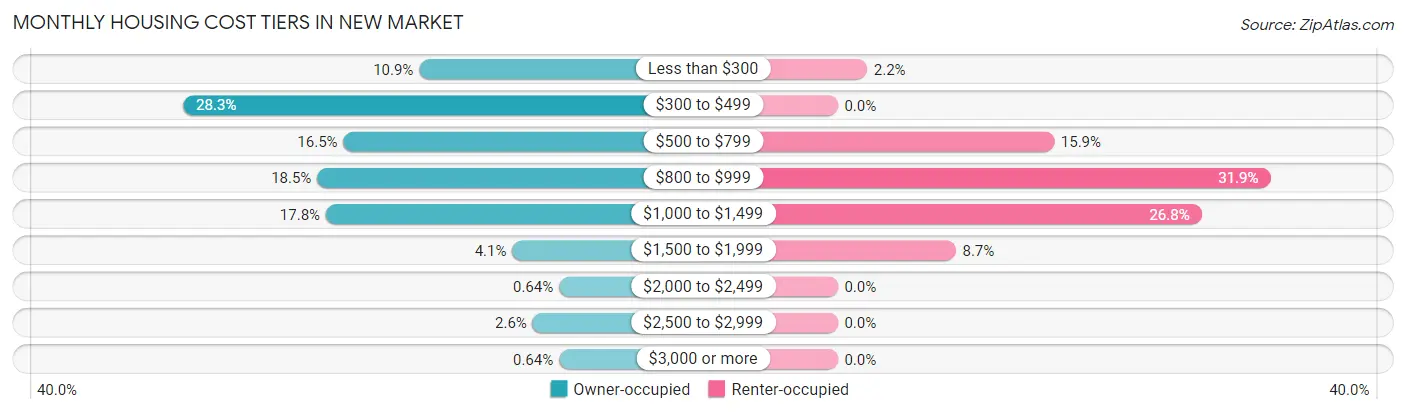
| Monthly Cost | Owner-occupied | Renter-occupied |
| Less than $300 | 51 (10.9%) | 3 (2.2%) |
| $300 to $499 | 132 (28.3%) | 0 (0.0%) |
| $500 to $799 | 77 (16.5%) | 22 (15.9%) |
| $800 to $999 | 86 (18.4%) | 44 (31.9%) |
| $1,000 to $1,499 | 83 (17.8%) | 37 (26.8%) |
| $1,500 to $1,999 | 19 (4.1%) | 12 (8.7%) |
| $2,000 to $2,499 | 3 (0.6%) | 0 (0.0%) |
| $2,500 to $2,999 | 12 (2.6%) | 0 (0.0%) |
| $3,000 or more | 3 (0.6%) | 0 (0.0%) |
| Total | 466 (100.0%) | 138 (100.0%) |
Physical Housing Characteristics in New Market
Housing Structures in New Market
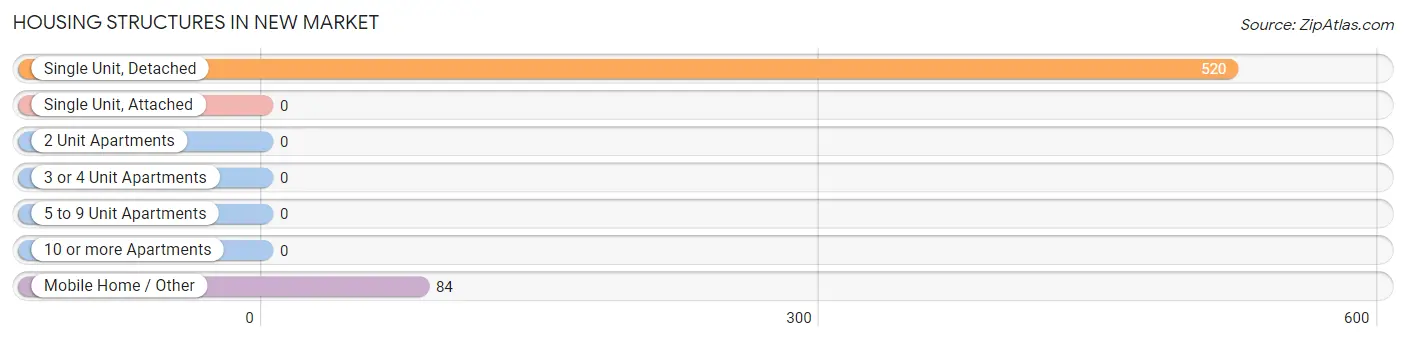
| Structure Type | # Housing Units | % Housing Units |
| Single Unit, Detached | 520 | 86.1% |
| Single Unit, Attached | 0 | 0.0% |
| 2 Unit Apartments | 0 | 0.0% |
| 3 or 4 Unit Apartments | 0 | 0.0% |
| 5 to 9 Unit Apartments | 0 | 0.0% |
| 10 or more Apartments | 0 | 0.0% |
| Mobile Home / Other | 84 | 13.9% |
| Total | 604 | 100.0% |
Housing Structures by Occupancy in New Market
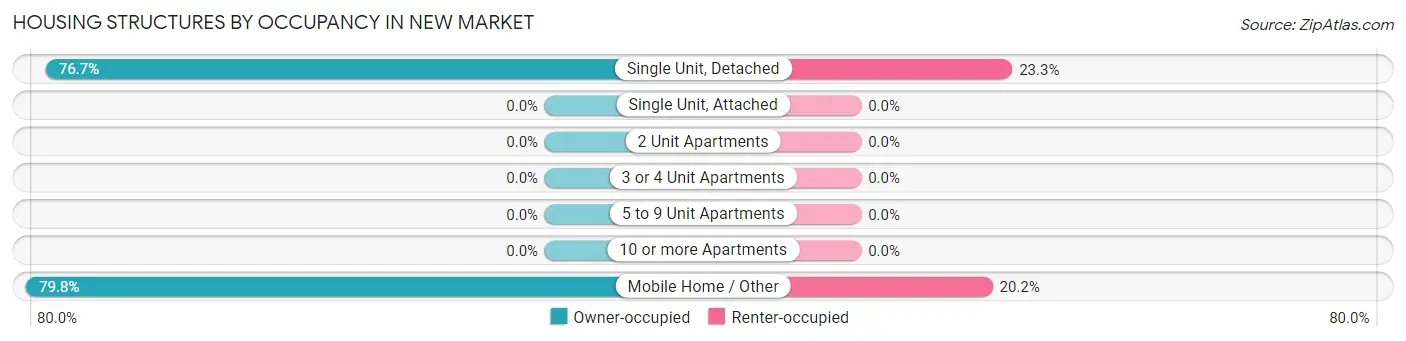
| Structure Type | Owner-occupied | Renter-occupied |
| Single Unit, Detached | 399 (76.7%) | 121 (23.3%) |
| Single Unit, Attached | 0 (0.0%) | 0 (0.0%) |
| 2 Unit Apartments | 0 (0.0%) | 0 (0.0%) |
| 3 or 4 Unit Apartments | 0 (0.0%) | 0 (0.0%) |
| 5 to 9 Unit Apartments | 0 (0.0%) | 0 (0.0%) |
| 10 or more Apartments | 0 (0.0%) | 0 (0.0%) |
| Mobile Home / Other | 67 (79.8%) | 17 (20.2%) |
| Total | 466 (77.1%) | 138 (22.9%) |
Housing Structures by Number of Rooms in New Market
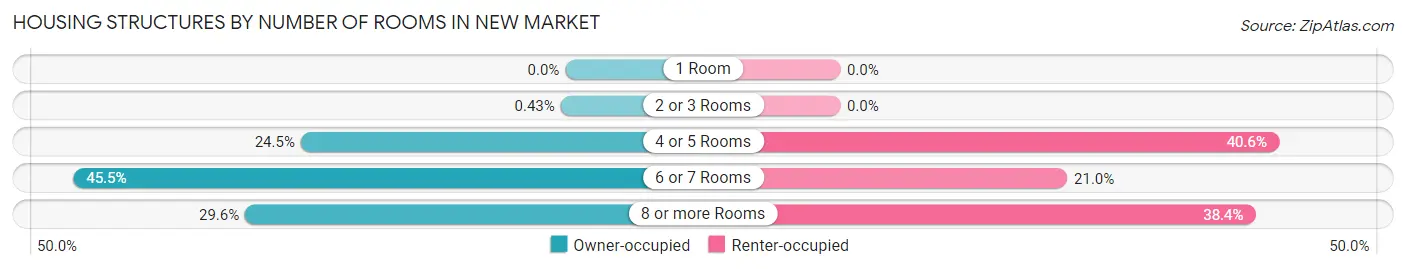
| Number of Rooms | Owner-occupied | Renter-occupied |
| 1 Room | 0 (0.0%) | 0 (0.0%) |
| 2 or 3 Rooms | 2 (0.4%) | 0 (0.0%) |
| 4 or 5 Rooms | 114 (24.5%) | 56 (40.6%) |
| 6 or 7 Rooms | 212 (45.5%) | 29 (21.0%) |
| 8 or more Rooms | 138 (29.6%) | 53 (38.4%) |
| Total | 466 (100.0%) | 138 (100.0%) |
Housing Structure by Heating Type in New Market
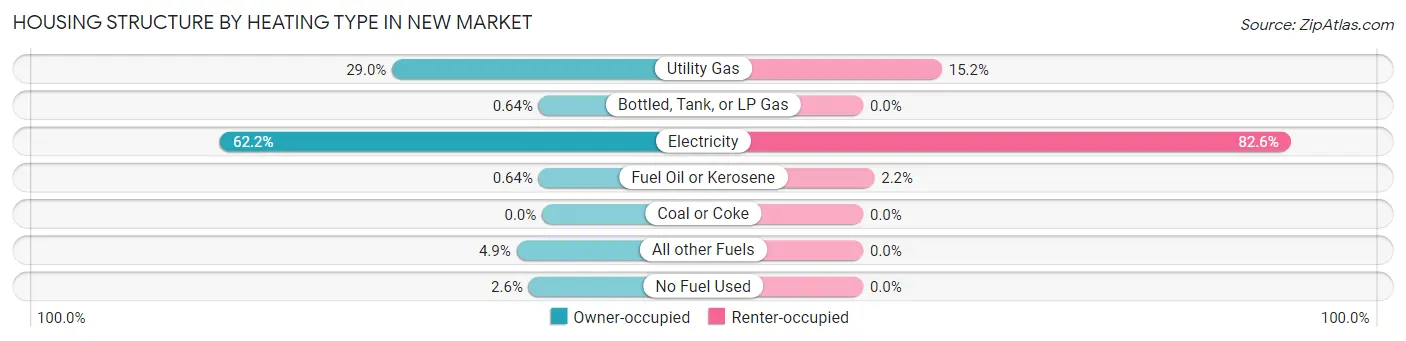
| Heating Type | Owner-occupied | Renter-occupied |
| Utility Gas | 135 (29.0%) | 21 (15.2%) |
| Bottled, Tank, or LP Gas | 3 (0.6%) | 0 (0.0%) |
| Electricity | 290 (62.2%) | 114 (82.6%) |
| Fuel Oil or Kerosene | 3 (0.6%) | 3 (2.2%) |
| Coal or Coke | 0 (0.0%) | 0 (0.0%) |
| All other Fuels | 23 (4.9%) | 0 (0.0%) |
| No Fuel Used | 12 (2.6%) | 0 (0.0%) |
| Total | 466 (100.0%) | 138 (100.0%) |
Household Vehicle Usage in New Market
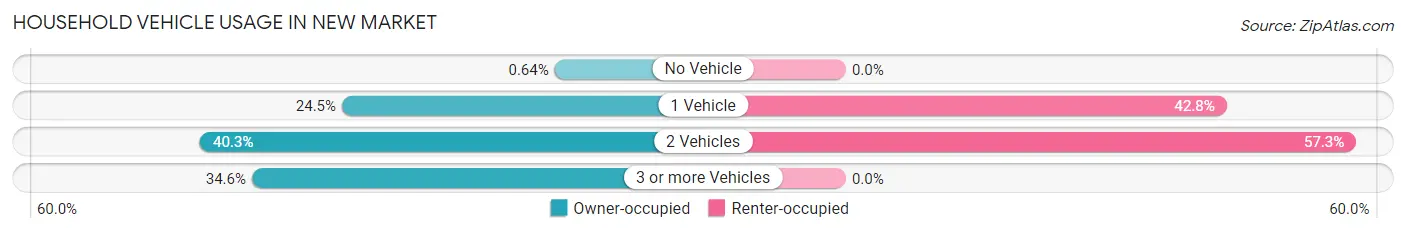
| Vehicles per Household | Owner-occupied | Renter-occupied |
| No Vehicle | 3 (0.6%) | 0 (0.0%) |
| 1 Vehicle | 114 (24.5%) | 59 (42.7%) |
| 2 Vehicles | 188 (40.3%) | 79 (57.3%) |
| 3 or more Vehicles | 161 (34.5%) | 0 (0.0%) |
| Total | 466 (100.0%) | 138 (100.0%) |
Real Estate & Mortgages in New Market
Real Estate and Mortgage Overview in New Market
| Characteristic | Without Mortgage | With Mortgage |
| Housing Units | 204 | 262 |
| Median Property Value | $146,400 | $148,200 |
| Median Household Income | $55,455 | $31 |
| Monthly Housing Costs | $354 | $3 |
| Real Estate Taxes | $829 | $0 |
Property Value by Mortgage Status in New Market
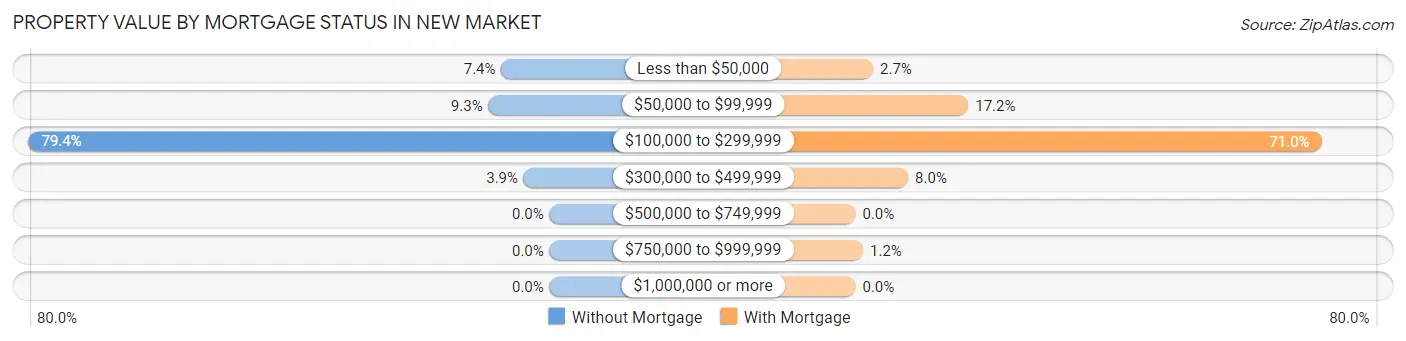
| Property Value | Without Mortgage | With Mortgage |
| Less than $50,000 | 15 (7.3%) | 7 (2.7%) |
| $50,000 to $99,999 | 19 (9.3%) | 45 (17.2%) |
| $100,000 to $299,999 | 162 (79.4%) | 186 (71.0%) |
| $300,000 to $499,999 | 8 (3.9%) | 21 (8.0%) |
| $500,000 to $749,999 | 0 (0.0%) | 0 (0.0%) |
| $750,000 to $999,999 | 0 (0.0%) | 3 (1.1%) |
| $1,000,000 or more | 0 (0.0%) | 0 (0.0%) |
| Total | 204 (100.0%) | 262 (100.0%) |
Household Income by Mortgage Status in New Market
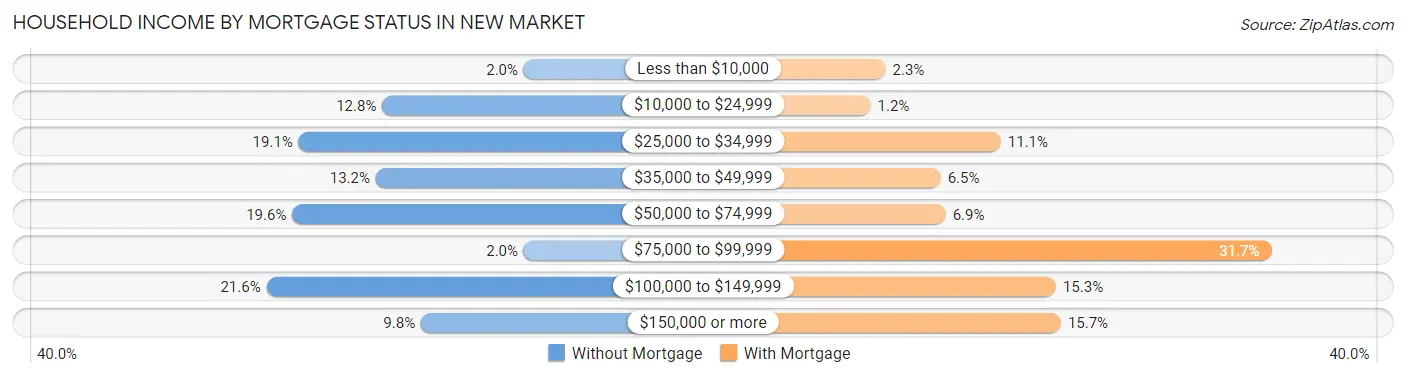
| Household Income | Without Mortgage | With Mortgage |
| Less than $10,000 | 4 (2.0%) | 6 (2.3%) |
| $10,000 to $24,999 | 26 (12.8%) | 3 (1.1%) |
| $25,000 to $34,999 | 39 (19.1%) | 29 (11.1%) |
| $35,000 to $49,999 | 27 (13.2%) | 17 (6.5%) |
| $50,000 to $74,999 | 40 (19.6%) | 18 (6.9%) |
| $75,000 to $99,999 | 4 (2.0%) | 83 (31.7%) |
| $100,000 to $149,999 | 44 (21.6%) | 40 (15.3%) |
| $150,000 or more | 20 (9.8%) | 41 (15.7%) |
| Total | 204 (100.0%) | 262 (100.0%) |
Property Value to Household Income Ratio in New Market
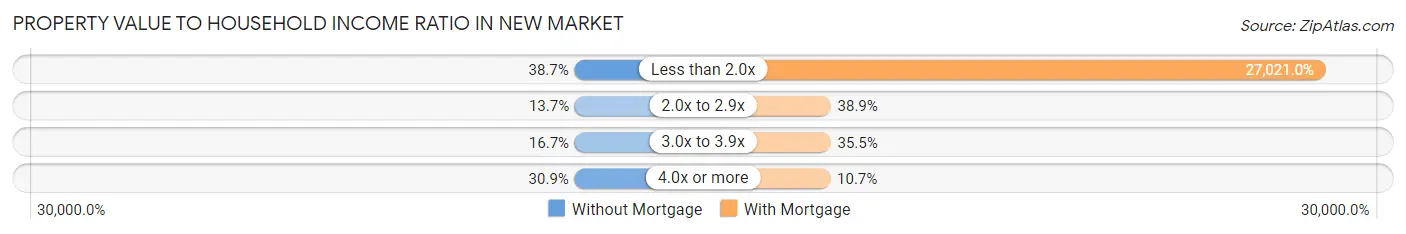
| Value-to-Income Ratio | Without Mortgage | With Mortgage |
| Less than 2.0x | 79 (38.7%) | 70,795 (27,021.0%) |
| 2.0x to 2.9x | 28 (13.7%) | 102 (38.9%) |
| 3.0x to 3.9x | 34 (16.7%) | 93 (35.5%) |
| 4.0x or more | 63 (30.9%) | 28 (10.7%) |
| Total | 204 (100.0%) | 262 (100.0%) |
Real Estate Taxes by Mortgage Status in New Market
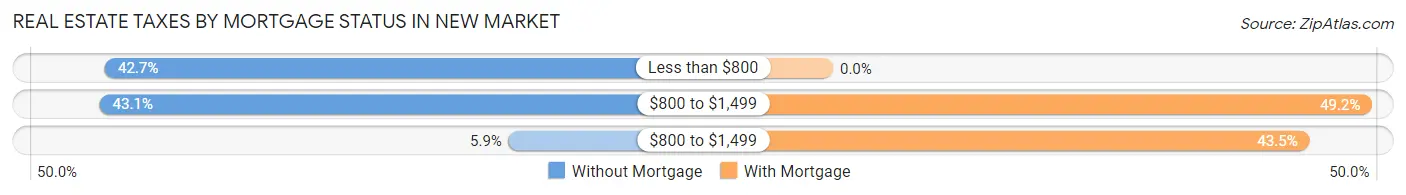
| Property Taxes | Without Mortgage | With Mortgage |
| Less than $800 | 87 (42.6%) | 0 (0.0%) |
| $800 to $1,499 | 88 (43.1%) | 129 (49.2%) |
| $800 to $1,499 | 12 (5.9%) | 114 (43.5%) |
| Total | 204 (100.0%) | 262 (100.0%) |
Health & Disability in New Market
Health Insurance Coverage by Age in New Market
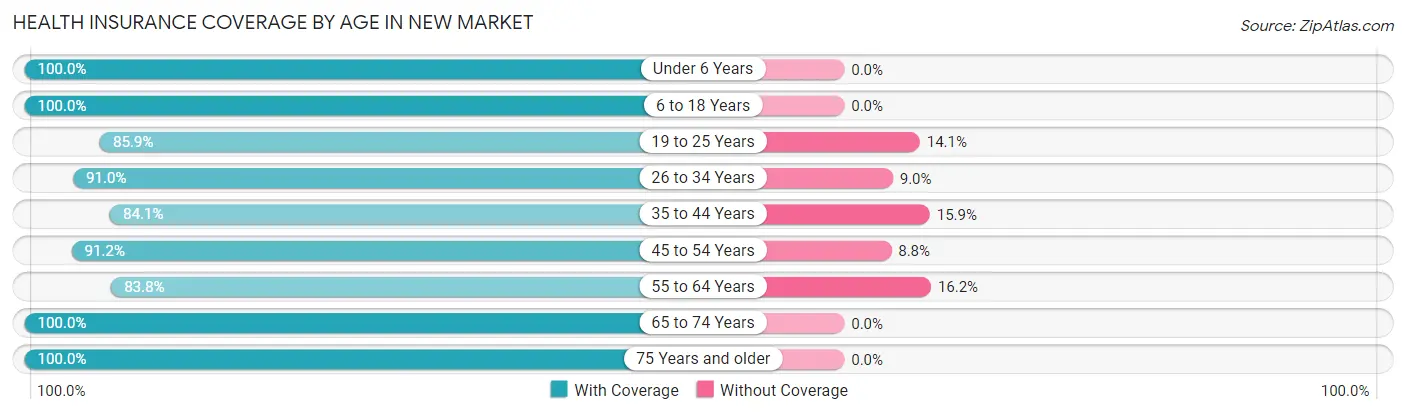
| Age Bracket | With Coverage | Without Coverage |
| Under 6 Years | 115 (100.0%) | 0 (0.0%) |
| 6 to 18 Years | 355 (100.0%) | 0 (0.0%) |
| 19 to 25 Years | 122 (85.9%) | 20 (14.1%) |
| 26 to 34 Years | 161 (91.0%) | 16 (9.0%) |
| 35 to 44 Years | 174 (84.1%) | 33 (15.9%) |
| 45 to 54 Years | 229 (91.2%) | 22 (8.8%) |
| 55 to 64 Years | 192 (83.8%) | 37 (16.2%) |
| 65 to 74 Years | 147 (100.0%) | 0 (0.0%) |
| 75 Years and older | 163 (100.0%) | 0 (0.0%) |
| Total | 1,658 (92.8%) | 128 (7.2%) |
Health Insurance Coverage by Citizenship Status in New Market
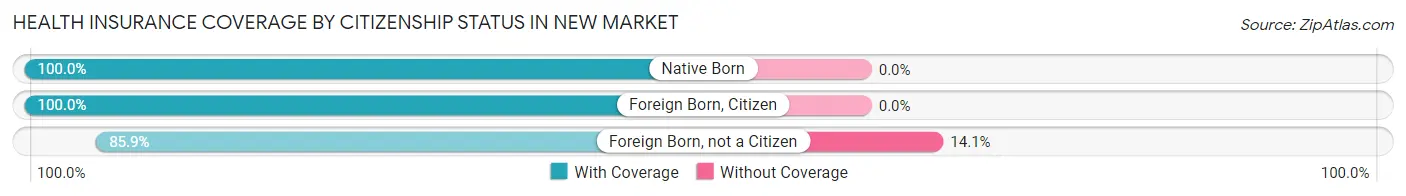
| Citizenship Status | With Coverage | Without Coverage |
| Native Born | 115 (100.0%) | 0 (0.0%) |
| Foreign Born, Citizen | 355 (100.0%) | 0 (0.0%) |
| Foreign Born, not a Citizen | 122 (85.9%) | 20 (14.1%) |
Health Insurance Coverage by Household Income in New Market
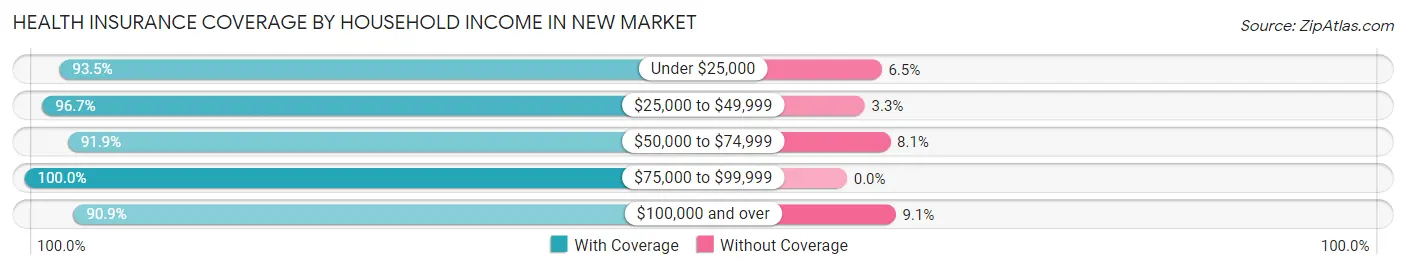
| Household Income | With Coverage | Without Coverage |
| Under $25,000 | 115 (93.5%) | 8 (6.5%) |
| $25,000 to $49,999 | 203 (96.7%) | 7 (3.3%) |
| $50,000 to $74,999 | 442 (91.9%) | 39 (8.1%) |
| $75,000 to $99,999 | 162 (100.0%) | 0 (0.0%) |
| $100,000 and over | 736 (90.9%) | 74 (9.1%) |
Public vs Private Health Insurance Coverage by Age in New Market
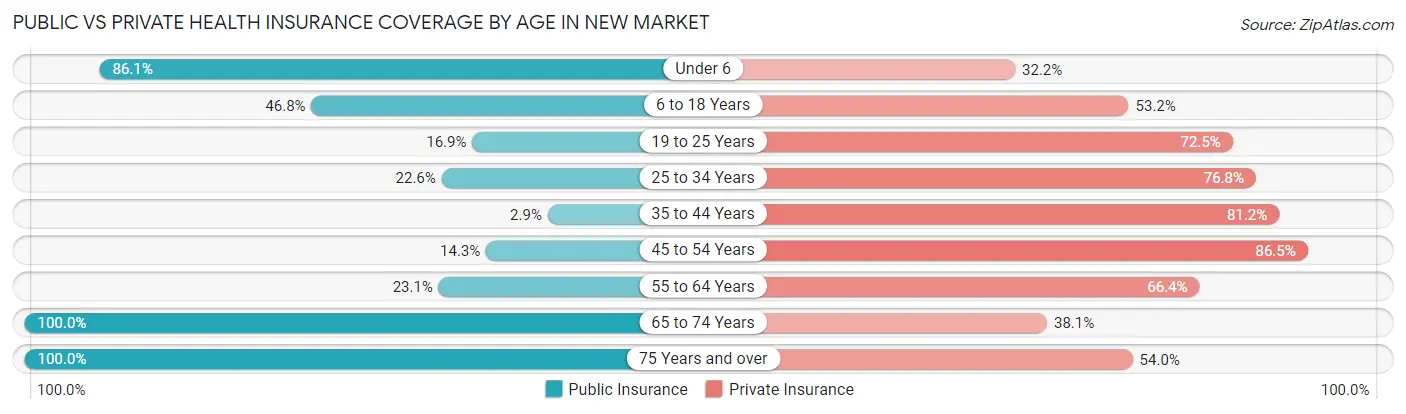
| Age Bracket | Public Insurance | Private Insurance |
| Under 6 | 99 (86.1%) | 37 (32.2%) |
| 6 to 18 Years | 166 (46.8%) | 189 (53.2%) |
| 19 to 25 Years | 24 (16.9%) | 103 (72.5%) |
| 25 to 34 Years | 40 (22.6%) | 136 (76.8%) |
| 35 to 44 Years | 6 (2.9%) | 168 (81.2%) |
| 45 to 54 Years | 36 (14.3%) | 217 (86.5%) |
| 55 to 64 Years | 53 (23.1%) | 152 (66.4%) |
| 65 to 74 Years | 147 (100.0%) | 56 (38.1%) |
| 75 Years and over | 163 (100.0%) | 88 (54.0%) |
| Total | 734 (41.1%) | 1,146 (64.2%) |
Disability Status by Sex by Age in New Market
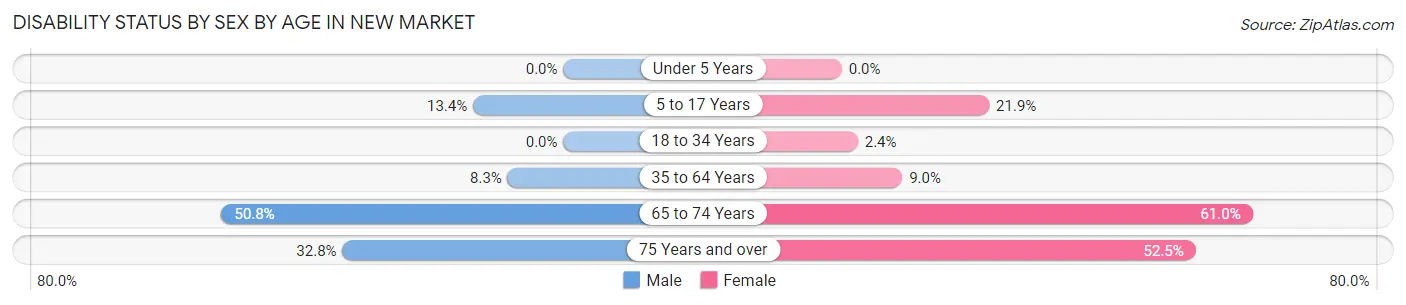
| Age Bracket | Male | Female |
| Under 5 Years | 0 (0.0%) | 0 (0.0%) |
| 5 to 17 Years | 22 (13.4%) | 42 (21.9%) |
| 18 to 34 Years | 0 (0.0%) | 4 (2.4%) |
| 35 to 64 Years | 31 (8.3%) | 28 (9.0%) |
| 65 to 74 Years | 33 (50.8%) | 50 (61.0%) |
| 75 Years and over | 21 (32.8%) | 52 (52.5%) |
Disability Class by Sex by Age in New Market
Disability Class: Hearing Difficulty
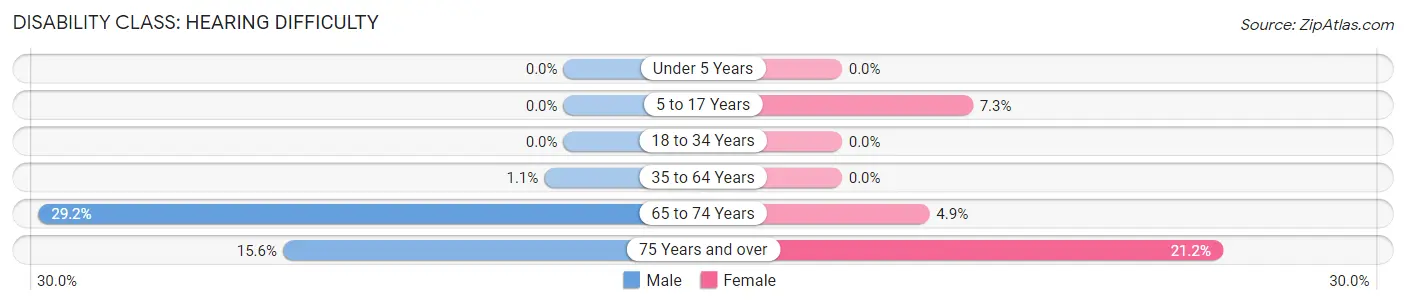
| Age Bracket | Male | Female |
| Under 5 Years | 0 (0.0%) | 0 (0.0%) |
| 5 to 17 Years | 0 (0.0%) | 14 (7.3%) |
| 18 to 34 Years | 0 (0.0%) | 0 (0.0%) |
| 35 to 64 Years | 4 (1.1%) | 0 (0.0%) |
| 65 to 74 Years | 19 (29.2%) | 4 (4.9%) |
| 75 Years and over | 10 (15.6%) | 21 (21.2%) |
Disability Class: Vision Difficulty
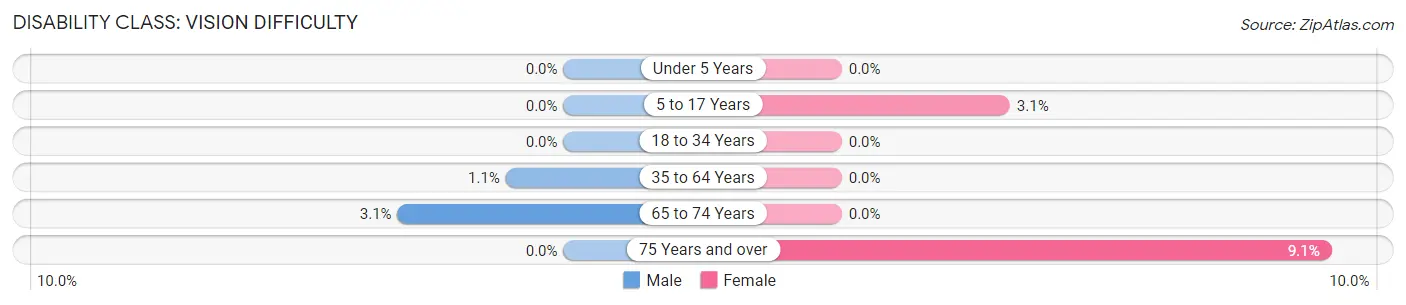
| Age Bracket | Male | Female |
| Under 5 Years | 0 (0.0%) | 0 (0.0%) |
| 5 to 17 Years | 0 (0.0%) | 6 (3.1%) |
| 18 to 34 Years | 0 (0.0%) | 0 (0.0%) |
| 35 to 64 Years | 4 (1.1%) | 0 (0.0%) |
| 65 to 74 Years | 2 (3.1%) | 0 (0.0%) |
| 75 Years and over | 0 (0.0%) | 9 (9.1%) |
Disability Class: Cognitive Difficulty
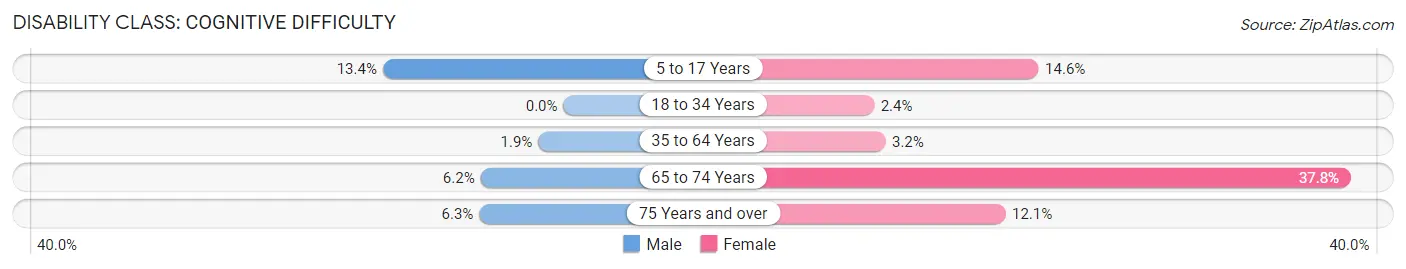
| Age Bracket | Male | Female |
| 5 to 17 Years | 22 (13.4%) | 28 (14.6%) |
| 18 to 34 Years | 0 (0.0%) | 4 (2.4%) |
| 35 to 64 Years | 7 (1.9%) | 10 (3.2%) |
| 65 to 74 Years | 4 (6.1%) | 31 (37.8%) |
| 75 Years and over | 4 (6.2%) | 12 (12.1%) |
Disability Class: Ambulatory Difficulty
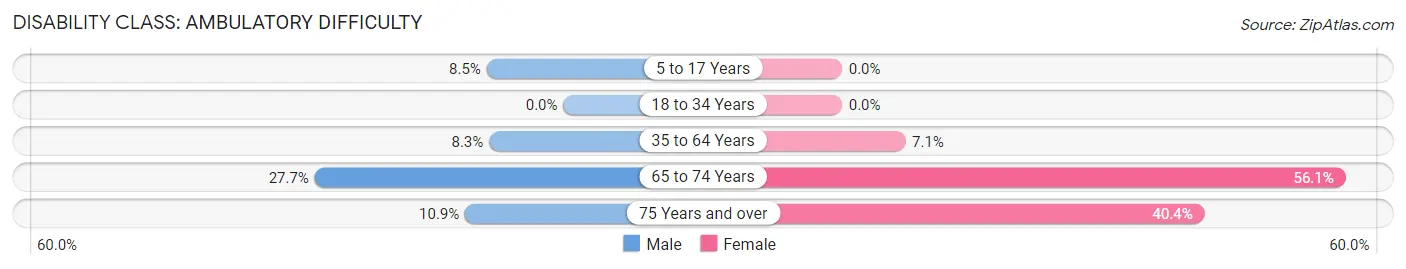
| Age Bracket | Male | Female |
| 5 to 17 Years | 14 (8.5%) | 0 (0.0%) |
| 18 to 34 Years | 0 (0.0%) | 0 (0.0%) |
| 35 to 64 Years | 31 (8.3%) | 22 (7.0%) |
| 65 to 74 Years | 18 (27.7%) | 46 (56.1%) |
| 75 Years and over | 7 (10.9%) | 40 (40.4%) |
Disability Class: Self-Care Difficulty
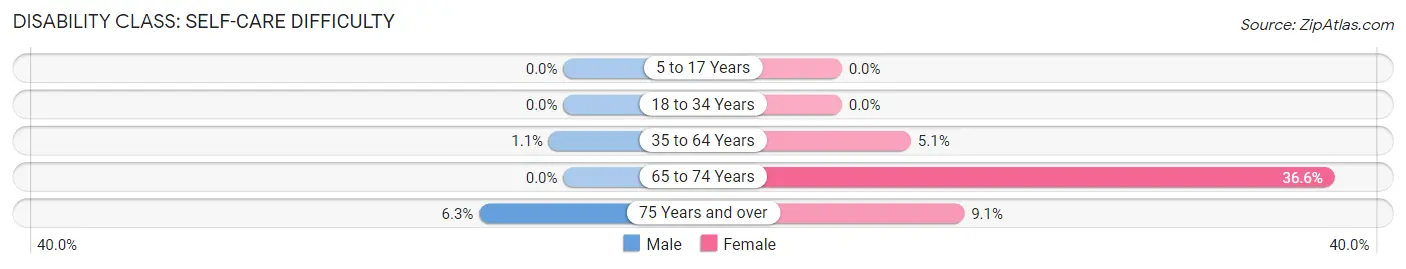
| Age Bracket | Male | Female |
| 5 to 17 Years | 0 (0.0%) | 0 (0.0%) |
| 18 to 34 Years | 0 (0.0%) | 0 (0.0%) |
| 35 to 64 Years | 4 (1.1%) | 16 (5.1%) |
| 65 to 74 Years | 0 (0.0%) | 30 (36.6%) |
| 75 Years and over | 4 (6.2%) | 9 (9.1%) |
Technology Access in New Market
Computing Device Access in New Market
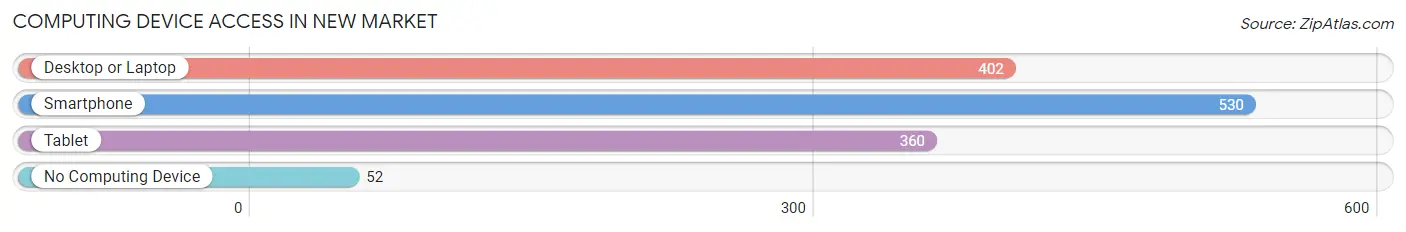
| Device Type | # Households | % Households |
| Desktop or Laptop | 402 | 66.6% |
| Smartphone | 530 | 87.7% |
| Tablet | 360 | 59.6% |
| No Computing Device | 52 | 8.6% |
| Total | 604 | 100.0% |
Internet Access in New Market
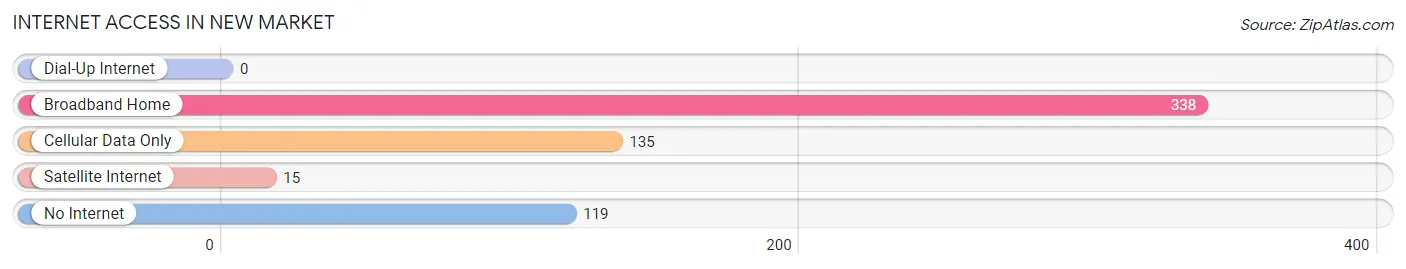
| Internet Type | # Households | % Households |
| Dial-Up Internet | 0 | 0.0% |
| Broadband Home | 338 | 56.0% |
| Cellular Data Only | 135 | 22.4% |
| Satellite Internet | 15 | 2.5% |
| No Internet | 119 | 19.7% |
| Total | 604 | 100.0% |
New Market Summary
New Market is a small town located in Jefferson County, Tennessee. It is situated in the foothills of the Great Smoky Mountains, and is part of the Knoxville metropolitan area. The town has a population of approximately 1,500 people, and is known for its rural charm and friendly atmosphere.
History
New Market was founded in 1820 by a group of settlers from North Carolina. The town was originally called “New Market Crossroads”, and was named after the nearby New Market Gap. The town was incorporated in 1836, and was the first town in Jefferson County to be incorporated.
The town was an important stop on the stagecoach route between Knoxville and Chattanooga. The stagecoach route was used by settlers traveling to the area, and by soldiers during the Civil War. During the Civil War, the town was occupied by Union forces, and was the site of a skirmish between Union and Confederate forces.
Geography
New Market is located in the foothills of the Great Smoky Mountains, and is part of the Knoxville metropolitan area. The town is situated at an elevation of 1,000 feet, and is surrounded by rolling hills and lush forests. The town is located near the French Broad River, and is close to several state parks and recreational areas.
Economy
New Market’s economy is largely based on agriculture and tourism. The town is home to several farms, and is known for its production of apples, peaches, and other fruits and vegetables. The town is also home to several small businesses, including restaurants, shops, and other services.
Tourism is an important part of the town’s economy. The town is home to several historic sites, including the New Market Gap Battlefield, which is a Civil War battlefield. The town is also home to several recreational areas, including the New Market Gap State Park.
Demographics
As of the 2010 census, the population of New Market was 1,500 people. The town is predominantly white, with approximately 95% of the population being white. The median household income in the town is $37,000, and the median age is 44. The town has a low unemployment rate, and the poverty rate is below the national average.
New Market is a small town with a rich history and a friendly atmosphere. The town is home to several farms and businesses, and is a popular destination for tourists. The town is also home to several historic sites, and is close to several state parks and recreational areas. The town has a population of approximately 1,500 people, and is known for its rural charm and friendly atmosphere.
Common Questions
What is Per Capita Income in New Market?
Per Capita income in New Market is $29,120.
What is the Median Family Income in New Market?
Median Family Income in New Market is $74,097.
What is the Median Household income in New Market?
Median Household Income in New Market is $66,324.
What is Income or Wage Gap in New Market?
Income or Wage Gap in New Market is 28.7%.
Women in New Market earn 71.3 cents for every dollar earned by a man.
What is Inequality or Gini Index in New Market?
Inequality or Gini Index in New Market is 0.35.
What is the Total Population of New Market?
Total Population of New Market is 1,786.
What is the Total Male Population of New Market?
Total Male Population of New Market is 887.
What is the Total Female Population of New Market?
Total Female Population of New Market is 899.
What is the Ratio of Males per 100 Females in New Market?
There are 98.67 Males per 100 Females in New Market.
What is the Ratio of Females per 100 Males in New Market?
There are 101.35 Females per 100 Males in New Market.
What is the Median Population Age in New Market?
Median Population Age in New Market is 41.4 Years.
What is the Average Family Size in New Market
Average Family Size in New Market is 3.5 People.
What is the Average Household Size in New Market
Average Household Size in New Market is 3.0 People.
How Large is the Labor Force in New Market?
There are 958 People in the Labor Forcein in New Market.
What is the Percentage of People in the Labor Force in New Market?
67.9% of People are in the Labor Force in New Market.
What is the Unemployment Rate in New Market?
Unemployment Rate in New Market is 2.5%.