Henderson, TN Map & Demographics
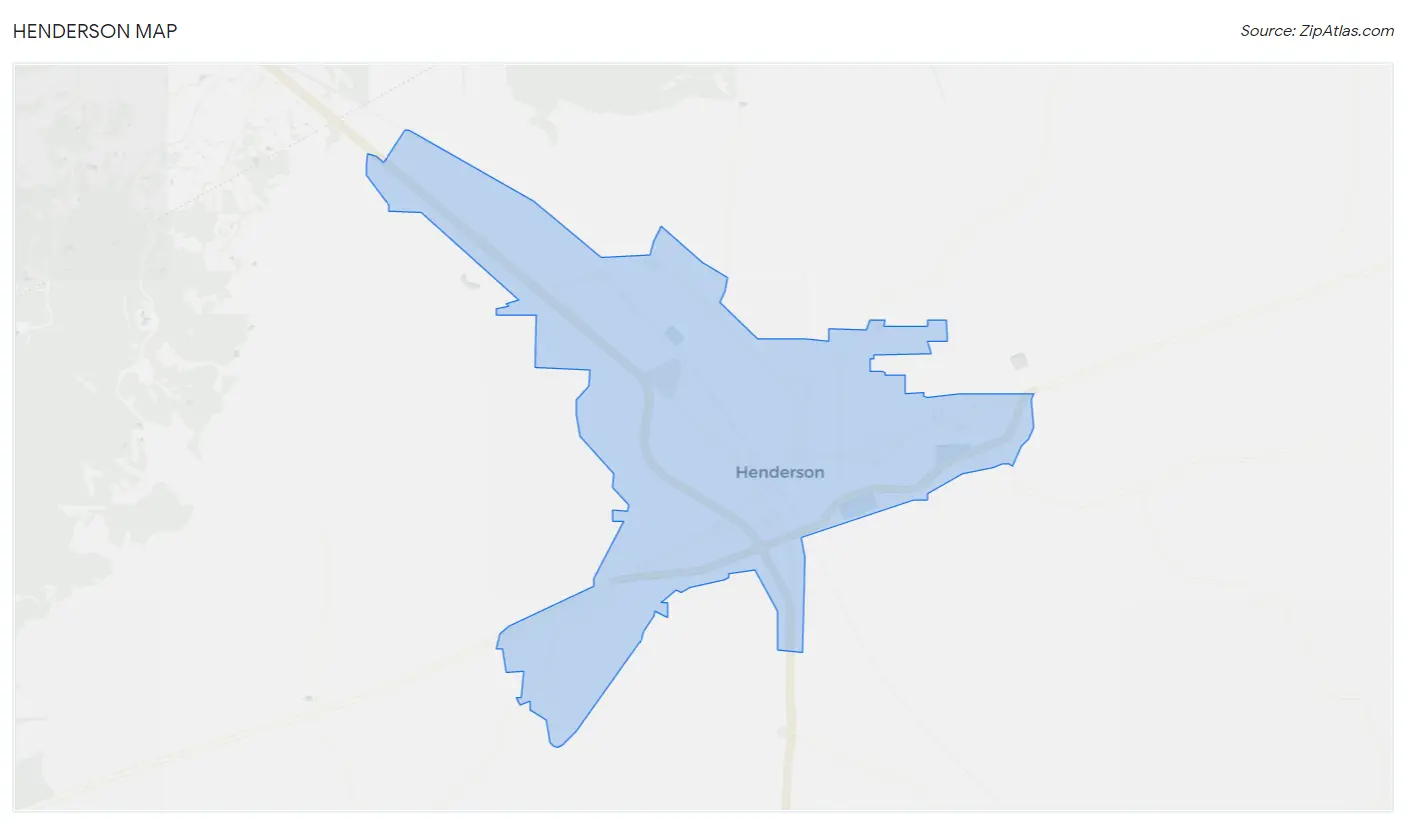
Henderson Map
Henderson Overview
$17,896
PER CAPITA INCOME
$56,061
AVG FAMILY INCOME
$44,077
AVG HOUSEHOLD INCOME
72.6%
WAGE / INCOME GAP [ % ]
27.4¢/ $1
WAGE / INCOME GAP [ $ ]
0.42
INEQUALITY / GINI INDEX
6,326
TOTAL POPULATION
3,019
MALE POPULATION
3,307
FEMALE POPULATION
91.29
MALES / 100 FEMALES
109.54
FEMALES / 100 MALES
26.8
MEDIAN AGE
3.2
AVG FAMILY SIZE
2.6
AVG HOUSEHOLD SIZE
2,264
LABOR FORCE [ PEOPLE ]
45.0%
PERCENT IN LABOR FORCE
3.7%
UNEMPLOYMENT RATE
Henderson Zip Codes
Henderson Area Codes
Income in Henderson
Income Overview in Henderson
Per Capita Income in Henderson is $17,896, while median incomes of families and households are $56,061 and $44,077 respectively.
| Characteristic | Number | Measure |
| Per Capita Income | 6,326 | $17,896 |
| Median Family Income | 1,232 | $56,061 |
| Mean Family Income | 1,232 | $64,334 |
| Median Household Income | 1,915 | $44,077 |
| Mean Household Income | 1,915 | $55,107 |
| Income Deficit | 1,232 | $0 |
| Wage / Income Gap (%) | 6,326 | 72.56% |
| Wage / Income Gap ($) | 6,326 | 27.44¢ per $1 |
| Gini / Inequality Index | 6,326 | 0.42 |
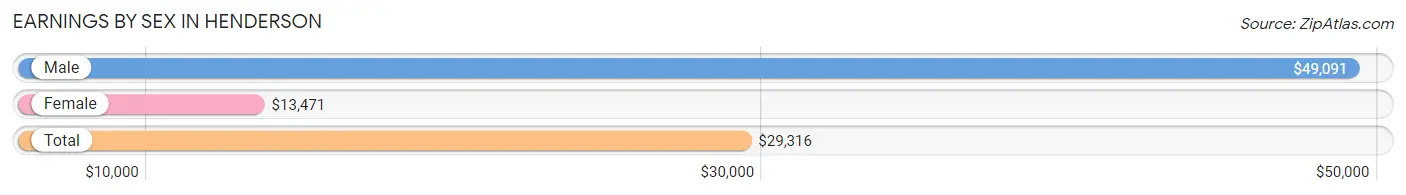
Earnings by Sex in Henderson
Average Earnings in Henderson are $29,316, $49,091 for men and $13,471 for women, a difference of 72.6%.
| Sex | Number | Average Earnings |
| Male | 1,092 (44.1%) | $49,091 |
| Female | 1,387 (55.9%) | $13,471 |
| Total | 2,479 (100.0%) | $29,316 |
Earnings by Sex by Income Bracket in Henderson
The most common earnings brackets in Henderson are $65,000 to $74,999 for men (167 | 15.3%) and $2,499 or less for women (185 | 13.3%).
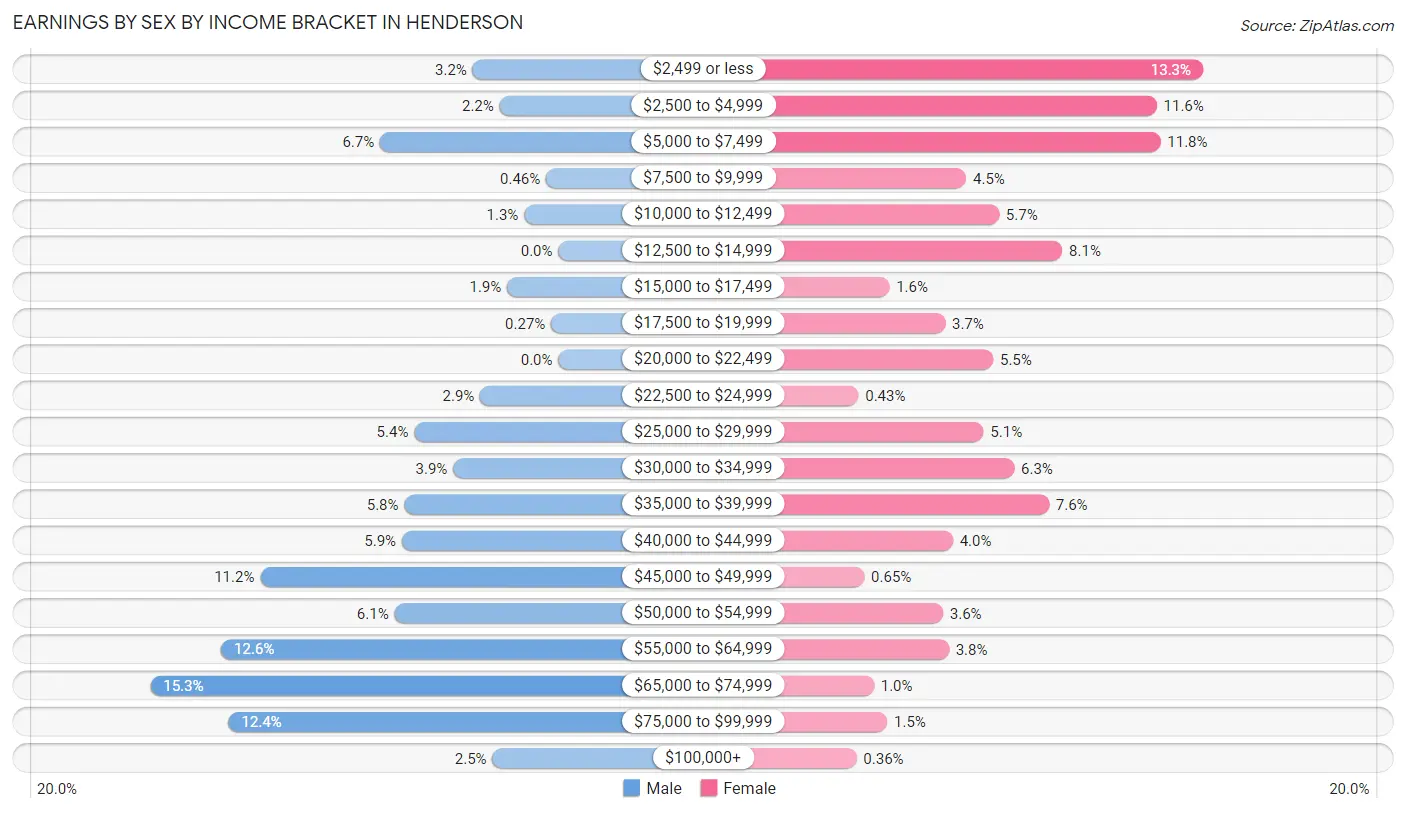
| Income | Male | Female |
| $2,499 or less | 35 (3.2%) | 185 (13.3%) |
| $2,500 to $4,999 | 24 (2.2%) | 161 (11.6%) |
| $5,000 to $7,499 | 73 (6.7%) | 163 (11.7%) |
| $7,500 to $9,999 | 5 (0.5%) | 62 (4.5%) |
| $10,000 to $12,499 | 14 (1.3%) | 79 (5.7%) |
| $12,500 to $14,999 | 0 (0.0%) | 112 (8.1%) |
| $15,000 to $17,499 | 21 (1.9%) | 22 (1.6%) |
| $17,500 to $19,999 | 3 (0.3%) | 51 (3.7%) |
| $20,000 to $22,499 | 0 (0.0%) | 76 (5.5%) |
| $22,500 to $24,999 | 32 (2.9%) | 6 (0.4%) |
| $25,000 to $29,999 | 59 (5.4%) | 71 (5.1%) |
| $30,000 to $34,999 | 43 (3.9%) | 87 (6.3%) |
| $35,000 to $39,999 | 63 (5.8%) | 105 (7.6%) |
| $40,000 to $44,999 | 64 (5.9%) | 55 (4.0%) |
| $45,000 to $49,999 | 122 (11.2%) | 9 (0.6%) |
| $50,000 to $54,999 | 67 (6.1%) | 50 (3.6%) |
| $55,000 to $64,999 | 138 (12.6%) | 53 (3.8%) |
| $65,000 to $74,999 | 167 (15.3%) | 14 (1.0%) |
| $75,000 to $99,999 | 135 (12.4%) | 21 (1.5%) |
| $100,000+ | 27 (2.5%) | 5 (0.4%) |
| Total | 1,092 (100.0%) | 1,387 (100.0%) |
Earnings by Sex by Educational Attainment in Henderson
Average earnings in Henderson are $53,375 for men and $26,466 for women, a difference of 50.4%. Men with an educational attainment of college or associate's degree enjoy the highest average annual earnings of $70,276, while those with graduate degree education earn the least with $47,344. Women with an educational attainment of graduate degree earn the most with the average annual earnings of $50,182, while those with high school diploma education have the smallest earnings of $18,676.
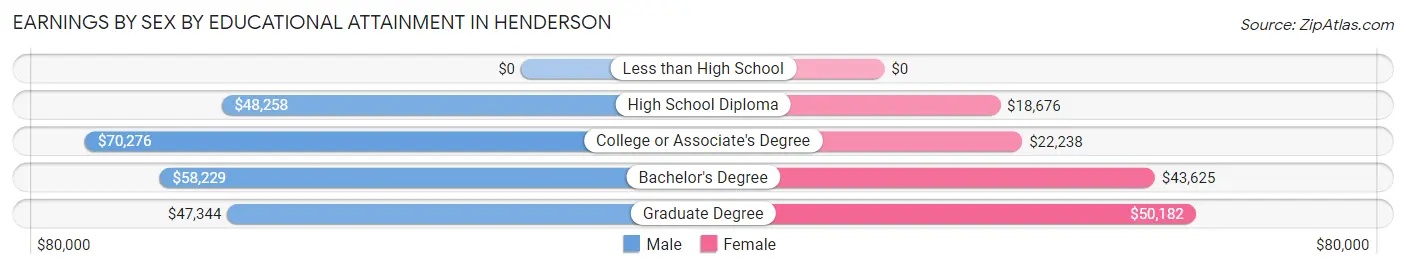
| Educational Attainment | Male Income | Female Income |
| Less than High School | - | - |
| High School Diploma | $48,258 | $18,676 |
| College or Associate's Degree | $70,276 | $22,238 |
| Bachelor's Degree | $58,229 | $43,625 |
| Graduate Degree | $47,344 | $50,182 |
| Total | $53,375 | $26,466 |
Family Income in Henderson
Family Income Brackets in Henderson
According to the Henderson family income data, there are 269 families falling into the $50,000 to $74,999 income range, which is the most common income bracket and makes up 21.8% of all families. Conversely, the $10,000 to $14,999 income bracket is the least frequent group with only 20 families (1.6%) belonging to this category.
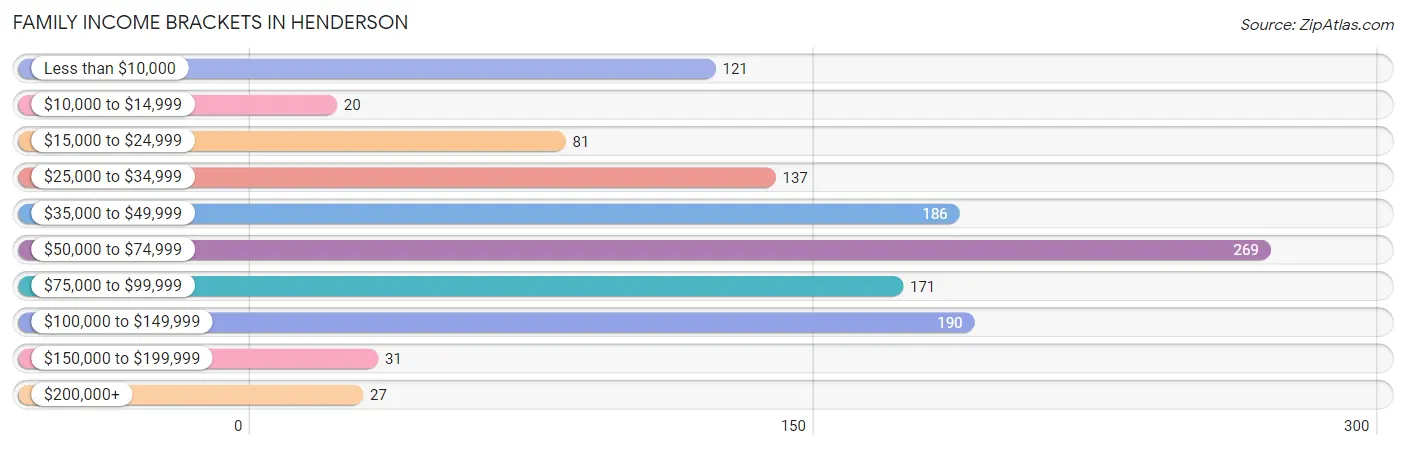
| Income Bracket | # Families | % Families |
| Less than $10,000 | 121 | 9.8% |
| $10,000 to $14,999 | 20 | 1.6% |
| $15,000 to $24,999 | 81 | 6.6% |
| $25,000 to $34,999 | 137 | 11.1% |
| $35,000 to $49,999 | 186 | 15.1% |
| $50,000 to $74,999 | 269 | 21.8% |
| $75,000 to $99,999 | 171 | 13.9% |
| $100,000 to $149,999 | 190 | 15.4% |
| $150,000 to $199,999 | 31 | 2.5% |
| $200,000+ | 27 | 2.2% |
Family Income by Famaliy Size in Henderson
4-person families (277 | 22.5%) account for the highest median family income in Henderson with $71,607 per family, while 2-person families (420 | 34.1%) have the highest median income of $30,625 per family member.
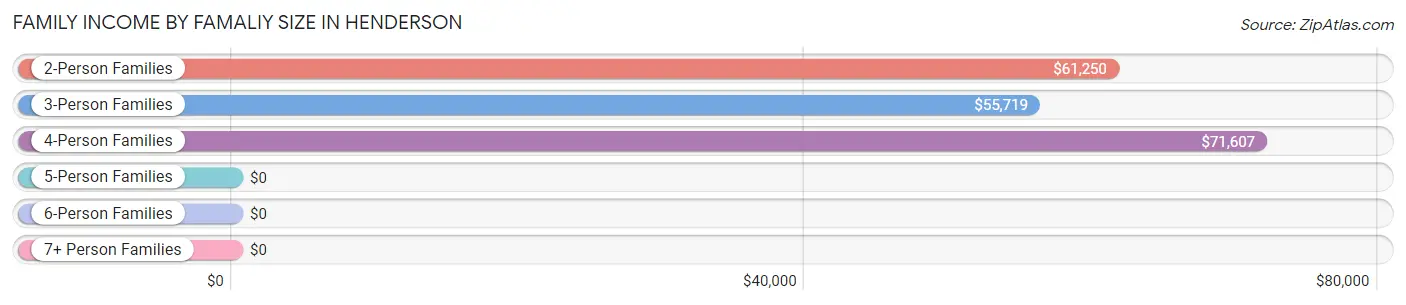
| Income Bracket | # Families | Median Income |
| 2-Person Families | 420 (34.1%) | $61,250 |
| 3-Person Families | 383 (31.1%) | $55,719 |
| 4-Person Families | 277 (22.5%) | $71,607 |
| 5-Person Families | 150 (12.2%) | $0 |
| 6-Person Families | 0 (0.0%) | $0 |
| 7+ Person Families | 2 (0.2%) | $0 |
| Total | 1,232 (100.0%) | $56,061 |
Family Income by Number of Earners in Henderson
The median family income in Henderson is $56,061, with families comprising 3+ earners (56) having the highest median family income of $120,313, while families with no earners (215) have the lowest median family income of $24,046, accounting for 4.5% and 17.4% of families, respectively.
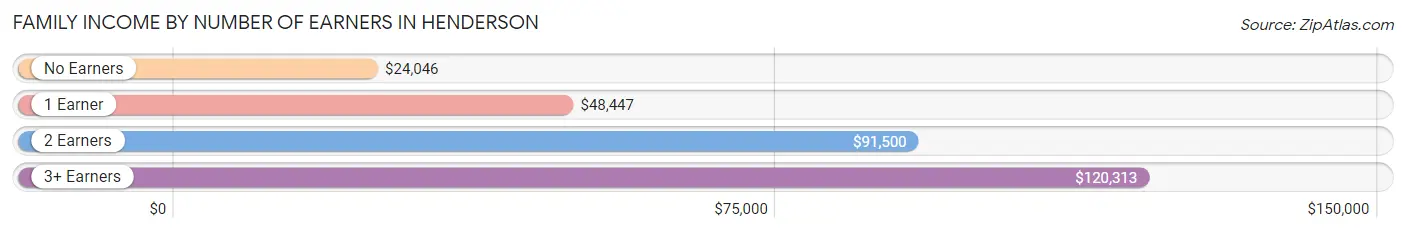
| Number of Earners | # Families | Median Income |
| No Earners | 215 (17.4%) | $24,046 |
| 1 Earner | 575 (46.7%) | $48,447 |
| 2 Earners | 386 (31.3%) | $91,500 |
| 3+ Earners | 56 (4.5%) | $120,313 |
| Total | 1,232 (100.0%) | $56,061 |
Household Income in Henderson
Household Income Brackets in Henderson
With 435 households falling in the category, the $50,000 to $74,999 income range is the most frequent in Henderson, accounting for 22.7% of all households. In contrast, only 27 households (1.4%) fall into the $200,000+ income bracket, making it the least populous group.
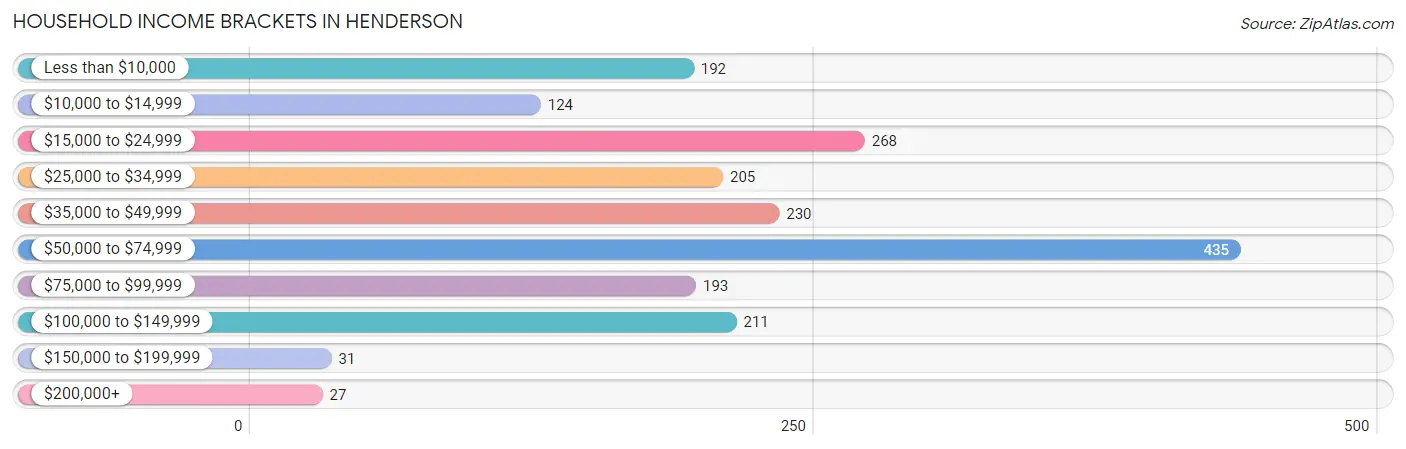
| Income Bracket | # Households | % Households |
| Less than $10,000 | 192 | 10.0% |
| $10,000 to $14,999 | 124 | 6.5% |
| $15,000 to $24,999 | 268 | 14.0% |
| $25,000 to $34,999 | 205 | 10.7% |
| $35,000 to $49,999 | 230 | 12.0% |
| $50,000 to $74,999 | 435 | 22.7% |
| $75,000 to $99,999 | 193 | 10.1% |
| $100,000 to $149,999 | 211 | 11.0% |
| $150,000 to $199,999 | 31 | 1.6% |
| $200,000+ | 27 | 1.4% |
Household Income by Householder Age in Henderson
The median household income in Henderson is $44,077, with the highest median household income of $68,185 found in the 45 to 64 years age bracket for the primary householder. A total of 644 households (33.6%) fall into this category. Meanwhile, the 15 to 24 years age bracket for the primary householder has the lowest median household income of $0, with 39 households (2.0%) in this group.
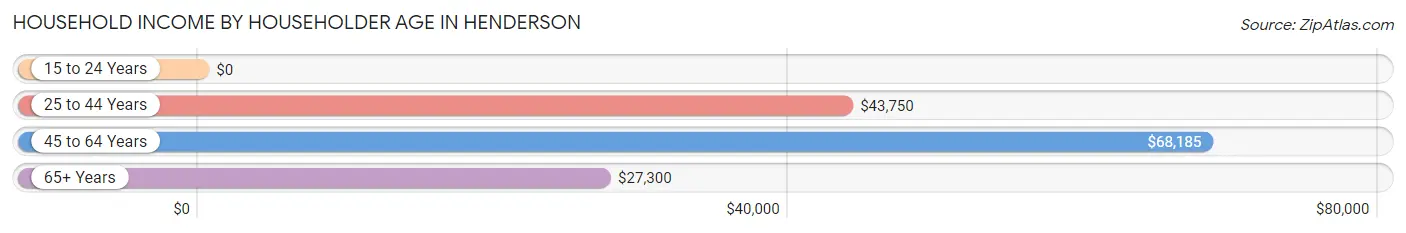
| Income Bracket | # Households | Median Income |
| 15 to 24 Years | 39 (2.0%) | $0 |
| 25 to 44 Years | 722 (37.7%) | $43,750 |
| 45 to 64 Years | 644 (33.6%) | $68,185 |
| 65+ Years | 510 (26.6%) | $27,300 |
| Total | 1,915 (100.0%) | $44,077 |
Poverty in Henderson
Income Below Poverty by Sex and Age in Henderson
With 20.5% poverty level for males and 25.9% for females among the residents of Henderson, 15 year old males and 15 year old females are the most vulnerable to poverty, with 24 males (82.8%) and 7 females (70.0%) in their respective age groups living below the poverty level.
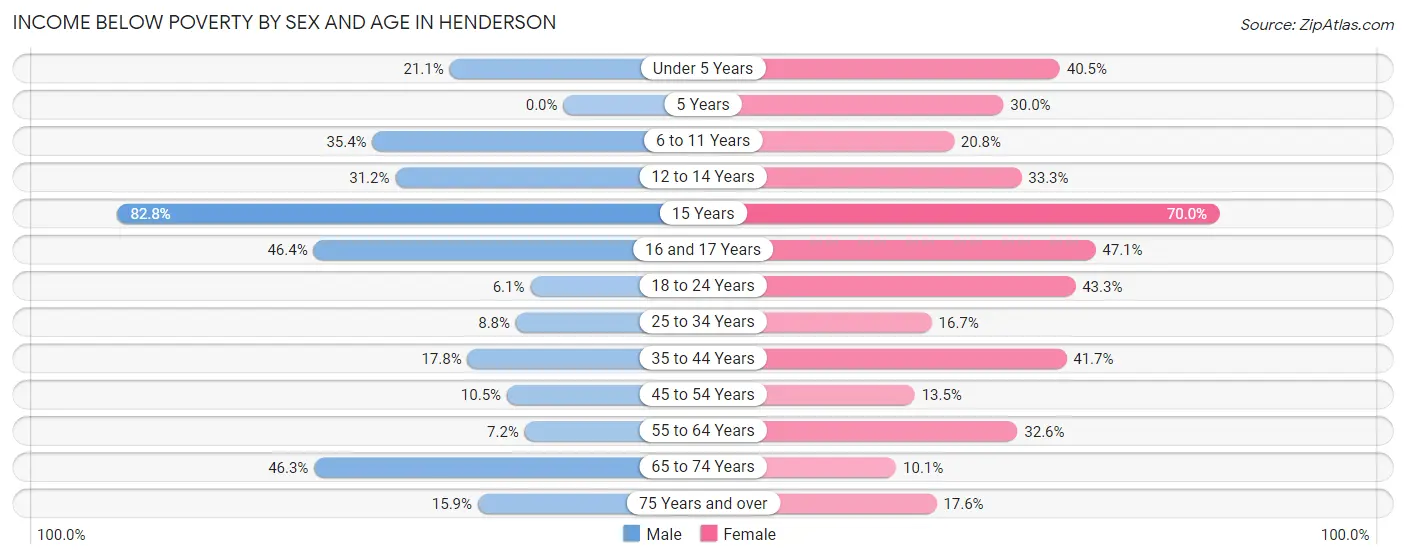
| Age Bracket | Male | Female |
| Under 5 Years | 34 (21.1%) | 70 (40.5%) |
| 5 Years | 0 (0.0%) | 6 (30.0%) |
| 6 to 11 Years | 107 (35.4%) | 57 (20.8%) |
| 12 to 14 Years | 34 (31.2%) | 34 (33.3%) |
| 15 Years | 24 (82.8%) | 7 (70.0%) |
| 16 and 17 Years | 32 (46.4%) | 40 (47.1%) |
| 18 to 24 Years | 13 (6.1%) | 104 (43.3%) |
| 25 to 34 Years | 38 (8.8%) | 66 (16.7%) |
| 35 to 44 Years | 37 (17.8%) | 130 (41.7%) |
| 45 to 54 Years | 35 (10.5%) | 51 (13.5%) |
| 55 to 64 Years | 13 (7.2%) | 44 (32.6%) |
| 65 to 74 Years | 111 (46.3%) | 25 (10.1%) |
| 75 Years and over | 10 (15.9%) | 39 (17.6%) |
| Total | 488 (20.5%) | 673 (25.9%) |
Income Above Poverty by Sex and Age in Henderson
According to the poverty statistics in Henderson, males aged 5 years and females aged 65 to 74 years are the age groups that are most secure financially, with 100.0% of males and 89.9% of females in these age groups living above the poverty line.
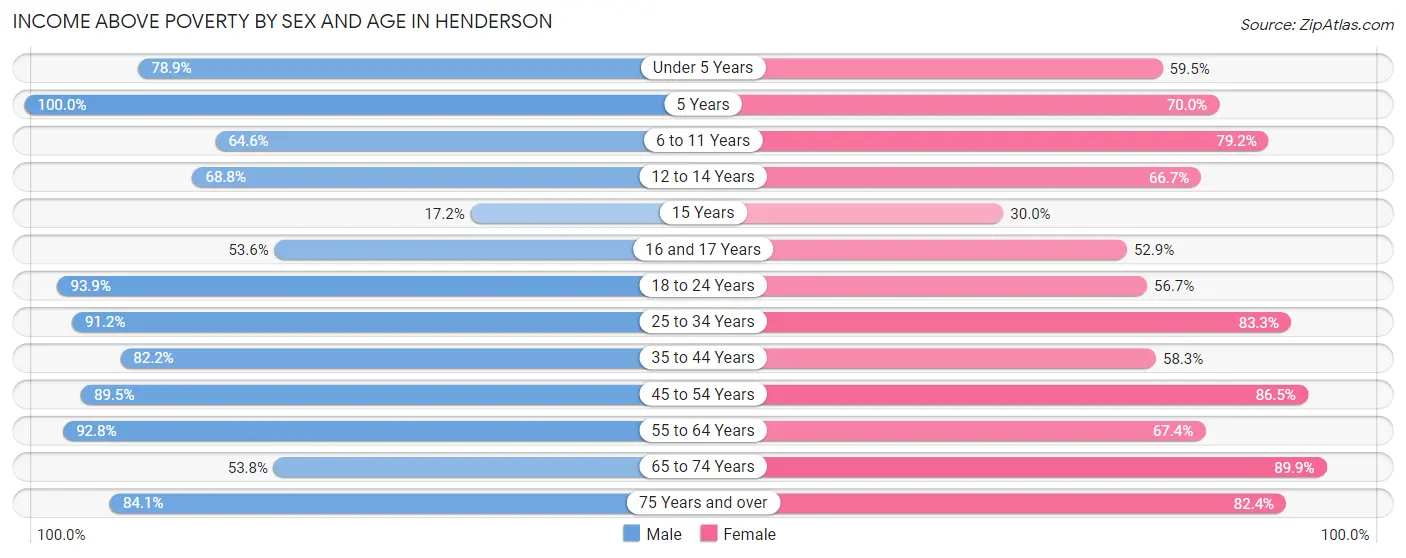
| Age Bracket | Male | Female |
| Under 5 Years | 127 (78.9%) | 103 (59.5%) |
| 5 Years | 41 (100.0%) | 14 (70.0%) |
| 6 to 11 Years | 195 (64.6%) | 217 (79.2%) |
| 12 to 14 Years | 75 (68.8%) | 68 (66.7%) |
| 15 Years | 5 (17.2%) | 3 (30.0%) |
| 16 and 17 Years | 37 (53.6%) | 45 (52.9%) |
| 18 to 24 Years | 199 (93.9%) | 136 (56.7%) |
| 25 to 34 Years | 393 (91.2%) | 330 (83.3%) |
| 35 to 44 Years | 171 (82.2%) | 182 (58.3%) |
| 45 to 54 Years | 299 (89.5%) | 326 (86.5%) |
| 55 to 64 Years | 168 (92.8%) | 91 (67.4%) |
| 65 to 74 Years | 129 (53.7%) | 223 (89.9%) |
| 75 Years and over | 53 (84.1%) | 183 (82.4%) |
| Total | 1,892 (79.5%) | 1,921 (74.1%) |
Income Below Poverty Among Married-Couple Families in Henderson
The poverty statistics for married-couple families in Henderson show that 10.3% or 71 of the total 692 families live below the poverty line. Families with 1 or 2 children have the highest poverty rate of 25.4%, comprising of 60 families. On the other hand, families with no children have the lowest poverty rate of 0.0%, which includes 0 families.
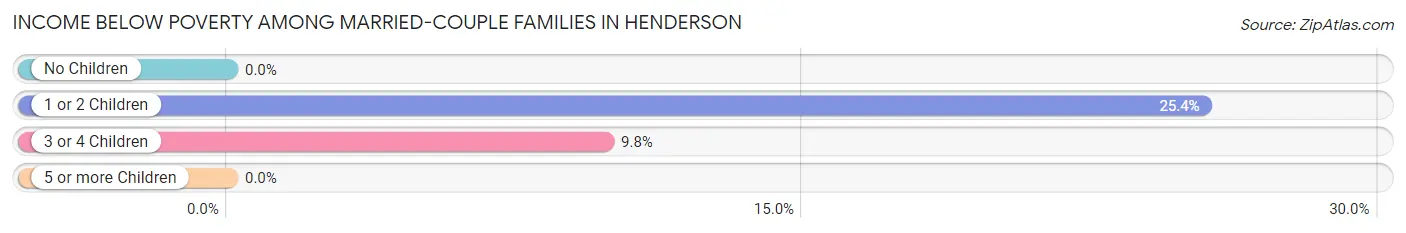
| Children | Above Poverty | Below Poverty |
| No Children | 342 (100.0%) | 0 (0.0%) |
| 1 or 2 Children | 176 (74.6%) | 60 (25.4%) |
| 3 or 4 Children | 101 (90.2%) | 11 (9.8%) |
| 5 or more Children | 2 (100.0%) | 0 (0.0%) |
| Total | 621 (89.7%) | 71 (10.3%) |
Income Below Poverty Among Single-Parent Households in Henderson
According to the poverty data in Henderson, 5.9% or 11 single-father households and 42.8% or 152 single-mother households are living below the poverty line. Among single-father households, those with 1 or 2 children have the highest poverty rate, with 11 households (6.7%) experiencing poverty. Likewise, among single-mother households, those with 3 or 4 children have the highest poverty rate, with 34 households (100.0%) falling below the poverty line.
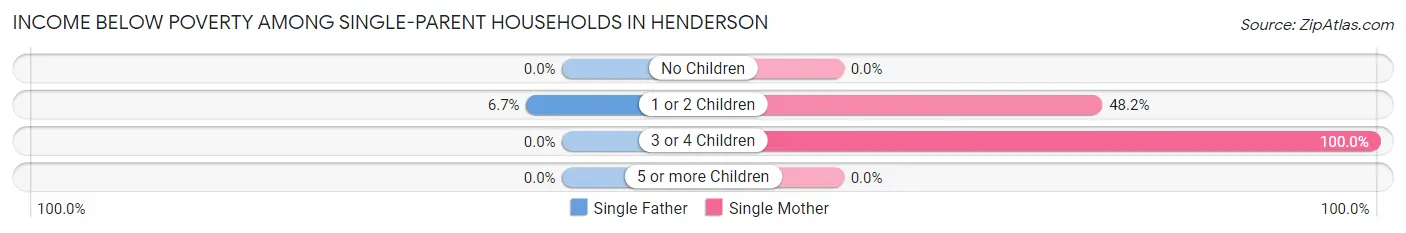
| Children | Single Father | Single Mother |
| No Children | 0 (0.0%) | 0 (0.0%) |
| 1 or 2 Children | 11 (6.7%) | 118 (48.2%) |
| 3 or 4 Children | 0 (0.0%) | 34 (100.0%) |
| 5 or more Children | 0 (0.0%) | 0 (0.0%) |
| Total | 11 (5.9%) | 152 (42.8%) |
Income Below Poverty Among Married-Couple vs Single-Parent Households in Henderson
The poverty data for Henderson shows that 71 of the married-couple family households (10.3%) and 163 of the single-parent households (30.2%) are living below the poverty level. Within the married-couple family households, those with 1 or 2 children have the highest poverty rate, with 60 households (25.4%) falling below the poverty line. Among the single-parent households, those with 3 or 4 children have the highest poverty rate, with 34 household (69.4%) living below poverty.
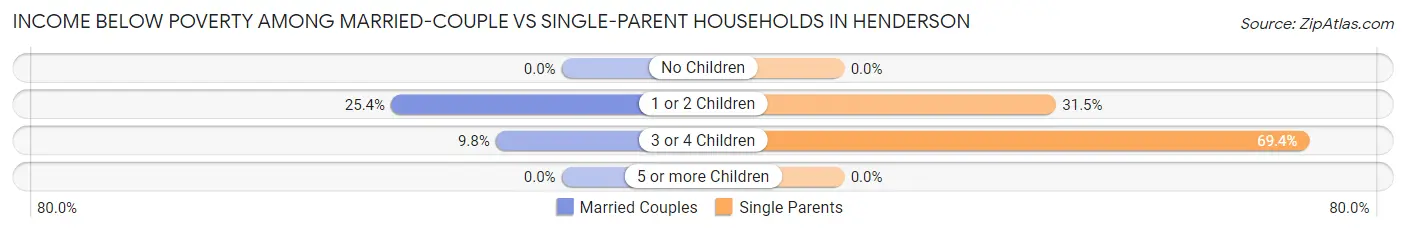
| Children | Married-Couple Families | Single-Parent Households |
| No Children | 0 (0.0%) | 0 (0.0%) |
| 1 or 2 Children | 60 (25.4%) | 129 (31.5%) |
| 3 or 4 Children | 11 (9.8%) | 34 (69.4%) |
| 5 or more Children | 0 (0.0%) | 0 (0.0%) |
| Total | 71 (10.3%) | 163 (30.2%) |
Race in Henderson
The most populous races in Henderson are White / Caucasian (4,642 | 73.4%), Black / African American (1,388 | 21.9%), and Hispanic or Latino (386 | 6.1%).
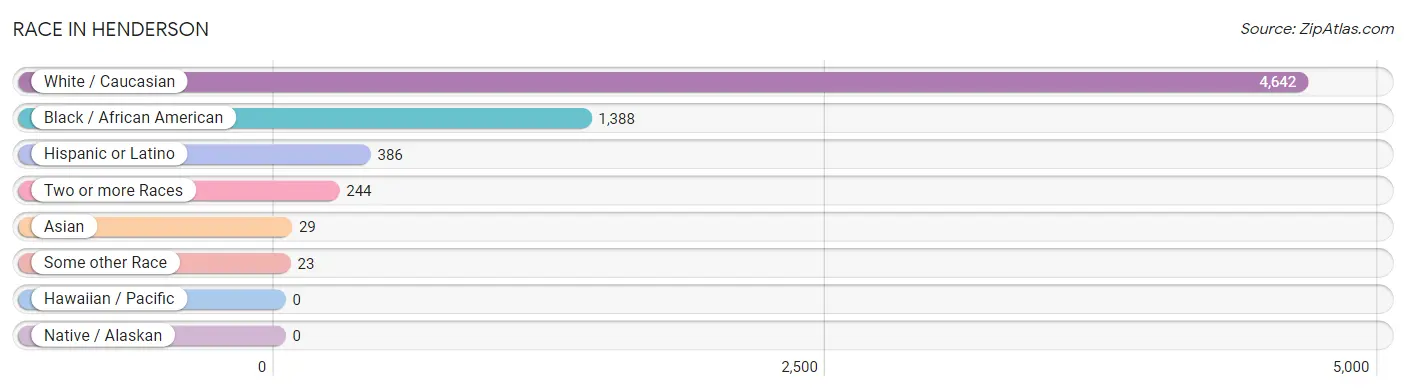
| Race | # Population | % Population |
| Asian | 29 | 0.5% |
| Black / African American | 1,388 | 21.9% |
| Hawaiian / Pacific | 0 | 0.0% |
| Hispanic or Latino | 386 | 6.1% |
| Native / Alaskan | 0 | 0.0% |
| White / Caucasian | 4,642 | 73.4% |
| Two or more Races | 244 | 3.9% |
| Some other Race | 23 | 0.4% |
| Total | 6,326 | 100.0% |
Ancestry in Henderson
The most populous ancestries reported in Henderson are Irish (946 | 14.9%), African (888 | 14.0%), Subsaharan African (888 | 14.0%), English (765 | 12.1%), and German (396 | 6.3%), together accounting for 61.4% of all Henderson residents.
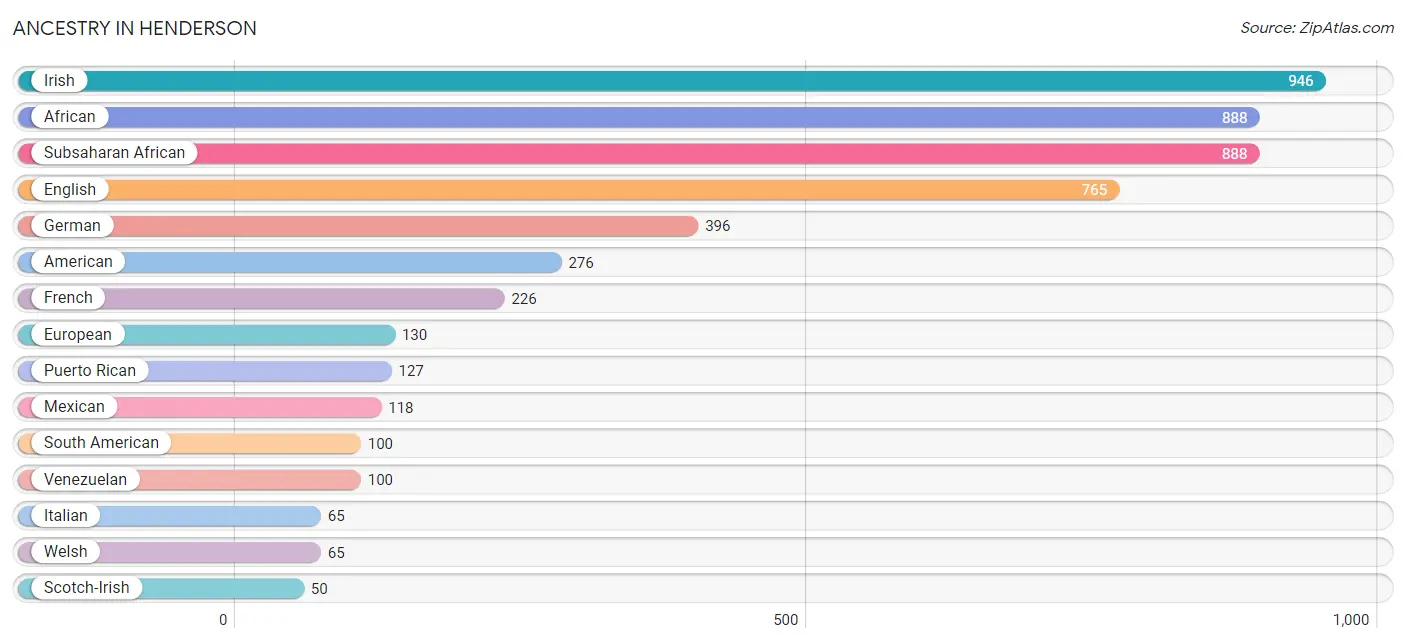
| Ancestry | # Population | % Population |
| African | 888 | 14.0% |
| American | 276 | 4.4% |
| Austrian | 8 | 0.1% |
| British | 4 | 0.1% |
| Burmese | 10 | 0.2% |
| Central American | 33 | 0.5% |
| Danish | 29 | 0.5% |
| Dutch | 9 | 0.1% |
| English | 765 | 12.1% |
| European | 130 | 2.1% |
| French | 226 | 3.6% |
| German | 396 | 6.3% |
| Honduran | 33 | 0.5% |
| Hungarian | 7 | 0.1% |
| Indian (Asian) | 3 | 0.1% |
| Irish | 946 | 14.9% |
| Italian | 65 | 1.0% |
| Korean | 17 | 0.3% |
| Mexican | 118 | 1.9% |
| Norwegian | 9 | 0.1% |
| Pakistani | 11 | 0.2% |
| Puerto Rican | 127 | 2.0% |
| Scotch-Irish | 50 | 0.8% |
| Scottish | 50 | 0.8% |
| South American | 100 | 1.6% |
| Subsaharan African | 888 | 14.0% |
| Swedish | 8 | 0.1% |
| Venezuelan | 100 | 1.6% |
| Welsh | 65 | 1.0% | View All 29 Rows |
Immigrants in Henderson
The most numerous immigrant groups reported in Henderson came from Latin America (133 | 2.1%), South America (100 | 1.6%), Venezuela (100 | 1.6%), Central America (33 | 0.5%), and Honduras (33 | 0.5%), together accounting for 6.3% of all Henderson residents.
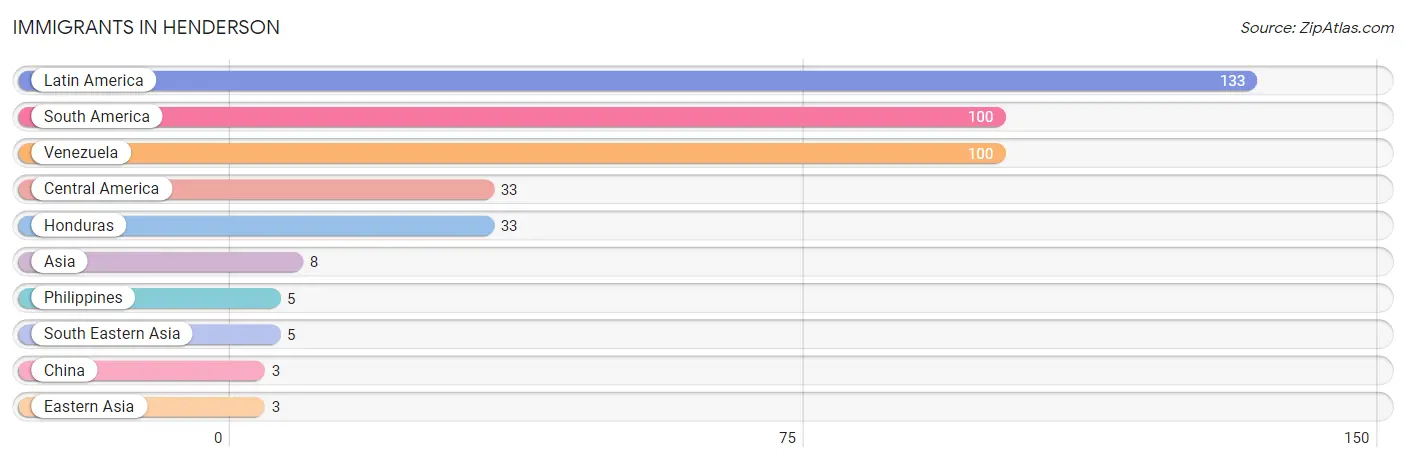
| Immigration Origin | # Population | % Population |
| Asia | 8 | 0.1% |
| Central America | 33 | 0.5% |
| China | 3 | 0.1% |
| Eastern Asia | 3 | 0.1% |
| Honduras | 33 | 0.5% |
| Latin America | 133 | 2.1% |
| Philippines | 5 | 0.1% |
| South America | 100 | 1.6% |
| South Eastern Asia | 5 | 0.1% |
| Venezuela | 100 | 1.6% | View All 10 Rows |
Sex and Age in Henderson
Sex and Age in Henderson
The most populous age groups in Henderson are 20 to 24 Years (477 | 15.8%) for men and 20 to 24 Years (607 | 18.4%) for women.
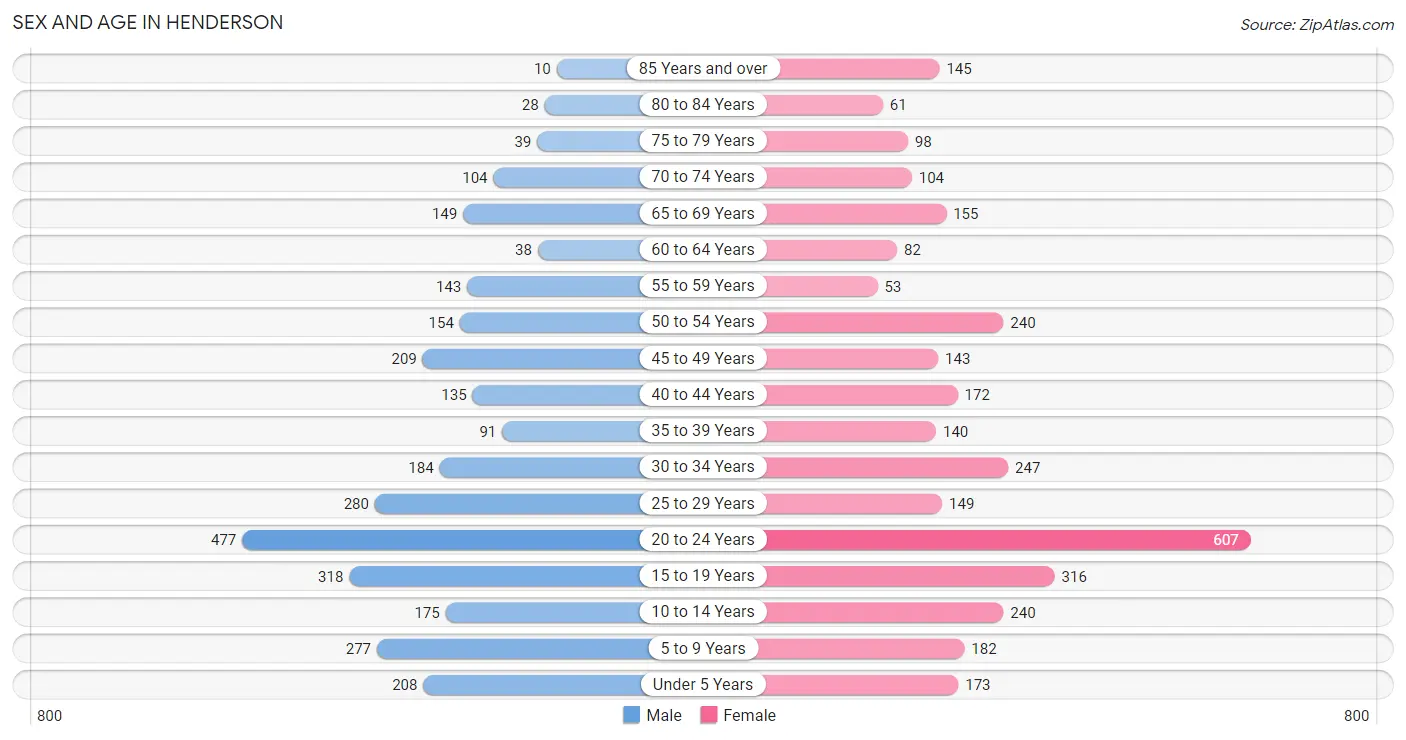
| Age Bracket | Male | Female |
| Under 5 Years | 208 (6.9%) | 173 (5.2%) |
| 5 to 9 Years | 277 (9.2%) | 182 (5.5%) |
| 10 to 14 Years | 175 (5.8%) | 240 (7.3%) |
| 15 to 19 Years | 318 (10.5%) | 316 (9.6%) |
| 20 to 24 Years | 477 (15.8%) | 607 (18.4%) |
| 25 to 29 Years | 280 (9.3%) | 149 (4.5%) |
| 30 to 34 Years | 184 (6.1%) | 247 (7.5%) |
| 35 to 39 Years | 91 (3.0%) | 140 (4.2%) |
| 40 to 44 Years | 135 (4.5%) | 172 (5.2%) |
| 45 to 49 Years | 209 (6.9%) | 143 (4.3%) |
| 50 to 54 Years | 154 (5.1%) | 240 (7.3%) |
| 55 to 59 Years | 143 (4.7%) | 53 (1.6%) |
| 60 to 64 Years | 38 (1.3%) | 82 (2.5%) |
| 65 to 69 Years | 149 (4.9%) | 155 (4.7%) |
| 70 to 74 Years | 104 (3.4%) | 104 (3.1%) |
| 75 to 79 Years | 39 (1.3%) | 98 (3.0%) |
| 80 to 84 Years | 28 (0.9%) | 61 (1.8%) |
| 85 Years and over | 10 (0.3%) | 145 (4.4%) |
| Total | 3,019 (100.0%) | 3,307 (100.0%) |
Families and Households in Henderson
Median Family Size in Henderson
The median family size in Henderson is 3.20 persons per family, with married-couple families (692 | 56.2%) accounting for the largest median family size of 3.4 persons per family. On the other hand, single male/father families (185 | 15.0%) represent the smallest median family size with 2.39 persons per family.
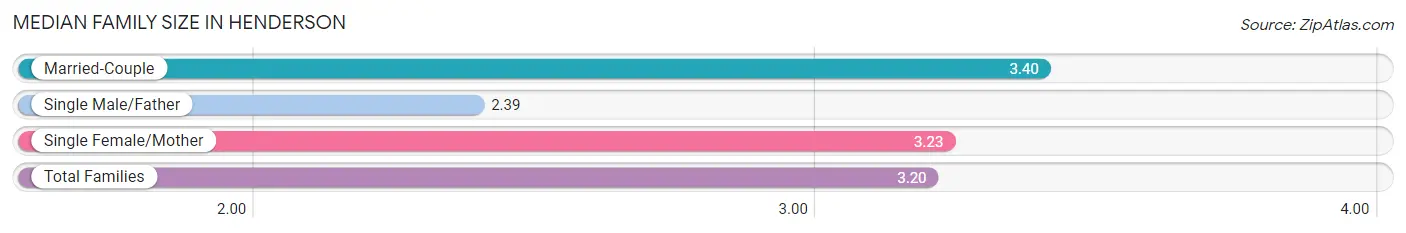
| Family Type | # Families | Family Size |
| Married-Couple | 692 (56.2%) | 3.40 |
| Single Male/Father | 185 (15.0%) | 2.39 |
| Single Female/Mother | 355 (28.8%) | 3.23 |
| Total Families | 1,232 (100.0%) | 3.20 |
Median Household Size in Henderson
The median household size in Henderson is 2.64 persons per household, with married-couple households (692 | 36.1%) accounting for the largest median household size of 3.42 persons per household. non-family households (683 | 35.7%) represent the smallest median household size with 1.40 persons per household.
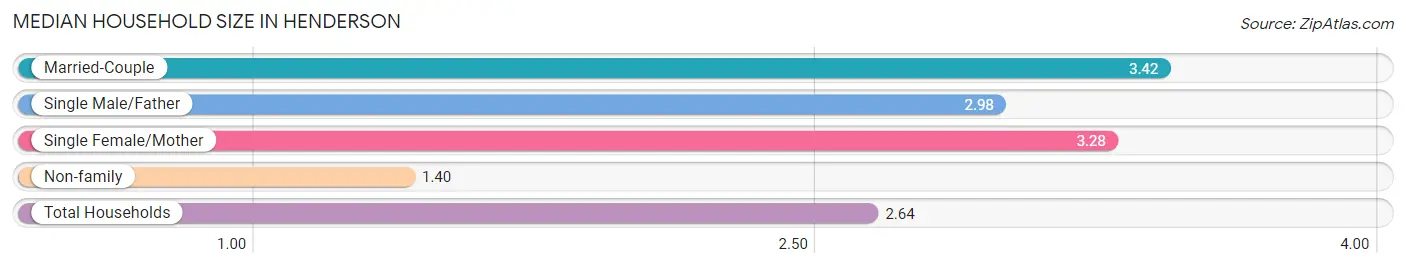
| Household Type | # Households | Household Size |
| Married-Couple | 692 (36.1%) | 3.42 |
| Single Male/Father | 185 (9.7%) | 2.98 |
| Single Female/Mother | 355 (18.5%) | 3.28 |
| Non-family | 683 (35.7%) | 1.40 |
| Total Households | 1,915 (100.0%) | 2.64 |
Household Size by Marriage Status in Henderson
Out of a total of 1,915 households in Henderson, 1,232 (64.3%) are family households, while 683 (35.7%) are nonfamily households. The most numerous type of family households are 2-person households, comprising 420, and the most common type of nonfamily households are 1-person households, comprising 583.
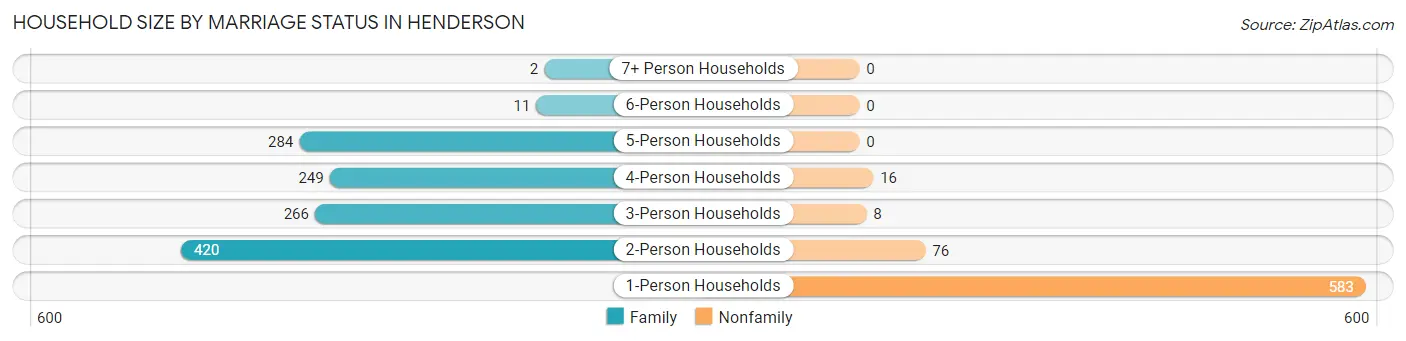
| Household Size | Family Households | Nonfamily Households |
| 1-Person Households | - | 583 (30.4%) |
| 2-Person Households | 420 (21.9%) | 76 (4.0%) |
| 3-Person Households | 266 (13.9%) | 8 (0.4%) |
| 4-Person Households | 249 (13.0%) | 16 (0.8%) |
| 5-Person Households | 284 (14.8%) | 0 (0.0%) |
| 6-Person Households | 11 (0.6%) | 0 (0.0%) |
| 7+ Person Households | 2 (0.1%) | 0 (0.0%) |
| Total | 1,232 (64.3%) | 683 (35.7%) |
Female Fertility in Henderson
Fertility by Age in Henderson
Average fertility rate in Henderson is 102.0 births per 1,000 women. Women in the age bracket of 20 to 34 years have the highest fertility rate with 187.0 births per 1,000 women. Women in the age bracket of 20 to 34 years acount for 97.4% of all women with births.
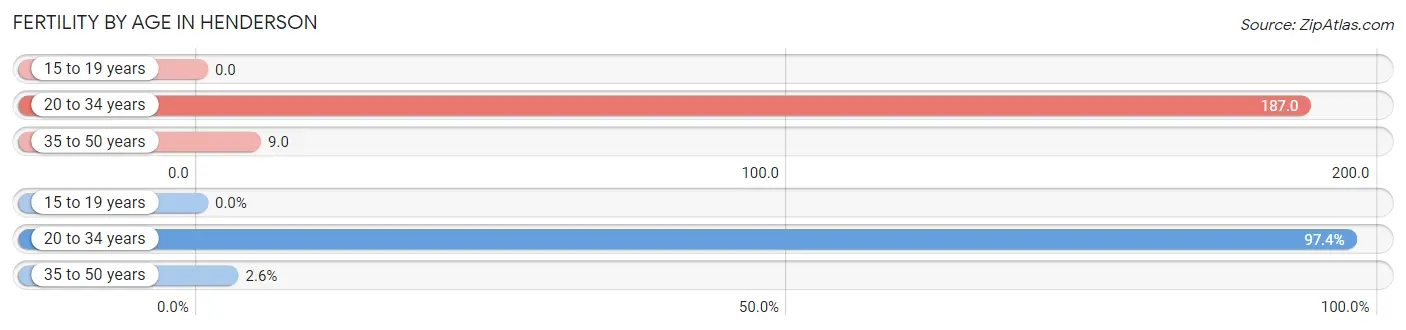
| Age Bracket | Women with Births | Births / 1,000 Women |
| 15 to 19 years | 0 (0.0%) | 0.0 |
| 20 to 34 years | 188 (97.4%) | 187.0 |
| 35 to 50 years | 5 (2.6%) | 9.0 |
| Total | 193 (100.0%) | 102.0 |
Fertility by Age by Marriage Status in Henderson
20.7% of women with births (193) in Henderson are married. The highest percentage of unmarried women with births falls into 20 to 34 years age bracket with 81.4% of them unmarried at the time of birth, while the lowest percentage of unmarried women with births belong to 35 to 50 years age bracket with 0.0% of them unmarried.
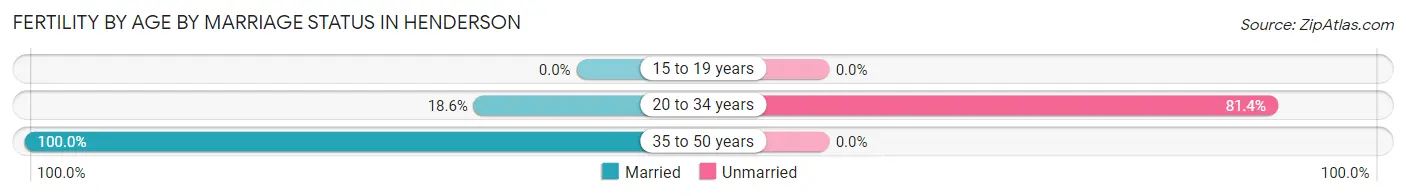
| Age Bracket | Married | Unmarried |
| 15 to 19 years | 0 (0.0%) | 0 (0.0%) |
| 20 to 34 years | 35 (18.6%) | 153 (81.4%) |
| 35 to 50 years | 5 (100.0%) | 0 (0.0%) |
| Total | 40 (20.7%) | 153 (79.3%) |
Fertility by Education in Henderson
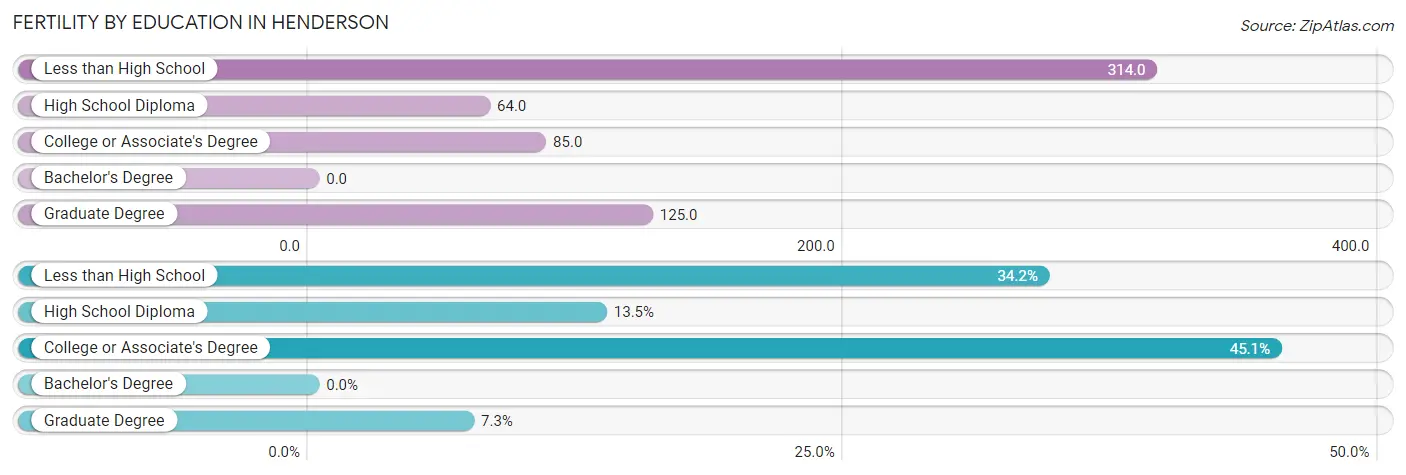
| Educational Attainment | Women with Births | Births / 1,000 Women |
| Less than High School | 66 (34.2%) | 314.0 |
| High School Diploma | 26 (13.5%) | 64.0 |
| College or Associate's Degree | 87 (45.1%) | 85.0 |
| Bachelor's Degree | 0 (0.0%) | 0.0 |
| Graduate Degree | 14 (7.2%) | 125.0 |
| Total | 193 (100.0%) | 102.0 |
Fertility by Education by Marriage Status in Henderson
79.3% of women with births in Henderson are unmarried. Women with the educational attainment of high school diploma are most likely to be married with 100.0% of them married at childbirth, while women with the educational attainment of less than high school are least likely to be married with 100.0% of them unmarried at childbirth.
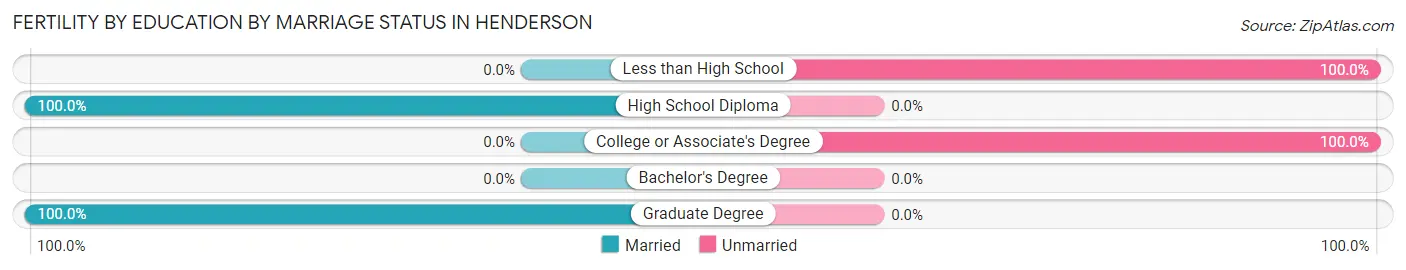
| Educational Attainment | Married | Unmarried |
| Less than High School | 0 (0.0%) | 66 (100.0%) |
| High School Diploma | 26 (100.0%) | 0 (0.0%) |
| College or Associate's Degree | 0 (0.0%) | 87 (100.0%) |
| Bachelor's Degree | 0 (0.0%) | 0 (0.0%) |
| Graduate Degree | 14 (100.0%) | 0 (0.0%) |
| Total | 40 (20.7%) | 153 (79.3%) |
Employment Characteristics in Henderson
Employment by Class of Employer in Henderson
Among the 2,176 employed individuals in Henderson, private company employees (1,386 | 63.7%), not-for-profit organizations (267 | 12.3%), and local government employees (193 | 8.9%) make up the most common classes of employment.
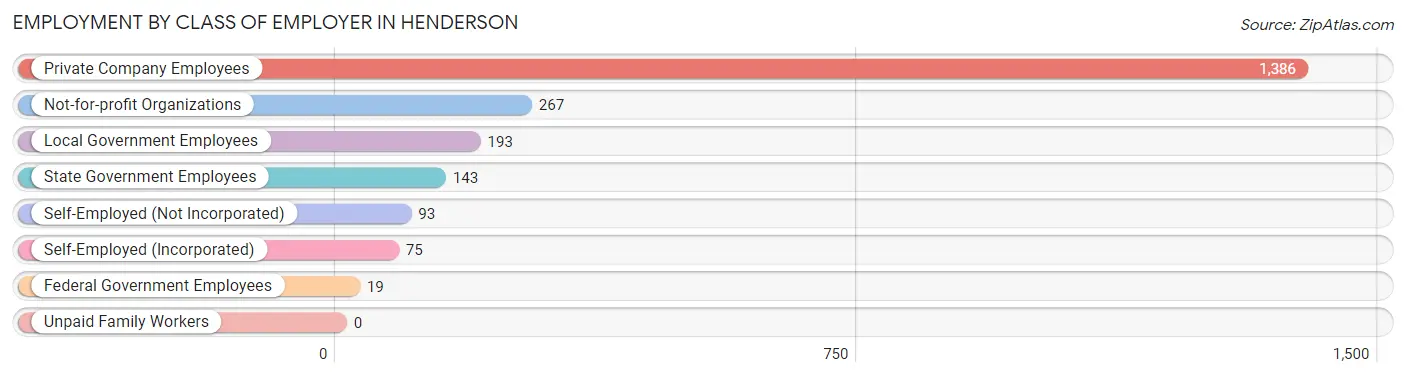
| Employer Class | # Employees | % Employees |
| Private Company Employees | 1,386 | 63.7% |
| Self-Employed (Incorporated) | 75 | 3.5% |
| Self-Employed (Not Incorporated) | 93 | 4.3% |
| Not-for-profit Organizations | 267 | 12.3% |
| Local Government Employees | 193 | 8.9% |
| State Government Employees | 143 | 6.6% |
| Federal Government Employees | 19 | 0.9% |
| Unpaid Family Workers | 0 | 0.0% |
| Total | 2,176 | 100.0% |
Employment Status by Age in Henderson
According to the labor force statistics for Henderson, out of the total population over 16 years of age (5,032), 45.0% or 2,264 individuals are in the labor force, with 3.7% or 84 of them unemployed. The age group with the highest labor force participation rate is 35 to 44 years, with 85.1% or 458 individuals in the labor force. Within the labor force, the 16 to 19 years age range has the highest percentage of unemployed individuals, with 22.8% or 36 of them being unemployed.
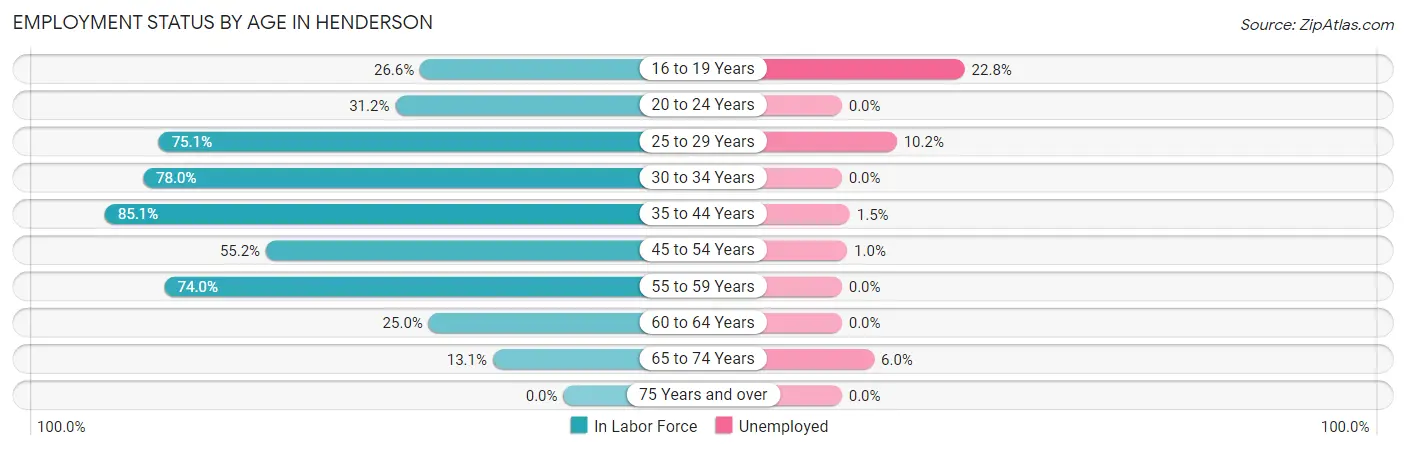
| Age Bracket | In Labor Force | Unemployed |
| 16 to 19 Years | 158 (26.6%) | 36 (22.8%) |
| 20 to 24 Years | 338 (31.2%) | 0 (0.0%) |
| 25 to 29 Years | 322 (75.1%) | 33 (10.2%) |
| 30 to 34 Years | 336 (78.0%) | 0 (0.0%) |
| 35 to 44 Years | 458 (85.1%) | 7 (1.5%) |
| 45 to 54 Years | 412 (55.2%) | 4 (1.0%) |
| 55 to 59 Years | 145 (74.0%) | 0 (0.0%) |
| 60 to 64 Years | 30 (25.0%) | 0 (0.0%) |
| 65 to 74 Years | 67 (13.1%) | 4 (6.0%) |
| 75 Years and over | 0 (0.0%) | 0 (0.0%) |
| Total | 2,264 (45.0%) | 84 (3.7%) |
Employment Status by Educational Attainment in Henderson
According to labor force statistics for Henderson, 69.2% of individuals (1,702) out of the total population between 25 and 64 years of age (2,460) are in the labor force, with 2.6% or 44 of them being unemployed. The group with the highest labor force participation rate are those with the educational attainment of bachelor's degree or higher, with 87.9% or 509 individuals in the labor force. Within the labor force, individuals with college / associate degree education have the highest percentage of unemployment, with 6.0% or 33 of them being unemployed.
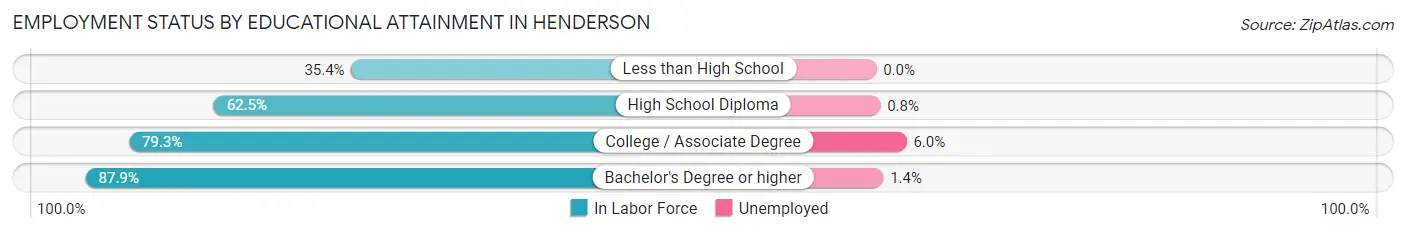
| Educational Attainment | In Labor Force | Unemployed |
| Less than High School | 129 (35.4%) | 0 (0.0%) |
| High School Diploma | 513 (62.5%) | 7 (0.8%) |
| College / Associate Degree | 552 (79.3%) | 42 (6.0%) |
| Bachelor's Degree or higher | 509 (87.9%) | 8 (1.4%) |
| Total | 1,702 (69.2%) | 64 (2.6%) |
Employment Occupations by Sex in Henderson
Management, Business, Science and Arts Occupations
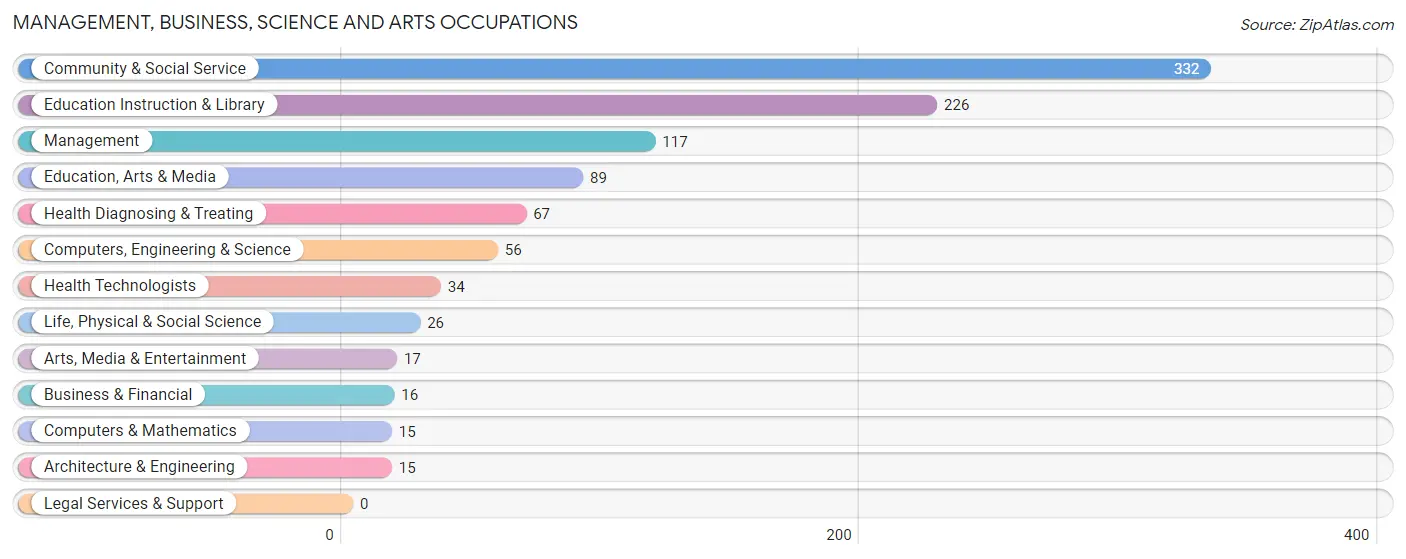
The most common Management, Business, Science and Arts occupations in Henderson are Community & Social Service (332 | 15.2%), Education Instruction & Library (226 | 10.4%), Management (117 | 5.4%), Education, Arts & Media (89 | 4.1%), and Health Diagnosing & Treating (67 | 3.1%).
Management, Business, Science and Arts Occupations by Sex
Within the Management, Business, Science and Arts occupations in Henderson, the most male-oriented occupations are Computers & Mathematics (100.0%), Life, Physical & Social Science (100.0%), and Computers, Engineering & Science (91.1%), while the most female-oriented occupations are Health Technologists (100.0%), Health Diagnosing & Treating (83.6%), and Education, Arts & Media (75.3%).
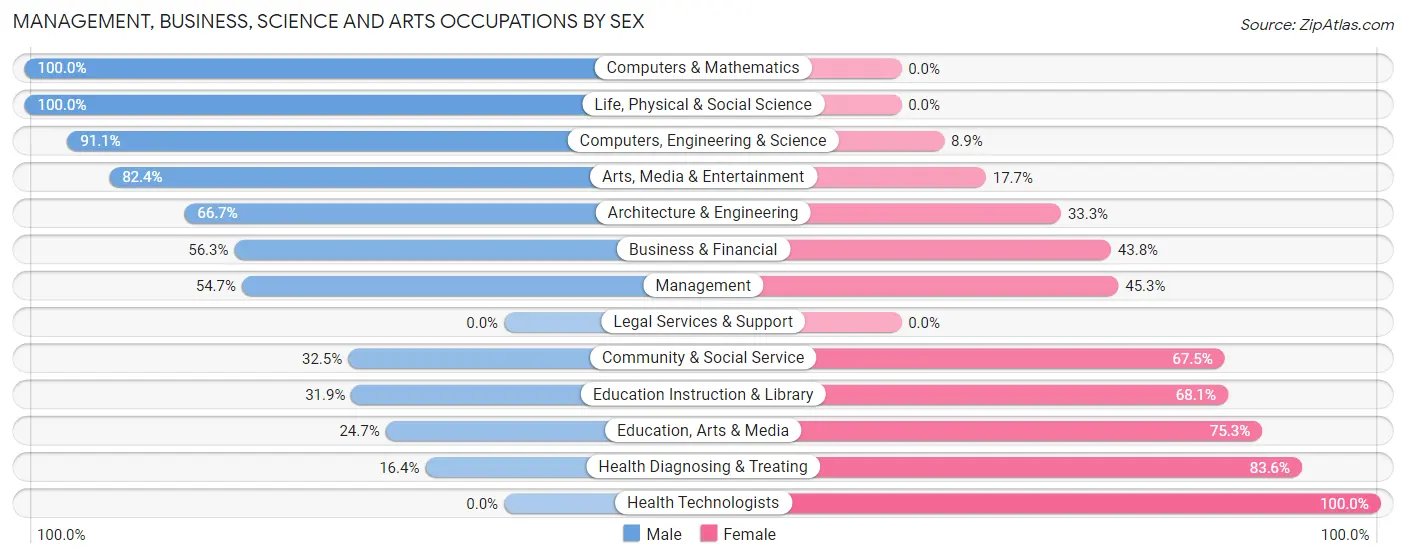
| Occupation | Male | Female |
| Management | 64 (54.7%) | 53 (45.3%) |
| Business & Financial | 9 (56.2%) | 7 (43.8%) |
| Computers, Engineering & Science | 51 (91.1%) | 5 (8.9%) |
| Computers & Mathematics | 15 (100.0%) | 0 (0.0%) |
| Architecture & Engineering | 10 (66.7%) | 5 (33.3%) |
| Life, Physical & Social Science | 26 (100.0%) | 0 (0.0%) |
| Community & Social Service | 108 (32.5%) | 224 (67.5%) |
| Education, Arts & Media | 22 (24.7%) | 67 (75.3%) |
| Legal Services & Support | 0 (0.0%) | 0 (0.0%) |
| Education Instruction & Library | 72 (31.9%) | 154 (68.1%) |
| Arts, Media & Entertainment | 14 (82.4%) | 3 (17.6%) |
| Health Diagnosing & Treating | 11 (16.4%) | 56 (83.6%) |
| Health Technologists | 0 (0.0%) | 34 (100.0%) |
| Total (Category) | 243 (41.3%) | 345 (58.7%) |
| Total (Overall) | 1,007 (46.2%) | 1,175 (53.8%) |
Services Occupations
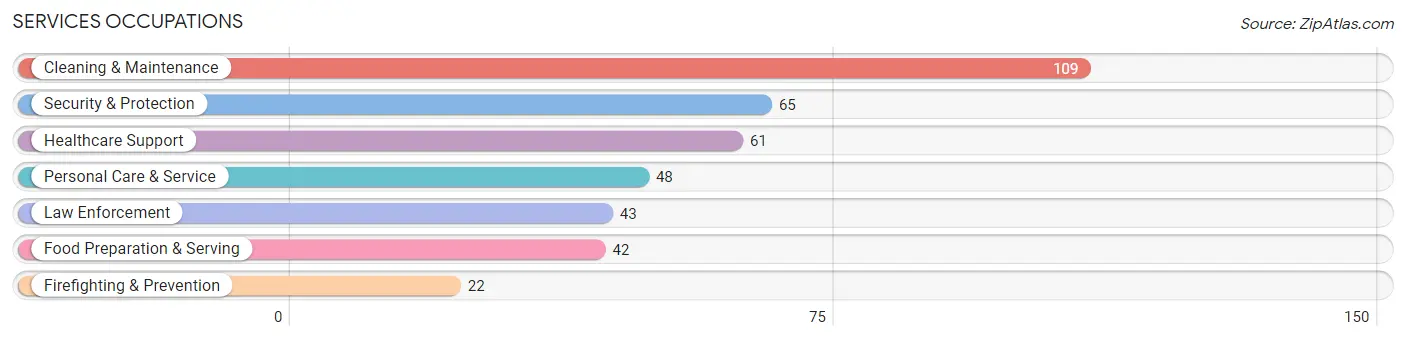
The most common Services occupations in Henderson are Cleaning & Maintenance (109 | 5.0%), Security & Protection (65 | 3.0%), Healthcare Support (61 | 2.8%), Personal Care & Service (48 | 2.2%), and Law Enforcement (43 | 2.0%).
Services Occupations by Sex
Within the Services occupations in Henderson, the most male-oriented occupations are Firefighting & Prevention (100.0%), Security & Protection (96.9%), and Law Enforcement (95.4%), while the most female-oriented occupations are Personal Care & Service (100.0%), Healthcare Support (93.4%), and Food Preparation & Serving (92.9%).
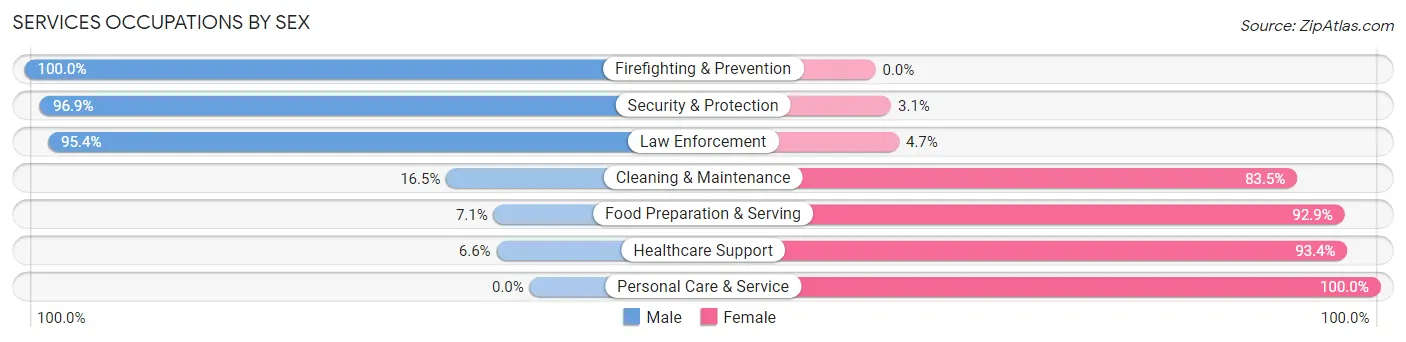
| Occupation | Male | Female |
| Healthcare Support | 4 (6.6%) | 57 (93.4%) |
| Security & Protection | 63 (96.9%) | 2 (3.1%) |
| Firefighting & Prevention | 22 (100.0%) | 0 (0.0%) |
| Law Enforcement | 41 (95.4%) | 2 (4.6%) |
| Food Preparation & Serving | 3 (7.1%) | 39 (92.9%) |
| Cleaning & Maintenance | 18 (16.5%) | 91 (83.5%) |
| Personal Care & Service | 0 (0.0%) | 48 (100.0%) |
| Total (Category) | 88 (27.1%) | 237 (72.9%) |
| Total (Overall) | 1,007 (46.2%) | 1,175 (53.8%) |
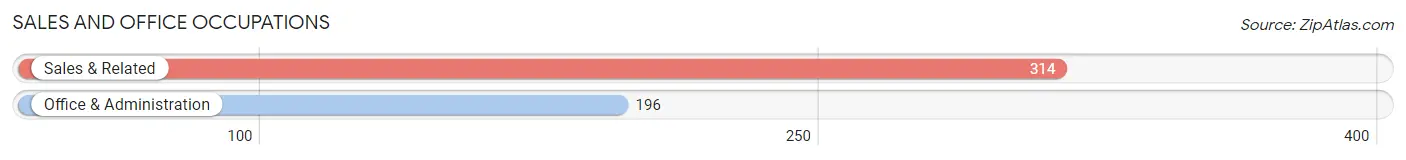
Sales and Office Occupations
The most common Sales and Office occupations in Henderson are Sales & Related (314 | 14.4%), and Office & Administration (196 | 9.0%).
Sales and Office Occupations by Sex
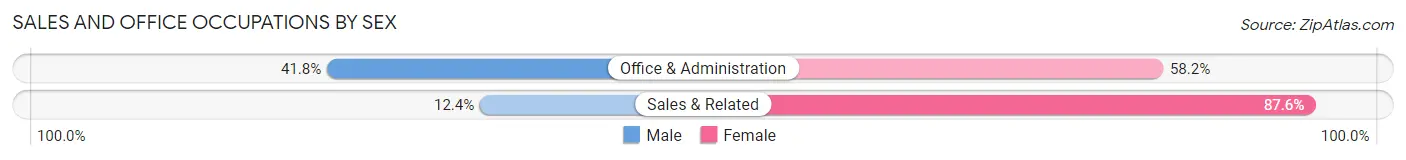
| Occupation | Male | Female |
| Sales & Related | 39 (12.4%) | 275 (87.6%) |
| Office & Administration | 82 (41.8%) | 114 (58.2%) |
| Total (Category) | 121 (23.7%) | 389 (76.3%) |
| Total (Overall) | 1,007 (46.2%) | 1,175 (53.8%) |
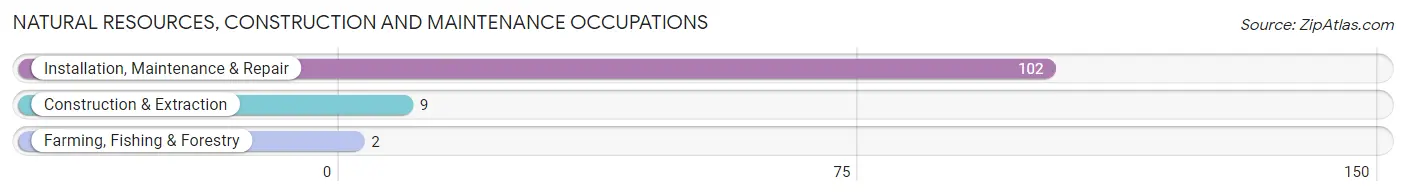
Natural Resources, Construction and Maintenance Occupations
The most common Natural Resources, Construction and Maintenance occupations in Henderson are Installation, Maintenance & Repair (102 | 4.7%), Construction & Extraction (9 | 0.4%), and Farming, Fishing & Forestry (2 | 0.1%).
Natural Resources, Construction and Maintenance Occupations by Sex
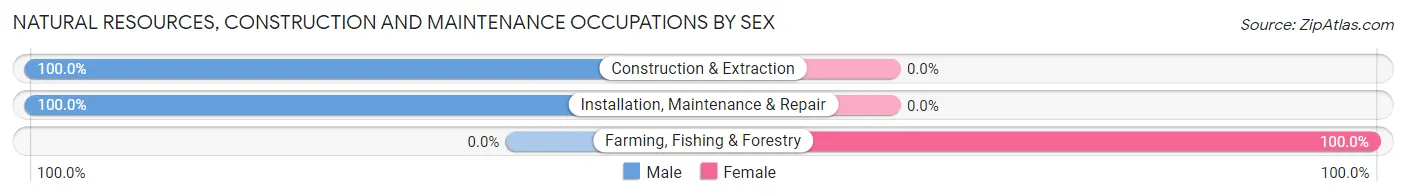
| Occupation | Male | Female |
| Farming, Fishing & Forestry | 0 (0.0%) | 2 (100.0%) |
| Construction & Extraction | 9 (100.0%) | 0 (0.0%) |
| Installation, Maintenance & Repair | 102 (100.0%) | 0 (0.0%) |
| Total (Category) | 111 (98.2%) | 2 (1.8%) |
| Total (Overall) | 1,007 (46.2%) | 1,175 (53.8%) |
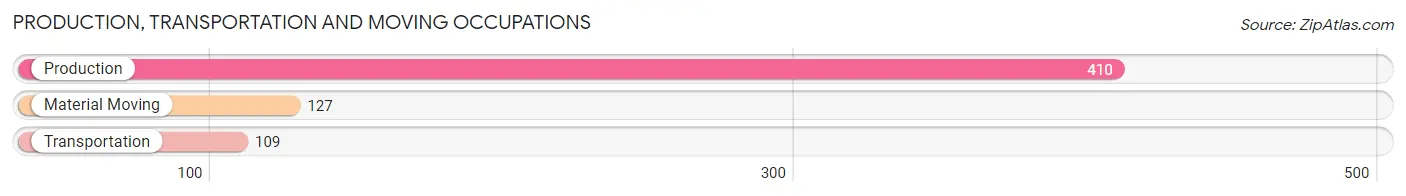
Production, Transportation and Moving Occupations
The most common Production, Transportation and Moving occupations in Henderson are Production (410 | 18.8%), Material Moving (127 | 5.8%), and Transportation (109 | 5.0%).
Production, Transportation and Moving Occupations by Sex
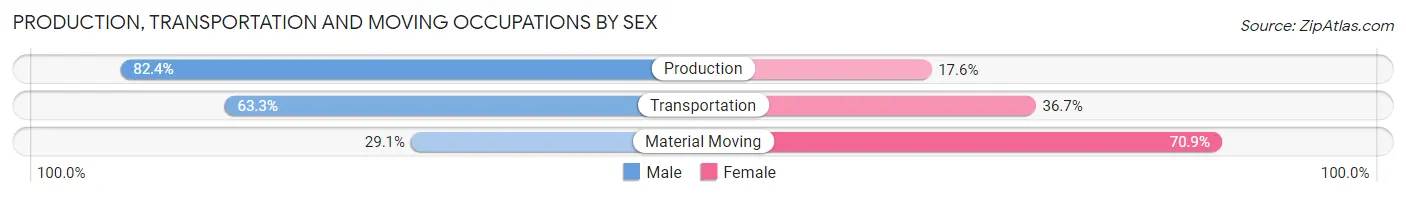
| Occupation | Male | Female |
| Production | 338 (82.4%) | 72 (17.6%) |
| Transportation | 69 (63.3%) | 40 (36.7%) |
| Material Moving | 37 (29.1%) | 90 (70.9%) |
| Total (Category) | 444 (68.7%) | 202 (31.3%) |
| Total (Overall) | 1,007 (46.2%) | 1,175 (53.8%) |
Employment Industries by Sex in Henderson
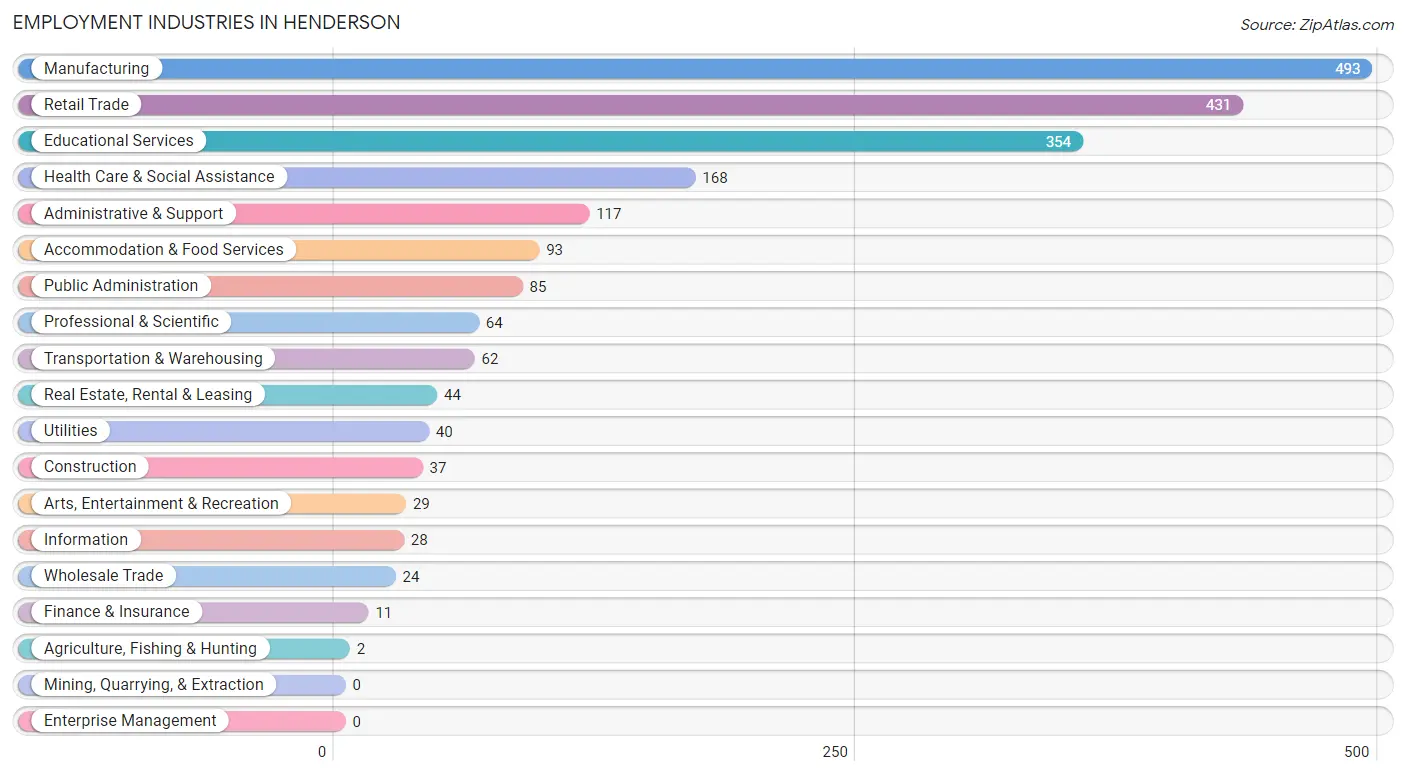
Employment Industries in Henderson
The major employment industries in Henderson include Manufacturing (493 | 22.6%), Retail Trade (431 | 19.8%), Educational Services (354 | 16.2%), Health Care & Social Assistance (168 | 7.7%), and Administrative & Support (117 | 5.4%).
Employment Industries by Sex in Henderson
The Henderson industries that see more men than women are Construction (100.0%), Transportation & Warehousing (100.0%), and Arts, Entertainment & Recreation (89.7%), whereas the industries that tend to have a higher number of women are Agriculture, Fishing & Hunting (100.0%), Wholesale Trade (100.0%), and Utilities (100.0%).
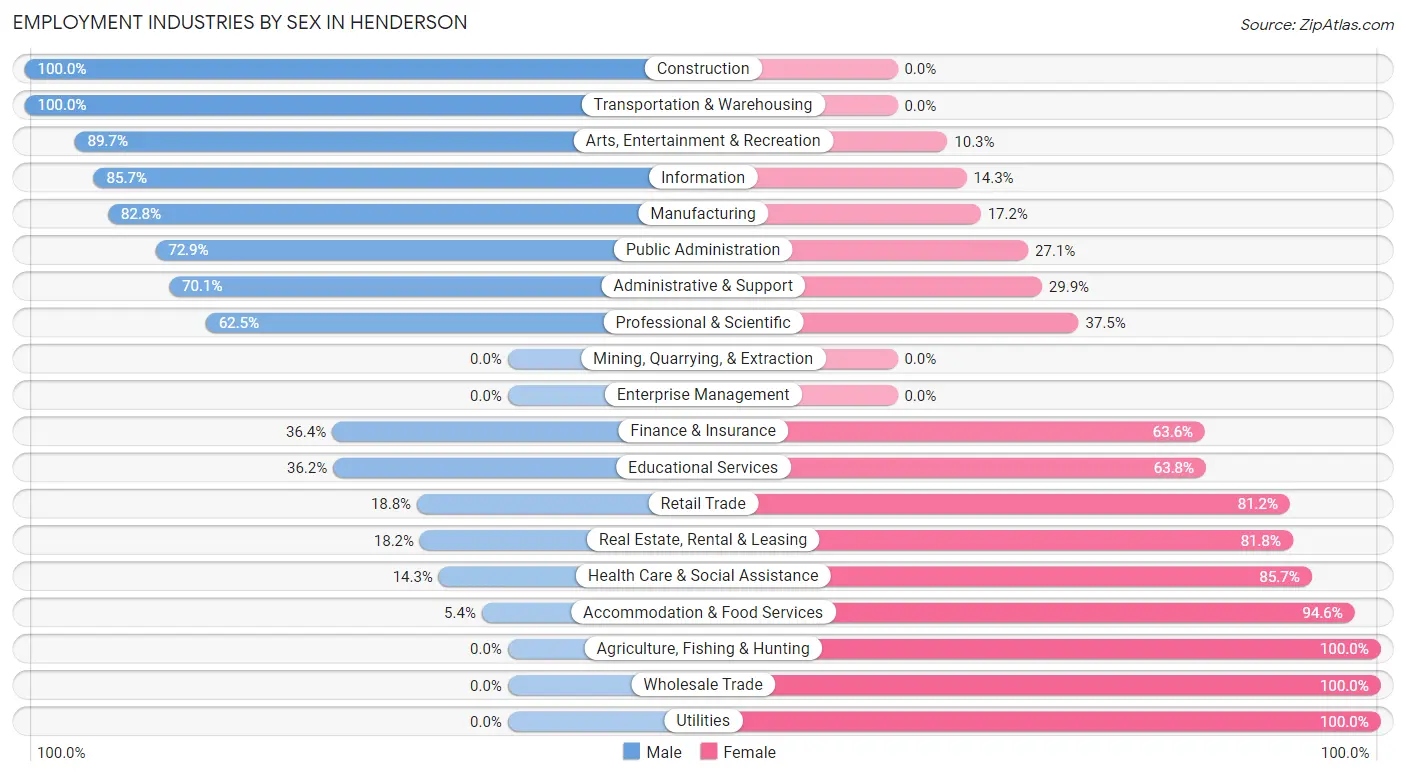
| Industry | Male | Female |
| Agriculture, Fishing & Hunting | 0 (0.0%) | 2 (100.0%) |
| Mining, Quarrying, & Extraction | 0 (0.0%) | 0 (0.0%) |
| Construction | 37 (100.0%) | 0 (0.0%) |
| Manufacturing | 408 (82.8%) | 85 (17.2%) |
| Wholesale Trade | 0 (0.0%) | 24 (100.0%) |
| Retail Trade | 81 (18.8%) | 350 (81.2%) |
| Transportation & Warehousing | 62 (100.0%) | 0 (0.0%) |
| Utilities | 0 (0.0%) | 40 (100.0%) |
| Information | 24 (85.7%) | 4 (14.3%) |
| Finance & Insurance | 4 (36.4%) | 7 (63.6%) |
| Real Estate, Rental & Leasing | 8 (18.2%) | 36 (81.8%) |
| Professional & Scientific | 40 (62.5%) | 24 (37.5%) |
| Enterprise Management | 0 (0.0%) | 0 (0.0%) |
| Administrative & Support | 82 (70.1%) | 35 (29.9%) |
| Educational Services | 128 (36.2%) | 226 (63.8%) |
| Health Care & Social Assistance | 24 (14.3%) | 144 (85.7%) |
| Arts, Entertainment & Recreation | 26 (89.7%) | 3 (10.3%) |
| Accommodation & Food Services | 5 (5.4%) | 88 (94.6%) |
| Public Administration | 62 (72.9%) | 23 (27.1%) |
| Total | 1,007 (46.2%) | 1,175 (53.8%) |
Education in Henderson
School Enrollment in Henderson
The most common levels of schooling among the 2,307 students in Henderson are college / undergraduate (1,162 | 50.4%), elementary school (434 | 18.8%), and middle school (289 | 12.5%).
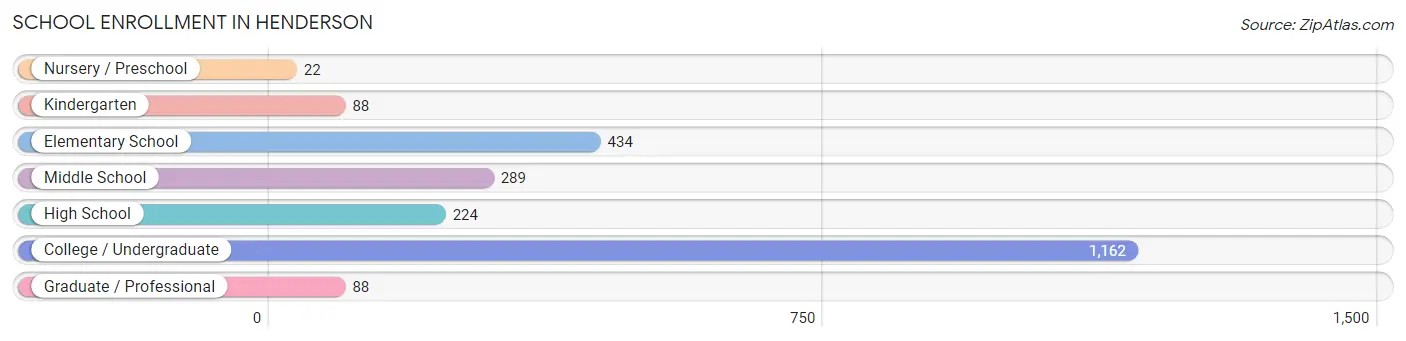
| School Level | # Students | % Students |
| Nursery / Preschool | 22 | 0.9% |
| Kindergarten | 88 | 3.8% |
| Elementary School | 434 | 18.8% |
| Middle School | 289 | 12.5% |
| High School | 224 | 9.7% |
| College / Undergraduate | 1,162 | 50.4% |
| Graduate / Professional | 88 | 3.8% |
| Total | 2,307 | 100.0% |
School Enrollment by Age by Funding Source in Henderson
Out of a total of 2,307 students who are enrolled in schools in Henderson, 1,183 (51.3%) attend a private institution, while the remaining 1,124 (48.7%) are enrolled in public schools. The age group of 20 to 24 year olds has the highest likelihood of being enrolled in private schools, with 731 (96.4% in the age bracket) enrolled. Conversely, the age group of 3 to 4 year olds has the lowest likelihood of being enrolled in a private school, with 6 (100.0% in the age bracket) attending a public institution.
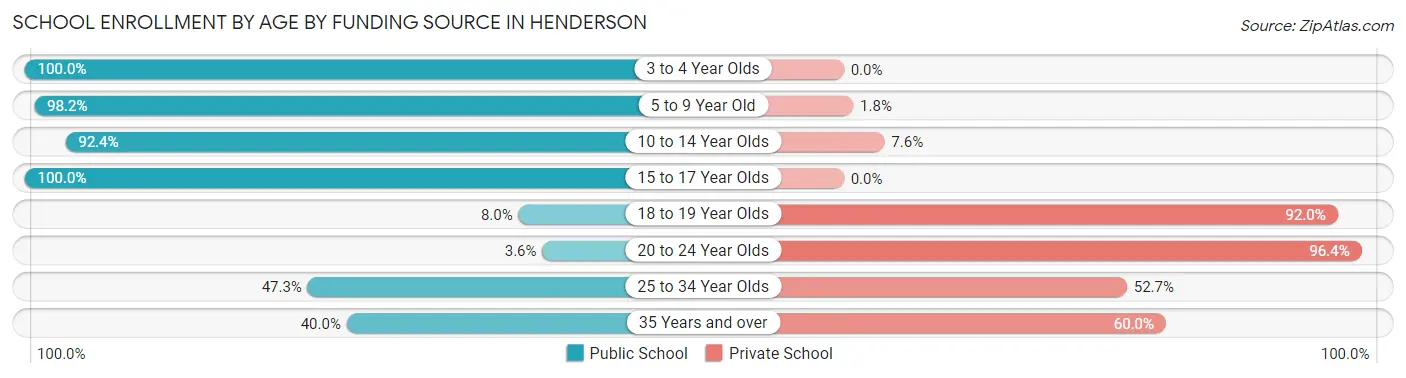
| Age Bracket | Public School | Private School |
| 3 to 4 Year Olds | 6 (100.0%) | 0 (0.0%) |
| 5 to 9 Year Old | 445 (98.2%) | 8 (1.8%) |
| 10 to 14 Year Olds | 365 (92.4%) | 30 (7.6%) |
| 15 to 17 Year Olds | 190 (100.0%) | 0 (0.0%) |
| 18 to 19 Year Olds | 30 (8.0%) | 345 (92.0%) |
| 20 to 24 Year Olds | 27 (3.6%) | 731 (96.4%) |
| 25 to 34 Year Olds | 52 (47.3%) | 58 (52.7%) |
| 35 Years and over | 8 (40.0%) | 12 (60.0%) |
| Total | 1,124 (48.7%) | 1,183 (51.3%) |
Educational Attainment by Field of Study in Henderson
Education (272 | 37.4%), business (117 | 16.1%), arts & humanities (54 | 7.4%), science & technology (50 | 6.9%), and bio, nature & agricultural (49 | 6.7%) are the most common fields of study among 728 individuals in Henderson who have obtained a bachelor's degree or higher.
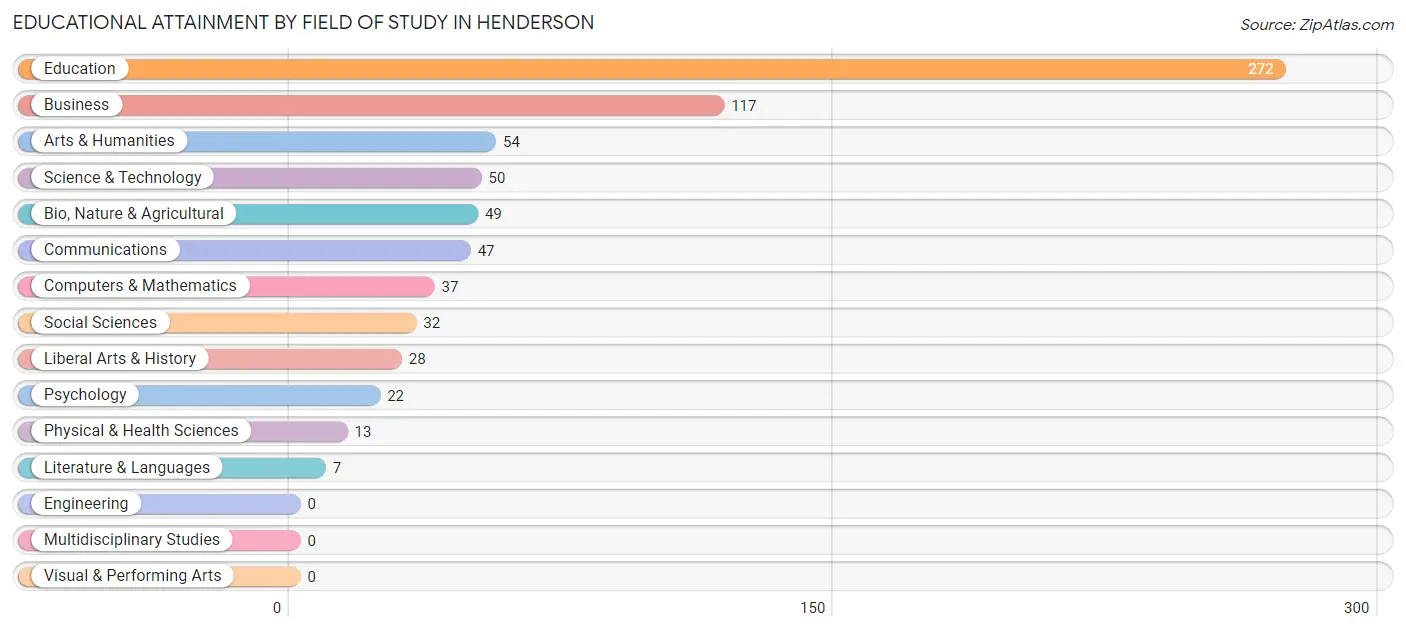
| Field of Study | # Graduates | % Graduates |
| Computers & Mathematics | 37 | 5.1% |
| Bio, Nature & Agricultural | 49 | 6.7% |
| Physical & Health Sciences | 13 | 1.8% |
| Psychology | 22 | 3.0% |
| Social Sciences | 32 | 4.4% |
| Engineering | 0 | 0.0% |
| Multidisciplinary Studies | 0 | 0.0% |
| Science & Technology | 50 | 6.9% |
| Business | 117 | 16.1% |
| Education | 272 | 37.4% |
| Literature & Languages | 7 | 1.0% |
| Liberal Arts & History | 28 | 3.8% |
| Visual & Performing Arts | 0 | 0.0% |
| Communications | 47 | 6.5% |
| Arts & Humanities | 54 | 7.4% |
| Total | 728 | 100.0% |
Transportation & Commute in Henderson
Vehicle Availability by Sex in Henderson
The most prevalent vehicle ownership categories in Henderson are males with 2 vehicles (479, accounting for 48.9%) and females with 2 vehicles (314, making up 45.4%).
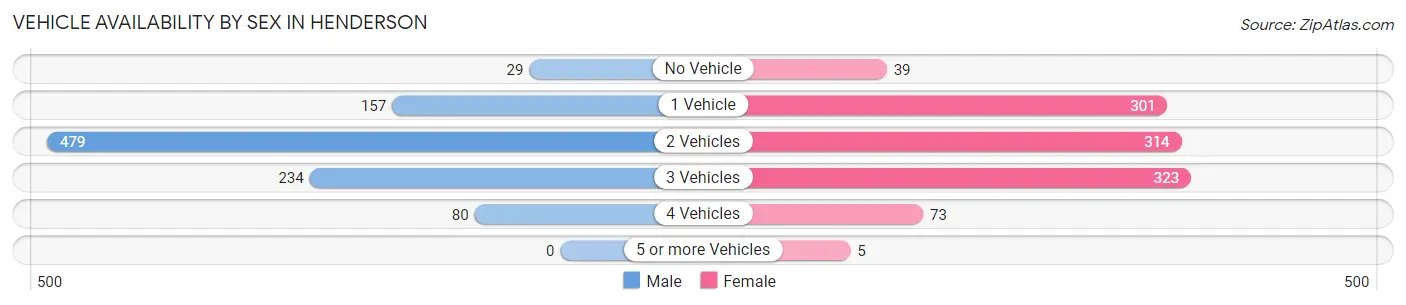
| Vehicles Available | Male | Female |
| No Vehicle | 29 (3.0%) | 39 (3.7%) |
| 1 Vehicle | 157 (16.0%) | 301 (28.5%) |
| 2 Vehicles | 479 (48.9%) | 314 (29.8%) |
| 3 Vehicles | 234 (23.9%) | 323 (30.6%) |
| 4 Vehicles | 80 (8.2%) | 73 (6.9%) |
| 5 or more Vehicles | 0 (0.0%) | 5 (0.5%) |
| Total | 979 (100.0%) | 1,055 (100.0%) |
Commute Time in Henderson
The most frequently occuring commute durations in Henderson are 5 to 9 minutes (497 commuters, 24.7%), 10 to 14 minutes (300 commuters, 14.9%), and 30 to 34 minutes (238 commuters, 11.8%).
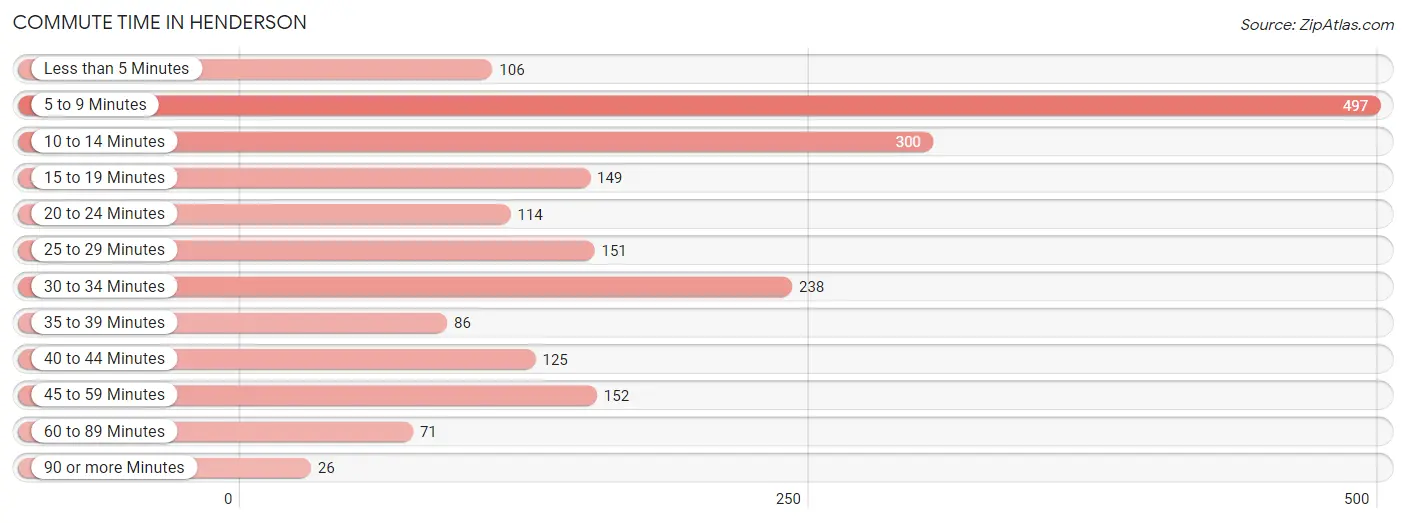
| Commute Time | # Commuters | % Commuters |
| Less than 5 Minutes | 106 | 5.3% |
| 5 to 9 Minutes | 497 | 24.7% |
| 10 to 14 Minutes | 300 | 14.9% |
| 15 to 19 Minutes | 149 | 7.4% |
| 20 to 24 Minutes | 114 | 5.7% |
| 25 to 29 Minutes | 151 | 7.5% |
| 30 to 34 Minutes | 238 | 11.8% |
| 35 to 39 Minutes | 86 | 4.3% |
| 40 to 44 Minutes | 125 | 6.2% |
| 45 to 59 Minutes | 152 | 7.5% |
| 60 to 89 Minutes | 71 | 3.5% |
| 90 or more Minutes | 26 | 1.3% |
Commute Time by Sex in Henderson
The most common commute times in Henderson are 5 to 9 minutes (237 commuters, 25.3%) for males and 5 to 9 minutes (260 commuters, 24.1%) for females.
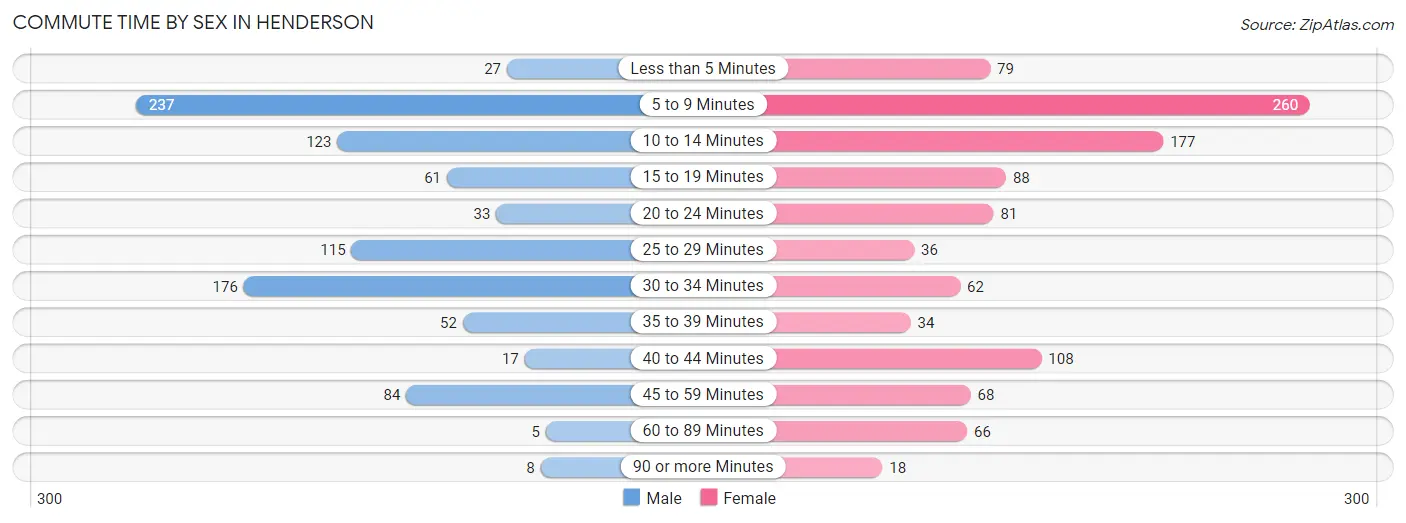
| Commute Time | Male | Female |
| Less than 5 Minutes | 27 (2.9%) | 79 (7.3%) |
| 5 to 9 Minutes | 237 (25.3%) | 260 (24.1%) |
| 10 to 14 Minutes | 123 (13.1%) | 177 (16.4%) |
| 15 to 19 Minutes | 61 (6.5%) | 88 (8.2%) |
| 20 to 24 Minutes | 33 (3.5%) | 81 (7.5%) |
| 25 to 29 Minutes | 115 (12.3%) | 36 (3.3%) |
| 30 to 34 Minutes | 176 (18.8%) | 62 (5.8%) |
| 35 to 39 Minutes | 52 (5.5%) | 34 (3.2%) |
| 40 to 44 Minutes | 17 (1.8%) | 108 (10.0%) |
| 45 to 59 Minutes | 84 (9.0%) | 68 (6.3%) |
| 60 to 89 Minutes | 5 (0.5%) | 66 (6.1%) |
| 90 or more Minutes | 8 (0.9%) | 18 (1.7%) |
Time of Departure to Work by Sex in Henderson
The most frequent times of departure to work in Henderson are 7:00 AM to 7:29 AM (145, 15.5%) for males and 7:30 AM to 7:59 AM (277, 25.7%) for females.
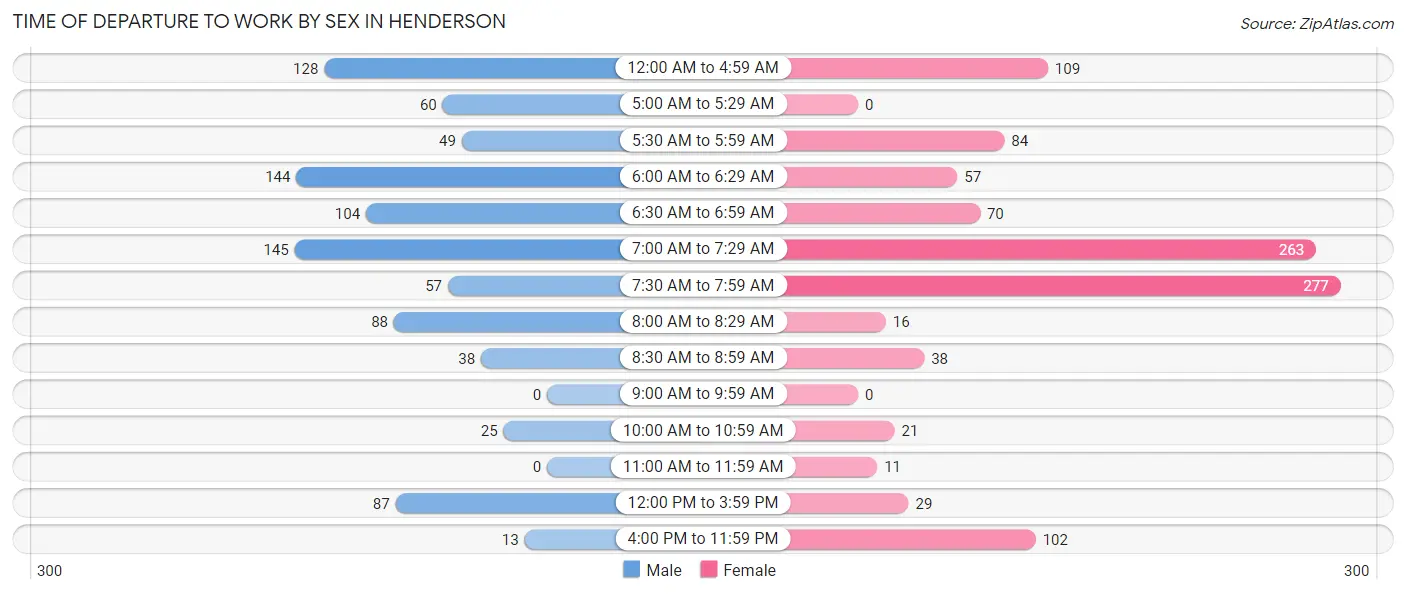
| Time of Departure | Male | Female |
| 12:00 AM to 4:59 AM | 128 (13.7%) | 109 (10.1%) |
| 5:00 AM to 5:29 AM | 60 (6.4%) | 0 (0.0%) |
| 5:30 AM to 5:59 AM | 49 (5.2%) | 84 (7.8%) |
| 6:00 AM to 6:29 AM | 144 (15.3%) | 57 (5.3%) |
| 6:30 AM to 6:59 AM | 104 (11.1%) | 70 (6.5%) |
| 7:00 AM to 7:29 AM | 145 (15.5%) | 263 (24.4%) |
| 7:30 AM to 7:59 AM | 57 (6.1%) | 277 (25.7%) |
| 8:00 AM to 8:29 AM | 88 (9.4%) | 16 (1.5%) |
| 8:30 AM to 8:59 AM | 38 (4.1%) | 38 (3.5%) |
| 9:00 AM to 9:59 AM | 0 (0.0%) | 0 (0.0%) |
| 10:00 AM to 10:59 AM | 25 (2.7%) | 21 (1.9%) |
| 11:00 AM to 11:59 AM | 0 (0.0%) | 11 (1.0%) |
| 12:00 PM to 3:59 PM | 87 (9.3%) | 29 (2.7%) |
| 4:00 PM to 11:59 PM | 13 (1.4%) | 102 (9.5%) |
| Total | 938 (100.0%) | 1,077 (100.0%) |
Housing Occupancy in Henderson
Occupancy by Ownership in Henderson
Of the total 1,915 dwellings in Henderson, owner-occupied units account for 1,200 (62.7%), while renter-occupied units make up 715 (37.3%).
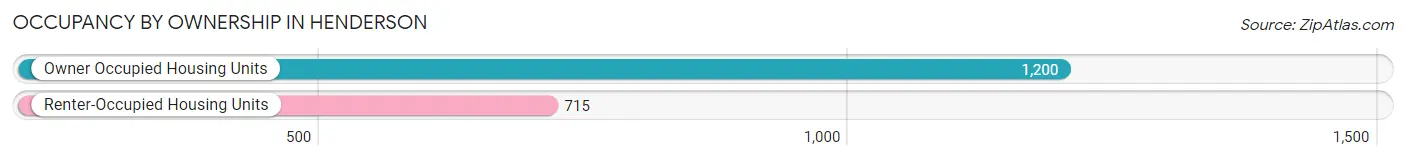
| Occupancy | # Housing Units | % Housing Units |
| Owner Occupied Housing Units | 1,200 | 62.7% |
| Renter-Occupied Housing Units | 715 | 37.3% |
| Total Occupied Housing Units | 1,915 | 100.0% |
Occupancy by Household Size in Henderson
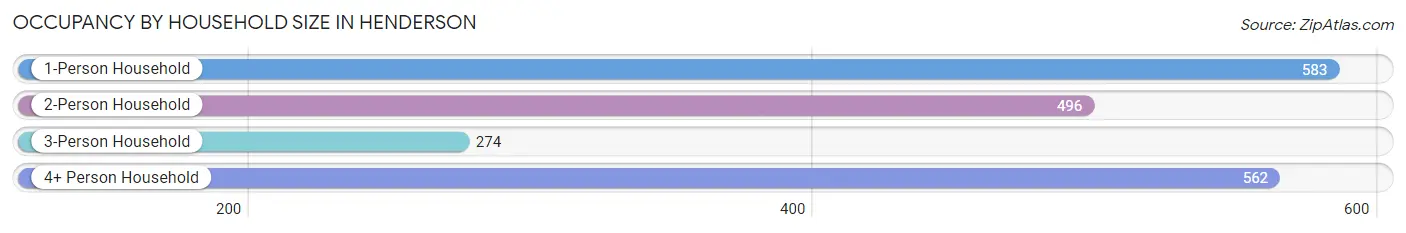
| Household Size | # Housing Units | % Housing Units |
| 1-Person Household | 583 | 30.4% |
| 2-Person Household | 496 | 25.9% |
| 3-Person Household | 274 | 14.3% |
| 4+ Person Household | 562 | 29.3% |
| Total Housing Units | 1,915 | 100.0% |
Occupancy by Ownership by Household Size in Henderson
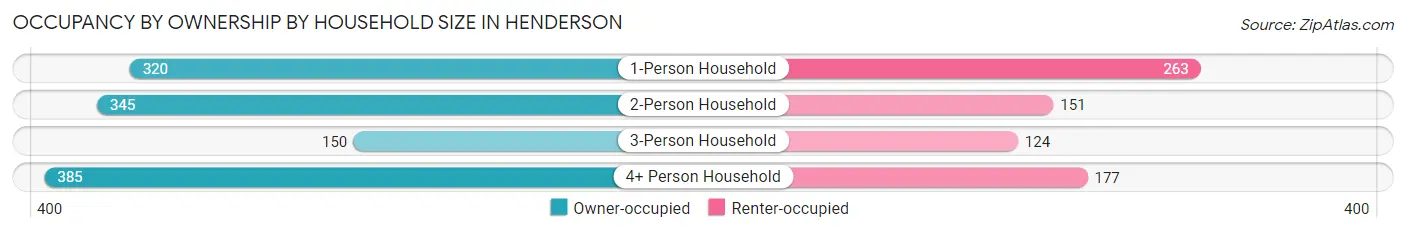
| Household Size | Owner-occupied | Renter-occupied |
| 1-Person Household | 320 (54.9%) | 263 (45.1%) |
| 2-Person Household | 345 (69.6%) | 151 (30.4%) |
| 3-Person Household | 150 (54.7%) | 124 (45.3%) |
| 4+ Person Household | 385 (68.5%) | 177 (31.5%) |
| Total Housing Units | 1,200 (62.7%) | 715 (37.3%) |
Occupancy by Educational Attainment in Henderson
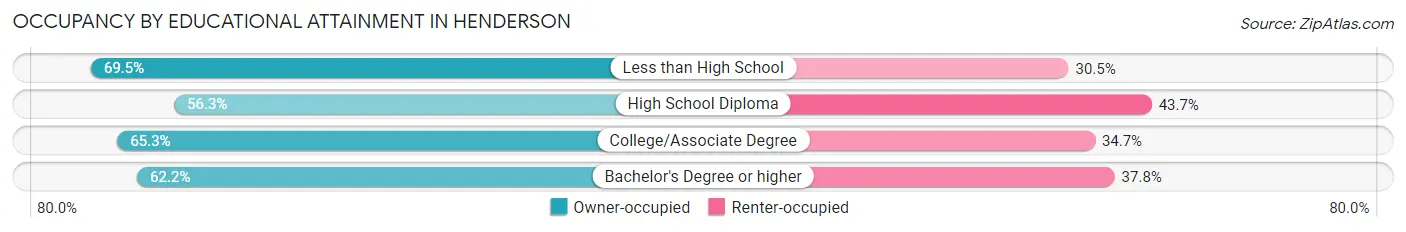
| Household Size | Owner-occupied | Renter-occupied |
| Less than High School | 246 (69.5%) | 108 (30.5%) |
| High School Diploma | 326 (56.3%) | 253 (43.7%) |
| College/Associate Degree | 365 (65.3%) | 194 (34.7%) |
| Bachelor's Degree or higher | 263 (62.2%) | 160 (37.8%) |
Occupancy by Age of Householder in Henderson
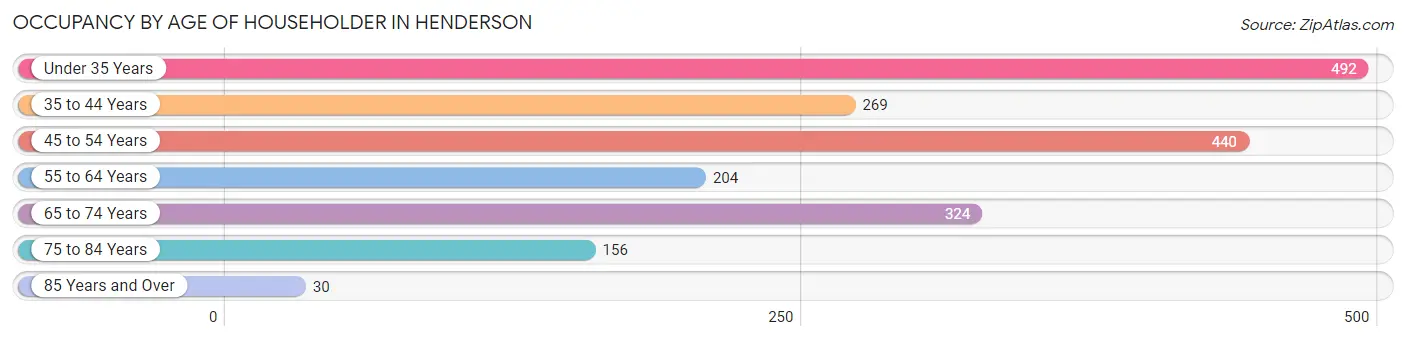
| Age Bracket | # Households | % Households |
| Under 35 Years | 492 | 25.7% |
| 35 to 44 Years | 269 | 14.1% |
| 45 to 54 Years | 440 | 23.0% |
| 55 to 64 Years | 204 | 10.6% |
| 65 to 74 Years | 324 | 16.9% |
| 75 to 84 Years | 156 | 8.2% |
| 85 Years and Over | 30 | 1.6% |
| Total | 1,915 | 100.0% |
Housing Finances in Henderson
Median Income by Occupancy in Henderson
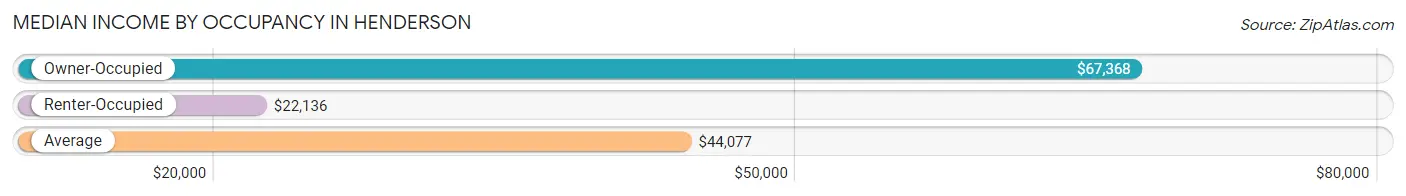
| Occupancy Type | # Households | Median Income |
| Owner-Occupied | 1,200 (62.7%) | $67,368 |
| Renter-Occupied | 715 (37.3%) | $22,136 |
| Average | 1,915 (100.0%) | $44,077 |
Occupancy by Householder Income Bracket in Henderson
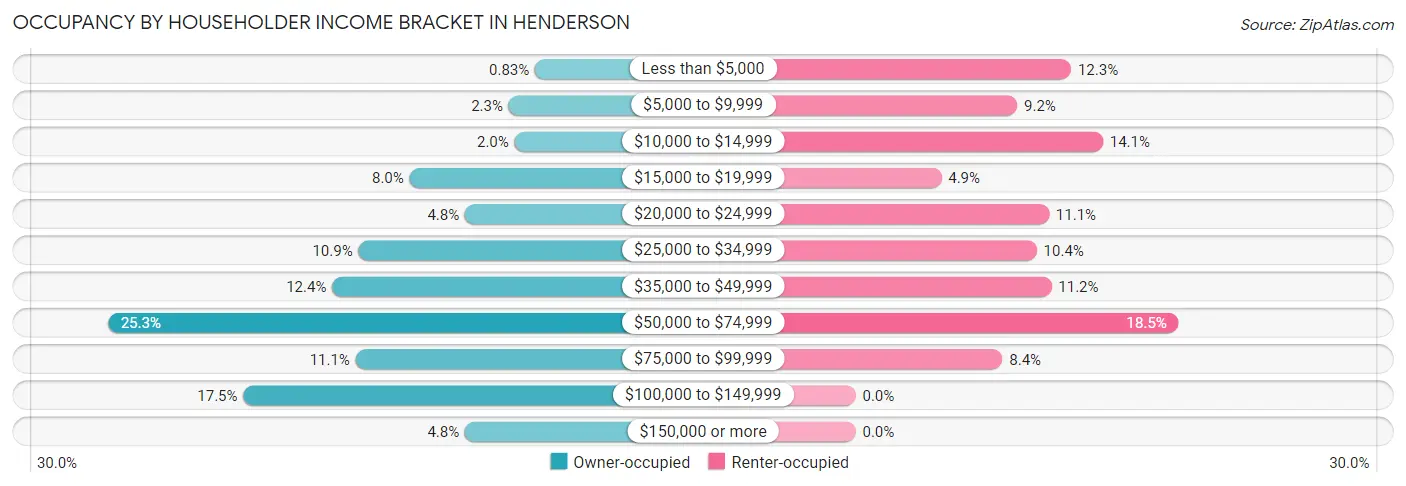
| Income Bracket | Owner-occupied | Renter-occupied |
| Less than $5,000 | 10 (0.8%) | 88 (12.3%) |
| $5,000 to $9,999 | 28 (2.3%) | 66 (9.2%) |
| $10,000 to $14,999 | 24 (2.0%) | 101 (14.1%) |
| $15,000 to $19,999 | 96 (8.0%) | 35 (4.9%) |
| $20,000 to $24,999 | 58 (4.8%) | 79 (11.1%) |
| $25,000 to $34,999 | 131 (10.9%) | 74 (10.3%) |
| $35,000 to $49,999 | 149 (12.4%) | 80 (11.2%) |
| $50,000 to $74,999 | 303 (25.3%) | 132 (18.5%) |
| $75,000 to $99,999 | 133 (11.1%) | 60 (8.4%) |
| $100,000 to $149,999 | 210 (17.5%) | 0 (0.0%) |
| $150,000 or more | 58 (4.8%) | 0 (0.0%) |
| Total | 1,200 (100.0%) | 715 (100.0%) |
Monthly Housing Cost Tiers in Henderson
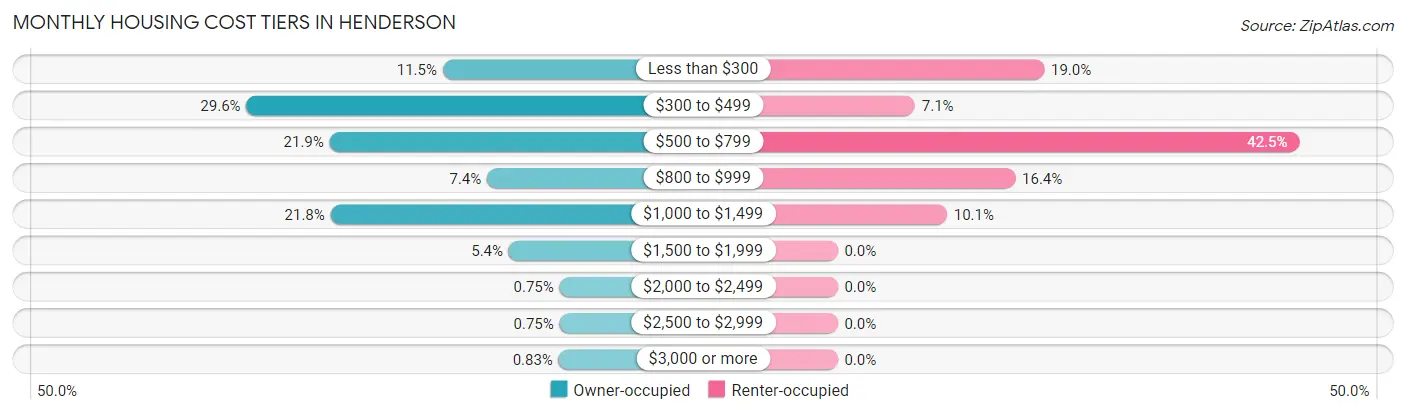
| Monthly Cost | Owner-occupied | Renter-occupied |
| Less than $300 | 138 (11.5%) | 136 (19.0%) |
| $300 to $499 | 355 (29.6%) | 51 (7.1%) |
| $500 to $799 | 263 (21.9%) | 304 (42.5%) |
| $800 to $999 | 89 (7.4%) | 117 (16.4%) |
| $1,000 to $1,499 | 262 (21.8%) | 72 (10.1%) |
| $1,500 to $1,999 | 65 (5.4%) | 0 (0.0%) |
| $2,000 to $2,499 | 9 (0.7%) | 0 (0.0%) |
| $2,500 to $2,999 | 9 (0.7%) | 0 (0.0%) |
| $3,000 or more | 10 (0.8%) | 0 (0.0%) |
| Total | 1,200 (100.0%) | 715 (100.0%) |
Physical Housing Characteristics in Henderson
Housing Structures in Henderson
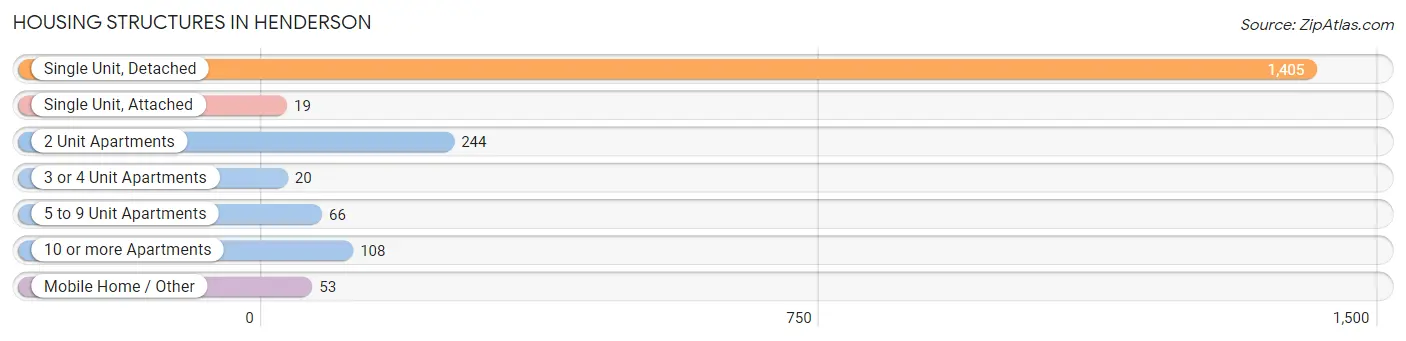
| Structure Type | # Housing Units | % Housing Units |
| Single Unit, Detached | 1,405 | 73.4% |
| Single Unit, Attached | 19 | 1.0% |
| 2 Unit Apartments | 244 | 12.7% |
| 3 or 4 Unit Apartments | 20 | 1.0% |
| 5 to 9 Unit Apartments | 66 | 3.5% |
| 10 or more Apartments | 108 | 5.6% |
| Mobile Home / Other | 53 | 2.8% |
| Total | 1,915 | 100.0% |
Housing Structures by Occupancy in Henderson
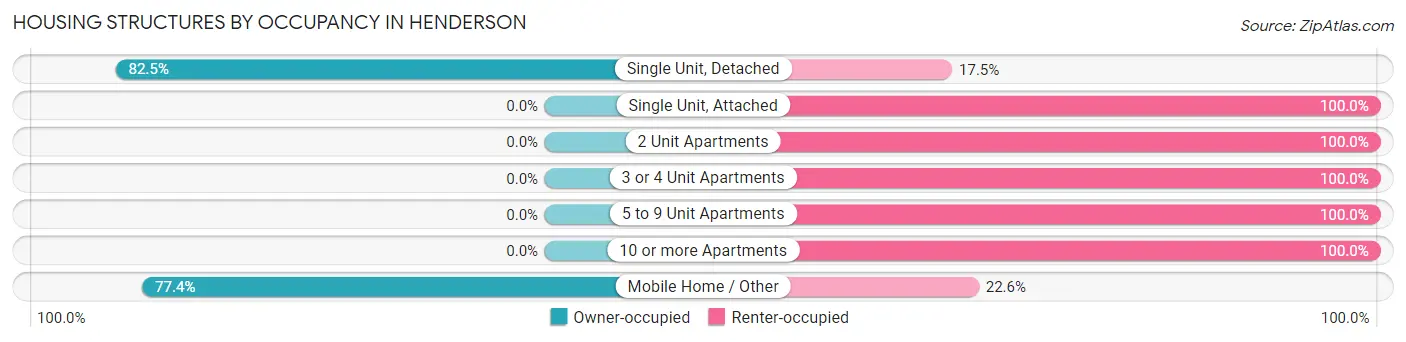
| Structure Type | Owner-occupied | Renter-occupied |
| Single Unit, Detached | 1,159 (82.5%) | 246 (17.5%) |
| Single Unit, Attached | 0 (0.0%) | 19 (100.0%) |
| 2 Unit Apartments | 0 (0.0%) | 244 (100.0%) |
| 3 or 4 Unit Apartments | 0 (0.0%) | 20 (100.0%) |
| 5 to 9 Unit Apartments | 0 (0.0%) | 66 (100.0%) |
| 10 or more Apartments | 0 (0.0%) | 108 (100.0%) |
| Mobile Home / Other | 41 (77.4%) | 12 (22.6%) |
| Total | 1,200 (62.7%) | 715 (37.3%) |
Housing Structures by Number of Rooms in Henderson
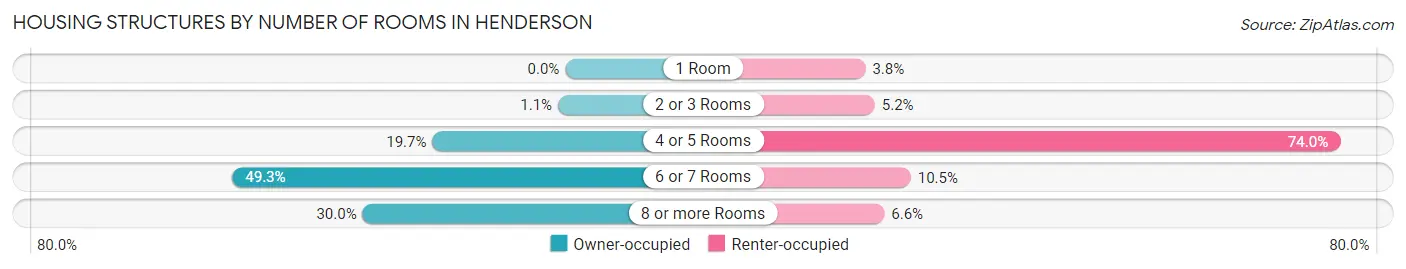
| Number of Rooms | Owner-occupied | Renter-occupied |
| 1 Room | 0 (0.0%) | 27 (3.8%) |
| 2 or 3 Rooms | 13 (1.1%) | 37 (5.2%) |
| 4 or 5 Rooms | 236 (19.7%) | 529 (74.0%) |
| 6 or 7 Rooms | 591 (49.2%) | 75 (10.5%) |
| 8 or more Rooms | 360 (30.0%) | 47 (6.6%) |
| Total | 1,200 (100.0%) | 715 (100.0%) |
Housing Structure by Heating Type in Henderson
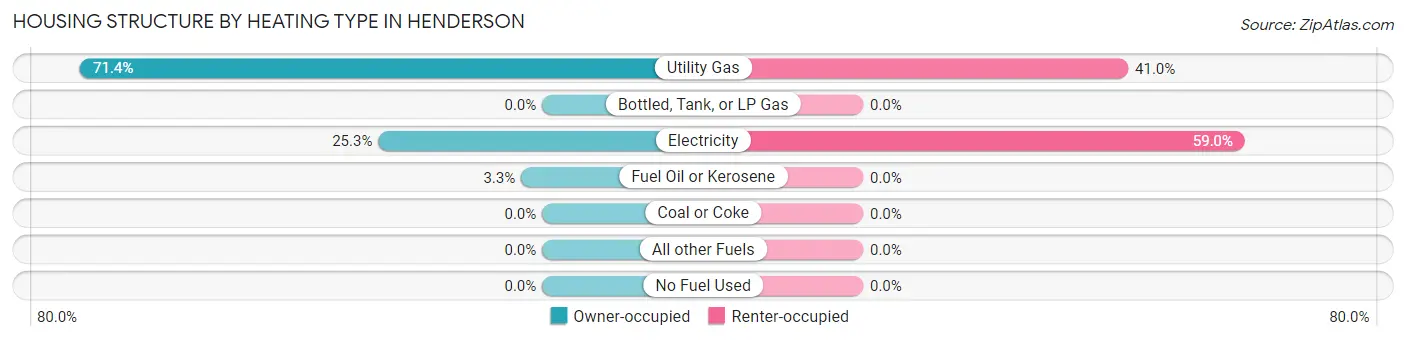
| Heating Type | Owner-occupied | Renter-occupied |
| Utility Gas | 857 (71.4%) | 293 (41.0%) |
| Bottled, Tank, or LP Gas | 0 (0.0%) | 0 (0.0%) |
| Electricity | 304 (25.3%) | 422 (59.0%) |
| Fuel Oil or Kerosene | 39 (3.3%) | 0 (0.0%) |
| Coal or Coke | 0 (0.0%) | 0 (0.0%) |
| All other Fuels | 0 (0.0%) | 0 (0.0%) |
| No Fuel Used | 0 (0.0%) | 0 (0.0%) |
| Total | 1,200 (100.0%) | 715 (100.0%) |
Household Vehicle Usage in Henderson
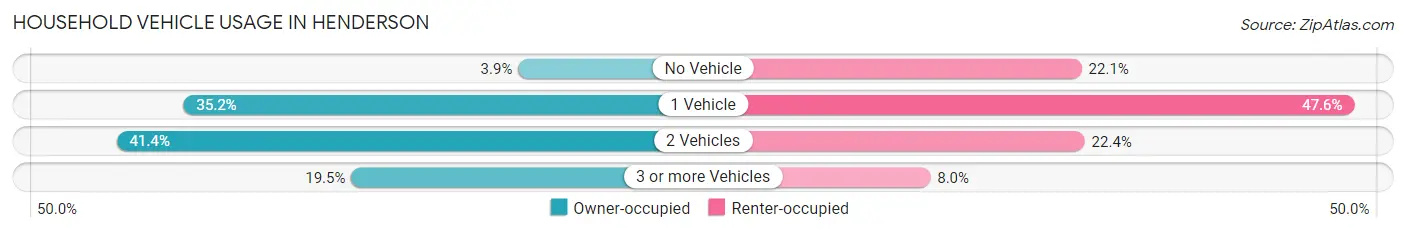
| Vehicles per Household | Owner-occupied | Renter-occupied |
| No Vehicle | 47 (3.9%) | 158 (22.1%) |
| 1 Vehicle | 422 (35.2%) | 340 (47.5%) |
| 2 Vehicles | 497 (41.4%) | 160 (22.4%) |
| 3 or more Vehicles | 234 (19.5%) | 57 (8.0%) |
| Total | 1,200 (100.0%) | 715 (100.0%) |
Real Estate & Mortgages in Henderson
Real Estate and Mortgage Overview in Henderson
| Characteristic | Without Mortgage | With Mortgage |
| Housing Units | 495 | 705 |
| Median Property Value | $103,900 | $129,900 |
| Median Household Income | $36,302 | $39 |
| Monthly Housing Costs | $350 | $10 |
| Real Estate Taxes | $593 | $6 |
Property Value by Mortgage Status in Henderson
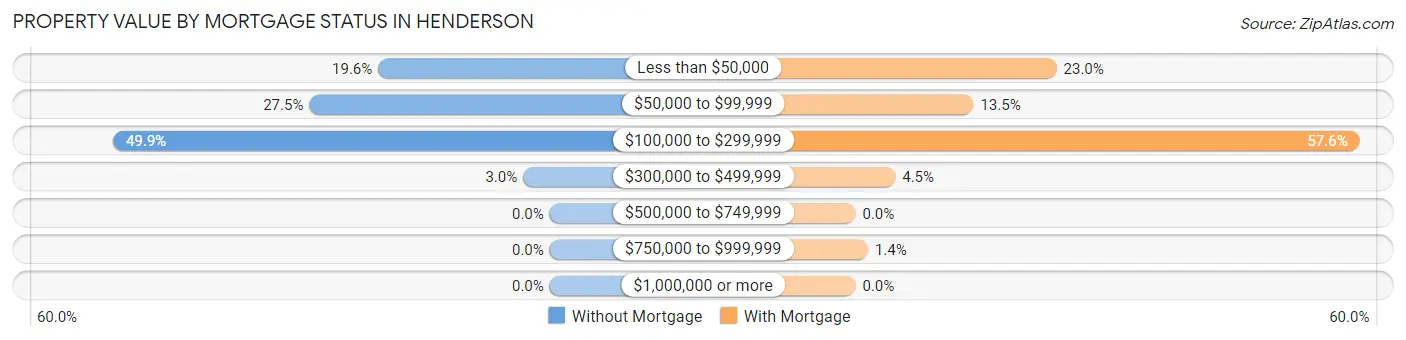
| Property Value | Without Mortgage | With Mortgage |
| Less than $50,000 | 97 (19.6%) | 162 (23.0%) |
| $50,000 to $99,999 | 136 (27.5%) | 95 (13.5%) |
| $100,000 to $299,999 | 247 (49.9%) | 406 (57.6%) |
| $300,000 to $499,999 | 15 (3.0%) | 32 (4.5%) |
| $500,000 to $749,999 | 0 (0.0%) | 0 (0.0%) |
| $750,000 to $999,999 | 0 (0.0%) | 10 (1.4%) |
| $1,000,000 or more | 0 (0.0%) | 0 (0.0%) |
| Total | 495 (100.0%) | 705 (100.0%) |
Household Income by Mortgage Status in Henderson
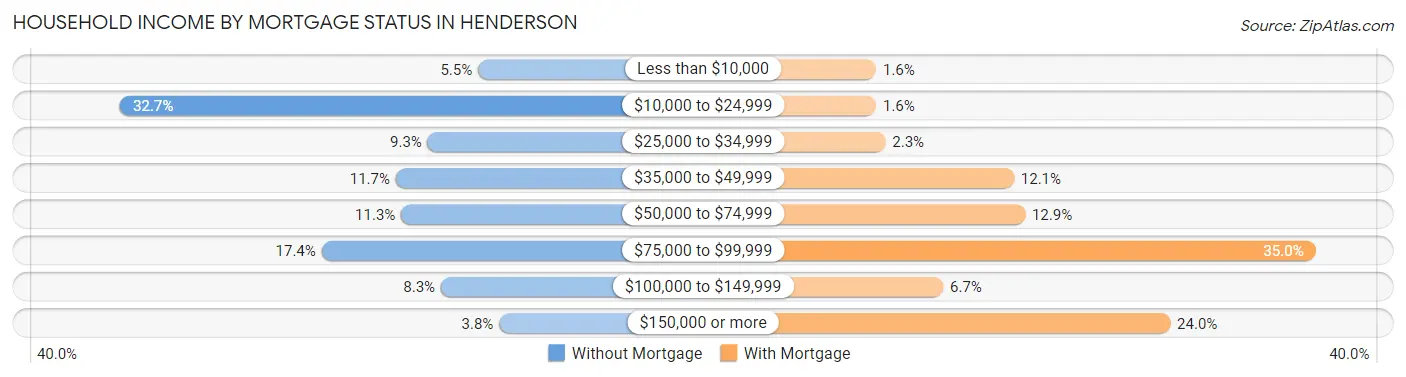
| Household Income | Without Mortgage | With Mortgage |
| Less than $10,000 | 27 (5.4%) | 11 (1.6%) |
| $10,000 to $24,999 | 162 (32.7%) | 11 (1.6%) |
| $25,000 to $34,999 | 46 (9.3%) | 16 (2.3%) |
| $35,000 to $49,999 | 58 (11.7%) | 85 (12.1%) |
| $50,000 to $74,999 | 56 (11.3%) | 91 (12.9%) |
| $75,000 to $99,999 | 86 (17.4%) | 247 (35.0%) |
| $100,000 to $149,999 | 41 (8.3%) | 47 (6.7%) |
| $150,000 or more | 19 (3.8%) | 169 (24.0%) |
| Total | 495 (100.0%) | 705 (100.0%) |
Property Value to Household Income Ratio in Henderson
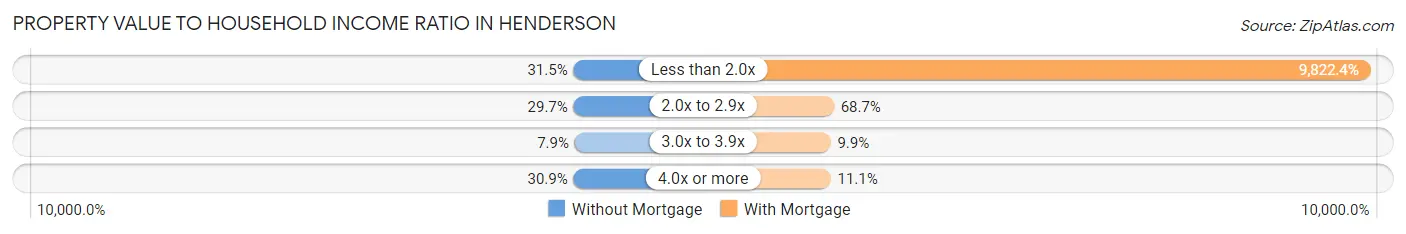
| Value-to-Income Ratio | Without Mortgage | With Mortgage |
| Less than 2.0x | 156 (31.5%) | 69,248 (9,822.4%) |
| 2.0x to 2.9x | 147 (29.7%) | 484 (68.6%) |
| 3.0x to 3.9x | 39 (7.9%) | 70 (9.9%) |
| 4.0x or more | 153 (30.9%) | 78 (11.1%) |
| Total | 495 (100.0%) | 705 (100.0%) |
Real Estate Taxes by Mortgage Status in Henderson
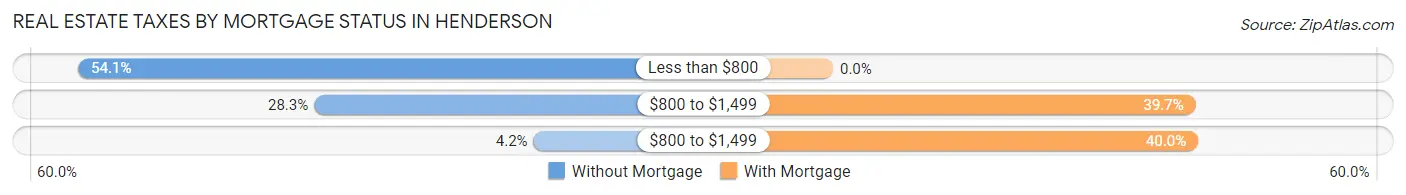
| Property Taxes | Without Mortgage | With Mortgage |
| Less than $800 | 268 (54.1%) | 0 (0.0%) |
| $800 to $1,499 | 140 (28.3%) | 280 (39.7%) |
| $800 to $1,499 | 21 (4.2%) | 282 (40.0%) |
| Total | 495 (100.0%) | 705 (100.0%) |
Health & Disability in Henderson
Health Insurance Coverage by Age in Henderson

| Age Bracket | With Coverage | Without Coverage |
| Under 6 Years | 442 (100.0%) | 0 (0.0%) |
| 6 to 18 Years | 1,087 (95.3%) | 54 (4.7%) |
| 19 to 25 Years | 1,379 (92.7%) | 108 (7.3%) |
| 26 to 34 Years | 678 (91.5%) | 63 (8.5%) |
| 35 to 44 Years | 463 (89.0%) | 57 (11.0%) |
| 45 to 54 Years | 567 (79.7%) | 144 (20.3%) |
| 55 to 64 Years | 286 (90.5%) | 30 (9.5%) |
| 65 to 74 Years | 488 (100.0%) | 0 (0.0%) |
| 75 Years and older | 285 (100.0%) | 0 (0.0%) |
| Total | 5,675 (92.6%) | 456 (7.4%) |
Health Insurance Coverage by Citizenship Status in Henderson
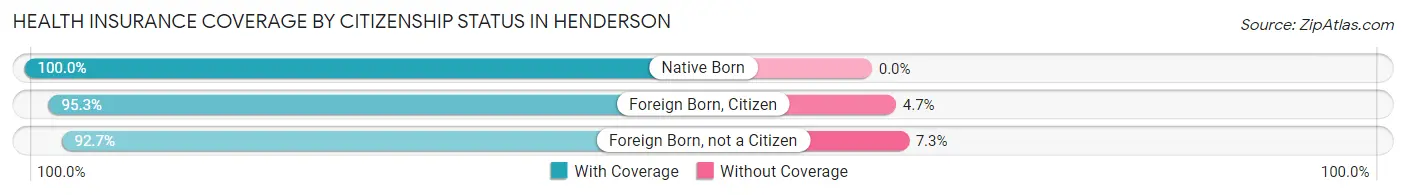
| Citizenship Status | With Coverage | Without Coverage |
| Native Born | 442 (100.0%) | 0 (0.0%) |
| Foreign Born, Citizen | 1,087 (95.3%) | 54 (4.7%) |
| Foreign Born, not a Citizen | 1,379 (92.7%) | 108 (7.3%) |
Health Insurance Coverage by Household Income in Henderson
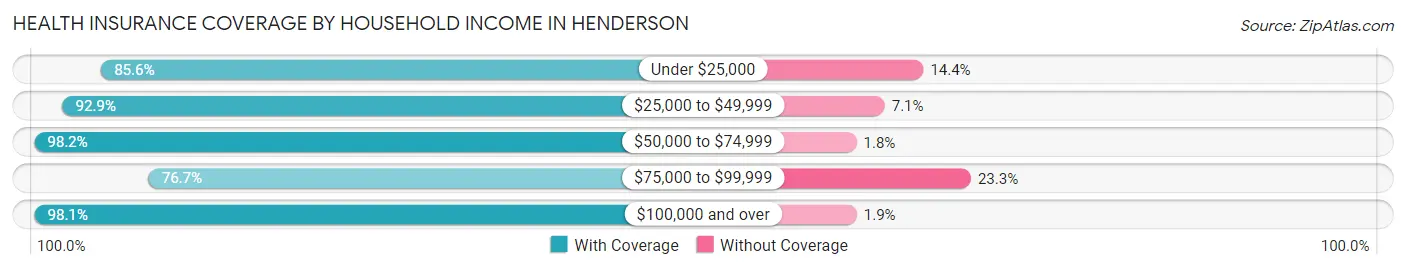
| Household Income | With Coverage | Without Coverage |
| Under $25,000 | 978 (85.6%) | 164 (14.4%) |
| $25,000 to $49,999 | 1,200 (92.9%) | 92 (7.1%) |
| $50,000 to $74,999 | 1,022 (98.2%) | 19 (1.8%) |
| $75,000 to $99,999 | 432 (76.7%) | 131 (23.3%) |
| $100,000 and over | 990 (98.1%) | 19 (1.9%) |
Public vs Private Health Insurance Coverage by Age in Henderson
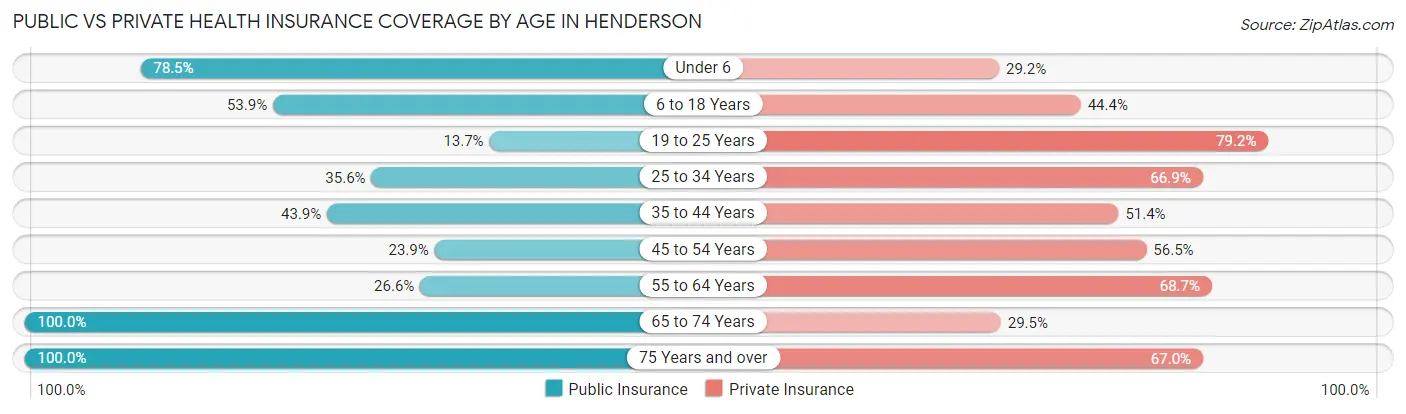
| Age Bracket | Public Insurance | Private Insurance |
| Under 6 | 347 (78.5%) | 129 (29.2%) |
| 6 to 18 Years | 615 (53.9%) | 506 (44.4%) |
| 19 to 25 Years | 204 (13.7%) | 1,177 (79.1%) |
| 25 to 34 Years | 264 (35.6%) | 496 (66.9%) |
| 35 to 44 Years | 228 (43.9%) | 267 (51.3%) |
| 45 to 54 Years | 170 (23.9%) | 402 (56.5%) |
| 55 to 64 Years | 84 (26.6%) | 217 (68.7%) |
| 65 to 74 Years | 488 (100.0%) | 144 (29.5%) |
| 75 Years and over | 285 (100.0%) | 191 (67.0%) |
| Total | 2,685 (43.8%) | 3,529 (57.6%) |
Disability Status by Sex by Age in Henderson
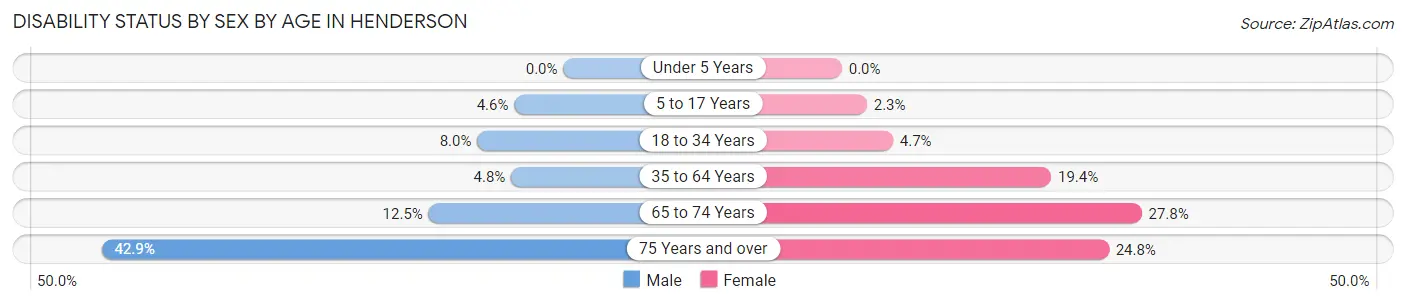
| Age Bracket | Male | Female |
| Under 5 Years | 0 (0.0%) | 0 (0.0%) |
| 5 to 17 Years | 25 (4.5%) | 12 (2.3%) |
| 18 to 34 Years | 91 (8.0%) | 58 (4.7%) |
| 35 to 64 Years | 35 (4.8%) | 160 (19.4%) |
| 65 to 74 Years | 30 (12.5%) | 69 (27.8%) |
| 75 Years and over | 27 (42.9%) | 55 (24.8%) |
Disability Class by Sex by Age in Henderson
Disability Class: Hearing Difficulty
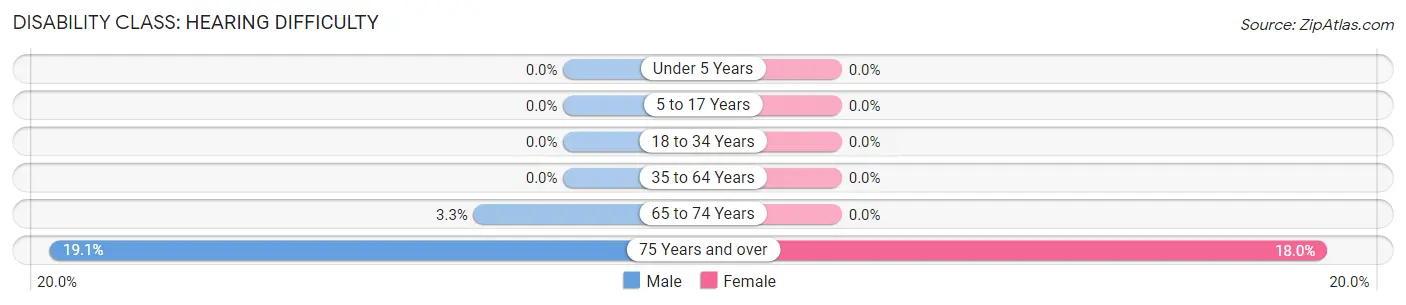
| Age Bracket | Male | Female |
| Under 5 Years | 0 (0.0%) | 0 (0.0%) |
| 5 to 17 Years | 0 (0.0%) | 0 (0.0%) |
| 18 to 34 Years | 0 (0.0%) | 0 (0.0%) |
| 35 to 64 Years | 0 (0.0%) | 0 (0.0%) |
| 65 to 74 Years | 8 (3.3%) | 0 (0.0%) |
| 75 Years and over | 12 (19.1%) | 40 (18.0%) |
Disability Class: Vision Difficulty
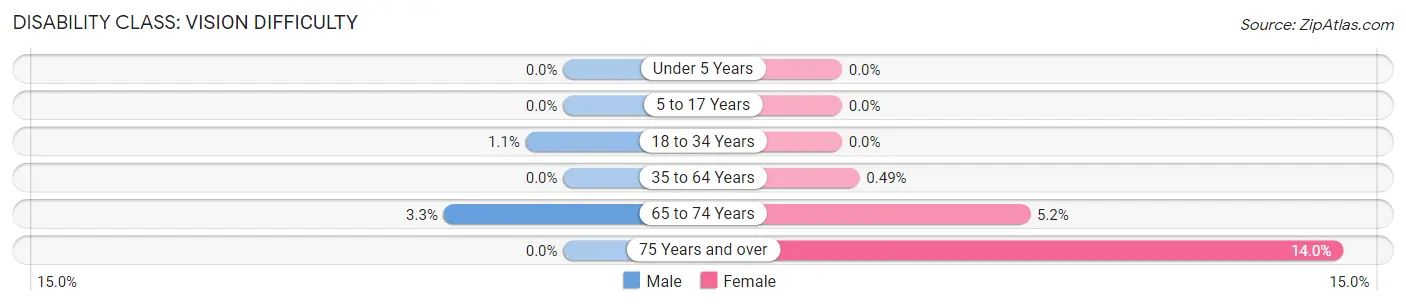
| Age Bracket | Male | Female |
| Under 5 Years | 0 (0.0%) | 0 (0.0%) |
| 5 to 17 Years | 0 (0.0%) | 0 (0.0%) |
| 18 to 34 Years | 12 (1.1%) | 0 (0.0%) |
| 35 to 64 Years | 0 (0.0%) | 4 (0.5%) |
| 65 to 74 Years | 8 (3.3%) | 13 (5.2%) |
| 75 Years and over | 0 (0.0%) | 31 (14.0%) |
Disability Class: Cognitive Difficulty
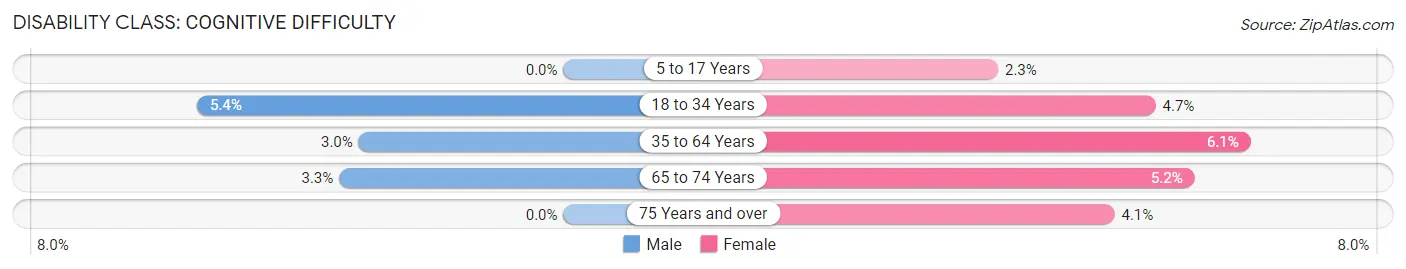
| Age Bracket | Male | Female |
| 5 to 17 Years | 0 (0.0%) | 12 (2.3%) |
| 18 to 34 Years | 62 (5.4%) | 57 (4.7%) |
| 35 to 64 Years | 22 (3.0%) | 50 (6.1%) |
| 65 to 74 Years | 8 (3.3%) | 13 (5.2%) |
| 75 Years and over | 0 (0.0%) | 9 (4.1%) |
Disability Class: Ambulatory Difficulty
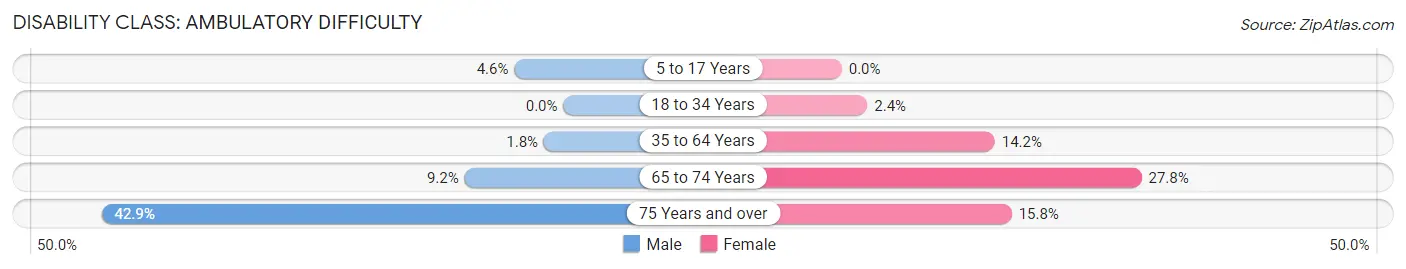
| Age Bracket | Male | Female |
| 5 to 17 Years | 25 (4.5%) | 0 (0.0%) |
| 18 to 34 Years | 0 (0.0%) | 29 (2.4%) |
| 35 to 64 Years | 13 (1.8%) | 117 (14.2%) |
| 65 to 74 Years | 22 (9.2%) | 69 (27.8%) |
| 75 Years and over | 27 (42.9%) | 35 (15.8%) |
Disability Class: Self-Care Difficulty
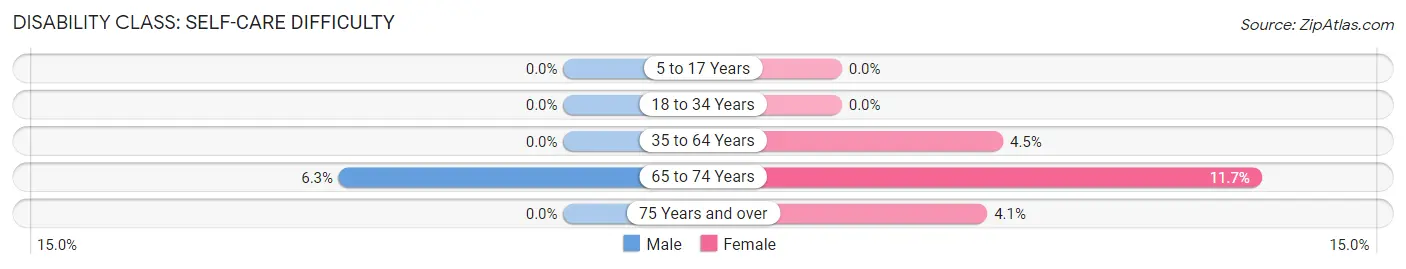
| Age Bracket | Male | Female |
| 5 to 17 Years | 0 (0.0%) | 0 (0.0%) |
| 18 to 34 Years | 0 (0.0%) | 0 (0.0%) |
| 35 to 64 Years | 0 (0.0%) | 37 (4.5%) |
| 65 to 74 Years | 15 (6.2%) | 29 (11.7%) |
| 75 Years and over | 0 (0.0%) | 9 (4.1%) |
Technology Access in Henderson
Computing Device Access in Henderson
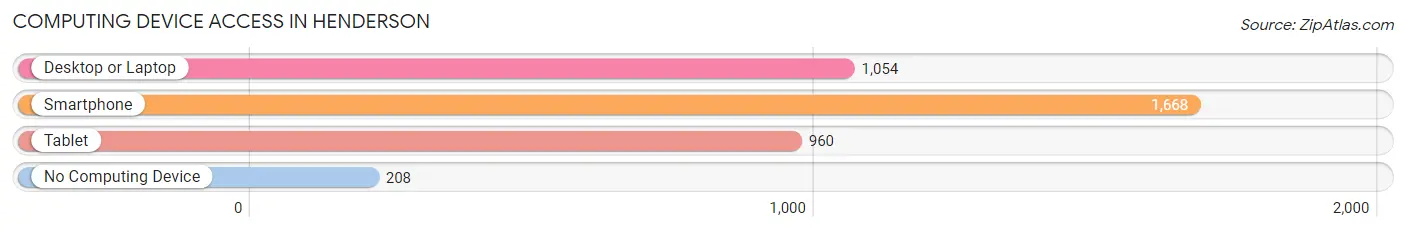
| Device Type | # Households | % Households |
| Desktop or Laptop | 1,054 | 55.0% |
| Smartphone | 1,668 | 87.1% |
| Tablet | 960 | 50.1% |
| No Computing Device | 208 | 10.9% |
| Total | 1,915 | 100.0% |
Internet Access in Henderson
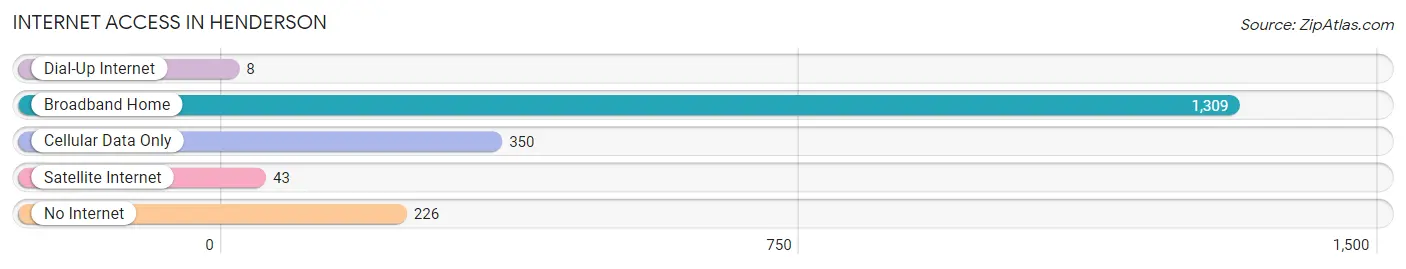
| Internet Type | # Households | % Households |
| Dial-Up Internet | 8 | 0.4% |
| Broadband Home | 1,309 | 68.4% |
| Cellular Data Only | 350 | 18.3% |
| Satellite Internet | 43 | 2.2% |
| No Internet | 226 | 11.8% |
| Total | 1,915 | 100.0% |
Henderson Summary
Henderson, Tennessee is a small city located in Chester County, in the western part of the state. It is situated along the banks of the Mississippi River, and is part of the Jackson metropolitan area. The city has a population of around 8,000 people, and is the county seat of Chester County.
History
Henderson was founded in 1821 by William Henderson, a Revolutionary War veteran. He named the town after himself, and it was incorporated in 1838. The city was an important trading center during the 19th century, and was the site of a major Civil War battle in 1862. After the war, the city experienced a period of growth and prosperity, and by the early 20th century, it had become a major industrial center.
Geography
Henderson is located in western Tennessee, in Chester County. It is situated along the banks of the Mississippi River, and is part of the Jackson metropolitan area. The city has a total area of 4.2 square miles, all of which is land. The terrain is mostly flat, with some rolling hills in the surrounding area.
Economy
Henderson’s economy is largely based on agriculture and manufacturing. The city is home to several large manufacturing plants, including a paper mill, a furniture factory, and a plastics plant. Agriculture is also an important part of the local economy, with corn, soybeans, and cotton being the main crops. The city also has a thriving tourism industry, with many visitors coming to enjoy the city’s historic sites and natural beauty.
Demographics
As of the 2010 census, Henderson had a population of 8,000 people. The racial makeup of the city was 79.3% White, 17.2% African American, 0.3% Native American, 0.7% Asian, 0.1% Pacific Islander, and 2.4% from other races. The median household income was $35,000, and the median family income was $41,000. The per capita income was $17,000.
Henderson is a small city with a rich history and a vibrant economy. It is home to a diverse population, and offers a variety of attractions and activities for visitors and residents alike. With its convenient location along the Mississippi River, Henderson is an ideal place to live, work, and play.
Common Questions
What is Per Capita Income in Henderson?
Per Capita income in Henderson is $17,896.
What is the Median Family Income in Henderson?
Median Family Income in Henderson is $56,061.
What is the Median Household income in Henderson?
Median Household Income in Henderson is $44,077.
What is Income or Wage Gap in Henderson?
Income or Wage Gap in Henderson is 72.6%.
Women in Henderson earn 27.4 cents for every dollar earned by a man.
What is Inequality or Gini Index in Henderson?
Inequality or Gini Index in Henderson is 0.42.
What is the Total Population of Henderson?
Total Population of Henderson is 6,326.
What is the Total Male Population of Henderson?
Total Male Population of Henderson is 3,019.
What is the Total Female Population of Henderson?
Total Female Population of Henderson is 3,307.
What is the Ratio of Males per 100 Females in Henderson?
There are 91.29 Males per 100 Females in Henderson.
What is the Ratio of Females per 100 Males in Henderson?
There are 109.54 Females per 100 Males in Henderson.
What is the Median Population Age in Henderson?
Median Population Age in Henderson is 26.8 Years.
What is the Average Family Size in Henderson
Average Family Size in Henderson is 3.2 People.
What is the Average Household Size in Henderson
Average Household Size in Henderson is 2.6 People.
How Large is the Labor Force in Henderson?
There are 2,264 People in the Labor Forcein in Henderson.
What is the Percentage of People in the Labor Force in Henderson?
45.0% of People are in the Labor Force in Henderson.
What is the Unemployment Rate in Henderson?
Unemployment Rate in Henderson is 3.7%.