Munford, TN Map & Demographics
Munford Map
Munford Overview
$33,711
PER CAPITA INCOME
$89,310
AVG FAMILY INCOME
$89,397
AVG HOUSEHOLD INCOME
9.0%
WAGE / INCOME GAP [ % ]
91.0¢/ $1
WAGE / INCOME GAP [ $ ]
0.33
INEQUALITY / GINI INDEX
6,357
TOTAL POPULATION
3,290
MALE POPULATION
3,067
FEMALE POPULATION
107.27
MALES / 100 FEMALES
93.22
FEMALES / 100 MALES
33.5
MEDIAN AGE
3.5
AVG FAMILY SIZE
3.0
AVG HOUSEHOLD SIZE
3,375
LABOR FORCE [ PEOPLE ]
69.0%
PERCENT IN LABOR FORCE
8.2%
UNEMPLOYMENT RATE
Munford Zip Codes
Munford Area Codes
Income in Munford
Income Overview in Munford
Per Capita Income in Munford is $33,711, while median incomes of families and households are $89,310 and $89,397 respectively.
| Characteristic | Number | Measure |
| Per Capita Income | 6,357 | $33,711 |
| Median Family Income | 1,594 | $89,310 |
| Mean Family Income | 1,594 | $103,601 |
| Median Household Income | 2,112 | $89,397 |
| Mean Household Income | 2,112 | $101,102 |
| Income Deficit | 1,594 | $0 |
| Wage / Income Gap (%) | 6,357 | 9.00% |
| Wage / Income Gap ($) | 6,357 | 91.00¢ per $1 |
| Gini / Inequality Index | 6,357 | 0.33 |
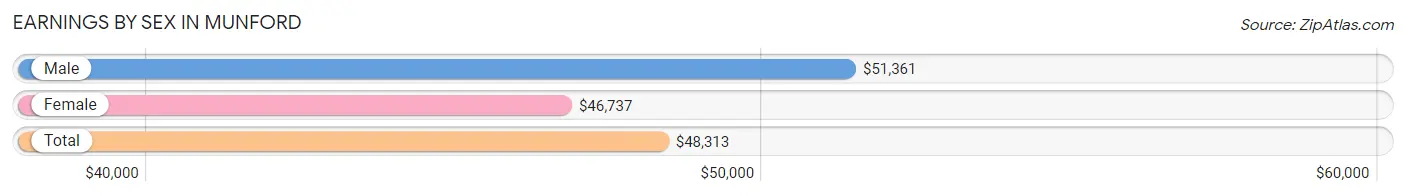
Earnings by Sex in Munford
Average Earnings in Munford are $48,313, $51,361 for men and $46,737 for women, a difference of 9.0%.
| Sex | Number | Average Earnings |
| Male | 2,043 (59.3%) | $51,361 |
| Female | 1,404 (40.7%) | $46,737 |
| Total | 3,447 (100.0%) | $48,313 |
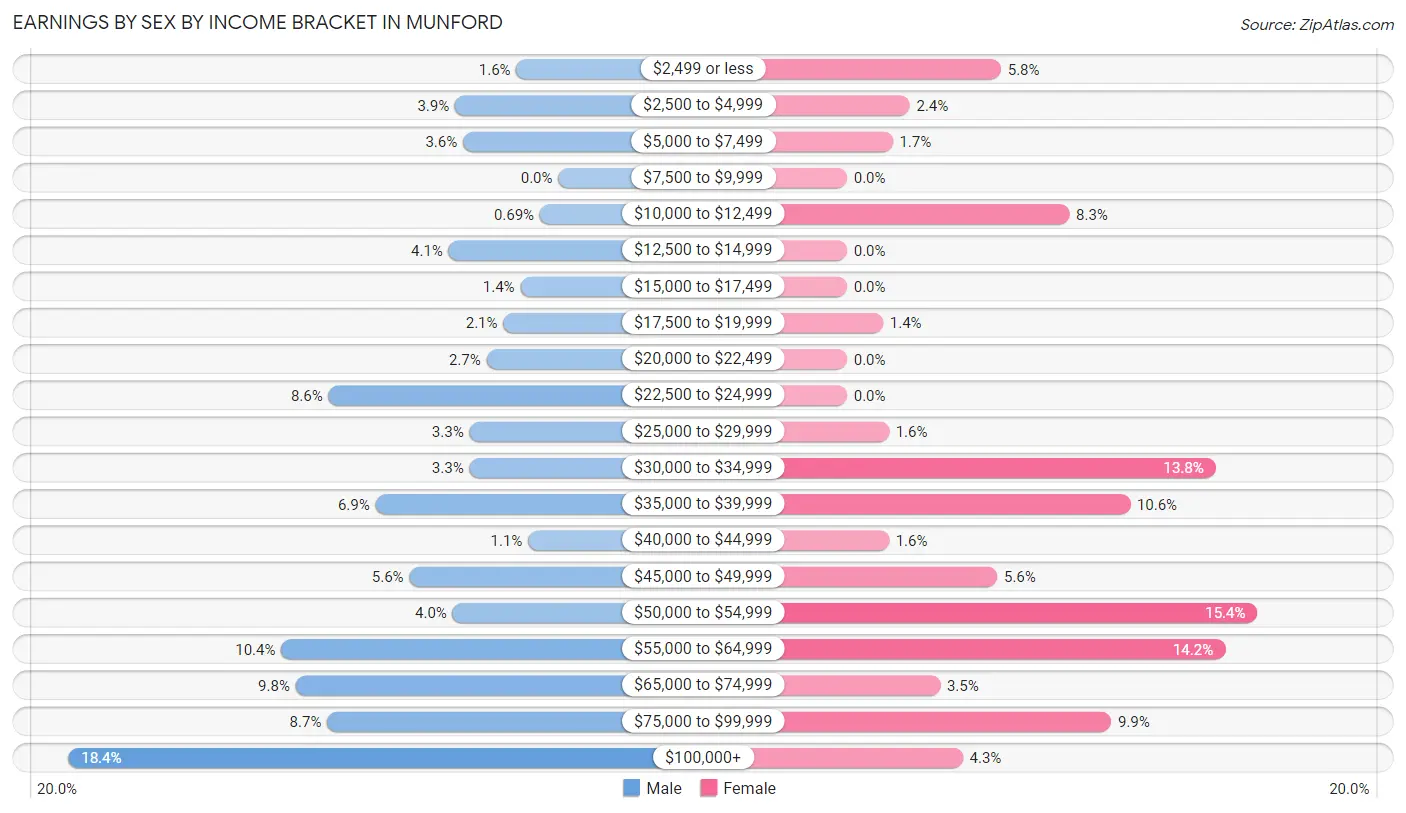
Earnings by Sex by Income Bracket in Munford
The most common earnings brackets in Munford are $100,000+ for men (375 | 18.4%) and $50,000 to $54,999 for women (216 | 15.4%).
| Income | Male | Female |
| $2,499 or less | 32 (1.6%) | 81 (5.8%) |
| $2,500 to $4,999 | 79 (3.9%) | 33 (2.4%) |
| $5,000 to $7,499 | 73 (3.6%) | 24 (1.7%) |
| $7,500 to $9,999 | 0 (0.0%) | 0 (0.0%) |
| $10,000 to $12,499 | 14 (0.7%) | 117 (8.3%) |
| $12,500 to $14,999 | 84 (4.1%) | 0 (0.0%) |
| $15,000 to $17,499 | 29 (1.4%) | 0 (0.0%) |
| $17,500 to $19,999 | 42 (2.1%) | 19 (1.3%) |
| $20,000 to $22,499 | 55 (2.7%) | 0 (0.0%) |
| $22,500 to $24,999 | 176 (8.6%) | 0 (0.0%) |
| $25,000 to $29,999 | 68 (3.3%) | 22 (1.6%) |
| $30,000 to $34,999 | 68 (3.3%) | 194 (13.8%) |
| $35,000 to $39,999 | 140 (6.9%) | 149 (10.6%) |
| $40,000 to $44,999 | 23 (1.1%) | 22 (1.6%) |
| $45,000 to $49,999 | 114 (5.6%) | 79 (5.6%) |
| $50,000 to $54,999 | 81 (4.0%) | 216 (15.4%) |
| $55,000 to $64,999 | 212 (10.4%) | 199 (14.2%) |
| $65,000 to $74,999 | 201 (9.8%) | 49 (3.5%) |
| $75,000 to $99,999 | 177 (8.7%) | 139 (9.9%) |
| $100,000+ | 375 (18.4%) | 61 (4.3%) |
| Total | 2,043 (100.0%) | 1,404 (100.0%) |
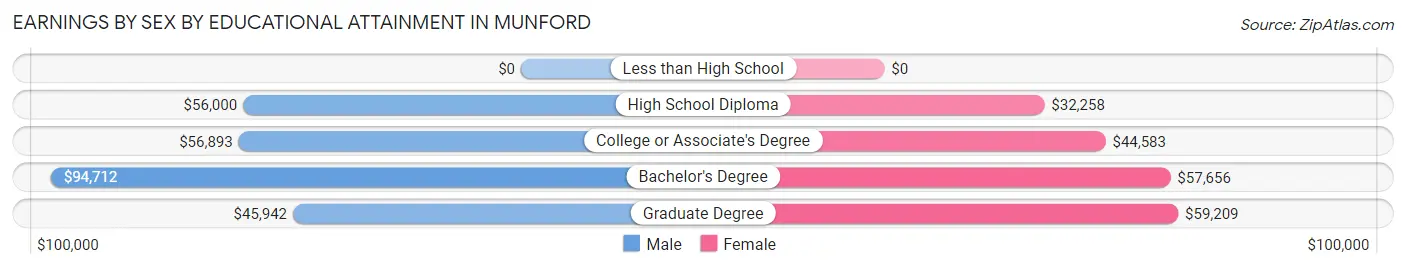
Earnings by Sex by Educational Attainment in Munford
Average earnings in Munford are $56,957 for men and $50,753 for women, a difference of 10.9%. Men with an educational attainment of bachelor's degree enjoy the highest average annual earnings of $94,712, while those with graduate degree education earn the least with $45,942. Women with an educational attainment of graduate degree earn the most with the average annual earnings of $59,209, while those with high school diploma education have the smallest earnings of $32,258.
| Educational Attainment | Male Income | Female Income |
| Less than High School | - | - |
| High School Diploma | $56,000 | $32,258 |
| College or Associate's Degree | $56,893 | $44,583 |
| Bachelor's Degree | $94,712 | $57,656 |
| Graduate Degree | $45,942 | $59,209 |
| Total | $56,957 | $50,753 |
Family Income in Munford
Family Income Brackets in Munford
According to the Munford family income data, there are 469 families falling into the $100,000 to $149,999 income range, which is the most common income bracket and makes up 29.4% of all families.
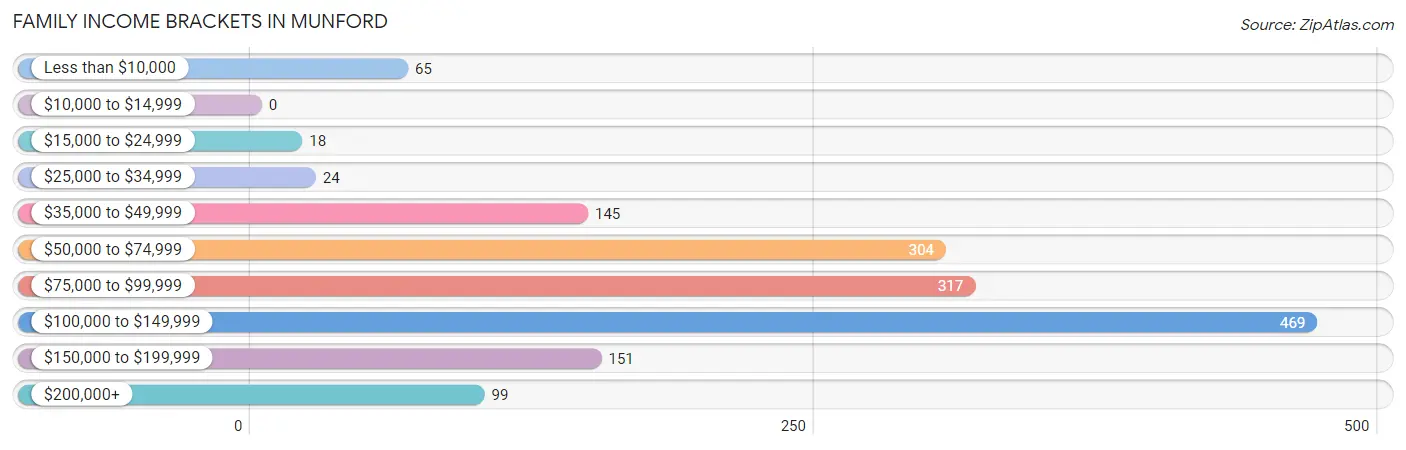
| Income Bracket | # Families | % Families |
| Less than $10,000 | 65 | 4.1% |
| $10,000 to $14,999 | 0 | 0.0% |
| $15,000 to $24,999 | 18 | 1.1% |
| $25,000 to $34,999 | 24 | 1.5% |
| $35,000 to $49,999 | 145 | 9.1% |
| $50,000 to $74,999 | 304 | 19.1% |
| $75,000 to $99,999 | 317 | 19.9% |
| $100,000 to $149,999 | 469 | 29.4% |
| $150,000 to $199,999 | 151 | 9.5% |
| $200,000+ | 99 | 6.2% |
Family Income by Famaliy Size in Munford
5-person families (167 | 10.5%) account for the highest median family income in Munford with $124,508 per family, while 3-person families (318 | 20.0%) have the highest median income of $40,432 per family member.
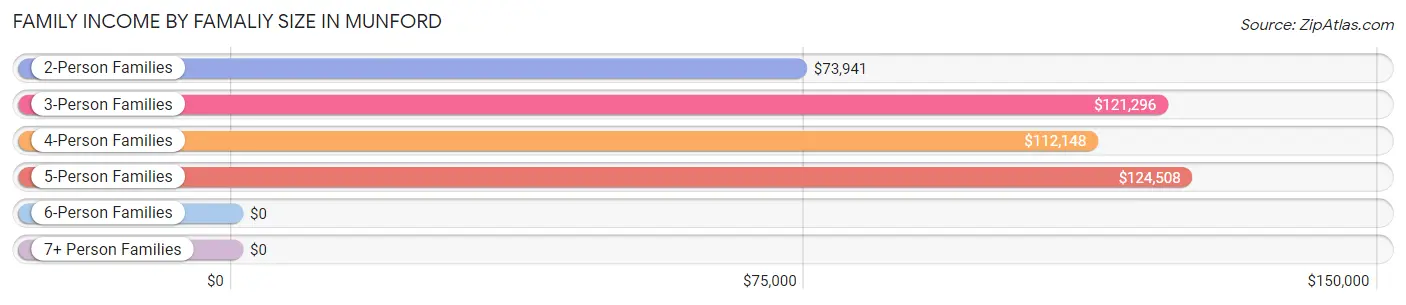
| Income Bracket | # Families | Median Income |
| 2-Person Families | 653 (41.0%) | $73,941 |
| 3-Person Families | 318 (20.0%) | $121,296 |
| 4-Person Families | 347 (21.8%) | $112,148 |
| 5-Person Families | 167 (10.5%) | $124,508 |
| 6-Person Families | 42 (2.6%) | $0 |
| 7+ Person Families | 67 (4.2%) | $0 |
| Total | 1,594 (100.0%) | $89,310 |
Family Income by Number of Earners in Munford
The median family income in Munford is $89,310, with families comprising 3+ earners (232) having the highest median family income of $137,908, while families with no earners (141) have the lowest median family income of $58,750, accounting for 14.5% and 8.8% of families, respectively.
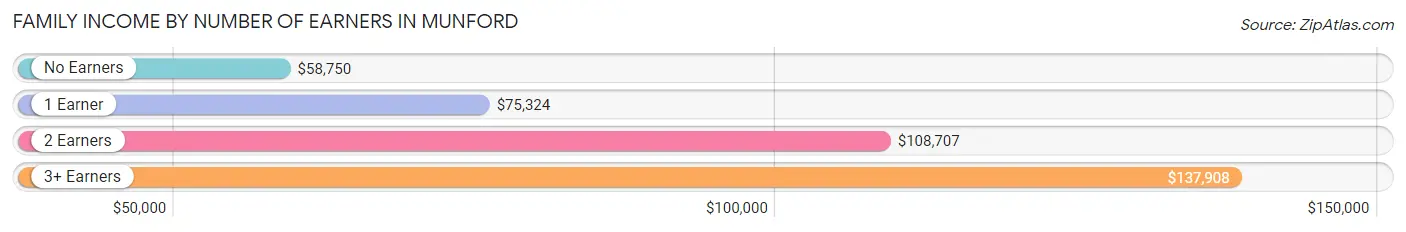
| Number of Earners | # Families | Median Income |
| No Earners | 141 (8.8%) | $58,750 |
| 1 Earner | 593 (37.2%) | $75,324 |
| 2 Earners | 628 (39.4%) | $108,707 |
| 3+ Earners | 232 (14.5%) | $137,908 |
| Total | 1,594 (100.0%) | $89,310 |
Household Income in Munford
Household Income Brackets in Munford
With 598 households falling in the category, the $100,000 to $149,999 income range is the most frequent in Munford, accounting for 28.3% of all households. In contrast, only 17 households (0.8%) fall into the $10,000 to $14,999 income bracket, making it the least populous group.
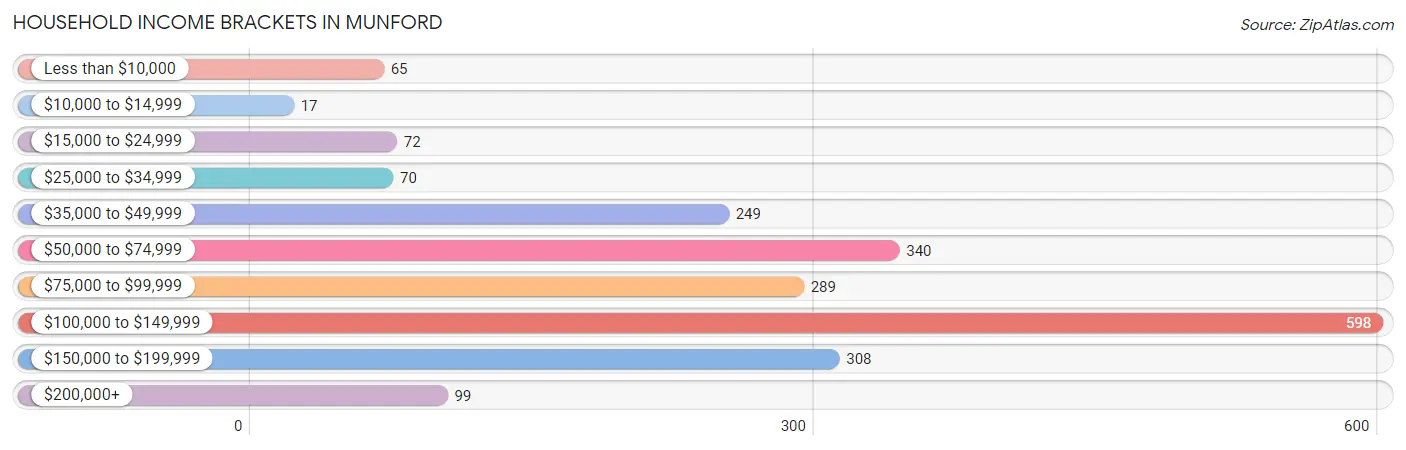
| Income Bracket | # Households | % Households |
| Less than $10,000 | 65 | 3.1% |
| $10,000 to $14,999 | 17 | 0.8% |
| $15,000 to $24,999 | 72 | 3.4% |
| $25,000 to $34,999 | 70 | 3.3% |
| $35,000 to $49,999 | 249 | 11.8% |
| $50,000 to $74,999 | 340 | 16.1% |
| $75,000 to $99,999 | 289 | 13.7% |
| $100,000 to $149,999 | 598 | 28.3% |
| $150,000 to $199,999 | 308 | 14.6% |
| $200,000+ | 99 | 4.7% |
Household Income by Householder Age in Munford
The median household income in Munford is $89,397, with the highest median household income of $110,742 found in the 45 to 64 years age bracket for the primary householder. A total of 765 households (36.2%) fall into this category. Meanwhile, the 65+ years age bracket for the primary householder has the lowest median household income of $57,738, with 314 households (14.9%) in this group.
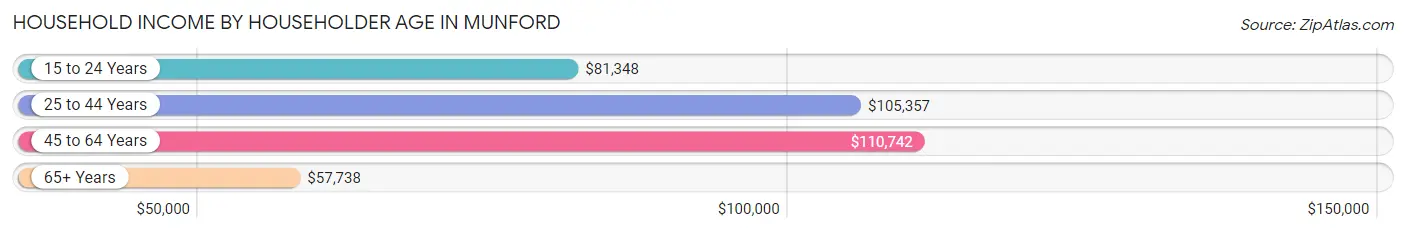
| Income Bracket | # Households | Median Income |
| 15 to 24 Years | 121 (5.7%) | $81,348 |
| 25 to 44 Years | 912 (43.2%) | $105,357 |
| 45 to 64 Years | 765 (36.2%) | $110,742 |
| 65+ Years | 314 (14.9%) | $57,738 |
| Total | 2,112 (100.0%) | $89,397 |
Poverty in Munford
Income Below Poverty by Sex and Age in Munford
With 2.9% poverty level for males and 3.7% for females among the residents of Munford, 35 to 44 year old males and 16 and 17 year old females are the most vulnerable to poverty, with 39 males (8.1%) and 32 females (18.8%) in their respective age groups living below the poverty level.
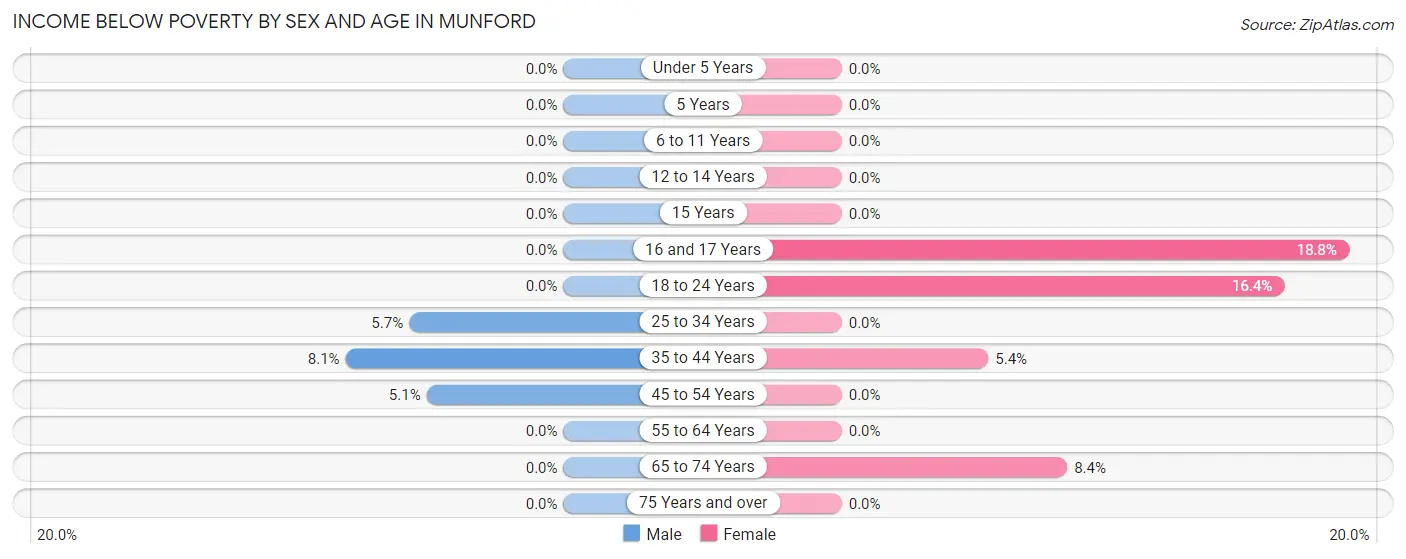
| Age Bracket | Male | Female |
| Under 5 Years | 0 (0.0%) | 0 (0.0%) |
| 5 Years | 0 (0.0%) | 0 (0.0%) |
| 6 to 11 Years | 0 (0.0%) | 0 (0.0%) |
| 12 to 14 Years | 0 (0.0%) | 0 (0.0%) |
| 15 Years | 0 (0.0%) | 0 (0.0%) |
| 16 and 17 Years | 0 (0.0%) | 32 (18.8%) |
| 18 to 24 Years | 0 (0.0%) | 33 (16.4%) |
| 25 to 34 Years | 30 (5.7%) | 0 (0.0%) |
| 35 to 44 Years | 39 (8.1%) | 33 (5.4%) |
| 45 to 54 Years | 27 (5.1%) | 0 (0.0%) |
| 55 to 64 Years | 0 (0.0%) | 0 (0.0%) |
| 65 to 74 Years | 0 (0.0%) | 17 (8.4%) |
| 75 Years and over | 0 (0.0%) | 0 (0.0%) |
| Total | 96 (2.9%) | 115 (3.7%) |
Income Above Poverty by Sex and Age in Munford
According to the poverty statistics in Munford, males aged under 5 years and females aged under 5 years are the age groups that are most secure financially, with 100.0% of males and 100.0% of females in these age groups living above the poverty line.
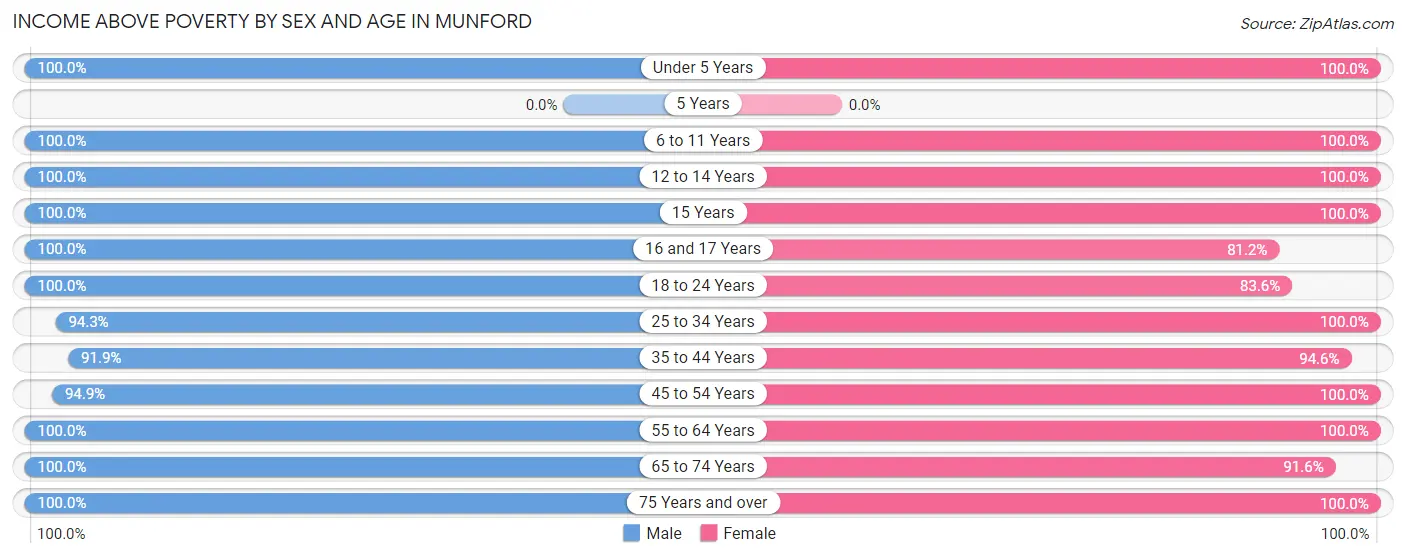
| Age Bracket | Male | Female |
| Under 5 Years | 158 (100.0%) | 208 (100.0%) |
| 5 Years | 0 (0.0%) | 0 (0.0%) |
| 6 to 11 Years | 315 (100.0%) | 390 (100.0%) |
| 12 to 14 Years | 135 (100.0%) | 198 (100.0%) |
| 15 Years | 33 (100.0%) | 29 (100.0%) |
| 16 and 17 Years | 254 (100.0%) | 138 (81.2%) |
| 18 to 24 Years | 308 (100.0%) | 168 (83.6%) |
| 25 to 34 Years | 494 (94.3%) | 347 (100.0%) |
| 35 to 44 Years | 443 (91.9%) | 574 (94.6%) |
| 45 to 54 Years | 505 (94.9%) | 319 (100.0%) |
| 55 to 64 Years | 272 (100.0%) | 293 (100.0%) |
| 65 to 74 Years | 213 (100.0%) | 186 (91.6%) |
| 75 Years and over | 64 (100.0%) | 102 (100.0%) |
| Total | 3,194 (97.1%) | 2,952 (96.3%) |
Income Below Poverty Among Married-Couple Families in Munford
The poverty statistics for married-couple families in Munford show that 5.3% or 66 of the total 1,255 families live below the poverty line. Families with 1 or 2 children have the highest poverty rate of 6.6%, comprising of 33 families. On the other hand, families with 3 or 4 children have the lowest poverty rate of 0.0%, which includes 0 families.
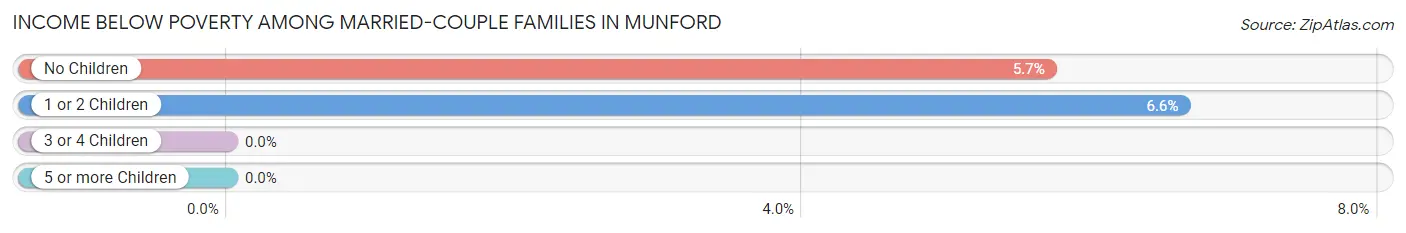
| Children | Above Poverty | Below Poverty |
| No Children | 546 (94.3%) | 33 (5.7%) |
| 1 or 2 Children | 465 (93.4%) | 33 (6.6%) |
| 3 or 4 Children | 111 (100.0%) | 0 (0.0%) |
| 5 or more Children | 67 (100.0%) | 0 (0.0%) |
| Total | 1,189 (94.7%) | 66 (5.3%) |
Income Below Poverty Among Single-Parent Households in Munford
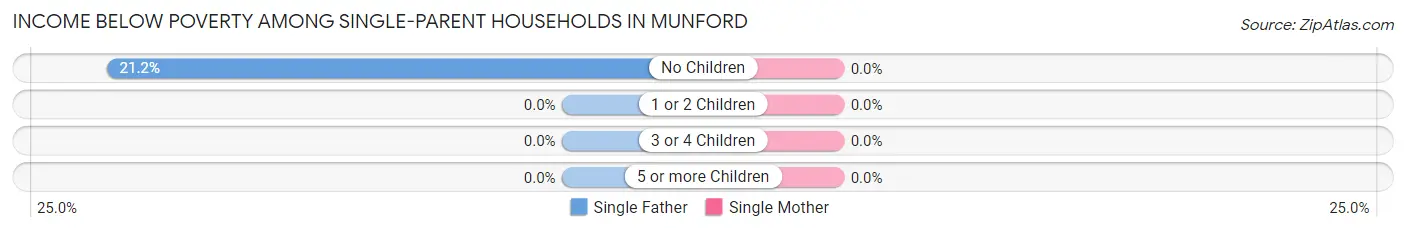
| Children | Single Father | Single Mother |
| No Children | 18 (21.2%) | 0 (0.0%) |
| 1 or 2 Children | 0 (0.0%) | 0 (0.0%) |
| 3 or 4 Children | 0 (0.0%) | 0 (0.0%) |
| 5 or more Children | 0 (0.0%) | 0 (0.0%) |
| Total | 18 (9.1%) | 0 (0.0%) |
Income Below Poverty Among Married-Couple vs Single-Parent Households in Munford
The poverty data for Munford shows that 66 of the married-couple family households (5.3%) and 18 of the single-parent households (5.3%) are living below the poverty level. Within the married-couple family households, those with 1 or 2 children have the highest poverty rate, with 33 households (6.6%) falling below the poverty line. Among the single-parent households, those with no children have the highest poverty rate, with 18 household (14.2%) living below poverty.
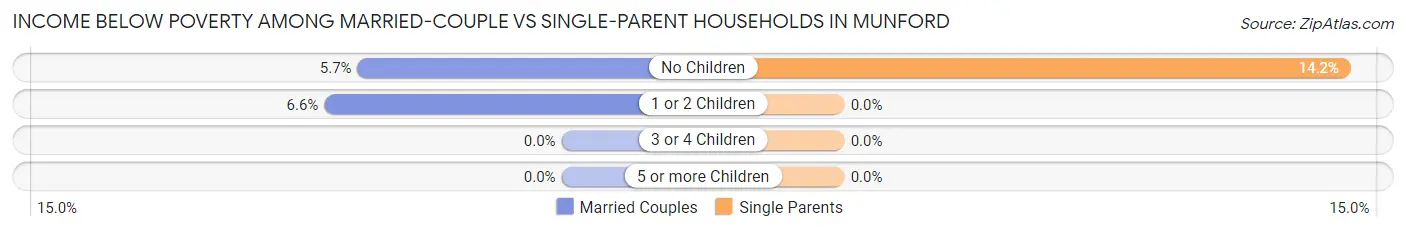
| Children | Married-Couple Families | Single-Parent Households |
| No Children | 33 (5.7%) | 18 (14.2%) |
| 1 or 2 Children | 33 (6.6%) | 0 (0.0%) |
| 3 or 4 Children | 0 (0.0%) | 0 (0.0%) |
| 5 or more Children | 0 (0.0%) | 0 (0.0%) |
| Total | 66 (5.3%) | 18 (5.3%) |
Race in Munford
The most populous races in Munford are White / Caucasian (5,286 | 83.2%), Black / African American (462 | 7.3%), and Two or more Races (311 | 4.9%).
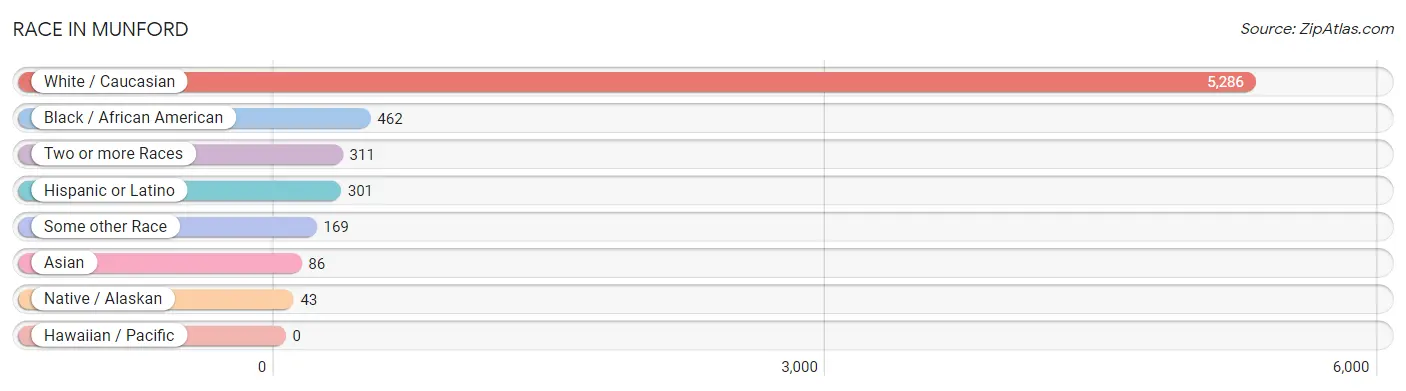
| Race | # Population | % Population |
| Asian | 86 | 1.3% |
| Black / African American | 462 | 7.3% |
| Hawaiian / Pacific | 0 | 0.0% |
| Hispanic or Latino | 301 | 4.7% |
| Native / Alaskan | 43 | 0.7% |
| White / Caucasian | 5,286 | 83.2% |
| Two or more Races | 311 | 4.9% |
| Some other Race | 169 | 2.7% |
| Total | 6,357 | 100.0% |
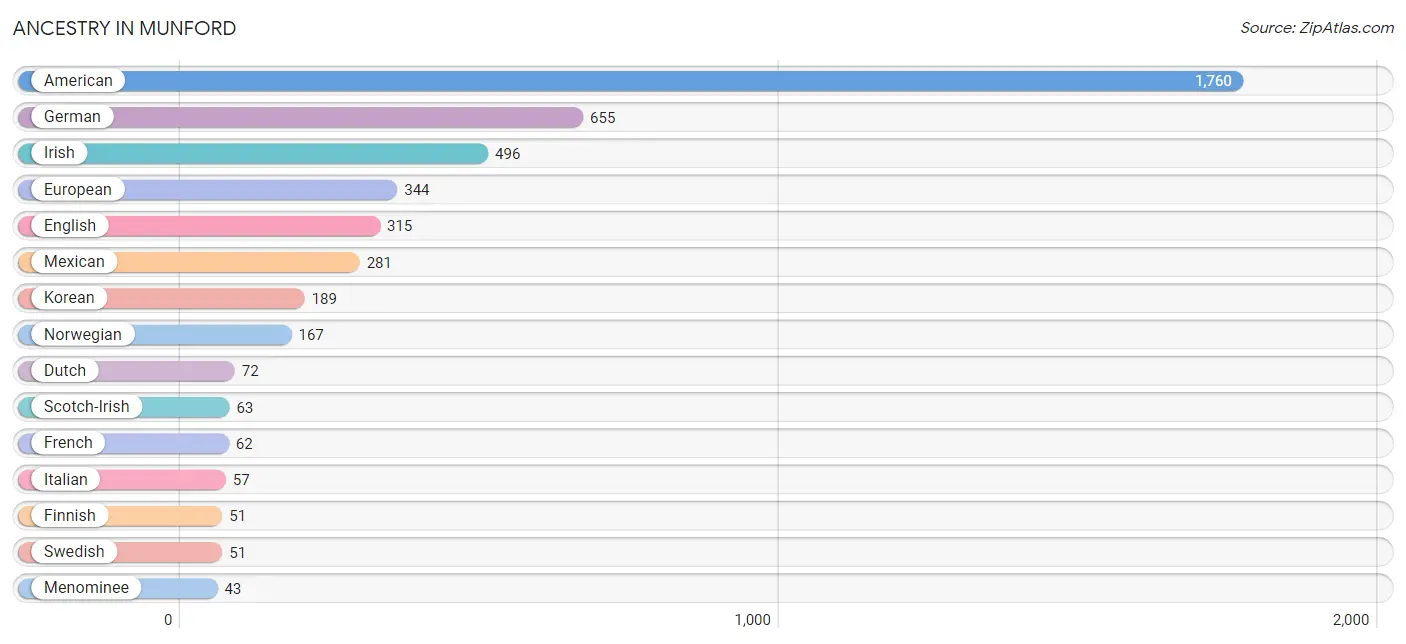
Ancestry in Munford
The most populous ancestries reported in Munford are American (1,760 | 27.7%), German (655 | 10.3%), Irish (496 | 7.8%), European (344 | 5.4%), and English (315 | 5.0%), together accounting for 56.2% of all Munford residents.
| Ancestry | # Population | % Population |
| American | 1,760 | 27.7% |
| Austrian | 27 | 0.4% |
| British | 14 | 0.2% |
| Danish | 6 | 0.1% |
| Dutch | 72 | 1.1% |
| English | 315 | 5.0% |
| European | 344 | 5.4% |
| Finnish | 51 | 0.8% |
| French | 62 | 1.0% |
| French Canadian | 13 | 0.2% |
| German | 655 | 10.3% |
| Irish | 496 | 7.8% |
| Italian | 57 | 0.9% |
| Korean | 189 | 3.0% |
| Menominee | 43 | 0.7% |
| Mexican | 281 | 4.4% |
| Norwegian | 167 | 2.6% |
| Polish | 12 | 0.2% |
| Portuguese | 22 | 0.4% |
| Scotch-Irish | 63 | 1.0% |
| Scottish | 12 | 0.2% |
| Spaniard | 20 | 0.3% |
| Swedish | 51 | 0.8% |
| Ukrainian | 28 | 0.4% | View All 24 Rows |
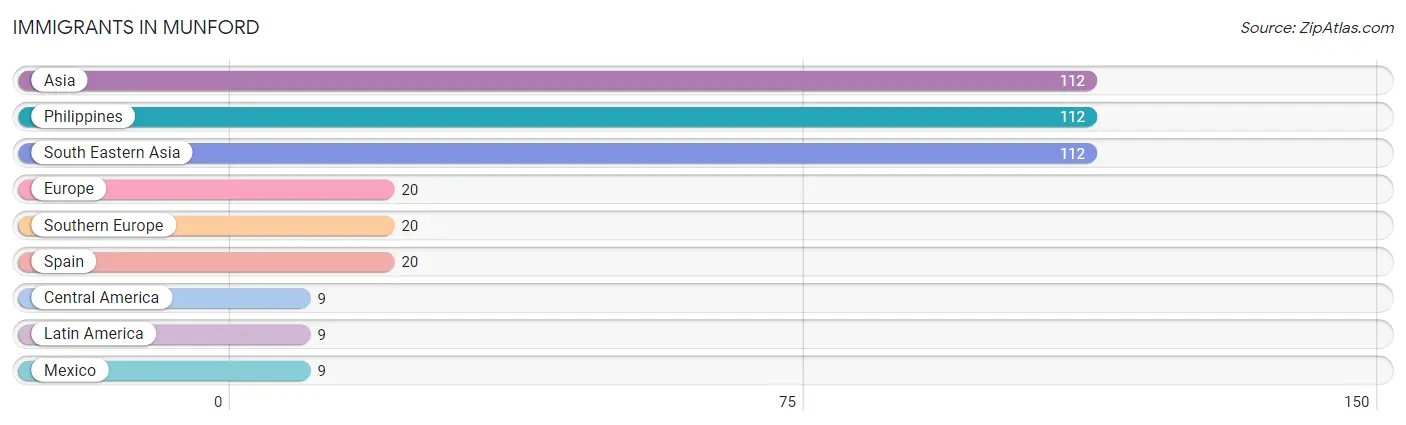
Immigrants in Munford
The most numerous immigrant groups reported in Munford came from Asia (112 | 1.8%), Philippines (112 | 1.8%), South Eastern Asia (112 | 1.8%), Europe (20 | 0.3%), and Southern Europe (20 | 0.3%), together accounting for 5.9% of all Munford residents.
| Immigration Origin | # Population | % Population |
| Asia | 112 | 1.8% |
| Central America | 9 | 0.1% |
| Europe | 20 | 0.3% |
| Latin America | 9 | 0.1% |
| Mexico | 9 | 0.1% |
| Philippines | 112 | 1.8% |
| South Eastern Asia | 112 | 1.8% |
| Southern Europe | 20 | 0.3% |
| Spain | 20 | 0.3% | View All 9 Rows |
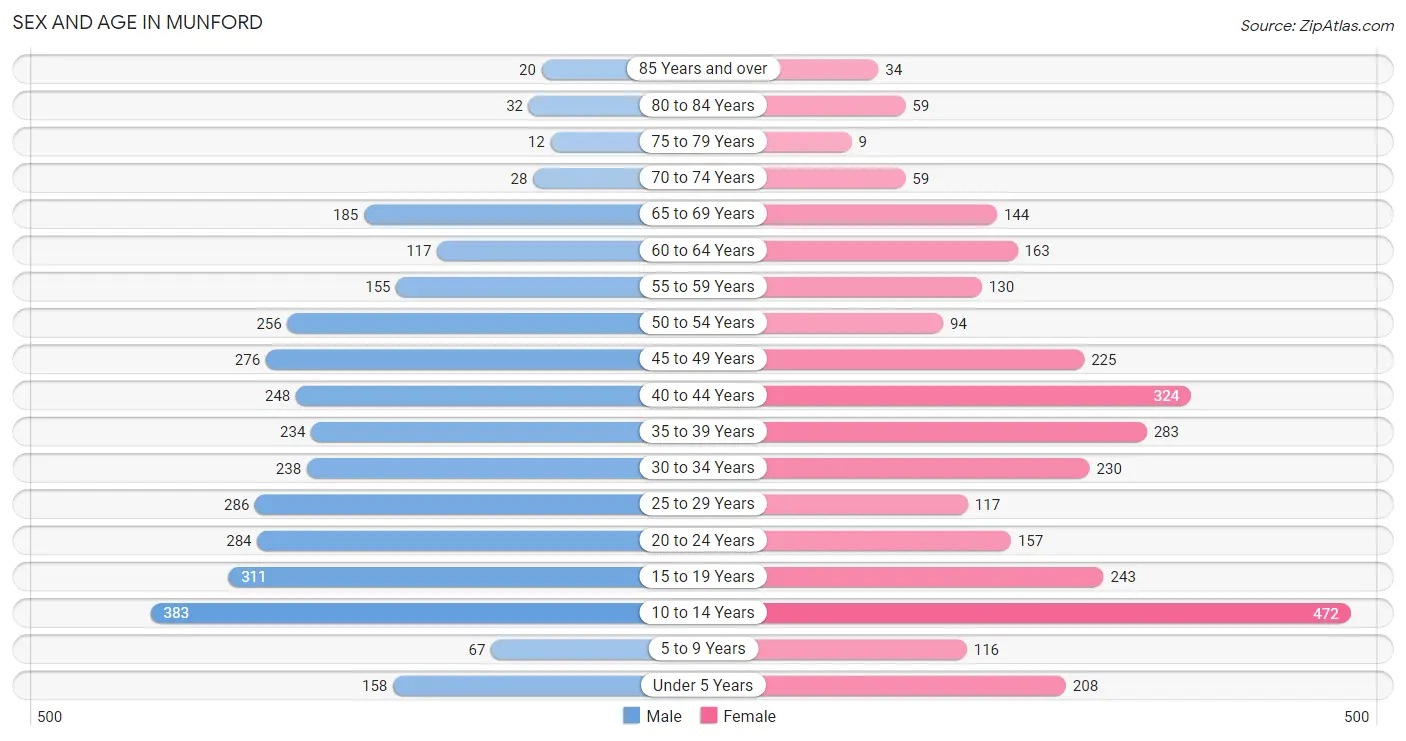
Sex and Age in Munford
Sex and Age in Munford
The most populous age groups in Munford are 10 to 14 Years (383 | 11.6%) for men and 10 to 14 Years (472 | 15.4%) for women.
| Age Bracket | Male | Female |
| Under 5 Years | 158 (4.8%) | 208 (6.8%) |
| 5 to 9 Years | 67 (2.0%) | 116 (3.8%) |
| 10 to 14 Years | 383 (11.6%) | 472 (15.4%) |
| 15 to 19 Years | 311 (9.5%) | 243 (7.9%) |
| 20 to 24 Years | 284 (8.6%) | 157 (5.1%) |
| 25 to 29 Years | 286 (8.7%) | 117 (3.8%) |
| 30 to 34 Years | 238 (7.2%) | 230 (7.5%) |
| 35 to 39 Years | 234 (7.1%) | 283 (9.2%) |
| 40 to 44 Years | 248 (7.5%) | 324 (10.6%) |
| 45 to 49 Years | 276 (8.4%) | 225 (7.3%) |
| 50 to 54 Years | 256 (7.8%) | 94 (3.1%) |
| 55 to 59 Years | 155 (4.7%) | 130 (4.2%) |
| 60 to 64 Years | 117 (3.6%) | 163 (5.3%) |
| 65 to 69 Years | 185 (5.6%) | 144 (4.7%) |
| 70 to 74 Years | 28 (0.9%) | 59 (1.9%) |
| 75 to 79 Years | 12 (0.4%) | 9 (0.3%) |
| 80 to 84 Years | 32 (1.0%) | 59 (1.9%) |
| 85 Years and over | 20 (0.6%) | 34 (1.1%) |
| Total | 3,290 (100.0%) | 3,067 (100.0%) |
Families and Households in Munford
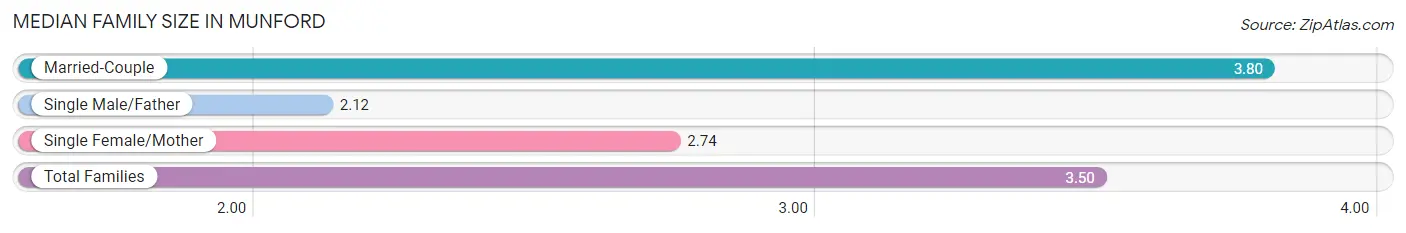
Median Family Size in Munford
The median family size in Munford is 3.50 persons per family, with married-couple families (1,255 | 78.7%) accounting for the largest median family size of 3.8 persons per family. On the other hand, single male/father families (198 | 12.4%) represent the smallest median family size with 2.12 persons per family.
| Family Type | # Families | Family Size |
| Married-Couple | 1,255 (78.7%) | 3.80 |
| Single Male/Father | 198 (12.4%) | 2.12 |
| Single Female/Mother | 141 (8.8%) | 2.74 |
| Total Families | 1,594 (100.0%) | 3.50 |
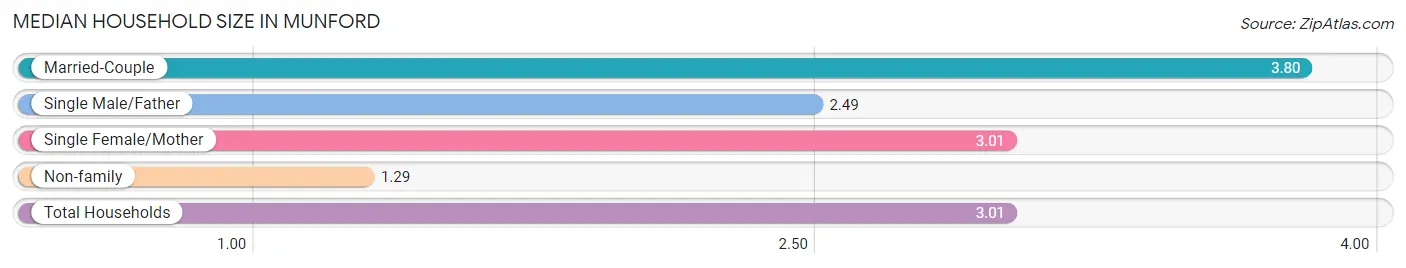
Median Household Size in Munford
The median household size in Munford is 3.01 persons per household, with married-couple households (1,255 | 59.4%) accounting for the largest median household size of 3.8 persons per household. non-family households (518 | 24.5%) represent the smallest median household size with 1.29 persons per household.
| Household Type | # Households | Household Size |
| Married-Couple | 1,255 (59.4%) | 3.80 |
| Single Male/Father | 198 (9.4%) | 2.49 |
| Single Female/Mother | 141 (6.7%) | 3.01 |
| Non-family | 518 (24.5%) | 1.29 |
| Total Households | 2,112 (100.0%) | 3.01 |
Household Size by Marriage Status in Munford
Out of a total of 2,112 households in Munford, 1,594 (75.5%) are family households, while 518 (24.5%) are nonfamily households. The most numerous type of family households are 2-person households, comprising 590, and the most common type of nonfamily households are 1-person households, comprising 333.
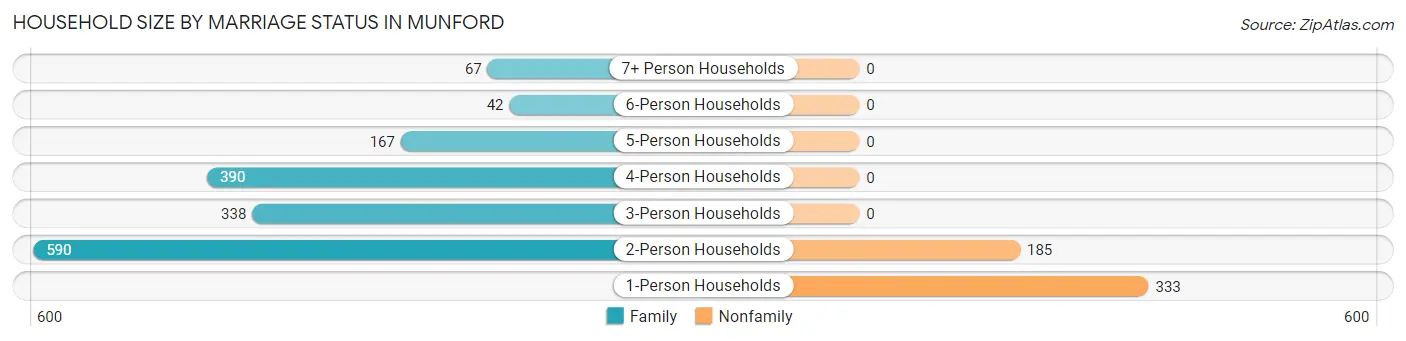
| Household Size | Family Households | Nonfamily Households |
| 1-Person Households | - | 333 (15.8%) |
| 2-Person Households | 590 (27.9%) | 185 (8.8%) |
| 3-Person Households | 338 (16.0%) | 0 (0.0%) |
| 4-Person Households | 390 (18.5%) | 0 (0.0%) |
| 5-Person Households | 167 (7.9%) | 0 (0.0%) |
| 6-Person Households | 42 (2.0%) | 0 (0.0%) |
| 7+ Person Households | 67 (3.2%) | 0 (0.0%) |
| Total | 1,594 (75.5%) | 518 (24.5%) |
Female Fertility in Munford
Fertility by Age in Munford
Average fertility rate in Munford is 24.0 births per 1,000 women. Women in the age bracket of 20 to 34 years have the highest fertility rate with 77.0 births per 1,000 women. Women in the age bracket of 20 to 34 years acount for 100.0% of all women with births.
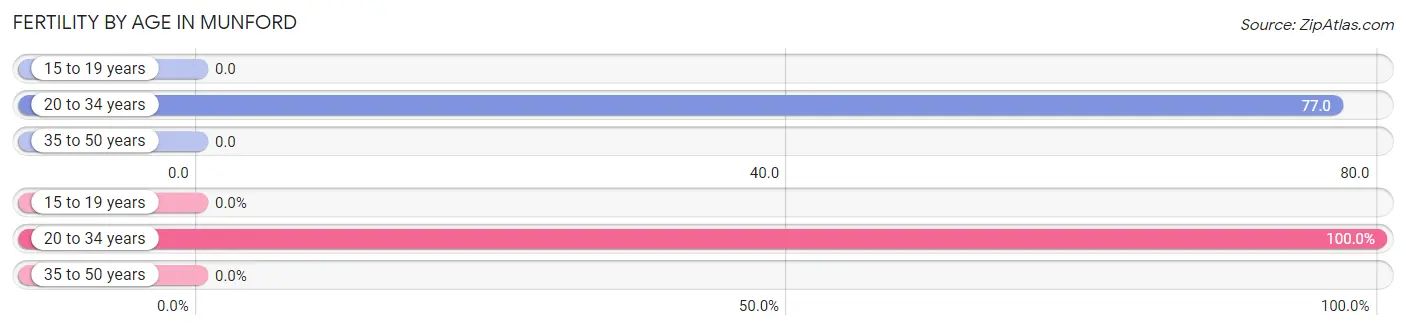
| Age Bracket | Women with Births | Births / 1,000 Women |
| 15 to 19 years | 0 (0.0%) | 0.0 |
| 20 to 34 years | 39 (100.0%) | 77.0 |
| 35 to 50 years | 0 (0.0%) | 0.0 |
| Total | 39 (100.0%) | 24.0 |
Fertility by Age by Marriage Status in Munford
64.1% of women with births (39) in Munford are married. The highest percentage of unmarried women with births falls into 20 to 34 years age bracket with 35.9% of them unmarried at the time of birth, while the lowest percentage of unmarried women with births belong to 20 to 34 years age bracket with 35.9% of them unmarried.
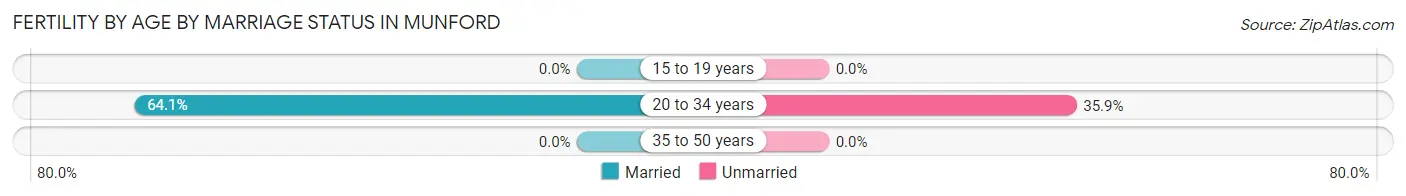
| Age Bracket | Married | Unmarried |
| 15 to 19 years | 0 (0.0%) | 0 (0.0%) |
| 20 to 34 years | 25 (64.1%) | 14 (35.9%) |
| 35 to 50 years | 0 (0.0%) | 0 (0.0%) |
| Total | 25 (64.1%) | 14 (35.9%) |
Fertility by Education in Munford
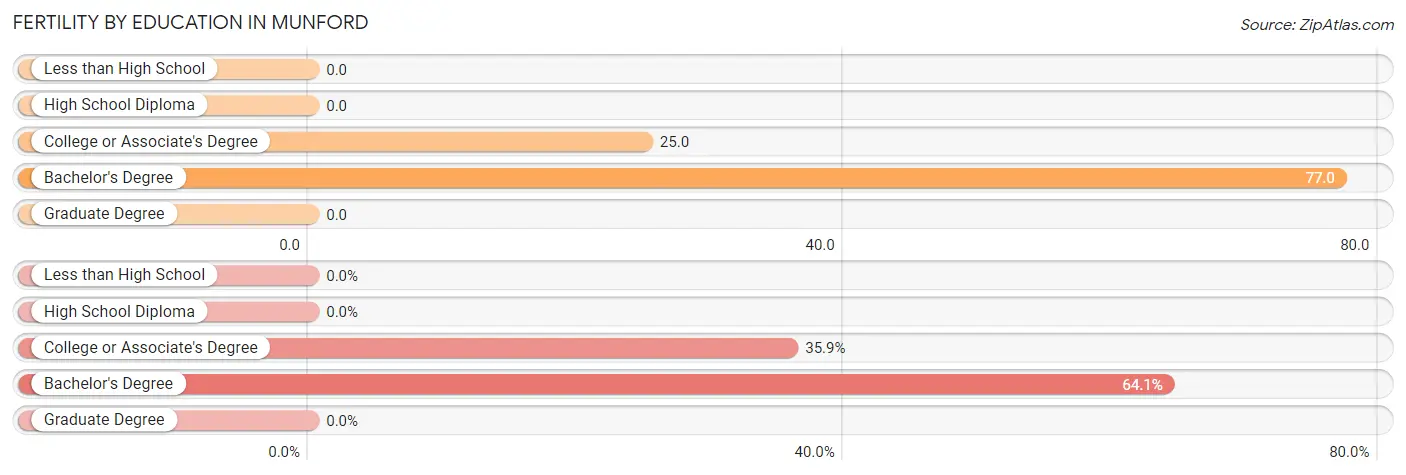
| Educational Attainment | Women with Births | Births / 1,000 Women |
| Less than High School | 0 (0.0%) | 0.0 |
| High School Diploma | 0 (0.0%) | 0.0 |
| College or Associate's Degree | 14 (35.9%) | 25.0 |
| Bachelor's Degree | 25 (64.1%) | 77.0 |
| Graduate Degree | 0 (0.0%) | 0.0 |
| Total | 39 (100.0%) | 24.0 |
Fertility by Education by Marriage Status in Munford
35.9% of women with births in Munford are unmarried. Women with the educational attainment of bachelor's degree are most likely to be married with 100.0% of them married at childbirth, while women with the educational attainment of college or associate's degree are least likely to be married with 100.0% of them unmarried at childbirth.
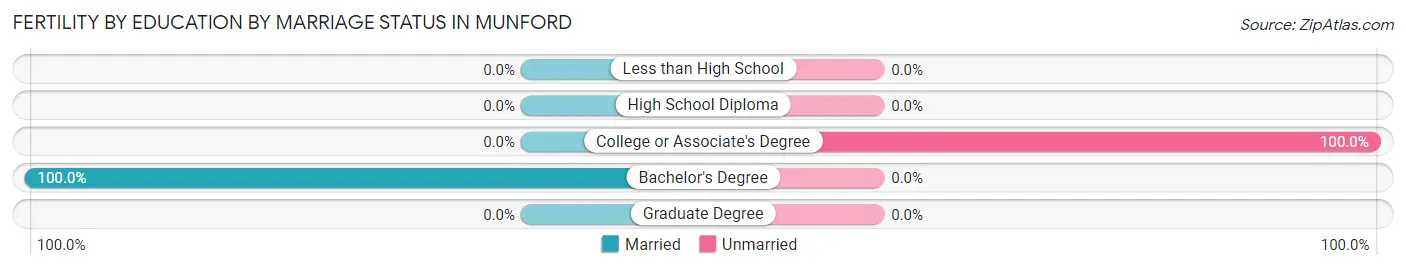
| Educational Attainment | Married | Unmarried |
| Less than High School | 0 (0.0%) | 0 (0.0%) |
| High School Diploma | 0 (0.0%) | 0 (0.0%) |
| College or Associate's Degree | 0 (0.0%) | 14 (100.0%) |
| Bachelor's Degree | 25 (100.0%) | 0 (0.0%) |
| Graduate Degree | 0 (0.0%) | 0 (0.0%) |
| Total | 25 (64.1%) | 14 (35.9%) |
Employment Characteristics in Munford
Employment by Class of Employer in Munford
Among the 3,102 employed individuals in Munford, private company employees (1,957 | 63.1%), local government employees (326 | 10.5%), and federal government employees (268 | 8.6%) make up the most common classes of employment.
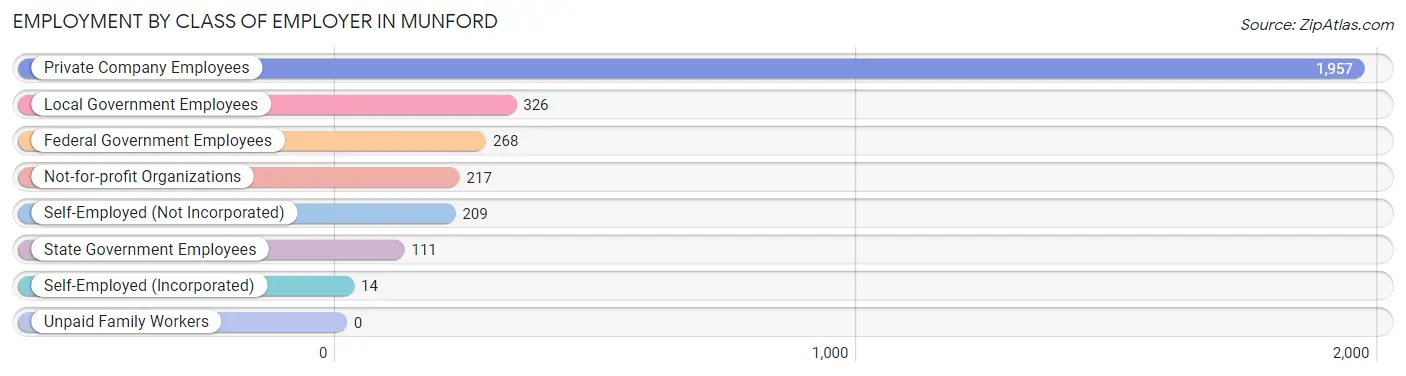
| Employer Class | # Employees | % Employees |
| Private Company Employees | 1,957 | 63.1% |
| Self-Employed (Incorporated) | 14 | 0.4% |
| Self-Employed (Not Incorporated) | 209 | 6.7% |
| Not-for-profit Organizations | 217 | 7.0% |
| Local Government Employees | 326 | 10.5% |
| State Government Employees | 111 | 3.6% |
| Federal Government Employees | 268 | 8.6% |
| Unpaid Family Workers | 0 | 0.0% |
| Total | 3,102 | 100.0% |
Employment Status by Age in Munford
According to the labor force statistics for Munford, out of the total population over 16 years of age (4,891), 69.0% or 3,375 individuals are in the labor force, with 8.2% or 277 of them unemployed. The age group with the highest labor force participation rate is 45 to 54 years, with 89.2% or 759 individuals in the labor force. Within the labor force, the 16 to 19 years age range has the highest percentage of unemployed individuals, with 66.2% or 86 of them being unemployed.
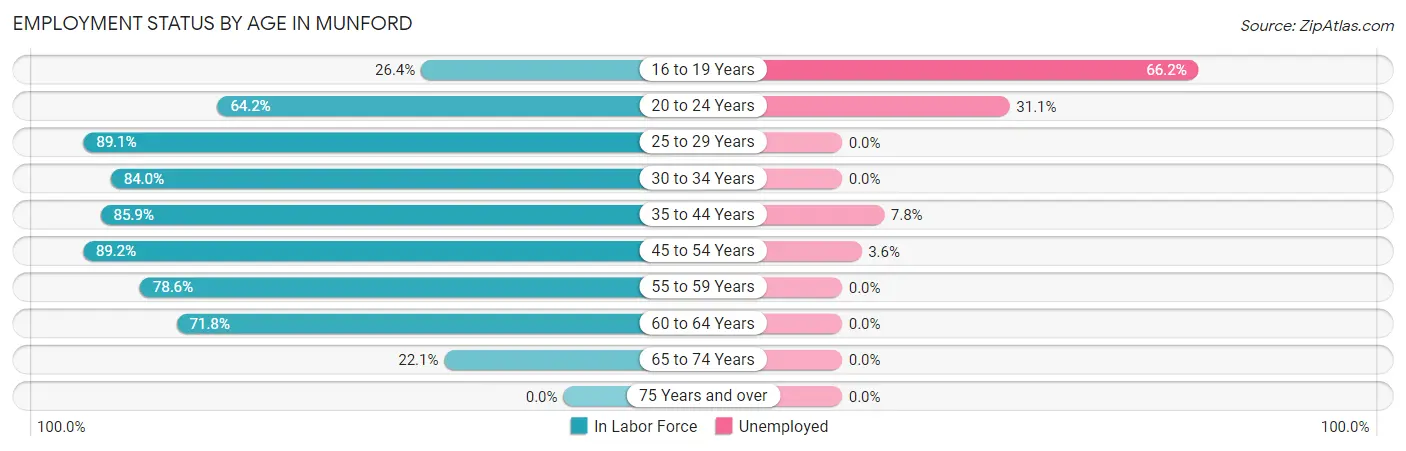
| Age Bracket | In Labor Force | Unemployed |
| 16 to 19 Years | 130 (26.4%) | 86 (66.2%) |
| 20 to 24 Years | 283 (64.2%) | 88 (31.1%) |
| 25 to 29 Years | 359 (89.1%) | 0 (0.0%) |
| 30 to 34 Years | 393 (84.0%) | 0 (0.0%) |
| 35 to 44 Years | 935 (85.9%) | 73 (7.8%) |
| 45 to 54 Years | 759 (89.2%) | 27 (3.6%) |
| 55 to 59 Years | 224 (78.6%) | 0 (0.0%) |
| 60 to 64 Years | 201 (71.8%) | 0 (0.0%) |
| 65 to 74 Years | 92 (22.1%) | 0 (0.0%) |
| 75 Years and over | 0 (0.0%) | 0 (0.0%) |
| Total | 3,375 (69.0%) | 277 (8.2%) |
Employment Status by Educational Attainment in Munford
According to labor force statistics for Munford, 85.0% of individuals (2,870) out of the total population between 25 and 64 years of age (3,376) are in the labor force, with 3.5% or 100 of them being unemployed. The group with the highest labor force participation rate are those with the educational attainment of less than high school, with 100.0% or 179 individuals in the labor force. Within the labor force, individuals with less than high school education have the highest percentage of unemployment, with 15.1% or 27 of them being unemployed.
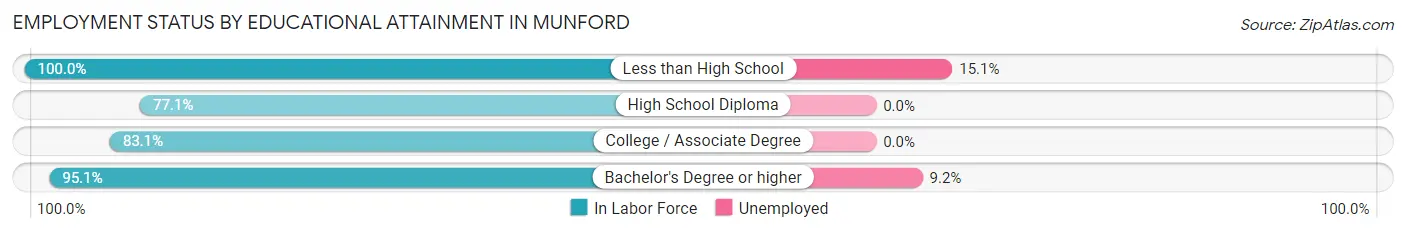
| Educational Attainment | In Labor Force | Unemployed |
| Less than High School | 179 (100.0%) | 27 (15.1%) |
| High School Diploma | 821 (77.1%) | 0 (0.0%) |
| College / Associate Degree | 1,079 (83.1%) | 0 (0.0%) |
| Bachelor's Degree or higher | 793 (95.1%) | 77 (9.2%) |
| Total | 2,870 (85.0%) | 118 (3.5%) |
Employment Occupations by Sex in Munford
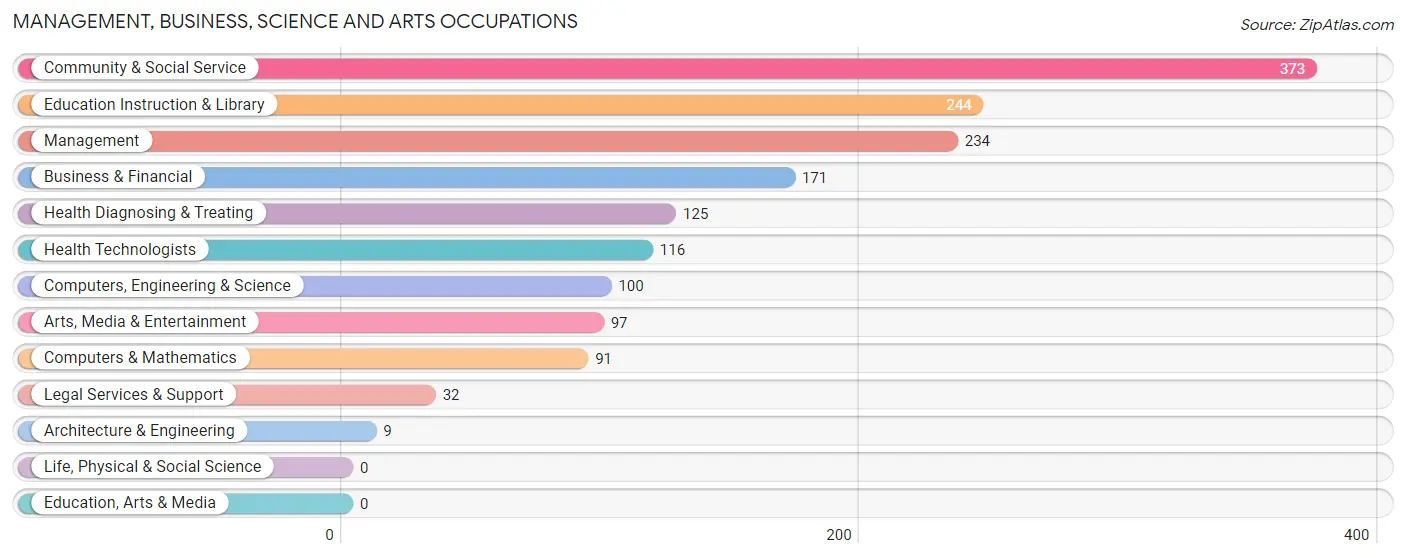
Management, Business, Science and Arts Occupations
The most common Management, Business, Science and Arts occupations in Munford are Community & Social Service (373 | 12.1%), Education Instruction & Library (244 | 7.9%), Management (234 | 7.6%), Business & Financial (171 | 5.5%), and Health Diagnosing & Treating (125 | 4.1%).
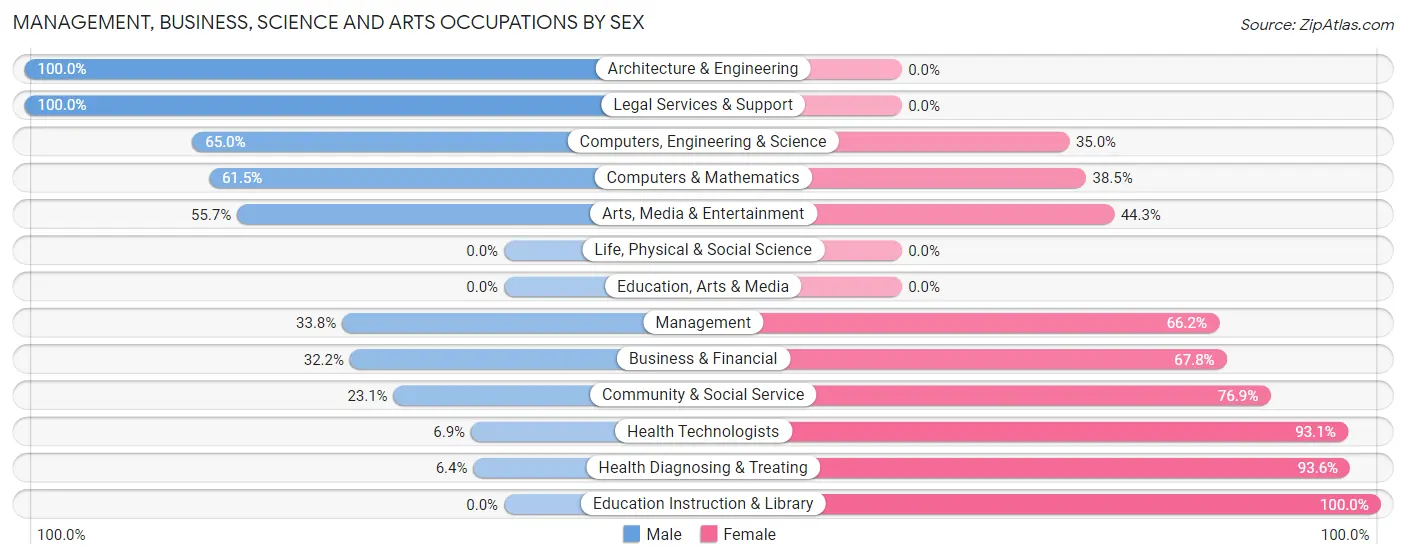
Management, Business, Science and Arts Occupations by Sex
Within the Management, Business, Science and Arts occupations in Munford, the most male-oriented occupations are Architecture & Engineering (100.0%), Legal Services & Support (100.0%), and Computers, Engineering & Science (65.0%), while the most female-oriented occupations are Education Instruction & Library (100.0%), Health Diagnosing & Treating (93.6%), and Health Technologists (93.1%).
| Occupation | Male | Female |
| Management | 79 (33.8%) | 155 (66.2%) |
| Business & Financial | 55 (32.2%) | 116 (67.8%) |
| Computers, Engineering & Science | 65 (65.0%) | 35 (35.0%) |
| Computers & Mathematics | 56 (61.5%) | 35 (38.5%) |
| Architecture & Engineering | 9 (100.0%) | 0 (0.0%) |
| Life, Physical & Social Science | 0 (0.0%) | 0 (0.0%) |
| Community & Social Service | 86 (23.1%) | 287 (76.9%) |
| Education, Arts & Media | 0 (0.0%) | 0 (0.0%) |
| Legal Services & Support | 32 (100.0%) | 0 (0.0%) |
| Education Instruction & Library | 0 (0.0%) | 244 (100.0%) |
| Arts, Media & Entertainment | 54 (55.7%) | 43 (44.3%) |
| Health Diagnosing & Treating | 8 (6.4%) | 117 (93.6%) |
| Health Technologists | 8 (6.9%) | 108 (93.1%) |
| Total (Category) | 293 (29.2%) | 710 (70.8%) |
| Total (Overall) | 1,717 (55.7%) | 1,367 (44.3%) |
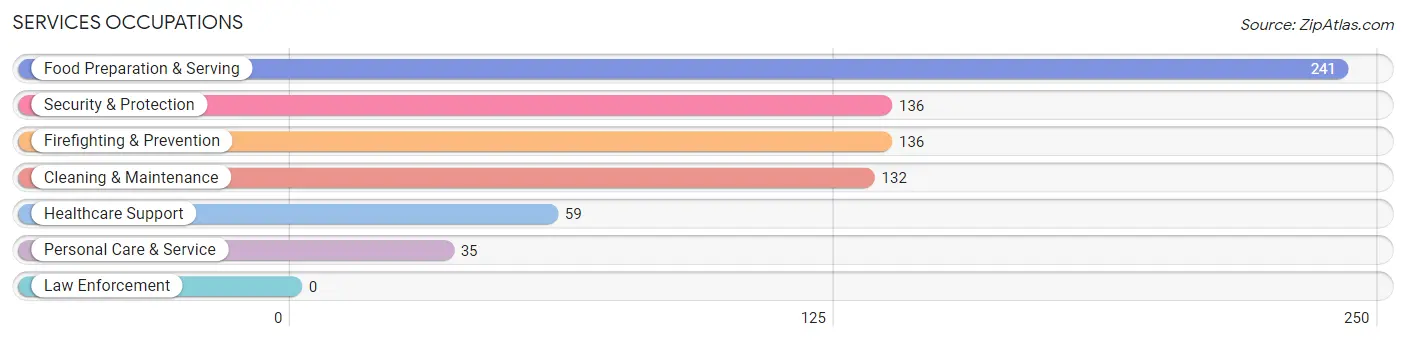
Services Occupations
The most common Services occupations in Munford are Food Preparation & Serving (241 | 7.8%), Security & Protection (136 | 4.4%), Firefighting & Prevention (136 | 4.4%), Cleaning & Maintenance (132 | 4.3%), and Healthcare Support (59 | 1.9%).
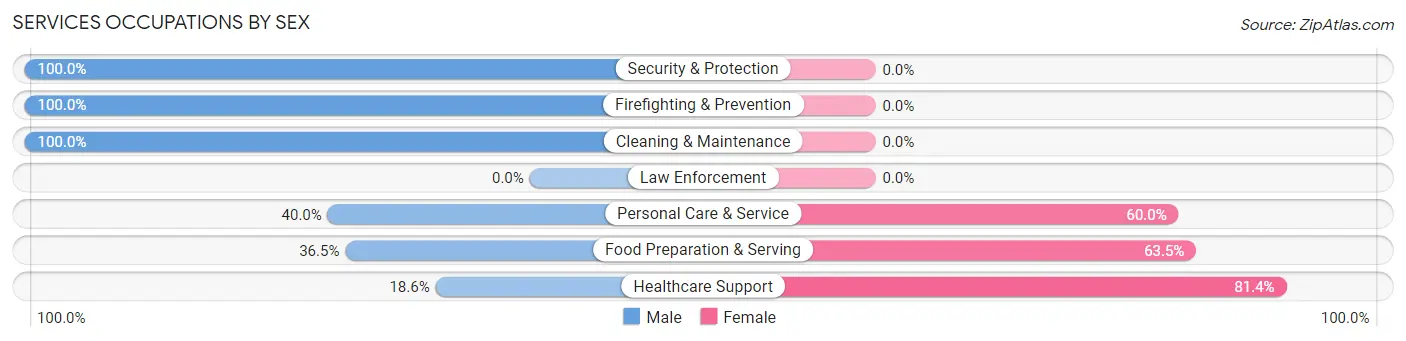
Services Occupations by Sex
Within the Services occupations in Munford, the most male-oriented occupations are Security & Protection (100.0%), Firefighting & Prevention (100.0%), and Cleaning & Maintenance (100.0%), while the most female-oriented occupations are Healthcare Support (81.4%), Food Preparation & Serving (63.5%), and Personal Care & Service (60.0%).
| Occupation | Male | Female |
| Healthcare Support | 11 (18.6%) | 48 (81.4%) |
| Security & Protection | 136 (100.0%) | 0 (0.0%) |
| Firefighting & Prevention | 136 (100.0%) | 0 (0.0%) |
| Law Enforcement | 0 (0.0%) | 0 (0.0%) |
| Food Preparation & Serving | 88 (36.5%) | 153 (63.5%) |
| Cleaning & Maintenance | 132 (100.0%) | 0 (0.0%) |
| Personal Care & Service | 14 (40.0%) | 21 (60.0%) |
| Total (Category) | 381 (63.2%) | 222 (36.8%) |
| Total (Overall) | 1,717 (55.7%) | 1,367 (44.3%) |
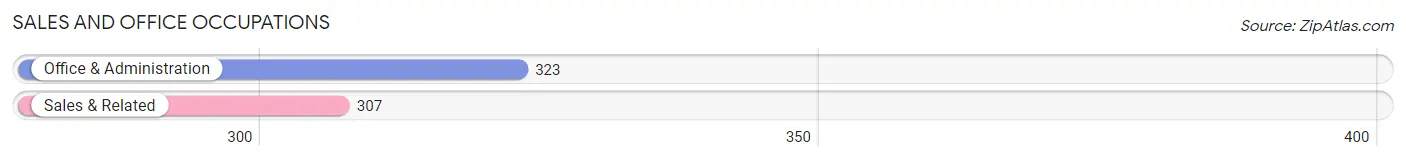
Sales and Office Occupations
The most common Sales and Office occupations in Munford are Office & Administration (323 | 10.5%), and Sales & Related (307 | 10.0%).
Sales and Office Occupations by Sex
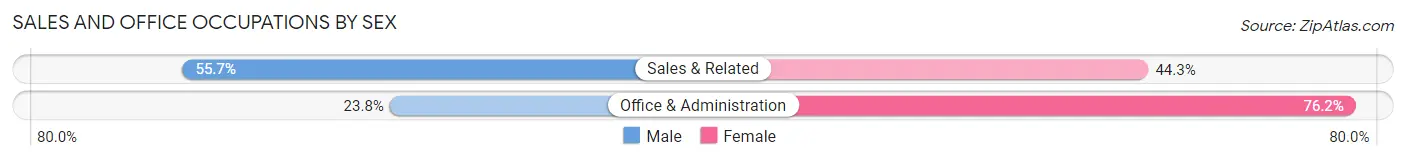
| Occupation | Male | Female |
| Sales & Related | 171 (55.7%) | 136 (44.3%) |
| Office & Administration | 77 (23.8%) | 246 (76.2%) |
| Total (Category) | 248 (39.4%) | 382 (60.6%) |
| Total (Overall) | 1,717 (55.7%) | 1,367 (44.3%) |
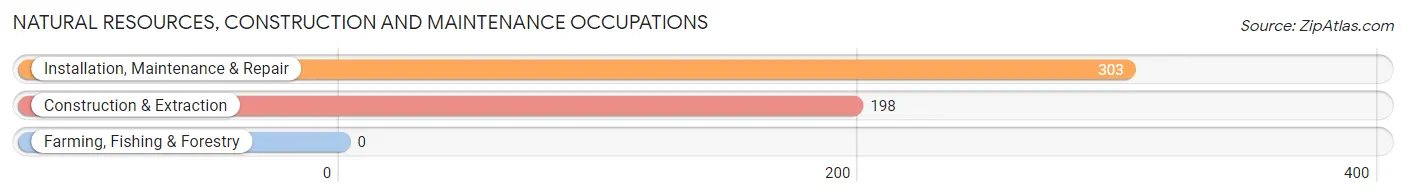
Natural Resources, Construction and Maintenance Occupations
The most common Natural Resources, Construction and Maintenance occupations in Munford are Installation, Maintenance & Repair (303 | 9.8%), and Construction & Extraction (198 | 6.4%).
Natural Resources, Construction and Maintenance Occupations by Sex
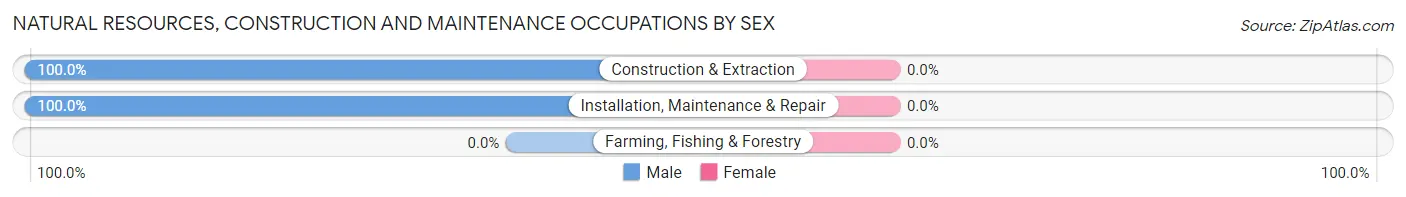
| Occupation | Male | Female |
| Farming, Fishing & Forestry | 0 (0.0%) | 0 (0.0%) |
| Construction & Extraction | 198 (100.0%) | 0 (0.0%) |
| Installation, Maintenance & Repair | 303 (100.0%) | 0 (0.0%) |
| Total (Category) | 501 (100.0%) | 0 (0.0%) |
| Total (Overall) | 1,717 (55.7%) | 1,367 (44.3%) |
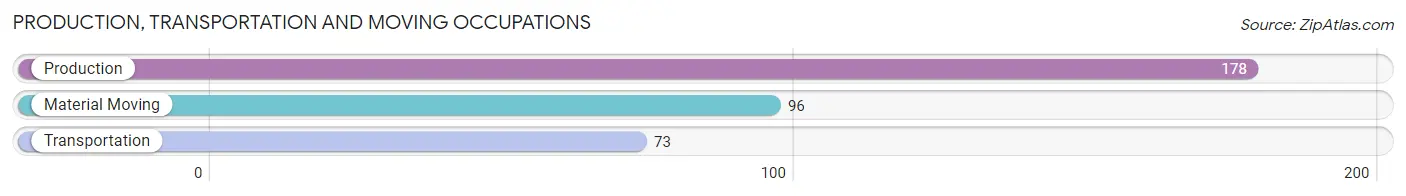
Production, Transportation and Moving Occupations
The most common Production, Transportation and Moving occupations in Munford are Production (178 | 5.8%), Material Moving (96 | 3.1%), and Transportation (73 | 2.4%).
Production, Transportation and Moving Occupations by Sex
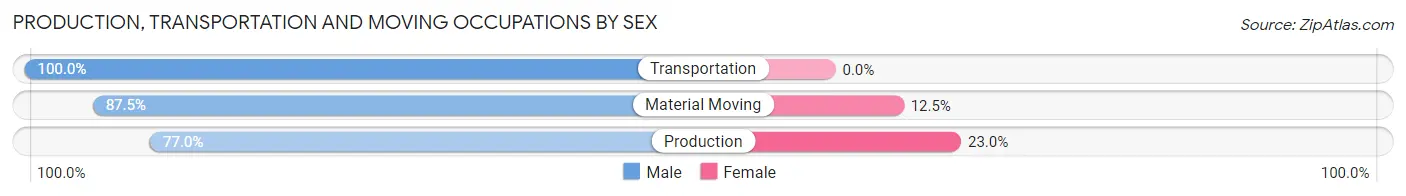
| Occupation | Male | Female |
| Production | 137 (77.0%) | 41 (23.0%) |
| Transportation | 73 (100.0%) | 0 (0.0%) |
| Material Moving | 84 (87.5%) | 12 (12.5%) |
| Total (Category) | 294 (84.7%) | 53 (15.3%) |
| Total (Overall) | 1,717 (55.7%) | 1,367 (44.3%) |
Employment Industries by Sex in Munford
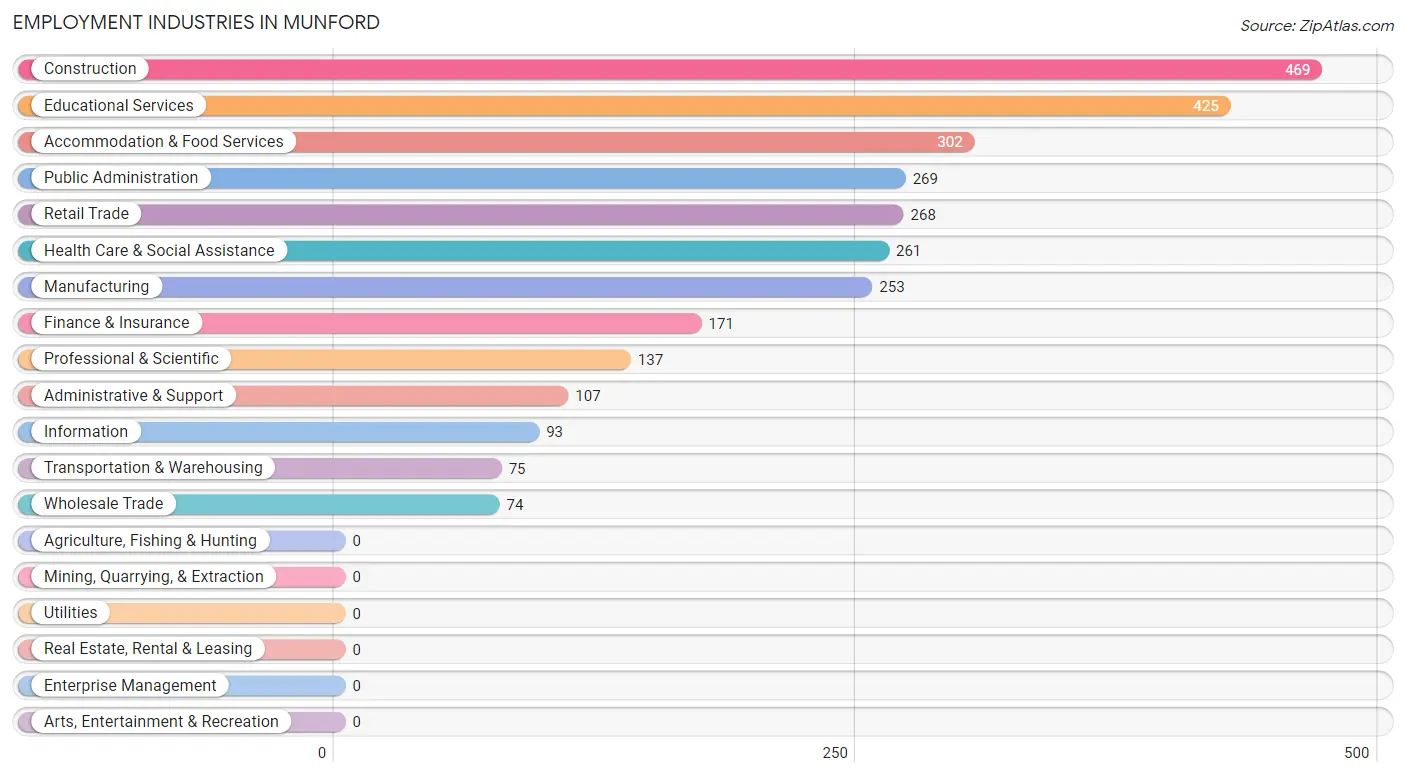
Employment Industries in Munford
The major employment industries in Munford include Construction (469 | 15.2%), Educational Services (425 | 13.8%), Accommodation & Food Services (302 | 9.8%), Public Administration (269 | 8.7%), and Retail Trade (268 | 8.7%).
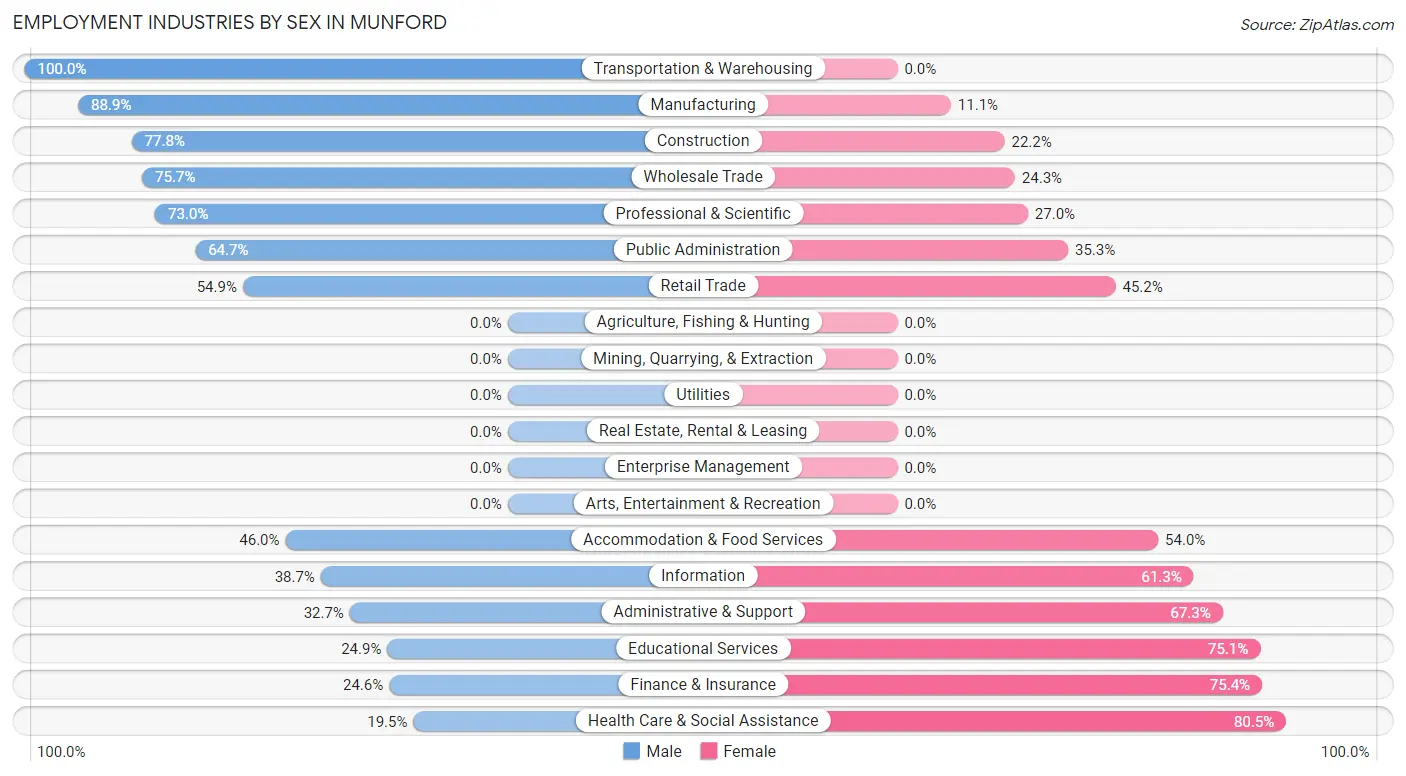
Employment Industries by Sex in Munford
The Munford industries that see more men than women are Transportation & Warehousing (100.0%), Manufacturing (88.9%), and Construction (77.8%), whereas the industries that tend to have a higher number of women are Health Care & Social Assistance (80.5%), Finance & Insurance (75.4%), and Educational Services (75.1%).
| Industry | Male | Female |
| Agriculture, Fishing & Hunting | 0 (0.0%) | 0 (0.0%) |
| Mining, Quarrying, & Extraction | 0 (0.0%) | 0 (0.0%) |
| Construction | 365 (77.8%) | 104 (22.2%) |
| Manufacturing | 225 (88.9%) | 28 (11.1%) |
| Wholesale Trade | 56 (75.7%) | 18 (24.3%) |
| Retail Trade | 147 (54.8%) | 121 (45.2%) |
| Transportation & Warehousing | 75 (100.0%) | 0 (0.0%) |
| Utilities | 0 (0.0%) | 0 (0.0%) |
| Information | 36 (38.7%) | 57 (61.3%) |
| Finance & Insurance | 42 (24.6%) | 129 (75.4%) |
| Real Estate, Rental & Leasing | 0 (0.0%) | 0 (0.0%) |
| Professional & Scientific | 100 (73.0%) | 37 (27.0%) |
| Enterprise Management | 0 (0.0%) | 0 (0.0%) |
| Administrative & Support | 35 (32.7%) | 72 (67.3%) |
| Educational Services | 106 (24.9%) | 319 (75.1%) |
| Health Care & Social Assistance | 51 (19.5%) | 210 (80.5%) |
| Arts, Entertainment & Recreation | 0 (0.0%) | 0 (0.0%) |
| Accommodation & Food Services | 139 (46.0%) | 163 (54.0%) |
| Public Administration | 174 (64.7%) | 95 (35.3%) |
| Total | 1,717 (55.7%) | 1,367 (44.3%) |
Education in Munford
School Enrollment in Munford
The most common levels of schooling among the 2,052 students in Munford are middle school (664 | 32.4%), high school (622 | 30.3%), and college / undergraduate (366 | 17.8%).
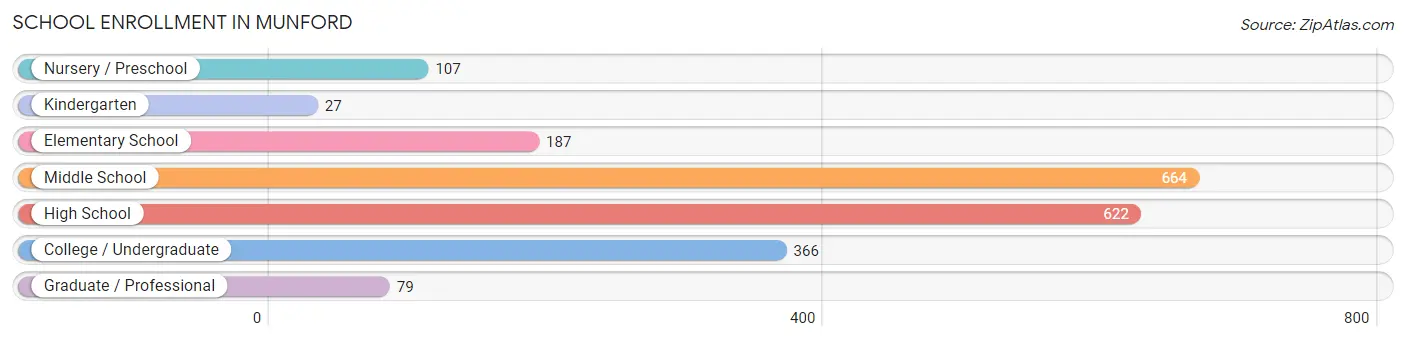
| School Level | # Students | % Students |
| Nursery / Preschool | 107 | 5.2% |
| Kindergarten | 27 | 1.3% |
| Elementary School | 187 | 9.1% |
| Middle School | 664 | 32.4% |
| High School | 622 | 30.3% |
| College / Undergraduate | 366 | 17.8% |
| Graduate / Professional | 79 | 3.8% |
| Total | 2,052 | 100.0% |
School Enrollment by Age by Funding Source in Munford
Out of a total of 2,052 students who are enrolled in schools in Munford, 160 (7.8%) attend a private institution, while the remaining 1,892 (92.2%) are enrolled in public schools. The age group of 25 to 34 year olds has the highest likelihood of being enrolled in private schools, with 121 (100.0% in the age bracket) enrolled. Conversely, the age group of 3 to 4 year olds has the lowest likelihood of being enrolled in a private school, with 107 (100.0% in the age bracket) attending a public institution.
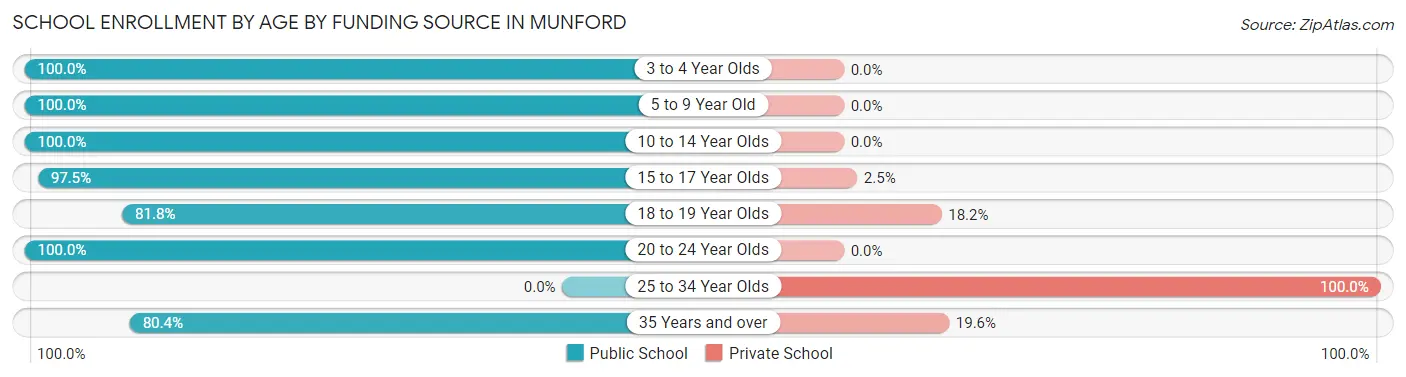
| Age Bracket | Public School | Private School |
| 3 to 4 Year Olds | 107 (100.0%) | 0 (0.0%) |
| 5 to 9 Year Old | 151 (100.0%) | 0 (0.0%) |
| 10 to 14 Year Olds | 855 (100.0%) | 0 (0.0%) |
| 15 to 17 Year Olds | 474 (97.5%) | 12 (2.5%) |
| 18 to 19 Year Olds | 36 (81.8%) | 8 (18.2%) |
| 20 to 24 Year Olds | 191 (100.0%) | 0 (0.0%) |
| 25 to 34 Year Olds | 0 (0.0%) | 121 (100.0%) |
| 35 Years and over | 78 (80.4%) | 19 (19.6%) |
| Total | 1,892 (92.2%) | 160 (7.8%) |
Educational Attainment by Field of Study in Munford
Education (324 | 34.5%), business (161 | 17.2%), science & technology (118 | 12.6%), physical & health sciences (97 | 10.3%), and computers & mathematics (93 | 9.9%) are the most common fields of study among 939 individuals in Munford who have obtained a bachelor's degree or higher.
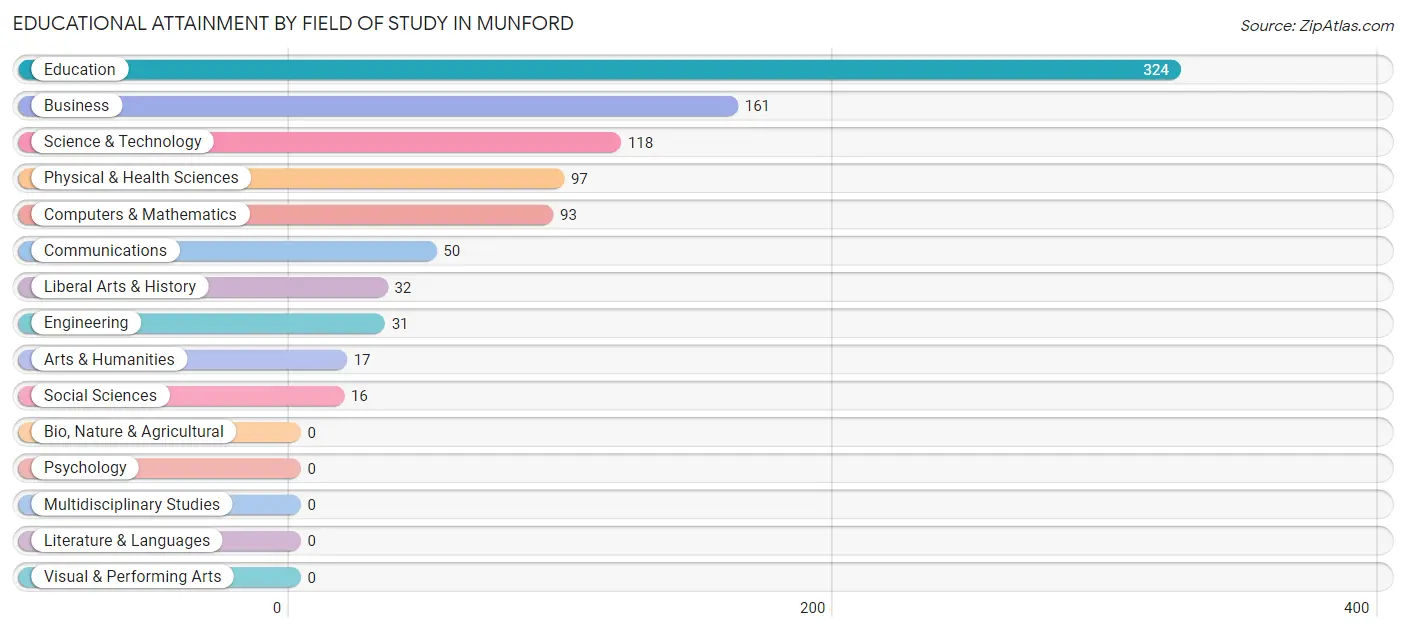
| Field of Study | # Graduates | % Graduates |
| Computers & Mathematics | 93 | 9.9% |
| Bio, Nature & Agricultural | 0 | 0.0% |
| Physical & Health Sciences | 97 | 10.3% |
| Psychology | 0 | 0.0% |
| Social Sciences | 16 | 1.7% |
| Engineering | 31 | 3.3% |
| Multidisciplinary Studies | 0 | 0.0% |
| Science & Technology | 118 | 12.6% |
| Business | 161 | 17.2% |
| Education | 324 | 34.5% |
| Literature & Languages | 0 | 0.0% |
| Liberal Arts & History | 32 | 3.4% |
| Visual & Performing Arts | 0 | 0.0% |
| Communications | 50 | 5.3% |
| Arts & Humanities | 17 | 1.8% |
| Total | 939 | 100.0% |
Transportation & Commute in Munford
Vehicle Availability by Sex in Munford
The most prevalent vehicle ownership categories in Munford are males with 3 vehicles (655, accounting for 37.8%) and females with 3 vehicles (285, making up 47.9%).
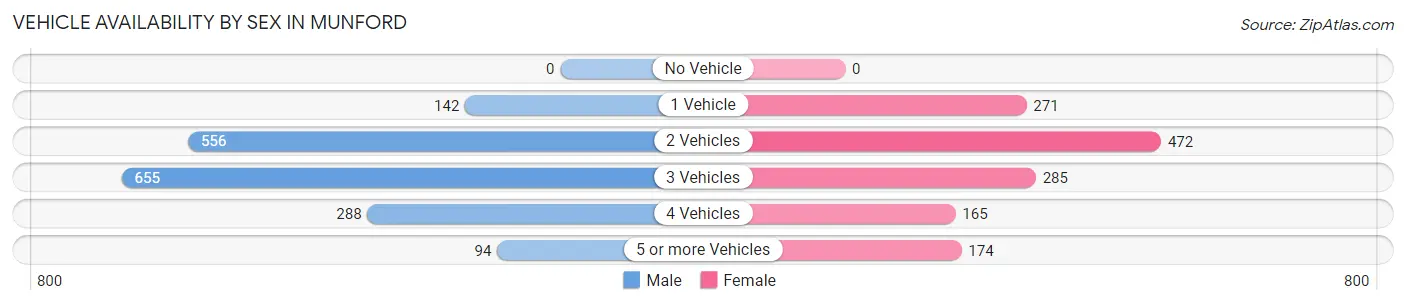
| Vehicles Available | Male | Female |
| No Vehicle | 0 (0.0%) | 0 (0.0%) |
| 1 Vehicle | 142 (8.2%) | 271 (19.8%) |
| 2 Vehicles | 556 (32.1%) | 472 (34.5%) |
| 3 Vehicles | 655 (37.8%) | 285 (20.8%) |
| 4 Vehicles | 288 (16.6%) | 165 (12.1%) |
| 5 or more Vehicles | 94 (5.4%) | 174 (12.7%) |
| Total | 1,735 (100.0%) | 1,367 (100.0%) |
Commute Time in Munford
The most frequently occuring commute durations in Munford are 45 to 59 minutes (686 commuters, 24.0%), 20 to 24 minutes (415 commuters, 14.5%), and 10 to 14 minutes (294 commuters, 10.3%).
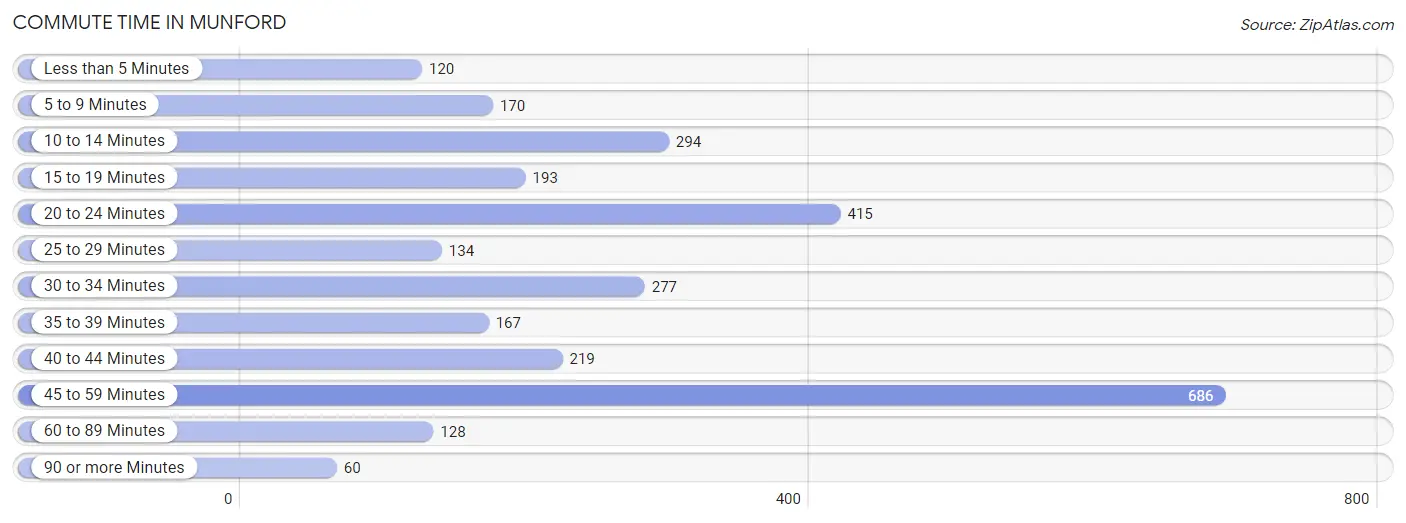
| Commute Time | # Commuters | % Commuters |
| Less than 5 Minutes | 120 | 4.2% |
| 5 to 9 Minutes | 170 | 5.9% |
| 10 to 14 Minutes | 294 | 10.3% |
| 15 to 19 Minutes | 193 | 6.7% |
| 20 to 24 Minutes | 415 | 14.5% |
| 25 to 29 Minutes | 134 | 4.7% |
| 30 to 34 Minutes | 277 | 9.7% |
| 35 to 39 Minutes | 167 | 5.8% |
| 40 to 44 Minutes | 219 | 7.6% |
| 45 to 59 Minutes | 686 | 24.0% |
| 60 to 89 Minutes | 128 | 4.5% |
| 90 or more Minutes | 60 | 2.1% |
Commute Time by Sex in Munford
The most common commute times in Munford are 45 to 59 minutes (466 commuters, 29.6%) for males and 45 to 59 minutes (220 commuters, 17.1%) for females.
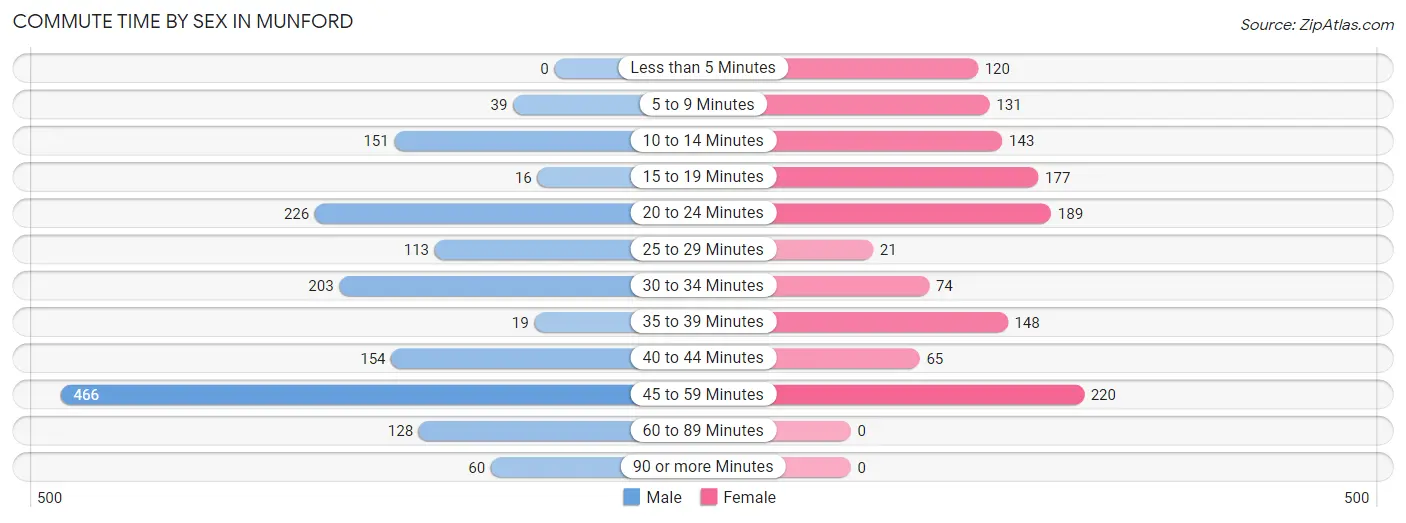
| Commute Time | Male | Female |
| Less than 5 Minutes | 0 (0.0%) | 120 (9.3%) |
| 5 to 9 Minutes | 39 (2.5%) | 131 (10.2%) |
| 10 to 14 Minutes | 151 (9.6%) | 143 (11.1%) |
| 15 to 19 Minutes | 16 (1.0%) | 177 (13.7%) |
| 20 to 24 Minutes | 226 (14.3%) | 189 (14.7%) |
| 25 to 29 Minutes | 113 (7.2%) | 21 (1.6%) |
| 30 to 34 Minutes | 203 (12.9%) | 74 (5.8%) |
| 35 to 39 Minutes | 19 (1.2%) | 148 (11.5%) |
| 40 to 44 Minutes | 154 (9.8%) | 65 (5.1%) |
| 45 to 59 Minutes | 466 (29.6%) | 220 (17.1%) |
| 60 to 89 Minutes | 128 (8.1%) | 0 (0.0%) |
| 90 or more Minutes | 60 (3.8%) | 0 (0.0%) |
Time of Departure to Work by Sex in Munford
The most frequent times of departure to work in Munford are 7:00 AM to 7:29 AM (437, 27.8%) for males and 7:00 AM to 7:29 AM (520, 40.4%) for females.
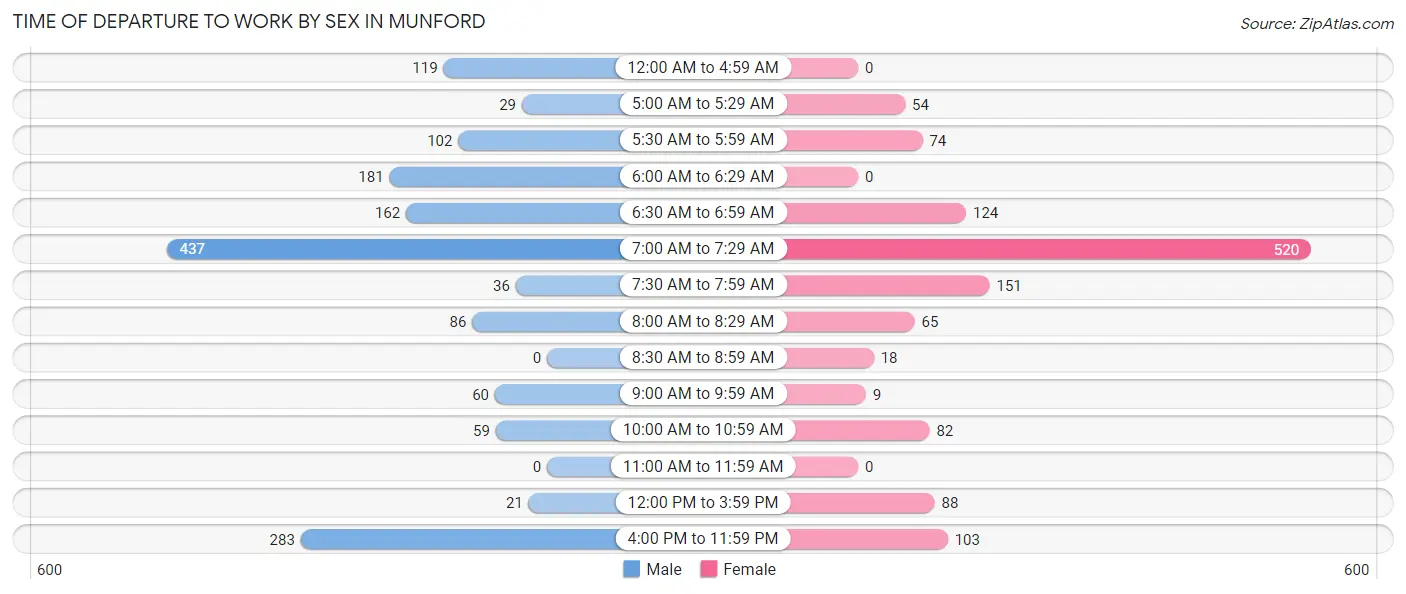
| Time of Departure | Male | Female |
| 12:00 AM to 4:59 AM | 119 (7.6%) | 0 (0.0%) |
| 5:00 AM to 5:29 AM | 29 (1.8%) | 54 (4.2%) |
| 5:30 AM to 5:59 AM | 102 (6.5%) | 74 (5.8%) |
| 6:00 AM to 6:29 AM | 181 (11.5%) | 0 (0.0%) |
| 6:30 AM to 6:59 AM | 162 (10.3%) | 124 (9.6%) |
| 7:00 AM to 7:29 AM | 437 (27.8%) | 520 (40.4%) |
| 7:30 AM to 7:59 AM | 36 (2.3%) | 151 (11.7%) |
| 8:00 AM to 8:29 AM | 86 (5.5%) | 65 (5.1%) |
| 8:30 AM to 8:59 AM | 0 (0.0%) | 18 (1.4%) |
| 9:00 AM to 9:59 AM | 60 (3.8%) | 9 (0.7%) |
| 10:00 AM to 10:59 AM | 59 (3.7%) | 82 (6.4%) |
| 11:00 AM to 11:59 AM | 0 (0.0%) | 0 (0.0%) |
| 12:00 PM to 3:59 PM | 21 (1.3%) | 88 (6.8%) |
| 4:00 PM to 11:59 PM | 283 (18.0%) | 103 (8.0%) |
| Total | 1,575 (100.0%) | 1,288 (100.0%) |
Housing Occupancy in Munford
Occupancy by Ownership in Munford
Of the total 2,112 dwellings in Munford, owner-occupied units account for 1,637 (77.5%), while renter-occupied units make up 475 (22.5%).
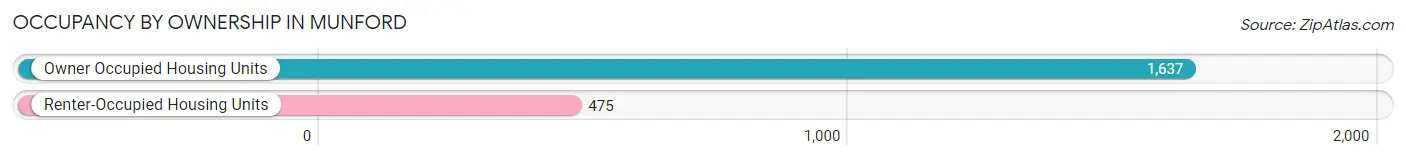
| Occupancy | # Housing Units | % Housing Units |
| Owner Occupied Housing Units | 1,637 | 77.5% |
| Renter-Occupied Housing Units | 475 | 22.5% |
| Total Occupied Housing Units | 2,112 | 100.0% |
Occupancy by Household Size in Munford
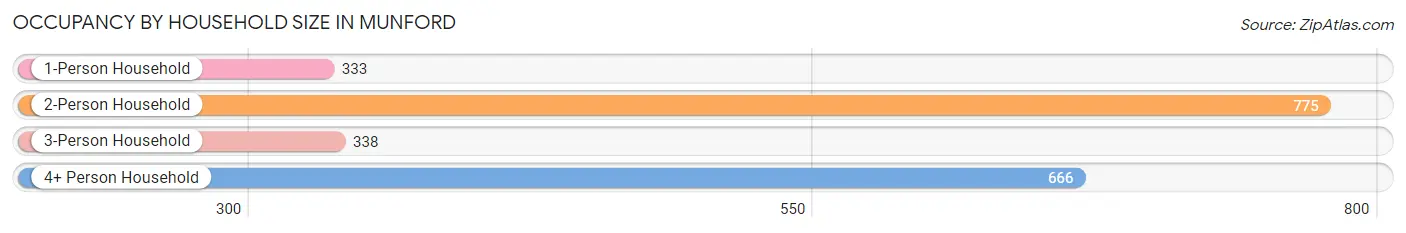
| Household Size | # Housing Units | % Housing Units |
| 1-Person Household | 333 | 15.8% |
| 2-Person Household | 775 | 36.7% |
| 3-Person Household | 338 | 16.0% |
| 4+ Person Household | 666 | 31.5% |
| Total Housing Units | 2,112 | 100.0% |
Occupancy by Ownership by Household Size in Munford
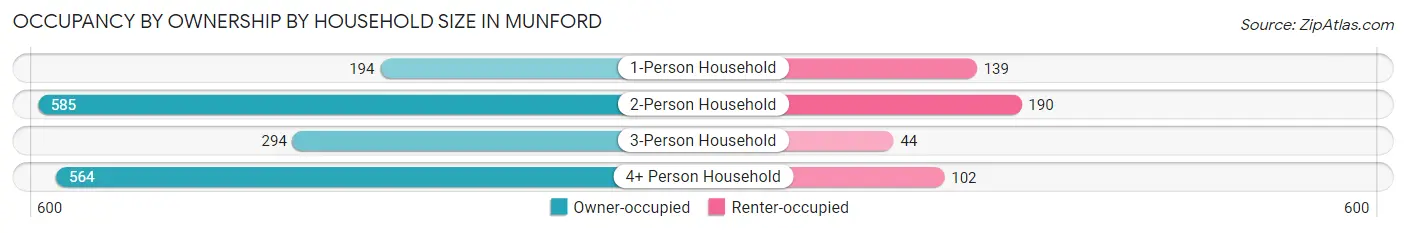
| Household Size | Owner-occupied | Renter-occupied |
| 1-Person Household | 194 (58.3%) | 139 (41.7%) |
| 2-Person Household | 585 (75.5%) | 190 (24.5%) |
| 3-Person Household | 294 (87.0%) | 44 (13.0%) |
| 4+ Person Household | 564 (84.7%) | 102 (15.3%) |
| Total Housing Units | 1,637 (77.5%) | 475 (22.5%) |
Occupancy by Educational Attainment in Munford
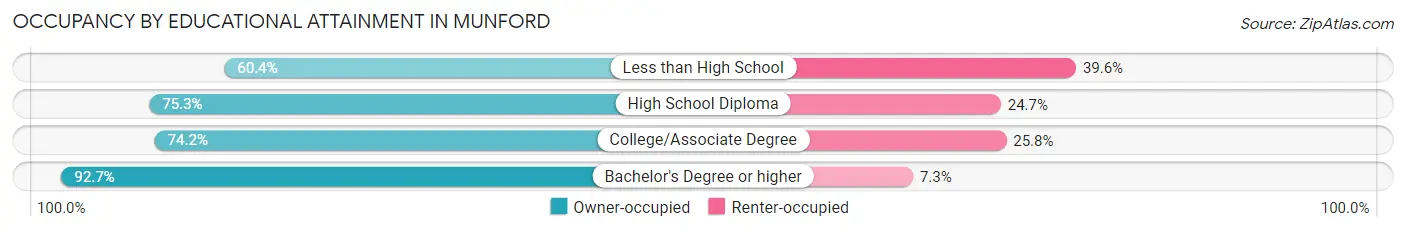
| Household Size | Owner-occupied | Renter-occupied |
| Less than High School | 93 (60.4%) | 61 (39.6%) |
| High School Diploma | 512 (75.3%) | 168 (24.7%) |
| College/Associate Degree | 613 (74.2%) | 213 (25.8%) |
| Bachelor's Degree or higher | 419 (92.7%) | 33 (7.3%) |
Occupancy by Age of Householder in Munford
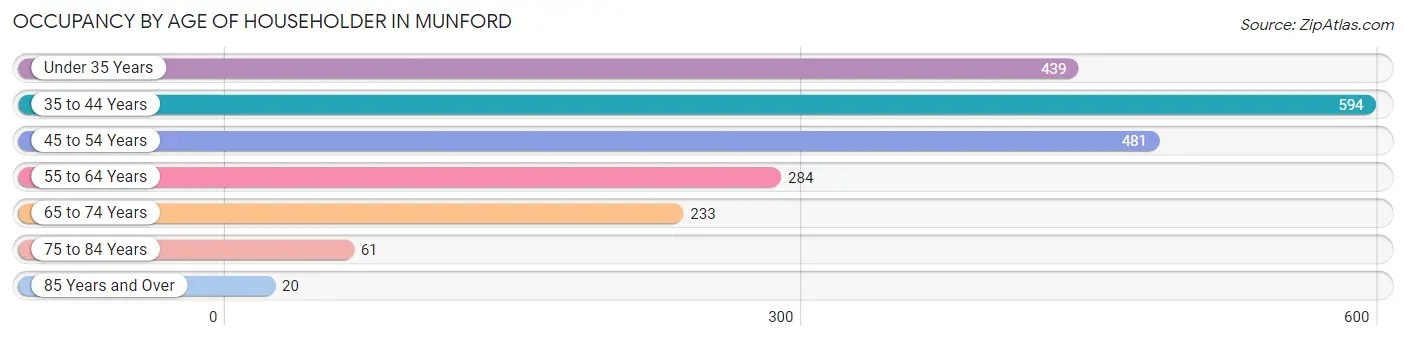
| Age Bracket | # Households | % Households |
| Under 35 Years | 439 | 20.8% |
| 35 to 44 Years | 594 | 28.1% |
| 45 to 54 Years | 481 | 22.8% |
| 55 to 64 Years | 284 | 13.5% |
| 65 to 74 Years | 233 | 11.0% |
| 75 to 84 Years | 61 | 2.9% |
| 85 Years and Over | 20 | 0.9% |
| Total | 2,112 | 100.0% |
Housing Finances in Munford
Median Income by Occupancy in Munford
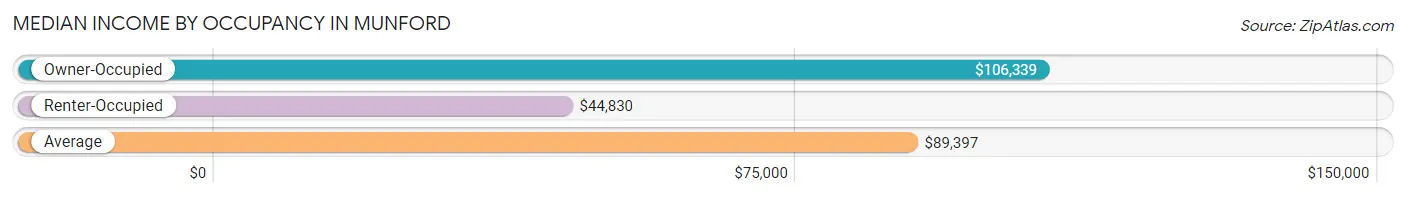
| Occupancy Type | # Households | Median Income |
| Owner-Occupied | 1,637 (77.5%) | $106,339 |
| Renter-Occupied | 475 (22.5%) | $44,830 |
| Average | 2,112 (100.0%) | $89,397 |
Occupancy by Householder Income Bracket in Munford
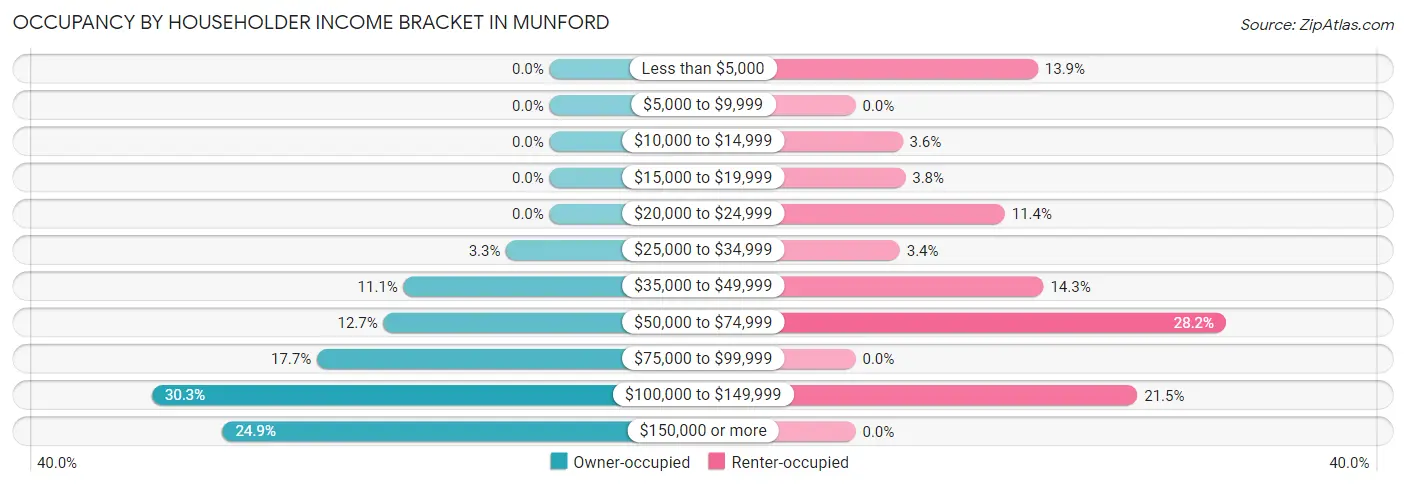
| Income Bracket | Owner-occupied | Renter-occupied |
| Less than $5,000 | 0 (0.0%) | 66 (13.9%) |
| $5,000 to $9,999 | 0 (0.0%) | 0 (0.0%) |
| $10,000 to $14,999 | 0 (0.0%) | 17 (3.6%) |
| $15,000 to $19,999 | 0 (0.0%) | 18 (3.8%) |
| $20,000 to $24,999 | 0 (0.0%) | 54 (11.4%) |
| $25,000 to $34,999 | 54 (3.3%) | 16 (3.4%) |
| $35,000 to $49,999 | 182 (11.1%) | 68 (14.3%) |
| $50,000 to $74,999 | 207 (12.7%) | 134 (28.2%) |
| $75,000 to $99,999 | 290 (17.7%) | 0 (0.0%) |
| $100,000 to $149,999 | 496 (30.3%) | 102 (21.5%) |
| $150,000 or more | 408 (24.9%) | 0 (0.0%) |
| Total | 1,637 (100.0%) | 475 (100.0%) |
Monthly Housing Cost Tiers in Munford
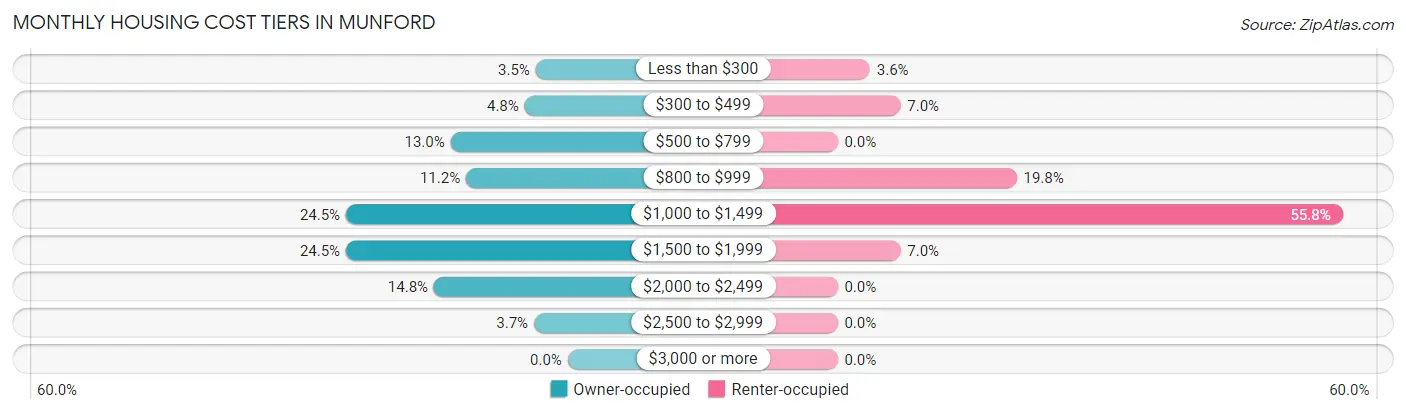
| Monthly Cost | Owner-occupied | Renter-occupied |
| Less than $300 | 58 (3.5%) | 17 (3.6%) |
| $300 to $499 | 78 (4.8%) | 33 (7.0%) |
| $500 to $799 | 212 (13.0%) | 0 (0.0%) |
| $800 to $999 | 184 (11.2%) | 94 (19.8%) |
| $1,000 to $1,499 | 401 (24.5%) | 265 (55.8%) |
| $1,500 to $1,999 | 401 (24.5%) | 33 (7.0%) |
| $2,000 to $2,499 | 242 (14.8%) | 0 (0.0%) |
| $2,500 to $2,999 | 61 (3.7%) | 0 (0.0%) |
| $3,000 or more | 0 (0.0%) | 0 (0.0%) |
| Total | 1,637 (100.0%) | 475 (100.0%) |
Physical Housing Characteristics in Munford
Housing Structures in Munford
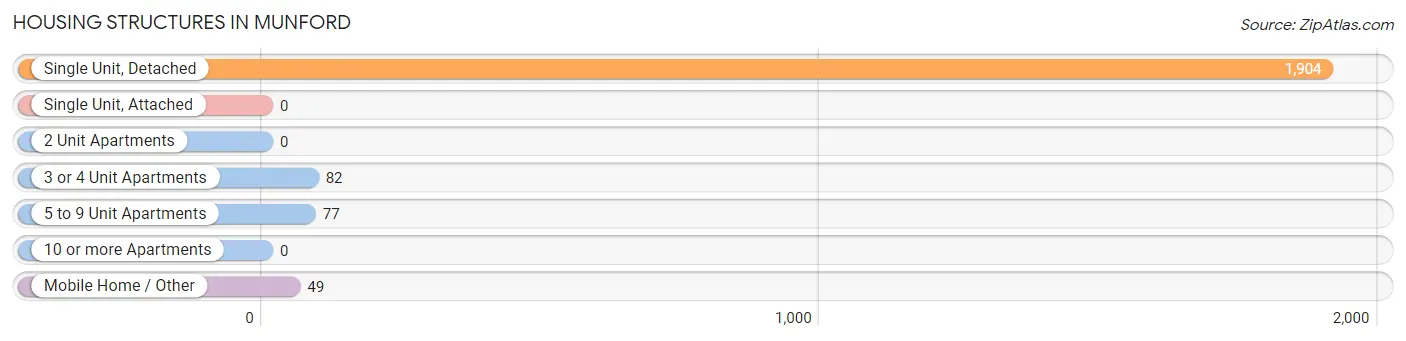
| Structure Type | # Housing Units | % Housing Units |
| Single Unit, Detached | 1,904 | 90.1% |
| Single Unit, Attached | 0 | 0.0% |
| 2 Unit Apartments | 0 | 0.0% |
| 3 or 4 Unit Apartments | 82 | 3.9% |
| 5 to 9 Unit Apartments | 77 | 3.6% |
| 10 or more Apartments | 0 | 0.0% |
| Mobile Home / Other | 49 | 2.3% |
| Total | 2,112 | 100.0% |
Housing Structures by Occupancy in Munford
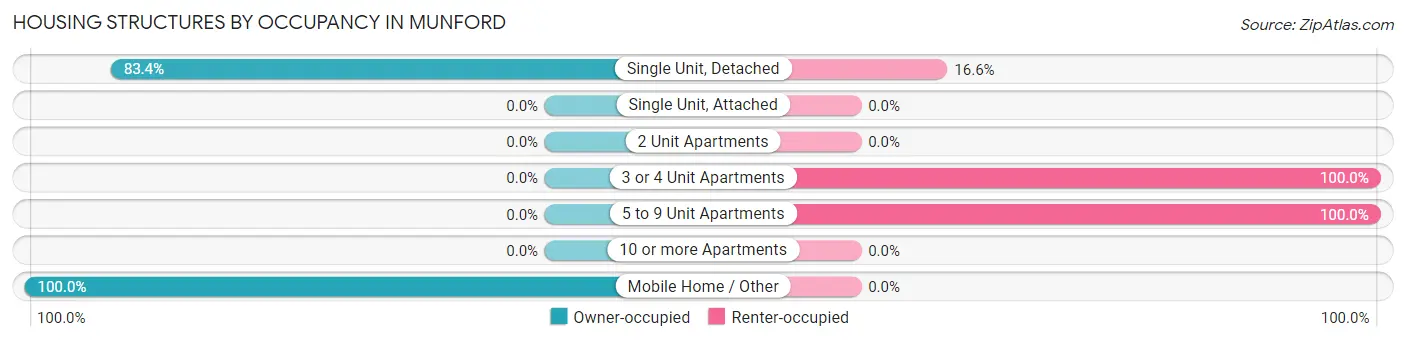
| Structure Type | Owner-occupied | Renter-occupied |
| Single Unit, Detached | 1,588 (83.4%) | 316 (16.6%) |
| Single Unit, Attached | 0 (0.0%) | 0 (0.0%) |
| 2 Unit Apartments | 0 (0.0%) | 0 (0.0%) |
| 3 or 4 Unit Apartments | 0 (0.0%) | 82 (100.0%) |
| 5 to 9 Unit Apartments | 0 (0.0%) | 77 (100.0%) |
| 10 or more Apartments | 0 (0.0%) | 0 (0.0%) |
| Mobile Home / Other | 49 (100.0%) | 0 (0.0%) |
| Total | 1,637 (77.5%) | 475 (22.5%) |
Housing Structures by Number of Rooms in Munford
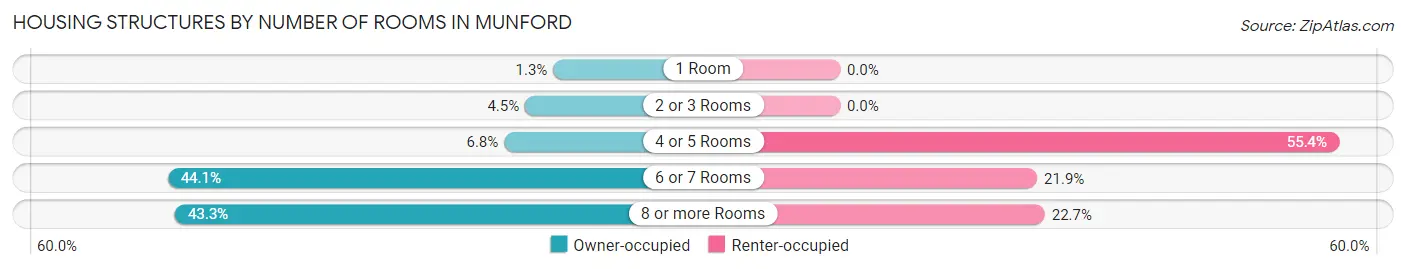
| Number of Rooms | Owner-occupied | Renter-occupied |
| 1 Room | 22 (1.3%) | 0 (0.0%) |
| 2 or 3 Rooms | 73 (4.5%) | 0 (0.0%) |
| 4 or 5 Rooms | 111 (6.8%) | 263 (55.4%) |
| 6 or 7 Rooms | 722 (44.1%) | 104 (21.9%) |
| 8 or more Rooms | 709 (43.3%) | 108 (22.7%) |
| Total | 1,637 (100.0%) | 475 (100.0%) |
Housing Structure by Heating Type in Munford
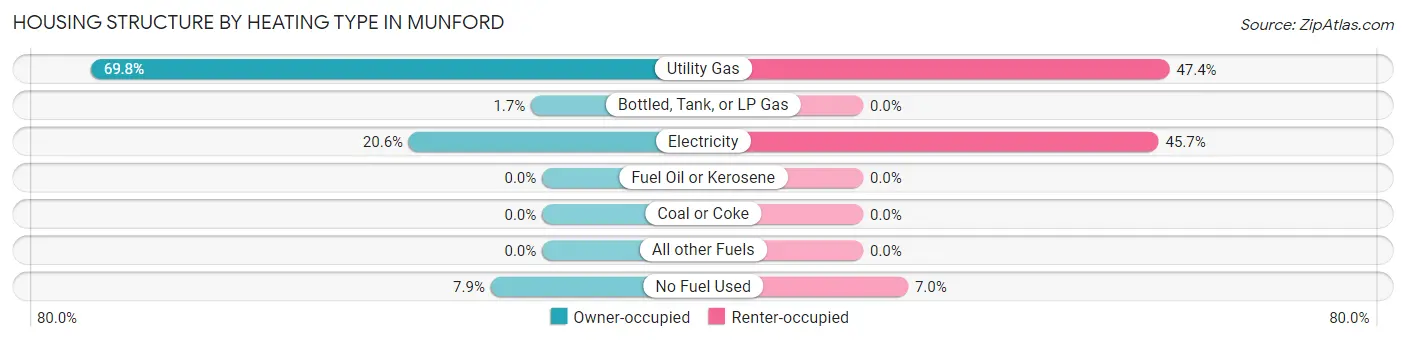
| Heating Type | Owner-occupied | Renter-occupied |
| Utility Gas | 1,142 (69.8%) | 225 (47.4%) |
| Bottled, Tank, or LP Gas | 28 (1.7%) | 0 (0.0%) |
| Electricity | 337 (20.6%) | 217 (45.7%) |
| Fuel Oil or Kerosene | 0 (0.0%) | 0 (0.0%) |
| Coal or Coke | 0 (0.0%) | 0 (0.0%) |
| All other Fuels | 0 (0.0%) | 0 (0.0%) |
| No Fuel Used | 130 (7.9%) | 33 (7.0%) |
| Total | 1,637 (100.0%) | 475 (100.0%) |
Household Vehicle Usage in Munford
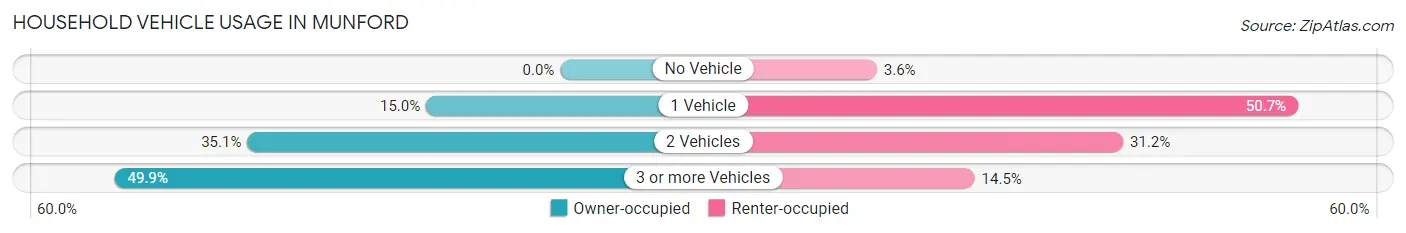
| Vehicles per Household | Owner-occupied | Renter-occupied |
| No Vehicle | 0 (0.0%) | 17 (3.6%) |
| 1 Vehicle | 246 (15.0%) | 241 (50.7%) |
| 2 Vehicles | 574 (35.1%) | 148 (31.2%) |
| 3 or more Vehicles | 817 (49.9%) | 69 (14.5%) |
| Total | 1,637 (100.0%) | 475 (100.0%) |
Real Estate & Mortgages in Munford
Real Estate and Mortgage Overview in Munford
| Characteristic | Without Mortgage | With Mortgage |
| Housing Units | 351 | 1,286 |
| Median Property Value | $172,300 | $217,700 |
| Median Household Income | $98,309 | $334 |
| Monthly Housing Costs | $604 | $0 |
| Real Estate Taxes | $1,400 | $23 |
Property Value by Mortgage Status in Munford
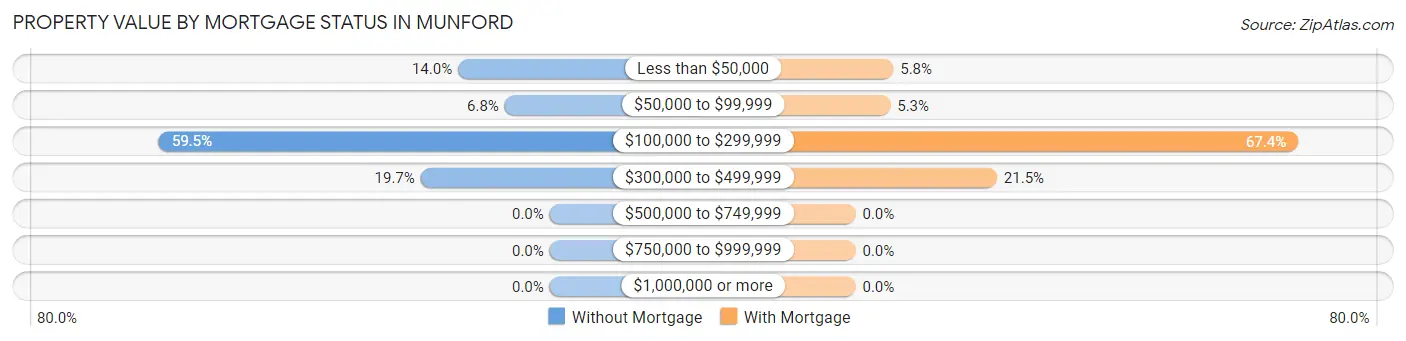
| Property Value | Without Mortgage | With Mortgage |
| Less than $50,000 | 49 (14.0%) | 74 (5.8%) |
| $50,000 to $99,999 | 24 (6.8%) | 68 (5.3%) |
| $100,000 to $299,999 | 209 (59.5%) | 867 (67.4%) |
| $300,000 to $499,999 | 69 (19.7%) | 277 (21.5%) |
| $500,000 to $749,999 | 0 (0.0%) | 0 (0.0%) |
| $750,000 to $999,999 | 0 (0.0%) | 0 (0.0%) |
| $1,000,000 or more | 0 (0.0%) | 0 (0.0%) |
| Total | 351 (100.0%) | 1,286 (100.0%) |
Household Income by Mortgage Status in Munford
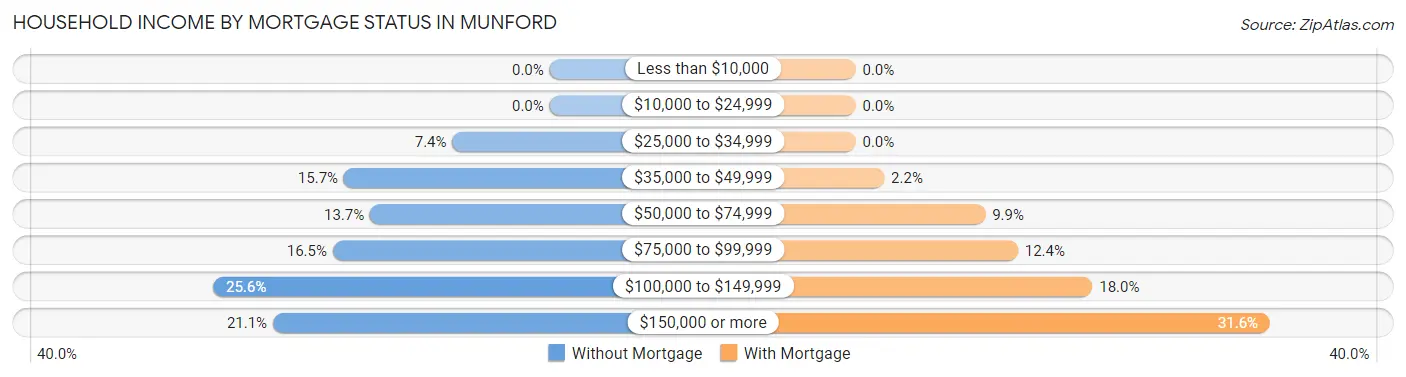
| Household Income | Without Mortgage | With Mortgage |
| Less than $10,000 | 0 (0.0%) | 0 (0.0%) |
| $10,000 to $24,999 | 0 (0.0%) | 0 (0.0%) |
| $25,000 to $34,999 | 26 (7.4%) | 0 (0.0%) |
| $35,000 to $49,999 | 55 (15.7%) | 28 (2.2%) |
| $50,000 to $74,999 | 48 (13.7%) | 127 (9.9%) |
| $75,000 to $99,999 | 58 (16.5%) | 159 (12.4%) |
| $100,000 to $149,999 | 90 (25.6%) | 232 (18.0%) |
| $150,000 or more | 74 (21.1%) | 406 (31.6%) |
| Total | 351 (100.0%) | 1,286 (100.0%) |
Property Value to Household Income Ratio in Munford
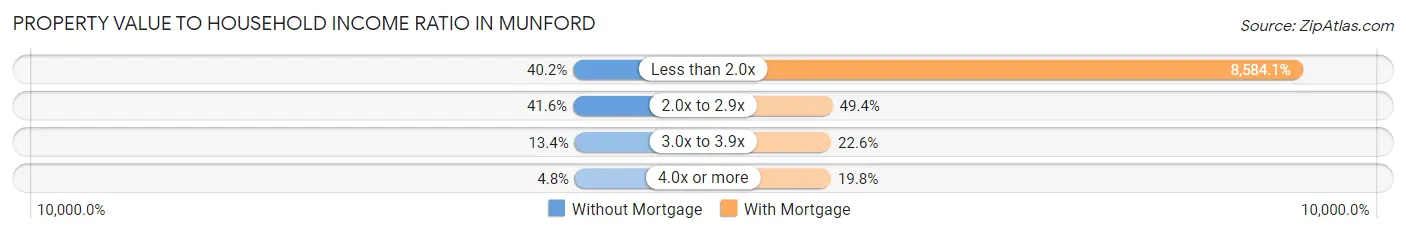
| Value-to-Income Ratio | Without Mortgage | With Mortgage |
| Less than 2.0x | 141 (40.2%) | 110,391 (8,584.1%) |
| 2.0x to 2.9x | 146 (41.6%) | 635 (49.4%) |
| 3.0x to 3.9x | 47 (13.4%) | 290 (22.6%) |
| 4.0x or more | 17 (4.8%) | 255 (19.8%) |
| Total | 351 (100.0%) | 1,286 (100.0%) |
Real Estate Taxes by Mortgage Status in Munford
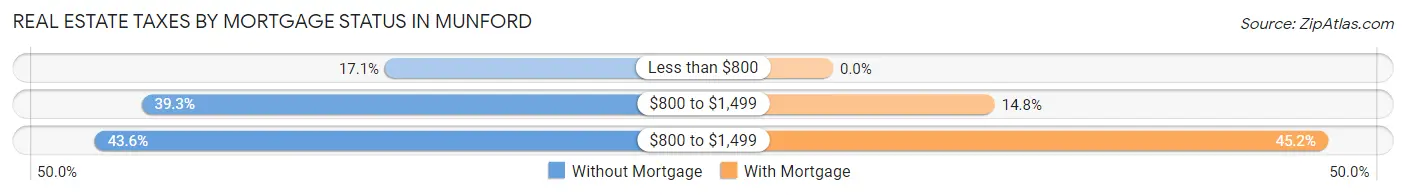
| Property Taxes | Without Mortgage | With Mortgage |
| Less than $800 | 60 (17.1%) | 0 (0.0%) |
| $800 to $1,499 | 138 (39.3%) | 190 (14.8%) |
| $800 to $1,499 | 153 (43.6%) | 581 (45.2%) |
| Total | 351 (100.0%) | 1,286 (100.0%) |
Health & Disability in Munford
Health Insurance Coverage by Age in Munford
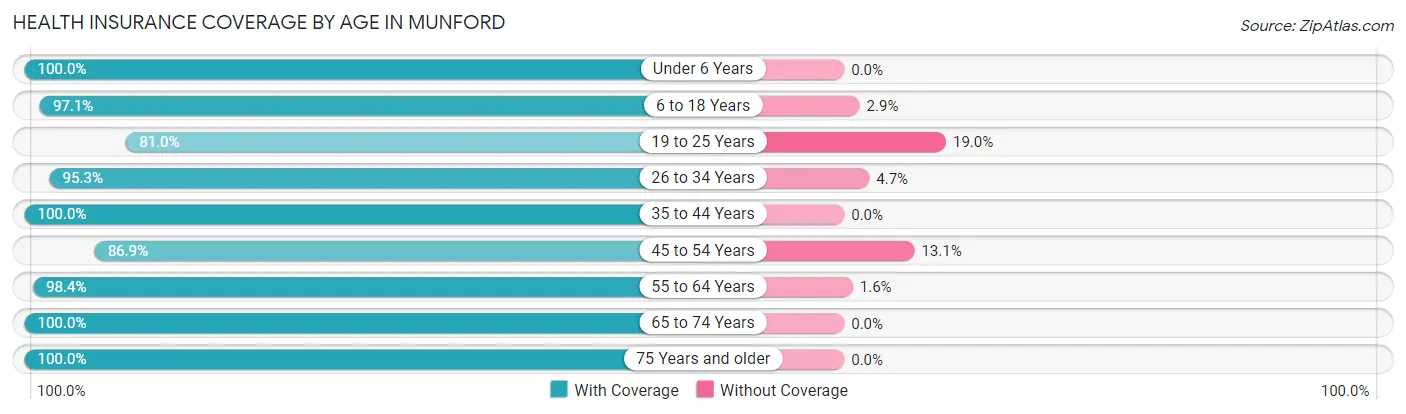
| Age Bracket | With Coverage | Without Coverage |
| Under 6 Years | 366 (100.0%) | 0 (0.0%) |
| 6 to 18 Years | 1,488 (97.1%) | 44 (2.9%) |
| 19 to 25 Years | 504 (81.0%) | 118 (19.0%) |
| 26 to 34 Years | 715 (95.3%) | 35 (4.7%) |
| 35 to 44 Years | 1,089 (100.0%) | 0 (0.0%) |
| 45 to 54 Years | 724 (86.9%) | 109 (13.1%) |
| 55 to 64 Years | 556 (98.4%) | 9 (1.6%) |
| 65 to 74 Years | 416 (100.0%) | 0 (0.0%) |
| 75 Years and older | 166 (100.0%) | 0 (0.0%) |
| Total | 6,024 (95.0%) | 315 (5.0%) |
Health Insurance Coverage by Citizenship Status in Munford
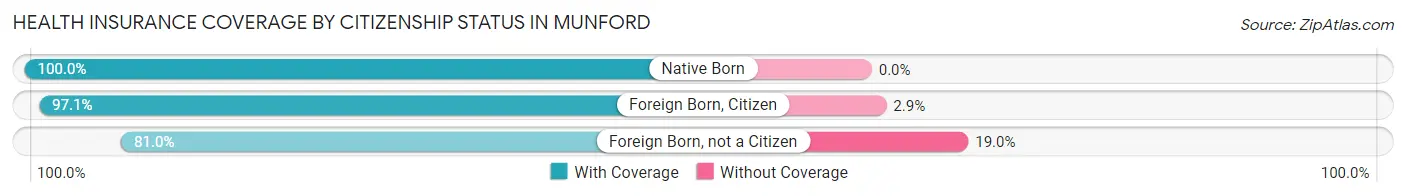
| Citizenship Status | With Coverage | Without Coverage |
| Native Born | 366 (100.0%) | 0 (0.0%) |
| Foreign Born, Citizen | 1,488 (97.1%) | 44 (2.9%) |
| Foreign Born, not a Citizen | 504 (81.0%) | 118 (19.0%) |
Health Insurance Coverage by Household Income in Munford
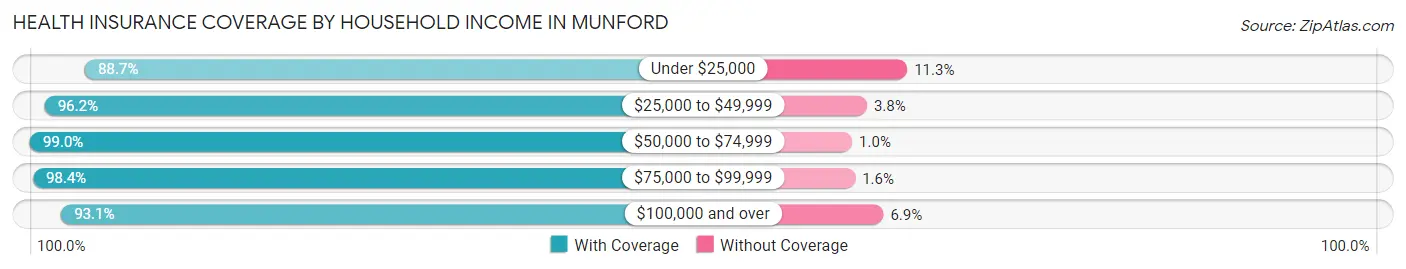
| Household Income | With Coverage | Without Coverage |
| Under $25,000 | 235 (88.7%) | 30 (11.3%) |
| $25,000 to $49,999 | 585 (96.2%) | 23 (3.8%) |
| $50,000 to $74,999 | 887 (99.0%) | 9 (1.0%) |
| $75,000 to $99,999 | 1,131 (98.4%) | 18 (1.6%) |
| $100,000 and over | 3,186 (93.1%) | 235 (6.9%) |
Public vs Private Health Insurance Coverage by Age in Munford
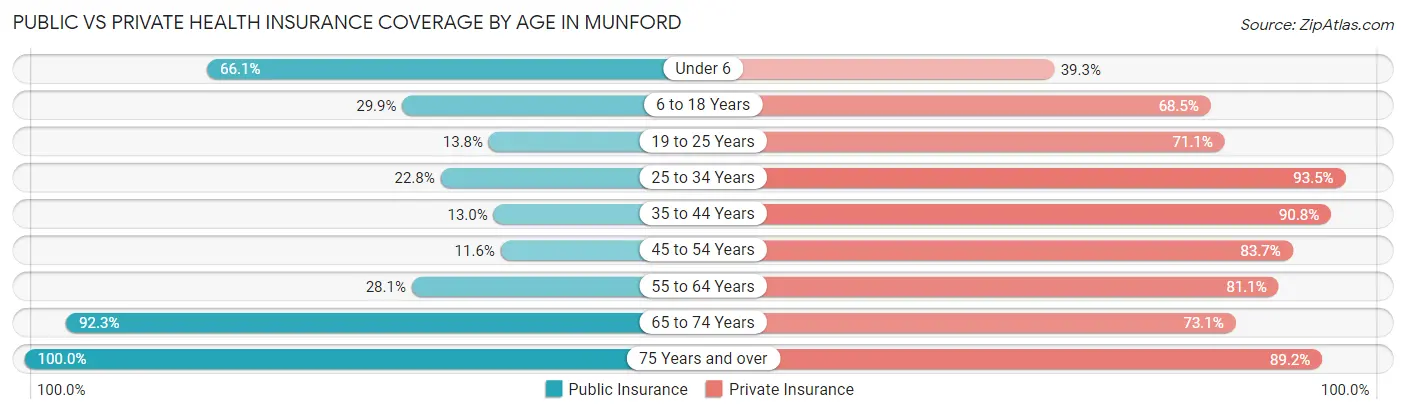
| Age Bracket | Public Insurance | Private Insurance |
| Under 6 | 242 (66.1%) | 144 (39.3%) |
| 6 to 18 Years | 458 (29.9%) | 1,049 (68.5%) |
| 19 to 25 Years | 86 (13.8%) | 442 (71.1%) |
| 25 to 34 Years | 171 (22.8%) | 701 (93.5%) |
| 35 to 44 Years | 141 (13.0%) | 989 (90.8%) |
| 45 to 54 Years | 97 (11.6%) | 697 (83.7%) |
| 55 to 64 Years | 159 (28.1%) | 458 (81.1%) |
| 65 to 74 Years | 384 (92.3%) | 304 (73.1%) |
| 75 Years and over | 166 (100.0%) | 148 (89.2%) |
| Total | 1,904 (30.0%) | 4,932 (77.8%) |
Disability Status by Sex by Age in Munford
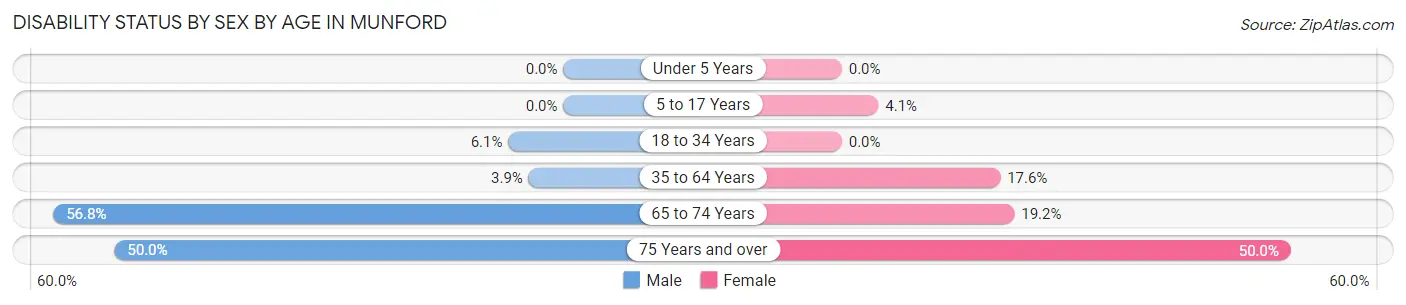
| Age Bracket | Male | Female |
| Under 5 Years | 0 (0.0%) | 0 (0.0%) |
| 5 to 17 Years | 0 (0.0%) | 32 (4.1%) |
| 18 to 34 Years | 51 (6.1%) | 0 (0.0%) |
| 35 to 64 Years | 49 (3.9%) | 215 (17.6%) |
| 65 to 74 Years | 121 (56.8%) | 39 (19.2%) |
| 75 Years and over | 32 (50.0%) | 51 (50.0%) |
Disability Class by Sex by Age in Munford
Disability Class: Hearing Difficulty
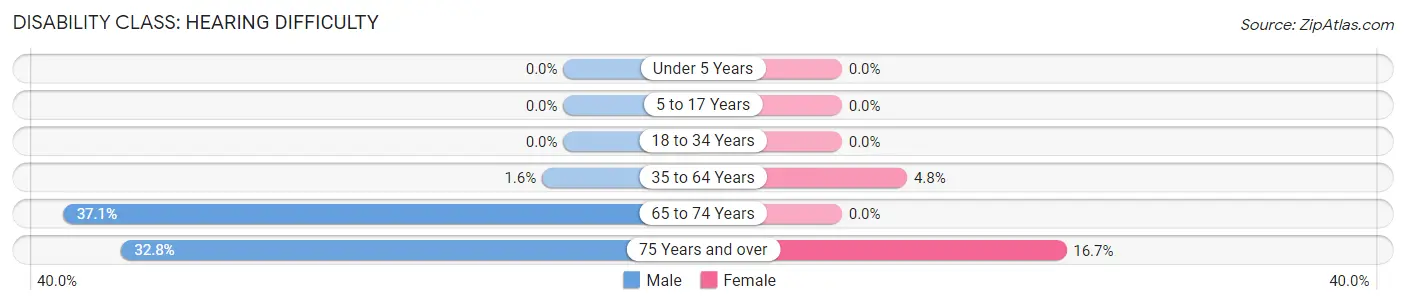
| Age Bracket | Male | Female |
| Under 5 Years | 0 (0.0%) | 0 (0.0%) |
| 5 to 17 Years | 0 (0.0%) | 0 (0.0%) |
| 18 to 34 Years | 0 (0.0%) | 0 (0.0%) |
| 35 to 64 Years | 20 (1.6%) | 59 (4.8%) |
| 65 to 74 Years | 79 (37.1%) | 0 (0.0%) |
| 75 Years and over | 21 (32.8%) | 17 (16.7%) |
Disability Class: Vision Difficulty
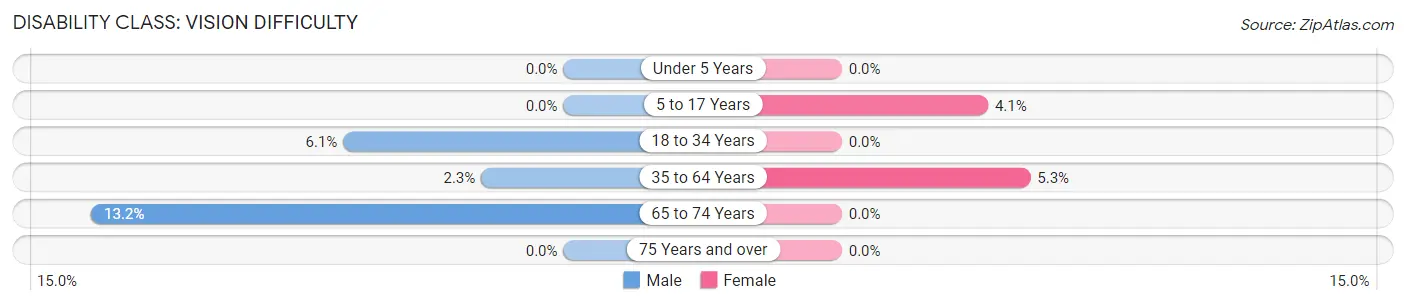
| Age Bracket | Male | Female |
| Under 5 Years | 0 (0.0%) | 0 (0.0%) |
| 5 to 17 Years | 0 (0.0%) | 32 (4.1%) |
| 18 to 34 Years | 51 (6.1%) | 0 (0.0%) |
| 35 to 64 Years | 29 (2.3%) | 64 (5.2%) |
| 65 to 74 Years | 28 (13.2%) | 0 (0.0%) |
| 75 Years and over | 0 (0.0%) | 0 (0.0%) |
Disability Class: Cognitive Difficulty
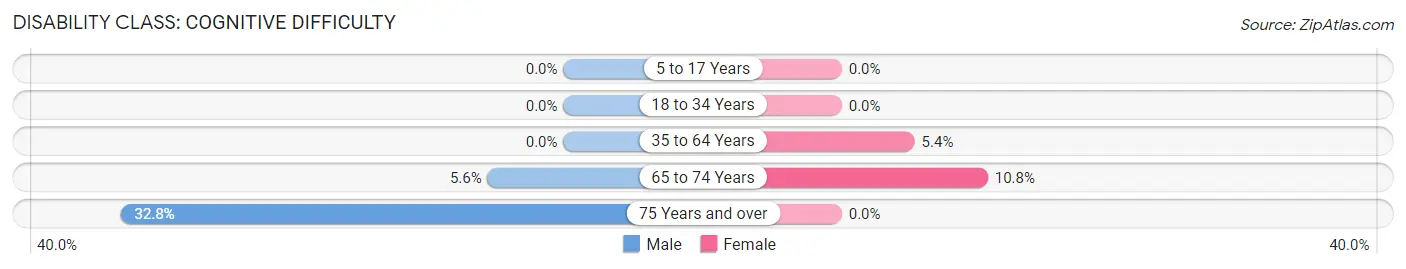
| Age Bracket | Male | Female |
| 5 to 17 Years | 0 (0.0%) | 0 (0.0%) |
| 18 to 34 Years | 0 (0.0%) | 0 (0.0%) |
| 35 to 64 Years | 0 (0.0%) | 66 (5.4%) |
| 65 to 74 Years | 12 (5.6%) | 22 (10.8%) |
| 75 Years and over | 21 (32.8%) | 0 (0.0%) |
Disability Class: Ambulatory Difficulty
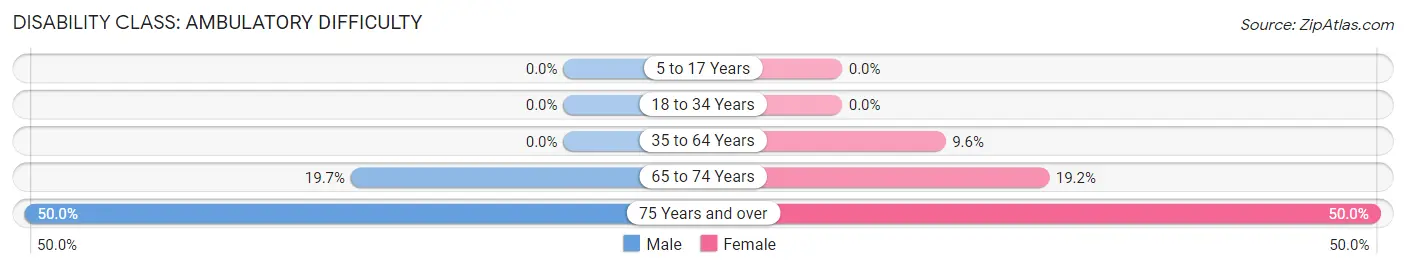
| Age Bracket | Male | Female |
| 5 to 17 Years | 0 (0.0%) | 0 (0.0%) |
| 18 to 34 Years | 0 (0.0%) | 0 (0.0%) |
| 35 to 64 Years | 0 (0.0%) | 117 (9.6%) |
| 65 to 74 Years | 42 (19.7%) | 39 (19.2%) |
| 75 Years and over | 32 (50.0%) | 51 (50.0%) |
Disability Class: Self-Care Difficulty
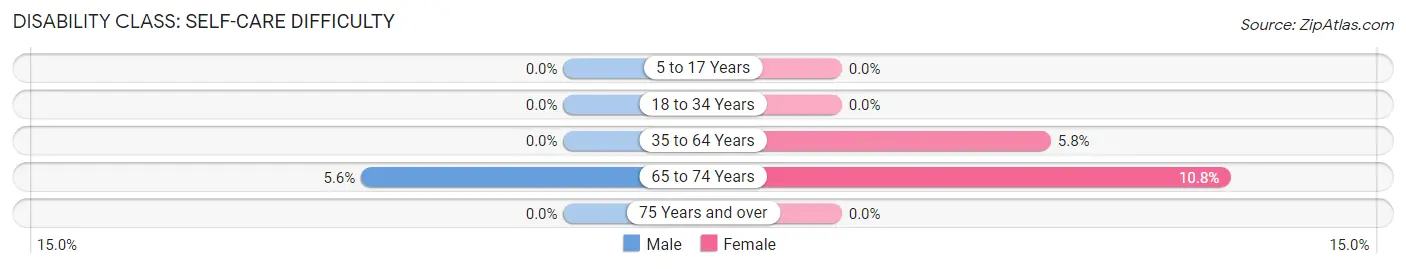
| Age Bracket | Male | Female |
| 5 to 17 Years | 0 (0.0%) | 0 (0.0%) |
| 18 to 34 Years | 0 (0.0%) | 0 (0.0%) |
| 35 to 64 Years | 0 (0.0%) | 71 (5.8%) |
| 65 to 74 Years | 12 (5.6%) | 22 (10.8%) |
| 75 Years and over | 0 (0.0%) | 0 (0.0%) |
Technology Access in Munford
Computing Device Access in Munford
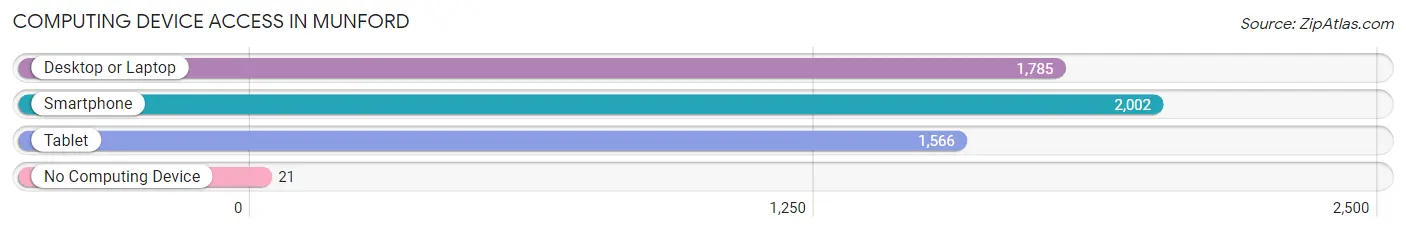
| Device Type | # Households | % Households |
| Desktop or Laptop | 1,785 | 84.5% |
| Smartphone | 2,002 | 94.8% |
| Tablet | 1,566 | 74.2% |
| No Computing Device | 21 | 1.0% |
| Total | 2,112 | 100.0% |
Internet Access in Munford
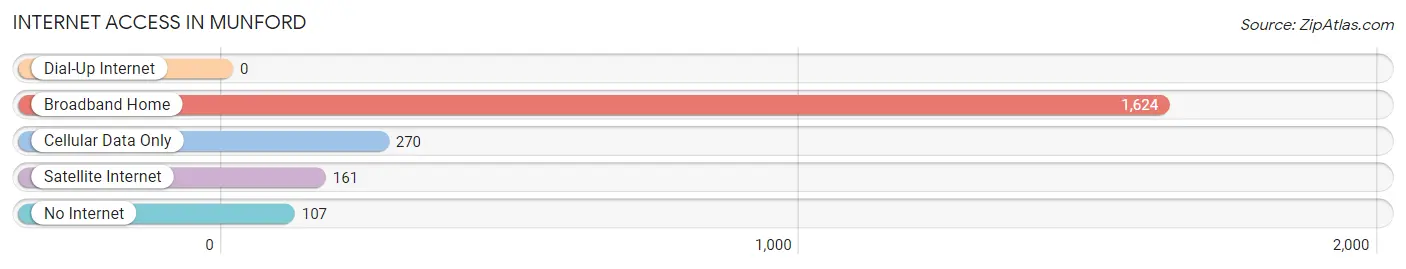
| Internet Type | # Households | % Households |
| Dial-Up Internet | 0 | 0.0% |
| Broadband Home | 1,624 | 76.9% |
| Cellular Data Only | 270 | 12.8% |
| Satellite Internet | 161 | 7.6% |
| No Internet | 107 | 5.1% |
| Total | 2,112 | 100.0% |
Munford Summary
Munford, Tennessee is a small town located in Tipton County, Tennessee. It is situated about 20 miles northeast of Memphis and is part of the Memphis Metropolitan Statistical Area. The town has a population of approximately 5,000 people and is known for its small-town charm and friendly atmosphere.
History
Munford was founded in 1854 by a group of settlers from North Carolina. The town was named after William Munford, a prominent local landowner. The town was incorporated in 1871 and quickly grew to become a thriving agricultural center. The town was home to several cotton gins, a grist mill, and a sawmill. The town also had a railroad station, which connected it to Memphis and other nearby towns.
In the early 1900s, Munford began to experience a period of growth and development. The town was home to several businesses, including a bank, a hotel, and a movie theater. The town also had a thriving school system, which included a high school and a college.
Geography
Munford is located in the western part of Tipton County, Tennessee. The town is situated on the banks of the Wolf River, which flows through the town. The town is surrounded by rolling hills and farmland. The town is located about 20 miles northeast of Memphis and is part of the Memphis Metropolitan Statistical Area.
Economy
Munford’s economy is largely based on agriculture. The town is home to several farms, which produce a variety of crops, including cotton, corn, soybeans, and wheat. The town also has several businesses, including a bank, a hotel, and a movie theater. The town is also home to several manufacturing companies, which produce a variety of products, including furniture, clothing, and automotive parts.
Demographics
As of the 2010 census, Munford had a population of 5,000 people. The town is predominantly white, with about 90% of the population being white. The town also has a small African American population, which makes up about 5% of the population. The town also has a small Hispanic population, which makes up about 2% of the population. The median household income in Munford is $41,000, and the median home value is $125,000.
Munford is a small town with a rich history and a friendly atmosphere. The town is home to several businesses and is surrounded by rolling hills and farmland. The town has a population of about 5,000 people and is predominantly white. The town also has a small African American and Hispanic population. The town’s economy is largely based on agriculture, and the town is home to several manufacturing companies.
Common Questions
What is Per Capita Income in Munford?
Per Capita income in Munford is $33,711.
What is the Median Family Income in Munford?
Median Family Income in Munford is $89,310.
What is the Median Household income in Munford?
Median Household Income in Munford is $89,397.
What is Income or Wage Gap in Munford?
Income or Wage Gap in Munford is 9.0%.
Women in Munford earn 91.0 cents for every dollar earned by a man.
What is Inequality or Gini Index in Munford?
Inequality or Gini Index in Munford is 0.33.
What is the Total Population of Munford?
Total Population of Munford is 6,357.
What is the Total Male Population of Munford?
Total Male Population of Munford is 3,290.
What is the Total Female Population of Munford?
Total Female Population of Munford is 3,067.
What is the Ratio of Males per 100 Females in Munford?
There are 107.27 Males per 100 Females in Munford.
What is the Ratio of Females per 100 Males in Munford?
There are 93.22 Females per 100 Males in Munford.
What is the Median Population Age in Munford?
Median Population Age in Munford is 33.5 Years.
What is the Average Family Size in Munford
Average Family Size in Munford is 3.5 People.
What is the Average Household Size in Munford
Average Household Size in Munford is 3.0 People.
How Large is the Labor Force in Munford?
There are 3,375 People in the Labor Forcein in Munford.
What is the Percentage of People in the Labor Force in Munford?
69.0% of People are in the Labor Force in Munford.
What is the Unemployment Rate in Munford?
Unemployment Rate in Munford is 8.2%.