Harriman, TN Map & Demographics
Harriman Map
Harriman Overview
$28,866
PER CAPITA INCOME
$77,965
AVG FAMILY INCOME
$45,458
AVG HOUSEHOLD INCOME
23.8%
WAGE / INCOME GAP [ % ]
76.2¢/ $1
WAGE / INCOME GAP [ $ ]
0.47
INEQUALITY / GINI INDEX
6,000
TOTAL POPULATION
3,132
MALE POPULATION
2,868
FEMALE POPULATION
109.21
MALES / 100 FEMALES
91.57
FEMALES / 100 MALES
43.8
MEDIAN AGE
3.0
AVG FAMILY SIZE
2.3
AVG HOUSEHOLD SIZE
2,737
LABOR FORCE [ PEOPLE ]
52.5%
PERCENT IN LABOR FORCE
3.4%
UNEMPLOYMENT RATE
Harriman Zip Codes
Harriman Area Codes
Income in Harriman
Income Overview in Harriman
Per Capita Income in Harriman is $28,866, while median incomes of families and households are $77,965 and $45,458 respectively.
| Characteristic | Number | Measure |
| Per Capita Income | 6,000 | $28,866 |
| Median Family Income | 1,526 | $77,965 |
| Mean Family Income | 1,526 | $81,571 |
| Median Household Income | 2,542 | $45,458 |
| Mean Household Income | 2,542 | $63,518 |
| Income Deficit | 1,526 | $0 |
| Wage / Income Gap (%) | 6,000 | 23.75% |
| Wage / Income Gap ($) | 6,000 | 76.25¢ per $1 |
| Gini / Inequality Index | 6,000 | 0.47 |
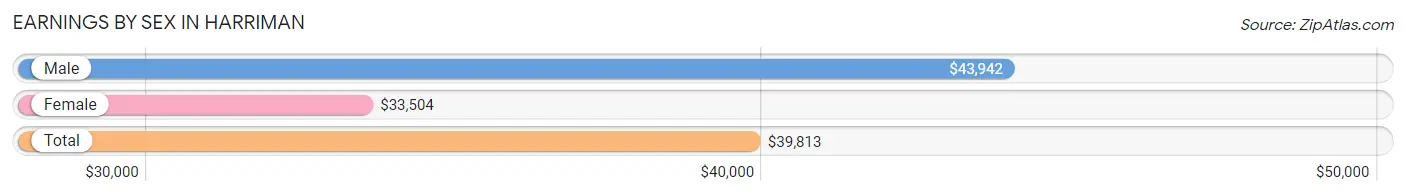
Earnings by Sex in Harriman
Average Earnings in Harriman are $39,813, $43,942 for men and $33,504 for women, a difference of 23.7%.
| Sex | Number | Average Earnings |
| Male | 1,574 (52.8%) | $43,942 |
| Female | 1,406 (47.2%) | $33,504 |
| Total | 2,980 (100.0%) | $39,813 |
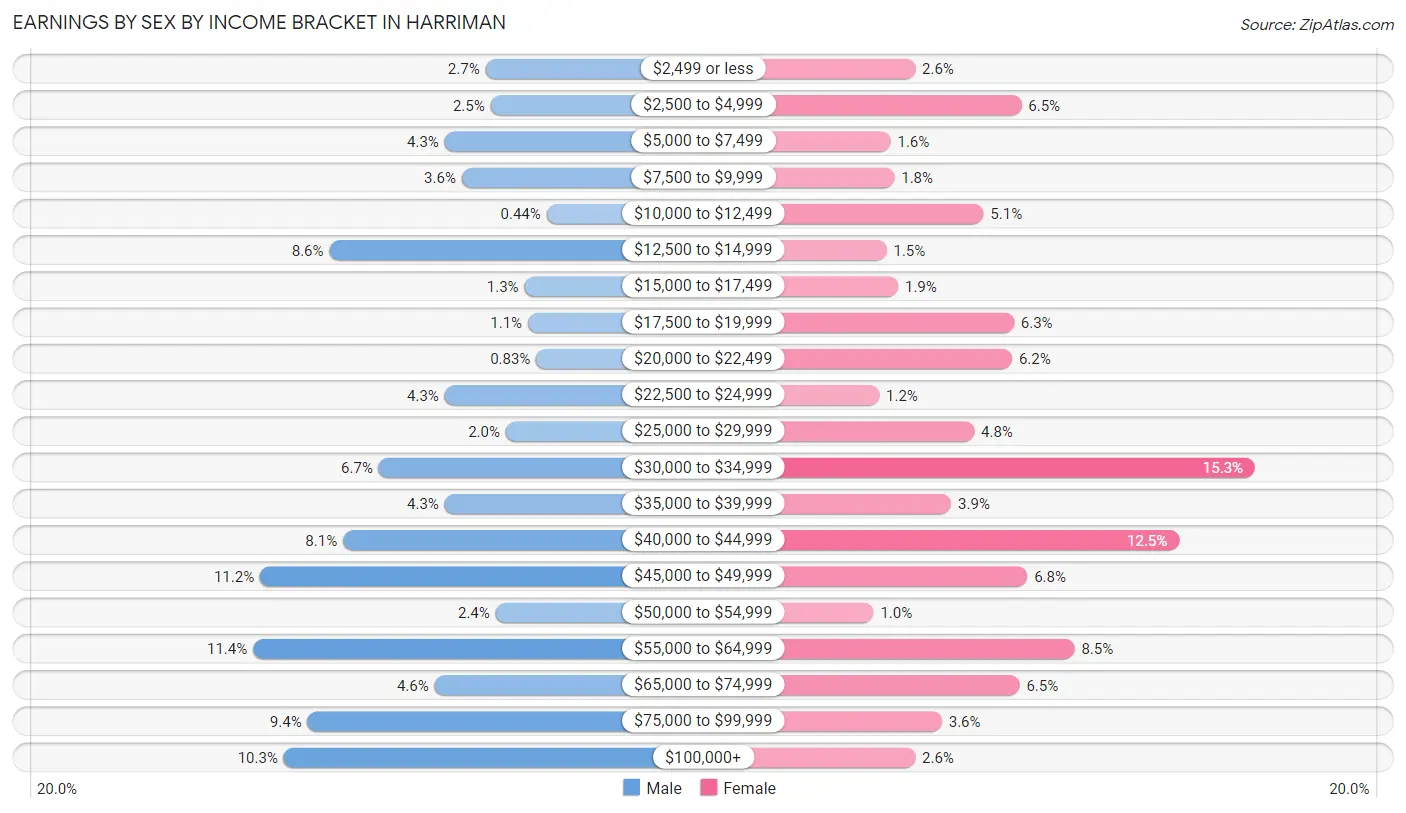
Earnings by Sex by Income Bracket in Harriman
The most common earnings brackets in Harriman are $55,000 to $64,999 for men (180 | 11.4%) and $30,000 to $34,999 for women (215 | 15.3%).
| Income | Male | Female |
| $2,499 or less | 43 (2.7%) | 36 (2.6%) |
| $2,500 to $4,999 | 40 (2.5%) | 92 (6.5%) |
| $5,000 to $7,499 | 67 (4.3%) | 23 (1.6%) |
| $7,500 to $9,999 | 57 (3.6%) | 25 (1.8%) |
| $10,000 to $12,499 | 7 (0.4%) | 72 (5.1%) |
| $12,500 to $14,999 | 135 (8.6%) | 21 (1.5%) |
| $15,000 to $17,499 | 20 (1.3%) | 27 (1.9%) |
| $17,500 to $19,999 | 18 (1.1%) | 88 (6.3%) |
| $20,000 to $22,499 | 13 (0.8%) | 87 (6.2%) |
| $22,500 to $24,999 | 67 (4.3%) | 17 (1.2%) |
| $25,000 to $29,999 | 31 (2.0%) | 67 (4.8%) |
| $30,000 to $34,999 | 106 (6.7%) | 215 (15.3%) |
| $35,000 to $39,999 | 67 (4.3%) | 55 (3.9%) |
| $40,000 to $44,999 | 127 (8.1%) | 175 (12.4%) |
| $45,000 to $49,999 | 176 (11.2%) | 95 (6.8%) |
| $50,000 to $54,999 | 37 (2.4%) | 14 (1.0%) |
| $55,000 to $64,999 | 180 (11.4%) | 120 (8.5%) |
| $65,000 to $74,999 | 73 (4.6%) | 91 (6.5%) |
| $75,000 to $99,999 | 148 (9.4%) | 50 (3.6%) |
| $100,000+ | 162 (10.3%) | 36 (2.6%) |
| Total | 1,574 (100.0%) | 1,406 (100.0%) |
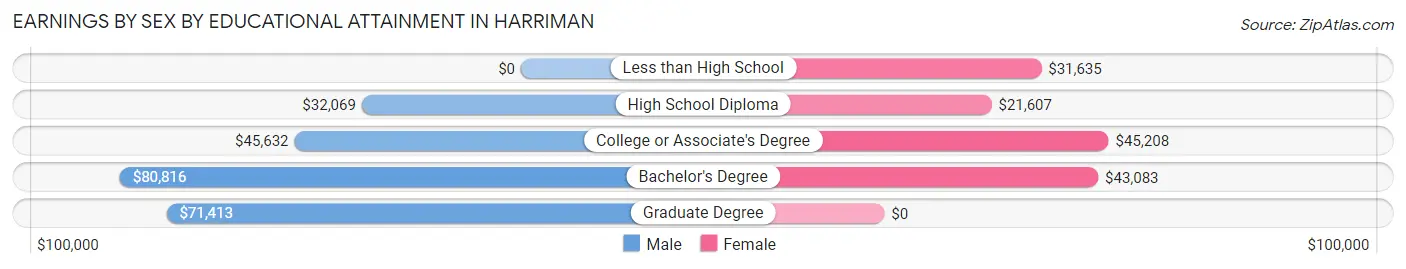
Earnings by Sex by Educational Attainment in Harriman
Average earnings in Harriman are $46,789 for men and $36,518 for women, a difference of 22.0%. Men with an educational attainment of bachelor's degree enjoy the highest average annual earnings of $80,816, while those with high school diploma education earn the least with $32,069. Women with an educational attainment of college or associate's degree earn the most with the average annual earnings of $45,208, while those with high school diploma education have the smallest earnings of $21,607.
| Educational Attainment | Male Income | Female Income |
| Less than High School | - | - |
| High School Diploma | $32,069 | $21,607 |
| College or Associate's Degree | $45,632 | $45,208 |
| Bachelor's Degree | $80,816 | $43,083 |
| Graduate Degree | $71,413 | $0 |
| Total | $46,789 | $36,518 |
Family Income in Harriman
Family Income Brackets in Harriman
According to the Harriman family income data, there are 497 families falling into the $100,000 to $149,999 income range, which is the most common income bracket and makes up 32.6% of all families. Conversely, the $25,000 to $34,999 income bracket is the least frequent group with only 43 families (2.8%) belonging to this category.
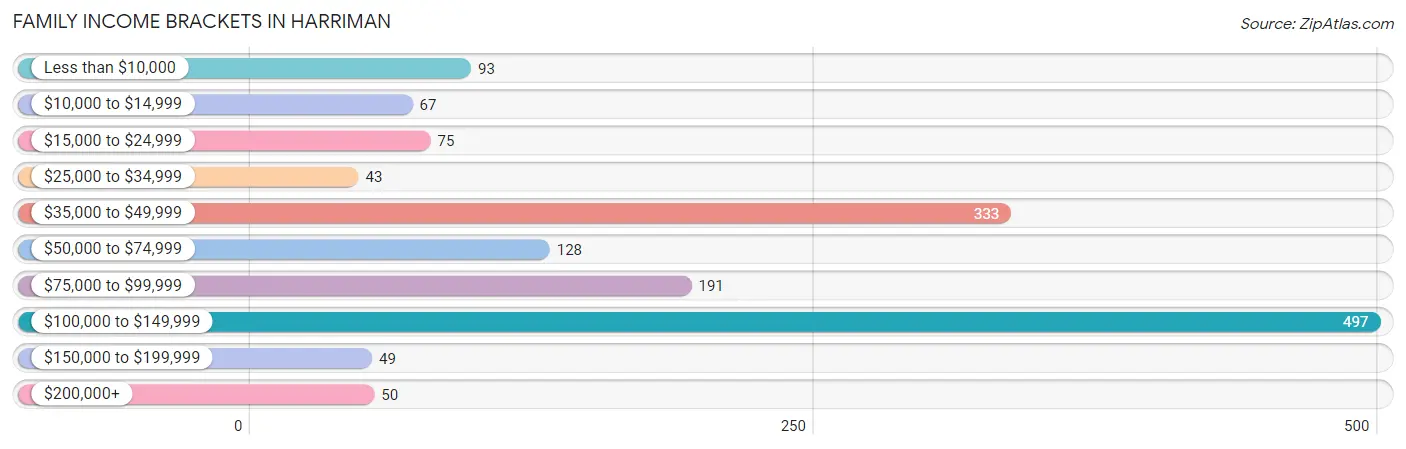
| Income Bracket | # Families | % Families |
| Less than $10,000 | 93 | 6.1% |
| $10,000 to $14,999 | 67 | 4.4% |
| $15,000 to $24,999 | 75 | 4.9% |
| $25,000 to $34,999 | 43 | 2.8% |
| $35,000 to $49,999 | 333 | 21.8% |
| $50,000 to $74,999 | 128 | 8.4% |
| $75,000 to $99,999 | 191 | 12.5% |
| $100,000 to $149,999 | 497 | 32.6% |
| $150,000 to $199,999 | 49 | 3.2% |
| $200,000+ | 50 | 3.3% |
Family Income by Famaliy Size in Harriman
6-person families (62 | 4.1%) account for the highest median family income in Harriman with $171,750 per family, while 2-person families (966 | 63.3%) have the highest median income of $47,857 per family member.
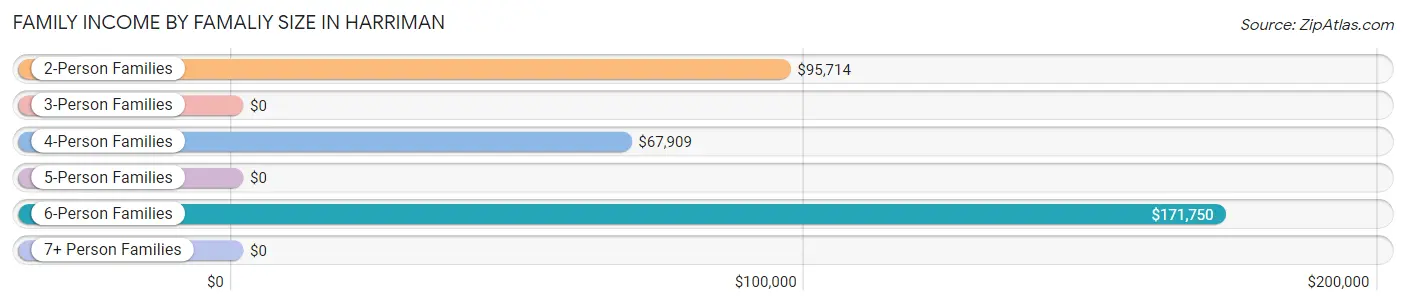
| Income Bracket | # Families | Median Income |
| 2-Person Families | 966 (63.3%) | $95,714 |
| 3-Person Families | 158 (10.3%) | $0 |
| 4-Person Families | 265 (17.4%) | $67,909 |
| 5-Person Families | 75 (4.9%) | $0 |
| 6-Person Families | 62 (4.1%) | $171,750 |
| 7+ Person Families | 0 (0.0%) | $0 |
| Total | 1,526 (100.0%) | $77,965 |
Family Income by Number of Earners in Harriman
The median family income in Harriman is $77,965, with families comprising 3+ earners (116) having the highest median family income of $142,045, while families with no earners (378) have the lowest median family income of $37,692, accounting for 7.6% and 24.8% of families, respectively.
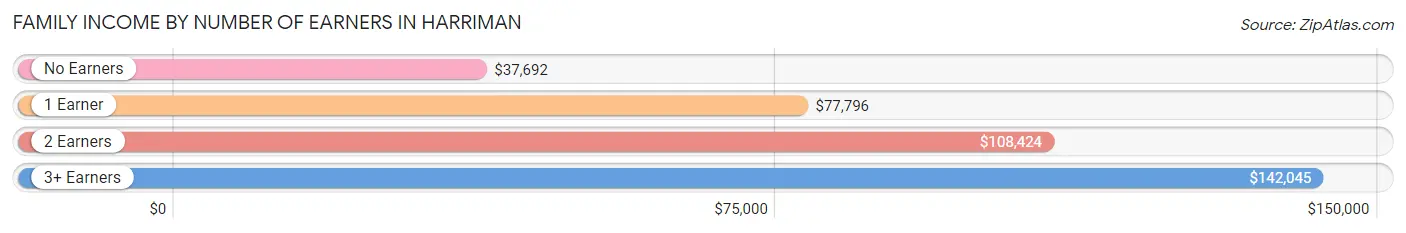
| Number of Earners | # Families | Median Income |
| No Earners | 378 (24.8%) | $37,692 |
| 1 Earner | 339 (22.2%) | $77,796 |
| 2 Earners | 693 (45.4%) | $108,424 |
| 3+ Earners | 116 (7.6%) | $142,045 |
| Total | 1,526 (100.0%) | $77,965 |
Household Income in Harriman
Household Income Brackets in Harriman
With 544 households falling in the category, the $100,000 to $149,999 income range is the most frequent in Harriman, accounting for 21.4% of all households. In contrast, only 48 households (1.9%) fall into the $150,000 to $199,999 income bracket, making it the least populous group.
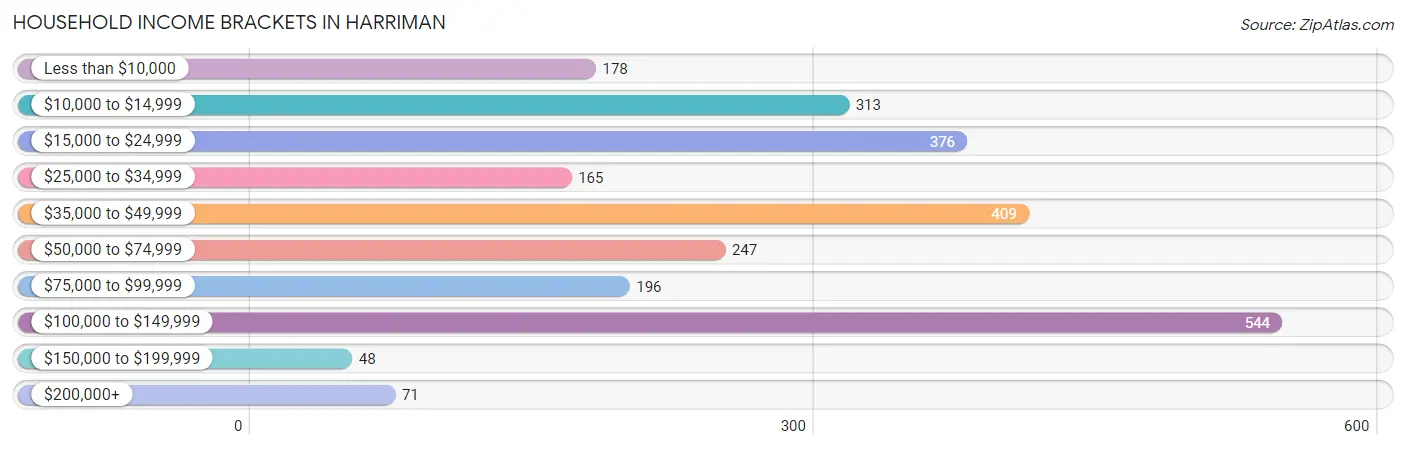
| Income Bracket | # Households | % Households |
| Less than $10,000 | 178 | 7.0% |
| $10,000 to $14,999 | 313 | 12.3% |
| $15,000 to $24,999 | 376 | 14.8% |
| $25,000 to $34,999 | 165 | 6.5% |
| $35,000 to $49,999 | 409 | 16.1% |
| $50,000 to $74,999 | 247 | 9.7% |
| $75,000 to $99,999 | 196 | 7.7% |
| $100,000 to $149,999 | 544 | 21.4% |
| $150,000 to $199,999 | 48 | 1.9% |
| $200,000+ | 71 | 2.8% |
Household Income by Householder Age in Harriman
The median household income in Harriman is $45,458, with the highest median household income of $67,882 found in the 45 to 64 years age bracket for the primary householder. A total of 1,263 households (49.7%) fall into this category. Meanwhile, the 15 to 24 years age bracket for the primary householder has the lowest median household income of $0, with 99 households (3.9%) in this group.
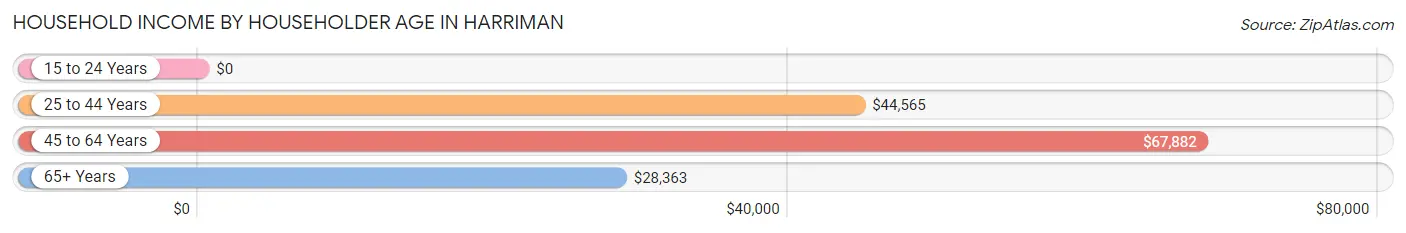
| Income Bracket | # Households | Median Income |
| 15 to 24 Years | 99 (3.9%) | $0 |
| 25 to 44 Years | 541 (21.3%) | $44,565 |
| 45 to 64 Years | 1,263 (49.7%) | $67,882 |
| 65+ Years | 639 (25.1%) | $28,363 |
| Total | 2,542 (100.0%) | $45,458 |
Poverty in Harriman
Income Below Poverty by Sex and Age in Harriman
With 11.3% poverty level for males and 24.2% for females among the residents of Harriman, 5 year old males and 15 year old females are the most vulnerable to poverty, with 42 males (100.0%) and 1 females (100.0%) in their respective age groups living below the poverty level.
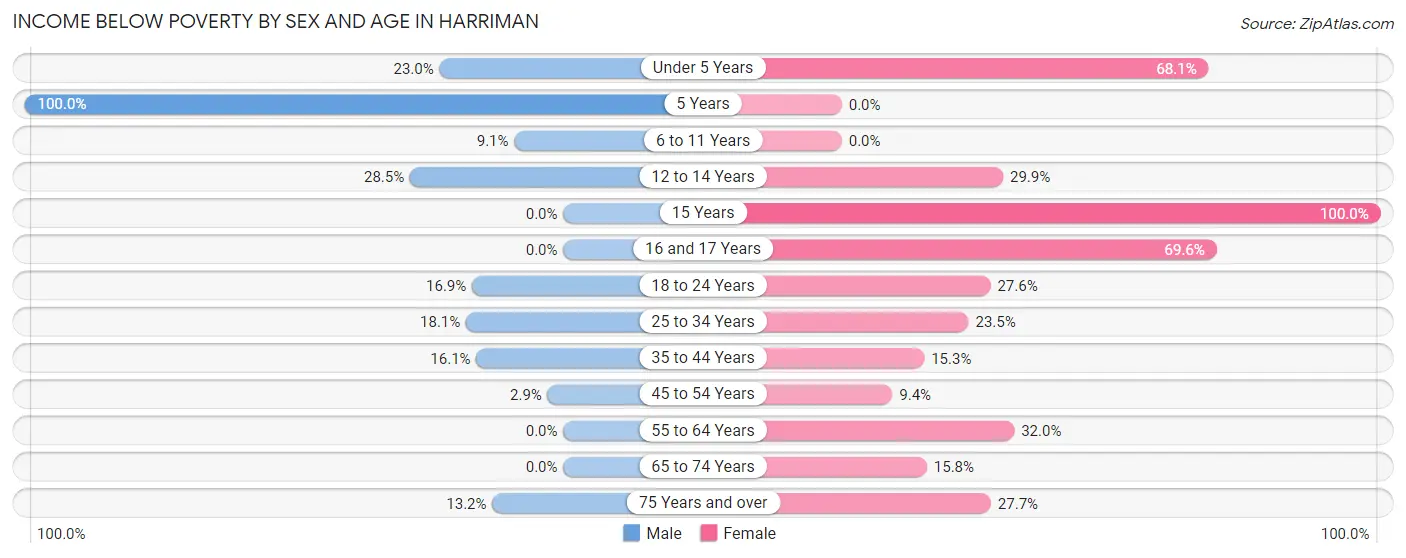
| Age Bracket | Male | Female |
| Under 5 Years | 37 (23.0%) | 49 (68.1%) |
| 5 Years | 42 (100.0%) | 0 (0.0%) |
| 6 to 11 Years | 18 (9.1%) | 0 (0.0%) |
| 12 to 14 Years | 33 (28.4%) | 41 (29.9%) |
| 15 Years | 0 (0.0%) | 1 (100.0%) |
| 16 and 17 Years | 0 (0.0%) | 32 (69.6%) |
| 18 to 24 Years | 62 (16.9%) | 69 (27.6%) |
| 25 to 34 Years | 50 (18.0%) | 92 (23.5%) |
| 35 to 44 Years | 72 (16.1%) | 58 (15.3%) |
| 45 to 54 Years | 17 (2.9%) | 41 (9.4%) |
| 55 to 64 Years | 0 (0.0%) | 186 (32.0%) |
| 65 to 74 Years | 0 (0.0%) | 21 (15.8%) |
| 75 Years and over | 17 (13.2%) | 75 (27.7%) |
| Total | 348 (11.3%) | 665 (24.2%) |
Income Above Poverty by Sex and Age in Harriman
According to the poverty statistics in Harriman, males aged 15 years and females aged 5 years are the age groups that are most secure financially, with 100.0% of males and 100.0% of females in these age groups living above the poverty line.
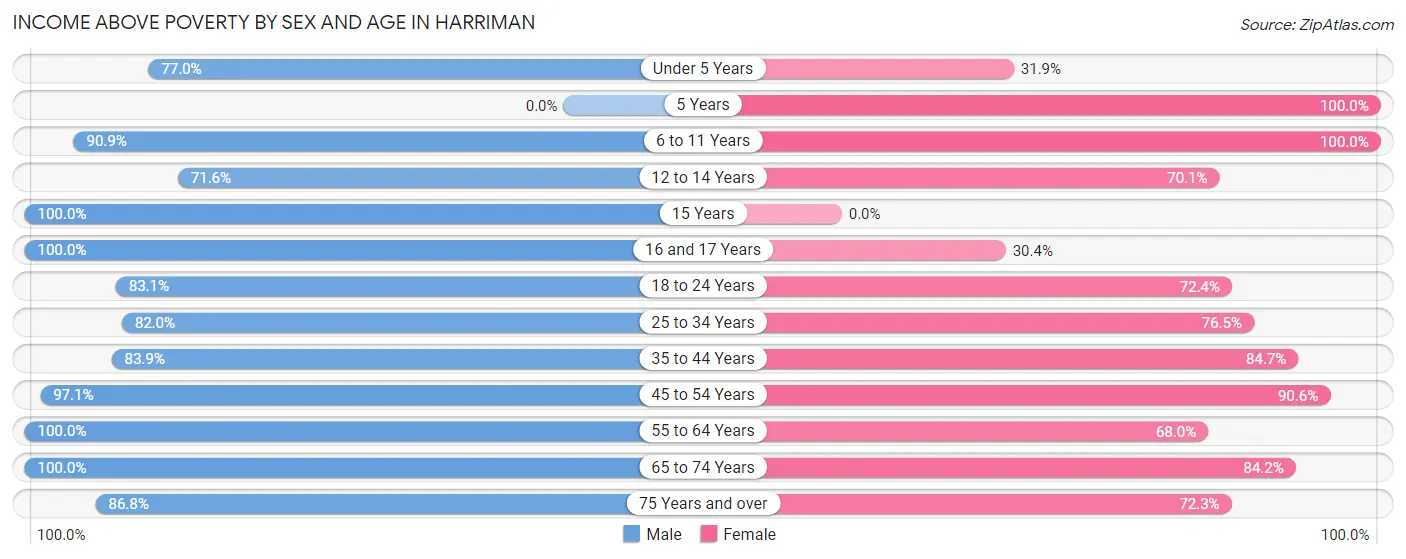
| Age Bracket | Male | Female |
| Under 5 Years | 124 (77.0%) | 23 (31.9%) |
| 5 Years | 0 (0.0%) | 11 (100.0%) |
| 6 to 11 Years | 180 (90.9%) | 33 (100.0%) |
| 12 to 14 Years | 83 (71.6%) | 96 (70.1%) |
| 15 Years | 12 (100.0%) | 0 (0.0%) |
| 16 and 17 Years | 116 (100.0%) | 14 (30.4%) |
| 18 to 24 Years | 304 (83.1%) | 181 (72.4%) |
| 25 to 34 Years | 227 (82.0%) | 299 (76.5%) |
| 35 to 44 Years | 374 (83.9%) | 321 (84.7%) |
| 45 to 54 Years | 568 (97.1%) | 396 (90.6%) |
| 55 to 64 Years | 347 (100.0%) | 395 (68.0%) |
| 65 to 74 Years | 282 (100.0%) | 112 (84.2%) |
| 75 Years and over | 112 (86.8%) | 196 (72.3%) |
| Total | 2,729 (88.7%) | 2,077 (75.7%) |
Income Below Poverty Among Married-Couple Families in Harriman
The poverty statistics for married-couple families in Harriman show that 4.3% or 40 of the total 940 families live below the poverty line. Families with 3 or 4 children have the highest poverty rate of 29.0%, comprising of 9 families. On the other hand, families with no children have the lowest poverty rate of 0.0%, which includes 0 families.
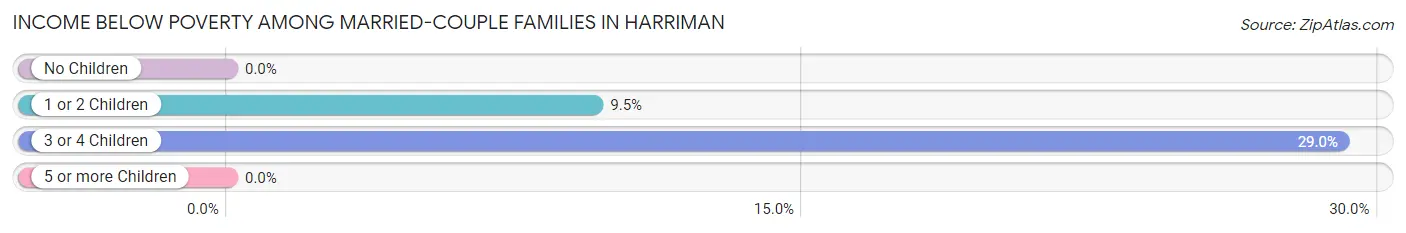
| Children | Above Poverty | Below Poverty |
| No Children | 584 (100.0%) | 0 (0.0%) |
| 1 or 2 Children | 294 (90.5%) | 31 (9.5%) |
| 3 or 4 Children | 22 (71.0%) | 9 (29.0%) |
| 5 or more Children | 0 (0.0%) | 0 (0.0%) |
| Total | 900 (95.7%) | 40 (4.3%) |
Income Below Poverty Among Single-Parent Households in Harriman
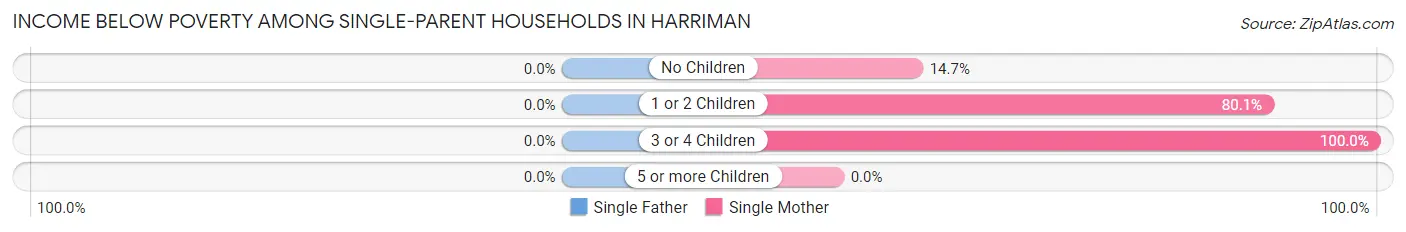
| Children | Single Father | Single Mother |
| No Children | 0 (0.0%) | 19 (14.7%) |
| 1 or 2 Children | 0 (0.0%) | 121 (80.1%) |
| 3 or 4 Children | 0 (0.0%) | 2 (100.0%) |
| 5 or more Children | 0 (0.0%) | 0 (0.0%) |
| Total | 0 (0.0%) | 142 (50.3%) |
Income Below Poverty Among Married-Couple vs Single-Parent Households in Harriman
The poverty data for Harriman shows that 40 of the married-couple family households (4.3%) and 142 of the single-parent households (24.2%) are living below the poverty level. Within the married-couple family households, those with 3 or 4 children have the highest poverty rate, with 9 households (29.0%) falling below the poverty line. Among the single-parent households, those with 3 or 4 children have the highest poverty rate, with 2 household (100.0%) living below poverty.
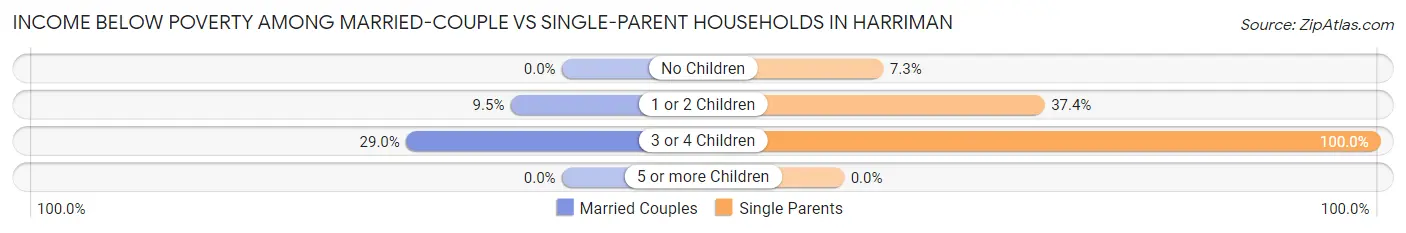
| Children | Married-Couple Families | Single-Parent Households |
| No Children | 0 (0.0%) | 19 (7.3%) |
| 1 or 2 Children | 31 (9.5%) | 121 (37.3%) |
| 3 or 4 Children | 9 (29.0%) | 2 (100.0%) |
| 5 or more Children | 0 (0.0%) | 0 (0.0%) |
| Total | 40 (4.3%) | 142 (24.2%) |
Race in Harriman
The most populous races in Harriman are White / Caucasian (5,203 | 86.7%), Black / African American (403 | 6.7%), and Two or more Races (371 | 6.2%).
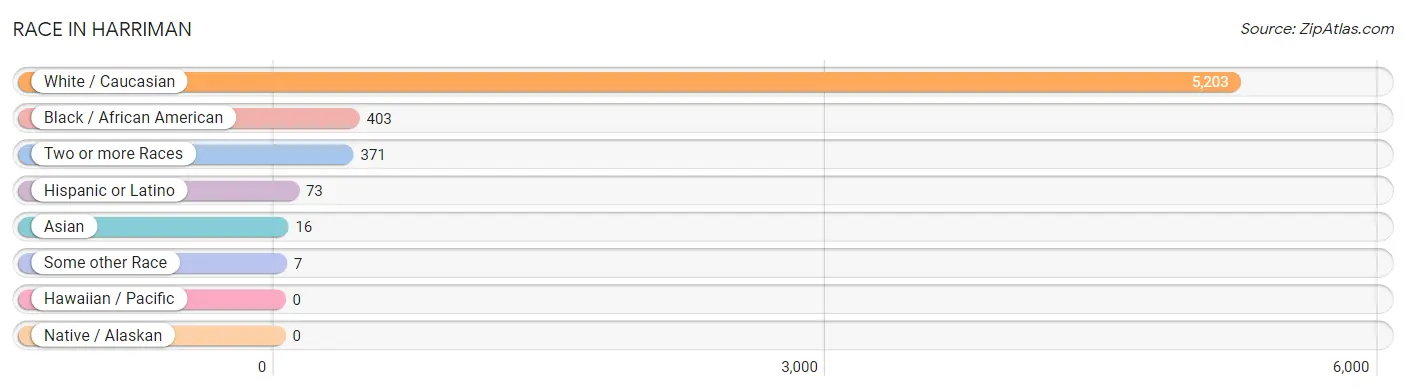
| Race | # Population | % Population |
| Asian | 16 | 0.3% |
| Black / African American | 403 | 6.7% |
| Hawaiian / Pacific | 0 | 0.0% |
| Hispanic or Latino | 73 | 1.2% |
| Native / Alaskan | 0 | 0.0% |
| White / Caucasian | 5,203 | 86.7% |
| Two or more Races | 371 | 6.2% |
| Some other Race | 7 | 0.1% |
| Total | 6,000 | 100.0% |
Ancestry in Harriman
The most populous ancestries reported in Harriman are English (621 | 10.3%), Irish (534 | 8.9%), German (502 | 8.4%), American (338 | 5.6%), and Scotch-Irish (260 | 4.3%), together accounting for 37.6% of all Harriman residents.
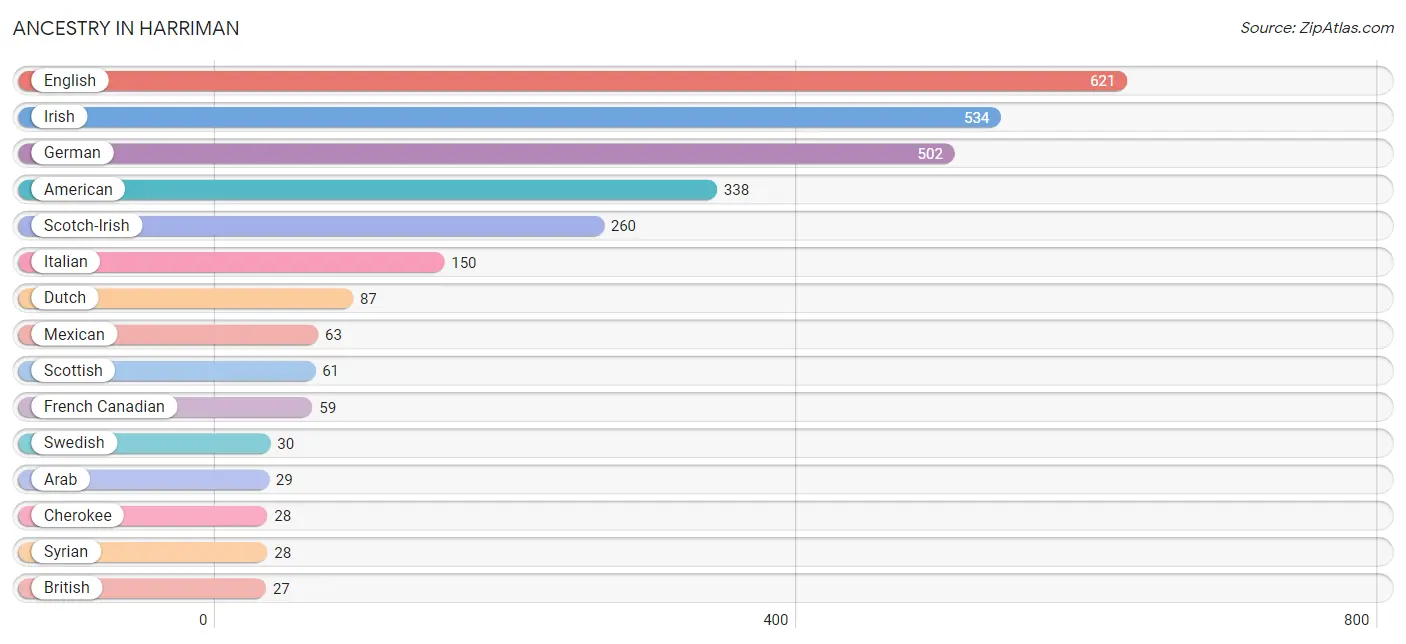
| Ancestry | # Population | % Population |
| American | 338 | 5.6% |
| Arab | 29 | 0.5% |
| Austrian | 26 | 0.4% |
| Bolivian | 7 | 0.1% |
| British | 27 | 0.4% |
| Cherokee | 28 | 0.5% |
| Dominican | 3 | 0.1% |
| Dutch | 87 | 1.5% |
| Eastern European | 20 | 0.3% |
| Egyptian | 1 | 0.0% |
| English | 621 | 10.3% |
| European | 24 | 0.4% |
| French Canadian | 59 | 1.0% |
| German | 502 | 8.4% |
| Irish | 534 | 8.9% |
| Italian | 150 | 2.5% |
| Korean | 16 | 0.3% |
| Mexican | 63 | 1.1% |
| Polish | 20 | 0.3% |
| Scotch-Irish | 260 | 4.3% |
| Scottish | 61 | 1.0% |
| South American | 7 | 0.1% |
| Swedish | 30 | 0.5% |
| Syrian | 28 | 0.5% | View All 24 Rows |
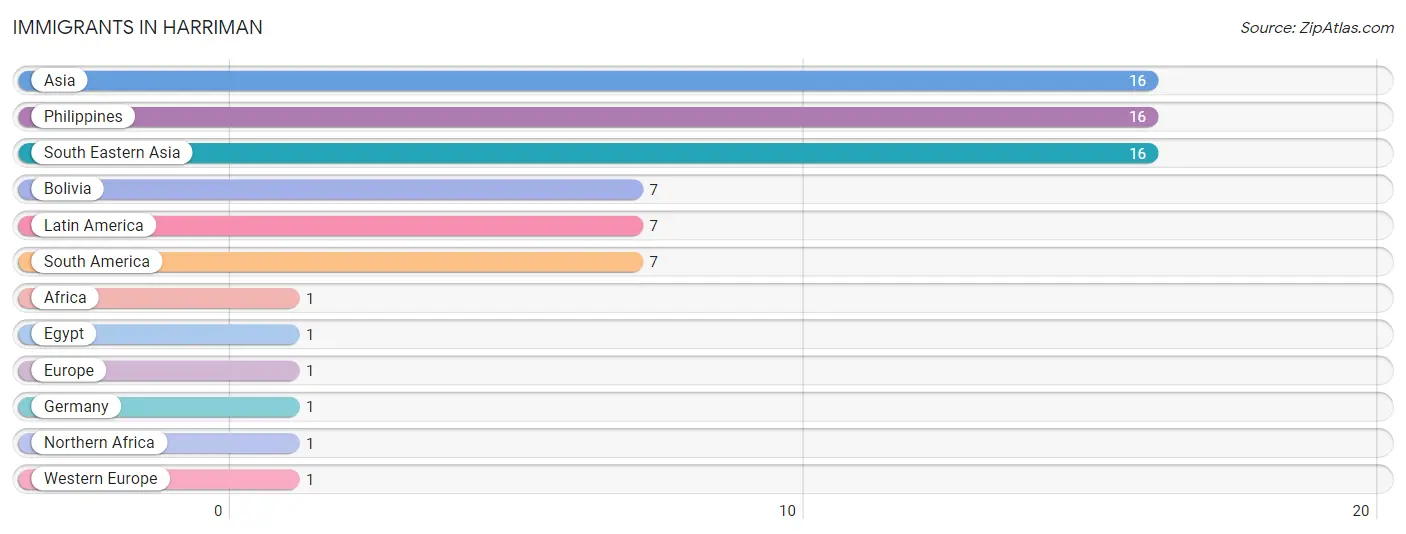
Immigrants in Harriman
The most numerous immigrant groups reported in Harriman came from Asia (16 | 0.3%), Philippines (16 | 0.3%), South Eastern Asia (16 | 0.3%), Bolivia (7 | 0.1%), and Latin America (7 | 0.1%), together accounting for 1.0% of all Harriman residents.
| Immigration Origin | # Population | % Population |
| Africa | 1 | 0.0% |
| Asia | 16 | 0.3% |
| Bolivia | 7 | 0.1% |
| Egypt | 1 | 0.0% |
| Europe | 1 | 0.0% |
| Germany | 1 | 0.0% |
| Latin America | 7 | 0.1% |
| Northern Africa | 1 | 0.0% |
| Philippines | 16 | 0.3% |
| South America | 7 | 0.1% |
| South Eastern Asia | 16 | 0.3% |
| Western Europe | 1 | 0.0% | View All 12 Rows |
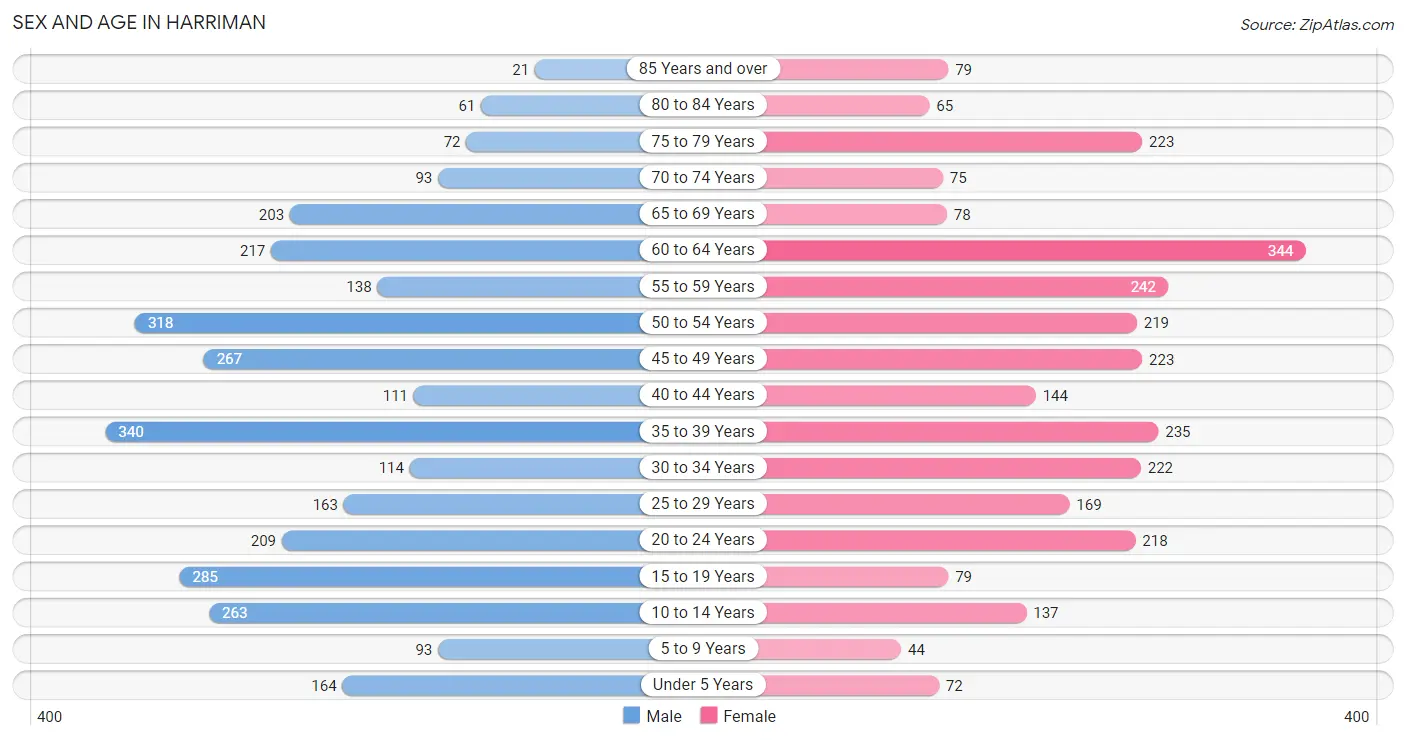
Sex and Age in Harriman
Sex and Age in Harriman
The most populous age groups in Harriman are 35 to 39 Years (340 | 10.9%) for men and 60 to 64 Years (344 | 12.0%) for women.
| Age Bracket | Male | Female |
| Under 5 Years | 164 (5.2%) | 72 (2.5%) |
| 5 to 9 Years | 93 (3.0%) | 44 (1.5%) |
| 10 to 14 Years | 263 (8.4%) | 137 (4.8%) |
| 15 to 19 Years | 285 (9.1%) | 79 (2.8%) |
| 20 to 24 Years | 209 (6.7%) | 218 (7.6%) |
| 25 to 29 Years | 163 (5.2%) | 169 (5.9%) |
| 30 to 34 Years | 114 (3.6%) | 222 (7.7%) |
| 35 to 39 Years | 340 (10.9%) | 235 (8.2%) |
| 40 to 44 Years | 111 (3.5%) | 144 (5.0%) |
| 45 to 49 Years | 267 (8.5%) | 223 (7.8%) |
| 50 to 54 Years | 318 (10.2%) | 219 (7.6%) |
| 55 to 59 Years | 138 (4.4%) | 242 (8.4%) |
| 60 to 64 Years | 217 (6.9%) | 344 (12.0%) |
| 65 to 69 Years | 203 (6.5%) | 78 (2.7%) |
| 70 to 74 Years | 93 (3.0%) | 75 (2.6%) |
| 75 to 79 Years | 72 (2.3%) | 223 (7.8%) |
| 80 to 84 Years | 61 (1.9%) | 65 (2.3%) |
| 85 Years and over | 21 (0.7%) | 79 (2.8%) |
| Total | 3,132 (100.0%) | 2,868 (100.0%) |
Families and Households in Harriman
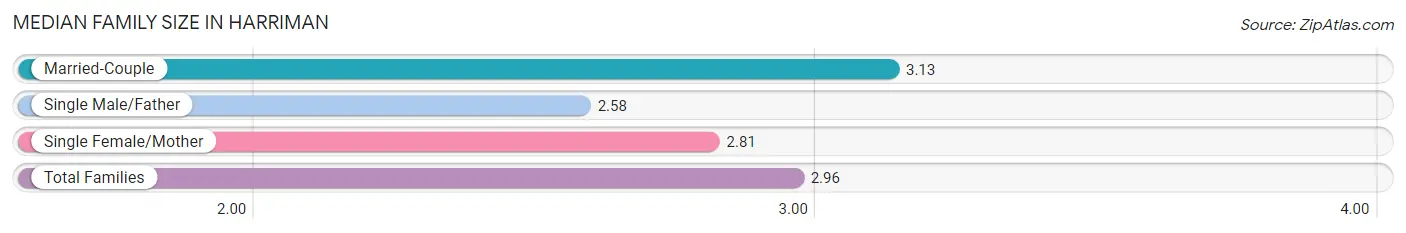
Median Family Size in Harriman
The median family size in Harriman is 2.96 persons per family, with married-couple families (940 | 61.6%) accounting for the largest median family size of 3.13 persons per family. On the other hand, single male/father families (304 | 19.9%) represent the smallest median family size with 2.58 persons per family.
| Family Type | # Families | Family Size |
| Married-Couple | 940 (61.6%) | 3.13 |
| Single Male/Father | 304 (19.9%) | 2.58 |
| Single Female/Mother | 282 (18.5%) | 2.81 |
| Total Families | 1,526 (100.0%) | 2.96 |
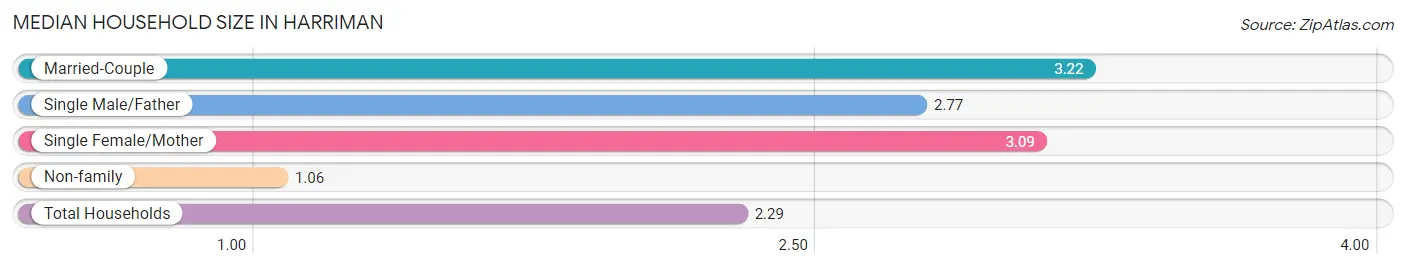
Median Household Size in Harriman
The median household size in Harriman is 2.29 persons per household, with married-couple households (940 | 37.0%) accounting for the largest median household size of 3.22 persons per household. non-family households (1,016 | 40.0%) represent the smallest median household size with 1.06 persons per household.
| Household Type | # Households | Household Size |
| Married-Couple | 940 (37.0%) | 3.22 |
| Single Male/Father | 304 (12.0%) | 2.77 |
| Single Female/Mother | 282 (11.1%) | 3.09 |
| Non-family | 1,016 (40.0%) | 1.06 |
| Total Households | 2,542 (100.0%) | 2.29 |
Household Size by Marriage Status in Harriman
Out of a total of 2,542 households in Harriman, 1,526 (60.0%) are family households, while 1,016 (40.0%) are nonfamily households. The most numerous type of family households are 2-person households, comprising 905, and the most common type of nonfamily households are 1-person households, comprising 962.
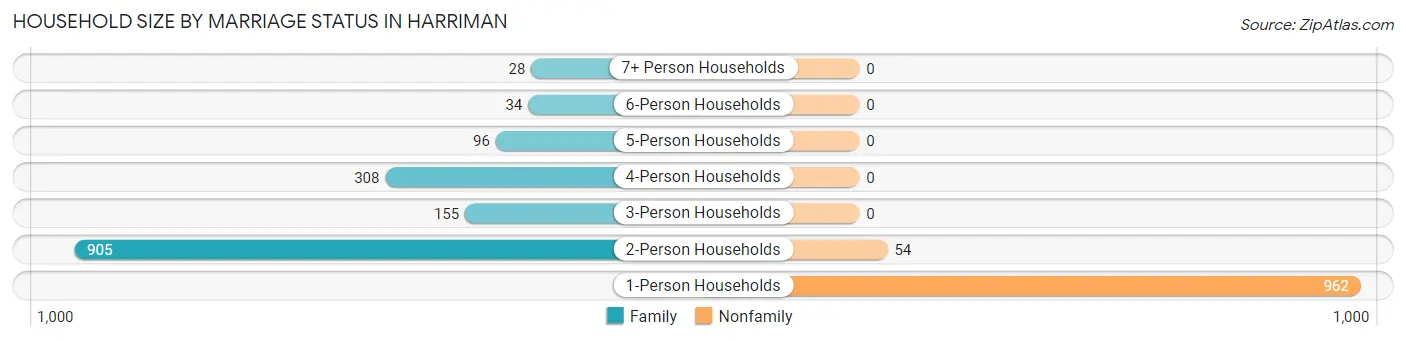
| Household Size | Family Households | Nonfamily Households |
| 1-Person Households | - | 962 (37.8%) |
| 2-Person Households | 905 (35.6%) | 54 (2.1%) |
| 3-Person Households | 155 (6.1%) | 0 (0.0%) |
| 4-Person Households | 308 (12.1%) | 0 (0.0%) |
| 5-Person Households | 96 (3.8%) | 0 (0.0%) |
| 6-Person Households | 34 (1.3%) | 0 (0.0%) |
| 7+ Person Households | 28 (1.1%) | 0 (0.0%) |
| Total | 1,526 (60.0%) | 1,016 (40.0%) |
Female Fertility in Harriman
Fertility by Age in Harriman
Average fertility rate in Harriman is 73.0 births per 1,000 women. Women in the age bracket of 20 to 34 years have the highest fertility rate with 103.0 births per 1,000 women. Women in the age bracket of 20 to 34 years acount for 64.3% of all women with births.
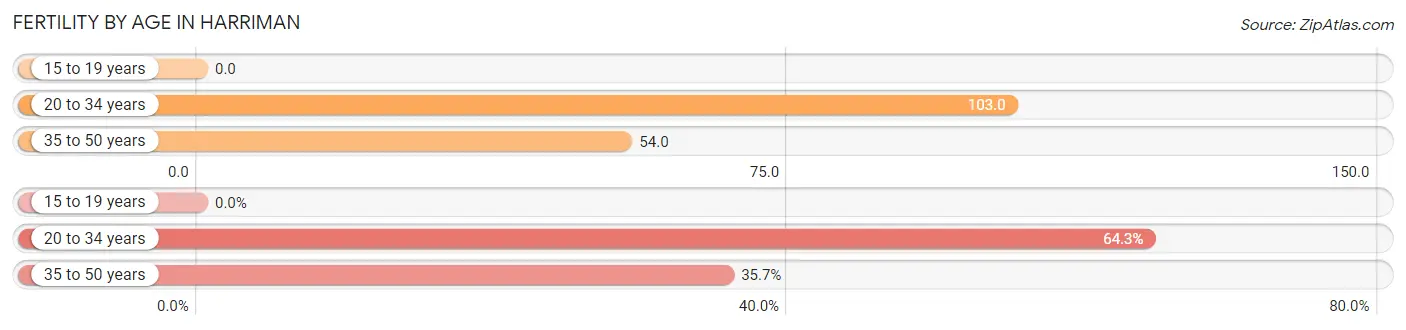
| Age Bracket | Women with Births | Births / 1,000 Women |
| 15 to 19 years | 0 (0.0%) | 0.0 |
| 20 to 34 years | 63 (64.3%) | 103.0 |
| 35 to 50 years | 35 (35.7%) | 54.0 |
| Total | 98 (100.0%) | 73.0 |
Fertility by Age by Marriage Status in Harriman
61.2% of women with births (98) in Harriman are married. The highest percentage of unmarried women with births falls into 35 to 50 years age bracket with 100.0% of them unmarried at the time of birth, while the lowest percentage of unmarried women with births belong to 20 to 34 years age bracket with 4.8% of them unmarried.
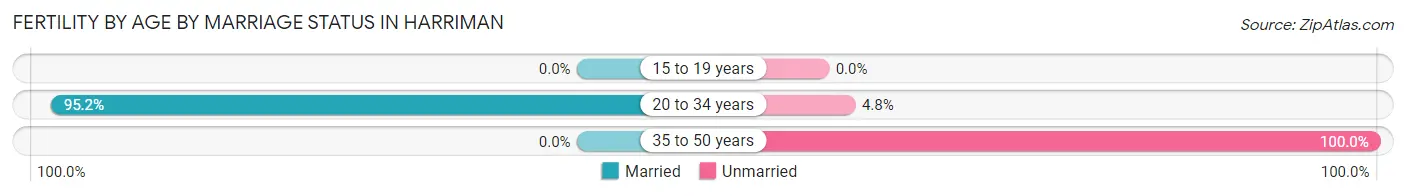
| Age Bracket | Married | Unmarried |
| 15 to 19 years | 0 (0.0%) | 0 (0.0%) |
| 20 to 34 years | 60 (95.2%) | 3 (4.8%) |
| 35 to 50 years | 0 (0.0%) | 35 (100.0%) |
| Total | 60 (61.2%) | 38 (38.8%) |
Fertility by Education in Harriman
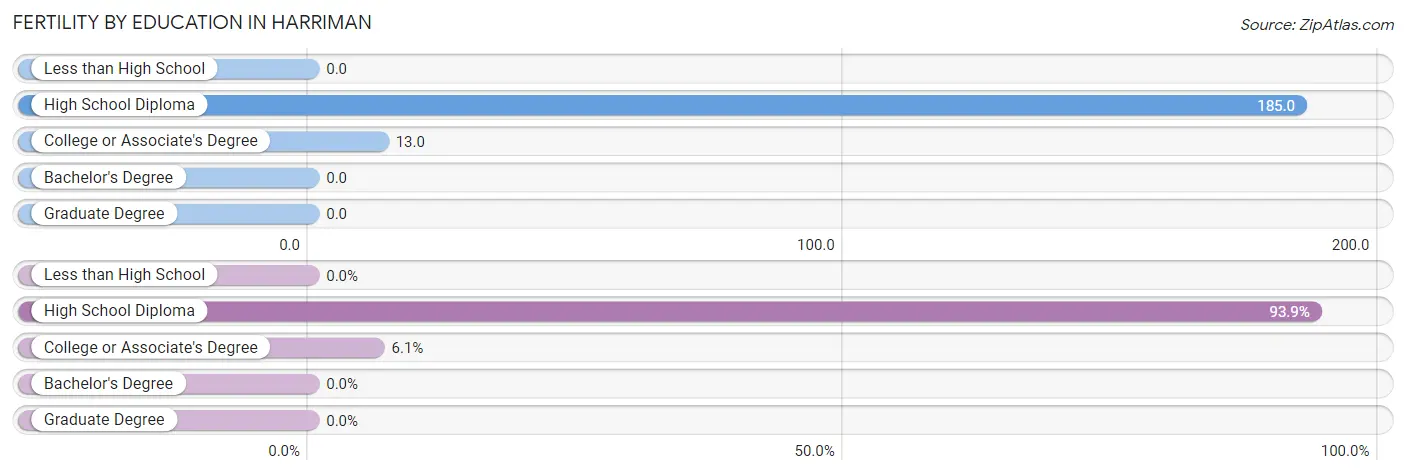
| Educational Attainment | Women with Births | Births / 1,000 Women |
| Less than High School | 0 (0.0%) | 0.0 |
| High School Diploma | 92 (93.9%) | 185.0 |
| College or Associate's Degree | 6 (6.1%) | 13.0 |
| Bachelor's Degree | 0 (0.0%) | 0.0 |
| Graduate Degree | 0 (0.0%) | 0.0 |
| Total | 98 (100.0%) | 73.0 |
Fertility by Education by Marriage Status in Harriman
38.8% of women with births in Harriman are unmarried. Women with the educational attainment of high school diploma are most likely to be married with 62.0% of them married at childbirth, while women with the educational attainment of college or associate's degree are least likely to be married with 50.0% of them unmarried at childbirth.
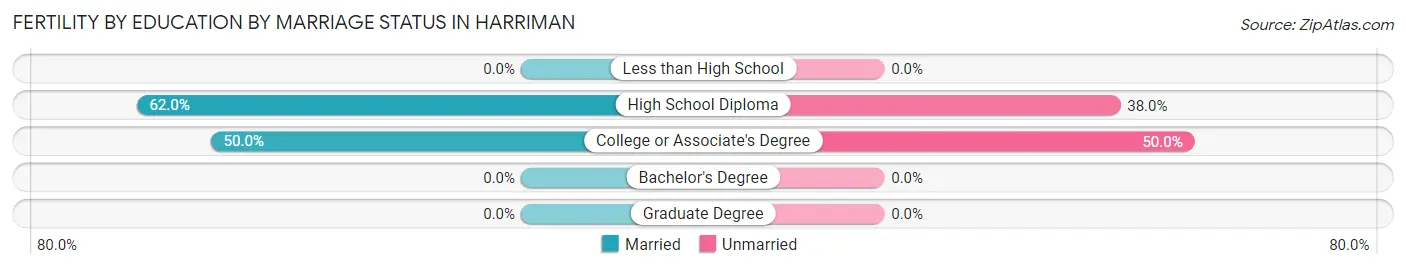
| Educational Attainment | Married | Unmarried |
| Less than High School | 0 (0.0%) | 0 (0.0%) |
| High School Diploma | 57 (62.0%) | 35 (38.0%) |
| College or Associate's Degree | 3 (50.0%) | 3 (50.0%) |
| Bachelor's Degree | 0 (0.0%) | 0 (0.0%) |
| Graduate Degree | 0 (0.0%) | 0 (0.0%) |
| Total | 60 (61.2%) | 38 (38.8%) |
Employment Characteristics in Harriman
Employment by Class of Employer in Harriman
Among the 2,634 employed individuals in Harriman, private company employees (1,572 | 59.7%), not-for-profit organizations (336 | 12.8%), and local government employees (289 | 11.0%) make up the most common classes of employment.
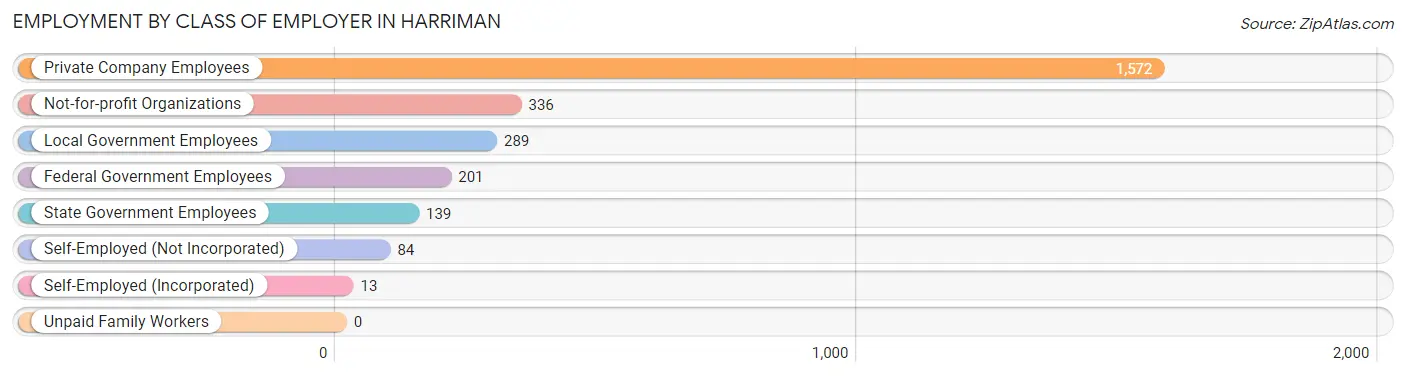
| Employer Class | # Employees | % Employees |
| Private Company Employees | 1,572 | 59.7% |
| Self-Employed (Incorporated) | 13 | 0.5% |
| Self-Employed (Not Incorporated) | 84 | 3.2% |
| Not-for-profit Organizations | 336 | 12.8% |
| Local Government Employees | 289 | 11.0% |
| State Government Employees | 139 | 5.3% |
| Federal Government Employees | 201 | 7.6% |
| Unpaid Family Workers | 0 | 0.0% |
| Total | 2,634 | 100.0% |
Employment Status by Age in Harriman
According to the labor force statistics for Harriman, out of the total population over 16 years of age (5,214), 52.5% or 2,737 individuals are in the labor force, with 3.4% or 93 of them unemployed. The age group with the highest labor force participation rate is 45 to 54 years, with 86.1% or 884 individuals in the labor force. Within the labor force, the 20 to 24 years age range has the highest percentage of unemployed individuals, with 21.2% or 66 of them being unemployed.
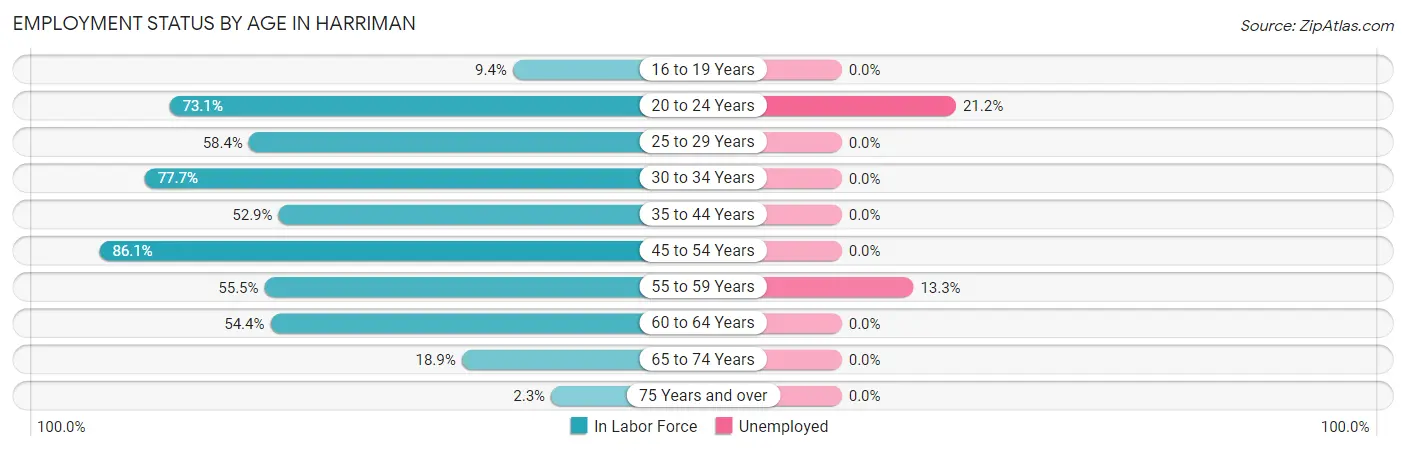
| Age Bracket | In Labor Force | Unemployed |
| 16 to 19 Years | 33 (9.4%) | 0 (0.0%) |
| 20 to 24 Years | 312 (73.1%) | 66 (21.2%) |
| 25 to 29 Years | 194 (58.4%) | 0 (0.0%) |
| 30 to 34 Years | 261 (77.7%) | 0 (0.0%) |
| 35 to 44 Years | 439 (52.9%) | 0 (0.0%) |
| 45 to 54 Years | 884 (86.1%) | 0 (0.0%) |
| 55 to 59 Years | 211 (55.5%) | 28 (13.3%) |
| 60 to 64 Years | 305 (54.4%) | 0 (0.0%) |
| 65 to 74 Years | 85 (18.9%) | 0 (0.0%) |
| 75 Years and over | 12 (2.3%) | 0 (0.0%) |
| Total | 2,737 (52.5%) | 93 (3.4%) |
Employment Status by Educational Attainment in Harriman
According to labor force statistics for Harriman, 66.2% of individuals (2,294) out of the total population between 25 and 64 years of age (3,466) are in the labor force, with 1.2% or 28 of them being unemployed. The group with the highest labor force participation rate are those with the educational attainment of bachelor's degree or higher, with 97.4% or 568 individuals in the labor force. Within the labor force, individuals with college / associate degree education have the highest percentage of unemployment, with 3.0% or 28 of them being unemployed.
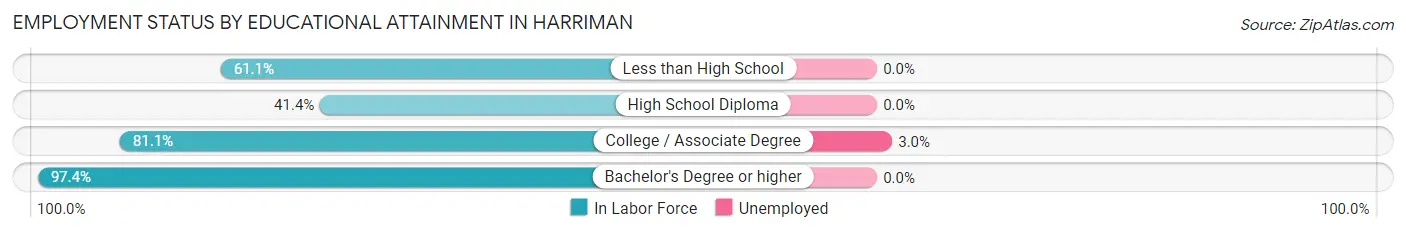
| Educational Attainment | In Labor Force | Unemployed |
| Less than High School | 232 (61.1%) | 0 (0.0%) |
| High School Diploma | 560 (41.4%) | 0 (0.0%) |
| College / Associate Degree | 933 (81.1%) | 35 (3.0%) |
| Bachelor's Degree or higher | 568 (97.4%) | 0 (0.0%) |
| Total | 2,294 (66.2%) | 42 (1.2%) |
Employment Occupations by Sex in Harriman
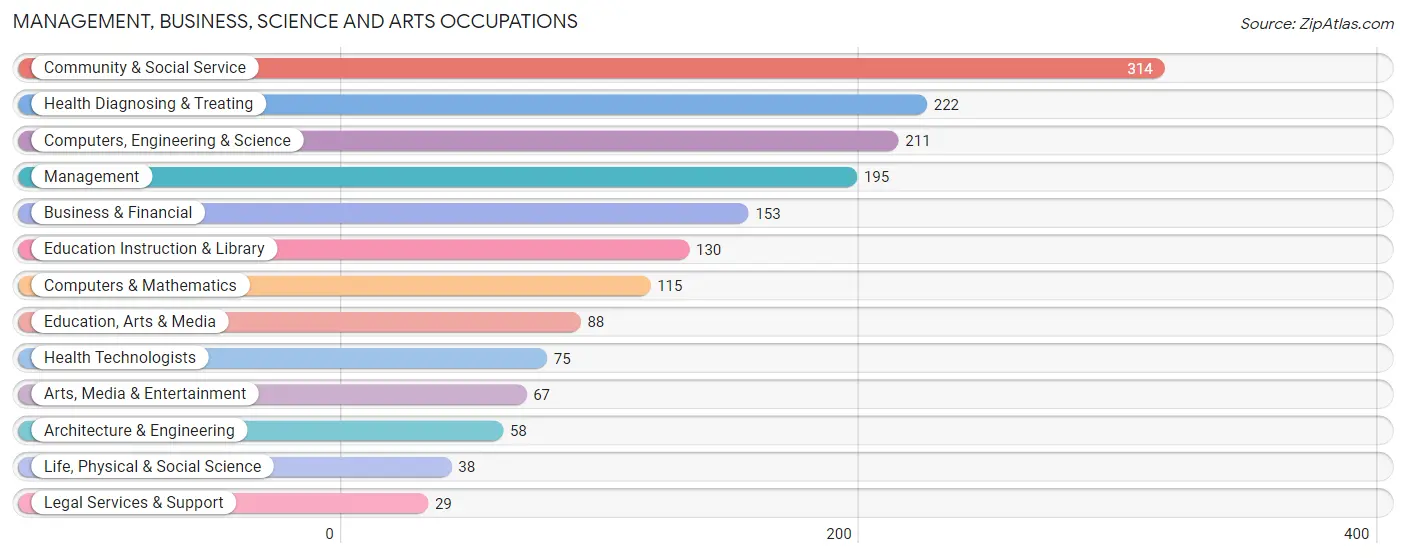
Management, Business, Science and Arts Occupations
The most common Management, Business, Science and Arts occupations in Harriman are Community & Social Service (314 | 11.9%), Health Diagnosing & Treating (222 | 8.4%), Computers, Engineering & Science (211 | 8.0%), Management (195 | 7.4%), and Business & Financial (153 | 5.8%).
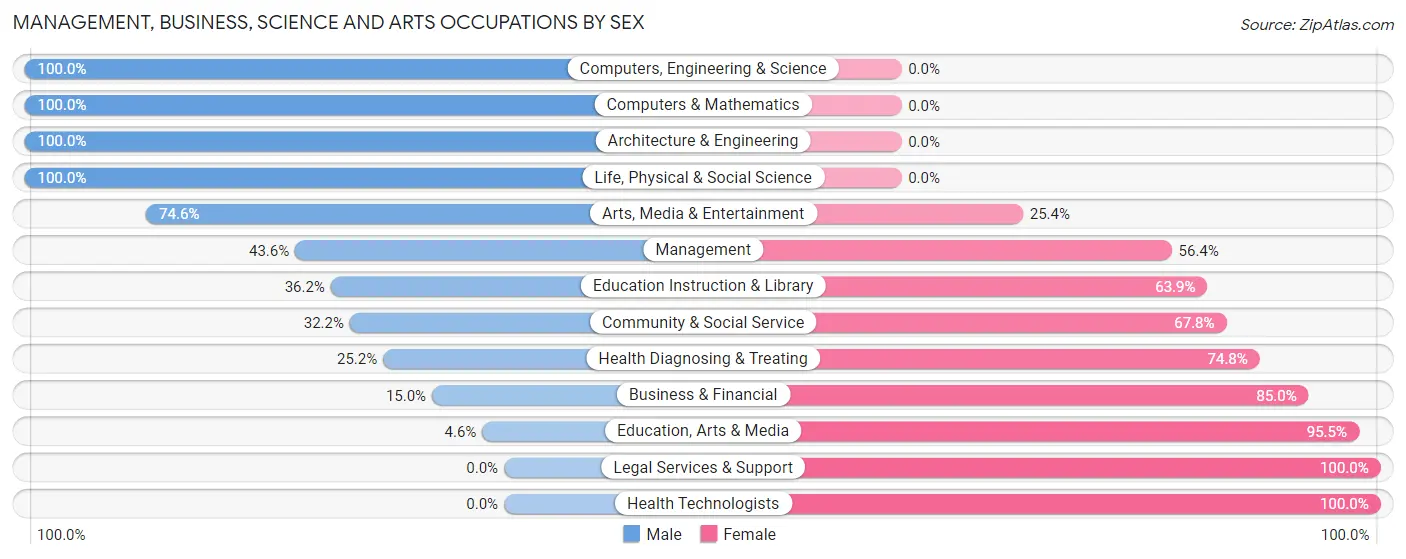
Management, Business, Science and Arts Occupations by Sex
Within the Management, Business, Science and Arts occupations in Harriman, the most male-oriented occupations are Computers, Engineering & Science (100.0%), Computers & Mathematics (100.0%), and Architecture & Engineering (100.0%), while the most female-oriented occupations are Legal Services & Support (100.0%), Health Technologists (100.0%), and Education, Arts & Media (95.5%).
| Occupation | Male | Female |
| Management | 85 (43.6%) | 110 (56.4%) |
| Business & Financial | 23 (15.0%) | 130 (85.0%) |
| Computers, Engineering & Science | 211 (100.0%) | 0 (0.0%) |
| Computers & Mathematics | 115 (100.0%) | 0 (0.0%) |
| Architecture & Engineering | 58 (100.0%) | 0 (0.0%) |
| Life, Physical & Social Science | 38 (100.0%) | 0 (0.0%) |
| Community & Social Service | 101 (32.2%) | 213 (67.8%) |
| Education, Arts & Media | 4 (4.5%) | 84 (95.5%) |
| Legal Services & Support | 0 (0.0%) | 29 (100.0%) |
| Education Instruction & Library | 47 (36.1%) | 83 (63.8%) |
| Arts, Media & Entertainment | 50 (74.6%) | 17 (25.4%) |
| Health Diagnosing & Treating | 56 (25.2%) | 166 (74.8%) |
| Health Technologists | 0 (0.0%) | 75 (100.0%) |
| Total (Category) | 476 (43.5%) | 619 (56.5%) |
| Total (Overall) | 1,458 (55.2%) | 1,184 (44.8%) |
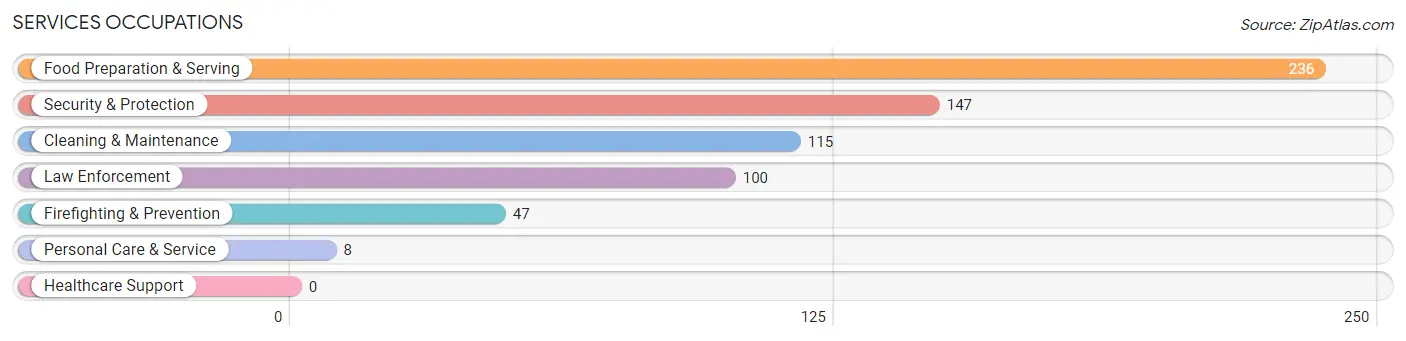
Services Occupations
The most common Services occupations in Harriman are Food Preparation & Serving (236 | 8.9%), Security & Protection (147 | 5.6%), Cleaning & Maintenance (115 | 4.3%), Law Enforcement (100 | 3.8%), and Firefighting & Prevention (47 | 1.8%).
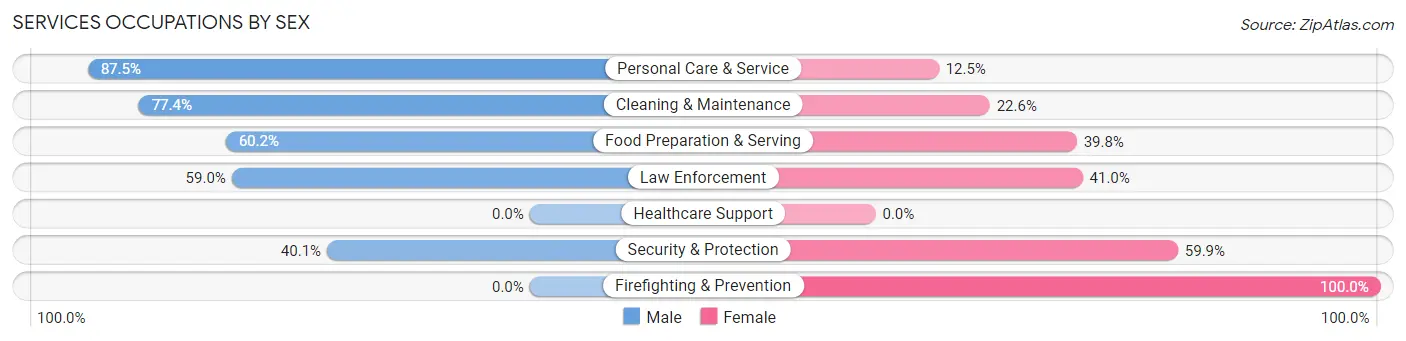
Services Occupations by Sex
Within the Services occupations in Harriman, the most male-oriented occupations are Personal Care & Service (87.5%), Cleaning & Maintenance (77.4%), and Food Preparation & Serving (60.2%), while the most female-oriented occupations are Firefighting & Prevention (100.0%), Security & Protection (59.9%), and Law Enforcement (41.0%).
| Occupation | Male | Female |
| Healthcare Support | 0 (0.0%) | 0 (0.0%) |
| Security & Protection | 59 (40.1%) | 88 (59.9%) |
| Firefighting & Prevention | 0 (0.0%) | 47 (100.0%) |
| Law Enforcement | 59 (59.0%) | 41 (41.0%) |
| Food Preparation & Serving | 142 (60.2%) | 94 (39.8%) |
| Cleaning & Maintenance | 89 (77.4%) | 26 (22.6%) |
| Personal Care & Service | 7 (87.5%) | 1 (12.5%) |
| Total (Category) | 297 (58.7%) | 209 (41.3%) |
| Total (Overall) | 1,458 (55.2%) | 1,184 (44.8%) |
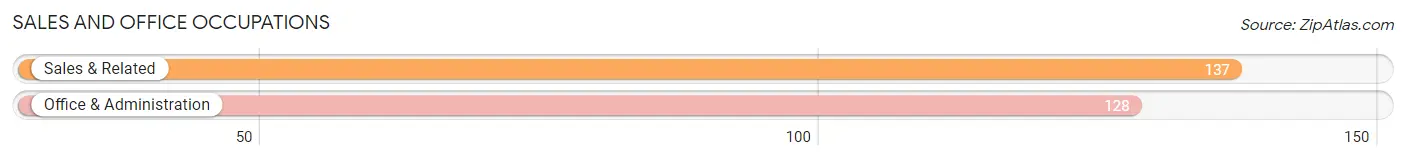
Sales and Office Occupations
The most common Sales and Office occupations in Harriman are Sales & Related (137 | 5.2%), and Office & Administration (128 | 4.8%).
Sales and Office Occupations by Sex
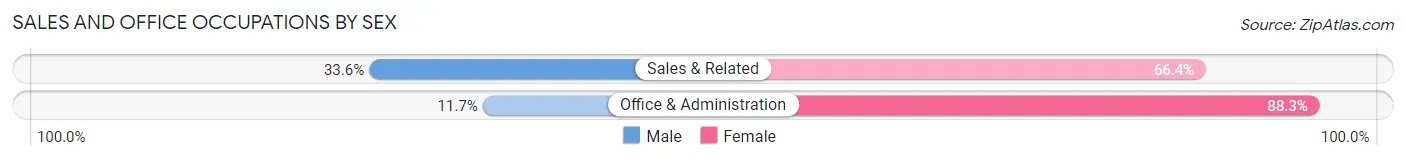
| Occupation | Male | Female |
| Sales & Related | 46 (33.6%) | 91 (66.4%) |
| Office & Administration | 15 (11.7%) | 113 (88.3%) |
| Total (Category) | 61 (23.0%) | 204 (77.0%) |
| Total (Overall) | 1,458 (55.2%) | 1,184 (44.8%) |
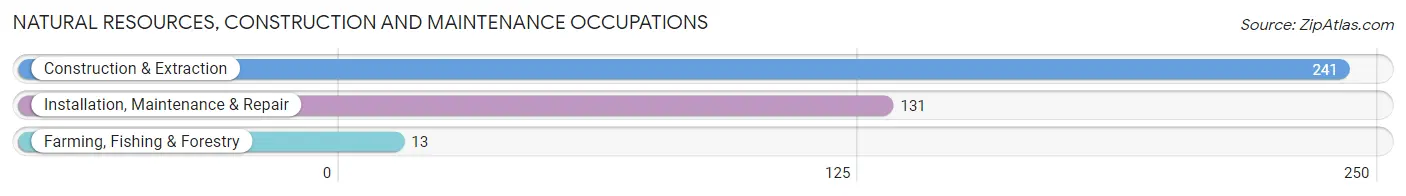
Natural Resources, Construction and Maintenance Occupations
The most common Natural Resources, Construction and Maintenance occupations in Harriman are Construction & Extraction (241 | 9.1%), Installation, Maintenance & Repair (131 | 5.0%), and Farming, Fishing & Forestry (13 | 0.5%).
Natural Resources, Construction and Maintenance Occupations by Sex
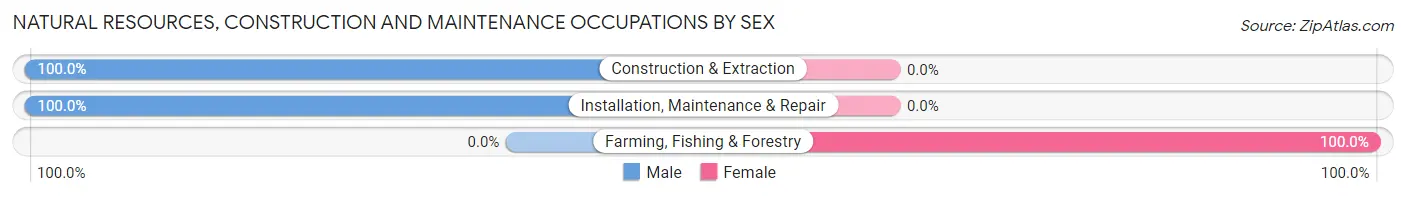
| Occupation | Male | Female |
| Farming, Fishing & Forestry | 0 (0.0%) | 13 (100.0%) |
| Construction & Extraction | 241 (100.0%) | 0 (0.0%) |
| Installation, Maintenance & Repair | 131 (100.0%) | 0 (0.0%) |
| Total (Category) | 372 (96.6%) | 13 (3.4%) |
| Total (Overall) | 1,458 (55.2%) | 1,184 (44.8%) |
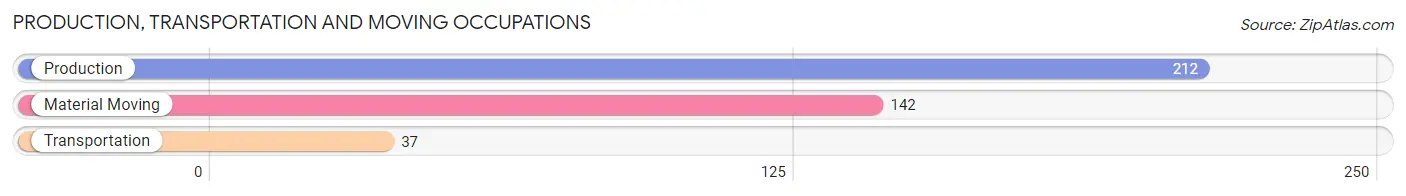
Production, Transportation and Moving Occupations
The most common Production, Transportation and Moving occupations in Harriman are Production (212 | 8.0%), Material Moving (142 | 5.4%), and Transportation (37 | 1.4%).
Production, Transportation and Moving Occupations by Sex
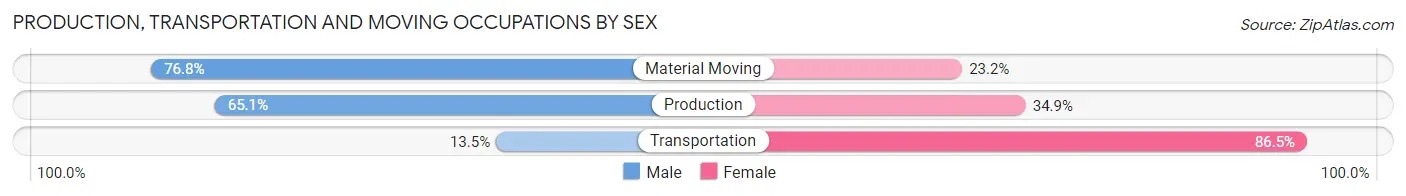
| Occupation | Male | Female |
| Production | 138 (65.1%) | 74 (34.9%) |
| Transportation | 5 (13.5%) | 32 (86.5%) |
| Material Moving | 109 (76.8%) | 33 (23.2%) |
| Total (Category) | 252 (64.4%) | 139 (35.5%) |
| Total (Overall) | 1,458 (55.2%) | 1,184 (44.8%) |
Employment Industries by Sex in Harriman
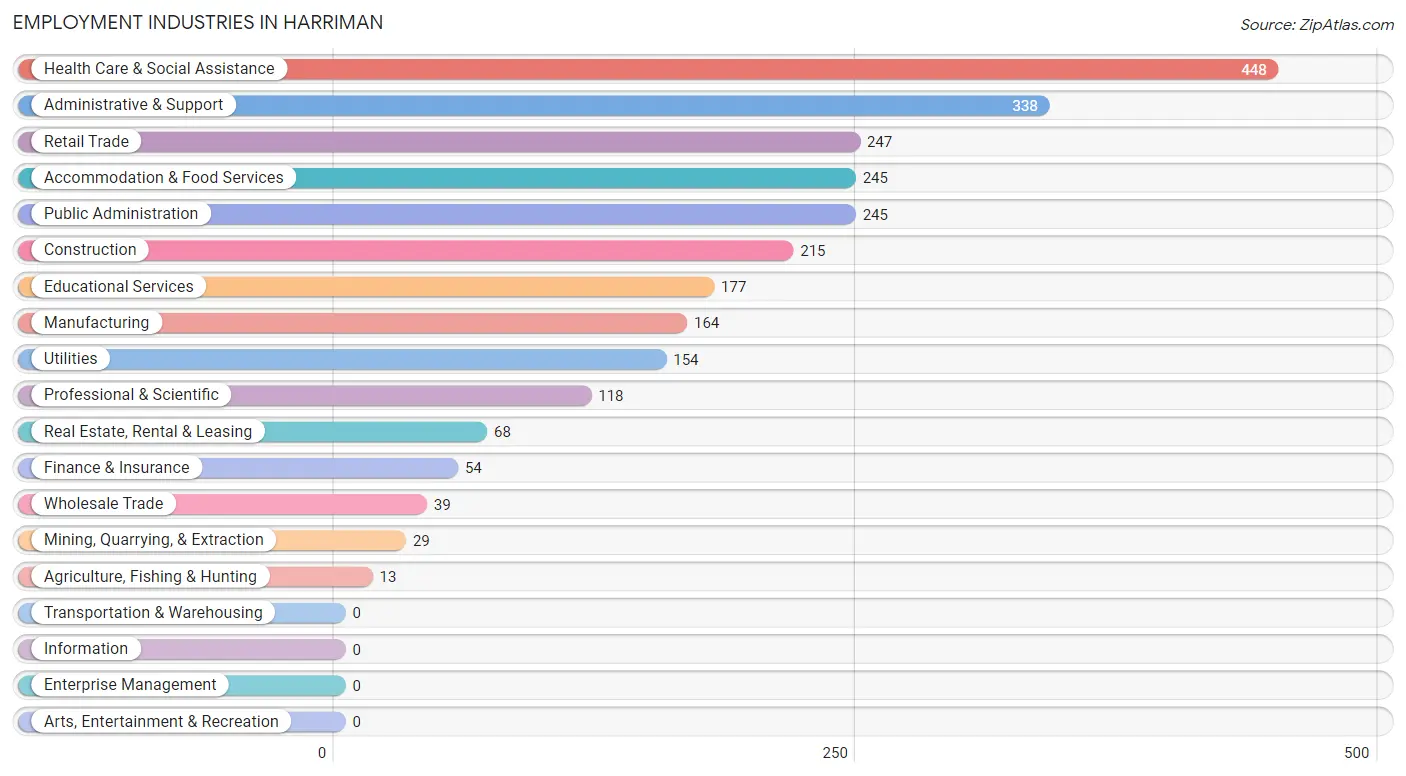
Employment Industries in Harriman
The major employment industries in Harriman include Health Care & Social Assistance (448 | 17.0%), Administrative & Support (338 | 12.8%), Retail Trade (247 | 9.3%), Accommodation & Food Services (245 | 9.3%), and Public Administration (245 | 9.3%).
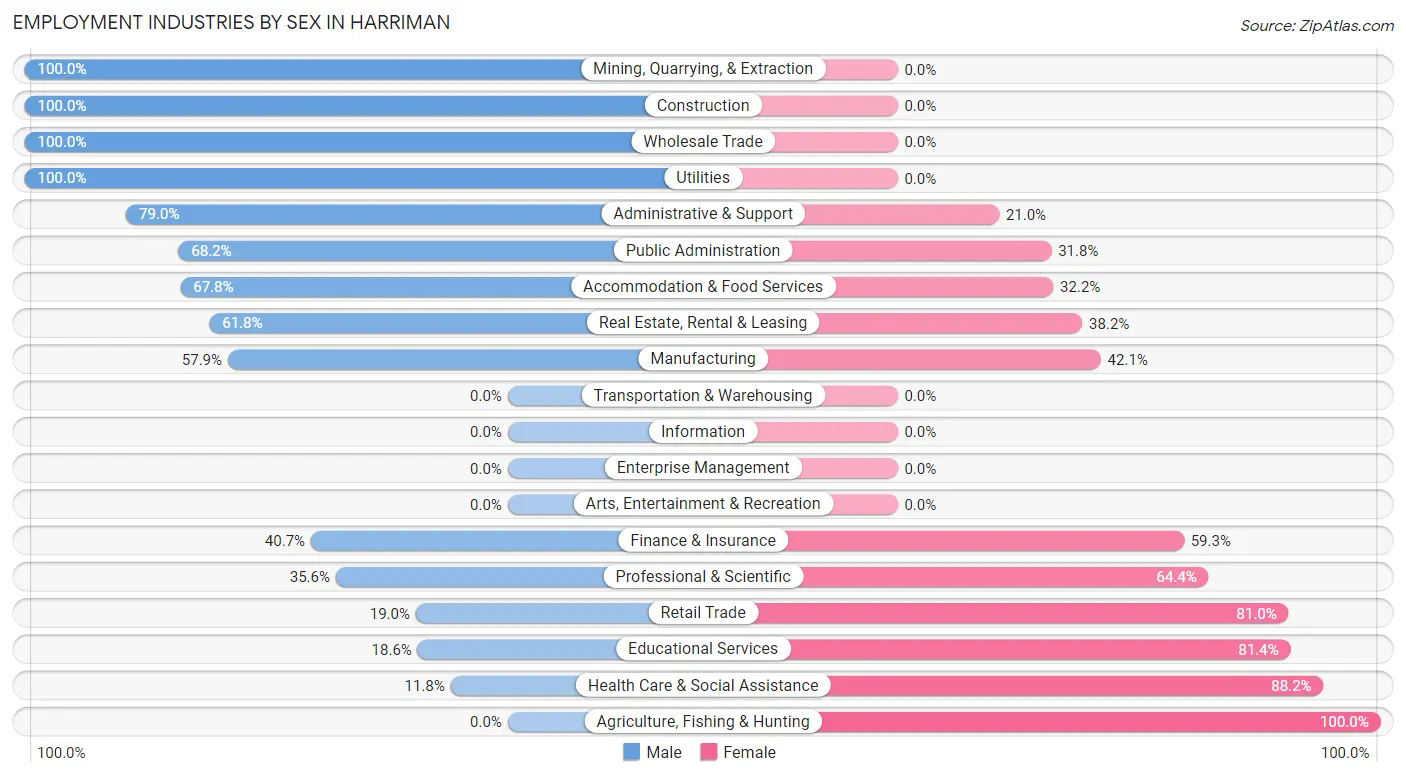
Employment Industries by Sex in Harriman
The Harriman industries that see more men than women are Mining, Quarrying, & Extraction (100.0%), Construction (100.0%), and Wholesale Trade (100.0%), whereas the industries that tend to have a higher number of women are Agriculture, Fishing & Hunting (100.0%), Health Care & Social Assistance (88.2%), and Educational Services (81.4%).
| Industry | Male | Female |
| Agriculture, Fishing & Hunting | 0 (0.0%) | 13 (100.0%) |
| Mining, Quarrying, & Extraction | 29 (100.0%) | 0 (0.0%) |
| Construction | 215 (100.0%) | 0 (0.0%) |
| Manufacturing | 95 (57.9%) | 69 (42.1%) |
| Wholesale Trade | 39 (100.0%) | 0 (0.0%) |
| Retail Trade | 47 (19.0%) | 200 (81.0%) |
| Transportation & Warehousing | 0 (0.0%) | 0 (0.0%) |
| Utilities | 154 (100.0%) | 0 (0.0%) |
| Information | 0 (0.0%) | 0 (0.0%) |
| Finance & Insurance | 22 (40.7%) | 32 (59.3%) |
| Real Estate, Rental & Leasing | 42 (61.8%) | 26 (38.2%) |
| Professional & Scientific | 42 (35.6%) | 76 (64.4%) |
| Enterprise Management | 0 (0.0%) | 0 (0.0%) |
| Administrative & Support | 267 (79.0%) | 71 (21.0%) |
| Educational Services | 33 (18.6%) | 144 (81.4%) |
| Health Care & Social Assistance | 53 (11.8%) | 395 (88.2%) |
| Arts, Entertainment & Recreation | 0 (0.0%) | 0 (0.0%) |
| Accommodation & Food Services | 166 (67.8%) | 79 (32.2%) |
| Public Administration | 167 (68.2%) | 78 (31.8%) |
| Total | 1,458 (55.2%) | 1,184 (44.8%) |
Education in Harriman
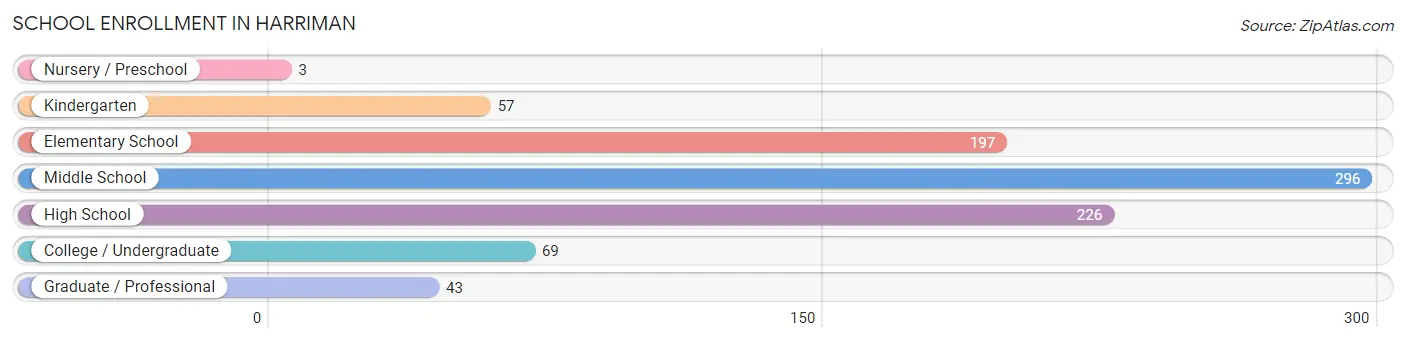
School Enrollment in Harriman
The most common levels of schooling among the 891 students in Harriman are middle school (296 | 33.2%), high school (226 | 25.4%), and elementary school (197 | 22.1%).
| School Level | # Students | % Students |
| Nursery / Preschool | 3 | 0.3% |
| Kindergarten | 57 | 6.4% |
| Elementary School | 197 | 22.1% |
| Middle School | 296 | 33.2% |
| High School | 226 | 25.4% |
| College / Undergraduate | 69 | 7.7% |
| Graduate / Professional | 43 | 4.8% |
| Total | 891 | 100.0% |
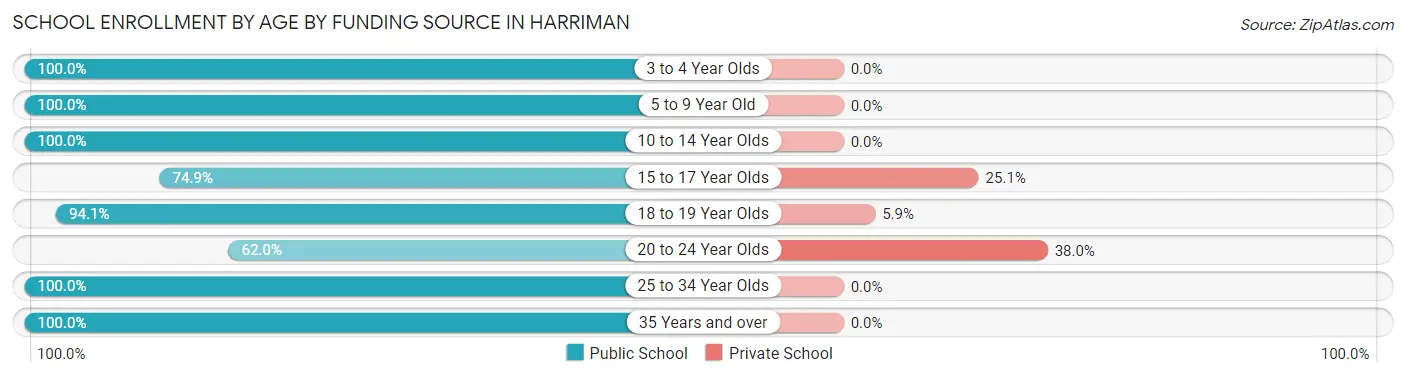
School Enrollment by Age by Funding Source in Harriman
Out of a total of 891 students who are enrolled in schools in Harriman, 67 (7.5%) attend a private institution, while the remaining 824 (92.5%) are enrolled in public schools. The age group of 20 to 24 year olds has the highest likelihood of being enrolled in private schools, with 19 (38.0% in the age bracket) enrolled. Conversely, the age group of 3 to 4 year olds has the lowest likelihood of being enrolled in a private school, with 4 (100.0% in the age bracket) attending a public institution.
| Age Bracket | Public School | Private School |
| 3 to 4 Year Olds | 4 (100.0%) | 0 (0.0%) |
| 5 to 9 Year Old | 137 (100.0%) | 0 (0.0%) |
| 10 to 14 Year Olds | 389 (100.0%) | 0 (0.0%) |
| 15 to 17 Year Olds | 131 (74.9%) | 44 (25.1%) |
| 18 to 19 Year Olds | 64 (94.1%) | 4 (5.9%) |
| 20 to 24 Year Olds | 31 (62.0%) | 19 (38.0%) |
| 25 to 34 Year Olds | 11 (100.0%) | 0 (0.0%) |
| 35 Years and over | 57 (100.0%) | 0 (0.0%) |
| Total | 824 (92.5%) | 67 (7.5%) |
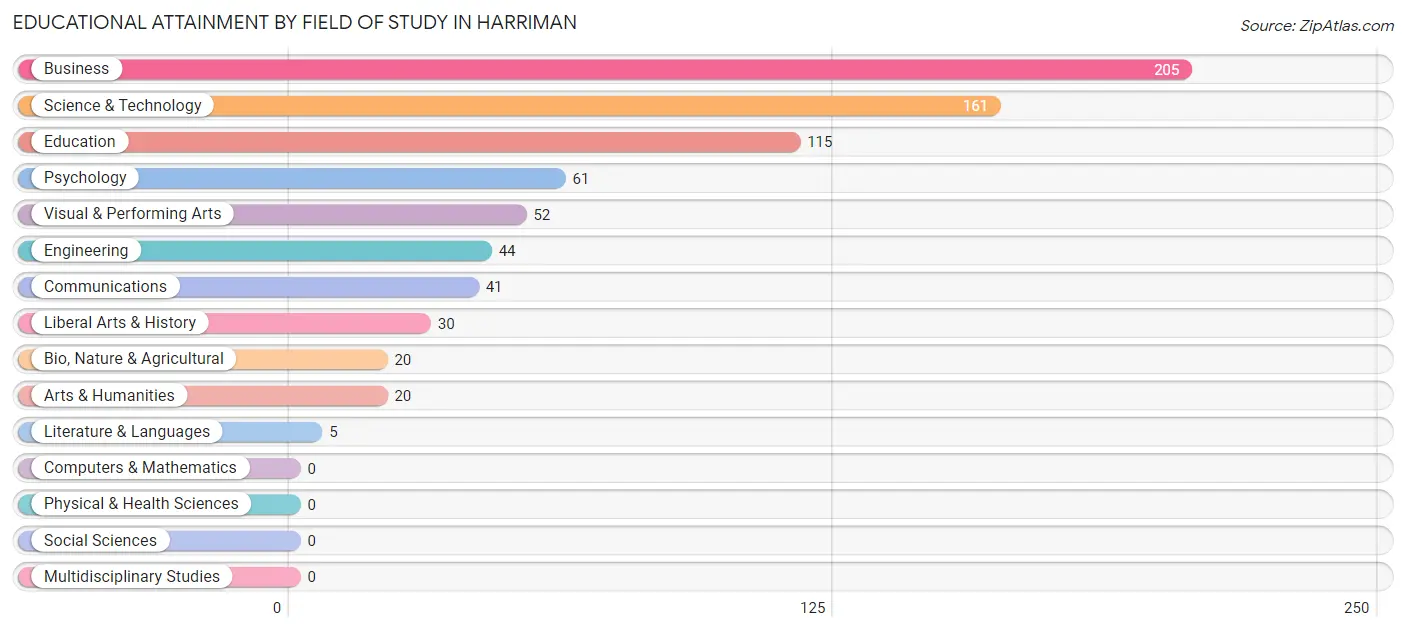
Educational Attainment by Field of Study in Harriman
Business (205 | 27.2%), science & technology (161 | 21.3%), education (115 | 15.2%), psychology (61 | 8.1%), and visual & performing arts (52 | 6.9%) are the most common fields of study among 754 individuals in Harriman who have obtained a bachelor's degree or higher.
| Field of Study | # Graduates | % Graduates |
| Computers & Mathematics | 0 | 0.0% |
| Bio, Nature & Agricultural | 20 | 2.6% |
| Physical & Health Sciences | 0 | 0.0% |
| Psychology | 61 | 8.1% |
| Social Sciences | 0 | 0.0% |
| Engineering | 44 | 5.8% |
| Multidisciplinary Studies | 0 | 0.0% |
| Science & Technology | 161 | 21.3% |
| Business | 205 | 27.2% |
| Education | 115 | 15.2% |
| Literature & Languages | 5 | 0.7% |
| Liberal Arts & History | 30 | 4.0% |
| Visual & Performing Arts | 52 | 6.9% |
| Communications | 41 | 5.4% |
| Arts & Humanities | 20 | 2.6% |
| Total | 754 | 100.0% |
Transportation & Commute in Harriman
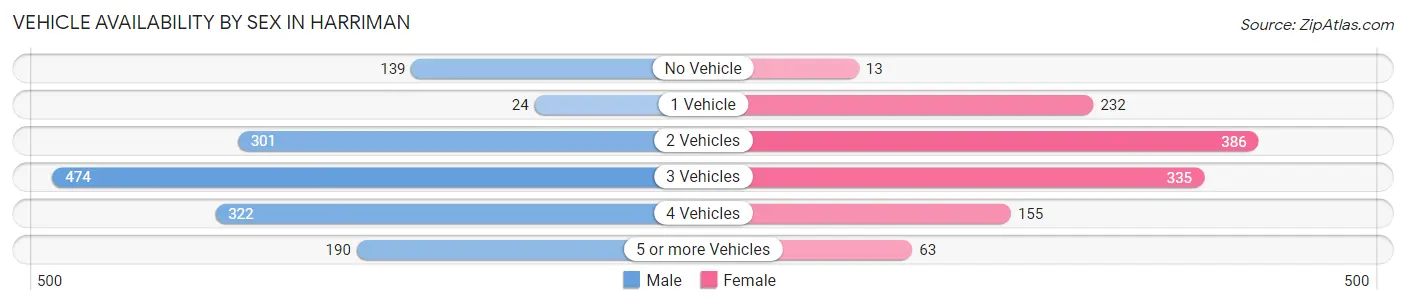
Vehicle Availability by Sex in Harriman
The most prevalent vehicle ownership categories in Harriman are males with 3 vehicles (474, accounting for 32.7%) and females with 3 vehicles (335, making up 40.0%).
| Vehicles Available | Male | Female |
| No Vehicle | 139 (9.6%) | 13 (1.1%) |
| 1 Vehicle | 24 (1.7%) | 232 (19.6%) |
| 2 Vehicles | 301 (20.8%) | 386 (32.6%) |
| 3 Vehicles | 474 (32.7%) | 335 (28.3%) |
| 4 Vehicles | 322 (22.2%) | 155 (13.1%) |
| 5 or more Vehicles | 190 (13.1%) | 63 (5.3%) |
| Total | 1,450 (100.0%) | 1,184 (100.0%) |
Commute Time in Harriman
The most frequently occuring commute durations in Harriman are 10 to 14 minutes (401 commuters, 15.8%), 45 to 59 minutes (364 commuters, 14.4%), and 35 to 39 minutes (299 commuters, 11.8%).
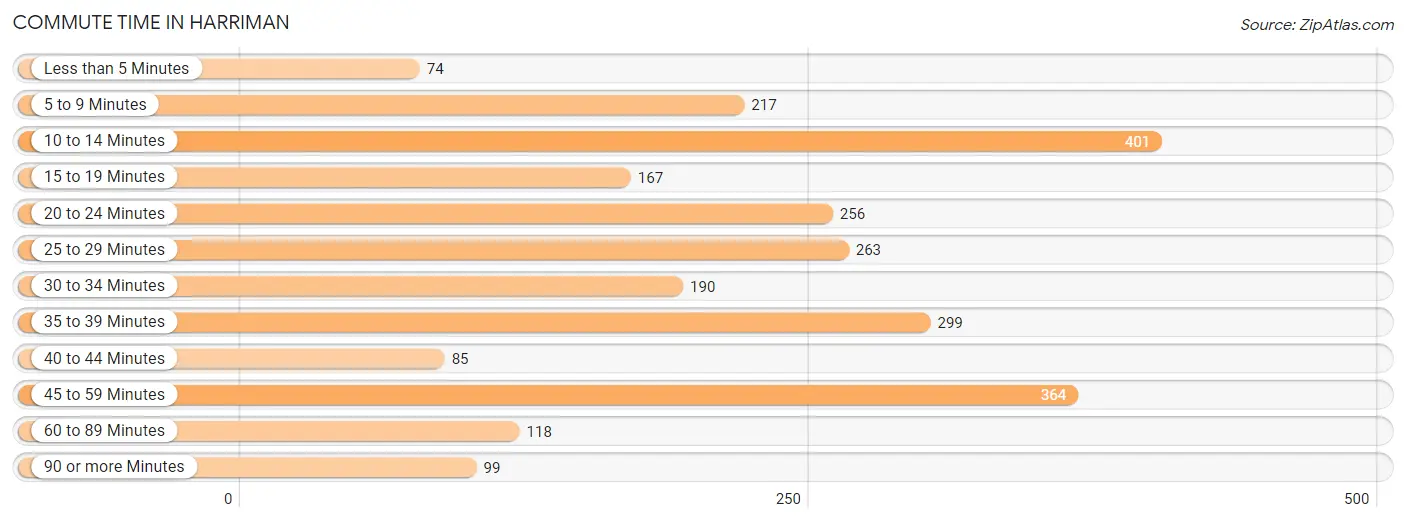
| Commute Time | # Commuters | % Commuters |
| Less than 5 Minutes | 74 | 2.9% |
| 5 to 9 Minutes | 217 | 8.6% |
| 10 to 14 Minutes | 401 | 15.8% |
| 15 to 19 Minutes | 167 | 6.6% |
| 20 to 24 Minutes | 256 | 10.1% |
| 25 to 29 Minutes | 263 | 10.4% |
| 30 to 34 Minutes | 190 | 7.5% |
| 35 to 39 Minutes | 299 | 11.8% |
| 40 to 44 Minutes | 85 | 3.4% |
| 45 to 59 Minutes | 364 | 14.4% |
| 60 to 89 Minutes | 118 | 4.7% |
| 90 or more Minutes | 99 | 3.9% |
Commute Time by Sex in Harriman
The most common commute times in Harriman are 10 to 14 minutes (235 commuters, 17.3%) for males and 45 to 59 minutes (211 commuters, 18.0%) for females.
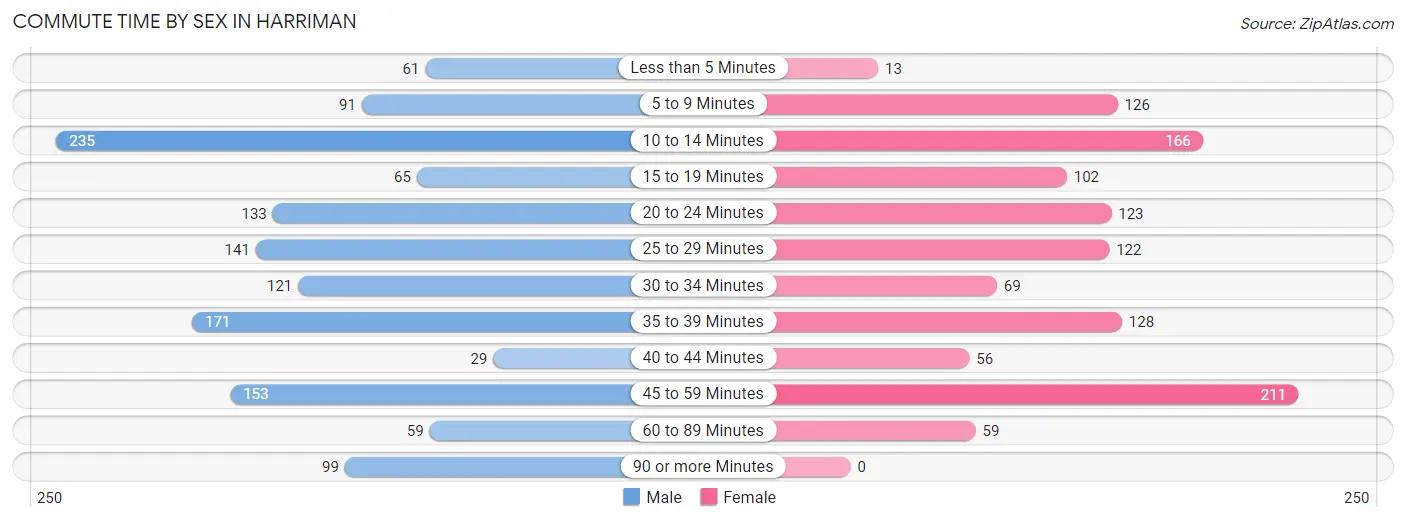
| Commute Time | Male | Female |
| Less than 5 Minutes | 61 (4.5%) | 13 (1.1%) |
| 5 to 9 Minutes | 91 (6.7%) | 126 (10.7%) |
| 10 to 14 Minutes | 235 (17.3%) | 166 (14.1%) |
| 15 to 19 Minutes | 65 (4.8%) | 102 (8.7%) |
| 20 to 24 Minutes | 133 (9.8%) | 123 (10.5%) |
| 25 to 29 Minutes | 141 (10.4%) | 122 (10.4%) |
| 30 to 34 Minutes | 121 (8.9%) | 69 (5.9%) |
| 35 to 39 Minutes | 171 (12.6%) | 128 (10.9%) |
| 40 to 44 Minutes | 29 (2.1%) | 56 (4.8%) |
| 45 to 59 Minutes | 153 (11.3%) | 211 (18.0%) |
| 60 to 89 Minutes | 59 (4.3%) | 59 (5.0%) |
| 90 or more Minutes | 99 (7.3%) | 0 (0.0%) |
Time of Departure to Work by Sex in Harriman
The most frequent times of departure to work in Harriman are 12:00 PM to 3:59 PM (185, 13.6%) for males and 7:00 AM to 7:29 AM (276, 23.5%) for females.
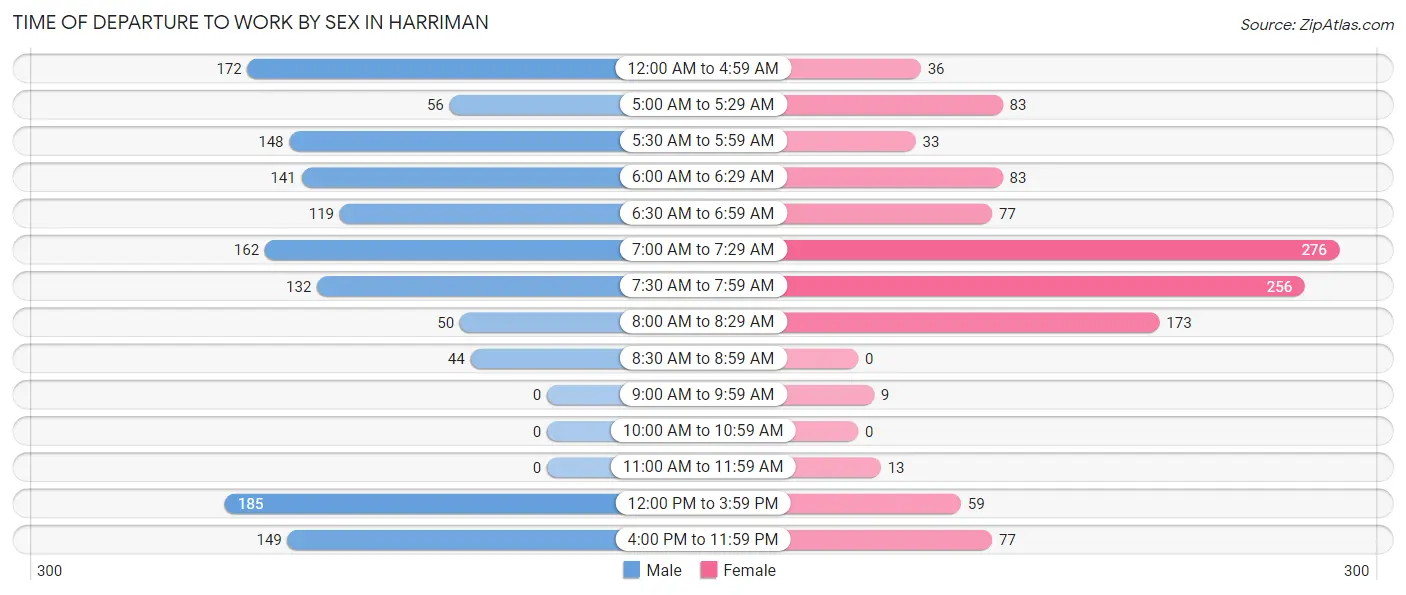
| Time of Departure | Male | Female |
| 12:00 AM to 4:59 AM | 172 (12.7%) | 36 (3.1%) |
| 5:00 AM to 5:29 AM | 56 (4.1%) | 83 (7.1%) |
| 5:30 AM to 5:59 AM | 148 (10.9%) | 33 (2.8%) |
| 6:00 AM to 6:29 AM | 141 (10.4%) | 83 (7.1%) |
| 6:30 AM to 6:59 AM | 119 (8.8%) | 77 (6.6%) |
| 7:00 AM to 7:29 AM | 162 (11.9%) | 276 (23.5%) |
| 7:30 AM to 7:59 AM | 132 (9.7%) | 256 (21.8%) |
| 8:00 AM to 8:29 AM | 50 (3.7%) | 173 (14.7%) |
| 8:30 AM to 8:59 AM | 44 (3.2%) | 0 (0.0%) |
| 9:00 AM to 9:59 AM | 0 (0.0%) | 9 (0.8%) |
| 10:00 AM to 10:59 AM | 0 (0.0%) | 0 (0.0%) |
| 11:00 AM to 11:59 AM | 0 (0.0%) | 13 (1.1%) |
| 12:00 PM to 3:59 PM | 185 (13.6%) | 59 (5.0%) |
| 4:00 PM to 11:59 PM | 149 (11.0%) | 77 (6.6%) |
| Total | 1,358 (100.0%) | 1,175 (100.0%) |
Housing Occupancy in Harriman
Occupancy by Ownership in Harriman
Of the total 2,542 dwellings in Harriman, owner-occupied units account for 1,635 (64.3%), while renter-occupied units make up 907 (35.7%).
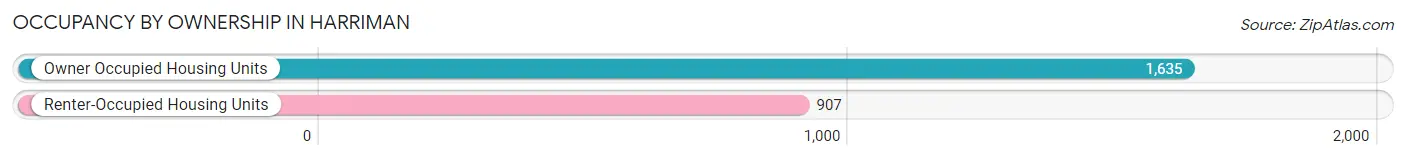
| Occupancy | # Housing Units | % Housing Units |
| Owner Occupied Housing Units | 1,635 | 64.3% |
| Renter-Occupied Housing Units | 907 | 35.7% |
| Total Occupied Housing Units | 2,542 | 100.0% |
Occupancy by Household Size in Harriman
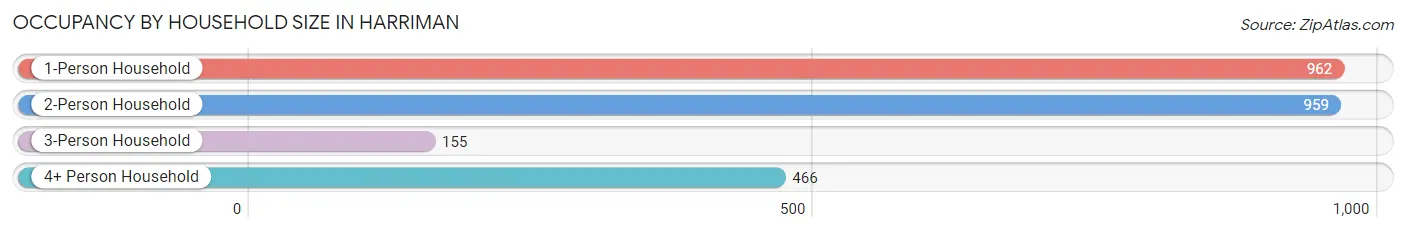
| Household Size | # Housing Units | % Housing Units |
| 1-Person Household | 962 | 37.8% |
| 2-Person Household | 959 | 37.7% |
| 3-Person Household | 155 | 6.1% |
| 4+ Person Household | 466 | 18.3% |
| Total Housing Units | 2,542 | 100.0% |
Occupancy by Ownership by Household Size in Harriman
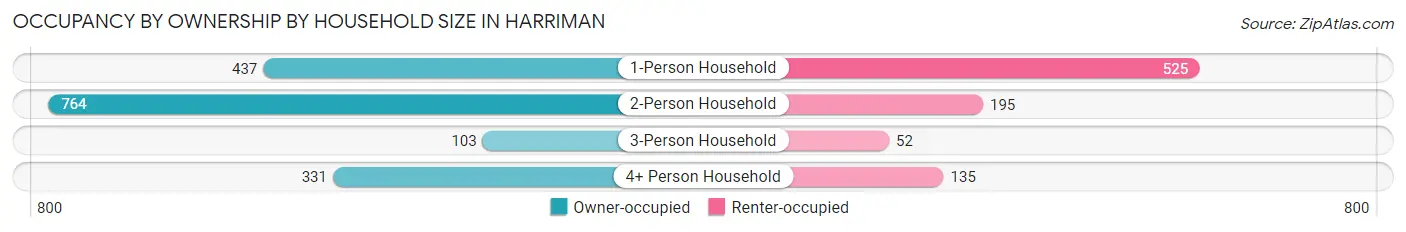
| Household Size | Owner-occupied | Renter-occupied |
| 1-Person Household | 437 (45.4%) | 525 (54.6%) |
| 2-Person Household | 764 (79.7%) | 195 (20.3%) |
| 3-Person Household | 103 (66.4%) | 52 (33.6%) |
| 4+ Person Household | 331 (71.0%) | 135 (29.0%) |
| Total Housing Units | 1,635 (64.3%) | 907 (35.7%) |
Occupancy by Educational Attainment in Harriman
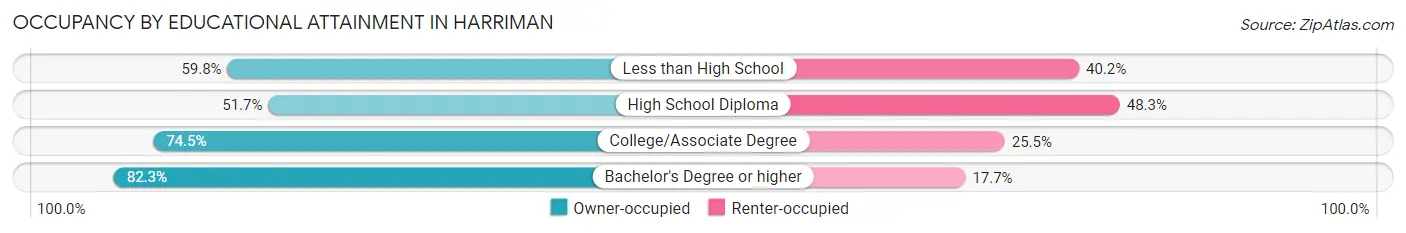
| Household Size | Owner-occupied | Renter-occupied |
| Less than High School | 278 (59.8%) | 187 (40.2%) |
| High School Diploma | 505 (51.7%) | 472 (48.3%) |
| College/Associate Degree | 508 (74.5%) | 174 (25.5%) |
| Bachelor's Degree or higher | 344 (82.3%) | 74 (17.7%) |
Occupancy by Age of Householder in Harriman
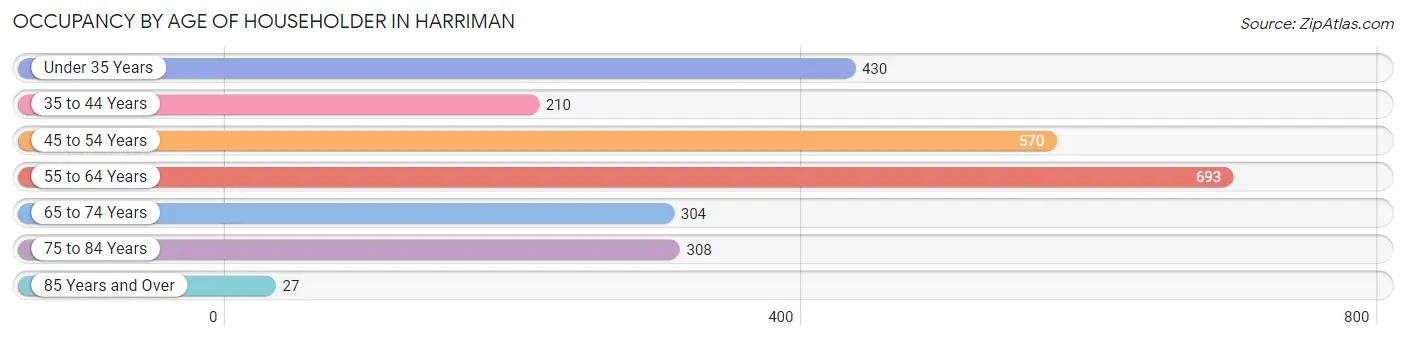
| Age Bracket | # Households | % Households |
| Under 35 Years | 430 | 16.9% |
| 35 to 44 Years | 210 | 8.3% |
| 45 to 54 Years | 570 | 22.4% |
| 55 to 64 Years | 693 | 27.3% |
| 65 to 74 Years | 304 | 12.0% |
| 75 to 84 Years | 308 | 12.1% |
| 85 Years and Over | 27 | 1.1% |
| Total | 2,542 | 100.0% |
Housing Finances in Harriman
Median Income by Occupancy in Harriman
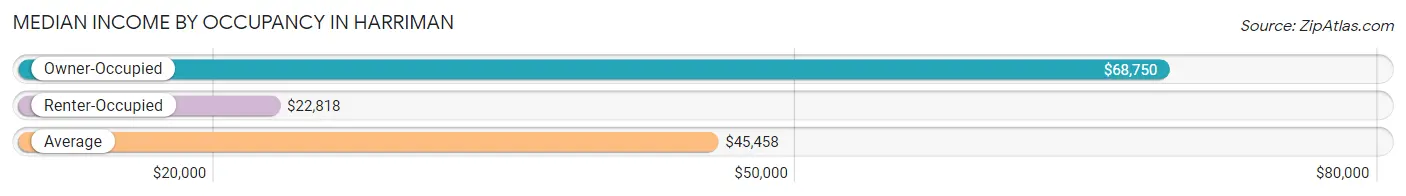
| Occupancy Type | # Households | Median Income |
| Owner-Occupied | 1,635 (64.3%) | $68,750 |
| Renter-Occupied | 907 (35.7%) | $22,818 |
| Average | 2,542 (100.0%) | $45,458 |
Occupancy by Householder Income Bracket in Harriman
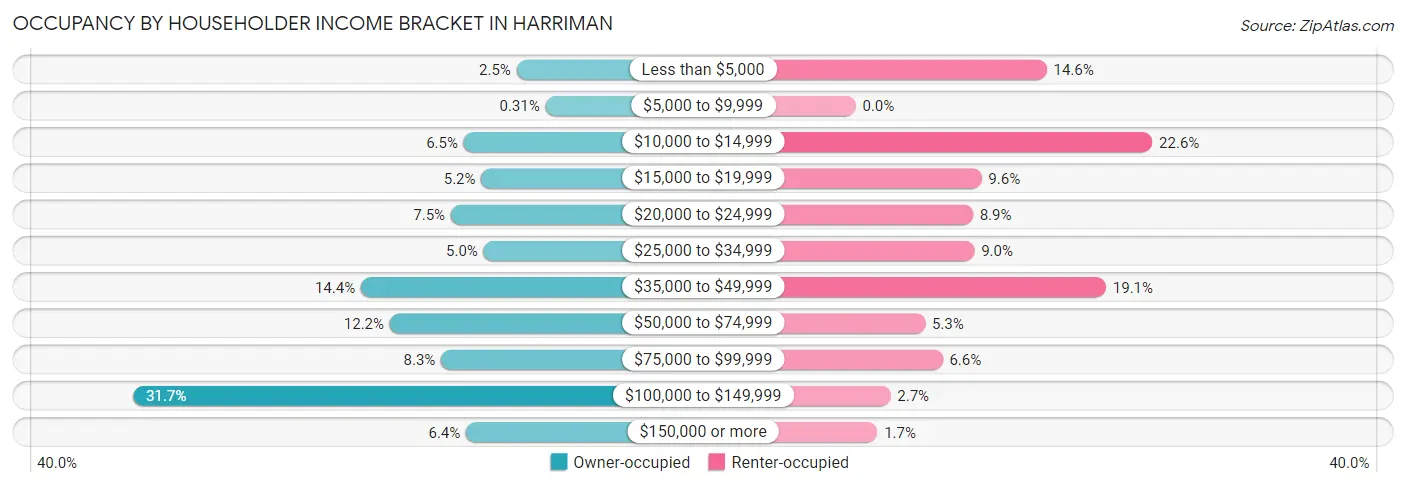
| Income Bracket | Owner-occupied | Renter-occupied |
| Less than $5,000 | 41 (2.5%) | 132 (14.5%) |
| $5,000 to $9,999 | 5 (0.3%) | 0 (0.0%) |
| $10,000 to $14,999 | 107 (6.5%) | 205 (22.6%) |
| $15,000 to $19,999 | 85 (5.2%) | 87 (9.6%) |
| $20,000 to $24,999 | 123 (7.5%) | 81 (8.9%) |
| $25,000 to $34,999 | 82 (5.0%) | 82 (9.0%) |
| $35,000 to $49,999 | 235 (14.4%) | 173 (19.1%) |
| $50,000 to $74,999 | 199 (12.2%) | 48 (5.3%) |
| $75,000 to $99,999 | 135 (8.3%) | 60 (6.6%) |
| $100,000 to $149,999 | 519 (31.7%) | 24 (2.6%) |
| $150,000 or more | 104 (6.4%) | 15 (1.7%) |
| Total | 1,635 (100.0%) | 907 (100.0%) |
Monthly Housing Cost Tiers in Harriman
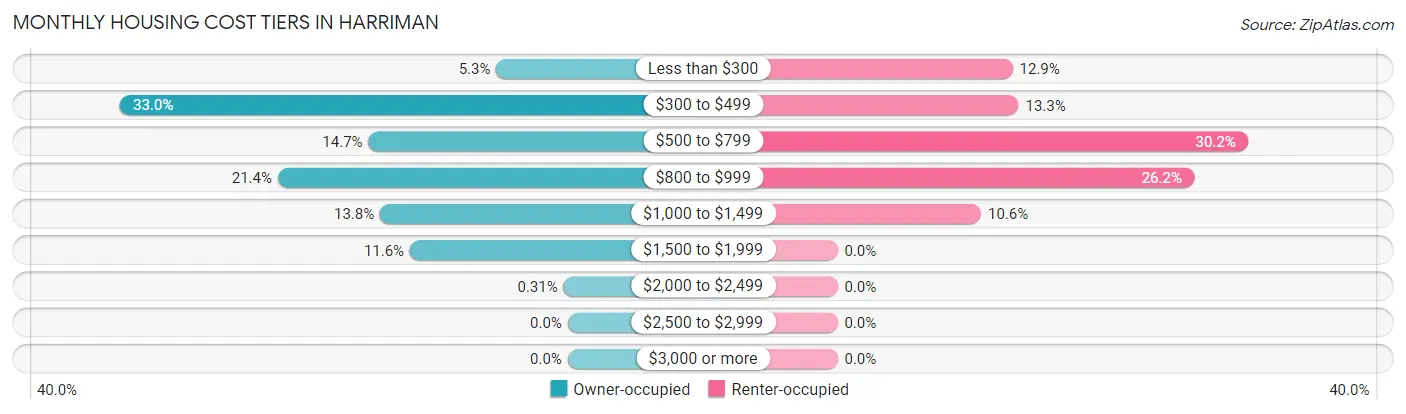
| Monthly Cost | Owner-occupied | Renter-occupied |
| Less than $300 | 86 (5.3%) | 117 (12.9%) |
| $300 to $499 | 539 (33.0%) | 121 (13.3%) |
| $500 to $799 | 240 (14.7%) | 274 (30.2%) |
| $800 to $999 | 349 (21.3%) | 238 (26.2%) |
| $1,000 to $1,499 | 226 (13.8%) | 96 (10.6%) |
| $1,500 to $1,999 | 190 (11.6%) | 0 (0.0%) |
| $2,000 to $2,499 | 5 (0.3%) | 0 (0.0%) |
| $2,500 to $2,999 | 0 (0.0%) | 0 (0.0%) |
| $3,000 or more | 0 (0.0%) | 0 (0.0%) |
| Total | 1,635 (100.0%) | 907 (100.0%) |
Physical Housing Characteristics in Harriman
Housing Structures in Harriman
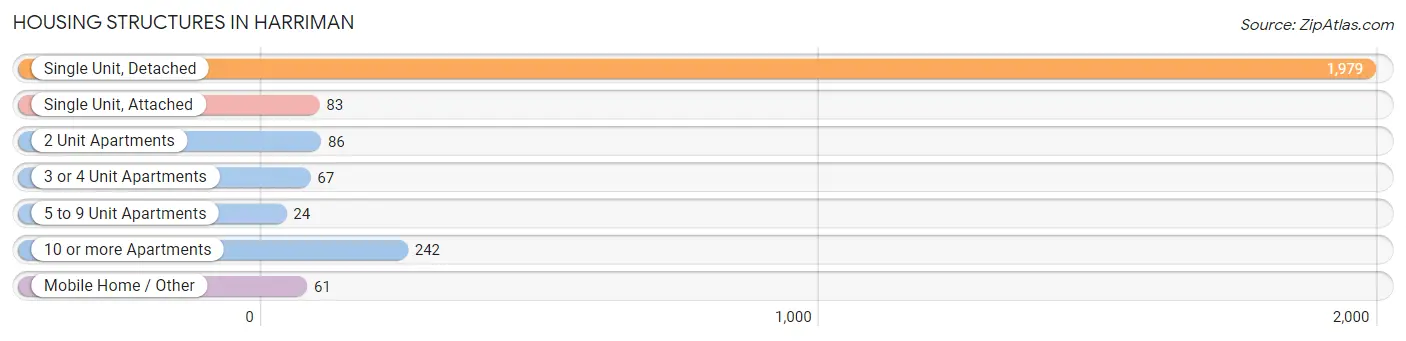
| Structure Type | # Housing Units | % Housing Units |
| Single Unit, Detached | 1,979 | 77.8% |
| Single Unit, Attached | 83 | 3.3% |
| 2 Unit Apartments | 86 | 3.4% |
| 3 or 4 Unit Apartments | 67 | 2.6% |
| 5 to 9 Unit Apartments | 24 | 0.9% |
| 10 or more Apartments | 242 | 9.5% |
| Mobile Home / Other | 61 | 2.4% |
| Total | 2,542 | 100.0% |
Housing Structures by Occupancy in Harriman
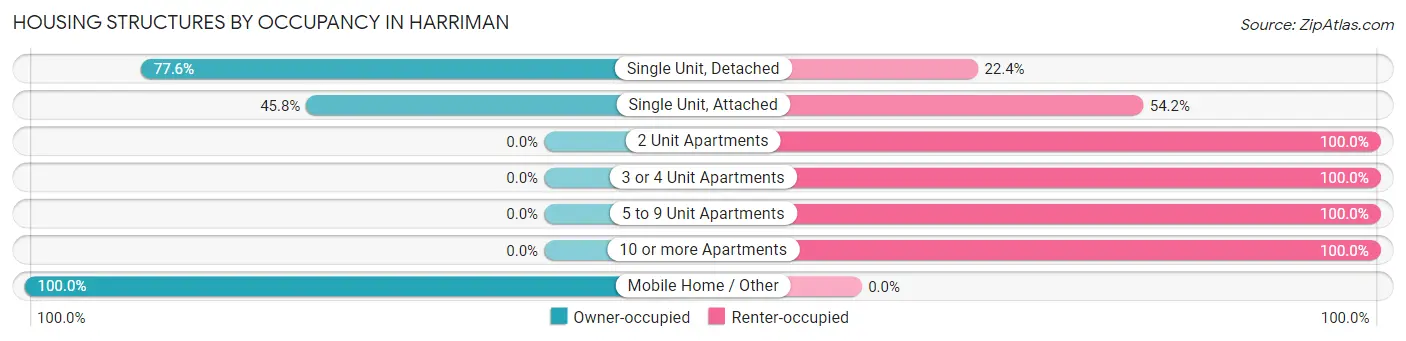
| Structure Type | Owner-occupied | Renter-occupied |
| Single Unit, Detached | 1,536 (77.6%) | 443 (22.4%) |
| Single Unit, Attached | 38 (45.8%) | 45 (54.2%) |
| 2 Unit Apartments | 0 (0.0%) | 86 (100.0%) |
| 3 or 4 Unit Apartments | 0 (0.0%) | 67 (100.0%) |
| 5 to 9 Unit Apartments | 0 (0.0%) | 24 (100.0%) |
| 10 or more Apartments | 0 (0.0%) | 242 (100.0%) |
| Mobile Home / Other | 61 (100.0%) | 0 (0.0%) |
| Total | 1,635 (64.3%) | 907 (35.7%) |
Housing Structures by Number of Rooms in Harriman
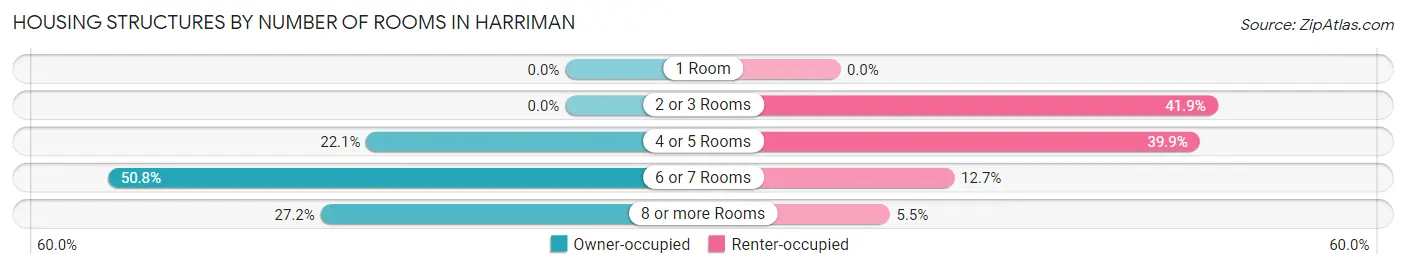
| Number of Rooms | Owner-occupied | Renter-occupied |
| 1 Room | 0 (0.0%) | 0 (0.0%) |
| 2 or 3 Rooms | 0 (0.0%) | 380 (41.9%) |
| 4 or 5 Rooms | 361 (22.1%) | 362 (39.9%) |
| 6 or 7 Rooms | 830 (50.8%) | 115 (12.7%) |
| 8 or more Rooms | 444 (27.2%) | 50 (5.5%) |
| Total | 1,635 (100.0%) | 907 (100.0%) |
Housing Structure by Heating Type in Harriman
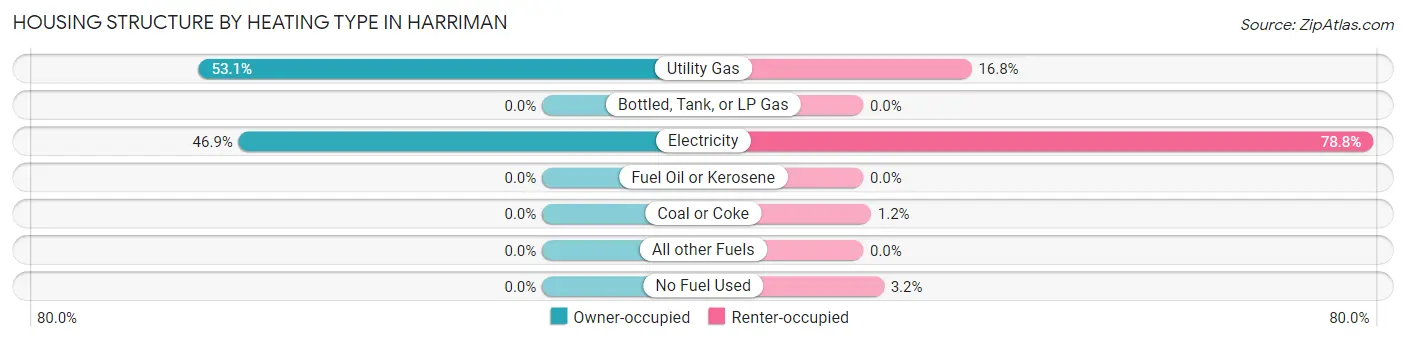
| Heating Type | Owner-occupied | Renter-occupied |
| Utility Gas | 868 (53.1%) | 152 (16.8%) |
| Bottled, Tank, or LP Gas | 0 (0.0%) | 0 (0.0%) |
| Electricity | 767 (46.9%) | 715 (78.8%) |
| Fuel Oil or Kerosene | 0 (0.0%) | 0 (0.0%) |
| Coal or Coke | 0 (0.0%) | 11 (1.2%) |
| All other Fuels | 0 (0.0%) | 0 (0.0%) |
| No Fuel Used | 0 (0.0%) | 29 (3.2%) |
| Total | 1,635 (100.0%) | 907 (100.0%) |
Household Vehicle Usage in Harriman
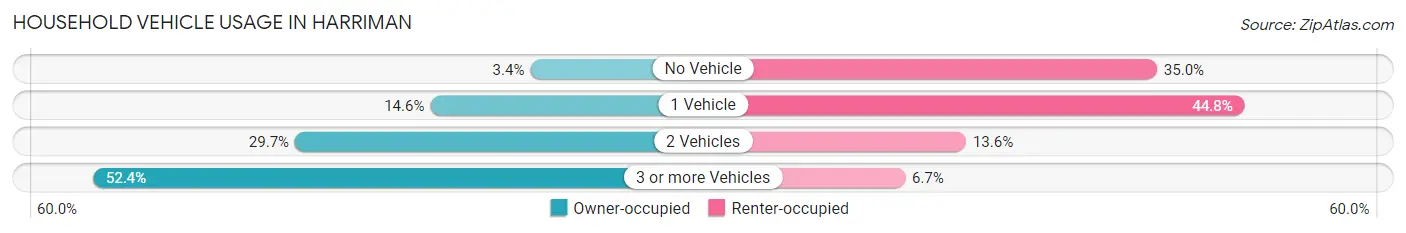
| Vehicles per Household | Owner-occupied | Renter-occupied |
| No Vehicle | 55 (3.4%) | 317 (34.9%) |
| 1 Vehicle | 238 (14.6%) | 406 (44.8%) |
| 2 Vehicles | 486 (29.7%) | 123 (13.6%) |
| 3 or more Vehicles | 856 (52.3%) | 61 (6.7%) |
| Total | 1,635 (100.0%) | 907 (100.0%) |
Real Estate & Mortgages in Harriman
Real Estate and Mortgage Overview in Harriman
| Characteristic | Without Mortgage | With Mortgage |
| Housing Units | 777 | 858 |
| Median Property Value | $119,800 | $161,400 |
| Median Household Income | $46,600 | $75 |
| Monthly Housing Costs | $419 | $0 |
| Real Estate Taxes | $1,008 | $0 |
Property Value by Mortgage Status in Harriman
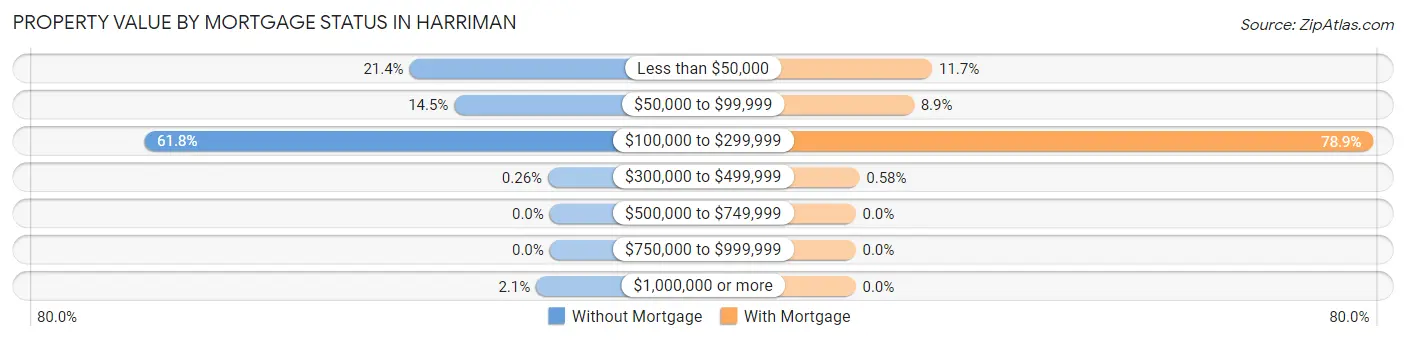
| Property Value | Without Mortgage | With Mortgage |
| Less than $50,000 | 166 (21.4%) | 100 (11.7%) |
| $50,000 to $99,999 | 113 (14.5%) | 76 (8.9%) |
| $100,000 to $299,999 | 480 (61.8%) | 677 (78.9%) |
| $300,000 to $499,999 | 2 (0.3%) | 5 (0.6%) |
| $500,000 to $749,999 | 0 (0.0%) | 0 (0.0%) |
| $750,000 to $999,999 | 0 (0.0%) | 0 (0.0%) |
| $1,000,000 or more | 16 (2.1%) | 0 (0.0%) |
| Total | 777 (100.0%) | 858 (100.0%) |
Household Income by Mortgage Status in Harriman
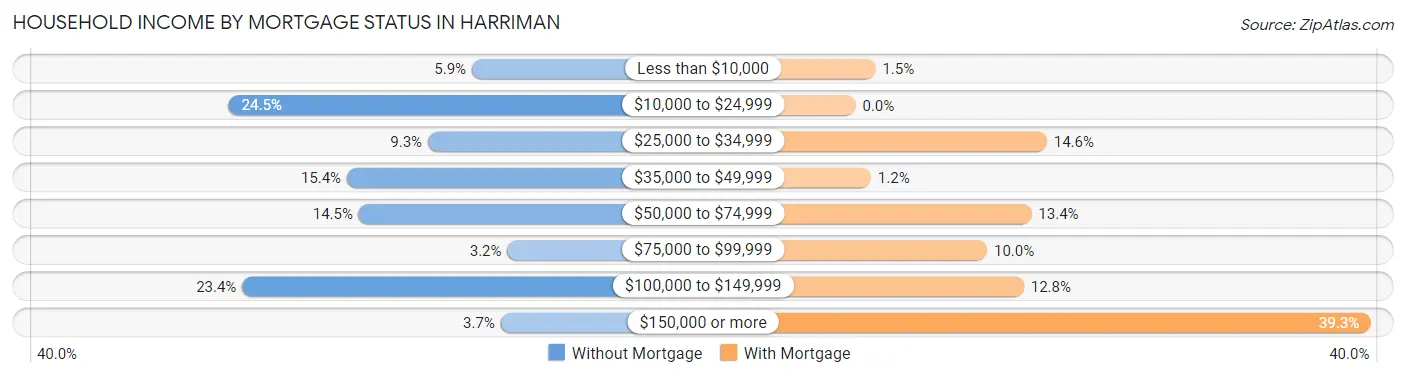
| Household Income | Without Mortgage | With Mortgage |
| Less than $10,000 | 46 (5.9%) | 13 (1.5%) |
| $10,000 to $24,999 | 190 (24.4%) | 0 (0.0%) |
| $25,000 to $34,999 | 72 (9.3%) | 125 (14.6%) |
| $35,000 to $49,999 | 120 (15.4%) | 10 (1.2%) |
| $50,000 to $74,999 | 113 (14.5%) | 115 (13.4%) |
| $75,000 to $99,999 | 25 (3.2%) | 86 (10.0%) |
| $100,000 to $149,999 | 182 (23.4%) | 110 (12.8%) |
| $150,000 or more | 29 (3.7%) | 337 (39.3%) |
| Total | 777 (100.0%) | 858 (100.0%) |
Property Value to Household Income Ratio in Harriman
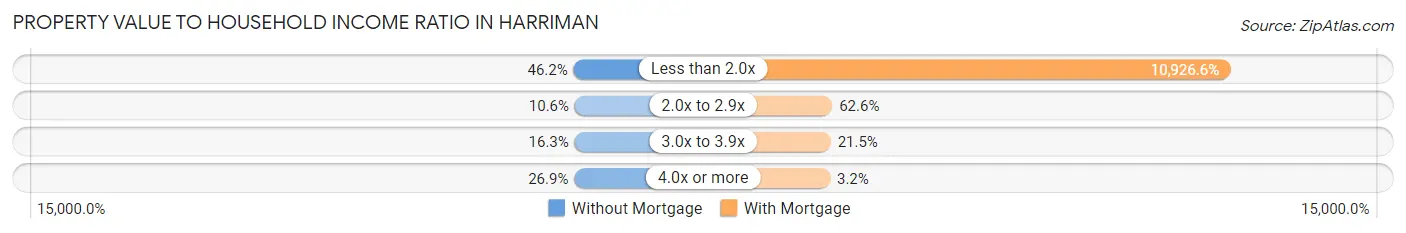
| Value-to-Income Ratio | Without Mortgage | With Mortgage |
| Less than 2.0x | 359 (46.2%) | 93,750 (10,926.6%) |
| 2.0x to 2.9x | 82 (10.5%) | 537 (62.6%) |
| 3.0x to 3.9x | 127 (16.3%) | 184 (21.4%) |
| 4.0x or more | 209 (26.9%) | 27 (3.2%) |
| Total | 777 (100.0%) | 858 (100.0%) |
Real Estate Taxes by Mortgage Status in Harriman
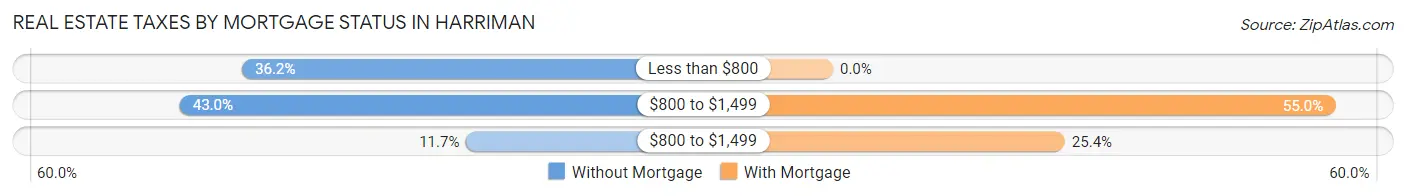
| Property Taxes | Without Mortgage | With Mortgage |
| Less than $800 | 281 (36.2%) | 0 (0.0%) |
| $800 to $1,499 | 334 (43.0%) | 472 (55.0%) |
| $800 to $1,499 | 91 (11.7%) | 218 (25.4%) |
| Total | 777 (100.0%) | 858 (100.0%) |
Health & Disability in Harriman
Health Insurance Coverage by Age in Harriman
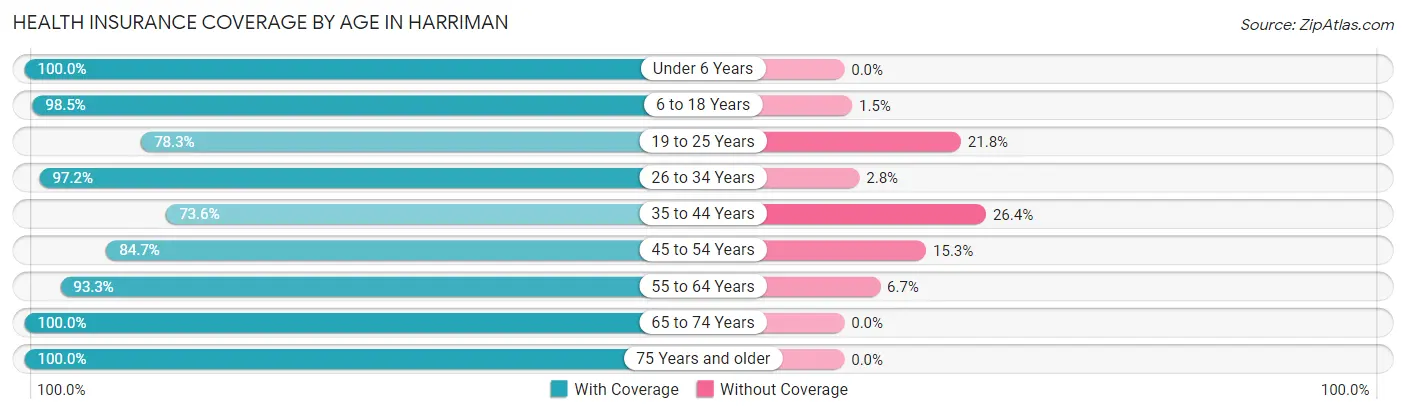
| Age Bracket | With Coverage | Without Coverage |
| Under 6 Years | 289 (100.0%) | 0 (0.0%) |
| 6 to 18 Years | 742 (98.5%) | 11 (1.5%) |
| 19 to 25 Years | 457 (78.2%) | 127 (21.7%) |
| 26 to 34 Years | 589 (97.2%) | 17 (2.8%) |
| 35 to 44 Years | 607 (73.6%) | 218 (26.4%) |
| 45 to 54 Years | 866 (84.7%) | 156 (15.3%) |
| 55 to 64 Years | 866 (93.3%) | 62 (6.7%) |
| 65 to 74 Years | 415 (100.0%) | 0 (0.0%) |
| 75 Years and older | 400 (100.0%) | 0 (0.0%) |
| Total | 5,231 (89.8%) | 591 (10.2%) |
Health Insurance Coverage by Citizenship Status in Harriman
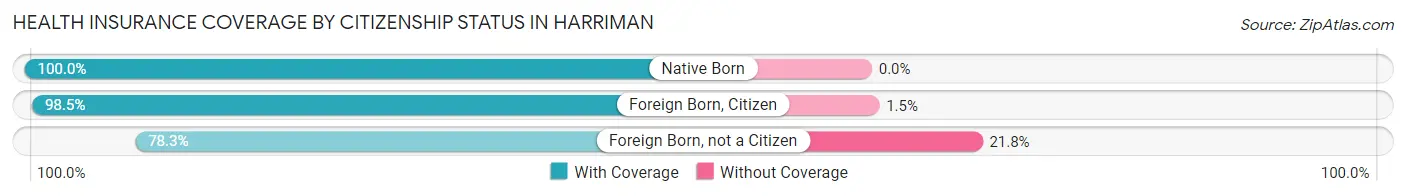
| Citizenship Status | With Coverage | Without Coverage |
| Native Born | 289 (100.0%) | 0 (0.0%) |
| Foreign Born, Citizen | 742 (98.5%) | 11 (1.5%) |
| Foreign Born, not a Citizen | 457 (78.2%) | 127 (21.7%) |
Health Insurance Coverage by Household Income in Harriman
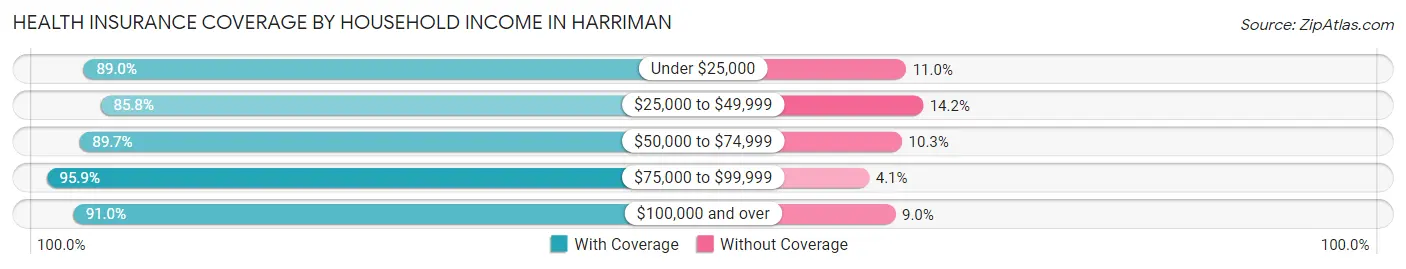
| Household Income | With Coverage | Without Coverage |
| Under $25,000 | 1,144 (89.0%) | 142 (11.0%) |
| $25,000 to $49,999 | 1,121 (85.8%) | 186 (14.2%) |
| $50,000 to $74,999 | 568 (89.7%) | 65 (10.3%) |
| $75,000 to $99,999 | 699 (95.9%) | 30 (4.1%) |
| $100,000 and over | 1,691 (91.0%) | 168 (9.0%) |
Public vs Private Health Insurance Coverage by Age in Harriman
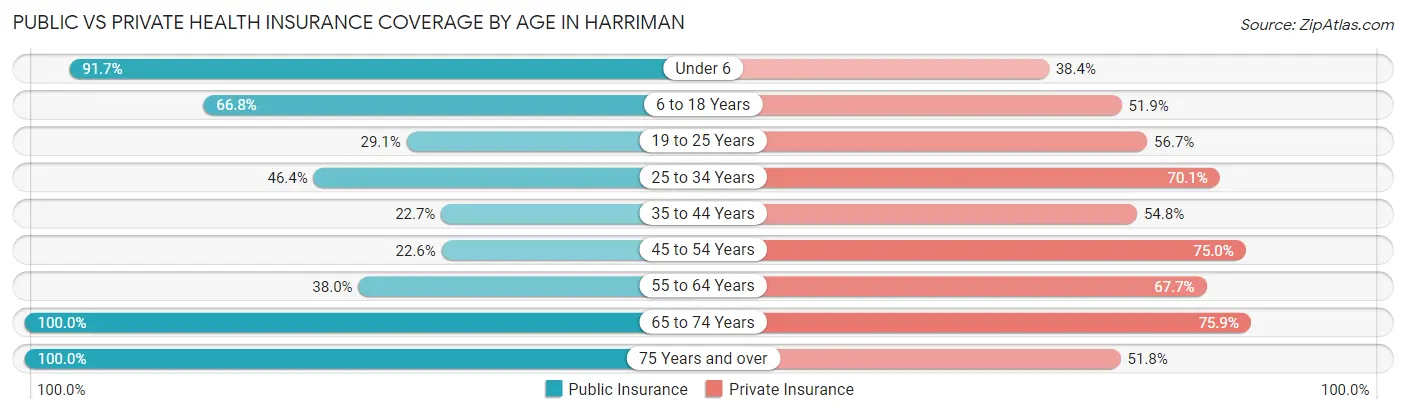
| Age Bracket | Public Insurance | Private Insurance |
| Under 6 | 265 (91.7%) | 111 (38.4%) |
| 6 to 18 Years | 503 (66.8%) | 391 (51.9%) |
| 19 to 25 Years | 170 (29.1%) | 331 (56.7%) |
| 25 to 34 Years | 281 (46.4%) | 425 (70.1%) |
| 35 to 44 Years | 187 (22.7%) | 452 (54.8%) |
| 45 to 54 Years | 231 (22.6%) | 766 (75.0%) |
| 55 to 64 Years | 353 (38.0%) | 628 (67.7%) |
| 65 to 74 Years | 415 (100.0%) | 315 (75.9%) |
| 75 Years and over | 400 (100.0%) | 207 (51.7%) |
| Total | 2,805 (48.2%) | 3,626 (62.3%) |
Disability Status by Sex by Age in Harriman
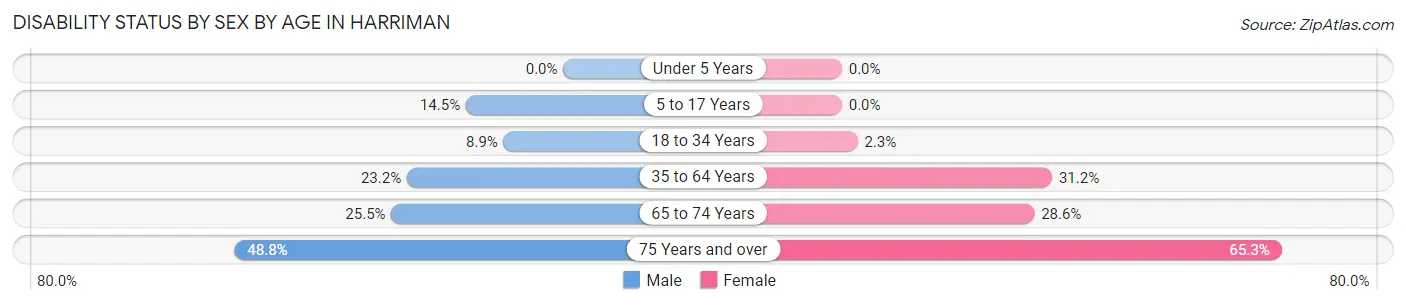
| Age Bracket | Male | Female |
| Under 5 Years | 0 (0.0%) | 0 (0.0%) |
| 5 to 17 Years | 70 (14.5%) | 0 (0.0%) |
| 18 to 34 Years | 57 (8.9%) | 15 (2.3%) |
| 35 to 64 Years | 320 (23.2%) | 436 (31.2%) |
| 65 to 74 Years | 72 (25.5%) | 38 (28.6%) |
| 75 Years and over | 63 (48.8%) | 177 (65.3%) |
Disability Class by Sex by Age in Harriman
Disability Class: Hearing Difficulty
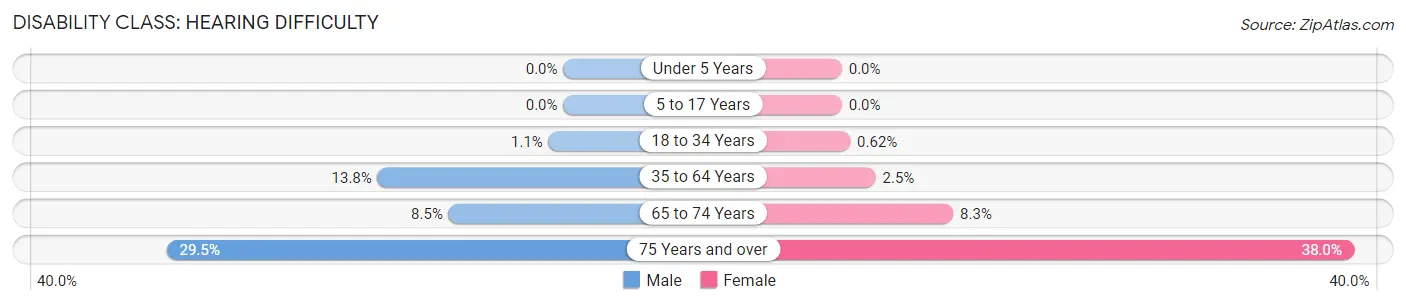
| Age Bracket | Male | Female |
| Under 5 Years | 0 (0.0%) | 0 (0.0%) |
| 5 to 17 Years | 0 (0.0%) | 0 (0.0%) |
| 18 to 34 Years | 7 (1.1%) | 4 (0.6%) |
| 35 to 64 Years | 190 (13.8%) | 35 (2.5%) |
| 65 to 74 Years | 24 (8.5%) | 11 (8.3%) |
| 75 Years and over | 38 (29.5%) | 103 (38.0%) |
Disability Class: Vision Difficulty
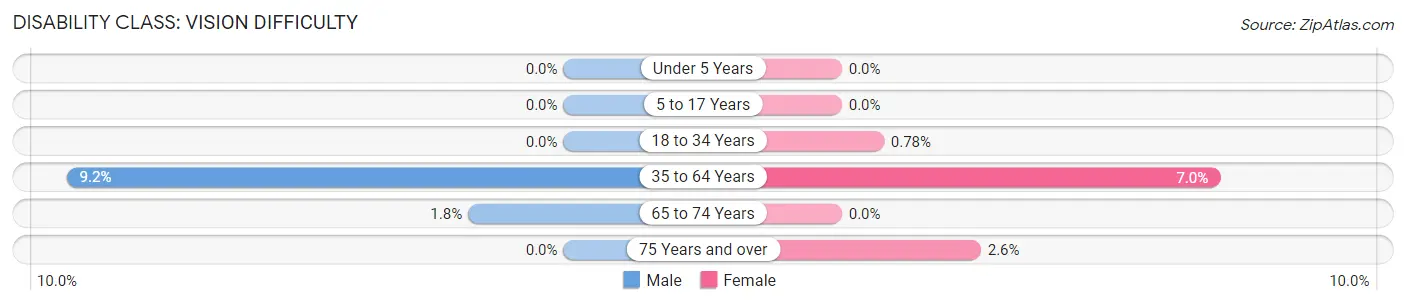
| Age Bracket | Male | Female |
| Under 5 Years | 0 (0.0%) | 0 (0.0%) |
| 5 to 17 Years | 0 (0.0%) | 0 (0.0%) |
| 18 to 34 Years | 0 (0.0%) | 5 (0.8%) |
| 35 to 64 Years | 127 (9.2%) | 98 (7.0%) |
| 65 to 74 Years | 5 (1.8%) | 0 (0.0%) |
| 75 Years and over | 0 (0.0%) | 7 (2.6%) |
Disability Class: Cognitive Difficulty
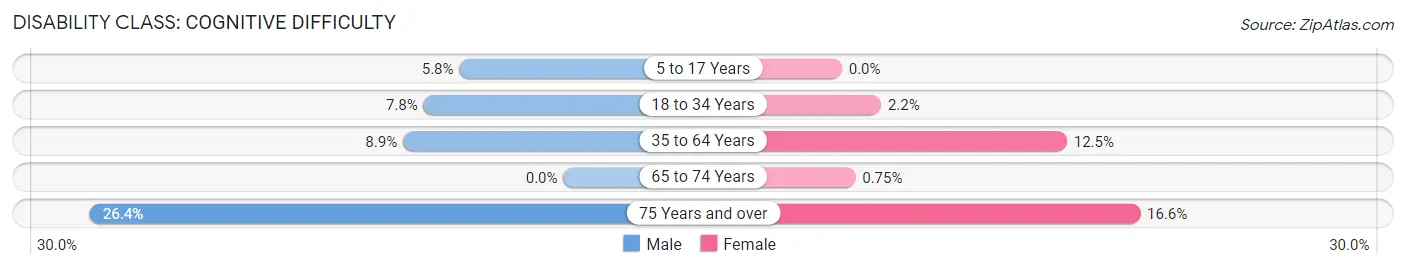
| Age Bracket | Male | Female |
| 5 to 17 Years | 28 (5.8%) | 0 (0.0%) |
| 18 to 34 Years | 50 (7.8%) | 14 (2.2%) |
| 35 to 64 Years | 123 (8.9%) | 175 (12.5%) |
| 65 to 74 Years | 0 (0.0%) | 1 (0.7%) |
| 75 Years and over | 34 (26.4%) | 45 (16.6%) |
Disability Class: Ambulatory Difficulty
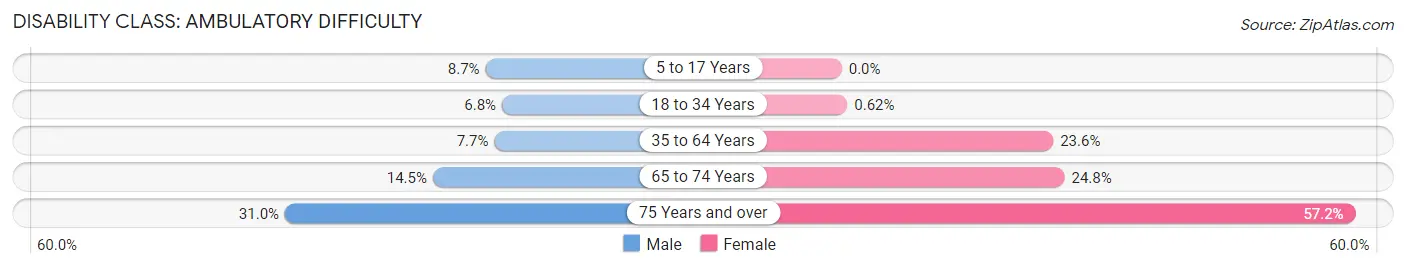
| Age Bracket | Male | Female |
| 5 to 17 Years | 42 (8.7%) | 0 (0.0%) |
| 18 to 34 Years | 44 (6.8%) | 4 (0.6%) |
| 35 to 64 Years | 106 (7.7%) | 329 (23.5%) |
| 65 to 74 Years | 41 (14.5%) | 33 (24.8%) |
| 75 Years and over | 40 (31.0%) | 155 (57.2%) |
Disability Class: Self-Care Difficulty
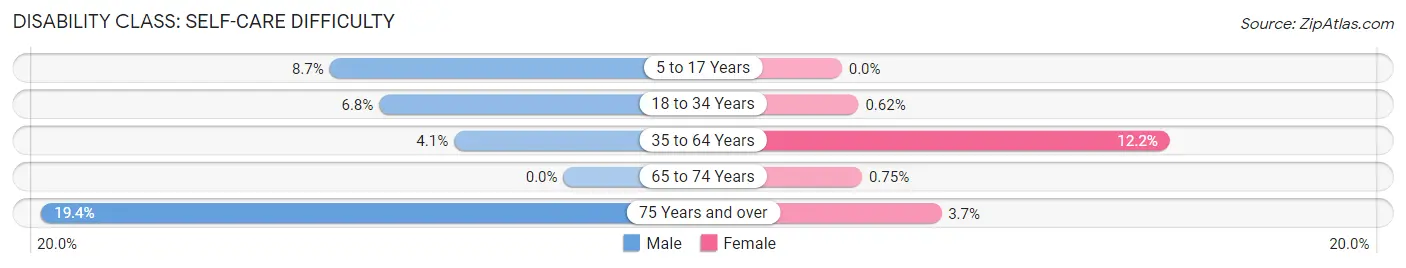
| Age Bracket | Male | Female |
| 5 to 17 Years | 42 (8.7%) | 0 (0.0%) |
| 18 to 34 Years | 44 (6.8%) | 4 (0.6%) |
| 35 to 64 Years | 56 (4.1%) | 170 (12.2%) |
| 65 to 74 Years | 0 (0.0%) | 1 (0.7%) |
| 75 Years and over | 25 (19.4%) | 10 (3.7%) |
Technology Access in Harriman
Computing Device Access in Harriman
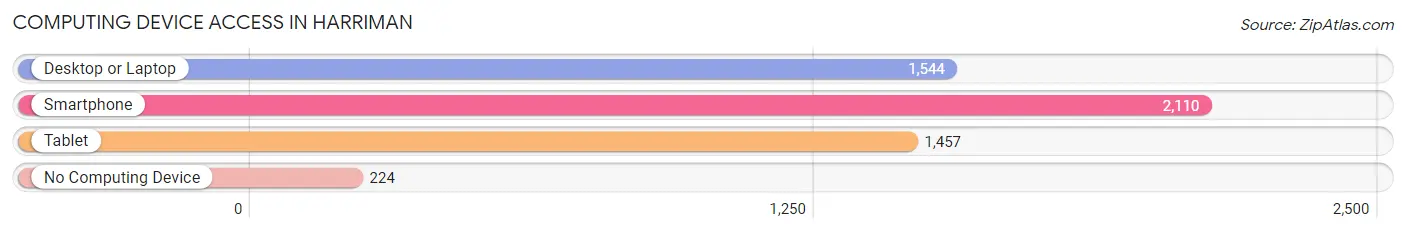
| Device Type | # Households | % Households |
| Desktop or Laptop | 1,544 | 60.7% |
| Smartphone | 2,110 | 83.0% |
| Tablet | 1,457 | 57.3% |
| No Computing Device | 224 | 8.8% |
| Total | 2,542 | 100.0% |
Internet Access in Harriman
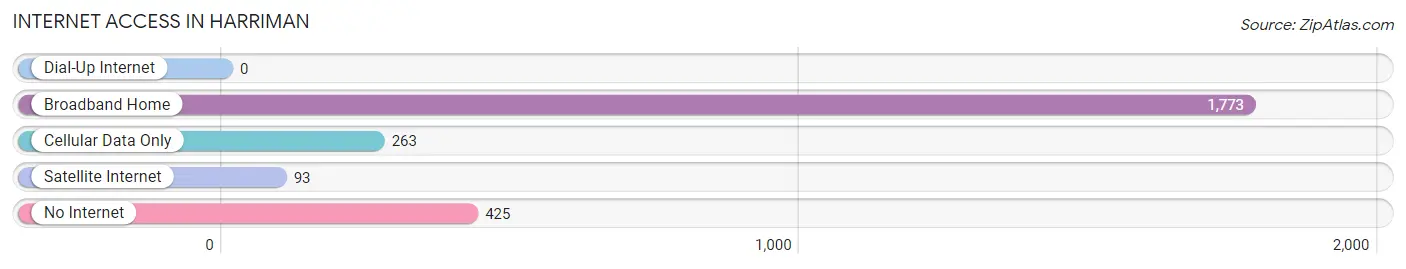
| Internet Type | # Households | % Households |
| Dial-Up Internet | 0 | 0.0% |
| Broadband Home | 1,773 | 69.8% |
| Cellular Data Only | 263 | 10.3% |
| Satellite Internet | 93 | 3.7% |
| No Internet | 425 | 16.7% |
| Total | 2,542 | 100.0% |
Harriman Summary
Harriman, Tennessee is a small city located in Roane County, Tennessee. It is situated along the banks of the Emory River, approximately 25 miles west of Knoxville. The city has a population of 6,350 people, according to the 2010 census.
History
Harriman was founded in 1889 by railroad magnate and philanthropist, Colonel Oliver Hazard Payne. Payne named the city after his friend, former New York Governor, and U.S. Senator, Thomas C. Harriman. Payne was instrumental in the development of the city, donating land for the construction of a railroad depot, a post office, and a school.
The city was incorporated in 1901 and quickly became a hub for the surrounding agricultural communities. The city was also home to several manufacturing plants, including a cotton mill, a furniture factory, and a brickyard.
Geography
Harriman is located in the foothills of the Cumberland Mountains, approximately 25 miles west of Knoxville. The city is situated along the banks of the Emory River, which flows through the city and provides a source of recreation for the residents.
The city has a total area of 8.2 square miles, of which 8.1 square miles is land and 0.1 square miles is water. The city is located at an elevation of 845 feet above sea level.
Economy
Harriman’s economy is largely based on manufacturing and agriculture. The city is home to several manufacturing plants, including a cotton mill, a furniture factory, and a brickyard. The city is also home to several agricultural businesses, including a dairy farm, a poultry farm, and a vegetable farm.
The city is also home to several retail businesses, including a grocery store, a hardware store, and a variety of restaurants.
Demographics
According to the 2010 census, Harriman has a population of 6,350 people. The racial makeup of the city is 87.3% White, 8.2% African American, 0.7% Native American, 0.4% Asian, 0.1% Pacific Islander, 1.2% from other races, and 2.3% from two or more races.
The median household income in Harriman is $31,944, and the median family income is $41,944. The per capita income in Harriman is $17,845. The city has a poverty rate of 22.3%.
Conclusion
Harriman, Tennessee is a small city located in Roane County, Tennessee. It is situated along the banks of the Emory River, approximately 25 miles west of Knoxville. The city has a population of 6,350 people, according to the 2010 census. Harriman’s economy is largely based on manufacturing and agriculture. The city is home to several manufacturing plants, including a cotton mill, a furniture factory, and a brickyard. The city is also home to several agricultural businesses, including a dairy farm, a poultry farm, and a vegetable farm. The median household income in Harriman is $31,944, and the median family income is $41,944. The per capita income in Harriman is $17,845. The city has a poverty rate of 22.3%.
Common Questions
What is Per Capita Income in Harriman?
Per Capita income in Harriman is $28,866.
What is the Median Family Income in Harriman?
Median Family Income in Harriman is $77,965.
What is the Median Household income in Harriman?
Median Household Income in Harriman is $45,458.
What is Income or Wage Gap in Harriman?
Income or Wage Gap in Harriman is 23.8%.
Women in Harriman earn 76.2 cents for every dollar earned by a man.
What is Inequality or Gini Index in Harriman?
Inequality or Gini Index in Harriman is 0.47.
What is the Total Population of Harriman?
Total Population of Harriman is 6,000.
What is the Total Male Population of Harriman?
Total Male Population of Harriman is 3,132.
What is the Total Female Population of Harriman?
Total Female Population of Harriman is 2,868.
What is the Ratio of Males per 100 Females in Harriman?
There are 109.21 Males per 100 Females in Harriman.
What is the Ratio of Females per 100 Males in Harriman?
There are 91.57 Females per 100 Males in Harriman.
What is the Median Population Age in Harriman?
Median Population Age in Harriman is 43.8 Years.
What is the Average Family Size in Harriman
Average Family Size in Harriman is 3.0 People.
What is the Average Household Size in Harriman
Average Household Size in Harriman is 2.3 People.
How Large is the Labor Force in Harriman?
There are 2,737 People in the Labor Forcein in Harriman.
What is the Percentage of People in the Labor Force in Harriman?
52.5% of People are in the Labor Force in Harriman.
What is the Unemployment Rate in Harriman?
Unemployment Rate in Harriman is 3.4%.