Baxter, TN Map & Demographics
Baxter Map
Baxter Overview
$30,099
PER CAPITA INCOME
$54,556
AVG FAMILY INCOME
$57,829
AVG HOUSEHOLD INCOME
21.0%
WAGE / INCOME GAP [ % ]
79.0¢/ $1
WAGE / INCOME GAP [ $ ]
$10,773
FAMILY INCOME DEFICIT
0.46
INEQUALITY / GINI INDEX
1,477
TOTAL POPULATION
748
MALE POPULATION
729
FEMALE POPULATION
102.61
MALES / 100 FEMALES
97.46
FEMALES / 100 MALES
36.4
MEDIAN AGE
2.8
AVG FAMILY SIZE
2.4
AVG HOUSEHOLD SIZE
648
LABOR FORCE [ PEOPLE ]
54.8%
PERCENT IN LABOR FORCE
1.2%
UNEMPLOYMENT RATE
Baxter Zip Codes
Baxter Area Codes
Income in Baxter
Income Overview in Baxter
Per Capita Income in Baxter is $30,099, while median incomes of families and households are $54,556 and $57,829 respectively.
| Characteristic | Number | Measure |
| Per Capita Income | 1,477 | $30,099 |
| Median Family Income | 418 | $54,556 |
| Mean Family Income | 418 | $68,322 |
| Median Household Income | 607 | $57,829 |
| Mean Household Income | 607 | $74,802 |
| Income Deficit | 418 | $10,773 |
| Wage / Income Gap (%) | 1,477 | 21.02% |
| Wage / Income Gap ($) | 1,477 | 78.98¢ per $1 |
| Gini / Inequality Index | 1,477 | 0.46 |
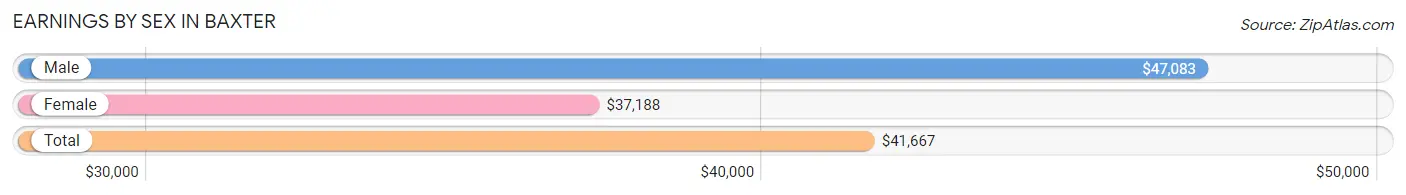
Earnings by Sex in Baxter
Average Earnings in Baxter are $41,667, $47,083 for men and $37,188 for women, a difference of 21.0%.
| Sex | Number | Average Earnings |
| Male | 334 (49.0%) | $47,083 |
| Female | 348 (51.0%) | $37,188 |
| Total | 682 (100.0%) | $41,667 |
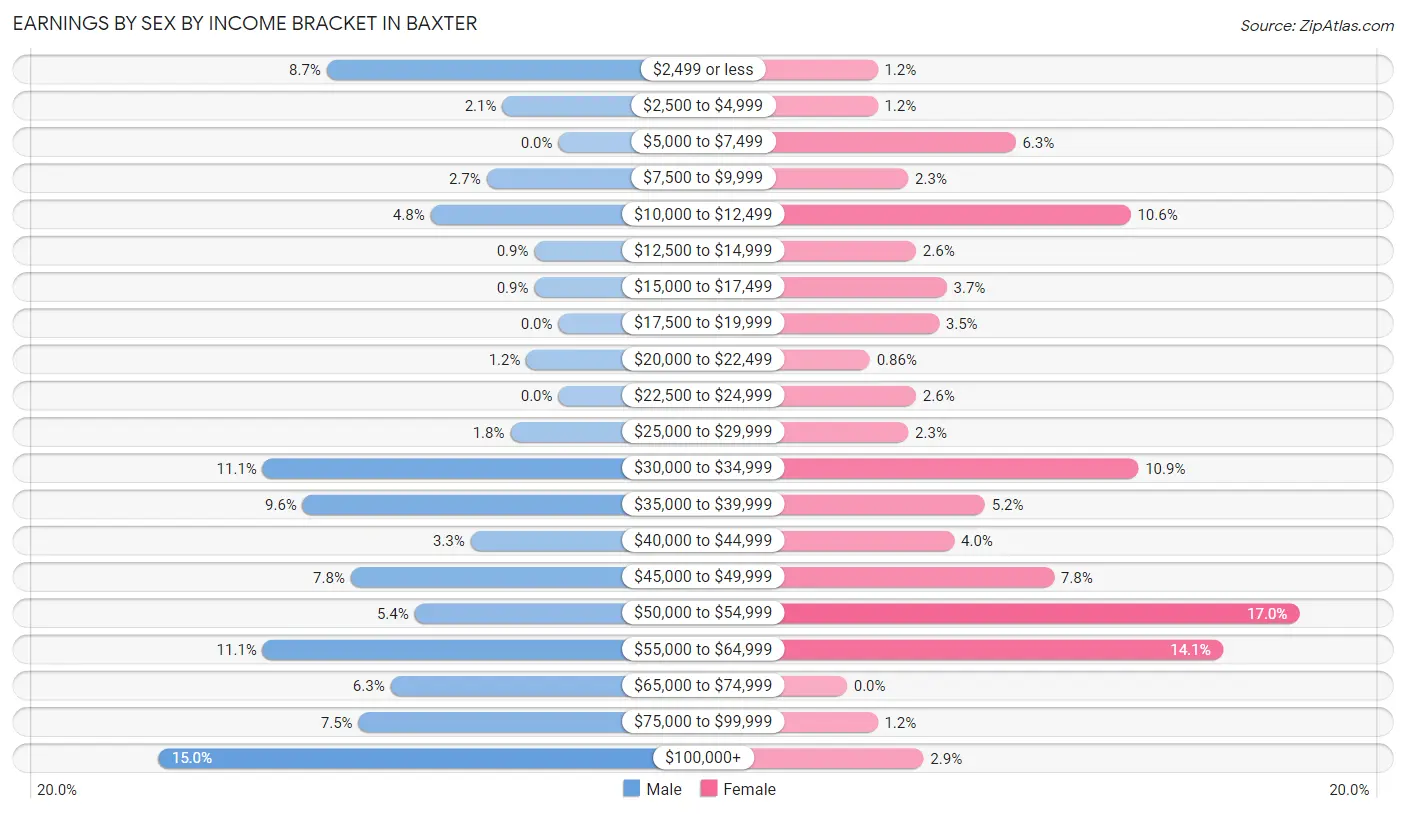
Earnings by Sex by Income Bracket in Baxter
The most common earnings brackets in Baxter are $100,000+ for men (50 | 15.0%) and $50,000 to $54,999 for women (59 | 17.0%).
| Income | Male | Female |
| $2,499 or less | 29 (8.7%) | 4 (1.1%) |
| $2,500 to $4,999 | 7 (2.1%) | 4 (1.1%) |
| $5,000 to $7,499 | 0 (0.0%) | 22 (6.3%) |
| $7,500 to $9,999 | 9 (2.7%) | 8 (2.3%) |
| $10,000 to $12,499 | 16 (4.8%) | 37 (10.6%) |
| $12,500 to $14,999 | 3 (0.9%) | 9 (2.6%) |
| $15,000 to $17,499 | 3 (0.9%) | 13 (3.7%) |
| $17,500 to $19,999 | 0 (0.0%) | 12 (3.5%) |
| $20,000 to $22,499 | 4 (1.2%) | 3 (0.9%) |
| $22,500 to $24,999 | 0 (0.0%) | 9 (2.6%) |
| $25,000 to $29,999 | 6 (1.8%) | 8 (2.3%) |
| $30,000 to $34,999 | 37 (11.1%) | 38 (10.9%) |
| $35,000 to $39,999 | 32 (9.6%) | 18 (5.2%) |
| $40,000 to $44,999 | 11 (3.3%) | 14 (4.0%) |
| $45,000 to $49,999 | 26 (7.8%) | 27 (7.8%) |
| $50,000 to $54,999 | 18 (5.4%) | 59 (17.0%) |
| $55,000 to $64,999 | 37 (11.1%) | 49 (14.1%) |
| $65,000 to $74,999 | 21 (6.3%) | 0 (0.0%) |
| $75,000 to $99,999 | 25 (7.5%) | 4 (1.1%) |
| $100,000+ | 50 (15.0%) | 10 (2.9%) |
| Total | 334 (100.0%) | 348 (100.0%) |
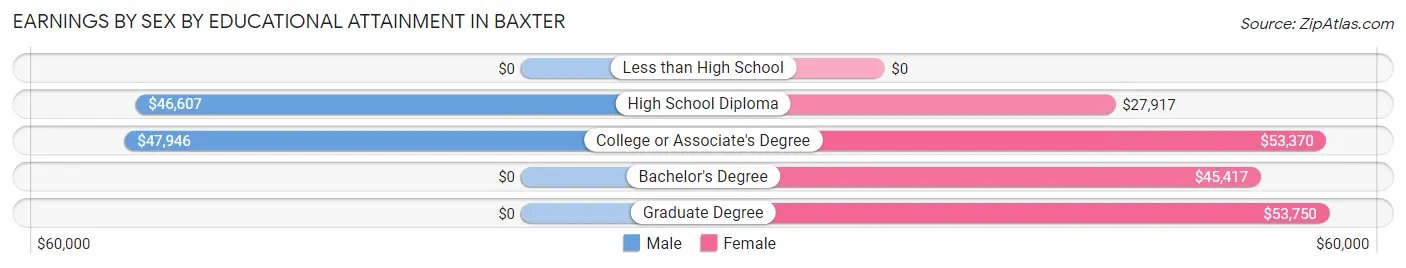
Earnings by Sex by Educational Attainment in Baxter
Average earnings in Baxter are $48,661 for men and $40,357 for women, a difference of 17.1%. Men with an educational attainment of college or associate's degree enjoy the highest average annual earnings of $47,946, while those with high school diploma education earn the least with $46,607. Women with an educational attainment of graduate degree earn the most with the average annual earnings of $53,750, while those with high school diploma education have the smallest earnings of $27,917.
| Educational Attainment | Male Income | Female Income |
| Less than High School | - | - |
| High School Diploma | $46,607 | $27,917 |
| College or Associate's Degree | $47,946 | $53,370 |
| Bachelor's Degree | - | - |
| Graduate Degree | - | - |
| Total | $48,661 | $40,357 |
Family Income in Baxter
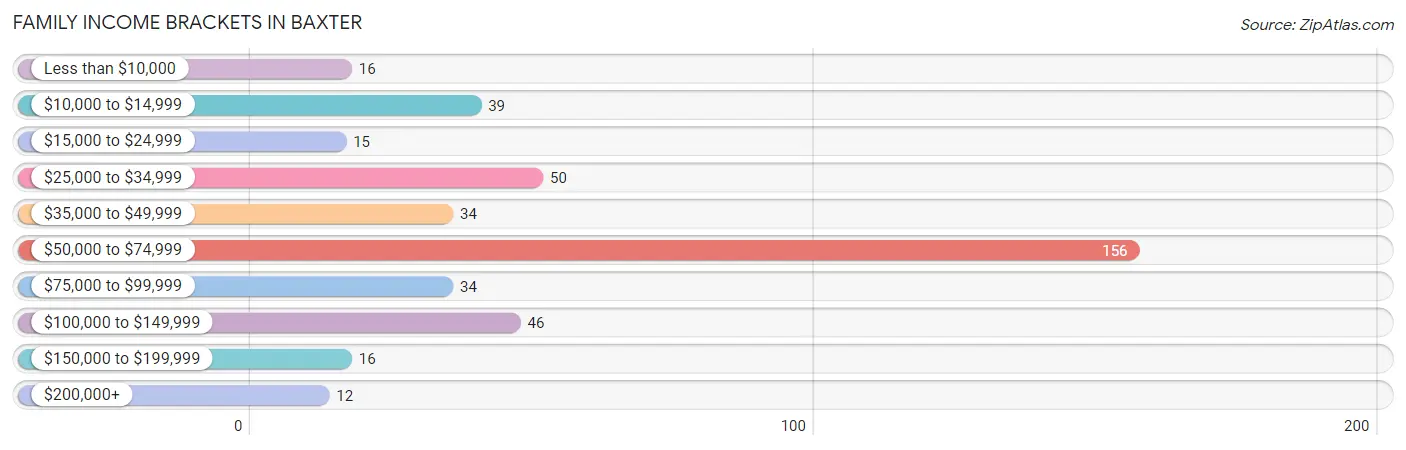
Family Income Brackets in Baxter
According to the Baxter family income data, there are 156 families falling into the $50,000 to $74,999 income range, which is the most common income bracket and makes up 37.3% of all families. Conversely, the $200,000+ income bracket is the least frequent group with only 12 families (2.9%) belonging to this category.
| Income Bracket | # Families | % Families |
| Less than $10,000 | 16 | 3.8% |
| $10,000 to $14,999 | 39 | 9.3% |
| $15,000 to $24,999 | 15 | 3.6% |
| $25,000 to $34,999 | 50 | 12.0% |
| $35,000 to $49,999 | 34 | 8.1% |
| $50,000 to $74,999 | 156 | 37.3% |
| $75,000 to $99,999 | 34 | 8.1% |
| $100,000 to $149,999 | 46 | 11.0% |
| $150,000 to $199,999 | 16 | 3.8% |
| $200,000+ | 12 | 2.9% |
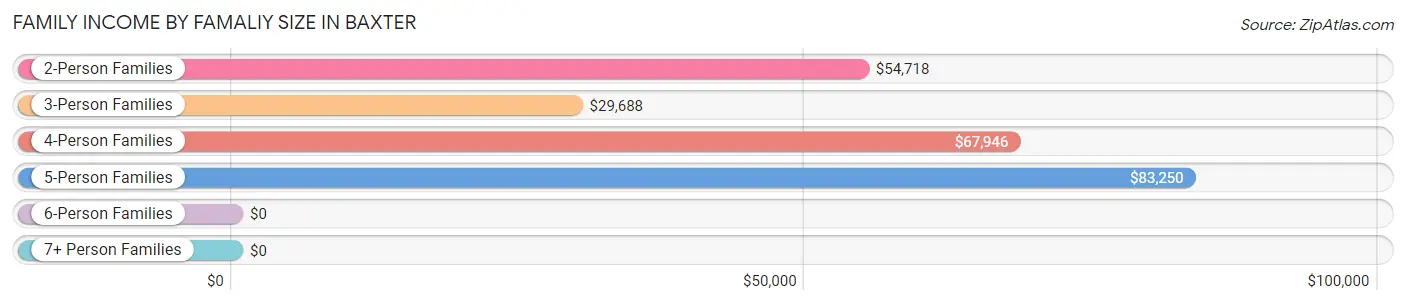
Family Income by Famaliy Size in Baxter
5-person families (43 | 10.3%) account for the highest median family income in Baxter with $83,250 per family, while 2-person families (206 | 49.3%) have the highest median income of $27,359 per family member.
| Income Bracket | # Families | Median Income |
| 2-Person Families | 206 (49.3%) | $54,718 |
| 3-Person Families | 111 (26.6%) | $29,688 |
| 4-Person Families | 55 (13.2%) | $67,946 |
| 5-Person Families | 43 (10.3%) | $83,250 |
| 6-Person Families | 3 (0.7%) | $0 |
| 7+ Person Families | 0 (0.0%) | $0 |
| Total | 418 (100.0%) | $54,556 |
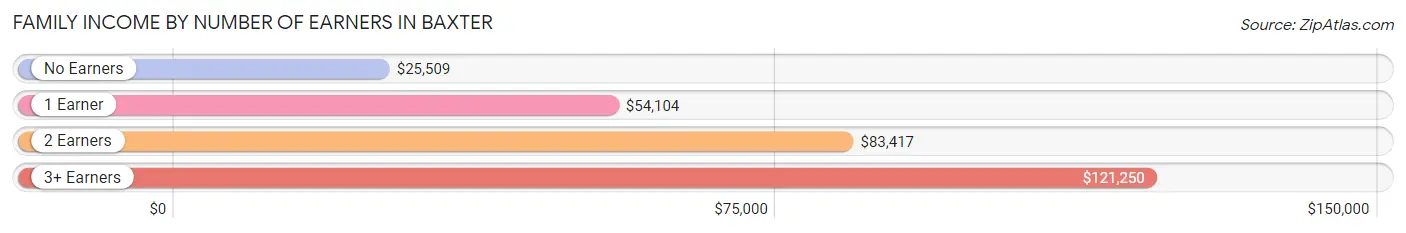
Family Income by Number of Earners in Baxter
The median family income in Baxter is $54,556, with families comprising 3+ earners (9) having the highest median family income of $121,250, while families with no earners (95) have the lowest median family income of $25,509, accounting for 2.1% and 22.7% of families, respectively.
| Number of Earners | # Families | Median Income |
| No Earners | 95 (22.7%) | $25,509 |
| 1 Earner | 171 (40.9%) | $54,104 |
| 2 Earners | 143 (34.2%) | $83,417 |
| 3+ Earners | 9 (2.1%) | $121,250 |
| Total | 418 (100.0%) | $54,556 |
Household Income in Baxter
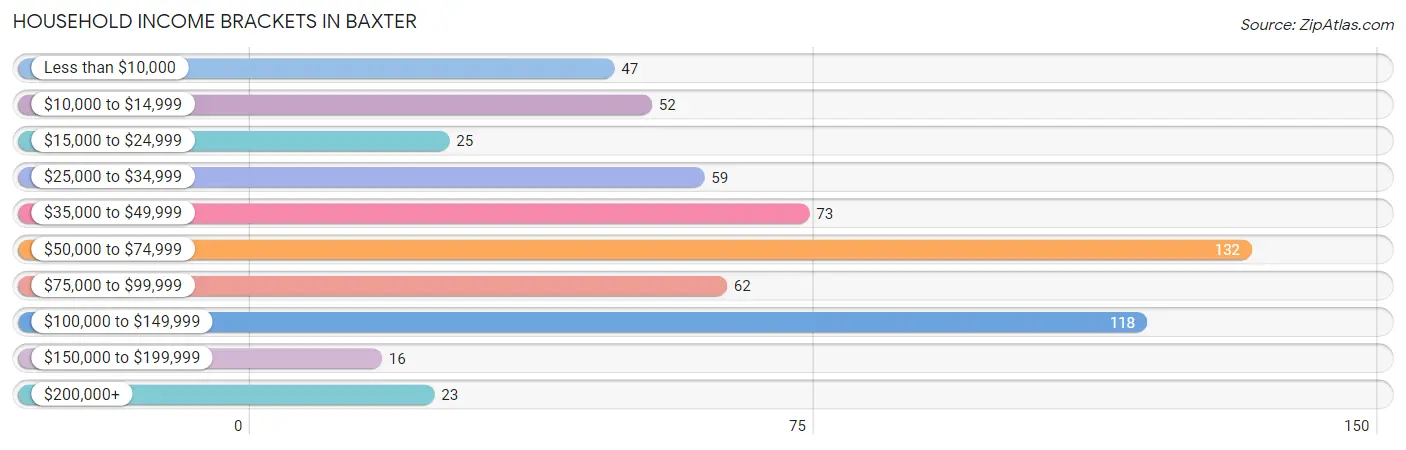
Household Income Brackets in Baxter
With 132 households falling in the category, the $50,000 to $74,999 income range is the most frequent in Baxter, accounting for 21.7% of all households. In contrast, only 16 households (2.6%) fall into the $150,000 to $199,999 income bracket, making it the least populous group.
| Income Bracket | # Households | % Households |
| Less than $10,000 | 47 | 7.7% |
| $10,000 to $14,999 | 52 | 8.6% |
| $15,000 to $24,999 | 25 | 4.1% |
| $25,000 to $34,999 | 59 | 9.7% |
| $35,000 to $49,999 | 73 | 12.0% |
| $50,000 to $74,999 | 132 | 21.7% |
| $75,000 to $99,999 | 62 | 10.2% |
| $100,000 to $149,999 | 118 | 19.4% |
| $150,000 to $199,999 | 16 | 2.6% |
| $200,000+ | 23 | 3.8% |
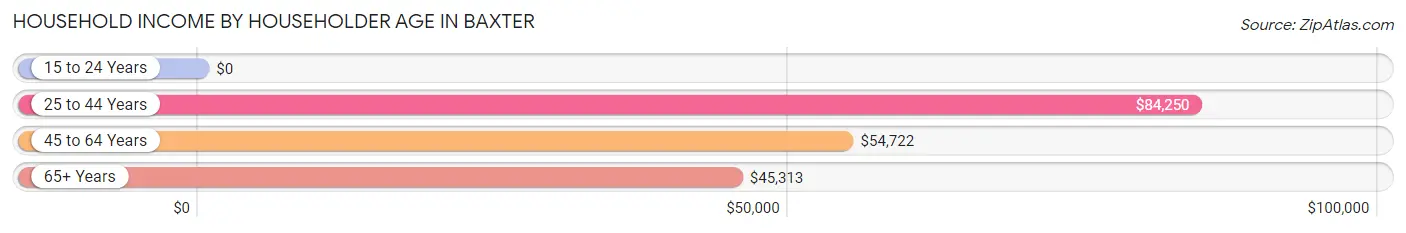
Household Income by Householder Age in Baxter
The median household income in Baxter is $57,829, with the highest median household income of $84,250 found in the 25 to 44 years age bracket for the primary householder. A total of 243 households (40.0%) fall into this category. Meanwhile, the 15 to 24 years age bracket for the primary householder has the lowest median household income of $0, with 11 households (1.8%) in this group.
| Income Bracket | # Households | Median Income |
| 15 to 24 Years | 11 (1.8%) | $0 |
| 25 to 44 Years | 243 (40.0%) | $84,250 |
| 45 to 64 Years | 166 (27.4%) | $54,722 |
| 65+ Years | 187 (30.8%) | $45,313 |
| Total | 607 (100.0%) | $57,829 |
Poverty in Baxter
Income Below Poverty by Sex and Age in Baxter
With 22.1% poverty level for males and 21.8% for females among the residents of Baxter, under 5 year old males and 16 and 17 year old females are the most vulnerable to poverty, with 39 males (70.9%) and 13 females (100.0%) in their respective age groups living below the poverty level.
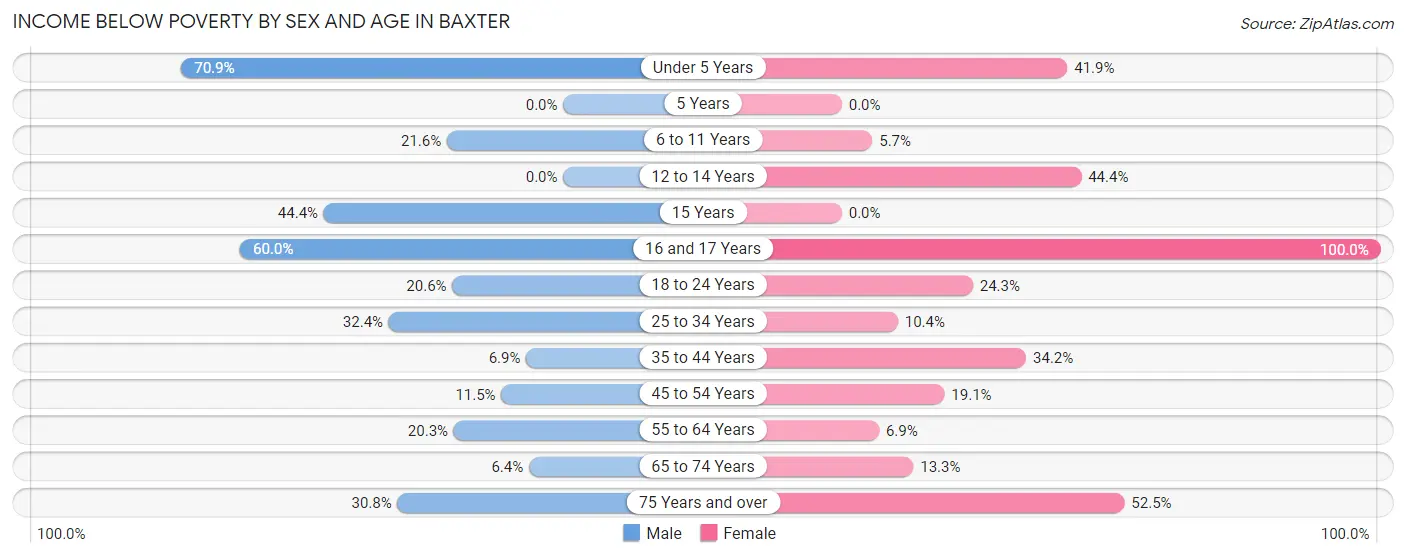
| Age Bracket | Male | Female |
| Under 5 Years | 39 (70.9%) | 18 (41.9%) |
| 5 Years | 0 (0.0%) | 0 (0.0%) |
| 6 to 11 Years | 19 (21.6%) | 3 (5.7%) |
| 12 to 14 Years | 0 (0.0%) | 4 (44.4%) |
| 15 Years | 4 (44.4%) | 0 (0.0%) |
| 16 and 17 Years | 15 (60.0%) | 13 (100.0%) |
| 18 to 24 Years | 7 (20.6%) | 9 (24.3%) |
| 25 to 34 Years | 34 (32.4%) | 18 (10.4%) |
| 35 to 44 Years | 9 (6.9%) | 26 (34.2%) |
| 45 to 54 Years | 10 (11.5%) | 16 (19.1%) |
| 55 to 64 Years | 13 (20.3%) | 4 (6.9%) |
| 65 to 74 Years | 7 (6.4%) | 13 (13.3%) |
| 75 Years and over | 8 (30.8%) | 32 (52.5%) |
| Total | 165 (22.1%) | 156 (21.8%) |
Income Above Poverty by Sex and Age in Baxter
According to the poverty statistics in Baxter, males aged 12 to 14 years and females aged 5 years are the age groups that are most secure financially, with 100.0% of males and 100.0% of females in these age groups living above the poverty line.
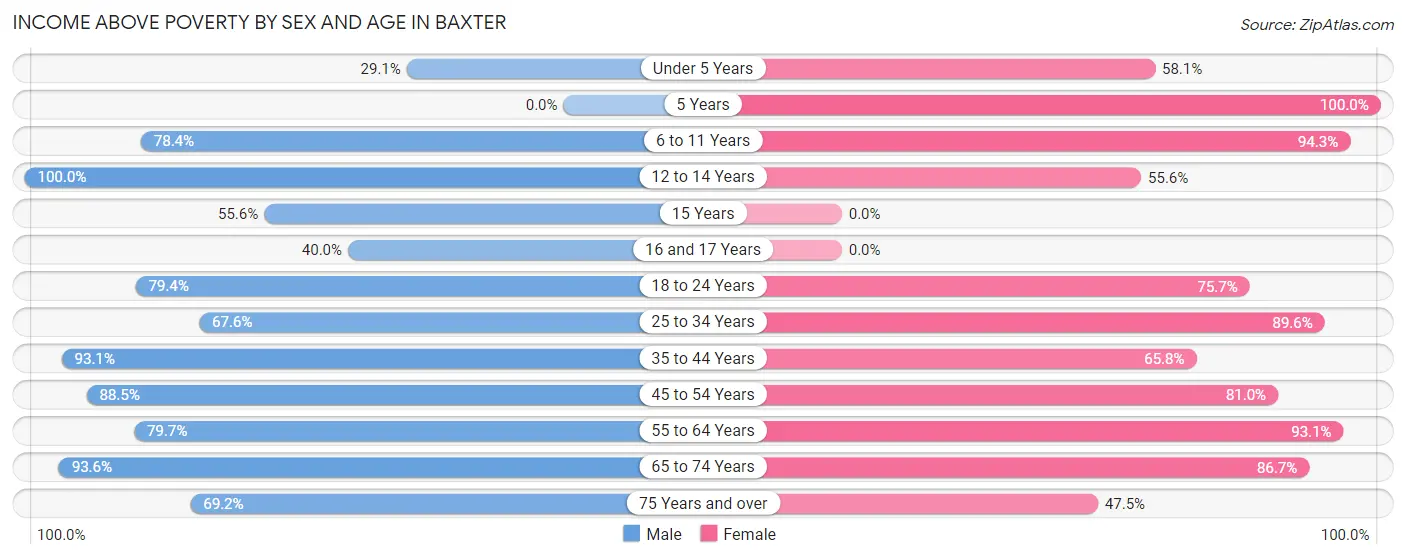
| Age Bracket | Male | Female |
| Under 5 Years | 16 (29.1%) | 25 (58.1%) |
| 5 Years | 0 (0.0%) | 11 (100.0%) |
| 6 to 11 Years | 69 (78.4%) | 50 (94.3%) |
| 12 to 14 Years | 14 (100.0%) | 5 (55.6%) |
| 15 Years | 5 (55.6%) | 0 (0.0%) |
| 16 and 17 Years | 10 (40.0%) | 0 (0.0%) |
| 18 to 24 Years | 27 (79.4%) | 28 (75.7%) |
| 25 to 34 Years | 71 (67.6%) | 155 (89.6%) |
| 35 to 44 Years | 122 (93.1%) | 50 (65.8%) |
| 45 to 54 Years | 77 (88.5%) | 68 (80.9%) |
| 55 to 64 Years | 51 (79.7%) | 54 (93.1%) |
| 65 to 74 Years | 103 (93.6%) | 85 (86.7%) |
| 75 Years and over | 18 (69.2%) | 29 (47.5%) |
| Total | 583 (77.9%) | 560 (78.2%) |
Income Below Poverty Among Married-Couple Families in Baxter
The poverty statistics for married-couple families in Baxter show that 14.6% or 41 of the total 281 families live below the poverty line. Families with 1 or 2 children have the highest poverty rate of 29.9%, comprising of 23 families. On the other hand, families with no children have the lowest poverty rate of 5.2%, which includes 9 families.
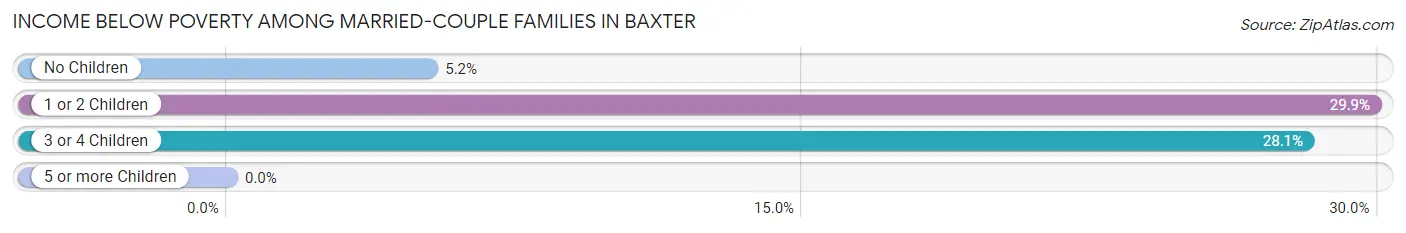
| Children | Above Poverty | Below Poverty |
| No Children | 163 (94.8%) | 9 (5.2%) |
| 1 or 2 Children | 54 (70.1%) | 23 (29.9%) |
| 3 or 4 Children | 23 (71.9%) | 9 (28.1%) |
| 5 or more Children | 0 (0.0%) | 0 (0.0%) |
| Total | 240 (85.4%) | 41 (14.6%) |
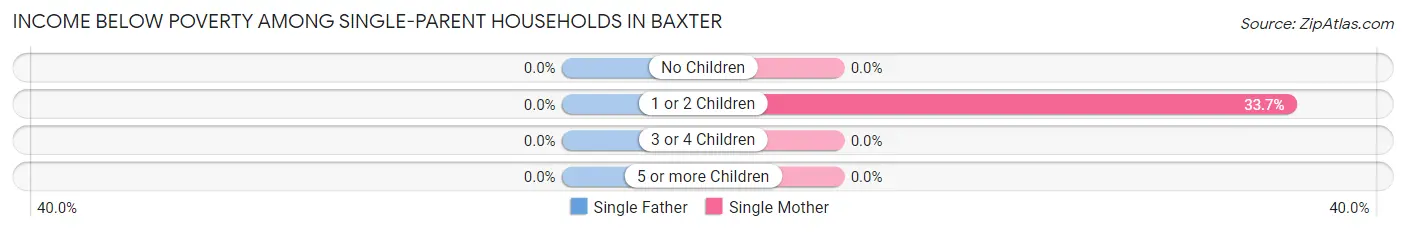
Income Below Poverty Among Single-Parent Households in Baxter
| Children | Single Father | Single Mother |
| No Children | 0 (0.0%) | 0 (0.0%) |
| 1 or 2 Children | 0 (0.0%) | 29 (33.7%) |
| 3 or 4 Children | 0 (0.0%) | 0 (0.0%) |
| 5 or more Children | 0 (0.0%) | 0 (0.0%) |
| Total | 0 (0.0%) | 29 (27.1%) |
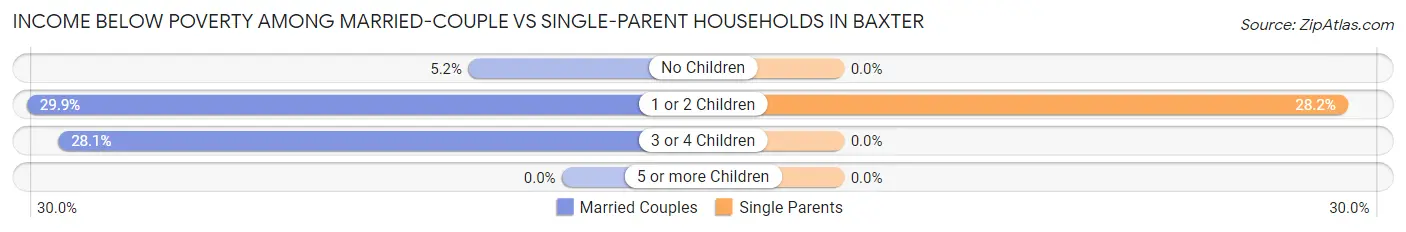
Income Below Poverty Among Married-Couple vs Single-Parent Households in Baxter
The poverty data for Baxter shows that 41 of the married-couple family households (14.6%) and 29 of the single-parent households (21.2%) are living below the poverty level. Within the married-couple family households, those with 1 or 2 children have the highest poverty rate, with 23 households (29.9%) falling below the poverty line. Among the single-parent households, those with 1 or 2 children have the highest poverty rate, with 29 household (28.2%) living below poverty.
| Children | Married-Couple Families | Single-Parent Households |
| No Children | 9 (5.2%) | 0 (0.0%) |
| 1 or 2 Children | 23 (29.9%) | 29 (28.2%) |
| 3 or 4 Children | 9 (28.1%) | 0 (0.0%) |
| 5 or more Children | 0 (0.0%) | 0 (0.0%) |
| Total | 41 (14.6%) | 29 (21.2%) |
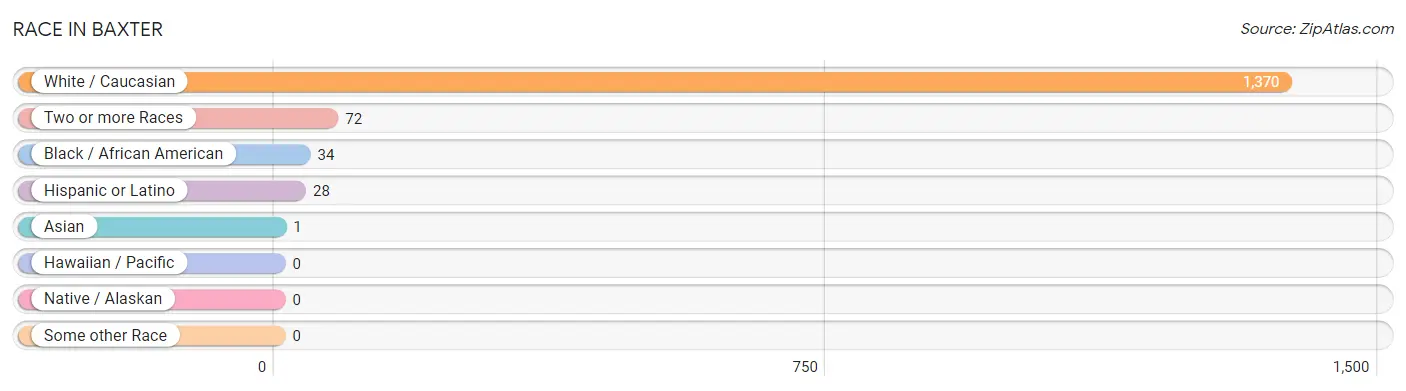
Race in Baxter
The most populous races in Baxter are White / Caucasian (1,370 | 92.8%), Two or more Races (72 | 4.9%), and Black / African American (34 | 2.3%).
| Race | # Population | % Population |
| Asian | 1 | 0.1% |
| Black / African American | 34 | 2.3% |
| Hawaiian / Pacific | 0 | 0.0% |
| Hispanic or Latino | 28 | 1.9% |
| Native / Alaskan | 0 | 0.0% |
| White / Caucasian | 1,370 | 92.8% |
| Two or more Races | 72 | 4.9% |
| Some other Race | 0 | 0.0% |
| Total | 1,477 | 100.0% |
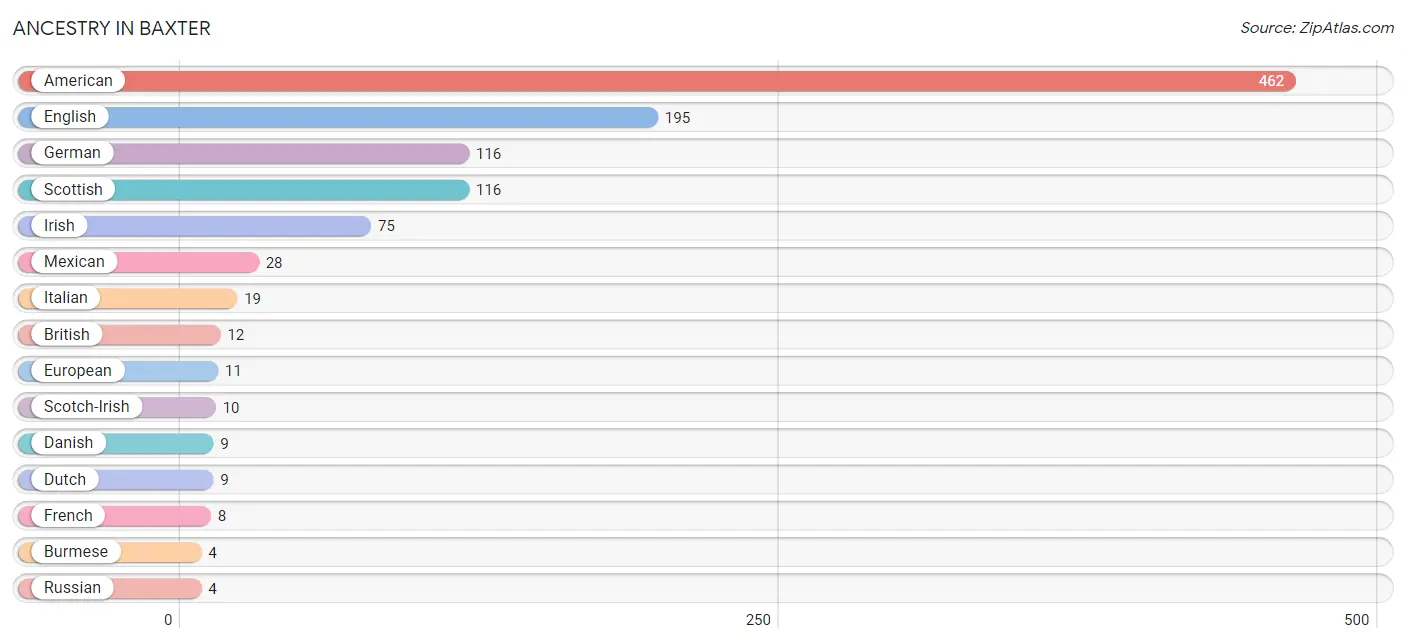
Ancestry in Baxter
The most populous ancestries reported in Baxter are American (462 | 31.3%), English (195 | 13.2%), German (116 | 7.9%), Scottish (116 | 7.9%), and Irish (75 | 5.1%), together accounting for 65.3% of all Baxter residents.
| Ancestry | # Population | % Population |
| American | 462 | 31.3% |
| British | 12 | 0.8% |
| Burmese | 4 | 0.3% |
| Danish | 9 | 0.6% |
| Dutch | 9 | 0.6% |
| English | 195 | 13.2% |
| European | 11 | 0.7% |
| French | 8 | 0.5% |
| German | 116 | 7.9% |
| Irish | 75 | 5.1% |
| Italian | 19 | 1.3% |
| Korean | 1 | 0.1% |
| Mexican | 28 | 1.9% |
| Polish | 3 | 0.2% |
| Russian | 4 | 0.3% |
| Scotch-Irish | 10 | 0.7% |
| Scottish | 116 | 7.9% |
| Swedish | 2 | 0.1% |
| Swiss | 1 | 0.1% |
| Ukrainian | 3 | 0.2% | View All 20 Rows |
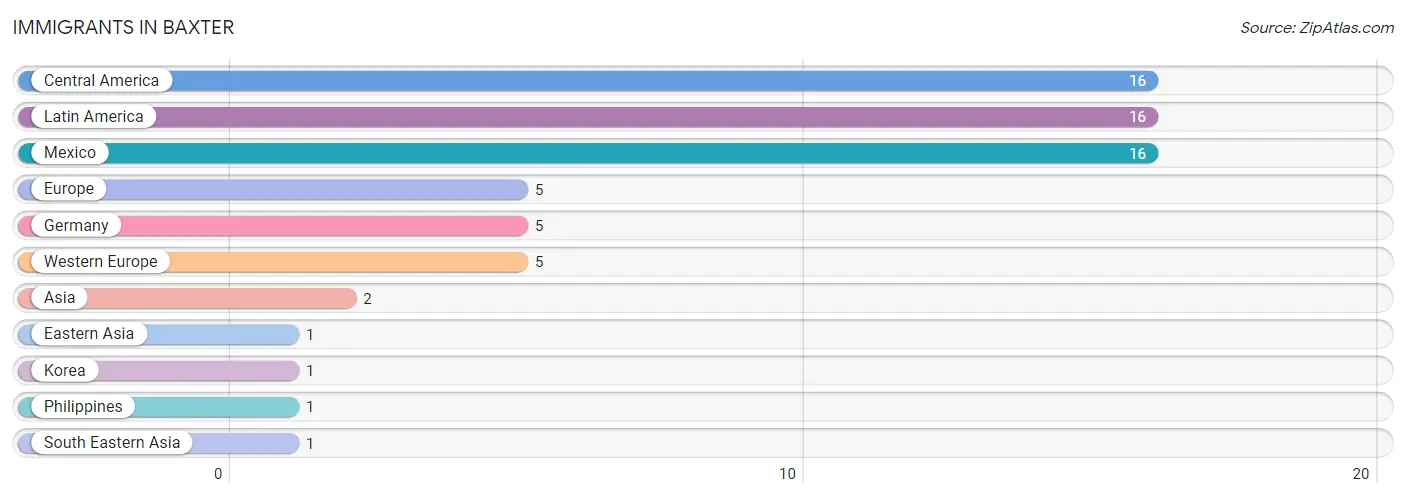
Immigrants in Baxter
The most numerous immigrant groups reported in Baxter came from Central America (16 | 1.1%), Latin America (16 | 1.1%), Mexico (16 | 1.1%), Europe (5 | 0.3%), and Germany (5 | 0.3%), together accounting for 3.9% of all Baxter residents.
| Immigration Origin | # Population | % Population |
| Asia | 2 | 0.1% |
| Central America | 16 | 1.1% |
| Eastern Asia | 1 | 0.1% |
| Europe | 5 | 0.3% |
| Germany | 5 | 0.3% |
| Korea | 1 | 0.1% |
| Latin America | 16 | 1.1% |
| Mexico | 16 | 1.1% |
| Philippines | 1 | 0.1% |
| South Eastern Asia | 1 | 0.1% |
| Western Europe | 5 | 0.3% | View All 11 Rows |
Sex and Age in Baxter
Sex and Age in Baxter
The most populous age groups in Baxter are 35 to 39 Years (82 | 11.0%) for men and 25 to 29 Years (123 | 16.9%) for women.
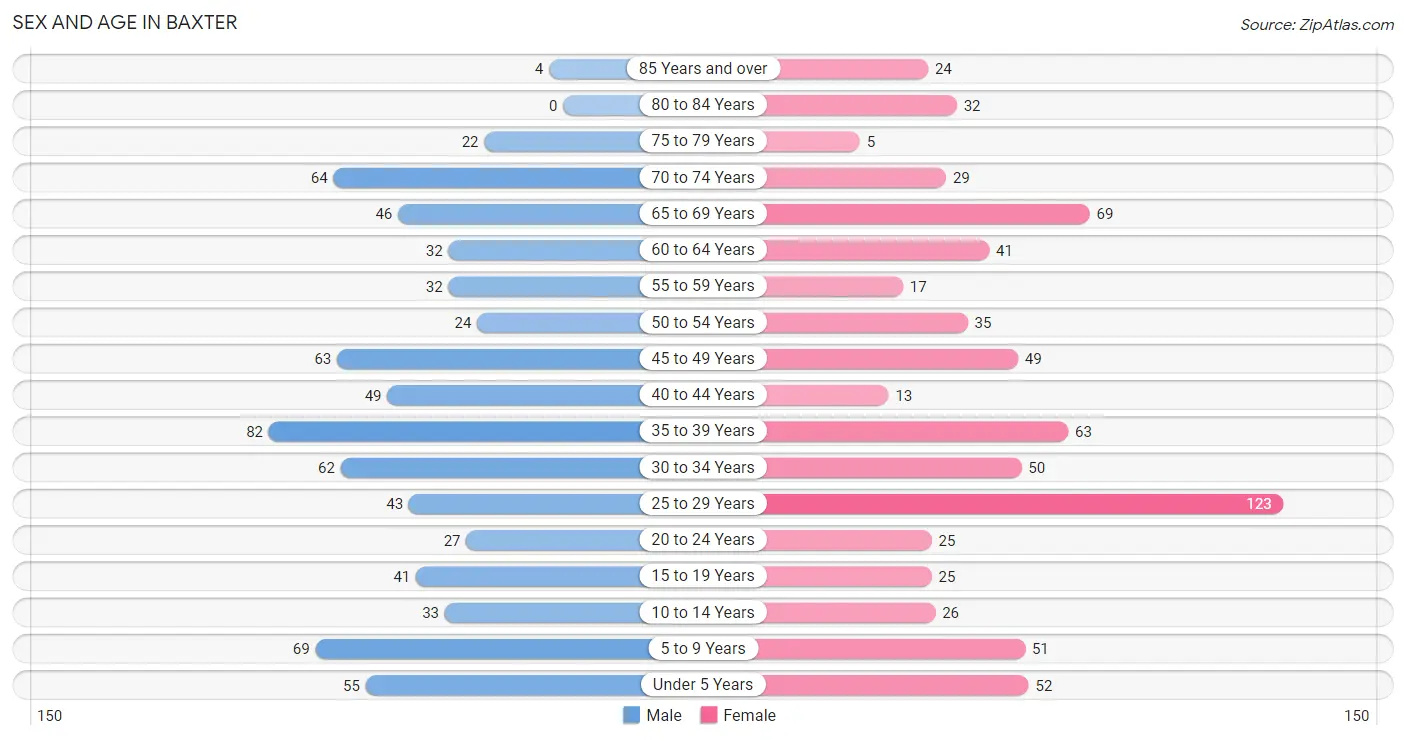
| Age Bracket | Male | Female |
| Under 5 Years | 55 (7.3%) | 52 (7.1%) |
| 5 to 9 Years | 69 (9.2%) | 51 (7.0%) |
| 10 to 14 Years | 33 (4.4%) | 26 (3.6%) |
| 15 to 19 Years | 41 (5.5%) | 25 (3.4%) |
| 20 to 24 Years | 27 (3.6%) | 25 (3.4%) |
| 25 to 29 Years | 43 (5.8%) | 123 (16.9%) |
| 30 to 34 Years | 62 (8.3%) | 50 (6.9%) |
| 35 to 39 Years | 82 (11.0%) | 63 (8.6%) |
| 40 to 44 Years | 49 (6.6%) | 13 (1.8%) |
| 45 to 49 Years | 63 (8.4%) | 49 (6.7%) |
| 50 to 54 Years | 24 (3.2%) | 35 (4.8%) |
| 55 to 59 Years | 32 (4.3%) | 17 (2.3%) |
| 60 to 64 Years | 32 (4.3%) | 41 (5.6%) |
| 65 to 69 Years | 46 (6.1%) | 69 (9.5%) |
| 70 to 74 Years | 64 (8.6%) | 29 (4.0%) |
| 75 to 79 Years | 22 (2.9%) | 5 (0.7%) |
| 80 to 84 Years | 0 (0.0%) | 32 (4.4%) |
| 85 Years and over | 4 (0.5%) | 24 (3.3%) |
| Total | 748 (100.0%) | 729 (100.0%) |
Families and Households in Baxter
Median Family Size in Baxter
The median family size in Baxter is 2.79 persons per family, with married-couple families (281 | 67.2%) accounting for the largest median family size of 3.08 persons per family. On the other hand, single female/mother families (107 | 25.6%) represent the smallest median family size with 2.04 persons per family.
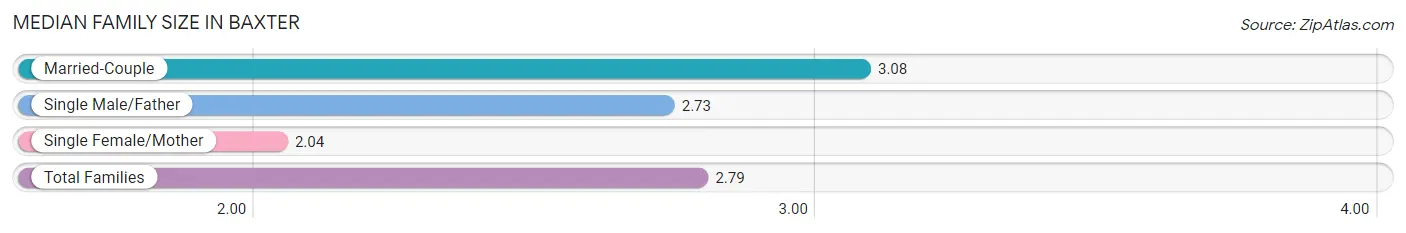
| Family Type | # Families | Family Size |
| Married-Couple | 281 (67.2%) | 3.08 |
| Single Male/Father | 30 (7.2%) | 2.73 |
| Single Female/Mother | 107 (25.6%) | 2.04 |
| Total Families | 418 (100.0%) | 2.79 |
Median Household Size in Baxter
The median household size in Baxter is 2.43 persons per household, with single male/father households (30 | 4.9%) accounting for the largest median household size of 3.13 persons per household. non-family households (189 | 31.1%) represent the smallest median household size with 1.21 persons per household.
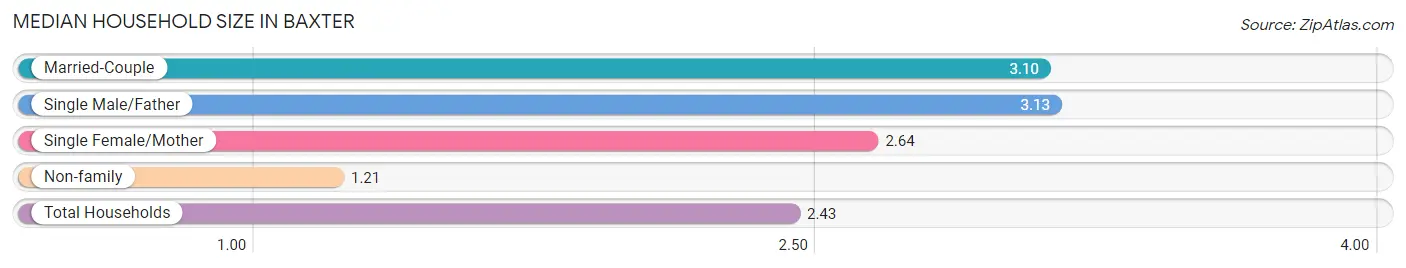
| Household Type | # Households | Household Size |
| Married-Couple | 281 (46.3%) | 3.10 |
| Single Male/Father | 30 (4.9%) | 3.13 |
| Single Female/Mother | 107 (17.6%) | 2.64 |
| Non-family | 189 (31.1%) | 1.21 |
| Total Households | 607 (100.0%) | 2.43 |
Household Size by Marriage Status in Baxter
Out of a total of 607 households in Baxter, 418 (68.9%) are family households, while 189 (31.1%) are nonfamily households. The most numerous type of family households are 3-person households, comprising 162, and the most common type of nonfamily households are 1-person households, comprising 149.
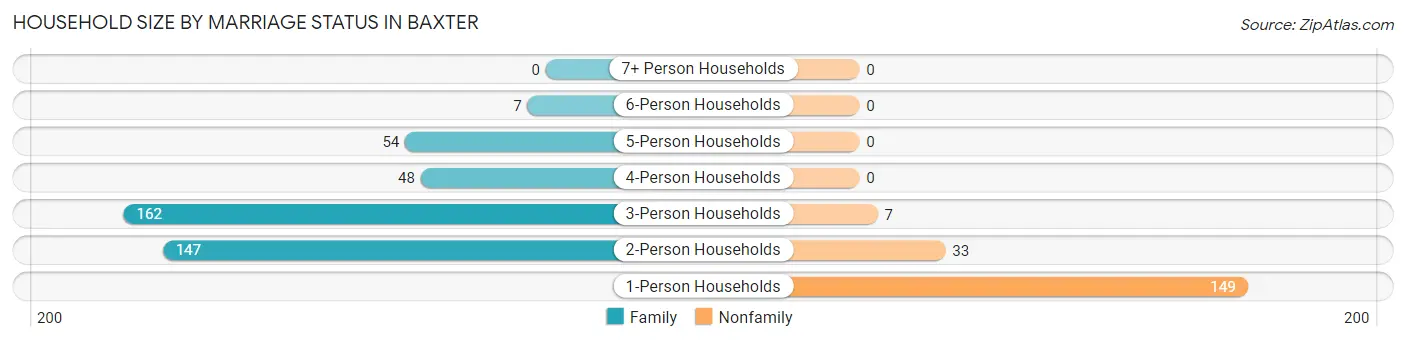
| Household Size | Family Households | Nonfamily Households |
| 1-Person Households | - | 149 (24.5%) |
| 2-Person Households | 147 (24.2%) | 33 (5.4%) |
| 3-Person Households | 162 (26.7%) | 7 (1.1%) |
| 4-Person Households | 48 (7.9%) | 0 (0.0%) |
| 5-Person Households | 54 (8.9%) | 0 (0.0%) |
| 6-Person Households | 7 (1.1%) | 0 (0.0%) |
| 7+ Person Households | 0 (0.0%) | 0 (0.0%) |
| Total | 418 (68.9%) | 189 (31.1%) |
Female Fertility in Baxter
Fertility by Age in Baxter
Average fertility rate in Baxter is 74.0 births per 1,000 women. Women in the age bracket of 15 to 19 years have the highest fertility rate with 200.0 births per 1,000 women. Women in the age bracket of 20 to 34 years acount for 48.1% of all women with births.
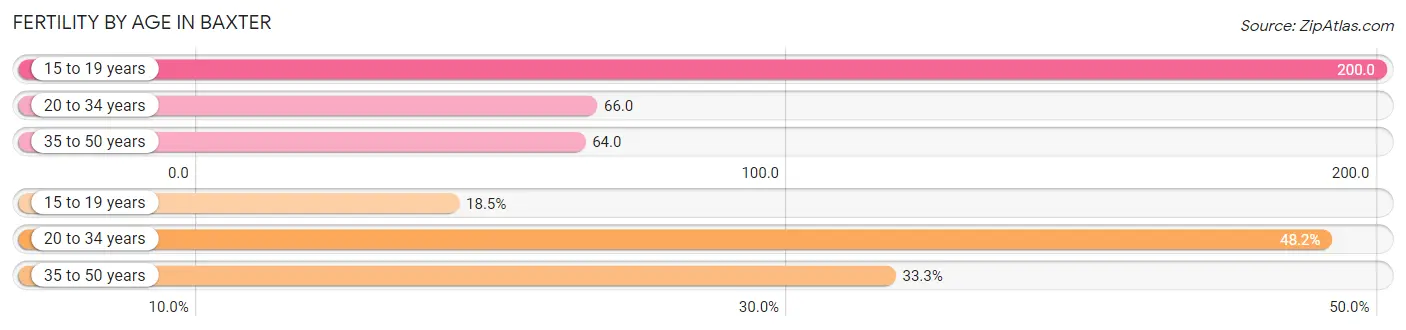
| Age Bracket | Women with Births | Births / 1,000 Women |
| 15 to 19 years | 5 (18.5%) | 200.0 |
| 20 to 34 years | 13 (48.1%) | 66.0 |
| 35 to 50 years | 9 (33.3%) | 64.0 |
| Total | 27 (100.0%) | 74.0 |
Fertility by Age by Marriage Status in Baxter
66.7% of women with births (27) in Baxter are married. The highest percentage of unmarried women with births falls into 15 to 19 years age bracket with 100.0% of them unmarried at the time of birth, while the lowest percentage of unmarried women with births belong to 35 to 50 years age bracket with 0.0% of them unmarried.
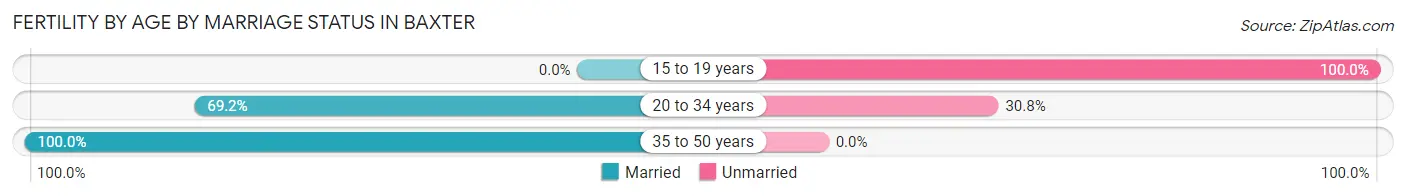
| Age Bracket | Married | Unmarried |
| 15 to 19 years | 0 (0.0%) | 5 (100.0%) |
| 20 to 34 years | 9 (69.2%) | 4 (30.8%) |
| 35 to 50 years | 9 (100.0%) | 0 (0.0%) |
| Total | 18 (66.7%) | 9 (33.3%) |
Fertility by Education in Baxter
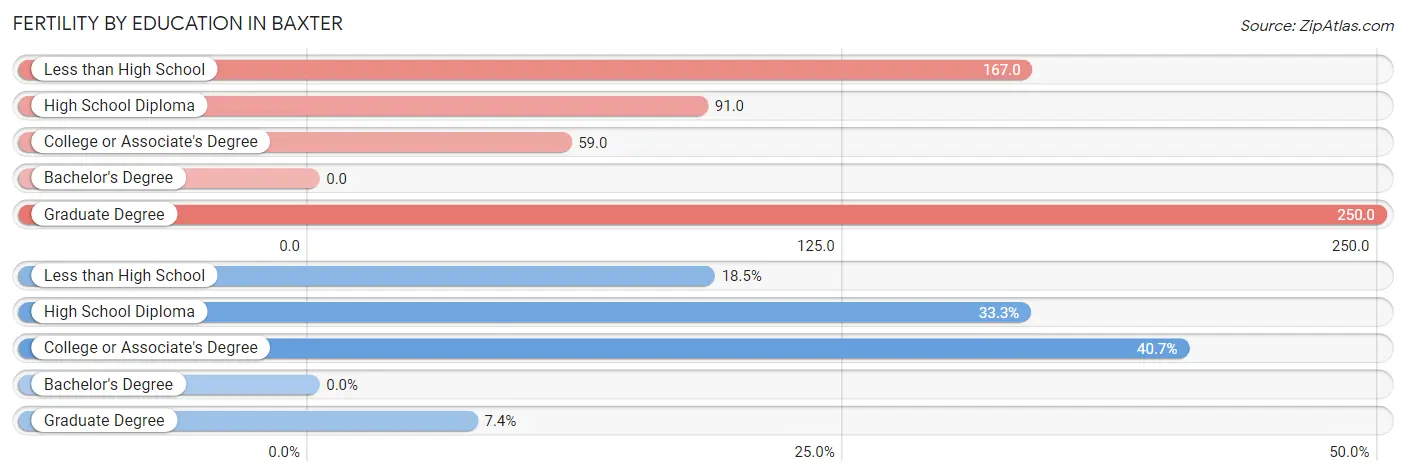
| Educational Attainment | Women with Births | Births / 1,000 Women |
| Less than High School | 5 (18.5%) | 167.0 |
| High School Diploma | 9 (33.3%) | 91.0 |
| College or Associate's Degree | 11 (40.7%) | 59.0 |
| Bachelor's Degree | 0 (0.0%) | 0.0 |
| Graduate Degree | 2 (7.4%) | 250.0 |
| Total | 27 (100.0%) | 74.0 |
Fertility by Education by Marriage Status in Baxter
33.3% of women with births in Baxter are unmarried. Women with the educational attainment of college or associate's degree are most likely to be married with 100.0% of them married at childbirth, while women with the educational attainment of less than high school are least likely to be married with 100.0% of them unmarried at childbirth.
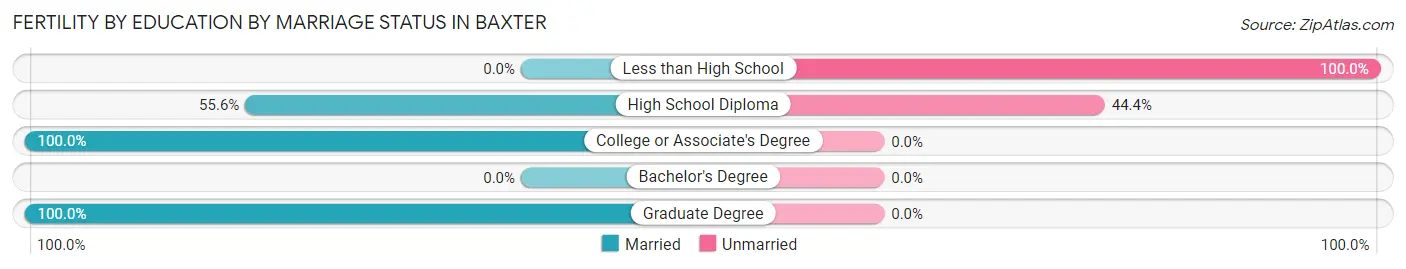
| Educational Attainment | Married | Unmarried |
| Less than High School | 0 (0.0%) | 5 (100.0%) |
| High School Diploma | 5 (55.6%) | 4 (44.4%) |
| College or Associate's Degree | 11 (100.0%) | 0 (0.0%) |
| Bachelor's Degree | 0 (0.0%) | 0 (0.0%) |
| Graduate Degree | 2 (100.0%) | 0 (0.0%) |
| Total | 18 (66.7%) | 9 (33.3%) |
Employment Characteristics in Baxter
Employment by Class of Employer in Baxter
Among the 625 employed individuals in Baxter, private company employees (428 | 68.5%), local government employees (74 | 11.8%), and self-employed (not incorporated) (52 | 8.3%) make up the most common classes of employment.
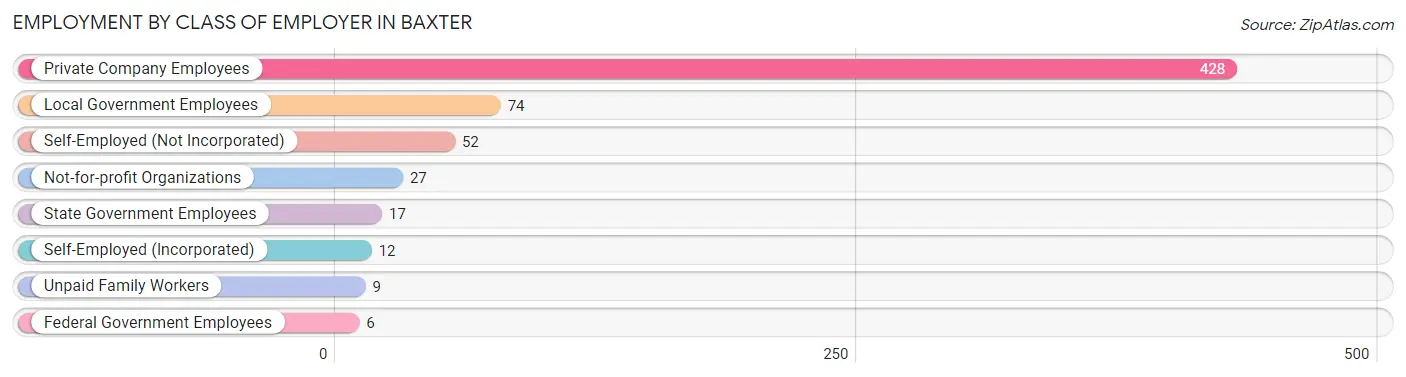
| Employer Class | # Employees | % Employees |
| Private Company Employees | 428 | 68.5% |
| Self-Employed (Incorporated) | 12 | 1.9% |
| Self-Employed (Not Incorporated) | 52 | 8.3% |
| Not-for-profit Organizations | 27 | 4.3% |
| Local Government Employees | 74 | 11.8% |
| State Government Employees | 17 | 2.7% |
| Federal Government Employees | 6 | 1.0% |
| Unpaid Family Workers | 9 | 1.4% |
| Total | 625 | 100.0% |
Employment Status by Age in Baxter
According to the labor force statistics for Baxter, out of the total population over 16 years of age (1,182), 54.8% or 648 individuals are in the labor force, with 1.2% or 8 of them unemployed. The age group with the highest labor force participation rate is 25 to 29 years, with 94.0% or 156 individuals in the labor force. Within the labor force, the 55 to 59 years age range has the highest percentage of unemployed individuals, with 8.8% or 3 of them being unemployed.
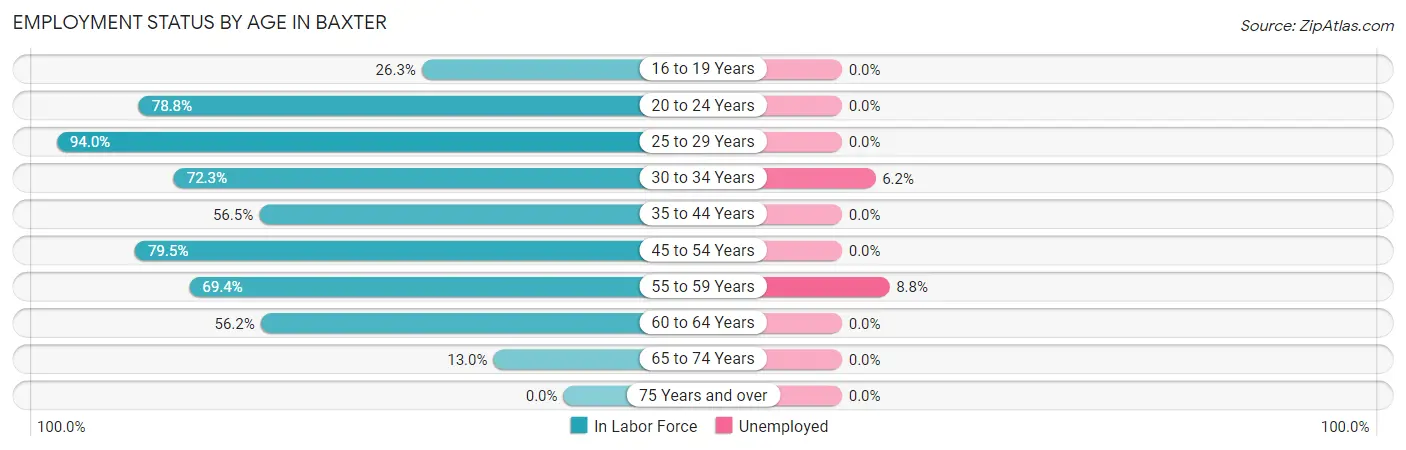
| Age Bracket | In Labor Force | Unemployed |
| 16 to 19 Years | 15 (26.3%) | 0 (0.0%) |
| 20 to 24 Years | 41 (78.8%) | 0 (0.0%) |
| 25 to 29 Years | 156 (94.0%) | 0 (0.0%) |
| 30 to 34 Years | 81 (72.3%) | 5 (6.2%) |
| 35 to 44 Years | 117 (56.5%) | 0 (0.0%) |
| 45 to 54 Years | 136 (79.5%) | 0 (0.0%) |
| 55 to 59 Years | 34 (69.4%) | 3 (8.8%) |
| 60 to 64 Years | 41 (56.2%) | 0 (0.0%) |
| 65 to 74 Years | 27 (13.0%) | 0 (0.0%) |
| 75 Years and over | 0 (0.0%) | 0 (0.0%) |
| Total | 648 (54.8%) | 8 (1.2%) |
Employment Status by Educational Attainment in Baxter
According to labor force statistics for Baxter, 72.6% of individuals (565) out of the total population between 25 and 64 years of age (778) are in the labor force, with 1.4% or 8 of them being unemployed. The group with the highest labor force participation rate are those with the educational attainment of bachelor's degree or higher, with 91.3% or 73 individuals in the labor force. Within the labor force, individuals with college / associate degree education have the highest percentage of unemployment, with 3.1% or 8 of them being unemployed.
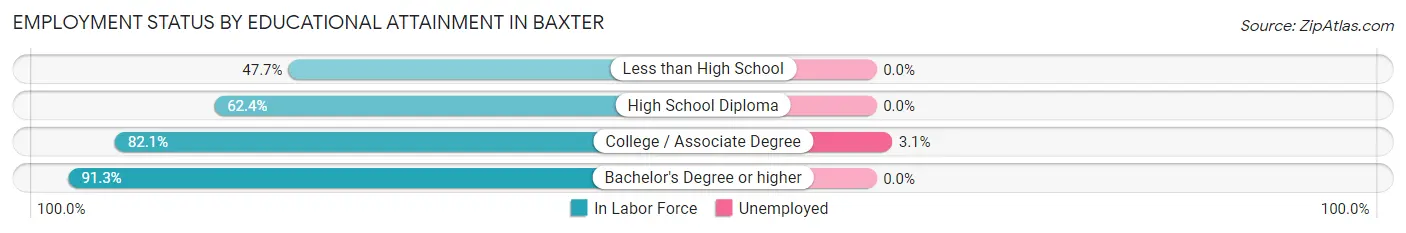
| Educational Attainment | In Labor Force | Unemployed |
| Less than High School | 21 (47.7%) | 0 (0.0%) |
| High School Diploma | 209 (62.4%) | 0 (0.0%) |
| College / Associate Degree | 262 (82.1%) | 10 (3.1%) |
| Bachelor's Degree or higher | 73 (91.3%) | 0 (0.0%) |
| Total | 565 (72.6%) | 11 (1.4%) |
Employment Occupations by Sex in Baxter
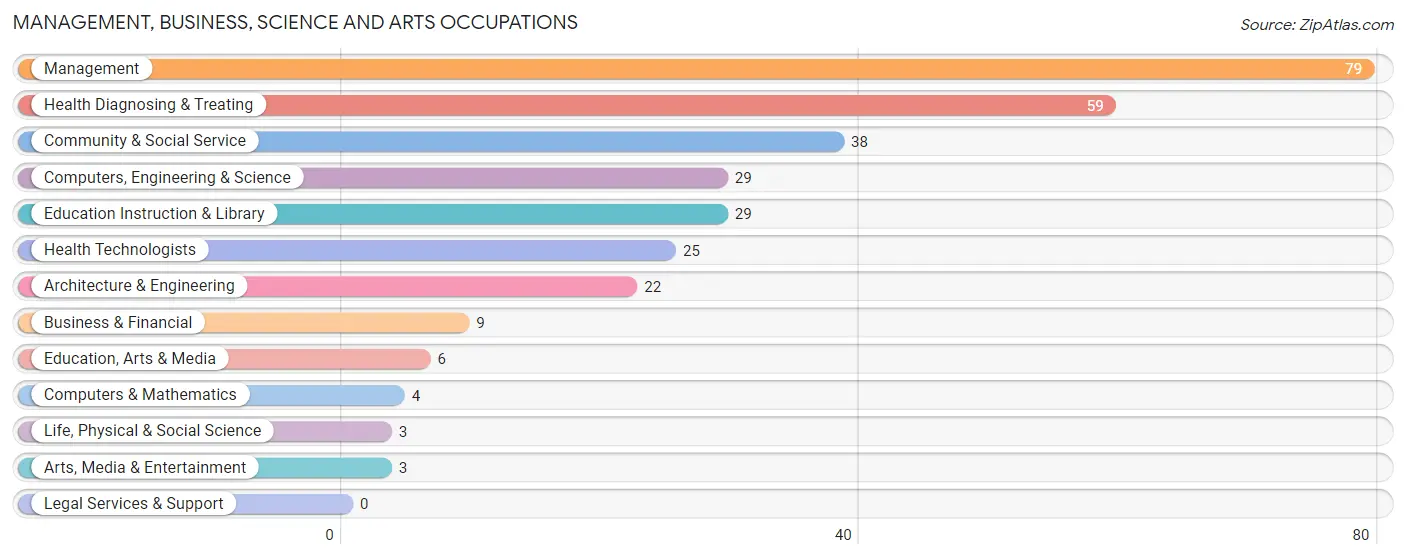
Management, Business, Science and Arts Occupations
The most common Management, Business, Science and Arts occupations in Baxter are Management (79 | 12.3%), Health Diagnosing & Treating (59 | 9.2%), Community & Social Service (38 | 5.9%), Computers, Engineering & Science (29 | 4.5%), and Education Instruction & Library (29 | 4.5%).
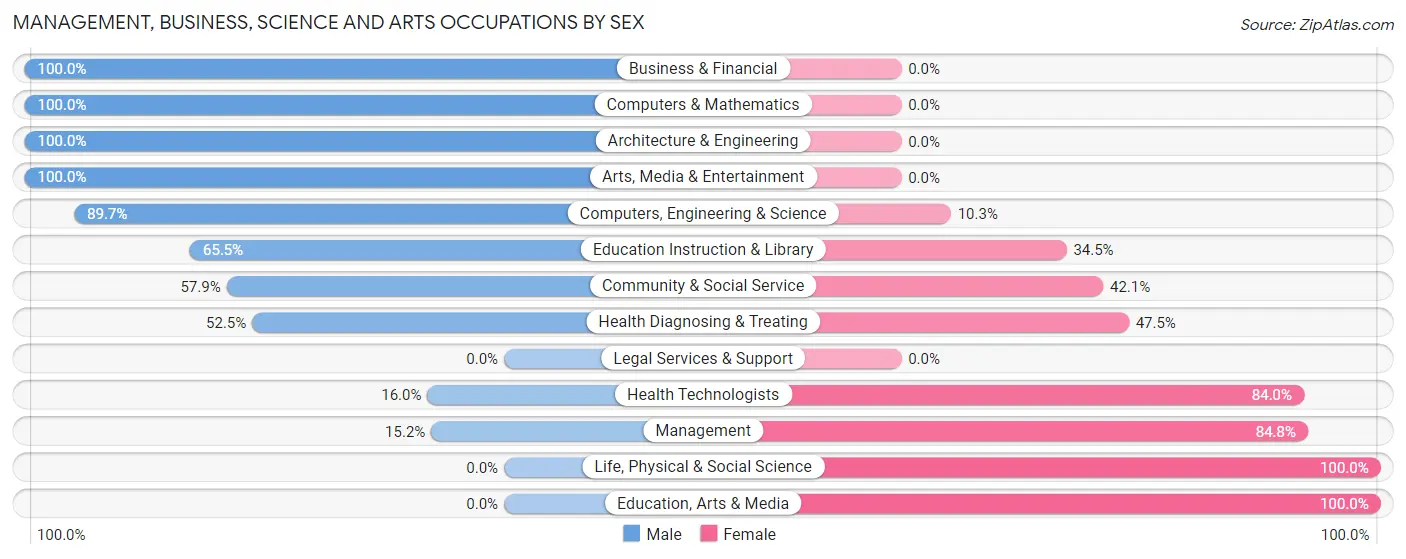
Management, Business, Science and Arts Occupations by Sex
Within the Management, Business, Science and Arts occupations in Baxter, the most male-oriented occupations are Business & Financial (100.0%), Computers & Mathematics (100.0%), and Architecture & Engineering (100.0%), while the most female-oriented occupations are Life, Physical & Social Science (100.0%), Education, Arts & Media (100.0%), and Management (84.8%).
| Occupation | Male | Female |
| Management | 12 (15.2%) | 67 (84.8%) |
| Business & Financial | 9 (100.0%) | 0 (0.0%) |
| Computers, Engineering & Science | 26 (89.7%) | 3 (10.3%) |
| Computers & Mathematics | 4 (100.0%) | 0 (0.0%) |
| Architecture & Engineering | 22 (100.0%) | 0 (0.0%) |
| Life, Physical & Social Science | 0 (0.0%) | 3 (100.0%) |
| Community & Social Service | 22 (57.9%) | 16 (42.1%) |
| Education, Arts & Media | 0 (0.0%) | 6 (100.0%) |
| Legal Services & Support | 0 (0.0%) | 0 (0.0%) |
| Education Instruction & Library | 19 (65.5%) | 10 (34.5%) |
| Arts, Media & Entertainment | 3 (100.0%) | 0 (0.0%) |
| Health Diagnosing & Treating | 31 (52.5%) | 28 (47.5%) |
| Health Technologists | 4 (16.0%) | 21 (84.0%) |
| Total (Category) | 100 (46.7%) | 114 (53.3%) |
| Total (Overall) | 313 (48.9%) | 327 (51.1%) |
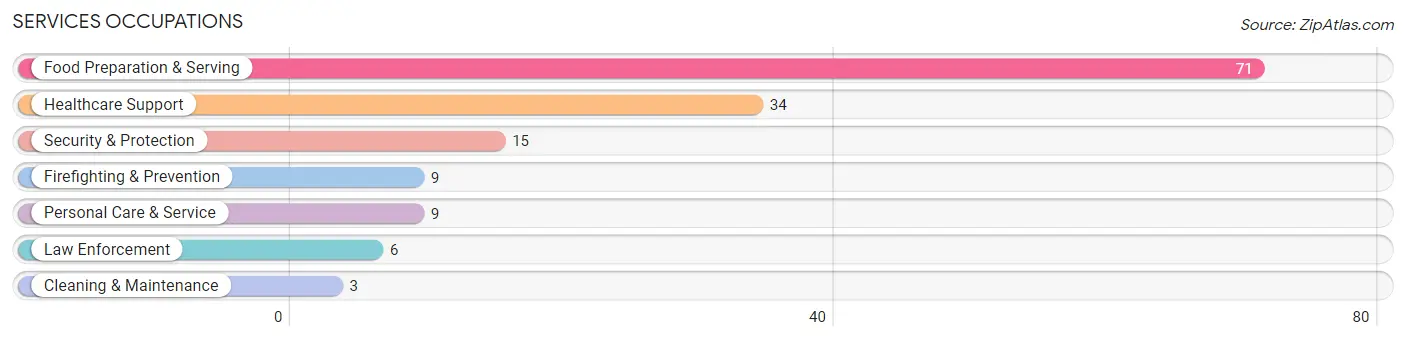
Services Occupations
The most common Services occupations in Baxter are Food Preparation & Serving (71 | 11.1%), Healthcare Support (34 | 5.3%), Security & Protection (15 | 2.3%), Firefighting & Prevention (9 | 1.4%), and Personal Care & Service (9 | 1.4%).
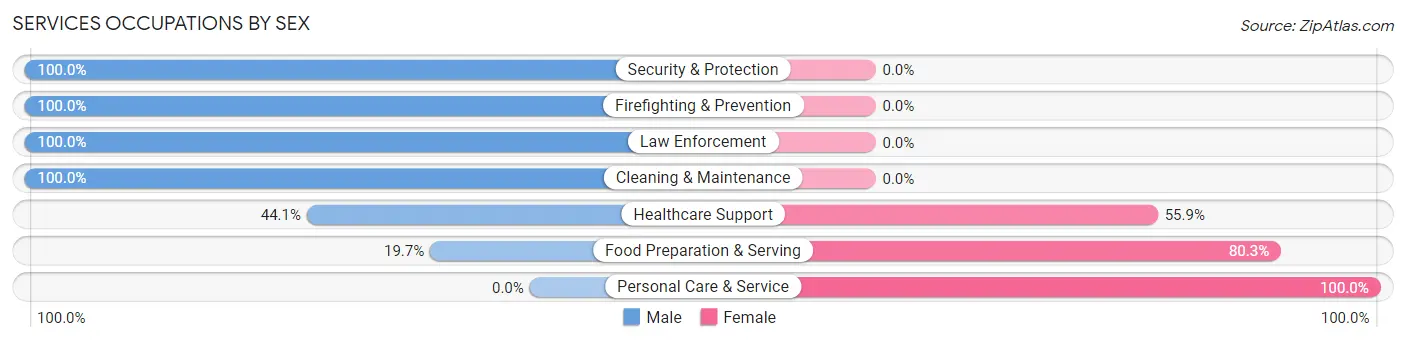
Services Occupations by Sex
Within the Services occupations in Baxter, the most male-oriented occupations are Security & Protection (100.0%), Firefighting & Prevention (100.0%), and Law Enforcement (100.0%), while the most female-oriented occupations are Personal Care & Service (100.0%), Food Preparation & Serving (80.3%), and Healthcare Support (55.9%).
| Occupation | Male | Female |
| Healthcare Support | 15 (44.1%) | 19 (55.9%) |
| Security & Protection | 15 (100.0%) | 0 (0.0%) |
| Firefighting & Prevention | 9 (100.0%) | 0 (0.0%) |
| Law Enforcement | 6 (100.0%) | 0 (0.0%) |
| Food Preparation & Serving | 14 (19.7%) | 57 (80.3%) |
| Cleaning & Maintenance | 3 (100.0%) | 0 (0.0%) |
| Personal Care & Service | 0 (0.0%) | 9 (100.0%) |
| Total (Category) | 47 (35.6%) | 85 (64.4%) |
| Total (Overall) | 313 (48.9%) | 327 (51.1%) |
Sales and Office Occupations
The most common Sales and Office occupations in Baxter are Sales & Related (78 | 12.2%), and Office & Administration (46 | 7.2%).
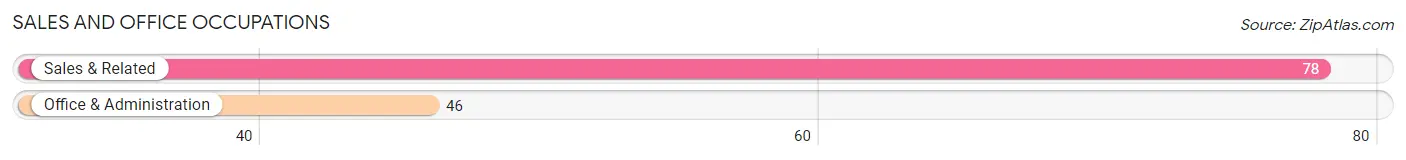
Sales and Office Occupations by Sex
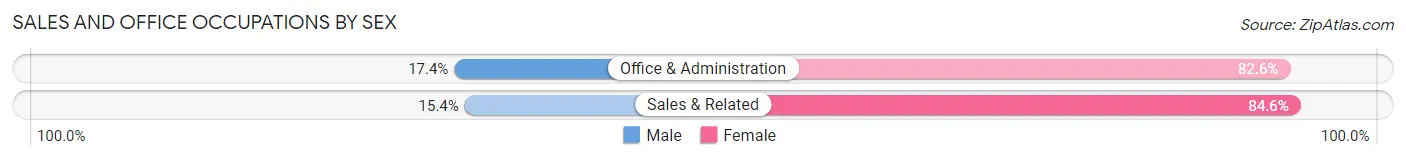
| Occupation | Male | Female |
| Sales & Related | 12 (15.4%) | 66 (84.6%) |
| Office & Administration | 8 (17.4%) | 38 (82.6%) |
| Total (Category) | 20 (16.1%) | 104 (83.9%) |
| Total (Overall) | 313 (48.9%) | 327 (51.1%) |
Natural Resources, Construction and Maintenance Occupations
The most common Natural Resources, Construction and Maintenance occupations in Baxter are , and Construction & Extraction (53 | 8.3%).
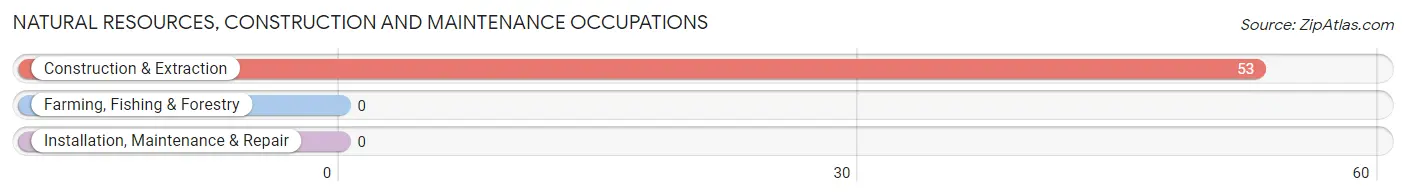
Natural Resources, Construction and Maintenance Occupations by Sex
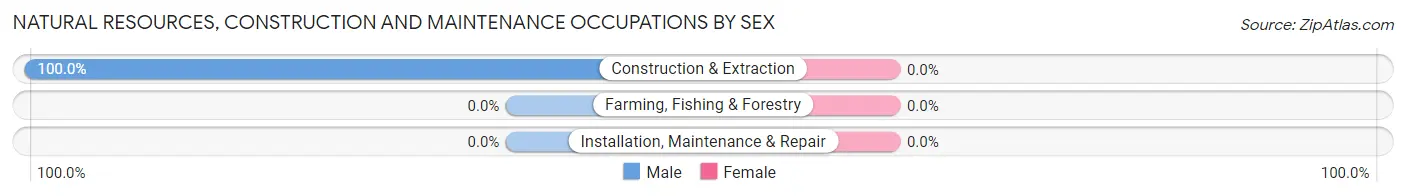
| Occupation | Male | Female |
| Farming, Fishing & Forestry | 0 (0.0%) | 0 (0.0%) |
| Construction & Extraction | 53 (100.0%) | 0 (0.0%) |
| Installation, Maintenance & Repair | 0 (0.0%) | 0 (0.0%) |
| Total (Category) | 53 (100.0%) | 0 (0.0%) |
| Total (Overall) | 313 (48.9%) | 327 (51.1%) |
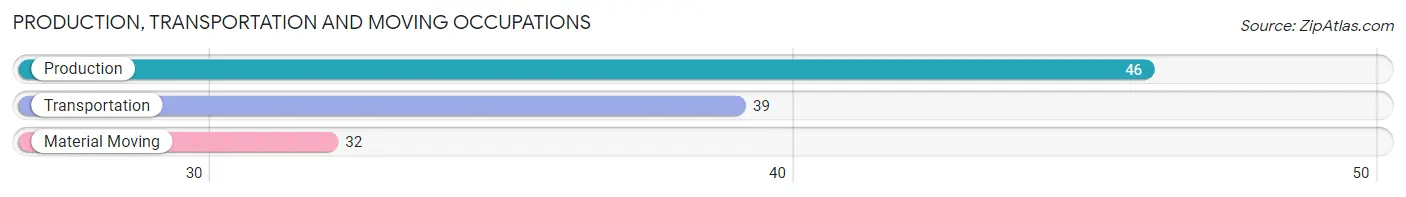
Production, Transportation and Moving Occupations
The most common Production, Transportation and Moving occupations in Baxter are Production (46 | 7.2%), Transportation (39 | 6.1%), and Material Moving (32 | 5.0%).
Production, Transportation and Moving Occupations by Sex
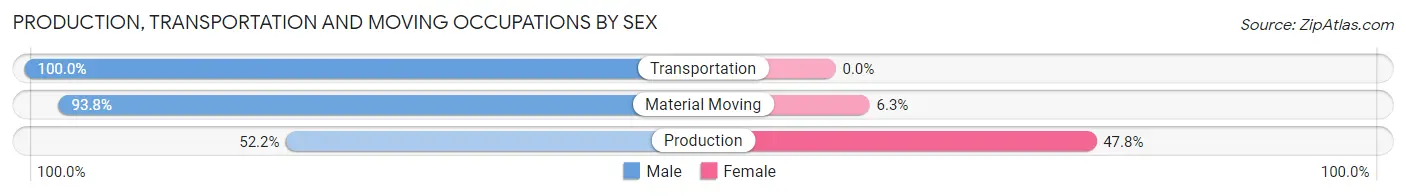
| Occupation | Male | Female |
| Production | 24 (52.2%) | 22 (47.8%) |
| Transportation | 39 (100.0%) | 0 (0.0%) |
| Material Moving | 30 (93.8%) | 2 (6.2%) |
| Total (Category) | 93 (79.5%) | 24 (20.5%) |
| Total (Overall) | 313 (48.9%) | 327 (51.1%) |
Employment Industries by Sex in Baxter
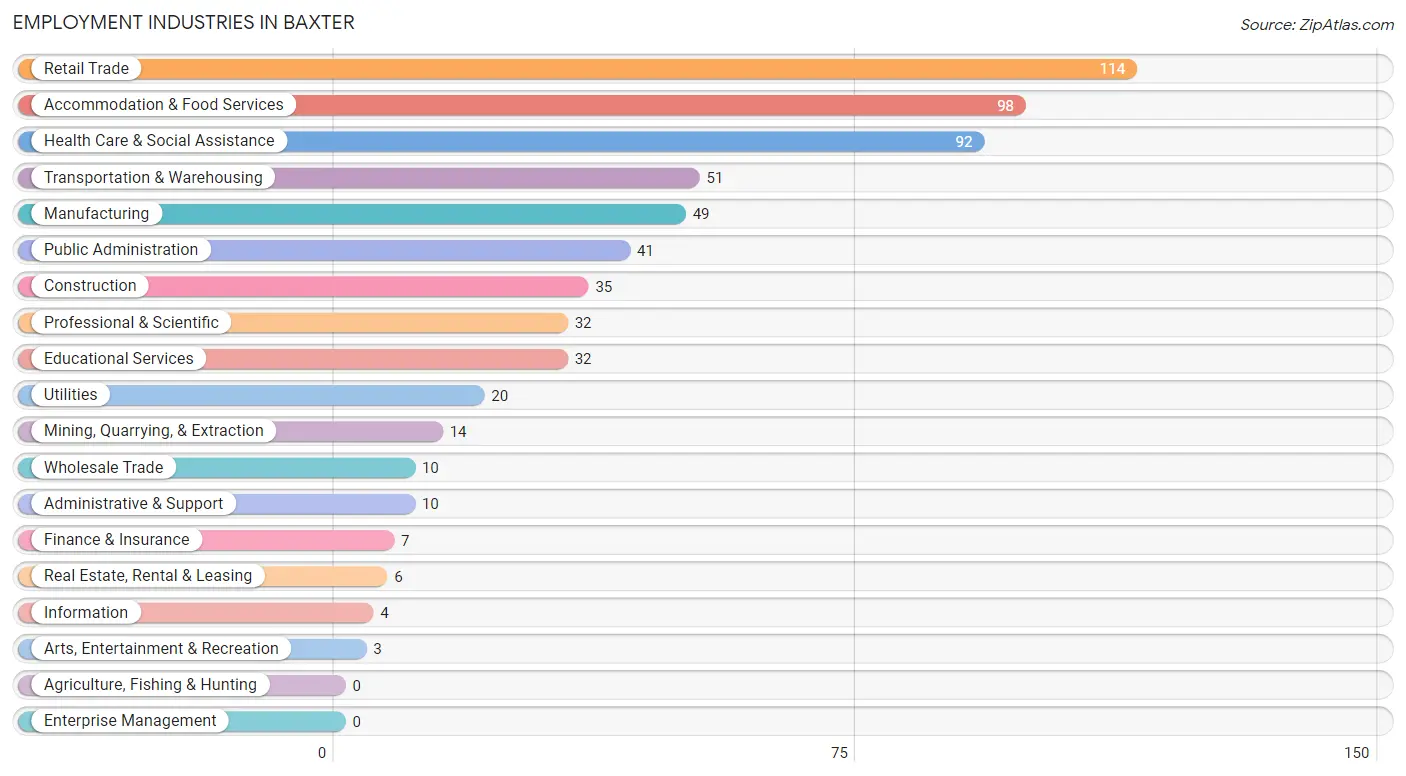
Employment Industries in Baxter
The major employment industries in Baxter include Retail Trade (114 | 17.8%), Accommodation & Food Services (98 | 15.3%), Health Care & Social Assistance (92 | 14.4%), Transportation & Warehousing (51 | 8.0%), and Manufacturing (49 | 7.7%).
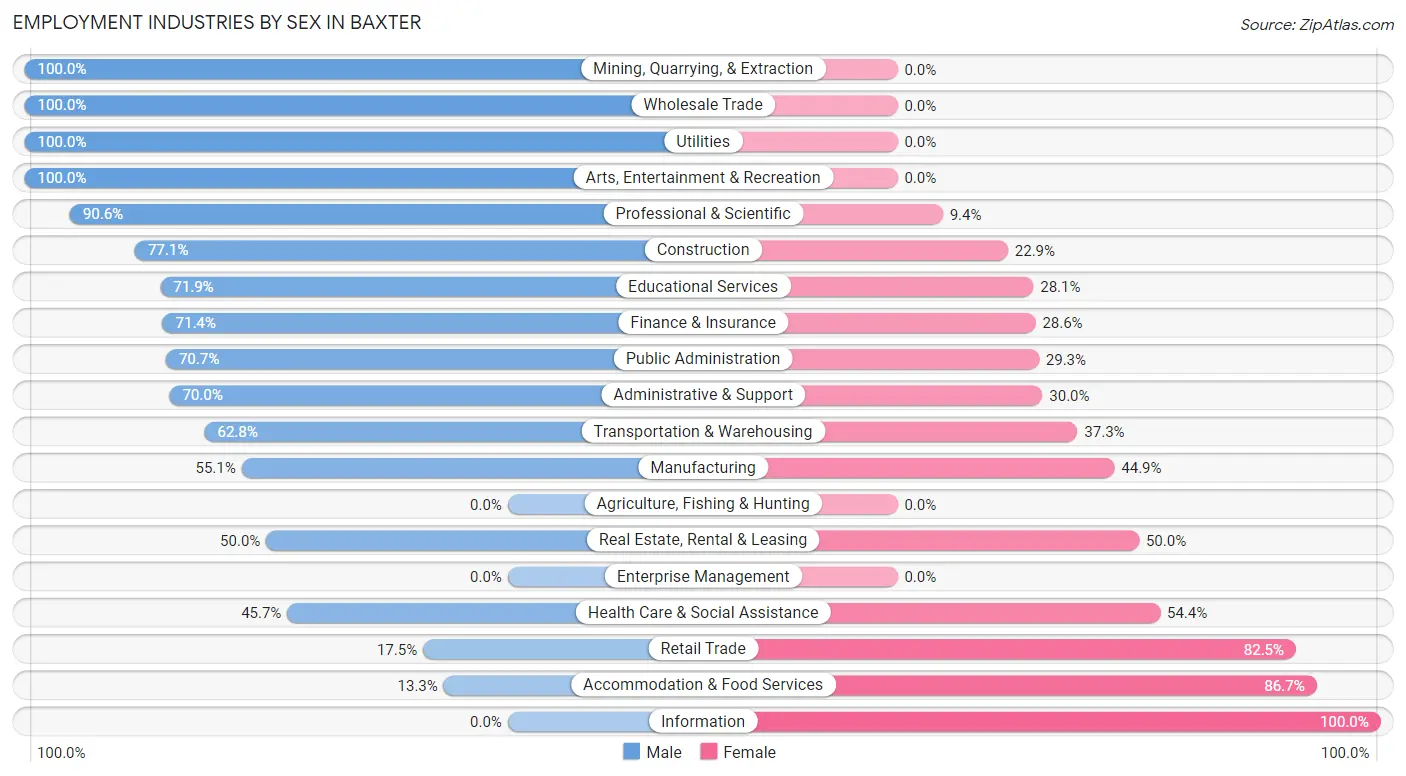
Employment Industries by Sex in Baxter
The Baxter industries that see more men than women are Mining, Quarrying, & Extraction (100.0%), Wholesale Trade (100.0%), and Utilities (100.0%), whereas the industries that tend to have a higher number of women are Information (100.0%), Accommodation & Food Services (86.7%), and Retail Trade (82.5%).
| Industry | Male | Female |
| Agriculture, Fishing & Hunting | 0 (0.0%) | 0 (0.0%) |
| Mining, Quarrying, & Extraction | 14 (100.0%) | 0 (0.0%) |
| Construction | 27 (77.1%) | 8 (22.9%) |
| Manufacturing | 27 (55.1%) | 22 (44.9%) |
| Wholesale Trade | 10 (100.0%) | 0 (0.0%) |
| Retail Trade | 20 (17.5%) | 94 (82.5%) |
| Transportation & Warehousing | 32 (62.7%) | 19 (37.2%) |
| Utilities | 20 (100.0%) | 0 (0.0%) |
| Information | 0 (0.0%) | 4 (100.0%) |
| Finance & Insurance | 5 (71.4%) | 2 (28.6%) |
| Real Estate, Rental & Leasing | 3 (50.0%) | 3 (50.0%) |
| Professional & Scientific | 29 (90.6%) | 3 (9.4%) |
| Enterprise Management | 0 (0.0%) | 0 (0.0%) |
| Administrative & Support | 7 (70.0%) | 3 (30.0%) |
| Educational Services | 23 (71.9%) | 9 (28.1%) |
| Health Care & Social Assistance | 42 (45.7%) | 50 (54.3%) |
| Arts, Entertainment & Recreation | 3 (100.0%) | 0 (0.0%) |
| Accommodation & Food Services | 13 (13.3%) | 85 (86.7%) |
| Public Administration | 29 (70.7%) | 12 (29.3%) |
| Total | 313 (48.9%) | 327 (51.1%) |
Education in Baxter
School Enrollment in Baxter
The most common levels of schooling among the 263 students in Baxter are elementary school (109 | 41.4%), high school (60 | 22.8%), and middle school (42 | 16.0%).
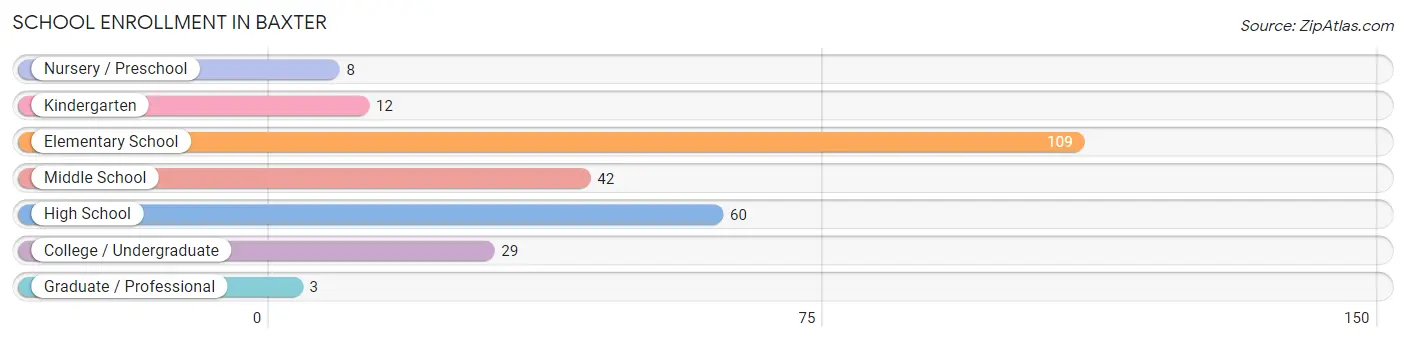
| School Level | # Students | % Students |
| Nursery / Preschool | 8 | 3.0% |
| Kindergarten | 12 | 4.6% |
| Elementary School | 109 | 41.4% |
| Middle School | 42 | 16.0% |
| High School | 60 | 22.8% |
| College / Undergraduate | 29 | 11.0% |
| Graduate / Professional | 3 | 1.1% |
| Total | 263 | 100.0% |
School Enrollment by Age by Funding Source in Baxter
Out of a total of 263 students who are enrolled in schools in Baxter, 24 (9.1%) attend a private institution, while the remaining 239 (90.9%) are enrolled in public schools. The age group of 20 to 24 year olds has the highest likelihood of being enrolled in private schools, with 17 (89.5% in the age bracket) enrolled. Conversely, the age group of 3 to 4 year olds has the lowest likelihood of being enrolled in a private school, with 12 (100.0% in the age bracket) attending a public institution.
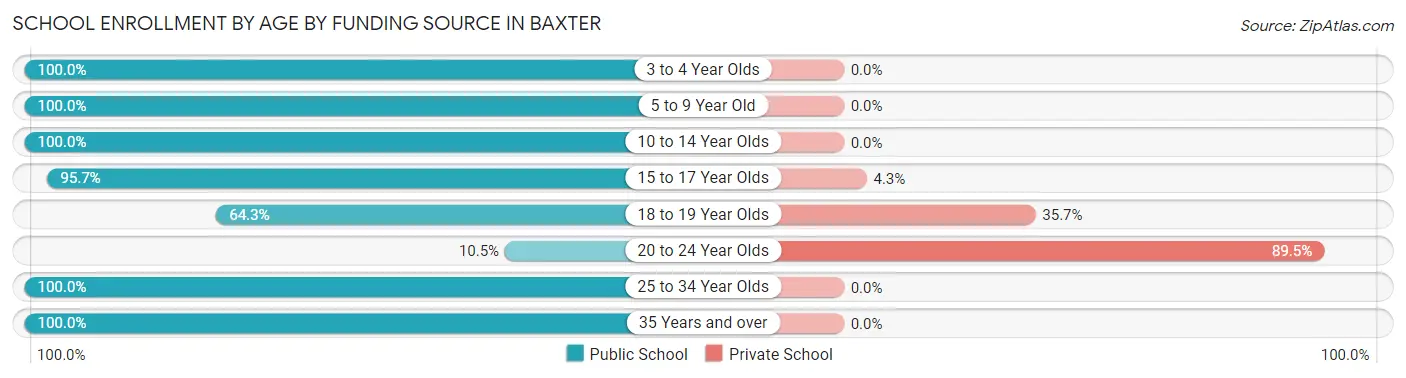
| Age Bracket | Public School | Private School |
| 3 to 4 Year Olds | 12 (100.0%) | 0 (0.0%) |
| 5 to 9 Year Old | 101 (100.0%) | 0 (0.0%) |
| 10 to 14 Year Olds | 59 (100.0%) | 0 (0.0%) |
| 15 to 17 Year Olds | 45 (95.7%) | 2 (4.3%) |
| 18 to 19 Year Olds | 9 (64.3%) | 5 (35.7%) |
| 20 to 24 Year Olds | 2 (10.5%) | 17 (89.5%) |
| 25 to 34 Year Olds | 8 (100.0%) | 0 (0.0%) |
| 35 Years and over | 3 (100.0%) | 0 (0.0%) |
| Total | 239 (90.9%) | 24 (9.1%) |
Educational Attainment by Field of Study in Baxter
Education (31 | 29.5%), psychology (20 | 19.1%), arts & humanities (14 | 13.3%), science & technology (8 | 7.6%), and multidisciplinary studies (7 | 6.7%) are the most common fields of study among 105 individuals in Baxter who have obtained a bachelor's degree or higher.
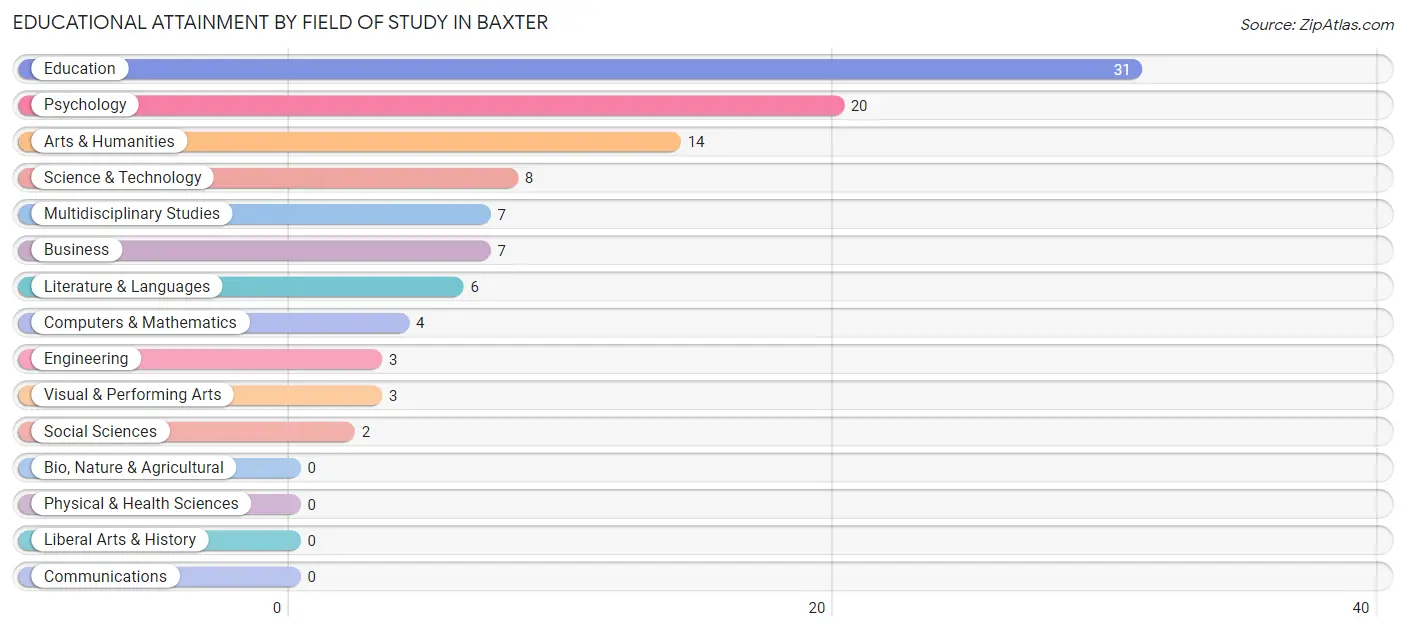
| Field of Study | # Graduates | % Graduates |
| Computers & Mathematics | 4 | 3.8% |
| Bio, Nature & Agricultural | 0 | 0.0% |
| Physical & Health Sciences | 0 | 0.0% |
| Psychology | 20 | 19.1% |
| Social Sciences | 2 | 1.9% |
| Engineering | 3 | 2.9% |
| Multidisciplinary Studies | 7 | 6.7% |
| Science & Technology | 8 | 7.6% |
| Business | 7 | 6.7% |
| Education | 31 | 29.5% |
| Literature & Languages | 6 | 5.7% |
| Liberal Arts & History | 0 | 0.0% |
| Visual & Performing Arts | 3 | 2.9% |
| Communications | 0 | 0.0% |
| Arts & Humanities | 14 | 13.3% |
| Total | 105 | 100.0% |
Transportation & Commute in Baxter
Vehicle Availability by Sex in Baxter
The most prevalent vehicle ownership categories in Baxter are males with 2 vehicles (151, accounting for 50.7%) and females with 2 vehicles (193, making up 46.2%).
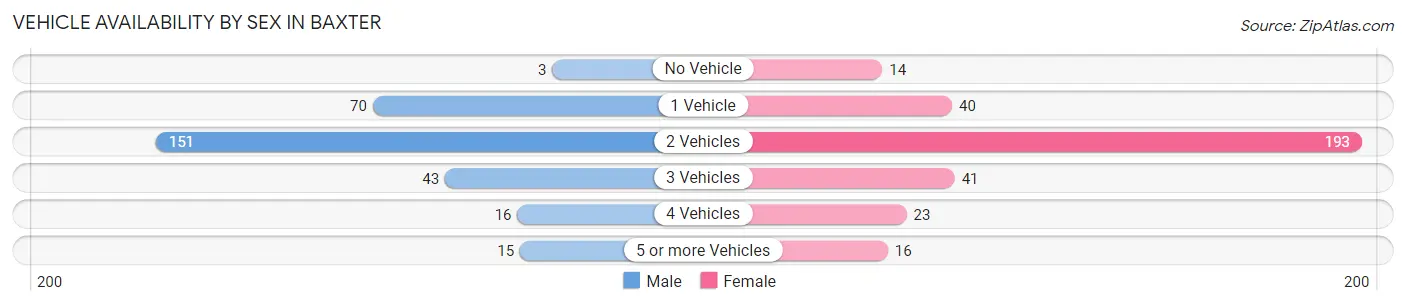
| Vehicles Available | Male | Female |
| No Vehicle | 3 (1.0%) | 14 (4.3%) |
| 1 Vehicle | 70 (23.5%) | 40 (12.2%) |
| 2 Vehicles | 151 (50.7%) | 193 (59.0%) |
| 3 Vehicles | 43 (14.4%) | 41 (12.5%) |
| 4 Vehicles | 16 (5.4%) | 23 (7.0%) |
| 5 or more Vehicles | 15 (5.0%) | 16 (4.9%) |
| Total | 298 (100.0%) | 327 (100.0%) |
Commute Time in Baxter
The most frequently occuring commute durations in Baxter are 15 to 19 minutes (136 commuters, 24.6%), 10 to 14 minutes (117 commuters, 21.2%), and 20 to 24 minutes (111 commuters, 20.1%).
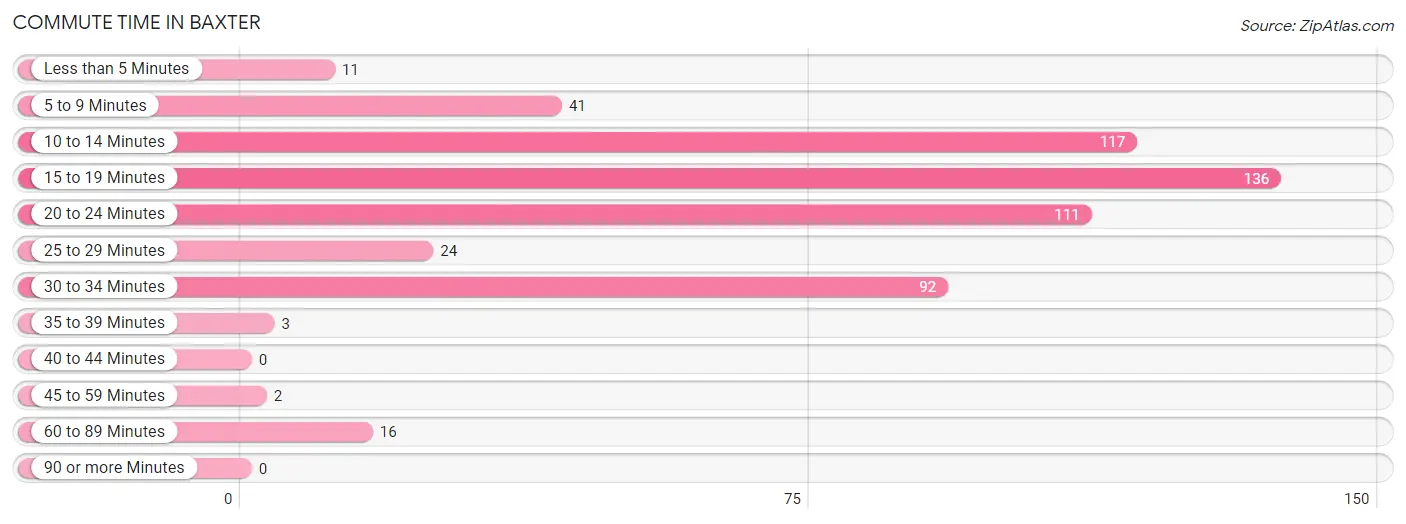
| Commute Time | # Commuters | % Commuters |
| Less than 5 Minutes | 11 | 2.0% |
| 5 to 9 Minutes | 41 | 7.4% |
| 10 to 14 Minutes | 117 | 21.2% |
| 15 to 19 Minutes | 136 | 24.6% |
| 20 to 24 Minutes | 111 | 20.1% |
| 25 to 29 Minutes | 24 | 4.3% |
| 30 to 34 Minutes | 92 | 16.6% |
| 35 to 39 Minutes | 3 | 0.5% |
| 40 to 44 Minutes | 0 | 0.0% |
| 45 to 59 Minutes | 2 | 0.4% |
| 60 to 89 Minutes | 16 | 2.9% |
| 90 or more Minutes | 0 | 0.0% |
Commute Time by Sex in Baxter
The most common commute times in Baxter are 30 to 34 minutes (64 commuters, 25.4%) for males and 15 to 19 minutes (104 commuters, 34.5%) for females.
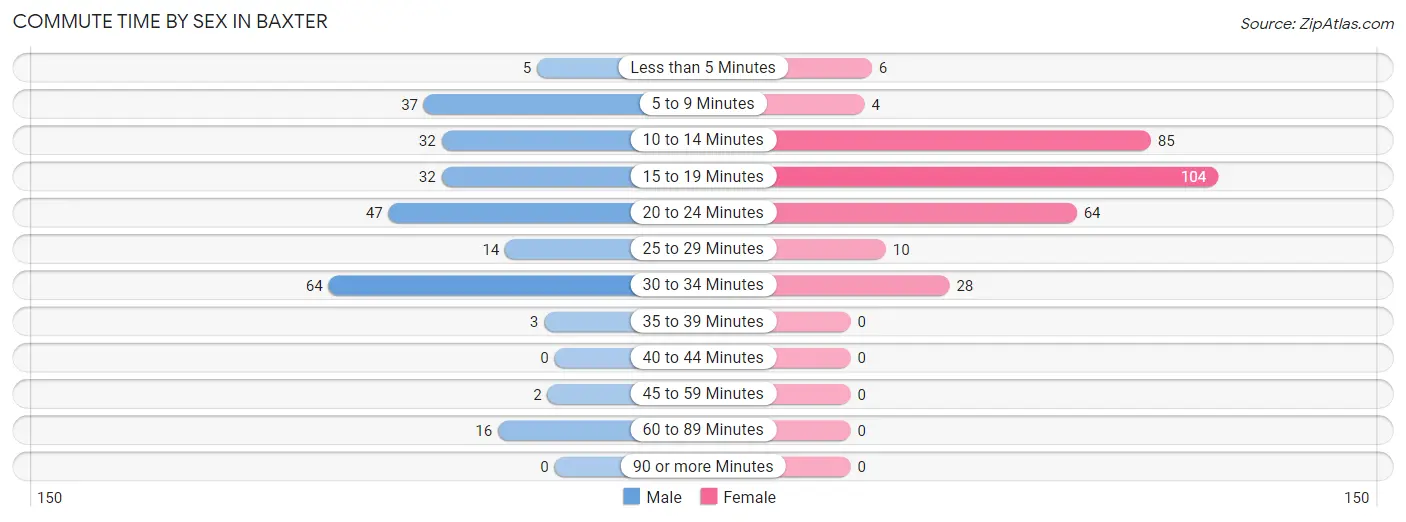
| Commute Time | Male | Female |
| Less than 5 Minutes | 5 (2.0%) | 6 (2.0%) |
| 5 to 9 Minutes | 37 (14.7%) | 4 (1.3%) |
| 10 to 14 Minutes | 32 (12.7%) | 85 (28.2%) |
| 15 to 19 Minutes | 32 (12.7%) | 104 (34.5%) |
| 20 to 24 Minutes | 47 (18.6%) | 64 (21.3%) |
| 25 to 29 Minutes | 14 (5.6%) | 10 (3.3%) |
| 30 to 34 Minutes | 64 (25.4%) | 28 (9.3%) |
| 35 to 39 Minutes | 3 (1.2%) | 0 (0.0%) |
| 40 to 44 Minutes | 0 (0.0%) | 0 (0.0%) |
| 45 to 59 Minutes | 2 (0.8%) | 0 (0.0%) |
| 60 to 89 Minutes | 16 (6.4%) | 0 (0.0%) |
| 90 or more Minutes | 0 (0.0%) | 0 (0.0%) |
Time of Departure to Work by Sex in Baxter
The most frequent times of departure to work in Baxter are 6:00 AM to 6:29 AM (51, 20.2%) for males and 5:30 AM to 5:59 AM (95, 31.6%) for females.
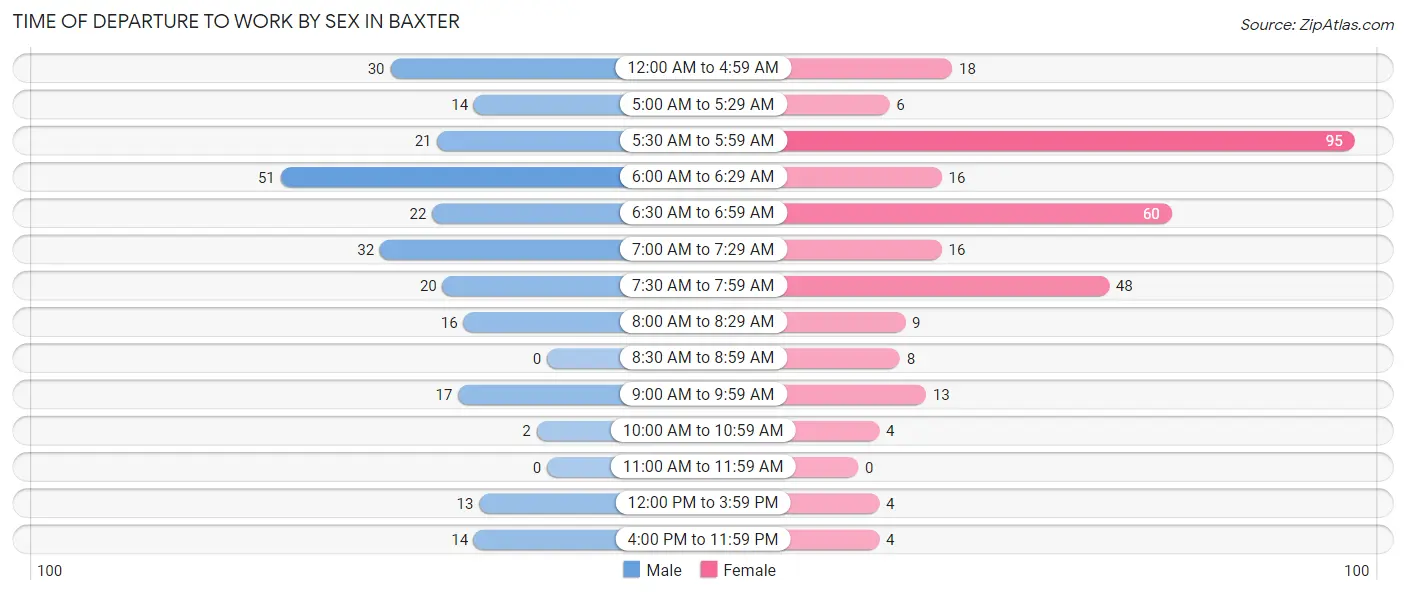
| Time of Departure | Male | Female |
| 12:00 AM to 4:59 AM | 30 (11.9%) | 18 (6.0%) |
| 5:00 AM to 5:29 AM | 14 (5.6%) | 6 (2.0%) |
| 5:30 AM to 5:59 AM | 21 (8.3%) | 95 (31.6%) |
| 6:00 AM to 6:29 AM | 51 (20.2%) | 16 (5.3%) |
| 6:30 AM to 6:59 AM | 22 (8.7%) | 60 (19.9%) |
| 7:00 AM to 7:29 AM | 32 (12.7%) | 16 (5.3%) |
| 7:30 AM to 7:59 AM | 20 (7.9%) | 48 (16.0%) |
| 8:00 AM to 8:29 AM | 16 (6.4%) | 9 (3.0%) |
| 8:30 AM to 8:59 AM | 0 (0.0%) | 8 (2.7%) |
| 9:00 AM to 9:59 AM | 17 (6.8%) | 13 (4.3%) |
| 10:00 AM to 10:59 AM | 2 (0.8%) | 4 (1.3%) |
| 11:00 AM to 11:59 AM | 0 (0.0%) | 0 (0.0%) |
| 12:00 PM to 3:59 PM | 13 (5.2%) | 4 (1.3%) |
| 4:00 PM to 11:59 PM | 14 (5.6%) | 4 (1.3%) |
| Total | 252 (100.0%) | 301 (100.0%) |
Housing Occupancy in Baxter
Occupancy by Ownership in Baxter
Of the total 607 dwellings in Baxter, owner-occupied units account for 435 (71.7%), while renter-occupied units make up 172 (28.3%).
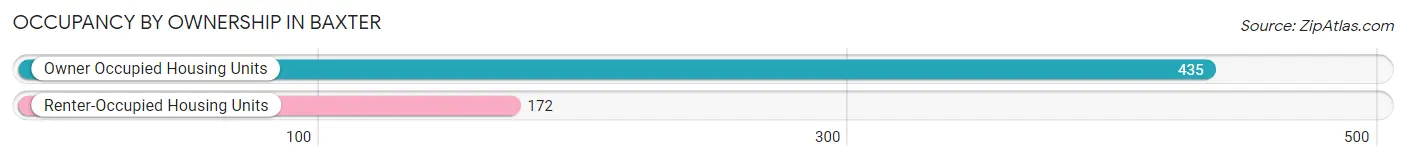
| Occupancy | # Housing Units | % Housing Units |
| Owner Occupied Housing Units | 435 | 71.7% |
| Renter-Occupied Housing Units | 172 | 28.3% |
| Total Occupied Housing Units | 607 | 100.0% |
Occupancy by Household Size in Baxter
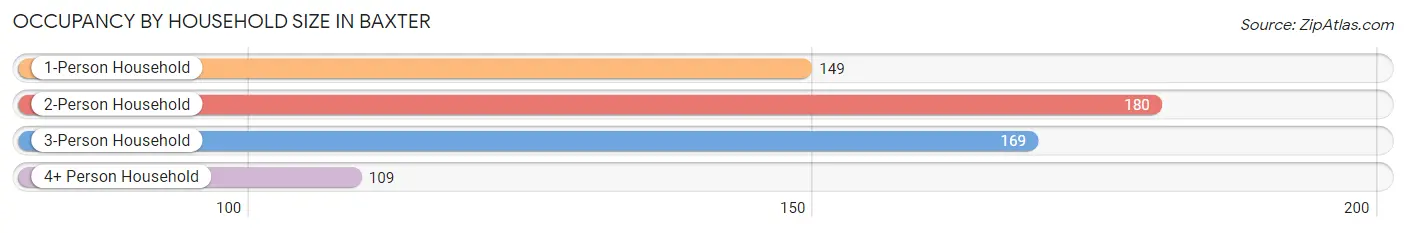
| Household Size | # Housing Units | % Housing Units |
| 1-Person Household | 149 | 24.5% |
| 2-Person Household | 180 | 29.6% |
| 3-Person Household | 169 | 27.8% |
| 4+ Person Household | 109 | 18.0% |
| Total Housing Units | 607 | 100.0% |
Occupancy by Ownership by Household Size in Baxter
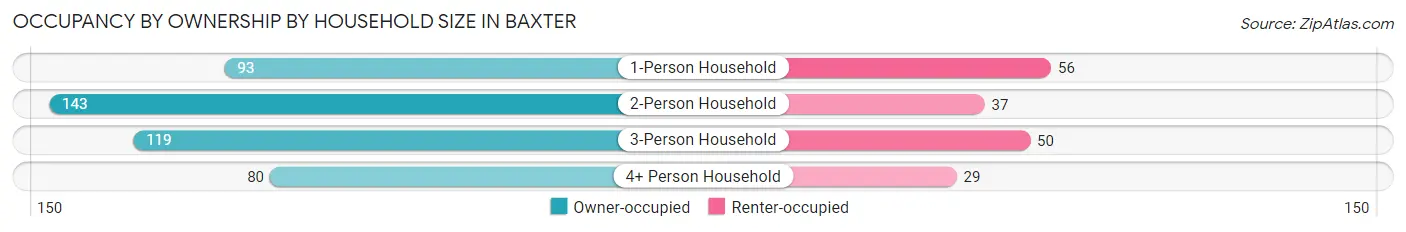
| Household Size | Owner-occupied | Renter-occupied |
| 1-Person Household | 93 (62.4%) | 56 (37.6%) |
| 2-Person Household | 143 (79.4%) | 37 (20.6%) |
| 3-Person Household | 119 (70.4%) | 50 (29.6%) |
| 4+ Person Household | 80 (73.4%) | 29 (26.6%) |
| Total Housing Units | 435 (71.7%) | 172 (28.3%) |
Occupancy by Educational Attainment in Baxter
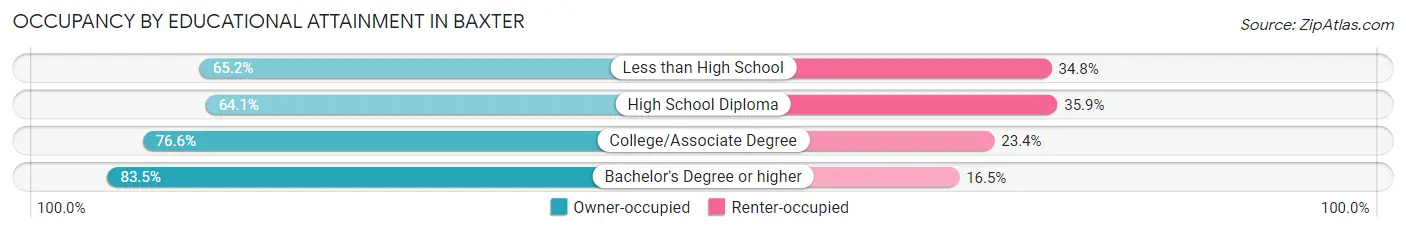
| Household Size | Owner-occupied | Renter-occupied |
| Less than High School | 45 (65.2%) | 24 (34.8%) |
| High School Diploma | 141 (64.1%) | 79 (35.9%) |
| College/Associate Degree | 183 (76.6%) | 56 (23.4%) |
| Bachelor's Degree or higher | 66 (83.5%) | 13 (16.5%) |
Occupancy by Age of Householder in Baxter
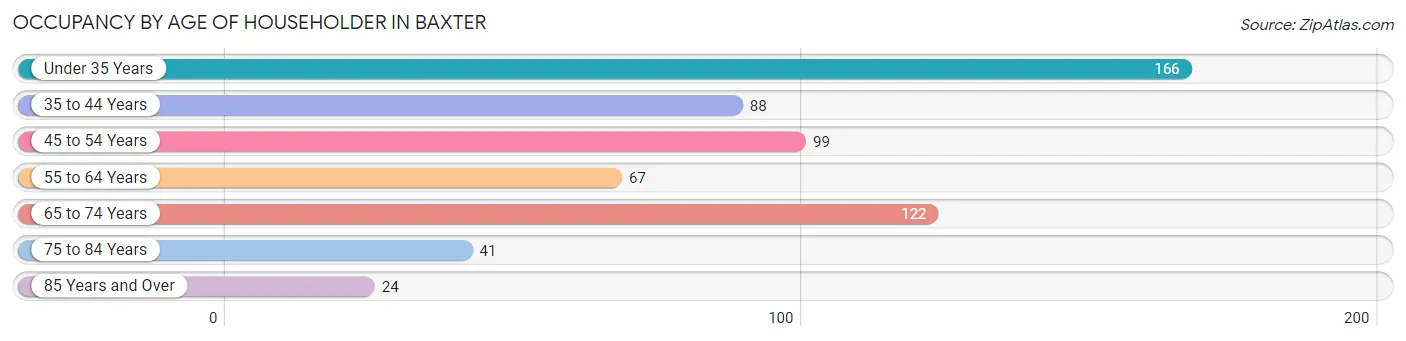
| Age Bracket | # Households | % Households |
| Under 35 Years | 166 | 27.4% |
| 35 to 44 Years | 88 | 14.5% |
| 45 to 54 Years | 99 | 16.3% |
| 55 to 64 Years | 67 | 11.0% |
| 65 to 74 Years | 122 | 20.1% |
| 75 to 84 Years | 41 | 6.8% |
| 85 Years and Over | 24 | 4.0% |
| Total | 607 | 100.0% |
Housing Finances in Baxter
Median Income by Occupancy in Baxter
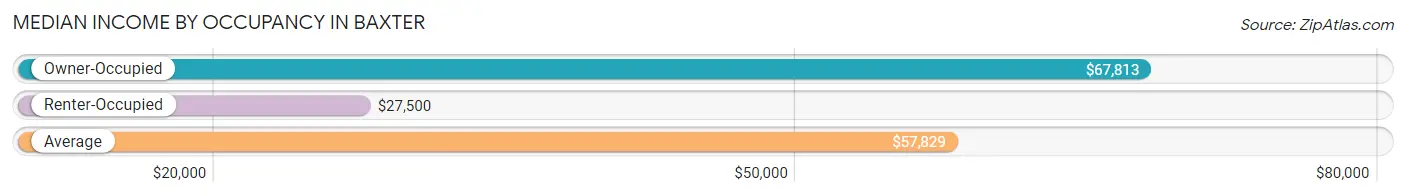
| Occupancy Type | # Households | Median Income |
| Owner-Occupied | 435 (71.7%) | $67,813 |
| Renter-Occupied | 172 (28.3%) | $27,500 |
| Average | 607 (100.0%) | $57,829 |
Occupancy by Householder Income Bracket in Baxter
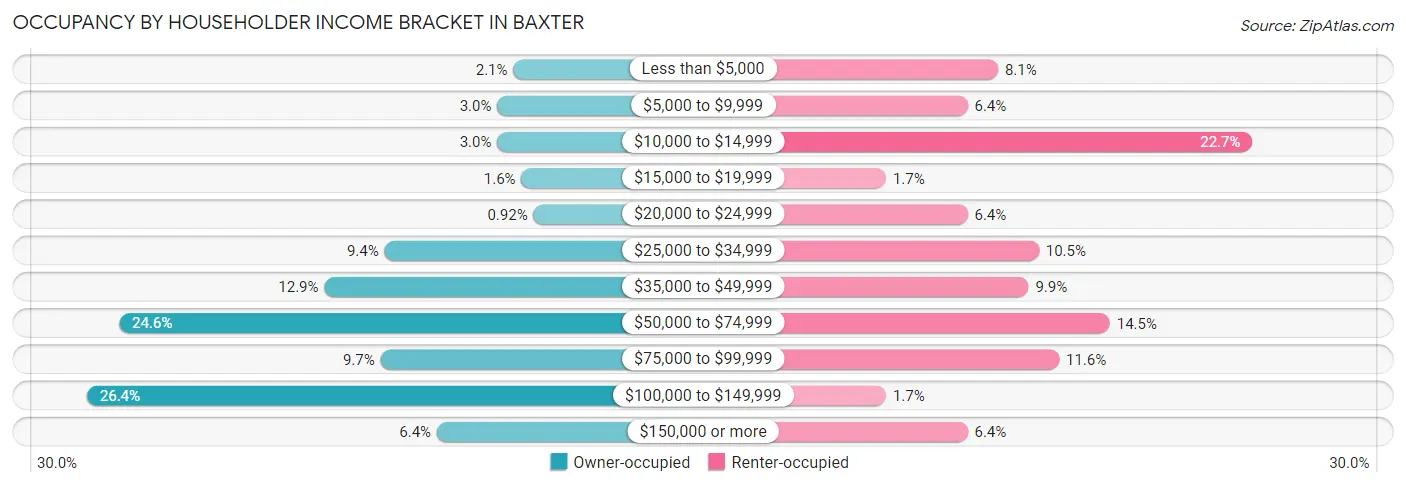
| Income Bracket | Owner-occupied | Renter-occupied |
| Less than $5,000 | 9 (2.1%) | 14 (8.1%) |
| $5,000 to $9,999 | 13 (3.0%) | 11 (6.4%) |
| $10,000 to $14,999 | 13 (3.0%) | 39 (22.7%) |
| $15,000 to $19,999 | 7 (1.6%) | 3 (1.7%) |
| $20,000 to $24,999 | 4 (0.9%) | 11 (6.4%) |
| $25,000 to $34,999 | 41 (9.4%) | 18 (10.5%) |
| $35,000 to $49,999 | 56 (12.9%) | 17 (9.9%) |
| $50,000 to $74,999 | 107 (24.6%) | 25 (14.5%) |
| $75,000 to $99,999 | 42 (9.7%) | 20 (11.6%) |
| $100,000 to $149,999 | 115 (26.4%) | 3 (1.7%) |
| $150,000 or more | 28 (6.4%) | 11 (6.4%) |
| Total | 435 (100.0%) | 172 (100.0%) |
Monthly Housing Cost Tiers in Baxter
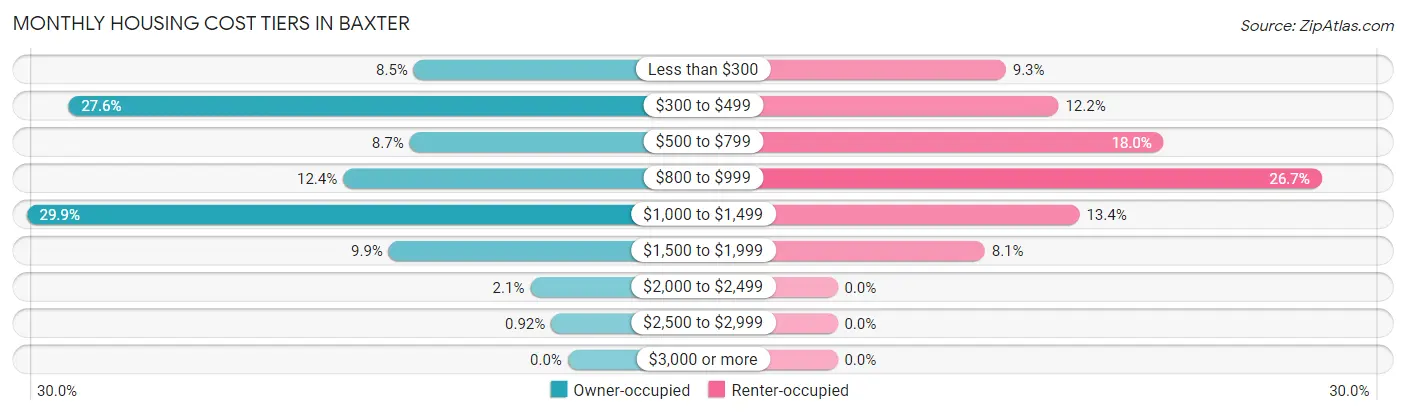
| Monthly Cost | Owner-occupied | Renter-occupied |
| Less than $300 | 37 (8.5%) | 16 (9.3%) |
| $300 to $499 | 120 (27.6%) | 21 (12.2%) |
| $500 to $799 | 38 (8.7%) | 31 (18.0%) |
| $800 to $999 | 54 (12.4%) | 46 (26.7%) |
| $1,000 to $1,499 | 130 (29.9%) | 23 (13.4%) |
| $1,500 to $1,999 | 43 (9.9%) | 14 (8.1%) |
| $2,000 to $2,499 | 9 (2.1%) | 0 (0.0%) |
| $2,500 to $2,999 | 4 (0.9%) | 0 (0.0%) |
| $3,000 or more | 0 (0.0%) | 0 (0.0%) |
| Total | 435 (100.0%) | 172 (100.0%) |
Physical Housing Characteristics in Baxter
Housing Structures in Baxter
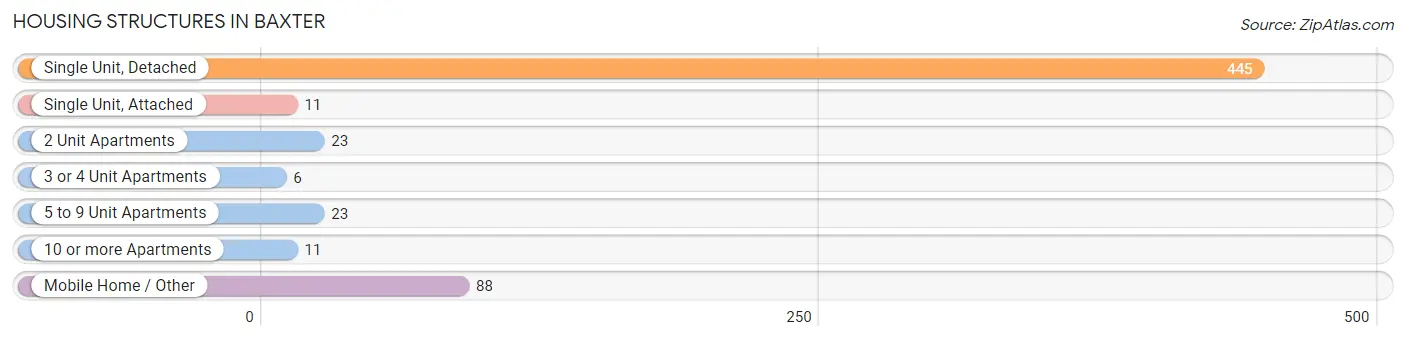
| Structure Type | # Housing Units | % Housing Units |
| Single Unit, Detached | 445 | 73.3% |
| Single Unit, Attached | 11 | 1.8% |
| 2 Unit Apartments | 23 | 3.8% |
| 3 or 4 Unit Apartments | 6 | 1.0% |
| 5 to 9 Unit Apartments | 23 | 3.8% |
| 10 or more Apartments | 11 | 1.8% |
| Mobile Home / Other | 88 | 14.5% |
| Total | 607 | 100.0% |
Housing Structures by Occupancy in Baxter
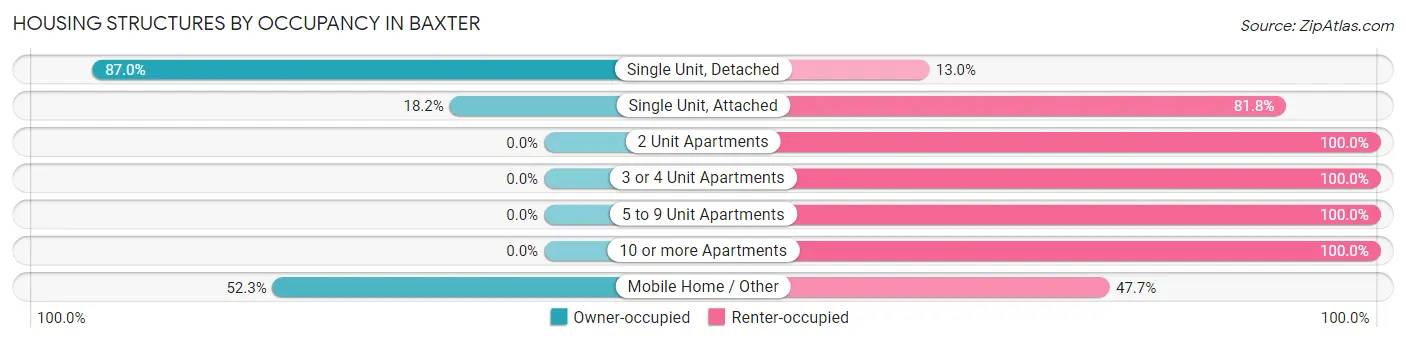
| Structure Type | Owner-occupied | Renter-occupied |
| Single Unit, Detached | 387 (87.0%) | 58 (13.0%) |
| Single Unit, Attached | 2 (18.2%) | 9 (81.8%) |
| 2 Unit Apartments | 0 (0.0%) | 23 (100.0%) |
| 3 or 4 Unit Apartments | 0 (0.0%) | 6 (100.0%) |
| 5 to 9 Unit Apartments | 0 (0.0%) | 23 (100.0%) |
| 10 or more Apartments | 0 (0.0%) | 11 (100.0%) |
| Mobile Home / Other | 46 (52.3%) | 42 (47.7%) |
| Total | 435 (71.7%) | 172 (28.3%) |
Housing Structures by Number of Rooms in Baxter
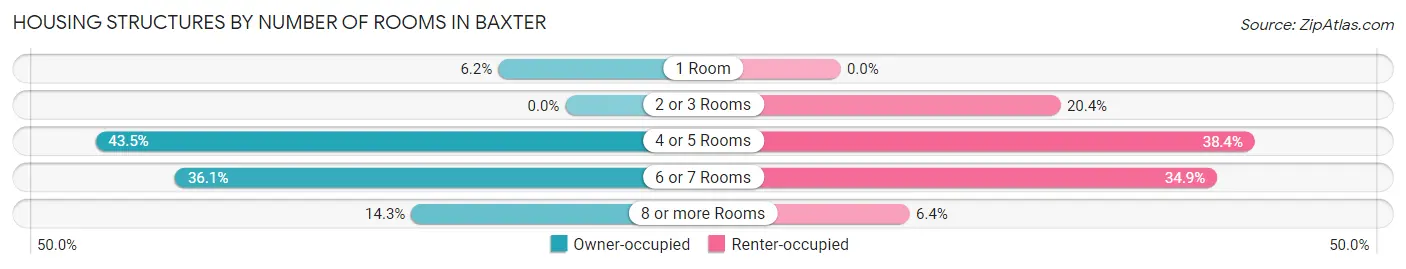
| Number of Rooms | Owner-occupied | Renter-occupied |
| 1 Room | 27 (6.2%) | 0 (0.0%) |
| 2 or 3 Rooms | 0 (0.0%) | 35 (20.3%) |
| 4 or 5 Rooms | 189 (43.4%) | 66 (38.4%) |
| 6 or 7 Rooms | 157 (36.1%) | 60 (34.9%) |
| 8 or more Rooms | 62 (14.2%) | 11 (6.4%) |
| Total | 435 (100.0%) | 172 (100.0%) |
Housing Structure by Heating Type in Baxter
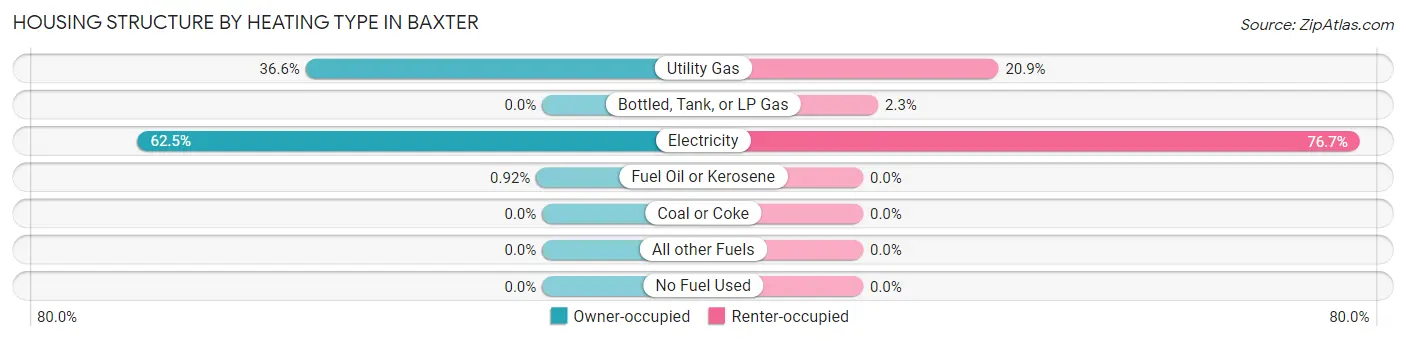
| Heating Type | Owner-occupied | Renter-occupied |
| Utility Gas | 159 (36.5%) | 36 (20.9%) |
| Bottled, Tank, or LP Gas | 0 (0.0%) | 4 (2.3%) |
| Electricity | 272 (62.5%) | 132 (76.7%) |
| Fuel Oil or Kerosene | 4 (0.9%) | 0 (0.0%) |
| Coal or Coke | 0 (0.0%) | 0 (0.0%) |
| All other Fuels | 0 (0.0%) | 0 (0.0%) |
| No Fuel Used | 0 (0.0%) | 0 (0.0%) |
| Total | 435 (100.0%) | 172 (100.0%) |
Household Vehicle Usage in Baxter
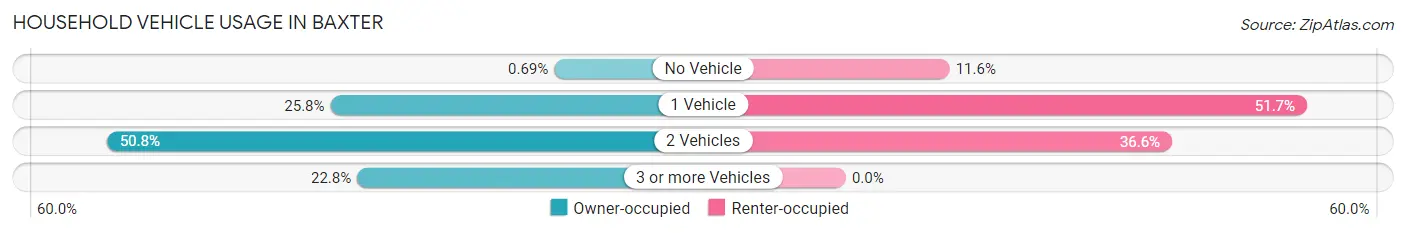
| Vehicles per Household | Owner-occupied | Renter-occupied |
| No Vehicle | 3 (0.7%) | 20 (11.6%) |
| 1 Vehicle | 112 (25.8%) | 89 (51.7%) |
| 2 Vehicles | 221 (50.8%) | 63 (36.6%) |
| 3 or more Vehicles | 99 (22.8%) | 0 (0.0%) |
| Total | 435 (100.0%) | 172 (100.0%) |
Real Estate & Mortgages in Baxter
Real Estate and Mortgage Overview in Baxter
| Characteristic | Without Mortgage | With Mortgage |
| Housing Units | 169 | 266 |
| Median Property Value | $124,700 | $219,700 |
| Median Household Income | $51,875 | $28 |
| Monthly Housing Costs | $389 | $0 |
| Real Estate Taxes | $740 | $3 |
Property Value by Mortgage Status in Baxter
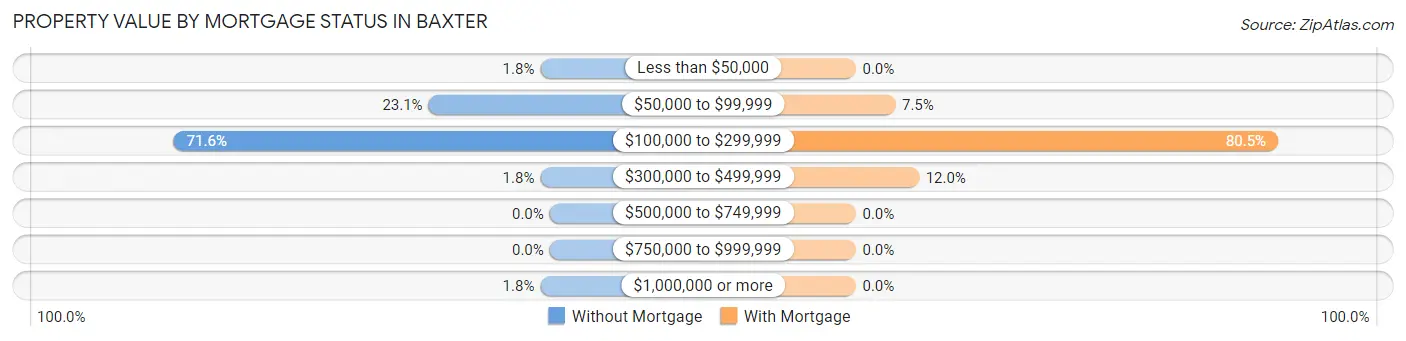
| Property Value | Without Mortgage | With Mortgage |
| Less than $50,000 | 3 (1.8%) | 0 (0.0%) |
| $50,000 to $99,999 | 39 (23.1%) | 20 (7.5%) |
| $100,000 to $299,999 | 121 (71.6%) | 214 (80.4%) |
| $300,000 to $499,999 | 3 (1.8%) | 32 (12.0%) |
| $500,000 to $749,999 | 0 (0.0%) | 0 (0.0%) |
| $750,000 to $999,999 | 0 (0.0%) | 0 (0.0%) |
| $1,000,000 or more | 3 (1.8%) | 0 (0.0%) |
| Total | 169 (100.0%) | 266 (100.0%) |
Household Income by Mortgage Status in Baxter
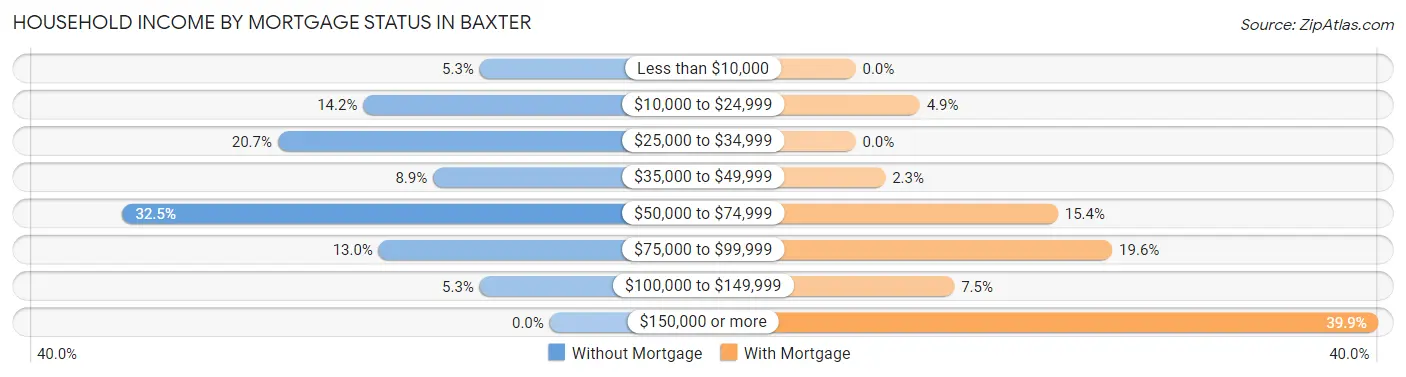
| Household Income | Without Mortgage | With Mortgage |
| Less than $10,000 | 9 (5.3%) | 0 (0.0%) |
| $10,000 to $24,999 | 24 (14.2%) | 13 (4.9%) |
| $25,000 to $34,999 | 35 (20.7%) | 0 (0.0%) |
| $35,000 to $49,999 | 15 (8.9%) | 6 (2.3%) |
| $50,000 to $74,999 | 55 (32.5%) | 41 (15.4%) |
| $75,000 to $99,999 | 22 (13.0%) | 52 (19.6%) |
| $100,000 to $149,999 | 9 (5.3%) | 20 (7.5%) |
| $150,000 or more | 0 (0.0%) | 106 (39.9%) |
| Total | 169 (100.0%) | 266 (100.0%) |
Property Value to Household Income Ratio in Baxter
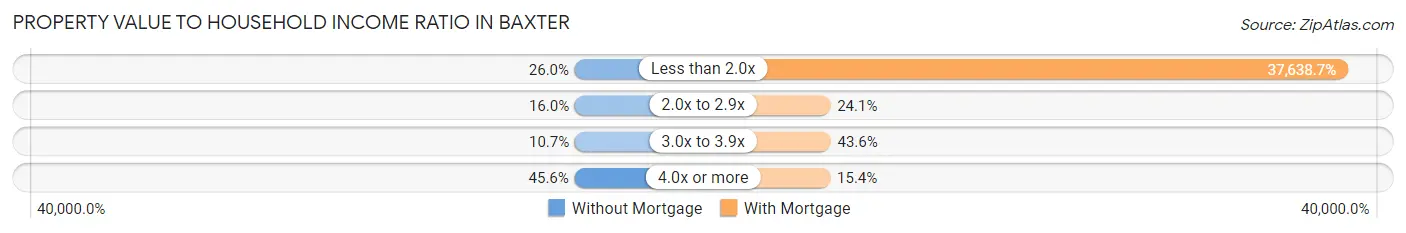
| Value-to-Income Ratio | Without Mortgage | With Mortgage |
| Less than 2.0x | 44 (26.0%) | 100,119 (37,638.7%) |
| 2.0x to 2.9x | 27 (16.0%) | 64 (24.1%) |
| 3.0x to 3.9x | 18 (10.6%) | 116 (43.6%) |
| 4.0x or more | 77 (45.6%) | 41 (15.4%) |
| Total | 169 (100.0%) | 266 (100.0%) |
Real Estate Taxes by Mortgage Status in Baxter
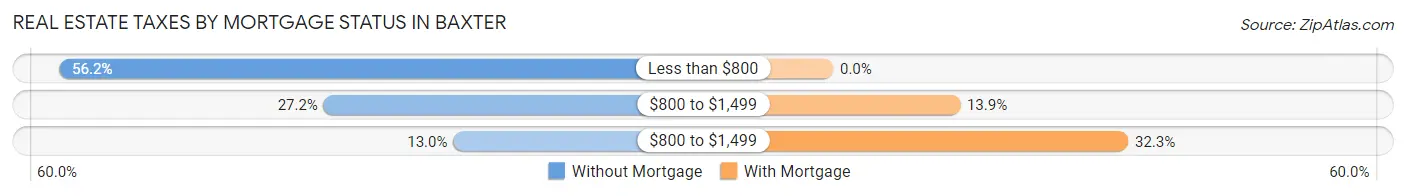
| Property Taxes | Without Mortgage | With Mortgage |
| Less than $800 | 95 (56.2%) | 0 (0.0%) |
| $800 to $1,499 | 46 (27.2%) | 37 (13.9%) |
| $800 to $1,499 | 22 (13.0%) | 86 (32.3%) |
| Total | 169 (100.0%) | 266 (100.0%) |
Health & Disability in Baxter
Health Insurance Coverage by Age in Baxter
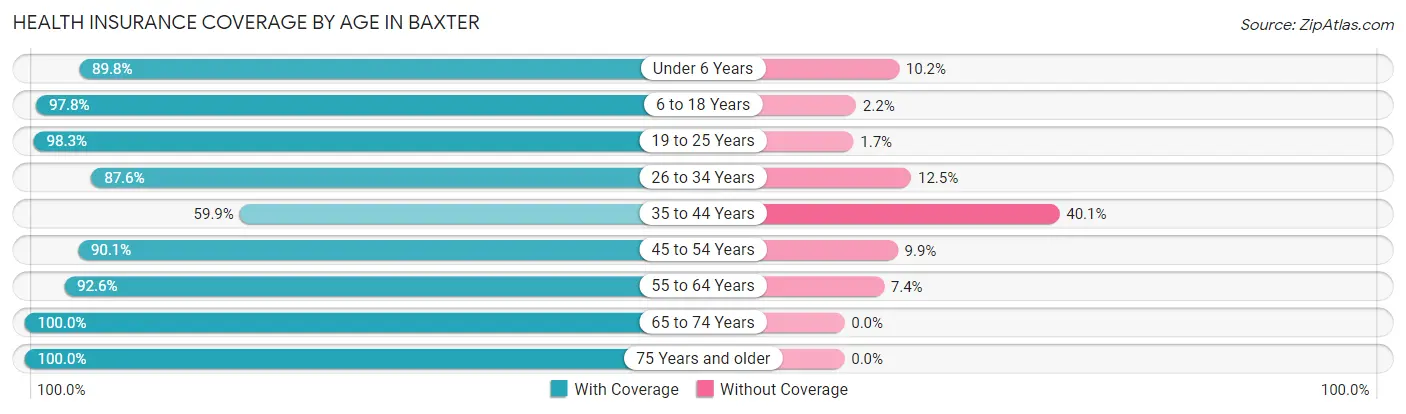
| Age Bracket | With Coverage | Without Coverage |
| Under 6 Years | 106 (89.8%) | 12 (10.2%) |
| 6 to 18 Years | 227 (97.8%) | 5 (2.2%) |
| 19 to 25 Years | 58 (98.3%) | 1 (1.7%) |
| 26 to 34 Years | 239 (87.5%) | 34 (12.4%) |
| 35 to 44 Years | 124 (59.9%) | 83 (40.1%) |
| 45 to 54 Years | 154 (90.1%) | 17 (9.9%) |
| 55 to 64 Years | 113 (92.6%) | 9 (7.4%) |
| 65 to 74 Years | 208 (100.0%) | 0 (0.0%) |
| 75 Years and older | 87 (100.0%) | 0 (0.0%) |
| Total | 1,316 (89.1%) | 161 (10.9%) |
Health Insurance Coverage by Citizenship Status in Baxter
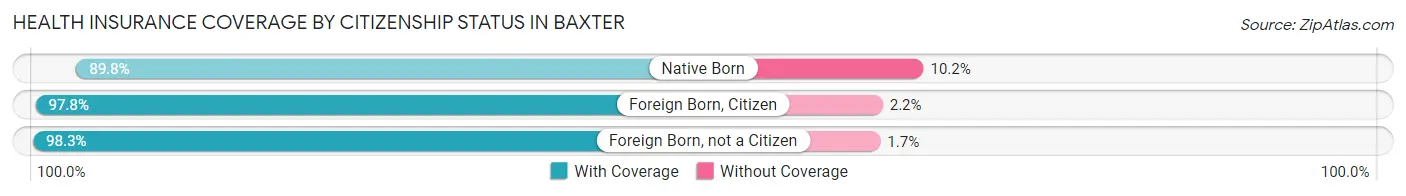
| Citizenship Status | With Coverage | Without Coverage |
| Native Born | 106 (89.8%) | 12 (10.2%) |
| Foreign Born, Citizen | 227 (97.8%) | 5 (2.2%) |
| Foreign Born, not a Citizen | 58 (98.3%) | 1 (1.7%) |
Health Insurance Coverage by Household Income in Baxter
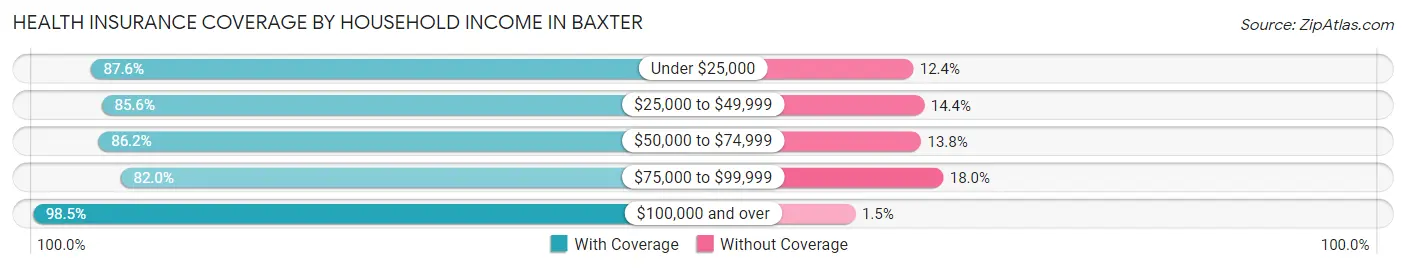
| Household Income | With Coverage | Without Coverage |
| Under $25,000 | 248 (87.6%) | 35 (12.4%) |
| $25,000 to $49,999 | 273 (85.6%) | 46 (14.4%) |
| $50,000 to $74,999 | 262 (86.2%) | 42 (13.8%) |
| $75,000 to $99,999 | 146 (82.0%) | 32 (18.0%) |
| $100,000 and over | 387 (98.5%) | 6 (1.5%) |
Public vs Private Health Insurance Coverage by Age in Baxter
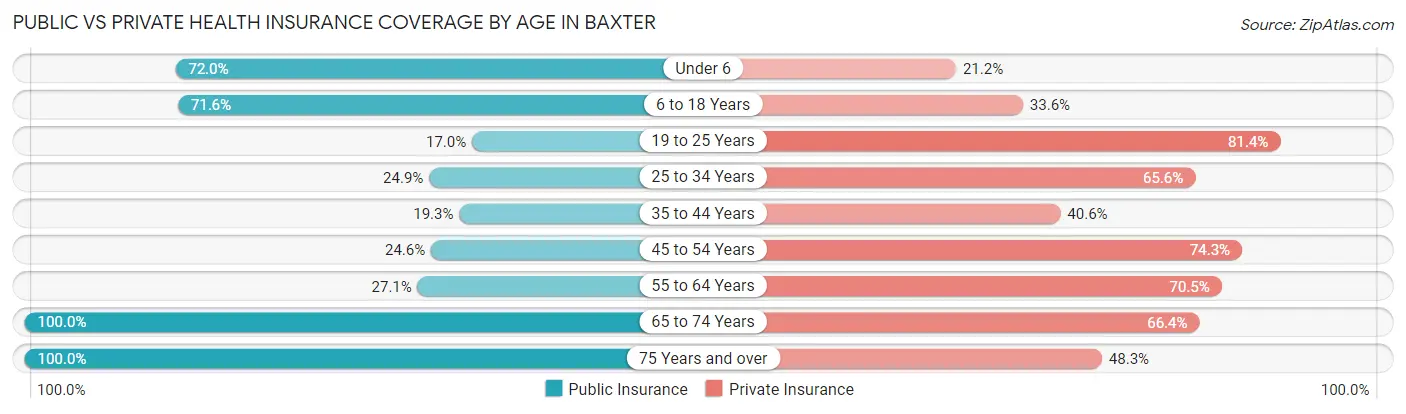
| Age Bracket | Public Insurance | Private Insurance |
| Under 6 | 85 (72.0%) | 25 (21.2%) |
| 6 to 18 Years | 166 (71.6%) | 78 (33.6%) |
| 19 to 25 Years | 10 (17.0%) | 48 (81.4%) |
| 25 to 34 Years | 68 (24.9%) | 179 (65.6%) |
| 35 to 44 Years | 40 (19.3%) | 84 (40.6%) |
| 45 to 54 Years | 42 (24.6%) | 127 (74.3%) |
| 55 to 64 Years | 33 (27.1%) | 86 (70.5%) |
| 65 to 74 Years | 208 (100.0%) | 138 (66.3%) |
| 75 Years and over | 87 (100.0%) | 42 (48.3%) |
| Total | 739 (50.0%) | 807 (54.6%) |
Disability Status by Sex by Age in Baxter
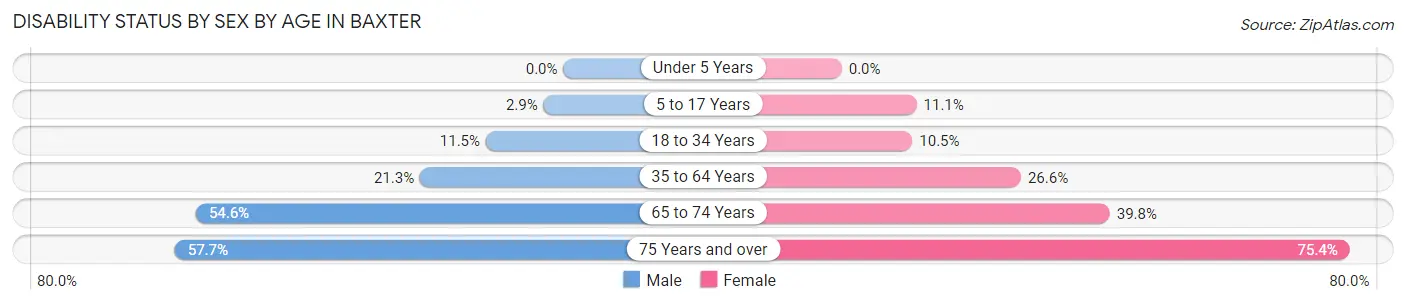
| Age Bracket | Male | Female |
| Under 5 Years | 0 (0.0%) | 0 (0.0%) |
| 5 to 17 Years | 4 (2.9%) | 10 (11.1%) |
| 18 to 34 Years | 16 (11.5%) | 22 (10.5%) |
| 35 to 64 Years | 60 (21.3%) | 58 (26.6%) |
| 65 to 74 Years | 60 (54.5%) | 39 (39.8%) |
| 75 Years and over | 15 (57.7%) | 46 (75.4%) |
Disability Class by Sex by Age in Baxter
Disability Class: Hearing Difficulty
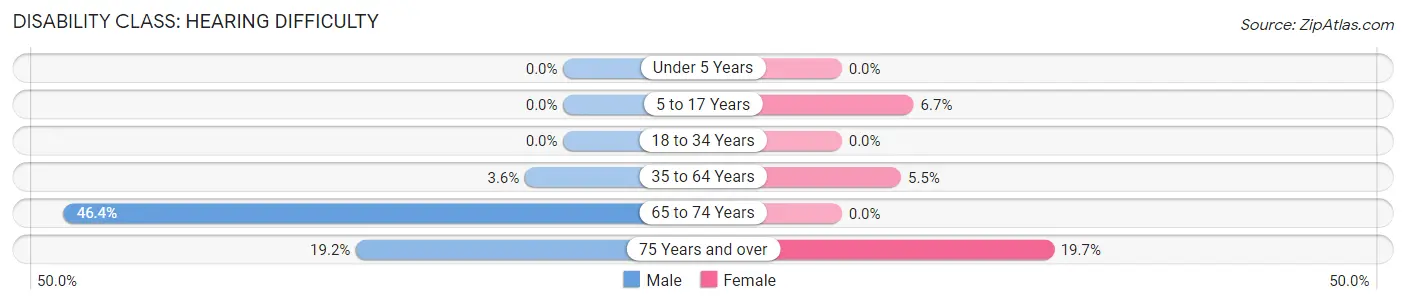
| Age Bracket | Male | Female |
| Under 5 Years | 0 (0.0%) | 0 (0.0%) |
| 5 to 17 Years | 0 (0.0%) | 6 (6.7%) |
| 18 to 34 Years | 0 (0.0%) | 0 (0.0%) |
| 35 to 64 Years | 10 (3.5%) | 12 (5.5%) |
| 65 to 74 Years | 51 (46.4%) | 0 (0.0%) |
| 75 Years and over | 5 (19.2%) | 12 (19.7%) |
Disability Class: Vision Difficulty
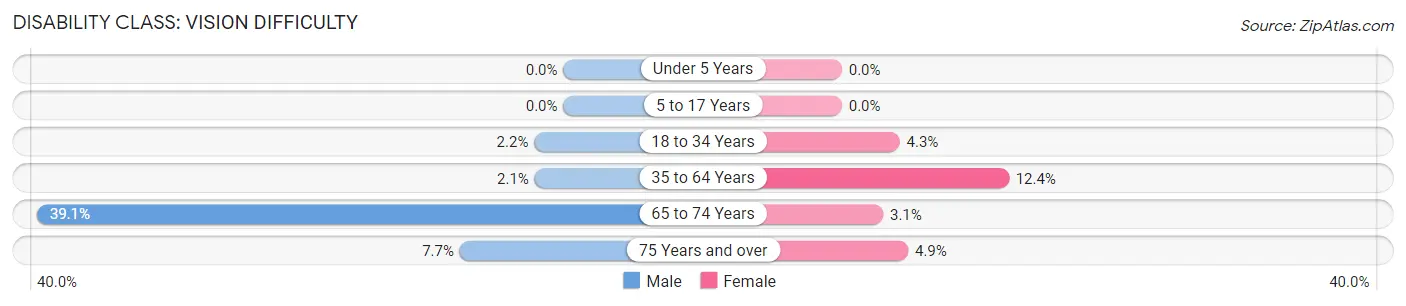
| Age Bracket | Male | Female |
| Under 5 Years | 0 (0.0%) | 0 (0.0%) |
| 5 to 17 Years | 0 (0.0%) | 0 (0.0%) |
| 18 to 34 Years | 3 (2.2%) | 9 (4.3%) |
| 35 to 64 Years | 6 (2.1%) | 27 (12.4%) |
| 65 to 74 Years | 43 (39.1%) | 3 (3.1%) |
| 75 Years and over | 2 (7.7%) | 3 (4.9%) |
Disability Class: Cognitive Difficulty
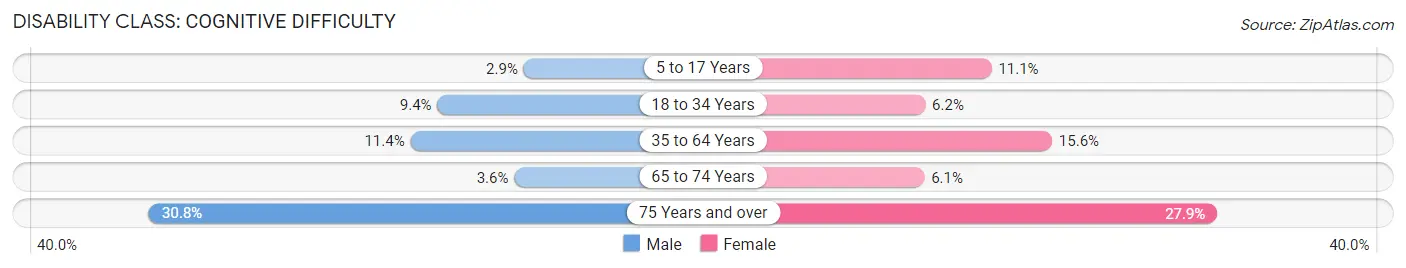
| Age Bracket | Male | Female |
| 5 to 17 Years | 4 (2.9%) | 10 (11.1%) |
| 18 to 34 Years | 13 (9.3%) | 13 (6.2%) |
| 35 to 64 Years | 32 (11.4%) | 34 (15.6%) |
| 65 to 74 Years | 4 (3.6%) | 6 (6.1%) |
| 75 Years and over | 8 (30.8%) | 17 (27.9%) |
Disability Class: Ambulatory Difficulty
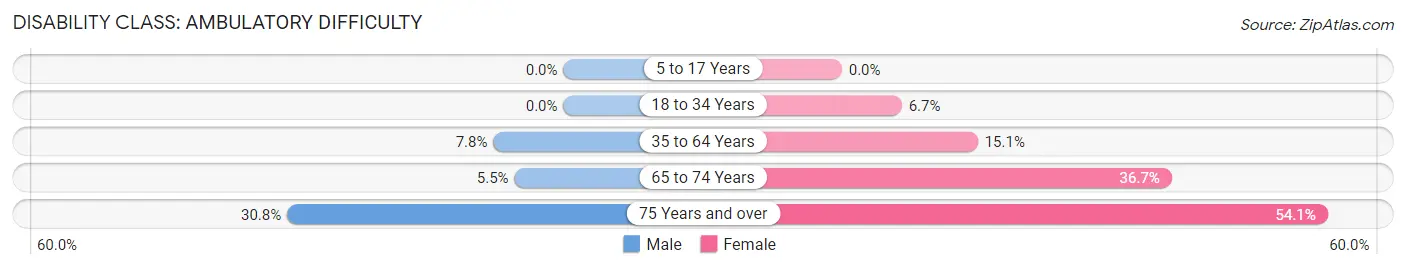
| Age Bracket | Male | Female |
| 5 to 17 Years | 0 (0.0%) | 0 (0.0%) |
| 18 to 34 Years | 0 (0.0%) | 14 (6.7%) |
| 35 to 64 Years | 22 (7.8%) | 33 (15.1%) |
| 65 to 74 Years | 6 (5.4%) | 36 (36.7%) |
| 75 Years and over | 8 (30.8%) | 33 (54.1%) |
Disability Class: Self-Care Difficulty
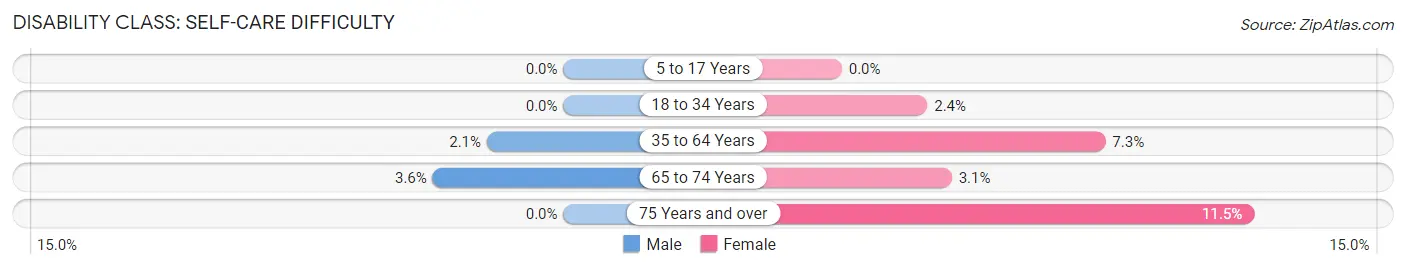
| Age Bracket | Male | Female |
| 5 to 17 Years | 0 (0.0%) | 0 (0.0%) |
| 18 to 34 Years | 0 (0.0%) | 5 (2.4%) |
| 35 to 64 Years | 6 (2.1%) | 16 (7.3%) |
| 65 to 74 Years | 4 (3.6%) | 3 (3.1%) |
| 75 Years and over | 0 (0.0%) | 7 (11.5%) |
Technology Access in Baxter
Computing Device Access in Baxter
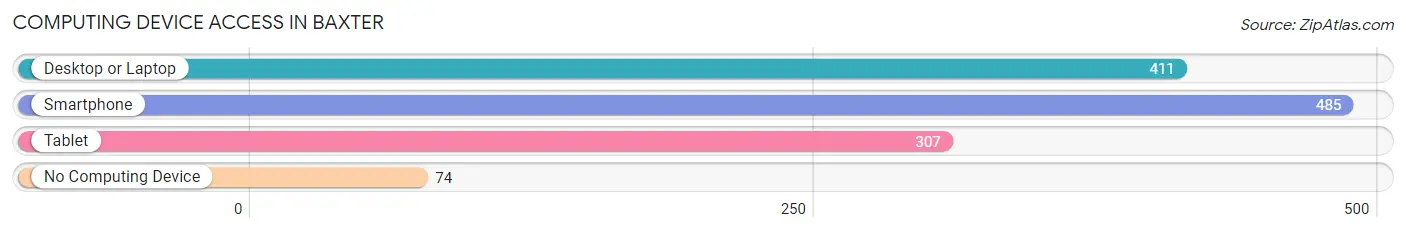
| Device Type | # Households | % Households |
| Desktop or Laptop | 411 | 67.7% |
| Smartphone | 485 | 79.9% |
| Tablet | 307 | 50.6% |
| No Computing Device | 74 | 12.2% |
| Total | 607 | 100.0% |
Internet Access in Baxter
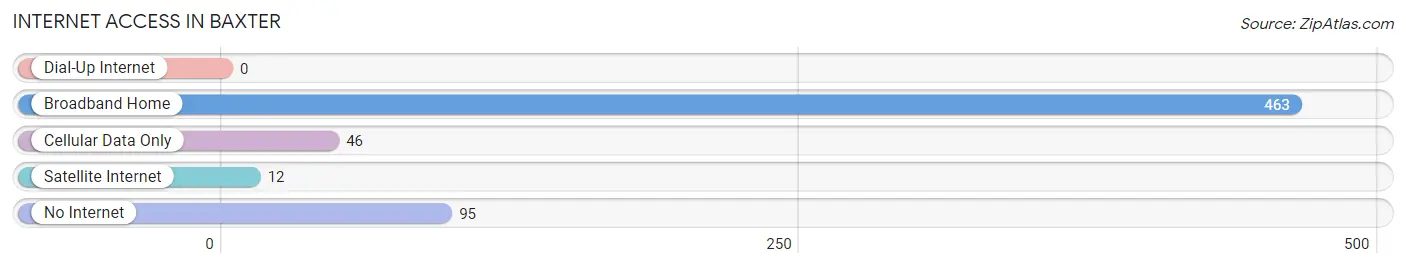
| Internet Type | # Households | % Households |
| Dial-Up Internet | 0 | 0.0% |
| Broadband Home | 463 | 76.3% |
| Cellular Data Only | 46 | 7.6% |
| Satellite Internet | 12 | 2.0% |
| No Internet | 95 | 15.7% |
| Total | 607 | 100.0% |
Baxter Summary
Baxter is a small town located in Putnam County, Tennessee. It is situated in the foothills of the Cumberland Mountains, approximately 30 miles east of Cookeville. The town was founded in 1887 and has a population of approximately 1,500 people.
History
Baxter was founded in 1887 by a group of settlers from the nearby town of Cookeville. The town was named after a local doctor, Dr. Baxter, who had a large influence in the area. The town was originally a farming community, but in the early 1900s, the railroad came through and the town began to grow. The railroad brought new businesses and industries to the area, and Baxter soon became a thriving small town.
In the early 1900s, Baxter was home to several businesses, including a sawmill, a gristmill, a blacksmith shop, and a general store. The town also had a post office, a bank, and a hotel. In the 1920s, the town was home to a movie theater, a bowling alley, and a pool hall.
Geography
Baxter is located in Putnam County, Tennessee, in the foothills of the Cumberland Mountains. The town is situated at an elevation of 1,000 feet above sea level. The town is located approximately 30 miles east of Cookeville and is bordered by the towns of Monterey, Algood, and Cookeville.
The town is located in a rural area and is surrounded by rolling hills and farmland. The town is also located near several lakes, including Center Hill Lake, Dale Hollow Lake, and Cordell Hull Lake.
Economy
Baxter’s economy is largely based on agriculture and tourism. The town is home to several farms, which produce a variety of crops, including corn, soybeans, and hay. The town is also home to several tourist attractions, including the Baxter State Park, which offers camping, fishing, and hiking.
The town is also home to several small businesses, including restaurants, shops, and a hardware store. The town is also home to several manufacturing companies, including a furniture factory and a plastics factory.
Demographics
As of the 2010 census, the population of Baxter was 1,500. The town is predominantly white, with approximately 95% of the population being white. The town also has a small Hispanic population, with approximately 4% of the population being Hispanic. The median household income in Baxter is $35,000, and the median home value is $90,000.
Baxter is a small town with a rich history and a strong sense of community. The town is home to several businesses and industries, and is a popular tourist destination. The town is also home to several farms, which produce a variety of crops. The town is predominantly white, with a small Hispanic population. The median household income in Baxter is $35,000, and the median home value is $90,000.
Common Questions
What is Per Capita Income in Baxter?
Per Capita income in Baxter is $30,099.
What is the Median Family Income in Baxter?
Median Family Income in Baxter is $54,556.
What is the Median Household income in Baxter?
Median Household Income in Baxter is $57,829.
What is Income or Wage Gap in Baxter?
Income or Wage Gap in Baxter is 21.0%.
Women in Baxter earn 79.0 cents for every dollar earned by a man.
What is Family Income Deficit in Baxter?
Family Income Deficit in Baxter is $10,773.
Families that are below poverty line in Baxter earn $10,773 less on average than the poverty threshold level.
What is Inequality or Gini Index in Baxter?
Inequality or Gini Index in Baxter is 0.46.
What is the Total Population of Baxter?
Total Population of Baxter is 1,477.
What is the Total Male Population of Baxter?
Total Male Population of Baxter is 748.
What is the Total Female Population of Baxter?
Total Female Population of Baxter is 729.
What is the Ratio of Males per 100 Females in Baxter?
There are 102.61 Males per 100 Females in Baxter.
What is the Ratio of Females per 100 Males in Baxter?
There are 97.46 Females per 100 Males in Baxter.
What is the Median Population Age in Baxter?
Median Population Age in Baxter is 36.4 Years.
What is the Average Family Size in Baxter
Average Family Size in Baxter is 2.8 People.
What is the Average Household Size in Baxter
Average Household Size in Baxter is 2.4 People.
How Large is the Labor Force in Baxter?
There are 648 People in the Labor Forcein in Baxter.
What is the Percentage of People in the Labor Force in Baxter?
54.8% of People are in the Labor Force in Baxter.
What is the Unemployment Rate in Baxter?
Unemployment Rate in Baxter is 1.2%.