Johnson City, TN Map & Demographics
Johnson City Map
Johnson City Overview
$36,210
PER CAPITA INCOME
$78,509
AVG FAMILY INCOME
$53,173
AVG HOUSEHOLD INCOME
29.0%
WAGE / INCOME GAP [ % ]
71.0¢/ $1
WAGE / INCOME GAP [ $ ]
$10,643
FAMILY INCOME DEFICIT
0.53
INEQUALITY / GINI INDEX
70,720
TOTAL POPULATION
33,878
MALE POPULATION
36,842
FEMALE POPULATION
91.95
MALES / 100 FEMALES
108.75
FEMALES / 100 MALES
34.9
MEDIAN AGE
2.9
AVG FAMILY SIZE
2.2
AVG HOUSEHOLD SIZE
36,646
LABOR FORCE [ PEOPLE ]
62.0%
PERCENT IN LABOR FORCE
6.1%
UNEMPLOYMENT RATE
Johnson City Area Codes
Income in Johnson City
Income Overview in Johnson City
Per Capita Income in Johnson City is $36,210, while median incomes of families and households are $78,509 and $53,173 respectively.
| Characteristic | Number | Measure |
| Per Capita Income | 70,720 | $36,210 |
| Median Family Income | 16,278 | $78,509 |
| Mean Family Income | 16,278 | $113,208 |
| Median Household Income | 30,107 | $53,173 |
| Mean Household Income | 30,107 | $82,397 |
| Income Deficit | 16,278 | $10,643 |
| Wage / Income Gap (%) | 70,720 | 29.03% |
| Wage / Income Gap ($) | 70,720 | 70.97¢ per $1 |
| Gini / Inequality Index | 70,720 | 0.53 |
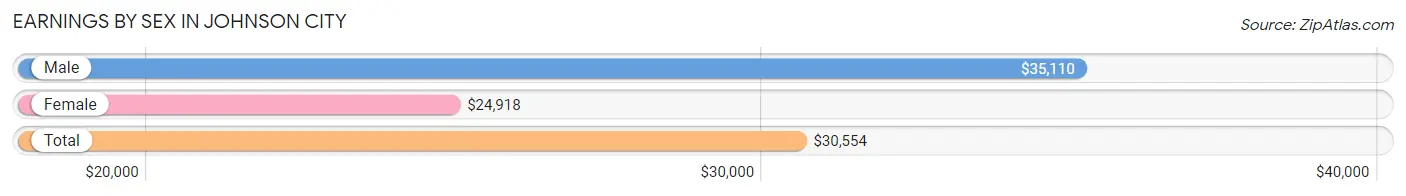
Earnings by Sex in Johnson City
Average Earnings in Johnson City are $30,554, $35,110 for men and $24,918 for women, a difference of 29.0%.
| Sex | Number | Average Earnings |
| Male | 19,569 (49.9%) | $35,110 |
| Female | 19,609 (50.0%) | $24,918 |
| Total | 39,178 (100.0%) | $30,554 |
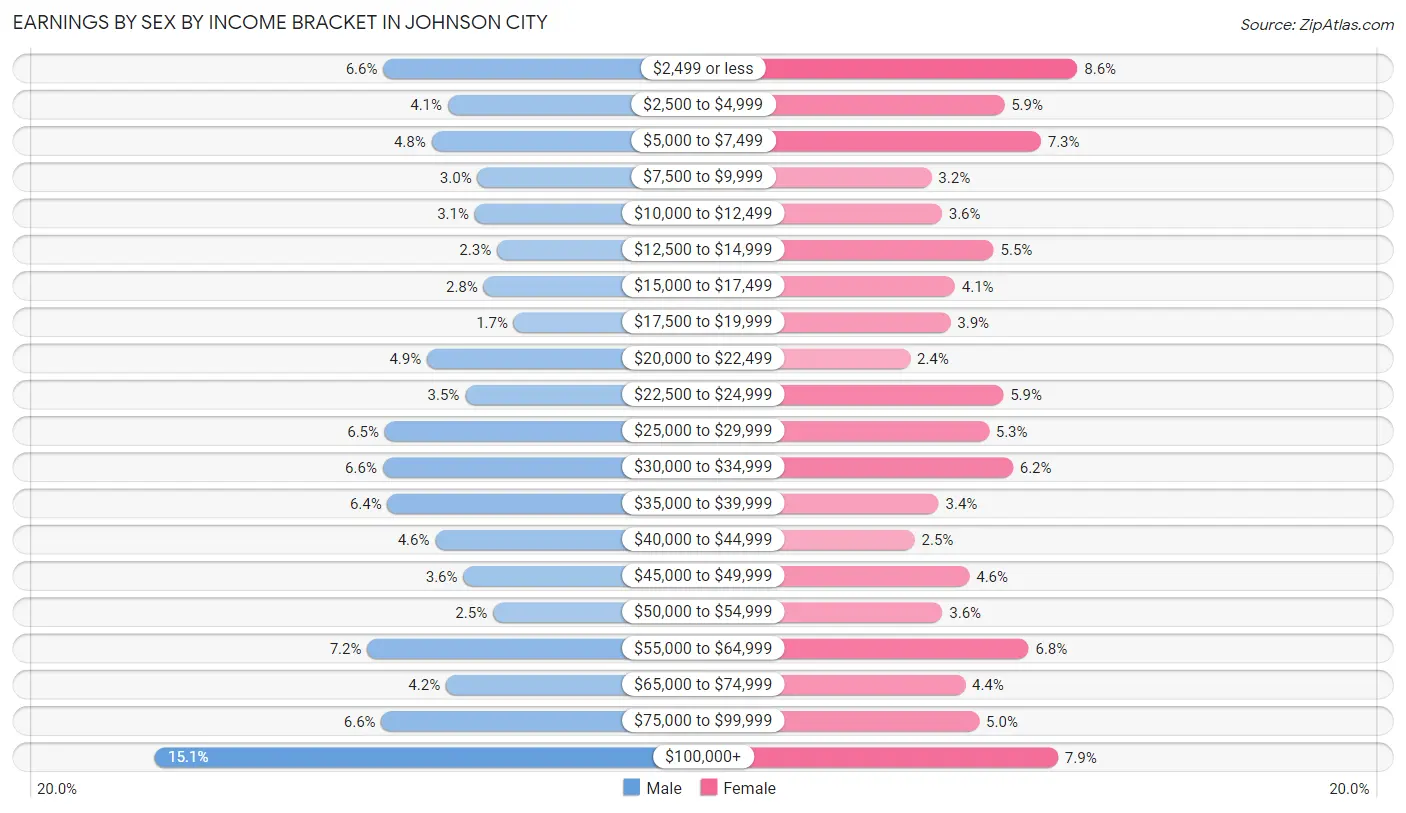
Earnings by Sex by Income Bracket in Johnson City
The most common earnings brackets in Johnson City are $100,000+ for men (2,957 | 15.1%) and $2,499 or less for women (1,695 | 8.6%).
| Income | Male | Female |
| $2,499 or less | 1,283 (6.6%) | 1,695 (8.6%) |
| $2,500 to $4,999 | 810 (4.1%) | 1,156 (5.9%) |
| $5,000 to $7,499 | 930 (4.8%) | 1,425 (7.3%) |
| $7,500 to $9,999 | 593 (3.0%) | 622 (3.2%) |
| $10,000 to $12,499 | 612 (3.1%) | 698 (3.6%) |
| $12,500 to $14,999 | 451 (2.3%) | 1,078 (5.5%) |
| $15,000 to $17,499 | 548 (2.8%) | 794 (4.1%) |
| $17,500 to $19,999 | 327 (1.7%) | 761 (3.9%) |
| $20,000 to $22,499 | 963 (4.9%) | 464 (2.4%) |
| $22,500 to $24,999 | 682 (3.5%) | 1,149 (5.9%) |
| $25,000 to $29,999 | 1,272 (6.5%) | 1,043 (5.3%) |
| $30,000 to $34,999 | 1,287 (6.6%) | 1,220 (6.2%) |
| $35,000 to $39,999 | 1,252 (6.4%) | 675 (3.4%) |
| $40,000 to $44,999 | 902 (4.6%) | 498 (2.5%) |
| $45,000 to $49,999 | 697 (3.6%) | 900 (4.6%) |
| $50,000 to $54,999 | 480 (2.5%) | 702 (3.6%) |
| $55,000 to $64,999 | 1,402 (7.2%) | 1,336 (6.8%) |
| $65,000 to $74,999 | 823 (4.2%) | 869 (4.4%) |
| $75,000 to $99,999 | 1,298 (6.6%) | 972 (5.0%) |
| $100,000+ | 2,957 (15.1%) | 1,552 (7.9%) |
| Total | 19,569 (100.0%) | 19,609 (100.0%) |
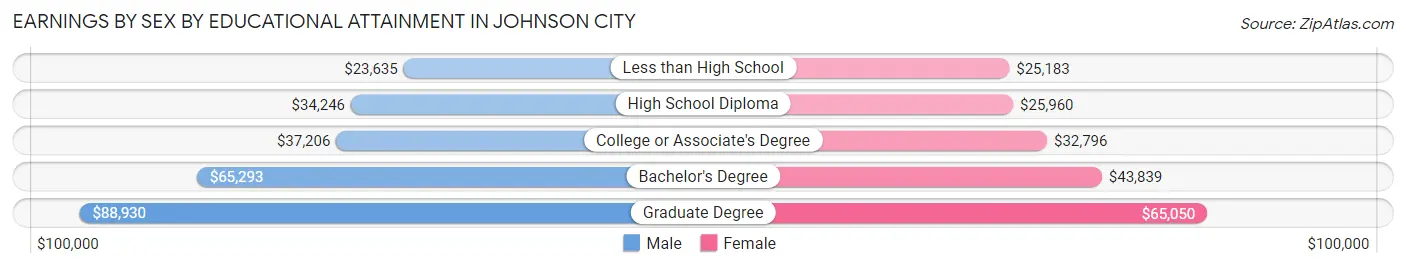
Earnings by Sex by Educational Attainment in Johnson City
Average earnings in Johnson City are $41,959 for men and $38,242 for women, a difference of 8.9%. Men with an educational attainment of graduate degree enjoy the highest average annual earnings of $88,930, while those with less than high school education earn the least with $23,635. Women with an educational attainment of graduate degree earn the most with the average annual earnings of $65,050, while those with less than high school education have the smallest earnings of $25,183.
| Educational Attainment | Male Income | Female Income |
| Less than High School | $23,635 | $25,183 |
| High School Diploma | $34,246 | $25,960 |
| College or Associate's Degree | $37,206 | $32,796 |
| Bachelor's Degree | $65,293 | $43,839 |
| Graduate Degree | $88,930 | $65,050 |
| Total | $41,959 | $38,242 |
Family Income in Johnson City
Family Income Brackets in Johnson City
According to the Johnson City family income data, there are 2,946 families falling into the $50,000 to $74,999 income range, which is the most common income bracket and makes up 18.1% of all families. Conversely, the $10,000 to $14,999 income bracket is the least frequent group with only 619 families (3.8%) belonging to this category.
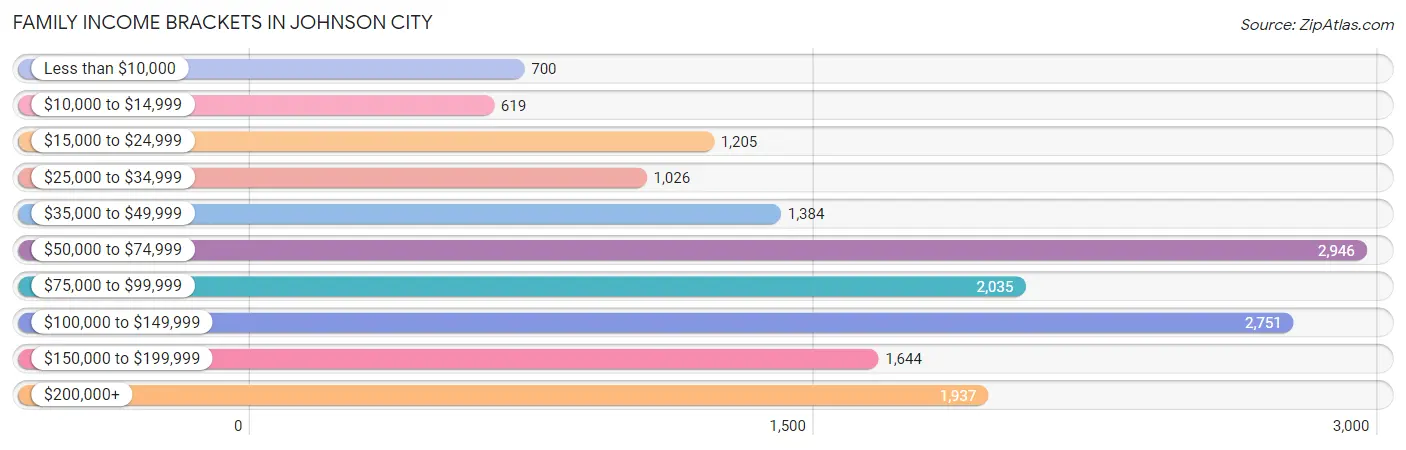
| Income Bracket | # Families | % Families |
| Less than $10,000 | 700 | 4.3% |
| $10,000 to $14,999 | 619 | 3.8% |
| $15,000 to $24,999 | 1,205 | 7.4% |
| $25,000 to $34,999 | 1,026 | 6.3% |
| $35,000 to $49,999 | 1,384 | 8.5% |
| $50,000 to $74,999 | 2,946 | 18.1% |
| $75,000 to $99,999 | 2,035 | 12.5% |
| $100,000 to $149,999 | 2,751 | 16.9% |
| $150,000 to $199,999 | 1,644 | 10.1% |
| $200,000+ | 1,937 | 11.9% |
Family Income by Famaliy Size in Johnson City
7+ person families (65 | 0.4%) account for the highest median family income in Johnson City with $241,188 per family, while 2-person families (8,587 | 52.7%) have the highest median income of $35,721 per family member.
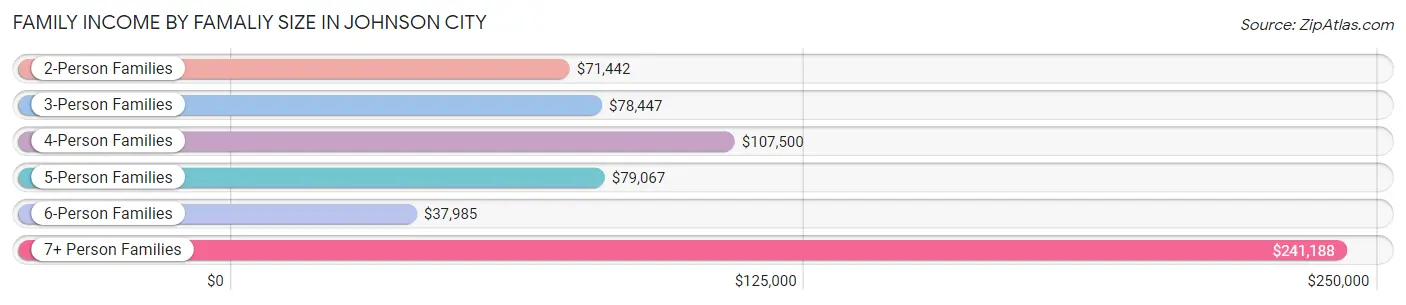
| Income Bracket | # Families | Median Income |
| 2-Person Families | 8,587 (52.7%) | $71,442 |
| 3-Person Families | 3,684 (22.6%) | $78,447 |
| 4-Person Families | 2,548 (15.7%) | $107,500 |
| 5-Person Families | 889 (5.5%) | $79,067 |
| 6-Person Families | 505 (3.1%) | $37,985 |
| 7+ Person Families | 65 (0.4%) | $241,188 |
| Total | 16,278 (100.0%) | $78,509 |
Family Income by Number of Earners in Johnson City
The median family income in Johnson City is $78,509, with families comprising 3+ earners (1,294) having the highest median family income of $136,477, while families with no earners (2,220) have the lowest median family income of $42,708, accounting for 8.0% and 13.6% of families, respectively.
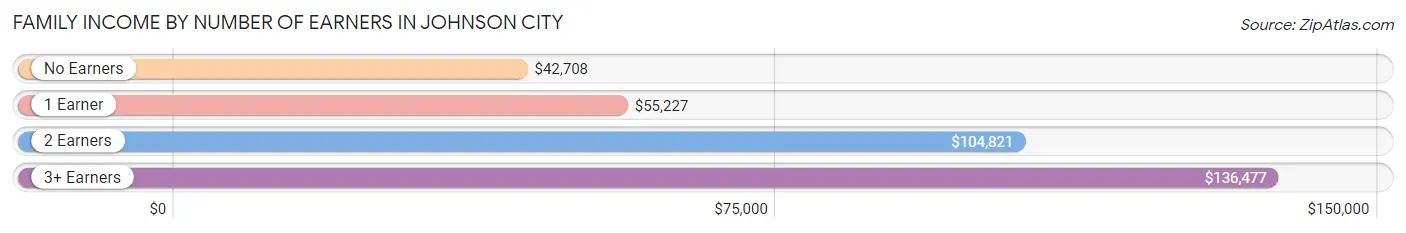
| Number of Earners | # Families | Median Income |
| No Earners | 2,220 (13.6%) | $42,708 |
| 1 Earner | 6,120 (37.6%) | $55,227 |
| 2 Earners | 6,644 (40.8%) | $104,821 |
| 3+ Earners | 1,294 (8.0%) | $136,477 |
| Total | 16,278 (100.0%) | $78,509 |
Household Income in Johnson City
Household Income Brackets in Johnson City
With 5,178 households falling in the category, the $50,000 to $74,999 income range is the most frequent in Johnson City, accounting for 17.2% of all households. In contrast, only 1,776 households (5.9%) fall into the $150,000 to $199,999 income bracket, making it the least populous group.
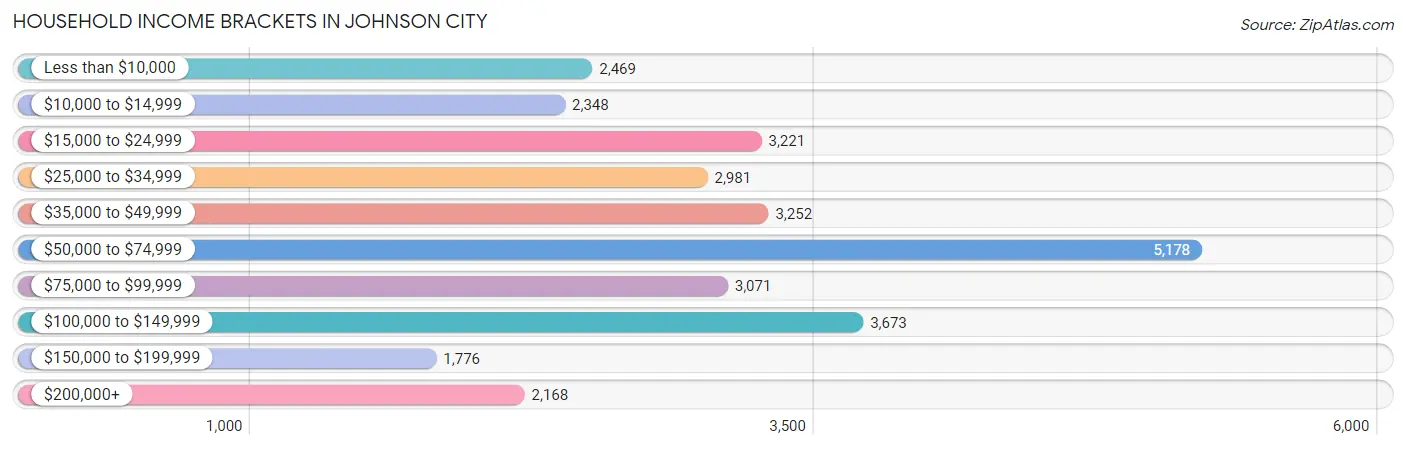
| Income Bracket | # Households | % Households |
| Less than $10,000 | 2,469 | 8.2% |
| $10,000 to $14,999 | 2,348 | 7.8% |
| $15,000 to $24,999 | 3,221 | 10.7% |
| $25,000 to $34,999 | 2,981 | 9.9% |
| $35,000 to $49,999 | 3,252 | 10.8% |
| $50,000 to $74,999 | 5,178 | 17.2% |
| $75,000 to $99,999 | 3,071 | 10.2% |
| $100,000 to $149,999 | 3,673 | 12.2% |
| $150,000 to $199,999 | 1,776 | 5.9% |
| $200,000+ | 2,168 | 7.2% |
Household Income by Householder Age in Johnson City
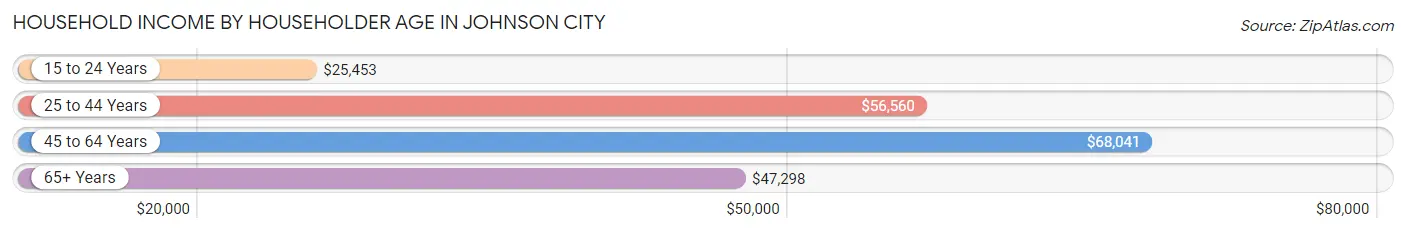
The median household income in Johnson City is $53,173, with the highest median household income of $68,041 found in the 45 to 64 years age bracket for the primary householder. A total of 9,861 households (32.8%) fall into this category. Meanwhile, the 15 to 24 years age bracket for the primary householder has the lowest median household income of $25,453, with 3,271 households (10.9%) in this group.
| Income Bracket | # Households | Median Income |
| 15 to 24 Years | 3,271 (10.9%) | $25,453 |
| 25 to 44 Years | 9,935 (33.0%) | $56,560 |
| 45 to 64 Years | 9,861 (32.8%) | $68,041 |
| 65+ Years | 7,040 (23.4%) | $47,298 |
| Total | 30,107 (100.0%) | $53,173 |
Poverty in Johnson City
Income Below Poverty by Sex and Age in Johnson City
With 20.1% poverty level for males and 23.2% for females among the residents of Johnson City, 16 and 17 year old males and 18 to 24 year old females are the most vulnerable to poverty, with 204 males (38.5%) and 2,499 females (45.6%) in their respective age groups living below the poverty level.
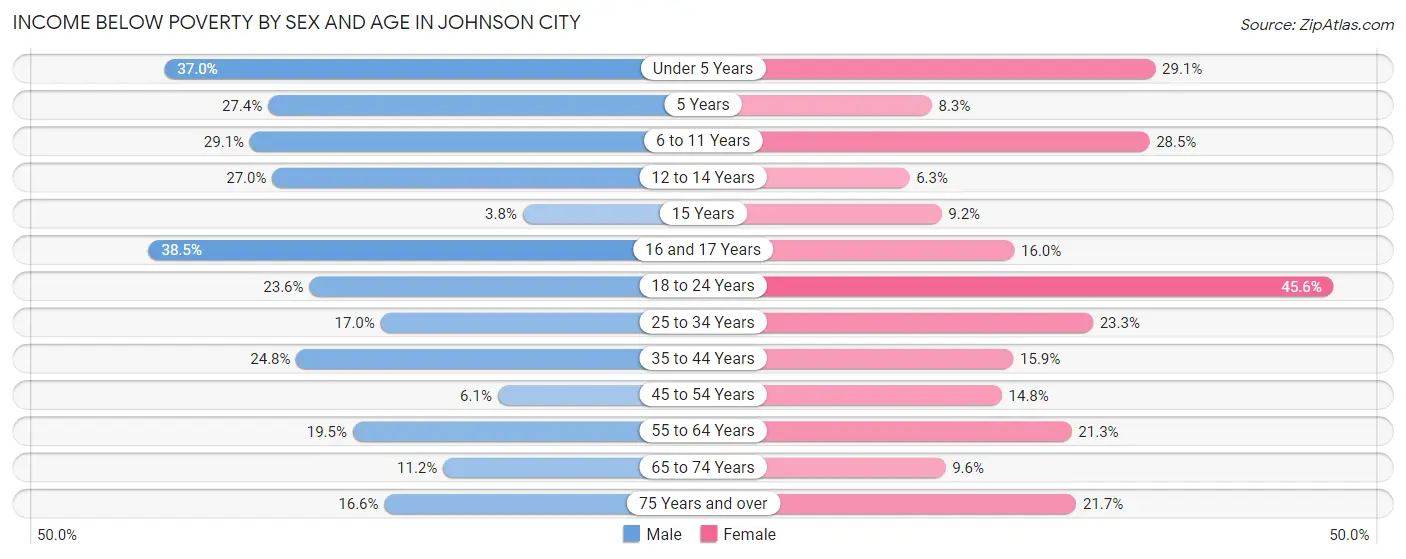
| Age Bracket | Male | Female |
| Under 5 Years | 707 (37.0%) | 538 (29.1%) |
| 5 Years | 145 (27.4%) | 14 (8.3%) |
| 6 to 11 Years | 639 (29.1%) | 637 (28.5%) |
| 12 to 14 Years | 269 (27.0%) | 58 (6.3%) |
| 15 Years | 9 (3.8%) | 29 (9.2%) |
| 16 and 17 Years | 204 (38.5%) | 133 (16.0%) |
| 18 to 24 Years | 975 (23.6%) | 2,499 (45.6%) |
| 25 to 34 Years | 848 (17.0%) | 1,200 (23.3%) |
| 35 to 44 Years | 1,088 (24.8%) | 624 (15.9%) |
| 45 to 54 Years | 243 (6.1%) | 609 (14.8%) |
| 55 to 64 Years | 765 (19.5%) | 876 (21.3%) |
| 65 to 74 Years | 325 (11.2%) | 317 (9.6%) |
| 75 Years and over | 250 (16.6%) | 526 (21.7%) |
| Total | 6,467 (20.1%) | 8,060 (23.2%) |
Income Above Poverty by Sex and Age in Johnson City
According to the poverty statistics in Johnson City, males aged 15 years and females aged 12 to 14 years are the age groups that are most secure financially, with 96.2% of males and 93.7% of females in these age groups living above the poverty line.
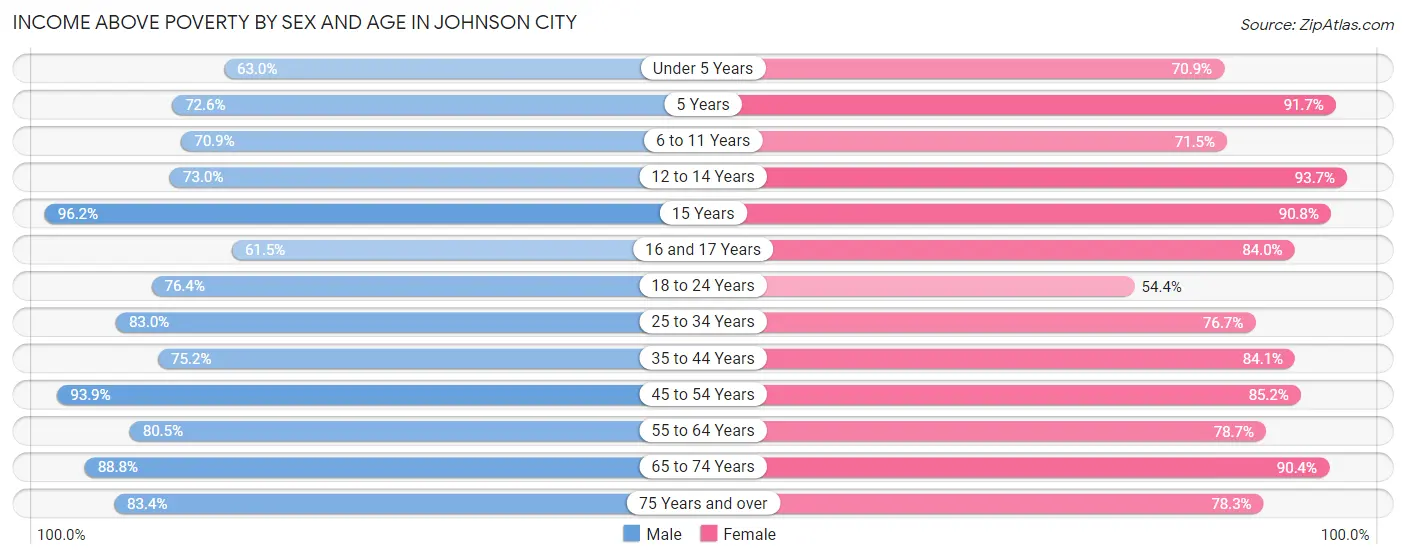
| Age Bracket | Male | Female |
| Under 5 Years | 1,203 (63.0%) | 1,312 (70.9%) |
| 5 Years | 384 (72.6%) | 154 (91.7%) |
| 6 to 11 Years | 1,558 (70.9%) | 1,596 (71.5%) |
| 12 to 14 Years | 727 (73.0%) | 869 (93.7%) |
| 15 Years | 230 (96.2%) | 285 (90.8%) |
| 16 and 17 Years | 326 (61.5%) | 699 (84.0%) |
| 18 to 24 Years | 3,162 (76.4%) | 2,976 (54.4%) |
| 25 to 34 Years | 4,151 (83.0%) | 3,953 (76.7%) |
| 35 to 44 Years | 3,303 (75.2%) | 3,301 (84.1%) |
| 45 to 54 Years | 3,745 (93.9%) | 3,497 (85.2%) |
| 55 to 64 Years | 3,151 (80.5%) | 3,235 (78.7%) |
| 65 to 74 Years | 2,588 (88.8%) | 2,986 (90.4%) |
| 75 Years and over | 1,255 (83.4%) | 1,894 (78.3%) |
| Total | 25,783 (79.9%) | 26,757 (76.8%) |
Income Below Poverty Among Married-Couple Families in Johnson City
The poverty statistics for married-couple families in Johnson City show that 7.4% or 861 of the total 11,645 families live below the poverty line. Families with 3 or 4 children have the highest poverty rate of 40.5%, comprising of 269 families. On the other hand, families with 5 or more children have the lowest poverty rate of 0.0%, which includes 0 families.
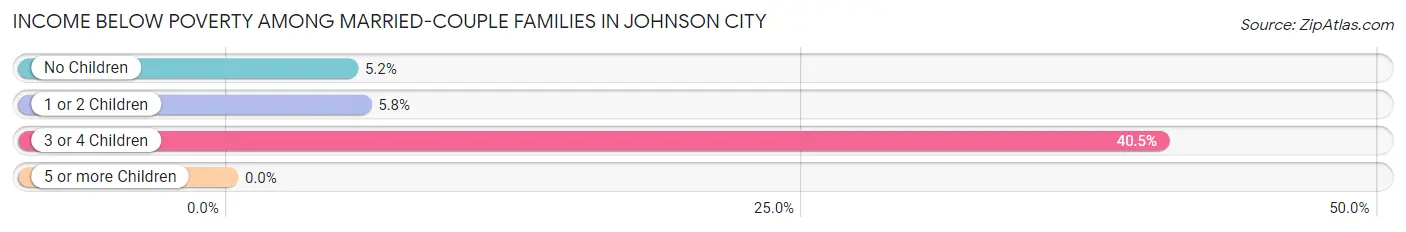
| Children | Above Poverty | Below Poverty |
| No Children | 6,955 (94.8%) | 383 (5.2%) |
| 1 or 2 Children | 3,393 (94.2%) | 209 (5.8%) |
| 3 or 4 Children | 395 (59.5%) | 269 (40.5%) |
| 5 or more Children | 41 (100.0%) | 0 (0.0%) |
| Total | 10,784 (92.6%) | 861 (7.4%) |
Income Below Poverty Among Single-Parent Households in Johnson City
According to the poverty data in Johnson City, 24.0% or 254 single-father households and 30.1% or 1,076 single-mother households are living below the poverty line. Among single-father households, those with 1 or 2 children have the highest poverty rate, with 145 households (34.2%) experiencing poverty. Likewise, among single-mother households, those with 3 or 4 children have the highest poverty rate, with 244 households (61.3%) falling below the poverty line.
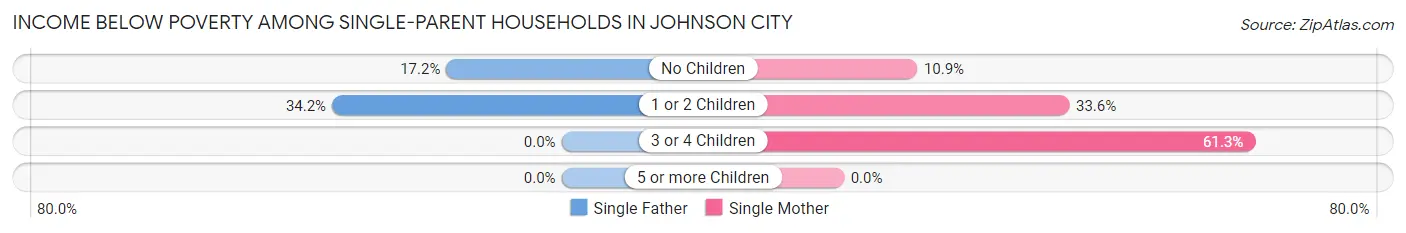
| Children | Single Father | Single Mother |
| No Children | 109 (17.2%) | 113 (10.9%) |
| 1 or 2 Children | 145 (34.2%) | 719 (33.6%) |
| 3 or 4 Children | 0 (0.0%) | 244 (61.3%) |
| 5 or more Children | 0 (0.0%) | 0 (0.0%) |
| Total | 254 (24.0%) | 1,076 (30.1%) |
Income Below Poverty Among Married-Couple vs Single-Parent Households in Johnson City
The poverty data for Johnson City shows that 861 of the married-couple family households (7.4%) and 1,330 of the single-parent households (28.7%) are living below the poverty level. Within the married-couple family households, those with 3 or 4 children have the highest poverty rate, with 269 households (40.5%) falling below the poverty line. Among the single-parent households, those with 3 or 4 children have the highest poverty rate, with 244 household (61.3%) living below poverty.
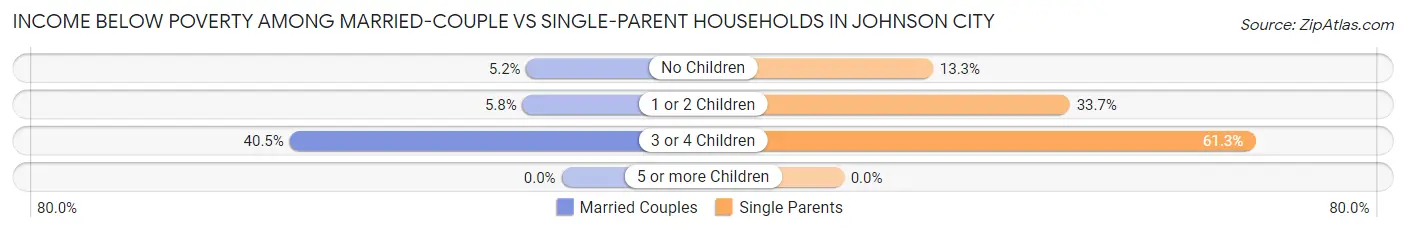
| Children | Married-Couple Families | Single-Parent Households |
| No Children | 383 (5.2%) | 222 (13.3%) |
| 1 or 2 Children | 209 (5.8%) | 864 (33.7%) |
| 3 or 4 Children | 269 (40.5%) | 244 (61.3%) |
| 5 or more Children | 0 (0.0%) | 0 (0.0%) |
| Total | 861 (7.4%) | 1,330 (28.7%) |
Race in Johnson City
The most populous races in Johnson City are White / Caucasian (60,053 | 84.9%), Black / African American (4,227 | 6.0%), and Hispanic or Latino (3,769 | 5.3%).
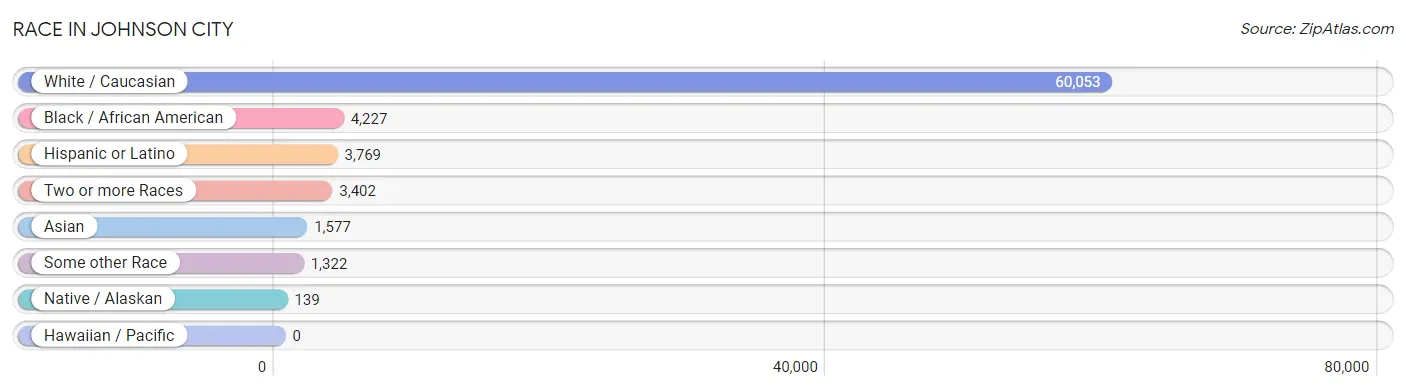
| Race | # Population | % Population |
| Asian | 1,577 | 2.2% |
| Black / African American | 4,227 | 6.0% |
| Hawaiian / Pacific | 0 | 0.0% |
| Hispanic or Latino | 3,769 | 5.3% |
| Native / Alaskan | 139 | 0.2% |
| White / Caucasian | 60,053 | 84.9% |
| Two or more Races | 3,402 | 4.8% |
| Some other Race | 1,322 | 1.9% |
| Total | 70,720 | 100.0% |
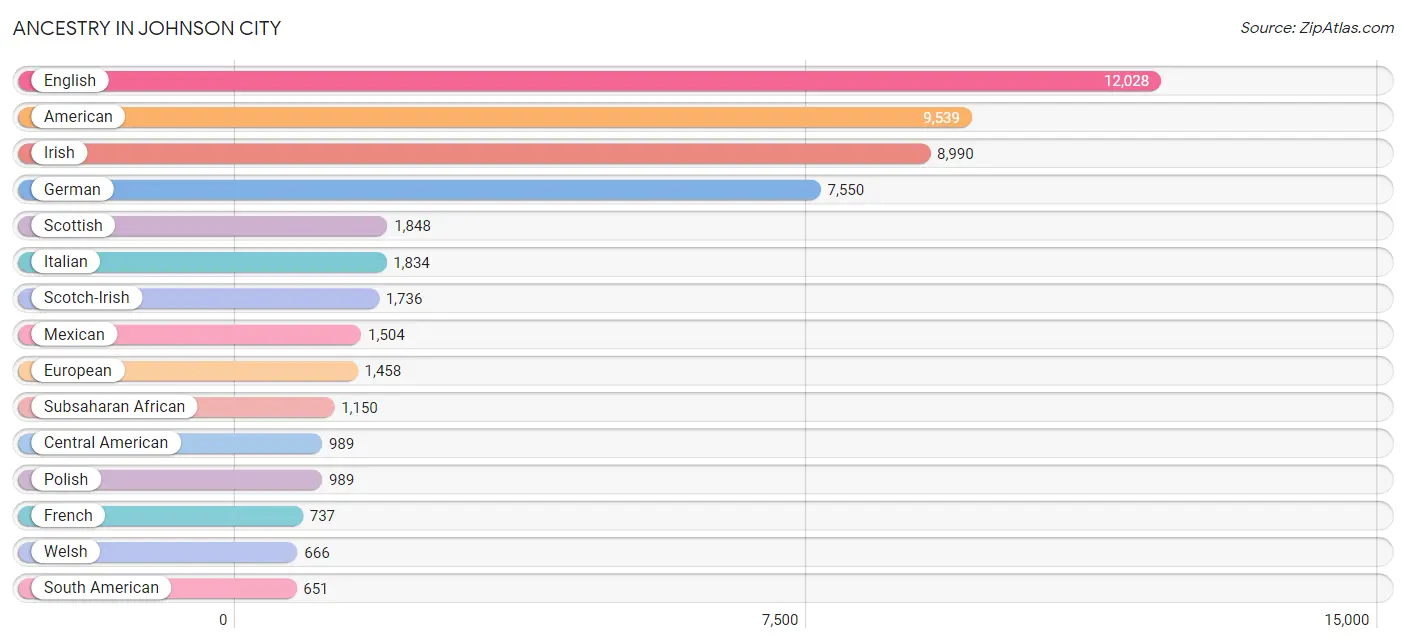
Ancestry in Johnson City
The most populous ancestries reported in Johnson City are English (12,028 | 17.0%), American (9,539 | 13.5%), Irish (8,990 | 12.7%), German (7,550 | 10.7%), and Scottish (1,848 | 2.6%), together accounting for 56.5% of all Johnson City residents.
| Ancestry | # Population | % Population |
| African | 156 | 0.2% |
| Albanian | 13 | 0.0% |
| American | 9,539 | 13.5% |
| Arab | 524 | 0.7% |
| Armenian | 26 | 0.0% |
| Assyrian / Chaldean / Syriac | 8 | 0.0% |
| Australian | 16 | 0.0% |
| Austrian | 246 | 0.4% |
| Belgian | 29 | 0.0% |
| Bhutanese | 261 | 0.4% |
| Blackfeet | 14 | 0.0% |
| Bolivian | 16 | 0.0% |
| Brazilian | 30 | 0.0% |
| British | 379 | 0.5% |
| Bulgarian | 20 | 0.0% |
| Burmese | 113 | 0.2% |
| Canadian | 46 | 0.1% |
| Central American | 989 | 1.4% |
| Central American Indian | 19 | 0.0% |
| Cherokee | 195 | 0.3% |
| Chilean | 158 | 0.2% |
| Choctaw | 4 | 0.0% |
| Colombian | 156 | 0.2% |
| Costa Rican | 18 | 0.0% |
| Creek | 11 | 0.0% |
| Cuban | 159 | 0.2% |
| Czech | 38 | 0.1% |
| Czechoslovakian | 18 | 0.0% |
| Danish | 80 | 0.1% |
| Dominican | 5 | 0.0% |
| Dutch | 625 | 0.9% |
| Eastern European | 183 | 0.3% |
| Ecuadorian | 52 | 0.1% |
| Egyptian | 125 | 0.2% |
| English | 12,028 | 17.0% |
| Ethiopian | 65 | 0.1% |
| European | 1,458 | 2.1% |
| French | 737 | 1.0% |
| French Canadian | 246 | 0.4% |
| German | 7,550 | 10.7% |
| German Russian | 112 | 0.2% |
| Ghanaian | 153 | 0.2% |
| Greek | 26 | 0.0% |
| Guatemalan | 29 | 0.0% |
| Haitian | 15 | 0.0% |
| Honduran | 417 | 0.6% |
| Hungarian | 86 | 0.1% |
| Indian (Asian) | 599 | 0.9% |
| Iranian | 21 | 0.0% |
| Irish | 8,990 | 12.7% |
| Iroquois | 11 | 0.0% |
| Italian | 1,834 | 2.6% |
| Jamaican | 45 | 0.1% |
| Japanese | 67 | 0.1% |
| Jordanian | 130 | 0.2% |
| Korean | 415 | 0.6% |
| Lebanese | 36 | 0.1% |
| Liberian | 337 | 0.5% |
| Lithuanian | 78 | 0.1% |
| Luxembourger | 3 | 0.0% |
| Malaysian | 9 | 0.0% |
| Mexican | 1,504 | 2.1% |
| Mexican American Indian | 56 | 0.1% |
| Mongolian | 70 | 0.1% |
| Native Hawaiian | 231 | 0.3% |
| Navajo | 3 | 0.0% |
| Nicaraguan | 12 | 0.0% |
| Nigerian | 136 | 0.2% |
| Northern European | 269 | 0.4% |
| Norwegian | 366 | 0.5% |
| Pakistani | 32 | 0.1% |
| Panamanian | 40 | 0.1% |
| Peruvian | 13 | 0.0% |
| Polish | 989 | 1.4% |
| Portuguese | 71 | 0.1% |
| Puerto Rican | 171 | 0.2% |
| Romanian | 120 | 0.2% |
| Russian | 89 | 0.1% |
| Salvadoran | 473 | 0.7% |
| Scandinavian | 367 | 0.5% |
| Scotch-Irish | 1,736 | 2.5% |
| Scottish | 1,848 | 2.6% |
| Seminole | 27 | 0.0% |
| Sioux | 14 | 0.0% |
| Slavic | 8 | 0.0% |
| Slovak | 39 | 0.1% |
| Slovene | 21 | 0.0% |
| South American | 651 | 0.9% |
| Spaniard | 17 | 0.0% |
| Spanish | 85 | 0.1% |
| Sri Lankan | 36 | 0.1% |
| Subsaharan African | 1,150 | 1.6% |
| Swedish | 354 | 0.5% |
| Swiss | 214 | 0.3% |
| Thai | 454 | 0.6% |
| Turkish | 59 | 0.1% |
| Ukrainian | 48 | 0.1% |
| Venezuelan | 256 | 0.4% |
| Welsh | 666 | 0.9% |
| West Indian | 20 | 0.0% |
| Yugoslavian | 21 | 0.0% |
| Zimbabwean | 25 | 0.0% | View All 102 Rows |
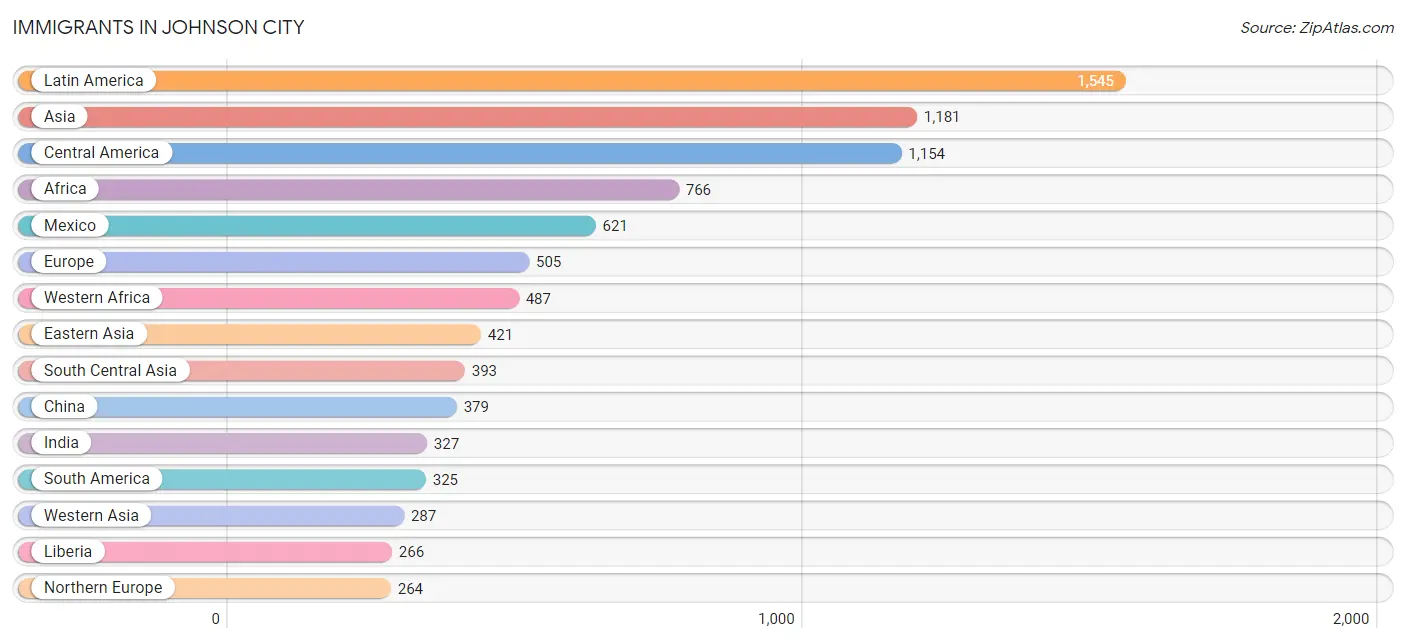
Immigrants in Johnson City
The most numerous immigrant groups reported in Johnson City came from Latin America (1,545 | 2.2%), Asia (1,181 | 1.7%), Central America (1,154 | 1.6%), Africa (766 | 1.1%), and Mexico (621 | 0.9%), together accounting for 7.4% of all Johnson City residents.
| Immigration Origin | # Population | % Population |
| Africa | 766 | 1.1% |
| Albania | 13 | 0.0% |
| Argentina | 8 | 0.0% |
| Asia | 1,181 | 1.7% |
| Australia | 16 | 0.0% |
| Austria | 18 | 0.0% |
| Bolivia | 7 | 0.0% |
| Bosnia and Herzegovina | 30 | 0.0% |
| Brazil | 57 | 0.1% |
| Cambodia | 36 | 0.1% |
| Cameroon | 61 | 0.1% |
| Canada | 125 | 0.2% |
| Caribbean | 66 | 0.1% |
| Central America | 1,154 | 1.6% |
| Chile | 158 | 0.2% |
| China | 379 | 0.5% |
| Costa Rica | 7 | 0.0% |
| Cuba | 11 | 0.0% |
| Eastern Africa | 78 | 0.1% |
| Eastern Asia | 421 | 0.6% |
| Eastern Europe | 161 | 0.2% |
| Egypt | 47 | 0.1% |
| El Salvador | 171 | 0.2% |
| England | 160 | 0.2% |
| Ethiopia | 21 | 0.0% |
| Europe | 505 | 0.7% |
| Germany | 50 | 0.1% |
| Ghana | 103 | 0.2% |
| Grenada | 20 | 0.0% |
| Guatemala | 92 | 0.1% |
| Honduras | 243 | 0.3% |
| India | 327 | 0.5% |
| Iraq | 13 | 0.0% |
| Japan | 17 | 0.0% |
| Jordan | 114 | 0.2% |
| Korea | 25 | 0.0% |
| Kuwait | 8 | 0.0% |
| Latin America | 1,545 | 2.2% |
| Latvia | 10 | 0.0% |
| Liberia | 266 | 0.4% |
| Mexico | 621 | 0.9% |
| Middle Africa | 96 | 0.1% |
| Morocco | 38 | 0.1% |
| Nigeria | 118 | 0.2% |
| Northern Africa | 97 | 0.1% |
| Northern Europe | 264 | 0.4% |
| Norway | 5 | 0.0% |
| Oceania | 16 | 0.0% |
| Pakistan | 65 | 0.1% |
| Panama | 20 | 0.0% |
| Peru | 13 | 0.0% |
| Philippines | 23 | 0.0% |
| Romania | 81 | 0.1% |
| Russia | 5 | 0.0% |
| Saudi Arabia | 79 | 0.1% |
| South America | 325 | 0.5% |
| South Central Asia | 393 | 0.6% |
| South Eastern Asia | 72 | 0.1% |
| Switzerland | 12 | 0.0% |
| Taiwan | 22 | 0.0% |
| Trinidad and Tobago | 17 | 0.0% |
| Turkey | 73 | 0.1% |
| Ukraine | 22 | 0.0% |
| Uzbekistan | 1 | 0.0% |
| Venezuela | 82 | 0.1% |
| Vietnam | 13 | 0.0% |
| Western Africa | 487 | 0.7% |
| Western Asia | 287 | 0.4% |
| Western Europe | 80 | 0.1% |
| Zaire | 35 | 0.1% |
| Zimbabwe | 25 | 0.0% | View All 71 Rows |
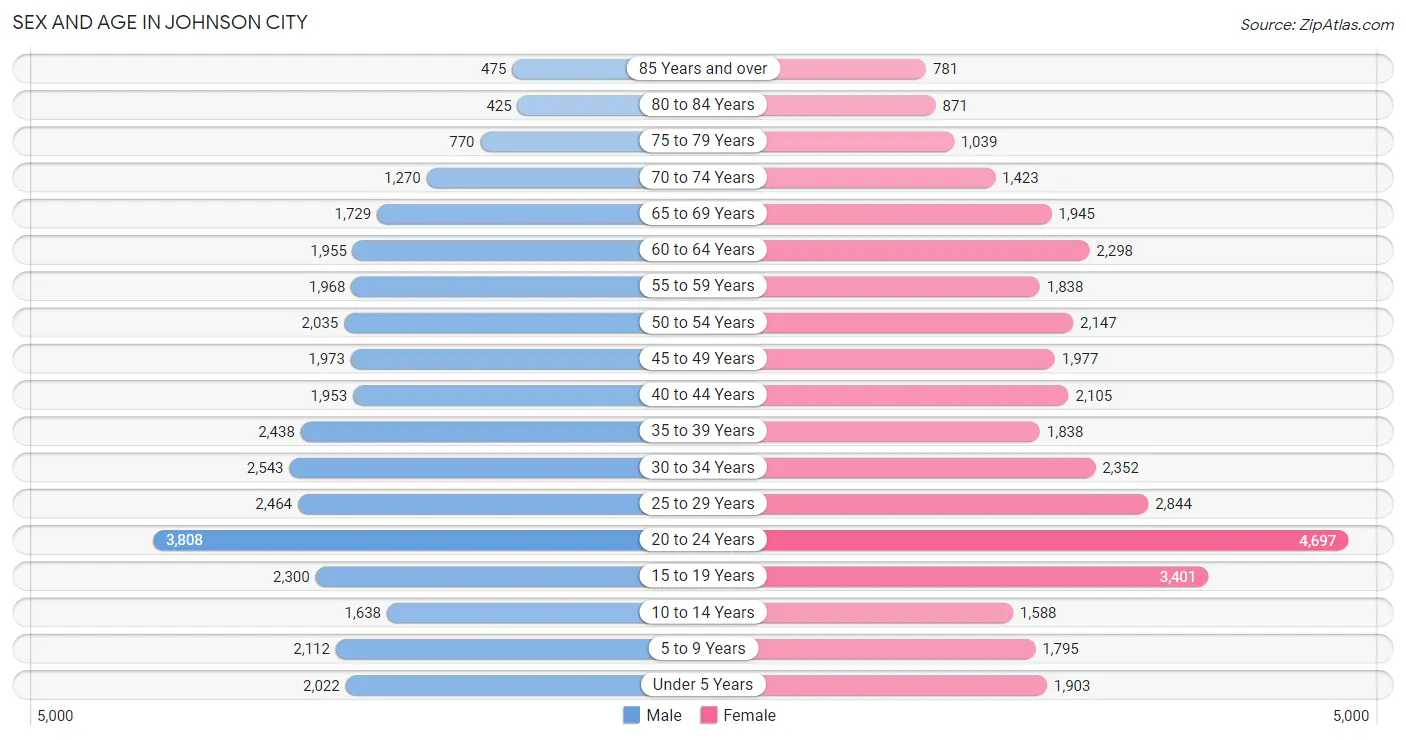
Sex and Age in Johnson City
Sex and Age in Johnson City
The most populous age groups in Johnson City are 20 to 24 Years (3,808 | 11.2%) for men and 20 to 24 Years (4,697 | 12.8%) for women.
| Age Bracket | Male | Female |
| Under 5 Years | 2,022 (6.0%) | 1,903 (5.2%) |
| 5 to 9 Years | 2,112 (6.2%) | 1,795 (4.9%) |
| 10 to 14 Years | 1,638 (4.8%) | 1,588 (4.3%) |
| 15 to 19 Years | 2,300 (6.8%) | 3,401 (9.2%) |
| 20 to 24 Years | 3,808 (11.2%) | 4,697 (12.8%) |
| 25 to 29 Years | 2,464 (7.3%) | 2,844 (7.7%) |
| 30 to 34 Years | 2,543 (7.5%) | 2,352 (6.4%) |
| 35 to 39 Years | 2,438 (7.2%) | 1,838 (5.0%) |
| 40 to 44 Years | 1,953 (5.8%) | 2,105 (5.7%) |
| 45 to 49 Years | 1,973 (5.8%) | 1,977 (5.4%) |
| 50 to 54 Years | 2,035 (6.0%) | 2,147 (5.8%) |
| 55 to 59 Years | 1,968 (5.8%) | 1,838 (5.0%) |
| 60 to 64 Years | 1,955 (5.8%) | 2,298 (6.2%) |
| 65 to 69 Years | 1,729 (5.1%) | 1,945 (5.3%) |
| 70 to 74 Years | 1,270 (3.7%) | 1,423 (3.9%) |
| 75 to 79 Years | 770 (2.3%) | 1,039 (2.8%) |
| 80 to 84 Years | 425 (1.3%) | 871 (2.4%) |
| 85 Years and over | 475 (1.4%) | 781 (2.1%) |
| Total | 33,878 (100.0%) | 36,842 (100.0%) |
Families and Households in Johnson City
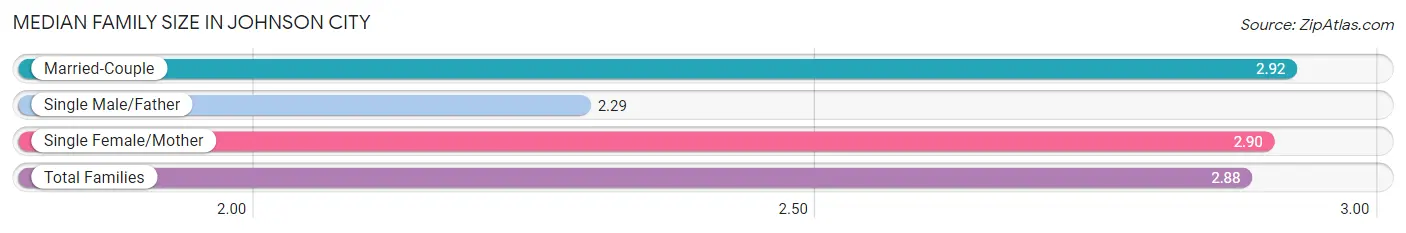
Median Family Size in Johnson City
The median family size in Johnson City is 2.88 persons per family, with married-couple families (11,645 | 71.5%) accounting for the largest median family size of 2.92 persons per family. On the other hand, single male/father families (1,059 | 6.5%) represent the smallest median family size with 2.29 persons per family.
| Family Type | # Families | Family Size |
| Married-Couple | 11,645 (71.5%) | 2.92 |
| Single Male/Father | 1,059 (6.5%) | 2.29 |
| Single Female/Mother | 3,574 (22.0%) | 2.90 |
| Total Families | 16,278 (100.0%) | 2.88 |
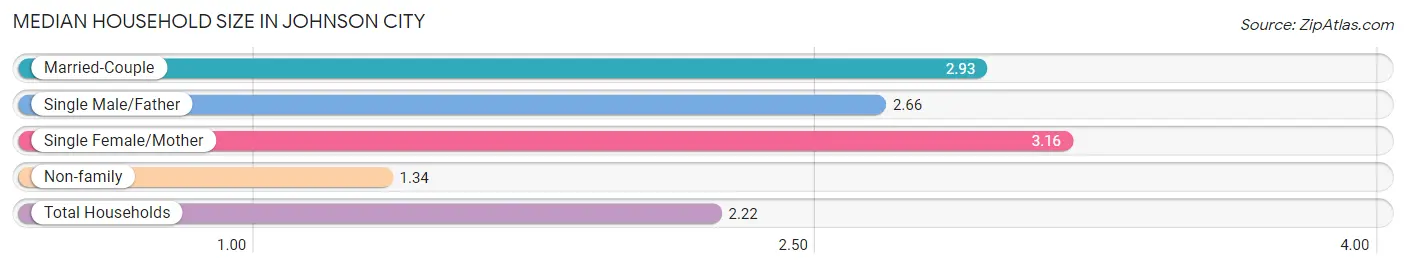
Median Household Size in Johnson City
The median household size in Johnson City is 2.22 persons per household, with single female/mother households (3,574 | 11.9%) accounting for the largest median household size of 3.16 persons per household. non-family households (13,829 | 45.9%) represent the smallest median household size with 1.34 persons per household.
| Household Type | # Households | Household Size |
| Married-Couple | 11,645 (38.7%) | 2.93 |
| Single Male/Father | 1,059 (3.5%) | 2.66 |
| Single Female/Mother | 3,574 (11.9%) | 3.16 |
| Non-family | 13,829 (45.9%) | 1.34 |
| Total Households | 30,107 (100.0%) | 2.22 |
Household Size by Marriage Status in Johnson City
Out of a total of 30,107 households in Johnson City, 16,278 (54.1%) are family households, while 13,829 (45.9%) are nonfamily households. The most numerous type of family households are 2-person households, comprising 7,803, and the most common type of nonfamily households are 1-person households, comprising 10,586.
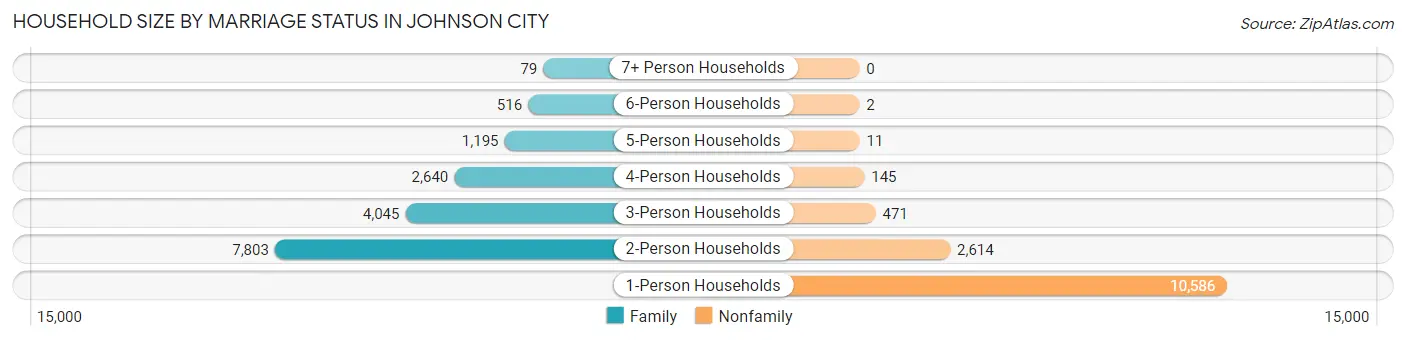
| Household Size | Family Households | Nonfamily Households |
| 1-Person Households | - | 10,586 (35.2%) |
| 2-Person Households | 7,803 (25.9%) | 2,614 (8.7%) |
| 3-Person Households | 4,045 (13.4%) | 471 (1.6%) |
| 4-Person Households | 2,640 (8.8%) | 145 (0.5%) |
| 5-Person Households | 1,195 (4.0%) | 11 (0.0%) |
| 6-Person Households | 516 (1.7%) | 2 (0.0%) |
| 7+ Person Households | 79 (0.3%) | 0 (0.0%) |
| Total | 16,278 (54.1%) | 13,829 (45.9%) |
Female Fertility in Johnson City
Fertility by Age in Johnson City
Average fertility rate in Johnson City is 35.0 births per 1,000 women. Women in the age bracket of 20 to 34 years have the highest fertility rate with 53.0 births per 1,000 women. Women in the age bracket of 20 to 34 years acount for 76.3% of all women with births.
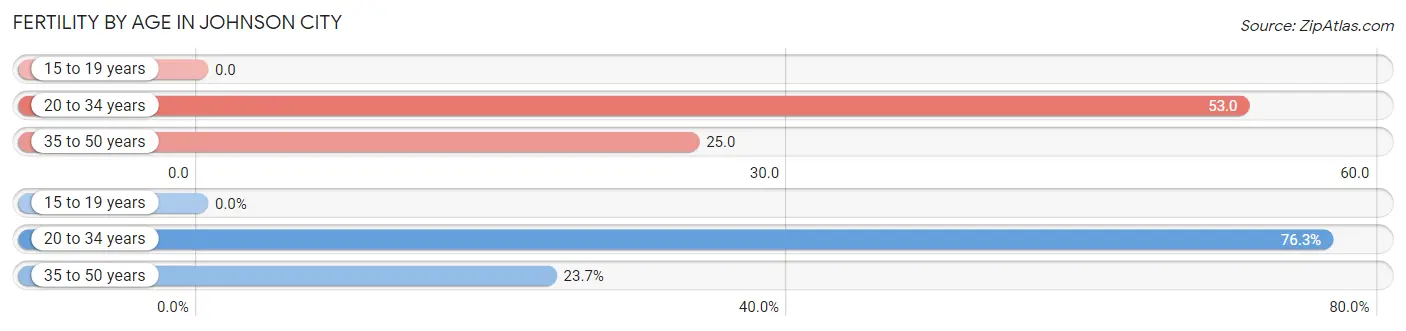
| Age Bracket | Women with Births | Births / 1,000 Women |
| 15 to 19 years | 0 (0.0%) | 0.0 |
| 20 to 34 years | 526 (76.3%) | 53.0 |
| 35 to 50 years | 163 (23.7%) | 25.0 |
| Total | 689 (100.0%) | 35.0 |
Fertility by Age by Marriage Status in Johnson City
78.1% of women with births (689) in Johnson City are married. The highest percentage of unmarried women with births falls into 35 to 50 years age bracket with 35.6% of them unmarried at the time of birth, while the lowest percentage of unmarried women with births belong to 20 to 34 years age bracket with 17.7% of them unmarried.
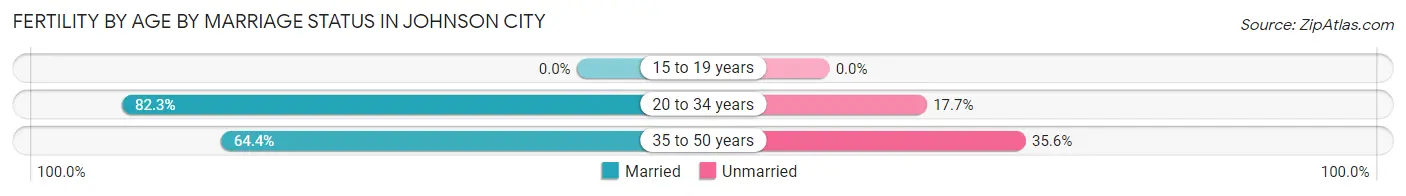
| Age Bracket | Married | Unmarried |
| 15 to 19 years | 0 (0.0%) | 0 (0.0%) |
| 20 to 34 years | 433 (82.3%) | 93 (17.7%) |
| 35 to 50 years | 105 (64.4%) | 58 (35.6%) |
| Total | 538 (78.1%) | 151 (21.9%) |
Fertility by Education in Johnson City
Average fertility rate in Johnson City is 35.0 births per 1,000 women. Women with the education attainment of bachelor's degree have the highest fertility rate of 44.0 births per 1,000 women, while women with the education attainment of less than high school have the lowest fertility at 15.0 births per 1,000 women. Women with the education attainment of college or associate's degree represent 39.9% of all women with births.
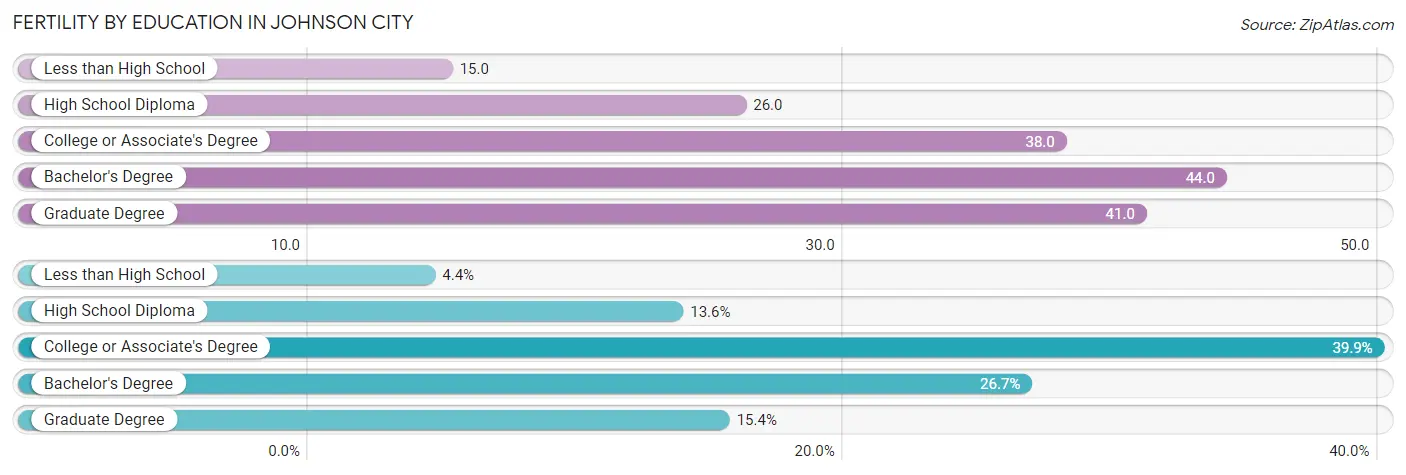
| Educational Attainment | Women with Births | Births / 1,000 Women |
| Less than High School | 30 (4.3%) | 15.0 |
| High School Diploma | 94 (13.6%) | 26.0 |
| College or Associate's Degree | 275 (39.9%) | 38.0 |
| Bachelor's Degree | 184 (26.7%) | 44.0 |
| Graduate Degree | 106 (15.4%) | 41.0 |
| Total | 689 (100.0%) | 35.0 |
Fertility by Education by Marriage Status in Johnson City
21.9% of women with births in Johnson City are unmarried. Women with the educational attainment of graduate degree are most likely to be married with 93.4% of them married at childbirth, while women with the educational attainment of less than high school are least likely to be married with 100.0% of them unmarried at childbirth.
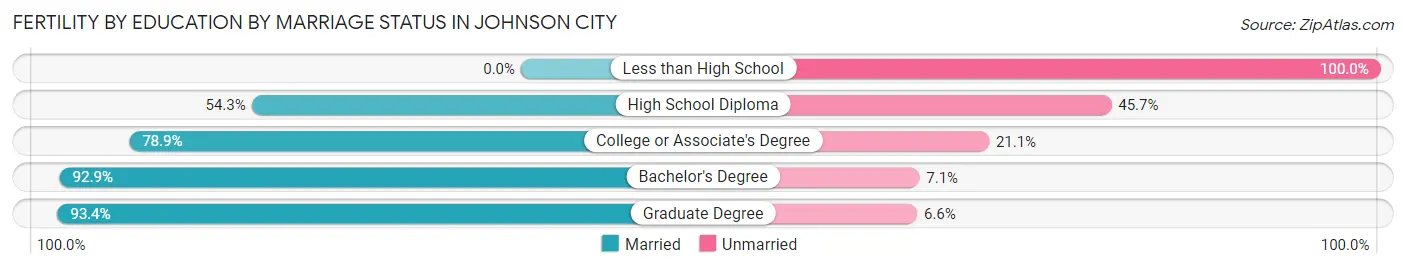
| Educational Attainment | Married | Unmarried |
| Less than High School | 0 (0.0%) | 30 (100.0%) |
| High School Diploma | 51 (54.3%) | 43 (45.7%) |
| College or Associate's Degree | 217 (78.9%) | 58 (21.1%) |
| Bachelor's Degree | 171 (92.9%) | 13 (7.1%) |
| Graduate Degree | 99 (93.4%) | 7 (6.6%) |
| Total | 538 (78.1%) | 151 (21.9%) |
Employment Characteristics in Johnson City
Employment by Class of Employer in Johnson City
Among the 33,544 employed individuals in Johnson City, private company employees (21,717 | 64.7%), not-for-profit organizations (3,504 | 10.4%), and state government employees (2,312 | 6.9%) make up the most common classes of employment.
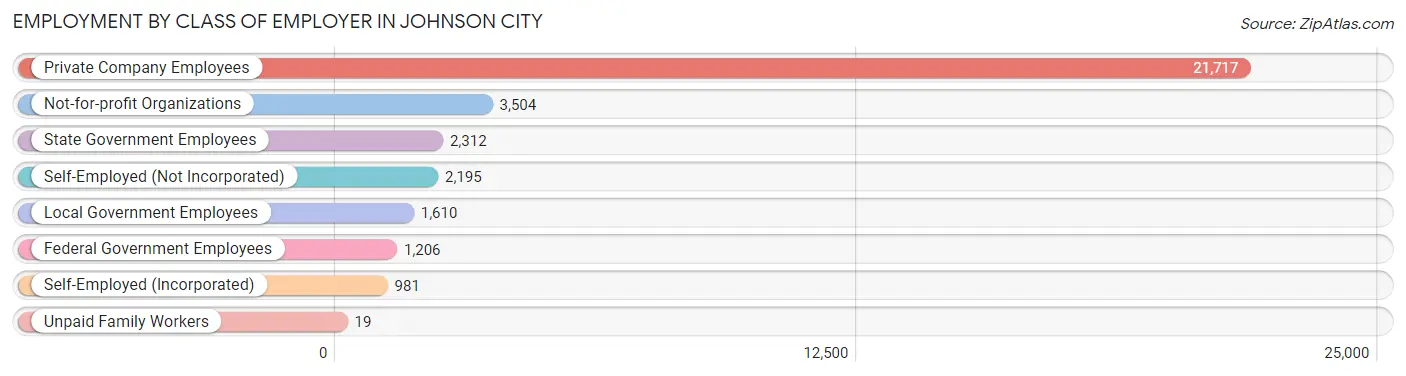
| Employer Class | # Employees | % Employees |
| Private Company Employees | 21,717 | 64.7% |
| Self-Employed (Incorporated) | 981 | 2.9% |
| Self-Employed (Not Incorporated) | 2,195 | 6.5% |
| Not-for-profit Organizations | 3,504 | 10.4% |
| Local Government Employees | 1,610 | 4.8% |
| State Government Employees | 2,312 | 6.9% |
| Federal Government Employees | 1,206 | 3.6% |
| Unpaid Family Workers | 19 | 0.1% |
| Total | 33,544 | 100.0% |
Employment Status by Age in Johnson City
According to the labor force statistics for Johnson City, out of the total population over 16 years of age (59,107), 62.0% or 36,646 individuals are in the labor force, with 6.1% or 2,235 of them unemployed. The age group with the highest labor force participation rate is 30 to 34 years, with 85.1% or 4,166 individuals in the labor force. Within the labor force, the 55 to 59 years age range has the highest percentage of unemployed individuals, with 10.0% or 261 of them being unemployed.
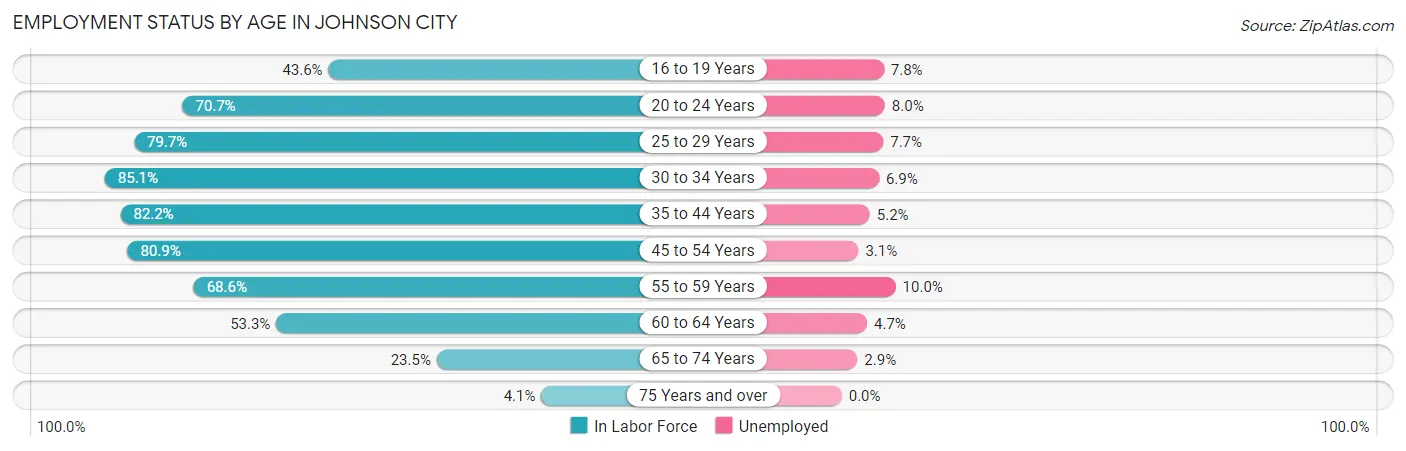
| Age Bracket | In Labor Force | Unemployed |
| 16 to 19 Years | 2,244 (43.6%) | 175 (7.8%) |
| 20 to 24 Years | 6,013 (70.7%) | 481 (8.0%) |
| 25 to 29 Years | 4,230 (79.7%) | 326 (7.7%) |
| 30 to 34 Years | 4,166 (85.1%) | 287 (6.9%) |
| 35 to 44 Years | 6,851 (82.2%) | 356 (5.2%) |
| 45 to 54 Years | 6,579 (80.9%) | 204 (3.1%) |
| 55 to 59 Years | 2,611 (68.6%) | 261 (10.0%) |
| 60 to 64 Years | 2,267 (53.3%) | 107 (4.7%) |
| 65 to 74 Years | 1,496 (23.5%) | 43 (2.9%) |
| 75 Years and over | 179 (4.1%) | 0 (0.0%) |
| Total | 36,646 (62.0%) | 2,235 (6.1%) |
Employment Status by Educational Attainment in Johnson City
According to labor force statistics for Johnson City, 76.9% of individuals (26,706) out of the total population between 25 and 64 years of age (34,728) are in the labor force, with 5.8% or 1,549 of them being unemployed. The group with the highest labor force participation rate are those with the educational attainment of bachelor's degree or higher, with 84.4% or 12,779 individuals in the labor force. Within the labor force, individuals with less than high school education have the highest percentage of unemployment, with 15.7% or 256 of them being unemployed.
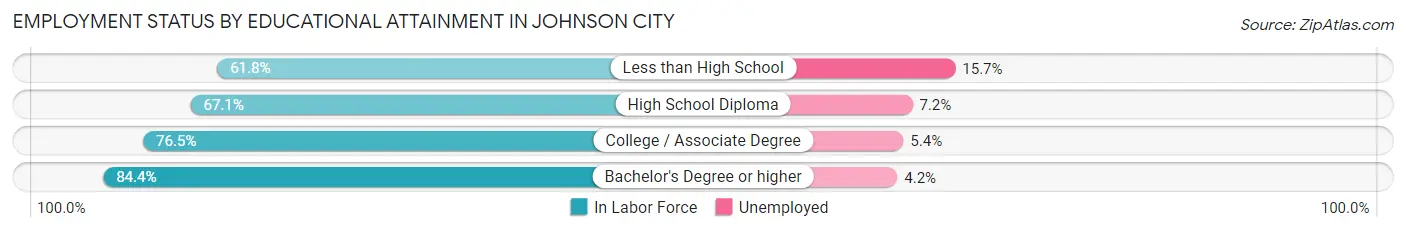
| Educational Attainment | In Labor Force | Unemployed |
| Less than High School | 1,632 (61.8%) | 415 (15.7%) |
| High School Diploma | 4,729 (67.1%) | 507 (7.2%) |
| College / Associate Degree | 7,572 (76.5%) | 534 (5.4%) |
| Bachelor's Degree or higher | 12,779 (84.4%) | 636 (4.2%) |
| Total | 26,706 (76.9%) | 2,014 (5.8%) |
Employment Occupations by Sex in Johnson City
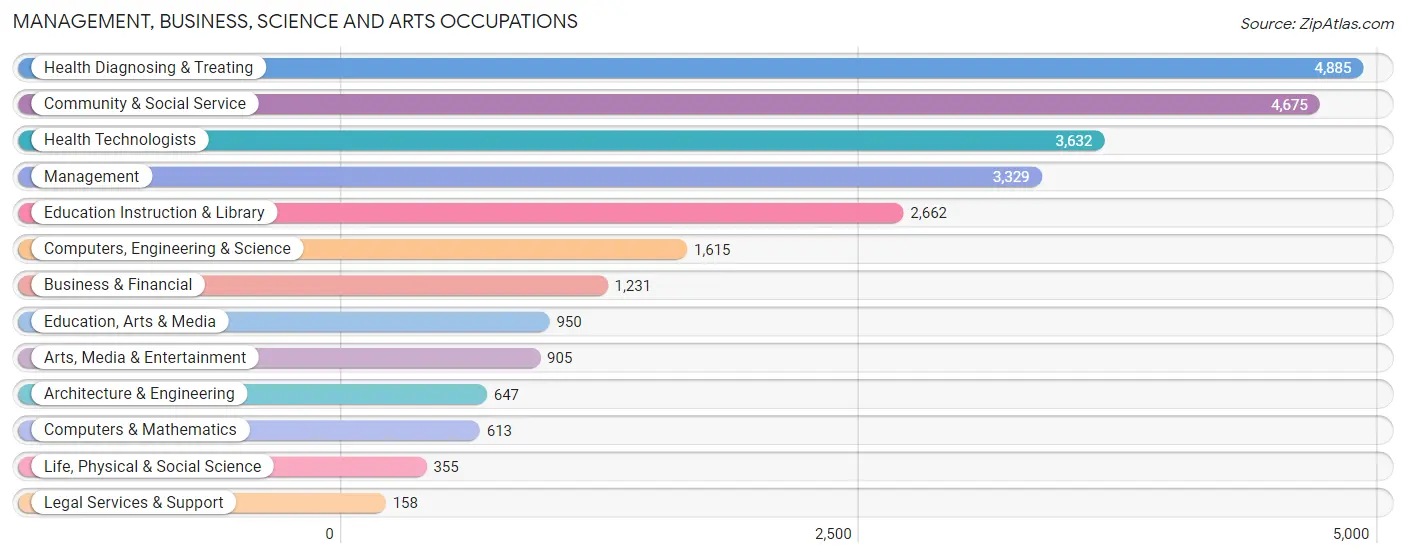
Management, Business, Science and Arts Occupations
The most common Management, Business, Science and Arts occupations in Johnson City are Health Diagnosing & Treating (4,885 | 14.2%), Community & Social Service (4,675 | 13.6%), Health Technologists (3,632 | 10.6%), Management (3,329 | 9.7%), and Education Instruction & Library (2,662 | 7.8%).
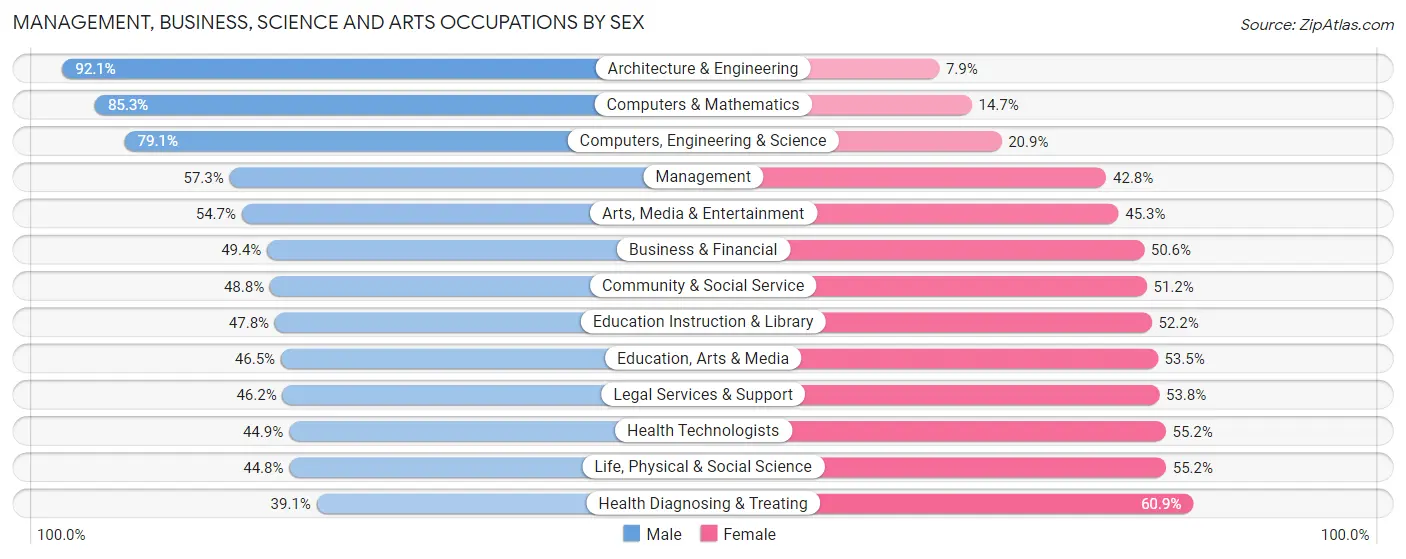
Management, Business, Science and Arts Occupations by Sex
Within the Management, Business, Science and Arts occupations in Johnson City, the most male-oriented occupations are Architecture & Engineering (92.1%), Computers & Mathematics (85.3%), and Computers, Engineering & Science (79.1%), while the most female-oriented occupations are Health Diagnosing & Treating (60.9%), Life, Physical & Social Science (55.2%), and Health Technologists (55.1%).
| Occupation | Male | Female |
| Management | 1,906 (57.3%) | 1,423 (42.7%) |
| Business & Financial | 608 (49.4%) | 623 (50.6%) |
| Computers, Engineering & Science | 1,278 (79.1%) | 337 (20.9%) |
| Computers & Mathematics | 523 (85.3%) | 90 (14.7%) |
| Architecture & Engineering | 596 (92.1%) | 51 (7.9%) |
| Life, Physical & Social Science | 159 (44.8%) | 196 (55.2%) |
| Community & Social Service | 2,282 (48.8%) | 2,393 (51.2%) |
| Education, Arts & Media | 442 (46.5%) | 508 (53.5%) |
| Legal Services & Support | 73 (46.2%) | 85 (53.8%) |
| Education Instruction & Library | 1,272 (47.8%) | 1,390 (52.2%) |
| Arts, Media & Entertainment | 495 (54.7%) | 410 (45.3%) |
| Health Diagnosing & Treating | 1,909 (39.1%) | 2,976 (60.9%) |
| Health Technologists | 1,629 (44.9%) | 2,003 (55.1%) |
| Total (Category) | 7,983 (50.7%) | 7,752 (49.3%) |
| Total (Overall) | 17,404 (50.7%) | 16,905 (49.3%) |
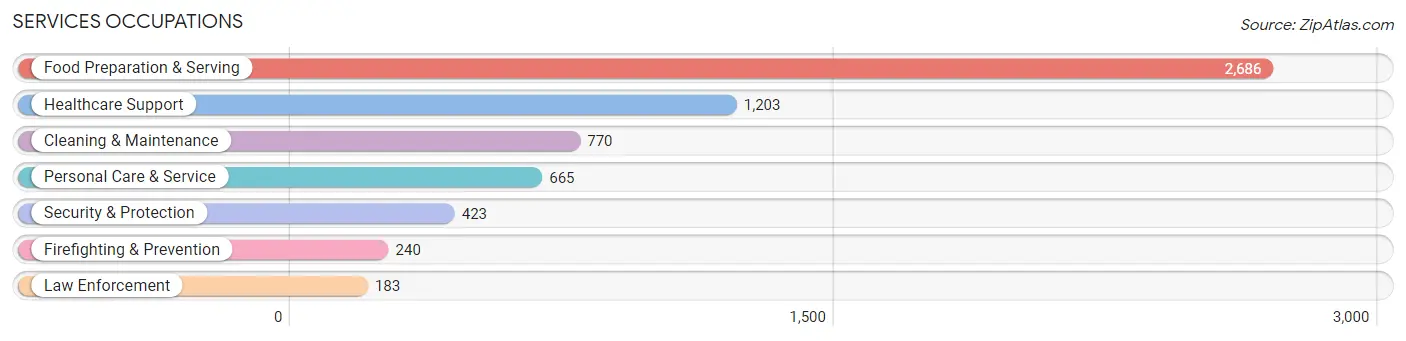
Services Occupations
The most common Services occupations in Johnson City are Food Preparation & Serving (2,686 | 7.8%), Healthcare Support (1,203 | 3.5%), Cleaning & Maintenance (770 | 2.2%), Personal Care & Service (665 | 1.9%), and Security & Protection (423 | 1.2%).
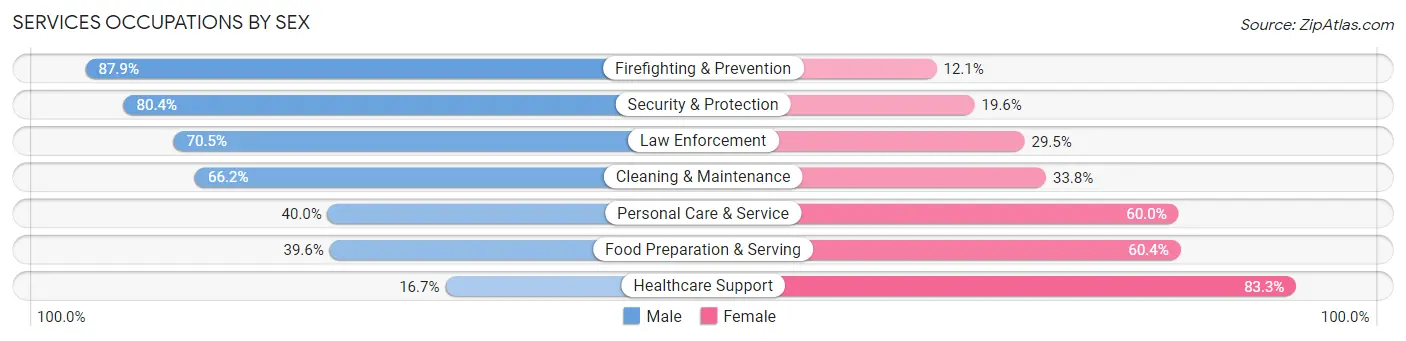
Services Occupations by Sex
Within the Services occupations in Johnson City, the most male-oriented occupations are Firefighting & Prevention (87.9%), Security & Protection (80.4%), and Law Enforcement (70.5%), while the most female-oriented occupations are Healthcare Support (83.3%), Food Preparation & Serving (60.4%), and Personal Care & Service (60.0%).
| Occupation | Male | Female |
| Healthcare Support | 201 (16.7%) | 1,002 (83.3%) |
| Security & Protection | 340 (80.4%) | 83 (19.6%) |
| Firefighting & Prevention | 211 (87.9%) | 29 (12.1%) |
| Law Enforcement | 129 (70.5%) | 54 (29.5%) |
| Food Preparation & Serving | 1,064 (39.6%) | 1,622 (60.4%) |
| Cleaning & Maintenance | 510 (66.2%) | 260 (33.8%) |
| Personal Care & Service | 266 (40.0%) | 399 (60.0%) |
| Total (Category) | 2,381 (41.4%) | 3,366 (58.6%) |
| Total (Overall) | 17,404 (50.7%) | 16,905 (49.3%) |
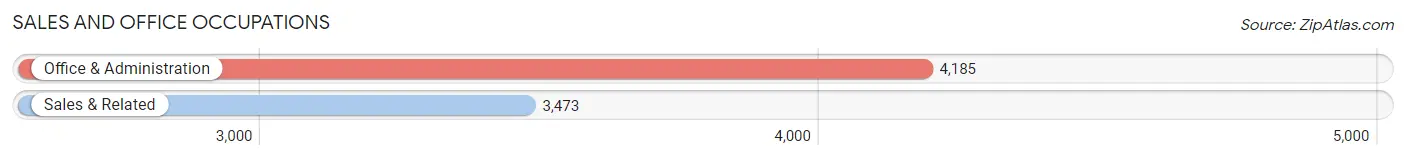
Sales and Office Occupations
The most common Sales and Office occupations in Johnson City are Office & Administration (4,185 | 12.2%), and Sales & Related (3,473 | 10.1%).
Sales and Office Occupations by Sex
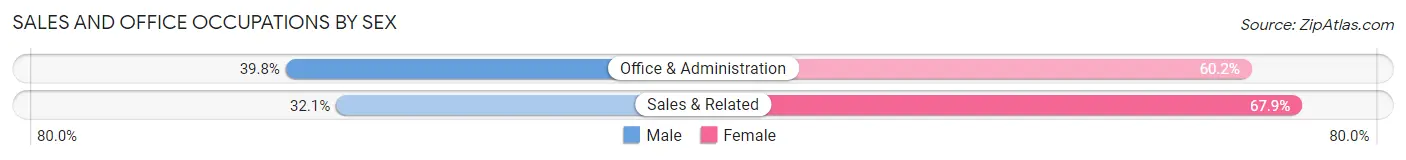
| Occupation | Male | Female |
| Sales & Related | 1,114 (32.1%) | 2,359 (67.9%) |
| Office & Administration | 1,667 (39.8%) | 2,518 (60.2%) |
| Total (Category) | 2,781 (36.3%) | 4,877 (63.7%) |
| Total (Overall) | 17,404 (50.7%) | 16,905 (49.3%) |
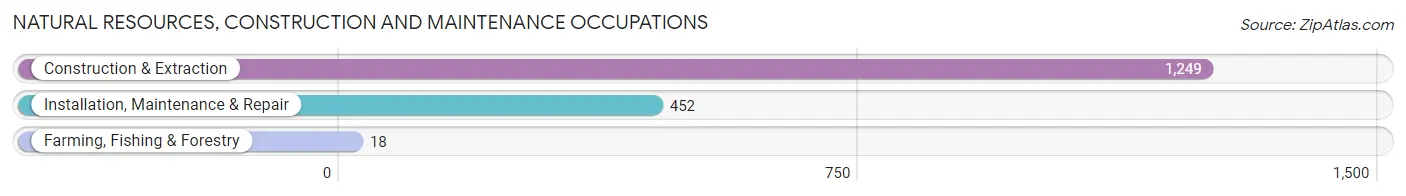
Natural Resources, Construction and Maintenance Occupations
The most common Natural Resources, Construction and Maintenance occupations in Johnson City are Construction & Extraction (1,249 | 3.6%), Installation, Maintenance & Repair (452 | 1.3%), and Farming, Fishing & Forestry (18 | 0.1%).
Natural Resources, Construction and Maintenance Occupations by Sex
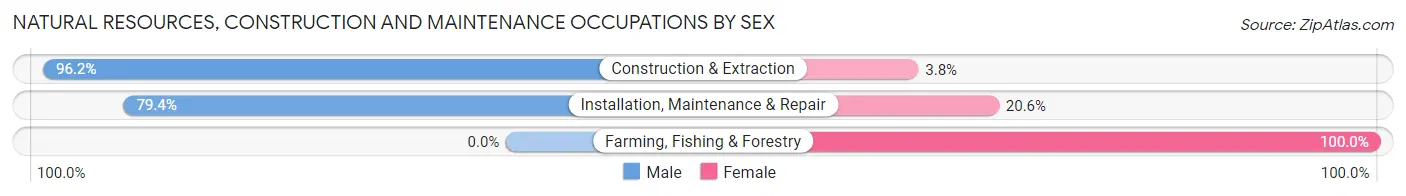
| Occupation | Male | Female |
| Farming, Fishing & Forestry | 0 (0.0%) | 18 (100.0%) |
| Construction & Extraction | 1,201 (96.2%) | 48 (3.8%) |
| Installation, Maintenance & Repair | 359 (79.4%) | 93 (20.6%) |
| Total (Category) | 1,560 (90.7%) | 159 (9.2%) |
| Total (Overall) | 17,404 (50.7%) | 16,905 (49.3%) |
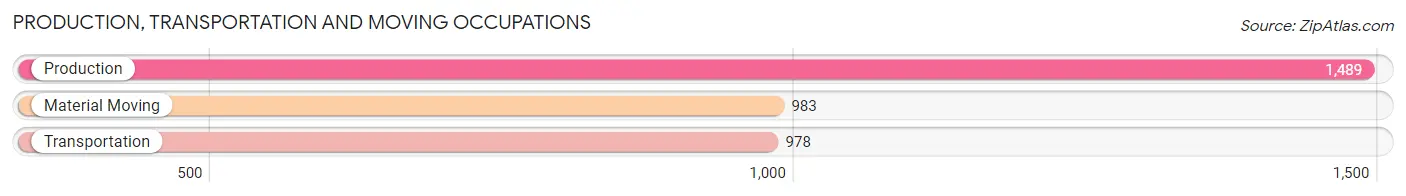
Production, Transportation and Moving Occupations
The most common Production, Transportation and Moving occupations in Johnson City are Production (1,489 | 4.3%), Material Moving (983 | 2.9%), and Transportation (978 | 2.9%).
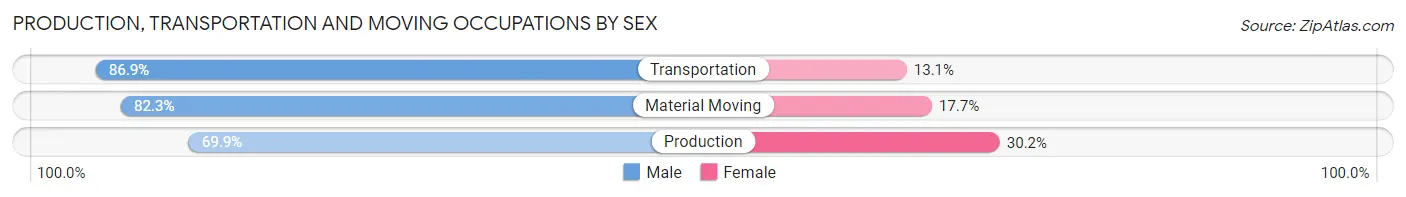
Production, Transportation and Moving Occupations by Sex
| Occupation | Male | Female |
| Production | 1,040 (69.9%) | 449 (30.1%) |
| Transportation | 850 (86.9%) | 128 (13.1%) |
| Material Moving | 809 (82.3%) | 174 (17.7%) |
| Total (Category) | 2,699 (78.2%) | 751 (21.8%) |
| Total (Overall) | 17,404 (50.7%) | 16,905 (49.3%) |
Employment Industries by Sex in Johnson City
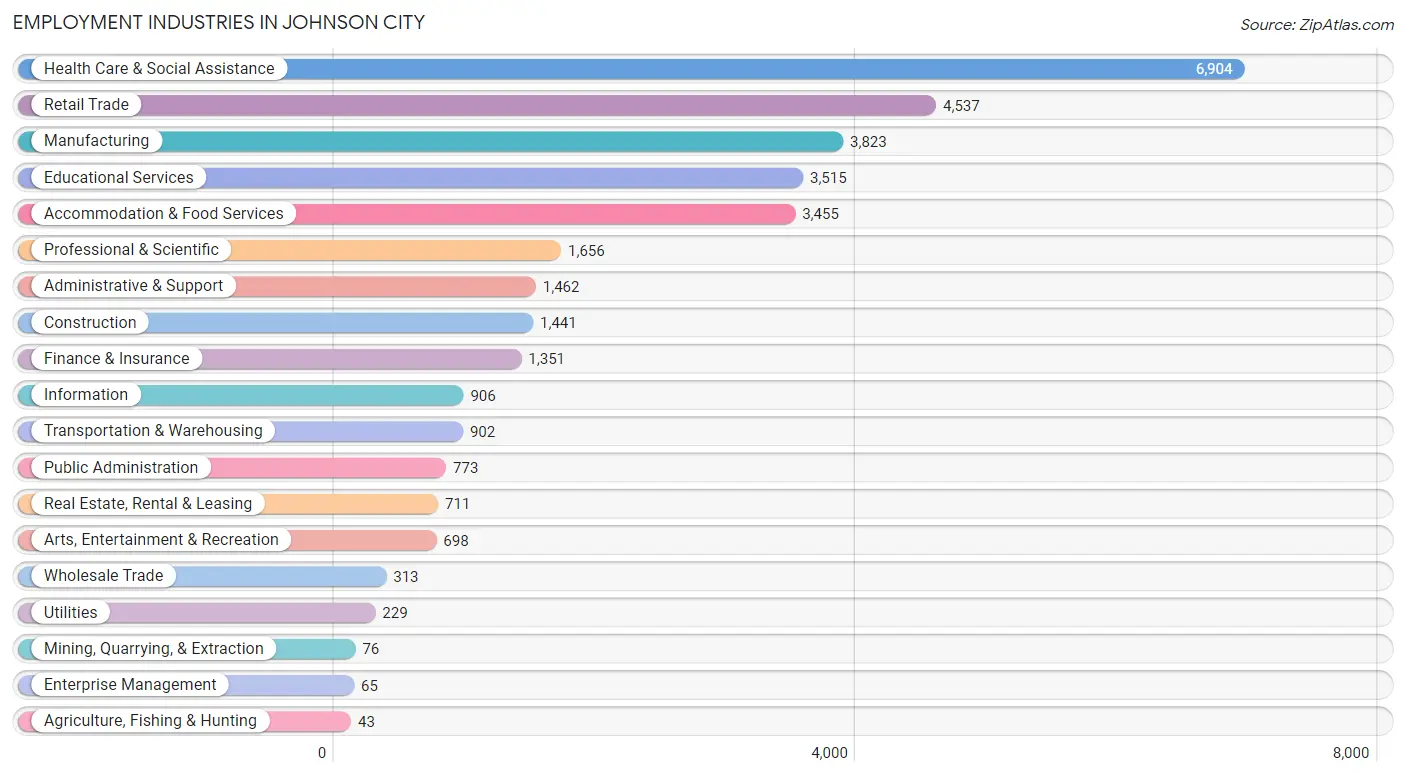
Employment Industries in Johnson City
The major employment industries in Johnson City include Health Care & Social Assistance (6,904 | 20.1%), Retail Trade (4,537 | 13.2%), Manufacturing (3,823 | 11.1%), Educational Services (3,515 | 10.2%), and Accommodation & Food Services (3,455 | 10.1%).
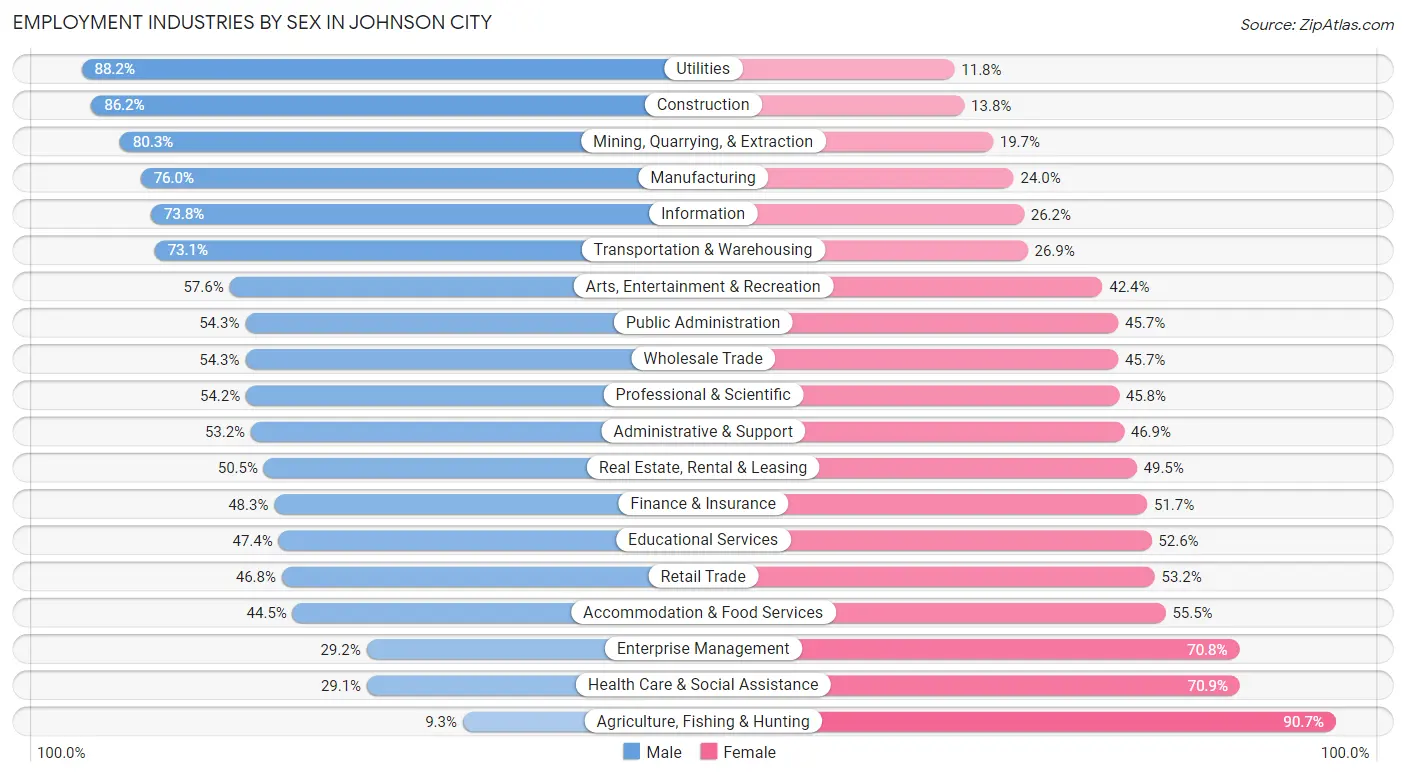
Employment Industries by Sex in Johnson City
The Johnson City industries that see more men than women are Utilities (88.2%), Construction (86.2%), and Mining, Quarrying, & Extraction (80.3%), whereas the industries that tend to have a higher number of women are Agriculture, Fishing & Hunting (90.7%), Health Care & Social Assistance (70.9%), and Enterprise Management (70.8%).
| Industry | Male | Female |
| Agriculture, Fishing & Hunting | 4 (9.3%) | 39 (90.7%) |
| Mining, Quarrying, & Extraction | 61 (80.3%) | 15 (19.7%) |
| Construction | 1,242 (86.2%) | 199 (13.8%) |
| Manufacturing | 2,904 (76.0%) | 919 (24.0%) |
| Wholesale Trade | 170 (54.3%) | 143 (45.7%) |
| Retail Trade | 2,122 (46.8%) | 2,415 (53.2%) |
| Transportation & Warehousing | 659 (73.1%) | 243 (26.9%) |
| Utilities | 202 (88.2%) | 27 (11.8%) |
| Information | 669 (73.8%) | 237 (26.2%) |
| Finance & Insurance | 653 (48.3%) | 698 (51.7%) |
| Real Estate, Rental & Leasing | 359 (50.5%) | 352 (49.5%) |
| Professional & Scientific | 897 (54.2%) | 759 (45.8%) |
| Enterprise Management | 19 (29.2%) | 46 (70.8%) |
| Administrative & Support | 777 (53.1%) | 685 (46.9%) |
| Educational Services | 1,667 (47.4%) | 1,848 (52.6%) |
| Health Care & Social Assistance | 2,012 (29.1%) | 4,892 (70.9%) |
| Arts, Entertainment & Recreation | 402 (57.6%) | 296 (42.4%) |
| Accommodation & Food Services | 1,538 (44.5%) | 1,917 (55.5%) |
| Public Administration | 420 (54.3%) | 353 (45.7%) |
| Total | 17,404 (50.7%) | 16,905 (49.3%) |
Education in Johnson City
School Enrollment in Johnson City
The most common levels of schooling among the 19,779 students in Johnson City are college / undergraduate (8,065 | 40.8%), elementary school (2,996 | 15.1%), and middle school (2,608 | 13.2%).
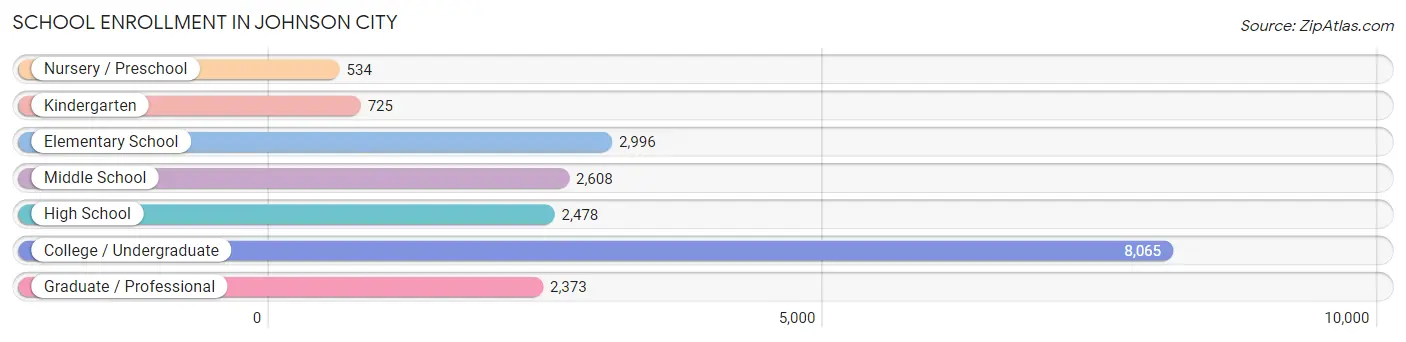
| School Level | # Students | % Students |
| Nursery / Preschool | 534 | 2.7% |
| Kindergarten | 725 | 3.7% |
| Elementary School | 2,996 | 15.1% |
| Middle School | 2,608 | 13.2% |
| High School | 2,478 | 12.5% |
| College / Undergraduate | 8,065 | 40.8% |
| Graduate / Professional | 2,373 | 12.0% |
| Total | 19,779 | 100.0% |
School Enrollment by Age by Funding Source in Johnson City
Out of a total of 19,779 students who are enrolled in schools in Johnson City, 2,215 (11.2%) attend a private institution, while the remaining 17,564 (88.8%) are enrolled in public schools. The age group of 3 to 4 year olds has the highest likelihood of being enrolled in private schools, with 203 (55.3% in the age bracket) enrolled. Conversely, the age group of 18 to 19 year olds has the lowest likelihood of being enrolled in a private school, with 3,252 (96.0% in the age bracket) attending a public institution.
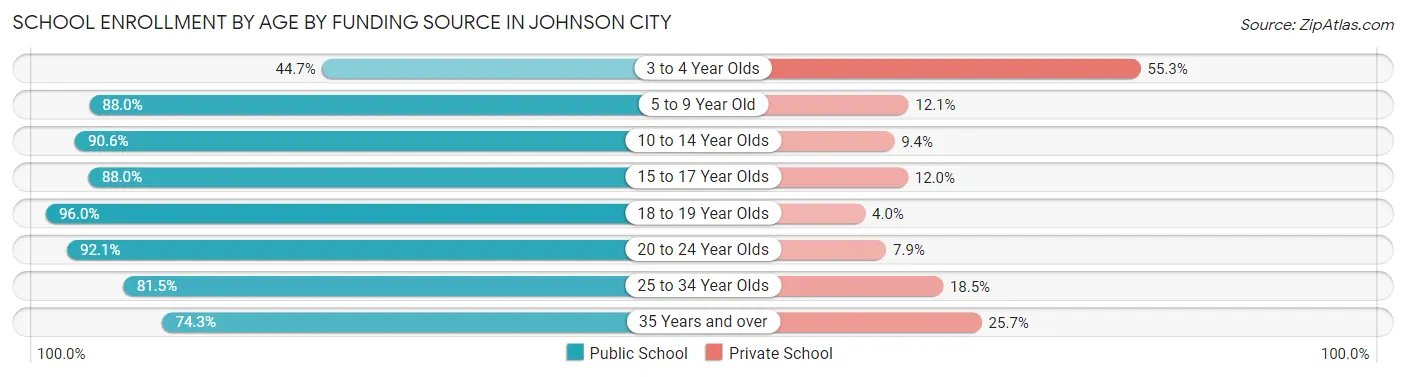
| Age Bracket | Public School | Private School |
| 3 to 4 Year Olds | 164 (44.7%) | 203 (55.3%) |
| 5 to 9 Year Old | 3,299 (87.9%) | 452 (12.0%) |
| 10 to 14 Year Olds | 2,730 (90.6%) | 284 (9.4%) |
| 15 to 17 Year Olds | 1,604 (88.0%) | 218 (12.0%) |
| 18 to 19 Year Olds | 3,252 (96.0%) | 135 (4.0%) |
| 20 to 24 Year Olds | 4,433 (92.1%) | 381 (7.9%) |
| 25 to 34 Year Olds | 1,406 (81.5%) | 319 (18.5%) |
| 35 Years and over | 668 (74.3%) | 231 (25.7%) |
| Total | 17,564 (88.8%) | 2,215 (11.2%) |
Educational Attainment by Field of Study in Johnson City
Business (3,089 | 15.6%), science & technology (2,751 | 13.9%), education (2,244 | 11.3%), bio, nature & agricultural (2,052 | 10.4%), and arts & humanities (1,515 | 7.6%) are the most common fields of study among 19,802 individuals in Johnson City who have obtained a bachelor's degree or higher.
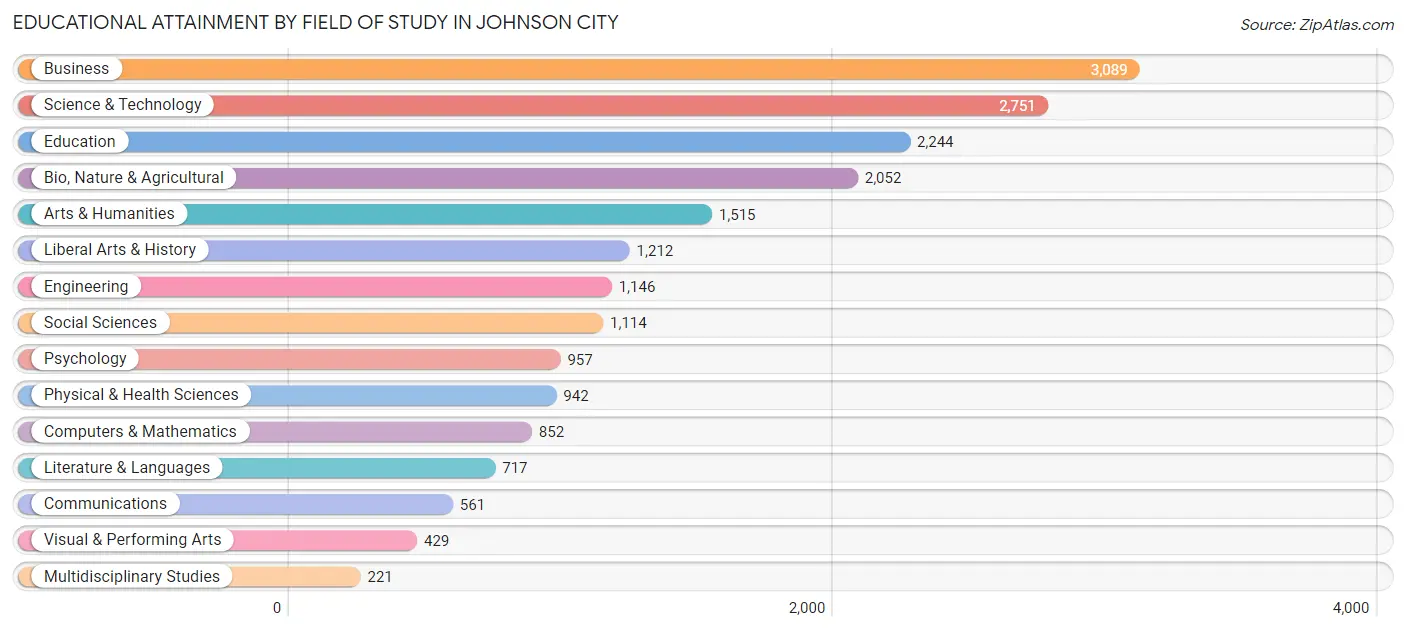
| Field of Study | # Graduates | % Graduates |
| Computers & Mathematics | 852 | 4.3% |
| Bio, Nature & Agricultural | 2,052 | 10.4% |
| Physical & Health Sciences | 942 | 4.8% |
| Psychology | 957 | 4.8% |
| Social Sciences | 1,114 | 5.6% |
| Engineering | 1,146 | 5.8% |
| Multidisciplinary Studies | 221 | 1.1% |
| Science & Technology | 2,751 | 13.9% |
| Business | 3,089 | 15.6% |
| Education | 2,244 | 11.3% |
| Literature & Languages | 717 | 3.6% |
| Liberal Arts & History | 1,212 | 6.1% |
| Visual & Performing Arts | 429 | 2.2% |
| Communications | 561 | 2.8% |
| Arts & Humanities | 1,515 | 7.6% |
| Total | 19,802 | 100.0% |
Transportation & Commute in Johnson City
Vehicle Availability by Sex in Johnson City
The most prevalent vehicle ownership categories in Johnson City are males with 2 vehicles (7,598, accounting for 45.5%) and females with 2 vehicles (6,824, making up 47.8%).
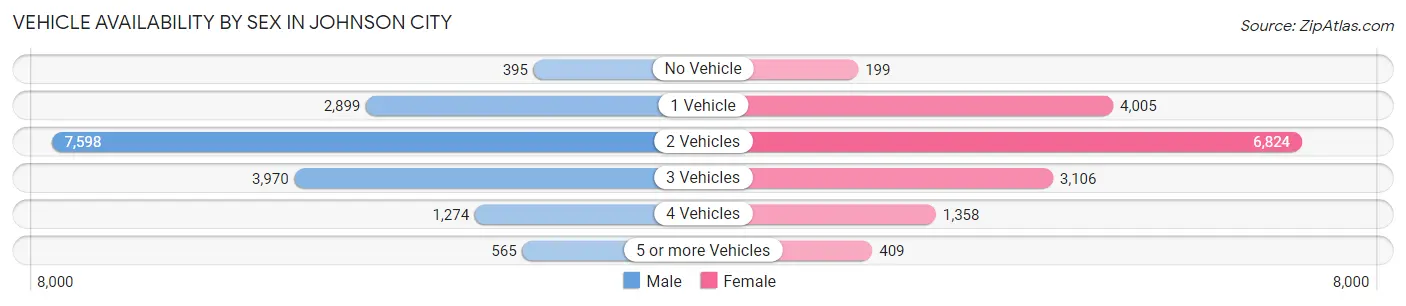
| Vehicles Available | Male | Female |
| No Vehicle | 395 (2.4%) | 199 (1.3%) |
| 1 Vehicle | 2,899 (17.4%) | 4,005 (25.2%) |
| 2 Vehicles | 7,598 (45.5%) | 6,824 (42.9%) |
| 3 Vehicles | 3,970 (23.8%) | 3,106 (19.5%) |
| 4 Vehicles | 1,274 (7.6%) | 1,358 (8.5%) |
| 5 or more Vehicles | 565 (3.4%) | 409 (2.6%) |
| Total | 16,701 (100.0%) | 15,901 (100.0%) |
Commute Time in Johnson City
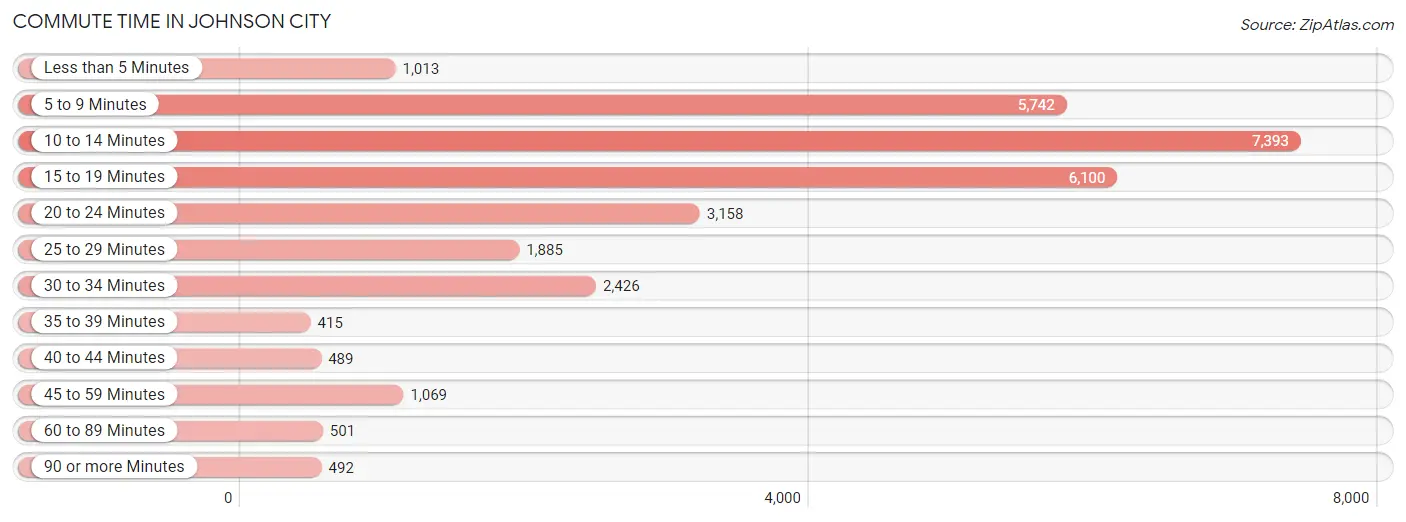
The most frequently occuring commute durations in Johnson City are 10 to 14 minutes (7,393 commuters, 24.1%), 15 to 19 minutes (6,100 commuters, 19.9%), and 5 to 9 minutes (5,742 commuters, 18.7%).
| Commute Time | # Commuters | % Commuters |
| Less than 5 Minutes | 1,013 | 3.3% |
| 5 to 9 Minutes | 5,742 | 18.7% |
| 10 to 14 Minutes | 7,393 | 24.1% |
| 15 to 19 Minutes | 6,100 | 19.9% |
| 20 to 24 Minutes | 3,158 | 10.3% |
| 25 to 29 Minutes | 1,885 | 6.1% |
| 30 to 34 Minutes | 2,426 | 7.9% |
| 35 to 39 Minutes | 415 | 1.3% |
| 40 to 44 Minutes | 489 | 1.6% |
| 45 to 59 Minutes | 1,069 | 3.5% |
| 60 to 89 Minutes | 501 | 1.6% |
| 90 or more Minutes | 492 | 1.6% |
Commute Time by Sex in Johnson City
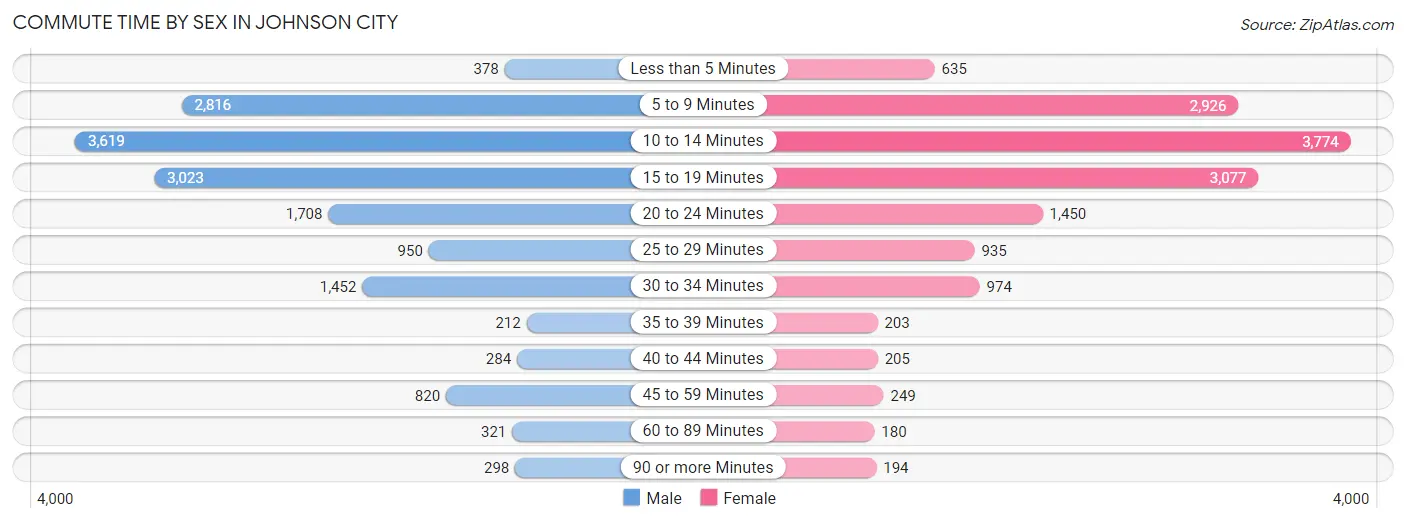
The most common commute times in Johnson City are 10 to 14 minutes (3,619 commuters, 22.8%) for males and 10 to 14 minutes (3,774 commuters, 25.5%) for females.
| Commute Time | Male | Female |
| Less than 5 Minutes | 378 (2.4%) | 635 (4.3%) |
| 5 to 9 Minutes | 2,816 (17.7%) | 2,926 (19.8%) |
| 10 to 14 Minutes | 3,619 (22.8%) | 3,774 (25.5%) |
| 15 to 19 Minutes | 3,023 (19.0%) | 3,077 (20.8%) |
| 20 to 24 Minutes | 1,708 (10.7%) | 1,450 (9.8%) |
| 25 to 29 Minutes | 950 (6.0%) | 935 (6.3%) |
| 30 to 34 Minutes | 1,452 (9.1%) | 974 (6.6%) |
| 35 to 39 Minutes | 212 (1.3%) | 203 (1.4%) |
| 40 to 44 Minutes | 284 (1.8%) | 205 (1.4%) |
| 45 to 59 Minutes | 820 (5.2%) | 249 (1.7%) |
| 60 to 89 Minutes | 321 (2.0%) | 180 (1.2%) |
| 90 or more Minutes | 298 (1.9%) | 194 (1.3%) |
Time of Departure to Work by Sex in Johnson City
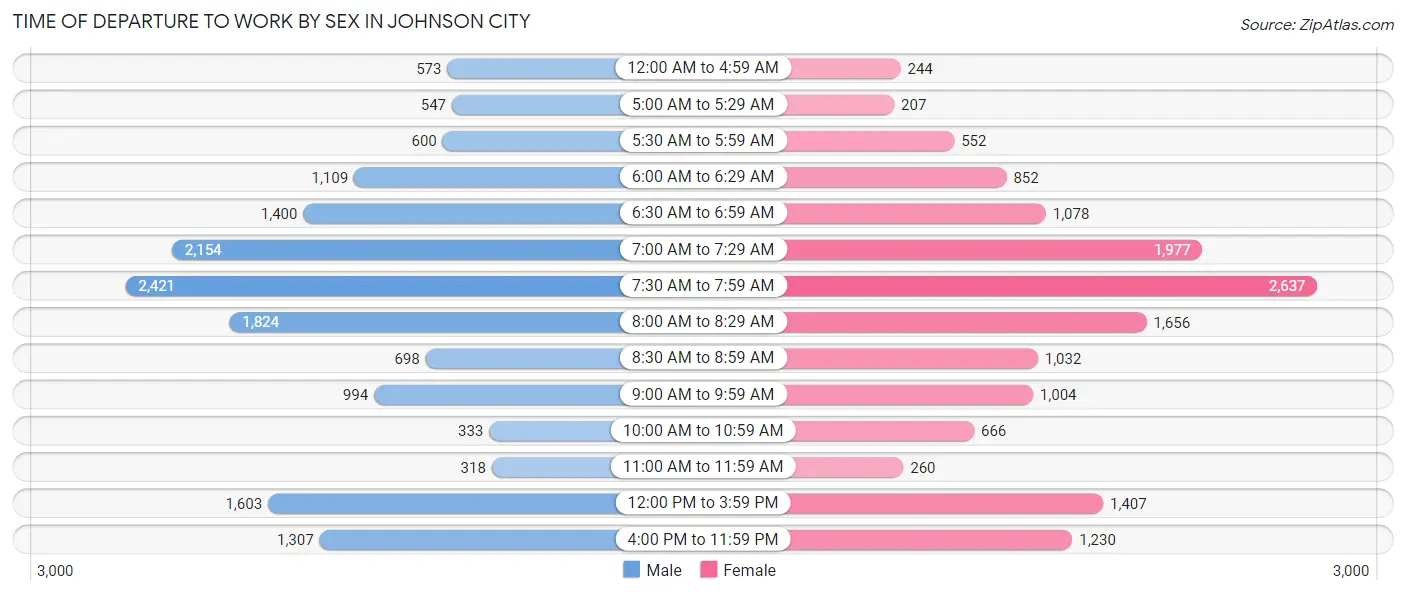
The most frequent times of departure to work in Johnson City are 7:30 AM to 7:59 AM (2,421, 15.2%) for males and 7:30 AM to 7:59 AM (2,637, 17.8%) for females.
| Time of Departure | Male | Female |
| 12:00 AM to 4:59 AM | 573 (3.6%) | 244 (1.7%) |
| 5:00 AM to 5:29 AM | 547 (3.4%) | 207 (1.4%) |
| 5:30 AM to 5:59 AM | 600 (3.8%) | 552 (3.7%) |
| 6:00 AM to 6:29 AM | 1,109 (7.0%) | 852 (5.8%) |
| 6:30 AM to 6:59 AM | 1,400 (8.8%) | 1,078 (7.3%) |
| 7:00 AM to 7:29 AM | 2,154 (13.6%) | 1,977 (13.4%) |
| 7:30 AM to 7:59 AM | 2,421 (15.2%) | 2,637 (17.8%) |
| 8:00 AM to 8:29 AM | 1,824 (11.5%) | 1,656 (11.2%) |
| 8:30 AM to 8:59 AM | 698 (4.4%) | 1,032 (7.0%) |
| 9:00 AM to 9:59 AM | 994 (6.3%) | 1,004 (6.8%) |
| 10:00 AM to 10:59 AM | 333 (2.1%) | 666 (4.5%) |
| 11:00 AM to 11:59 AM | 318 (2.0%) | 260 (1.8%) |
| 12:00 PM to 3:59 PM | 1,603 (10.1%) | 1,407 (9.5%) |
| 4:00 PM to 11:59 PM | 1,307 (8.2%) | 1,230 (8.3%) |
| Total | 15,881 (100.0%) | 14,802 (100.0%) |
Housing Occupancy in Johnson City
Occupancy by Ownership in Johnson City
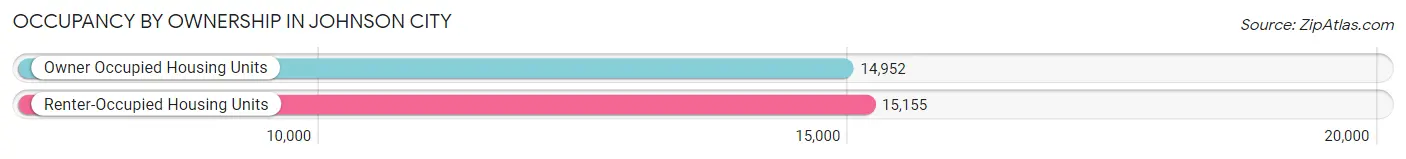
Of the total 30,107 dwellings in Johnson City, owner-occupied units account for 14,952 (49.7%), while renter-occupied units make up 15,155 (50.3%).
| Occupancy | # Housing Units | % Housing Units |
| Owner Occupied Housing Units | 14,952 | 49.7% |
| Renter-Occupied Housing Units | 15,155 | 50.3% |
| Total Occupied Housing Units | 30,107 | 100.0% |
Occupancy by Household Size in Johnson City
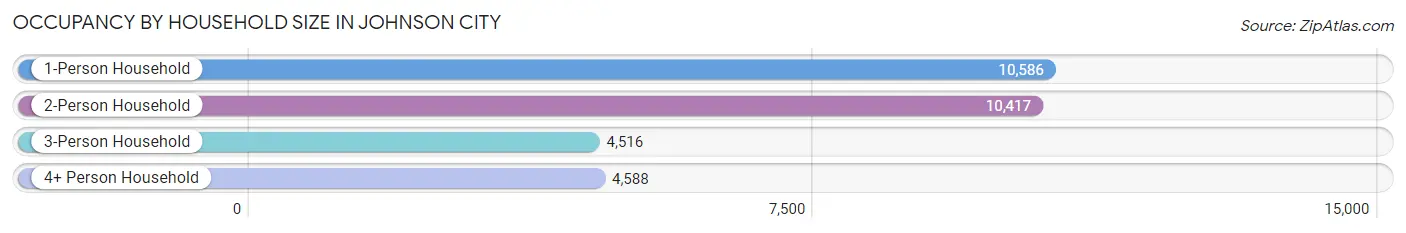
| Household Size | # Housing Units | % Housing Units |
| 1-Person Household | 10,586 | 35.2% |
| 2-Person Household | 10,417 | 34.6% |
| 3-Person Household | 4,516 | 15.0% |
| 4+ Person Household | 4,588 | 15.2% |
| Total Housing Units | 30,107 | 100.0% |
Occupancy by Ownership by Household Size in Johnson City
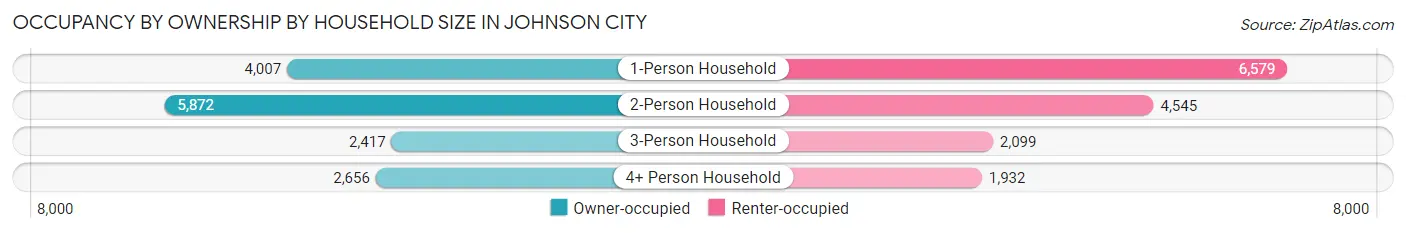
| Household Size | Owner-occupied | Renter-occupied |
| 1-Person Household | 4,007 (37.9%) | 6,579 (62.2%) |
| 2-Person Household | 5,872 (56.4%) | 4,545 (43.6%) |
| 3-Person Household | 2,417 (53.5%) | 2,099 (46.5%) |
| 4+ Person Household | 2,656 (57.9%) | 1,932 (42.1%) |
| Total Housing Units | 14,952 (49.7%) | 15,155 (50.3%) |
Occupancy by Educational Attainment in Johnson City
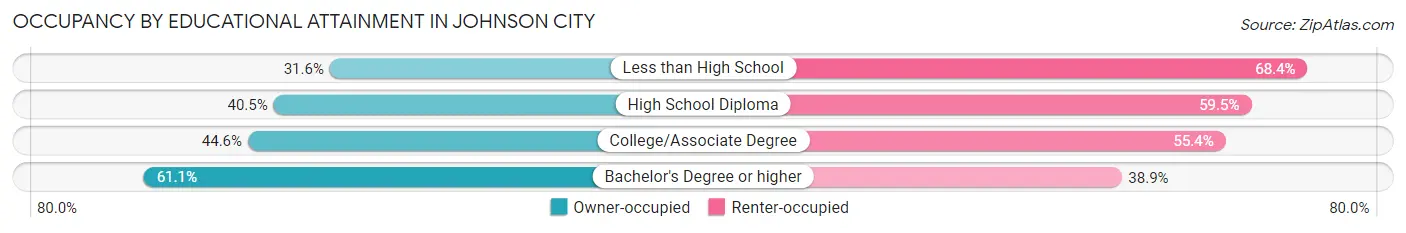
| Household Size | Owner-occupied | Renter-occupied |
| Less than High School | 693 (31.6%) | 1,500 (68.4%) |
| High School Diploma | 2,455 (40.5%) | 3,603 (59.5%) |
| College/Associate Degree | 4,187 (44.6%) | 5,203 (55.4%) |
| Bachelor's Degree or higher | 7,617 (61.1%) | 4,849 (38.9%) |
Occupancy by Age of Householder in Johnson City
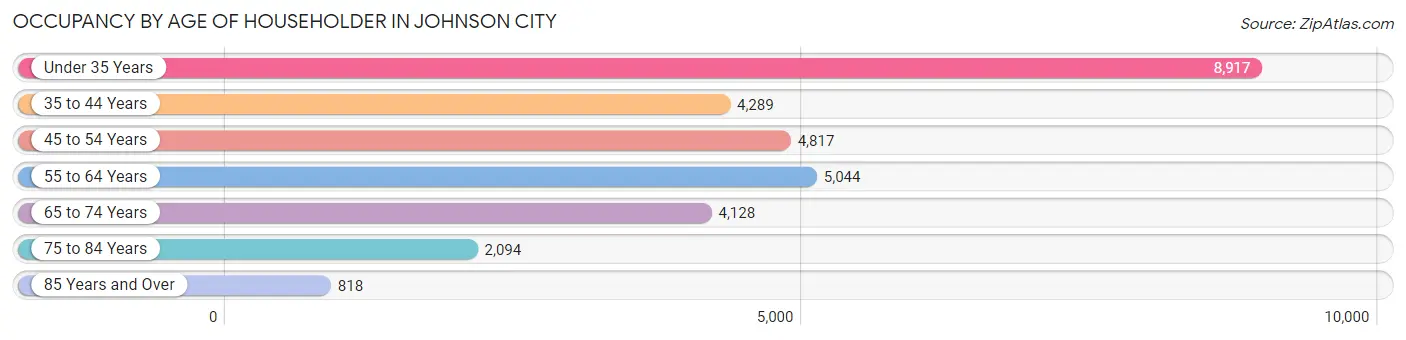
| Age Bracket | # Households | % Households |
| Under 35 Years | 8,917 | 29.6% |
| 35 to 44 Years | 4,289 | 14.2% |
| 45 to 54 Years | 4,817 | 16.0% |
| 55 to 64 Years | 5,044 | 16.8% |
| 65 to 74 Years | 4,128 | 13.7% |
| 75 to 84 Years | 2,094 | 7.0% |
| 85 Years and Over | 818 | 2.7% |
| Total | 30,107 | 100.0% |
Housing Finances in Johnson City
Median Income by Occupancy in Johnson City
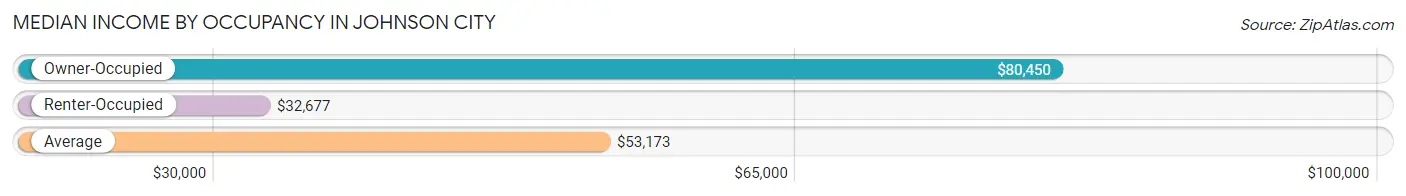
| Occupancy Type | # Households | Median Income |
| Owner-Occupied | 14,952 (49.7%) | $80,450 |
| Renter-Occupied | 15,155 (50.3%) | $32,677 |
| Average | 30,107 (100.0%) | $53,173 |
Occupancy by Householder Income Bracket in Johnson City
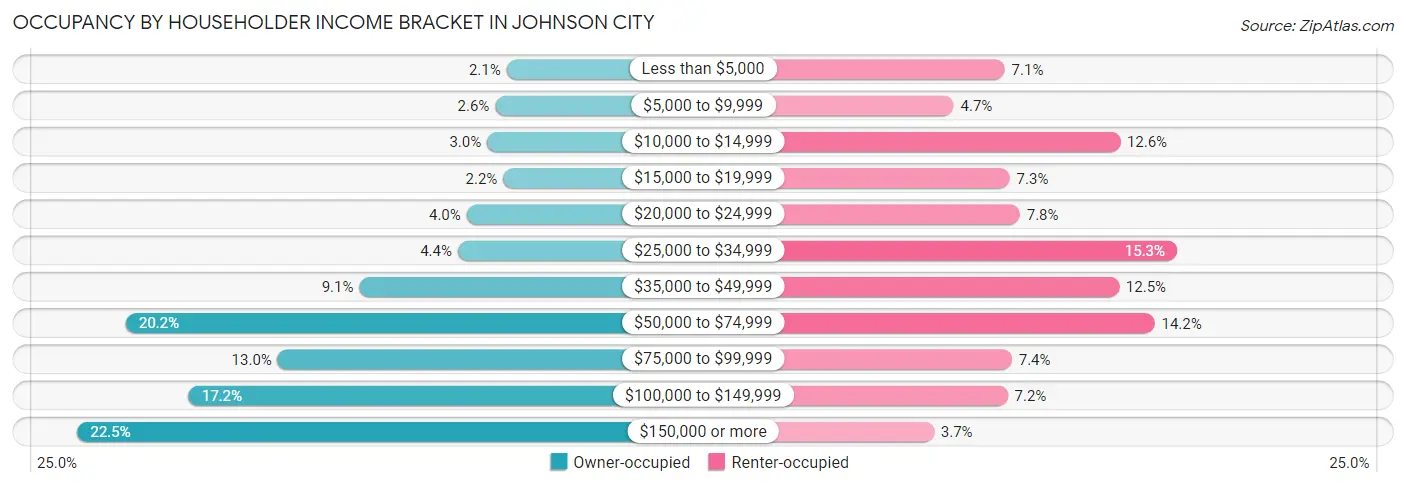
| Income Bracket | Owner-occupied | Renter-occupied |
| Less than $5,000 | 306 (2.1%) | 1,076 (7.1%) |
| $5,000 to $9,999 | 388 (2.6%) | 708 (4.7%) |
| $10,000 to $14,999 | 445 (3.0%) | 1,908 (12.6%) |
| $15,000 to $19,999 | 330 (2.2%) | 1,112 (7.3%) |
| $20,000 to $24,999 | 590 (4.0%) | 1,185 (7.8%) |
| $25,000 to $34,999 | 654 (4.4%) | 2,318 (15.3%) |
| $35,000 to $49,999 | 1,354 (9.1%) | 1,900 (12.5%) |
| $50,000 to $74,999 | 3,017 (20.2%) | 2,158 (14.2%) |
| $75,000 to $99,999 | 1,936 (13.0%) | 1,127 (7.4%) |
| $100,000 to $149,999 | 2,569 (17.2%) | 1,097 (7.2%) |
| $150,000 or more | 3,363 (22.5%) | 566 (3.7%) |
| Total | 14,952 (100.0%) | 15,155 (100.0%) |
Monthly Housing Cost Tiers in Johnson City
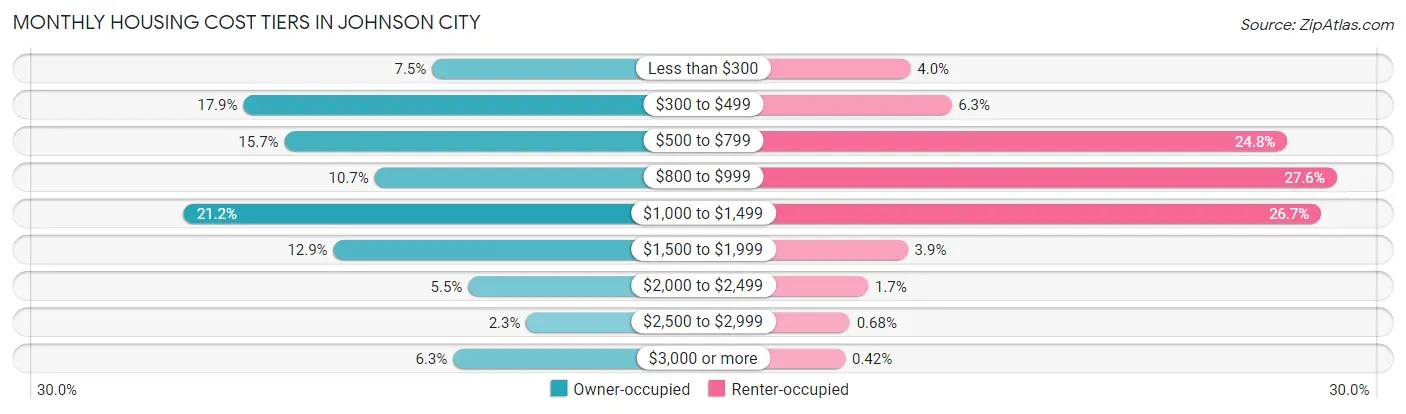
| Monthly Cost | Owner-occupied | Renter-occupied |
| Less than $300 | 1,120 (7.5%) | 611 (4.0%) |
| $300 to $499 | 2,680 (17.9%) | 953 (6.3%) |
| $500 to $799 | 2,340 (15.7%) | 3,764 (24.8%) |
| $800 to $999 | 1,595 (10.7%) | 4,178 (27.6%) |
| $1,000 to $1,499 | 3,171 (21.2%) | 4,050 (26.7%) |
| $1,500 to $1,999 | 1,935 (12.9%) | 588 (3.9%) |
| $2,000 to $2,499 | 823 (5.5%) | 256 (1.7%) |
| $2,500 to $2,999 | 342 (2.3%) | 103 (0.7%) |
| $3,000 or more | 946 (6.3%) | 64 (0.4%) |
| Total | 14,952 (100.0%) | 15,155 (100.0%) |
Physical Housing Characteristics in Johnson City
Housing Structures in Johnson City
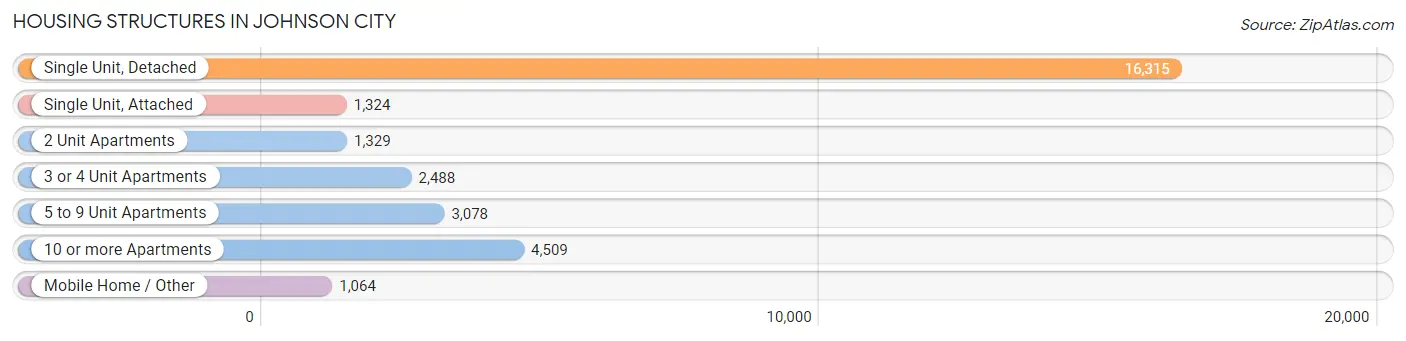
| Structure Type | # Housing Units | % Housing Units |
| Single Unit, Detached | 16,315 | 54.2% |
| Single Unit, Attached | 1,324 | 4.4% |
| 2 Unit Apartments | 1,329 | 4.4% |
| 3 or 4 Unit Apartments | 2,488 | 8.3% |
| 5 to 9 Unit Apartments | 3,078 | 10.2% |
| 10 or more Apartments | 4,509 | 15.0% |
| Mobile Home / Other | 1,064 | 3.5% |
| Total | 30,107 | 100.0% |
Housing Structures by Occupancy in Johnson City
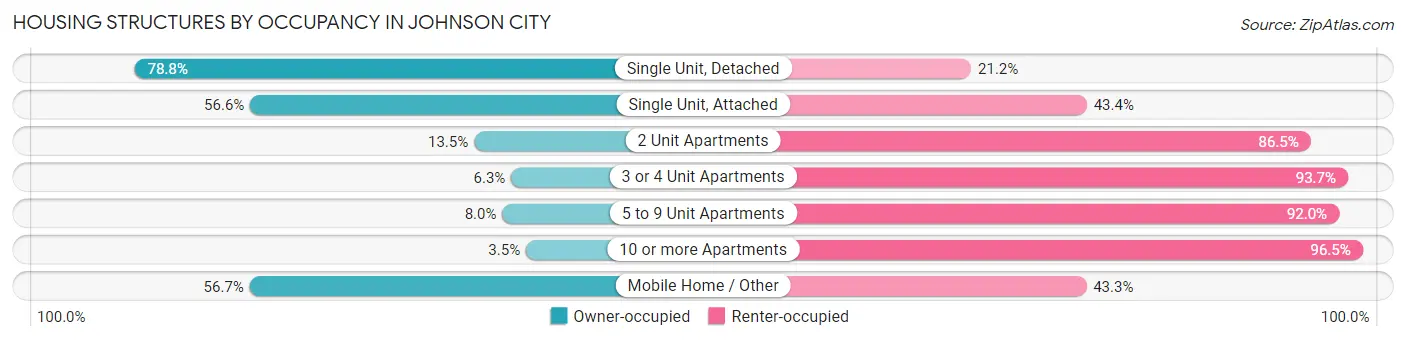
| Structure Type | Owner-occupied | Renter-occupied |
| Single Unit, Detached | 12,861 (78.8%) | 3,454 (21.2%) |
| Single Unit, Attached | 749 (56.6%) | 575 (43.4%) |
| 2 Unit Apartments | 179 (13.5%) | 1,150 (86.5%) |
| 3 or 4 Unit Apartments | 157 (6.3%) | 2,331 (93.7%) |
| 5 to 9 Unit Apartments | 247 (8.0%) | 2,831 (92.0%) |
| 10 or more Apartments | 156 (3.5%) | 4,353 (96.5%) |
| Mobile Home / Other | 603 (56.7%) | 461 (43.3%) |
| Total | 14,952 (49.7%) | 15,155 (50.3%) |
Housing Structures by Number of Rooms in Johnson City
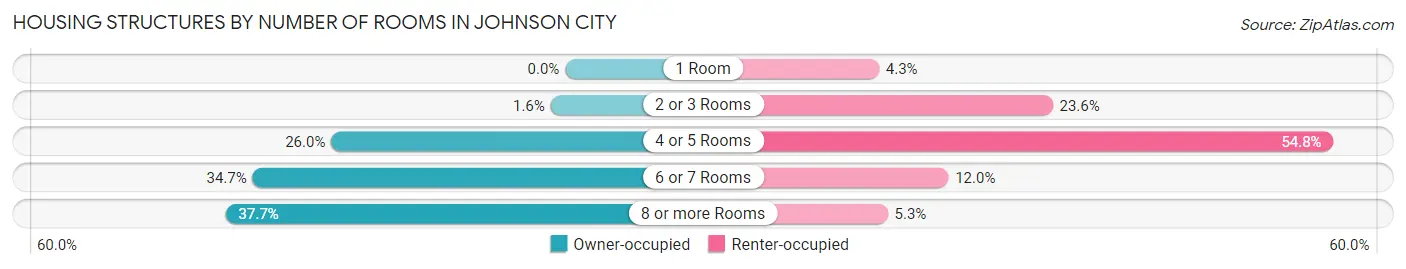
| Number of Rooms | Owner-occupied | Renter-occupied |
| 1 Room | 0 (0.0%) | 655 (4.3%) |
| 2 or 3 Rooms | 242 (1.6%) | 3,576 (23.6%) |
| 4 or 5 Rooms | 3,883 (26.0%) | 8,301 (54.8%) |
| 6 or 7 Rooms | 5,189 (34.7%) | 1,822 (12.0%) |
| 8 or more Rooms | 5,638 (37.7%) | 801 (5.3%) |
| Total | 14,952 (100.0%) | 15,155 (100.0%) |
Housing Structure by Heating Type in Johnson City
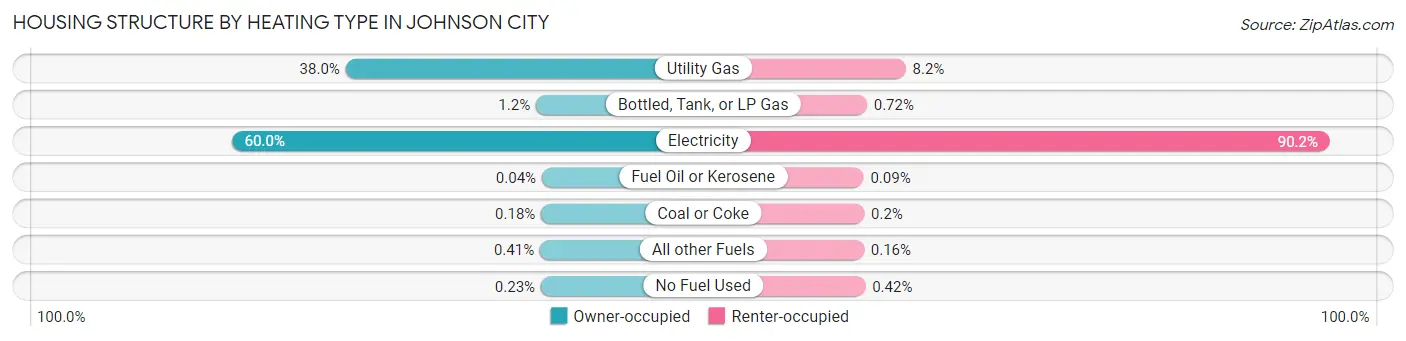
| Heating Type | Owner-occupied | Renter-occupied |
| Utility Gas | 5,676 (38.0%) | 1,246 (8.2%) |
| Bottled, Tank, or LP Gas | 176 (1.2%) | 109 (0.7%) |
| Electricity | 8,972 (60.0%) | 13,667 (90.2%) |
| Fuel Oil or Kerosene | 6 (0.0%) | 14 (0.1%) |
| Coal or Coke | 27 (0.2%) | 31 (0.2%) |
| All other Fuels | 61 (0.4%) | 25 (0.2%) |
| No Fuel Used | 34 (0.2%) | 63 (0.4%) |
| Total | 14,952 (100.0%) | 15,155 (100.0%) |
Household Vehicle Usage in Johnson City
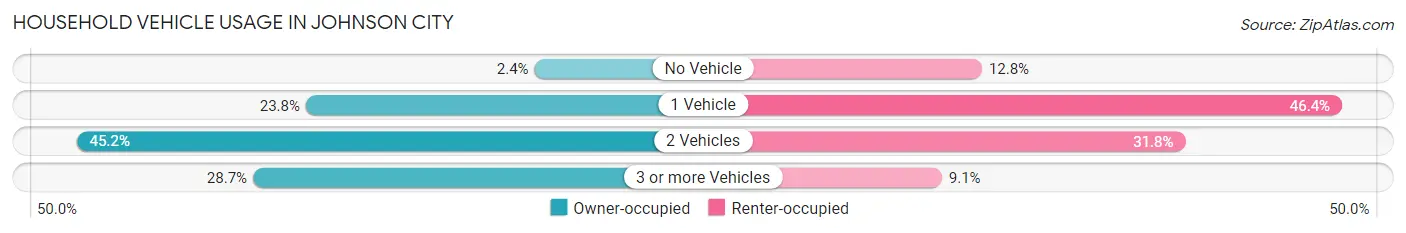
| Vehicles per Household | Owner-occupied | Renter-occupied |
| No Vehicle | 361 (2.4%) | 1,939 (12.8%) |
| 1 Vehicle | 3,551 (23.7%) | 7,030 (46.4%) |
| 2 Vehicles | 6,751 (45.2%) | 4,815 (31.8%) |
| 3 or more Vehicles | 4,289 (28.7%) | 1,371 (9.0%) |
| Total | 14,952 (100.0%) | 15,155 (100.0%) |
Real Estate & Mortgages in Johnson City
Real Estate and Mortgage Overview in Johnson City
| Characteristic | Without Mortgage | With Mortgage |
| Housing Units | 6,046 | 8,906 |
| Median Property Value | $195,400 | $232,100 |
| Median Household Income | $60,721 | $2,392 |
| Monthly Housing Costs | $449 | $923 |
| Real Estate Taxes | $1,564 | $323 |
Property Value by Mortgage Status in Johnson City
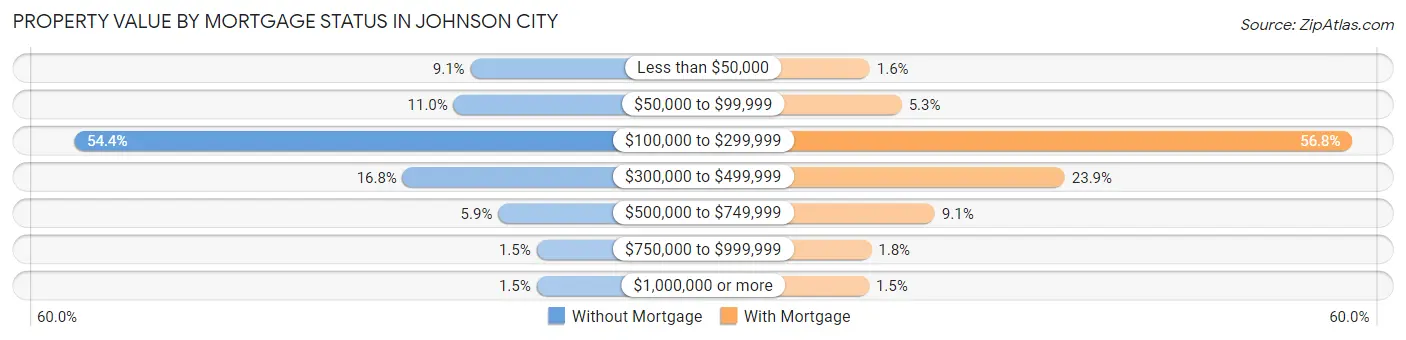
| Property Value | Without Mortgage | With Mortgage |
| Less than $50,000 | 547 (9.0%) | 145 (1.6%) |
| $50,000 to $99,999 | 663 (11.0%) | 470 (5.3%) |
| $100,000 to $299,999 | 3,286 (54.3%) | 5,056 (56.8%) |
| $300,000 to $499,999 | 1,015 (16.8%) | 2,130 (23.9%) |
| $500,000 to $749,999 | 355 (5.9%) | 808 (9.1%) |
| $750,000 to $999,999 | 90 (1.5%) | 161 (1.8%) |
| $1,000,000 or more | 90 (1.5%) | 136 (1.5%) |
| Total | 6,046 (100.0%) | 8,906 (100.0%) |
Household Income by Mortgage Status in Johnson City
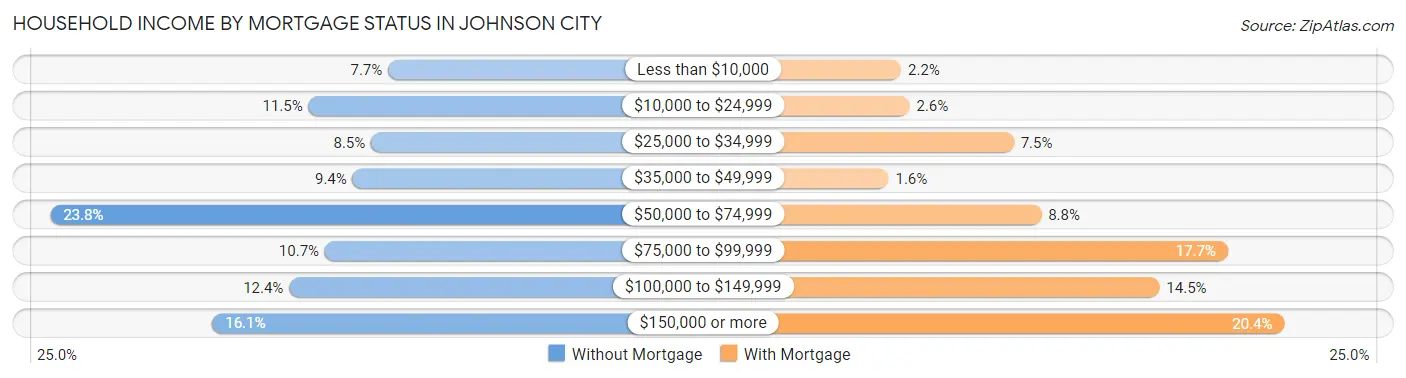
| Household Income | Without Mortgage | With Mortgage |
| Less than $10,000 | 465 (7.7%) | 193 (2.2%) |
| $10,000 to $24,999 | 694 (11.5%) | 229 (2.6%) |
| $25,000 to $34,999 | 514 (8.5%) | 671 (7.5%) |
| $35,000 to $49,999 | 567 (9.4%) | 140 (1.6%) |
| $50,000 to $74,999 | 1,438 (23.8%) | 787 (8.8%) |
| $75,000 to $99,999 | 647 (10.7%) | 1,579 (17.7%) |
| $100,000 to $149,999 | 750 (12.4%) | 1,289 (14.5%) |
| $150,000 or more | 971 (16.1%) | 1,819 (20.4%) |
| Total | 6,046 (100.0%) | 8,906 (100.0%) |
Property Value to Household Income Ratio in Johnson City
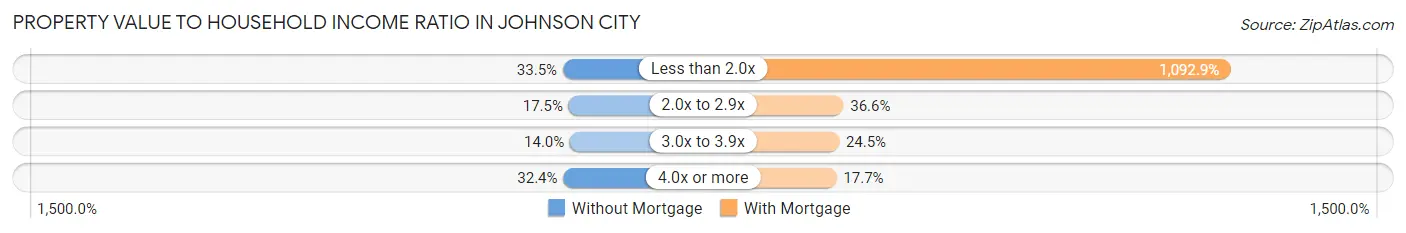
| Value-to-Income Ratio | Without Mortgage | With Mortgage |
| Less than 2.0x | 2,028 (33.5%) | 97,331 (1,092.9%) |
| 2.0x to 2.9x | 1,057 (17.5%) | 3,255 (36.5%) |
| 3.0x to 3.9x | 845 (14.0%) | 2,185 (24.5%) |
| 4.0x or more | 1,959 (32.4%) | 1,578 (17.7%) |
| Total | 6,046 (100.0%) | 8,906 (100.0%) |
Real Estate Taxes by Mortgage Status in Johnson City
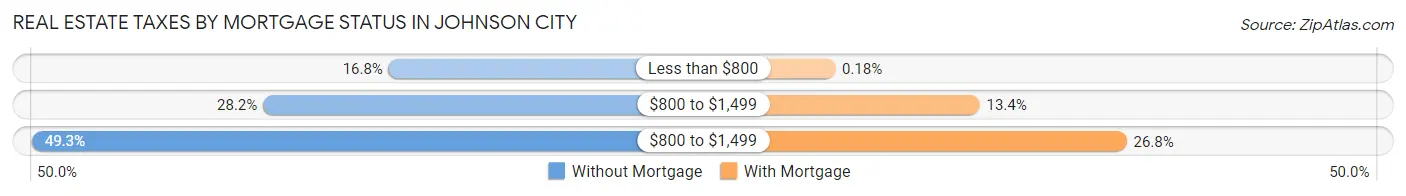
| Property Taxes | Without Mortgage | With Mortgage |
| Less than $800 | 1,013 (16.8%) | 16 (0.2%) |
| $800 to $1,499 | 1,706 (28.2%) | 1,192 (13.4%) |
| $800 to $1,499 | 2,983 (49.3%) | 2,387 (26.8%) |
| Total | 6,046 (100.0%) | 8,906 (100.0%) |
Health & Disability in Johnson City
Health Insurance Coverage by Age in Johnson City
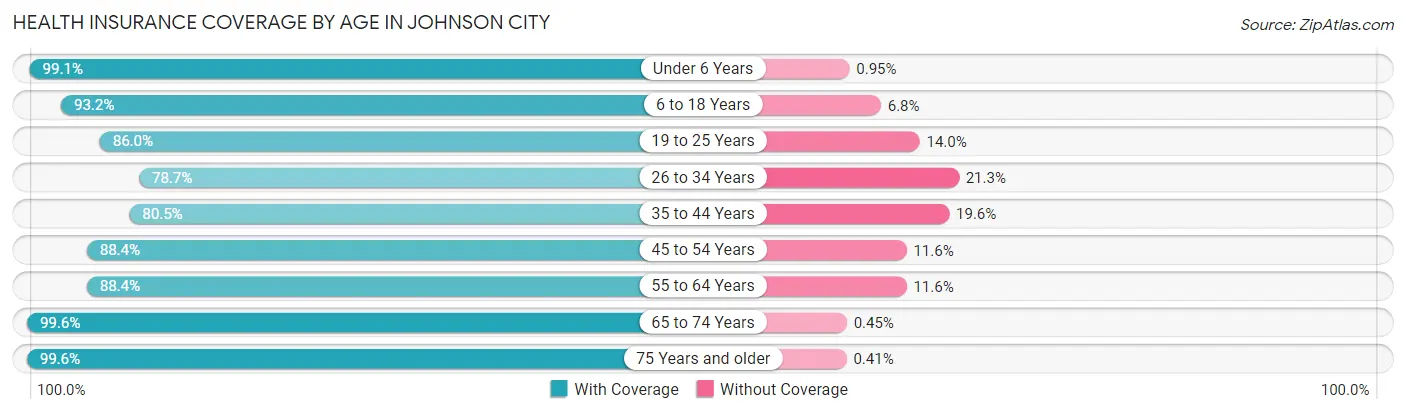
| Age Bracket | With Coverage | Without Coverage |
| Under 6 Years | 4,578 (99.1%) | 44 (0.9%) |
| 6 to 18 Years | 9,454 (93.2%) | 691 (6.8%) |
| 19 to 25 Years | 10,234 (86.0%) | 1,670 (14.0%) |
| 26 to 34 Years | 6,830 (78.7%) | 1,853 (21.3%) |
| 35 to 44 Years | 6,654 (80.4%) | 1,617 (19.6%) |
| 45 to 54 Years | 7,155 (88.4%) | 939 (11.6%) |
| 55 to 64 Years | 7,096 (88.4%) | 931 (11.6%) |
| 65 to 74 Years | 6,188 (99.6%) | 28 (0.4%) |
| 75 Years and older | 3,909 (99.6%) | 16 (0.4%) |
| Total | 62,098 (88.8%) | 7,789 (11.2%) |
Health Insurance Coverage by Citizenship Status in Johnson City
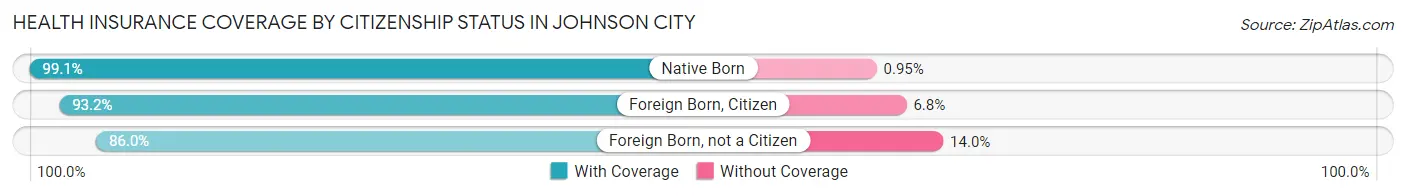
| Citizenship Status | With Coverage | Without Coverage |
| Native Born | 4,578 (99.1%) | 44 (0.9%) |
| Foreign Born, Citizen | 9,454 (93.2%) | 691 (6.8%) |
| Foreign Born, not a Citizen | 10,234 (86.0%) | 1,670 (14.0%) |
Health Insurance Coverage by Household Income in Johnson City
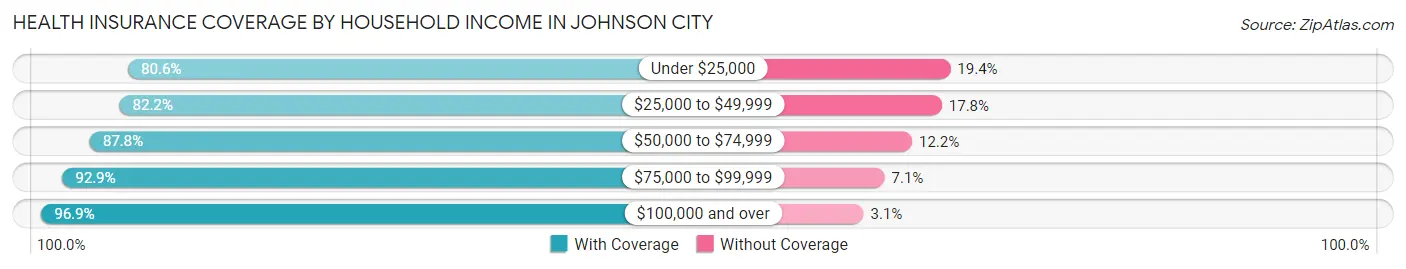
| Household Income | With Coverage | Without Coverage |
| Under $25,000 | 10,801 (80.6%) | 2,601 (19.4%) |
| $25,000 to $49,999 | 10,616 (82.2%) | 2,301 (17.8%) |
| $50,000 to $74,999 | 10,326 (87.8%) | 1,438 (12.2%) |
| $75,000 to $99,999 | 6,894 (92.9%) | 525 (7.1%) |
| $100,000 and over | 20,518 (96.9%) | 665 (3.1%) |
Public vs Private Health Insurance Coverage by Age in Johnson City
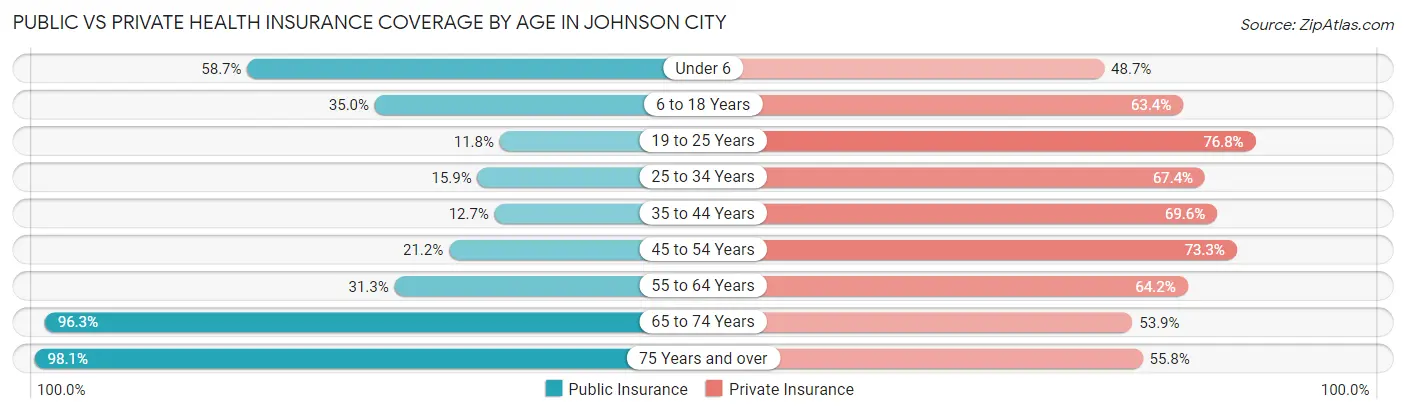
| Age Bracket | Public Insurance | Private Insurance |
| Under 6 | 2,711 (58.7%) | 2,251 (48.7%) |
| 6 to 18 Years | 3,550 (35.0%) | 6,427 (63.3%) |
| 19 to 25 Years | 1,405 (11.8%) | 9,139 (76.8%) |
| 25 to 34 Years | 1,382 (15.9%) | 5,852 (67.4%) |
| 35 to 44 Years | 1,054 (12.7%) | 5,760 (69.6%) |
| 45 to 54 Years | 1,717 (21.2%) | 5,932 (73.3%) |
| 55 to 64 Years | 2,515 (31.3%) | 5,151 (64.2%) |
| 65 to 74 Years | 5,983 (96.3%) | 3,352 (53.9%) |
| 75 Years and over | 3,852 (98.1%) | 2,191 (55.8%) |
| Total | 24,169 (34.6%) | 46,055 (65.9%) |
Disability Status by Sex by Age in Johnson City
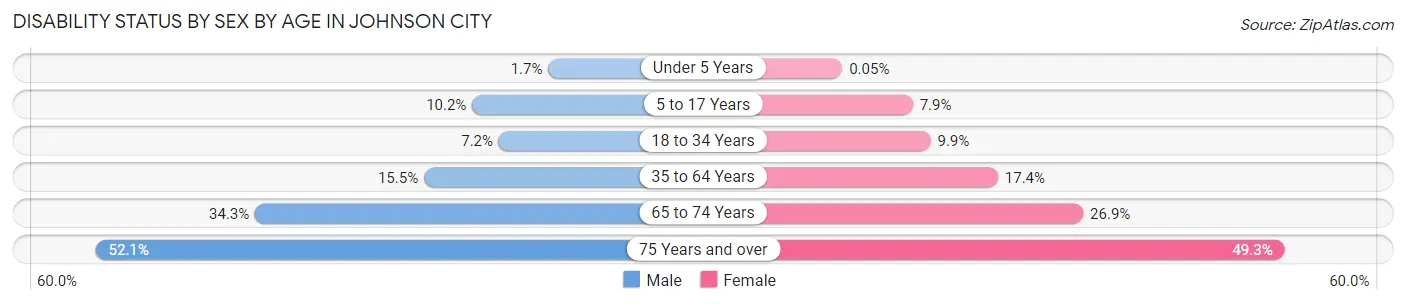
| Age Bracket | Male | Female |
| Under 5 Years | 34 (1.7%) | 1 (0.1%) |
| 5 to 17 Years | 458 (10.2%) | 358 (7.9%) |
| 18 to 34 Years | 738 (7.2%) | 1,196 (9.9%) |
| 35 to 64 Years | 1,901 (15.5%) | 2,110 (17.4%) |
| 65 to 74 Years | 1,000 (34.3%) | 888 (26.9%) |
| 75 Years and over | 784 (52.1%) | 1,193 (49.3%) |
Disability Class by Sex by Age in Johnson City
Disability Class: Hearing Difficulty
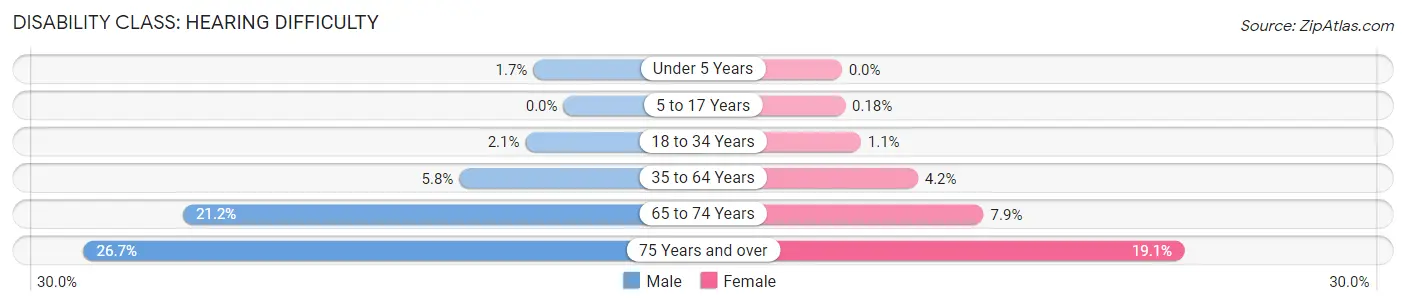
| Age Bracket | Male | Female |
| Under 5 Years | 34 (1.7%) | 0 (0.0%) |
| 5 to 17 Years | 0 (0.0%) | 8 (0.2%) |
| 18 to 34 Years | 218 (2.1%) | 128 (1.1%) |
| 35 to 64 Years | 711 (5.8%) | 514 (4.2%) |
| 65 to 74 Years | 617 (21.2%) | 261 (7.9%) |
| 75 Years and over | 402 (26.7%) | 461 (19.1%) |
Disability Class: Vision Difficulty
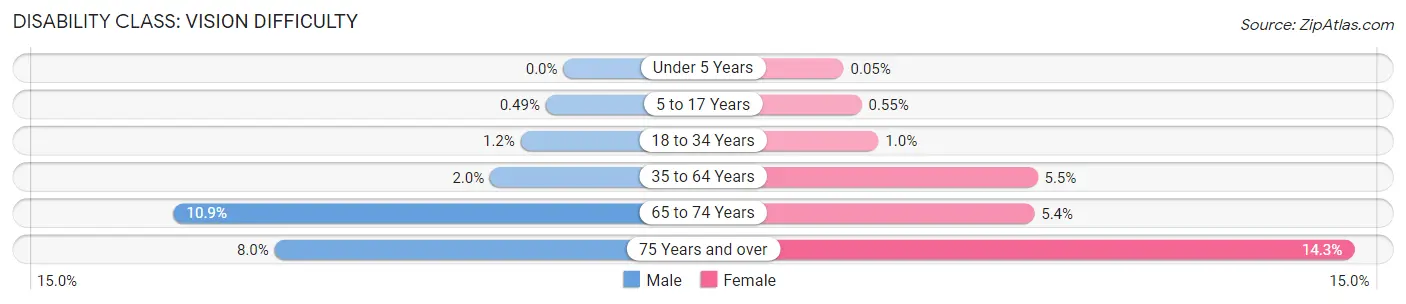
| Age Bracket | Male | Female |
| Under 5 Years | 0 (0.0%) | 1 (0.1%) |
| 5 to 17 Years | 22 (0.5%) | 25 (0.5%) |
| 18 to 34 Years | 122 (1.2%) | 123 (1.0%) |
| 35 to 64 Years | 250 (2.0%) | 662 (5.4%) |
| 65 to 74 Years | 316 (10.8%) | 177 (5.4%) |
| 75 Years and over | 121 (8.0%) | 345 (14.3%) |
Disability Class: Cognitive Difficulty
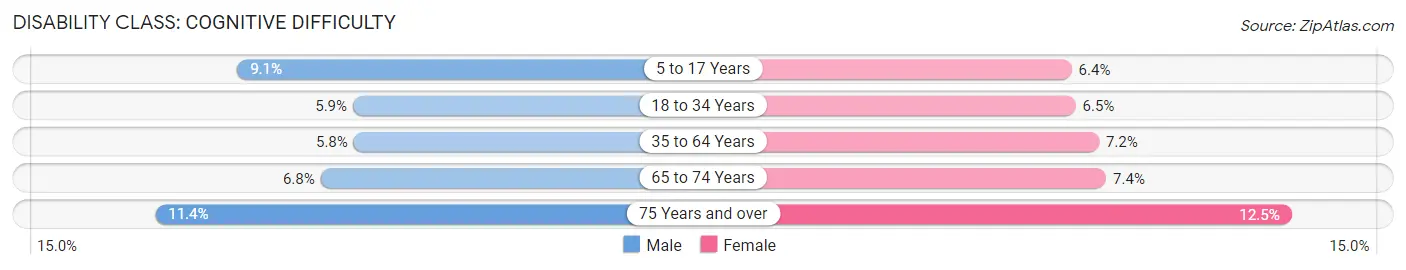
| Age Bracket | Male | Female |
| 5 to 17 Years | 410 (9.1%) | 290 (6.4%) |
| 18 to 34 Years | 602 (5.9%) | 788 (6.5%) |
| 35 to 64 Years | 716 (5.8%) | 869 (7.2%) |
| 65 to 74 Years | 197 (6.8%) | 243 (7.4%) |
| 75 Years and over | 171 (11.4%) | 303 (12.5%) |
Disability Class: Ambulatory Difficulty
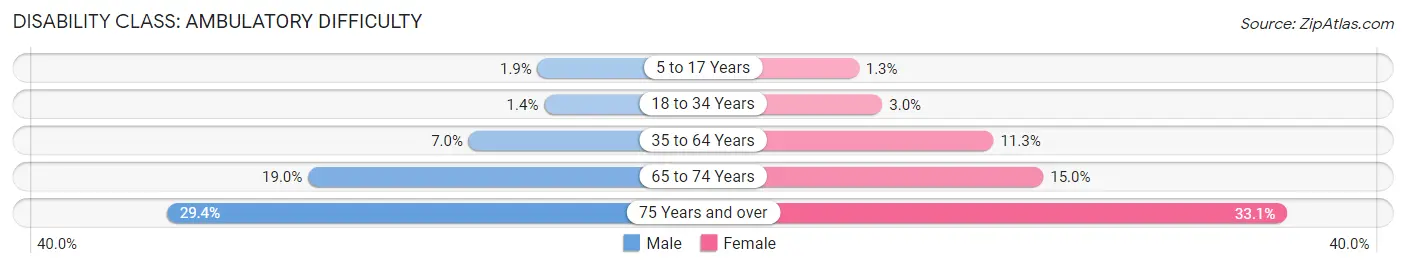
| Age Bracket | Male | Female |
| 5 to 17 Years | 86 (1.9%) | 57 (1.3%) |
| 18 to 34 Years | 146 (1.4%) | 365 (3.0%) |
| 35 to 64 Years | 860 (7.0%) | 1,369 (11.3%) |
| 65 to 74 Years | 552 (19.0%) | 494 (15.0%) |
| 75 Years and over | 443 (29.4%) | 800 (33.1%) |
Disability Class: Self-Care Difficulty
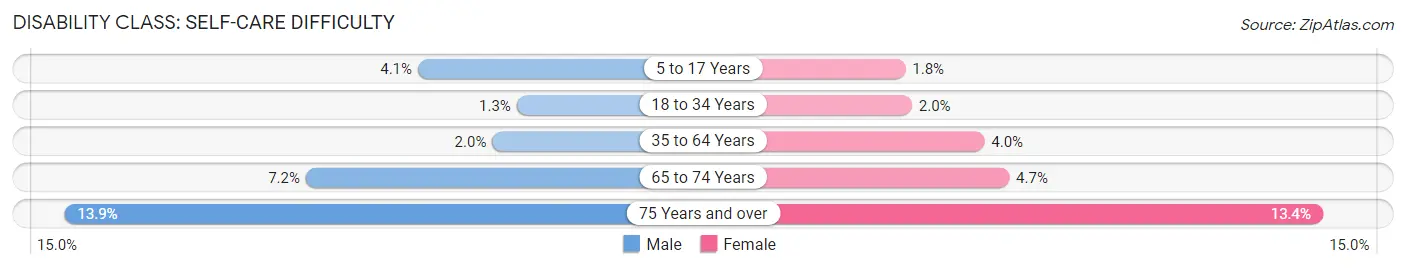
| Age Bracket | Male | Female |
| 5 to 17 Years | 183 (4.1%) | 80 (1.8%) |
| 18 to 34 Years | 134 (1.3%) | 236 (1.9%) |
| 35 to 64 Years | 243 (2.0%) | 482 (4.0%) |
| 65 to 74 Years | 209 (7.2%) | 154 (4.7%) |
| 75 Years and over | 209 (13.9%) | 324 (13.4%) |
Technology Access in Johnson City
Computing Device Access in Johnson City
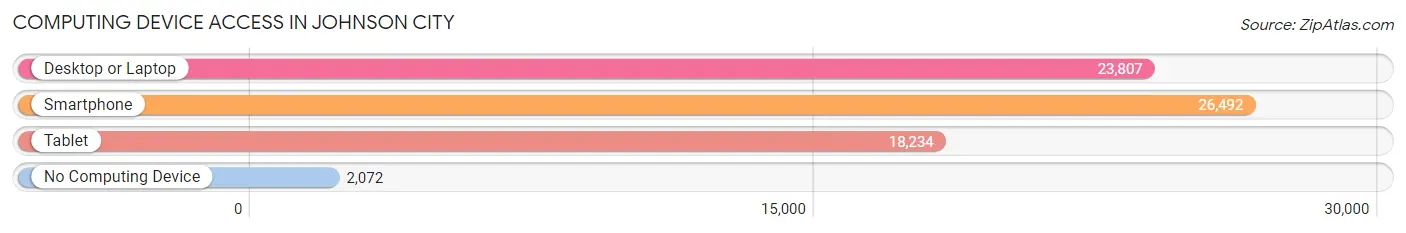
| Device Type | # Households | % Households |
| Desktop or Laptop | 23,807 | 79.1% |
| Smartphone | 26,492 | 88.0% |
| Tablet | 18,234 | 60.6% |
| No Computing Device | 2,072 | 6.9% |
| Total | 30,107 | 100.0% |
Internet Access in Johnson City
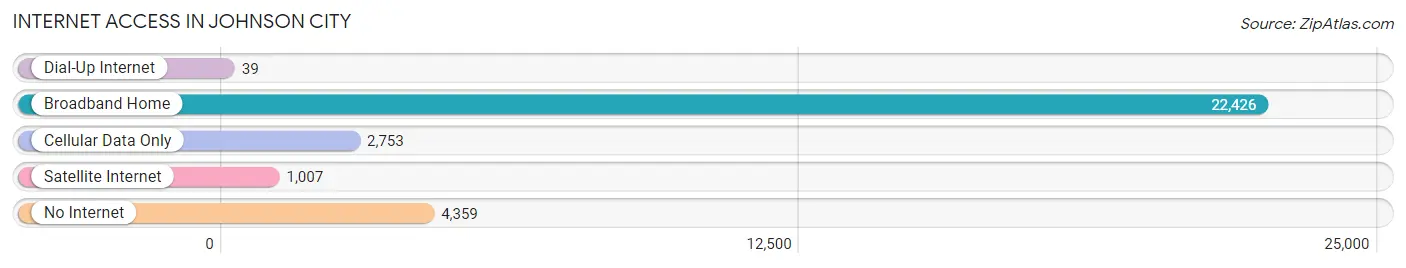
| Internet Type | # Households | % Households |
| Dial-Up Internet | 39 | 0.1% |
| Broadband Home | 22,426 | 74.5% |
| Cellular Data Only | 2,753 | 9.1% |
| Satellite Internet | 1,007 | 3.3% |
| No Internet | 4,359 | 14.5% |
| Total | 30,107 | 100.0% |
Johnson City Summary
Johnson City, Tennessee is a city located in the northeastern part of the state, in Washington County. It is the county seat of Washington County and is part of the Johnson City Metropolitan Statistical Area, which is a component of the Johnson City–Kingsport–Bristol Combined Statistical Area – commonly known as the "Tri-Cities" region. The city is the ninth-largest in the state and the largest in the Tri-Cities region.
History
The area that is now Johnson City was first settled in 1777 by William Bean, who is considered to be the first permanent settler in the area. The city was officially established in 1856 and was named after Henry Johnson, a state senator who had served in the state legislature from 1835 to 1837.
The city grew rapidly in the late 19th and early 20th centuries, due in part to the railroad industry. The city was home to several major railroads, including the East Tennessee and Western North Carolina Railroad, the Clinchfield Railroad, and the Southern Railway. The city was also home to several major manufacturing companies, including the American Bemberg Corporation, which was the largest employer in the city for many years.
Geography
Johnson City is located in the northeastern part of the state, in Washington County. It is situated at the confluence of the Doe River and the Watauga River, and is surrounded by the Appalachian Mountains. The city has a total area of 24.2 square miles, of which 24.1 square miles is land and 0.1 square miles is water.
The city is located at an elevation of 1,890 feet above sea level. The climate is humid subtropical, with hot, humid summers and mild winters. The average annual temperature is 57.2°F, and the average annual precipitation is 45.2 inches.
Economy
Johnson City has a diverse economy, with a mix of manufacturing, retail, healthcare, and educational services. The city is home to several major employers, including Eastman Chemical Company, Johnson City Medical Center, and East Tennessee State University.
The city is also home to several major retail centers, including the Mall at Johnson City, which is the largest shopping mall in the Tri-Cities region. The city is also home to several major restaurants, including the popular local chain, Pal's Sudden Service.
Demographics
As of the 2010 census, Johnson City had a population of 63,152. The racial makeup of the city was 84.2% White, 8.3% African American, 0.3% Native American, 2.2% Asian, 0.1% Pacific Islander, 2.3% from other races, and 2.7% from two or more races. Hispanic or Latino of any race were 5.2% of the population.
The median household income in Johnson City was $37,837, and the median family income was $45,945. The per capita income was $20,945. About 14.2% of the population was below the poverty line.
Johnson City is served by the Johnson City School System, which consists of seven elementary schools, two middle schools, and two high schools. The city is also home to East Tennessee State University, which is a public university with an enrollment of over 14,000 students.
Common Questions
What is Per Capita Income in Johnson City?
Per Capita income in Johnson City is $36,210.
What is the Median Family Income in Johnson City?
Median Family Income in Johnson City is $78,509.
What is the Median Household income in Johnson City?
Median Household Income in Johnson City is $53,173.
What is Income or Wage Gap in Johnson City?
Income or Wage Gap in Johnson City is 29.0%.
Women in Johnson City earn 71.0 cents for every dollar earned by a man.
What is Family Income Deficit in Johnson City?
Family Income Deficit in Johnson City is $10,643.
Families that are below poverty line in Johnson City earn $10,643 less on average than the poverty threshold level.
What is Inequality or Gini Index in Johnson City?
Inequality or Gini Index in Johnson City is 0.53.
What is the Total Population of Johnson City?
Total Population of Johnson City is 70,720.
What is the Total Male Population of Johnson City?
Total Male Population of Johnson City is 33,878.
What is the Total Female Population of Johnson City?
Total Female Population of Johnson City is 36,842.
What is the Ratio of Males per 100 Females in Johnson City?
There are 91.95 Males per 100 Females in Johnson City.
What is the Ratio of Females per 100 Males in Johnson City?
There are 108.75 Females per 100 Males in Johnson City.
What is the Median Population Age in Johnson City?
Median Population Age in Johnson City is 34.9 Years.
What is the Average Family Size in Johnson City
Average Family Size in Johnson City is 2.9 People.
What is the Average Household Size in Johnson City
Average Household Size in Johnson City is 2.2 People.
How Large is the Labor Force in Johnson City?
There are 36,646 People in the Labor Forcein in Johnson City.
What is the Percentage of People in the Labor Force in Johnson City?
62.0% of People are in the Labor Force in Johnson City.
What is the Unemployment Rate in Johnson City?
Unemployment Rate in Johnson City is 6.1%.