Kingston, TN Map & Demographics
Kingston Map
Kingston Overview
$33,574
PER CAPITA INCOME
$83,389
AVG FAMILY INCOME
$67,637
AVG HOUSEHOLD INCOME
33.9%
WAGE / INCOME GAP [ % ]
66.1¢/ $1
WAGE / INCOME GAP [ $ ]
0.41
INEQUALITY / GINI INDEX
5,987
TOTAL POPULATION
2,898
MALE POPULATION
3,089
FEMALE POPULATION
93.82
MALES / 100 FEMALES
106.59
FEMALES / 100 MALES
44.7
MEDIAN AGE
3.2
AVG FAMILY SIZE
2.4
AVG HOUSEHOLD SIZE
2,768
LABOR FORCE [ PEOPLE ]
55.4%
PERCENT IN LABOR FORCE
7.3%
UNEMPLOYMENT RATE
Kingston Zip Codes
Kingston Area Codes
Income in Kingston
Income Overview in Kingston
Per Capita Income in Kingston is $33,574, while median incomes of families and households are $83,389 and $67,637 respectively.
| Characteristic | Number | Measure |
| Per Capita Income | 5,987 | $33,574 |
| Median Family Income | 1,432 | $83,389 |
| Mean Family Income | 1,432 | $97,771 |
| Median Household Income | 2,393 | $67,637 |
| Mean Household Income | 2,393 | $80,274 |
| Income Deficit | 1,432 | $0 |
| Wage / Income Gap (%) | 5,987 | 33.94% |
| Wage / Income Gap ($) | 5,987 | 66.06¢ per $1 |
| Gini / Inequality Index | 5,987 | 0.41 |
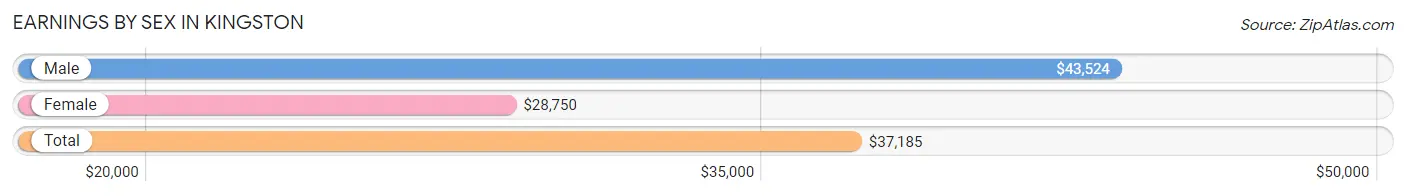
Earnings by Sex in Kingston
Average Earnings in Kingston are $37,185, $43,524 for men and $28,750 for women, a difference of 33.9%.
| Sex | Number | Average Earnings |
| Male | 1,613 (55.5%) | $43,524 |
| Female | 1,295 (44.5%) | $28,750 |
| Total | 2,908 (100.0%) | $37,185 |
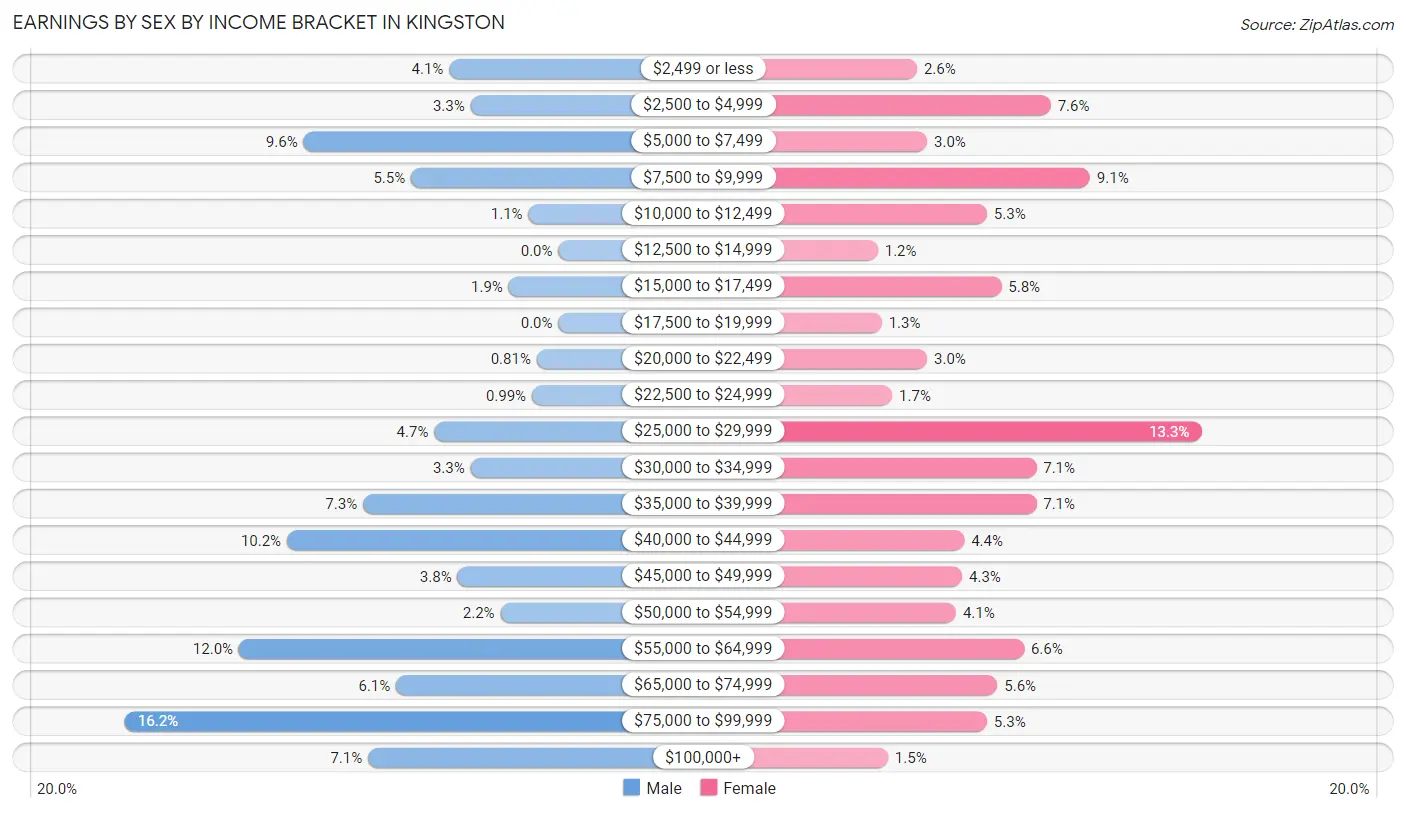
Earnings by Sex by Income Bracket in Kingston
The most common earnings brackets in Kingston are $75,000 to $99,999 for men (262 | 16.2%) and $25,000 to $29,999 for women (172 | 13.3%).
| Income | Male | Female |
| $2,499 or less | 66 (4.1%) | 34 (2.6%) |
| $2,500 to $4,999 | 53 (3.3%) | 99 (7.6%) |
| $5,000 to $7,499 | 154 (9.6%) | 39 (3.0%) |
| $7,500 to $9,999 | 89 (5.5%) | 118 (9.1%) |
| $10,000 to $12,499 | 18 (1.1%) | 68 (5.2%) |
| $12,500 to $14,999 | 0 (0.0%) | 15 (1.2%) |
| $15,000 to $17,499 | 30 (1.9%) | 75 (5.8%) |
| $17,500 to $19,999 | 0 (0.0%) | 17 (1.3%) |
| $20,000 to $22,499 | 13 (0.8%) | 39 (3.0%) |
| $22,500 to $24,999 | 16 (1.0%) | 22 (1.7%) |
| $25,000 to $29,999 | 75 (4.6%) | 172 (13.3%) |
| $30,000 to $34,999 | 53 (3.3%) | 92 (7.1%) |
| $35,000 to $39,999 | 118 (7.3%) | 92 (7.1%) |
| $40,000 to $44,999 | 164 (10.2%) | 57 (4.4%) |
| $45,000 to $49,999 | 61 (3.8%) | 56 (4.3%) |
| $50,000 to $54,999 | 35 (2.2%) | 53 (4.1%) |
| $55,000 to $64,999 | 193 (12.0%) | 86 (6.6%) |
| $65,000 to $74,999 | 98 (6.1%) | 73 (5.6%) |
| $75,000 to $99,999 | 262 (16.2%) | 68 (5.2%) |
| $100,000+ | 115 (7.1%) | 20 (1.5%) |
| Total | 1,613 (100.0%) | 1,295 (100.0%) |
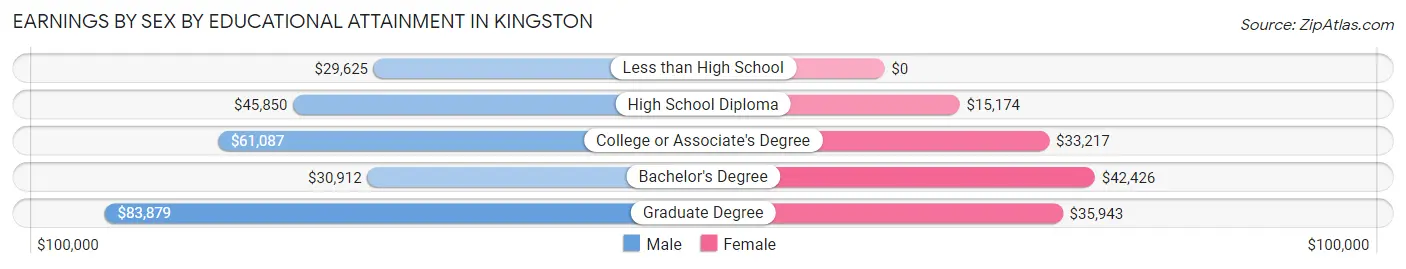
Earnings by Sex by Educational Attainment in Kingston
Average earnings in Kingston are $50,821 for men and $28,775 for women, a difference of 43.4%. Men with an educational attainment of graduate degree enjoy the highest average annual earnings of $83,879, while those with less than high school education earn the least with $29,625. Women with an educational attainment of bachelor's degree earn the most with the average annual earnings of $42,426, while those with high school diploma education have the smallest earnings of $15,174.
| Educational Attainment | Male Income | Female Income |
| Less than High School | $29,625 | $0 |
| High School Diploma | $45,850 | $15,174 |
| College or Associate's Degree | $61,087 | $33,217 |
| Bachelor's Degree | $30,912 | $42,426 |
| Graduate Degree | $83,879 | $35,943 |
| Total | $50,821 | $28,775 |
Family Income in Kingston
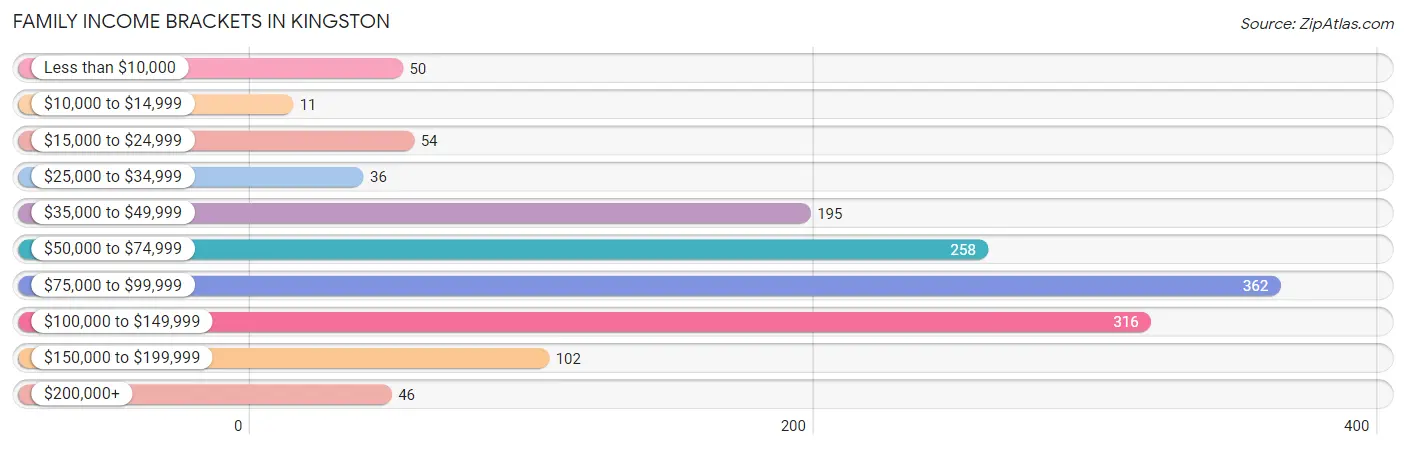
Family Income Brackets in Kingston
According to the Kingston family income data, there are 362 families falling into the $75,000 to $99,999 income range, which is the most common income bracket and makes up 25.3% of all families. Conversely, the $10,000 to $14,999 income bracket is the least frequent group with only 11 families (0.8%) belonging to this category.
| Income Bracket | # Families | % Families |
| Less than $10,000 | 50 | 3.5% |
| $10,000 to $14,999 | 11 | 0.8% |
| $15,000 to $24,999 | 54 | 3.8% |
| $25,000 to $34,999 | 36 | 2.5% |
| $35,000 to $49,999 | 195 | 13.6% |
| $50,000 to $74,999 | 258 | 18.0% |
| $75,000 to $99,999 | 362 | 25.3% |
| $100,000 to $149,999 | 316 | 22.1% |
| $150,000 to $199,999 | 102 | 7.1% |
| $200,000+ | 46 | 3.2% |
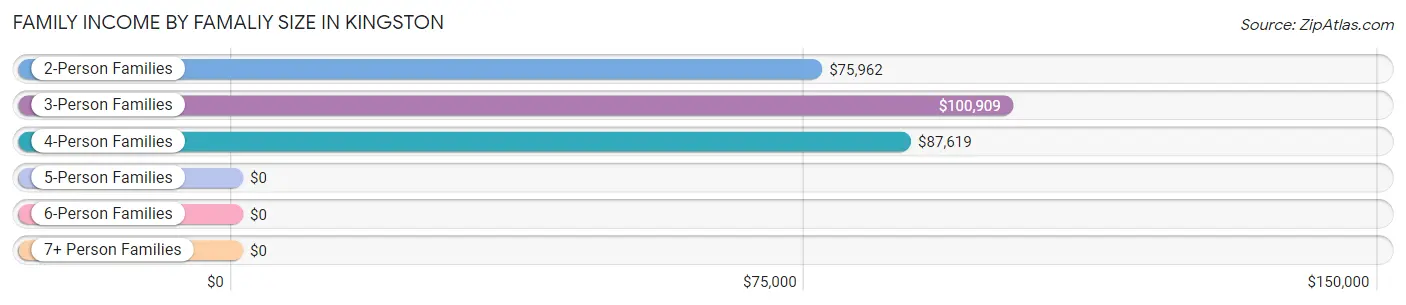
Family Income by Famaliy Size in Kingston
3-person families (270 | 18.9%) account for the highest median family income in Kingston with $100,909 per family, while 2-person families (702 | 49.0%) have the highest median income of $37,981 per family member.
| Income Bracket | # Families | Median Income |
| 2-Person Families | 702 (49.0%) | $75,962 |
| 3-Person Families | 270 (18.9%) | $100,909 |
| 4-Person Families | 308 (21.5%) | $87,619 |
| 5-Person Families | 45 (3.1%) | $0 |
| 6-Person Families | 27 (1.9%) | $0 |
| 7+ Person Families | 80 (5.6%) | $0 |
| Total | 1,432 (100.0%) | $83,389 |
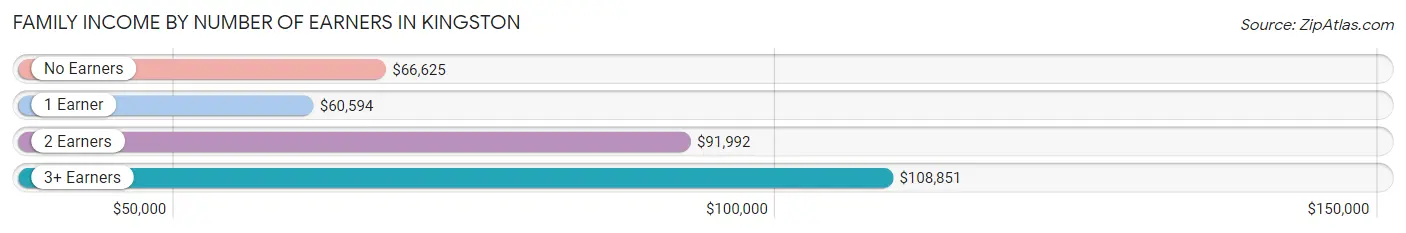
Family Income by Number of Earners in Kingston
The median family income in Kingston is $83,389, with families comprising 3+ earners (177) having the highest median family income of $108,851, while families with 1 earner (443) have the lowest median family income of $60,594, accounting for 12.4% and 30.9% of families, respectively.
| Number of Earners | # Families | Median Income |
| No Earners | 277 (19.3%) | $66,625 |
| 1 Earner | 443 (30.9%) | $60,594 |
| 2 Earners | 535 (37.4%) | $91,992 |
| 3+ Earners | 177 (12.4%) | $108,851 |
| Total | 1,432 (100.0%) | $83,389 |
Household Income in Kingston
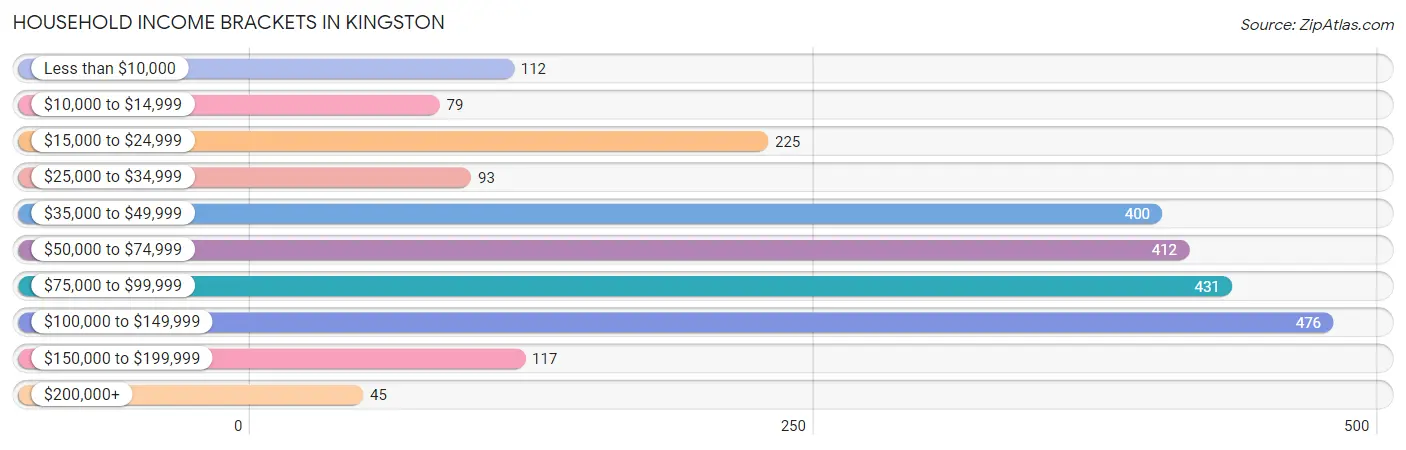
Household Income Brackets in Kingston
With 476 households falling in the category, the $100,000 to $149,999 income range is the most frequent in Kingston, accounting for 19.9% of all households. In contrast, only 45 households (1.9%) fall into the $200,000+ income bracket, making it the least populous group.
| Income Bracket | # Households | % Households |
| Less than $10,000 | 112 | 4.7% |
| $10,000 to $14,999 | 79 | 3.3% |
| $15,000 to $24,999 | 225 | 9.4% |
| $25,000 to $34,999 | 93 | 3.9% |
| $35,000 to $49,999 | 400 | 16.7% |
| $50,000 to $74,999 | 412 | 17.2% |
| $75,000 to $99,999 | 431 | 18.0% |
| $100,000 to $149,999 | 476 | 19.9% |
| $150,000 to $199,999 | 117 | 4.9% |
| $200,000+ | 45 | 1.9% |
Household Income by Householder Age in Kingston
The median household income in Kingston is $67,637, with the highest median household income of $87,872 found in the 45 to 64 years age bracket for the primary householder. A total of 800 households (33.4%) fall into this category. Meanwhile, the 65+ years age bracket for the primary householder has the lowest median household income of $49,231, with 978 households (40.9%) in this group.
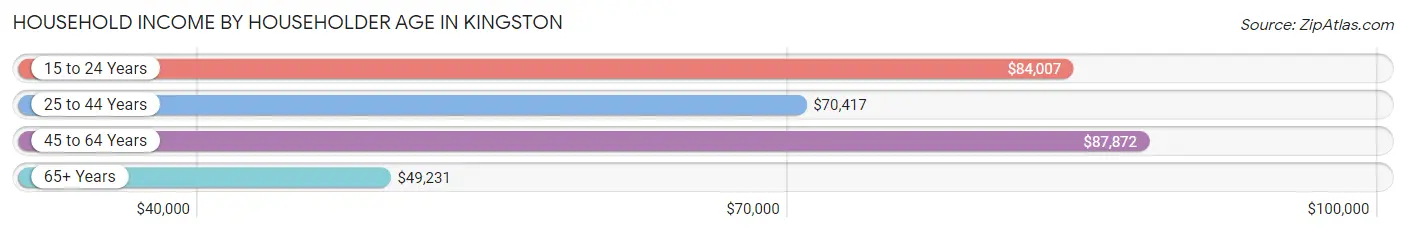
| Income Bracket | # Households | Median Income |
| 15 to 24 Years | 91 (3.8%) | $84,007 |
| 25 to 44 Years | 524 (21.9%) | $70,417 |
| 45 to 64 Years | 800 (33.4%) | $87,872 |
| 65+ Years | 978 (40.9%) | $49,231 |
| Total | 2,393 (100.0%) | $67,637 |
Poverty in Kingston
Income Below Poverty by Sex and Age in Kingston
With 3.4% poverty level for males and 8.3% for females among the residents of Kingston, 16 and 17 year old males and 15 year old females are the most vulnerable to poverty, with 9 males (27.3%) and 15 females (100.0%) in their respective age groups living below the poverty level.
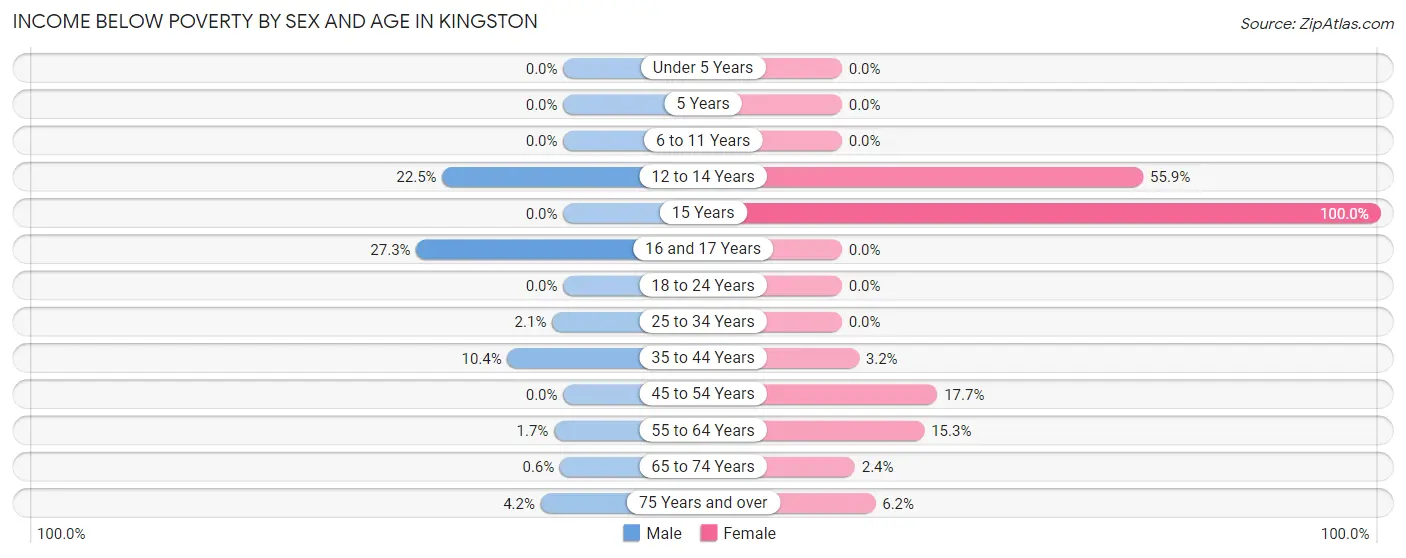
| Age Bracket | Male | Female |
| Under 5 Years | 0 (0.0%) | 0 (0.0%) |
| 5 Years | 0 (0.0%) | 0 (0.0%) |
| 6 to 11 Years | 0 (0.0%) | 0 (0.0%) |
| 12 to 14 Years | 11 (22.5%) | 33 (55.9%) |
| 15 Years | 0 (0.0%) | 15 (100.0%) |
| 16 and 17 Years | 9 (27.3%) | 0 (0.0%) |
| 18 to 24 Years | 0 (0.0%) | 0 (0.0%) |
| 25 to 34 Years | 4 (2.1%) | 0 (0.0%) |
| 35 to 44 Years | 52 (10.4%) | 12 (3.2%) |
| 45 to 54 Years | 0 (0.0%) | 88 (17.7%) |
| 55 to 64 Years | 5 (1.7%) | 71 (15.3%) |
| 65 to 74 Years | 2 (0.6%) | 8 (2.4%) |
| 75 Years and over | 11 (4.2%) | 26 (6.2%) |
| Total | 94 (3.4%) | 253 (8.3%) |
Income Above Poverty by Sex and Age in Kingston
According to the poverty statistics in Kingston, males aged under 5 years and females aged under 5 years are the age groups that are most secure financially, with 100.0% of males and 100.0% of females in these age groups living above the poverty line.
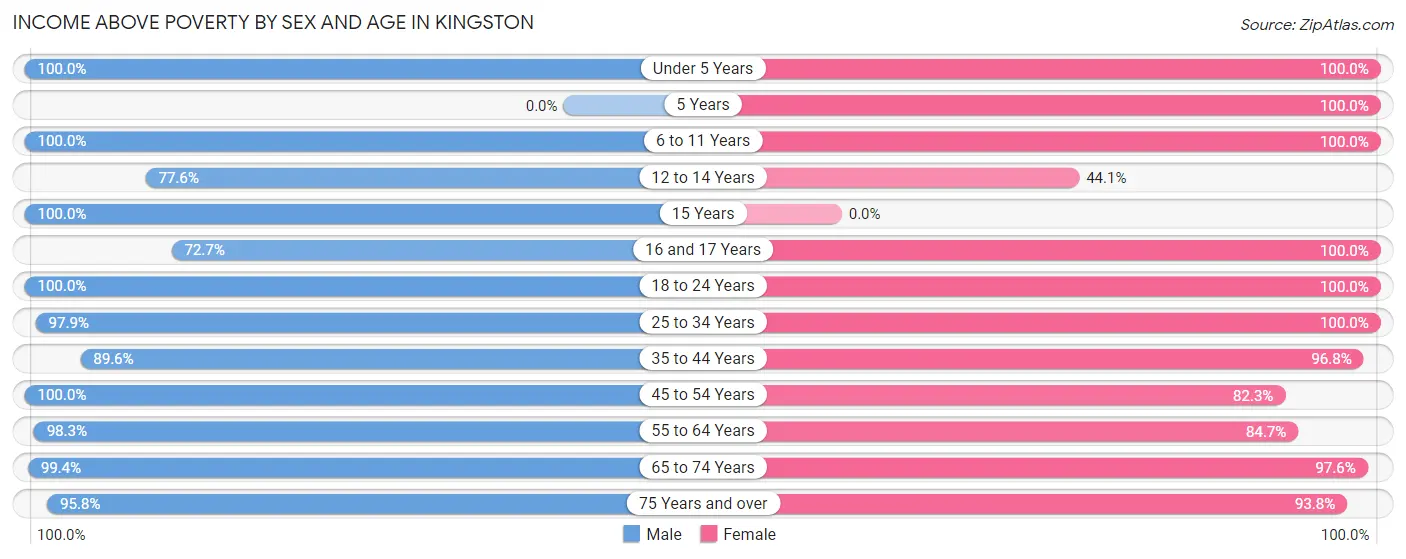
| Age Bracket | Male | Female |
| Under 5 Years | 113 (100.0%) | 190 (100.0%) |
| 5 Years | 0 (0.0%) | 15 (100.0%) |
| 6 to 11 Years | 277 (100.0%) | 251 (100.0%) |
| 12 to 14 Years | 38 (77.5%) | 26 (44.1%) |
| 15 Years | 21 (100.0%) | 0 (0.0%) |
| 16 and 17 Years | 24 (72.7%) | 94 (100.0%) |
| 18 to 24 Years | 352 (100.0%) | 108 (100.0%) |
| 25 to 34 Years | 190 (97.9%) | 231 (100.0%) |
| 35 to 44 Years | 450 (89.6%) | 367 (96.8%) |
| 45 to 54 Years | 328 (100.0%) | 409 (82.3%) |
| 55 to 64 Years | 289 (98.3%) | 393 (84.7%) |
| 65 to 74 Years | 331 (99.4%) | 324 (97.6%) |
| 75 Years and over | 252 (95.8%) | 392 (93.8%) |
| Total | 2,665 (96.6%) | 2,800 (91.7%) |
Income Below Poverty Among Married-Couple Families in Kingston
The poverty statistics for married-couple families in Kingston show that 1.2% or 12 of the total 1,037 families live below the poverty line. Families with 1 or 2 children have the highest poverty rate of 3.6%, comprising of 12 families. On the other hand, families with no children have the lowest poverty rate of 0.0%, which includes 0 families.
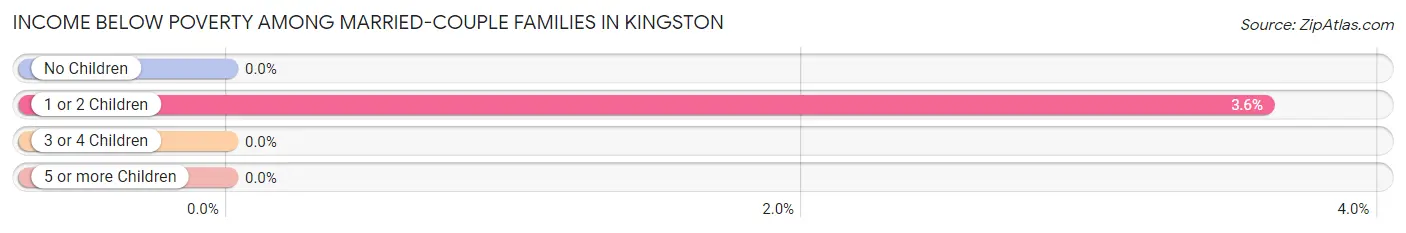
| Children | Above Poverty | Below Poverty |
| No Children | 651 (100.0%) | 0 (0.0%) |
| 1 or 2 Children | 320 (96.4%) | 12 (3.6%) |
| 3 or 4 Children | 14 (100.0%) | 0 (0.0%) |
| 5 or more Children | 40 (100.0%) | 0 (0.0%) |
| Total | 1,025 (98.8%) | 12 (1.2%) |
Income Below Poverty Among Single-Parent Households in Kingston
According to the poverty data in Kingston, 7.2% or 11 single-father households and 16.1% or 39 single-mother households are living below the poverty line. Among single-father households, those with no children have the highest poverty rate, with 11 households (16.2%) experiencing poverty. Likewise, among single-mother households, those with 1 or 2 children have the highest poverty rate, with 39 households (41.5%) falling below the poverty line.
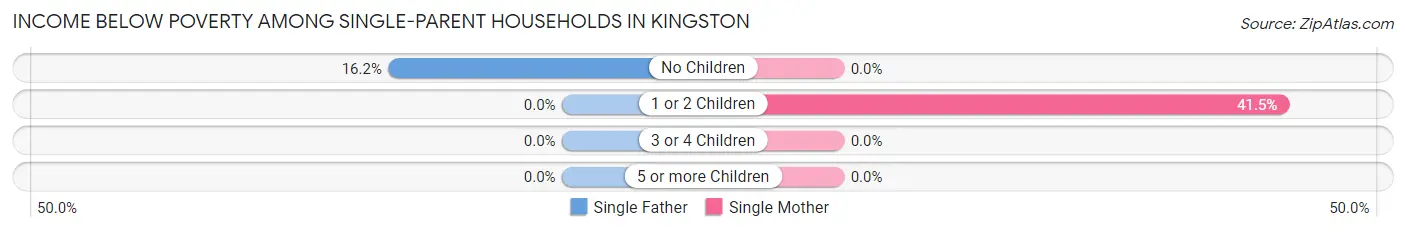
| Children | Single Father | Single Mother |
| No Children | 11 (16.2%) | 0 (0.0%) |
| 1 or 2 Children | 0 (0.0%) | 39 (41.5%) |
| 3 or 4 Children | 0 (0.0%) | 0 (0.0%) |
| 5 or more Children | 0 (0.0%) | 0 (0.0%) |
| Total | 11 (7.2%) | 39 (16.1%) |
Income Below Poverty Among Married-Couple vs Single-Parent Households in Kingston
The poverty data for Kingston shows that 12 of the married-couple family households (1.2%) and 50 of the single-parent households (12.7%) are living below the poverty level. Within the married-couple family households, those with 1 or 2 children have the highest poverty rate, with 12 households (3.6%) falling below the poverty line. Among the single-parent households, those with 1 or 2 children have the highest poverty rate, with 39 household (21.9%) living below poverty.
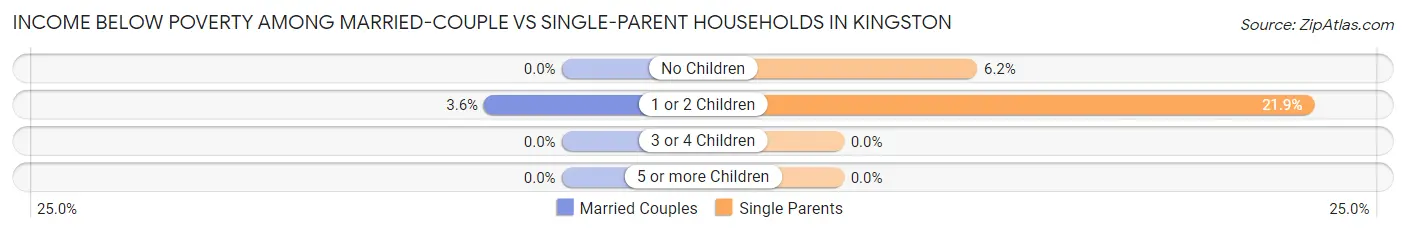
| Children | Married-Couple Families | Single-Parent Households |
| No Children | 0 (0.0%) | 11 (6.2%) |
| 1 or 2 Children | 12 (3.6%) | 39 (21.9%) |
| 3 or 4 Children | 0 (0.0%) | 0 (0.0%) |
| 5 or more Children | 0 (0.0%) | 0 (0.0%) |
| Total | 12 (1.2%) | 50 (12.7%) |
Race in Kingston
The most populous races in Kingston are White / Caucasian (5,543 | 92.6%), Black / African American (229 | 3.8%), and Two or more Races (158 | 2.6%).
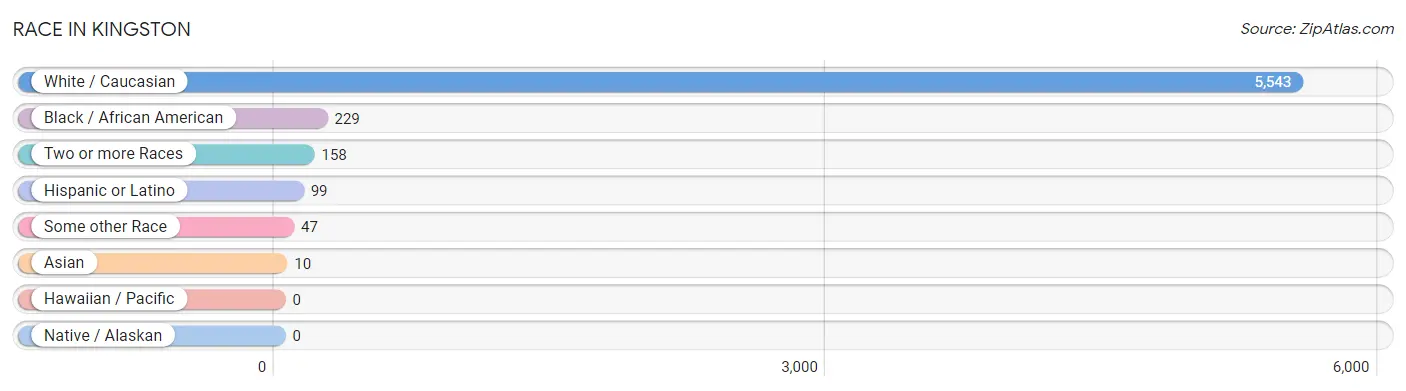
| Race | # Population | % Population |
| Asian | 10 | 0.2% |
| Black / African American | 229 | 3.8% |
| Hawaiian / Pacific | 0 | 0.0% |
| Hispanic or Latino | 99 | 1.7% |
| Native / Alaskan | 0 | 0.0% |
| White / Caucasian | 5,543 | 92.6% |
| Two or more Races | 158 | 2.6% |
| Some other Race | 47 | 0.8% |
| Total | 5,987 | 100.0% |
Ancestry in Kingston
The most populous ancestries reported in Kingston are Irish (791 | 13.2%), American (782 | 13.1%), English (578 | 9.7%), German (557 | 9.3%), and Scotch-Irish (172 | 2.9%), together accounting for 48.1% of all Kingston residents.
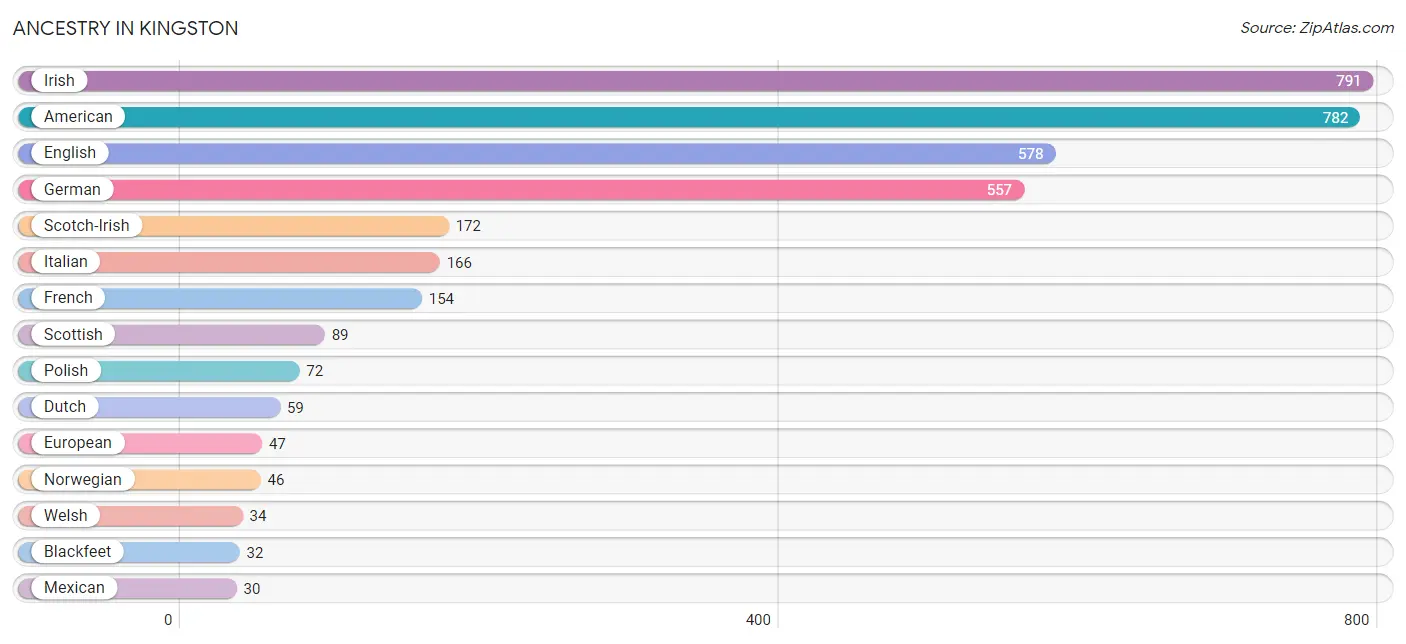
| Ancestry | # Population | % Population |
| American | 782 | 13.1% |
| Blackfeet | 32 | 0.5% |
| British | 9 | 0.2% |
| Cherokee | 18 | 0.3% |
| Dutch | 59 | 1.0% |
| Eastern European | 6 | 0.1% |
| English | 578 | 9.7% |
| European | 47 | 0.8% |
| French | 154 | 2.6% |
| German | 557 | 9.3% |
| Icelander | 10 | 0.2% |
| Irish | 791 | 13.2% |
| Italian | 166 | 2.8% |
| Korean | 11 | 0.2% |
| Mexican | 30 | 0.5% |
| Norwegian | 46 | 0.8% |
| Polish | 72 | 1.2% |
| Puerto Rican | 6 | 0.1% |
| Russian | 6 | 0.1% |
| Scotch-Irish | 172 | 2.9% |
| Scottish | 89 | 1.5% |
| Ukrainian | 6 | 0.1% |
| Welsh | 34 | 0.6% | View All 23 Rows |
Immigrants in Kingston
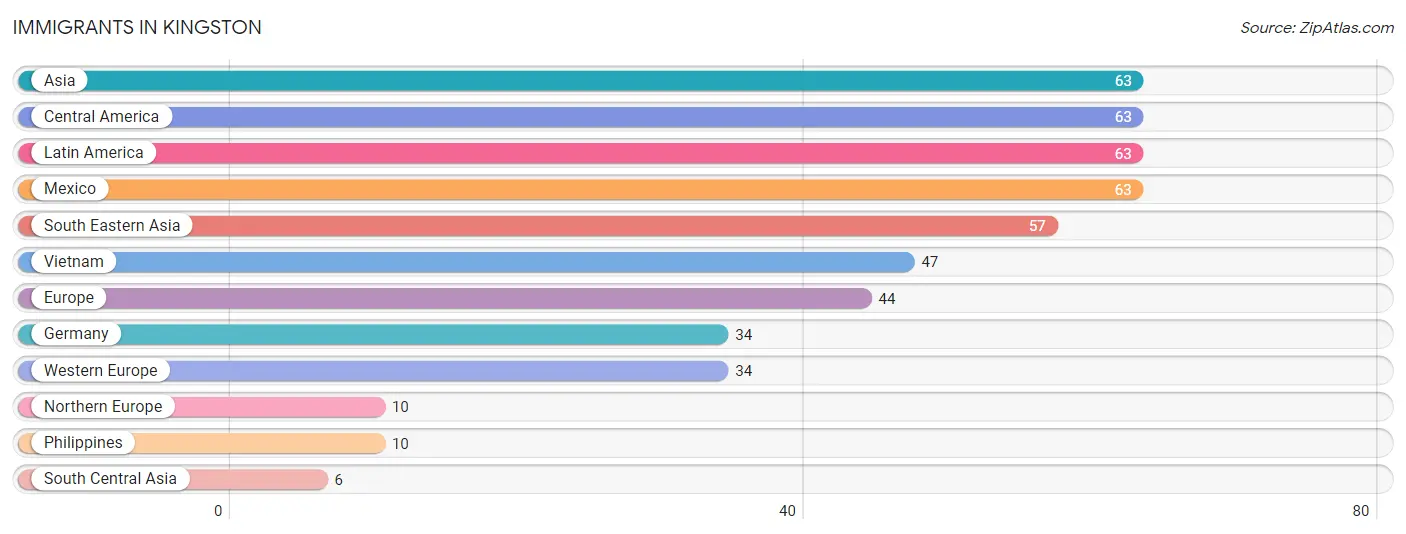
The most numerous immigrant groups reported in Kingston came from Asia (63 | 1.1%), Central America (63 | 1.1%), Latin America (63 | 1.1%), Mexico (63 | 1.1%), and South Eastern Asia (57 | 0.9%), together accounting for 5.2% of all Kingston residents.
| Immigration Origin | # Population | % Population |
| Asia | 63 | 1.1% |
| Central America | 63 | 1.1% |
| Europe | 44 | 0.7% |
| Germany | 34 | 0.6% |
| Latin America | 63 | 1.1% |
| Mexico | 63 | 1.1% |
| Northern Europe | 10 | 0.2% |
| Philippines | 10 | 0.2% |
| South Central Asia | 6 | 0.1% |
| South Eastern Asia | 57 | 0.9% |
| Vietnam | 47 | 0.8% |
| Western Europe | 34 | 0.6% | View All 12 Rows |
Sex and Age in Kingston
Sex and Age in Kingston
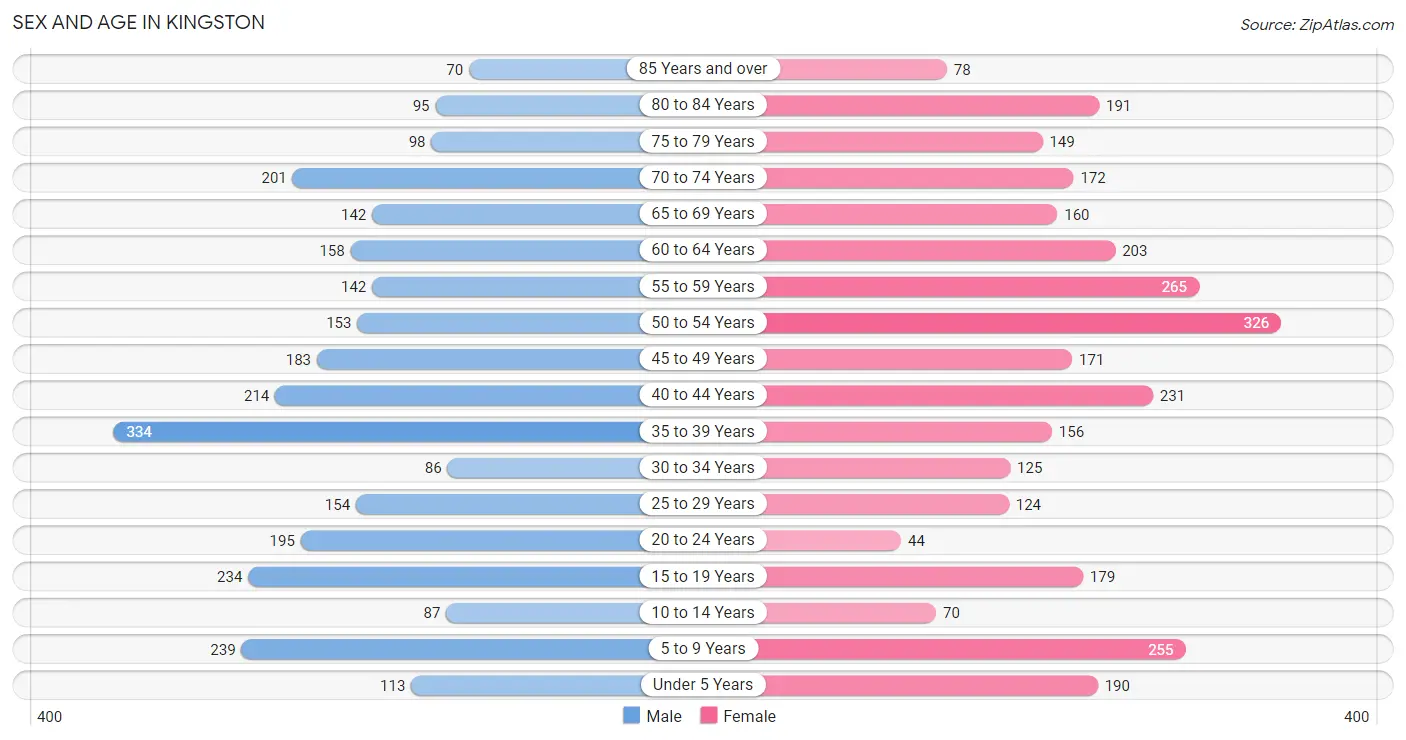
The most populous age groups in Kingston are 35 to 39 Years (334 | 11.5%) for men and 50 to 54 Years (326 | 10.5%) for women.
| Age Bracket | Male | Female |
| Under 5 Years | 113 (3.9%) | 190 (6.1%) |
| 5 to 9 Years | 239 (8.3%) | 255 (8.3%) |
| 10 to 14 Years | 87 (3.0%) | 70 (2.3%) |
| 15 to 19 Years | 234 (8.1%) | 179 (5.8%) |
| 20 to 24 Years | 195 (6.7%) | 44 (1.4%) |
| 25 to 29 Years | 154 (5.3%) | 124 (4.0%) |
| 30 to 34 Years | 86 (3.0%) | 125 (4.1%) |
| 35 to 39 Years | 334 (11.5%) | 156 (5.1%) |
| 40 to 44 Years | 214 (7.4%) | 231 (7.5%) |
| 45 to 49 Years | 183 (6.3%) | 171 (5.5%) |
| 50 to 54 Years | 153 (5.3%) | 326 (10.5%) |
| 55 to 59 Years | 142 (4.9%) | 265 (8.6%) |
| 60 to 64 Years | 158 (5.4%) | 203 (6.6%) |
| 65 to 69 Years | 142 (4.9%) | 160 (5.2%) |
| 70 to 74 Years | 201 (6.9%) | 172 (5.6%) |
| 75 to 79 Years | 98 (3.4%) | 149 (4.8%) |
| 80 to 84 Years | 95 (3.3%) | 191 (6.2%) |
| 85 Years and over | 70 (2.4%) | 78 (2.5%) |
| Total | 2,898 (100.0%) | 3,089 (100.0%) |
Families and Households in Kingston
Median Family Size in Kingston
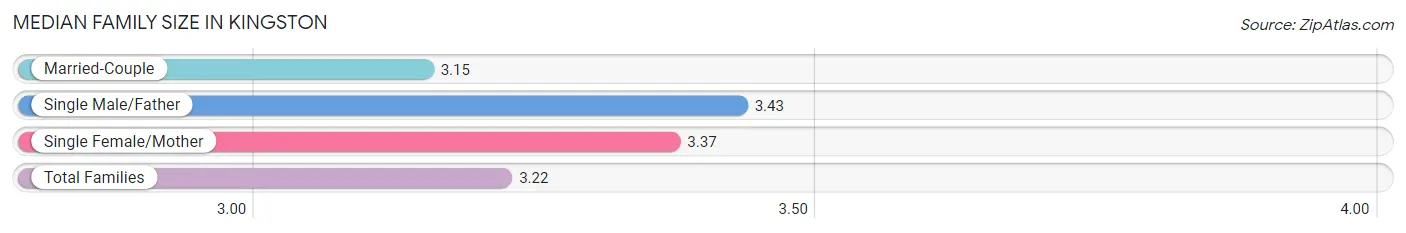
The median family size in Kingston is 3.22 persons per family, with single male/father families (152 | 10.6%) accounting for the largest median family size of 3.43 persons per family. On the other hand, married-couple families (1,037 | 72.4%) represent the smallest median family size with 3.15 persons per family.
| Family Type | # Families | Family Size |
| Married-Couple | 1,037 (72.4%) | 3.15 |
| Single Male/Father | 152 (10.6%) | 3.43 |
| Single Female/Mother | 243 (17.0%) | 3.37 |
| Total Families | 1,432 (100.0%) | 3.22 |
Median Household Size in Kingston
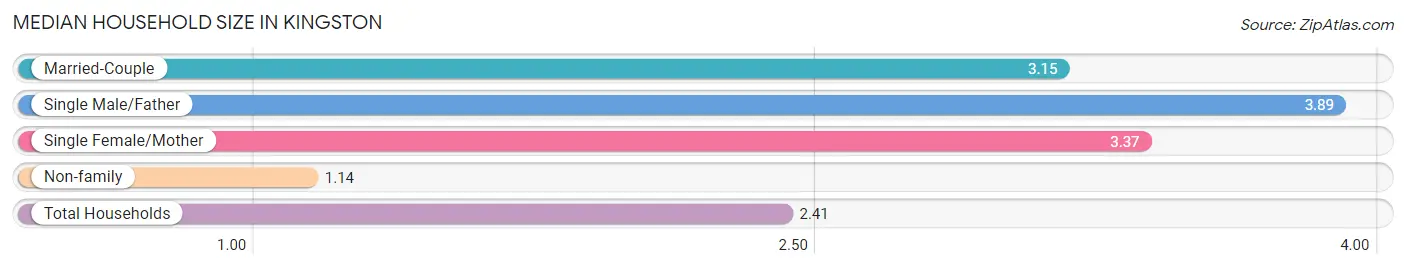
The median household size in Kingston is 2.41 persons per household, with single male/father households (152 | 6.4%) accounting for the largest median household size of 3.89 persons per household. non-family households (961 | 40.2%) represent the smallest median household size with 1.14 persons per household.
| Household Type | # Households | Household Size |
| Married-Couple | 1,037 (43.3%) | 3.15 |
| Single Male/Father | 152 (6.4%) | 3.89 |
| Single Female/Mother | 243 (10.2%) | 3.37 |
| Non-family | 961 (40.2%) | 1.14 |
| Total Households | 2,393 (100.0%) | 2.41 |
Household Size by Marriage Status in Kingston
Out of a total of 2,393 households in Kingston, 1,432 (59.8%) are family households, while 961 (40.2%) are nonfamily households. The most numerous type of family households are 2-person households, comprising 687, and the most common type of nonfamily households are 1-person households, comprising 845.
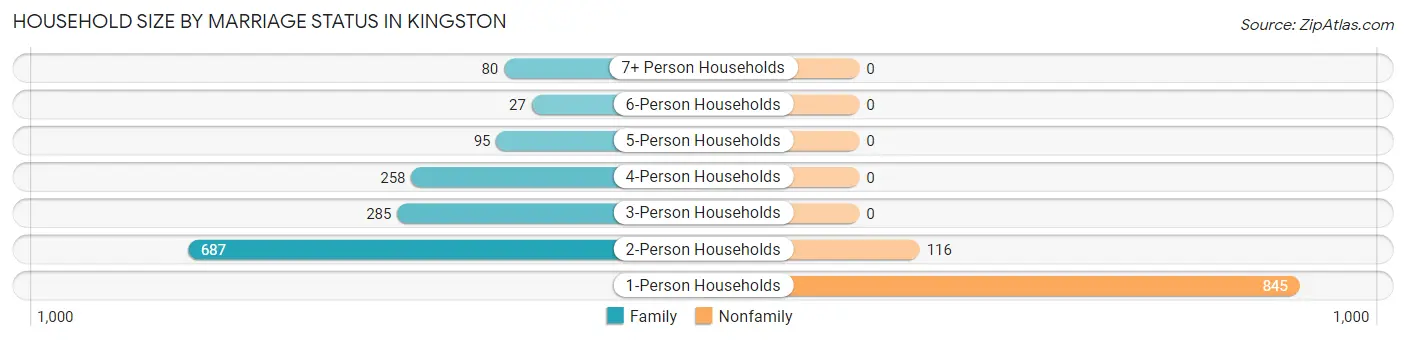
| Household Size | Family Households | Nonfamily Households |
| 1-Person Households | - | 845 (35.3%) |
| 2-Person Households | 687 (28.7%) | 116 (4.9%) |
| 3-Person Households | 285 (11.9%) | 0 (0.0%) |
| 4-Person Households | 258 (10.8%) | 0 (0.0%) |
| 5-Person Households | 95 (4.0%) | 0 (0.0%) |
| 6-Person Households | 27 (1.1%) | 0 (0.0%) |
| 7+ Person Households | 80 (3.3%) | 0 (0.0%) |
| Total | 1,432 (59.8%) | 961 (40.2%) |
Female Fertility in Kingston
Fertility by Age in Kingston
Average fertility rate in Kingston is 54.0 births per 1,000 women. Women in the age bracket of 20 to 34 years have the highest fertility rate with 218.0 births per 1,000 women. Women in the age bracket of 20 to 34 years acount for 100.0% of all women with births.
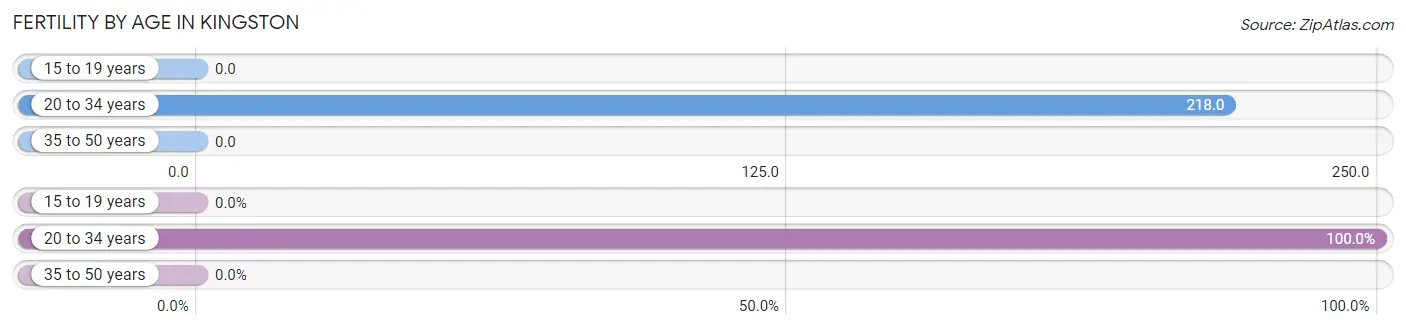
| Age Bracket | Women with Births | Births / 1,000 Women |
| 15 to 19 years | 0 (0.0%) | 0.0 |
| 20 to 34 years | 64 (100.0%) | 218.0 |
| 35 to 50 years | 0 (0.0%) | 0.0 |
| Total | 64 (100.0%) | 54.0 |
Fertility by Age by Marriage Status in Kingston
90.6% of women with births (64) in Kingston are married. The highest percentage of unmarried women with births falls into 20 to 34 years age bracket with 9.4% of them unmarried at the time of birth, while the lowest percentage of unmarried women with births belong to 20 to 34 years age bracket with 9.4% of them unmarried.
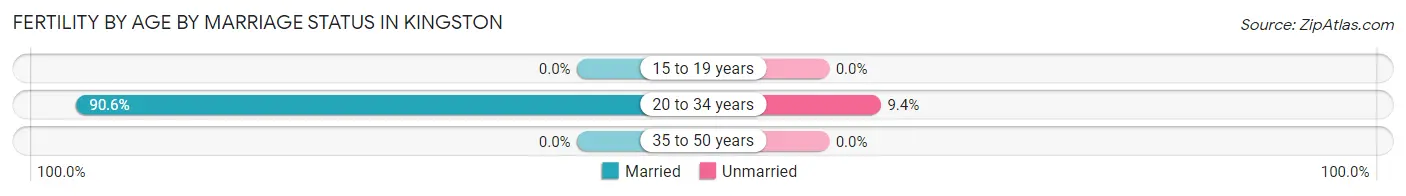
| Age Bracket | Married | Unmarried |
| 15 to 19 years | 0 (0.0%) | 0 (0.0%) |
| 20 to 34 years | 58 (90.6%) | 6 (9.4%) |
| 35 to 50 years | 0 (0.0%) | 0 (0.0%) |
| Total | 58 (90.6%) | 6 (9.4%) |
Fertility by Education in Kingston
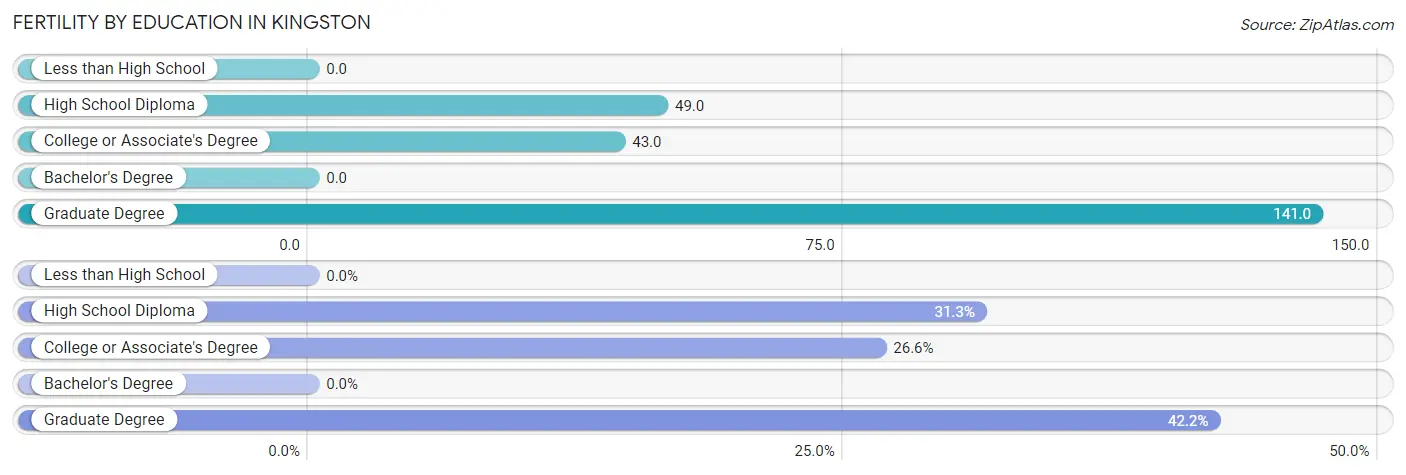
| Educational Attainment | Women with Births | Births / 1,000 Women |
| Less than High School | 0 (0.0%) | 0.0 |
| High School Diploma | 20 (31.2%) | 49.0 |
| College or Associate's Degree | 17 (26.6%) | 43.0 |
| Bachelor's Degree | 0 (0.0%) | 0.0 |
| Graduate Degree | 27 (42.2%) | 141.0 |
| Total | 64 (100.0%) | 54.0 |
Fertility by Education by Marriage Status in Kingston
9.4% of women with births in Kingston are unmarried. Women with the educational attainment of college or associate's degree are most likely to be married with 100.0% of them married at childbirth, while women with the educational attainment of high school diploma are least likely to be married with 30.0% of them unmarried at childbirth.
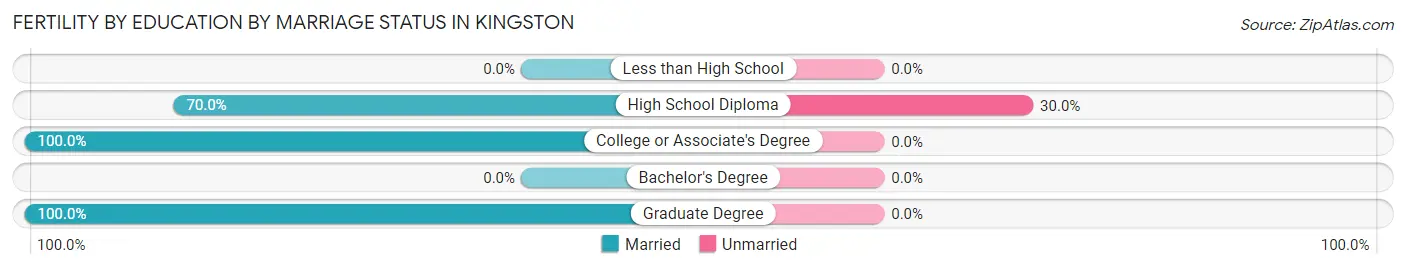
| Educational Attainment | Married | Unmarried |
| Less than High School | 0 (0.0%) | 0 (0.0%) |
| High School Diploma | 14 (70.0%) | 6 (30.0%) |
| College or Associate's Degree | 17 (100.0%) | 0 (0.0%) |
| Bachelor's Degree | 0 (0.0%) | 0 (0.0%) |
| Graduate Degree | 27 (100.0%) | 0 (0.0%) |
| Total | 58 (90.6%) | 6 (9.4%) |
Employment Characteristics in Kingston
Employment by Class of Employer in Kingston
Among the 2,563 employed individuals in Kingston, private company employees (1,543 | 60.2%), federal government employees (259 | 10.1%), and self-employed (not incorporated) (232 | 9.0%) make up the most common classes of employment.
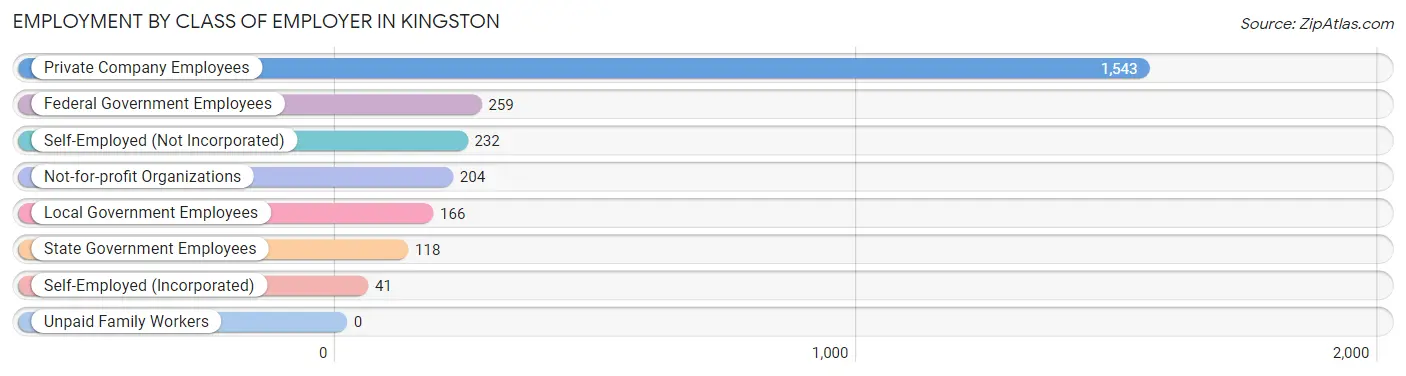
| Employer Class | # Employees | % Employees |
| Private Company Employees | 1,543 | 60.2% |
| Self-Employed (Incorporated) | 41 | 1.6% |
| Self-Employed (Not Incorporated) | 232 | 9.0% |
| Not-for-profit Organizations | 204 | 8.0% |
| Local Government Employees | 166 | 6.5% |
| State Government Employees | 118 | 4.6% |
| Federal Government Employees | 259 | 10.1% |
| Unpaid Family Workers | 0 | 0.0% |
| Total | 2,563 | 100.0% |
Employment Status by Age in Kingston
According to the labor force statistics for Kingston, out of the total population over 16 years of age (4,997), 55.4% or 2,768 individuals are in the labor force, with 7.3% or 202 of them unemployed. The age group with the highest labor force participation rate is 20 to 24 years, with 85.8% or 205 individuals in the labor force. Within the labor force, the 45 to 54 years age range has the highest percentage of unemployed individuals, with 15.5% or 101 of them being unemployed.
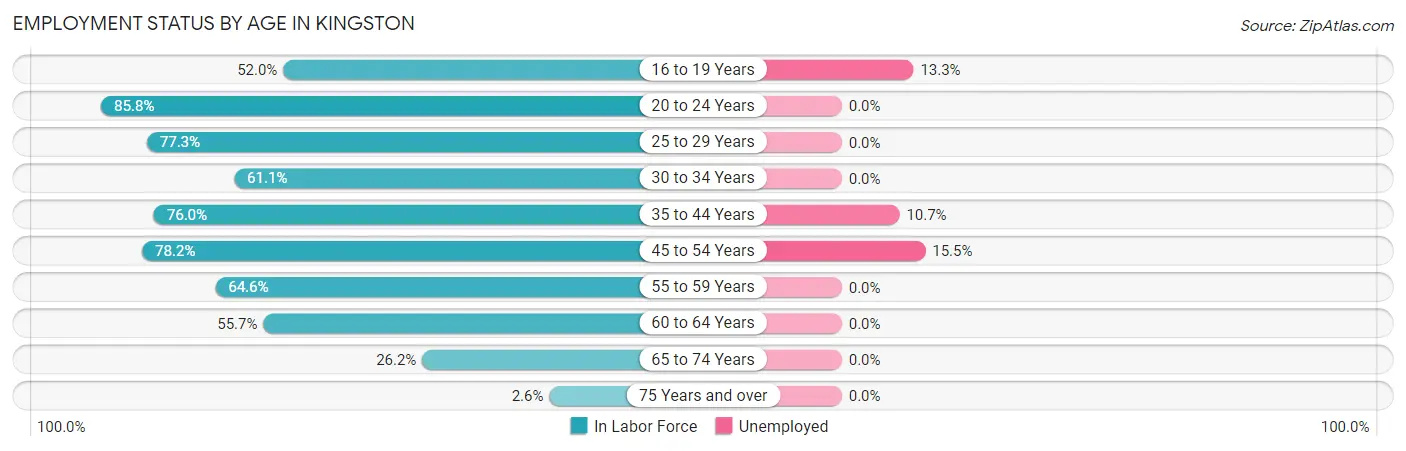
| Age Bracket | In Labor Force | Unemployed |
| 16 to 19 Years | 196 (52.0%) | 26 (13.3%) |
| 20 to 24 Years | 205 (85.8%) | 0 (0.0%) |
| 25 to 29 Years | 215 (77.3%) | 0 (0.0%) |
| 30 to 34 Years | 129 (61.1%) | 0 (0.0%) |
| 35 to 44 Years | 711 (76.0%) | 76 (10.7%) |
| 45 to 54 Years | 651 (78.2%) | 101 (15.5%) |
| 55 to 59 Years | 263 (64.6%) | 0 (0.0%) |
| 60 to 64 Years | 201 (55.7%) | 0 (0.0%) |
| 65 to 74 Years | 177 (26.2%) | 0 (0.0%) |
| 75 Years and over | 18 (2.6%) | 0 (0.0%) |
| Total | 2,768 (55.4%) | 202 (7.3%) |
Employment Status by Educational Attainment in Kingston
According to labor force statistics for Kingston, 71.7% of individuals (2,169) out of the total population between 25 and 64 years of age (3,025) are in the labor force, with 8.2% or 178 of them being unemployed. The group with the highest labor force participation rate are those with the educational attainment of college / associate degree, with 90.1% or 850 individuals in the labor force. Within the labor force, individuals with high school diploma education have the highest percentage of unemployment, with 13.3% or 95 of them being unemployed.
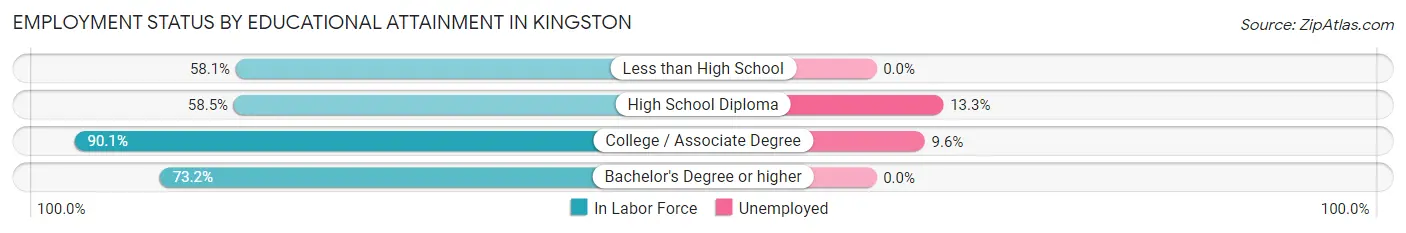
| Educational Attainment | In Labor Force | Unemployed |
| Less than High School | 97 (58.1%) | 0 (0.0%) |
| High School Diploma | 712 (58.5%) | 162 (13.3%) |
| College / Associate Degree | 850 (90.1%) | 91 (9.6%) |
| Bachelor's Degree or higher | 511 (73.2%) | 0 (0.0%) |
| Total | 2,169 (71.7%) | 248 (8.2%) |
Employment Occupations by Sex in Kingston
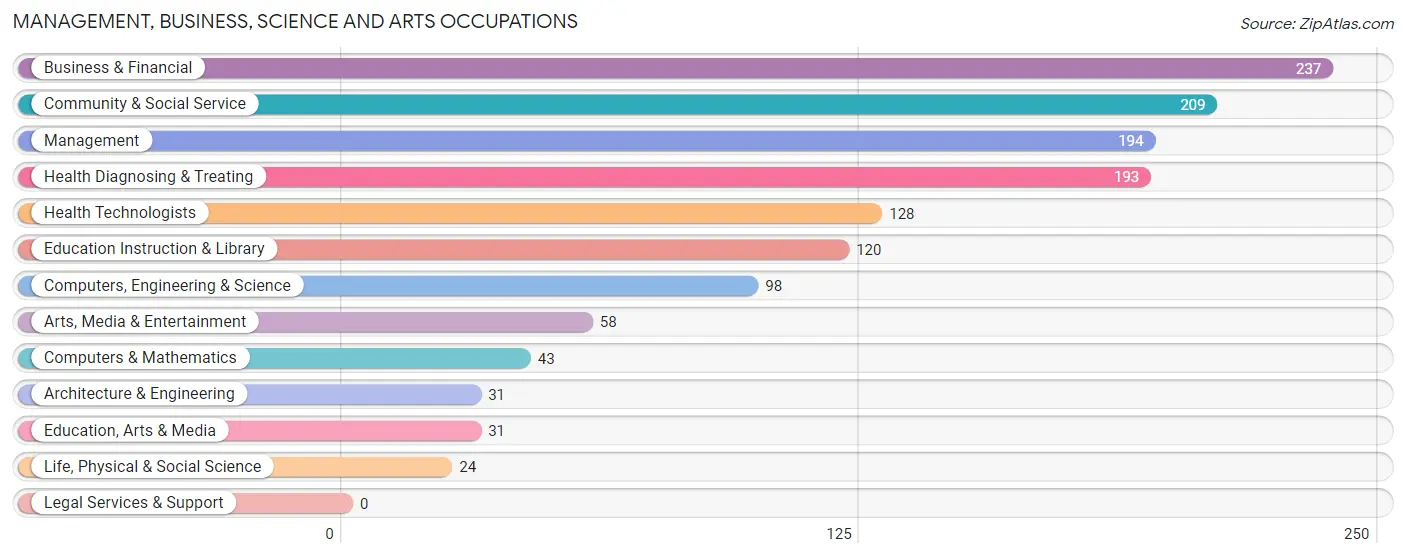
Management, Business, Science and Arts Occupations
The most common Management, Business, Science and Arts occupations in Kingston are Business & Financial (237 | 9.2%), Community & Social Service (209 | 8.2%), Management (194 | 7.6%), Health Diagnosing & Treating (193 | 7.5%), and Health Technologists (128 | 5.0%).
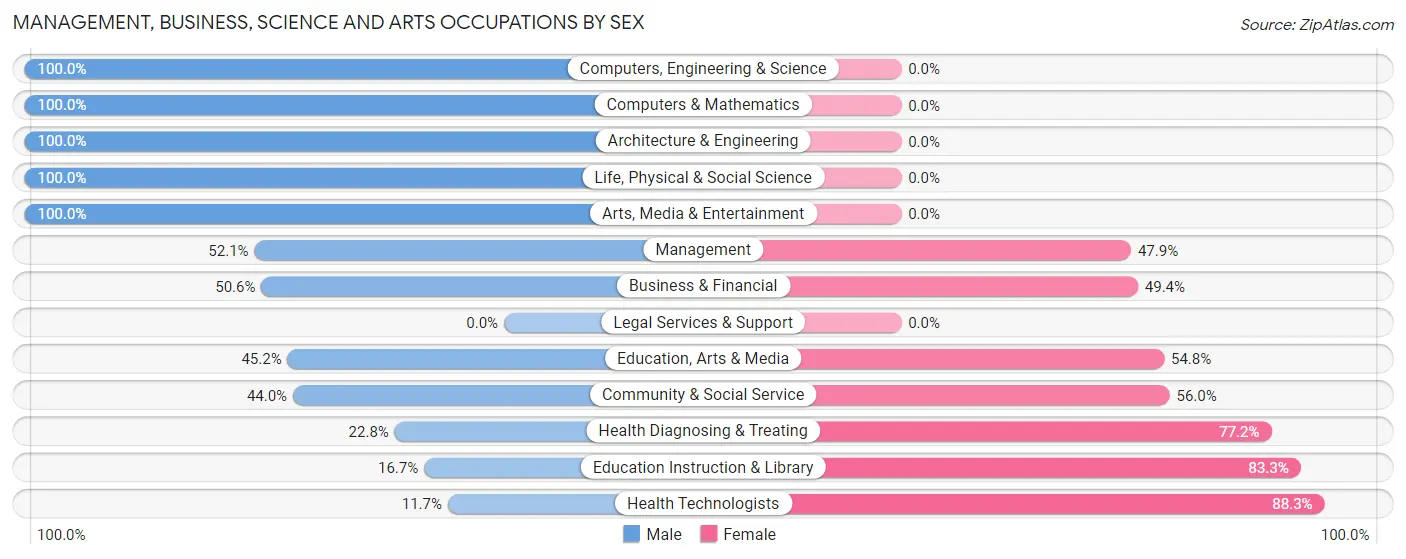
Management, Business, Science and Arts Occupations by Sex
Within the Management, Business, Science and Arts occupations in Kingston, the most male-oriented occupations are Computers, Engineering & Science (100.0%), Computers & Mathematics (100.0%), and Architecture & Engineering (100.0%), while the most female-oriented occupations are Health Technologists (88.3%), Education Instruction & Library (83.3%), and Health Diagnosing & Treating (77.2%).
| Occupation | Male | Female |
| Management | 101 (52.1%) | 93 (47.9%) |
| Business & Financial | 120 (50.6%) | 117 (49.4%) |
| Computers, Engineering & Science | 98 (100.0%) | 0 (0.0%) |
| Computers & Mathematics | 43 (100.0%) | 0 (0.0%) |
| Architecture & Engineering | 31 (100.0%) | 0 (0.0%) |
| Life, Physical & Social Science | 24 (100.0%) | 0 (0.0%) |
| Community & Social Service | 92 (44.0%) | 117 (56.0%) |
| Education, Arts & Media | 14 (45.2%) | 17 (54.8%) |
| Legal Services & Support | 0 (0.0%) | 0 (0.0%) |
| Education Instruction & Library | 20 (16.7%) | 100 (83.3%) |
| Arts, Media & Entertainment | 58 (100.0%) | 0 (0.0%) |
| Health Diagnosing & Treating | 44 (22.8%) | 149 (77.2%) |
| Health Technologists | 15 (11.7%) | 113 (88.3%) |
| Total (Category) | 455 (48.9%) | 476 (51.1%) |
| Total (Overall) | 1,380 (53.8%) | 1,183 (46.2%) |
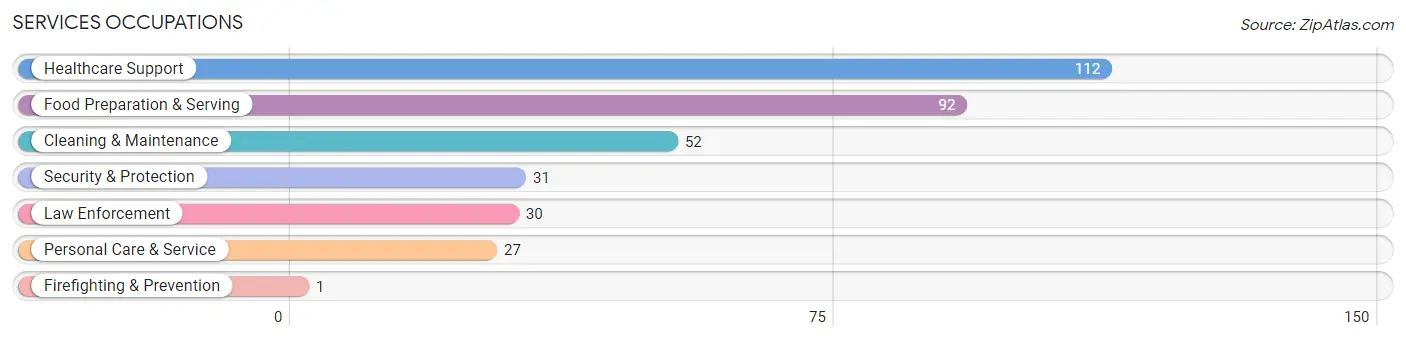
Services Occupations
The most common Services occupations in Kingston are Healthcare Support (112 | 4.4%), Food Preparation & Serving (92 | 3.6%), Cleaning & Maintenance (52 | 2.0%), Security & Protection (31 | 1.2%), and Law Enforcement (30 | 1.2%).
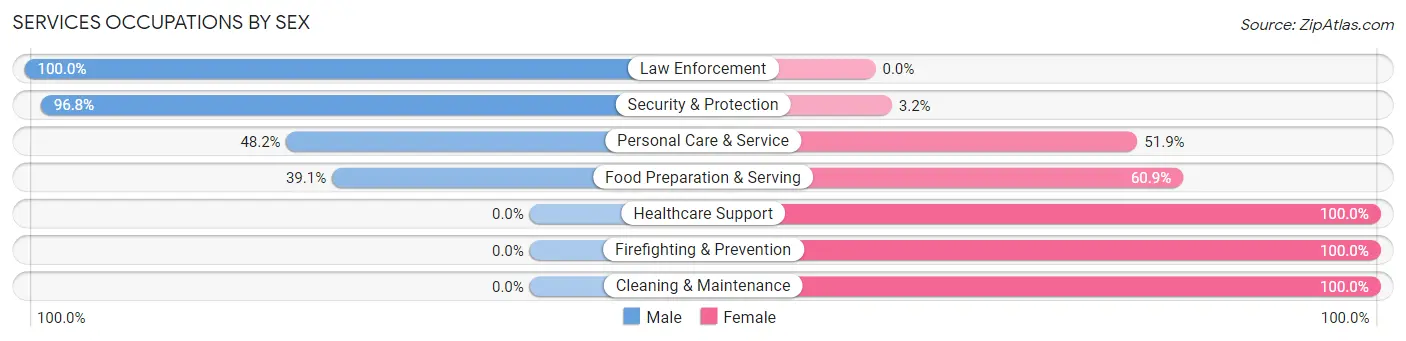
Services Occupations by Sex
Within the Services occupations in Kingston, the most male-oriented occupations are Law Enforcement (100.0%), Security & Protection (96.8%), and Personal Care & Service (48.1%), while the most female-oriented occupations are Healthcare Support (100.0%), Firefighting & Prevention (100.0%), and Cleaning & Maintenance (100.0%).
| Occupation | Male | Female |
| Healthcare Support | 0 (0.0%) | 112 (100.0%) |
| Security & Protection | 30 (96.8%) | 1 (3.2%) |
| Firefighting & Prevention | 0 (0.0%) | 1 (100.0%) |
| Law Enforcement | 30 (100.0%) | 0 (0.0%) |
| Food Preparation & Serving | 36 (39.1%) | 56 (60.9%) |
| Cleaning & Maintenance | 0 (0.0%) | 52 (100.0%) |
| Personal Care & Service | 13 (48.1%) | 14 (51.8%) |
| Total (Category) | 79 (25.2%) | 235 (74.8%) |
| Total (Overall) | 1,380 (53.8%) | 1,183 (46.2%) |
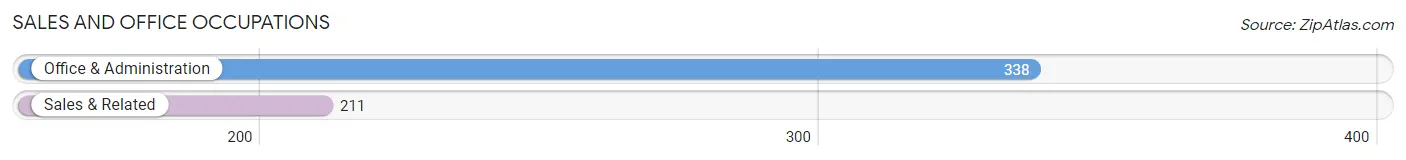
Sales and Office Occupations
The most common Sales and Office occupations in Kingston are Office & Administration (338 | 13.2%), and Sales & Related (211 | 8.2%).
Sales and Office Occupations by Sex
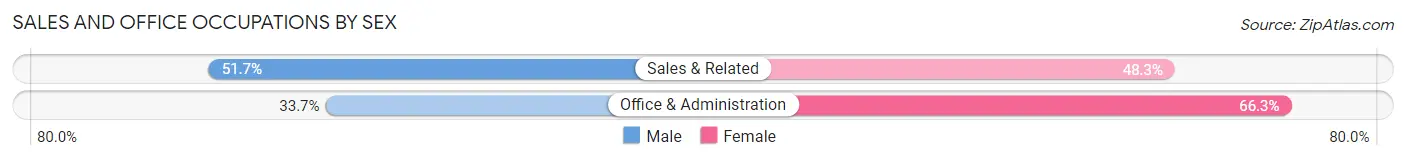
| Occupation | Male | Female |
| Sales & Related | 109 (51.7%) | 102 (48.3%) |
| Office & Administration | 114 (33.7%) | 224 (66.3%) |
| Total (Category) | 223 (40.6%) | 326 (59.4%) |
| Total (Overall) | 1,380 (53.8%) | 1,183 (46.2%) |
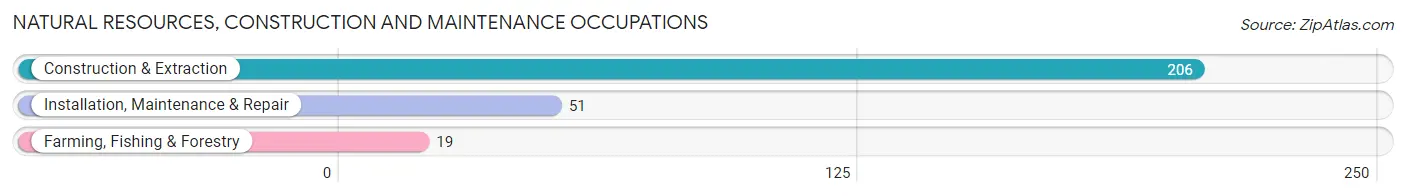
Natural Resources, Construction and Maintenance Occupations
The most common Natural Resources, Construction and Maintenance occupations in Kingston are Construction & Extraction (206 | 8.0%), Installation, Maintenance & Repair (51 | 2.0%), and Farming, Fishing & Forestry (19 | 0.7%).
Natural Resources, Construction and Maintenance Occupations by Sex
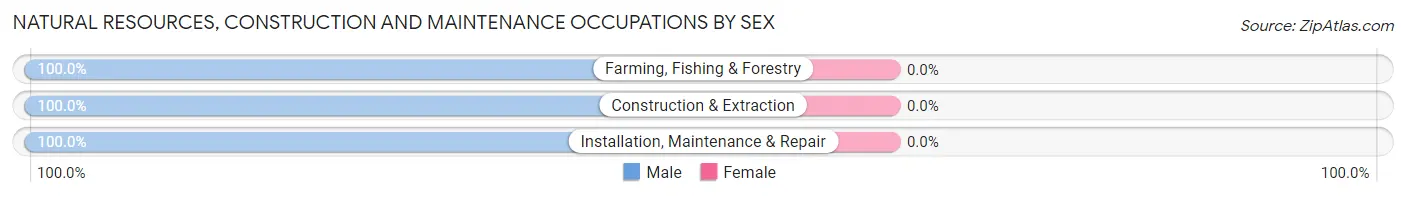
| Occupation | Male | Female |
| Farming, Fishing & Forestry | 19 (100.0%) | 0 (0.0%) |
| Construction & Extraction | 206 (100.0%) | 0 (0.0%) |
| Installation, Maintenance & Repair | 51 (100.0%) | 0 (0.0%) |
| Total (Category) | 276 (100.0%) | 0 (0.0%) |
| Total (Overall) | 1,380 (53.8%) | 1,183 (46.2%) |
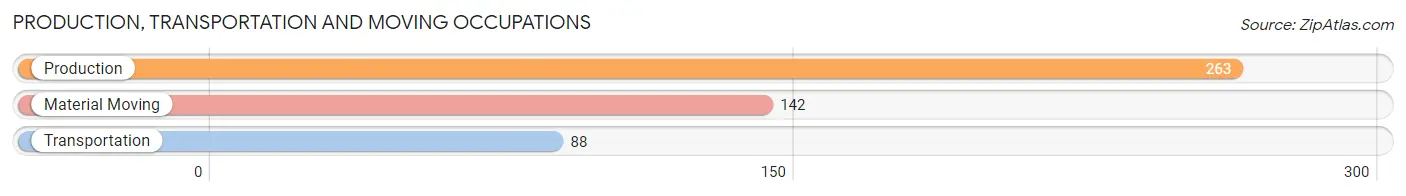
Production, Transportation and Moving Occupations
The most common Production, Transportation and Moving occupations in Kingston are Production (263 | 10.3%), Material Moving (142 | 5.5%), and Transportation (88 | 3.4%).
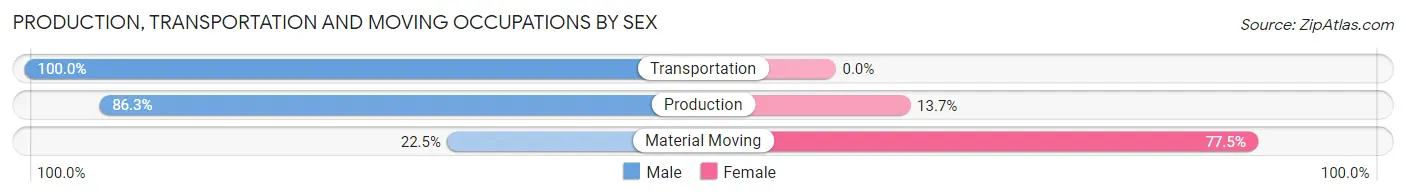
Production, Transportation and Moving Occupations by Sex
| Occupation | Male | Female |
| Production | 227 (86.3%) | 36 (13.7%) |
| Transportation | 88 (100.0%) | 0 (0.0%) |
| Material Moving | 32 (22.5%) | 110 (77.5%) |
| Total (Category) | 347 (70.4%) | 146 (29.6%) |
| Total (Overall) | 1,380 (53.8%) | 1,183 (46.2%) |
Employment Industries by Sex in Kingston
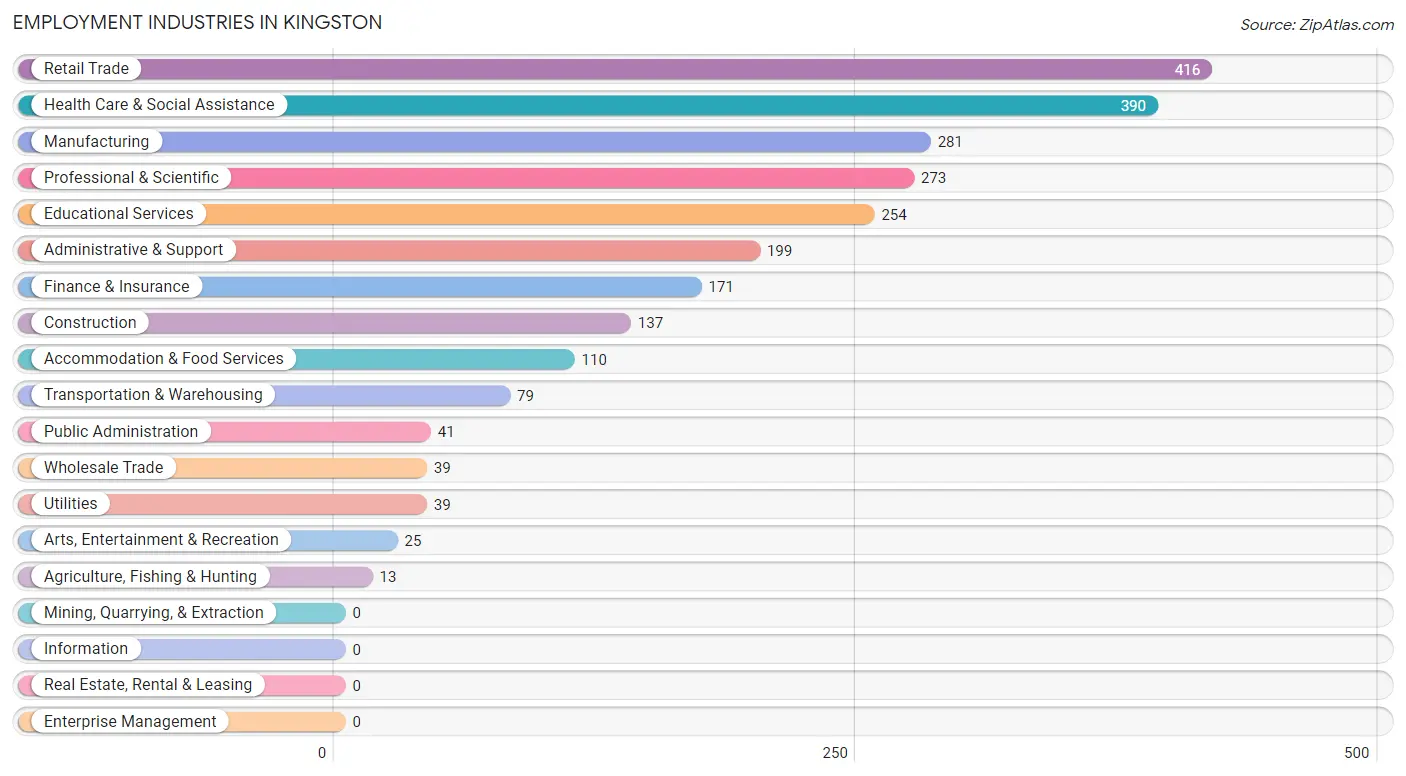
Employment Industries in Kingston
The major employment industries in Kingston include Retail Trade (416 | 16.2%), Health Care & Social Assistance (390 | 15.2%), Manufacturing (281 | 11.0%), Professional & Scientific (273 | 10.6%), and Educational Services (254 | 9.9%).
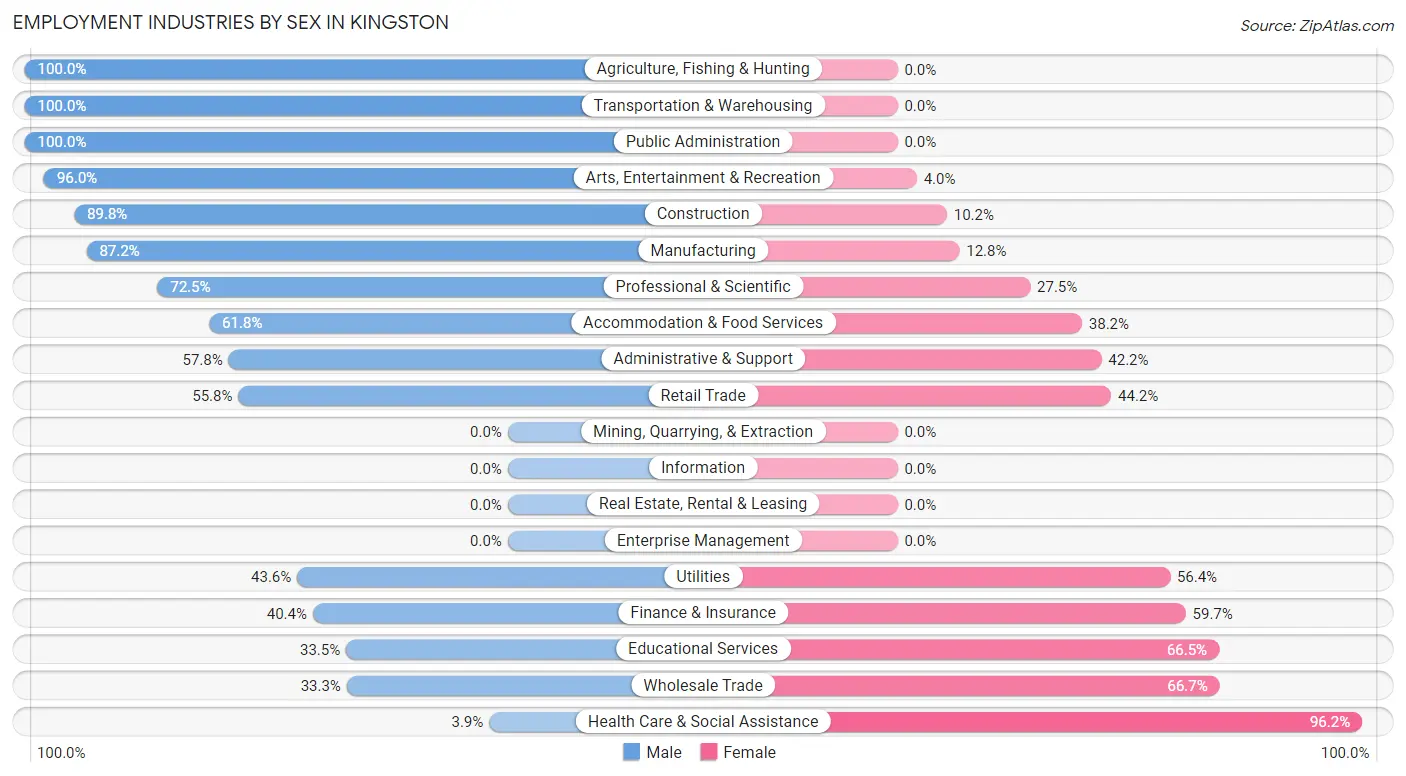
Employment Industries by Sex in Kingston
The Kingston industries that see more men than women are Agriculture, Fishing & Hunting (100.0%), Transportation & Warehousing (100.0%), and Public Administration (100.0%), whereas the industries that tend to have a higher number of women are Health Care & Social Assistance (96.2%), Wholesale Trade (66.7%), and Educational Services (66.5%).
| Industry | Male | Female |
| Agriculture, Fishing & Hunting | 13 (100.0%) | 0 (0.0%) |
| Mining, Quarrying, & Extraction | 0 (0.0%) | 0 (0.0%) |
| Construction | 123 (89.8%) | 14 (10.2%) |
| Manufacturing | 245 (87.2%) | 36 (12.8%) |
| Wholesale Trade | 13 (33.3%) | 26 (66.7%) |
| Retail Trade | 232 (55.8%) | 184 (44.2%) |
| Transportation & Warehousing | 79 (100.0%) | 0 (0.0%) |
| Utilities | 17 (43.6%) | 22 (56.4%) |
| Information | 0 (0.0%) | 0 (0.0%) |
| Finance & Insurance | 69 (40.4%) | 102 (59.7%) |
| Real Estate, Rental & Leasing | 0 (0.0%) | 0 (0.0%) |
| Professional & Scientific | 198 (72.5%) | 75 (27.5%) |
| Enterprise Management | 0 (0.0%) | 0 (0.0%) |
| Administrative & Support | 115 (57.8%) | 84 (42.2%) |
| Educational Services | 85 (33.5%) | 169 (66.5%) |
| Health Care & Social Assistance | 15 (3.8%) | 375 (96.2%) |
| Arts, Entertainment & Recreation | 24 (96.0%) | 1 (4.0%) |
| Accommodation & Food Services | 68 (61.8%) | 42 (38.2%) |
| Public Administration | 41 (100.0%) | 0 (0.0%) |
| Total | 1,380 (53.8%) | 1,183 (46.2%) |
Education in Kingston
School Enrollment in Kingston
The most common levels of schooling among the 1,216 students in Kingston are elementary school (466 | 38.3%), college / undergraduate (207 | 17.0%), and high school (180 | 14.8%).
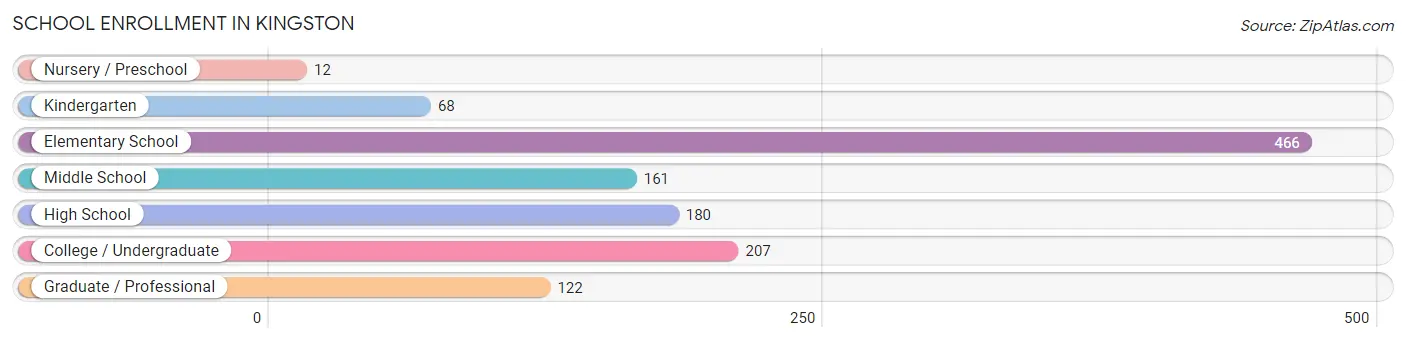
| School Level | # Students | % Students |
| Nursery / Preschool | 12 | 1.0% |
| Kindergarten | 68 | 5.6% |
| Elementary School | 466 | 38.3% |
| Middle School | 161 | 13.2% |
| High School | 180 | 14.8% |
| College / Undergraduate | 207 | 17.0% |
| Graduate / Professional | 122 | 10.0% |
| Total | 1,216 | 100.0% |
School Enrollment by Age by Funding Source in Kingston
Out of a total of 1,216 students who are enrolled in schools in Kingston, 295 (24.3%) attend a private institution, while the remaining 921 (75.7%) are enrolled in public schools. The age group of 10 to 14 year olds has the highest likelihood of being enrolled in private schools, with 76 (48.4% in the age bracket) enrolled. Conversely, the age group of 3 to 4 year olds has the lowest likelihood of being enrolled in a private school, with 41 (100.0% in the age bracket) attending a public institution.
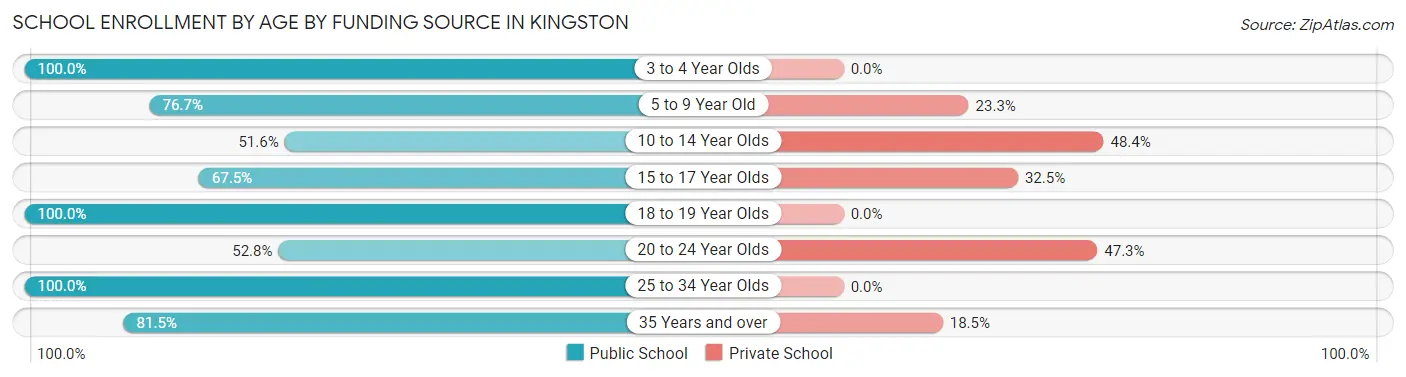
| Age Bracket | Public School | Private School |
| 3 to 4 Year Olds | 41 (100.0%) | 0 (0.0%) |
| 5 to 9 Year Old | 379 (76.7%) | 115 (23.3%) |
| 10 to 14 Year Olds | 81 (51.6%) | 76 (48.4%) |
| 15 to 17 Year Olds | 104 (67.5%) | 50 (32.5%) |
| 18 to 19 Year Olds | 129 (100.0%) | 0 (0.0%) |
| 20 to 24 Year Olds | 48 (52.7%) | 43 (47.2%) |
| 25 to 34 Year Olds | 85 (100.0%) | 0 (0.0%) |
| 35 Years and over | 53 (81.5%) | 12 (18.5%) |
| Total | 921 (75.7%) | 295 (24.3%) |
Educational Attainment by Field of Study in Kingston
Arts & humanities (254 | 21.9%), education (206 | 17.7%), business (192 | 16.5%), science & technology (172 | 14.8%), and social sciences (101 | 8.7%) are the most common fields of study among 1,161 individuals in Kingston who have obtained a bachelor's degree or higher.
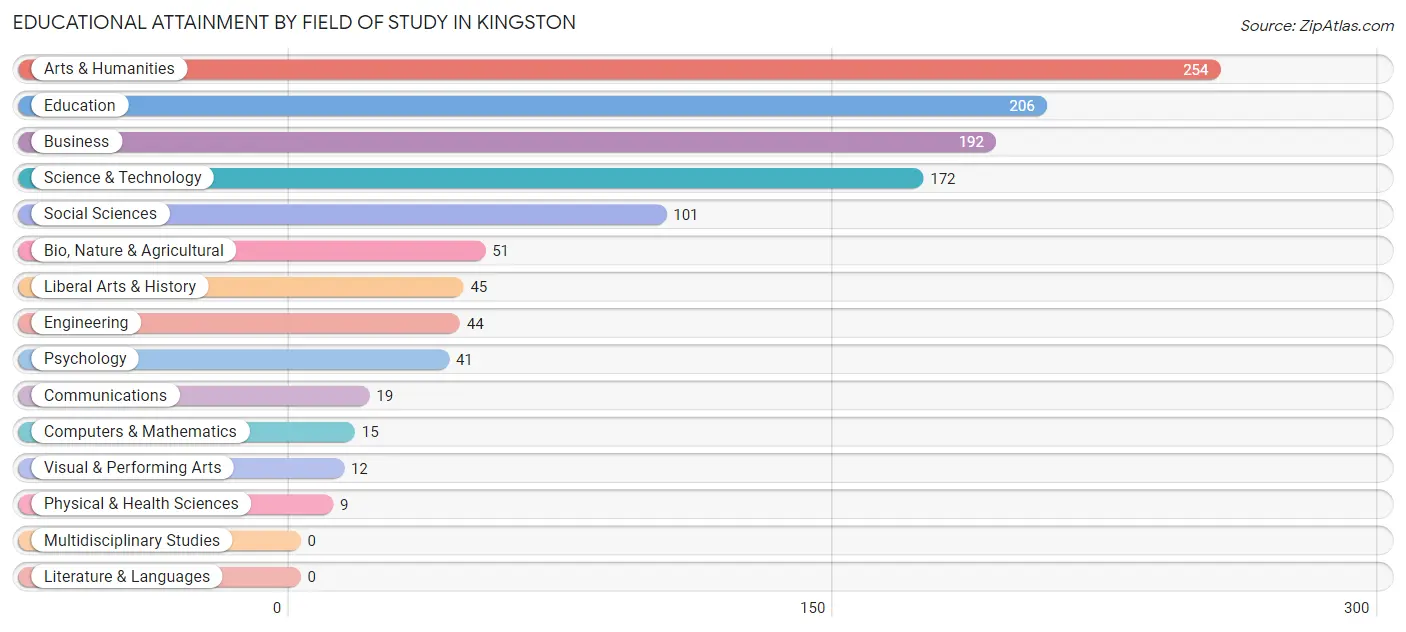
| Field of Study | # Graduates | % Graduates |
| Computers & Mathematics | 15 | 1.3% |
| Bio, Nature & Agricultural | 51 | 4.4% |
| Physical & Health Sciences | 9 | 0.8% |
| Psychology | 41 | 3.5% |
| Social Sciences | 101 | 8.7% |
| Engineering | 44 | 3.8% |
| Multidisciplinary Studies | 0 | 0.0% |
| Science & Technology | 172 | 14.8% |
| Business | 192 | 16.5% |
| Education | 206 | 17.7% |
| Literature & Languages | 0 | 0.0% |
| Liberal Arts & History | 45 | 3.9% |
| Visual & Performing Arts | 12 | 1.0% |
| Communications | 19 | 1.6% |
| Arts & Humanities | 254 | 21.9% |
| Total | 1,161 | 100.0% |
Transportation & Commute in Kingston
Vehicle Availability by Sex in Kingston
The most prevalent vehicle ownership categories in Kingston are males with 2 vehicles (516, accounting for 37.4%) and females with 2 vehicles (417, making up 43.6%).
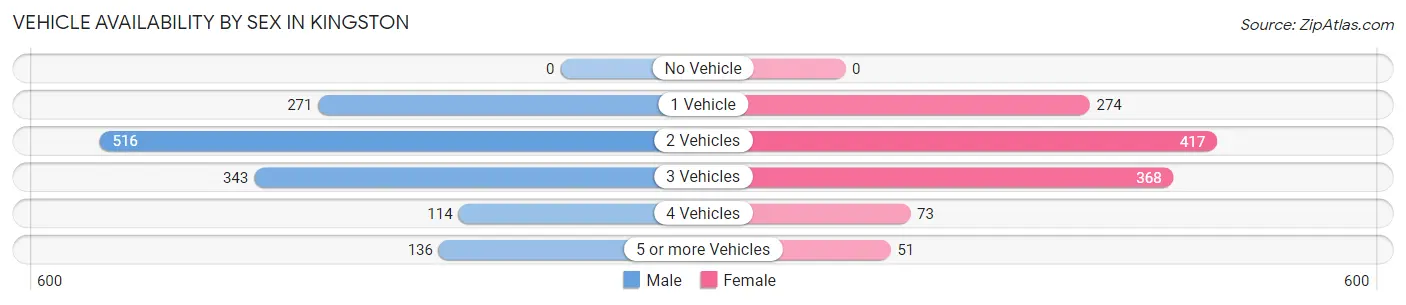
| Vehicles Available | Male | Female |
| No Vehicle | 0 (0.0%) | 0 (0.0%) |
| 1 Vehicle | 271 (19.6%) | 274 (23.2%) |
| 2 Vehicles | 516 (37.4%) | 417 (35.2%) |
| 3 Vehicles | 343 (24.9%) | 368 (31.1%) |
| 4 Vehicles | 114 (8.3%) | 73 (6.2%) |
| 5 or more Vehicles | 136 (9.9%) | 51 (4.3%) |
| Total | 1,380 (100.0%) | 1,183 (100.0%) |
Commute Time in Kingston
The most frequently occuring commute durations in Kingston are 30 to 34 minutes (364 commuters, 15.2%), 5 to 9 minutes (352 commuters, 14.7%), and 25 to 29 minutes (276 commuters, 11.5%).
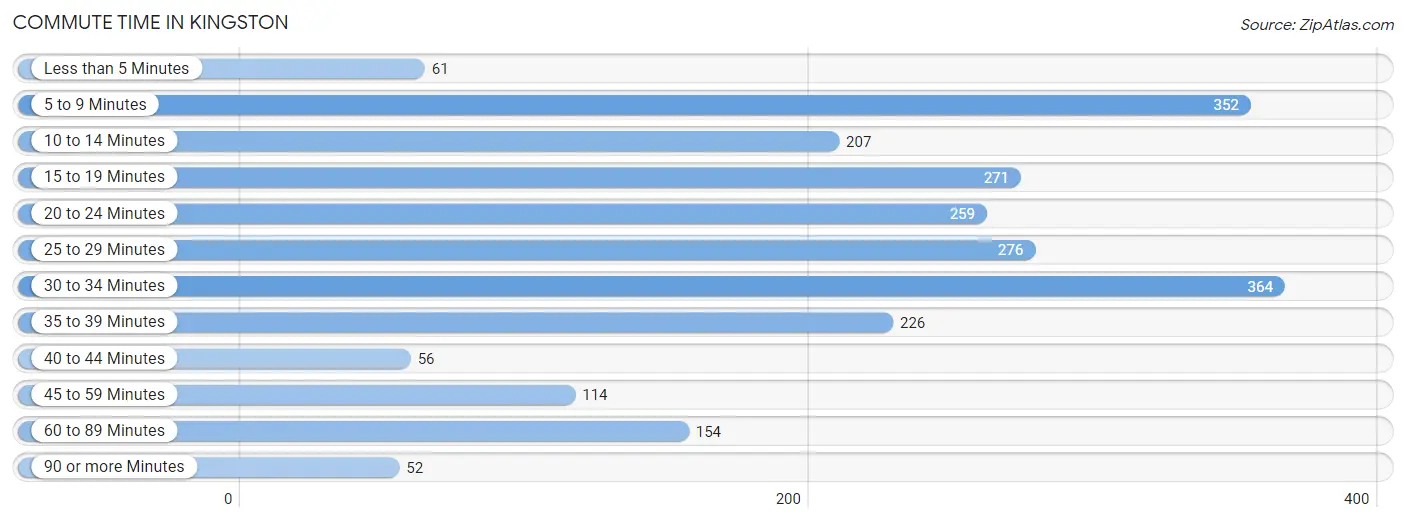
| Commute Time | # Commuters | % Commuters |
| Less than 5 Minutes | 61 | 2.5% |
| 5 to 9 Minutes | 352 | 14.7% |
| 10 to 14 Minutes | 207 | 8.6% |
| 15 to 19 Minutes | 271 | 11.3% |
| 20 to 24 Minutes | 259 | 10.8% |
| 25 to 29 Minutes | 276 | 11.5% |
| 30 to 34 Minutes | 364 | 15.2% |
| 35 to 39 Minutes | 226 | 9.5% |
| 40 to 44 Minutes | 56 | 2.3% |
| 45 to 59 Minutes | 114 | 4.8% |
| 60 to 89 Minutes | 154 | 6.4% |
| 90 or more Minutes | 52 | 2.2% |
Commute Time by Sex in Kingston
The most common commute times in Kingston are 5 to 9 minutes (229 commuters, 17.2%) for males and 15 to 19 minutes (188 commuters, 17.7%) for females.
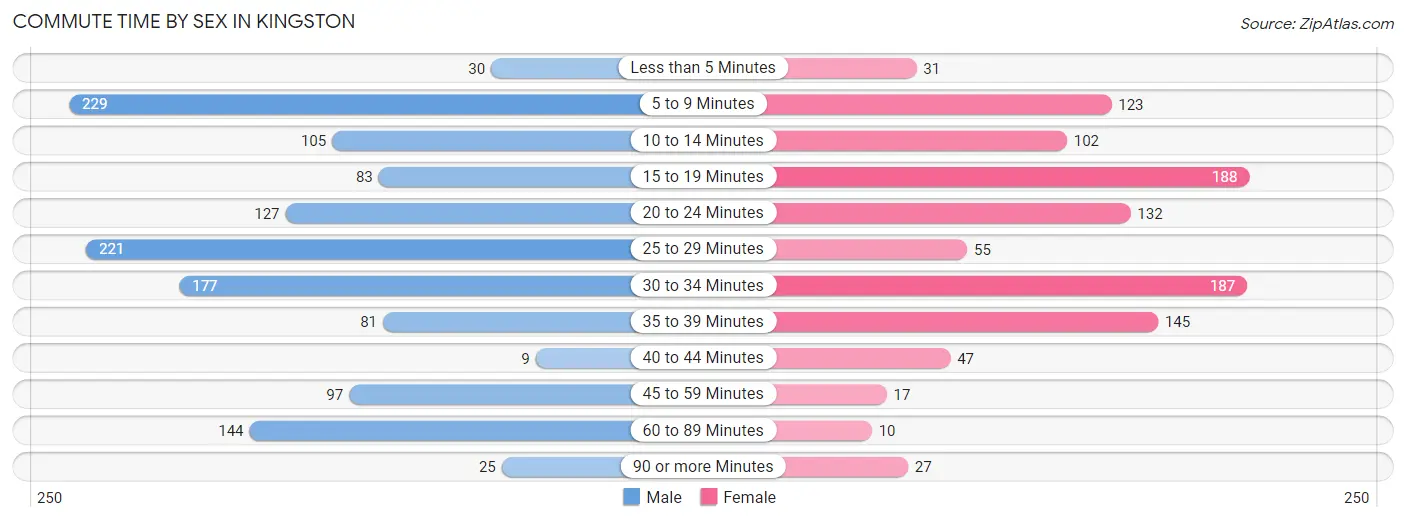
| Commute Time | Male | Female |
| Less than 5 Minutes | 30 (2.3%) | 31 (2.9%) |
| 5 to 9 Minutes | 229 (17.2%) | 123 (11.6%) |
| 10 to 14 Minutes | 105 (7.9%) | 102 (9.6%) |
| 15 to 19 Minutes | 83 (6.2%) | 188 (17.7%) |
| 20 to 24 Minutes | 127 (9.6%) | 132 (12.4%) |
| 25 to 29 Minutes | 221 (16.6%) | 55 (5.2%) |
| 30 to 34 Minutes | 177 (13.3%) | 187 (17.6%) |
| 35 to 39 Minutes | 81 (6.1%) | 145 (13.6%) |
| 40 to 44 Minutes | 9 (0.7%) | 47 (4.4%) |
| 45 to 59 Minutes | 97 (7.3%) | 17 (1.6%) |
| 60 to 89 Minutes | 144 (10.8%) | 10 (0.9%) |
| 90 or more Minutes | 25 (1.9%) | 27 (2.5%) |
Time of Departure to Work by Sex in Kingston
The most frequent times of departure to work in Kingston are 12:00 PM to 3:59 PM (204, 15.4%) for males and 5:00 AM to 5:29 AM (188, 17.7%) for females.
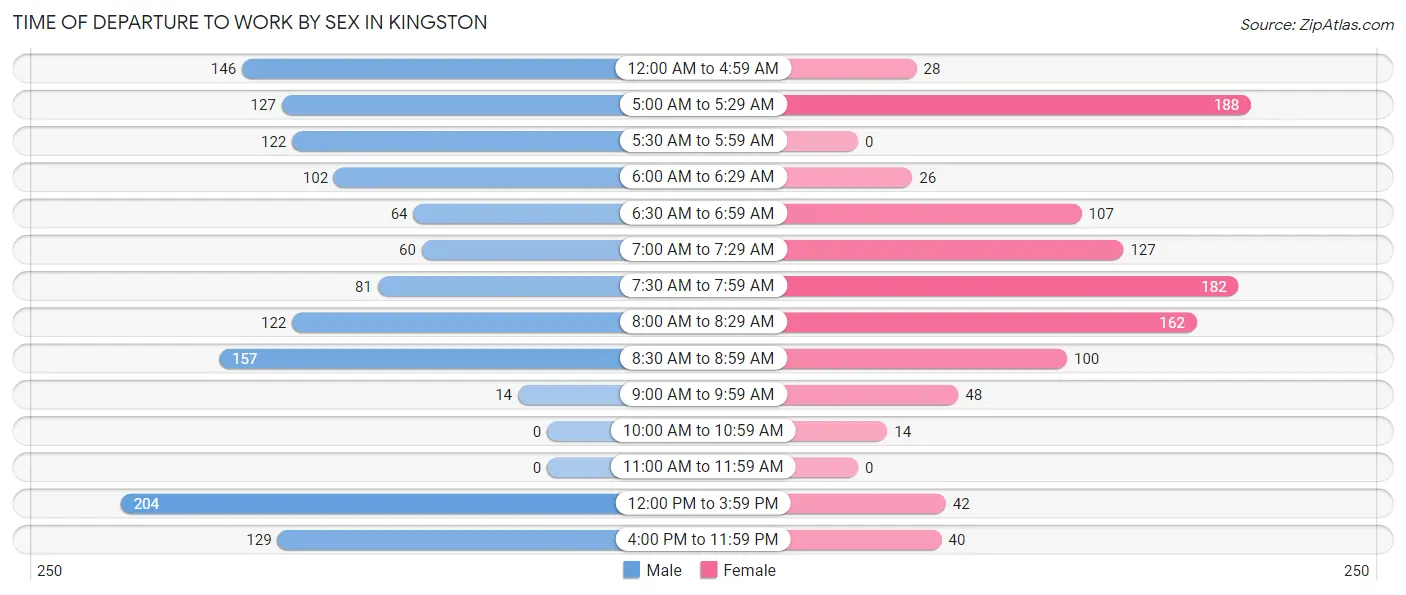
| Time of Departure | Male | Female |
| 12:00 AM to 4:59 AM | 146 (11.0%) | 28 (2.6%) |
| 5:00 AM to 5:29 AM | 127 (9.6%) | 188 (17.7%) |
| 5:30 AM to 5:59 AM | 122 (9.2%) | 0 (0.0%) |
| 6:00 AM to 6:29 AM | 102 (7.7%) | 26 (2.4%) |
| 6:30 AM to 6:59 AM | 64 (4.8%) | 107 (10.1%) |
| 7:00 AM to 7:29 AM | 60 (4.5%) | 127 (11.9%) |
| 7:30 AM to 7:59 AM | 81 (6.1%) | 182 (17.1%) |
| 8:00 AM to 8:29 AM | 122 (9.2%) | 162 (15.2%) |
| 8:30 AM to 8:59 AM | 157 (11.8%) | 100 (9.4%) |
| 9:00 AM to 9:59 AM | 14 (1.1%) | 48 (4.5%) |
| 10:00 AM to 10:59 AM | 0 (0.0%) | 14 (1.3%) |
| 11:00 AM to 11:59 AM | 0 (0.0%) | 0 (0.0%) |
| 12:00 PM to 3:59 PM | 204 (15.4%) | 42 (4.0%) |
| 4:00 PM to 11:59 PM | 129 (9.7%) | 40 (3.8%) |
| Total | 1,328 (100.0%) | 1,064 (100.0%) |
Housing Occupancy in Kingston
Occupancy by Ownership in Kingston
Of the total 2,393 dwellings in Kingston, owner-occupied units account for 1,624 (67.9%), while renter-occupied units make up 769 (32.1%).
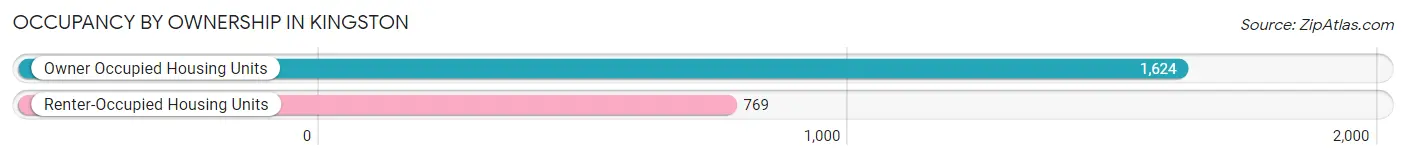
| Occupancy | # Housing Units | % Housing Units |
| Owner Occupied Housing Units | 1,624 | 67.9% |
| Renter-Occupied Housing Units | 769 | 32.1% |
| Total Occupied Housing Units | 2,393 | 100.0% |
Occupancy by Household Size in Kingston
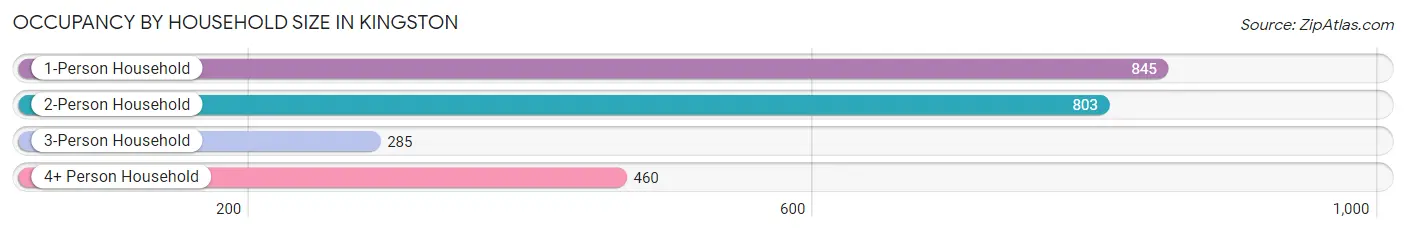
| Household Size | # Housing Units | % Housing Units |
| 1-Person Household | 845 | 35.3% |
| 2-Person Household | 803 | 33.6% |
| 3-Person Household | 285 | 11.9% |
| 4+ Person Household | 460 | 19.2% |
| Total Housing Units | 2,393 | 100.0% |
Occupancy by Ownership by Household Size in Kingston
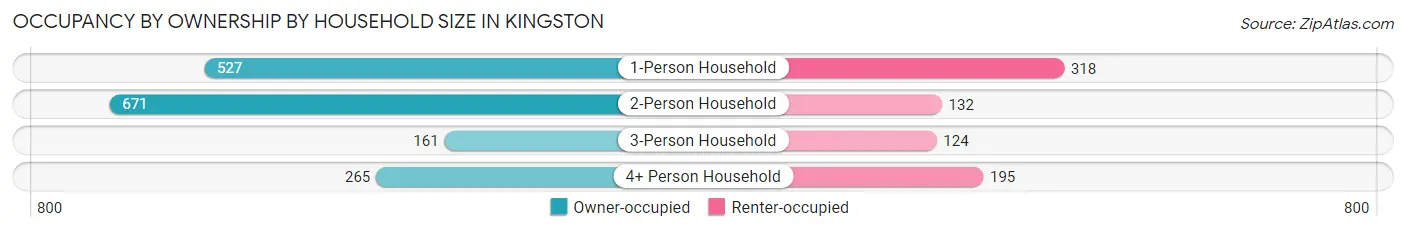
| Household Size | Owner-occupied | Renter-occupied |
| 1-Person Household | 527 (62.4%) | 318 (37.6%) |
| 2-Person Household | 671 (83.6%) | 132 (16.4%) |
| 3-Person Household | 161 (56.5%) | 124 (43.5%) |
| 4+ Person Household | 265 (57.6%) | 195 (42.4%) |
| Total Housing Units | 1,624 (67.9%) | 769 (32.1%) |
Occupancy by Educational Attainment in Kingston
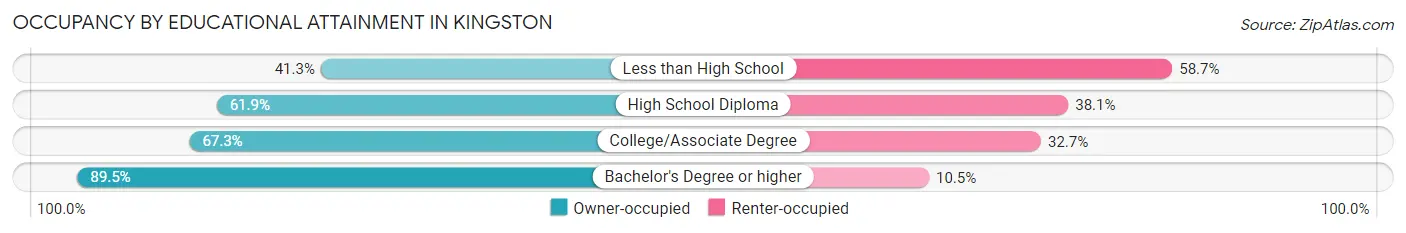
| Household Size | Owner-occupied | Renter-occupied |
| Less than High School | 83 (41.3%) | 118 (58.7%) |
| High School Diploma | 585 (61.9%) | 360 (38.1%) |
| College/Associate Degree | 486 (67.3%) | 236 (32.7%) |
| Bachelor's Degree or higher | 470 (89.5%) | 55 (10.5%) |
Occupancy by Age of Householder in Kingston
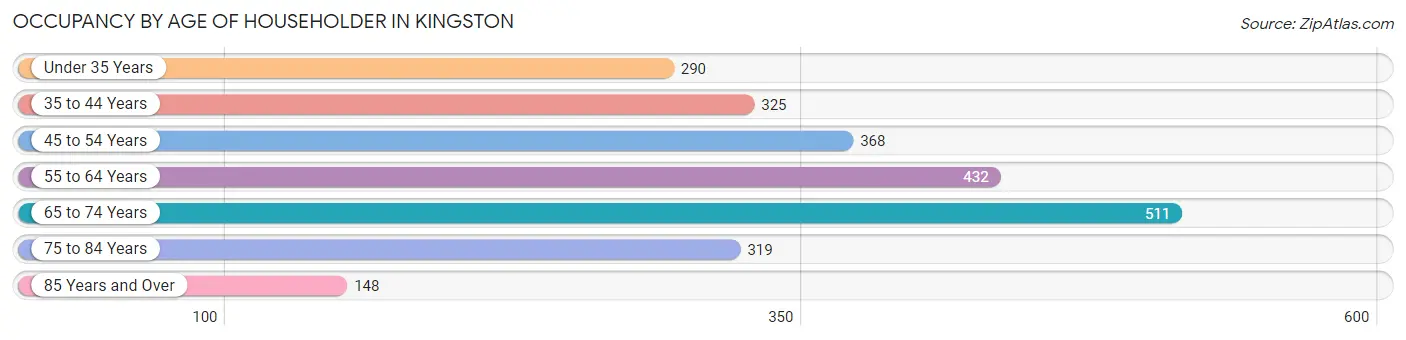
| Age Bracket | # Households | % Households |
| Under 35 Years | 290 | 12.1% |
| 35 to 44 Years | 325 | 13.6% |
| 45 to 54 Years | 368 | 15.4% |
| 55 to 64 Years | 432 | 18.0% |
| 65 to 74 Years | 511 | 21.3% |
| 75 to 84 Years | 319 | 13.3% |
| 85 Years and Over | 148 | 6.2% |
| Total | 2,393 | 100.0% |
Housing Finances in Kingston
Median Income by Occupancy in Kingston
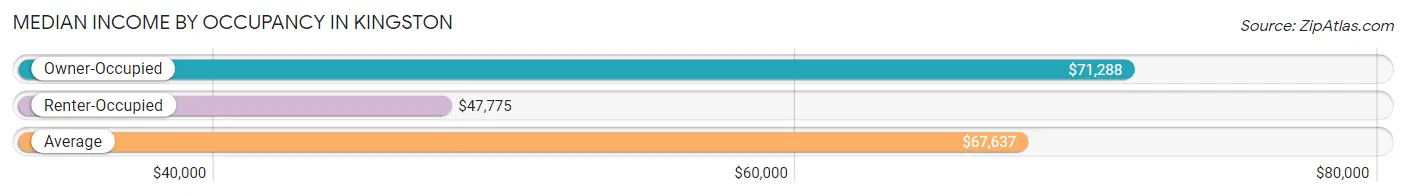
| Occupancy Type | # Households | Median Income |
| Owner-Occupied | 1,624 (67.9%) | $71,288 |
| Renter-Occupied | 769 (32.1%) | $47,775 |
| Average | 2,393 (100.0%) | $67,637 |
Occupancy by Householder Income Bracket in Kingston
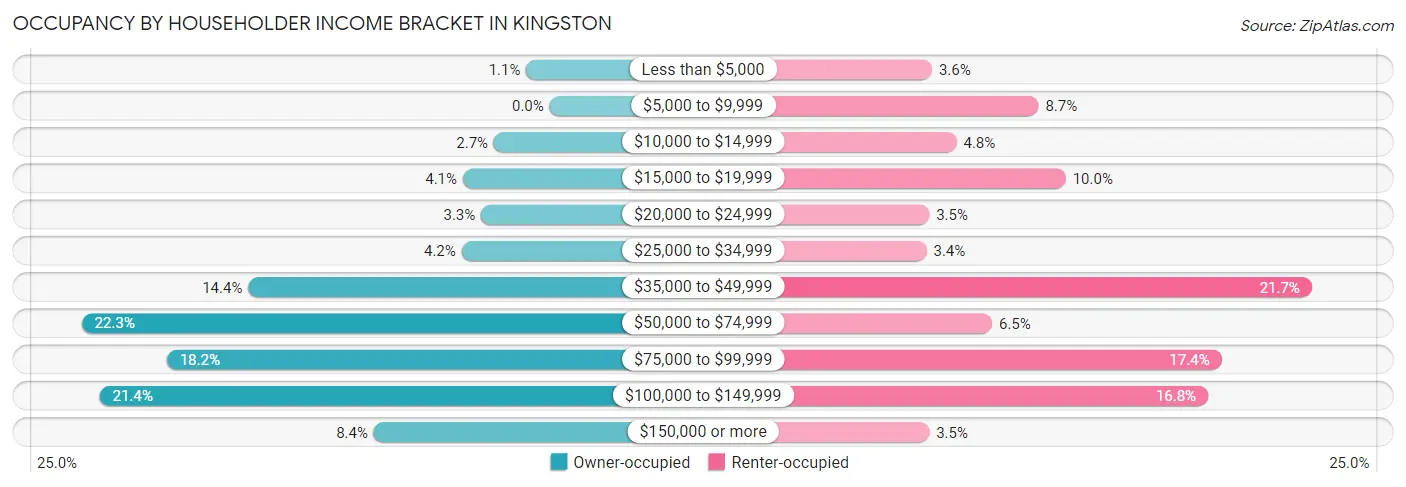
| Income Bracket | Owner-occupied | Renter-occupied |
| Less than $5,000 | 18 (1.1%) | 28 (3.6%) |
| $5,000 to $9,999 | 0 (0.0%) | 67 (8.7%) |
| $10,000 to $14,999 | 43 (2.6%) | 37 (4.8%) |
| $15,000 to $19,999 | 67 (4.1%) | 77 (10.0%) |
| $20,000 to $24,999 | 53 (3.3%) | 27 (3.5%) |
| $25,000 to $34,999 | 68 (4.2%) | 26 (3.4%) |
| $35,000 to $49,999 | 233 (14.3%) | 167 (21.7%) |
| $50,000 to $74,999 | 362 (22.3%) | 50 (6.5%) |
| $75,000 to $99,999 | 296 (18.2%) | 134 (17.4%) |
| $100,000 to $149,999 | 348 (21.4%) | 129 (16.8%) |
| $150,000 or more | 136 (8.4%) | 27 (3.5%) |
| Total | 1,624 (100.0%) | 769 (100.0%) |
Monthly Housing Cost Tiers in Kingston
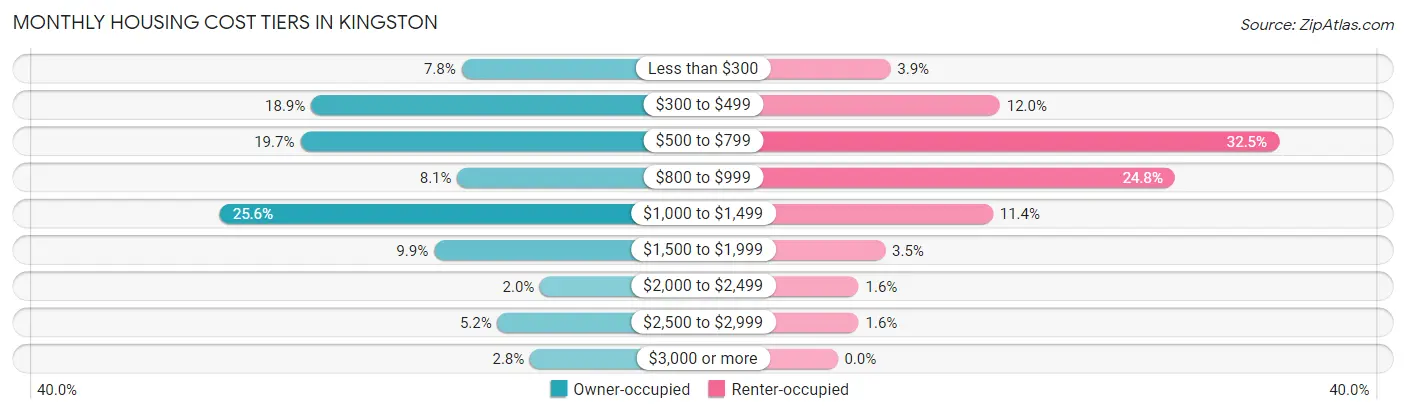
| Monthly Cost | Owner-occupied | Renter-occupied |
| Less than $300 | 127 (7.8%) | 30 (3.9%) |
| $300 to $499 | 307 (18.9%) | 92 (12.0%) |
| $500 to $799 | 320 (19.7%) | 250 (32.5%) |
| $800 to $999 | 132 (8.1%) | 191 (24.8%) |
| $1,000 to $1,499 | 416 (25.6%) | 88 (11.4%) |
| $1,500 to $1,999 | 160 (9.9%) | 27 (3.5%) |
| $2,000 to $2,499 | 33 (2.0%) | 12 (1.6%) |
| $2,500 to $2,999 | 84 (5.2%) | 12 (1.6%) |
| $3,000 or more | 45 (2.8%) | 0 (0.0%) |
| Total | 1,624 (100.0%) | 769 (100.0%) |
Physical Housing Characteristics in Kingston
Housing Structures in Kingston
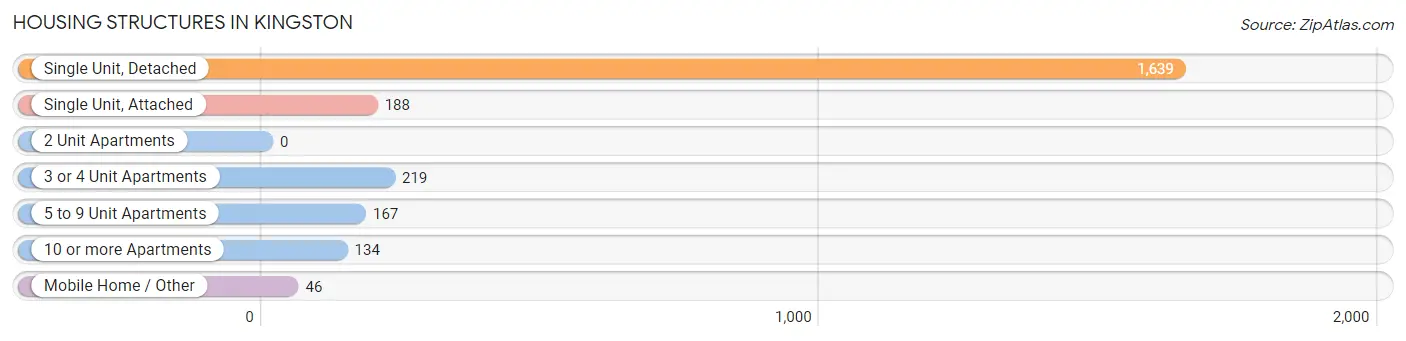
| Structure Type | # Housing Units | % Housing Units |
| Single Unit, Detached | 1,639 | 68.5% |
| Single Unit, Attached | 188 | 7.9% |
| 2 Unit Apartments | 0 | 0.0% |
| 3 or 4 Unit Apartments | 219 | 9.1% |
| 5 to 9 Unit Apartments | 167 | 7.0% |
| 10 or more Apartments | 134 | 5.6% |
| Mobile Home / Other | 46 | 1.9% |
| Total | 2,393 | 100.0% |
Housing Structures by Occupancy in Kingston
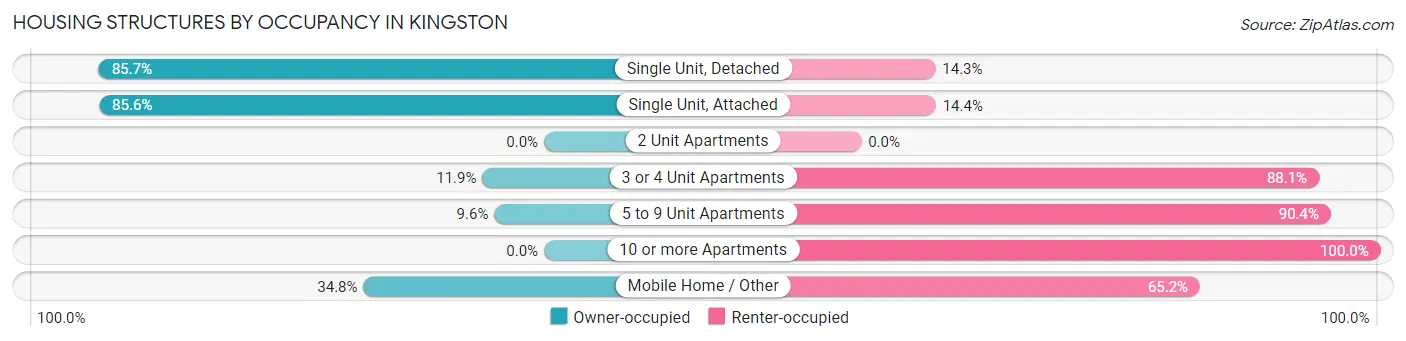
| Structure Type | Owner-occupied | Renter-occupied |
| Single Unit, Detached | 1,405 (85.7%) | 234 (14.3%) |
| Single Unit, Attached | 161 (85.6%) | 27 (14.4%) |
| 2 Unit Apartments | 0 (0.0%) | 0 (0.0%) |
| 3 or 4 Unit Apartments | 26 (11.9%) | 193 (88.1%) |
| 5 to 9 Unit Apartments | 16 (9.6%) | 151 (90.4%) |
| 10 or more Apartments | 0 (0.0%) | 134 (100.0%) |
| Mobile Home / Other | 16 (34.8%) | 30 (65.2%) |
| Total | 1,624 (67.9%) | 769 (32.1%) |
Housing Structures by Number of Rooms in Kingston
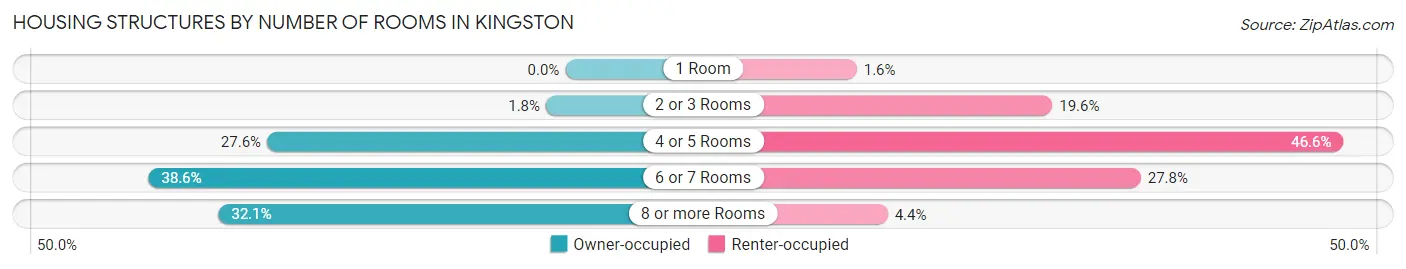
| Number of Rooms | Owner-occupied | Renter-occupied |
| 1 Room | 0 (0.0%) | 12 (1.6%) |
| 2 or 3 Rooms | 29 (1.8%) | 151 (19.6%) |
| 4 or 5 Rooms | 448 (27.6%) | 358 (46.6%) |
| 6 or 7 Rooms | 626 (38.6%) | 214 (27.8%) |
| 8 or more Rooms | 521 (32.1%) | 34 (4.4%) |
| Total | 1,624 (100.0%) | 769 (100.0%) |
Housing Structure by Heating Type in Kingston
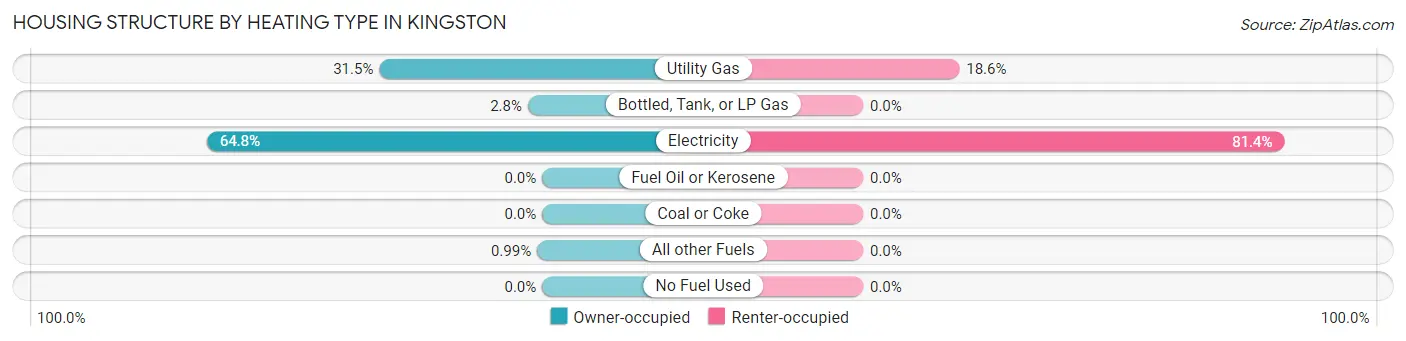
| Heating Type | Owner-occupied | Renter-occupied |
| Utility Gas | 511 (31.5%) | 143 (18.6%) |
| Bottled, Tank, or LP Gas | 45 (2.8%) | 0 (0.0%) |
| Electricity | 1,052 (64.8%) | 626 (81.4%) |
| Fuel Oil or Kerosene | 0 (0.0%) | 0 (0.0%) |
| Coal or Coke | 0 (0.0%) | 0 (0.0%) |
| All other Fuels | 16 (1.0%) | 0 (0.0%) |
| No Fuel Used | 0 (0.0%) | 0 (0.0%) |
| Total | 1,624 (100.0%) | 769 (100.0%) |
Household Vehicle Usage in Kingston
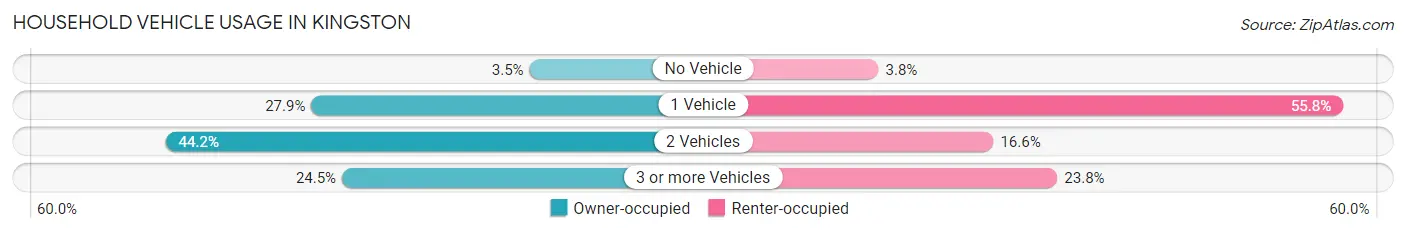
| Vehicles per Household | Owner-occupied | Renter-occupied |
| No Vehicle | 56 (3.5%) | 29 (3.8%) |
| 1 Vehicle | 453 (27.9%) | 429 (55.8%) |
| 2 Vehicles | 718 (44.2%) | 128 (16.6%) |
| 3 or more Vehicles | 397 (24.4%) | 183 (23.8%) |
| Total | 1,624 (100.0%) | 769 (100.0%) |
Real Estate & Mortgages in Kingston
Real Estate and Mortgage Overview in Kingston
| Characteristic | Without Mortgage | With Mortgage |
| Housing Units | 815 | 809 |
| Median Property Value | $167,100 | $193,900 |
| Median Household Income | $57,067 | $81 |
| Monthly Housing Costs | $481 | $45 |
| Real Estate Taxes | $1,580 | $62 |
Property Value by Mortgage Status in Kingston
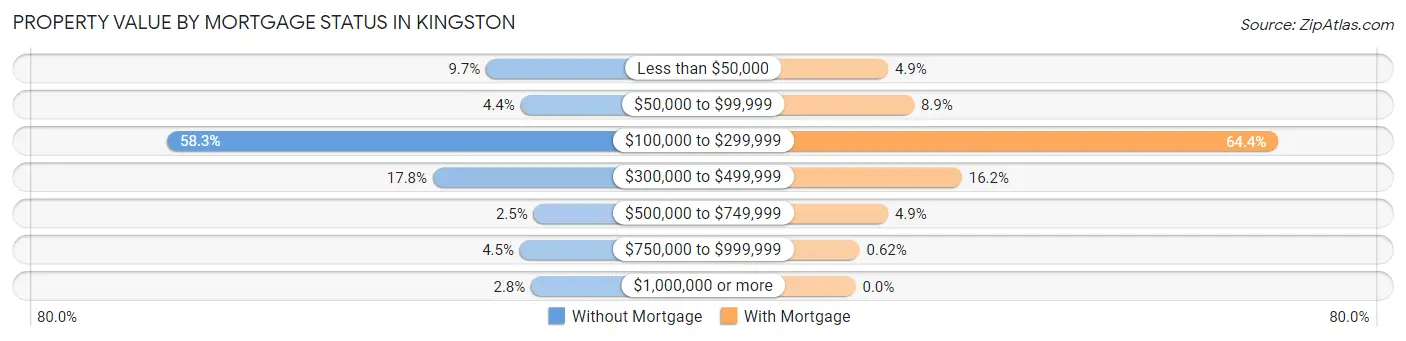
| Property Value | Without Mortgage | With Mortgage |
| Less than $50,000 | 79 (9.7%) | 40 (4.9%) |
| $50,000 to $99,999 | 36 (4.4%) | 72 (8.9%) |
| $100,000 to $299,999 | 475 (58.3%) | 521 (64.4%) |
| $300,000 to $499,999 | 145 (17.8%) | 131 (16.2%) |
| $500,000 to $749,999 | 20 (2.5%) | 40 (4.9%) |
| $750,000 to $999,999 | 37 (4.5%) | 5 (0.6%) |
| $1,000,000 or more | 23 (2.8%) | 0 (0.0%) |
| Total | 815 (100.0%) | 809 (100.0%) |
Household Income by Mortgage Status in Kingston
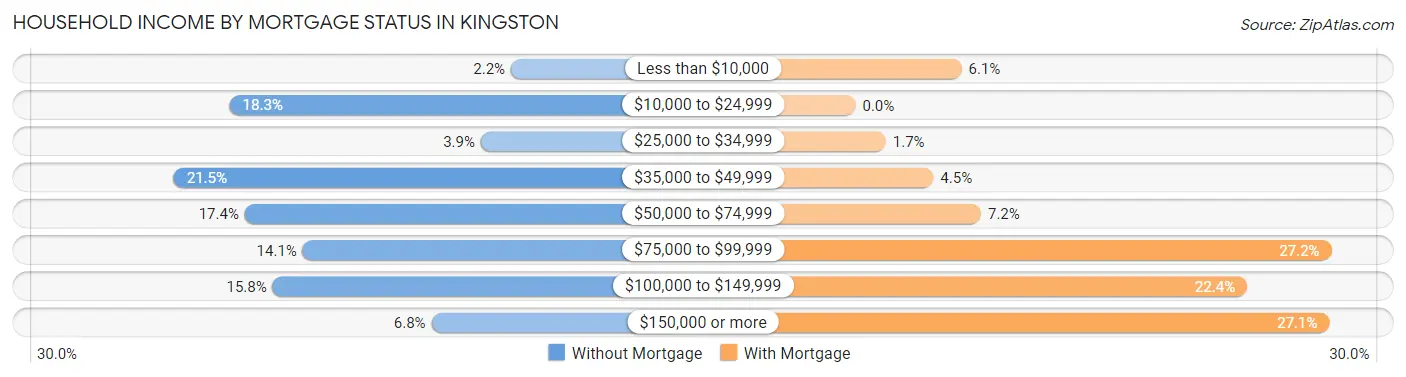
| Household Income | Without Mortgage | With Mortgage |
| Less than $10,000 | 18 (2.2%) | 49 (6.1%) |
| $10,000 to $24,999 | 149 (18.3%) | 0 (0.0%) |
| $25,000 to $34,999 | 32 (3.9%) | 14 (1.7%) |
| $35,000 to $49,999 | 175 (21.5%) | 36 (4.4%) |
| $50,000 to $74,999 | 142 (17.4%) | 58 (7.2%) |
| $75,000 to $99,999 | 115 (14.1%) | 220 (27.2%) |
| $100,000 to $149,999 | 129 (15.8%) | 181 (22.4%) |
| $150,000 or more | 55 (6.8%) | 219 (27.1%) |
| Total | 815 (100.0%) | 809 (100.0%) |
Property Value to Household Income Ratio in Kingston
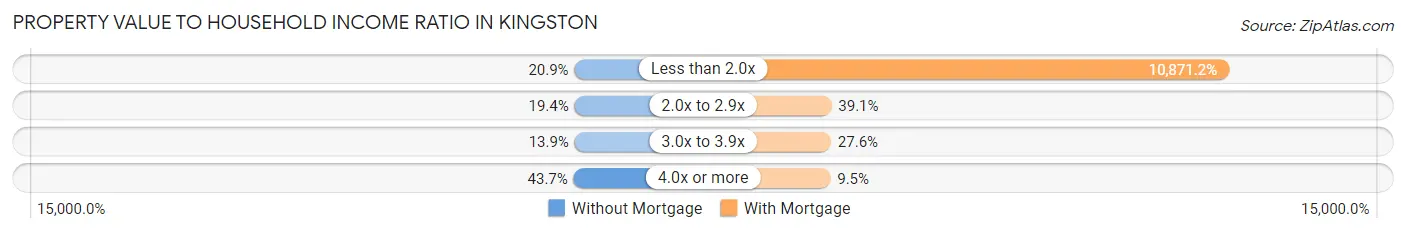
| Value-to-Income Ratio | Without Mortgage | With Mortgage |
| Less than 2.0x | 170 (20.9%) | 87,948 (10,871.2%) |
| 2.0x to 2.9x | 158 (19.4%) | 316 (39.1%) |
| 3.0x to 3.9x | 113 (13.9%) | 223 (27.6%) |
| 4.0x or more | 356 (43.7%) | 77 (9.5%) |
| Total | 815 (100.0%) | 809 (100.0%) |
Real Estate Taxes by Mortgage Status in Kingston
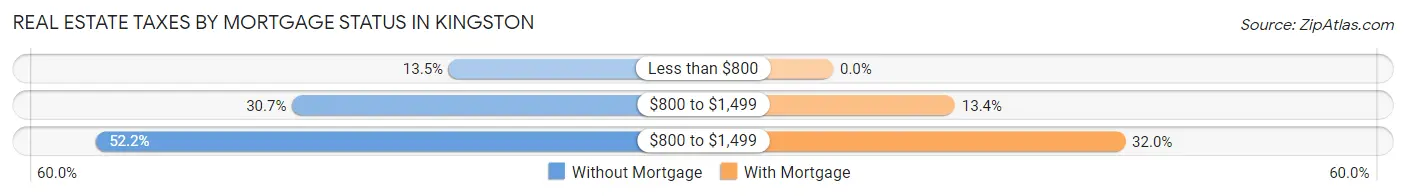
| Property Taxes | Without Mortgage | With Mortgage |
| Less than $800 | 110 (13.5%) | 0 (0.0%) |
| $800 to $1,499 | 250 (30.7%) | 108 (13.4%) |
| $800 to $1,499 | 425 (52.1%) | 259 (32.0%) |
| Total | 815 (100.0%) | 809 (100.0%) |
Health & Disability in Kingston
Health Insurance Coverage by Age in Kingston
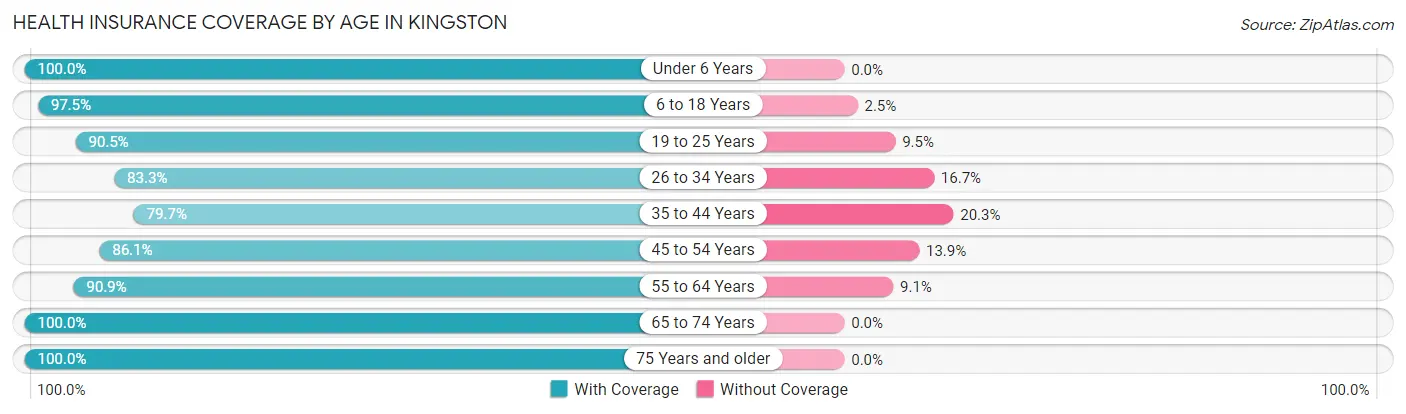
| Age Bracket | With Coverage | Without Coverage |
| Under 6 Years | 318 (100.0%) | 0 (0.0%) |
| 6 to 18 Years | 830 (97.5%) | 21 (2.5%) |
| 19 to 25 Years | 429 (90.5%) | 45 (9.5%) |
| 26 to 34 Years | 299 (83.3%) | 60 (16.7%) |
| 35 to 44 Years | 702 (79.7%) | 179 (20.3%) |
| 45 to 54 Years | 710 (86.1%) | 115 (13.9%) |
| 55 to 64 Years | 689 (90.9%) | 69 (9.1%) |
| 65 to 74 Years | 665 (100.0%) | 0 (0.0%) |
| 75 Years and older | 681 (100.0%) | 0 (0.0%) |
| Total | 5,323 (91.6%) | 489 (8.4%) |
Health Insurance Coverage by Citizenship Status in Kingston
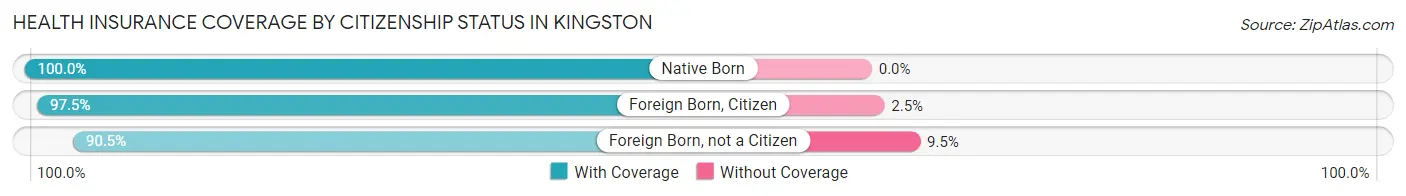
| Citizenship Status | With Coverage | Without Coverage |
| Native Born | 318 (100.0%) | 0 (0.0%) |
| Foreign Born, Citizen | 830 (97.5%) | 21 (2.5%) |
| Foreign Born, not a Citizen | 429 (90.5%) | 45 (9.5%) |
Health Insurance Coverage by Household Income in Kingston
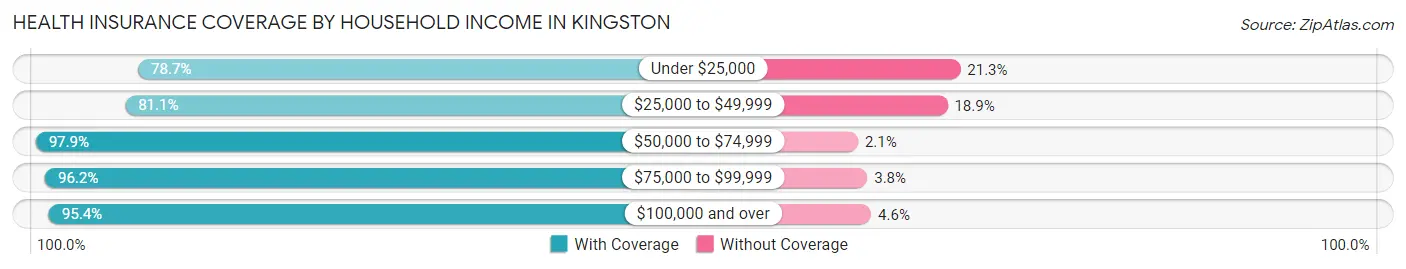
| Household Income | With Coverage | Without Coverage |
| Under $25,000 | 455 (78.7%) | 123 (21.3%) |
| $25,000 to $49,999 | 865 (81.1%) | 201 (18.9%) |
| $50,000 to $74,999 | 936 (97.9%) | 20 (2.1%) |
| $75,000 to $99,999 | 1,128 (96.2%) | 45 (3.8%) |
| $100,000 and over | 1,906 (95.4%) | 91 (4.6%) |
Public vs Private Health Insurance Coverage by Age in Kingston
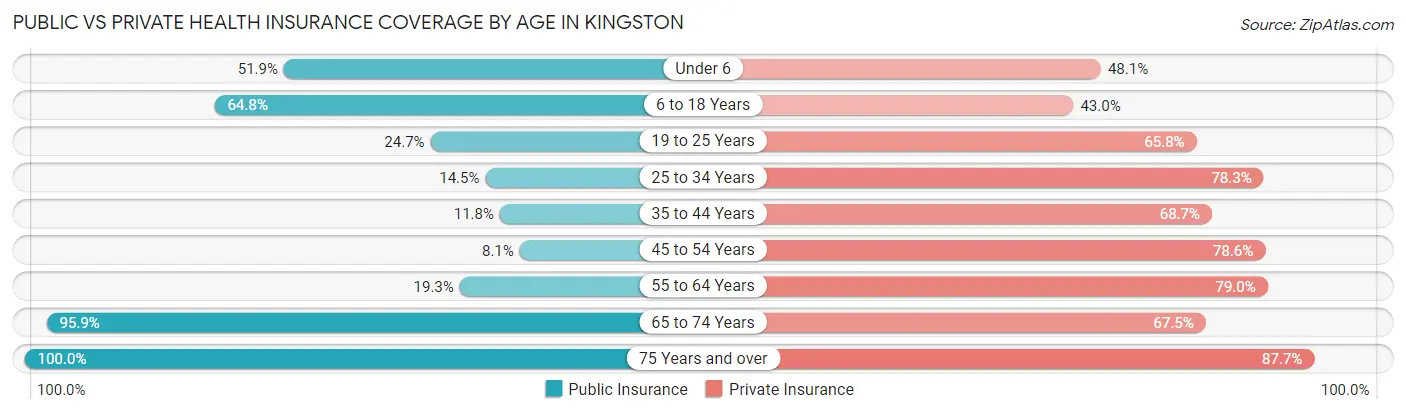
| Age Bracket | Public Insurance | Private Insurance |
| Under 6 | 165 (51.9%) | 153 (48.1%) |
| 6 to 18 Years | 551 (64.7%) | 366 (43.0%) |
| 19 to 25 Years | 117 (24.7%) | 312 (65.8%) |
| 25 to 34 Years | 52 (14.5%) | 281 (78.3%) |
| 35 to 44 Years | 104 (11.8%) | 605 (68.7%) |
| 45 to 54 Years | 67 (8.1%) | 648 (78.5%) |
| 55 to 64 Years | 146 (19.3%) | 599 (79.0%) |
| 65 to 74 Years | 638 (95.9%) | 449 (67.5%) |
| 75 Years and over | 681 (100.0%) | 597 (87.7%) |
| Total | 2,521 (43.4%) | 4,010 (69.0%) |
Disability Status by Sex by Age in Kingston
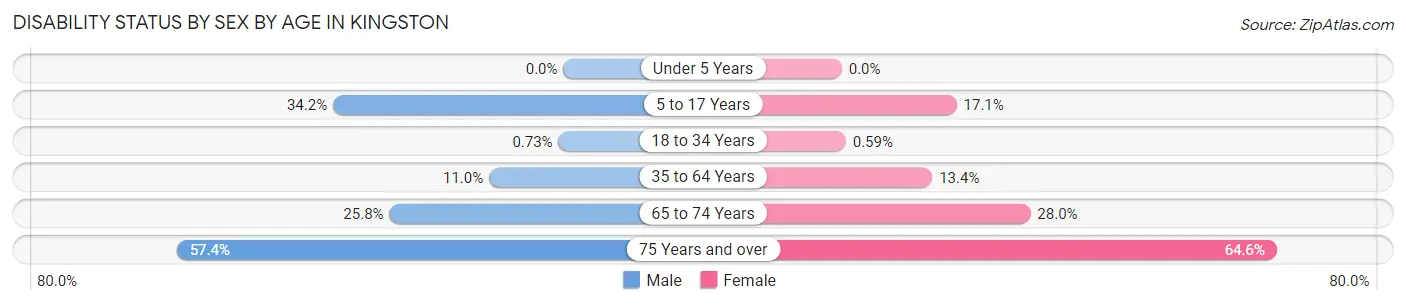
| Age Bracket | Male | Female |
| Under 5 Years | 0 (0.0%) | 0 (0.0%) |
| 5 to 17 Years | 130 (34.2%) | 74 (17.1%) |
| 18 to 34 Years | 4 (0.7%) | 2 (0.6%) |
| 35 to 64 Years | 124 (11.0%) | 180 (13.4%) |
| 65 to 74 Years | 86 (25.8%) | 93 (28.0%) |
| 75 Years and over | 151 (57.4%) | 270 (64.6%) |
Disability Class by Sex by Age in Kingston
Disability Class: Hearing Difficulty
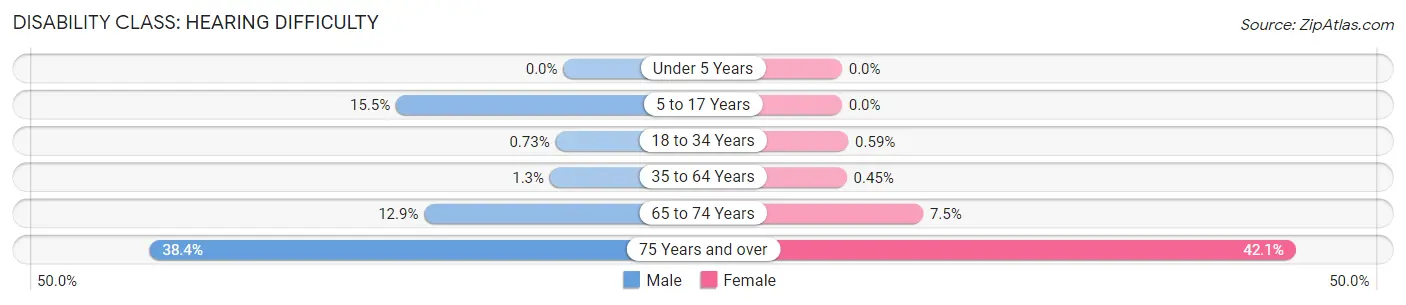
| Age Bracket | Male | Female |
| Under 5 Years | 0 (0.0%) | 0 (0.0%) |
| 5 to 17 Years | 59 (15.5%) | 0 (0.0%) |
| 18 to 34 Years | 4 (0.7%) | 2 (0.6%) |
| 35 to 64 Years | 14 (1.3%) | 6 (0.4%) |
| 65 to 74 Years | 43 (12.9%) | 25 (7.5%) |
| 75 Years and over | 101 (38.4%) | 176 (42.1%) |
Disability Class: Vision Difficulty
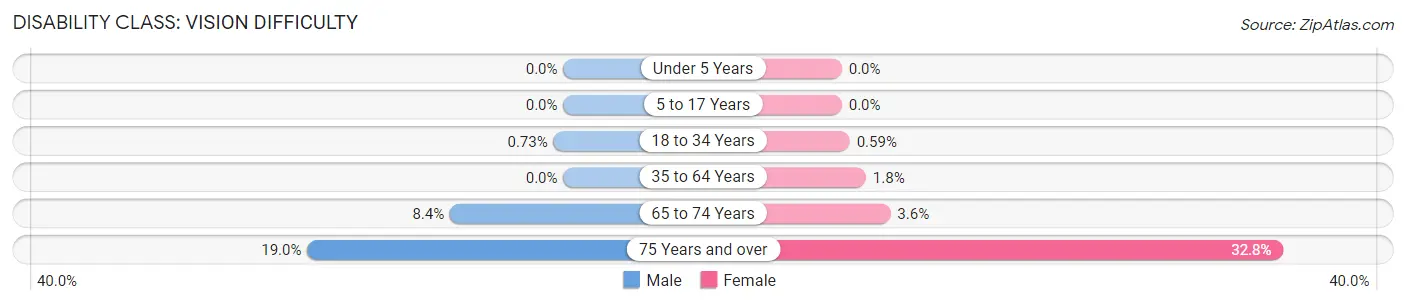
| Age Bracket | Male | Female |
| Under 5 Years | 0 (0.0%) | 0 (0.0%) |
| 5 to 17 Years | 0 (0.0%) | 0 (0.0%) |
| 18 to 34 Years | 4 (0.7%) | 2 (0.6%) |
| 35 to 64 Years | 0 (0.0%) | 24 (1.8%) |
| 65 to 74 Years | 28 (8.4%) | 12 (3.6%) |
| 75 Years and over | 50 (19.0%) | 137 (32.8%) |
Disability Class: Cognitive Difficulty
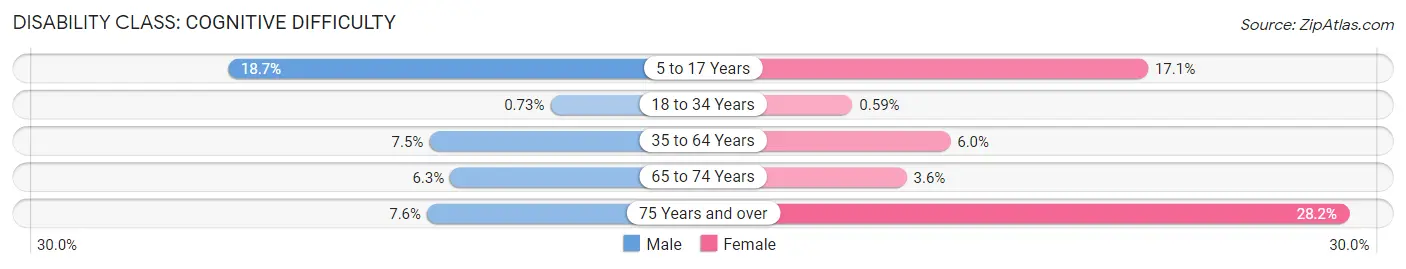
| Age Bracket | Male | Female |
| 5 to 17 Years | 71 (18.7%) | 74 (17.1%) |
| 18 to 34 Years | 4 (0.7%) | 2 (0.6%) |
| 35 to 64 Years | 84 (7.5%) | 81 (6.0%) |
| 65 to 74 Years | 21 (6.3%) | 12 (3.6%) |
| 75 Years and over | 20 (7.6%) | 118 (28.2%) |
Disability Class: Ambulatory Difficulty
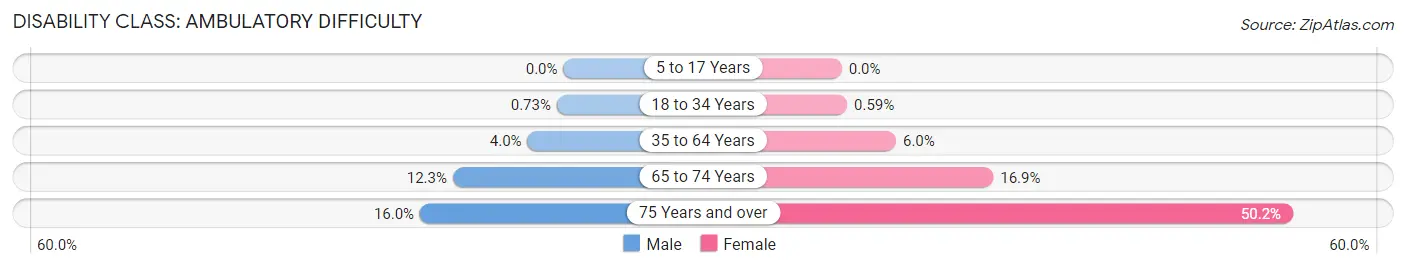
| Age Bracket | Male | Female |
| 5 to 17 Years | 0 (0.0%) | 0 (0.0%) |
| 18 to 34 Years | 4 (0.7%) | 2 (0.6%) |
| 35 to 64 Years | 45 (4.0%) | 81 (6.0%) |
| 65 to 74 Years | 41 (12.3%) | 56 (16.9%) |
| 75 Years and over | 42 (16.0%) | 210 (50.2%) |
Disability Class: Self-Care Difficulty
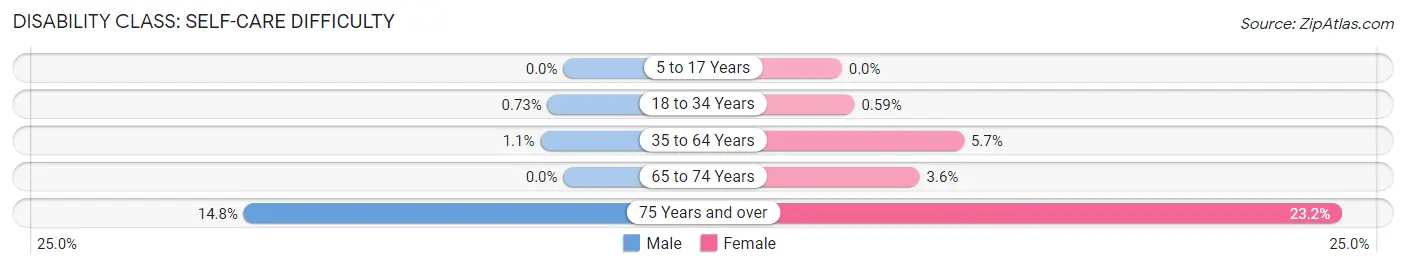
| Age Bracket | Male | Female |
| 5 to 17 Years | 0 (0.0%) | 0 (0.0%) |
| 18 to 34 Years | 4 (0.7%) | 2 (0.6%) |
| 35 to 64 Years | 12 (1.1%) | 76 (5.7%) |
| 65 to 74 Years | 0 (0.0%) | 12 (3.6%) |
| 75 Years and over | 39 (14.8%) | 97 (23.2%) |
Technology Access in Kingston
Computing Device Access in Kingston
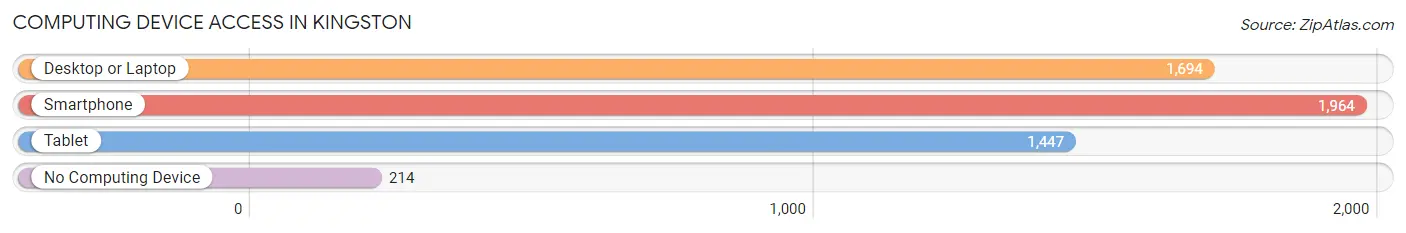
| Device Type | # Households | % Households |
| Desktop or Laptop | 1,694 | 70.8% |
| Smartphone | 1,964 | 82.1% |
| Tablet | 1,447 | 60.5% |
| No Computing Device | 214 | 8.9% |
| Total | 2,393 | 100.0% |
Internet Access in Kingston
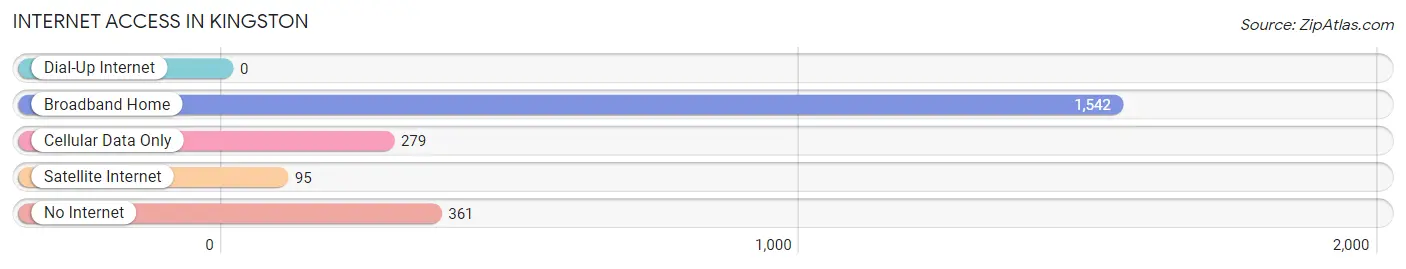
| Internet Type | # Households | % Households |
| Dial-Up Internet | 0 | 0.0% |
| Broadband Home | 1,542 | 64.4% |
| Cellular Data Only | 279 | 11.7% |
| Satellite Internet | 95 | 4.0% |
| No Internet | 361 | 15.1% |
| Total | 2,393 | 100.0% |
Kingston Summary
Kingston, Tennessee is a small city located in Roane County, Tennessee. It is situated along the banks of the Clinch River, approximately 25 miles southwest of Knoxville. The city has a population of 5,934 as of the 2010 census, making it the largest city in Roane County.
History
Kingston was founded in 1807 by William King, a Revolutionary War veteran. The city was originally known as King’s Town, but was later changed to Kingston. The city was incorporated in 1817 and was the county seat of Roane County until 1872, when the county seat was moved to Rockwood.
Kingston was an important stop on the East Tennessee and Georgia Railroad, which was completed in 1855. The railroad brought economic growth to the city, and it became a major shipping point for coal, timber, and other goods.
Geography
Kingston is located in the foothills of the Cumberland Mountains in East Tennessee. The city is situated along the banks of the Clinch River, which flows through the city. The city is surrounded by the Cherokee National Forest and is located approximately 25 miles southwest of Knoxville.
The climate in Kingston is humid subtropical, with hot summers and mild winters. The average annual temperature is around 57 degrees Fahrenheit, with an average high of around 79 degrees in the summer and an average low of around 35 degrees in the winter.
Economy
The economy of Kingston is largely based on manufacturing and agriculture. The city is home to several manufacturing plants, including a paper mill, a steel mill, and a plastics plant. The city is also home to several agricultural businesses, including a dairy farm, a poultry farm, and a vegetable farm.
The city is also home to several retail stores, restaurants, and other businesses. The city is served by the Roane County Airport, which offers flights to several major cities in the region.
Demographics
As of the 2010 census, the population of Kingston was 5,934. The racial makeup of the city was 92.3% White, 4.2% African American, 0.3% Native American, 0.7% Asian, 0.1% Pacific Islander, and 2.4% from other races. The median household income was $35,945, and the median family income was $41,945.
Conclusion
Kingston, Tennessee is a small city located in Roane County, Tennessee. It is situated along the banks of the Clinch River, approximately 25 miles southwest of Knoxville. The city has a population of 5,934 as of the 2010 census, making it the largest city in Roane County. The economy of Kingston is largely based on manufacturing and agriculture, and the city is home to several retail stores, restaurants, and other businesses. The racial makeup of the city is 92.3% White, 4.2% African American, 0.3% Native American, 0.7% Asian, 0.1% Pacific Islander, and 2.4% from other races.
Common Questions
What is Per Capita Income in Kingston?
Per Capita income in Kingston is $33,574.
What is the Median Family Income in Kingston?
Median Family Income in Kingston is $83,389.
What is the Median Household income in Kingston?
Median Household Income in Kingston is $67,637.
What is Income or Wage Gap in Kingston?
Income or Wage Gap in Kingston is 33.9%.
Women in Kingston earn 66.1 cents for every dollar earned by a man.
What is Inequality or Gini Index in Kingston?
Inequality or Gini Index in Kingston is 0.41.
What is the Total Population of Kingston?
Total Population of Kingston is 5,987.
What is the Total Male Population of Kingston?
Total Male Population of Kingston is 2,898.
What is the Total Female Population of Kingston?
Total Female Population of Kingston is 3,089.
What is the Ratio of Males per 100 Females in Kingston?
There are 93.82 Males per 100 Females in Kingston.
What is the Ratio of Females per 100 Males in Kingston?
There are 106.59 Females per 100 Males in Kingston.
What is the Median Population Age in Kingston?
Median Population Age in Kingston is 44.7 Years.
What is the Average Family Size in Kingston
Average Family Size in Kingston is 3.2 People.
What is the Average Household Size in Kingston
Average Household Size in Kingston is 2.4 People.
How Large is the Labor Force in Kingston?
There are 2,768 People in the Labor Forcein in Kingston.
What is the Percentage of People in the Labor Force in Kingston?
55.4% of People are in the Labor Force in Kingston.
What is the Unemployment Rate in Kingston?
Unemployment Rate in Kingston is 7.3%.