Parsons, TN Map & Demographics
Parsons Map
Parsons Overview
$23,921
PER CAPITA INCOME
$64,474
AVG FAMILY INCOME
$39,000
AVG HOUSEHOLD INCOME
54.9%
WAGE / INCOME GAP [ % ]
45.1¢/ $1
WAGE / INCOME GAP [ $ ]
0.47
INEQUALITY / GINI INDEX
2,452
TOTAL POPULATION
1,239
MALE POPULATION
1,213
FEMALE POPULATION
102.14
MALES / 100 FEMALES
97.90
FEMALES / 100 MALES
41.9
MEDIAN AGE
3.2
AVG FAMILY SIZE
2.4
AVG HOUSEHOLD SIZE
1,045
LABOR FORCE [ PEOPLE ]
50.9%
PERCENT IN LABOR FORCE
7.2%
UNEMPLOYMENT RATE
Parsons Zip Codes
Parsons Area Codes
Income in Parsons
Income Overview in Parsons
Per Capita Income in Parsons is $23,921, while median incomes of families and households are $64,474 and $39,000 respectively.
| Characteristic | Number | Measure |
| Per Capita Income | 2,452 | $23,921 |
| Median Family Income | 546 | $64,474 |
| Mean Family Income | 546 | $71,434 |
| Median Household Income | 986 | $39,000 |
| Mean Household Income | 986 | $55,159 |
| Income Deficit | 546 | $0 |
| Wage / Income Gap (%) | 2,452 | 54.92% |
| Wage / Income Gap ($) | 2,452 | 45.08¢ per $1 |
| Gini / Inequality Index | 2,452 | 0.47 |
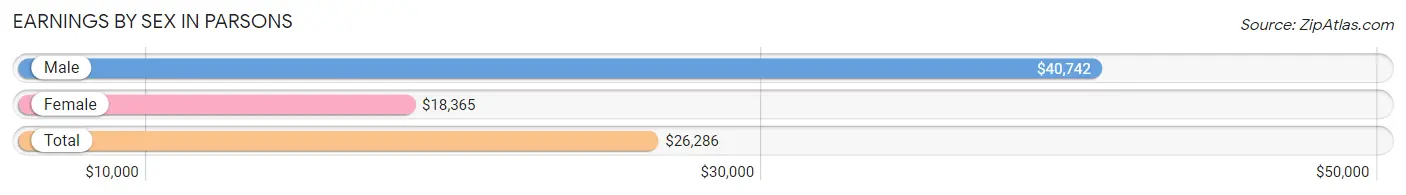
Earnings by Sex in Parsons
Average Earnings in Parsons are $26,286, $40,742 for men and $18,365 for women, a difference of 54.9%.
| Sex | Number | Average Earnings |
| Male | 591 (55.5%) | $40,742 |
| Female | 473 (44.5%) | $18,365 |
| Total | 1,064 (100.0%) | $26,286 |
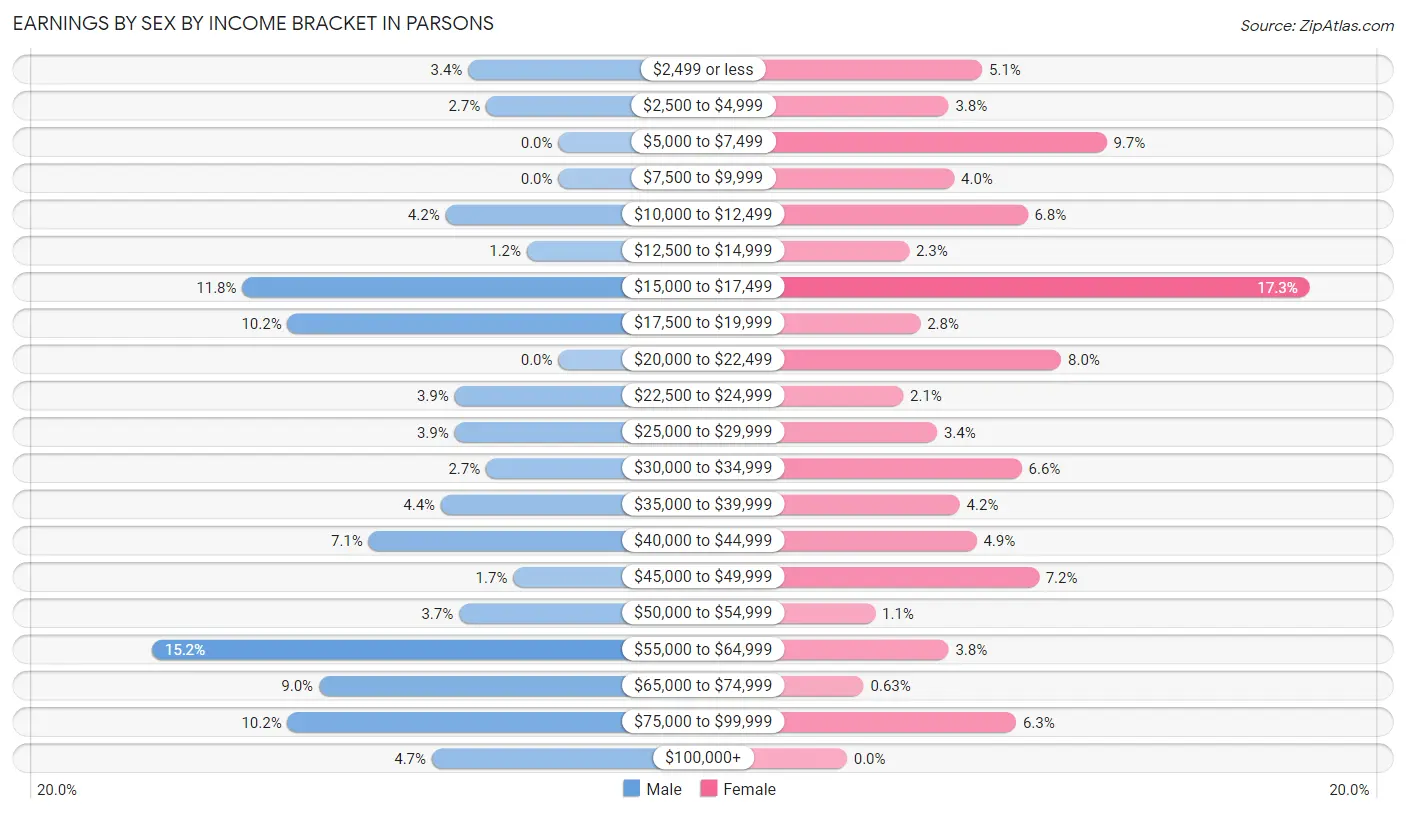
Earnings by Sex by Income Bracket in Parsons
The most common earnings brackets in Parsons are $55,000 to $64,999 for men (90 | 15.2%) and $15,000 to $17,499 for women (82 | 17.3%).
| Income | Male | Female |
| $2,499 or less | 20 (3.4%) | 24 (5.1%) |
| $2,500 to $4,999 | 16 (2.7%) | 18 (3.8%) |
| $5,000 to $7,499 | 0 (0.0%) | 46 (9.7%) |
| $7,500 to $9,999 | 0 (0.0%) | 19 (4.0%) |
| $10,000 to $12,499 | 25 (4.2%) | 32 (6.8%) |
| $12,500 to $14,999 | 7 (1.2%) | 11 (2.3%) |
| $15,000 to $17,499 | 70 (11.8%) | 82 (17.3%) |
| $17,500 to $19,999 | 60 (10.2%) | 13 (2.8%) |
| $20,000 to $22,499 | 0 (0.0%) | 38 (8.0%) |
| $22,500 to $24,999 | 23 (3.9%) | 10 (2.1%) |
| $25,000 to $29,999 | 23 (3.9%) | 16 (3.4%) |
| $30,000 to $34,999 | 16 (2.7%) | 31 (6.6%) |
| $35,000 to $39,999 | 26 (4.4%) | 20 (4.2%) |
| $40,000 to $44,999 | 42 (7.1%) | 23 (4.9%) |
| $45,000 to $49,999 | 10 (1.7%) | 34 (7.2%) |
| $50,000 to $54,999 | 22 (3.7%) | 5 (1.1%) |
| $55,000 to $64,999 | 90 (15.2%) | 18 (3.8%) |
| $65,000 to $74,999 | 53 (9.0%) | 3 (0.6%) |
| $75,000 to $99,999 | 60 (10.2%) | 30 (6.3%) |
| $100,000+ | 28 (4.7%) | 0 (0.0%) |
| Total | 591 (100.0%) | 473 (100.0%) |
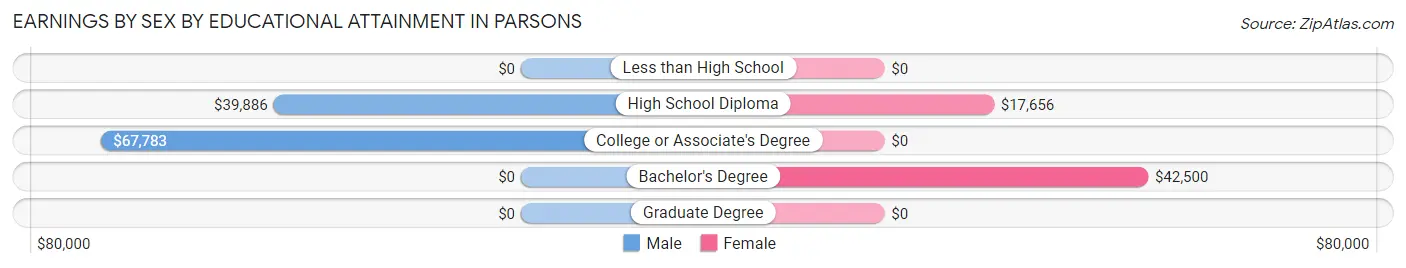
Earnings by Sex by Educational Attainment in Parsons
Average earnings in Parsons are $56,042 for men and $21,012 for women, a difference of 62.5%. Men with an educational attainment of college or associate's degree enjoy the highest average annual earnings of $67,783, while those with high school diploma education earn the least with $39,886. Women with an educational attainment of bachelor's degree earn the most with the average annual earnings of $42,500, while those with high school diploma education have the smallest earnings of $17,656.
| Educational Attainment | Male Income | Female Income |
| Less than High School | - | - |
| High School Diploma | $39,886 | $17,656 |
| College or Associate's Degree | $67,783 | $0 |
| Bachelor's Degree | - | - |
| Graduate Degree | - | - |
| Total | $56,042 | $21,012 |
Family Income in Parsons
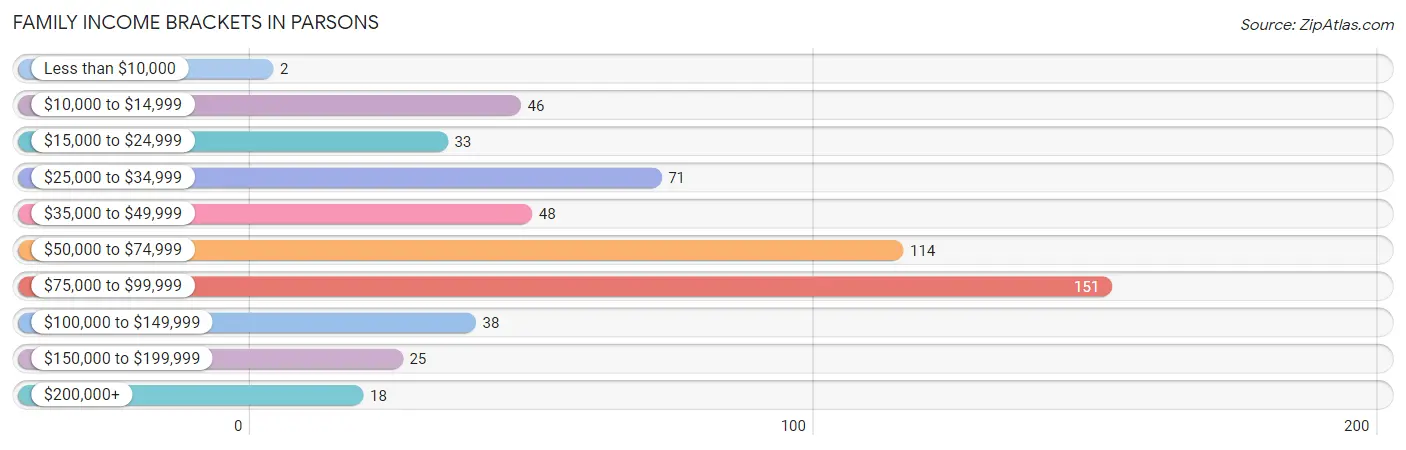
Family Income Brackets in Parsons
According to the Parsons family income data, there are 151 families falling into the $75,000 to $99,999 income range, which is the most common income bracket and makes up 27.7% of all families. Conversely, the less than $10,000 income bracket is the least frequent group with only 2 families (0.4%) belonging to this category.
| Income Bracket | # Families | % Families |
| Less than $10,000 | 2 | 0.4% |
| $10,000 to $14,999 | 46 | 8.4% |
| $15,000 to $24,999 | 33 | 6.0% |
| $25,000 to $34,999 | 71 | 13.0% |
| $35,000 to $49,999 | 48 | 8.8% |
| $50,000 to $74,999 | 114 | 20.9% |
| $75,000 to $99,999 | 151 | 27.7% |
| $100,000 to $149,999 | 38 | 7.0% |
| $150,000 to $199,999 | 25 | 4.6% |
| $200,000+ | 18 | 3.3% |
Family Income by Famaliy Size in Parsons
4-person families (107 | 19.6%) account for the highest median family income in Parsons with $91,607 per family, while 2-person families (321 | 58.8%) have the highest median income of $28,575 per family member.

| Income Bracket | # Families | Median Income |
| 2-Person Families | 321 (58.8%) | $57,150 |
| 3-Person Families | 62 (11.4%) | $0 |
| 4-Person Families | 107 (19.6%) | $91,607 |
| 5-Person Families | 37 (6.8%) | $79,464 |
| 6-Person Families | 19 (3.5%) | $0 |
| 7+ Person Families | 0 (0.0%) | $0 |
| Total | 546 (100.0%) | $64,474 |
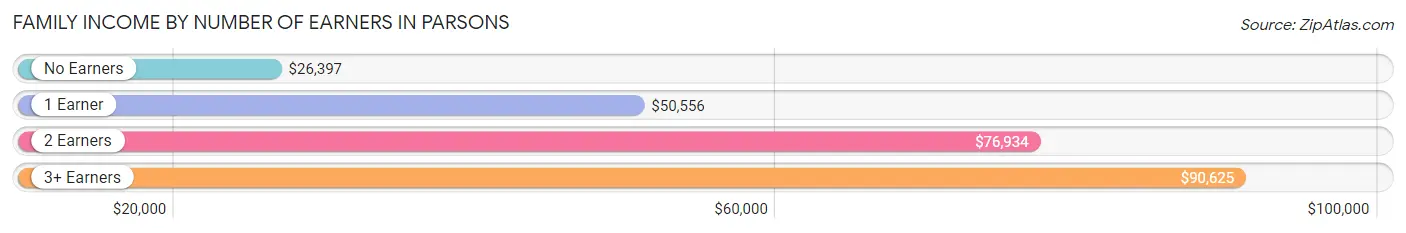
Family Income by Number of Earners in Parsons
The median family income in Parsons is $64,474, with families comprising 3+ earners (49) having the highest median family income of $90,625, while families with no earners (99) have the lowest median family income of $26,397, accounting for 9.0% and 18.1% of families, respectively.
| Number of Earners | # Families | Median Income |
| No Earners | 99 (18.1%) | $26,397 |
| 1 Earner | 168 (30.8%) | $50,556 |
| 2 Earners | 230 (42.1%) | $76,934 |
| 3+ Earners | 49 (9.0%) | $90,625 |
| Total | 546 (100.0%) | $64,474 |
Household Income in Parsons
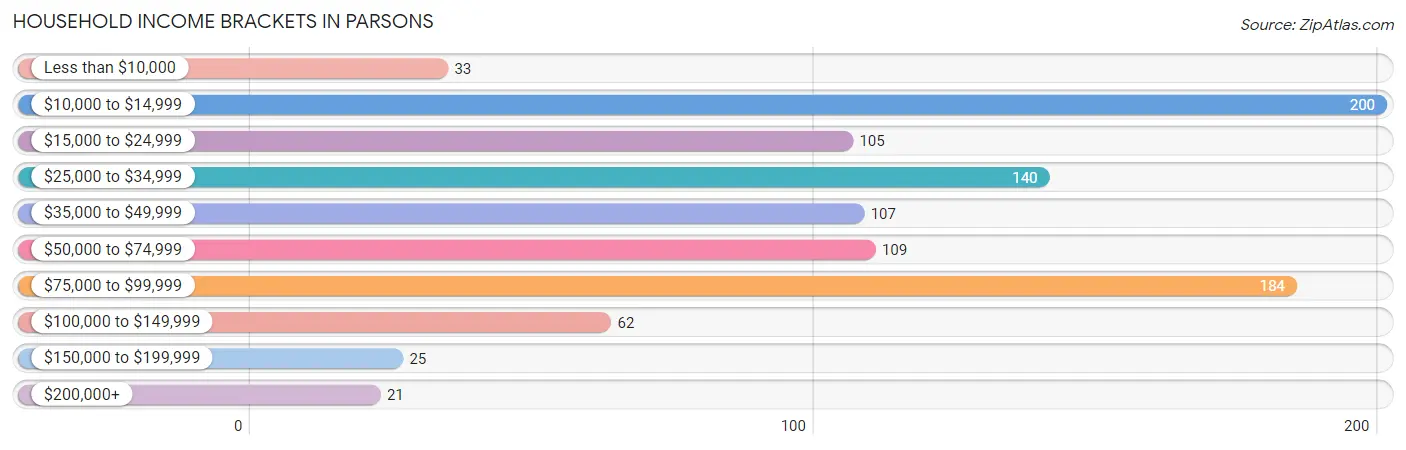
Household Income Brackets in Parsons
With 200 households falling in the category, the $10,000 to $14,999 income range is the most frequent in Parsons, accounting for 20.3% of all households. In contrast, only 21 households (2.1%) fall into the $200,000+ income bracket, making it the least populous group.
| Income Bracket | # Households | % Households |
| Less than $10,000 | 33 | 3.3% |
| $10,000 to $14,999 | 200 | 20.3% |
| $15,000 to $24,999 | 105 | 10.6% |
| $25,000 to $34,999 | 140 | 14.2% |
| $35,000 to $49,999 | 107 | 10.9% |
| $50,000 to $74,999 | 109 | 11.1% |
| $75,000 to $99,999 | 184 | 18.7% |
| $100,000 to $149,999 | 62 | 6.3% |
| $150,000 to $199,999 | 25 | 2.5% |
| $200,000+ | 21 | 2.1% |
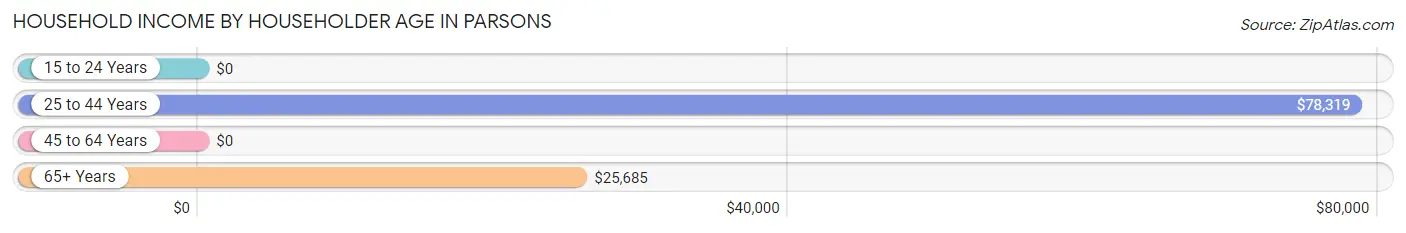
Household Income by Householder Age in Parsons
The median household income in Parsons is $39,000, with the highest median household income of $78,319 found in the 25 to 44 years age bracket for the primary householder. A total of 240 households (24.3%) fall into this category. Meanwhile, the 15 to 24 years age bracket for the primary householder has the lowest median household income of $0, with 48 households (4.9%) in this group.
| Income Bracket | # Households | Median Income |
| 15 to 24 Years | 48 (4.9%) | $0 |
| 25 to 44 Years | 240 (24.3%) | $78,319 |
| 45 to 64 Years | 279 (28.3%) | $0 |
| 65+ Years | 419 (42.5%) | $25,685 |
| Total | 986 (100.0%) | $39,000 |
Poverty in Parsons
Income Below Poverty by Sex and Age in Parsons
With 15.9% poverty level for males and 31.6% for females among the residents of Parsons, 55 to 64 year old males and 16 and 17 year old females are the most vulnerable to poverty, with 104 males (58.1%) and 10 females (83.3%) in their respective age groups living below the poverty level.
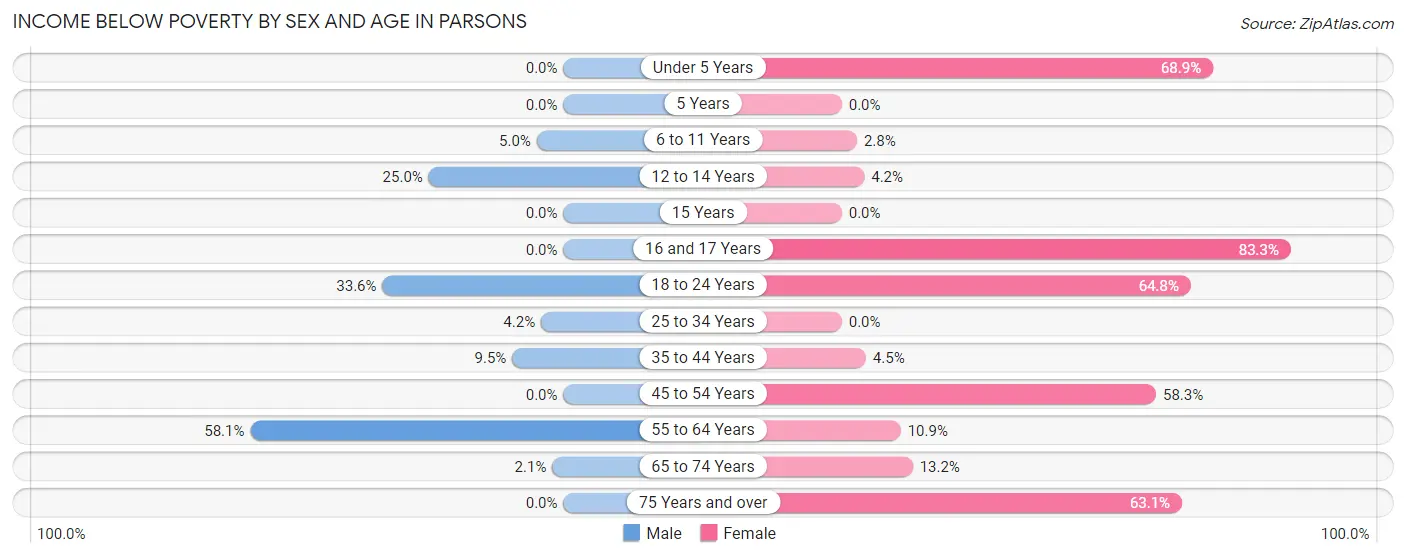
| Age Bracket | Male | Female |
| Under 5 Years | 0 (0.0%) | 31 (68.9%) |
| 5 Years | 0 (0.0%) | 0 (0.0%) |
| 6 to 11 Years | 5 (5.0%) | 2 (2.8%) |
| 12 to 14 Years | 11 (25.0%) | 2 (4.2%) |
| 15 Years | 0 (0.0%) | 0 (0.0%) |
| 16 and 17 Years | 0 (0.0%) | 10 (83.3%) |
| 18 to 24 Years | 44 (33.6%) | 57 (64.8%) |
| 25 to 34 Years | 9 (4.2%) | 0 (0.0%) |
| 35 to 44 Years | 17 (9.5%) | 6 (4.5%) |
| 45 to 54 Years | 0 (0.0%) | 84 (58.3%) |
| 55 to 64 Years | 104 (58.1%) | 14 (10.9%) |
| 65 to 74 Years | 2 (2.1%) | 15 (13.2%) |
| 75 Years and over | 0 (0.0%) | 137 (63.1%) |
| Total | 192 (15.9%) | 358 (31.6%) |
Income Above Poverty by Sex and Age in Parsons
According to the poverty statistics in Parsons, males aged under 5 years and females aged 15 years are the age groups that are most secure financially, with 100.0% of males and 100.0% of females in these age groups living above the poverty line.
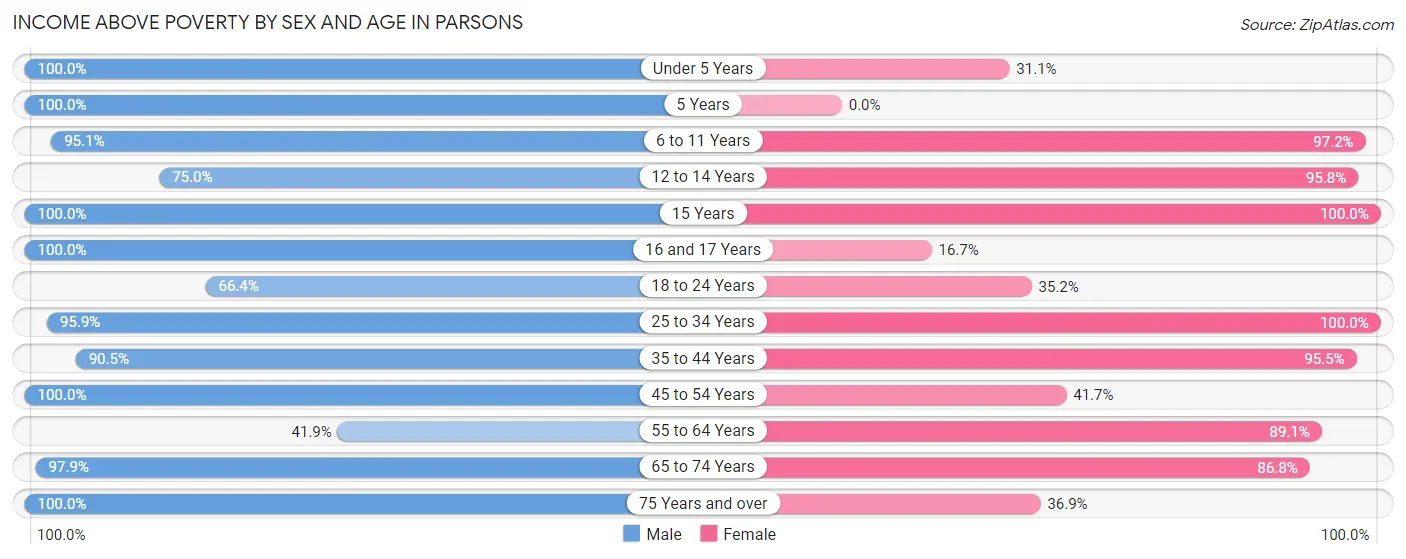
| Age Bracket | Male | Female |
| Under 5 Years | 29 (100.0%) | 14 (31.1%) |
| 5 Years | 18 (100.0%) | 0 (0.0%) |
| 6 to 11 Years | 96 (95.1%) | 69 (97.2%) |
| 12 to 14 Years | 33 (75.0%) | 46 (95.8%) |
| 15 Years | 14 (100.0%) | 29 (100.0%) |
| 16 and 17 Years | 65 (100.0%) | 2 (16.7%) |
| 18 to 24 Years | 87 (66.4%) | 31 (35.2%) |
| 25 to 34 Years | 208 (95.9%) | 102 (100.0%) |
| 35 to 44 Years | 162 (90.5%) | 128 (95.5%) |
| 45 to 54 Years | 80 (100.0%) | 60 (41.7%) |
| 55 to 64 Years | 75 (41.9%) | 114 (89.1%) |
| 65 to 74 Years | 95 (97.9%) | 99 (86.8%) |
| 75 Years and over | 54 (100.0%) | 80 (36.9%) |
| Total | 1,016 (84.1%) | 774 (68.4%) |
Income Below Poverty Among Married-Couple Families in Parsons
The poverty statistics for married-couple families in Parsons show that 5.5% or 20 of the total 366 families live below the poverty line. Families with 1 or 2 children have the highest poverty rate of 18.9%, comprising of 20 families. On the other hand, families with no children have the lowest poverty rate of 0.0%, which includes 0 families.
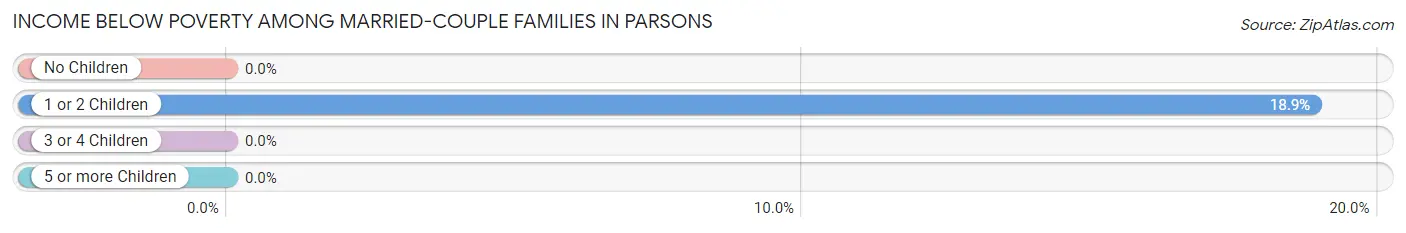
| Children | Above Poverty | Below Poverty |
| No Children | 220 (100.0%) | 0 (0.0%) |
| 1 or 2 Children | 86 (81.1%) | 20 (18.9%) |
| 3 or 4 Children | 40 (100.0%) | 0 (0.0%) |
| 5 or more Children | 0 (0.0%) | 0 (0.0%) |
| Total | 346 (94.5%) | 20 (5.5%) |
Income Below Poverty Among Single-Parent Households in Parsons
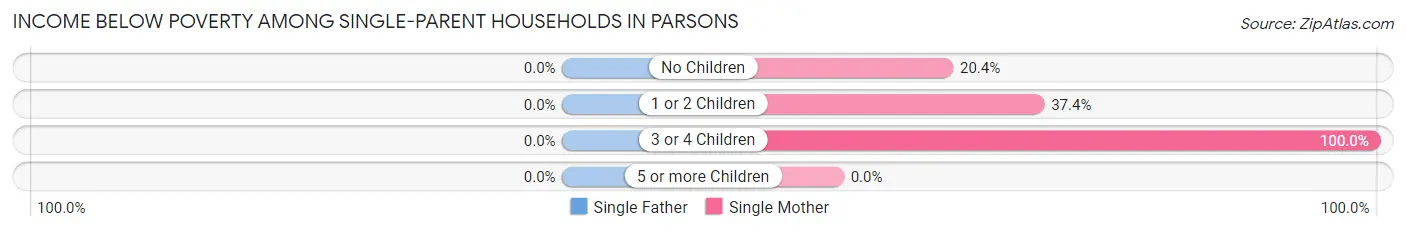
| Children | Single Father | Single Mother |
| No Children | 0 (0.0%) | 11 (20.4%) |
| 1 or 2 Children | 0 (0.0%) | 34 (37.4%) |
| 3 or 4 Children | 0 (0.0%) | 2 (100.0%) |
| 5 or more Children | 0 (0.0%) | 0 (0.0%) |
| Total | 0 (0.0%) | 47 (32.0%) |
Income Below Poverty Among Married-Couple vs Single-Parent Households in Parsons
The poverty data for Parsons shows that 20 of the married-couple family households (5.5%) and 47 of the single-parent households (26.1%) are living below the poverty level. Within the married-couple family households, those with 1 or 2 children have the highest poverty rate, with 20 households (18.9%) falling below the poverty line. Among the single-parent households, those with 3 or 4 children have the highest poverty rate, with 2 household (100.0%) living below poverty.
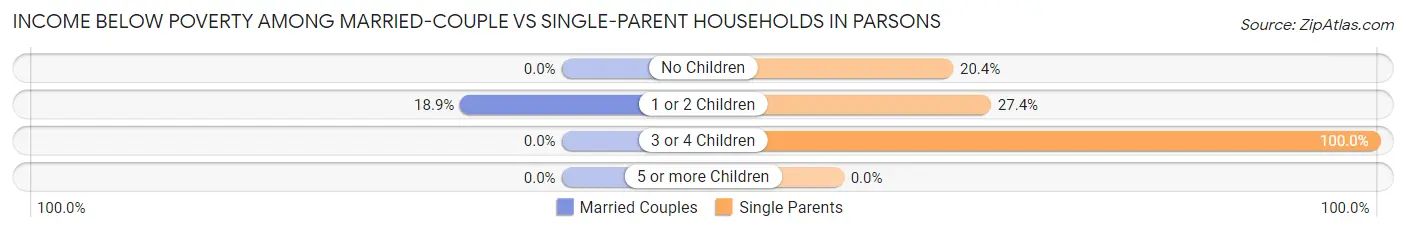
| Children | Married-Couple Families | Single-Parent Households |
| No Children | 0 (0.0%) | 11 (20.4%) |
| 1 or 2 Children | 20 (18.9%) | 34 (27.4%) |
| 3 or 4 Children | 0 (0.0%) | 2 (100.0%) |
| 5 or more Children | 0 (0.0%) | 0 (0.0%) |
| Total | 20 (5.5%) | 47 (26.1%) |
Race in Parsons
The most populous races in Parsons are White / Caucasian (2,245 | 91.6%), Black / African American (149 | 6.1%), and Two or more Races (51 | 2.1%).
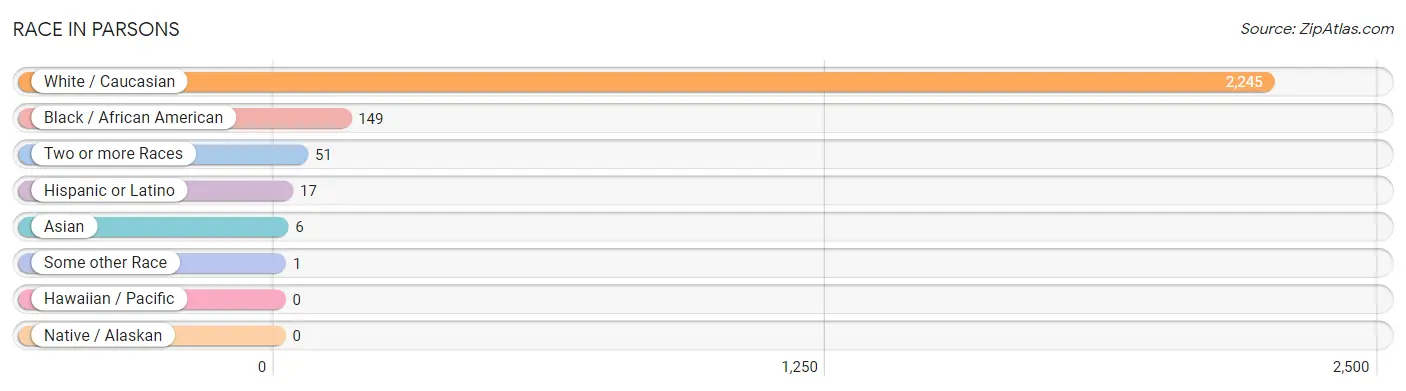
| Race | # Population | % Population |
| Asian | 6 | 0.2% |
| Black / African American | 149 | 6.1% |
| Hawaiian / Pacific | 0 | 0.0% |
| Hispanic or Latino | 17 | 0.7% |
| Native / Alaskan | 0 | 0.0% |
| White / Caucasian | 2,245 | 91.6% |
| Two or more Races | 51 | 2.1% |
| Some other Race | 1 | 0.0% |
| Total | 2,452 | 100.0% |
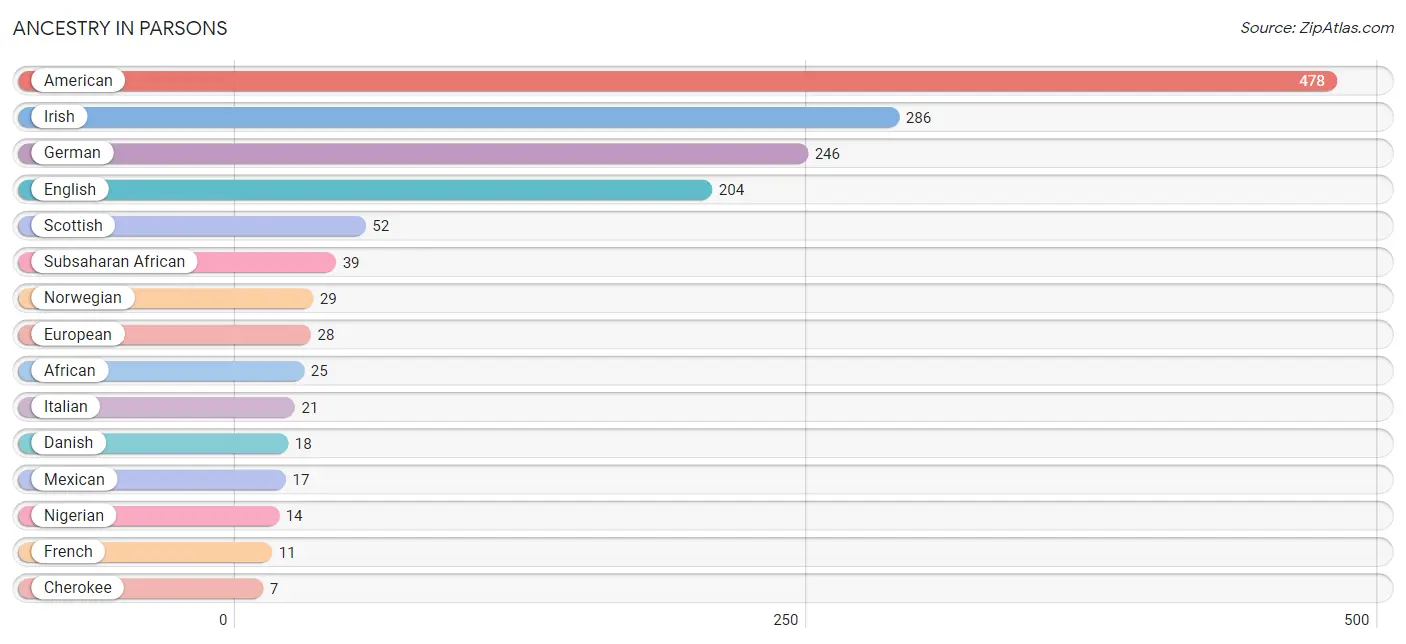
Ancestry in Parsons
The most populous ancestries reported in Parsons are American (478 | 19.5%), Irish (286 | 11.7%), German (246 | 10.0%), English (204 | 8.3%), and Scottish (52 | 2.1%), together accounting for 51.6% of all Parsons residents.
| Ancestry | # Population | % Population |
| African | 25 | 1.0% |
| American | 478 | 19.5% |
| Celtic | 6 | 0.2% |
| Cherokee | 7 | 0.3% |
| Danish | 18 | 0.7% |
| Dutch | 3 | 0.1% |
| English | 204 | 8.3% |
| European | 28 | 1.1% |
| French | 11 | 0.4% |
| French Canadian | 4 | 0.2% |
| German | 246 | 10.0% |
| Irish | 286 | 11.7% |
| Italian | 21 | 0.9% |
| Korean | 6 | 0.2% |
| Mexican | 17 | 0.7% |
| Nigerian | 14 | 0.6% |
| Norwegian | 29 | 1.2% |
| Polish | 5 | 0.2% |
| Scottish | 52 | 2.1% |
| Subsaharan African | 39 | 1.6% |
| Welsh | 6 | 0.2% | View All 21 Rows |
Immigrants in Parsons
The most numerous immigrant groups reported in Parsons came from Asia (6 | 0.2%), Philippines (6 | 0.2%), and South Eastern Asia (6 | 0.2%), together accounting for 0.7% of all Parsons residents.
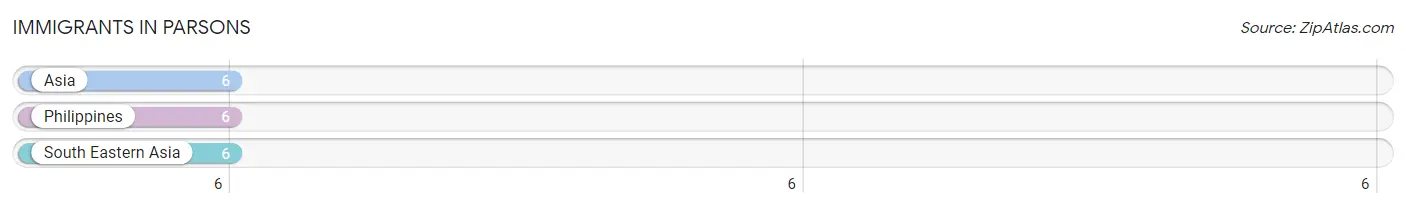
| Immigration Origin | # Population | % Population |
| Asia | 6 | 0.2% |
| Philippines | 6 | 0.2% |
| South Eastern Asia | 6 | 0.2% | View All 3 Rows |
Sex and Age in Parsons
Sex and Age in Parsons
The most populous age groups in Parsons are 25 to 29 Years (150 | 12.1%) for men and 80 to 84 Years (160 | 13.2%) for women.
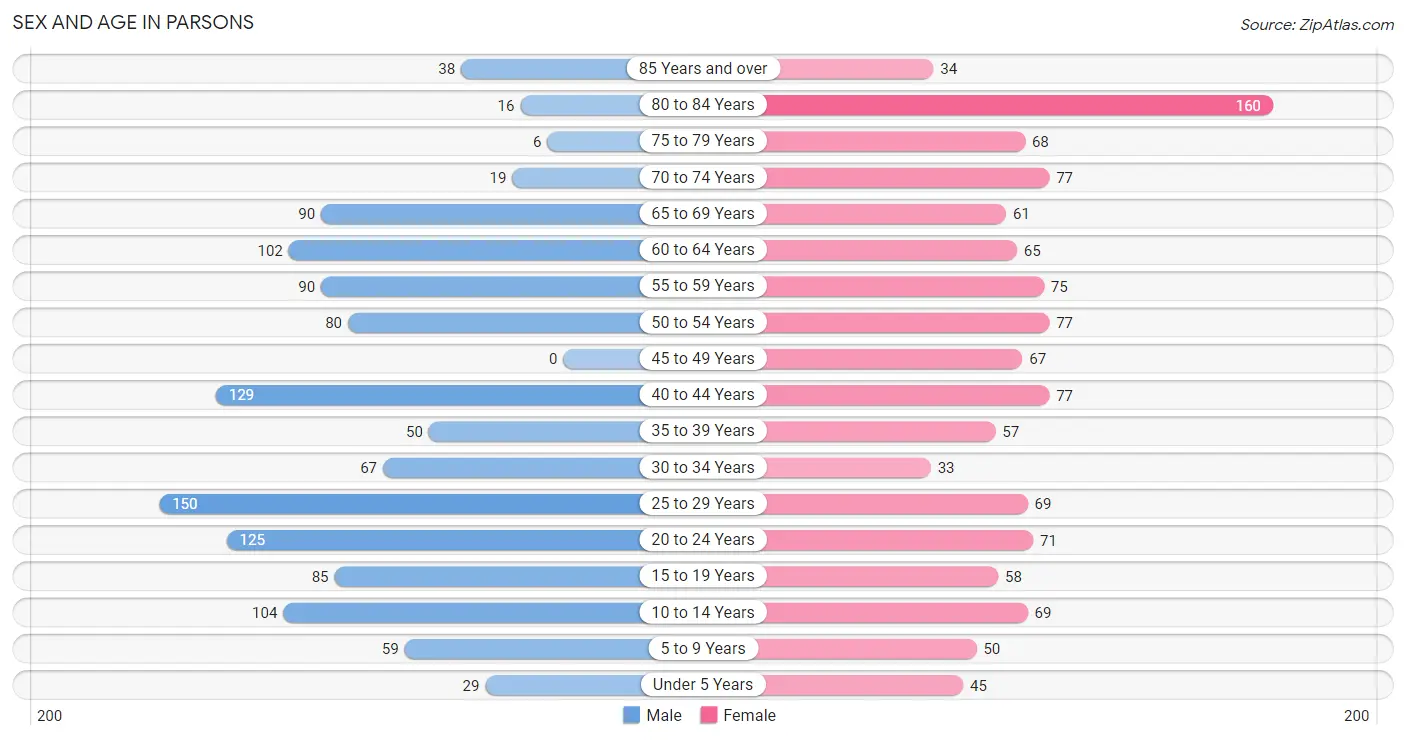
| Age Bracket | Male | Female |
| Under 5 Years | 29 (2.3%) | 45 (3.7%) |
| 5 to 9 Years | 59 (4.8%) | 50 (4.1%) |
| 10 to 14 Years | 104 (8.4%) | 69 (5.7%) |
| 15 to 19 Years | 85 (6.9%) | 58 (4.8%) |
| 20 to 24 Years | 125 (10.1%) | 71 (5.9%) |
| 25 to 29 Years | 150 (12.1%) | 69 (5.7%) |
| 30 to 34 Years | 67 (5.4%) | 33 (2.7%) |
| 35 to 39 Years | 50 (4.0%) | 57 (4.7%) |
| 40 to 44 Years | 129 (10.4%) | 77 (6.4%) |
| 45 to 49 Years | 0 (0.0%) | 67 (5.5%) |
| 50 to 54 Years | 80 (6.5%) | 77 (6.4%) |
| 55 to 59 Years | 90 (7.3%) | 75 (6.2%) |
| 60 to 64 Years | 102 (8.2%) | 65 (5.4%) |
| 65 to 69 Years | 90 (7.3%) | 61 (5.0%) |
| 70 to 74 Years | 19 (1.5%) | 77 (6.4%) |
| 75 to 79 Years | 6 (0.5%) | 68 (5.6%) |
| 80 to 84 Years | 16 (1.3%) | 160 (13.2%) |
| 85 Years and over | 38 (3.1%) | 34 (2.8%) |
| Total | 1,239 (100.0%) | 1,213 (100.0%) |
Families and Households in Parsons
Median Family Size in Parsons
The median family size in Parsons is 3.19 persons per family, with married-couple families (366 | 67.0%) accounting for the largest median family size of 3.44 persons per family. On the other hand, single male/father families (33 | 6.0%) represent the smallest median family size with 1.55 persons per family.
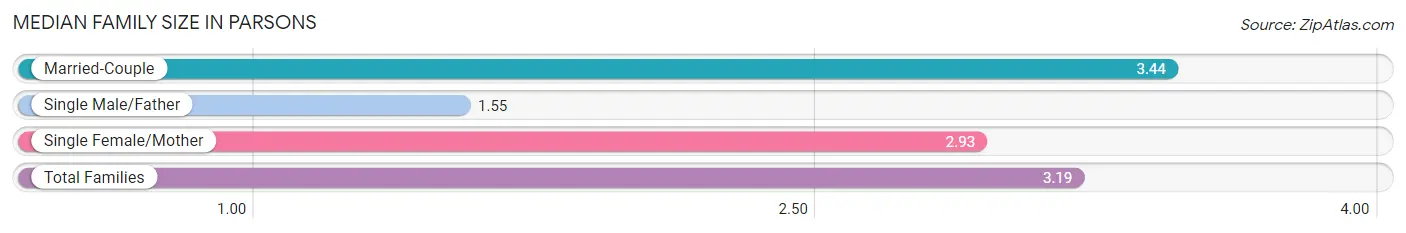
| Family Type | # Families | Family Size |
| Married-Couple | 366 (67.0%) | 3.44 |
| Single Male/Father | 33 (6.0%) | 1.55 |
| Single Female/Mother | 147 (26.9%) | 2.93 |
| Total Families | 546 (100.0%) | 3.19 |
Median Household Size in Parsons
The median household size in Parsons is 2.37 persons per household, with married-couple households (366 | 37.1%) accounting for the largest median household size of 3.44 persons per household. non-family households (440 | 44.6%) represent the smallest median household size with 1.20 persons per household.
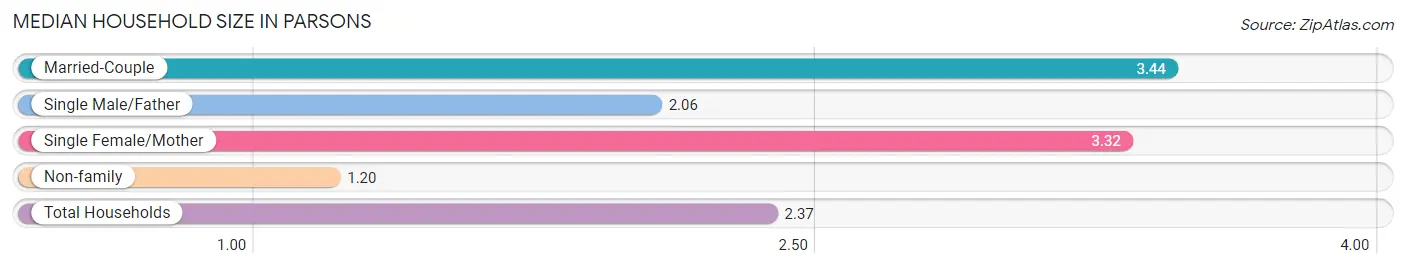
| Household Type | # Households | Household Size |
| Married-Couple | 366 (37.1%) | 3.44 |
| Single Male/Father | 33 (3.4%) | 2.06 |
| Single Female/Mother | 147 (14.9%) | 3.32 |
| Non-family | 440 (44.6%) | 1.20 |
| Total Households | 986 (100.0%) | 2.37 |
Household Size by Marriage Status in Parsons
Out of a total of 986 households in Parsons, 546 (55.4%) are family households, while 440 (44.6%) are nonfamily households. The most numerous type of family households are 2-person households, comprising 251, and the most common type of nonfamily households are 1-person households, comprising 389.
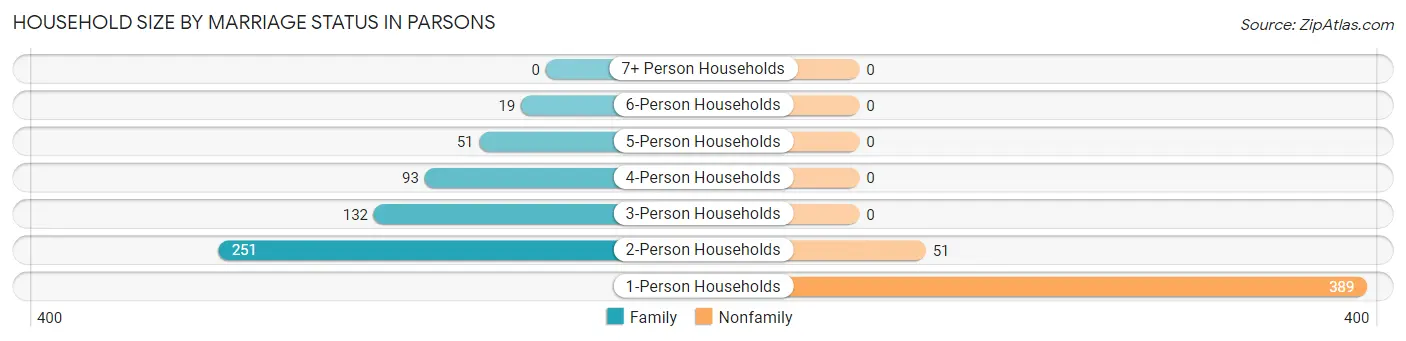
| Household Size | Family Households | Nonfamily Households |
| 1-Person Households | - | 389 (39.5%) |
| 2-Person Households | 251 (25.5%) | 51 (5.2%) |
| 3-Person Households | 132 (13.4%) | 0 (0.0%) |
| 4-Person Households | 93 (9.4%) | 0 (0.0%) |
| 5-Person Households | 51 (5.2%) | 0 (0.0%) |
| 6-Person Households | 19 (1.9%) | 0 (0.0%) |
| 7+ Person Households | 0 (0.0%) | 0 (0.0%) |
| Total | 546 (55.4%) | 440 (44.6%) |
Female Fertility in Parsons
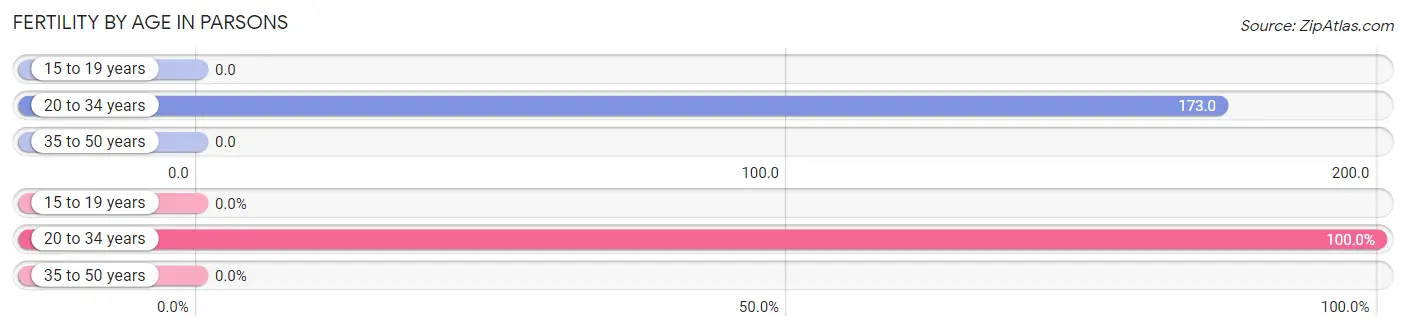
Fertility by Age in Parsons
Average fertility rate in Parsons is 69.0 births per 1,000 women. Women in the age bracket of 20 to 34 years have the highest fertility rate with 173.0 births per 1,000 women. Women in the age bracket of 20 to 34 years acount for 100.0% of all women with births.
| Age Bracket | Women with Births | Births / 1,000 Women |
| 15 to 19 years | 0 (0.0%) | 0.0 |
| 20 to 34 years | 30 (100.0%) | 173.0 |
| 35 to 50 years | 0 (0.0%) | 0.0 |
| Total | 30 (100.0%) | 69.0 |
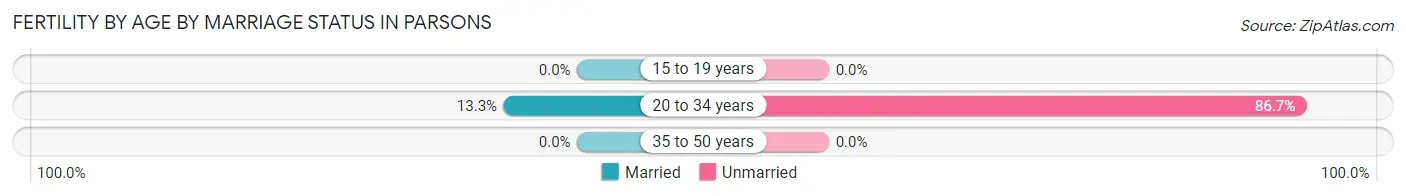
Fertility by Age by Marriage Status in Parsons
13.3% of women with births (30) in Parsons are married. The highest percentage of unmarried women with births falls into 20 to 34 years age bracket with 86.7% of them unmarried at the time of birth, while the lowest percentage of unmarried women with births belong to 20 to 34 years age bracket with 86.7% of them unmarried.
| Age Bracket | Married | Unmarried |
| 15 to 19 years | 0 (0.0%) | 0 (0.0%) |
| 20 to 34 years | 4 (13.3%) | 26 (86.7%) |
| 35 to 50 years | 0 (0.0%) | 0 (0.0%) |
| Total | 4 (13.3%) | 26 (86.7%) |
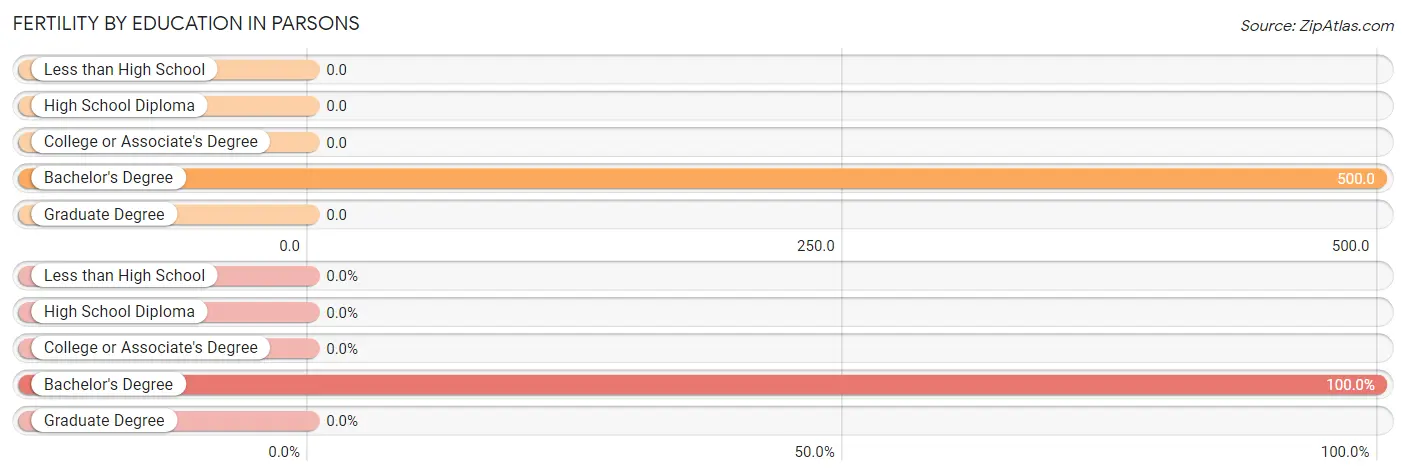
Fertility by Education in Parsons
| Educational Attainment | Women with Births | Births / 1,000 Women |
| Less than High School | 0 (0.0%) | 0.0 |
| High School Diploma | 0 (0.0%) | 0.0 |
| College or Associate's Degree | 0 (0.0%) | 0.0 |
| Bachelor's Degree | 30 (100.0%) | 500.0 |
| Graduate Degree | 0 (0.0%) | 0.0 |
| Total | 30 (100.0%) | 69.0 |
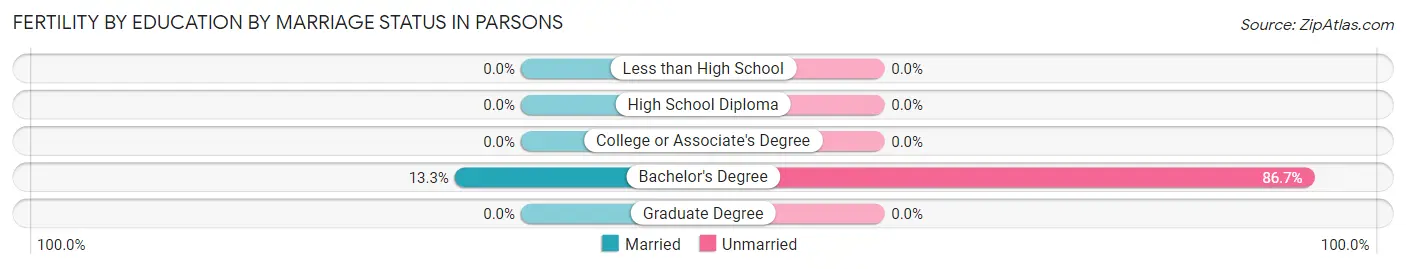
Fertility by Education by Marriage Status in Parsons
86.7% of women with births in Parsons are unmarried. Women with the educational attainment of bachelor's degree are most likely to be married with 13.3% of them married at childbirth, while women with the educational attainment of bachelor's degree are least likely to be married with 86.7% of them unmarried at childbirth.
| Educational Attainment | Married | Unmarried |
| Less than High School | 0 (0.0%) | 0 (0.0%) |
| High School Diploma | 0 (0.0%) | 0 (0.0%) |
| College or Associate's Degree | 0 (0.0%) | 0 (0.0%) |
| Bachelor's Degree | 4 (13.3%) | 26 (86.7%) |
| Graduate Degree | 0 (0.0%) | 0 (0.0%) |
| Total | 4 (13.3%) | 26 (86.7%) |
Employment Characteristics in Parsons
Employment by Class of Employer in Parsons
Among the 962 employed individuals in Parsons, private company employees (688 | 71.5%), self-employed (not incorporated) (115 | 11.9%), and local government employees (93 | 9.7%) make up the most common classes of employment.
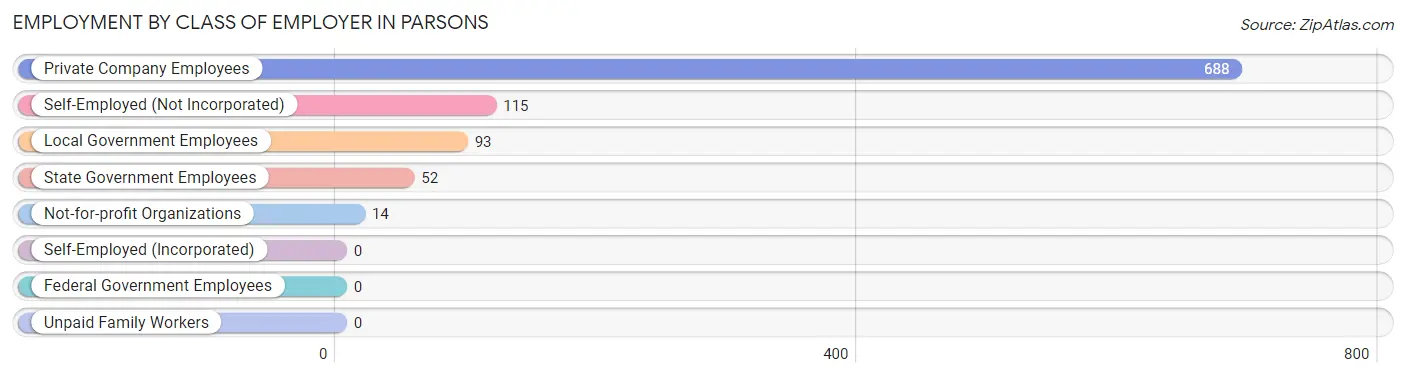
| Employer Class | # Employees | % Employees |
| Private Company Employees | 688 | 71.5% |
| Self-Employed (Incorporated) | 0 | 0.0% |
| Self-Employed (Not Incorporated) | 115 | 11.9% |
| Not-for-profit Organizations | 14 | 1.5% |
| Local Government Employees | 93 | 9.7% |
| State Government Employees | 52 | 5.4% |
| Federal Government Employees | 0 | 0.0% |
| Unpaid Family Workers | 0 | 0.0% |
| Total | 962 | 100.0% |
Employment Status by Age in Parsons
According to the labor force statistics for Parsons, out of the total population over 16 years of age (2,053), 50.9% or 1,045 individuals are in the labor force, with 7.2% or 75 of them unemployed. The age group with the highest labor force participation rate is 25 to 29 years, with 95.4% or 209 individuals in the labor force. Within the labor force, the 20 to 24 years age range has the highest percentage of unemployed individuals, with 20.3% or 25 of them being unemployed.
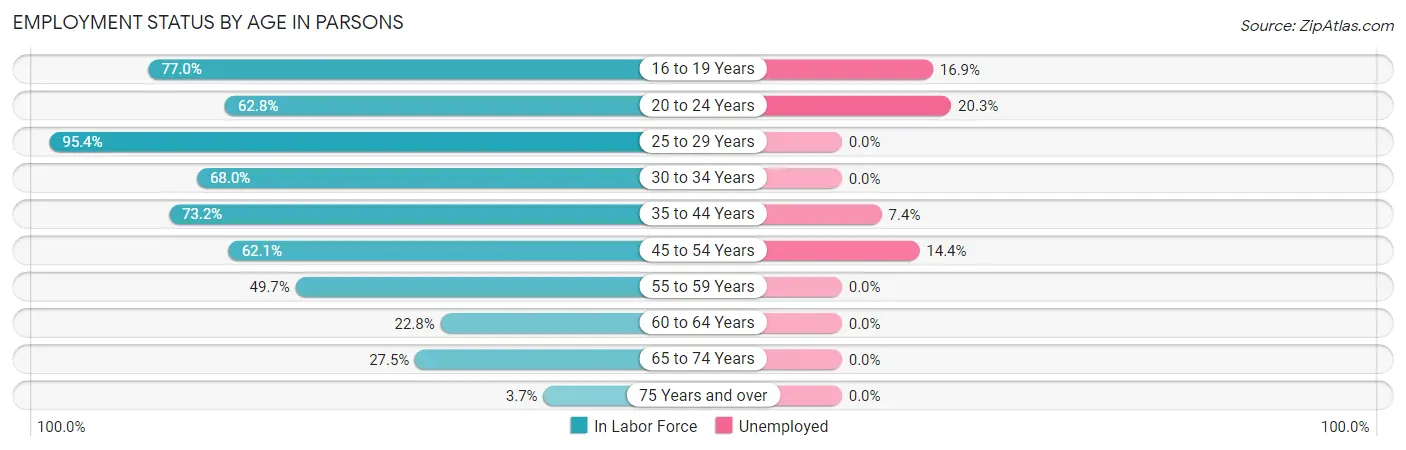
| Age Bracket | In Labor Force | Unemployed |
| 16 to 19 Years | 77 (77.0%) | 13 (16.9%) |
| 20 to 24 Years | 123 (62.8%) | 25 (20.3%) |
| 25 to 29 Years | 209 (95.4%) | 0 (0.0%) |
| 30 to 34 Years | 68 (68.0%) | 0 (0.0%) |
| 35 to 44 Years | 229 (73.2%) | 17 (7.4%) |
| 45 to 54 Years | 139 (62.1%) | 20 (14.4%) |
| 55 to 59 Years | 82 (49.7%) | 0 (0.0%) |
| 60 to 64 Years | 38 (22.8%) | 0 (0.0%) |
| 65 to 74 Years | 68 (27.5%) | 0 (0.0%) |
| 75 Years and over | 12 (3.7%) | 0 (0.0%) |
| Total | 1,045 (50.9%) | 75 (7.2%) |
Employment Status by Educational Attainment in Parsons
According to labor force statistics for Parsons, 64.4% of individuals (765) out of the total population between 25 and 64 years of age (1,188) are in the labor force, with 4.8% or 37 of them being unemployed. The group with the highest labor force participation rate are those with the educational attainment of bachelor's degree or higher, with 91.2% or 62 individuals in the labor force. Within the labor force, individuals with less than high school education have the highest percentage of unemployment, with 43.6% or 17 of them being unemployed.
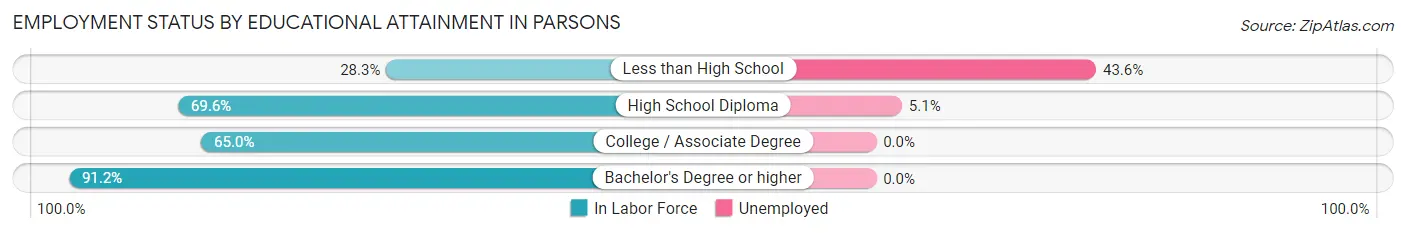
| Educational Attainment | In Labor Force | Unemployed |
| Less than High School | 39 (28.3%) | 60 (43.6%) |
| High School Diploma | 389 (69.6%) | 29 (5.1%) |
| College / Associate Degree | 275 (65.0%) | 0 (0.0%) |
| Bachelor's Degree or higher | 62 (91.2%) | 0 (0.0%) |
| Total | 765 (64.4%) | 57 (4.8%) |
Employment Occupations by Sex in Parsons
Management, Business, Science and Arts Occupations
The most common Management, Business, Science and Arts occupations in Parsons are Health Diagnosing & Treating (59 | 6.1%), Community & Social Service (52 | 5.4%), Education, Arts & Media (43 | 4.4%), Management (37 | 3.8%), and Health Technologists (32 | 3.3%).
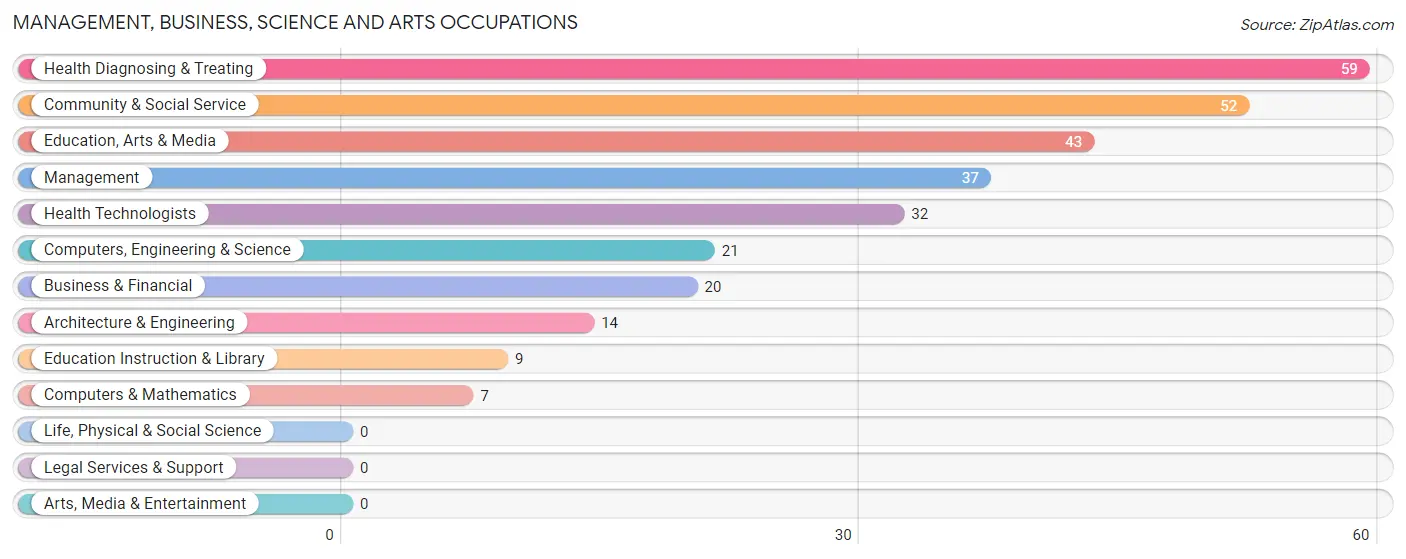
Management, Business, Science and Arts Occupations by Sex
Within the Management, Business, Science and Arts occupations in Parsons, the most male-oriented occupations are Computers, Engineering & Science (100.0%), Computers & Mathematics (100.0%), and Architecture & Engineering (100.0%), while the most female-oriented occupations are Education, Arts & Media (100.0%), Community & Social Service (90.4%), and Health Technologists (87.5%).
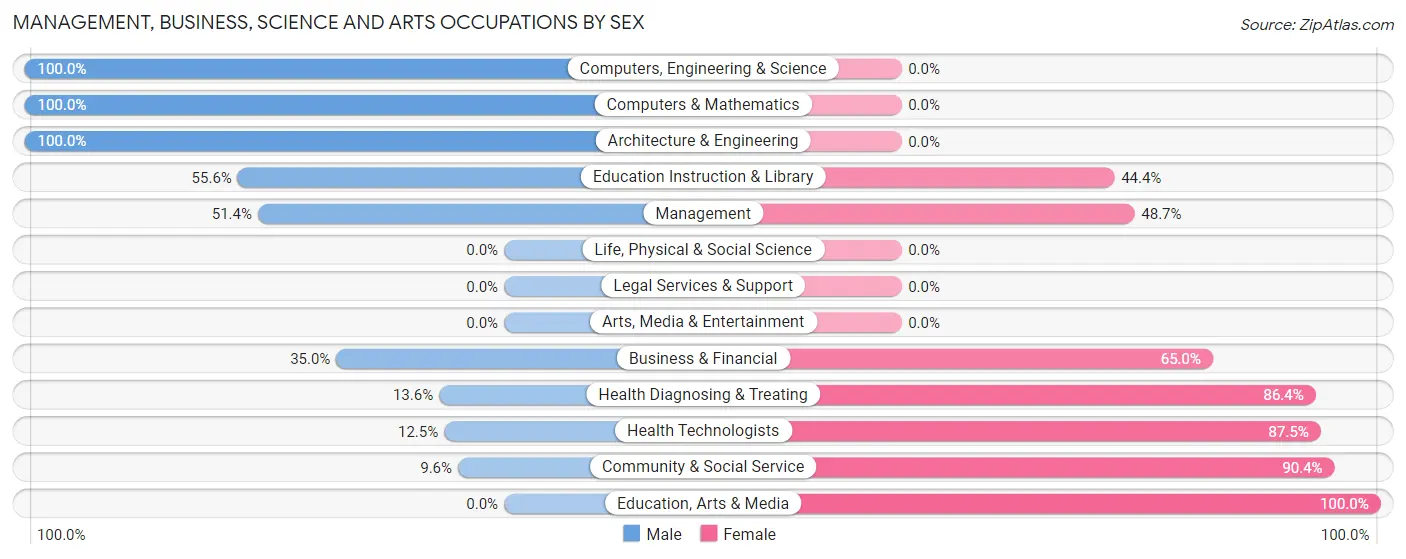
| Occupation | Male | Female |
| Management | 19 (51.3%) | 18 (48.6%) |
| Business & Financial | 7 (35.0%) | 13 (65.0%) |
| Computers, Engineering & Science | 21 (100.0%) | 0 (0.0%) |
| Computers & Mathematics | 7 (100.0%) | 0 (0.0%) |
| Architecture & Engineering | 14 (100.0%) | 0 (0.0%) |
| Life, Physical & Social Science | 0 (0.0%) | 0 (0.0%) |
| Community & Social Service | 5 (9.6%) | 47 (90.4%) |
| Education, Arts & Media | 0 (0.0%) | 43 (100.0%) |
| Legal Services & Support | 0 (0.0%) | 0 (0.0%) |
| Education Instruction & Library | 5 (55.6%) | 4 (44.4%) |
| Arts, Media & Entertainment | 0 (0.0%) | 0 (0.0%) |
| Health Diagnosing & Treating | 8 (13.6%) | 51 (86.4%) |
| Health Technologists | 4 (12.5%) | 28 (87.5%) |
| Total (Category) | 60 (31.8%) | 129 (68.2%) |
| Total (Overall) | 521 (53.7%) | 449 (46.3%) |
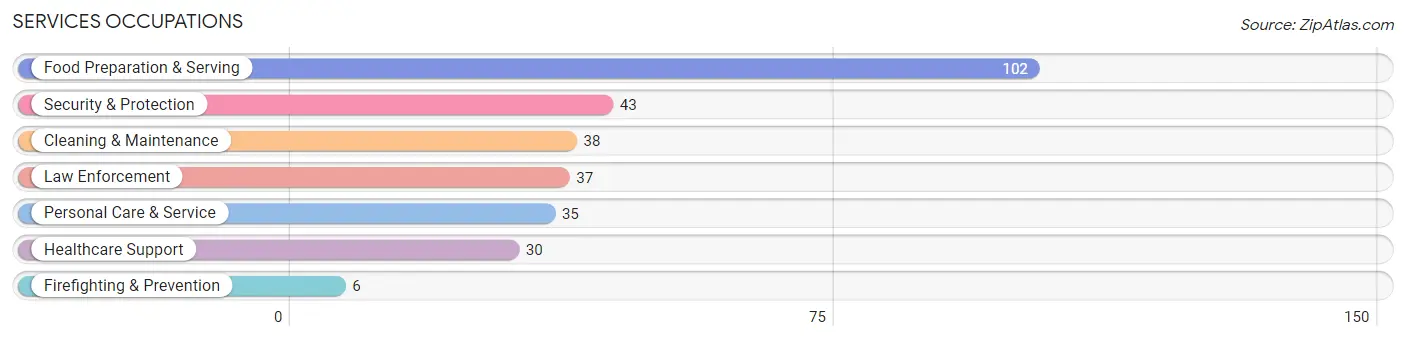
Services Occupations
The most common Services occupations in Parsons are Food Preparation & Serving (102 | 10.5%), Security & Protection (43 | 4.4%), Cleaning & Maintenance (38 | 3.9%), Law Enforcement (37 | 3.8%), and Personal Care & Service (35 | 3.6%).
Services Occupations by Sex
Within the Services occupations in Parsons, the most male-oriented occupations are Firefighting & Prevention (100.0%), Security & Protection (62.8%), and Law Enforcement (56.8%), while the most female-oriented occupations are Healthcare Support (100.0%), Personal Care & Service (100.0%), and Cleaning & Maintenance (92.1%).
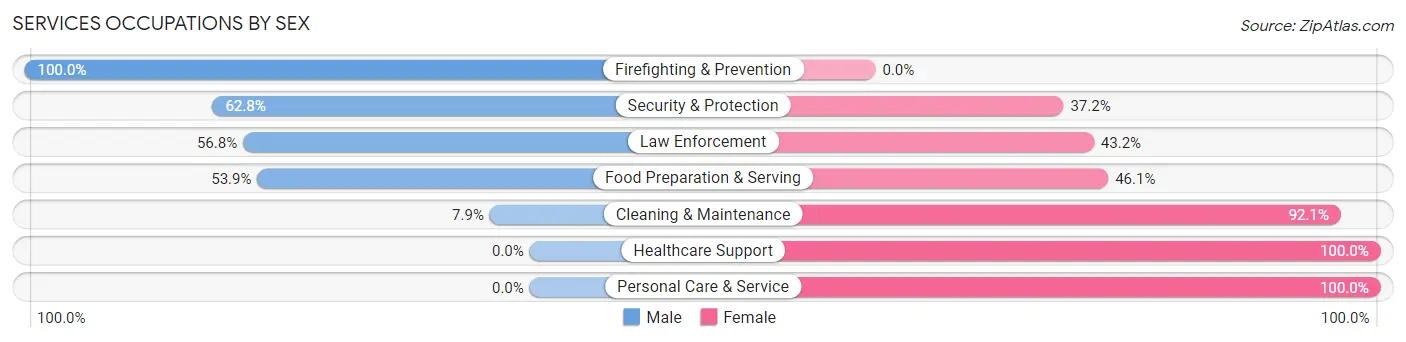
| Occupation | Male | Female |
| Healthcare Support | 0 (0.0%) | 30 (100.0%) |
| Security & Protection | 27 (62.8%) | 16 (37.2%) |
| Firefighting & Prevention | 6 (100.0%) | 0 (0.0%) |
| Law Enforcement | 21 (56.8%) | 16 (43.2%) |
| Food Preparation & Serving | 55 (53.9%) | 47 (46.1%) |
| Cleaning & Maintenance | 3 (7.9%) | 35 (92.1%) |
| Personal Care & Service | 0 (0.0%) | 35 (100.0%) |
| Total (Category) | 85 (34.3%) | 163 (65.7%) |
| Total (Overall) | 521 (53.7%) | 449 (46.3%) |
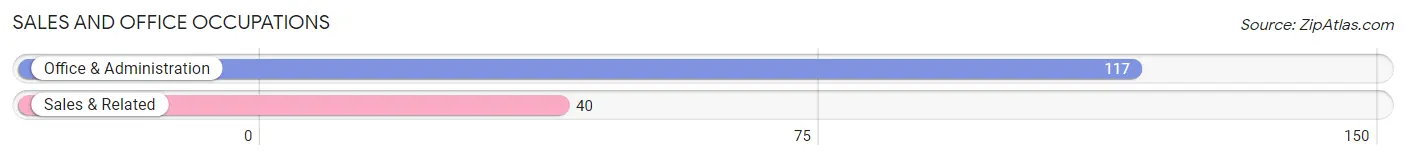
Sales and Office Occupations
The most common Sales and Office occupations in Parsons are Office & Administration (117 | 12.1%), and Sales & Related (40 | 4.1%).
Sales and Office Occupations by Sex
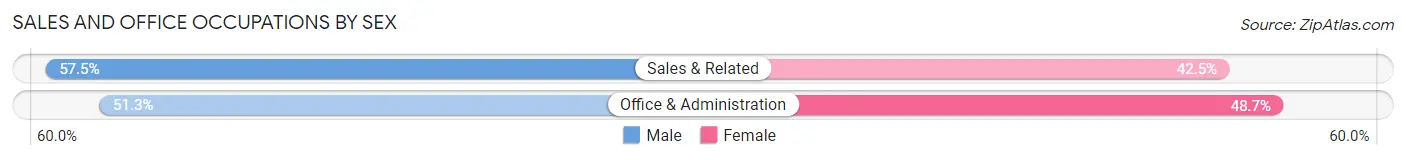
| Occupation | Male | Female |
| Sales & Related | 23 (57.5%) | 17 (42.5%) |
| Office & Administration | 60 (51.3%) | 57 (48.7%) |
| Total (Category) | 83 (52.9%) | 74 (47.1%) |
| Total (Overall) | 521 (53.7%) | 449 (46.3%) |
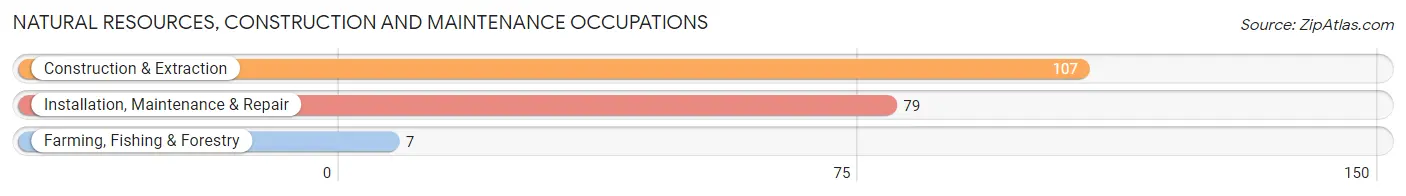
Natural Resources, Construction and Maintenance Occupations
The most common Natural Resources, Construction and Maintenance occupations in Parsons are Construction & Extraction (107 | 11.0%), Installation, Maintenance & Repair (79 | 8.1%), and Farming, Fishing & Forestry (7 | 0.7%).
Natural Resources, Construction and Maintenance Occupations by Sex
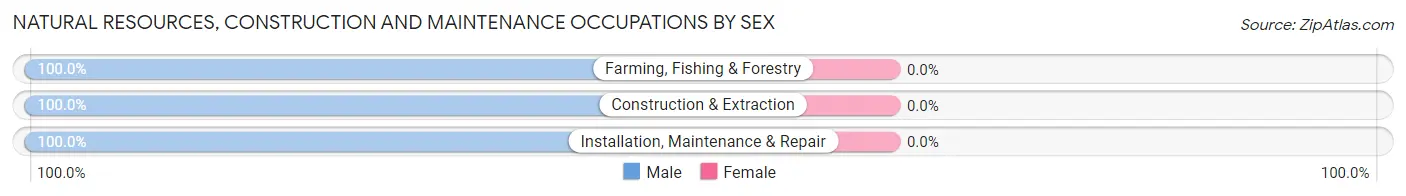
| Occupation | Male | Female |
| Farming, Fishing & Forestry | 7 (100.0%) | 0 (0.0%) |
| Construction & Extraction | 107 (100.0%) | 0 (0.0%) |
| Installation, Maintenance & Repair | 79 (100.0%) | 0 (0.0%) |
| Total (Category) | 193 (100.0%) | 0 (0.0%) |
| Total (Overall) | 521 (53.7%) | 449 (46.3%) |
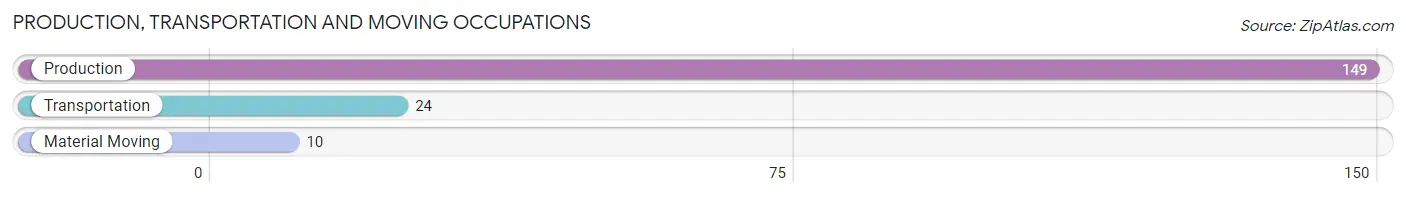
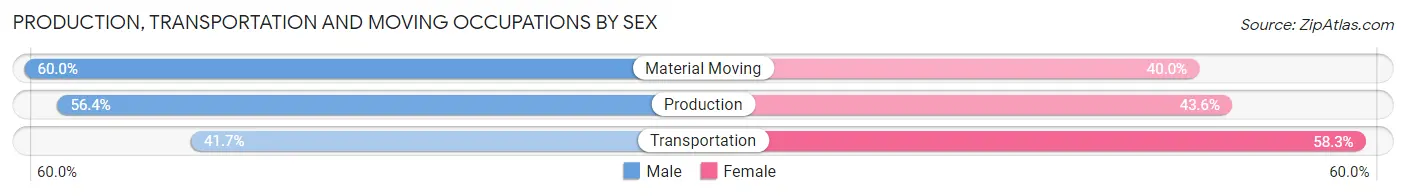
Production, Transportation and Moving Occupations
The most common Production, Transportation and Moving occupations in Parsons are Production (149 | 15.4%), Transportation (24 | 2.5%), and Material Moving (10 | 1.0%).
Production, Transportation and Moving Occupations by Sex
| Occupation | Male | Female |
| Production | 84 (56.4%) | 65 (43.6%) |
| Transportation | 10 (41.7%) | 14 (58.3%) |
| Material Moving | 6 (60.0%) | 4 (40.0%) |
| Total (Category) | 100 (54.6%) | 83 (45.4%) |
| Total (Overall) | 521 (53.7%) | 449 (46.3%) |
Employment Industries by Sex in Parsons
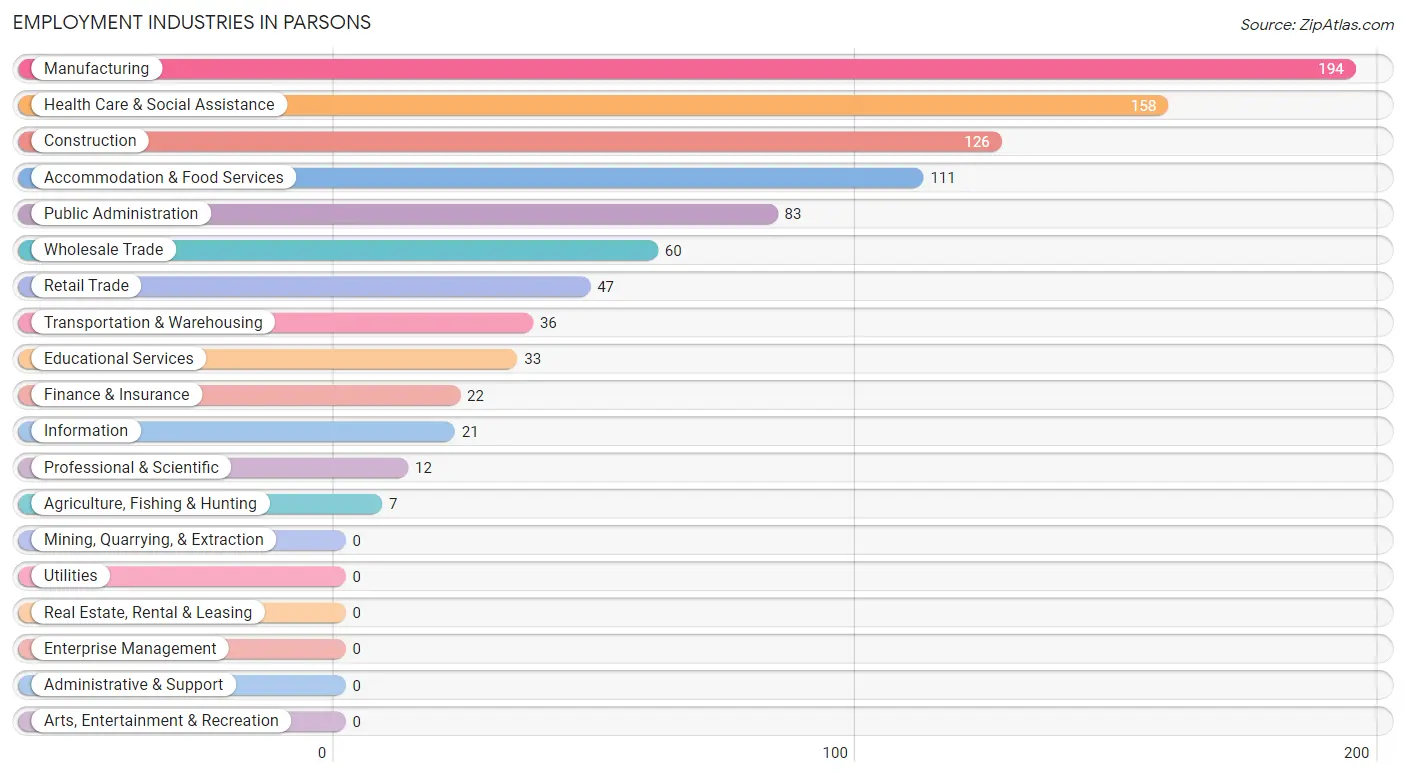
Employment Industries in Parsons
The major employment industries in Parsons include Manufacturing (194 | 20.0%), Health Care & Social Assistance (158 | 16.3%), Construction (126 | 13.0%), Accommodation & Food Services (111 | 11.4%), and Public Administration (83 | 8.6%).
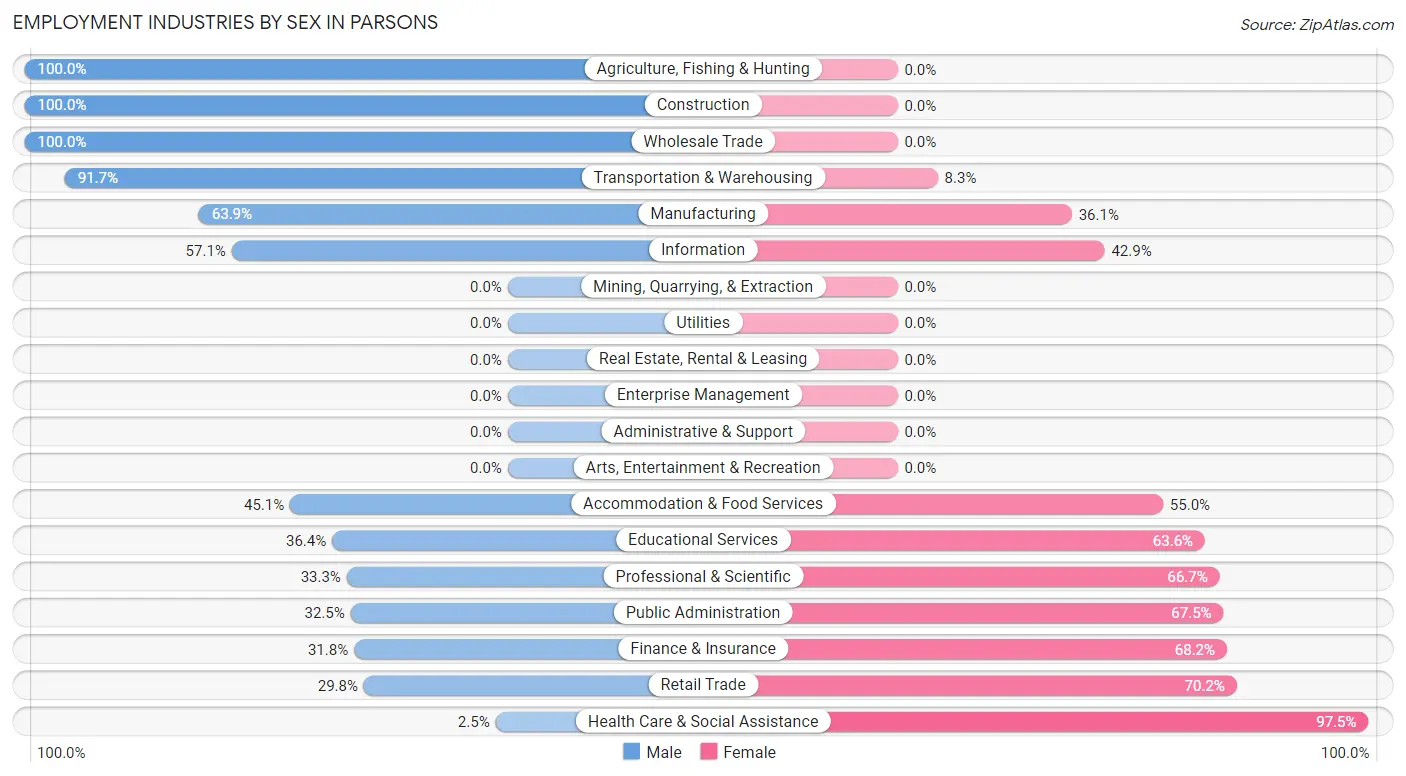
Employment Industries by Sex in Parsons
The Parsons industries that see more men than women are Agriculture, Fishing & Hunting (100.0%), Construction (100.0%), and Wholesale Trade (100.0%), whereas the industries that tend to have a higher number of women are Health Care & Social Assistance (97.5%), Retail Trade (70.2%), and Finance & Insurance (68.2%).
| Industry | Male | Female |
| Agriculture, Fishing & Hunting | 7 (100.0%) | 0 (0.0%) |
| Mining, Quarrying, & Extraction | 0 (0.0%) | 0 (0.0%) |
| Construction | 126 (100.0%) | 0 (0.0%) |
| Manufacturing | 124 (63.9%) | 70 (36.1%) |
| Wholesale Trade | 60 (100.0%) | 0 (0.0%) |
| Retail Trade | 14 (29.8%) | 33 (70.2%) |
| Transportation & Warehousing | 33 (91.7%) | 3 (8.3%) |
| Utilities | 0 (0.0%) | 0 (0.0%) |
| Information | 12 (57.1%) | 9 (42.9%) |
| Finance & Insurance | 7 (31.8%) | 15 (68.2%) |
| Real Estate, Rental & Leasing | 0 (0.0%) | 0 (0.0%) |
| Professional & Scientific | 4 (33.3%) | 8 (66.7%) |
| Enterprise Management | 0 (0.0%) | 0 (0.0%) |
| Administrative & Support | 0 (0.0%) | 0 (0.0%) |
| Educational Services | 12 (36.4%) | 21 (63.6%) |
| Health Care & Social Assistance | 4 (2.5%) | 154 (97.5%) |
| Arts, Entertainment & Recreation | 0 (0.0%) | 0 (0.0%) |
| Accommodation & Food Services | 50 (45.1%) | 61 (54.9%) |
| Public Administration | 27 (32.5%) | 56 (67.5%) |
| Total | 521 (53.7%) | 449 (46.3%) |
Education in Parsons
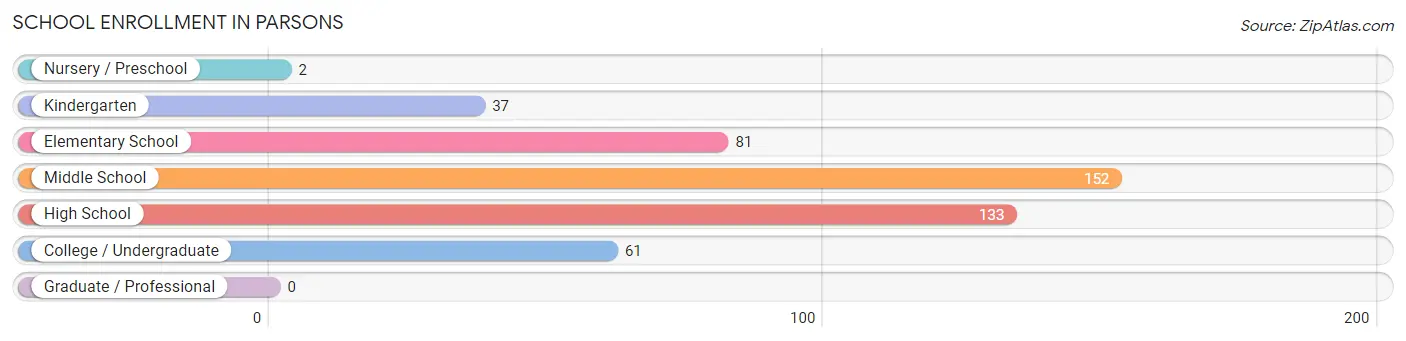
School Enrollment in Parsons
The most common levels of schooling among the 466 students in Parsons are middle school (152 | 32.6%), high school (133 | 28.5%), and elementary school (81 | 17.4%).
| School Level | # Students | % Students |
| Nursery / Preschool | 2 | 0.4% |
| Kindergarten | 37 | 7.9% |
| Elementary School | 81 | 17.4% |
| Middle School | 152 | 32.6% |
| High School | 133 | 28.5% |
| College / Undergraduate | 61 | 13.1% |
| Graduate / Professional | 0 | 0.0% |
| Total | 466 | 100.0% |
School Enrollment by Age by Funding Source in Parsons
Out of a total of 466 students who are enrolled in schools in Parsons, 82 (17.6%) attend a private institution, while the remaining 384 (82.4%) are enrolled in public schools. The age group of 18 to 19 year olds has the highest likelihood of being enrolled in private schools, with 7 (30.4% in the age bracket) enrolled. Conversely, the age group of 3 to 4 year olds has the lowest likelihood of being enrolled in a private school, with 2 (100.0% in the age bracket) attending a public institution.
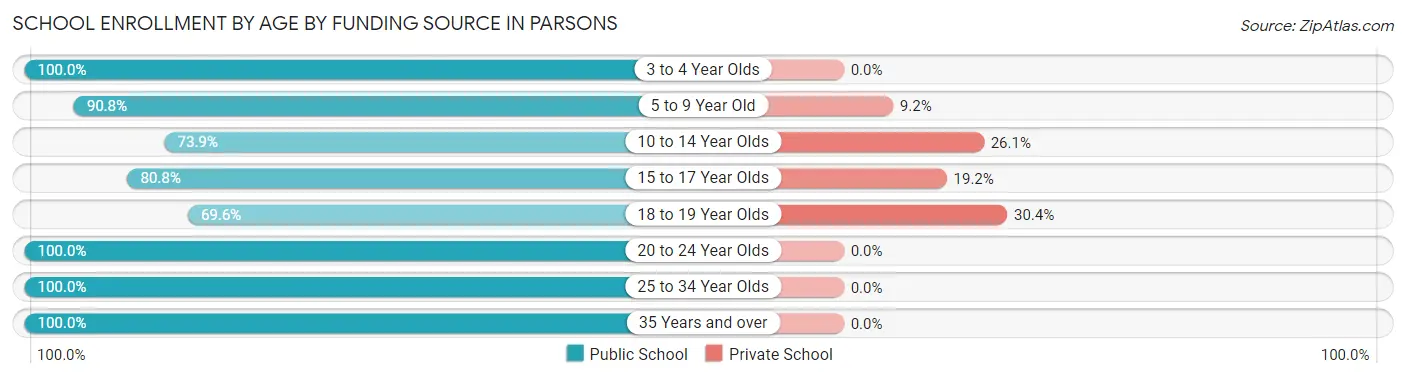
| Age Bracket | Public School | Private School |
| 3 to 4 Year Olds | 2 (100.0%) | 0 (0.0%) |
| 5 to 9 Year Old | 99 (90.8%) | 10 (9.2%) |
| 10 to 14 Year Olds | 119 (73.9%) | 42 (26.1%) |
| 15 to 17 Year Olds | 97 (80.8%) | 23 (19.2%) |
| 18 to 19 Year Olds | 16 (69.6%) | 7 (30.4%) |
| 20 to 24 Year Olds | 31 (100.0%) | 0 (0.0%) |
| 25 to 34 Year Olds | 10 (100.0%) | 0 (0.0%) |
| 35 Years and over | 10 (100.0%) | 0 (0.0%) |
| Total | 384 (82.4%) | 82 (17.6%) |
Educational Attainment by Field of Study in Parsons
Education (38 | 25.2%), social sciences (21 | 13.9%), business (19 | 12.6%), bio, nature & agricultural (16 | 10.6%), and liberal arts & history (13 | 8.6%) are the most common fields of study among 151 individuals in Parsons who have obtained a bachelor's degree or higher.
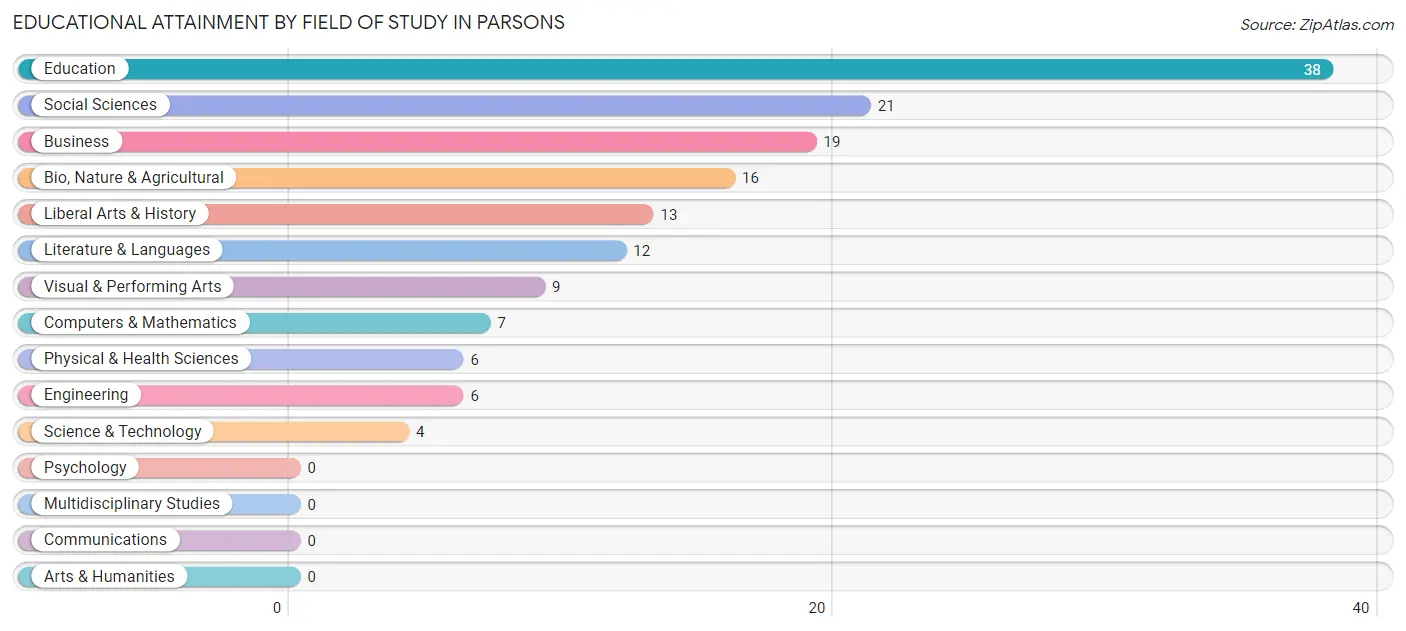
| Field of Study | # Graduates | % Graduates |
| Computers & Mathematics | 7 | 4.6% |
| Bio, Nature & Agricultural | 16 | 10.6% |
| Physical & Health Sciences | 6 | 4.0% |
| Psychology | 0 | 0.0% |
| Social Sciences | 21 | 13.9% |
| Engineering | 6 | 4.0% |
| Multidisciplinary Studies | 0 | 0.0% |
| Science & Technology | 4 | 2.6% |
| Business | 19 | 12.6% |
| Education | 38 | 25.2% |
| Literature & Languages | 12 | 8.0% |
| Liberal Arts & History | 13 | 8.6% |
| Visual & Performing Arts | 9 | 6.0% |
| Communications | 0 | 0.0% |
| Arts & Humanities | 0 | 0.0% |
| Total | 151 | 100.0% |
Transportation & Commute in Parsons
Vehicle Availability by Sex in Parsons
The most prevalent vehicle ownership categories in Parsons are males with 2 vehicles (295, accounting for 56.6%) and females with 2 vehicles (243, making up 66.9%).
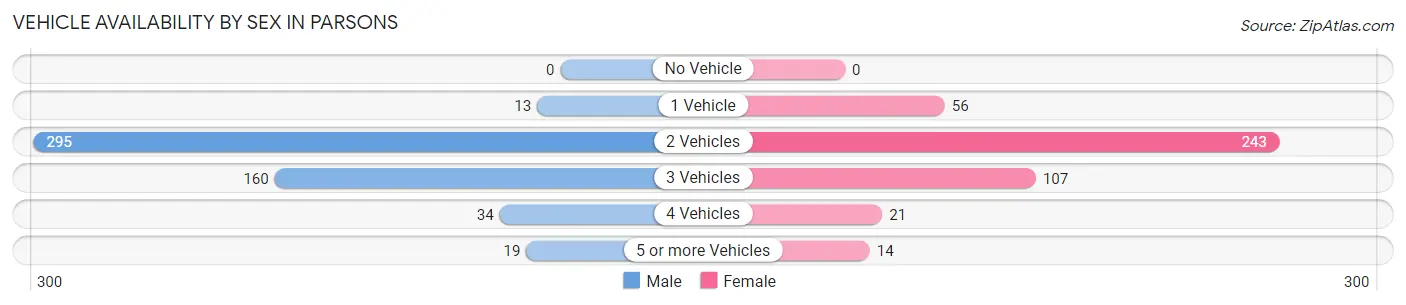
| Vehicles Available | Male | Female |
| No Vehicle | 0 (0.0%) | 0 (0.0%) |
| 1 Vehicle | 13 (2.5%) | 56 (12.7%) |
| 2 Vehicles | 295 (56.6%) | 243 (55.1%) |
| 3 Vehicles | 160 (30.7%) | 107 (24.3%) |
| 4 Vehicles | 34 (6.5%) | 21 (4.8%) |
| 5 or more Vehicles | 19 (3.6%) | 14 (3.2%) |
| Total | 521 (100.0%) | 441 (100.0%) |
Commute Time in Parsons
The most frequently occuring commute durations in Parsons are 10 to 14 minutes (203 commuters, 24.3%), 20 to 24 minutes (133 commuters, 15.9%), and less than 5 minutes (115 commuters, 13.8%).
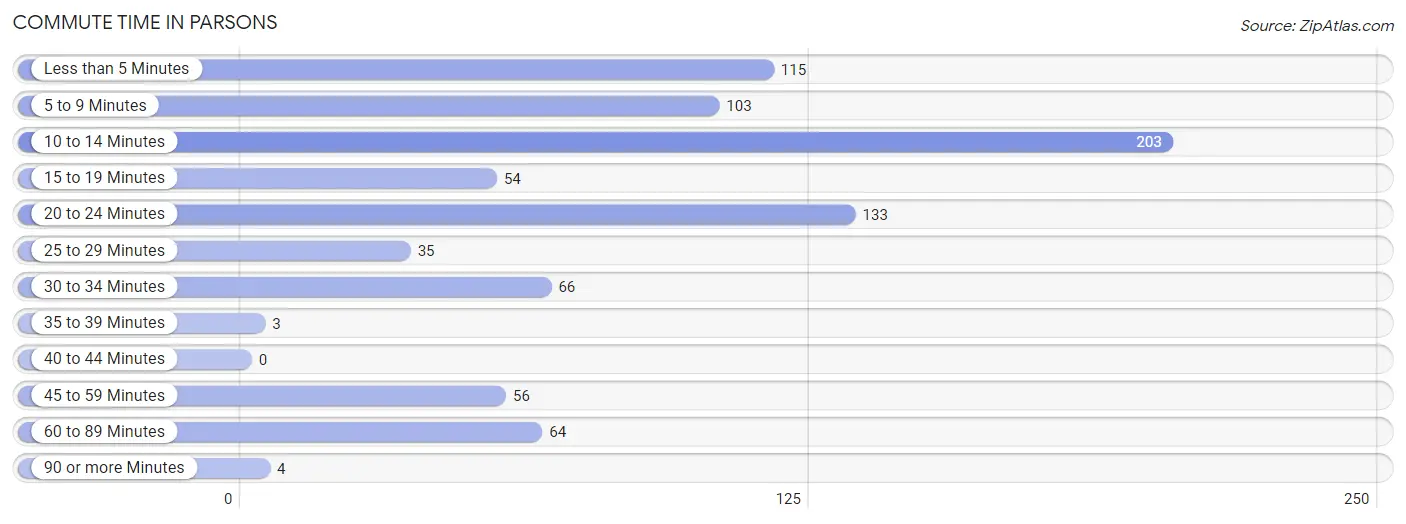
| Commute Time | # Commuters | % Commuters |
| Less than 5 Minutes | 115 | 13.8% |
| 5 to 9 Minutes | 103 | 12.3% |
| 10 to 14 Minutes | 203 | 24.3% |
| 15 to 19 Minutes | 54 | 6.5% |
| 20 to 24 Minutes | 133 | 15.9% |
| 25 to 29 Minutes | 35 | 4.2% |
| 30 to 34 Minutes | 66 | 7.9% |
| 35 to 39 Minutes | 3 | 0.4% |
| 40 to 44 Minutes | 0 | 0.0% |
| 45 to 59 Minutes | 56 | 6.7% |
| 60 to 89 Minutes | 64 | 7.7% |
| 90 or more Minutes | 4 | 0.5% |
Commute Time by Sex in Parsons
The most common commute times in Parsons are 10 to 14 minutes (113 commuters, 22.5%) for males and 10 to 14 minutes (90 commuters, 27.0%) for females.
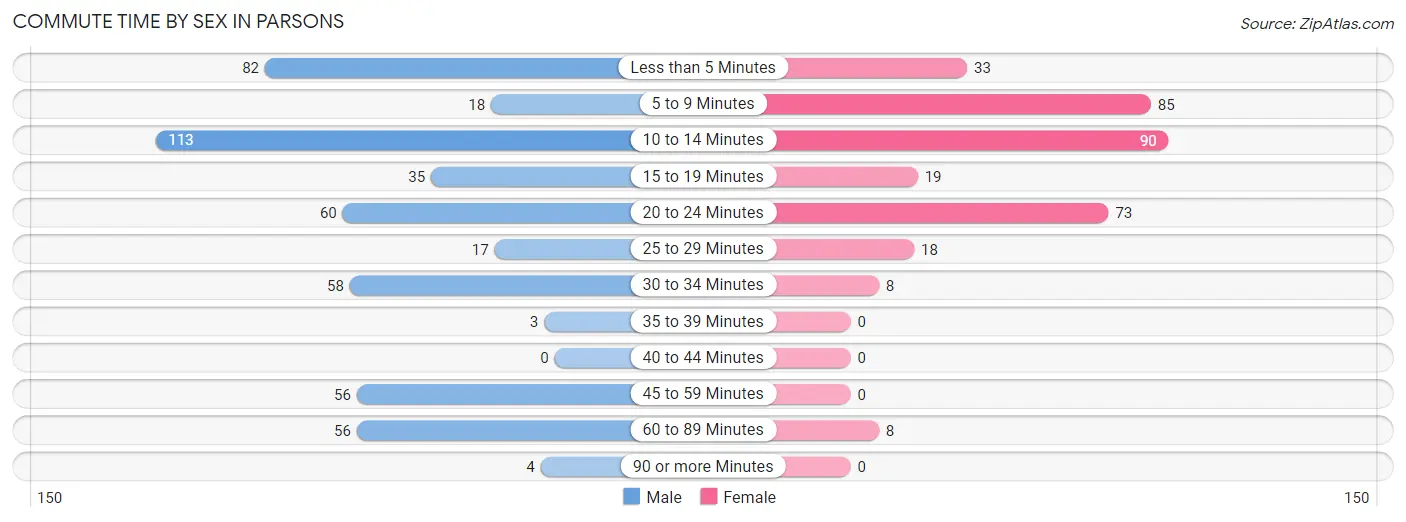
| Commute Time | Male | Female |
| Less than 5 Minutes | 82 (16.3%) | 33 (9.9%) |
| 5 to 9 Minutes | 18 (3.6%) | 85 (25.5%) |
| 10 to 14 Minutes | 113 (22.5%) | 90 (27.0%) |
| 15 to 19 Minutes | 35 (7.0%) | 19 (5.7%) |
| 20 to 24 Minutes | 60 (11.9%) | 73 (21.9%) |
| 25 to 29 Minutes | 17 (3.4%) | 18 (5.4%) |
| 30 to 34 Minutes | 58 (11.6%) | 8 (2.4%) |
| 35 to 39 Minutes | 3 (0.6%) | 0 (0.0%) |
| 40 to 44 Minutes | 0 (0.0%) | 0 (0.0%) |
| 45 to 59 Minutes | 56 (11.2%) | 0 (0.0%) |
| 60 to 89 Minutes | 56 (11.2%) | 8 (2.4%) |
| 90 or more Minutes | 4 (0.8%) | 0 (0.0%) |
Time of Departure to Work by Sex in Parsons
The most frequent times of departure to work in Parsons are 6:30 AM to 6:59 AM (129, 25.7%) for males and 6:00 AM to 6:29 AM (93, 27.8%) for females.
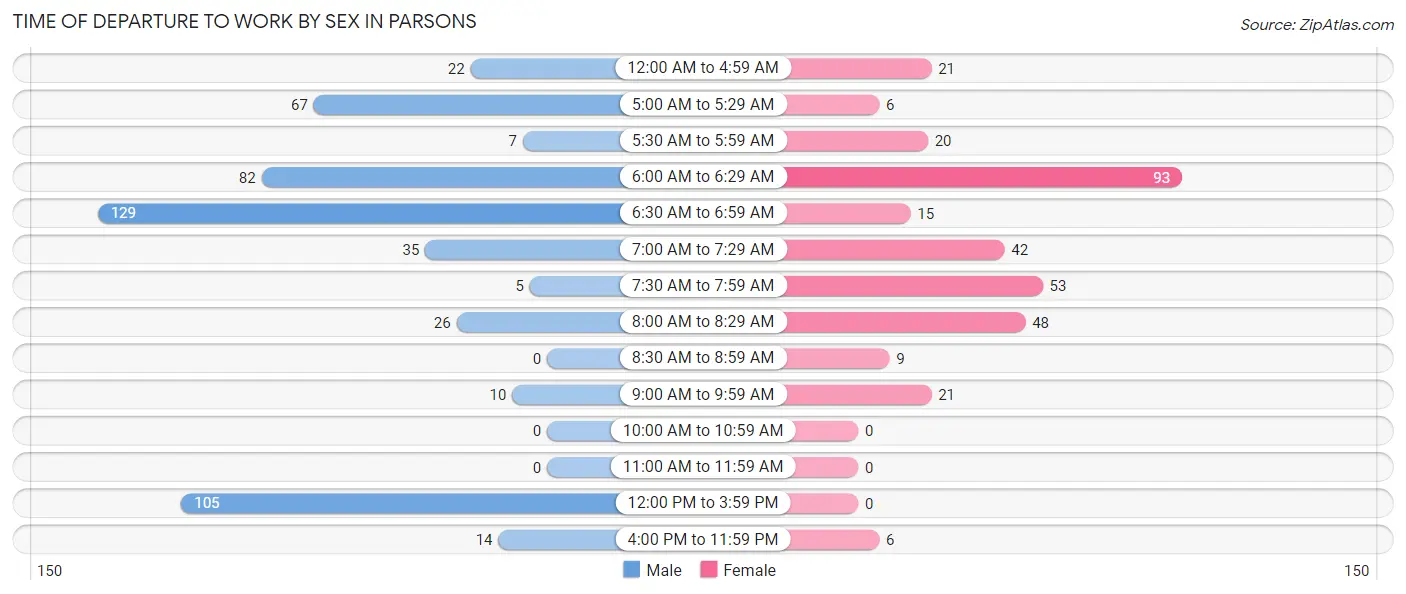
| Time of Departure | Male | Female |
| 12:00 AM to 4:59 AM | 22 (4.4%) | 21 (6.3%) |
| 5:00 AM to 5:29 AM | 67 (13.4%) | 6 (1.8%) |
| 5:30 AM to 5:59 AM | 7 (1.4%) | 20 (6.0%) |
| 6:00 AM to 6:29 AM | 82 (16.3%) | 93 (27.8%) |
| 6:30 AM to 6:59 AM | 129 (25.7%) | 15 (4.5%) |
| 7:00 AM to 7:29 AM | 35 (7.0%) | 42 (12.6%) |
| 7:30 AM to 7:59 AM | 5 (1.0%) | 53 (15.9%) |
| 8:00 AM to 8:29 AM | 26 (5.2%) | 48 (14.4%) |
| 8:30 AM to 8:59 AM | 0 (0.0%) | 9 (2.7%) |
| 9:00 AM to 9:59 AM | 10 (2.0%) | 21 (6.3%) |
| 10:00 AM to 10:59 AM | 0 (0.0%) | 0 (0.0%) |
| 11:00 AM to 11:59 AM | 0 (0.0%) | 0 (0.0%) |
| 12:00 PM to 3:59 PM | 105 (20.9%) | 0 (0.0%) |
| 4:00 PM to 11:59 PM | 14 (2.8%) | 6 (1.8%) |
| Total | 502 (100.0%) | 334 (100.0%) |
Housing Occupancy in Parsons
Occupancy by Ownership in Parsons
Of the total 986 dwellings in Parsons, owner-occupied units account for 646 (65.5%), while renter-occupied units make up 340 (34.5%).
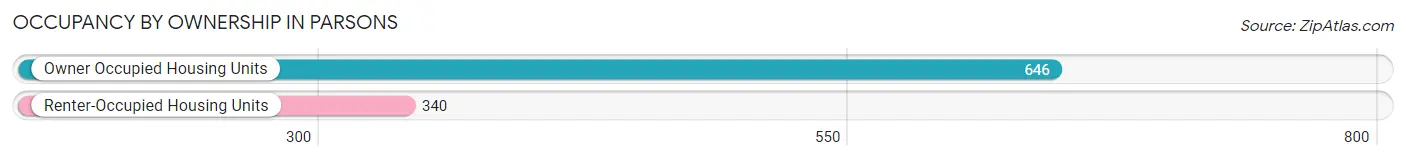
| Occupancy | # Housing Units | % Housing Units |
| Owner Occupied Housing Units | 646 | 65.5% |
| Renter-Occupied Housing Units | 340 | 34.5% |
| Total Occupied Housing Units | 986 | 100.0% |
Occupancy by Household Size in Parsons
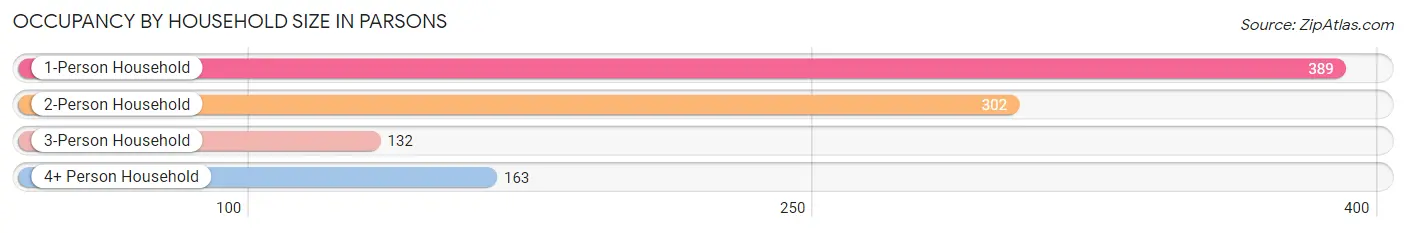
| Household Size | # Housing Units | % Housing Units |
| 1-Person Household | 389 | 39.5% |
| 2-Person Household | 302 | 30.6% |
| 3-Person Household | 132 | 13.4% |
| 4+ Person Household | 163 | 16.5% |
| Total Housing Units | 986 | 100.0% |
Occupancy by Ownership by Household Size in Parsons
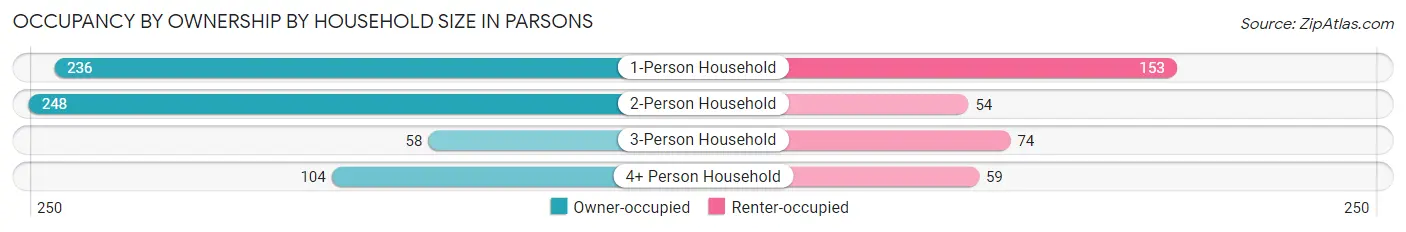
| Household Size | Owner-occupied | Renter-occupied |
| 1-Person Household | 236 (60.7%) | 153 (39.3%) |
| 2-Person Household | 248 (82.1%) | 54 (17.9%) |
| 3-Person Household | 58 (43.9%) | 74 (56.1%) |
| 4+ Person Household | 104 (63.8%) | 59 (36.2%) |
| Total Housing Units | 646 (65.5%) | 340 (34.5%) |
Occupancy by Educational Attainment in Parsons
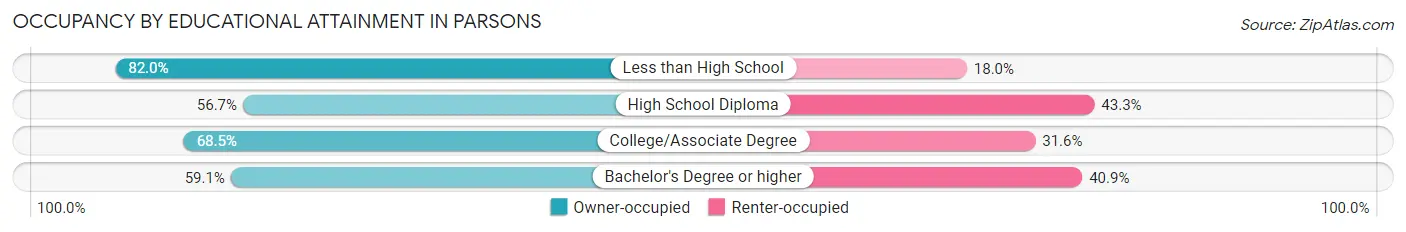
| Household Size | Owner-occupied | Renter-occupied |
| Less than High School | 146 (82.0%) | 32 (18.0%) |
| High School Diploma | 215 (56.7%) | 164 (43.3%) |
| College/Associate Degree | 230 (68.4%) | 106 (31.6%) |
| Bachelor's Degree or higher | 55 (59.1%) | 38 (40.9%) |
Occupancy by Age of Householder in Parsons
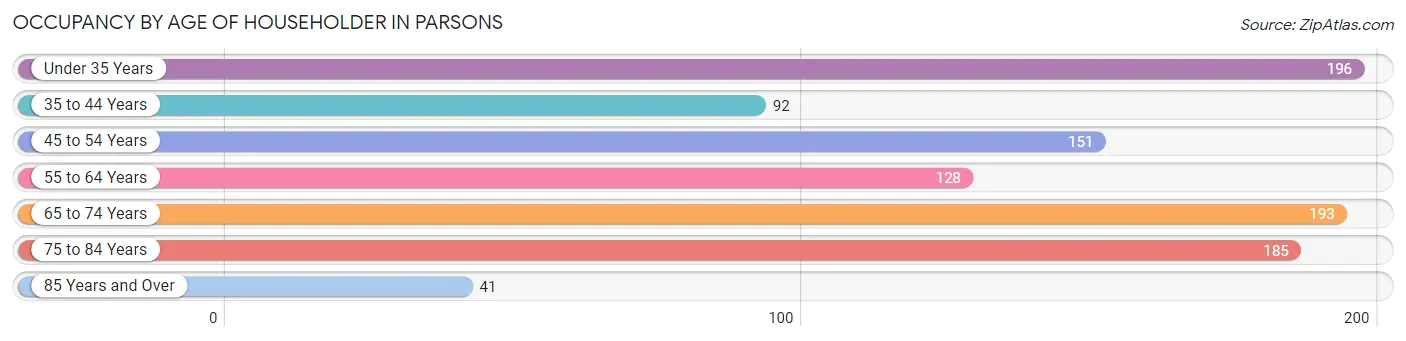
| Age Bracket | # Households | % Households |
| Under 35 Years | 196 | 19.9% |
| 35 to 44 Years | 92 | 9.3% |
| 45 to 54 Years | 151 | 15.3% |
| 55 to 64 Years | 128 | 13.0% |
| 65 to 74 Years | 193 | 19.6% |
| 75 to 84 Years | 185 | 18.8% |
| 85 Years and Over | 41 | 4.2% |
| Total | 986 | 100.0% |
Housing Finances in Parsons
Median Income by Occupancy in Parsons
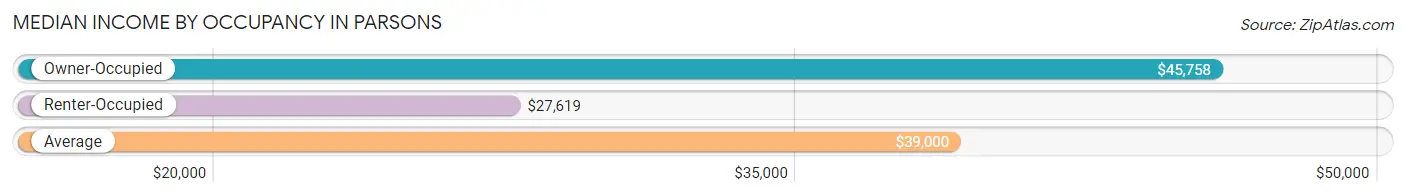
| Occupancy Type | # Households | Median Income |
| Owner-Occupied | 646 (65.5%) | $45,758 |
| Renter-Occupied | 340 (34.5%) | $27,619 |
| Average | 986 (100.0%) | $39,000 |
Occupancy by Householder Income Bracket in Parsons
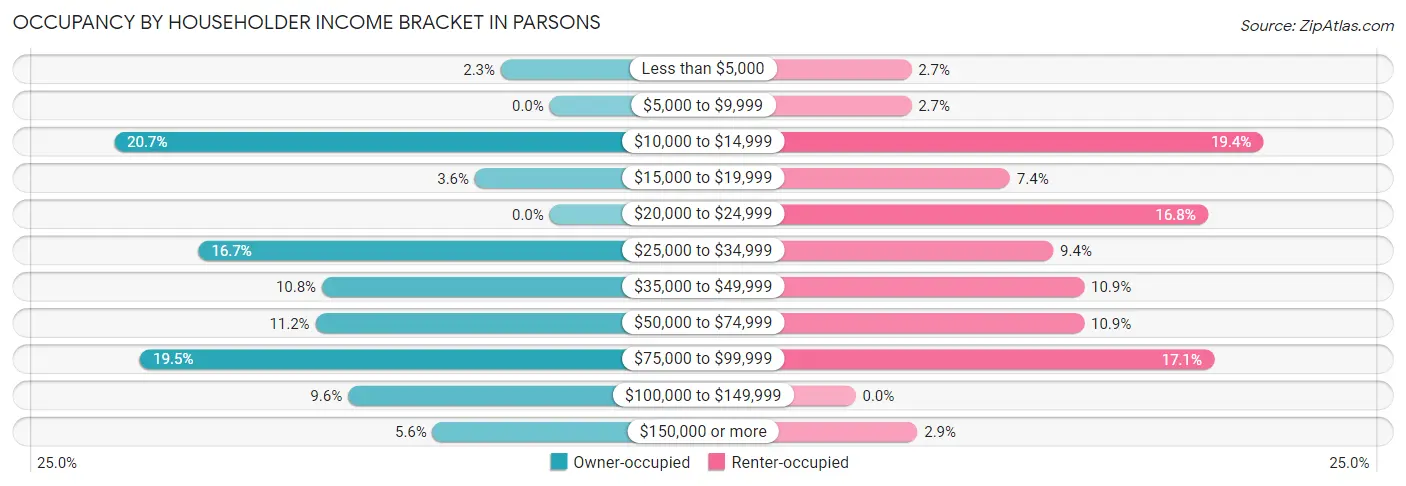
| Income Bracket | Owner-occupied | Renter-occupied |
| Less than $5,000 | 15 (2.3%) | 9 (2.6%) |
| $5,000 to $9,999 | 0 (0.0%) | 9 (2.6%) |
| $10,000 to $14,999 | 134 (20.7%) | 66 (19.4%) |
| $15,000 to $19,999 | 23 (3.6%) | 25 (7.3%) |
| $20,000 to $24,999 | 0 (0.0%) | 57 (16.8%) |
| $25,000 to $34,999 | 108 (16.7%) | 32 (9.4%) |
| $35,000 to $49,999 | 70 (10.8%) | 37 (10.9%) |
| $50,000 to $74,999 | 72 (11.2%) | 37 (10.9%) |
| $75,000 to $99,999 | 126 (19.5%) | 58 (17.1%) |
| $100,000 to $149,999 | 62 (9.6%) | 0 (0.0%) |
| $150,000 or more | 36 (5.6%) | 10 (2.9%) |
| Total | 646 (100.0%) | 340 (100.0%) |
Monthly Housing Cost Tiers in Parsons
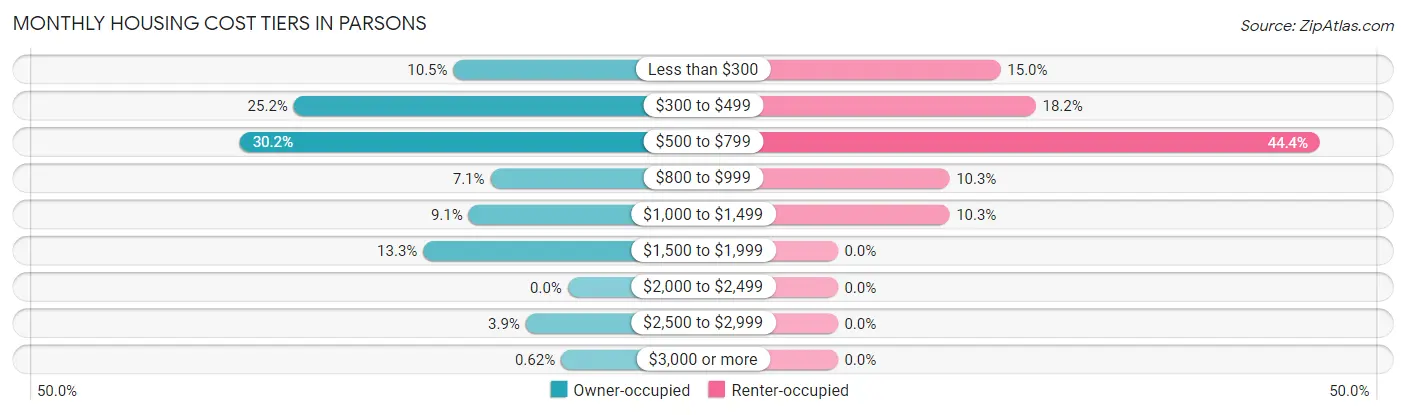
| Monthly Cost | Owner-occupied | Renter-occupied |
| Less than $300 | 68 (10.5%) | 51 (15.0%) |
| $300 to $499 | 163 (25.2%) | 62 (18.2%) |
| $500 to $799 | 195 (30.2%) | 151 (44.4%) |
| $800 to $999 | 46 (7.1%) | 35 (10.3%) |
| $1,000 to $1,499 | 59 (9.1%) | 35 (10.3%) |
| $1,500 to $1,999 | 86 (13.3%) | 0 (0.0%) |
| $2,000 to $2,499 | 0 (0.0%) | 0 (0.0%) |
| $2,500 to $2,999 | 25 (3.9%) | 0 (0.0%) |
| $3,000 or more | 4 (0.6%) | 0 (0.0%) |
| Total | 646 (100.0%) | 340 (100.0%) |
Physical Housing Characteristics in Parsons
Housing Structures in Parsons
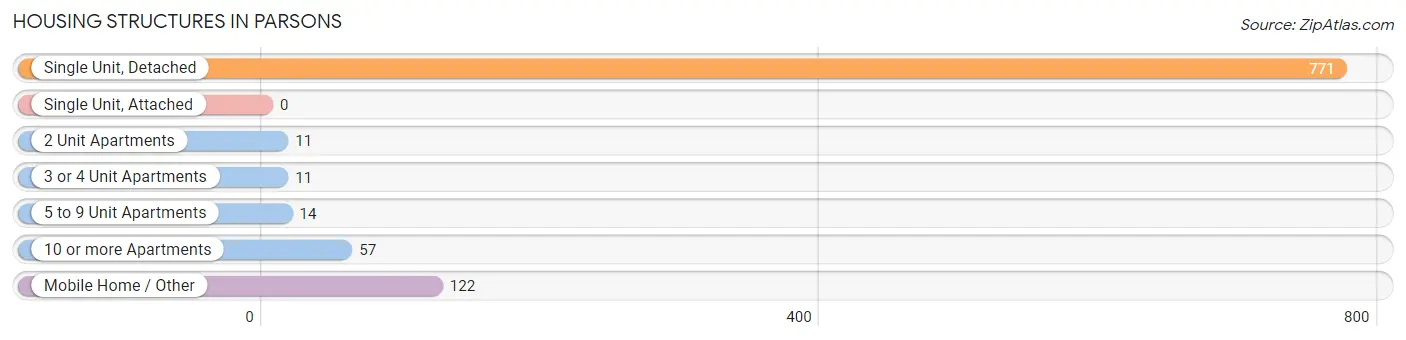
| Structure Type | # Housing Units | % Housing Units |
| Single Unit, Detached | 771 | 78.2% |
| Single Unit, Attached | 0 | 0.0% |
| 2 Unit Apartments | 11 | 1.1% |
| 3 or 4 Unit Apartments | 11 | 1.1% |
| 5 to 9 Unit Apartments | 14 | 1.4% |
| 10 or more Apartments | 57 | 5.8% |
| Mobile Home / Other | 122 | 12.4% |
| Total | 986 | 100.0% |
Housing Structures by Occupancy in Parsons
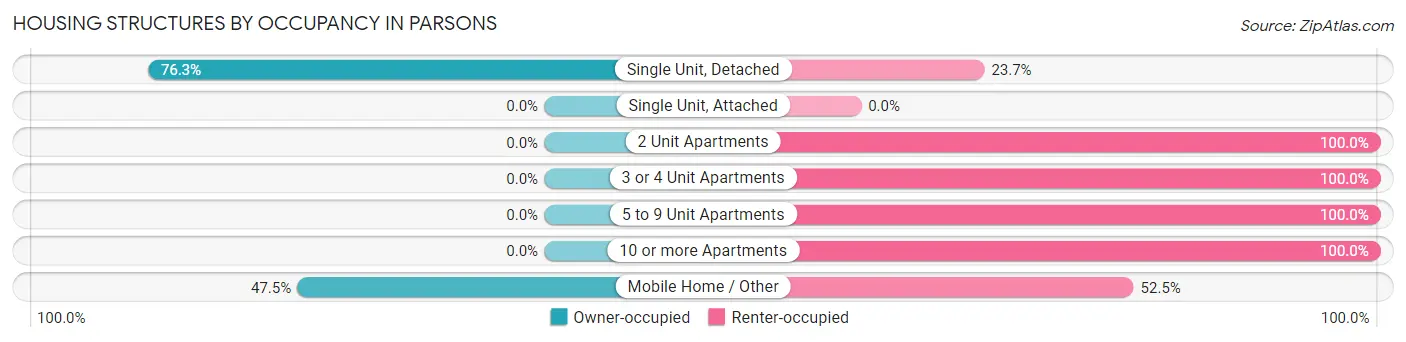
| Structure Type | Owner-occupied | Renter-occupied |
| Single Unit, Detached | 588 (76.3%) | 183 (23.7%) |
| Single Unit, Attached | 0 (0.0%) | 0 (0.0%) |
| 2 Unit Apartments | 0 (0.0%) | 11 (100.0%) |
| 3 or 4 Unit Apartments | 0 (0.0%) | 11 (100.0%) |
| 5 to 9 Unit Apartments | 0 (0.0%) | 14 (100.0%) |
| 10 or more Apartments | 0 (0.0%) | 57 (100.0%) |
| Mobile Home / Other | 58 (47.5%) | 64 (52.5%) |
| Total | 646 (65.5%) | 340 (34.5%) |
Housing Structures by Number of Rooms in Parsons
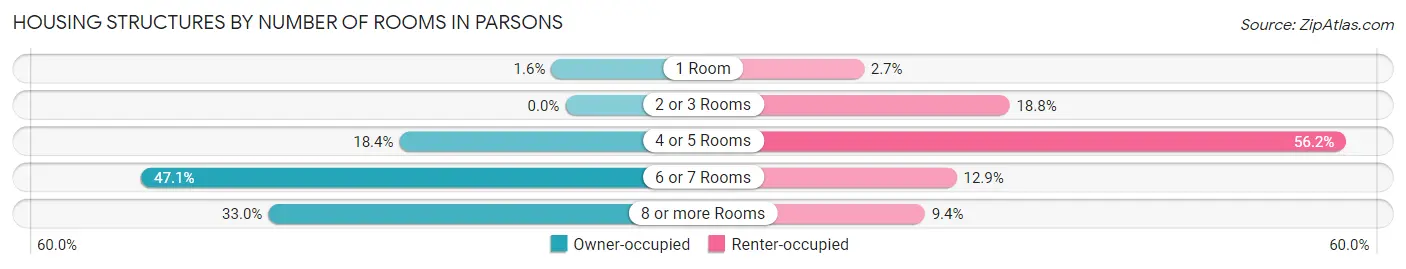
| Number of Rooms | Owner-occupied | Renter-occupied |
| 1 Room | 10 (1.5%) | 9 (2.6%) |
| 2 or 3 Rooms | 0 (0.0%) | 64 (18.8%) |
| 4 or 5 Rooms | 119 (18.4%) | 191 (56.2%) |
| 6 or 7 Rooms | 304 (47.1%) | 44 (12.9%) |
| 8 or more Rooms | 213 (33.0%) | 32 (9.4%) |
| Total | 646 (100.0%) | 340 (100.0%) |
Housing Structure by Heating Type in Parsons
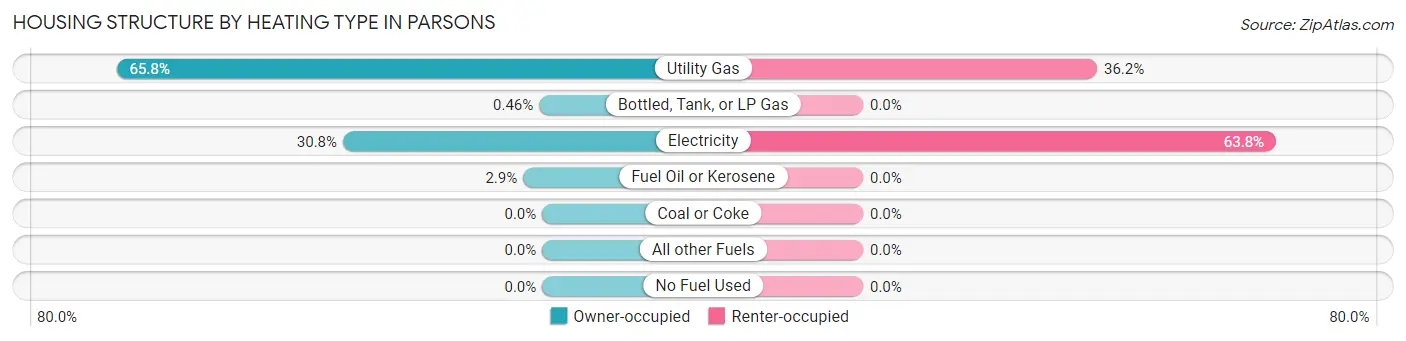
| Heating Type | Owner-occupied | Renter-occupied |
| Utility Gas | 425 (65.8%) | 123 (36.2%) |
| Bottled, Tank, or LP Gas | 3 (0.5%) | 0 (0.0%) |
| Electricity | 199 (30.8%) | 217 (63.8%) |
| Fuel Oil or Kerosene | 19 (2.9%) | 0 (0.0%) |
| Coal or Coke | 0 (0.0%) | 0 (0.0%) |
| All other Fuels | 0 (0.0%) | 0 (0.0%) |
| No Fuel Used | 0 (0.0%) | 0 (0.0%) |
| Total | 646 (100.0%) | 340 (100.0%) |
Household Vehicle Usage in Parsons
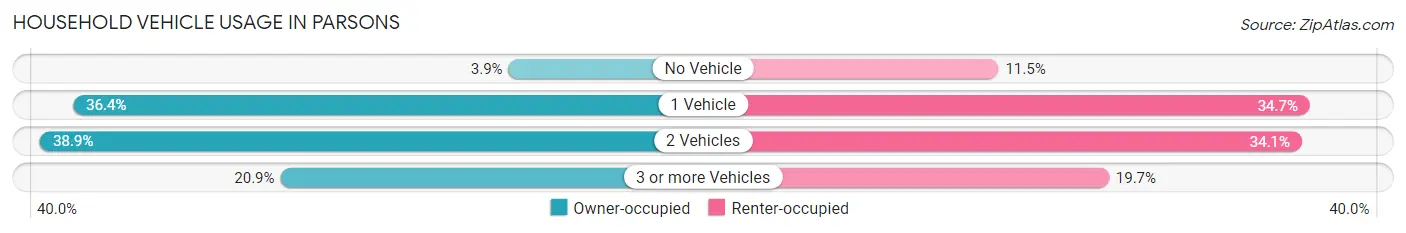
| Vehicles per Household | Owner-occupied | Renter-occupied |
| No Vehicle | 25 (3.9%) | 39 (11.5%) |
| 1 Vehicle | 235 (36.4%) | 118 (34.7%) |
| 2 Vehicles | 251 (38.9%) | 116 (34.1%) |
| 3 or more Vehicles | 135 (20.9%) | 67 (19.7%) |
| Total | 646 (100.0%) | 340 (100.0%) |
Real Estate & Mortgages in Parsons
Real Estate and Mortgage Overview in Parsons
| Characteristic | Without Mortgage | With Mortgage |
| Housing Units | 278 | 368 |
| Median Property Value | $113,000 | $121,400 |
| Median Household Income | $34,286 | $29 |
| Monthly Housing Costs | $412 | $4 |
| Real Estate Taxes | $566 | $4 |
Property Value by Mortgage Status in Parsons
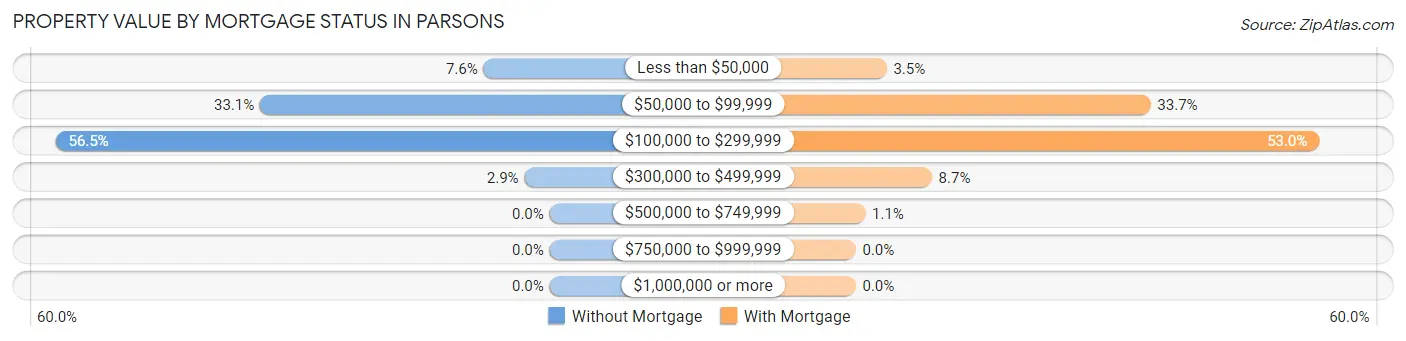
| Property Value | Without Mortgage | With Mortgage |
| Less than $50,000 | 21 (7.5%) | 13 (3.5%) |
| $50,000 to $99,999 | 92 (33.1%) | 124 (33.7%) |
| $100,000 to $299,999 | 157 (56.5%) | 195 (53.0%) |
| $300,000 to $499,999 | 8 (2.9%) | 32 (8.7%) |
| $500,000 to $749,999 | 0 (0.0%) | 4 (1.1%) |
| $750,000 to $999,999 | 0 (0.0%) | 0 (0.0%) |
| $1,000,000 or more | 0 (0.0%) | 0 (0.0%) |
| Total | 278 (100.0%) | 368 (100.0%) |
Household Income by Mortgage Status in Parsons
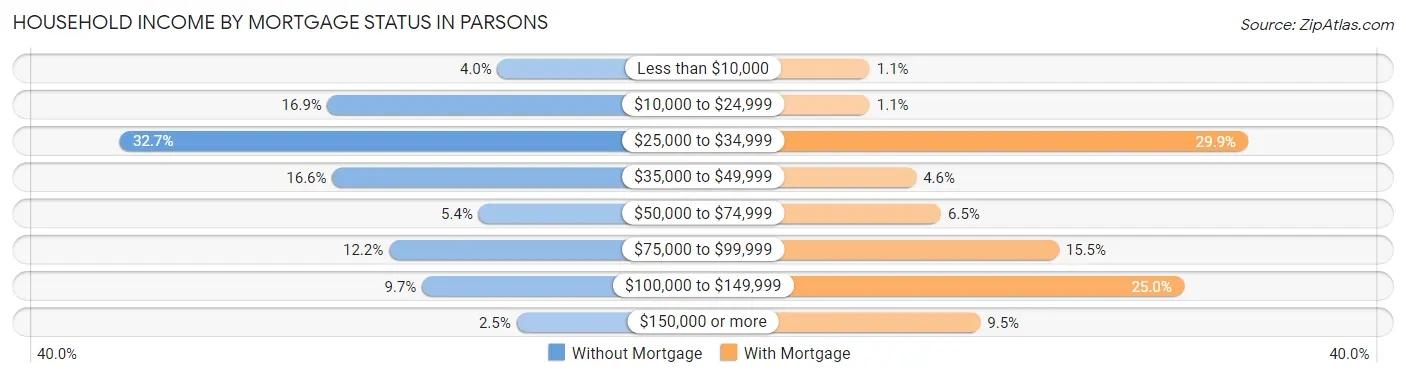
| Household Income | Without Mortgage | With Mortgage |
| Less than $10,000 | 11 (4.0%) | 4 (1.1%) |
| $10,000 to $24,999 | 47 (16.9%) | 4 (1.1%) |
| $25,000 to $34,999 | 91 (32.7%) | 110 (29.9%) |
| $35,000 to $49,999 | 46 (16.6%) | 17 (4.6%) |
| $50,000 to $74,999 | 15 (5.4%) | 24 (6.5%) |
| $75,000 to $99,999 | 34 (12.2%) | 57 (15.5%) |
| $100,000 to $149,999 | 27 (9.7%) | 92 (25.0%) |
| $150,000 or more | 7 (2.5%) | 35 (9.5%) |
| Total | 278 (100.0%) | 368 (100.0%) |
Property Value to Household Income Ratio in Parsons
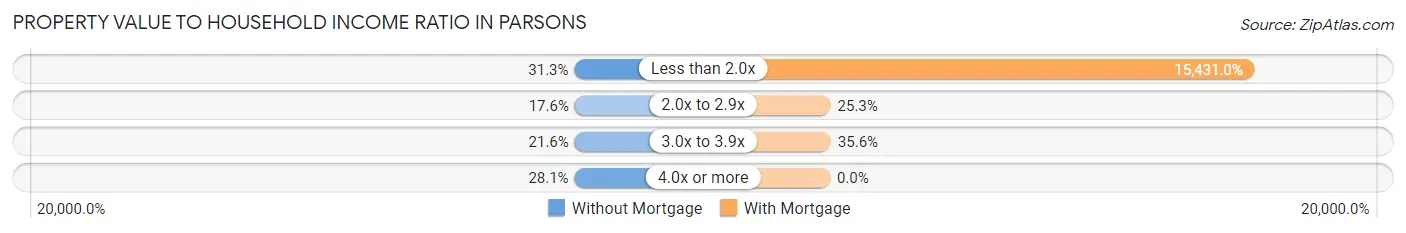
| Value-to-Income Ratio | Without Mortgage | With Mortgage |
| Less than 2.0x | 87 (31.3%) | 56,786 (15,431.0%) |
| 2.0x to 2.9x | 49 (17.6%) | 93 (25.3%) |
| 3.0x to 3.9x | 60 (21.6%) | 131 (35.6%) |
| 4.0x or more | 78 (28.1%) | 0 (0.0%) |
| Total | 278 (100.0%) | 368 (100.0%) |
Real Estate Taxes by Mortgage Status in Parsons
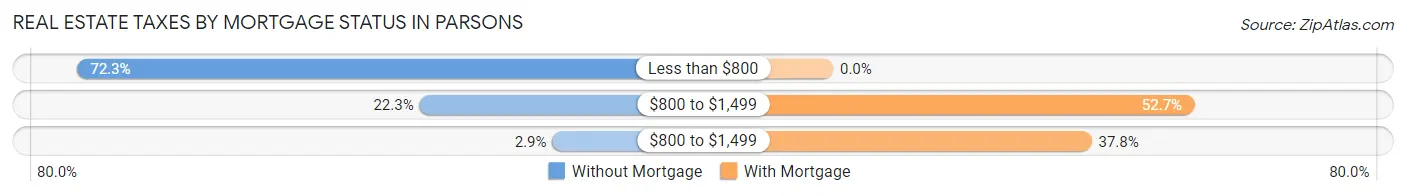
| Property Taxes | Without Mortgage | With Mortgage |
| Less than $800 | 201 (72.3%) | 0 (0.0%) |
| $800 to $1,499 | 62 (22.3%) | 194 (52.7%) |
| $800 to $1,499 | 8 (2.9%) | 139 (37.8%) |
| Total | 278 (100.0%) | 368 (100.0%) |
Health & Disability in Parsons
Health Insurance Coverage by Age in Parsons
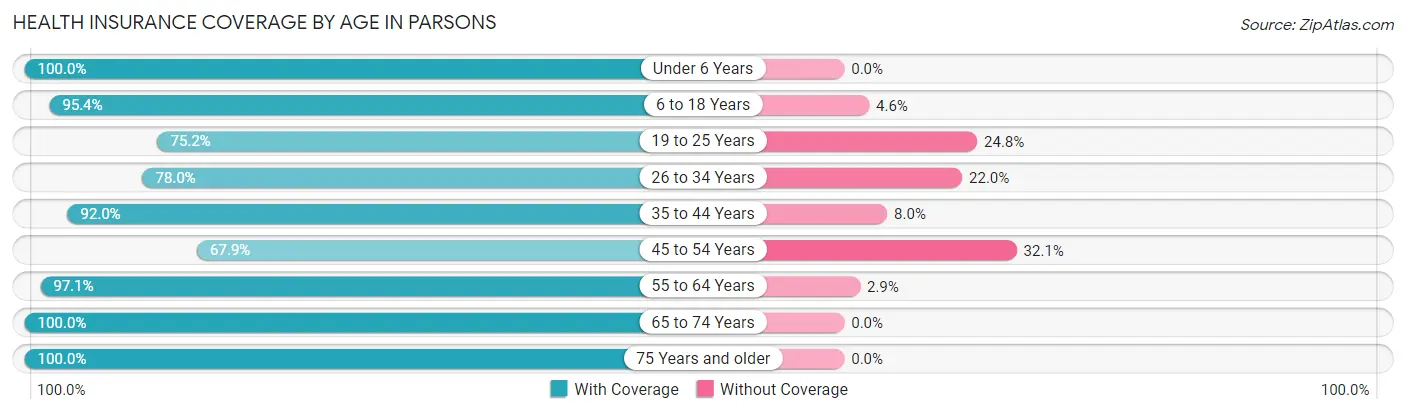
| Age Bracket | With Coverage | Without Coverage |
| Under 6 Years | 92 (100.0%) | 0 (0.0%) |
| 6 to 18 Years | 372 (95.4%) | 18 (4.6%) |
| 19 to 25 Years | 164 (75.2%) | 54 (24.8%) |
| 26 to 34 Years | 245 (78.0%) | 69 (22.0%) |
| 35 to 44 Years | 288 (92.0%) | 25 (8.0%) |
| 45 to 54 Years | 152 (67.9%) | 72 (32.1%) |
| 55 to 64 Years | 298 (97.1%) | 9 (2.9%) |
| 65 to 74 Years | 211 (100.0%) | 0 (0.0%) |
| 75 Years and older | 271 (100.0%) | 0 (0.0%) |
| Total | 2,093 (89.4%) | 247 (10.6%) |
Health Insurance Coverage by Citizenship Status in Parsons
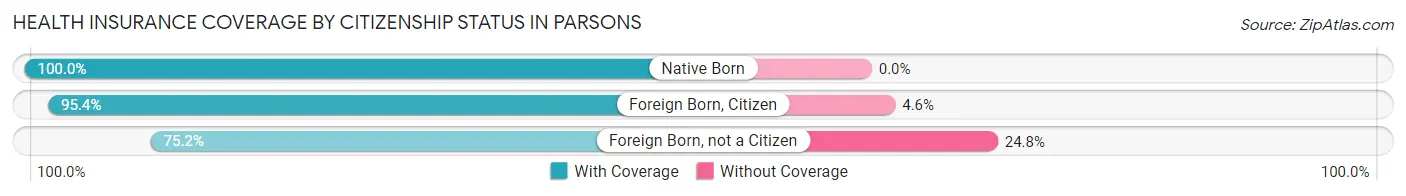
| Citizenship Status | With Coverage | Without Coverage |
| Native Born | 92 (100.0%) | 0 (0.0%) |
| Foreign Born, Citizen | 372 (95.4%) | 18 (4.6%) |
| Foreign Born, not a Citizen | 164 (75.2%) | 54 (24.8%) |
Health Insurance Coverage by Household Income in Parsons
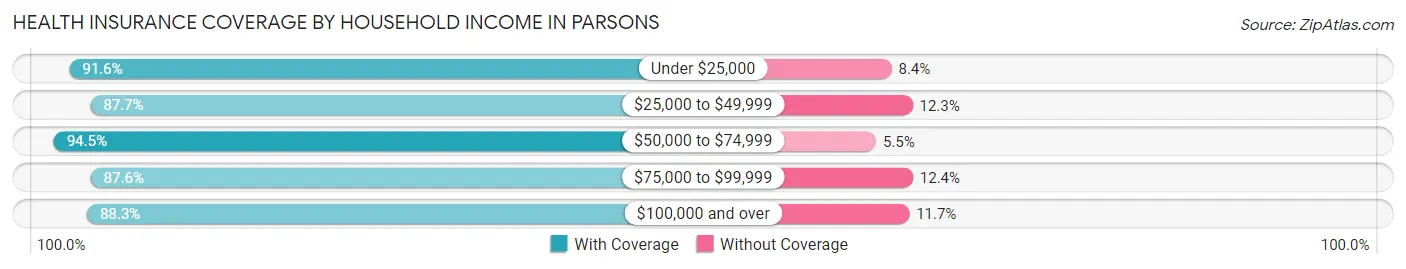
| Household Income | With Coverage | Without Coverage |
| Under $25,000 | 503 (91.6%) | 46 (8.4%) |
| $25,000 to $49,999 | 477 (87.7%) | 67 (12.3%) |
| $50,000 to $74,999 | 242 (94.5%) | 14 (5.5%) |
| $75,000 to $99,999 | 531 (87.6%) | 75 (12.4%) |
| $100,000 and over | 340 (88.3%) | 45 (11.7%) |
Public vs Private Health Insurance Coverage by Age in Parsons
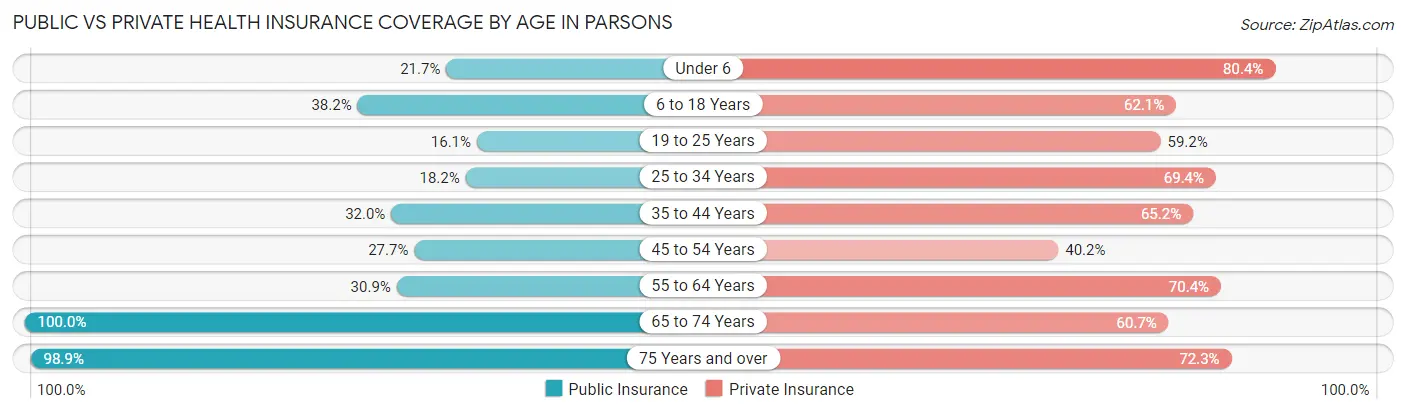
| Age Bracket | Public Insurance | Private Insurance |
| Under 6 | 20 (21.7%) | 74 (80.4%) |
| 6 to 18 Years | 149 (38.2%) | 242 (62.1%) |
| 19 to 25 Years | 35 (16.1%) | 129 (59.2%) |
| 25 to 34 Years | 57 (18.1%) | 218 (69.4%) |
| 35 to 44 Years | 100 (32.0%) | 204 (65.2%) |
| 45 to 54 Years | 62 (27.7%) | 90 (40.2%) |
| 55 to 64 Years | 95 (30.9%) | 216 (70.4%) |
| 65 to 74 Years | 211 (100.0%) | 128 (60.7%) |
| 75 Years and over | 268 (98.9%) | 196 (72.3%) |
| Total | 997 (42.6%) | 1,497 (64.0%) |
Disability Status by Sex by Age in Parsons
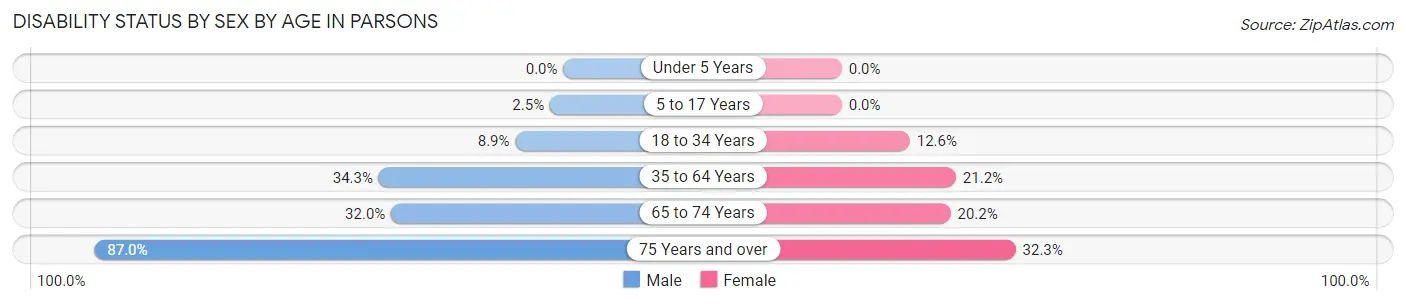
| Age Bracket | Male | Female |
| Under 5 Years | 0 (0.0%) | 0 (0.0%) |
| 5 to 17 Years | 6 (2.5%) | 0 (0.0%) |
| 18 to 34 Years | 31 (8.9%) | 24 (12.6%) |
| 35 to 64 Years | 150 (34.3%) | 86 (21.2%) |
| 65 to 74 Years | 31 (32.0%) | 23 (20.2%) |
| 75 Years and over | 47 (87.0%) | 70 (32.3%) |
Disability Class by Sex by Age in Parsons
Disability Class: Hearing Difficulty
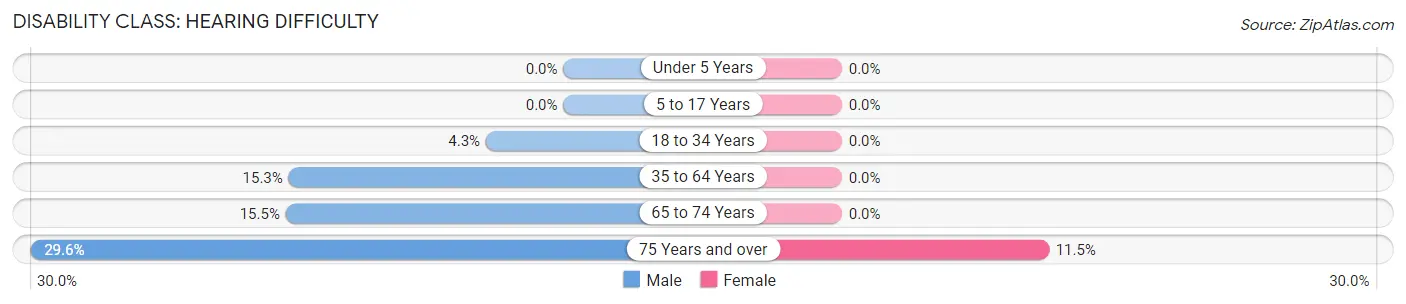
| Age Bracket | Male | Female |
| Under 5 Years | 0 (0.0%) | 0 (0.0%) |
| 5 to 17 Years | 0 (0.0%) | 0 (0.0%) |
| 18 to 34 Years | 15 (4.3%) | 0 (0.0%) |
| 35 to 64 Years | 67 (15.3%) | 0 (0.0%) |
| 65 to 74 Years | 15 (15.5%) | 0 (0.0%) |
| 75 Years and over | 16 (29.6%) | 25 (11.5%) |
Disability Class: Vision Difficulty
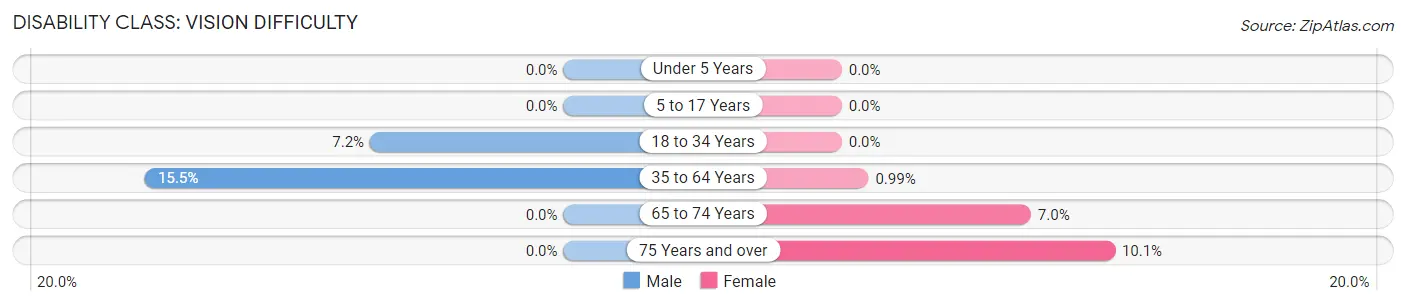
| Age Bracket | Male | Female |
| Under 5 Years | 0 (0.0%) | 0 (0.0%) |
| 5 to 17 Years | 0 (0.0%) | 0 (0.0%) |
| 18 to 34 Years | 25 (7.2%) | 0 (0.0%) |
| 35 to 64 Years | 68 (15.5%) | 4 (1.0%) |
| 65 to 74 Years | 0 (0.0%) | 8 (7.0%) |
| 75 Years and over | 0 (0.0%) | 22 (10.1%) |
Disability Class: Cognitive Difficulty
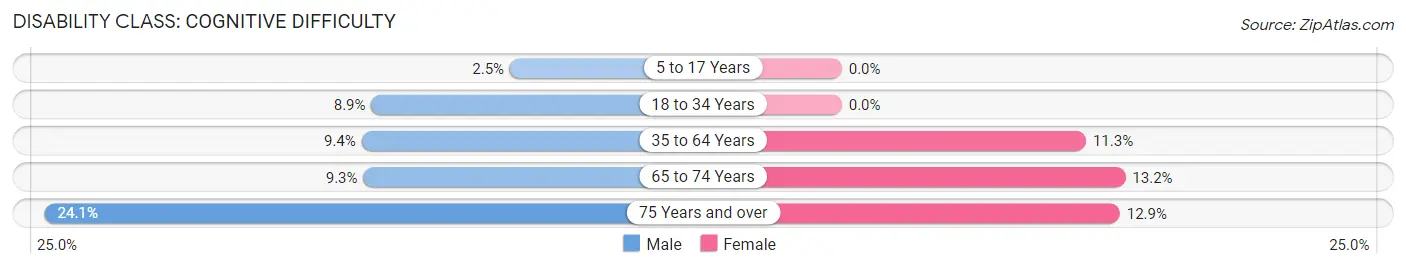
| Age Bracket | Male | Female |
| 5 to 17 Years | 6 (2.5%) | 0 (0.0%) |
| 18 to 34 Years | 31 (8.9%) | 0 (0.0%) |
| 35 to 64 Years | 41 (9.4%) | 46 (11.3%) |
| 65 to 74 Years | 9 (9.3%) | 15 (13.2%) |
| 75 Years and over | 13 (24.1%) | 28 (12.9%) |
Disability Class: Ambulatory Difficulty
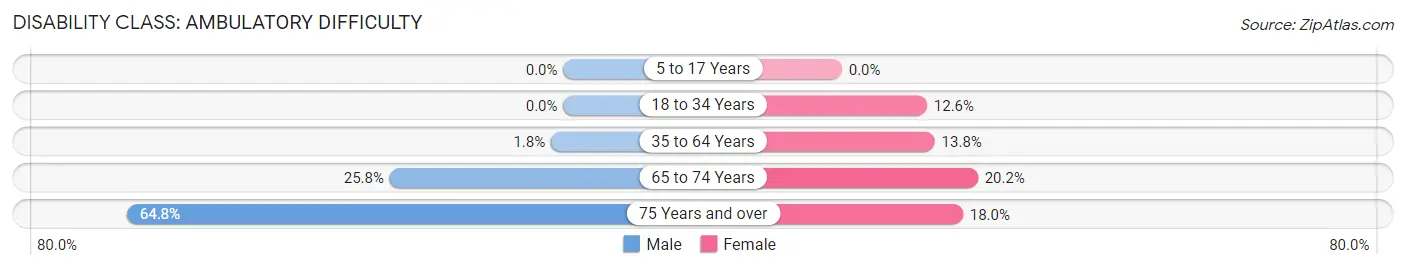
| Age Bracket | Male | Female |
| 5 to 17 Years | 0 (0.0%) | 0 (0.0%) |
| 18 to 34 Years | 0 (0.0%) | 24 (12.6%) |
| 35 to 64 Years | 8 (1.8%) | 56 (13.8%) |
| 65 to 74 Years | 25 (25.8%) | 23 (20.2%) |
| 75 Years and over | 35 (64.8%) | 39 (18.0%) |
Disability Class: Self-Care Difficulty
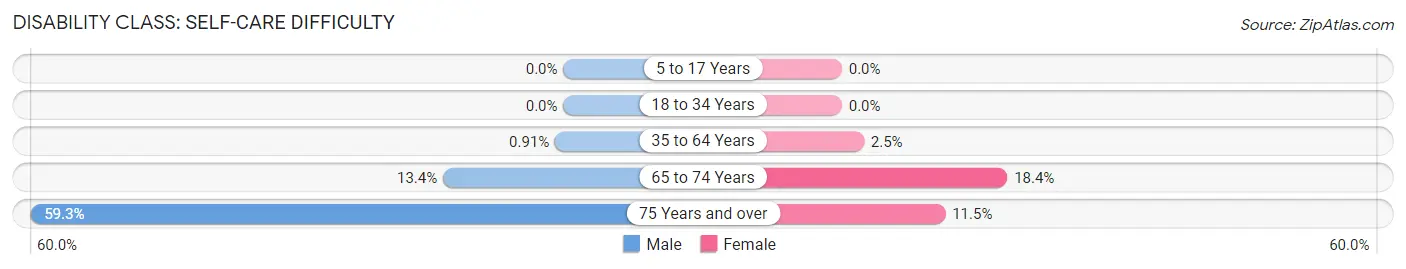
| Age Bracket | Male | Female |
| 5 to 17 Years | 0 (0.0%) | 0 (0.0%) |
| 18 to 34 Years | 0 (0.0%) | 0 (0.0%) |
| 35 to 64 Years | 4 (0.9%) | 10 (2.5%) |
| 65 to 74 Years | 13 (13.4%) | 21 (18.4%) |
| 75 Years and over | 32 (59.3%) | 25 (11.5%) |
Technology Access in Parsons
Computing Device Access in Parsons
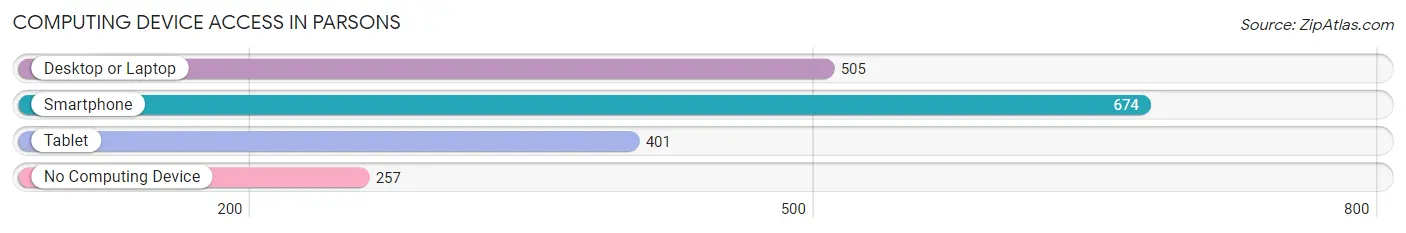
| Device Type | # Households | % Households |
| Desktop or Laptop | 505 | 51.2% |
| Smartphone | 674 | 68.4% |
| Tablet | 401 | 40.7% |
| No Computing Device | 257 | 26.1% |
| Total | 986 | 100.0% |
Internet Access in Parsons
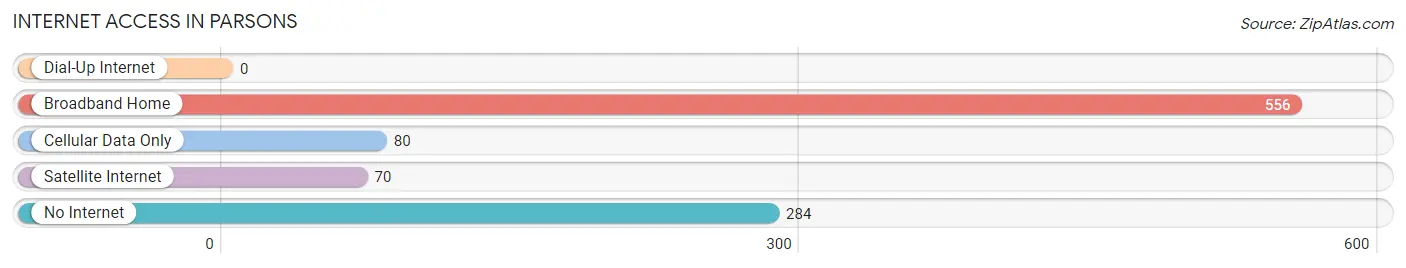
| Internet Type | # Households | % Households |
| Dial-Up Internet | 0 | 0.0% |
| Broadband Home | 556 | 56.4% |
| Cellular Data Only | 80 | 8.1% |
| Satellite Internet | 70 | 7.1% |
| No Internet | 284 | 28.8% |
| Total | 986 | 100.0% |
Parsons Summary
Parsons is a small city located in Decatur County, Tennessee. It is situated in the western part of the state, approximately halfway between Nashville and Memphis. The city has a population of approximately 2,500 people and is the county seat of Decatur County.
History
Parsons was founded in 1820 by William Parsons, a Revolutionary War veteran. The city was originally known as Parsonsville, but the name was changed to Parsons in 1871. The city was incorporated in 1875 and has remained a small, rural community ever since.
The city was an important stop on the Nashville and Chattanooga Railroad, which was built in the late 19th century. This railroad connected Parsons to the larger cities of Nashville and Chattanooga, and allowed the city to become an important trading center for the surrounding area.
Geography
Parsons is located in the western part of Decatur County, Tennessee. It is situated in the foothills of the Appalachian Mountains, and is surrounded by rolling hills and forests. The city is located approximately halfway between Nashville and Memphis, and is about an hour and a half drive from each city.
The city is situated along the Tennessee River, which provides a source of recreation for the city's residents. The city is also home to several parks, including the Parsons City Park, which features a playground, picnic areas, and a walking trail.
Economy
The economy of Parsons is largely based on agriculture and manufacturing. The city is home to several large farms, which produce a variety of crops, including corn, soybeans, and cotton. The city is also home to several manufacturing companies, which produce a variety of products, including furniture, clothing, and automotive parts.
The city is also home to several small businesses, including restaurants, retail stores, and service providers. The city is also home to several educational institutions, including a community college and a vocational school.
Demographics
As of the 2010 census, the population of Parsons was 2,500. The racial makeup of the city was 95.2% White, 2.2% African American, 0.4% Native American, 0.4% Asian, 0.2% from other races, and 1.6% from two or more races. Hispanic or Latino of any race were 1.2% of the population.
The median income for a household in the city was $30,000, and the median income for a family was $35,000. The per capita income for the city was $15,000. About 17.5% of the population was below the poverty line.
Parsons is a small, rural city with a rich history and a strong sense of community. The city is home to several businesses and educational institutions, and is a popular destination for outdoor recreation. The city is also home to a diverse population, with a variety of racial and ethnic backgrounds.
Common Questions
What is Per Capita Income in Parsons?
Per Capita income in Parsons is $23,921.
What is the Median Family Income in Parsons?
Median Family Income in Parsons is $64,474.
What is the Median Household income in Parsons?
Median Household Income in Parsons is $39,000.
What is Income or Wage Gap in Parsons?
Income or Wage Gap in Parsons is 54.9%.
Women in Parsons earn 45.1 cents for every dollar earned by a man.
What is Inequality or Gini Index in Parsons?
Inequality or Gini Index in Parsons is 0.47.
What is the Total Population of Parsons?
Total Population of Parsons is 2,452.
What is the Total Male Population of Parsons?
Total Male Population of Parsons is 1,239.
What is the Total Female Population of Parsons?
Total Female Population of Parsons is 1,213.
What is the Ratio of Males per 100 Females in Parsons?
There are 102.14 Males per 100 Females in Parsons.
What is the Ratio of Females per 100 Males in Parsons?
There are 97.90 Females per 100 Males in Parsons.
What is the Median Population Age in Parsons?
Median Population Age in Parsons is 41.9 Years.
What is the Average Family Size in Parsons
Average Family Size in Parsons is 3.2 People.
What is the Average Household Size in Parsons
Average Household Size in Parsons is 2.4 People.
How Large is the Labor Force in Parsons?
There are 1,045 People in the Labor Forcein in Parsons.
What is the Percentage of People in the Labor Force in Parsons?
50.9% of People are in the Labor Force in Parsons.
What is the Unemployment Rate in Parsons?
Unemployment Rate in Parsons is 7.2%.