Altamont, TN Map & Demographics
Altamont Map
Altamont Overview
$38,471
PER CAPITA INCOME
$40,833
AVG FAMILY INCOME
$38,920
AVG HOUSEHOLD INCOME
31.2%
WAGE / INCOME GAP [ % ]
68.8¢/ $1
WAGE / INCOME GAP [ $ ]
0.67
INEQUALITY / GINI INDEX
904
TOTAL POPULATION
463
MALE POPULATION
441
FEMALE POPULATION
104.99
MALES / 100 FEMALES
95.25
FEMALES / 100 MALES
50.0
MEDIAN AGE
3.2
AVG FAMILY SIZE
2.7
AVG HOUSEHOLD SIZE
281
LABOR FORCE [ PEOPLE ]
38.1%
PERCENT IN LABOR FORCE
3.6%
UNEMPLOYMENT RATE
Altamont Zip Codes
Altamont Area Codes
Income in Altamont
Income Overview in Altamont
Per Capita Income in Altamont is $38,471, while median incomes of families and households are $40,833 and $38,920 respectively.
| Characteristic | Number | Measure |
| Per Capita Income | 904 | $38,471 |
| Median Family Income | 236 | $40,833 |
| Mean Family Income | 236 | $109,708 |
| Median Household Income | 316 | $38,920 |
| Mean Household Income | 316 | $103,274 |
| Income Deficit | 236 | $0 |
| Wage / Income Gap (%) | 904 | 31.23% |
| Wage / Income Gap ($) | 904 | 68.77¢ per $1 |
| Gini / Inequality Index | 904 | 0.67 |
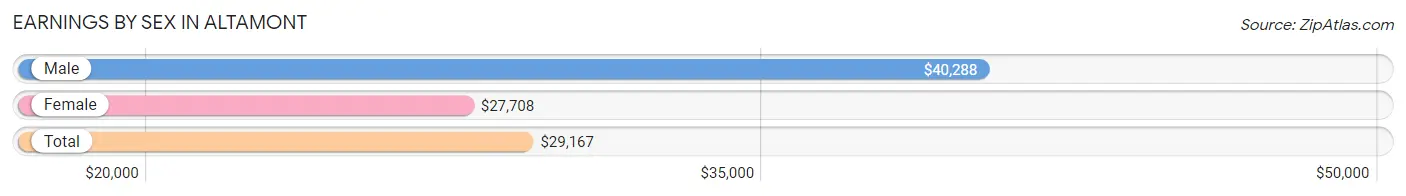
Earnings by Sex in Altamont
Average Earnings in Altamont are $29,167, $40,288 for men and $27,708 for women, a difference of 31.2%.
| Sex | Number | Average Earnings |
| Male | 129 (39.3%) | $40,288 |
| Female | 199 (60.7%) | $27,708 |
| Total | 328 (100.0%) | $29,167 |
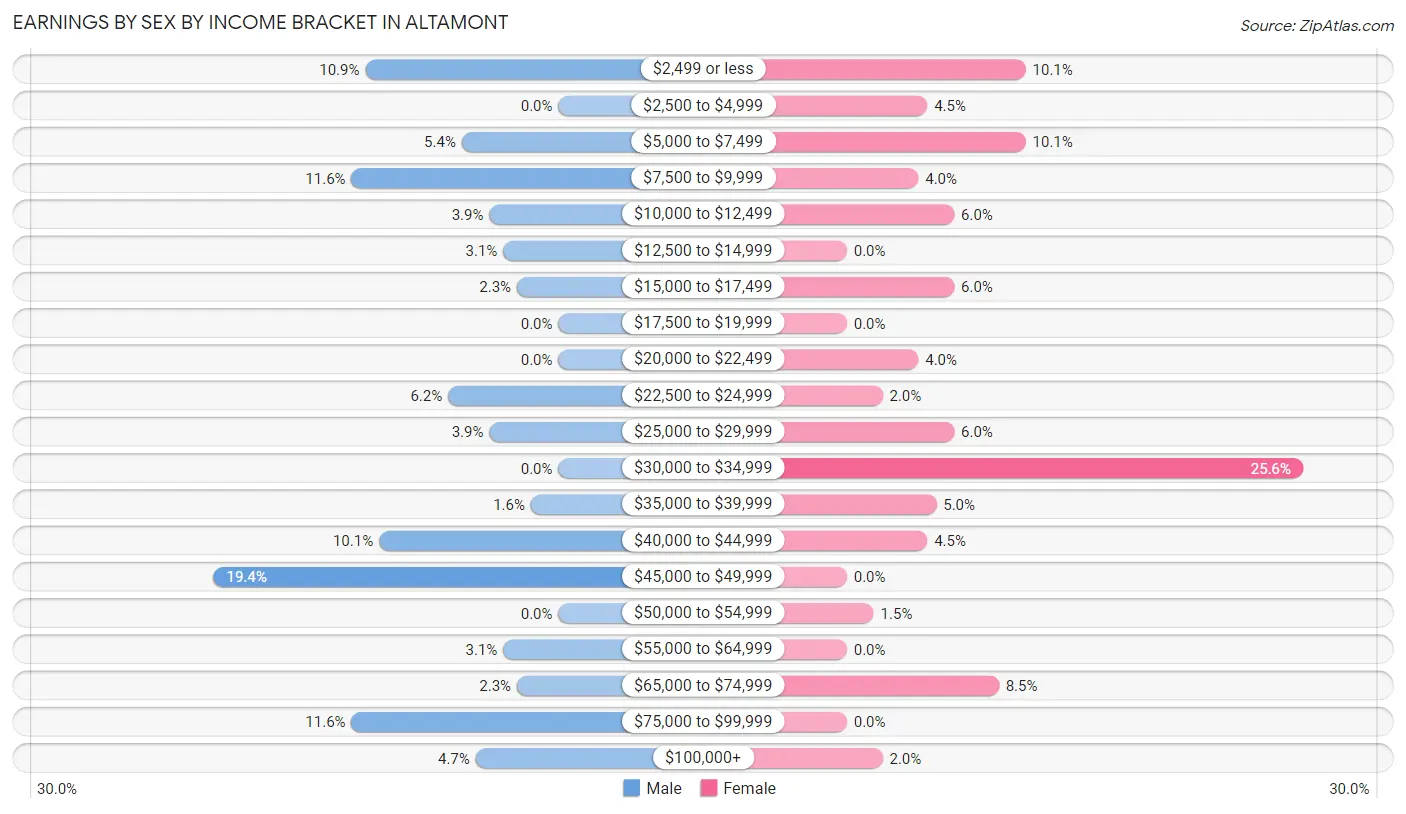
Earnings by Sex by Income Bracket in Altamont
The most common earnings brackets in Altamont are $45,000 to $49,999 for men (25 | 19.4%) and $30,000 to $34,999 for women (51 | 25.6%).
| Income | Male | Female |
| $2,499 or less | 14 (10.8%) | 20 (10.1%) |
| $2,500 to $4,999 | 0 (0.0%) | 9 (4.5%) |
| $5,000 to $7,499 | 7 (5.4%) | 20 (10.1%) |
| $7,500 to $9,999 | 15 (11.6%) | 8 (4.0%) |
| $10,000 to $12,499 | 5 (3.9%) | 12 (6.0%) |
| $12,500 to $14,999 | 4 (3.1%) | 0 (0.0%) |
| $15,000 to $17,499 | 3 (2.3%) | 12 (6.0%) |
| $17,500 to $19,999 | 0 (0.0%) | 0 (0.0%) |
| $20,000 to $22,499 | 0 (0.0%) | 8 (4.0%) |
| $22,500 to $24,999 | 8 (6.2%) | 4 (2.0%) |
| $25,000 to $29,999 | 5 (3.9%) | 12 (6.0%) |
| $30,000 to $34,999 | 0 (0.0%) | 51 (25.6%) |
| $35,000 to $39,999 | 2 (1.5%) | 10 (5.0%) |
| $40,000 to $44,999 | 13 (10.1%) | 9 (4.5%) |
| $45,000 to $49,999 | 25 (19.4%) | 0 (0.0%) |
| $50,000 to $54,999 | 0 (0.0%) | 3 (1.5%) |
| $55,000 to $64,999 | 4 (3.1%) | 0 (0.0%) |
| $65,000 to $74,999 | 3 (2.3%) | 17 (8.5%) |
| $75,000 to $99,999 | 15 (11.6%) | 0 (0.0%) |
| $100,000+ | 6 (4.6%) | 4 (2.0%) |
| Total | 129 (100.0%) | 199 (100.0%) |
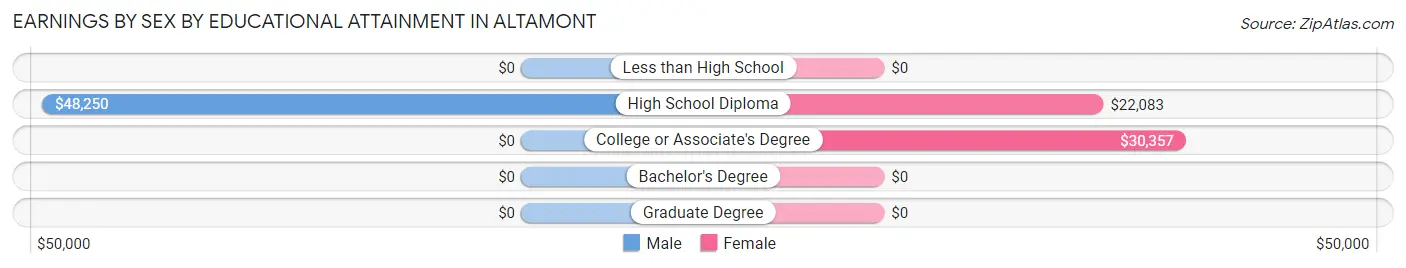
Earnings by Sex by Educational Attainment in Altamont
Average earnings in Altamont are $41,827 for men and $30,586 for women, a difference of 26.9%. Men with an educational attainment of high school diploma enjoy the highest average annual earnings of $48,250, while those with high school diploma education earn the least with $48,250. Women with an educational attainment of college or associate's degree earn the most with the average annual earnings of $30,357, while those with high school diploma education have the smallest earnings of $22,083.
| Educational Attainment | Male Income | Female Income |
| Less than High School | - | - |
| High School Diploma | $48,250 | $22,083 |
| College or Associate's Degree | - | - |
| Bachelor's Degree | - | - |
| Graduate Degree | - | - |
| Total | $41,827 | $30,586 |
Family Income in Altamont
Family Income Brackets in Altamont
According to the Altamont family income data, there are 78 families falling into the $35,000 to $49,999 income range, which is the most common income bracket and makes up 33.1% of all families.
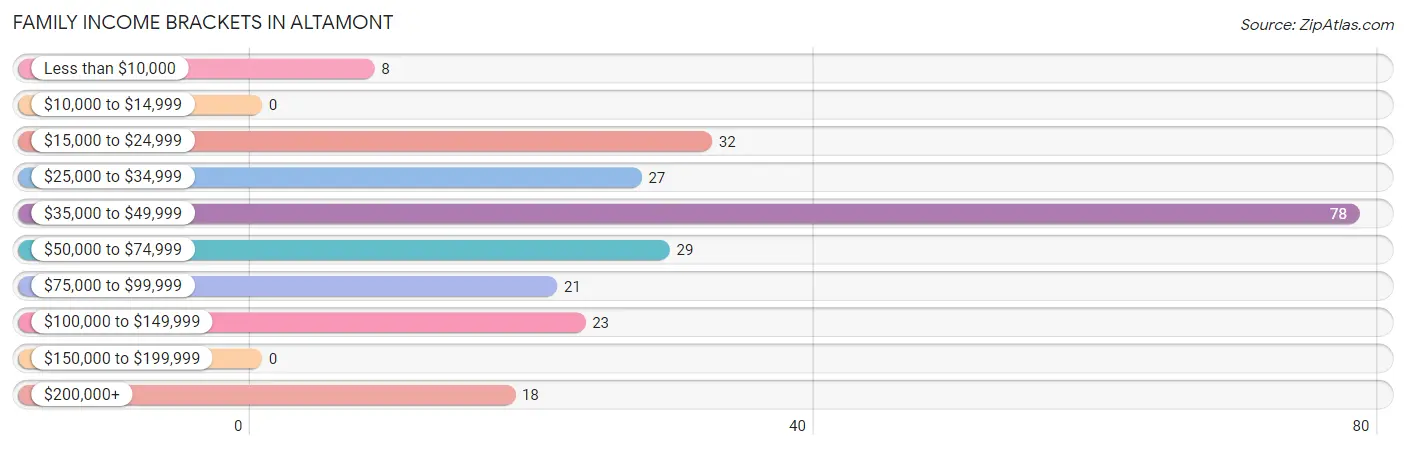
| Income Bracket | # Families | % Families |
| Less than $10,000 | 8 | 3.4% |
| $10,000 to $14,999 | 0 | 0.0% |
| $15,000 to $24,999 | 32 | 13.6% |
| $25,000 to $34,999 | 27 | 11.4% |
| $35,000 to $49,999 | 78 | 33.1% |
| $50,000 to $74,999 | 29 | 12.3% |
| $75,000 to $99,999 | 21 | 8.9% |
| $100,000 to $149,999 | 23 | 9.7% |
| $150,000 to $199,999 | 0 | 0.0% |
| $200,000+ | 18 | 7.6% |
Family Income by Famaliy Size in Altamont
3-person families (44 | 18.6%) account for the highest median family income in Altamont with $53,750 per family, while 2-person families (136 | 57.6%) have the highest median income of $19,570 per family member.
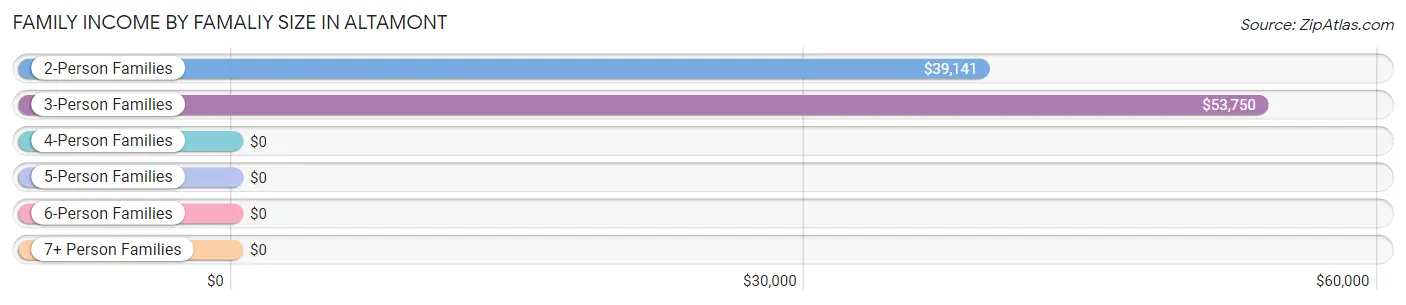
| Income Bracket | # Families | Median Income |
| 2-Person Families | 136 (57.6%) | $39,141 |
| 3-Person Families | 44 (18.6%) | $53,750 |
| 4-Person Families | 24 (10.2%) | $0 |
| 5-Person Families | 28 (11.9%) | $0 |
| 6-Person Families | 0 (0.0%) | $0 |
| 7+ Person Families | 4 (1.7%) | $0 |
| Total | 236 (100.0%) | $40,833 |
Family Income by Number of Earners in Altamont
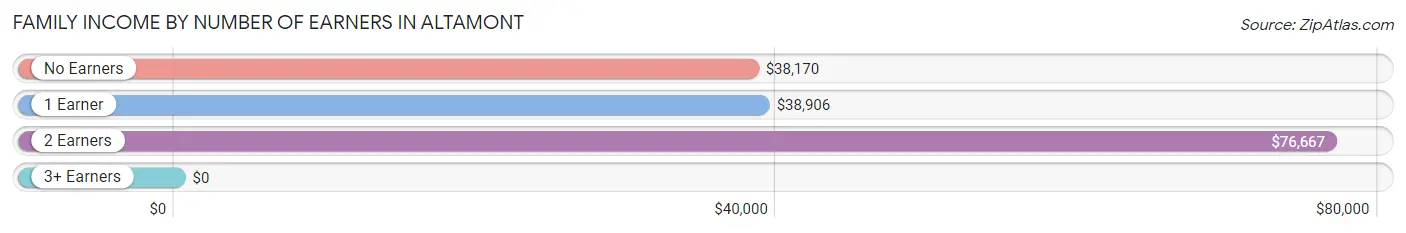
| Number of Earners | # Families | Median Income |
| No Earners | 87 (36.9%) | $38,170 |
| 1 Earner | 78 (33.1%) | $38,906 |
| 2 Earners | 46 (19.5%) | $76,667 |
| 3+ Earners | 25 (10.6%) | $0 |
| Total | 236 (100.0%) | $40,833 |
Household Income in Altamont
Household Income Brackets in Altamont
With 90 households falling in the category, the $35,000 to $49,999 income range is the most frequent in Altamont, accounting for 28.5% of all households.
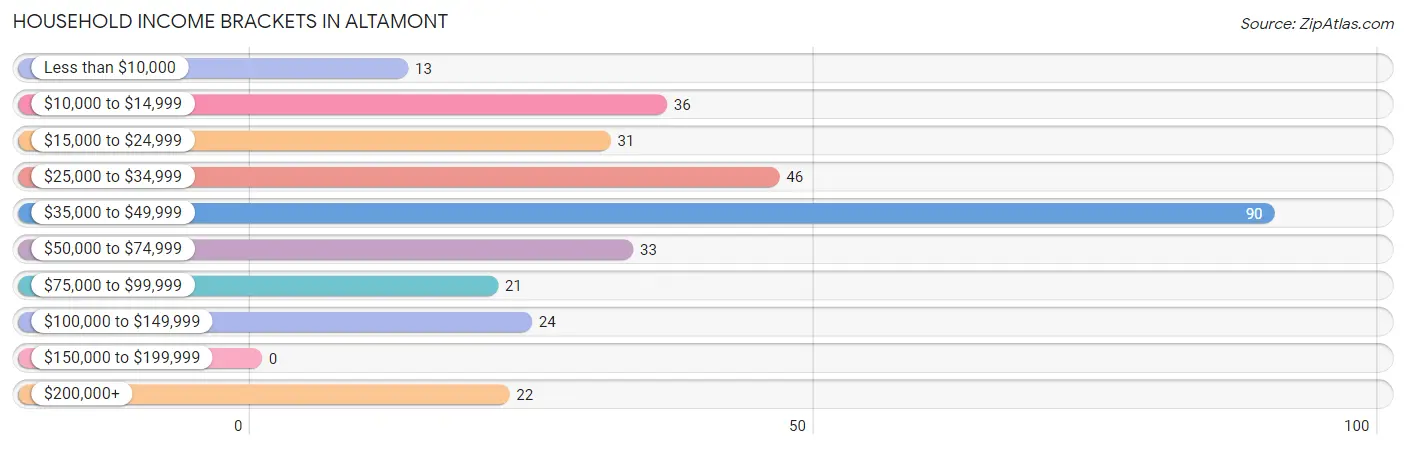
| Income Bracket | # Households | % Households |
| Less than $10,000 | 13 | 4.1% |
| $10,000 to $14,999 | 36 | 11.4% |
| $15,000 to $24,999 | 31 | 9.8% |
| $25,000 to $34,999 | 46 | 14.6% |
| $35,000 to $49,999 | 90 | 28.5% |
| $50,000 to $74,999 | 33 | 10.4% |
| $75,000 to $99,999 | 21 | 6.6% |
| $100,000 to $149,999 | 24 | 7.6% |
| $150,000 to $199,999 | 0 | 0.0% |
| $200,000+ | 22 | 7.0% |
Household Income by Householder Age in Altamont
The median household income in Altamont is $38,920, with the highest median household income of $47,778 found in the 25 to 44 years age bracket for the primary householder. A total of 66 households (20.9%) fall into this category.
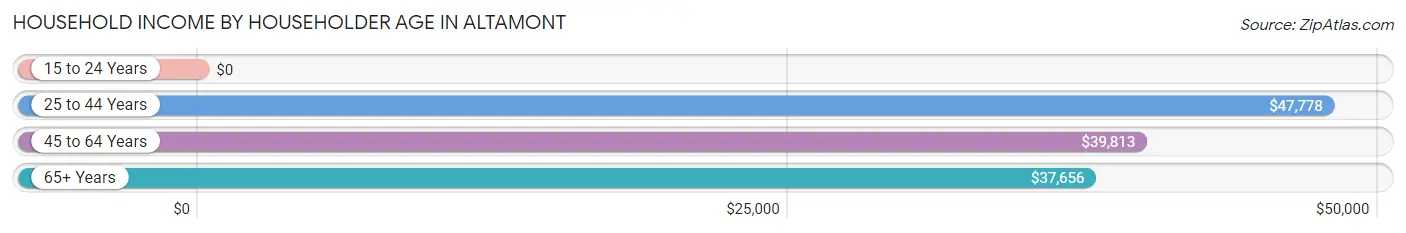
| Income Bracket | # Households | Median Income |
| 15 to 24 Years | 0 (0.0%) | $0 |
| 25 to 44 Years | 66 (20.9%) | $47,778 |
| 45 to 64 Years | 109 (34.5%) | $39,813 |
| 65+ Years | 141 (44.6%) | $37,656 |
| Total | 316 (100.0%) | $38,920 |
Poverty in Altamont
Income Below Poverty by Sex and Age in Altamont
With 23.8% poverty level for males and 27.4% for females among the residents of Altamont, under 5 year old males and 5 year old females are the most vulnerable to poverty, with 15 males (62.5%) and 19 females (100.0%) in their respective age groups living below the poverty level.
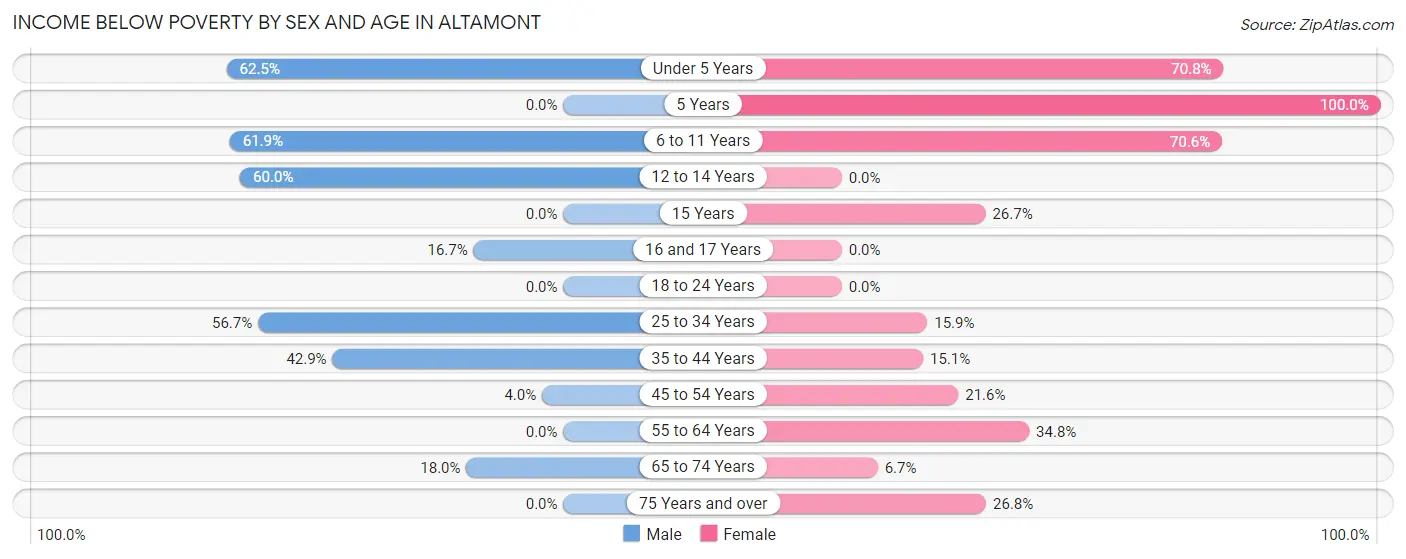
| Age Bracket | Male | Female |
| Under 5 Years | 15 (62.5%) | 17 (70.8%) |
| 5 Years | 0 (0.0%) | 19 (100.0%) |
| 6 to 11 Years | 26 (61.9%) | 12 (70.6%) |
| 12 to 14 Years | 12 (60.0%) | 0 (0.0%) |
| 15 Years | 0 (0.0%) | 4 (26.7%) |
| 16 and 17 Years | 4 (16.7%) | 0 (0.0%) |
| 18 to 24 Years | 0 (0.0%) | 0 (0.0%) |
| 25 to 34 Years | 17 (56.7%) | 10 (15.9%) |
| 35 to 44 Years | 12 (42.9%) | 8 (15.1%) |
| 45 to 54 Years | 4 (4.0%) | 8 (21.6%) |
| 55 to 64 Years | 0 (0.0%) | 24 (34.8%) |
| 65 to 74 Years | 9 (18.0%) | 4 (6.7%) |
| 75 Years and over | 0 (0.0%) | 15 (26.8%) |
| Total | 99 (23.8%) | 121 (27.4%) |
Income Above Poverty by Sex and Age in Altamont
According to the poverty statistics in Altamont, males aged 15 years and females aged 12 to 14 years are the age groups that are most secure financially, with 100.0% of males and 100.0% of females in these age groups living above the poverty line.
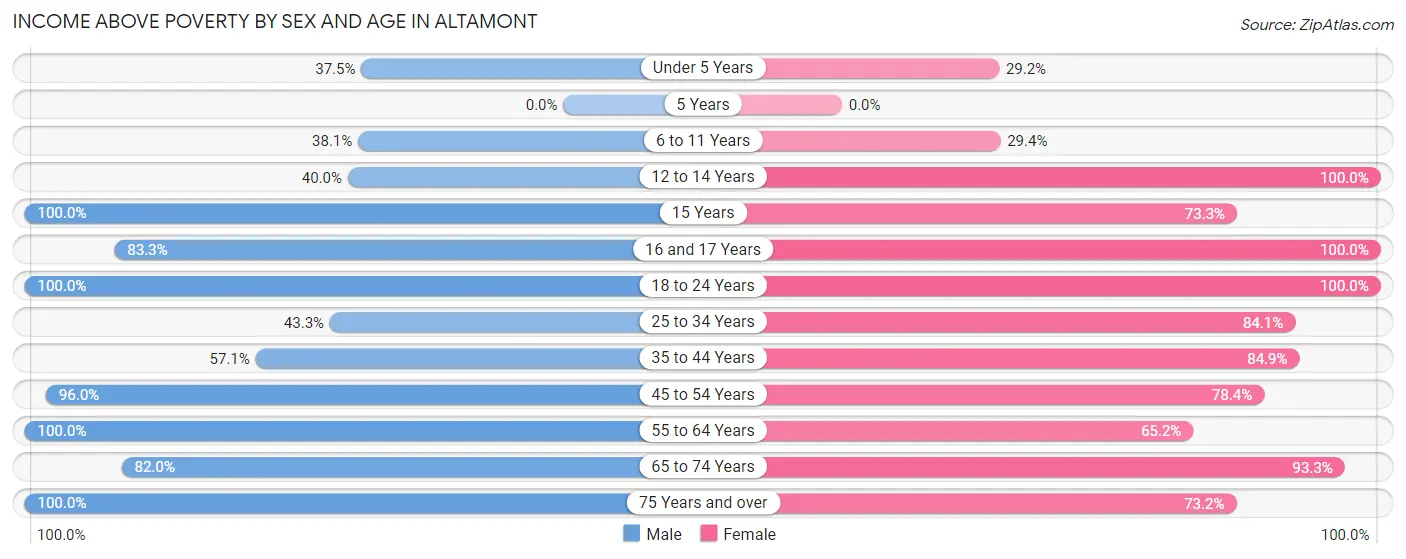
| Age Bracket | Male | Female |
| Under 5 Years | 9 (37.5%) | 7 (29.2%) |
| 5 Years | 0 (0.0%) | 0 (0.0%) |
| 6 to 11 Years | 16 (38.1%) | 5 (29.4%) |
| 12 to 14 Years | 8 (40.0%) | 2 (100.0%) |
| 15 Years | 4 (100.0%) | 11 (73.3%) |
| 16 and 17 Years | 20 (83.3%) | 11 (100.0%) |
| 18 to 24 Years | 5 (100.0%) | 15 (100.0%) |
| 25 to 34 Years | 13 (43.3%) | 53 (84.1%) |
| 35 to 44 Years | 16 (57.1%) | 45 (84.9%) |
| 45 to 54 Years | 97 (96.0%) | 29 (78.4%) |
| 55 to 64 Years | 49 (100.0%) | 45 (65.2%) |
| 65 to 74 Years | 41 (82.0%) | 56 (93.3%) |
| 75 Years and over | 39 (100.0%) | 41 (73.2%) |
| Total | 317 (76.2%) | 320 (72.6%) |
Income Below Poverty Among Married-Couple Families in Altamont
The poverty statistics for married-couple families in Altamont show that 9.0% or 14 of the total 155 families live below the poverty line. Families with 5 or more children have the highest poverty rate of 100.0%, comprising of 4 families. On the other hand, families with 3 or 4 children have the lowest poverty rate of 0.0%, which includes 0 families.
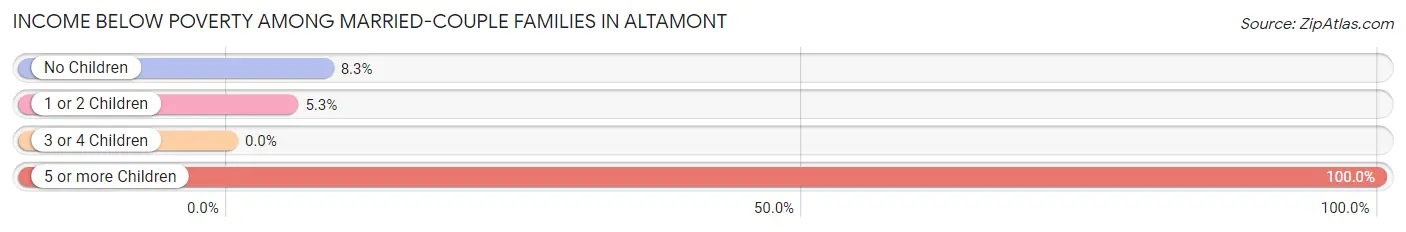
| Children | Above Poverty | Below Poverty |
| No Children | 88 (91.7%) | 8 (8.3%) |
| 1 or 2 Children | 36 (94.7%) | 2 (5.3%) |
| 3 or 4 Children | 17 (100.0%) | 0 (0.0%) |
| 5 or more Children | 0 (0.0%) | 4 (100.0%) |
| Total | 141 (91.0%) | 14 (9.0%) |
Income Below Poverty Among Single-Parent Households in Altamont
According to the poverty data in Altamont, 40.0% or 8 single-father households and 23.0% or 14 single-mother households are living below the poverty line. Among single-father households, those with 3 or 4 children have the highest poverty rate, with 8 households (100.0%) experiencing poverty. Likewise, among single-mother households, those with 3 or 4 children have the highest poverty rate, with 10 households (100.0%) falling below the poverty line.
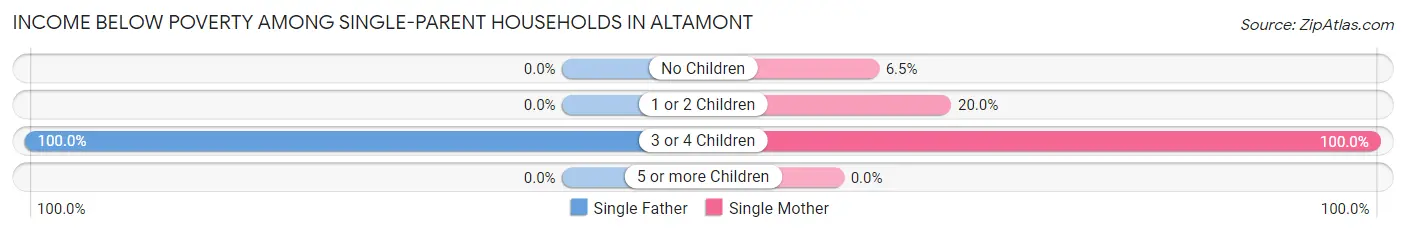
| Children | Single Father | Single Mother |
| No Children | 0 (0.0%) | 3 (6.5%) |
| 1 or 2 Children | 0 (0.0%) | 1 (20.0%) |
| 3 or 4 Children | 8 (100.0%) | 10 (100.0%) |
| 5 or more Children | 0 (0.0%) | 0 (0.0%) |
| Total | 8 (40.0%) | 14 (23.0%) |
Income Below Poverty Among Married-Couple vs Single-Parent Households in Altamont
The poverty data for Altamont shows that 14 of the married-couple family households (9.0%) and 22 of the single-parent households (27.2%) are living below the poverty level. Within the married-couple family households, those with 5 or more children have the highest poverty rate, with 4 households (100.0%) falling below the poverty line. Among the single-parent households, those with 3 or 4 children have the highest poverty rate, with 18 household (100.0%) living below poverty.
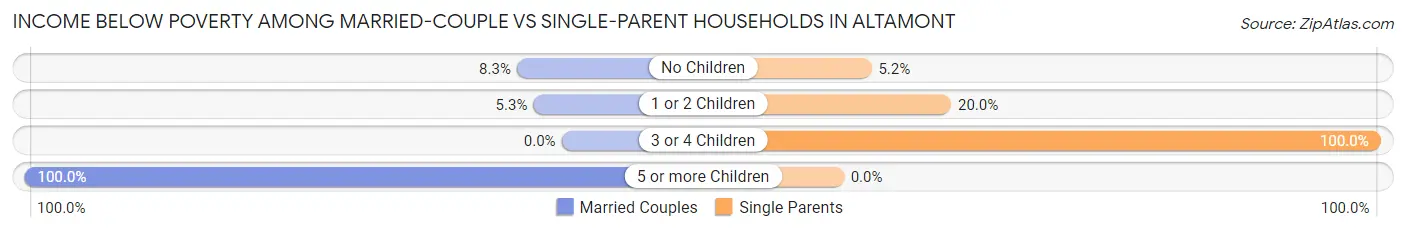
| Children | Married-Couple Families | Single-Parent Households |
| No Children | 8 (8.3%) | 3 (5.2%) |
| 1 or 2 Children | 2 (5.3%) | 1 (20.0%) |
| 3 or 4 Children | 0 (0.0%) | 18 (100.0%) |
| 5 or more Children | 4 (100.0%) | 0 (0.0%) |
| Total | 14 (9.0%) | 22 (27.2%) |
Race in Altamont
The most populous races in Altamont are White / Caucasian (840 | 92.9%), Two or more Races (34 | 3.8%), and Native / Alaskan (23 | 2.5%).
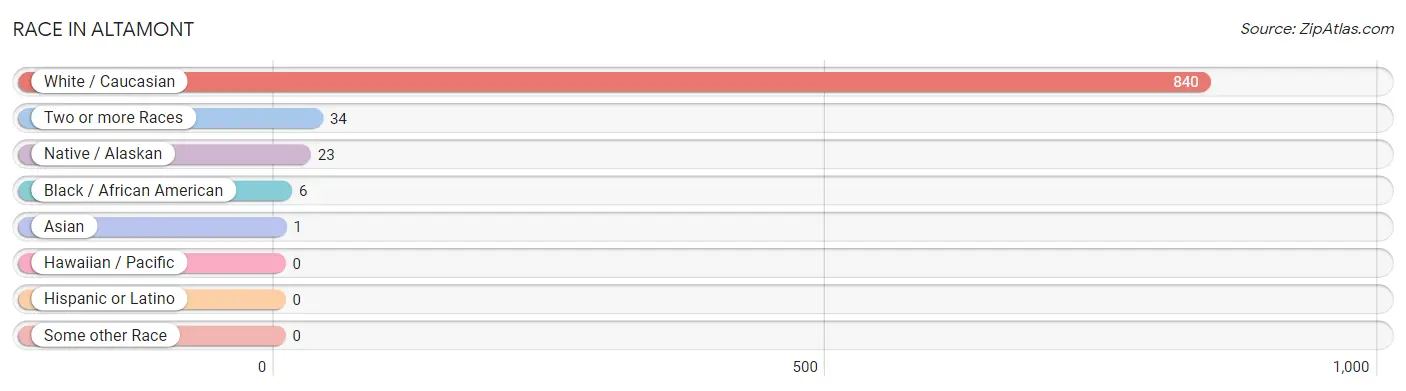
| Race | # Population | % Population |
| Asian | 1 | 0.1% |
| Black / African American | 6 | 0.7% |
| Hawaiian / Pacific | 0 | 0.0% |
| Hispanic or Latino | 0 | 0.0% |
| Native / Alaskan | 23 | 2.5% |
| White / Caucasian | 840 | 92.9% |
| Two or more Races | 34 | 3.8% |
| Some other Race | 0 | 0.0% |
| Total | 904 | 100.0% |
Ancestry in Altamont
The most populous ancestries reported in Altamont are American (153 | 16.9%), Irish (136 | 15.0%), German (75 | 8.3%), English (67 | 7.4%), and Cherokee (46 | 5.1%), together accounting for 52.8% of all Altamont residents.
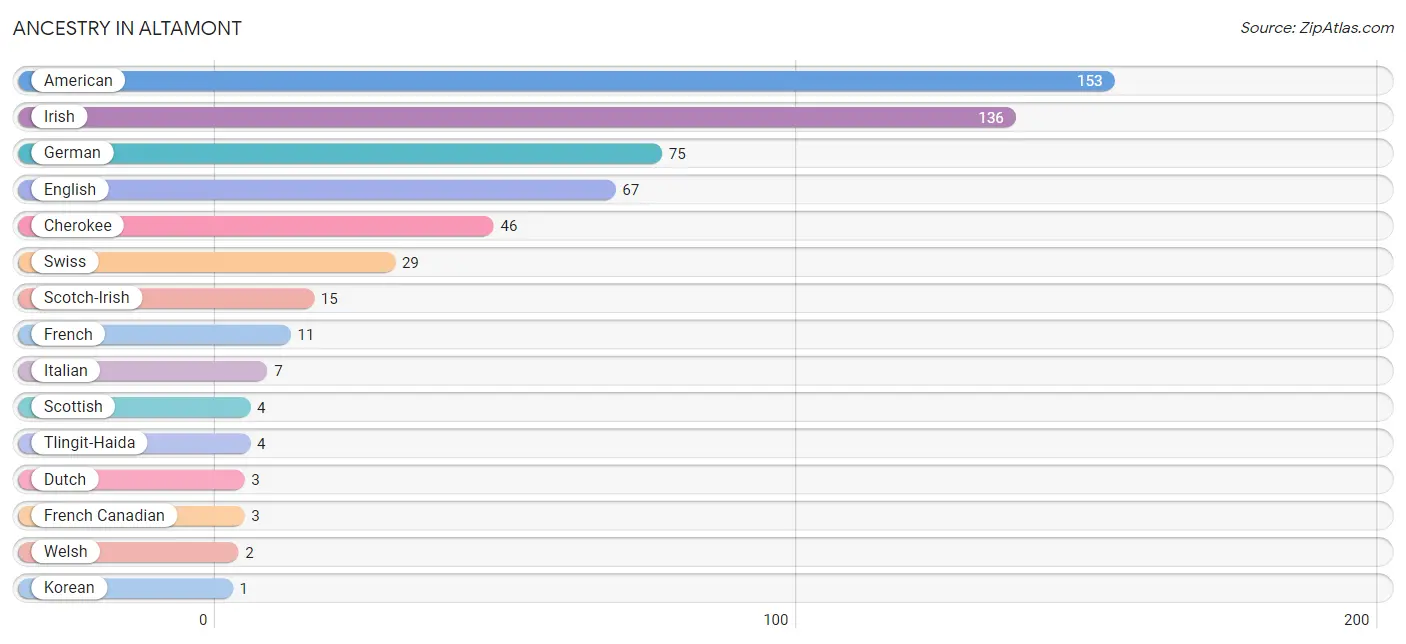
| Ancestry | # Population | % Population |
| American | 153 | 16.9% |
| Cherokee | 46 | 5.1% |
| Dutch | 3 | 0.3% |
| English | 67 | 7.4% |
| French | 11 | 1.2% |
| French Canadian | 3 | 0.3% |
| German | 75 | 8.3% |
| Irish | 136 | 15.0% |
| Italian | 7 | 0.8% |
| Korean | 1 | 0.1% |
| Scotch-Irish | 15 | 1.7% |
| Scottish | 4 | 0.4% |
| Swiss | 29 | 3.2% |
| Tlingit-Haida | 4 | 0.4% |
| Welsh | 2 | 0.2% | View All 15 Rows |
Immigrants in Altamont
The most numerous immigrant groups reported in Altamont came from Europe (3 | 0.3%), Germany (3 | 0.3%), Western Europe (3 | 0.3%), Asia (1 | 0.1%), and Philippines (1 | 0.1%), together accounting for 1.2% of all Altamont residents.
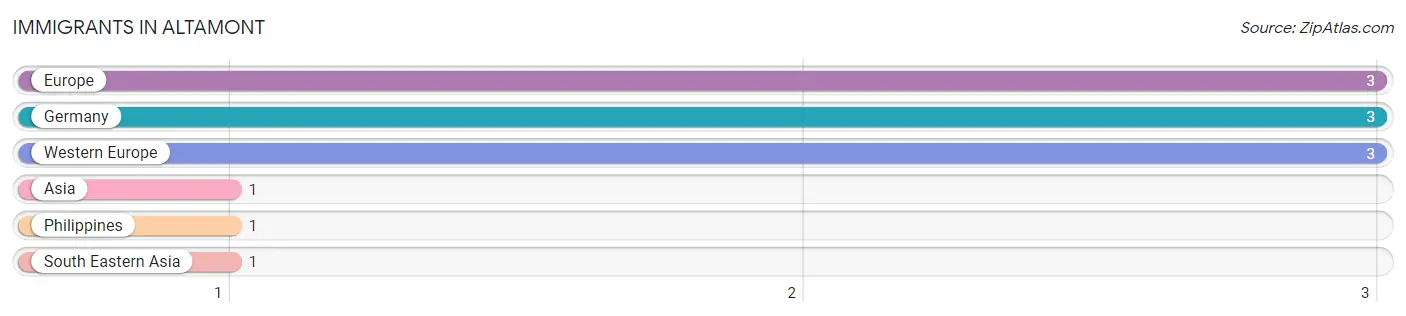
| Immigration Origin | # Population | % Population |
| Asia | 1 | 0.1% |
| Europe | 3 | 0.3% |
| Germany | 3 | 0.3% |
| Philippines | 1 | 0.1% |
| South Eastern Asia | 1 | 0.1% |
| Western Europe | 3 | 0.3% | View All 6 Rows |
Sex and Age in Altamont
Sex and Age in Altamont
The most populous age groups in Altamont are 50 to 54 Years (82 | 17.7%) for men and 15 to 19 Years (41 | 9.3%) for women.
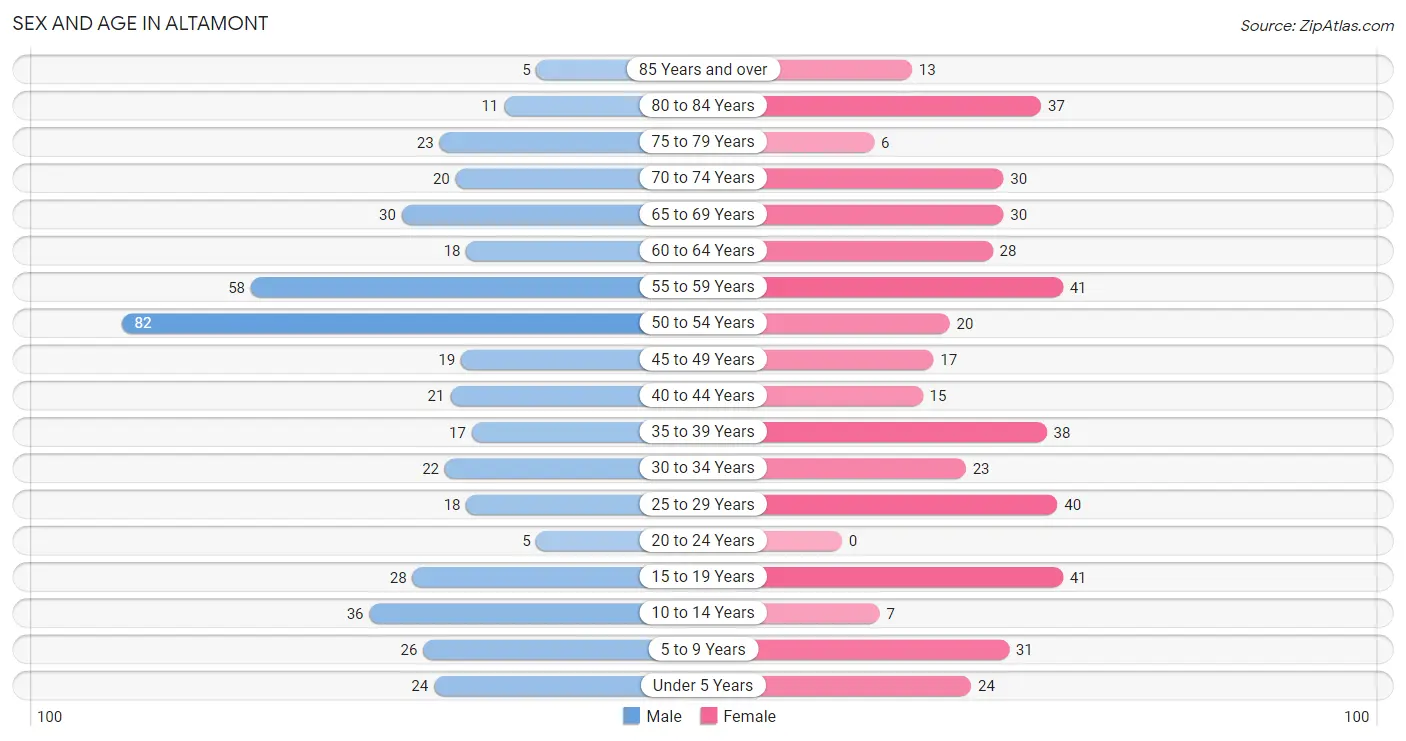
| Age Bracket | Male | Female |
| Under 5 Years | 24 (5.2%) | 24 (5.4%) |
| 5 to 9 Years | 26 (5.6%) | 31 (7.0%) |
| 10 to 14 Years | 36 (7.8%) | 7 (1.6%) |
| 15 to 19 Years | 28 (6.0%) | 41 (9.3%) |
| 20 to 24 Years | 5 (1.1%) | 0 (0.0%) |
| 25 to 29 Years | 18 (3.9%) | 40 (9.1%) |
| 30 to 34 Years | 22 (4.8%) | 23 (5.2%) |
| 35 to 39 Years | 17 (3.7%) | 38 (8.6%) |
| 40 to 44 Years | 21 (4.5%) | 15 (3.4%) |
| 45 to 49 Years | 19 (4.1%) | 17 (3.8%) |
| 50 to 54 Years | 82 (17.7%) | 20 (4.5%) |
| 55 to 59 Years | 58 (12.5%) | 41 (9.3%) |
| 60 to 64 Years | 18 (3.9%) | 28 (6.4%) |
| 65 to 69 Years | 30 (6.5%) | 30 (6.8%) |
| 70 to 74 Years | 20 (4.3%) | 30 (6.8%) |
| 75 to 79 Years | 23 (5.0%) | 6 (1.4%) |
| 80 to 84 Years | 11 (2.4%) | 37 (8.4%) |
| 85 Years and over | 5 (1.1%) | 13 (2.9%) |
| Total | 463 (100.0%) | 441 (100.0%) |
Families and Households in Altamont
Median Family Size in Altamont
The median family size in Altamont is 3.25 persons per family, with single male/father families (20 | 8.5%) accounting for the largest median family size of 4.2 persons per family. On the other hand, married-couple families (155 | 65.7%) represent the smallest median family size with 2.86 persons per family.
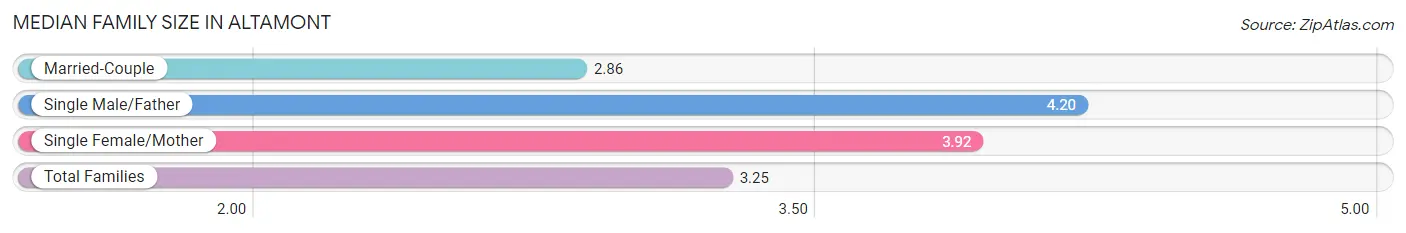
| Family Type | # Families | Family Size |
| Married-Couple | 155 (65.7%) | 2.86 |
| Single Male/Father | 20 (8.5%) | 4.20 |
| Single Female/Mother | 61 (25.9%) | 3.92 |
| Total Families | 236 (100.0%) | 3.25 |
Median Household Size in Altamont
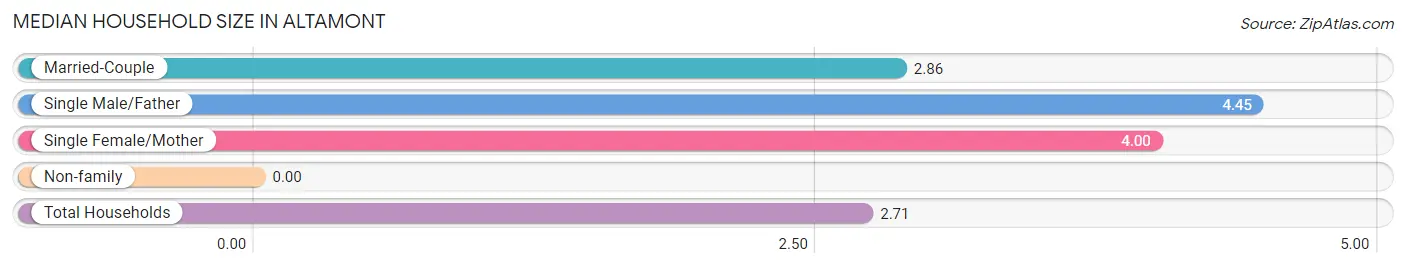
| Household Type | # Households | Household Size |
| Married-Couple | 155 (49.0%) | 2.86 |
| Single Male/Father | 20 (6.3%) | 4.45 |
| Single Female/Mother | 61 (19.3%) | 4.00 |
| Non-family | 80 (25.3%) | - |
| Total Households | 316 (100.0%) | 2.71 |
Household Size by Marriage Status in Altamont
Out of a total of 316 households in Altamont, 236 (74.7%) are family households, while 80 (25.3%) are nonfamily households. The most numerous type of family households are 2-person households, comprising 136, and the most common type of nonfamily households are 1-person households, comprising 80.
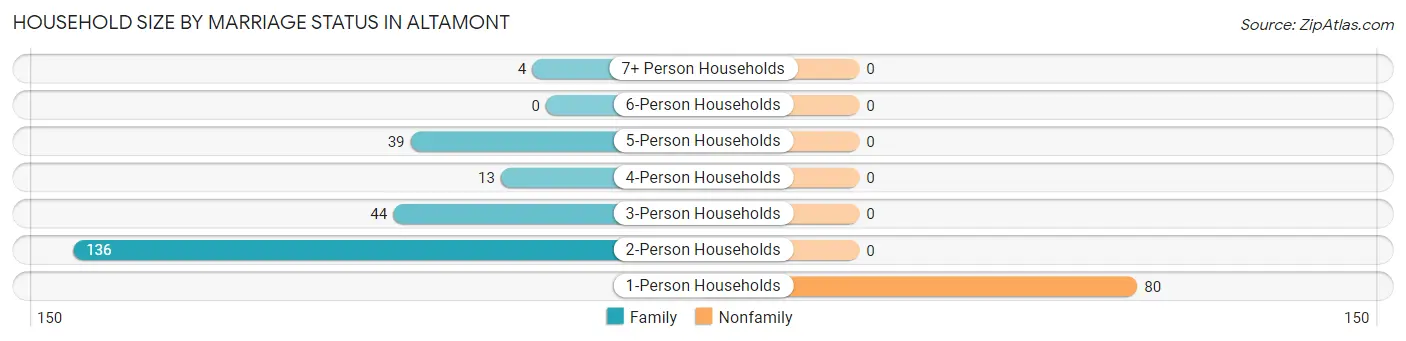
| Household Size | Family Households | Nonfamily Households |
| 1-Person Households | - | 80 (25.3%) |
| 2-Person Households | 136 (43.0%) | 0 (0.0%) |
| 3-Person Households | 44 (13.9%) | 0 (0.0%) |
| 4-Person Households | 13 (4.1%) | 0 (0.0%) |
| 5-Person Households | 39 (12.3%) | 0 (0.0%) |
| 6-Person Households | 0 (0.0%) | 0 (0.0%) |
| 7+ Person Households | 4 (1.3%) | 0 (0.0%) |
| Total | 236 (74.7%) | 80 (25.3%) |
Female Fertility in Altamont
Fertility by Age in Altamont
| Age Bracket | Women with Births | Births / 1,000 Women |
| 15 to 19 years | 0 (0.0%) | 0.0 |
| 20 to 34 years | 0 (0.0%) | 0.0 |
| 35 to 50 years | 0 (0.0%) | 0.0 |
| Total | 0 (0.0%) | 0.0 |
Fertility by Age by Marriage Status in Altamont
| Age Bracket | Married | Unmarried |
| 15 to 19 years | 0 (0.0%) | 0 (0.0%) |
| 20 to 34 years | 0 (0.0%) | 0 (0.0%) |
| 35 to 50 years | 0 (0.0%) | 0 (0.0%) |
| Total | 0 (0.0%) | 0 (0.0%) |
Fertility by Education in Altamont
| Educational Attainment | Women with Births | Births / 1,000 Women |
| Less than High School | 0 (0.0%) | 0.0 |
| High School Diploma | 0 (0.0%) | 0.0 |
| College or Associate's Degree | 0 (0.0%) | 0.0 |
| Bachelor's Degree | 0 (0.0%) | 0.0 |
| Graduate Degree | 0 (0.0%) | 0.0 |
| Total | 0 (0.0%) | 0.0 |
Fertility by Education by Marriage Status in Altamont
| Educational Attainment | Married | Unmarried |
| Less than High School | 0 (0.0%) | 0 (0.0%) |
| High School Diploma | 0 (0.0%) | 0 (0.0%) |
| College or Associate's Degree | 0 (0.0%) | 0 (0.0%) |
| Bachelor's Degree | 0 (0.0%) | 0 (0.0%) |
| Graduate Degree | 0 (0.0%) | 0 (0.0%) |
| Total | 0 (0.0%) | 0 (0.0%) |
Employment Characteristics in Altamont
Employment by Class of Employer in Altamont
Among the 271 employed individuals in Altamont, private company employees (141 | 52.0%), self-employed (not incorporated) (43 | 15.9%), and local government employees (23 | 8.5%) make up the most common classes of employment.
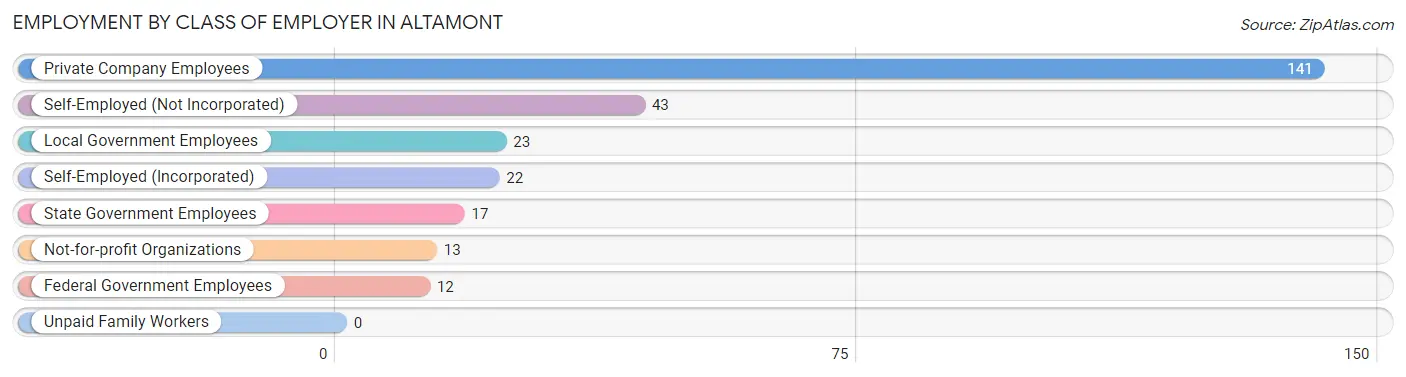
| Employer Class | # Employees | % Employees |
| Private Company Employees | 141 | 52.0% |
| Self-Employed (Incorporated) | 22 | 8.1% |
| Self-Employed (Not Incorporated) | 43 | 15.9% |
| Not-for-profit Organizations | 13 | 4.8% |
| Local Government Employees | 23 | 8.5% |
| State Government Employees | 17 | 6.3% |
| Federal Government Employees | 12 | 4.4% |
| Unpaid Family Workers | 0 | 0.0% |
| Total | 271 | 100.0% |
Employment Status by Age in Altamont
According to the labor force statistics for Altamont, out of the total population over 16 years of age (737), 38.1% or 281 individuals are in the labor force, with 3.6% or 10 of them unemployed. The age group with the highest labor force participation rate is 20 to 24 years, with 100.0% or 5 individuals in the labor force. Within the labor force, the 55 to 59 years age range has the highest percentage of unemployed individuals, with 12.2% or 6 of them being unemployed.
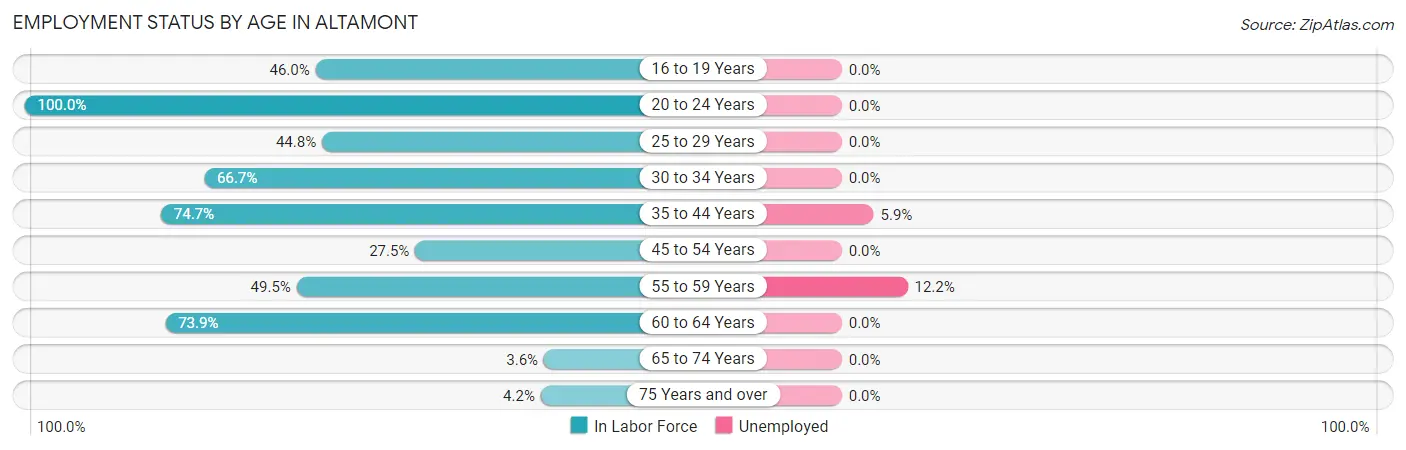
| Age Bracket | In Labor Force | Unemployed |
| 16 to 19 Years | 23 (46.0%) | 0 (0.0%) |
| 20 to 24 Years | 5 (100.0%) | 0 (0.0%) |
| 25 to 29 Years | 26 (44.8%) | 0 (0.0%) |
| 30 to 34 Years | 30 (66.7%) | 0 (0.0%) |
| 35 to 44 Years | 68 (74.7%) | 4 (5.9%) |
| 45 to 54 Years | 38 (27.5%) | 0 (0.0%) |
| 55 to 59 Years | 49 (49.5%) | 6 (12.2%) |
| 60 to 64 Years | 34 (73.9%) | 0 (0.0%) |
| 65 to 74 Years | 4 (3.6%) | 0 (0.0%) |
| 75 Years and over | 4 (4.2%) | 0 (0.0%) |
| Total | 281 (38.1%) | 10 (3.6%) |
Employment Status by Educational Attainment in Altamont
According to labor force statistics for Altamont, 51.4% of individuals (245) out of the total population between 25 and 64 years of age (477) are in the labor force, with 4.1% or 10 of them being unemployed. The group with the highest labor force participation rate are those with the educational attainment of college / associate degree, with 66.3% or 63 individuals in the labor force. Within the labor force, individuals with bachelor's degree or higher education have the highest percentage of unemployment, with 12.9% or 4 of them being unemployed.
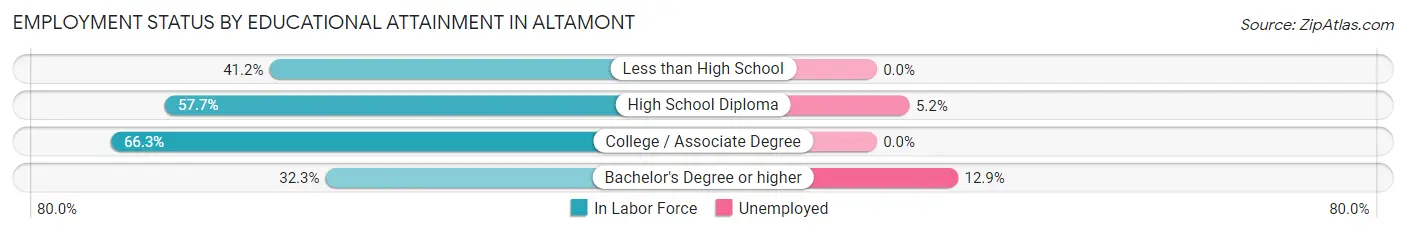
| Educational Attainment | In Labor Force | Unemployed |
| Less than High School | 35 (41.2%) | 0 (0.0%) |
| High School Diploma | 116 (57.7%) | 10 (5.2%) |
| College / Associate Degree | 63 (66.3%) | 0 (0.0%) |
| Bachelor's Degree or higher | 31 (32.3%) | 12 (12.9%) |
| Total | 245 (51.4%) | 20 (4.1%) |
Employment Occupations by Sex in Altamont
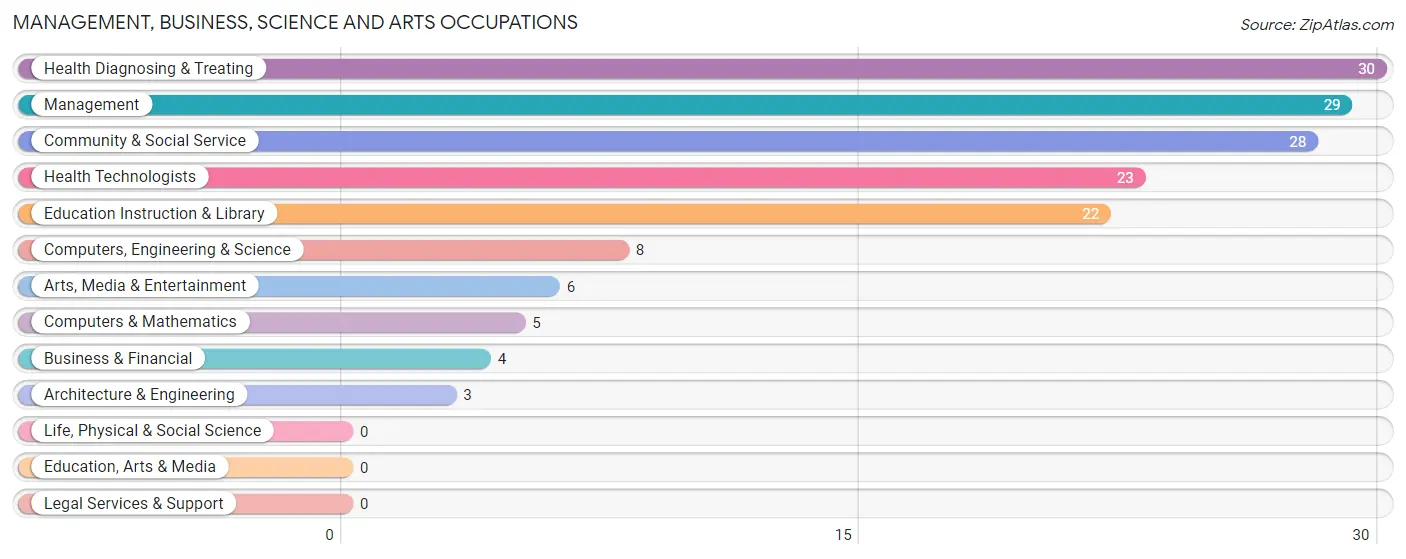
Management, Business, Science and Arts Occupations
The most common Management, Business, Science and Arts occupations in Altamont are Health Diagnosing & Treating (30 | 11.1%), Management (29 | 10.7%), Community & Social Service (28 | 10.3%), Health Technologists (23 | 8.5%), and Education Instruction & Library (22 | 8.1%).
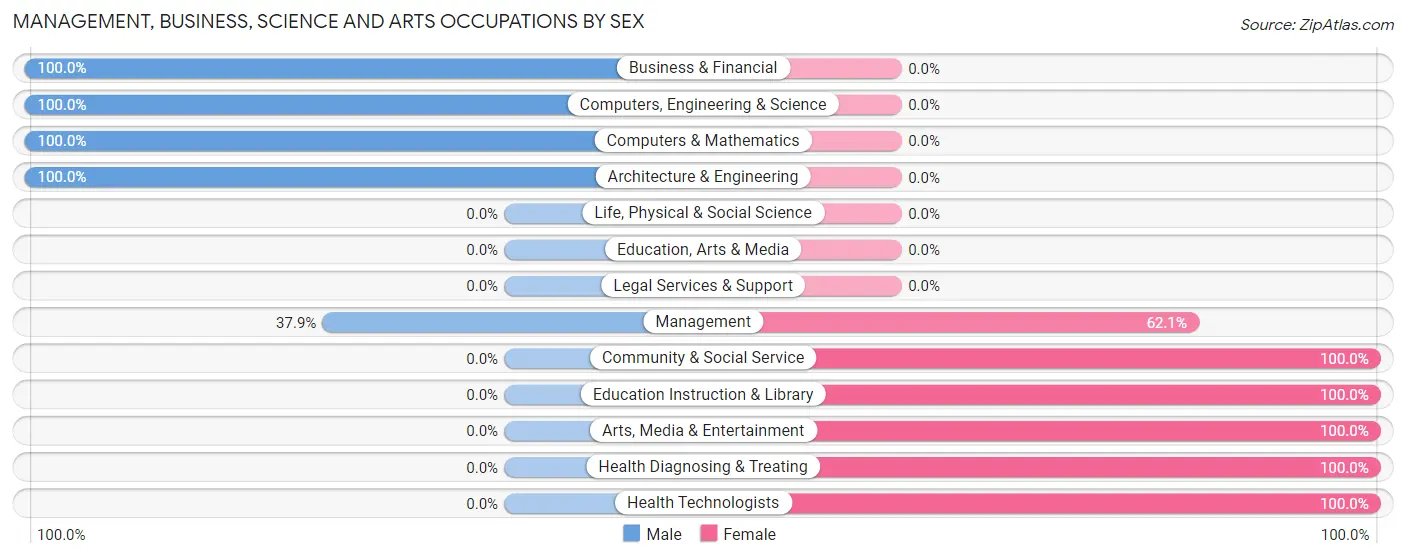
Management, Business, Science and Arts Occupations by Sex
Within the Management, Business, Science and Arts occupations in Altamont, the most male-oriented occupations are Business & Financial (100.0%), Computers, Engineering & Science (100.0%), and Computers & Mathematics (100.0%), while the most female-oriented occupations are Community & Social Service (100.0%), Education Instruction & Library (100.0%), and Arts, Media & Entertainment (100.0%).
| Occupation | Male | Female |
| Management | 11 (37.9%) | 18 (62.1%) |
| Business & Financial | 4 (100.0%) | 0 (0.0%) |
| Computers, Engineering & Science | 8 (100.0%) | 0 (0.0%) |
| Computers & Mathematics | 5 (100.0%) | 0 (0.0%) |
| Architecture & Engineering | 3 (100.0%) | 0 (0.0%) |
| Life, Physical & Social Science | 0 (0.0%) | 0 (0.0%) |
| Community & Social Service | 0 (0.0%) | 28 (100.0%) |
| Education, Arts & Media | 0 (0.0%) | 0 (0.0%) |
| Legal Services & Support | 0 (0.0%) | 0 (0.0%) |
| Education Instruction & Library | 0 (0.0%) | 22 (100.0%) |
| Arts, Media & Entertainment | 0 (0.0%) | 6 (100.0%) |
| Health Diagnosing & Treating | 0 (0.0%) | 30 (100.0%) |
| Health Technologists | 0 (0.0%) | 23 (100.0%) |
| Total (Category) | 23 (23.2%) | 76 (76.8%) |
| Total (Overall) | 103 (38.0%) | 168 (62.0%) |
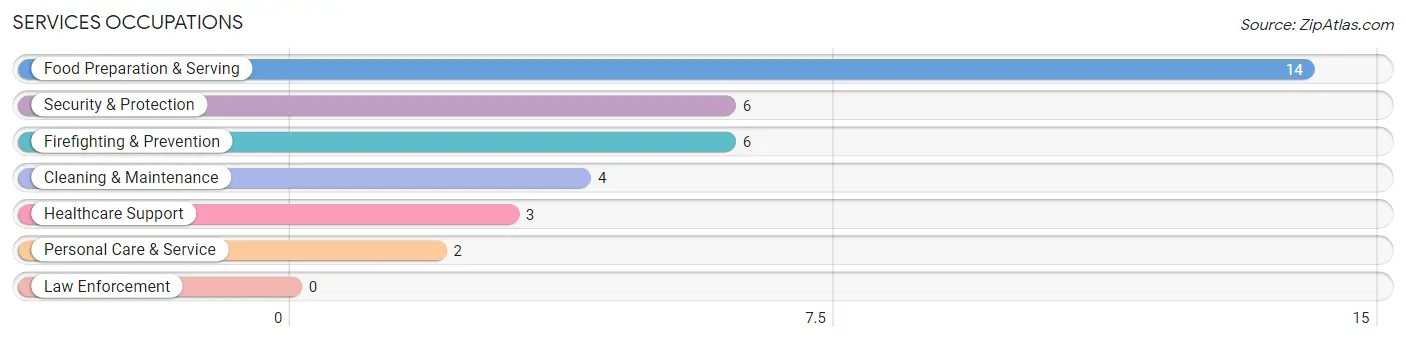
Services Occupations
The most common Services occupations in Altamont are Food Preparation & Serving (14 | 5.2%), Security & Protection (6 | 2.2%), Firefighting & Prevention (6 | 2.2%), Cleaning & Maintenance (4 | 1.5%), and Healthcare Support (3 | 1.1%).
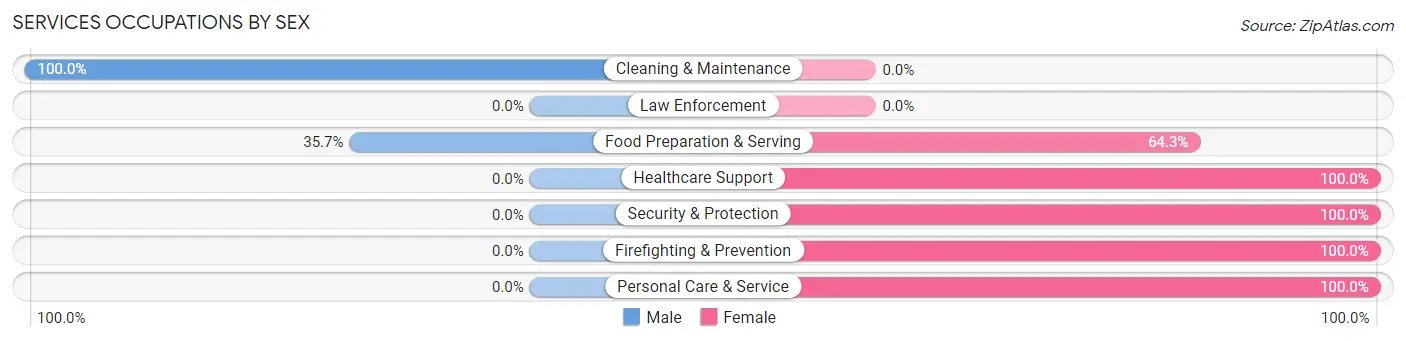
Services Occupations by Sex
Within the Services occupations in Altamont, the most male-oriented occupations are Cleaning & Maintenance (100.0%), and Food Preparation & Serving (35.7%), while the most female-oriented occupations are Healthcare Support (100.0%), Security & Protection (100.0%), and Firefighting & Prevention (100.0%).
| Occupation | Male | Female |
| Healthcare Support | 0 (0.0%) | 3 (100.0%) |
| Security & Protection | 0 (0.0%) | 6 (100.0%) |
| Firefighting & Prevention | 0 (0.0%) | 6 (100.0%) |
| Law Enforcement | 0 (0.0%) | 0 (0.0%) |
| Food Preparation & Serving | 5 (35.7%) | 9 (64.3%) |
| Cleaning & Maintenance | 4 (100.0%) | 0 (0.0%) |
| Personal Care & Service | 0 (0.0%) | 2 (100.0%) |
| Total (Category) | 9 (31.0%) | 20 (69.0%) |
| Total (Overall) | 103 (38.0%) | 168 (62.0%) |
Sales and Office Occupations
The most common Sales and Office occupations in Altamont are Sales & Related (33 | 12.2%), and Office & Administration (16 | 5.9%).
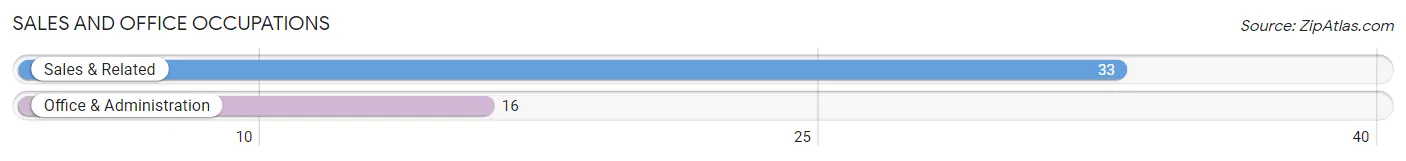
Sales and Office Occupations by Sex
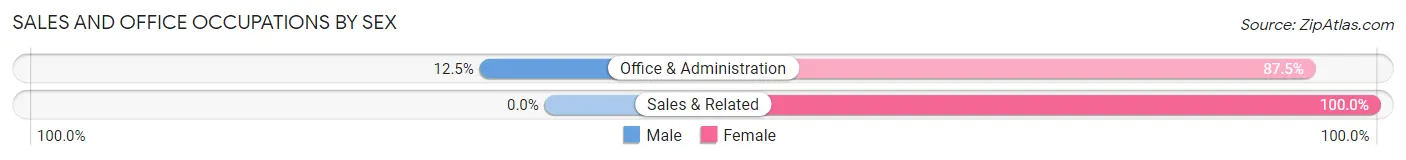
| Occupation | Male | Female |
| Sales & Related | 0 (0.0%) | 33 (100.0%) |
| Office & Administration | 2 (12.5%) | 14 (87.5%) |
| Total (Category) | 2 (4.1%) | 47 (95.9%) |
| Total (Overall) | 103 (38.0%) | 168 (62.0%) |
Natural Resources, Construction and Maintenance Occupations
The most common Natural Resources, Construction and Maintenance occupations in Altamont are Construction & Extraction (15 | 5.5%), Installation, Maintenance & Repair (15 | 5.5%), and Farming, Fishing & Forestry (14 | 5.2%).
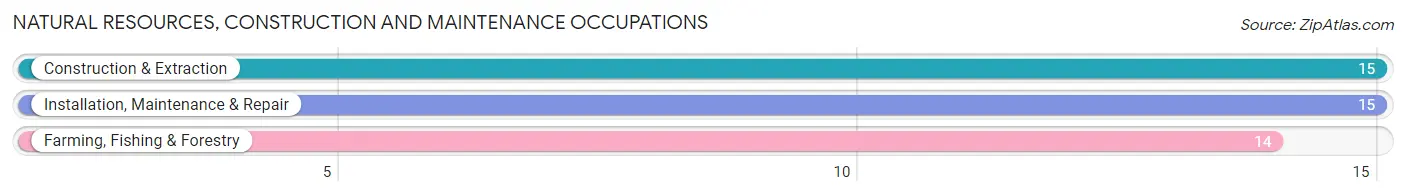
Natural Resources, Construction and Maintenance Occupations by Sex
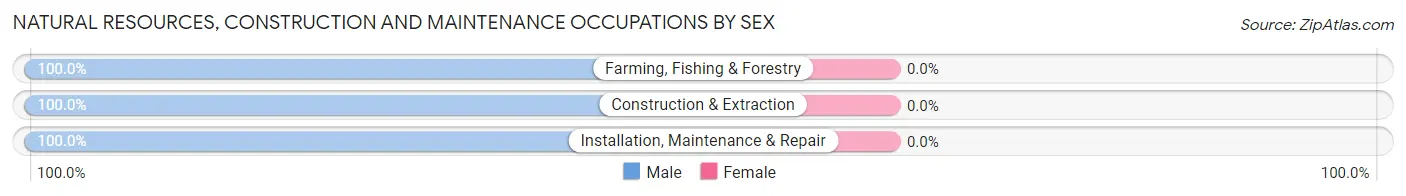
| Occupation | Male | Female |
| Farming, Fishing & Forestry | 14 (100.0%) | 0 (0.0%) |
| Construction & Extraction | 15 (100.0%) | 0 (0.0%) |
| Installation, Maintenance & Repair | 15 (100.0%) | 0 (0.0%) |
| Total (Category) | 44 (100.0%) | 0 (0.0%) |
| Total (Overall) | 103 (38.0%) | 168 (62.0%) |
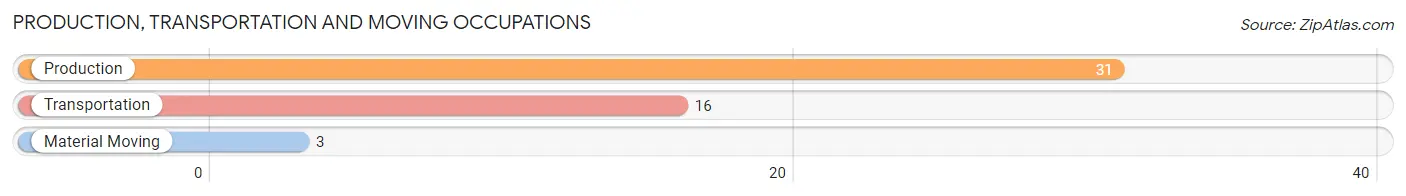
Production, Transportation and Moving Occupations
The most common Production, Transportation and Moving occupations in Altamont are Production (31 | 11.4%), Transportation (16 | 5.9%), and Material Moving (3 | 1.1%).
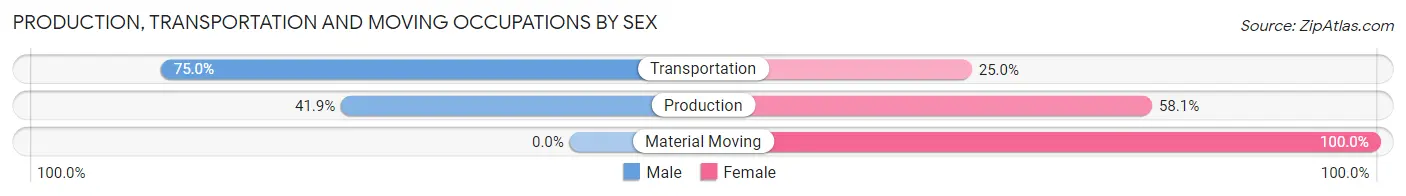
Production, Transportation and Moving Occupations by Sex
| Occupation | Male | Female |
| Production | 13 (41.9%) | 18 (58.1%) |
| Transportation | 12 (75.0%) | 4 (25.0%) |
| Material Moving | 0 (0.0%) | 3 (100.0%) |
| Total (Category) | 25 (50.0%) | 25 (50.0%) |
| Total (Overall) | 103 (38.0%) | 168 (62.0%) |
Employment Industries by Sex in Altamont
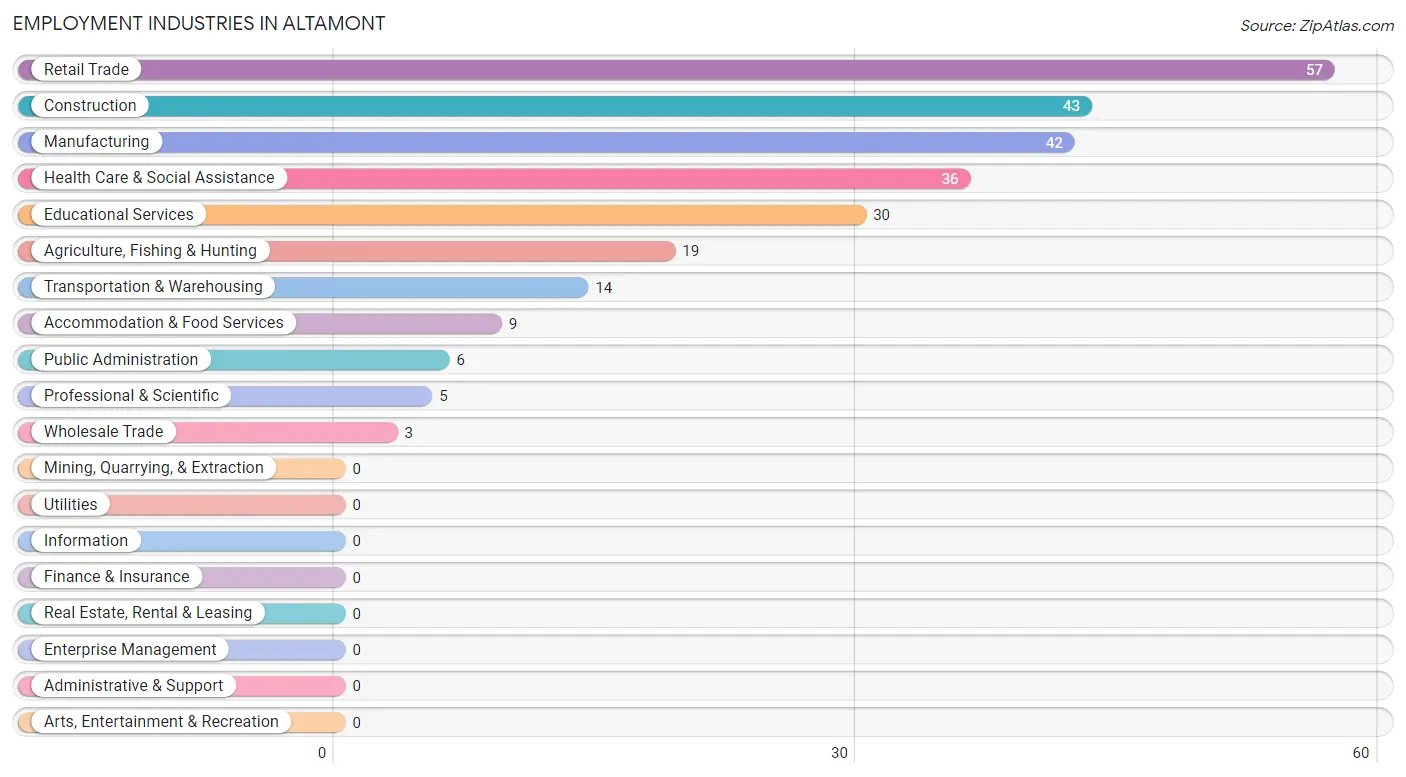
Employment Industries in Altamont
The major employment industries in Altamont include Retail Trade (57 | 21.0%), Construction (43 | 15.9%), Manufacturing (42 | 15.5%), Health Care & Social Assistance (36 | 13.3%), and Educational Services (30 | 11.1%).
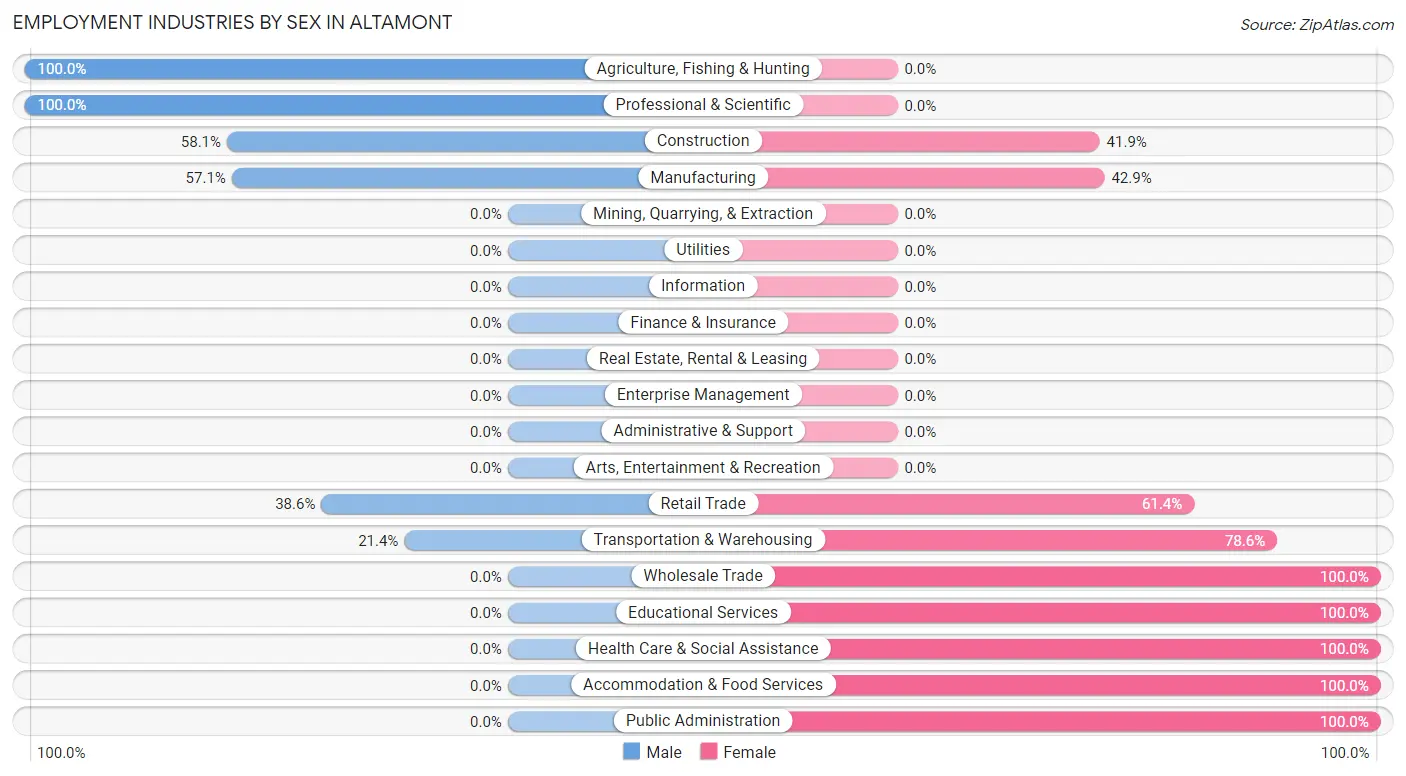
Employment Industries by Sex in Altamont
The Altamont industries that see more men than women are Agriculture, Fishing & Hunting (100.0%), Professional & Scientific (100.0%), and Construction (58.1%), whereas the industries that tend to have a higher number of women are Wholesale Trade (100.0%), Educational Services (100.0%), and Health Care & Social Assistance (100.0%).
| Industry | Male | Female |
| Agriculture, Fishing & Hunting | 19 (100.0%) | 0 (0.0%) |
| Mining, Quarrying, & Extraction | 0 (0.0%) | 0 (0.0%) |
| Construction | 25 (58.1%) | 18 (41.9%) |
| Manufacturing | 24 (57.1%) | 18 (42.9%) |
| Wholesale Trade | 0 (0.0%) | 3 (100.0%) |
| Retail Trade | 22 (38.6%) | 35 (61.4%) |
| Transportation & Warehousing | 3 (21.4%) | 11 (78.6%) |
| Utilities | 0 (0.0%) | 0 (0.0%) |
| Information | 0 (0.0%) | 0 (0.0%) |
| Finance & Insurance | 0 (0.0%) | 0 (0.0%) |
| Real Estate, Rental & Leasing | 0 (0.0%) | 0 (0.0%) |
| Professional & Scientific | 5 (100.0%) | 0 (0.0%) |
| Enterprise Management | 0 (0.0%) | 0 (0.0%) |
| Administrative & Support | 0 (0.0%) | 0 (0.0%) |
| Educational Services | 0 (0.0%) | 30 (100.0%) |
| Health Care & Social Assistance | 0 (0.0%) | 36 (100.0%) |
| Arts, Entertainment & Recreation | 0 (0.0%) | 0 (0.0%) |
| Accommodation & Food Services | 0 (0.0%) | 9 (100.0%) |
| Public Administration | 0 (0.0%) | 6 (100.0%) |
| Total | 103 (38.0%) | 168 (62.0%) |
Education in Altamont
School Enrollment in Altamont
The most common levels of schooling among the 204 students in Altamont are high school (54 | 26.5%), elementary school (48 | 23.5%), and nursery / preschool (42 | 20.6%).
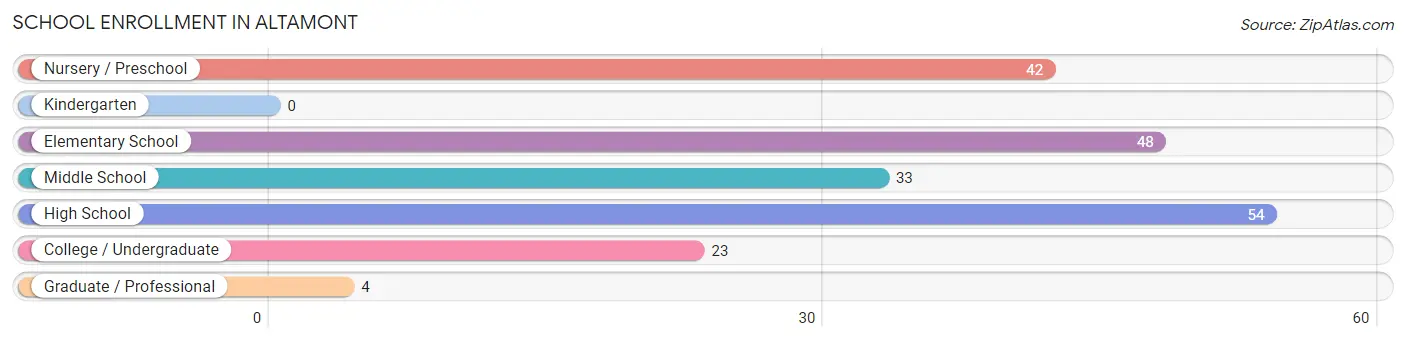
| School Level | # Students | % Students |
| Nursery / Preschool | 42 | 20.6% |
| Kindergarten | 0 | 0.0% |
| Elementary School | 48 | 23.5% |
| Middle School | 33 | 16.2% |
| High School | 54 | 26.5% |
| College / Undergraduate | 23 | 11.3% |
| Graduate / Professional | 4 | 2.0% |
| Total | 204 | 100.0% |
School Enrollment by Age by Funding Source in Altamont
Out of a total of 204 students who are enrolled in schools in Altamont, 26 (12.7%) attend a private institution, while the remaining 178 (87.3%) are enrolled in public schools. The age group of 10 to 14 year olds has the highest likelihood of being enrolled in private schools, with 12 (27.9% in the age bracket) enrolled. Conversely, the age group of 20 to 24 year olds has the lowest likelihood of being enrolled in a private school, with 5 (100.0% in the age bracket) attending a public institution.
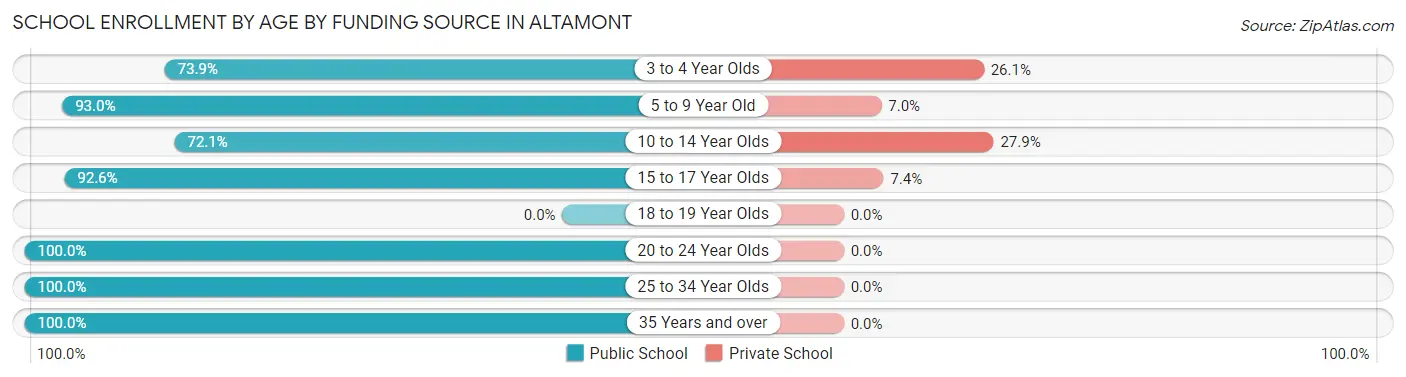
| Age Bracket | Public School | Private School |
| 3 to 4 Year Olds | 17 (73.9%) | 6 (26.1%) |
| 5 to 9 Year Old | 53 (93.0%) | 4 (7.0%) |
| 10 to 14 Year Olds | 31 (72.1%) | 12 (27.9%) |
| 15 to 17 Year Olds | 50 (92.6%) | 4 (7.4%) |
| 18 to 19 Year Olds | 0 (0.0%) | 0 (0.0%) |
| 20 to 24 Year Olds | 5 (100.0%) | 0 (0.0%) |
| 25 to 34 Year Olds | 18 (100.0%) | 0 (0.0%) |
| 35 Years and over | 4 (100.0%) | 0 (0.0%) |
| Total | 178 (87.3%) | 26 (12.7%) |
Educational Attainment by Field of Study in Altamont
Business (62 | 54.9%), science & technology (19 | 16.8%), education (16 | 14.2%), computers & mathematics (8 | 7.1%), and social sciences (5 | 4.4%) are the most common fields of study among 113 individuals in Altamont who have obtained a bachelor's degree or higher.
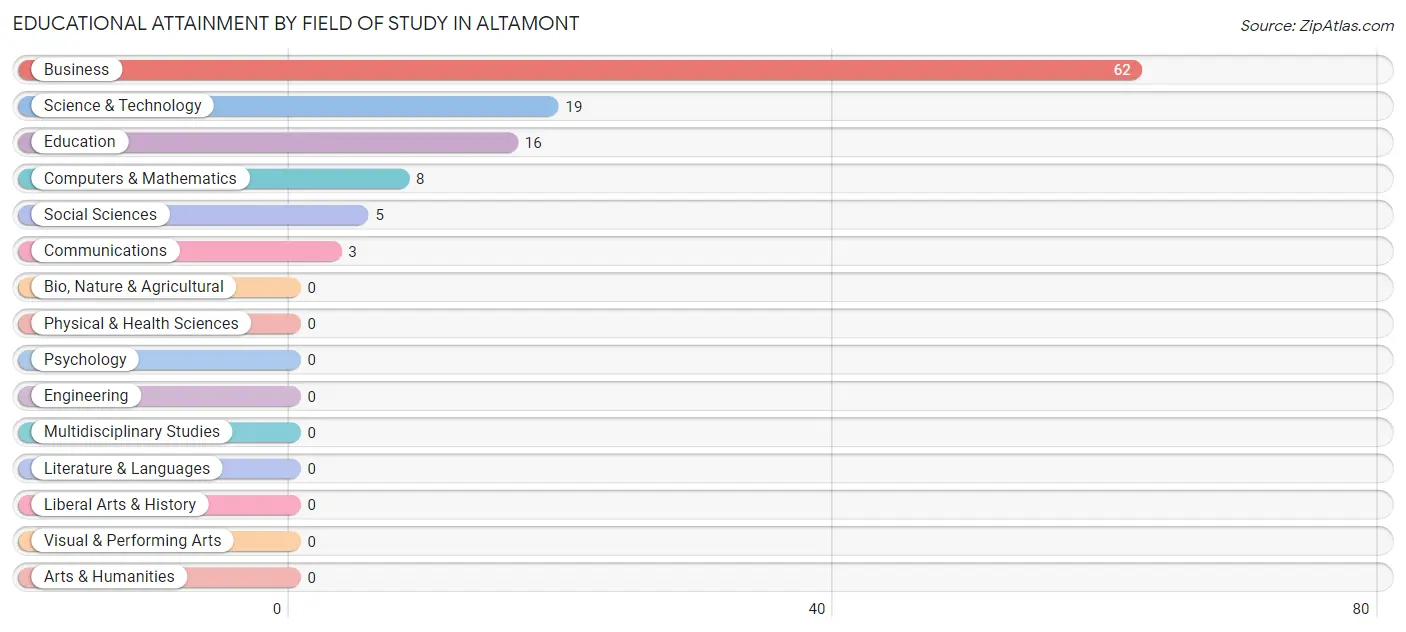
| Field of Study | # Graduates | % Graduates |
| Computers & Mathematics | 8 | 7.1% |
| Bio, Nature & Agricultural | 0 | 0.0% |
| Physical & Health Sciences | 0 | 0.0% |
| Psychology | 0 | 0.0% |
| Social Sciences | 5 | 4.4% |
| Engineering | 0 | 0.0% |
| Multidisciplinary Studies | 0 | 0.0% |
| Science & Technology | 19 | 16.8% |
| Business | 62 | 54.9% |
| Education | 16 | 14.2% |
| Literature & Languages | 0 | 0.0% |
| Liberal Arts & History | 0 | 0.0% |
| Visual & Performing Arts | 0 | 0.0% |
| Communications | 3 | 2.6% |
| Arts & Humanities | 0 | 0.0% |
| Total | 113 | 100.0% |
Transportation & Commute in Altamont
Vehicle Availability by Sex in Altamont
The most prevalent vehicle ownership categories in Altamont are males with 2 vehicles (32, accounting for 31.1%) and females with 2 vehicles (56, making up 19.1%).
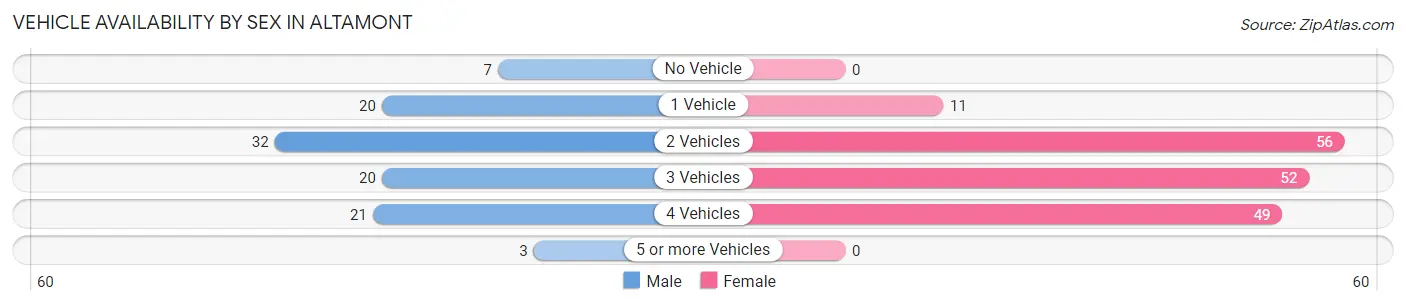
| Vehicles Available | Male | Female |
| No Vehicle | 7 (6.8%) | 0 (0.0%) |
| 1 Vehicle | 20 (19.4%) | 11 (6.6%) |
| 2 Vehicles | 32 (31.1%) | 56 (33.3%) |
| 3 Vehicles | 20 (19.4%) | 52 (30.9%) |
| 4 Vehicles | 21 (20.4%) | 49 (29.2%) |
| 5 or more Vehicles | 3 (2.9%) | 0 (0.0%) |
| Total | 103 (100.0%) | 168 (100.0%) |
Commute Time in Altamont
The most frequently occuring commute durations in Altamont are 45 to 59 minutes (35 commuters, 15.0%), 40 to 44 minutes (33 commuters, 14.2%), and 5 to 9 minutes (30 commuters, 12.9%).
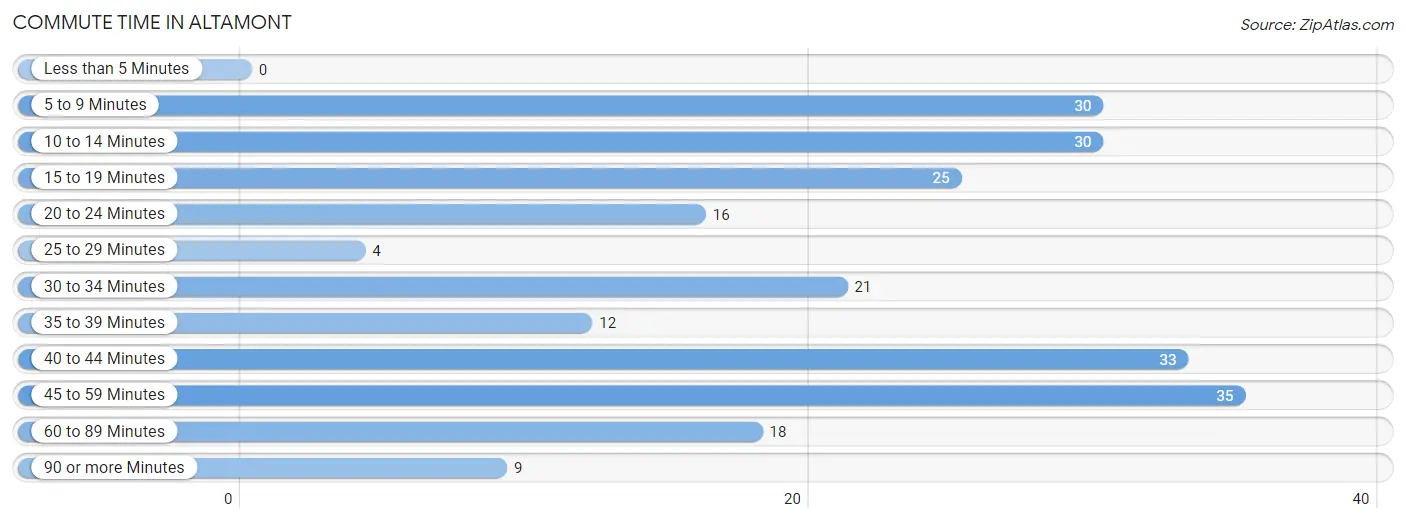
| Commute Time | # Commuters | % Commuters |
| Less than 5 Minutes | 0 | 0.0% |
| 5 to 9 Minutes | 30 | 12.9% |
| 10 to 14 Minutes | 30 | 12.9% |
| 15 to 19 Minutes | 25 | 10.7% |
| 20 to 24 Minutes | 16 | 6.9% |
| 25 to 29 Minutes | 4 | 1.7% |
| 30 to 34 Minutes | 21 | 9.0% |
| 35 to 39 Minutes | 12 | 5.1% |
| 40 to 44 Minutes | 33 | 14.2% |
| 45 to 59 Minutes | 35 | 15.0% |
| 60 to 89 Minutes | 18 | 7.7% |
| 90 or more Minutes | 9 | 3.9% |
Commute Time by Sex in Altamont
The most common commute times in Altamont are 45 to 59 minutes (20 commuters, 22.7%) for males and 10 to 14 minutes (25 commuters, 17.2%) for females.
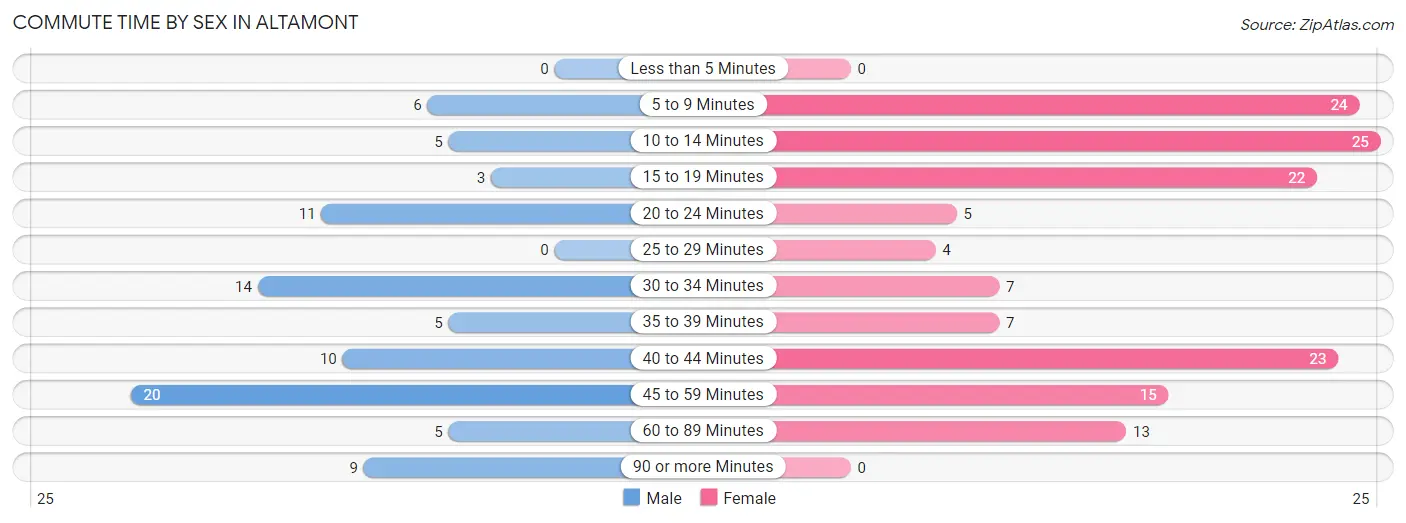
| Commute Time | Male | Female |
| Less than 5 Minutes | 0 (0.0%) | 0 (0.0%) |
| 5 to 9 Minutes | 6 (6.8%) | 24 (16.6%) |
| 10 to 14 Minutes | 5 (5.7%) | 25 (17.2%) |
| 15 to 19 Minutes | 3 (3.4%) | 22 (15.2%) |
| 20 to 24 Minutes | 11 (12.5%) | 5 (3.5%) |
| 25 to 29 Minutes | 0 (0.0%) | 4 (2.8%) |
| 30 to 34 Minutes | 14 (15.9%) | 7 (4.8%) |
| 35 to 39 Minutes | 5 (5.7%) | 7 (4.8%) |
| 40 to 44 Minutes | 10 (11.4%) | 23 (15.9%) |
| 45 to 59 Minutes | 20 (22.7%) | 15 (10.3%) |
| 60 to 89 Minutes | 5 (5.7%) | 13 (9.0%) |
| 90 or more Minutes | 9 (10.2%) | 0 (0.0%) |
Time of Departure to Work by Sex in Altamont
The most frequent times of departure to work in Altamont are 12:00 AM to 4:59 AM (22, 25.0%) for males and 12:00 AM to 4:59 AM (25, 17.2%) for females.
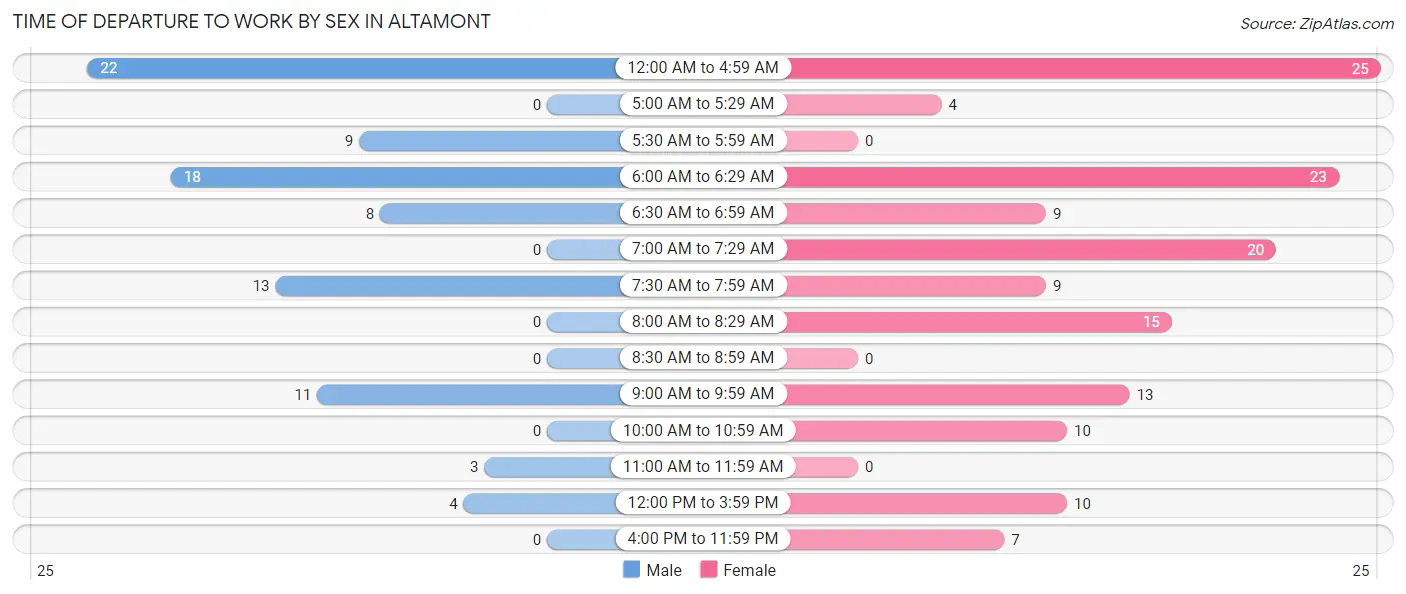
| Time of Departure | Male | Female |
| 12:00 AM to 4:59 AM | 22 (25.0%) | 25 (17.2%) |
| 5:00 AM to 5:29 AM | 0 (0.0%) | 4 (2.8%) |
| 5:30 AM to 5:59 AM | 9 (10.2%) | 0 (0.0%) |
| 6:00 AM to 6:29 AM | 18 (20.4%) | 23 (15.9%) |
| 6:30 AM to 6:59 AM | 8 (9.1%) | 9 (6.2%) |
| 7:00 AM to 7:29 AM | 0 (0.0%) | 20 (13.8%) |
| 7:30 AM to 7:59 AM | 13 (14.8%) | 9 (6.2%) |
| 8:00 AM to 8:29 AM | 0 (0.0%) | 15 (10.3%) |
| 8:30 AM to 8:59 AM | 0 (0.0%) | 0 (0.0%) |
| 9:00 AM to 9:59 AM | 11 (12.5%) | 13 (9.0%) |
| 10:00 AM to 10:59 AM | 0 (0.0%) | 10 (6.9%) |
| 11:00 AM to 11:59 AM | 3 (3.4%) | 0 (0.0%) |
| 12:00 PM to 3:59 PM | 4 (4.5%) | 10 (6.9%) |
| 4:00 PM to 11:59 PM | 0 (0.0%) | 7 (4.8%) |
| Total | 88 (100.0%) | 145 (100.0%) |
Housing Occupancy in Altamont
Occupancy by Ownership in Altamont
Of the total 316 dwellings in Altamont, owner-occupied units account for 290 (91.8%), while renter-occupied units make up 26 (8.2%).
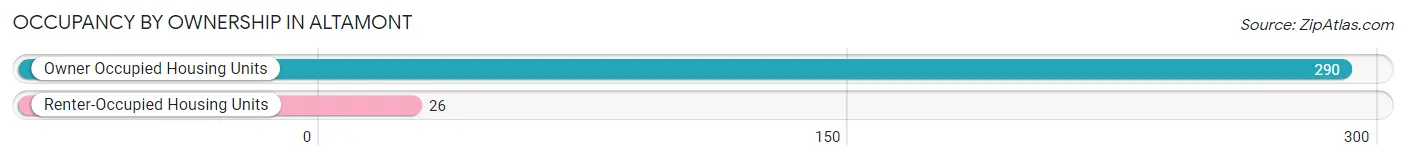
| Occupancy | # Housing Units | % Housing Units |
| Owner Occupied Housing Units | 290 | 91.8% |
| Renter-Occupied Housing Units | 26 | 8.2% |
| Total Occupied Housing Units | 316 | 100.0% |
Occupancy by Household Size in Altamont
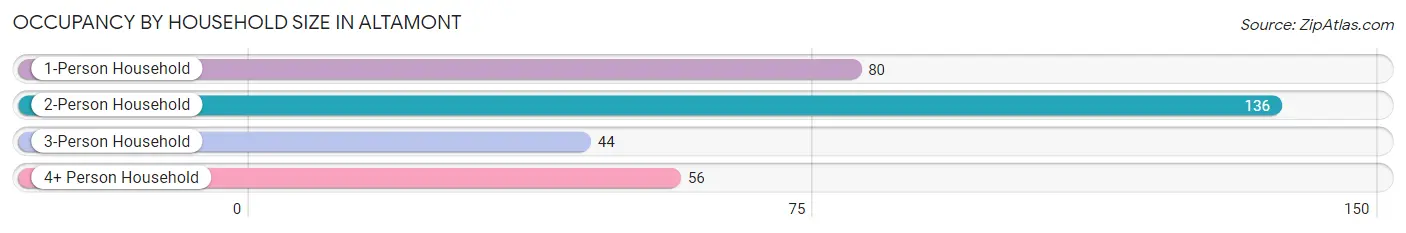
| Household Size | # Housing Units | % Housing Units |
| 1-Person Household | 80 | 25.3% |
| 2-Person Household | 136 | 43.0% |
| 3-Person Household | 44 | 13.9% |
| 4+ Person Household | 56 | 17.7% |
| Total Housing Units | 316 | 100.0% |
Occupancy by Ownership by Household Size in Altamont
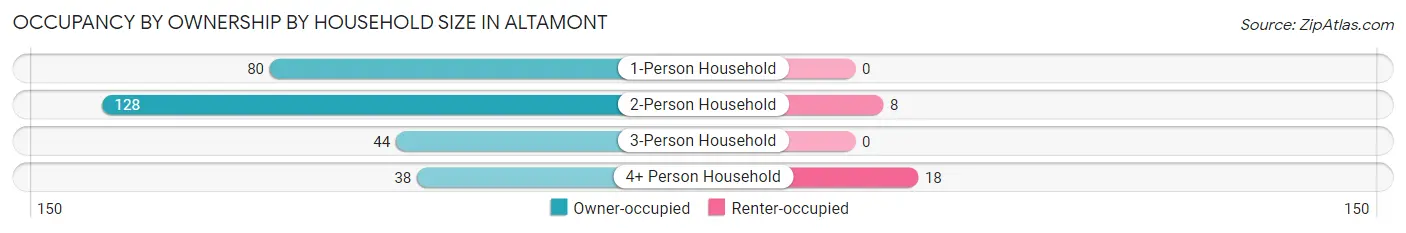
| Household Size | Owner-occupied | Renter-occupied |
| 1-Person Household | 80 (100.0%) | 0 (0.0%) |
| 2-Person Household | 128 (94.1%) | 8 (5.9%) |
| 3-Person Household | 44 (100.0%) | 0 (0.0%) |
| 4+ Person Household | 38 (67.9%) | 18 (32.1%) |
| Total Housing Units | 290 (91.8%) | 26 (8.2%) |
Occupancy by Educational Attainment in Altamont
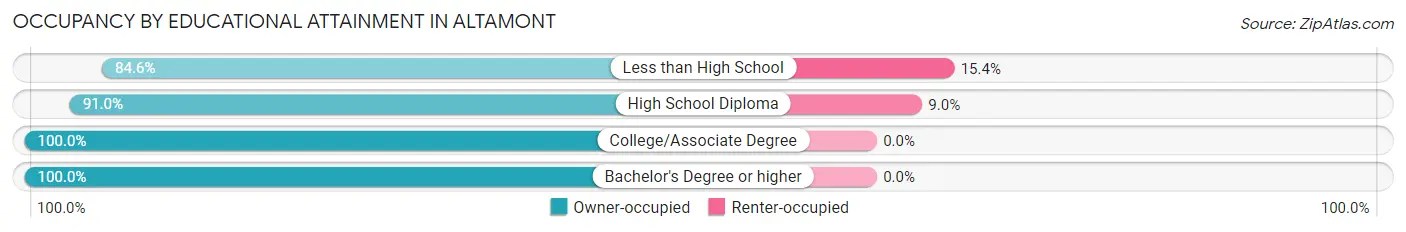
| Household Size | Owner-occupied | Renter-occupied |
| Less than High School | 66 (84.6%) | 12 (15.4%) |
| High School Diploma | 142 (91.0%) | 14 (9.0%) |
| College/Associate Degree | 69 (100.0%) | 0 (0.0%) |
| Bachelor's Degree or higher | 13 (100.0%) | 0 (0.0%) |
Occupancy by Age of Householder in Altamont
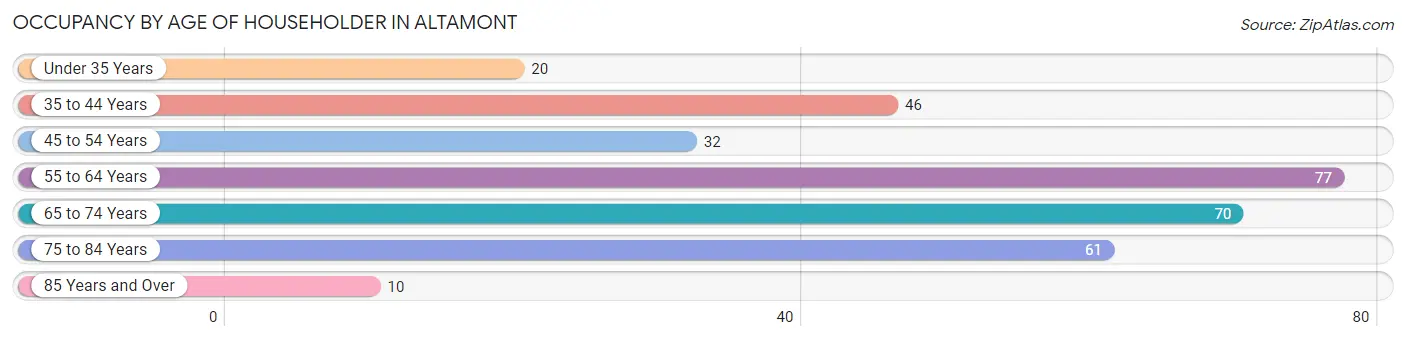
| Age Bracket | # Households | % Households |
| Under 35 Years | 20 | 6.3% |
| 35 to 44 Years | 46 | 14.6% |
| 45 to 54 Years | 32 | 10.1% |
| 55 to 64 Years | 77 | 24.4% |
| 65 to 74 Years | 70 | 22.2% |
| 75 to 84 Years | 61 | 19.3% |
| 85 Years and Over | 10 | 3.2% |
| Total | 316 | 100.0% |
Housing Finances in Altamont
Median Income by Occupancy in Altamont
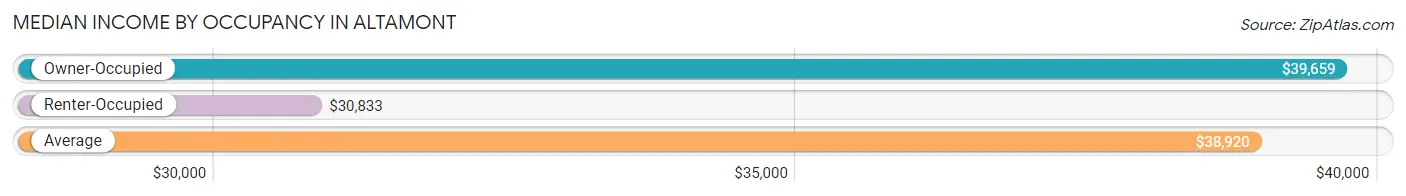
| Occupancy Type | # Households | Median Income |
| Owner-Occupied | 290 (91.8%) | $39,659 |
| Renter-Occupied | 26 (8.2%) | $30,833 |
| Average | 316 (100.0%) | $38,920 |
Occupancy by Householder Income Bracket in Altamont
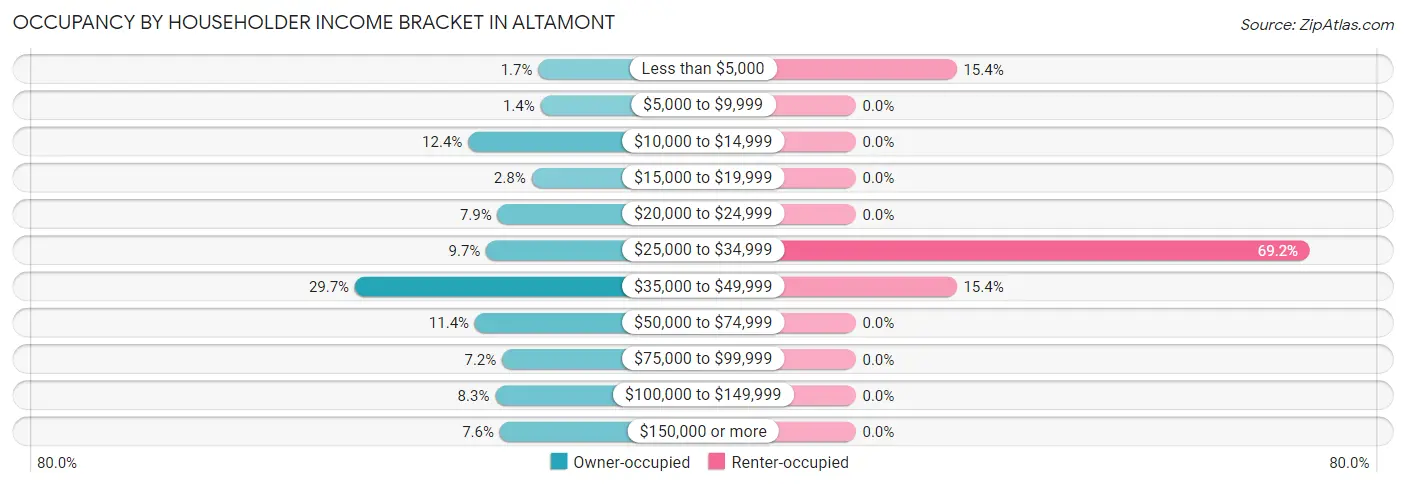
| Income Bracket | Owner-occupied | Renter-occupied |
| Less than $5,000 | 5 (1.7%) | 4 (15.4%) |
| $5,000 to $9,999 | 4 (1.4%) | 0 (0.0%) |
| $10,000 to $14,999 | 36 (12.4%) | 0 (0.0%) |
| $15,000 to $19,999 | 8 (2.8%) | 0 (0.0%) |
| $20,000 to $24,999 | 23 (7.9%) | 0 (0.0%) |
| $25,000 to $34,999 | 28 (9.7%) | 18 (69.2%) |
| $35,000 to $49,999 | 86 (29.7%) | 4 (15.4%) |
| $50,000 to $74,999 | 33 (11.4%) | 0 (0.0%) |
| $75,000 to $99,999 | 21 (7.2%) | 0 (0.0%) |
| $100,000 to $149,999 | 24 (8.3%) | 0 (0.0%) |
| $150,000 or more | 22 (7.6%) | 0 (0.0%) |
| Total | 290 (100.0%) | 26 (100.0%) |
Monthly Housing Cost Tiers in Altamont
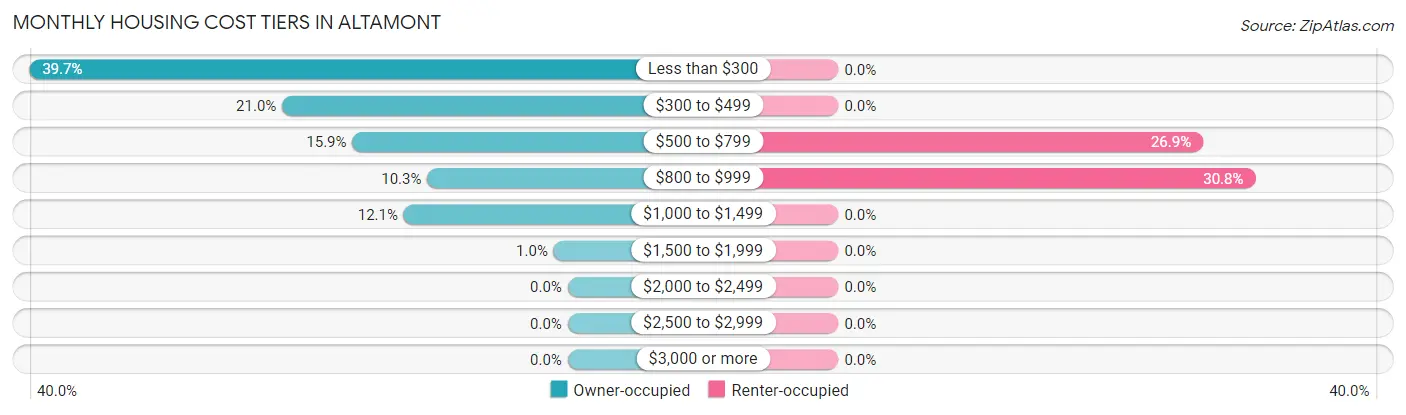
| Monthly Cost | Owner-occupied | Renter-occupied |
| Less than $300 | 115 (39.7%) | 0 (0.0%) |
| $300 to $499 | 61 (21.0%) | 0 (0.0%) |
| $500 to $799 | 46 (15.9%) | 7 (26.9%) |
| $800 to $999 | 30 (10.3%) | 8 (30.8%) |
| $1,000 to $1,499 | 35 (12.1%) | 0 (0.0%) |
| $1,500 to $1,999 | 3 (1.0%) | 0 (0.0%) |
| $2,000 to $2,499 | 0 (0.0%) | 0 (0.0%) |
| $2,500 to $2,999 | 0 (0.0%) | 0 (0.0%) |
| $3,000 or more | 0 (0.0%) | 0 (0.0%) |
| Total | 290 (100.0%) | 26 (100.0%) |
Physical Housing Characteristics in Altamont
Housing Structures in Altamont
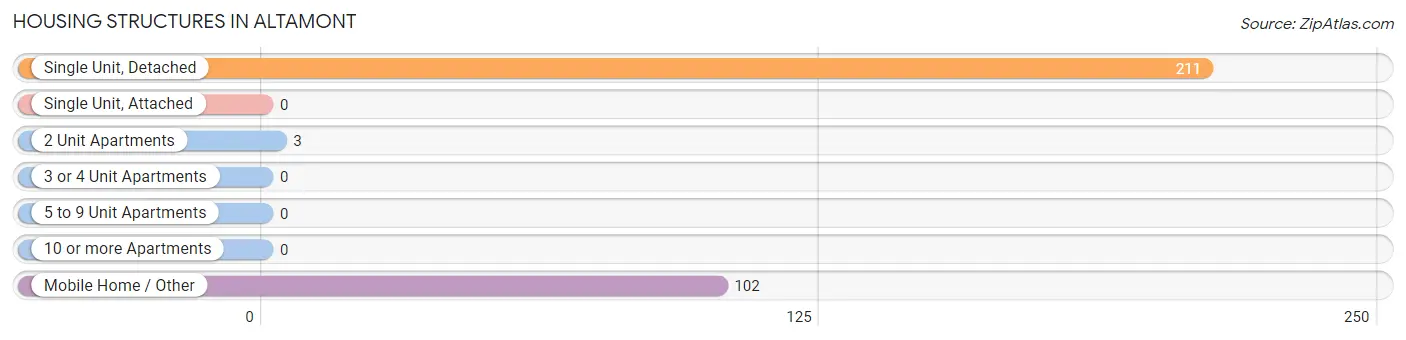
| Structure Type | # Housing Units | % Housing Units |
| Single Unit, Detached | 211 | 66.8% |
| Single Unit, Attached | 0 | 0.0% |
| 2 Unit Apartments | 3 | 0.9% |
| 3 or 4 Unit Apartments | 0 | 0.0% |
| 5 to 9 Unit Apartments | 0 | 0.0% |
| 10 or more Apartments | 0 | 0.0% |
| Mobile Home / Other | 102 | 32.3% |
| Total | 316 | 100.0% |
Housing Structures by Occupancy in Altamont
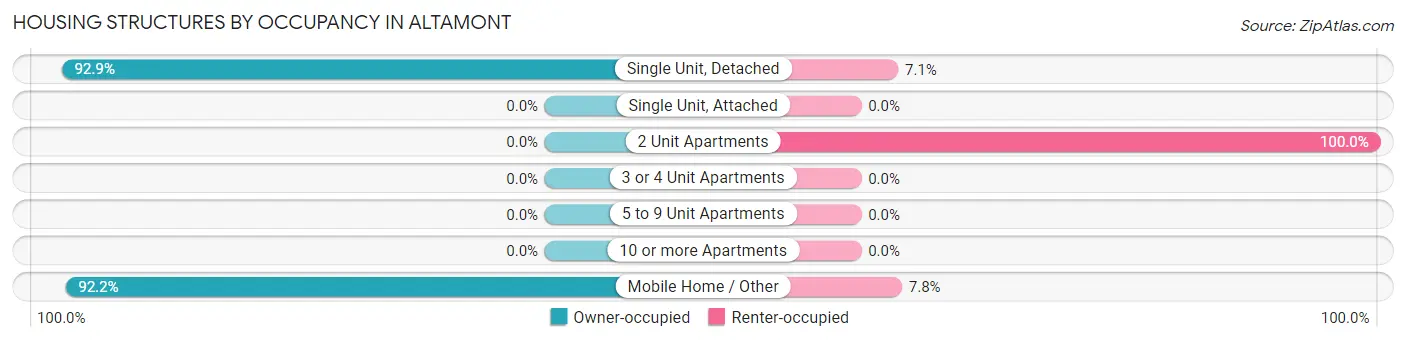
| Structure Type | Owner-occupied | Renter-occupied |
| Single Unit, Detached | 196 (92.9%) | 15 (7.1%) |
| Single Unit, Attached | 0 (0.0%) | 0 (0.0%) |
| 2 Unit Apartments | 0 (0.0%) | 3 (100.0%) |
| 3 or 4 Unit Apartments | 0 (0.0%) | 0 (0.0%) |
| 5 to 9 Unit Apartments | 0 (0.0%) | 0 (0.0%) |
| 10 or more Apartments | 0 (0.0%) | 0 (0.0%) |
| Mobile Home / Other | 94 (92.2%) | 8 (7.8%) |
| Total | 290 (91.8%) | 26 (8.2%) |
Housing Structures by Number of Rooms in Altamont
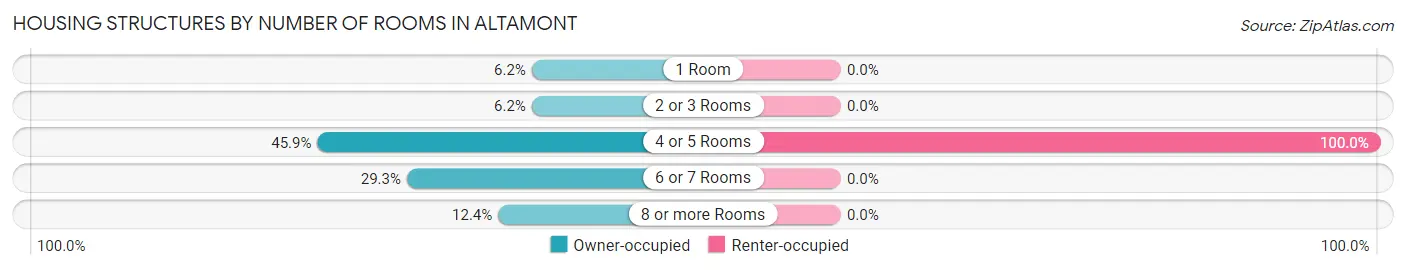
| Number of Rooms | Owner-occupied | Renter-occupied |
| 1 Room | 18 (6.2%) | 0 (0.0%) |
| 2 or 3 Rooms | 18 (6.2%) | 0 (0.0%) |
| 4 or 5 Rooms | 133 (45.9%) | 26 (100.0%) |
| 6 or 7 Rooms | 85 (29.3%) | 0 (0.0%) |
| 8 or more Rooms | 36 (12.4%) | 0 (0.0%) |
| Total | 290 (100.0%) | 26 (100.0%) |
Housing Structure by Heating Type in Altamont
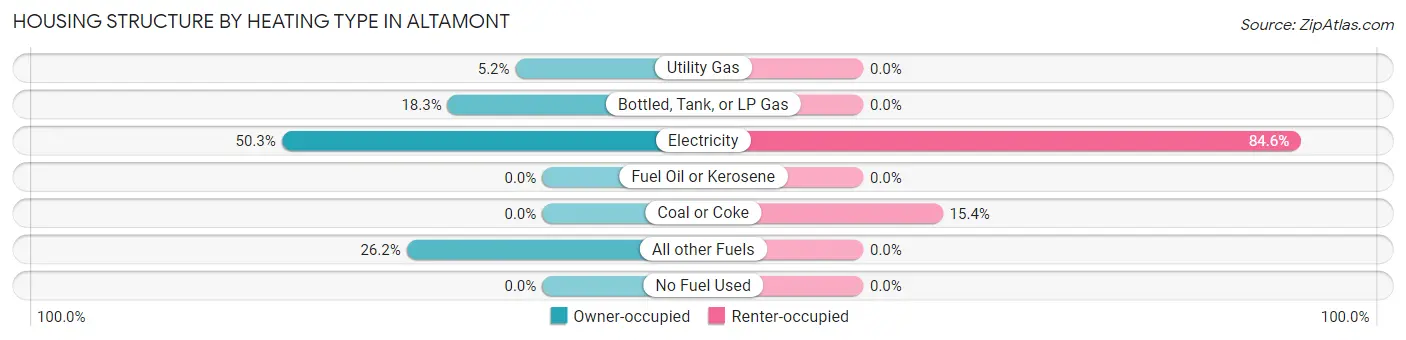
| Heating Type | Owner-occupied | Renter-occupied |
| Utility Gas | 15 (5.2%) | 0 (0.0%) |
| Bottled, Tank, or LP Gas | 53 (18.3%) | 0 (0.0%) |
| Electricity | 146 (50.3%) | 22 (84.6%) |
| Fuel Oil or Kerosene | 0 (0.0%) | 0 (0.0%) |
| Coal or Coke | 0 (0.0%) | 4 (15.4%) |
| All other Fuels | 76 (26.2%) | 0 (0.0%) |
| No Fuel Used | 0 (0.0%) | 0 (0.0%) |
| Total | 290 (100.0%) | 26 (100.0%) |
Household Vehicle Usage in Altamont
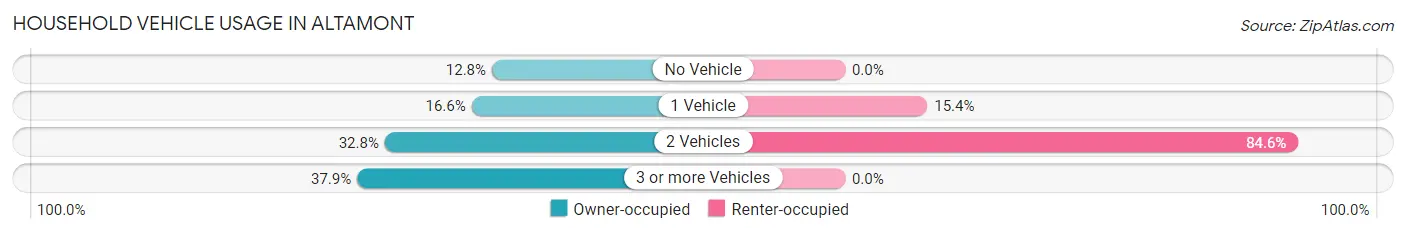
| Vehicles per Household | Owner-occupied | Renter-occupied |
| No Vehicle | 37 (12.8%) | 0 (0.0%) |
| 1 Vehicle | 48 (16.6%) | 4 (15.4%) |
| 2 Vehicles | 95 (32.8%) | 22 (84.6%) |
| 3 or more Vehicles | 110 (37.9%) | 0 (0.0%) |
| Total | 290 (100.0%) | 26 (100.0%) |
Real Estate & Mortgages in Altamont
Real Estate and Mortgage Overview in Altamont
| Characteristic | Without Mortgage | With Mortgage |
| Housing Units | 216 | 74 |
| Median Property Value | $86,300 | $141,700 |
| Median Household Income | $38,750 | $3 |
| Monthly Housing Costs | $288 | $0 |
| Real Estate Taxes | $413 | $0 |
Property Value by Mortgage Status in Altamont
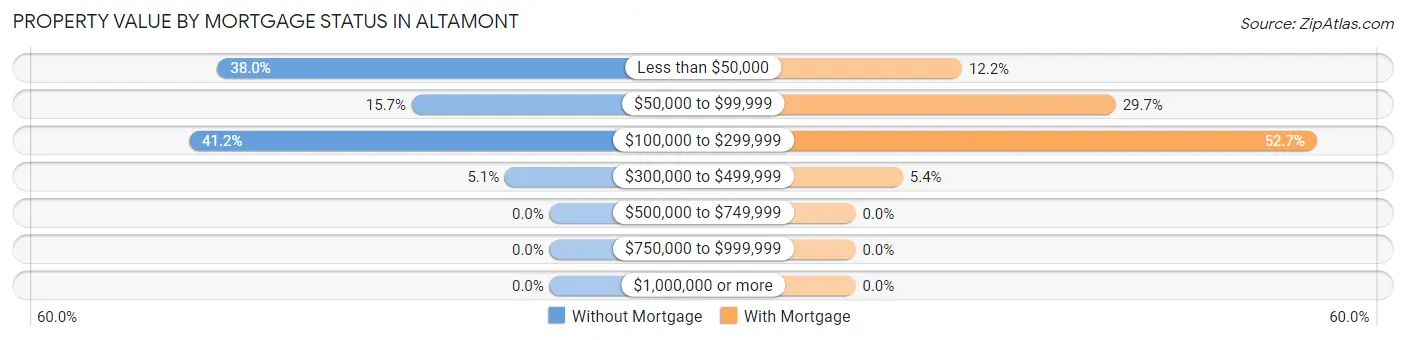
| Property Value | Without Mortgage | With Mortgage |
| Less than $50,000 | 82 (38.0%) | 9 (12.2%) |
| $50,000 to $99,999 | 34 (15.7%) | 22 (29.7%) |
| $100,000 to $299,999 | 89 (41.2%) | 39 (52.7%) |
| $300,000 to $499,999 | 11 (5.1%) | 4 (5.4%) |
| $500,000 to $749,999 | 0 (0.0%) | 0 (0.0%) |
| $750,000 to $999,999 | 0 (0.0%) | 0 (0.0%) |
| $1,000,000 or more | 0 (0.0%) | 0 (0.0%) |
| Total | 216 (100.0%) | 74 (100.0%) |
Household Income by Mortgage Status in Altamont
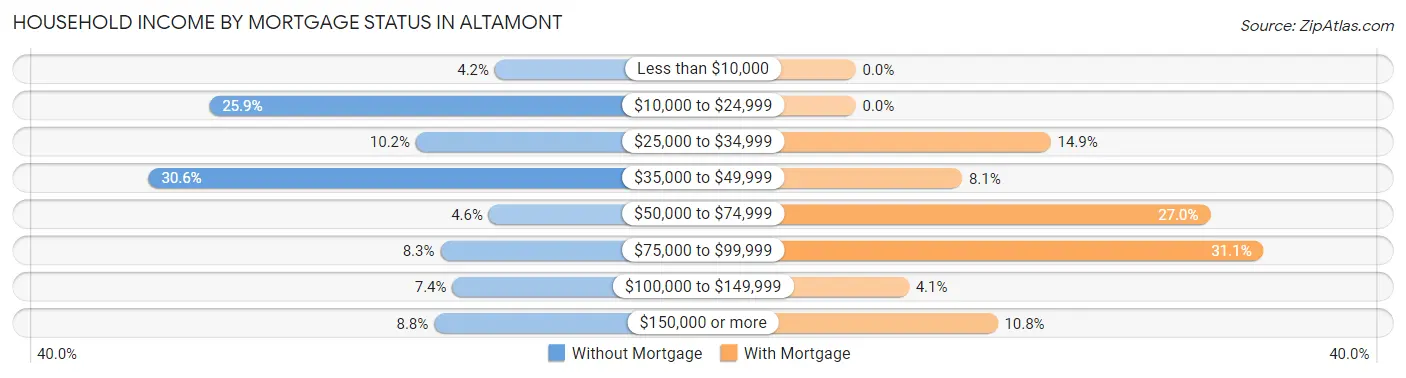
| Household Income | Without Mortgage | With Mortgage |
| Less than $10,000 | 9 (4.2%) | 0 (0.0%) |
| $10,000 to $24,999 | 56 (25.9%) | 0 (0.0%) |
| $25,000 to $34,999 | 22 (10.2%) | 11 (14.9%) |
| $35,000 to $49,999 | 66 (30.6%) | 6 (8.1%) |
| $50,000 to $74,999 | 10 (4.6%) | 20 (27.0%) |
| $75,000 to $99,999 | 18 (8.3%) | 23 (31.1%) |
| $100,000 to $149,999 | 16 (7.4%) | 3 (4.1%) |
| $150,000 or more | 19 (8.8%) | 8 (10.8%) |
| Total | 216 (100.0%) | 74 (100.0%) |
Property Value to Household Income Ratio in Altamont
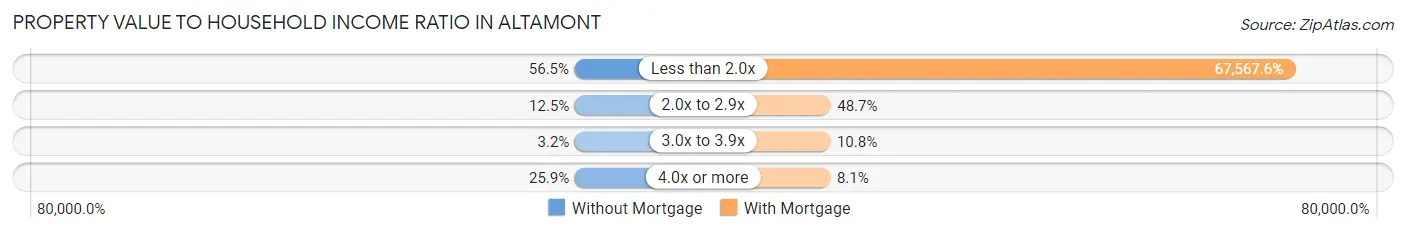
| Value-to-Income Ratio | Without Mortgage | With Mortgage |
| Less than 2.0x | 122 (56.5%) | 50,000 (67,567.6%) |
| 2.0x to 2.9x | 27 (12.5%) | 36 (48.6%) |
| 3.0x to 3.9x | 7 (3.2%) | 8 (10.8%) |
| 4.0x or more | 56 (25.9%) | 6 (8.1%) |
| Total | 216 (100.0%) | 74 (100.0%) |
Real Estate Taxes by Mortgage Status in Altamont
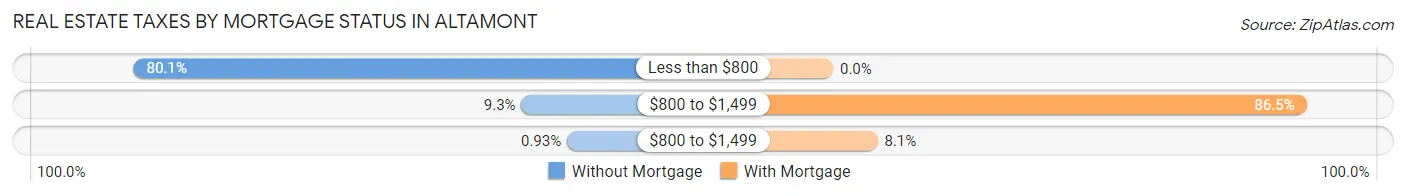
| Property Taxes | Without Mortgage | With Mortgage |
| Less than $800 | 173 (80.1%) | 0 (0.0%) |
| $800 to $1,499 | 20 (9.3%) | 64 (86.5%) |
| $800 to $1,499 | 2 (0.9%) | 6 (8.1%) |
| Total | 216 (100.0%) | 74 (100.0%) |
Health & Disability in Altamont
Health Insurance Coverage by Age in Altamont
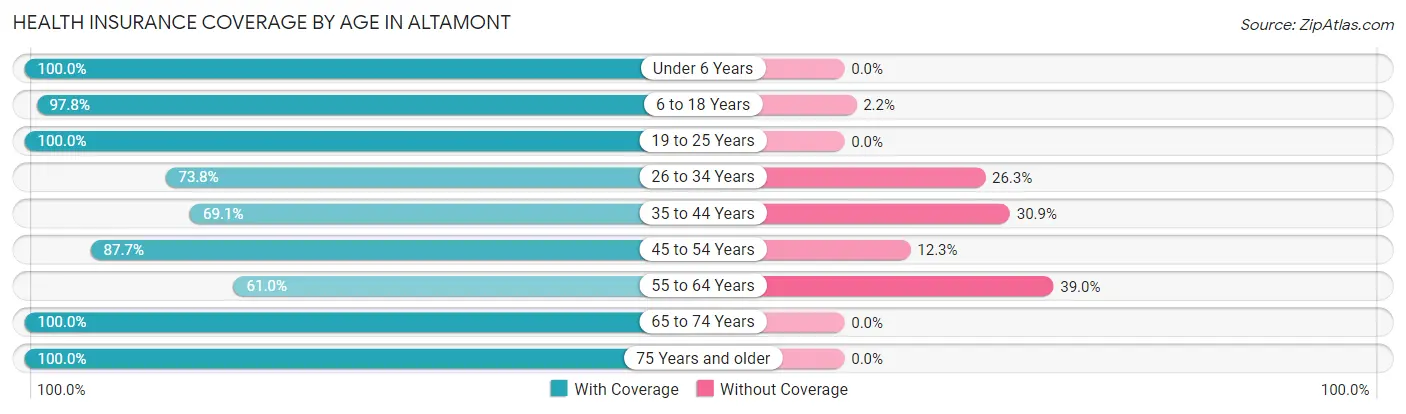
| Age Bracket | With Coverage | Without Coverage |
| Under 6 Years | 67 (100.0%) | 0 (0.0%) |
| 6 to 18 Years | 132 (97.8%) | 3 (2.2%) |
| 19 to 25 Years | 33 (100.0%) | 0 (0.0%) |
| 26 to 34 Years | 59 (73.8%) | 21 (26.3%) |
| 35 to 44 Years | 56 (69.1%) | 25 (30.9%) |
| 45 to 54 Years | 121 (87.7%) | 17 (12.3%) |
| 55 to 64 Years | 72 (61.0%) | 46 (39.0%) |
| 65 to 74 Years | 110 (100.0%) | 0 (0.0%) |
| 75 Years and older | 95 (100.0%) | 0 (0.0%) |
| Total | 745 (86.9%) | 112 (13.1%) |
Health Insurance Coverage by Citizenship Status in Altamont

| Citizenship Status | With Coverage | Without Coverage |
| Native Born | 67 (100.0%) | 0 (0.0%) |
| Foreign Born, Citizen | 132 (97.8%) | 3 (2.2%) |
| Foreign Born, not a Citizen | 33 (100.0%) | 0 (0.0%) |
Health Insurance Coverage by Household Income in Altamont
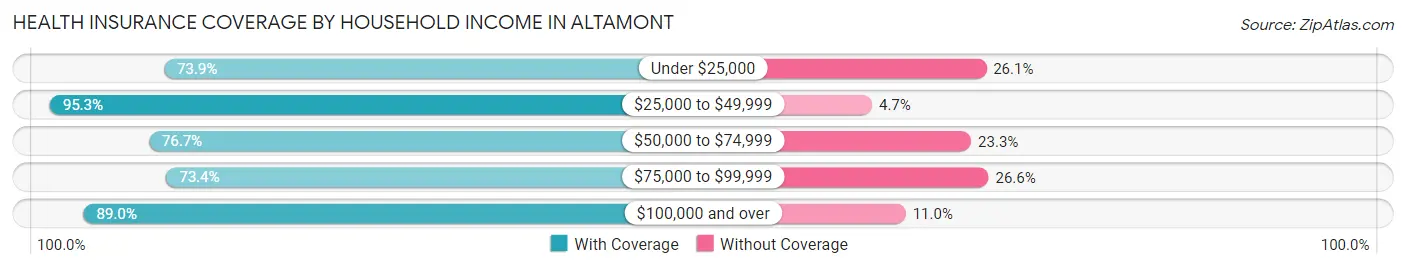
| Household Income | With Coverage | Without Coverage |
| Under $25,000 | 99 (73.9%) | 35 (26.1%) |
| $25,000 to $49,999 | 383 (95.3%) | 19 (4.7%) |
| $50,000 to $74,999 | 79 (76.7%) | 24 (23.3%) |
| $75,000 to $99,999 | 47 (73.4%) | 17 (26.6%) |
| $100,000 and over | 137 (89.0%) | 17 (11.0%) |
Public vs Private Health Insurance Coverage by Age in Altamont
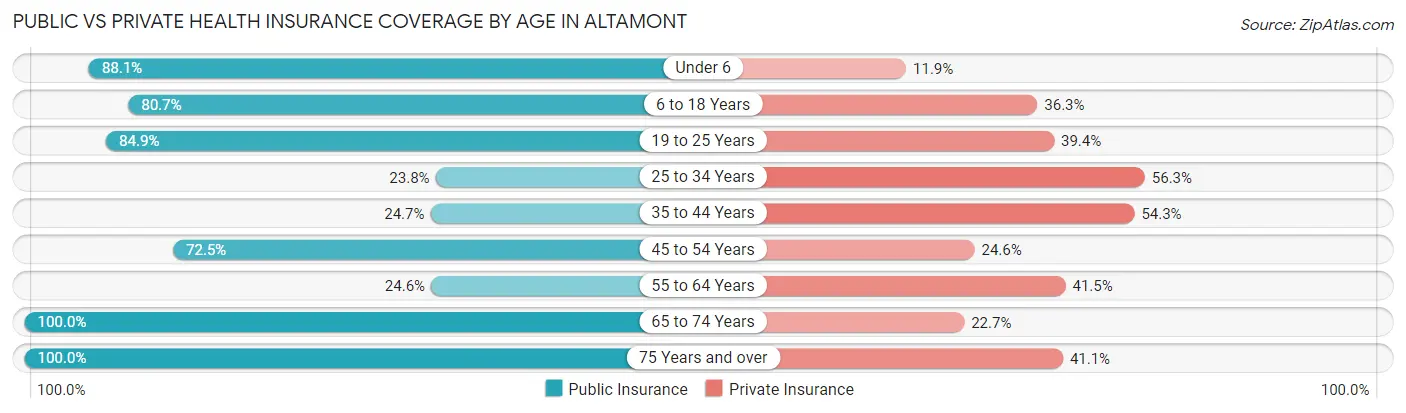
| Age Bracket | Public Insurance | Private Insurance |
| Under 6 | 59 (88.1%) | 8 (11.9%) |
| 6 to 18 Years | 109 (80.7%) | 49 (36.3%) |
| 19 to 25 Years | 28 (84.9%) | 13 (39.4%) |
| 25 to 34 Years | 19 (23.7%) | 45 (56.2%) |
| 35 to 44 Years | 20 (24.7%) | 44 (54.3%) |
| 45 to 54 Years | 100 (72.5%) | 34 (24.6%) |
| 55 to 64 Years | 29 (24.6%) | 49 (41.5%) |
| 65 to 74 Years | 110 (100.0%) | 25 (22.7%) |
| 75 Years and over | 95 (100.0%) | 39 (41.0%) |
| Total | 569 (66.4%) | 306 (35.7%) |
Disability Status by Sex by Age in Altamont
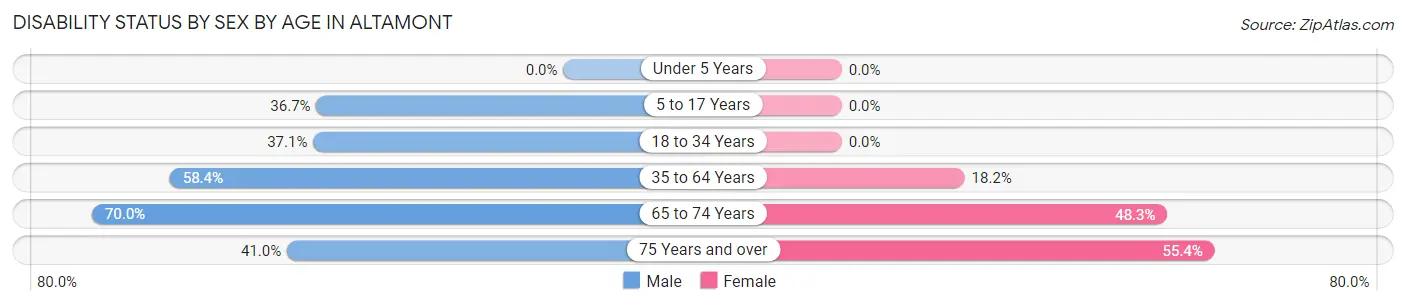
| Age Bracket | Male | Female |
| Under 5 Years | 0 (0.0%) | 0 (0.0%) |
| 5 to 17 Years | 33 (36.7%) | 0 (0.0%) |
| 18 to 34 Years | 13 (37.1%) | 0 (0.0%) |
| 35 to 64 Years | 104 (58.4%) | 29 (18.2%) |
| 65 to 74 Years | 35 (70.0%) | 29 (48.3%) |
| 75 Years and over | 16 (41.0%) | 31 (55.4%) |
Disability Class by Sex by Age in Altamont
Disability Class: Hearing Difficulty
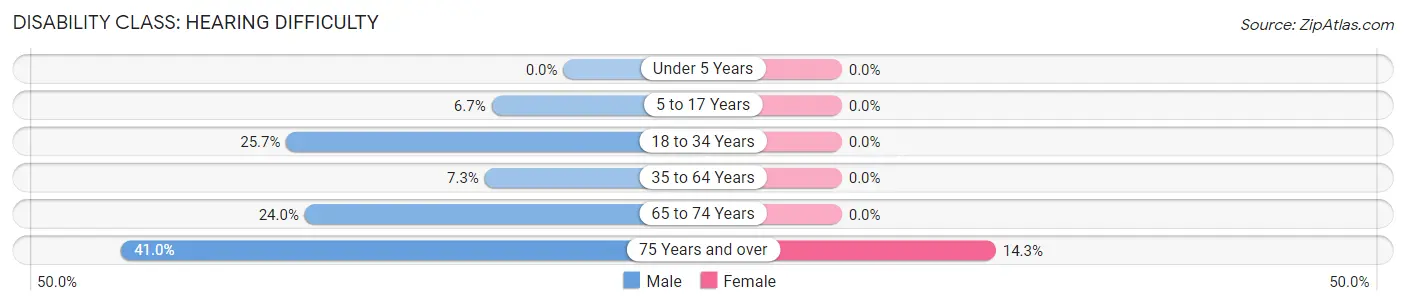
| Age Bracket | Male | Female |
| Under 5 Years | 0 (0.0%) | 0 (0.0%) |
| 5 to 17 Years | 6 (6.7%) | 0 (0.0%) |
| 18 to 34 Years | 9 (25.7%) | 0 (0.0%) |
| 35 to 64 Years | 13 (7.3%) | 0 (0.0%) |
| 65 to 74 Years | 12 (24.0%) | 0 (0.0%) |
| 75 Years and over | 16 (41.0%) | 8 (14.3%) |
Disability Class: Vision Difficulty
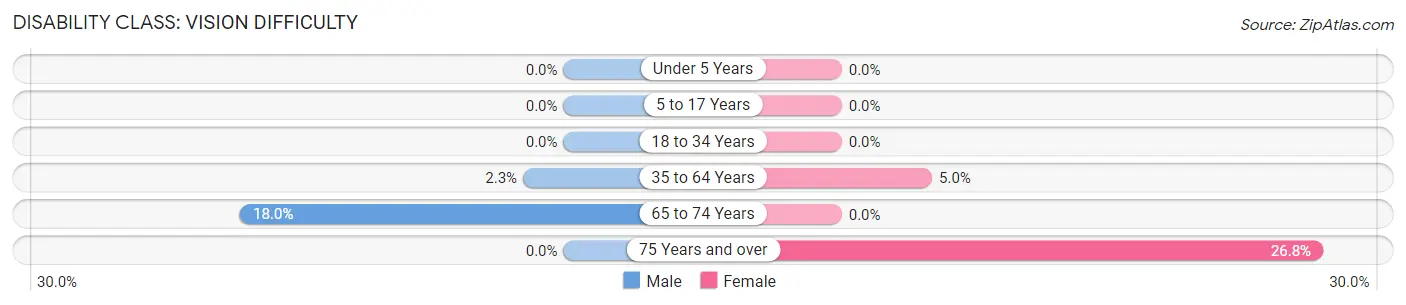
| Age Bracket | Male | Female |
| Under 5 Years | 0 (0.0%) | 0 (0.0%) |
| 5 to 17 Years | 0 (0.0%) | 0 (0.0%) |
| 18 to 34 Years | 0 (0.0%) | 0 (0.0%) |
| 35 to 64 Years | 4 (2.2%) | 8 (5.0%) |
| 65 to 74 Years | 9 (18.0%) | 0 (0.0%) |
| 75 Years and over | 0 (0.0%) | 15 (26.8%) |
Disability Class: Cognitive Difficulty
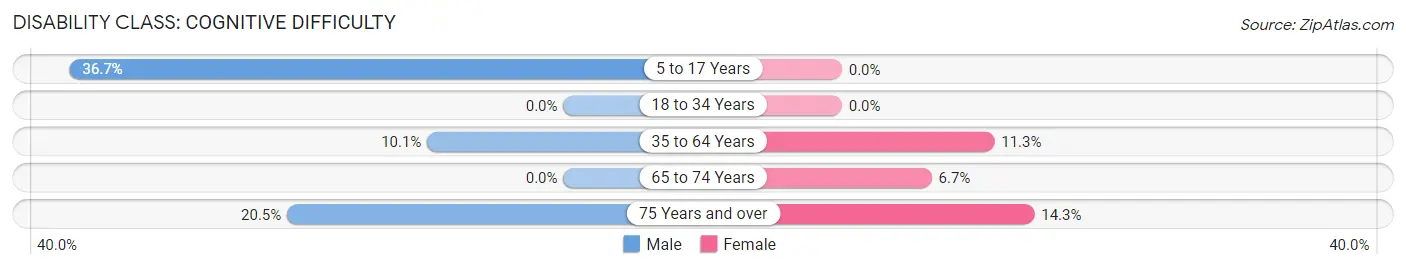
| Age Bracket | Male | Female |
| 5 to 17 Years | 33 (36.7%) | 0 (0.0%) |
| 18 to 34 Years | 0 (0.0%) | 0 (0.0%) |
| 35 to 64 Years | 18 (10.1%) | 18 (11.3%) |
| 65 to 74 Years | 0 (0.0%) | 4 (6.7%) |
| 75 Years and over | 8 (20.5%) | 8 (14.3%) |
Disability Class: Ambulatory Difficulty
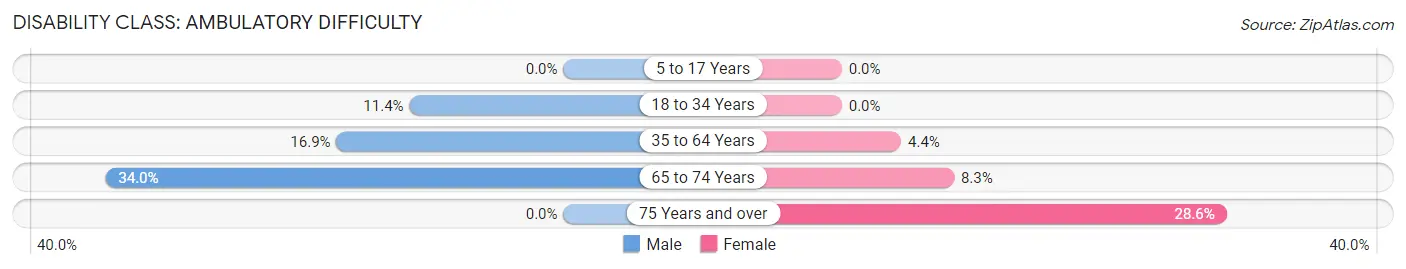
| Age Bracket | Male | Female |
| 5 to 17 Years | 0 (0.0%) | 0 (0.0%) |
| 18 to 34 Years | 4 (11.4%) | 0 (0.0%) |
| 35 to 64 Years | 30 (16.9%) | 7 (4.4%) |
| 65 to 74 Years | 17 (34.0%) | 5 (8.3%) |
| 75 Years and over | 0 (0.0%) | 16 (28.6%) |
Disability Class: Self-Care Difficulty
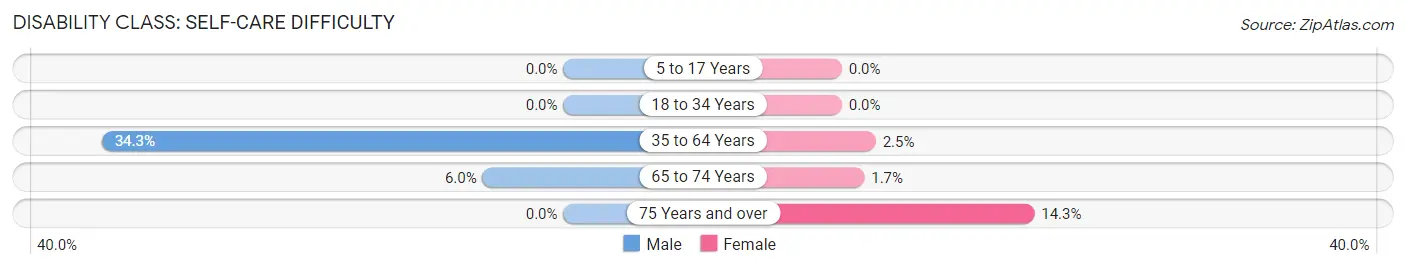
| Age Bracket | Male | Female |
| 5 to 17 Years | 0 (0.0%) | 0 (0.0%) |
| 18 to 34 Years | 0 (0.0%) | 0 (0.0%) |
| 35 to 64 Years | 61 (34.3%) | 4 (2.5%) |
| 65 to 74 Years | 3 (6.0%) | 1 (1.7%) |
| 75 Years and over | 0 (0.0%) | 8 (14.3%) |
Technology Access in Altamont
Computing Device Access in Altamont
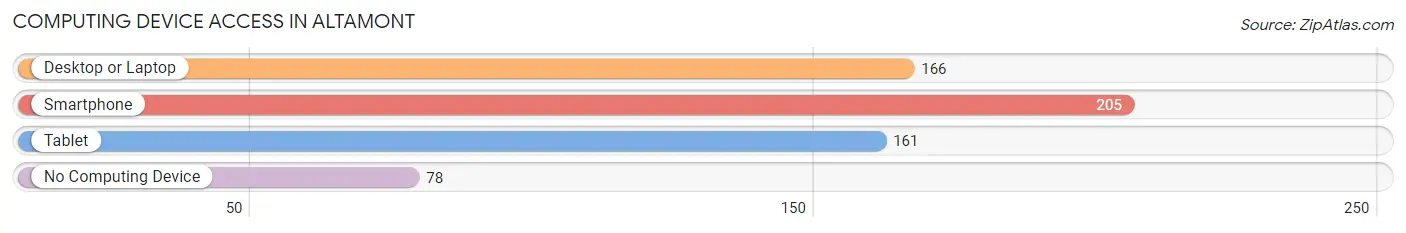
| Device Type | # Households | % Households |
| Desktop or Laptop | 166 | 52.5% |
| Smartphone | 205 | 64.9% |
| Tablet | 161 | 50.9% |
| No Computing Device | 78 | 24.7% |
| Total | 316 | 100.0% |
Internet Access in Altamont
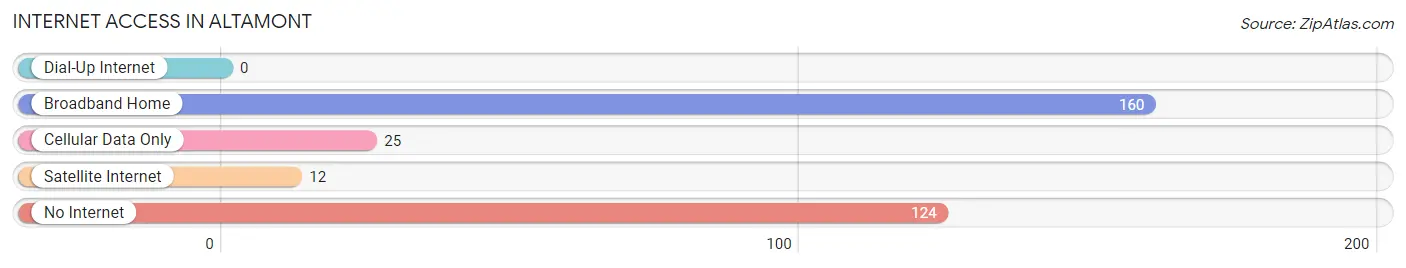
| Internet Type | # Households | % Households |
| Dial-Up Internet | 0 | 0.0% |
| Broadband Home | 160 | 50.6% |
| Cellular Data Only | 25 | 7.9% |
| Satellite Internet | 12 | 3.8% |
| No Internet | 124 | 39.2% |
| Total | 316 | 100.0% |
Altamont Summary
Altamont is a small town located in Grundy County, Tennessee. It is situated in the foothills of the Cumberland Plateau, approximately 40 miles northwest of Chattanooga. The town was founded in 1887 and has a population of approximately 1,000 people.
History
Altamont was founded in 1887 by a group of settlers from the nearby town of Tracy City. The town was named after the nearby Altamont Mountain, which was named after the Battle of Altamont in the American Civil War. The town was originally a farming community, but in the early 1900s, coal mining became the primary industry. The coal mines provided jobs for many of the town's residents and helped to fuel the local economy.
In the 1950s, the coal industry began to decline and many of the mines closed. This caused a significant economic downturn in the town and many of the residents moved away in search of work. In the late 1970s, the town began to experience a resurgence as new businesses began to move into the area. Today, Altamont is a small but vibrant community with a variety of businesses and services.
Geography
Altamont is located in the foothills of the Cumberland Plateau, approximately 40 miles northwest of Chattanooga. The town is situated at an elevation of 1,000 feet and is surrounded by rolling hills and forests. The town is located near the headwaters of the Sequatchie River, which flows through the area.
The climate in Altamont is mild and humid, with temperatures ranging from the low 30s in the winter to the mid-80s in the summer. The town receives an average of 45 inches of precipitation per year, with most of it falling in the form of rain.
Economy
The economy of Altamont is largely based on agriculture and tourism. The town is home to several farms, which produce a variety of crops, including corn, soybeans, and hay. The town also has several small businesses, including restaurants, shops, and a hardware store.
Tourism is an important part of the local economy, as the town is located near several popular attractions, including the Sequatchie Valley Railroad, the Cumberland Caverns, and the Altamont Mountain. The town also hosts several annual festivals, including the Altamont Music Festival and the Altamont Fall Festival.
Demographics
As of the 2010 census, the population of Altamont was 1,000 people. The racial makeup of the town was 97.2% White, 0.7% African American, 0.2% Native American, 0.2% Asian, 0.2% from other races, and 1.7% from two or more races. The median household income was $31,250 and the median family income was $37,500.
Altamont is a small but vibrant community with a variety of businesses and services. The town is home to a diverse population and offers a variety of recreational activities. The town is also located near several popular attractions, making it a great place to visit or live.
Common Questions
What is Per Capita Income in Altamont?
Per Capita income in Altamont is $38,471.
What is the Median Family Income in Altamont?
Median Family Income in Altamont is $40,833.
What is the Median Household income in Altamont?
Median Household Income in Altamont is $38,920.
What is Income or Wage Gap in Altamont?
Income or Wage Gap in Altamont is 31.2%.
Women in Altamont earn 68.8 cents for every dollar earned by a man.
What is Inequality or Gini Index in Altamont?
Inequality or Gini Index in Altamont is 0.67.
What is the Total Population of Altamont?
Total Population of Altamont is 904.
What is the Total Male Population of Altamont?
Total Male Population of Altamont is 463.
What is the Total Female Population of Altamont?
Total Female Population of Altamont is 441.
What is the Ratio of Males per 100 Females in Altamont?
There are 104.99 Males per 100 Females in Altamont.
What is the Ratio of Females per 100 Males in Altamont?
There are 95.25 Females per 100 Males in Altamont.
What is the Median Population Age in Altamont?
Median Population Age in Altamont is 50.0 Years.
What is the Average Family Size in Altamont
Average Family Size in Altamont is 3.2 People.
What is the Average Household Size in Altamont
Average Household Size in Altamont is 2.7 People.
How Large is the Labor Force in Altamont?
There are 281 People in the Labor Forcein in Altamont.
What is the Percentage of People in the Labor Force in Altamont?
38.1% of People are in the Labor Force in Altamont.
What is the Unemployment Rate in Altamont?
Unemployment Rate in Altamont is 3.6%.