Pigeon Forge, TN Map & Demographics
Pigeon Forge Map
Pigeon Forge Overview
$23,481
PER CAPITA INCOME
$56,617
AVG FAMILY INCOME
$53,380
AVG HOUSEHOLD INCOME
34.2%
WAGE / INCOME GAP [ % ]
65.8¢/ $1
WAGE / INCOME GAP [ $ ]
$8,876
FAMILY INCOME DEFICIT
0.40
INEQUALITY / GINI INDEX
6,345
TOTAL POPULATION
3,463
MALE POPULATION
2,882
FEMALE POPULATION
120.16
MALES / 100 FEMALES
83.22
FEMALES / 100 MALES
38.2
MEDIAN AGE
3.2
AVG FAMILY SIZE
2.7
AVG HOUSEHOLD SIZE
2,926
LABOR FORCE [ PEOPLE ]
59.6%
PERCENT IN LABOR FORCE
1.7%
UNEMPLOYMENT RATE
Pigeon Forge Zip Codes
Pigeon Forge Area Codes
Income in Pigeon Forge
Income Overview in Pigeon Forge
Per Capita Income in Pigeon Forge is $23,481, while median incomes of families and households are $56,617 and $53,380 respectively.
| Characteristic | Number | Measure |
| Per Capita Income | 6,345 | $23,481 |
| Median Family Income | 1,585 | $56,617 |
| Mean Family Income | 1,585 | $72,091 |
| Median Household Income | 2,277 | $53,380 |
| Mean Household Income | 2,277 | $66,357 |
| Income Deficit | 1,585 | $8,876 |
| Wage / Income Gap (%) | 6,345 | 34.25% |
| Wage / Income Gap ($) | 6,345 | 65.75¢ per $1 |
| Gini / Inequality Index | 6,345 | 0.40 |
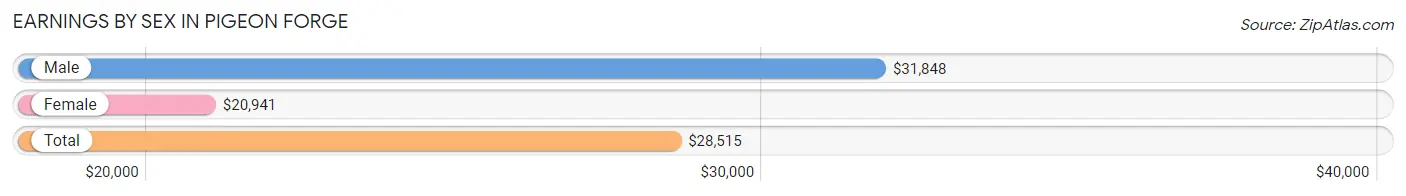
Earnings by Sex in Pigeon Forge
Average Earnings in Pigeon Forge are $28,515, $31,848 for men and $20,941 for women, a difference of 34.3%.
| Sex | Number | Average Earnings |
| Male | 1,694 (55.6%) | $31,848 |
| Female | 1,352 (44.4%) | $20,941 |
| Total | 3,046 (100.0%) | $28,515 |
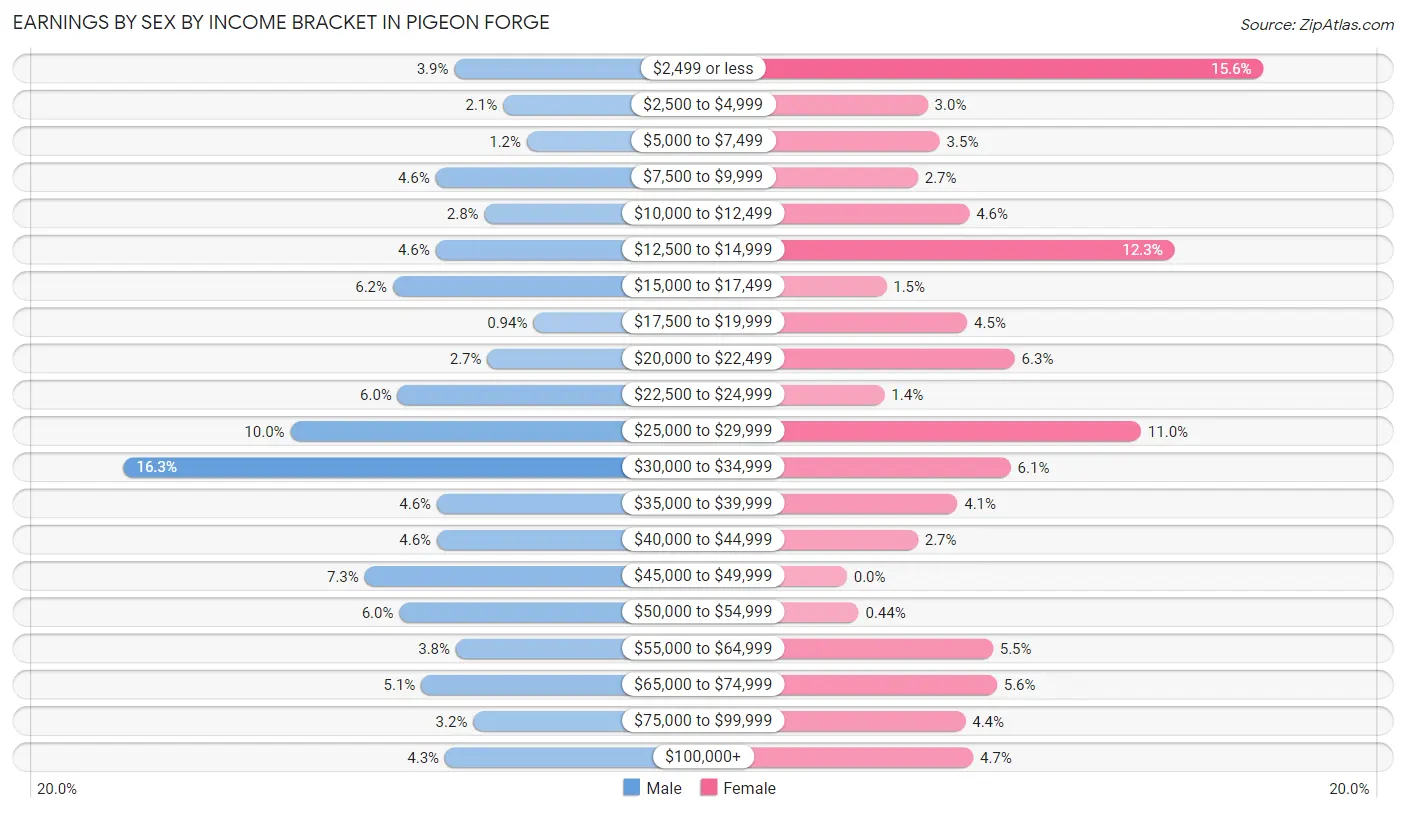
Earnings by Sex by Income Bracket in Pigeon Forge
The most common earnings brackets in Pigeon Forge are $30,000 to $34,999 for men (276 | 16.3%) and $2,499 or less for women (211 | 15.6%).
| Income | Male | Female |
| $2,499 or less | 66 (3.9%) | 211 (15.6%) |
| $2,500 to $4,999 | 35 (2.1%) | 41 (3.0%) |
| $5,000 to $7,499 | 20 (1.2%) | 47 (3.5%) |
| $7,500 to $9,999 | 78 (4.6%) | 36 (2.7%) |
| $10,000 to $12,499 | 47 (2.8%) | 62 (4.6%) |
| $12,500 to $14,999 | 78 (4.6%) | 166 (12.3%) |
| $15,000 to $17,499 | 105 (6.2%) | 20 (1.5%) |
| $17,500 to $19,999 | 16 (0.9%) | 61 (4.5%) |
| $20,000 to $22,499 | 45 (2.7%) | 85 (6.3%) |
| $22,500 to $24,999 | 102 (6.0%) | 19 (1.4%) |
| $25,000 to $29,999 | 170 (10.0%) | 149 (11.0%) |
| $30,000 to $34,999 | 276 (16.3%) | 83 (6.1%) |
| $35,000 to $39,999 | 77 (4.5%) | 56 (4.1%) |
| $40,000 to $44,999 | 77 (4.5%) | 36 (2.7%) |
| $45,000 to $49,999 | 123 (7.3%) | 0 (0.0%) |
| $50,000 to $54,999 | 101 (6.0%) | 6 (0.4%) |
| $55,000 to $64,999 | 65 (3.8%) | 74 (5.5%) |
| $65,000 to $74,999 | 87 (5.1%) | 76 (5.6%) |
| $75,000 to $99,999 | 54 (3.2%) | 60 (4.4%) |
| $100,000+ | 72 (4.3%) | 64 (4.7%) |
| Total | 1,694 (100.0%) | 1,352 (100.0%) |
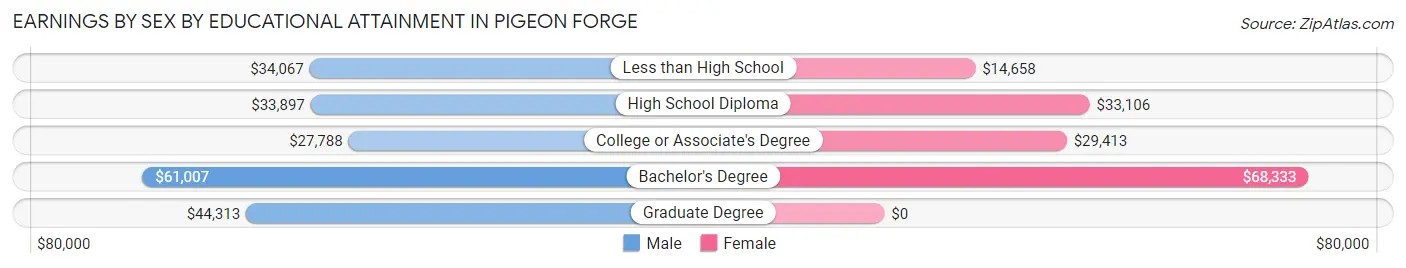
Earnings by Sex by Educational Attainment in Pigeon Forge
Average earnings in Pigeon Forge are $33,843 for men and $27,592 for women, a difference of 18.5%. Men with an educational attainment of bachelor's degree enjoy the highest average annual earnings of $61,007, while those with college or associate's degree education earn the least with $27,788. Women with an educational attainment of bachelor's degree earn the most with the average annual earnings of $68,333, while those with less than high school education have the smallest earnings of $14,658.
| Educational Attainment | Male Income | Female Income |
| Less than High School | $34,067 | $14,658 |
| High School Diploma | $33,897 | $33,106 |
| College or Associate's Degree | $27,788 | $29,413 |
| Bachelor's Degree | $61,007 | $68,333 |
| Graduate Degree | $44,313 | $0 |
| Total | $33,843 | $27,592 |
Family Income in Pigeon Forge
Family Income Brackets in Pigeon Forge
According to the Pigeon Forge family income data, there are 431 families falling into the $50,000 to $74,999 income range, which is the most common income bracket and makes up 27.2% of all families. Conversely, the $10,000 to $14,999 income bracket is the least frequent group with only 27 families (1.7%) belonging to this category.
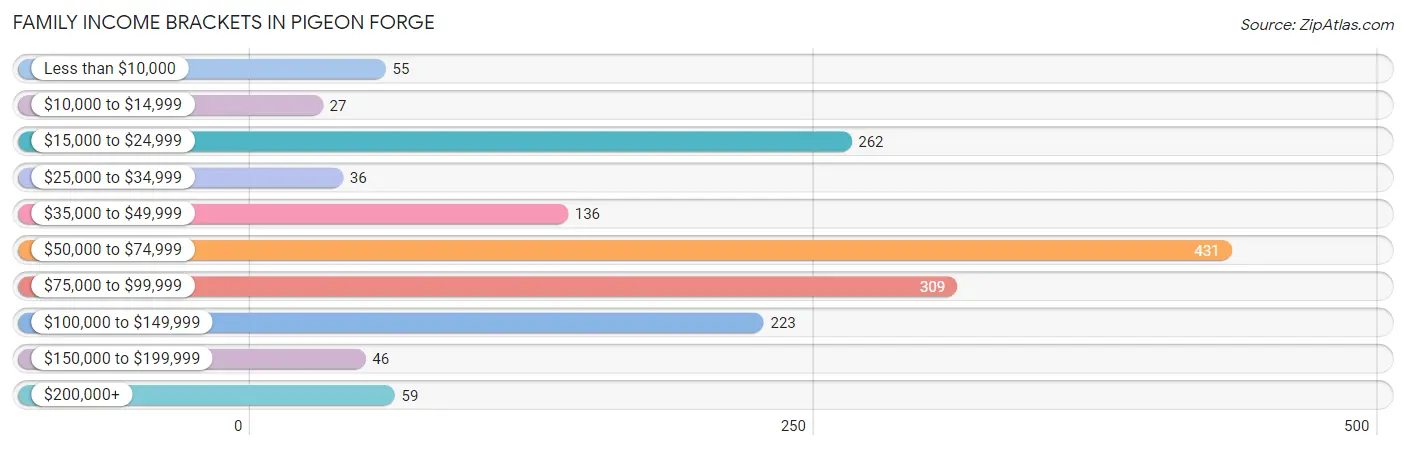
| Income Bracket | # Families | % Families |
| Less than $10,000 | 55 | 3.5% |
| $10,000 to $14,999 | 27 | 1.7% |
| $15,000 to $24,999 | 262 | 16.5% |
| $25,000 to $34,999 | 36 | 2.3% |
| $35,000 to $49,999 | 136 | 8.6% |
| $50,000 to $74,999 | 431 | 27.2% |
| $75,000 to $99,999 | 309 | 19.5% |
| $100,000 to $149,999 | 223 | 14.1% |
| $150,000 to $199,999 | 46 | 2.9% |
| $200,000+ | 59 | 3.7% |
Family Income by Famaliy Size in Pigeon Forge
5-person families (82 | 5.2%) account for the highest median family income in Pigeon Forge with $103,393 per family, while 2-person families (591 | 37.3%) have the highest median income of $28,610 per family member.
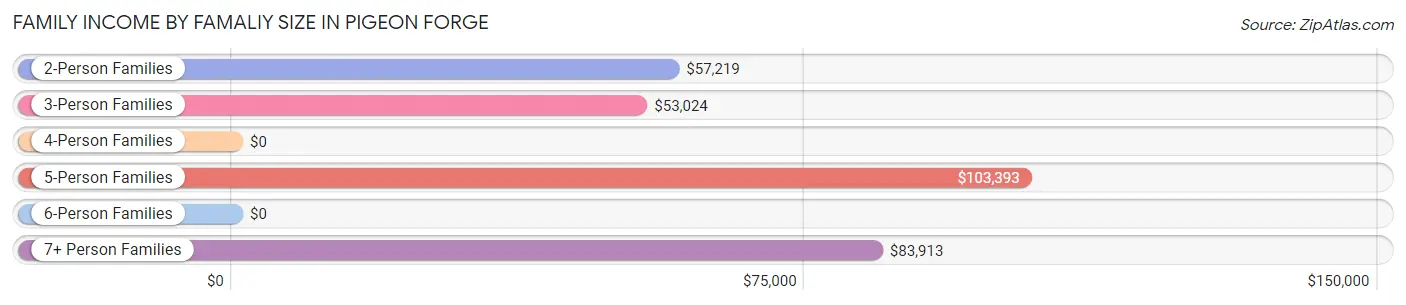
| Income Bracket | # Families | Median Income |
| 2-Person Families | 591 (37.3%) | $57,219 |
| 3-Person Families | 374 (23.6%) | $53,024 |
| 4-Person Families | 393 (24.8%) | $0 |
| 5-Person Families | 82 (5.2%) | $103,393 |
| 6-Person Families | 97 (6.1%) | $0 |
| 7+ Person Families | 48 (3.0%) | $83,913 |
| Total | 1,585 (100.0%) | $56,617 |
Family Income by Number of Earners in Pigeon Forge
The median family income in Pigeon Forge is $56,617, with families comprising 3+ earners (165) having the highest median family income of $94,856, while families with 1 earner (683) have the lowest median family income of $48,313, accounting for 10.4% and 43.1% of families, respectively.
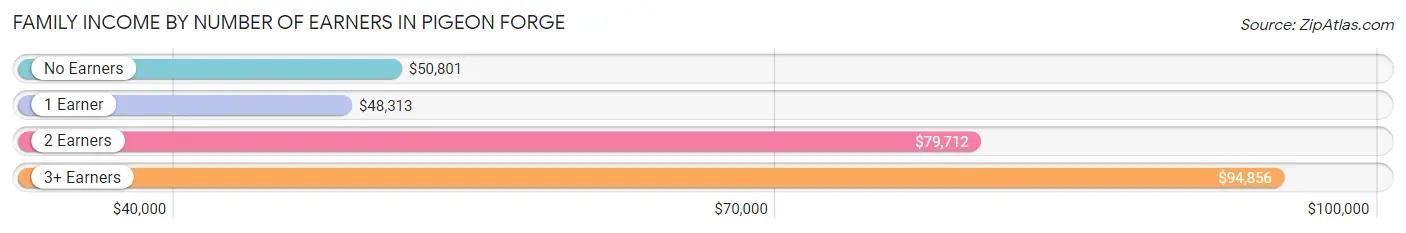
| Number of Earners | # Families | Median Income |
| No Earners | 169 (10.7%) | $50,801 |
| 1 Earner | 683 (43.1%) | $48,313 |
| 2 Earners | 568 (35.8%) | $79,712 |
| 3+ Earners | 165 (10.4%) | $94,856 |
| Total | 1,585 (100.0%) | $56,617 |
Household Income in Pigeon Forge
Household Income Brackets in Pigeon Forge
With 717 households falling in the category, the $50,000 to $74,999 income range is the most frequent in Pigeon Forge, accounting for 31.5% of all households. In contrast, only 27 households (1.2%) fall into the $10,000 to $14,999 income bracket, making it the least populous group.
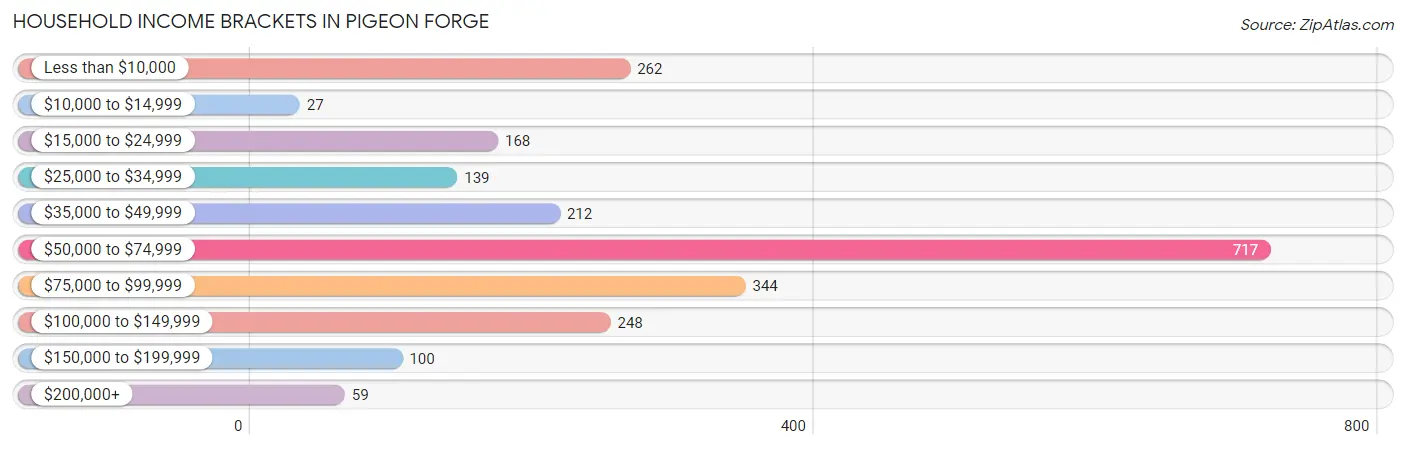
| Income Bracket | # Households | % Households |
| Less than $10,000 | 262 | 11.5% |
| $10,000 to $14,999 | 27 | 1.2% |
| $15,000 to $24,999 | 168 | 7.4% |
| $25,000 to $34,999 | 139 | 6.1% |
| $35,000 to $49,999 | 212 | 9.3% |
| $50,000 to $74,999 | 717 | 31.5% |
| $75,000 to $99,999 | 344 | 15.1% |
| $100,000 to $149,999 | 248 | 10.9% |
| $150,000 to $199,999 | 100 | 4.4% |
| $200,000+ | 59 | 2.6% |
Household Income by Householder Age in Pigeon Forge
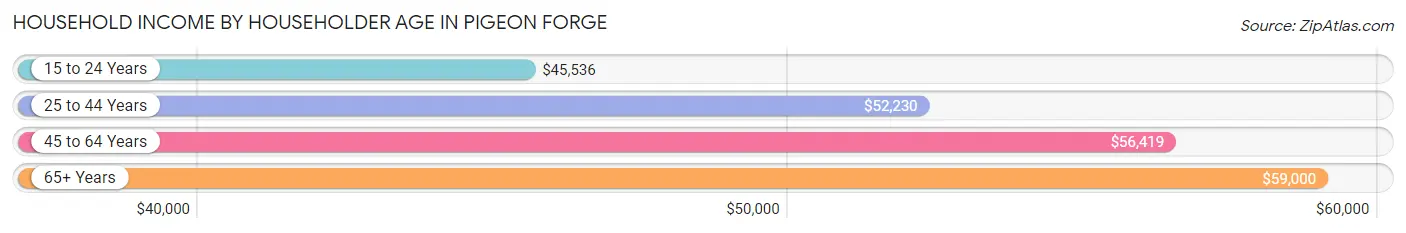
The median household income in Pigeon Forge is $53,380, with the highest median household income of $59,000 found in the 65+ years age bracket for the primary householder. A total of 592 households (26.0%) fall into this category. Meanwhile, the 15 to 24 years age bracket for the primary householder has the lowest median household income of $45,536, with 78 households (3.4%) in this group.
| Income Bracket | # Households | Median Income |
| 15 to 24 Years | 78 (3.4%) | $45,536 |
| 25 to 44 Years | 709 (31.1%) | $52,230 |
| 45 to 64 Years | 898 (39.4%) | $56,419 |
| 65+ Years | 592 (26.0%) | $59,000 |
| Total | 2,277 (100.0%) | $53,380 |
Poverty in Pigeon Forge
Income Below Poverty by Sex and Age in Pigeon Forge
With 19.8% poverty level for males and 23.4% for females among the residents of Pigeon Forge, 6 to 11 year old males and 12 to 14 year old females are the most vulnerable to poverty, with 219 males (58.9%) and 109 females (47.2%) in their respective age groups living below the poverty level.
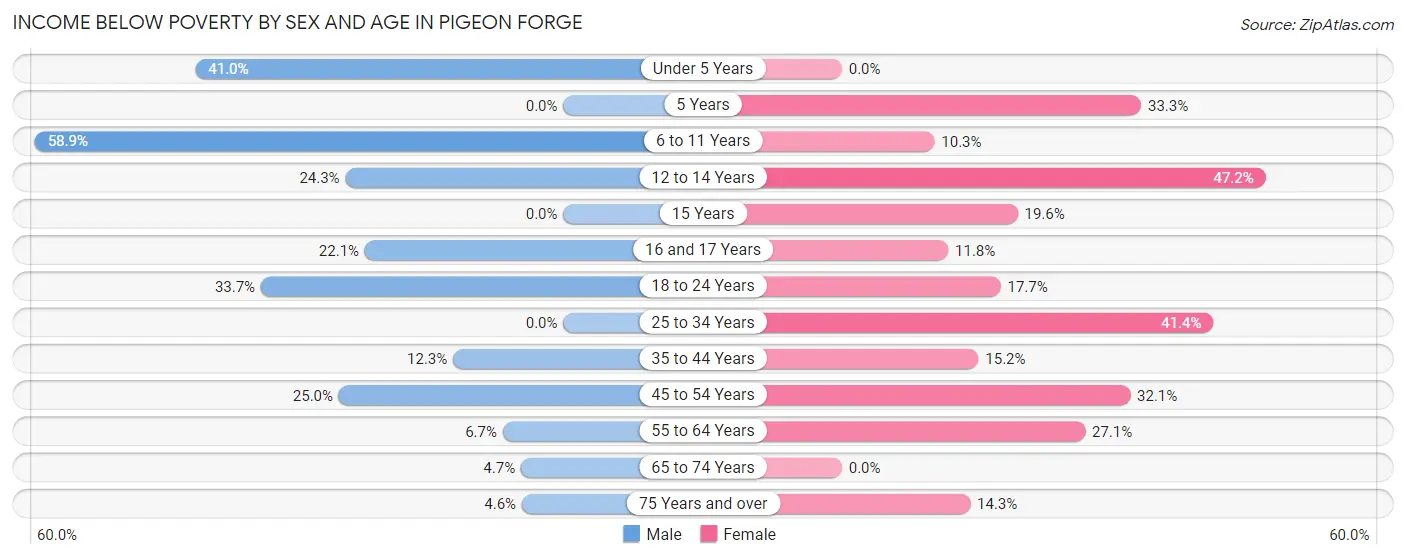
| Age Bracket | Male | Female |
| Under 5 Years | 75 (41.0%) | 0 (0.0%) |
| 5 Years | 0 (0.0%) | 13 (33.3%) |
| 6 to 11 Years | 219 (58.9%) | 10 (10.3%) |
| 12 to 14 Years | 25 (24.3%) | 109 (47.2%) |
| 15 Years | 0 (0.0%) | 9 (19.6%) |
| 16 and 17 Years | 40 (22.1%) | 9 (11.8%) |
| 18 to 24 Years | 96 (33.7%) | 29 (17.7%) |
| 25 to 34 Years | 0 (0.0%) | 168 (41.4%) |
| 35 to 44 Years | 49 (12.3%) | 47 (15.2%) |
| 45 to 54 Years | 87 (25.0%) | 96 (32.1%) |
| 55 to 64 Years | 30 (6.7%) | 136 (27.1%) |
| 65 to 74 Years | 15 (4.7%) | 0 (0.0%) |
| 75 Years and over | 10 (4.6%) | 32 (14.3%) |
| Total | 646 (19.8%) | 658 (23.4%) |
Income Above Poverty by Sex and Age in Pigeon Forge
According to the poverty statistics in Pigeon Forge, males aged 5 years and females aged under 5 years are the age groups that are most secure financially, with 100.0% of males and 100.0% of females in these age groups living above the poverty line.
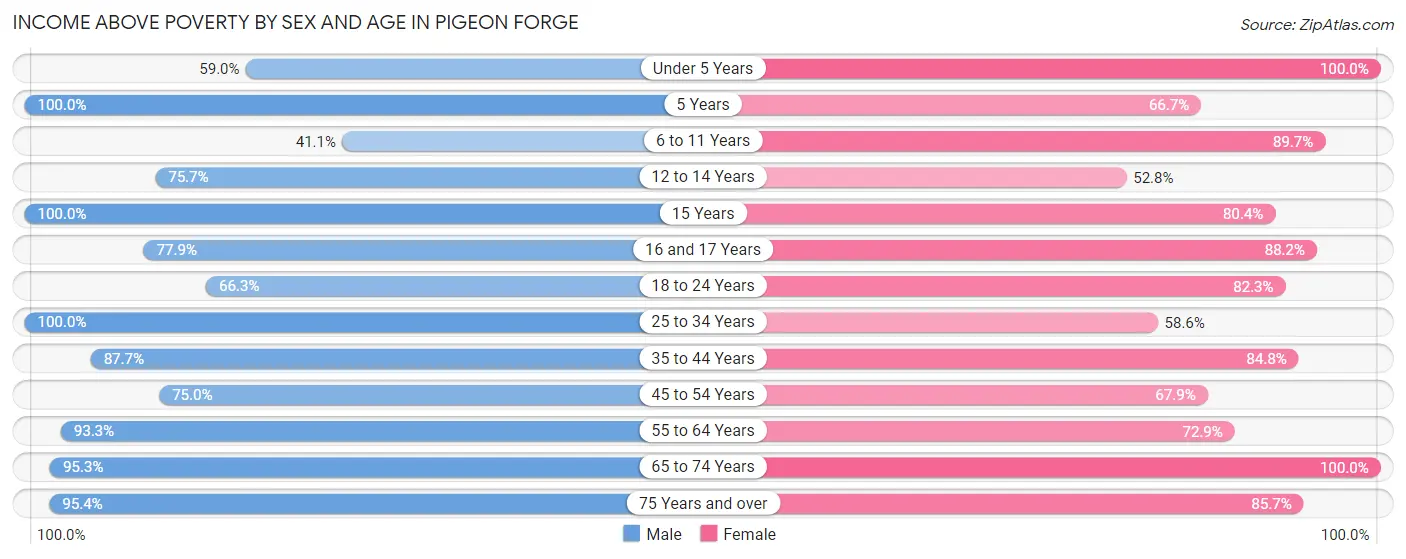
| Age Bracket | Male | Female |
| Under 5 Years | 108 (59.0%) | 104 (100.0%) |
| 5 Years | 14 (100.0%) | 26 (66.7%) |
| 6 to 11 Years | 153 (41.1%) | 87 (89.7%) |
| 12 to 14 Years | 78 (75.7%) | 122 (52.8%) |
| 15 Years | 80 (100.0%) | 37 (80.4%) |
| 16 and 17 Years | 141 (77.9%) | 67 (88.2%) |
| 18 to 24 Years | 189 (66.3%) | 135 (82.3%) |
| 25 to 34 Years | 321 (100.0%) | 238 (58.6%) |
| 35 to 44 Years | 350 (87.7%) | 262 (84.8%) |
| 45 to 54 Years | 261 (75.0%) | 203 (67.9%) |
| 55 to 64 Years | 415 (93.3%) | 366 (72.9%) |
| 65 to 74 Years | 303 (95.3%) | 320 (100.0%) |
| 75 Years and over | 207 (95.4%) | 192 (85.7%) |
| Total | 2,620 (80.2%) | 2,159 (76.6%) |
Income Below Poverty Among Married-Couple Families in Pigeon Forge
The poverty statistics for married-couple families in Pigeon Forge show that 7.2% or 71 of the total 987 families live below the poverty line. Families with 1 or 2 children have the highest poverty rate of 16.1%, comprising of 44 families. On the other hand, families with no children have the lowest poverty rate of 2.5%, which includes 16 families.
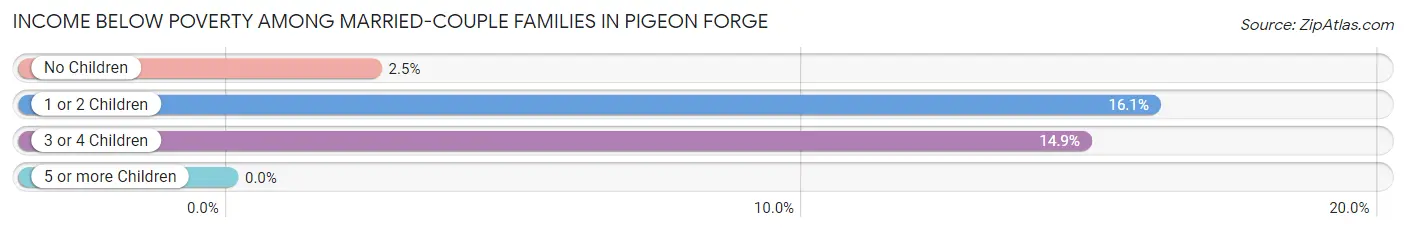
| Children | Above Poverty | Below Poverty |
| No Children | 623 (97.5%) | 16 (2.5%) |
| 1 or 2 Children | 230 (83.9%) | 44 (16.1%) |
| 3 or 4 Children | 63 (85.1%) | 11 (14.9%) |
| 5 or more Children | 0 (0.0%) | 0 (0.0%) |
| Total | 916 (92.8%) | 71 (7.2%) |
Income Below Poverty Among Single-Parent Households in Pigeon Forge
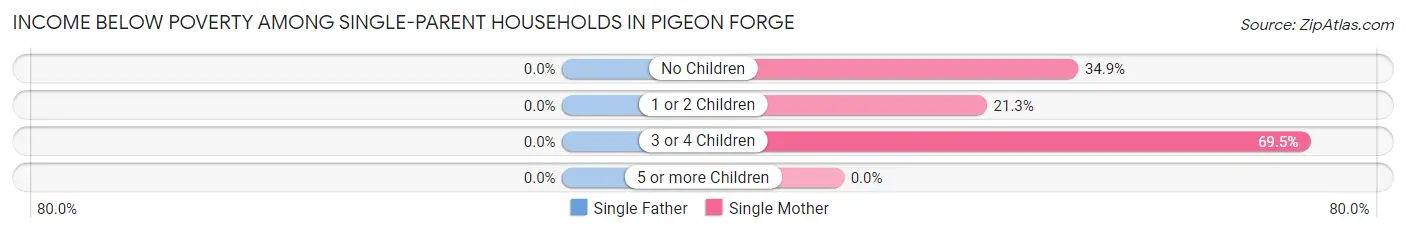
| Children | Single Father | Single Mother |
| No Children | 0 (0.0%) | 37 (34.9%) |
| 1 or 2 Children | 0 (0.0%) | 36 (21.3%) |
| 3 or 4 Children | 0 (0.0%) | 171 (69.5%) |
| 5 or more Children | 0 (0.0%) | 0 (0.0%) |
| Total | 0 (0.0%) | 244 (46.8%) |
Income Below Poverty Among Married-Couple vs Single-Parent Households in Pigeon Forge
The poverty data for Pigeon Forge shows that 71 of the married-couple family households (7.2%) and 244 of the single-parent households (40.8%) are living below the poverty level. Within the married-couple family households, those with 1 or 2 children have the highest poverty rate, with 44 households (16.1%) falling below the poverty line. Among the single-parent households, those with 3 or 4 children have the highest poverty rate, with 171 household (69.5%) living below poverty.
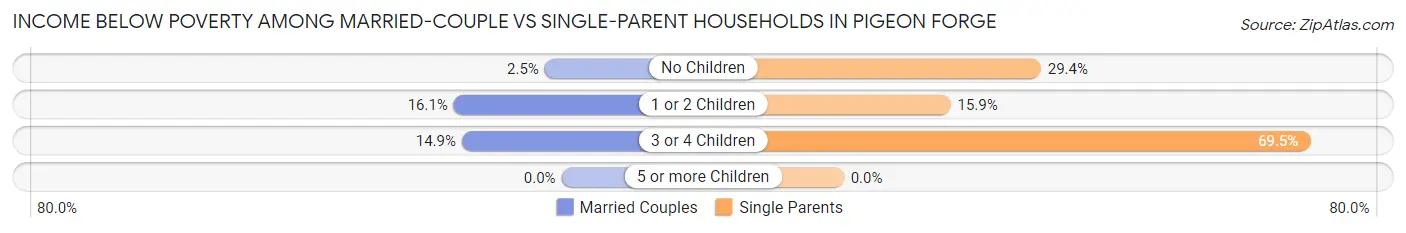
| Children | Married-Couple Families | Single-Parent Households |
| No Children | 16 (2.5%) | 37 (29.4%) |
| 1 or 2 Children | 44 (16.1%) | 36 (15.9%) |
| 3 or 4 Children | 11 (14.9%) | 171 (69.5%) |
| 5 or more Children | 0 (0.0%) | 0 (0.0%) |
| Total | 71 (7.2%) | 244 (40.8%) |
Race in Pigeon Forge
The most populous races in Pigeon Forge are White / Caucasian (5,038 | 79.4%), Hispanic or Latino (1,181 | 18.6%), and Two or more Races (618 | 9.7%).
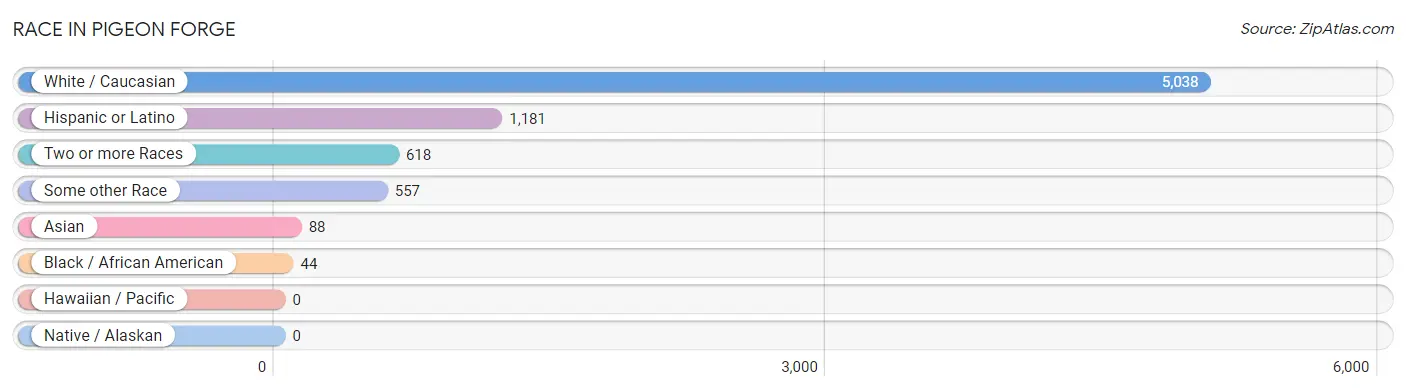
| Race | # Population | % Population |
| Asian | 88 | 1.4% |
| Black / African American | 44 | 0.7% |
| Hawaiian / Pacific | 0 | 0.0% |
| Hispanic or Latino | 1,181 | 18.6% |
| Native / Alaskan | 0 | 0.0% |
| White / Caucasian | 5,038 | 79.4% |
| Two or more Races | 618 | 9.7% |
| Some other Race | 557 | 8.8% |
| Total | 6,345 | 100.0% |
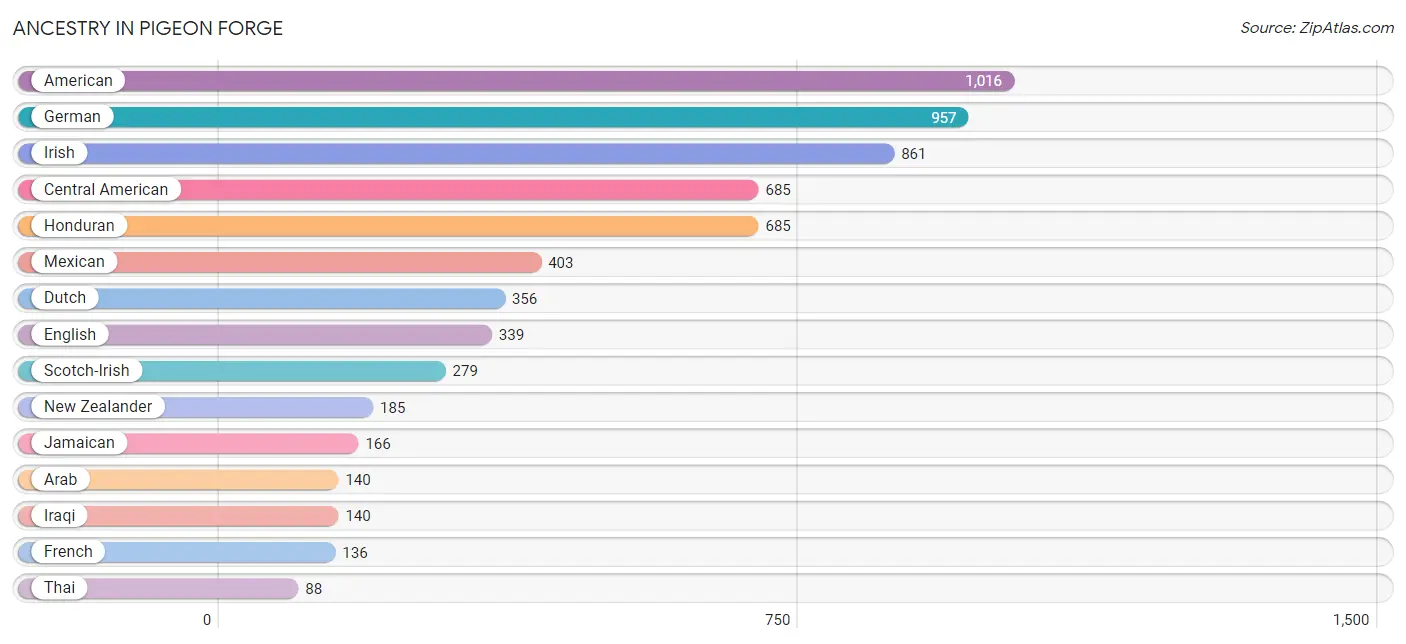
Ancestry in Pigeon Forge
The most populous ancestries reported in Pigeon Forge are American (1,016 | 16.0%), German (957 | 15.1%), Irish (861 | 13.6%), Central American (685 | 10.8%), and Honduran (685 | 10.8%), together accounting for 66.3% of all Pigeon Forge residents.
| Ancestry | # Population | % Population |
| American | 1,016 | 16.0% |
| Arab | 140 | 2.2% |
| Canadian | 31 | 0.5% |
| Central American | 685 | 10.8% |
| Colombian | 19 | 0.3% |
| Dutch | 356 | 5.6% |
| Eastern European | 5 | 0.1% |
| English | 339 | 5.3% |
| European | 62 | 1.0% |
| French | 136 | 2.1% |
| German | 957 | 15.1% |
| Honduran | 685 | 10.8% |
| Iraqi | 140 | 2.2% |
| Irish | 861 | 13.6% |
| Italian | 67 | 1.1% |
| Jamaican | 166 | 2.6% |
| Mexican | 403 | 6.4% |
| New Zealander | 185 | 2.9% |
| Northern European | 23 | 0.4% |
| Norwegian | 50 | 0.8% |
| Polish | 50 | 0.8% |
| Puerto Rican | 16 | 0.3% |
| Scotch-Irish | 279 | 4.4% |
| Scottish | 12 | 0.2% |
| South American | 72 | 1.1% |
| Spanish | 5 | 0.1% |
| Swiss | 14 | 0.2% |
| Thai | 88 | 1.4% |
| Venezuelan | 53 | 0.8% | View All 29 Rows |
Immigrants in Pigeon Forge
The most numerous immigrant groups reported in Pigeon Forge came from Latin America (759 | 12.0%), Central America (706 | 11.1%), Honduras (449 | 7.1%), Mexico (257 | 4.1%), and Asia (193 | 3.0%), together accounting for 37.3% of all Pigeon Forge residents.
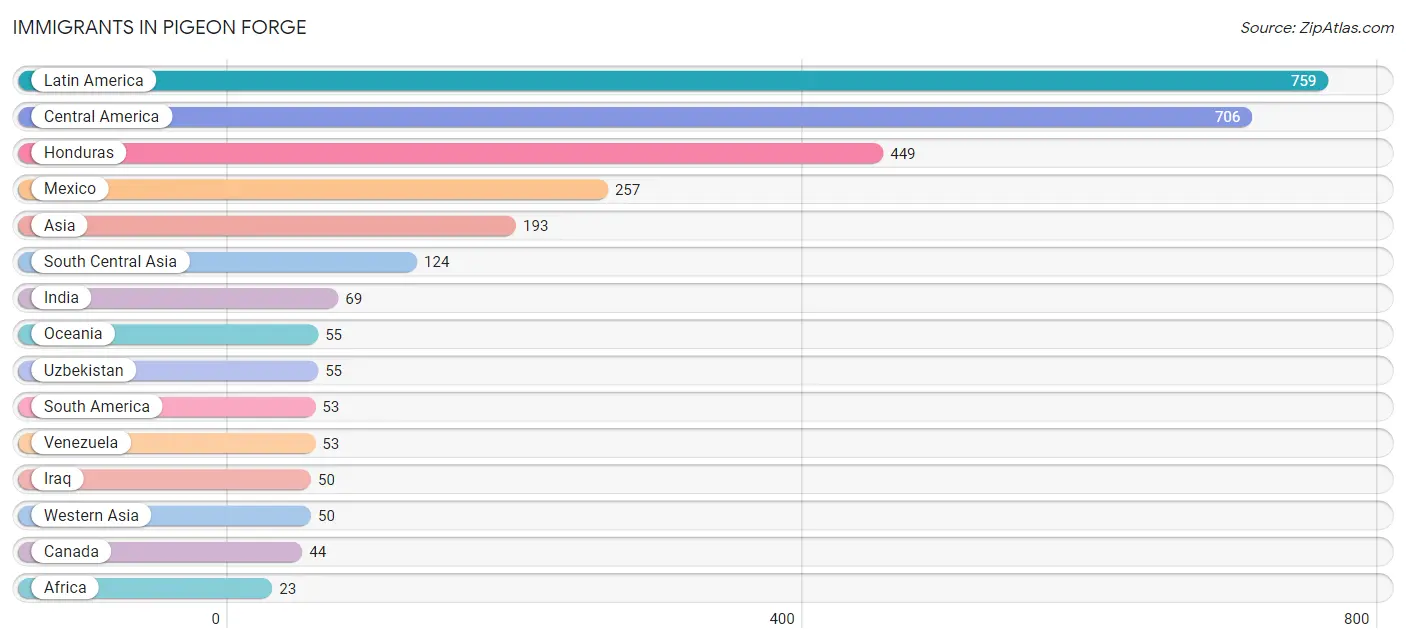
| Immigration Origin | # Population | % Population |
| Africa | 23 | 0.4% |
| Asia | 193 | 3.0% |
| Canada | 44 | 0.7% |
| Central America | 706 | 11.1% |
| China | 6 | 0.1% |
| Eastern Asia | 6 | 0.1% |
| Eastern Europe | 11 | 0.2% |
| Europe | 11 | 0.2% |
| Honduras | 449 | 7.1% |
| India | 69 | 1.1% |
| Iraq | 50 | 0.8% |
| Latin America | 759 | 12.0% |
| Mexico | 257 | 4.1% |
| Oceania | 55 | 0.9% |
| Philippines | 13 | 0.2% |
| Russia | 11 | 0.2% |
| South America | 53 | 0.8% |
| South Central Asia | 124 | 1.9% |
| South Eastern Asia | 13 | 0.2% |
| Taiwan | 6 | 0.1% |
| Uzbekistan | 55 | 0.9% |
| Venezuela | 53 | 0.8% |
| Western Asia | 50 | 0.8% | View All 23 Rows |
Sex and Age in Pigeon Forge
Sex and Age in Pigeon Forge
The most populous age groups in Pigeon Forge are 15 to 19 Years (354 | 10.2%) for men and 30 to 34 Years (305 | 10.6%) for women.
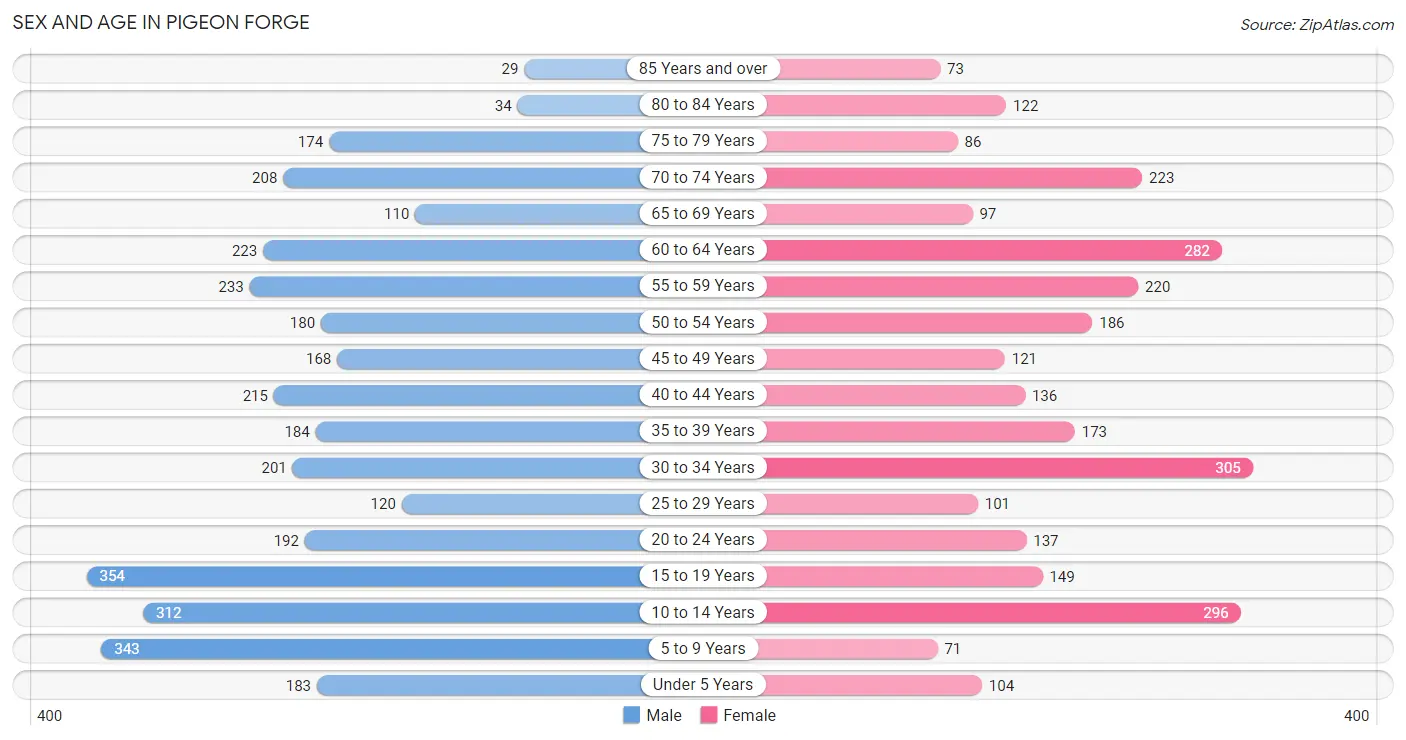
| Age Bracket | Male | Female |
| Under 5 Years | 183 (5.3%) | 104 (3.6%) |
| 5 to 9 Years | 343 (9.9%) | 71 (2.5%) |
| 10 to 14 Years | 312 (9.0%) | 296 (10.3%) |
| 15 to 19 Years | 354 (10.2%) | 149 (5.2%) |
| 20 to 24 Years | 192 (5.5%) | 137 (4.8%) |
| 25 to 29 Years | 120 (3.5%) | 101 (3.5%) |
| 30 to 34 Years | 201 (5.8%) | 305 (10.6%) |
| 35 to 39 Years | 184 (5.3%) | 173 (6.0%) |
| 40 to 44 Years | 215 (6.2%) | 136 (4.7%) |
| 45 to 49 Years | 168 (4.9%) | 121 (4.2%) |
| 50 to 54 Years | 180 (5.2%) | 186 (6.5%) |
| 55 to 59 Years | 233 (6.7%) | 220 (7.6%) |
| 60 to 64 Years | 223 (6.4%) | 282 (9.8%) |
| 65 to 69 Years | 110 (3.2%) | 97 (3.4%) |
| 70 to 74 Years | 208 (6.0%) | 223 (7.7%) |
| 75 to 79 Years | 174 (5.0%) | 86 (3.0%) |
| 80 to 84 Years | 34 (1.0%) | 122 (4.2%) |
| 85 Years and over | 29 (0.8%) | 73 (2.5%) |
| Total | 3,463 (100.0%) | 2,882 (100.0%) |
Families and Households in Pigeon Forge
Median Family Size in Pigeon Forge
The median family size in Pigeon Forge is 3.22 persons per family, with married-couple families (987 | 62.3%) accounting for the largest median family size of 3.32 persons per family. On the other hand, single male/father families (77 | 4.9%) represent the smallest median family size with 3.04 persons per family.
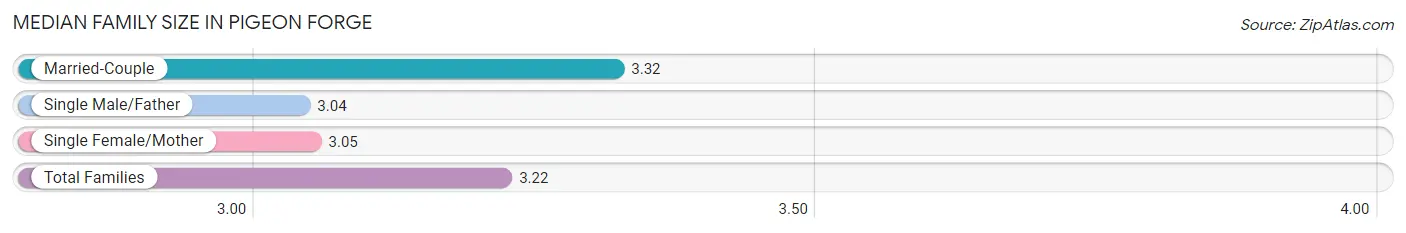
| Family Type | # Families | Family Size |
| Married-Couple | 987 (62.3%) | 3.32 |
| Single Male/Father | 77 (4.9%) | 3.04 |
| Single Female/Mother | 521 (32.9%) | 3.05 |
| Total Families | 1,585 (100.0%) | 3.22 |
Median Household Size in Pigeon Forge
The median household size in Pigeon Forge is 2.74 persons per household, with single male/father households (77 | 3.4%) accounting for the largest median household size of 3.69 persons per household. non-family households (692 | 30.4%) represent the smallest median household size with 1.17 persons per household.
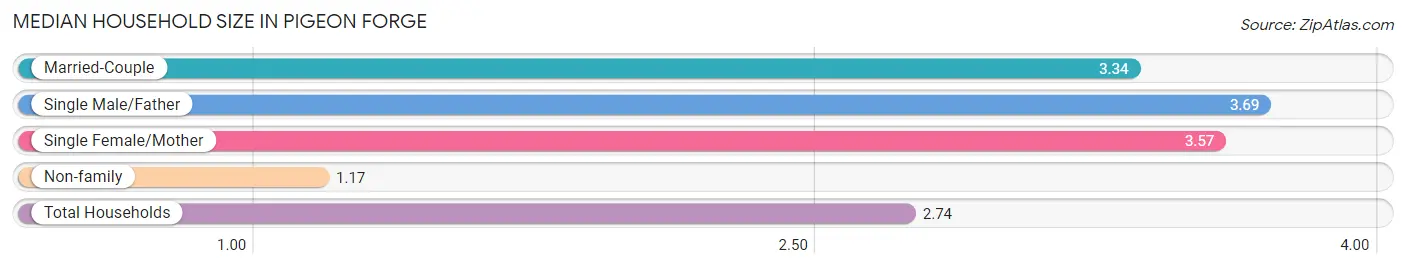
| Household Type | # Households | Household Size |
| Married-Couple | 987 (43.3%) | 3.34 |
| Single Male/Father | 77 (3.4%) | 3.69 |
| Single Female/Mother | 521 (22.9%) | 3.57 |
| Non-family | 692 (30.4%) | 1.17 |
| Total Households | 2,277 (100.0%) | 2.74 |
Household Size by Marriage Status in Pigeon Forge
Out of a total of 2,277 households in Pigeon Forge, 1,585 (69.6%) are family households, while 692 (30.4%) are nonfamily households. The most numerous type of family households are 2-person households, comprising 524, and the most common type of nonfamily households are 1-person households, comprising 602.
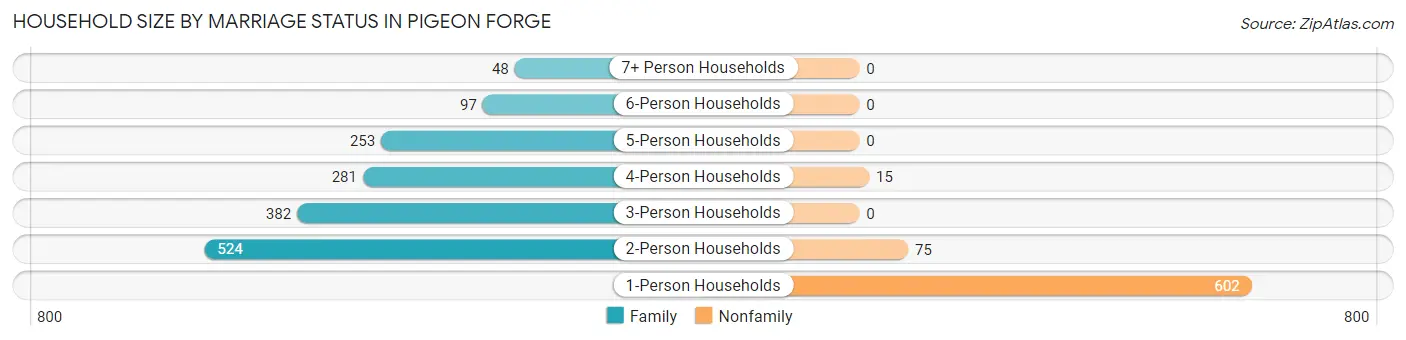
| Household Size | Family Households | Nonfamily Households |
| 1-Person Households | - | 602 (26.4%) |
| 2-Person Households | 524 (23.0%) | 75 (3.3%) |
| 3-Person Households | 382 (16.8%) | 0 (0.0%) |
| 4-Person Households | 281 (12.3%) | 15 (0.7%) |
| 5-Person Households | 253 (11.1%) | 0 (0.0%) |
| 6-Person Households | 97 (4.3%) | 0 (0.0%) |
| 7+ Person Households | 48 (2.1%) | 0 (0.0%) |
| Total | 1,585 (69.6%) | 692 (30.4%) |
Female Fertility in Pigeon Forge
Fertility by Age in Pigeon Forge
Average fertility rate in Pigeon Forge is 62.0 births per 1,000 women. Women in the age bracket of 20 to 34 years have the highest fertility rate with 92.0 births per 1,000 women. Women in the age bracket of 20 to 34 years acount for 71.4% of all women with births.
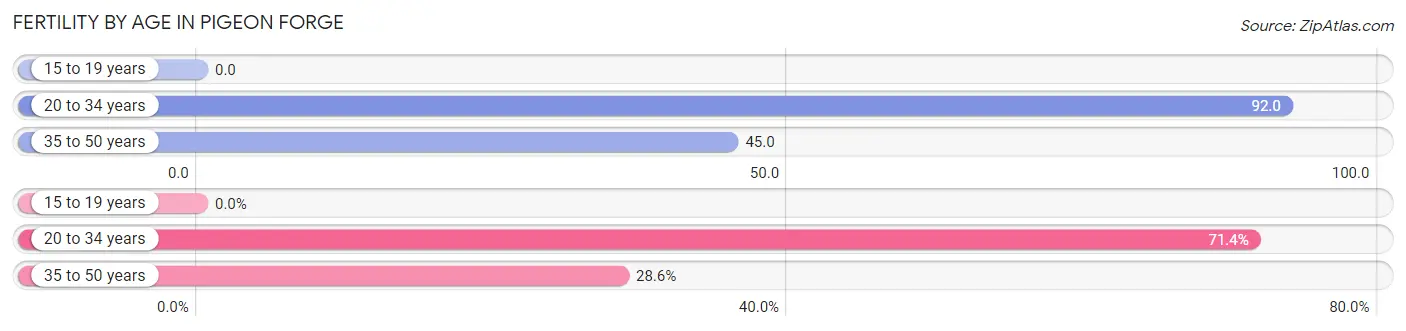
| Age Bracket | Women with Births | Births / 1,000 Women |
| 15 to 19 years | 0 (0.0%) | 0.0 |
| 20 to 34 years | 50 (71.4%) | 92.0 |
| 35 to 50 years | 20 (28.6%) | 45.0 |
| Total | 70 (100.0%) | 62.0 |
Fertility by Age by Marriage Status in Pigeon Forge
80.0% of women with births (70) in Pigeon Forge are married. The highest percentage of unmarried women with births falls into 20 to 34 years age bracket with 28.0% of them unmarried at the time of birth, while the lowest percentage of unmarried women with births belong to 35 to 50 years age bracket with 0.0% of them unmarried.
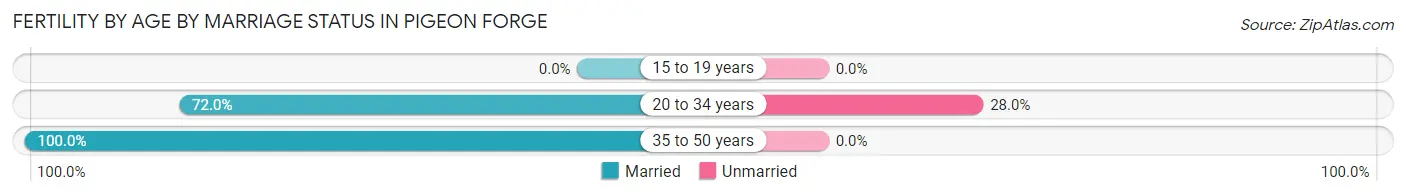
| Age Bracket | Married | Unmarried |
| 15 to 19 years | 0 (0.0%) | 0 (0.0%) |
| 20 to 34 years | 36 (72.0%) | 14 (28.0%) |
| 35 to 50 years | 20 (100.0%) | 0 (0.0%) |
| Total | 56 (80.0%) | 14 (20.0%) |
Fertility by Education in Pigeon Forge
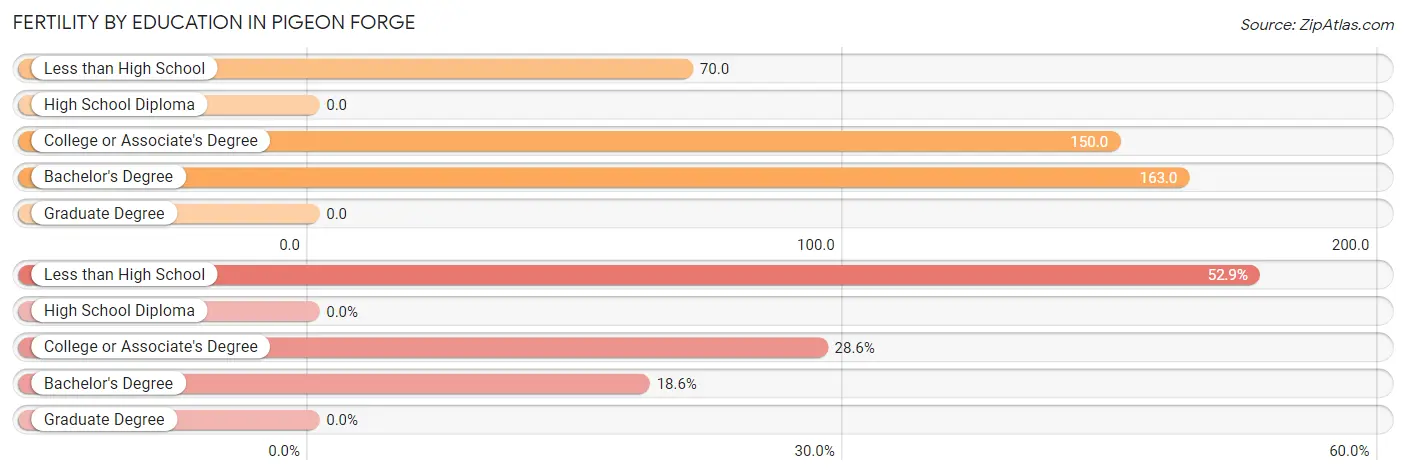
| Educational Attainment | Women with Births | Births / 1,000 Women |
| Less than High School | 37 (52.9%) | 70.0 |
| High School Diploma | 0 (0.0%) | 0.0 |
| College or Associate's Degree | 20 (28.6%) | 150.0 |
| Bachelor's Degree | 13 (18.6%) | 163.0 |
| Graduate Degree | 0 (0.0%) | 0.0 |
| Total | 70 (100.0%) | 62.0 |
Fertility by Education by Marriage Status in Pigeon Forge
20.0% of women with births in Pigeon Forge are unmarried. Women with the educational attainment of college or associate's degree are most likely to be married with 100.0% of them married at childbirth, while women with the educational attainment of less than high school are least likely to be married with 37.8% of them unmarried at childbirth.
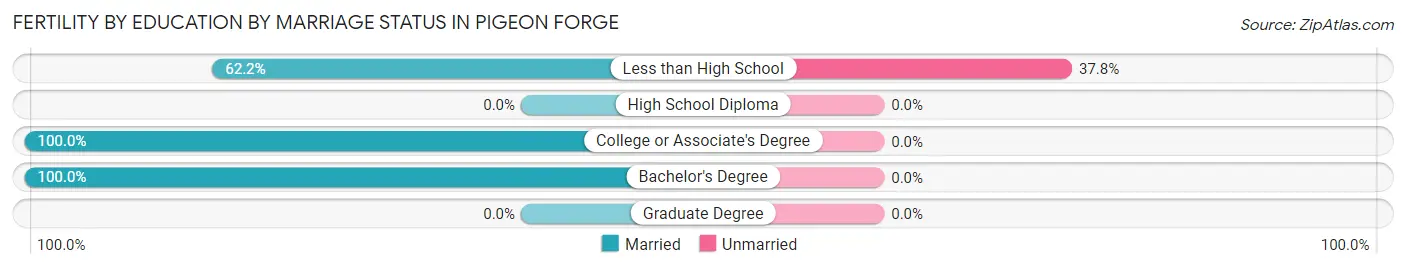
| Educational Attainment | Married | Unmarried |
| Less than High School | 23 (62.2%) | 14 (37.8%) |
| High School Diploma | 0 (0.0%) | 0 (0.0%) |
| College or Associate's Degree | 20 (100.0%) | 0 (0.0%) |
| Bachelor's Degree | 13 (100.0%) | 0 (0.0%) |
| Graduate Degree | 0 (0.0%) | 0 (0.0%) |
| Total | 56 (80.0%) | 14 (20.0%) |
Employment Characteristics in Pigeon Forge
Employment by Class of Employer in Pigeon Forge
Among the 2,787 employed individuals in Pigeon Forge, private company employees (2,116 | 75.9%), self-employed (not incorporated) (387 | 13.9%), and not-for-profit organizations (102 | 3.7%) make up the most common classes of employment.
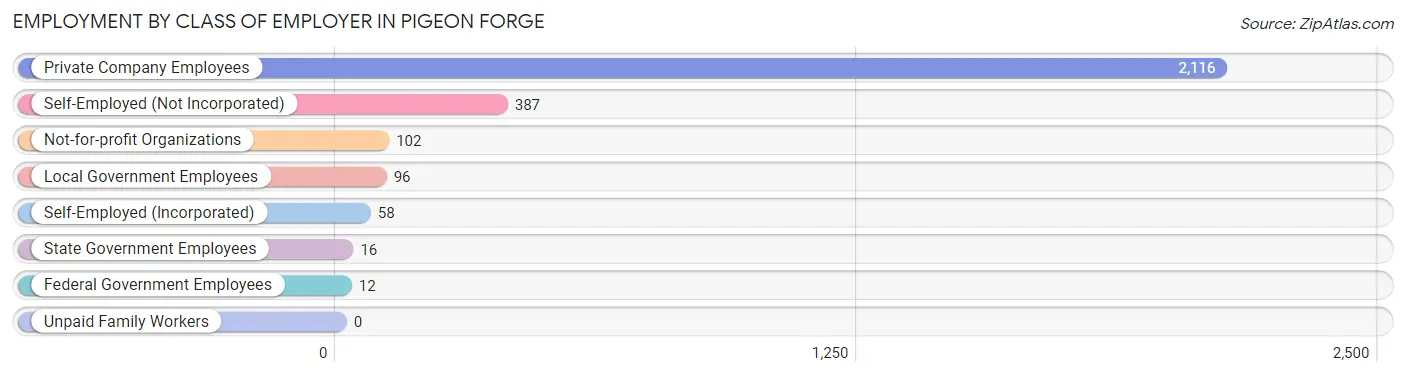
| Employer Class | # Employees | % Employees |
| Private Company Employees | 2,116 | 75.9% |
| Self-Employed (Incorporated) | 58 | 2.1% |
| Self-Employed (Not Incorporated) | 387 | 13.9% |
| Not-for-profit Organizations | 102 | 3.7% |
| Local Government Employees | 96 | 3.4% |
| State Government Employees | 16 | 0.6% |
| Federal Government Employees | 12 | 0.4% |
| Unpaid Family Workers | 0 | 0.0% |
| Total | 2,787 | 100.0% |
Employment Status by Age in Pigeon Forge
According to the labor force statistics for Pigeon Forge, out of the total population over 16 years of age (4,910), 59.6% or 2,926 individuals are in the labor force, with 1.7% or 50 of them unemployed. The age group with the highest labor force participation rate is 30 to 34 years, with 89.9% or 455 individuals in the labor force. Within the labor force, the 25 to 29 years age range has the highest percentage of unemployed individuals, with 10.5% or 17 of them being unemployed.
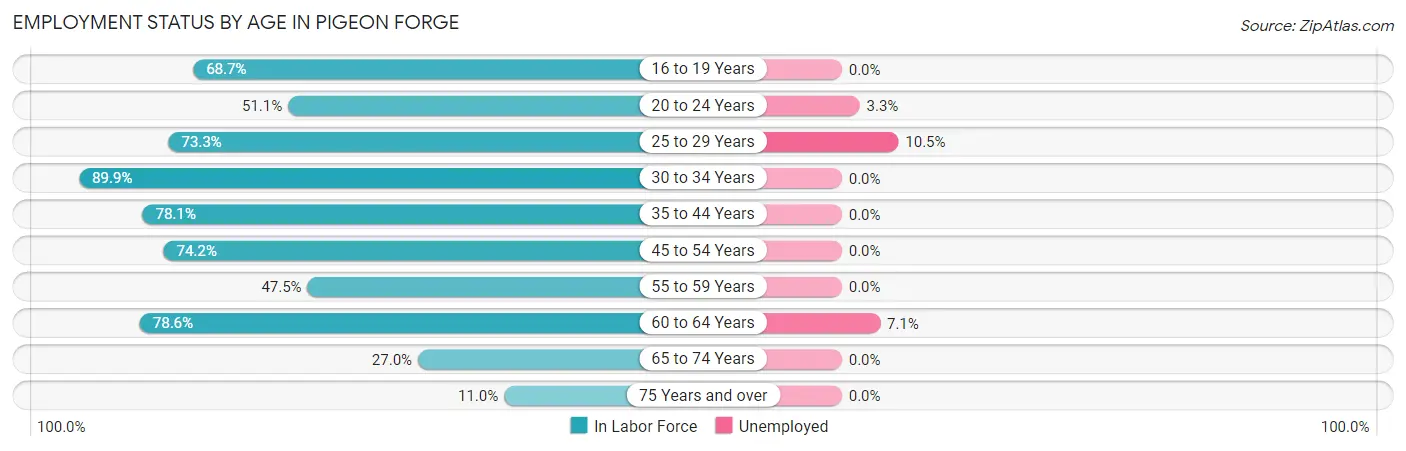
| Age Bracket | In Labor Force | Unemployed |
| 16 to 19 Years | 259 (68.7%) | 0 (0.0%) |
| 20 to 24 Years | 168 (51.1%) | 6 (3.3%) |
| 25 to 29 Years | 162 (73.3%) | 17 (10.5%) |
| 30 to 34 Years | 455 (89.9%) | 0 (0.0%) |
| 35 to 44 Years | 553 (78.1%) | 0 (0.0%) |
| 45 to 54 Years | 486 (74.2%) | 0 (0.0%) |
| 55 to 59 Years | 215 (47.5%) | 0 (0.0%) |
| 60 to 64 Years | 397 (78.6%) | 28 (7.1%) |
| 65 to 74 Years | 172 (27.0%) | 0 (0.0%) |
| 75 Years and over | 57 (11.0%) | 0 (0.0%) |
| Total | 2,926 (59.6%) | 50 (1.7%) |
Employment Status by Educational Attainment in Pigeon Forge
According to labor force statistics for Pigeon Forge, 74.4% of individuals (2,268) out of the total population between 25 and 64 years of age (3,048) are in the labor force, with 2.0% or 45 of them being unemployed. The group with the highest labor force participation rate are those with the educational attainment of bachelor's degree or higher, with 97.4% or 294 individuals in the labor force. Within the labor force, individuals with high school diploma education have the highest percentage of unemployment, with 4.2% or 32 of them being unemployed.
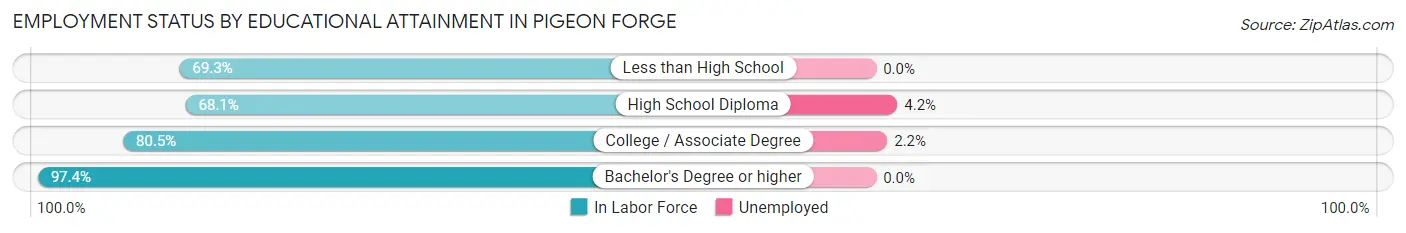
| Educational Attainment | In Labor Force | Unemployed |
| Less than High School | 612 (69.3%) | 0 (0.0%) |
| High School Diploma | 758 (68.1%) | 47 (4.2%) |
| College / Associate Degree | 604 (80.5%) | 17 (2.2%) |
| Bachelor's Degree or higher | 294 (97.4%) | 0 (0.0%) |
| Total | 2,268 (74.4%) | 61 (2.0%) |
Employment Occupations by Sex in Pigeon Forge
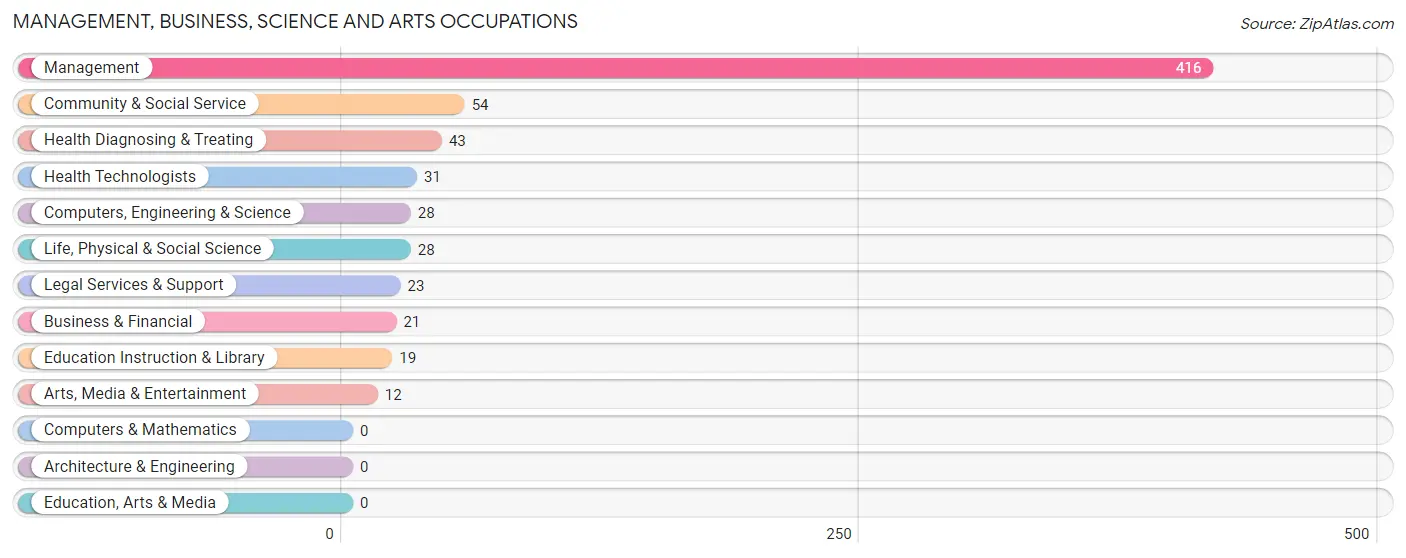
Management, Business, Science and Arts Occupations
The most common Management, Business, Science and Arts occupations in Pigeon Forge are Management (416 | 14.6%), Community & Social Service (54 | 1.9%), Health Diagnosing & Treating (43 | 1.5%), Health Technologists (31 | 1.1%), and Computers, Engineering & Science (28 | 1.0%).
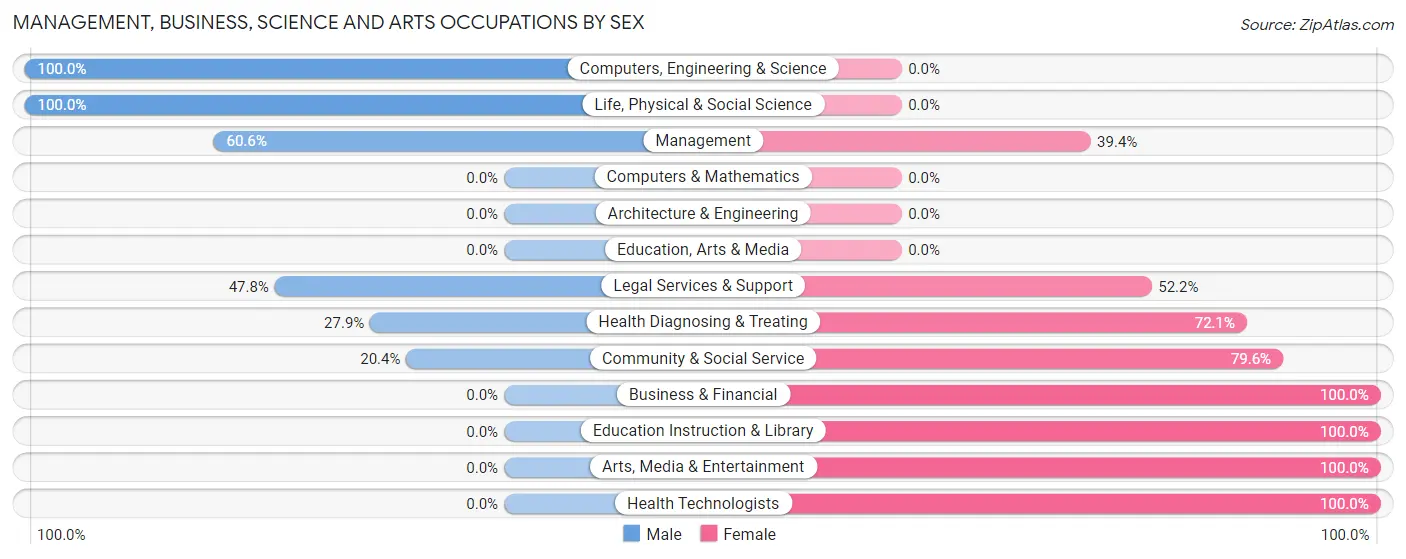
Management, Business, Science and Arts Occupations by Sex
Within the Management, Business, Science and Arts occupations in Pigeon Forge, the most male-oriented occupations are Computers, Engineering & Science (100.0%), Life, Physical & Social Science (100.0%), and Management (60.6%), while the most female-oriented occupations are Business & Financial (100.0%), Education Instruction & Library (100.0%), and Arts, Media & Entertainment (100.0%).
| Occupation | Male | Female |
| Management | 252 (60.6%) | 164 (39.4%) |
| Business & Financial | 0 (0.0%) | 21 (100.0%) |
| Computers, Engineering & Science | 28 (100.0%) | 0 (0.0%) |
| Computers & Mathematics | 0 (0.0%) | 0 (0.0%) |
| Architecture & Engineering | 0 (0.0%) | 0 (0.0%) |
| Life, Physical & Social Science | 28 (100.0%) | 0 (0.0%) |
| Community & Social Service | 11 (20.4%) | 43 (79.6%) |
| Education, Arts & Media | 0 (0.0%) | 0 (0.0%) |
| Legal Services & Support | 11 (47.8%) | 12 (52.2%) |
| Education Instruction & Library | 0 (0.0%) | 19 (100.0%) |
| Arts, Media & Entertainment | 0 (0.0%) | 12 (100.0%) |
| Health Diagnosing & Treating | 12 (27.9%) | 31 (72.1%) |
| Health Technologists | 0 (0.0%) | 31 (100.0%) |
| Total (Category) | 303 (53.9%) | 259 (46.1%) |
| Total (Overall) | 1,585 (55.5%) | 1,273 (44.5%) |
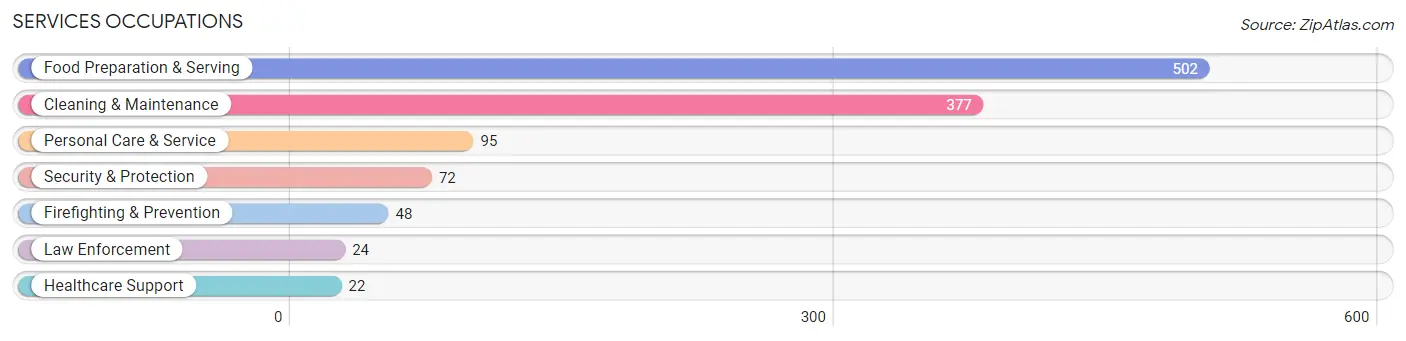
Services Occupations
The most common Services occupations in Pigeon Forge are Food Preparation & Serving (502 | 17.6%), Cleaning & Maintenance (377 | 13.2%), Personal Care & Service (95 | 3.3%), Security & Protection (72 | 2.5%), and Firefighting & Prevention (48 | 1.7%).
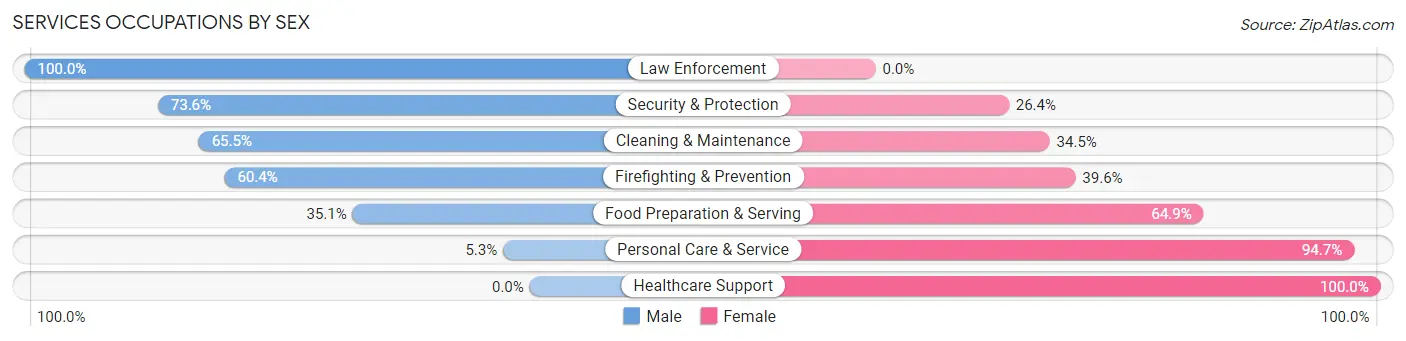
Services Occupations by Sex
Within the Services occupations in Pigeon Forge, the most male-oriented occupations are Law Enforcement (100.0%), Security & Protection (73.6%), and Cleaning & Maintenance (65.5%), while the most female-oriented occupations are Healthcare Support (100.0%), Personal Care & Service (94.7%), and Food Preparation & Serving (64.9%).
| Occupation | Male | Female |
| Healthcare Support | 0 (0.0%) | 22 (100.0%) |
| Security & Protection | 53 (73.6%) | 19 (26.4%) |
| Firefighting & Prevention | 29 (60.4%) | 19 (39.6%) |
| Law Enforcement | 24 (100.0%) | 0 (0.0%) |
| Food Preparation & Serving | 176 (35.1%) | 326 (64.9%) |
| Cleaning & Maintenance | 247 (65.5%) | 130 (34.5%) |
| Personal Care & Service | 5 (5.3%) | 90 (94.7%) |
| Total (Category) | 481 (45.0%) | 587 (55.0%) |
| Total (Overall) | 1,585 (55.5%) | 1,273 (44.5%) |
Sales and Office Occupations
The most common Sales and Office occupations in Pigeon Forge are Sales & Related (422 | 14.8%), and Office & Administration (204 | 7.1%).
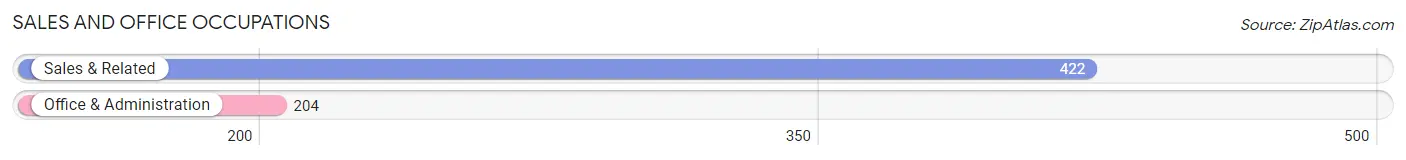
Sales and Office Occupations by Sex
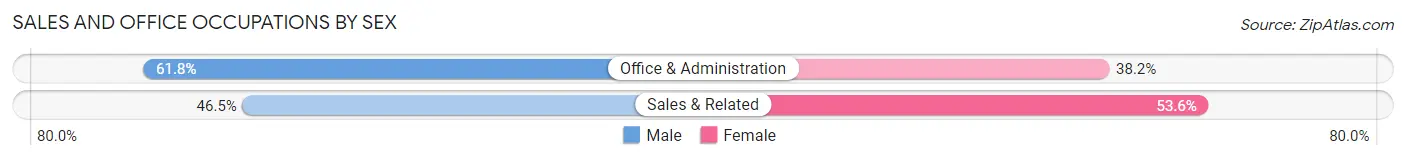
| Occupation | Male | Female |
| Sales & Related | 196 (46.5%) | 226 (53.5%) |
| Office & Administration | 126 (61.8%) | 78 (38.2%) |
| Total (Category) | 322 (51.4%) | 304 (48.6%) |
| Total (Overall) | 1,585 (55.5%) | 1,273 (44.5%) |
Natural Resources, Construction and Maintenance Occupations
The most common Natural Resources, Construction and Maintenance occupations in Pigeon Forge are Construction & Extraction (261 | 9.1%), Installation, Maintenance & Repair (35 | 1.2%), and Farming, Fishing & Forestry (17 | 0.6%).
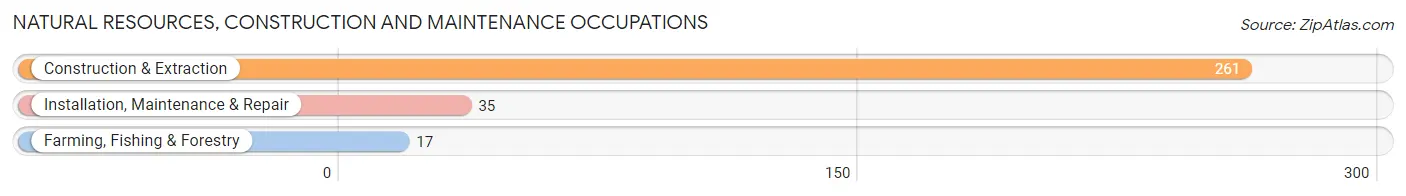
Natural Resources, Construction and Maintenance Occupations by Sex
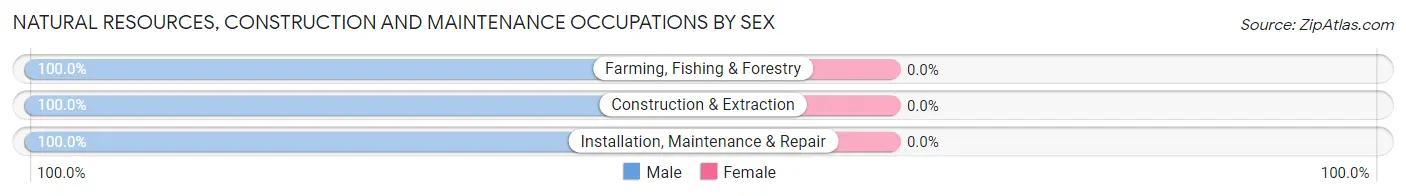
| Occupation | Male | Female |
| Farming, Fishing & Forestry | 17 (100.0%) | 0 (0.0%) |
| Construction & Extraction | 261 (100.0%) | 0 (0.0%) |
| Installation, Maintenance & Repair | 35 (100.0%) | 0 (0.0%) |
| Total (Category) | 313 (100.0%) | 0 (0.0%) |
| Total (Overall) | 1,585 (55.5%) | 1,273 (44.5%) |
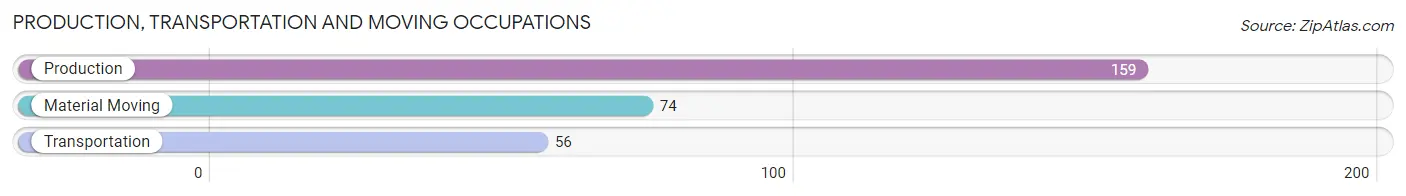
Production, Transportation and Moving Occupations
The most common Production, Transportation and Moving occupations in Pigeon Forge are Production (159 | 5.6%), Material Moving (74 | 2.6%), and Transportation (56 | 2.0%).
Production, Transportation and Moving Occupations by Sex
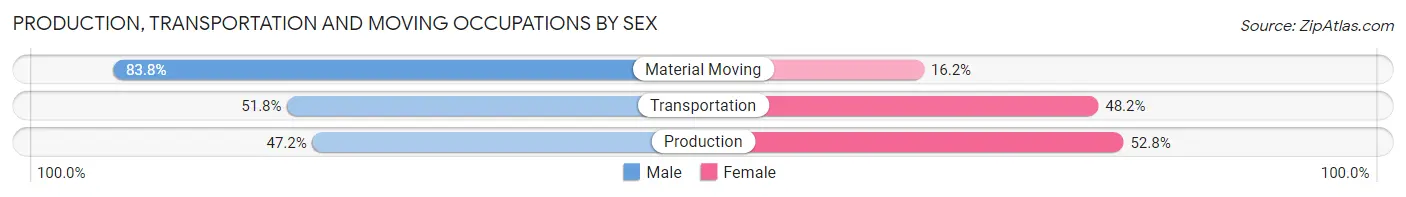
| Occupation | Male | Female |
| Production | 75 (47.2%) | 84 (52.8%) |
| Transportation | 29 (51.8%) | 27 (48.2%) |
| Material Moving | 62 (83.8%) | 12 (16.2%) |
| Total (Category) | 166 (57.4%) | 123 (42.6%) |
| Total (Overall) | 1,585 (55.5%) | 1,273 (44.5%) |
Employment Industries by Sex in Pigeon Forge
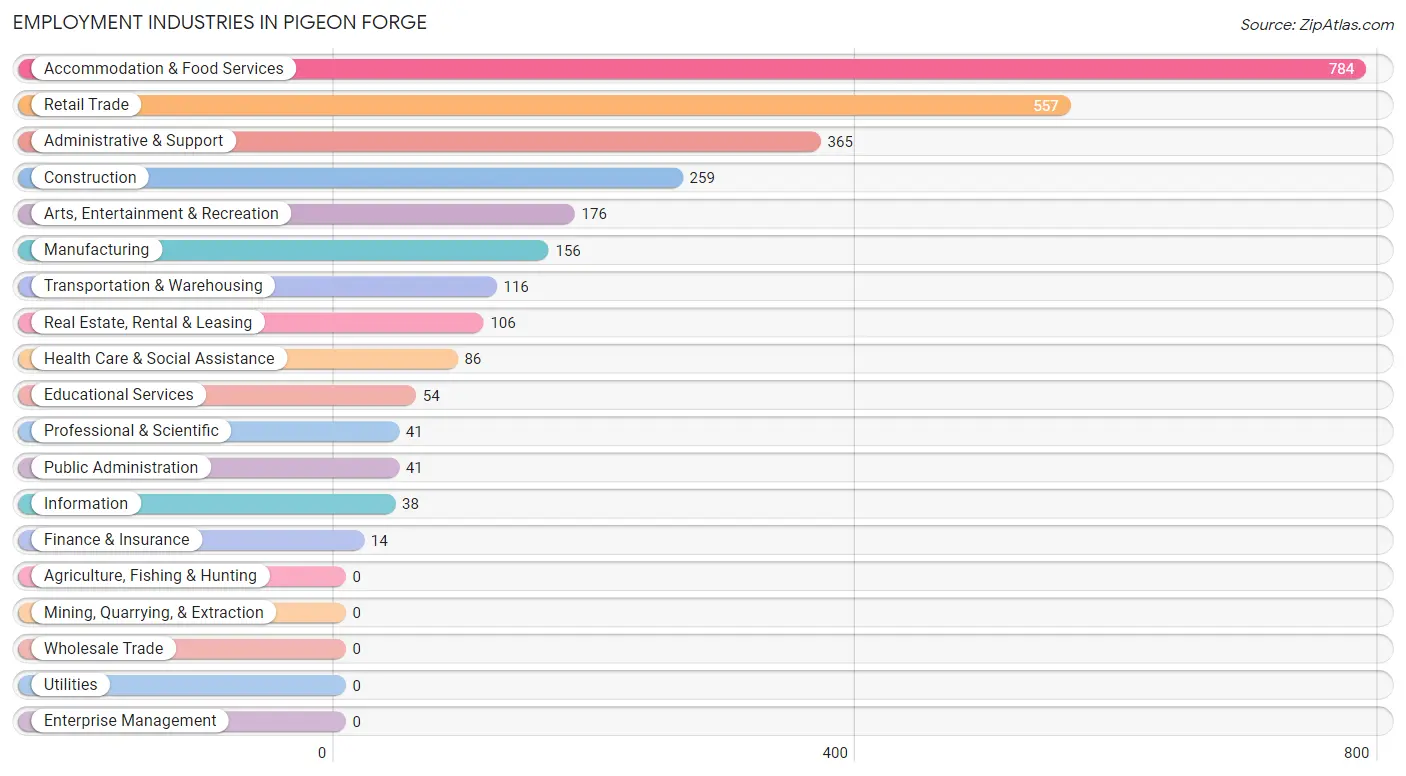
Employment Industries in Pigeon Forge
The major employment industries in Pigeon Forge include Accommodation & Food Services (784 | 27.4%), Retail Trade (557 | 19.5%), Administrative & Support (365 | 12.8%), Construction (259 | 9.1%), and Arts, Entertainment & Recreation (176 | 6.2%).
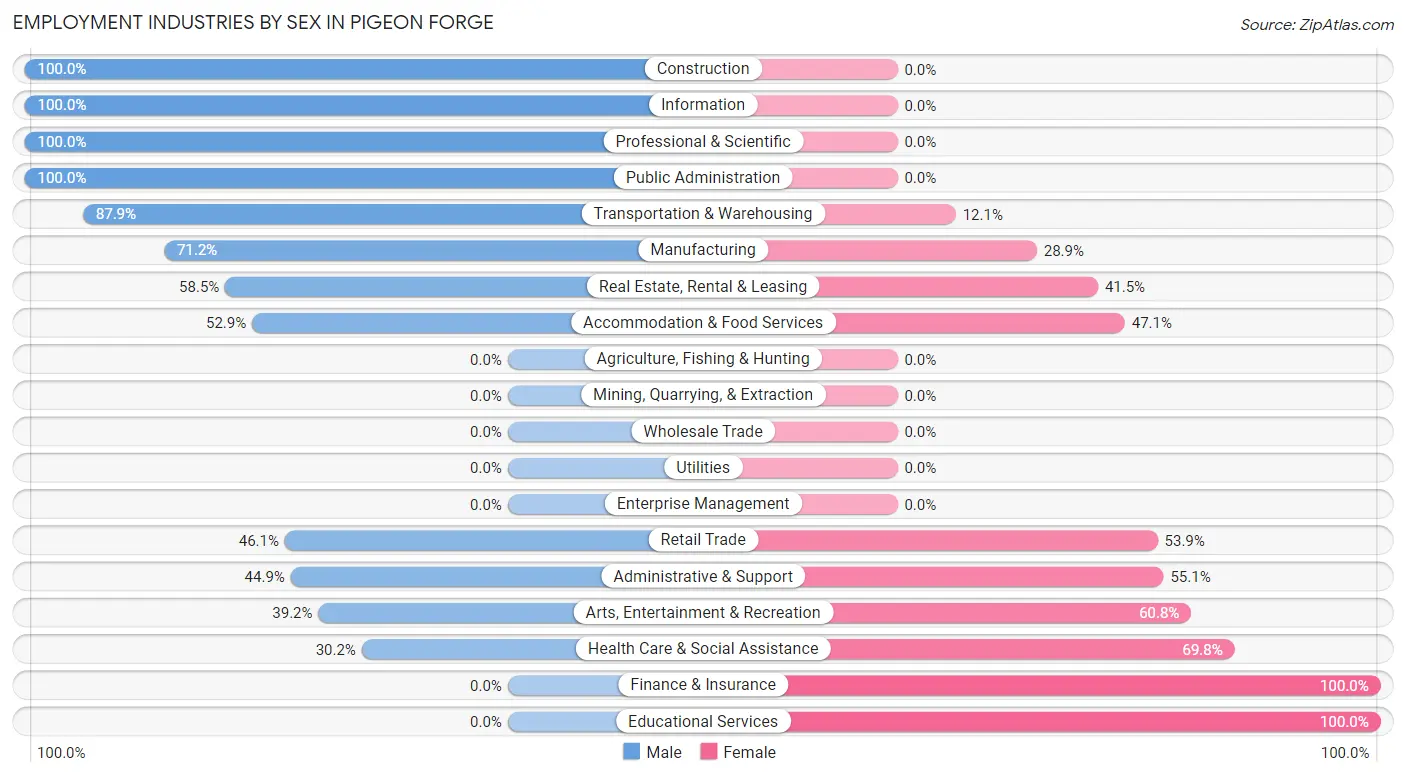
Employment Industries by Sex in Pigeon Forge
The Pigeon Forge industries that see more men than women are Construction (100.0%), Information (100.0%), and Professional & Scientific (100.0%), whereas the industries that tend to have a higher number of women are Finance & Insurance (100.0%), Educational Services (100.0%), and Health Care & Social Assistance (69.8%).
| Industry | Male | Female |
| Agriculture, Fishing & Hunting | 0 (0.0%) | 0 (0.0%) |
| Mining, Quarrying, & Extraction | 0 (0.0%) | 0 (0.0%) |
| Construction | 259 (100.0%) | 0 (0.0%) |
| Manufacturing | 111 (71.2%) | 45 (28.8%) |
| Wholesale Trade | 0 (0.0%) | 0 (0.0%) |
| Retail Trade | 257 (46.1%) | 300 (53.9%) |
| Transportation & Warehousing | 102 (87.9%) | 14 (12.1%) |
| Utilities | 0 (0.0%) | 0 (0.0%) |
| Information | 38 (100.0%) | 0 (0.0%) |
| Finance & Insurance | 0 (0.0%) | 14 (100.0%) |
| Real Estate, Rental & Leasing | 62 (58.5%) | 44 (41.5%) |
| Professional & Scientific | 41 (100.0%) | 0 (0.0%) |
| Enterprise Management | 0 (0.0%) | 0 (0.0%) |
| Administrative & Support | 164 (44.9%) | 201 (55.1%) |
| Educational Services | 0 (0.0%) | 54 (100.0%) |
| Health Care & Social Assistance | 26 (30.2%) | 60 (69.8%) |
| Arts, Entertainment & Recreation | 69 (39.2%) | 107 (60.8%) |
| Accommodation & Food Services | 415 (52.9%) | 369 (47.1%) |
| Public Administration | 41 (100.0%) | 0 (0.0%) |
| Total | 1,585 (55.5%) | 1,273 (44.5%) |
Education in Pigeon Forge
School Enrollment in Pigeon Forge
The most common levels of schooling among the 1,558 students in Pigeon Forge are middle school (537 | 34.5%), high school (411 | 26.4%), and elementary school (223 | 14.3%).
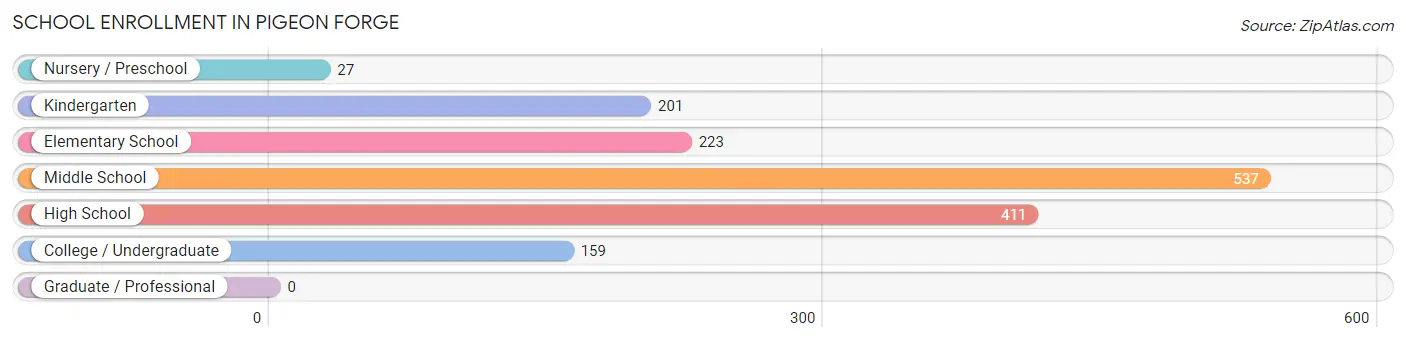
| School Level | # Students | % Students |
| Nursery / Preschool | 27 | 1.7% |
| Kindergarten | 201 | 12.9% |
| Elementary School | 223 | 14.3% |
| Middle School | 537 | 34.5% |
| High School | 411 | 26.4% |
| College / Undergraduate | 159 | 10.2% |
| Graduate / Professional | 0 | 0.0% |
| Total | 1,558 | 100.0% |
School Enrollment by Age by Funding Source in Pigeon Forge
Out of a total of 1,558 students who are enrolled in schools in Pigeon Forge, 19 (1.2%) attend a private institution, while the remaining 1,539 (98.8%) are enrolled in public schools. The age group of 18 to 19 year olds has the highest likelihood of being enrolled in private schools, with 3 (4.3% in the age bracket) enrolled. Conversely, the age group of 3 to 4 year olds has the lowest likelihood of being enrolled in a private school, with 9 (100.0% in the age bracket) attending a public institution.
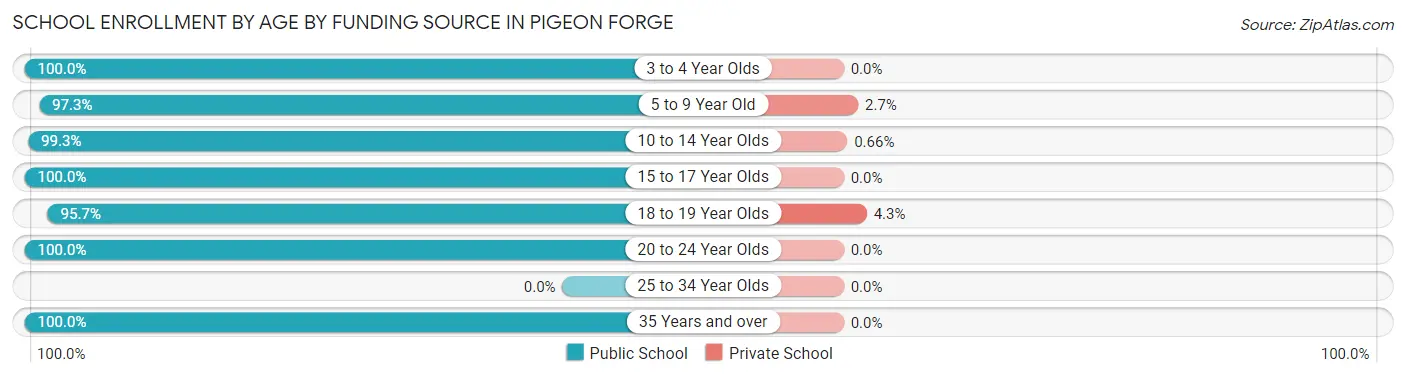
| Age Bracket | Public School | Private School |
| 3 to 4 Year Olds | 9 (100.0%) | 0 (0.0%) |
| 5 to 9 Year Old | 398 (97.3%) | 11 (2.7%) |
| 10 to 14 Year Olds | 604 (99.3%) | 4 (0.7%) |
| 15 to 17 Year Olds | 383 (100.0%) | 0 (0.0%) |
| 18 to 19 Year Olds | 67 (95.7%) | 3 (4.3%) |
| 20 to 24 Year Olds | 48 (100.0%) | 0 (0.0%) |
| 25 to 34 Year Olds | 0 (0.0%) | 0 (0.0%) |
| 35 Years and over | 31 (100.0%) | 0 (0.0%) |
| Total | 1,539 (98.8%) | 19 (1.2%) |
Educational Attainment by Field of Study in Pigeon Forge
Business (109 | 23.6%), arts & humanities (93 | 20.2%), education (61 | 13.2%), bio, nature & agricultural (53 | 11.5%), and visual & performing arts (39 | 8.5%) are the most common fields of study among 461 individuals in Pigeon Forge who have obtained a bachelor's degree or higher.
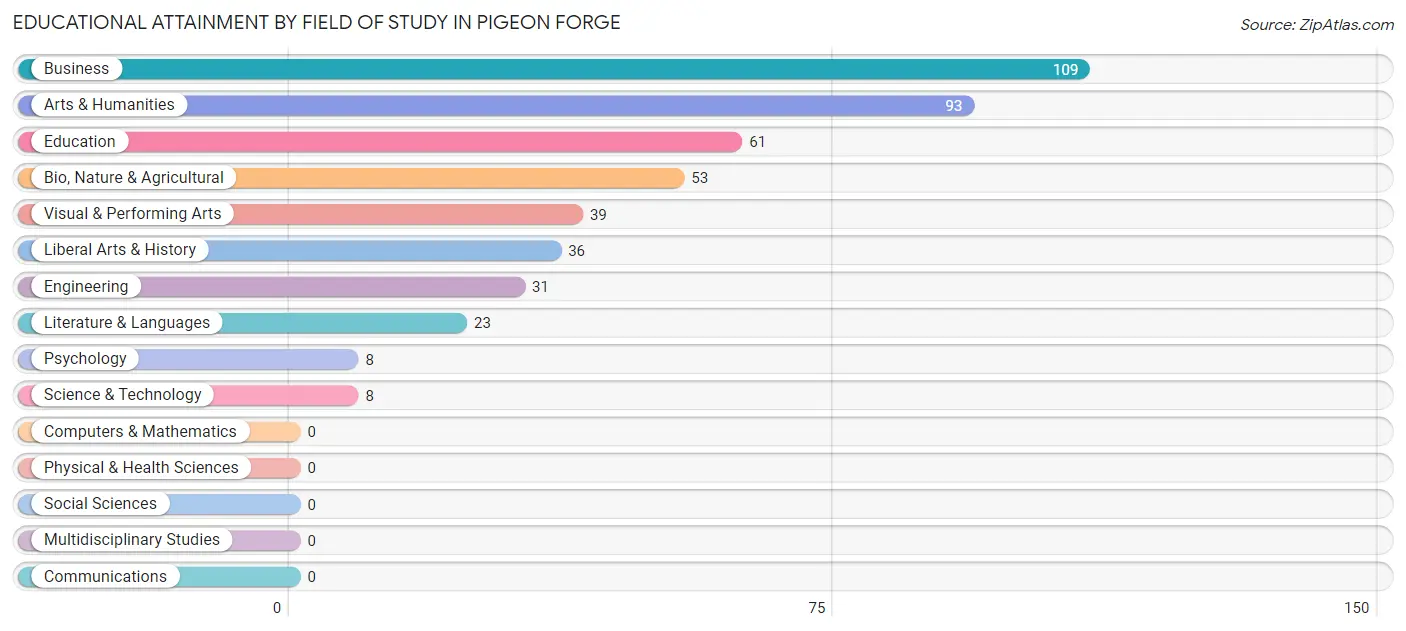
| Field of Study | # Graduates | % Graduates |
| Computers & Mathematics | 0 | 0.0% |
| Bio, Nature & Agricultural | 53 | 11.5% |
| Physical & Health Sciences | 0 | 0.0% |
| Psychology | 8 | 1.7% |
| Social Sciences | 0 | 0.0% |
| Engineering | 31 | 6.7% |
| Multidisciplinary Studies | 0 | 0.0% |
| Science & Technology | 8 | 1.7% |
| Business | 109 | 23.6% |
| Education | 61 | 13.2% |
| Literature & Languages | 23 | 5.0% |
| Liberal Arts & History | 36 | 7.8% |
| Visual & Performing Arts | 39 | 8.5% |
| Communications | 0 | 0.0% |
| Arts & Humanities | 93 | 20.2% |
| Total | 461 | 100.0% |
Transportation & Commute in Pigeon Forge
Vehicle Availability by Sex in Pigeon Forge
The most prevalent vehicle ownership categories in Pigeon Forge are males with 2 vehicles (647, accounting for 41.4%) and females with 2 vehicles (525, making up 52.9%).
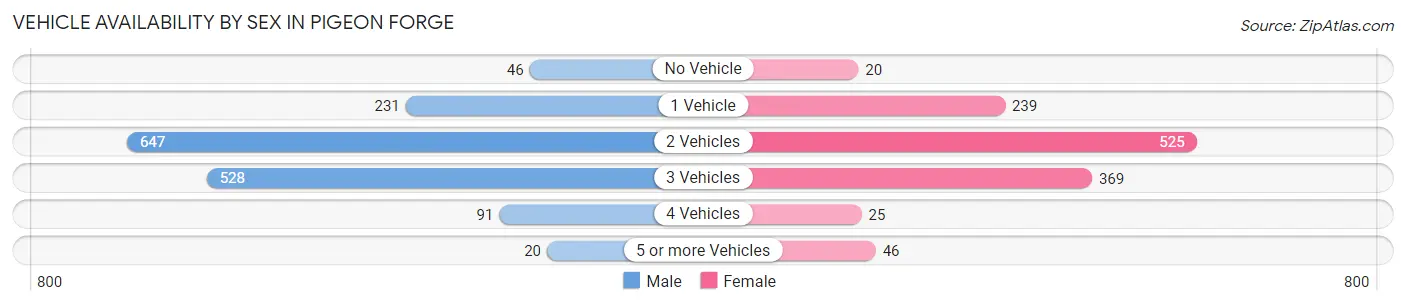
| Vehicles Available | Male | Female |
| No Vehicle | 46 (2.9%) | 20 (1.6%) |
| 1 Vehicle | 231 (14.8%) | 239 (19.5%) |
| 2 Vehicles | 647 (41.4%) | 525 (42.9%) |
| 3 Vehicles | 528 (33.8%) | 369 (30.1%) |
| 4 Vehicles | 91 (5.8%) | 25 (2.0%) |
| 5 or more Vehicles | 20 (1.3%) | 46 (3.8%) |
| Total | 1,563 (100.0%) | 1,224 (100.0%) |
Commute Time in Pigeon Forge
The most frequently occuring commute durations in Pigeon Forge are 5 to 9 minutes (575 commuters, 21.5%), 15 to 19 minutes (528 commuters, 19.8%), and 30 to 34 minutes (448 commuters, 16.8%).
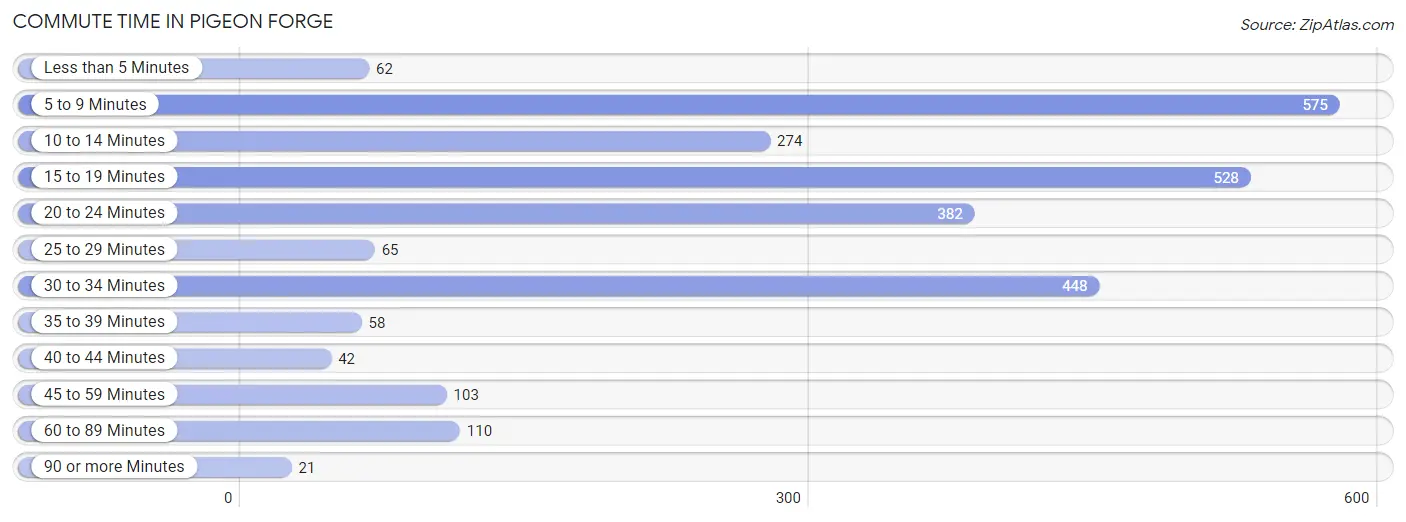
| Commute Time | # Commuters | % Commuters |
| Less than 5 Minutes | 62 | 2.3% |
| 5 to 9 Minutes | 575 | 21.5% |
| 10 to 14 Minutes | 274 | 10.3% |
| 15 to 19 Minutes | 528 | 19.8% |
| 20 to 24 Minutes | 382 | 14.3% |
| 25 to 29 Minutes | 65 | 2.4% |
| 30 to 34 Minutes | 448 | 16.8% |
| 35 to 39 Minutes | 58 | 2.2% |
| 40 to 44 Minutes | 42 | 1.6% |
| 45 to 59 Minutes | 103 | 3.9% |
| 60 to 89 Minutes | 110 | 4.1% |
| 90 or more Minutes | 21 | 0.8% |
Commute Time by Sex in Pigeon Forge
The most common commute times in Pigeon Forge are 30 to 34 minutes (359 commuters, 24.2%) for males and 5 to 9 minutes (347 commuters, 29.3%) for females.
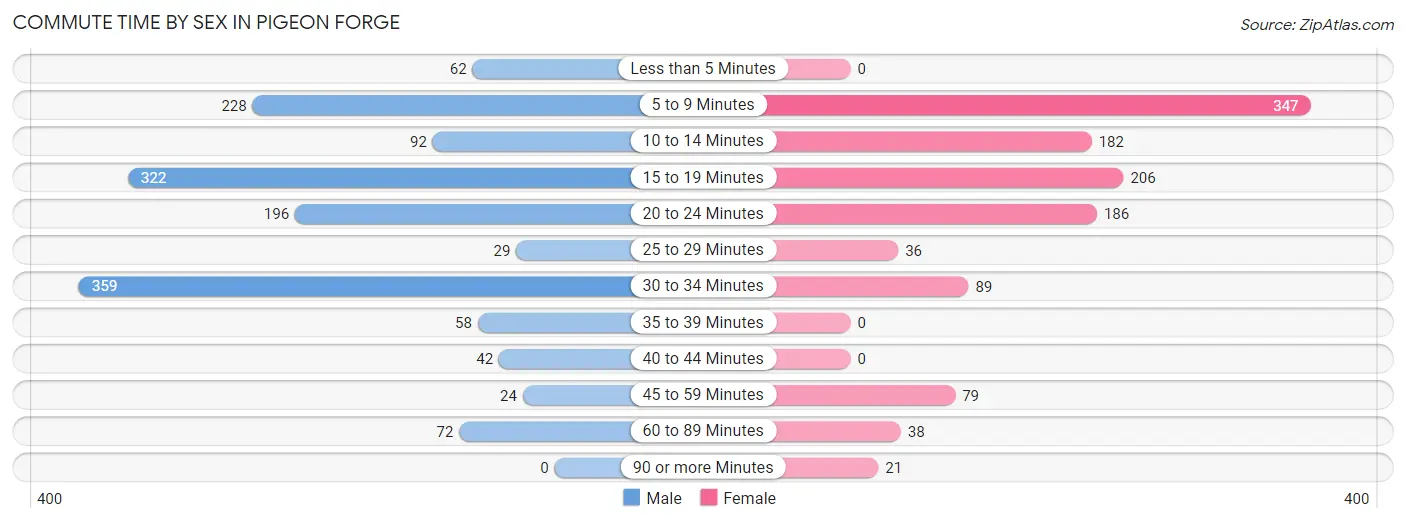
| Commute Time | Male | Female |
| Less than 5 Minutes | 62 (4.2%) | 0 (0.0%) |
| 5 to 9 Minutes | 228 (15.4%) | 347 (29.3%) |
| 10 to 14 Minutes | 92 (6.2%) | 182 (15.4%) |
| 15 to 19 Minutes | 322 (21.7%) | 206 (17.4%) |
| 20 to 24 Minutes | 196 (13.2%) | 186 (15.7%) |
| 25 to 29 Minutes | 29 (1.9%) | 36 (3.0%) |
| 30 to 34 Minutes | 359 (24.2%) | 89 (7.5%) |
| 35 to 39 Minutes | 58 (3.9%) | 0 (0.0%) |
| 40 to 44 Minutes | 42 (2.8%) | 0 (0.0%) |
| 45 to 59 Minutes | 24 (1.6%) | 79 (6.7%) |
| 60 to 89 Minutes | 72 (4.9%) | 38 (3.2%) |
| 90 or more Minutes | 0 (0.0%) | 21 (1.8%) |
Time of Departure to Work by Sex in Pigeon Forge
The most frequent times of departure to work in Pigeon Forge are 12:00 PM to 3:59 PM (314, 21.2%) for males and 4:00 PM to 11:59 PM (244, 20.6%) for females.
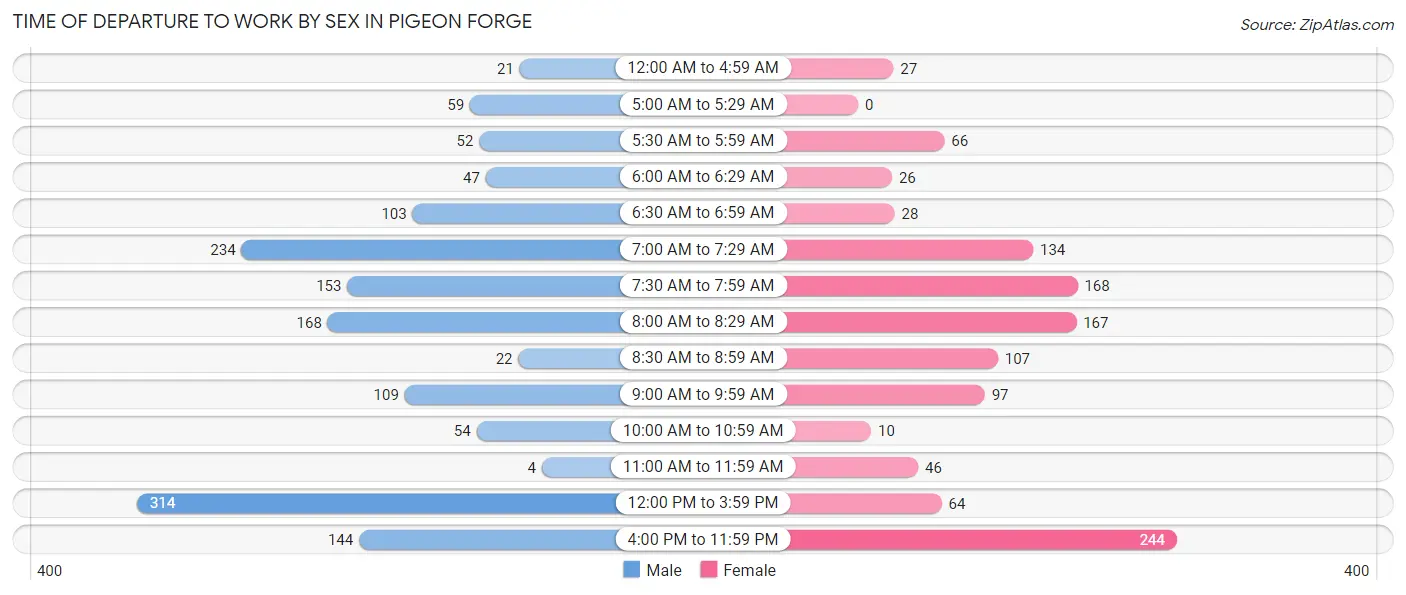
| Time of Departure | Male | Female |
| 12:00 AM to 4:59 AM | 21 (1.4%) | 27 (2.3%) |
| 5:00 AM to 5:29 AM | 59 (4.0%) | 0 (0.0%) |
| 5:30 AM to 5:59 AM | 52 (3.5%) | 66 (5.6%) |
| 6:00 AM to 6:29 AM | 47 (3.2%) | 26 (2.2%) |
| 6:30 AM to 6:59 AM | 103 (6.9%) | 28 (2.4%) |
| 7:00 AM to 7:29 AM | 234 (15.8%) | 134 (11.3%) |
| 7:30 AM to 7:59 AM | 153 (10.3%) | 168 (14.2%) |
| 8:00 AM to 8:29 AM | 168 (11.3%) | 167 (14.1%) |
| 8:30 AM to 8:59 AM | 22 (1.5%) | 107 (9.0%) |
| 9:00 AM to 9:59 AM | 109 (7.3%) | 97 (8.2%) |
| 10:00 AM to 10:59 AM | 54 (3.6%) | 10 (0.8%) |
| 11:00 AM to 11:59 AM | 4 (0.3%) | 46 (3.9%) |
| 12:00 PM to 3:59 PM | 314 (21.2%) | 64 (5.4%) |
| 4:00 PM to 11:59 PM | 144 (9.7%) | 244 (20.6%) |
| Total | 1,484 (100.0%) | 1,184 (100.0%) |
Housing Occupancy in Pigeon Forge
Occupancy by Ownership in Pigeon Forge
Of the total 2,277 dwellings in Pigeon Forge, owner-occupied units account for 1,097 (48.2%), while renter-occupied units make up 1,180 (51.8%).
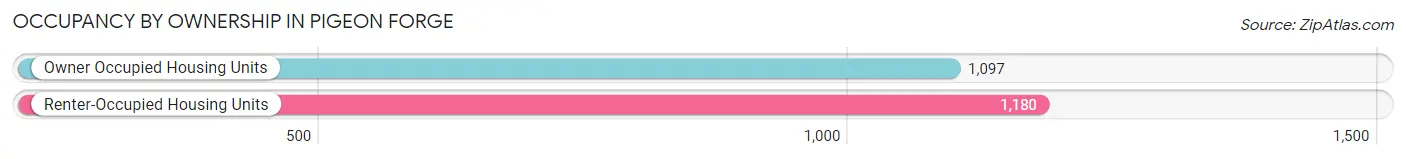
| Occupancy | # Housing Units | % Housing Units |
| Owner Occupied Housing Units | 1,097 | 48.2% |
| Renter-Occupied Housing Units | 1,180 | 51.8% |
| Total Occupied Housing Units | 2,277 | 100.0% |
Occupancy by Household Size in Pigeon Forge
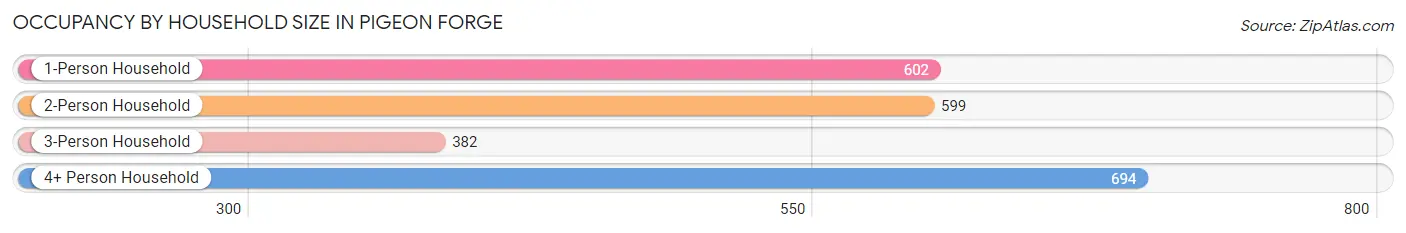
| Household Size | # Housing Units | % Housing Units |
| 1-Person Household | 602 | 26.4% |
| 2-Person Household | 599 | 26.3% |
| 3-Person Household | 382 | 16.8% |
| 4+ Person Household | 694 | 30.5% |
| Total Housing Units | 2,277 | 100.0% |
Occupancy by Ownership by Household Size in Pigeon Forge
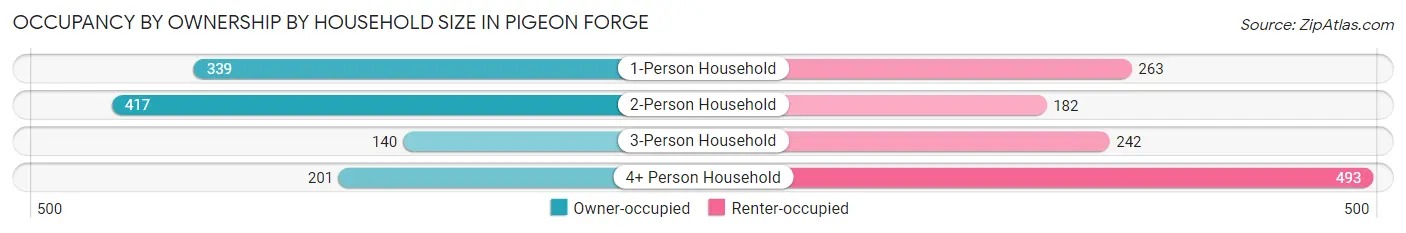
| Household Size | Owner-occupied | Renter-occupied |
| 1-Person Household | 339 (56.3%) | 263 (43.7%) |
| 2-Person Household | 417 (69.6%) | 182 (30.4%) |
| 3-Person Household | 140 (36.6%) | 242 (63.3%) |
| 4+ Person Household | 201 (29.0%) | 493 (71.0%) |
| Total Housing Units | 1,097 (48.2%) | 1,180 (51.8%) |
Occupancy by Educational Attainment in Pigeon Forge
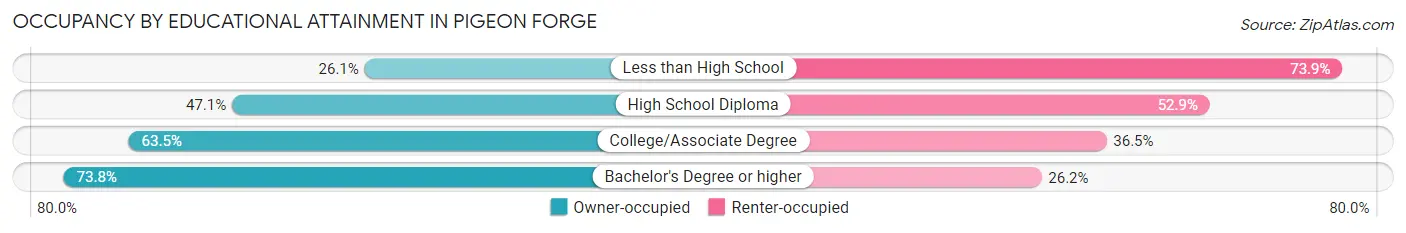
| Household Size | Owner-occupied | Renter-occupied |
| Less than High School | 170 (26.1%) | 482 (73.9%) |
| High School Diploma | 381 (47.1%) | 428 (52.9%) |
| College/Associate Degree | 346 (63.5%) | 199 (36.5%) |
| Bachelor's Degree or higher | 200 (73.8%) | 71 (26.2%) |
Occupancy by Age of Householder in Pigeon Forge
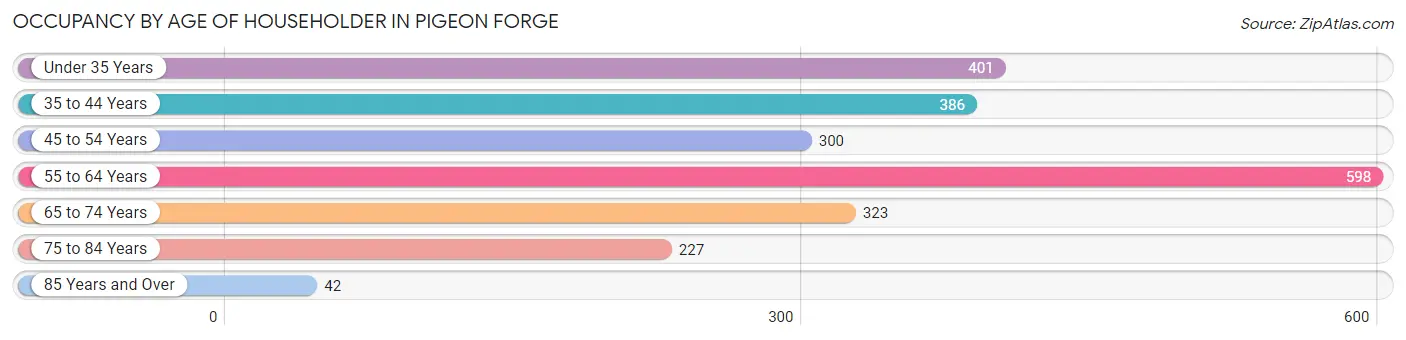
| Age Bracket | # Households | % Households |
| Under 35 Years | 401 | 17.6% |
| 35 to 44 Years | 386 | 17.0% |
| 45 to 54 Years | 300 | 13.2% |
| 55 to 64 Years | 598 | 26.3% |
| 65 to 74 Years | 323 | 14.2% |
| 75 to 84 Years | 227 | 10.0% |
| 85 Years and Over | 42 | 1.8% |
| Total | 2,277 | 100.0% |
Housing Finances in Pigeon Forge
Median Income by Occupancy in Pigeon Forge
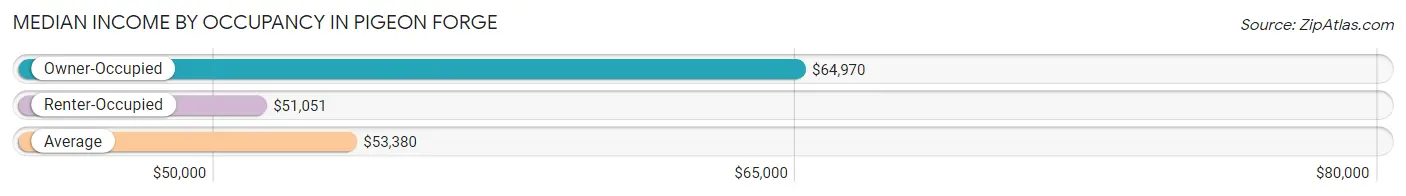
| Occupancy Type | # Households | Median Income |
| Owner-Occupied | 1,097 (48.2%) | $64,970 |
| Renter-Occupied | 1,180 (51.8%) | $51,051 |
| Average | 2,277 (100.0%) | $53,380 |
Occupancy by Householder Income Bracket in Pigeon Forge
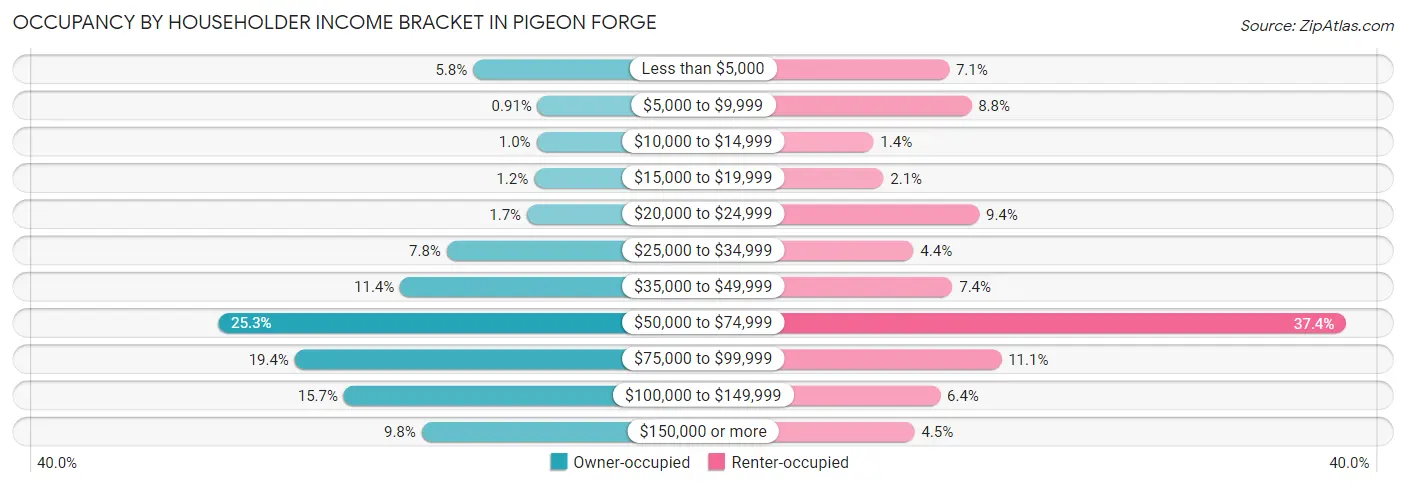
| Income Bracket | Owner-occupied | Renter-occupied |
| Less than $5,000 | 64 (5.8%) | 84 (7.1%) |
| $5,000 to $9,999 | 10 (0.9%) | 104 (8.8%) |
| $10,000 to $14,999 | 11 (1.0%) | 16 (1.4%) |
| $15,000 to $19,999 | 13 (1.2%) | 25 (2.1%) |
| $20,000 to $24,999 | 19 (1.7%) | 111 (9.4%) |
| $25,000 to $34,999 | 86 (7.8%) | 52 (4.4%) |
| $35,000 to $49,999 | 125 (11.4%) | 87 (7.4%) |
| $50,000 to $74,999 | 277 (25.3%) | 441 (37.4%) |
| $75,000 to $99,999 | 213 (19.4%) | 131 (11.1%) |
| $100,000 to $149,999 | 172 (15.7%) | 76 (6.4%) |
| $150,000 or more | 107 (9.8%) | 53 (4.5%) |
| Total | 1,097 (100.0%) | 1,180 (100.0%) |
Monthly Housing Cost Tiers in Pigeon Forge
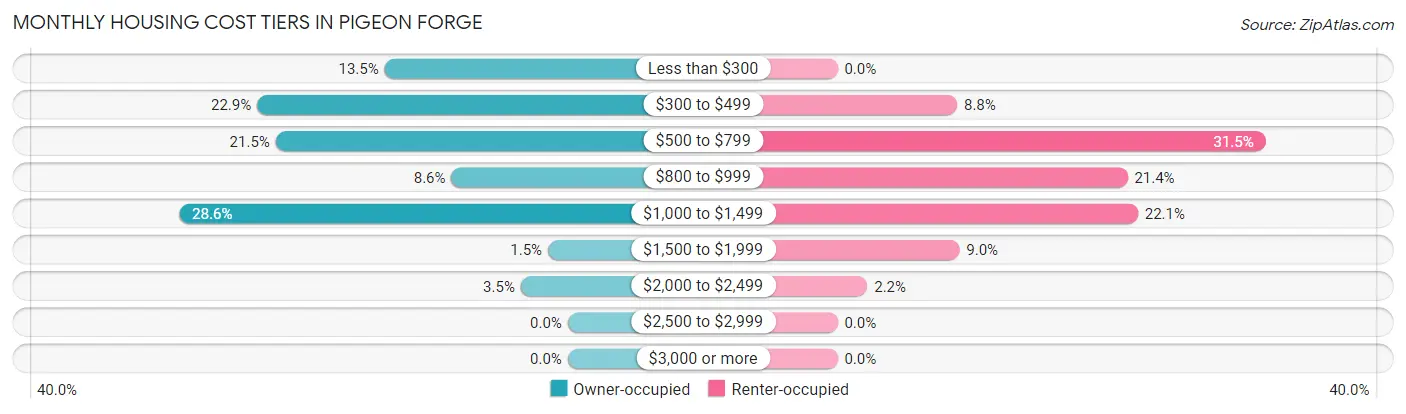
| Monthly Cost | Owner-occupied | Renter-occupied |
| Less than $300 | 148 (13.5%) | 0 (0.0%) |
| $300 to $499 | 251 (22.9%) | 104 (8.8%) |
| $500 to $799 | 236 (21.5%) | 372 (31.5%) |
| $800 to $999 | 94 (8.6%) | 252 (21.4%) |
| $1,000 to $1,499 | 314 (28.6%) | 261 (22.1%) |
| $1,500 to $1,999 | 16 (1.5%) | 106 (9.0%) |
| $2,000 to $2,499 | 38 (3.5%) | 26 (2.2%) |
| $2,500 to $2,999 | 0 (0.0%) | 0 (0.0%) |
| $3,000 or more | 0 (0.0%) | 0 (0.0%) |
| Total | 1,097 (100.0%) | 1,180 (100.0%) |
Physical Housing Characteristics in Pigeon Forge
Housing Structures in Pigeon Forge
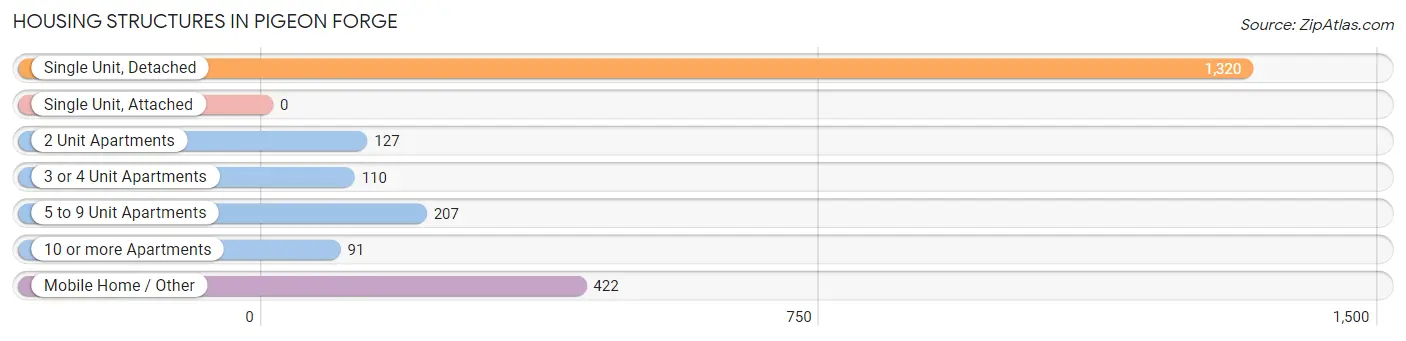
| Structure Type | # Housing Units | % Housing Units |
| Single Unit, Detached | 1,320 | 58.0% |
| Single Unit, Attached | 0 | 0.0% |
| 2 Unit Apartments | 127 | 5.6% |
| 3 or 4 Unit Apartments | 110 | 4.8% |
| 5 to 9 Unit Apartments | 207 | 9.1% |
| 10 or more Apartments | 91 | 4.0% |
| Mobile Home / Other | 422 | 18.5% |
| Total | 2,277 | 100.0% |
Housing Structures by Occupancy in Pigeon Forge
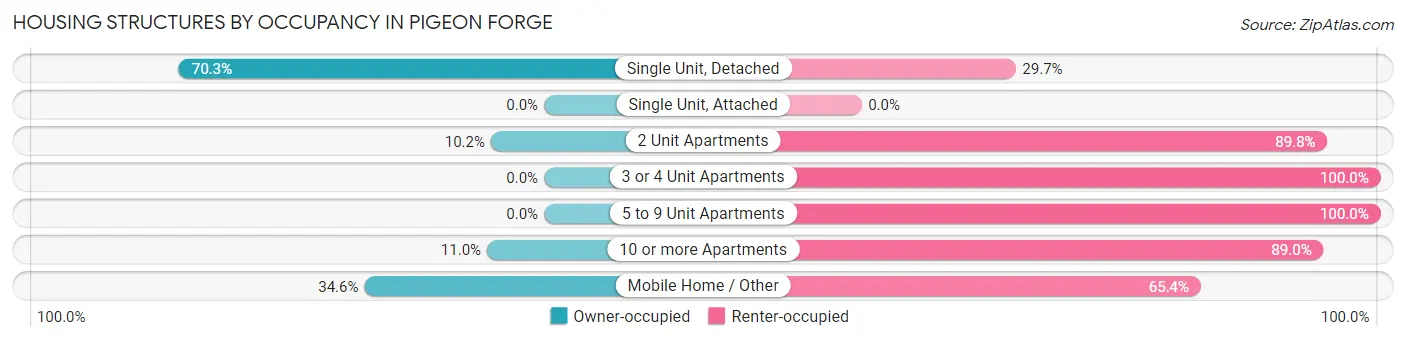
| Structure Type | Owner-occupied | Renter-occupied |
| Single Unit, Detached | 928 (70.3%) | 392 (29.7%) |
| Single Unit, Attached | 0 (0.0%) | 0 (0.0%) |
| 2 Unit Apartments | 13 (10.2%) | 114 (89.8%) |
| 3 or 4 Unit Apartments | 0 (0.0%) | 110 (100.0%) |
| 5 to 9 Unit Apartments | 0 (0.0%) | 207 (100.0%) |
| 10 or more Apartments | 10 (11.0%) | 81 (89.0%) |
| Mobile Home / Other | 146 (34.6%) | 276 (65.4%) |
| Total | 1,097 (48.2%) | 1,180 (51.8%) |
Housing Structures by Number of Rooms in Pigeon Forge
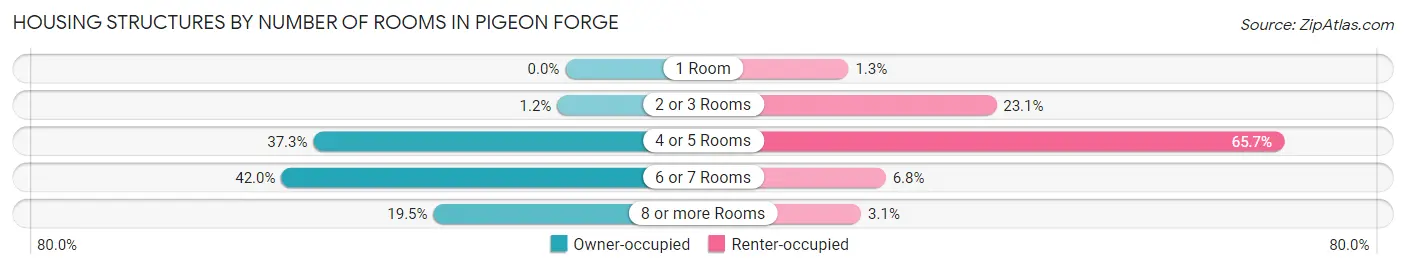
| Number of Rooms | Owner-occupied | Renter-occupied |
| 1 Room | 0 (0.0%) | 15 (1.3%) |
| 2 or 3 Rooms | 13 (1.2%) | 273 (23.1%) |
| 4 or 5 Rooms | 409 (37.3%) | 775 (65.7%) |
| 6 or 7 Rooms | 461 (42.0%) | 80 (6.8%) |
| 8 or more Rooms | 214 (19.5%) | 37 (3.1%) |
| Total | 1,097 (100.0%) | 1,180 (100.0%) |
Housing Structure by Heating Type in Pigeon Forge
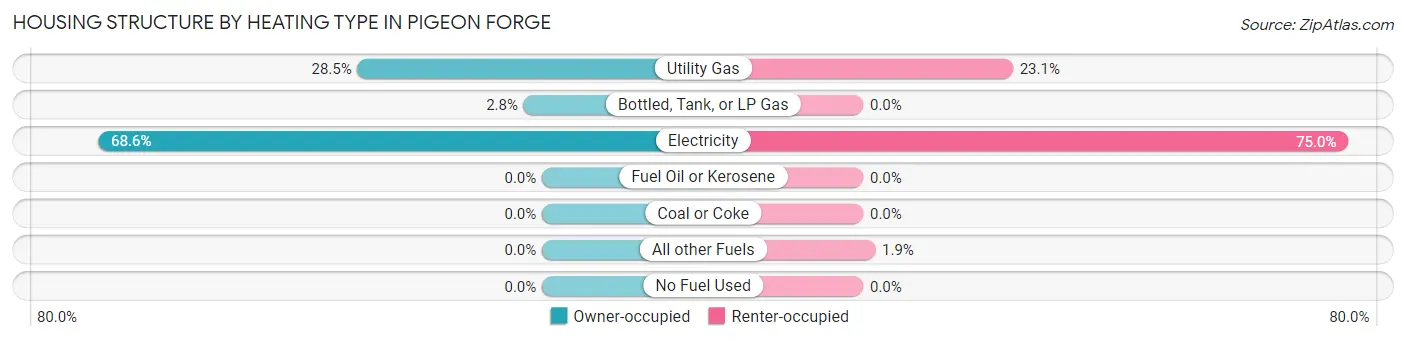
| Heating Type | Owner-occupied | Renter-occupied |
| Utility Gas | 313 (28.5%) | 273 (23.1%) |
| Bottled, Tank, or LP Gas | 31 (2.8%) | 0 (0.0%) |
| Electricity | 753 (68.6%) | 885 (75.0%) |
| Fuel Oil or Kerosene | 0 (0.0%) | 0 (0.0%) |
| Coal or Coke | 0 (0.0%) | 0 (0.0%) |
| All other Fuels | 0 (0.0%) | 22 (1.9%) |
| No Fuel Used | 0 (0.0%) | 0 (0.0%) |
| Total | 1,097 (100.0%) | 1,180 (100.0%) |
Household Vehicle Usage in Pigeon Forge
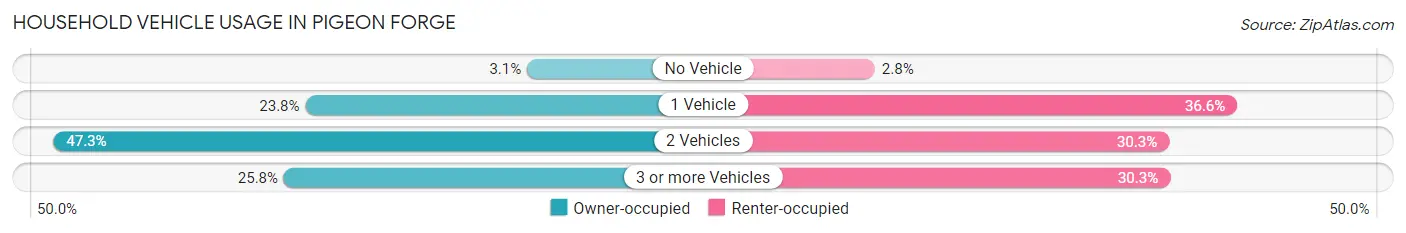
| Vehicles per Household | Owner-occupied | Renter-occupied |
| No Vehicle | 34 (3.1%) | 33 (2.8%) |
| 1 Vehicle | 261 (23.8%) | 432 (36.6%) |
| 2 Vehicles | 519 (47.3%) | 357 (30.2%) |
| 3 or more Vehicles | 283 (25.8%) | 358 (30.3%) |
| Total | 1,097 (100.0%) | 1,180 (100.0%) |
Real Estate & Mortgages in Pigeon Forge
Real Estate and Mortgage Overview in Pigeon Forge
| Characteristic | Without Mortgage | With Mortgage |
| Housing Units | 602 | 495 |
| Median Property Value | $216,800 | $258,900 |
| Median Household Income | $64,643 | $14 |
| Monthly Housing Costs | $401 | $0 |
| Real Estate Taxes | $783 | $0 |
Property Value by Mortgage Status in Pigeon Forge
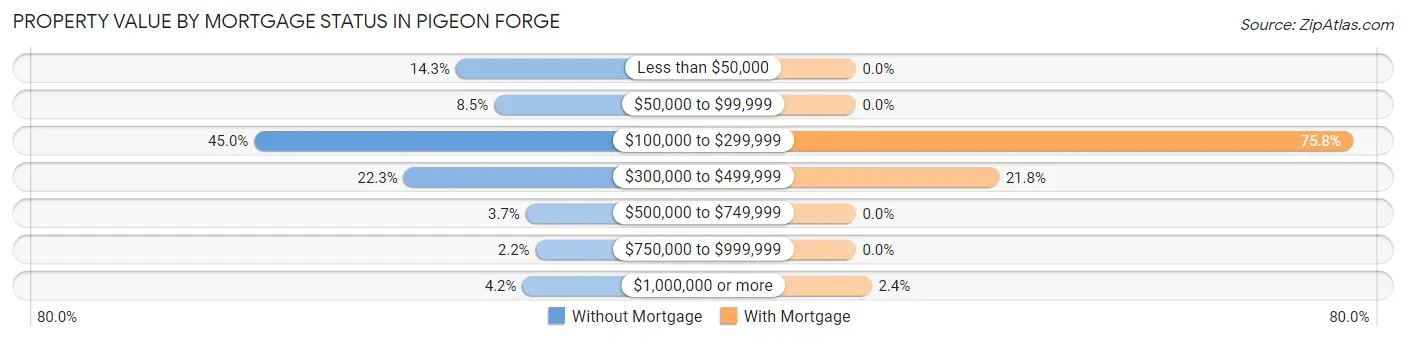
| Property Value | Without Mortgage | With Mortgage |
| Less than $50,000 | 86 (14.3%) | 0 (0.0%) |
| $50,000 to $99,999 | 51 (8.5%) | 0 (0.0%) |
| $100,000 to $299,999 | 271 (45.0%) | 375 (75.8%) |
| $300,000 to $499,999 | 134 (22.3%) | 108 (21.8%) |
| $500,000 to $749,999 | 22 (3.6%) | 0 (0.0%) |
| $750,000 to $999,999 | 13 (2.2%) | 0 (0.0%) |
| $1,000,000 or more | 25 (4.2%) | 12 (2.4%) |
| Total | 602 (100.0%) | 495 (100.0%) |
Household Income by Mortgage Status in Pigeon Forge
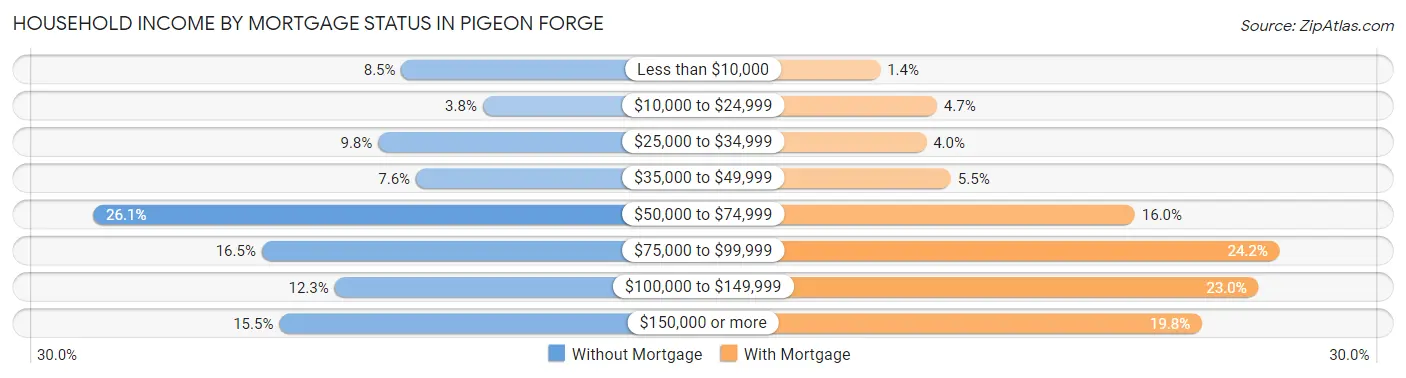
| Household Income | Without Mortgage | With Mortgage |
| Less than $10,000 | 51 (8.5%) | 7 (1.4%) |
| $10,000 to $24,999 | 23 (3.8%) | 23 (4.6%) |
| $25,000 to $34,999 | 59 (9.8%) | 20 (4.0%) |
| $35,000 to $49,999 | 46 (7.6%) | 27 (5.4%) |
| $50,000 to $74,999 | 157 (26.1%) | 79 (16.0%) |
| $75,000 to $99,999 | 99 (16.5%) | 120 (24.2%) |
| $100,000 to $149,999 | 74 (12.3%) | 114 (23.0%) |
| $150,000 or more | 93 (15.4%) | 98 (19.8%) |
| Total | 602 (100.0%) | 495 (100.0%) |
Property Value to Household Income Ratio in Pigeon Forge
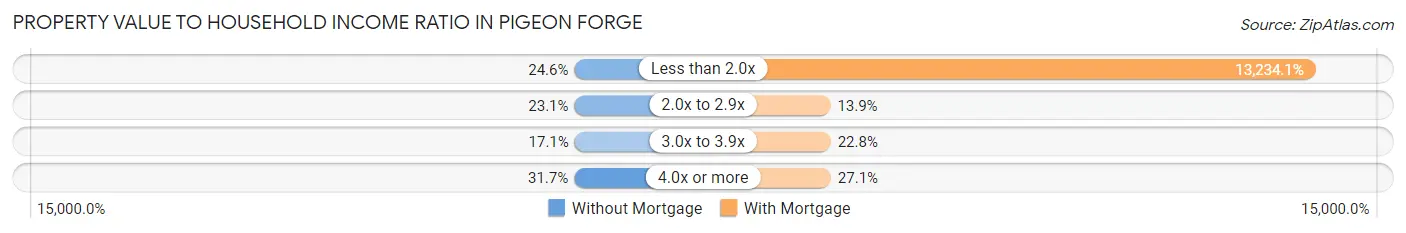
| Value-to-Income Ratio | Without Mortgage | With Mortgage |
| Less than 2.0x | 148 (24.6%) | 65,509 (13,234.1%) |
| 2.0x to 2.9x | 139 (23.1%) | 69 (13.9%) |
| 3.0x to 3.9x | 103 (17.1%) | 113 (22.8%) |
| 4.0x or more | 191 (31.7%) | 134 (27.1%) |
| Total | 602 (100.0%) | 495 (100.0%) |
Real Estate Taxes by Mortgage Status in Pigeon Forge
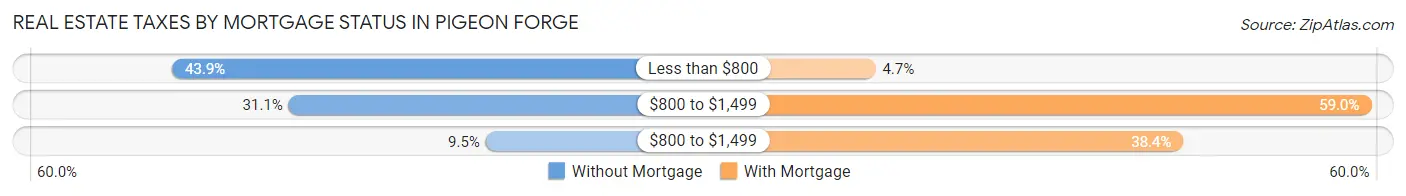
| Property Taxes | Without Mortgage | With Mortgage |
| Less than $800 | 264 (43.9%) | 23 (4.6%) |
| $800 to $1,499 | 187 (31.1%) | 292 (59.0%) |
| $800 to $1,499 | 57 (9.5%) | 190 (38.4%) |
| Total | 602 (100.0%) | 495 (100.0%) |
Health & Disability in Pigeon Forge
Health Insurance Coverage by Age in Pigeon Forge
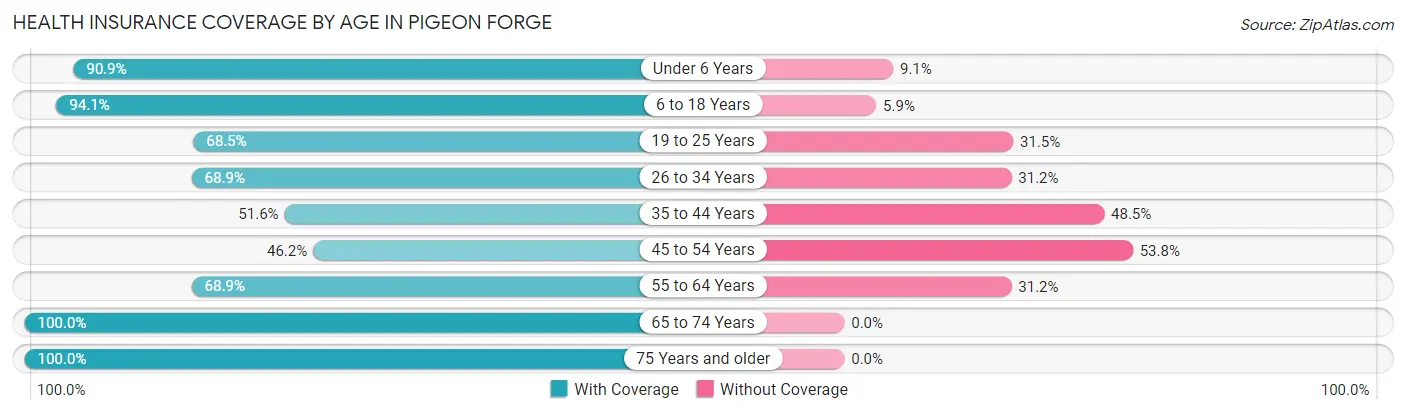
| Age Bracket | With Coverage | Without Coverage |
| Under 6 Years | 460 (90.9%) | 46 (9.1%) |
| 6 to 18 Years | 1,187 (94.1%) | 75 (5.9%) |
| 19 to 25 Years | 283 (68.5%) | 130 (31.5%) |
| 26 to 34 Years | 462 (68.9%) | 209 (31.1%) |
| 35 to 44 Years | 365 (51.5%) | 343 (48.4%) |
| 45 to 54 Years | 299 (46.2%) | 348 (53.8%) |
| 55 to 64 Years | 652 (68.9%) | 295 (31.1%) |
| 65 to 74 Years | 638 (100.0%) | 0 (0.0%) |
| 75 Years and older | 441 (100.0%) | 0 (0.0%) |
| Total | 4,787 (76.8%) | 1,446 (23.2%) |
Health Insurance Coverage by Citizenship Status in Pigeon Forge
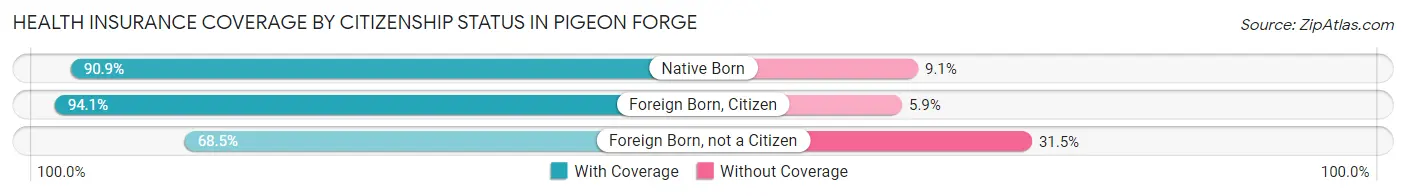
| Citizenship Status | With Coverage | Without Coverage |
| Native Born | 460 (90.9%) | 46 (9.1%) |
| Foreign Born, Citizen | 1,187 (94.1%) | 75 (5.9%) |
| Foreign Born, not a Citizen | 283 (68.5%) | 130 (31.5%) |
Health Insurance Coverage by Household Income in Pigeon Forge
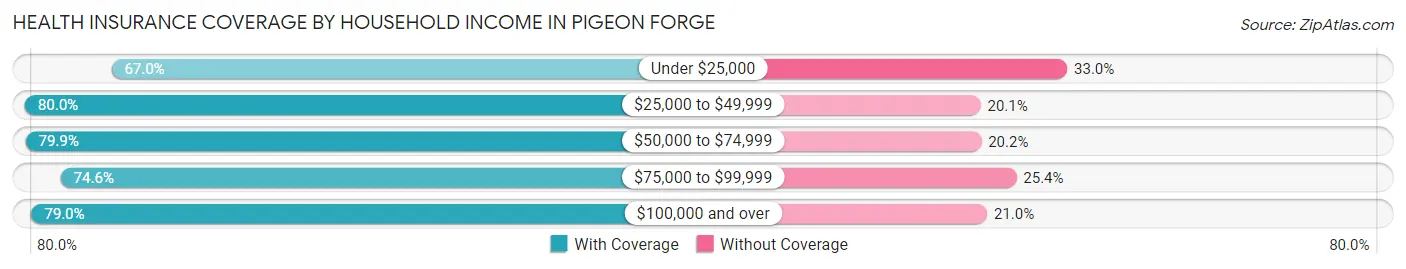
| Household Income | With Coverage | Without Coverage |
| Under $25,000 | 578 (67.0%) | 285 (33.0%) |
| $25,000 to $49,999 | 634 (79.9%) | 159 (20.1%) |
| $50,000 to $74,999 | 1,561 (79.8%) | 394 (20.2%) |
| $75,000 to $99,999 | 966 (74.6%) | 329 (25.4%) |
| $100,000 and over | 1,048 (79.0%) | 279 (21.0%) |
Public vs Private Health Insurance Coverage by Age in Pigeon Forge
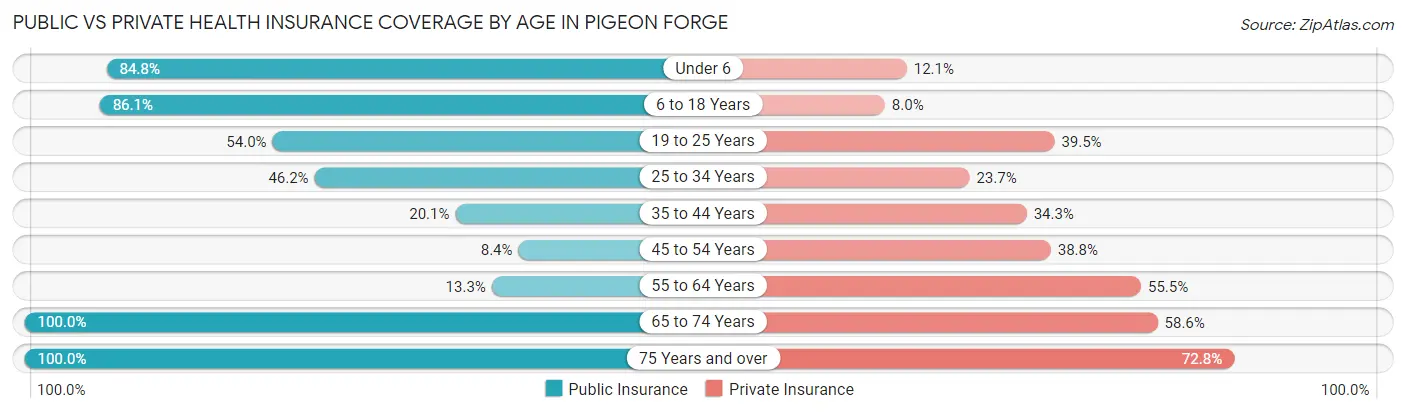
| Age Bracket | Public Insurance | Private Insurance |
| Under 6 | 429 (84.8%) | 61 (12.1%) |
| 6 to 18 Years | 1,086 (86.1%) | 101 (8.0%) |
| 19 to 25 Years | 223 (54.0%) | 163 (39.5%) |
| 25 to 34 Years | 310 (46.2%) | 159 (23.7%) |
| 35 to 44 Years | 142 (20.1%) | 243 (34.3%) |
| 45 to 54 Years | 54 (8.4%) | 251 (38.8%) |
| 55 to 64 Years | 126 (13.3%) | 526 (55.5%) |
| 65 to 74 Years | 638 (100.0%) | 374 (58.6%) |
| 75 Years and over | 441 (100.0%) | 321 (72.8%) |
| Total | 3,449 (55.3%) | 2,199 (35.3%) |
Disability Status by Sex by Age in Pigeon Forge
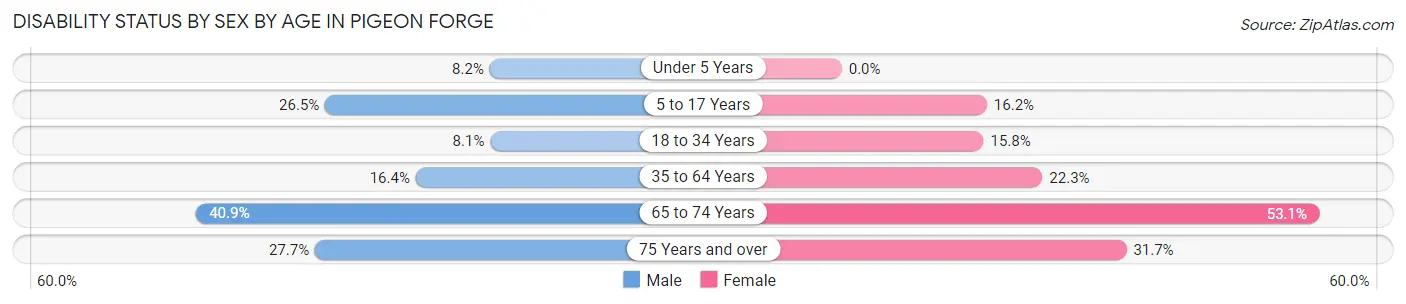
| Age Bracket | Male | Female |
| Under 5 Years | 15 (8.2%) | 0 (0.0%) |
| 5 to 17 Years | 243 (26.5%) | 79 (16.2%) |
| 18 to 34 Years | 48 (8.1%) | 90 (15.8%) |
| 35 to 64 Years | 196 (16.4%) | 248 (22.3%) |
| 65 to 74 Years | 130 (40.9%) | 170 (53.1%) |
| 75 Years and over | 60 (27.7%) | 71 (31.7%) |
Disability Class by Sex by Age in Pigeon Forge
Disability Class: Hearing Difficulty
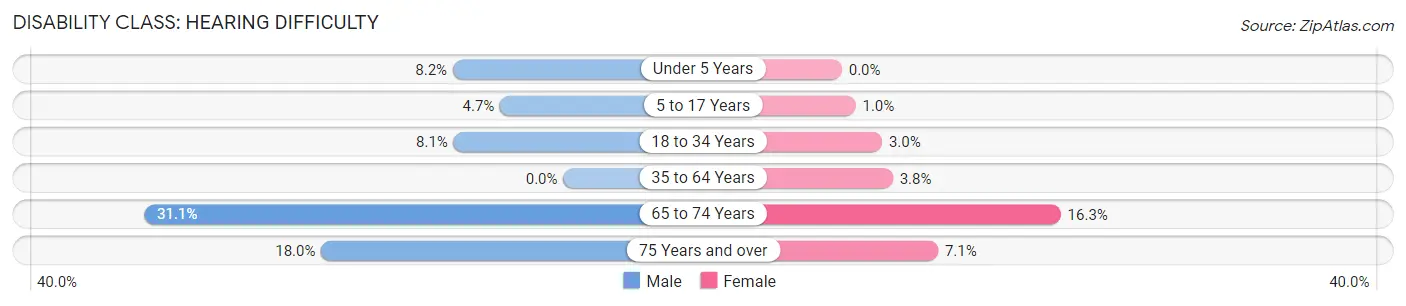
| Age Bracket | Male | Female |
| Under 5 Years | 15 (8.2%) | 0 (0.0%) |
| 5 to 17 Years | 43 (4.7%) | 5 (1.0%) |
| 18 to 34 Years | 48 (8.1%) | 17 (3.0%) |
| 35 to 64 Years | 0 (0.0%) | 42 (3.8%) |
| 65 to 74 Years | 99 (31.1%) | 52 (16.3%) |
| 75 Years and over | 39 (18.0%) | 16 (7.1%) |
Disability Class: Vision Difficulty
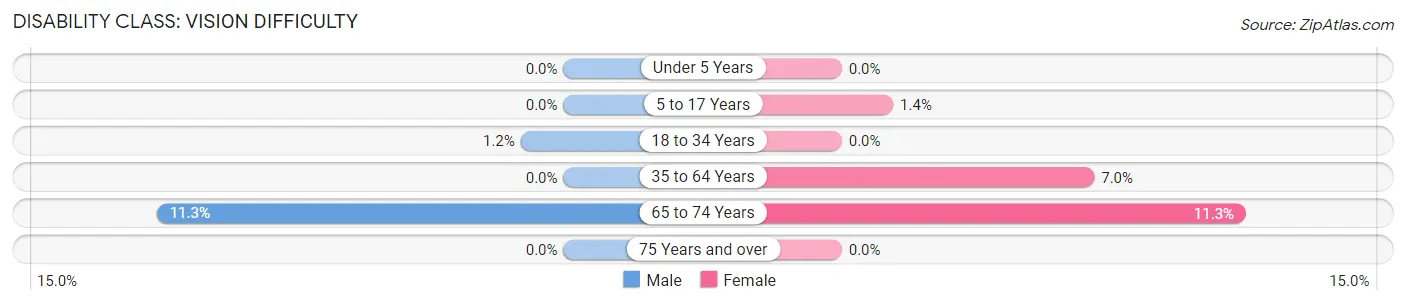
| Age Bracket | Male | Female |
| Under 5 Years | 0 (0.0%) | 0 (0.0%) |
| 5 to 17 Years | 0 (0.0%) | 7 (1.4%) |
| 18 to 34 Years | 7 (1.2%) | 0 (0.0%) |
| 35 to 64 Years | 0 (0.0%) | 78 (7.0%) |
| 65 to 74 Years | 36 (11.3%) | 36 (11.3%) |
| 75 Years and over | 0 (0.0%) | 0 (0.0%) |
Disability Class: Cognitive Difficulty
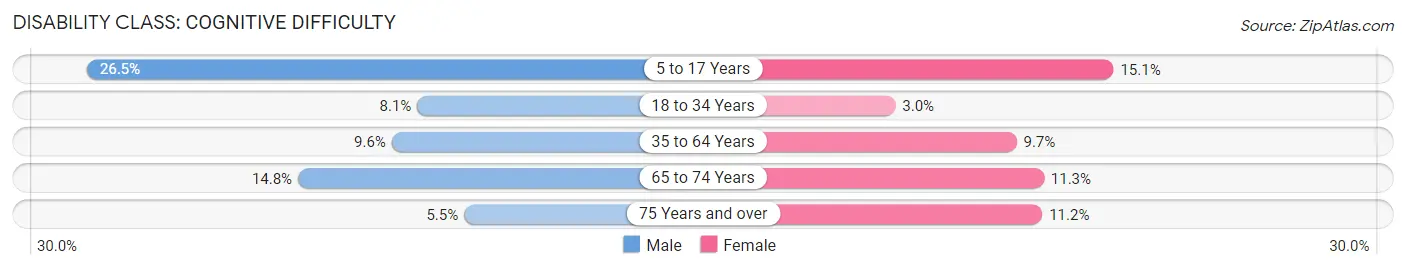
| Age Bracket | Male | Female |
| 5 to 17 Years | 243 (26.5%) | 74 (15.1%) |
| 18 to 34 Years | 48 (8.1%) | 17 (3.0%) |
| 35 to 64 Years | 114 (9.6%) | 108 (9.7%) |
| 65 to 74 Years | 47 (14.8%) | 36 (11.3%) |
| 75 Years and over | 12 (5.5%) | 25 (11.2%) |
Disability Class: Ambulatory Difficulty
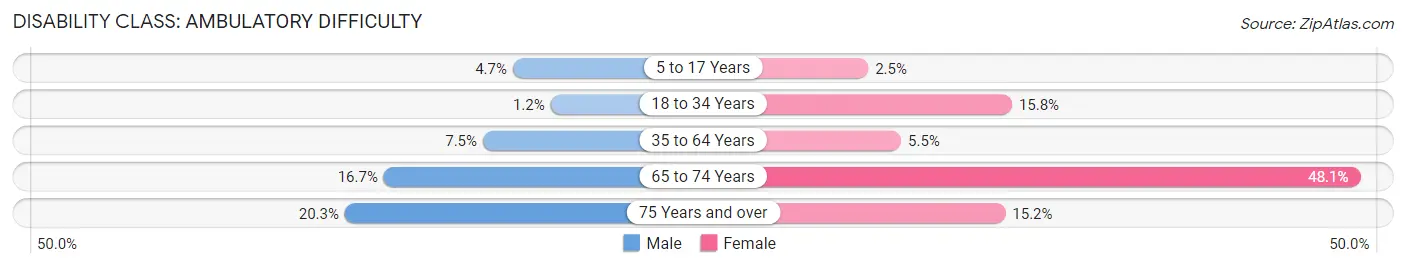
| Age Bracket | Male | Female |
| 5 to 17 Years | 43 (4.7%) | 12 (2.5%) |
| 18 to 34 Years | 7 (1.2%) | 90 (15.8%) |
| 35 to 64 Years | 89 (7.5%) | 61 (5.5%) |
| 65 to 74 Years | 53 (16.7%) | 154 (48.1%) |
| 75 Years and over | 44 (20.3%) | 34 (15.2%) |
Disability Class: Self-Care Difficulty
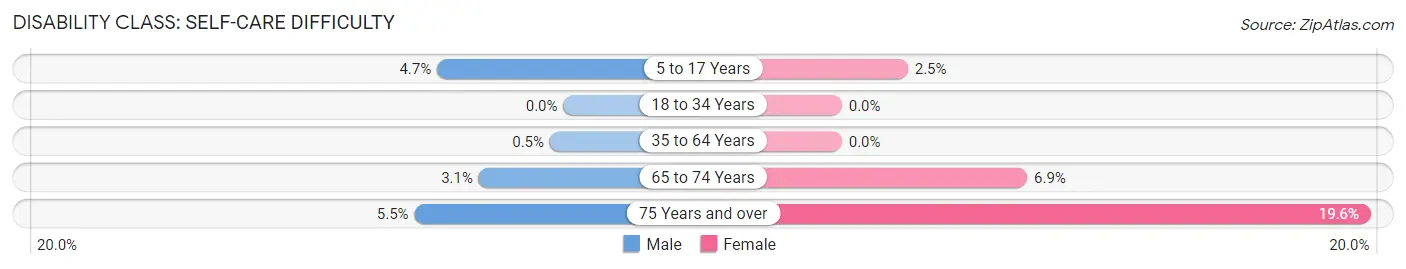
| Age Bracket | Male | Female |
| 5 to 17 Years | 43 (4.7%) | 12 (2.5%) |
| 18 to 34 Years | 0 (0.0%) | 0 (0.0%) |
| 35 to 64 Years | 6 (0.5%) | 0 (0.0%) |
| 65 to 74 Years | 10 (3.1%) | 22 (6.9%) |
| 75 Years and over | 12 (5.5%) | 44 (19.6%) |
Technology Access in Pigeon Forge
Computing Device Access in Pigeon Forge
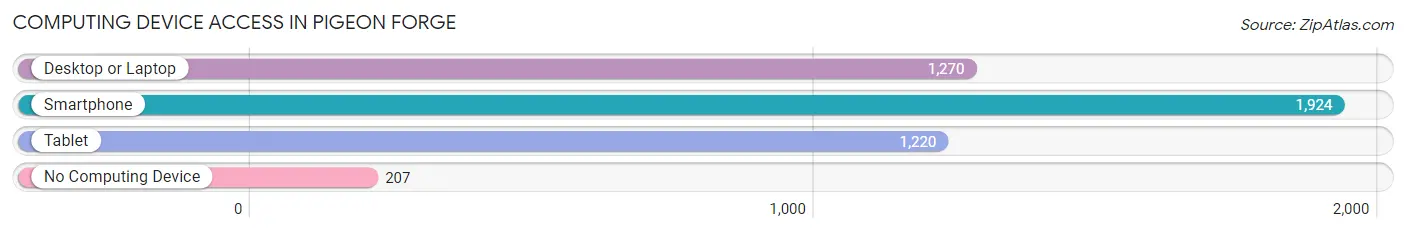
| Device Type | # Households | % Households |
| Desktop or Laptop | 1,270 | 55.8% |
| Smartphone | 1,924 | 84.5% |
| Tablet | 1,220 | 53.6% |
| No Computing Device | 207 | 9.1% |
| Total | 2,277 | 100.0% |
Internet Access in Pigeon Forge
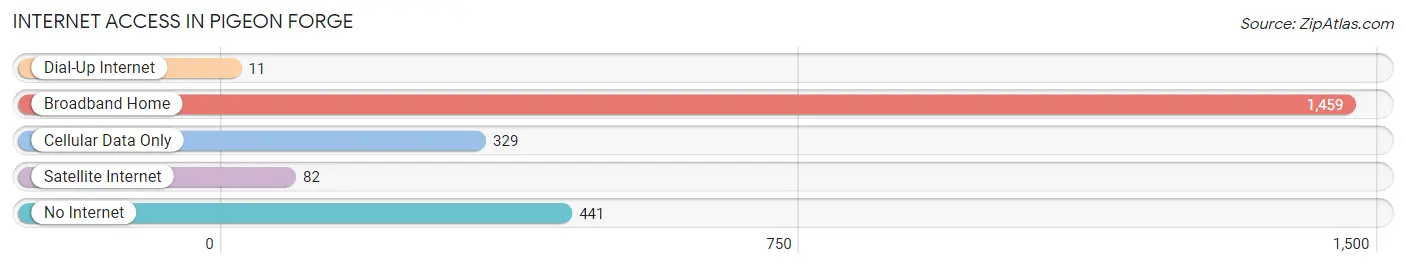
| Internet Type | # Households | % Households |
| Dial-Up Internet | 11 | 0.5% |
| Broadband Home | 1,459 | 64.1% |
| Cellular Data Only | 329 | 14.4% |
| Satellite Internet | 82 | 3.6% |
| No Internet | 441 | 19.4% |
| Total | 2,277 | 100.0% |
Pigeon Forge Summary
Pigeon Forge, Tennessee is a small mountain town located in the foothills of the Great Smoky Mountains. It is situated in Sevier County, Tennessee, and is part of the Knoxville metropolitan area. The town is known for its many attractions, including Dollywood, the Great Smoky Mountains National Park, and the Titanic Museum. Pigeon Forge is a popular tourist destination, and its economy is largely based on tourism.
History
The area that is now Pigeon Forge was first settled in the late 1700s by Isaac Love, who established a small iron forge on the banks of the Little Pigeon River. The forge was used to produce tools and weapons for the settlers of the area. The town was originally known as "Forks of the River," but the name was changed to Pigeon Forge in 1856.
The town grew slowly until the 1940s, when the Great Smoky Mountains National Park was established nearby. This brought an influx of tourists to the area, and Pigeon Forge began to develop as a tourist destination. In 1961, the Dollywood theme park was opened, and the town's economy began to shift towards tourism.
Geography
Pigeon Forge is located in the foothills of the Great Smoky Mountains, in Sevier County, Tennessee. The town is situated along the Little Pigeon River, and is surrounded by the Great Smoky Mountains National Park. The town is located at an elevation of 1,000 feet above sea level.
The climate of Pigeon Forge is humid subtropical, with hot summers and mild winters. The average annual temperature is 57°F, and the average annual precipitation is 48 inches.
Economy
Pigeon Forge's economy is largely based on tourism. The town is home to several popular attractions, including Dollywood, the Great Smoky Mountains National Park, and the Titanic Museum. The town also has several hotels, restaurants, and shops catering to tourists.
In addition to tourism, Pigeon Forge is home to several manufacturing companies, including a paper mill and a furniture factory. The town also has a growing technology sector, with several software companies located in the area.
Demographics
As of the 2010 census, Pigeon Forge had a population of 5,875. The racial makeup of the town was 95.3% White, 1.2% African American, 0.3% Native American, 0.7% Asian, 0.1% Pacific Islander, 0.7% from other races, and 1.7% from two or more races. Hispanic or Latino of any race were 2.2% of the population.
The median household income in Pigeon Forge was $37,917, and the median family income was $45,938. The per capita income was $20,945. About 11.3% of families and 14.2% of the population were below the poverty line.
Common Questions
What is Per Capita Income in Pigeon Forge?
Per Capita income in Pigeon Forge is $23,481.
What is the Median Family Income in Pigeon Forge?
Median Family Income in Pigeon Forge is $56,617.
What is the Median Household income in Pigeon Forge?
Median Household Income in Pigeon Forge is $53,380.
What is Income or Wage Gap in Pigeon Forge?
Income or Wage Gap in Pigeon Forge is 34.2%.
Women in Pigeon Forge earn 65.8 cents for every dollar earned by a man.
What is Family Income Deficit in Pigeon Forge?
Family Income Deficit in Pigeon Forge is $8,876.
Families that are below poverty line in Pigeon Forge earn $8,876 less on average than the poverty threshold level.
What is Inequality or Gini Index in Pigeon Forge?
Inequality or Gini Index in Pigeon Forge is 0.40.
What is the Total Population of Pigeon Forge?
Total Population of Pigeon Forge is 6,345.
What is the Total Male Population of Pigeon Forge?
Total Male Population of Pigeon Forge is 3,463.
What is the Total Female Population of Pigeon Forge?
Total Female Population of Pigeon Forge is 2,882.
What is the Ratio of Males per 100 Females in Pigeon Forge?
There are 120.16 Males per 100 Females in Pigeon Forge.
What is the Ratio of Females per 100 Males in Pigeon Forge?
There are 83.22 Females per 100 Males in Pigeon Forge.
What is the Median Population Age in Pigeon Forge?
Median Population Age in Pigeon Forge is 38.2 Years.
What is the Average Family Size in Pigeon Forge
Average Family Size in Pigeon Forge is 3.2 People.
What is the Average Household Size in Pigeon Forge
Average Household Size in Pigeon Forge is 2.7 People.
How Large is the Labor Force in Pigeon Forge?
There are 2,926 People in the Labor Forcein in Pigeon Forge.
What is the Percentage of People in the Labor Force in Pigeon Forge?
59.6% of People are in the Labor Force in Pigeon Forge.
What is the Unemployment Rate in Pigeon Forge?
Unemployment Rate in Pigeon Forge is 1.7%.