South Fulton, TN Map & Demographics
South Fulton Map
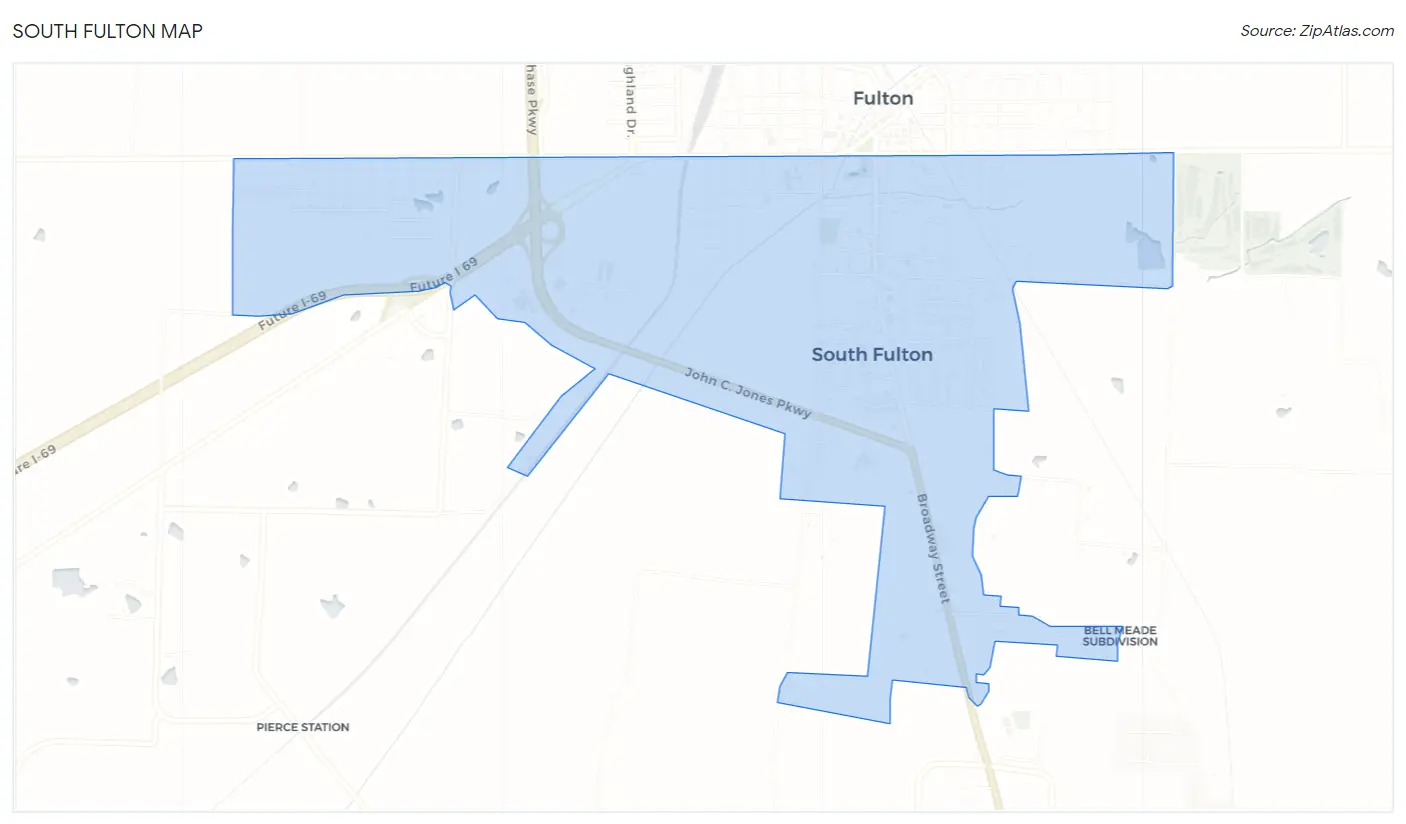
South Fulton Overview
$23,642
PER CAPITA INCOME
$58,333
AVG FAMILY INCOME
$48,646
AVG HOUSEHOLD INCOME
38.3%
WAGE / INCOME GAP [ % ]
61.7¢/ $1
WAGE / INCOME GAP [ $ ]
0.42
INEQUALITY / GINI INDEX
2,285
TOTAL POPULATION
1,037
MALE POPULATION
1,248
FEMALE POPULATION
83.09
MALES / 100 FEMALES
120.35
FEMALES / 100 MALES
38.7
MEDIAN AGE
3.2
AVG FAMILY SIZE
2.4
AVG HOUSEHOLD SIZE
1,012
LABOR FORCE [ PEOPLE ]
57.8%
PERCENT IN LABOR FORCE
4.1%
UNEMPLOYMENT RATE
South Fulton Zip Codes
South Fulton Area Codes
Income in South Fulton
Income Overview in South Fulton
Per Capita Income in South Fulton is $23,642, while median incomes of families and households are $58,333 and $48,646 respectively.
| Characteristic | Number | Measure |
| Per Capita Income | 2,285 | $23,642 |
| Median Family Income | 556 | $58,333 |
| Mean Family Income | 556 | $64,653 |
| Median Household Income | 965 | $48,646 |
| Mean Household Income | 965 | $55,757 |
| Income Deficit | 556 | $0 |
| Wage / Income Gap (%) | 2,285 | 38.28% |
| Wage / Income Gap ($) | 2,285 | 61.72¢ per $1 |
| Gini / Inequality Index | 2,285 | 0.42 |
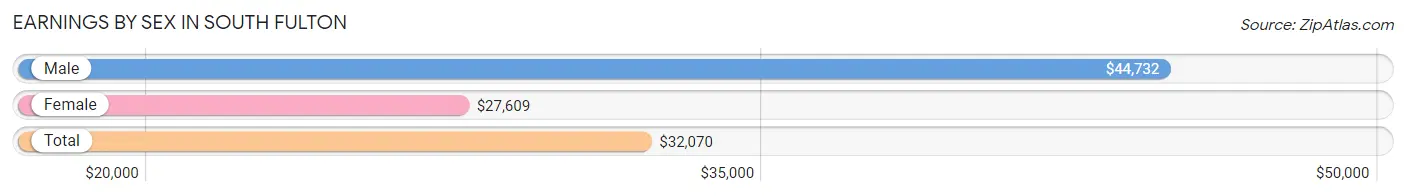
Earnings by Sex in South Fulton
Average Earnings in South Fulton are $32,070, $44,732 for men and $27,609 for women, a difference of 38.3%.
| Sex | Number | Average Earnings |
| Male | 503 (48.4%) | $44,732 |
| Female | 536 (51.6%) | $27,609 |
| Total | 1,039 (100.0%) | $32,070 |
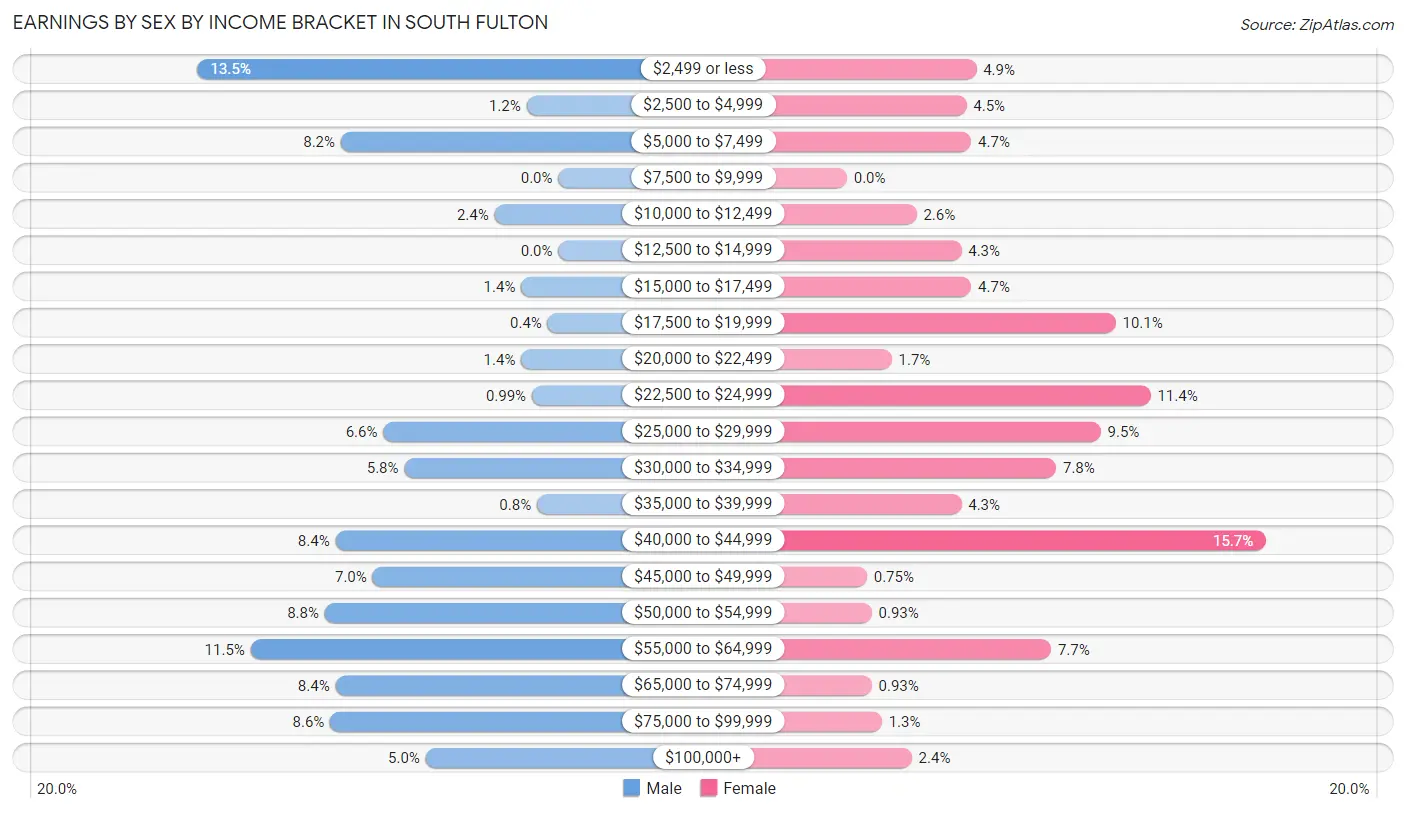
Earnings by Sex by Income Bracket in South Fulton
The most common earnings brackets in South Fulton are $2,499 or less for men (68 | 13.5%) and $40,000 to $44,999 for women (84 | 15.7%).
| Income | Male | Female |
| $2,499 or less | 68 (13.5%) | 26 (4.9%) |
| $2,500 to $4,999 | 6 (1.2%) | 24 (4.5%) |
| $5,000 to $7,499 | 41 (8.2%) | 25 (4.7%) |
| $7,500 to $9,999 | 0 (0.0%) | 0 (0.0%) |
| $10,000 to $12,499 | 12 (2.4%) | 14 (2.6%) |
| $12,500 to $14,999 | 0 (0.0%) | 23 (4.3%) |
| $15,000 to $17,499 | 7 (1.4%) | 25 (4.7%) |
| $17,500 to $19,999 | 2 (0.4%) | 54 (10.1%) |
| $20,000 to $22,499 | 7 (1.4%) | 9 (1.7%) |
| $22,500 to $24,999 | 5 (1.0%) | 61 (11.4%) |
| $25,000 to $29,999 | 33 (6.6%) | 51 (9.5%) |
| $30,000 to $34,999 | 29 (5.8%) | 42 (7.8%) |
| $35,000 to $39,999 | 4 (0.8%) | 23 (4.3%) |
| $40,000 to $44,999 | 42 (8.4%) | 84 (15.7%) |
| $45,000 to $49,999 | 35 (7.0%) | 4 (0.7%) |
| $50,000 to $54,999 | 44 (8.7%) | 5 (0.9%) |
| $55,000 to $64,999 | 58 (11.5%) | 41 (7.6%) |
| $65,000 to $74,999 | 42 (8.4%) | 5 (0.9%) |
| $75,000 to $99,999 | 43 (8.6%) | 7 (1.3%) |
| $100,000+ | 25 (5.0%) | 13 (2.4%) |
| Total | 503 (100.0%) | 536 (100.0%) |
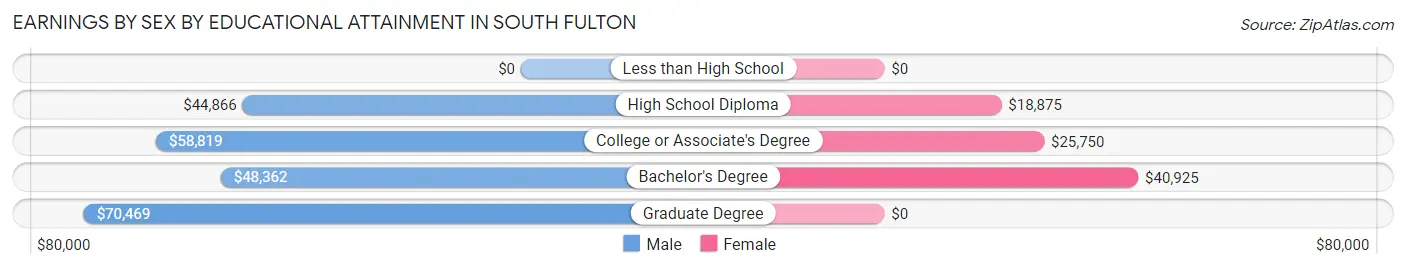
Earnings by Sex by Educational Attainment in South Fulton
Average earnings in South Fulton are $49,914 for men and $25,500 for women, a difference of 48.9%. Men with an educational attainment of graduate degree enjoy the highest average annual earnings of $70,469, while those with high school diploma education earn the least with $44,866. Women with an educational attainment of bachelor's degree earn the most with the average annual earnings of $40,925, while those with high school diploma education have the smallest earnings of $18,875.
| Educational Attainment | Male Income | Female Income |
| Less than High School | - | - |
| High School Diploma | $44,866 | $18,875 |
| College or Associate's Degree | $58,819 | $25,750 |
| Bachelor's Degree | $48,362 | $40,925 |
| Graduate Degree | $70,469 | $0 |
| Total | $49,914 | $25,500 |
Family Income in South Fulton
Family Income Brackets in South Fulton
According to the South Fulton family income data, there are 111 families falling into the $75,000 to $99,999 income range, which is the most common income bracket and makes up 20.0% of all families. Conversely, the $200,000+ income bracket is the least frequent group with only 5 families (0.9%) belonging to this category.
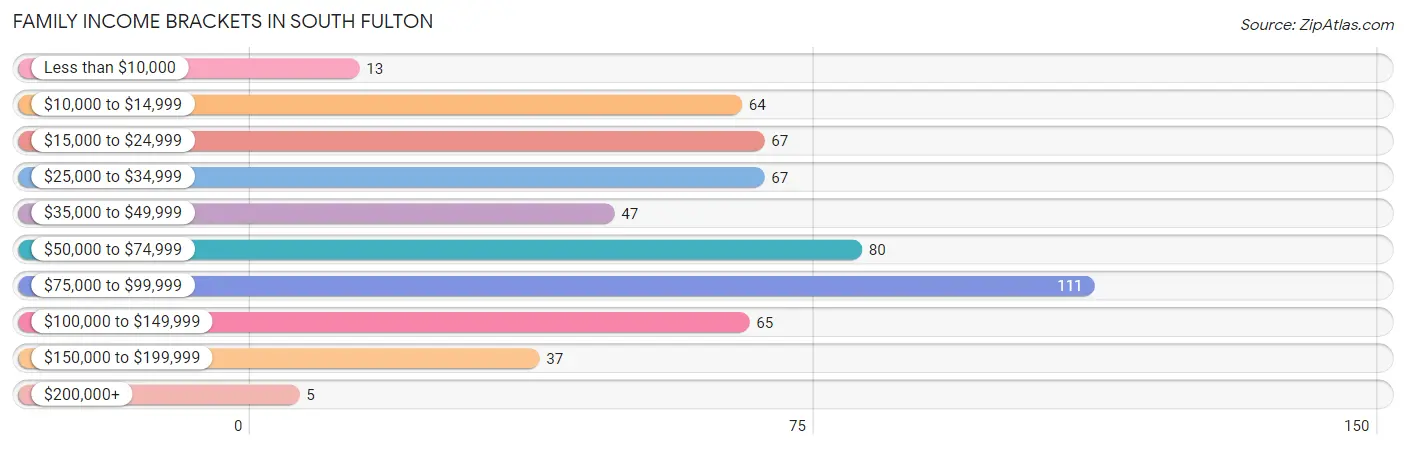
| Income Bracket | # Families | % Families |
| Less than $10,000 | 13 | 2.3% |
| $10,000 to $14,999 | 64 | 11.5% |
| $15,000 to $24,999 | 67 | 12.1% |
| $25,000 to $34,999 | 67 | 12.1% |
| $35,000 to $49,999 | 47 | 8.5% |
| $50,000 to $74,999 | 80 | 14.4% |
| $75,000 to $99,999 | 111 | 20.0% |
| $100,000 to $149,999 | 65 | 11.7% |
| $150,000 to $199,999 | 37 | 6.7% |
| $200,000+ | 5 | 0.9% |
Family Income by Famaliy Size in South Fulton
6-person families (10 | 1.8%) account for the highest median family income in South Fulton with $84,167 per family, while 2-person families (294 | 52.9%) have the highest median income of $29,416 per family member.
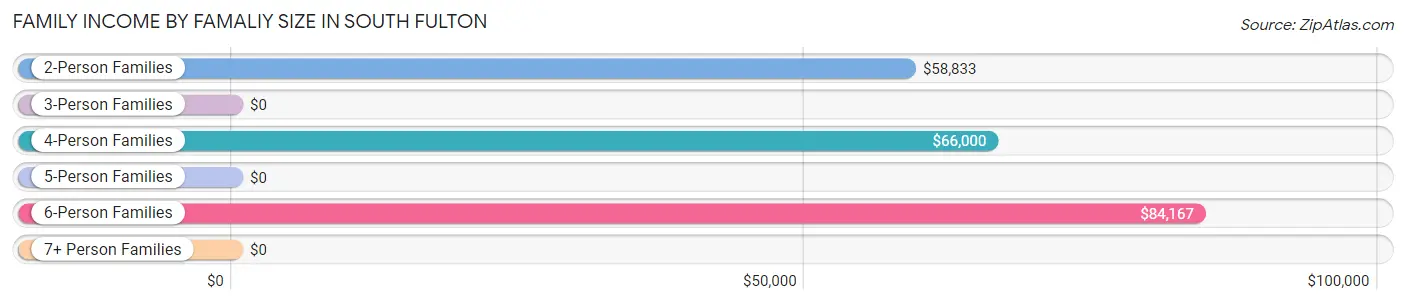
| Income Bracket | # Families | Median Income |
| 2-Person Families | 294 (52.9%) | $58,833 |
| 3-Person Families | 127 (22.8%) | $0 |
| 4-Person Families | 74 (13.3%) | $66,000 |
| 5-Person Families | 51 (9.2%) | $0 |
| 6-Person Families | 10 (1.8%) | $84,167 |
| 7+ Person Families | 0 (0.0%) | $0 |
| Total | 556 (100.0%) | $58,333 |
Family Income by Number of Earners in South Fulton
The median family income in South Fulton is $58,333, with families comprising 3+ earners (44) having the highest median family income of $148,750, while families with 1 earner (190) have the lowest median family income of $30,952, accounting for 7.9% and 34.2% of families, respectively.
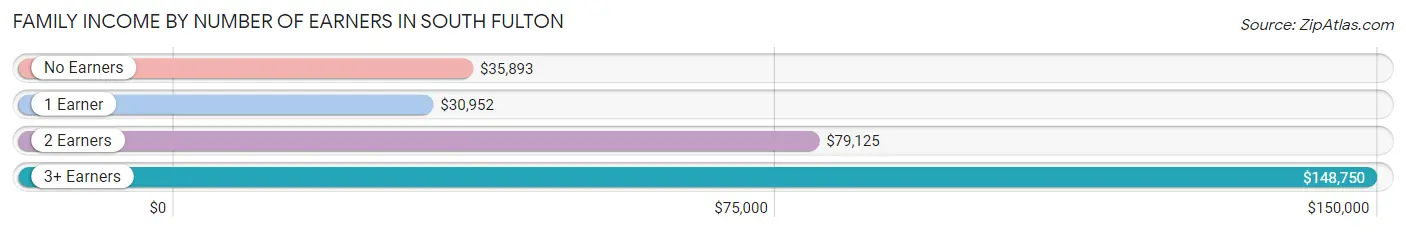
| Number of Earners | # Families | Median Income |
| No Earners | 129 (23.2%) | $35,893 |
| 1 Earner | 190 (34.2%) | $30,952 |
| 2 Earners | 193 (34.7%) | $79,125 |
| 3+ Earners | 44 (7.9%) | $148,750 |
| Total | 556 (100.0%) | $58,333 |
Household Income in South Fulton
Household Income Brackets in South Fulton
With 212 households falling in the category, the $50,000 to $74,999 income range is the most frequent in South Fulton, accounting for 22.0% of all households. In contrast, only 5 households (0.5%) fall into the $200,000+ income bracket, making it the least populous group.
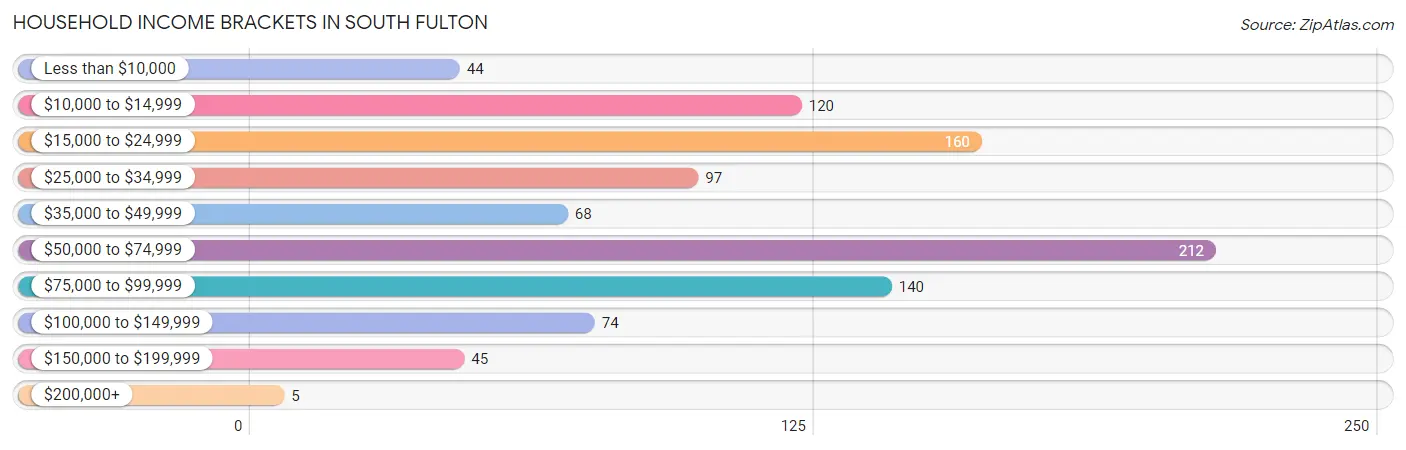
| Income Bracket | # Households | % Households |
| Less than $10,000 | 44 | 4.6% |
| $10,000 to $14,999 | 120 | 12.4% |
| $15,000 to $24,999 | 160 | 16.6% |
| $25,000 to $34,999 | 97 | 10.1% |
| $35,000 to $49,999 | 68 | 7.0% |
| $50,000 to $74,999 | 212 | 22.0% |
| $75,000 to $99,999 | 140 | 14.5% |
| $100,000 to $149,999 | 74 | 7.7% |
| $150,000 to $199,999 | 45 | 4.7% |
| $200,000+ | 5 | 0.5% |
Household Income by Householder Age in South Fulton
The median household income in South Fulton is $48,646, with the highest median household income of $71,563 found in the 15 to 24 years age bracket for the primary householder. A total of 76 households (7.9%) fall into this category. Meanwhile, the 65+ years age bracket for the primary householder has the lowest median household income of $38,289, with 340 households (35.2%) in this group.
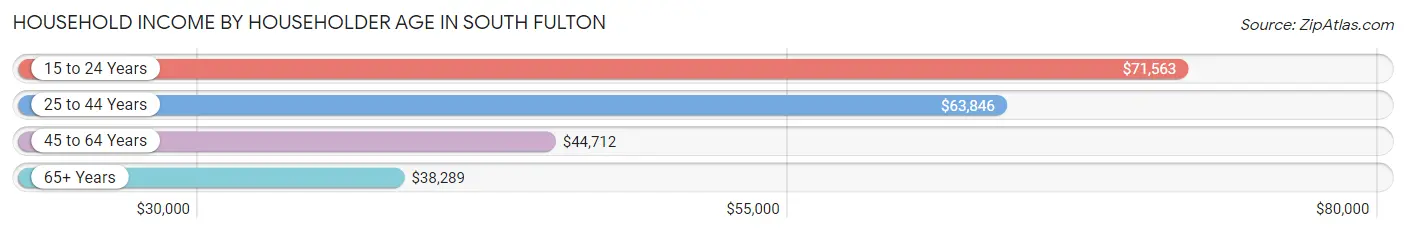
| Income Bracket | # Households | Median Income |
| 15 to 24 Years | 76 (7.9%) | $71,563 |
| 25 to 44 Years | 232 (24.0%) | $63,846 |
| 45 to 64 Years | 317 (32.9%) | $44,712 |
| 65+ Years | 340 (35.2%) | $38,289 |
| Total | 965 (100.0%) | $48,646 |
Poverty in South Fulton
Income Below Poverty by Sex and Age in South Fulton
With 28.7% poverty level for males and 21.6% for females among the residents of South Fulton, 15 year old males and 12 to 14 year old females are the most vulnerable to poverty, with 10 males (100.0%) and 35 females (56.5%) in their respective age groups living below the poverty level.
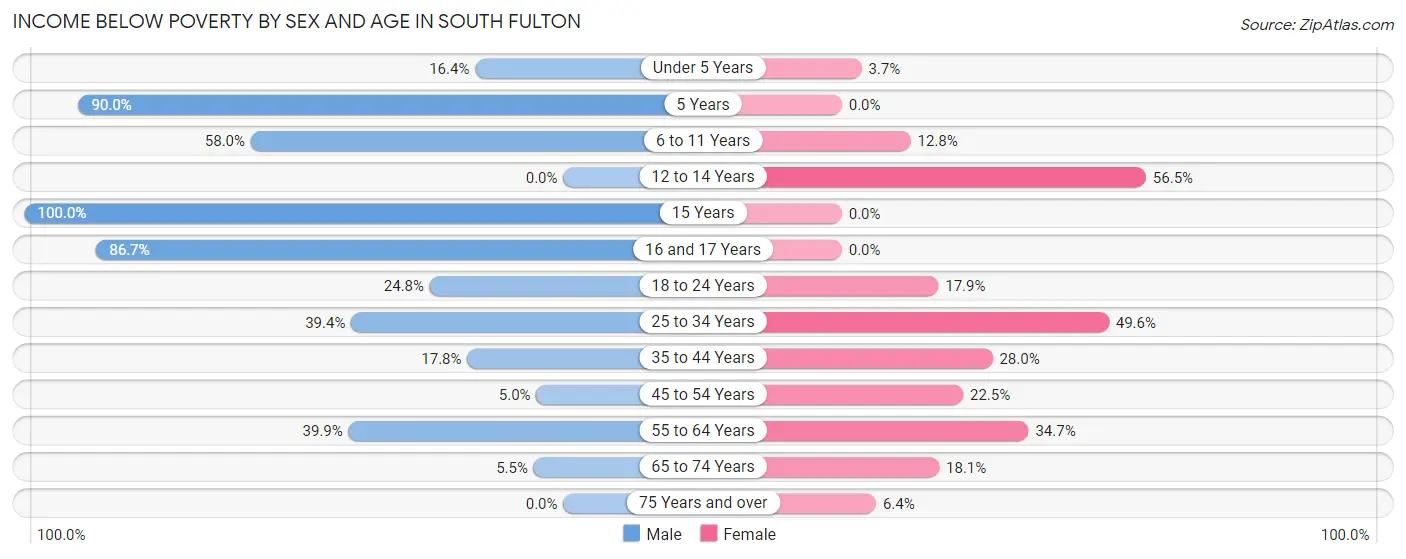
| Age Bracket | Male | Female |
| Under 5 Years | 9 (16.4%) | 7 (3.6%) |
| 5 Years | 27 (90.0%) | 0 (0.0%) |
| 6 to 11 Years | 58 (58.0%) | 6 (12.8%) |
| 12 to 14 Years | 0 (0.0%) | 35 (56.5%) |
| 15 Years | 10 (100.0%) | 0 (0.0%) |
| 16 and 17 Years | 26 (86.7%) | 0 (0.0%) |
| 18 to 24 Years | 28 (24.8%) | 24 (17.9%) |
| 25 to 34 Years | 50 (39.4%) | 56 (49.6%) |
| 35 to 44 Years | 18 (17.8%) | 33 (28.0%) |
| 45 to 54 Years | 6 (5.0%) | 36 (22.5%) |
| 55 to 64 Years | 57 (39.9%) | 35 (34.6%) |
| 65 to 74 Years | 5 (5.5%) | 28 (18.1%) |
| 75 Years and over | 0 (0.0%) | 8 (6.4%) |
| Total | 294 (28.7%) | 268 (21.6%) |
Income Above Poverty by Sex and Age in South Fulton
According to the poverty statistics in South Fulton, males aged 12 to 14 years and females aged 5 years are the age groups that are most secure financially, with 100.0% of males and 100.0% of females in these age groups living above the poverty line.
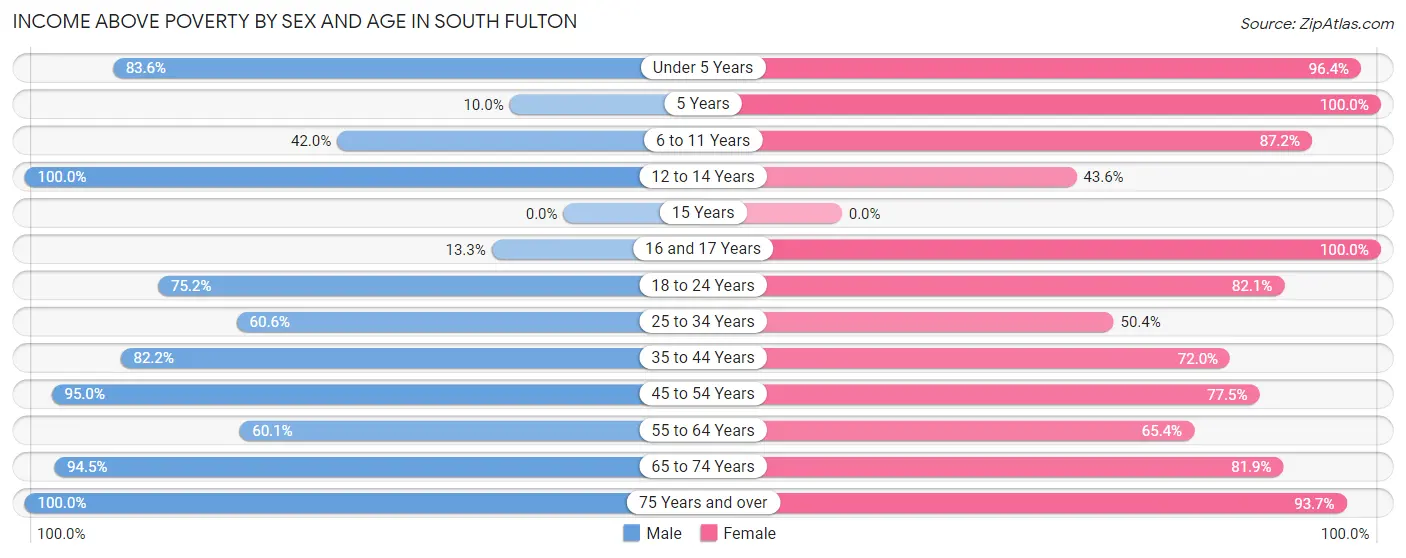
| Age Bracket | Male | Female |
| Under 5 Years | 46 (83.6%) | 185 (96.4%) |
| 5 Years | 3 (10.0%) | 7 (100.0%) |
| 6 to 11 Years | 42 (42.0%) | 41 (87.2%) |
| 12 to 14 Years | 12 (100.0%) | 27 (43.5%) |
| 15 Years | 0 (0.0%) | 0 (0.0%) |
| 16 and 17 Years | 4 (13.3%) | 26 (100.0%) |
| 18 to 24 Years | 85 (75.2%) | 110 (82.1%) |
| 25 to 34 Years | 77 (60.6%) | 57 (50.4%) |
| 35 to 44 Years | 83 (82.2%) | 85 (72.0%) |
| 45 to 54 Years | 114 (95.0%) | 124 (77.5%) |
| 55 to 64 Years | 86 (60.1%) | 66 (65.3%) |
| 65 to 74 Years | 86 (94.5%) | 127 (81.9%) |
| 75 Years and over | 92 (100.0%) | 118 (93.6%) |
| Total | 730 (71.3%) | 973 (78.4%) |
Income Below Poverty Among Married-Couple Families in South Fulton
The poverty statistics for married-couple families in South Fulton show that 13.5% or 51 of the total 378 families live below the poverty line. Families with 3 or 4 children have the highest poverty rate of 80.6%, comprising of 29 families. On the other hand, families with no children have the lowest poverty rate of 5.2%, which includes 13 families.
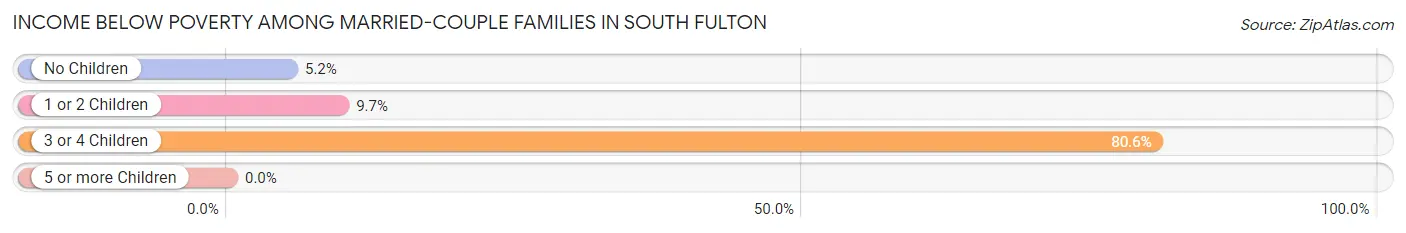
| Children | Above Poverty | Below Poverty |
| No Children | 236 (94.8%) | 13 (5.2%) |
| 1 or 2 Children | 84 (90.3%) | 9 (9.7%) |
| 3 or 4 Children | 7 (19.4%) | 29 (80.6%) |
| 5 or more Children | 0 (0.0%) | 0 (0.0%) |
| Total | 327 (86.5%) | 51 (13.5%) |
Income Below Poverty Among Single-Parent Households in South Fulton
According to the poverty data in South Fulton, 100.0% or 13 single-father households and 47.9% or 79 single-mother households are living below the poverty line. Among single-father households, those with 1 or 2 children have the highest poverty rate, with 13 households (100.0%) experiencing poverty. Likewise, among single-mother households, those with 1 or 2 children have the highest poverty rate, with 61 households (50.8%) falling below the poverty line.
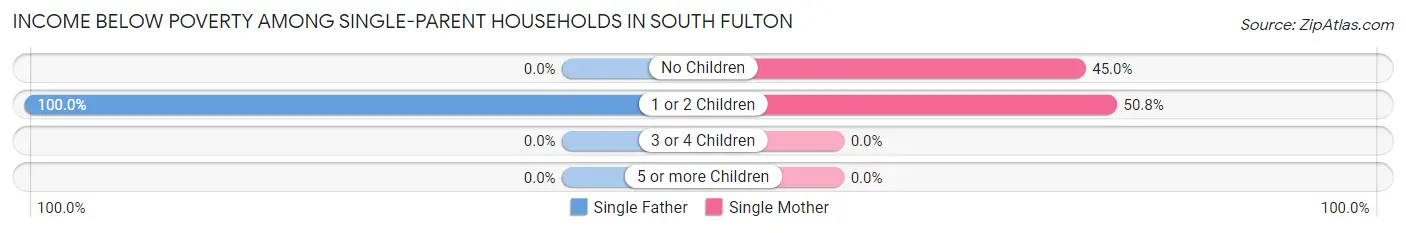
| Children | Single Father | Single Mother |
| No Children | 0 (0.0%) | 18 (45.0%) |
| 1 or 2 Children | 13 (100.0%) | 61 (50.8%) |
| 3 or 4 Children | 0 (0.0%) | 0 (0.0%) |
| 5 or more Children | 0 (0.0%) | 0 (0.0%) |
| Total | 13 (100.0%) | 79 (47.9%) |
Income Below Poverty Among Married-Couple vs Single-Parent Households in South Fulton
The poverty data for South Fulton shows that 51 of the married-couple family households (13.5%) and 92 of the single-parent households (51.7%) are living below the poverty level. Within the married-couple family households, those with 3 or 4 children have the highest poverty rate, with 29 households (80.6%) falling below the poverty line. Among the single-parent households, those with 1 or 2 children have the highest poverty rate, with 74 household (55.6%) living below poverty.
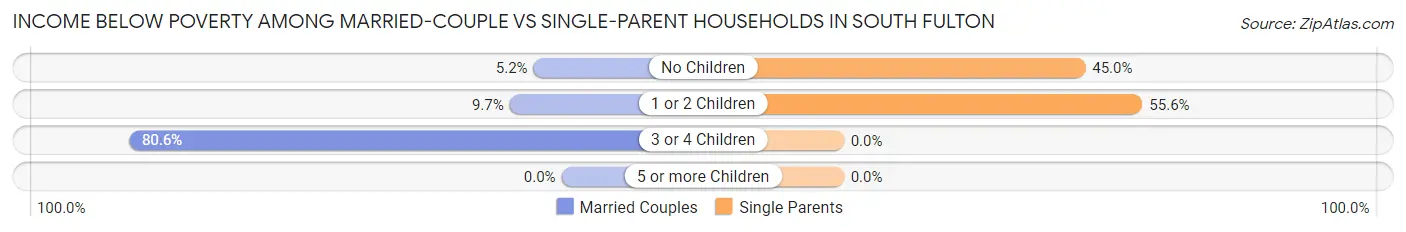
| Children | Married-Couple Families | Single-Parent Households |
| No Children | 13 (5.2%) | 18 (45.0%) |
| 1 or 2 Children | 9 (9.7%) | 74 (55.6%) |
| 3 or 4 Children | 29 (80.6%) | 0 (0.0%) |
| 5 or more Children | 0 (0.0%) | 0 (0.0%) |
| Total | 51 (13.5%) | 92 (51.7%) |
Race in South Fulton
The most populous races in South Fulton are White / Caucasian (1,723 | 75.4%), Black / African American (345 | 15.1%), and Hispanic or Latino (251 | 11.0%).
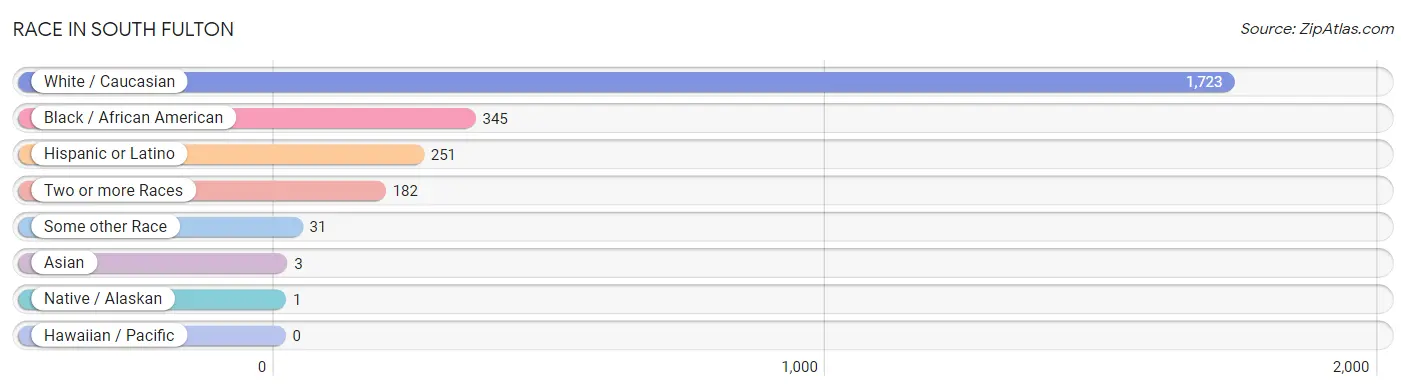
| Race | # Population | % Population |
| Asian | 3 | 0.1% |
| Black / African American | 345 | 15.1% |
| Hawaiian / Pacific | 0 | 0.0% |
| Hispanic or Latino | 251 | 11.0% |
| Native / Alaskan | 1 | 0.0% |
| White / Caucasian | 1,723 | 75.4% |
| Two or more Races | 182 | 8.0% |
| Some other Race | 31 | 1.4% |
| Total | 2,285 | 100.0% |
Ancestry in South Fulton
The most populous ancestries reported in South Fulton are American (945 | 41.4%), English (200 | 8.7%), Cuban (136 | 5.9%), Irish (83 | 3.6%), and German (77 | 3.4%), together accounting for 63.1% of all South Fulton residents.
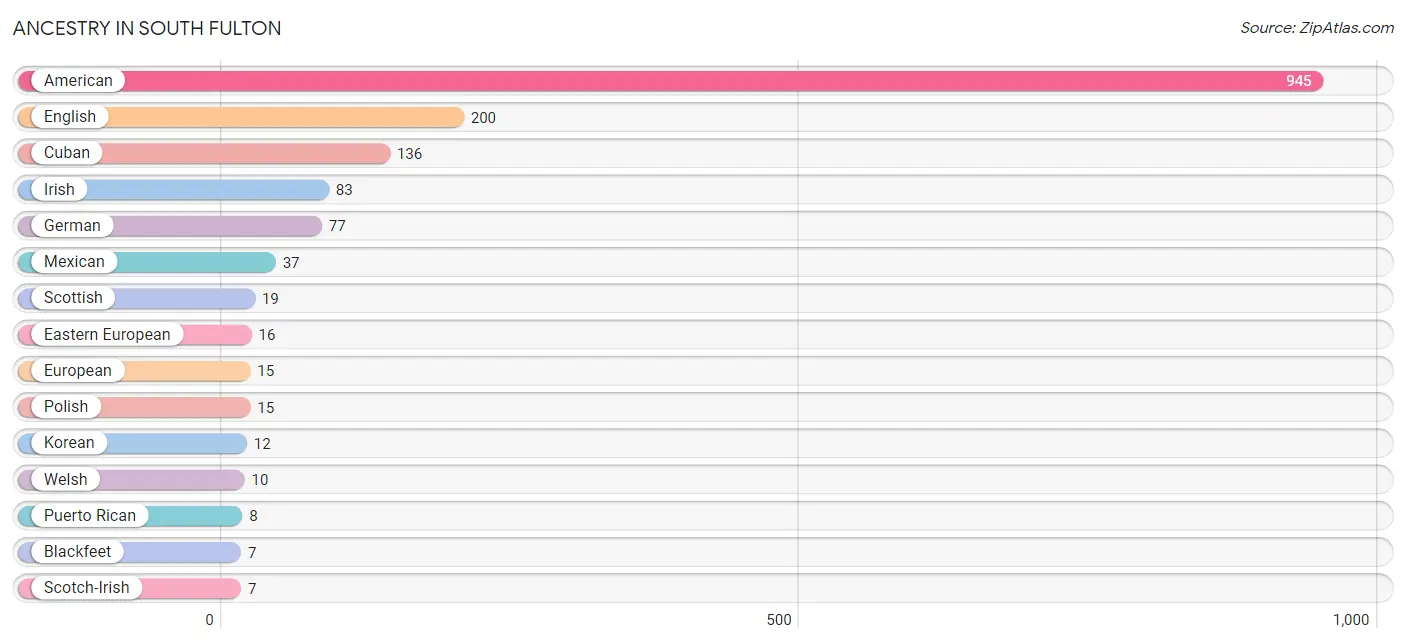
| Ancestry | # Population | % Population |
| American | 945 | 41.4% |
| Blackfeet | 7 | 0.3% |
| British | 4 | 0.2% |
| Choctaw | 1 | 0.0% |
| Cuban | 136 | 5.9% |
| Dutch | 5 | 0.2% |
| Eastern European | 16 | 0.7% |
| English | 200 | 8.7% |
| European | 15 | 0.7% |
| French | 6 | 0.3% |
| German | 77 | 3.4% |
| Greek | 6 | 0.3% |
| Irish | 83 | 3.6% |
| Italian | 6 | 0.3% |
| Korean | 12 | 0.5% |
| Mexican | 37 | 1.6% |
| Norwegian | 6 | 0.3% |
| Polish | 15 | 0.7% |
| Puerto Rican | 8 | 0.4% |
| Scotch-Irish | 7 | 0.3% |
| Scottish | 19 | 0.8% |
| Swedish | 2 | 0.1% |
| Swiss | 2 | 0.1% |
| Welsh | 10 | 0.4% | View All 24 Rows |
Immigrants in South Fulton
The most numerous immigrant groups reported in South Fulton came from Asia (3 | 0.1%), Central America (3 | 0.1%), Latin America (3 | 0.1%), Panama (3 | 0.1%), and Philippines (3 | 0.1%), together accounting for 0.6% of all South Fulton residents.
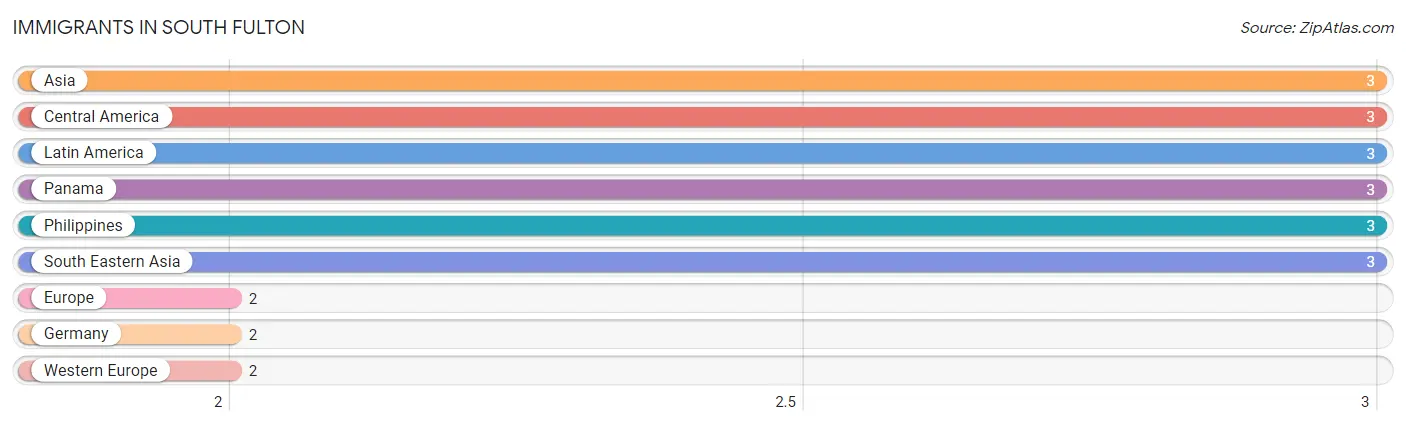
| Immigration Origin | # Population | % Population |
| Asia | 3 | 0.1% |
| Central America | 3 | 0.1% |
| Europe | 2 | 0.1% |
| Germany | 2 | 0.1% |
| Latin America | 3 | 0.1% |
| Panama | 3 | 0.1% |
| Philippines | 3 | 0.1% |
| South Eastern Asia | 3 | 0.1% |
| Western Europe | 2 | 0.1% | View All 9 Rows |
Sex and Age in South Fulton
Sex and Age in South Fulton
The most populous age groups in South Fulton are 60 to 64 Years (106 | 10.2%) for men and Under 5 Years (199 | 16.0%) for women.
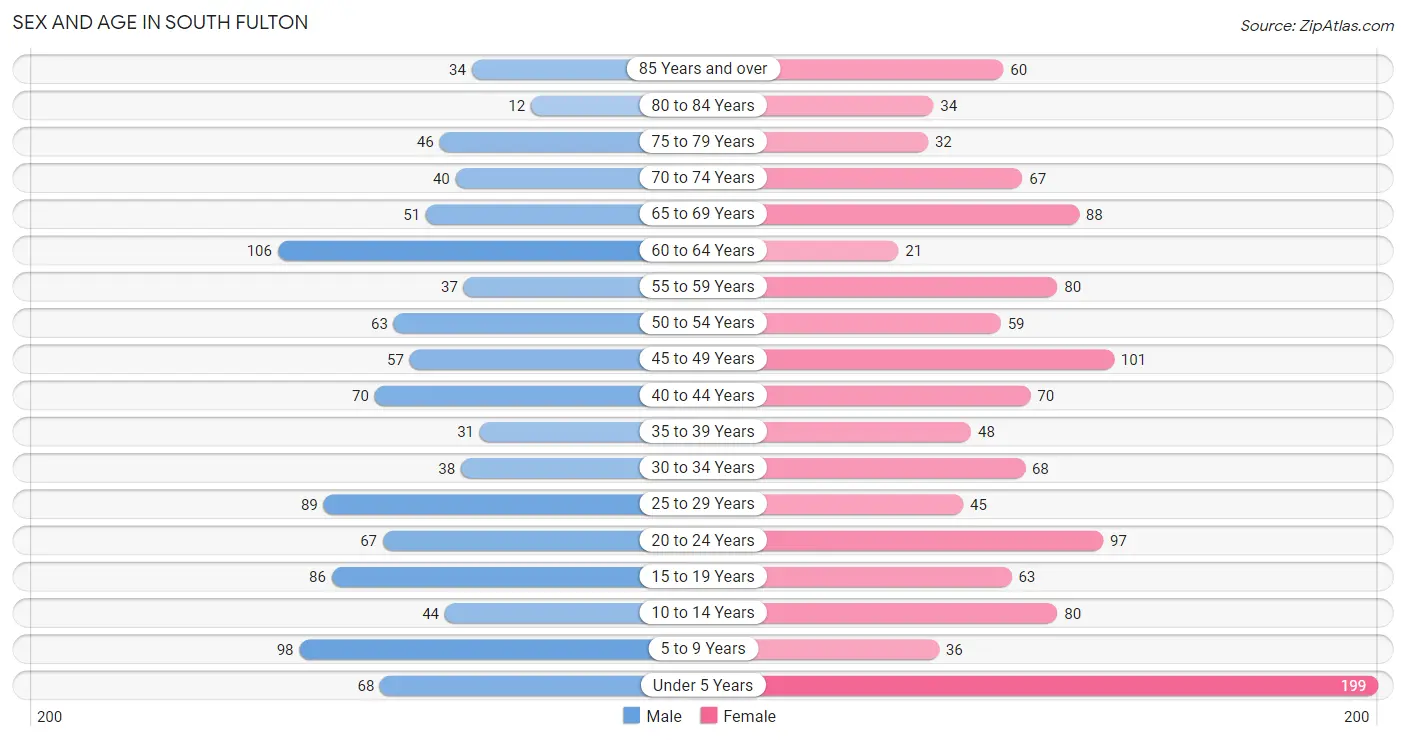
| Age Bracket | Male | Female |
| Under 5 Years | 68 (6.6%) | 199 (16.0%) |
| 5 to 9 Years | 98 (9.5%) | 36 (2.9%) |
| 10 to 14 Years | 44 (4.2%) | 80 (6.4%) |
| 15 to 19 Years | 86 (8.3%) | 63 (5.1%) |
| 20 to 24 Years | 67 (6.5%) | 97 (7.8%) |
| 25 to 29 Years | 89 (8.6%) | 45 (3.6%) |
| 30 to 34 Years | 38 (3.7%) | 68 (5.4%) |
| 35 to 39 Years | 31 (3.0%) | 48 (3.8%) |
| 40 to 44 Years | 70 (6.8%) | 70 (5.6%) |
| 45 to 49 Years | 57 (5.5%) | 101 (8.1%) |
| 50 to 54 Years | 63 (6.1%) | 59 (4.7%) |
| 55 to 59 Years | 37 (3.6%) | 80 (6.4%) |
| 60 to 64 Years | 106 (10.2%) | 21 (1.7%) |
| 65 to 69 Years | 51 (4.9%) | 88 (7.0%) |
| 70 to 74 Years | 40 (3.9%) | 67 (5.4%) |
| 75 to 79 Years | 46 (4.4%) | 32 (2.6%) |
| 80 to 84 Years | 12 (1.2%) | 34 (2.7%) |
| 85 Years and over | 34 (3.3%) | 60 (4.8%) |
| Total | 1,037 (100.0%) | 1,248 (100.0%) |
Families and Households in South Fulton
Median Family Size in South Fulton
The median family size in South Fulton is 3.20 persons per family, with single female/mother families (165 | 29.7%) accounting for the largest median family size of 3.62 persons per family. On the other hand, single male/father families (13 | 2.3%) represent the smallest median family size with 3.00 persons per family.
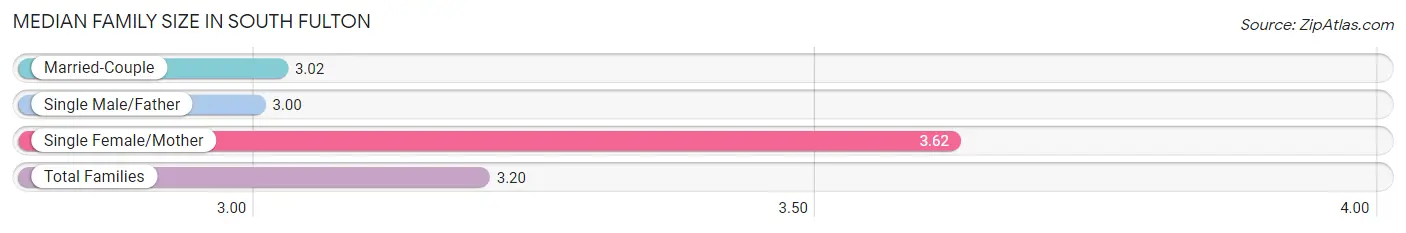
| Family Type | # Families | Family Size |
| Married-Couple | 378 (68.0%) | 3.02 |
| Single Male/Father | 13 (2.3%) | 3.00 |
| Single Female/Mother | 165 (29.7%) | 3.62 |
| Total Families | 556 (100.0%) | 3.20 |
Median Household Size in South Fulton
The median household size in South Fulton is 2.36 persons per household, with single female/mother households (165 | 17.1%) accounting for the largest median household size of 4.07 persons per household. non-family households (409 | 42.4%) represent the smallest median household size with 1.04 persons per household.
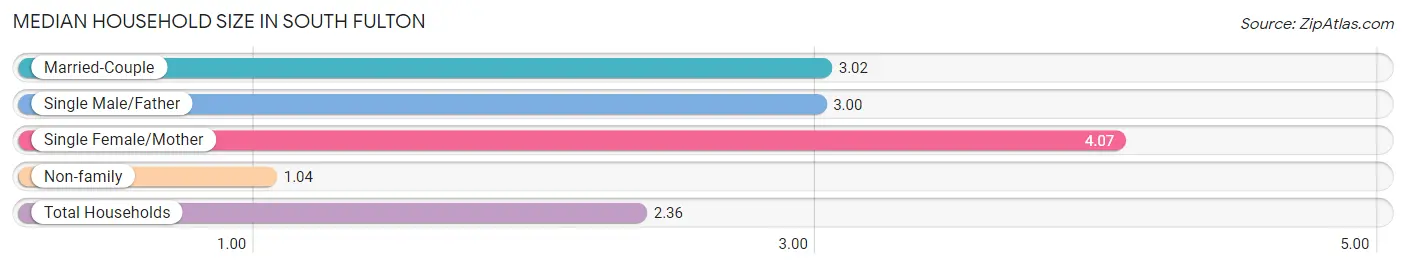
| Household Type | # Households | Household Size |
| Married-Couple | 378 (39.2%) | 3.02 |
| Single Male/Father | 13 (1.3%) | 3.00 |
| Single Female/Mother | 165 (17.1%) | 4.07 |
| Non-family | 409 (42.4%) | 1.04 |
| Total Households | 965 (100.0%) | 2.36 |
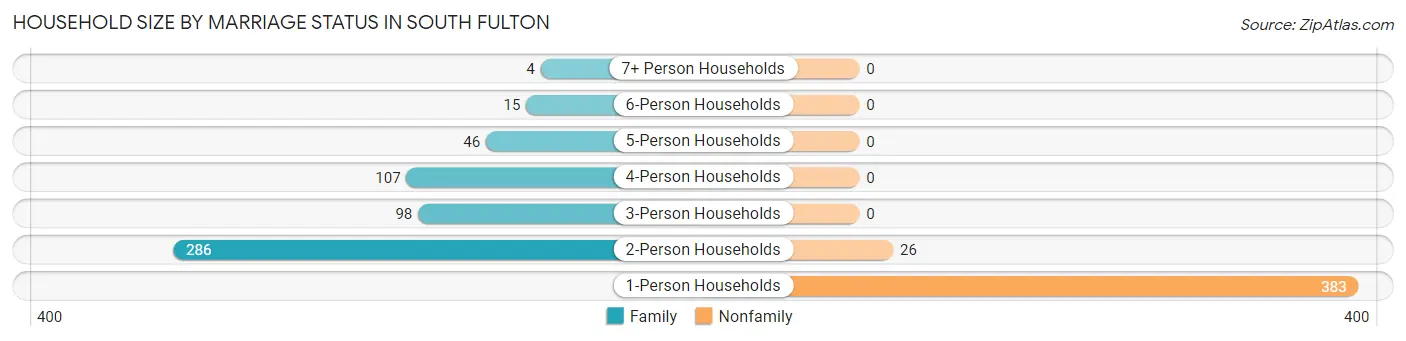
Household Size by Marriage Status in South Fulton
Out of a total of 965 households in South Fulton, 556 (57.6%) are family households, while 409 (42.4%) are nonfamily households. The most numerous type of family households are 2-person households, comprising 286, and the most common type of nonfamily households are 1-person households, comprising 383.
| Household Size | Family Households | Nonfamily Households |
| 1-Person Households | - | 383 (39.7%) |
| 2-Person Households | 286 (29.6%) | 26 (2.7%) |
| 3-Person Households | 98 (10.2%) | 0 (0.0%) |
| 4-Person Households | 107 (11.1%) | 0 (0.0%) |
| 5-Person Households | 46 (4.8%) | 0 (0.0%) |
| 6-Person Households | 15 (1.5%) | 0 (0.0%) |
| 7+ Person Households | 4 (0.4%) | 0 (0.0%) |
| Total | 556 (57.6%) | 409 (42.4%) |
Female Fertility in South Fulton
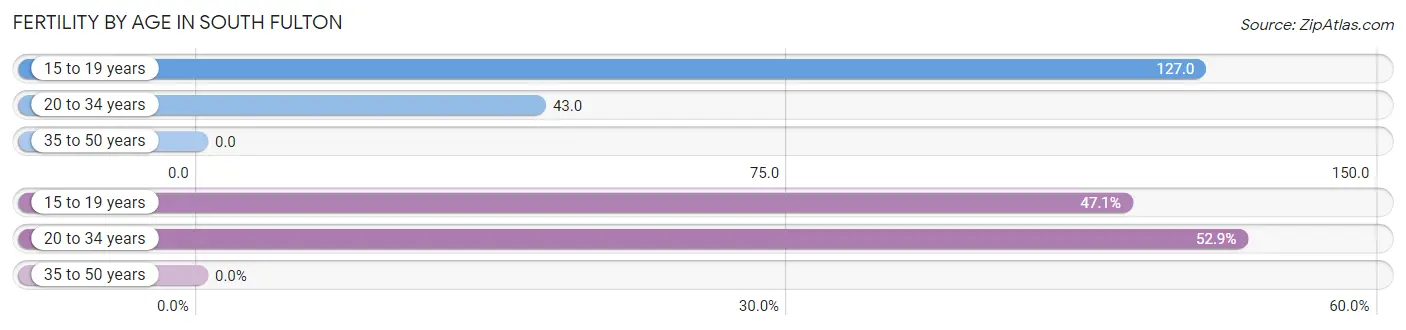
Fertility by Age in South Fulton
Average fertility rate in South Fulton is 33.0 births per 1,000 women. Women in the age bracket of 15 to 19 years have the highest fertility rate with 127.0 births per 1,000 women. Women in the age bracket of 20 to 34 years acount for 52.9% of all women with births.
| Age Bracket | Women with Births | Births / 1,000 Women |
| 15 to 19 years | 8 (47.1%) | 127.0 |
| 20 to 34 years | 9 (52.9%) | 43.0 |
| 35 to 50 years | 0 (0.0%) | 0.0 |
| Total | 17 (100.0%) | 33.0 |
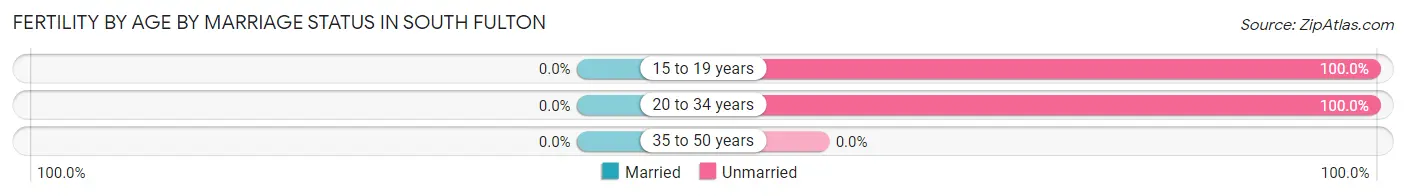
Fertility by Age by Marriage Status in South Fulton
| Age Bracket | Married | Unmarried |
| 15 to 19 years | 0 (0.0%) | 8 (100.0%) |
| 20 to 34 years | 0 (0.0%) | 9 (100.0%) |
| 35 to 50 years | 0 (0.0%) | 0 (0.0%) |
| Total | 0 (0.0%) | 17 (100.0%) |
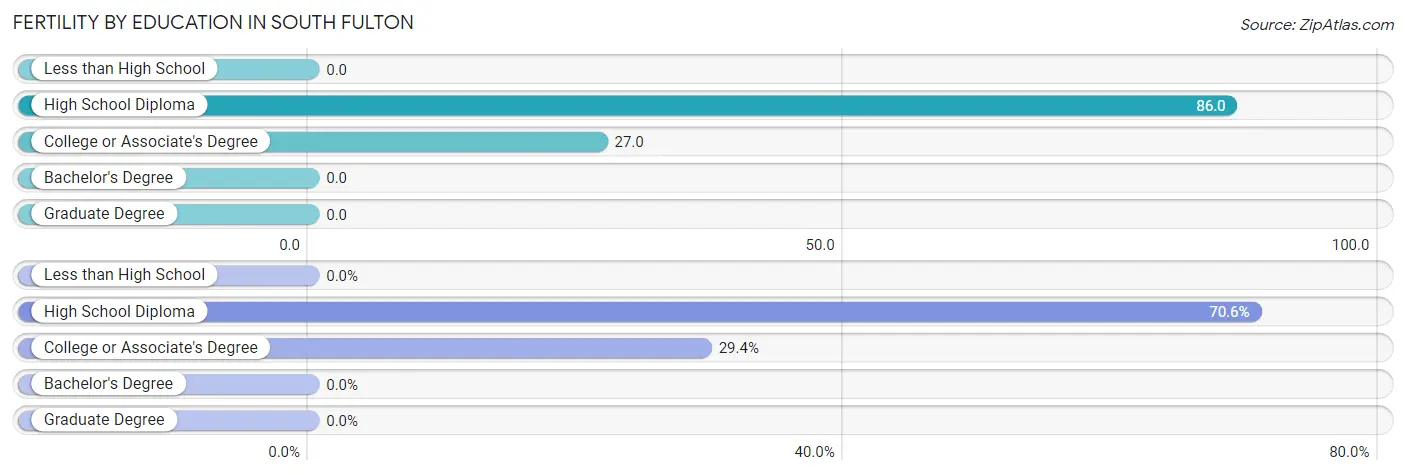
Fertility by Education in South Fulton
| Educational Attainment | Women with Births | Births / 1,000 Women |
| Less than High School | 0 (0.0%) | 0.0 |
| High School Diploma | 12 (70.6%) | 86.0 |
| College or Associate's Degree | 5 (29.4%) | 27.0 |
| Bachelor's Degree | 0 (0.0%) | 0.0 |
| Graduate Degree | 0 (0.0%) | 0.0 |
| Total | 17 (100.0%) | 33.0 |
Fertility by Education by Marriage Status in South Fulton
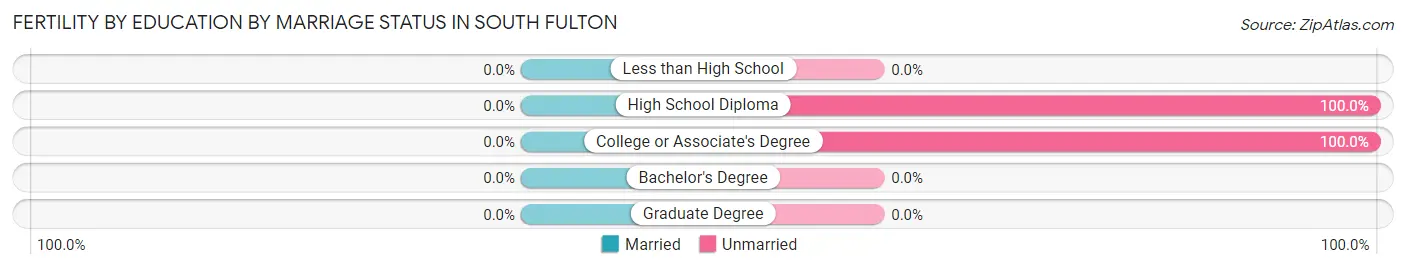
| Educational Attainment | Married | Unmarried |
| Less than High School | 0 (0.0%) | 0 (0.0%) |
| High School Diploma | 0 (0.0%) | 12 (100.0%) |
| College or Associate's Degree | 0 (0.0%) | 5 (100.0%) |
| Bachelor's Degree | 0 (0.0%) | 0 (0.0%) |
| Graduate Degree | 0 (0.0%) | 0 (0.0%) |
| Total | 0 (0.0%) | 17 (100.0%) |
Employment Characteristics in South Fulton
Employment by Class of Employer in South Fulton
Among the 972 employed individuals in South Fulton, private company employees (677 | 69.7%), not-for-profit organizations (73 | 7.5%), and federal government employees (71 | 7.3%) make up the most common classes of employment.
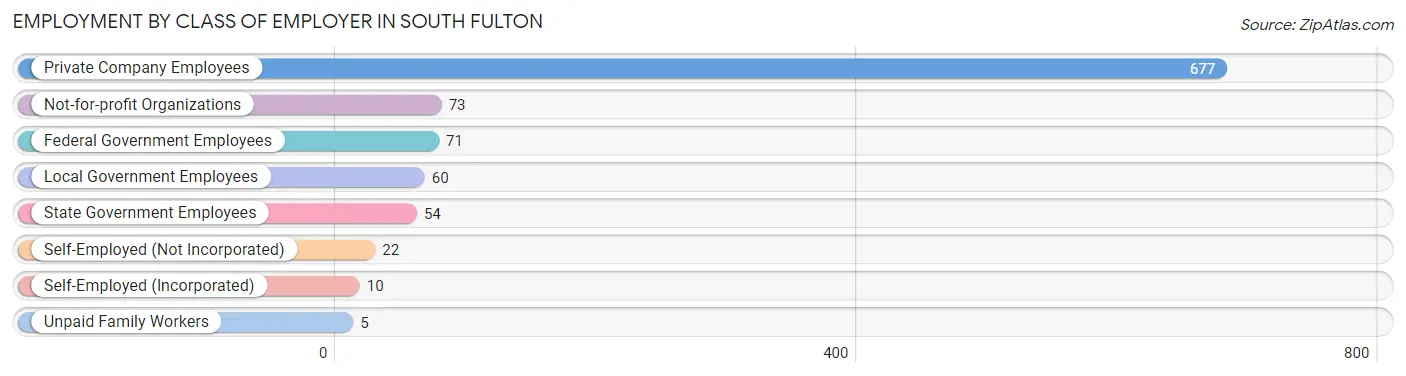
| Employer Class | # Employees | % Employees |
| Private Company Employees | 677 | 69.7% |
| Self-Employed (Incorporated) | 10 | 1.0% |
| Self-Employed (Not Incorporated) | 22 | 2.3% |
| Not-for-profit Organizations | 73 | 7.5% |
| Local Government Employees | 60 | 6.2% |
| State Government Employees | 54 | 5.6% |
| Federal Government Employees | 71 | 7.3% |
| Unpaid Family Workers | 5 | 0.5% |
| Total | 972 | 100.0% |
Employment Status by Age in South Fulton
According to the labor force statistics for South Fulton, out of the total population over 16 years of age (1,750), 57.8% or 1,011 individuals are in the labor force, with 4.1% or 41 of them unemployed. The age group with the highest labor force participation rate is 25 to 29 years, with 97.8% or 131 individuals in the labor force. Within the labor force, the 16 to 19 years age range has the highest percentage of unemployed individuals, with 8.6% or 6 of them being unemployed.
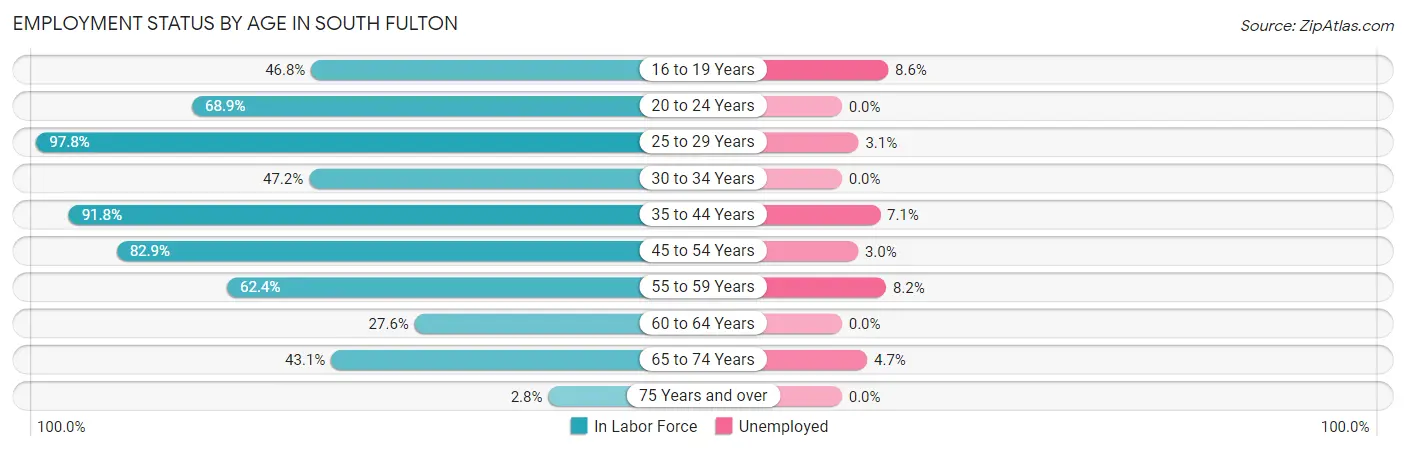
| Age Bracket | In Labor Force | Unemployed |
| 16 to 19 Years | 65 (46.8%) | 6 (8.6%) |
| 20 to 24 Years | 113 (68.9%) | 0 (0.0%) |
| 25 to 29 Years | 131 (97.8%) | 4 (3.1%) |
| 30 to 34 Years | 50 (47.2%) | 0 (0.0%) |
| 35 to 44 Years | 201 (91.8%) | 14 (7.1%) |
| 45 to 54 Years | 232 (82.9%) | 7 (3.0%) |
| 55 to 59 Years | 73 (62.4%) | 6 (8.2%) |
| 60 to 64 Years | 35 (27.6%) | 0 (0.0%) |
| 65 to 74 Years | 106 (43.1%) | 5 (4.7%) |
| 75 Years and over | 6 (2.8%) | 0 (0.0%) |
| Total | 1,012 (57.8%) | 41 (4.1%) |
Employment Status by Educational Attainment in South Fulton
According to labor force statistics for South Fulton, 73.4% of individuals (722) out of the total population between 25 and 64 years of age (983) are in the labor force, with 4.3% or 31 of them being unemployed. The group with the highest labor force participation rate are those with the educational attainment of bachelor's degree or higher, with 93.9% or 215 individuals in the labor force. Within the labor force, individuals with less than high school education have the highest percentage of unemployment, with 57.1% or 4 of them being unemployed.
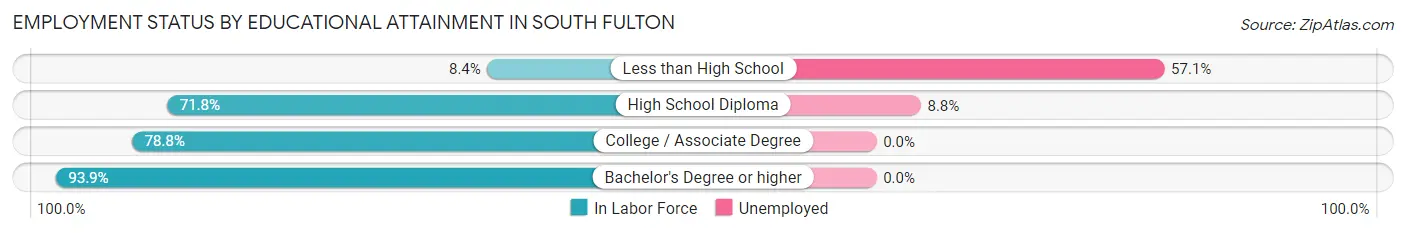
| Educational Attainment | In Labor Force | Unemployed |
| Less than High School | 7 (8.4%) | 47 (57.1%) |
| High School Diploma | 296 (71.8%) | 36 (8.8%) |
| College / Associate Degree | 204 (78.8%) | 0 (0.0%) |
| Bachelor's Degree or higher | 215 (93.9%) | 0 (0.0%) |
| Total | 722 (73.4%) | 42 (4.3%) |
Employment Occupations by Sex in South Fulton
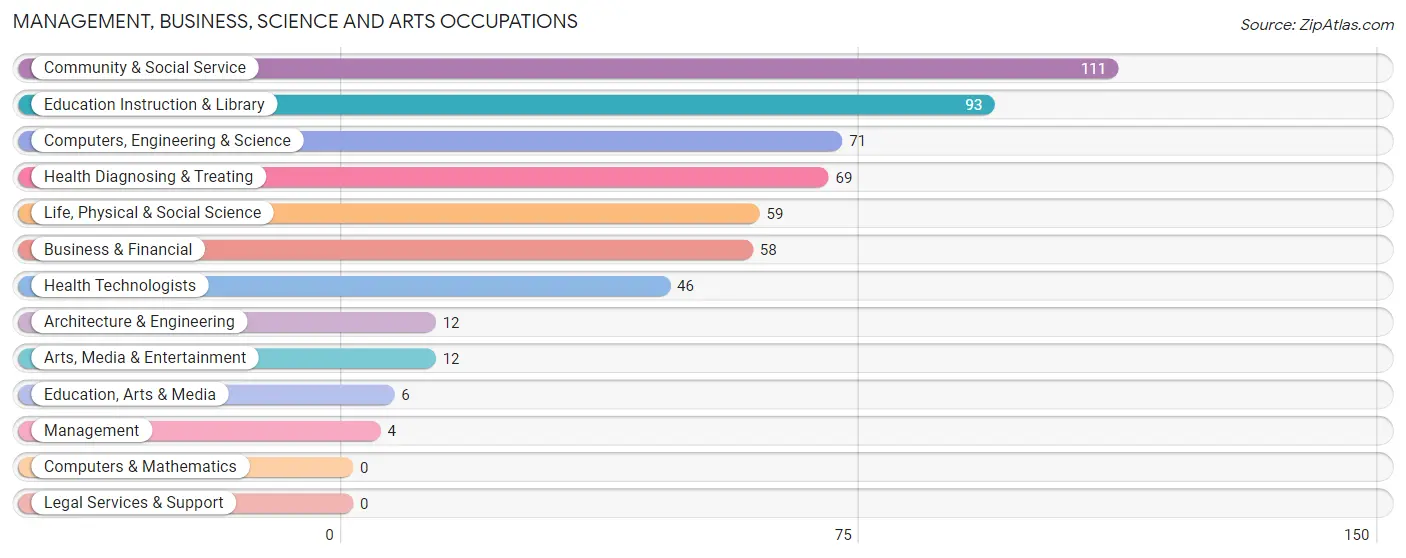
Management, Business, Science and Arts Occupations
The most common Management, Business, Science and Arts occupations in South Fulton are Community & Social Service (111 | 11.7%), Education Instruction & Library (93 | 9.8%), Computers, Engineering & Science (71 | 7.5%), Health Diagnosing & Treating (69 | 7.3%), and Life, Physical & Social Science (59 | 6.2%).
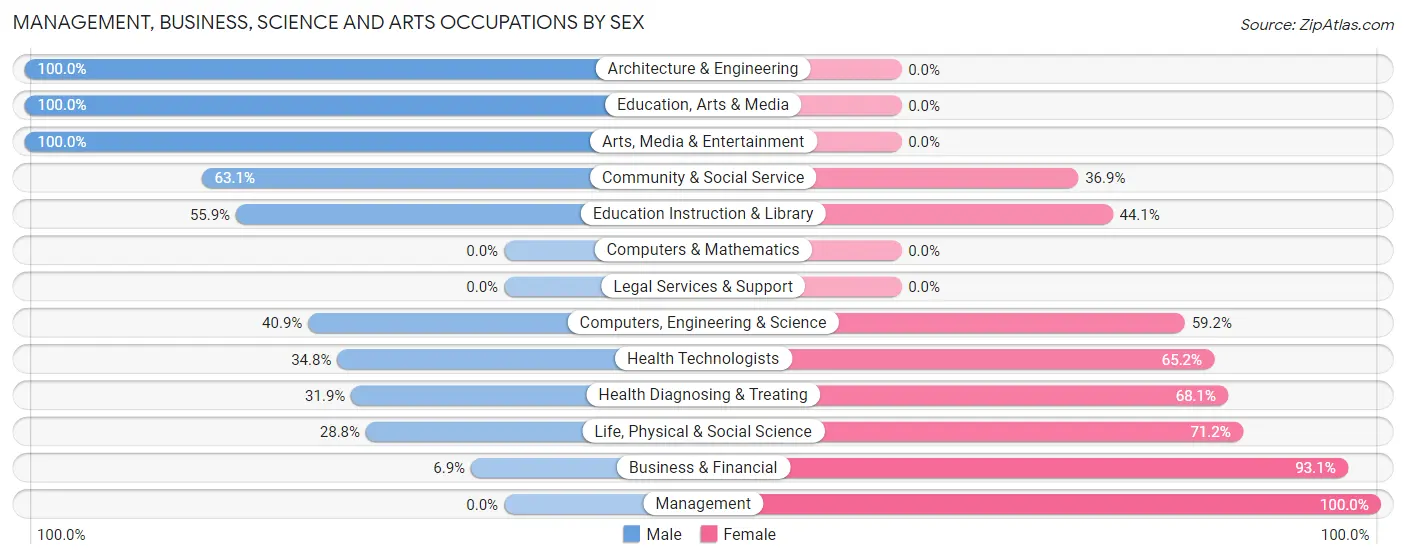
Management, Business, Science and Arts Occupations by Sex
Within the Management, Business, Science and Arts occupations in South Fulton, the most male-oriented occupations are Architecture & Engineering (100.0%), Education, Arts & Media (100.0%), and Arts, Media & Entertainment (100.0%), while the most female-oriented occupations are Management (100.0%), Business & Financial (93.1%), and Life, Physical & Social Science (71.2%).
| Occupation | Male | Female |
| Management | 0 (0.0%) | 4 (100.0%) |
| Business & Financial | 4 (6.9%) | 54 (93.1%) |
| Computers, Engineering & Science | 29 (40.8%) | 42 (59.2%) |
| Computers & Mathematics | 0 (0.0%) | 0 (0.0%) |
| Architecture & Engineering | 12 (100.0%) | 0 (0.0%) |
| Life, Physical & Social Science | 17 (28.8%) | 42 (71.2%) |
| Community & Social Service | 70 (63.1%) | 41 (36.9%) |
| Education, Arts & Media | 6 (100.0%) | 0 (0.0%) |
| Legal Services & Support | 0 (0.0%) | 0 (0.0%) |
| Education Instruction & Library | 52 (55.9%) | 41 (44.1%) |
| Arts, Media & Entertainment | 12 (100.0%) | 0 (0.0%) |
| Health Diagnosing & Treating | 22 (31.9%) | 47 (68.1%) |
| Health Technologists | 16 (34.8%) | 30 (65.2%) |
| Total (Category) | 125 (39.9%) | 188 (60.1%) |
| Total (Overall) | 442 (46.7%) | 505 (53.3%) |
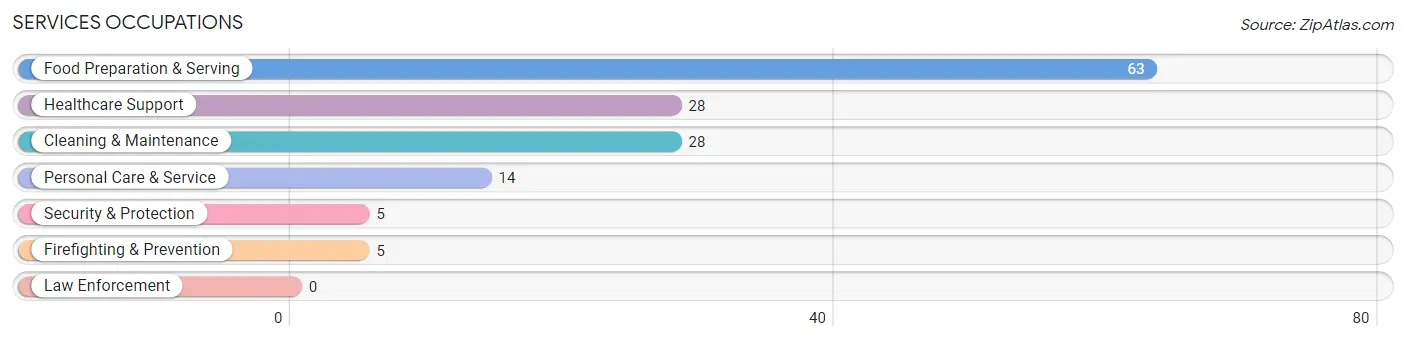
Services Occupations
The most common Services occupations in South Fulton are Food Preparation & Serving (63 | 6.7%), Healthcare Support (28 | 3.0%), Cleaning & Maintenance (28 | 3.0%), Personal Care & Service (14 | 1.5%), and Security & Protection (5 | 0.5%).
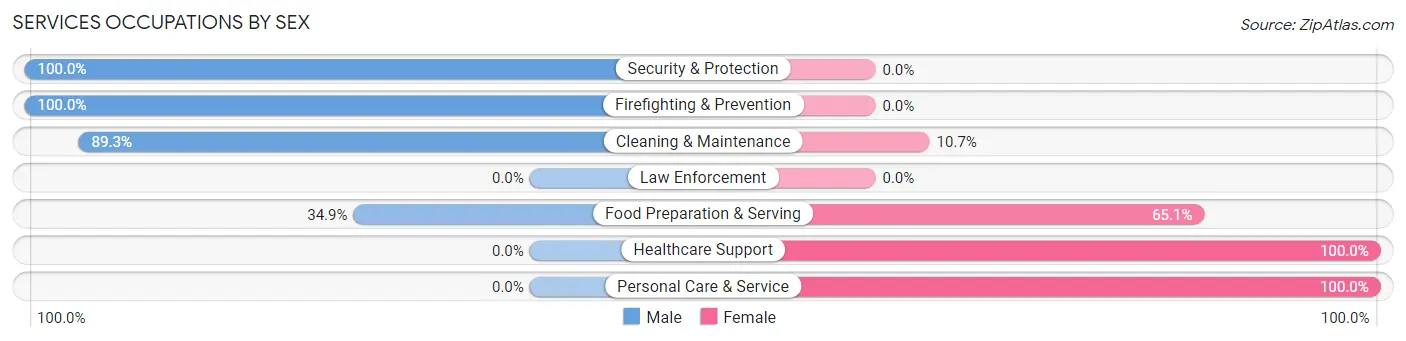
Services Occupations by Sex
Within the Services occupations in South Fulton, the most male-oriented occupations are Security & Protection (100.0%), Firefighting & Prevention (100.0%), and Cleaning & Maintenance (89.3%), while the most female-oriented occupations are Healthcare Support (100.0%), Personal Care & Service (100.0%), and Food Preparation & Serving (65.1%).
| Occupation | Male | Female |
| Healthcare Support | 0 (0.0%) | 28 (100.0%) |
| Security & Protection | 5 (100.0%) | 0 (0.0%) |
| Firefighting & Prevention | 5 (100.0%) | 0 (0.0%) |
| Law Enforcement | 0 (0.0%) | 0 (0.0%) |
| Food Preparation & Serving | 22 (34.9%) | 41 (65.1%) |
| Cleaning & Maintenance | 25 (89.3%) | 3 (10.7%) |
| Personal Care & Service | 0 (0.0%) | 14 (100.0%) |
| Total (Category) | 52 (37.7%) | 86 (62.3%) |
| Total (Overall) | 442 (46.7%) | 505 (53.3%) |
Sales and Office Occupations
The most common Sales and Office occupations in South Fulton are Sales & Related (126 | 13.3%), and Office & Administration (99 | 10.4%).
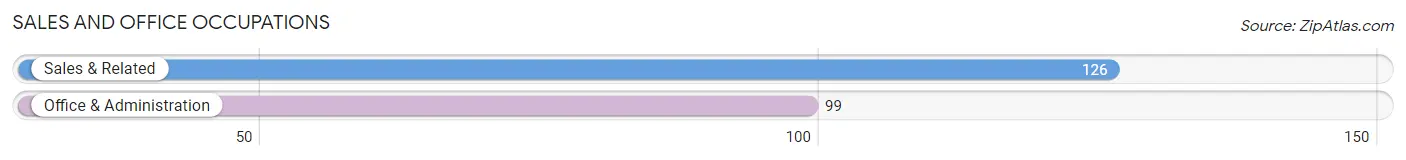
Sales and Office Occupations by Sex
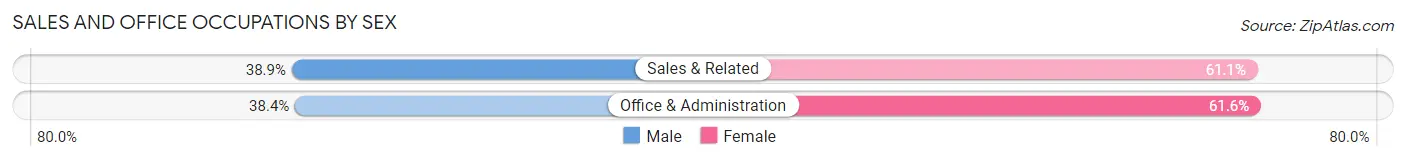
| Occupation | Male | Female |
| Sales & Related | 49 (38.9%) | 77 (61.1%) |
| Office & Administration | 38 (38.4%) | 61 (61.6%) |
| Total (Category) | 87 (38.7%) | 138 (61.3%) |
| Total (Overall) | 442 (46.7%) | 505 (53.3%) |
Natural Resources, Construction and Maintenance Occupations
The most common Natural Resources, Construction and Maintenance occupations in South Fulton are Installation, Maintenance & Repair (63 | 6.7%), and Construction & Extraction (12 | 1.3%).
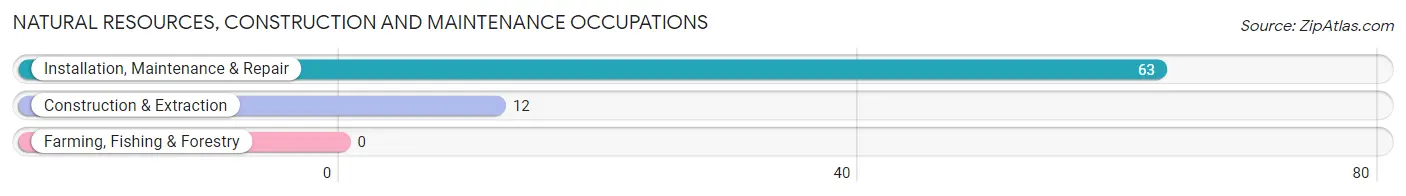
Natural Resources, Construction and Maintenance Occupations by Sex
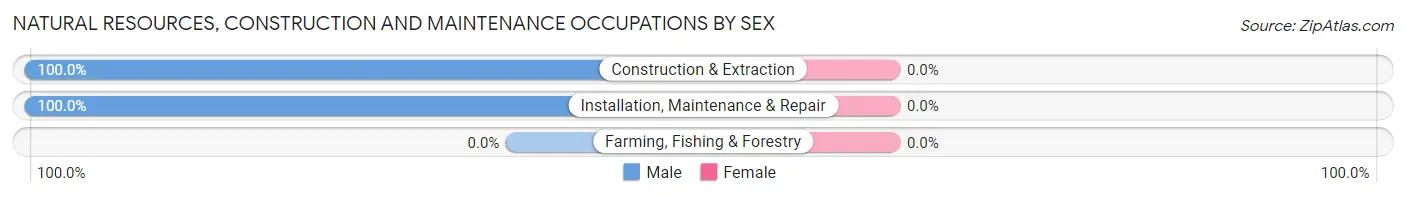
| Occupation | Male | Female |
| Farming, Fishing & Forestry | 0 (0.0%) | 0 (0.0%) |
| Construction & Extraction | 12 (100.0%) | 0 (0.0%) |
| Installation, Maintenance & Repair | 63 (100.0%) | 0 (0.0%) |
| Total (Category) | 75 (100.0%) | 0 (0.0%) |
| Total (Overall) | 442 (46.7%) | 505 (53.3%) |
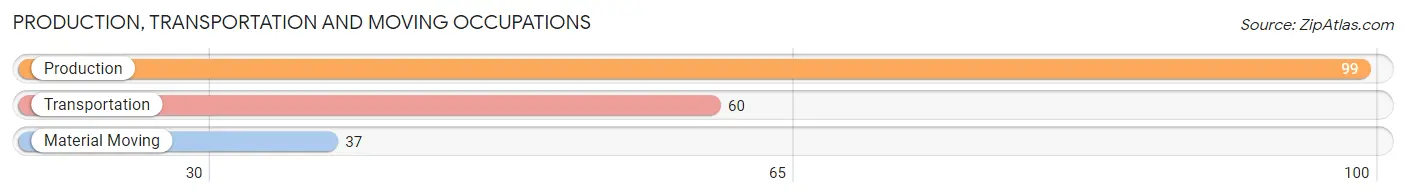
Production, Transportation and Moving Occupations
The most common Production, Transportation and Moving occupations in South Fulton are Production (99 | 10.4%), Transportation (60 | 6.3%), and Material Moving (37 | 3.9%).
Production, Transportation and Moving Occupations by Sex
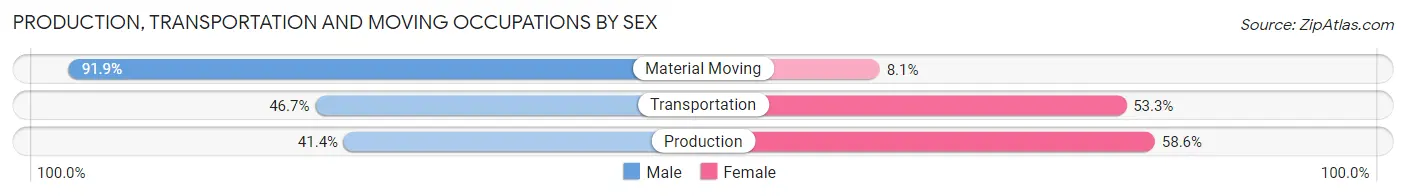
| Occupation | Male | Female |
| Production | 41 (41.4%) | 58 (58.6%) |
| Transportation | 28 (46.7%) | 32 (53.3%) |
| Material Moving | 34 (91.9%) | 3 (8.1%) |
| Total (Category) | 103 (52.5%) | 93 (47.4%) |
| Total (Overall) | 442 (46.7%) | 505 (53.3%) |
Employment Industries by Sex in South Fulton
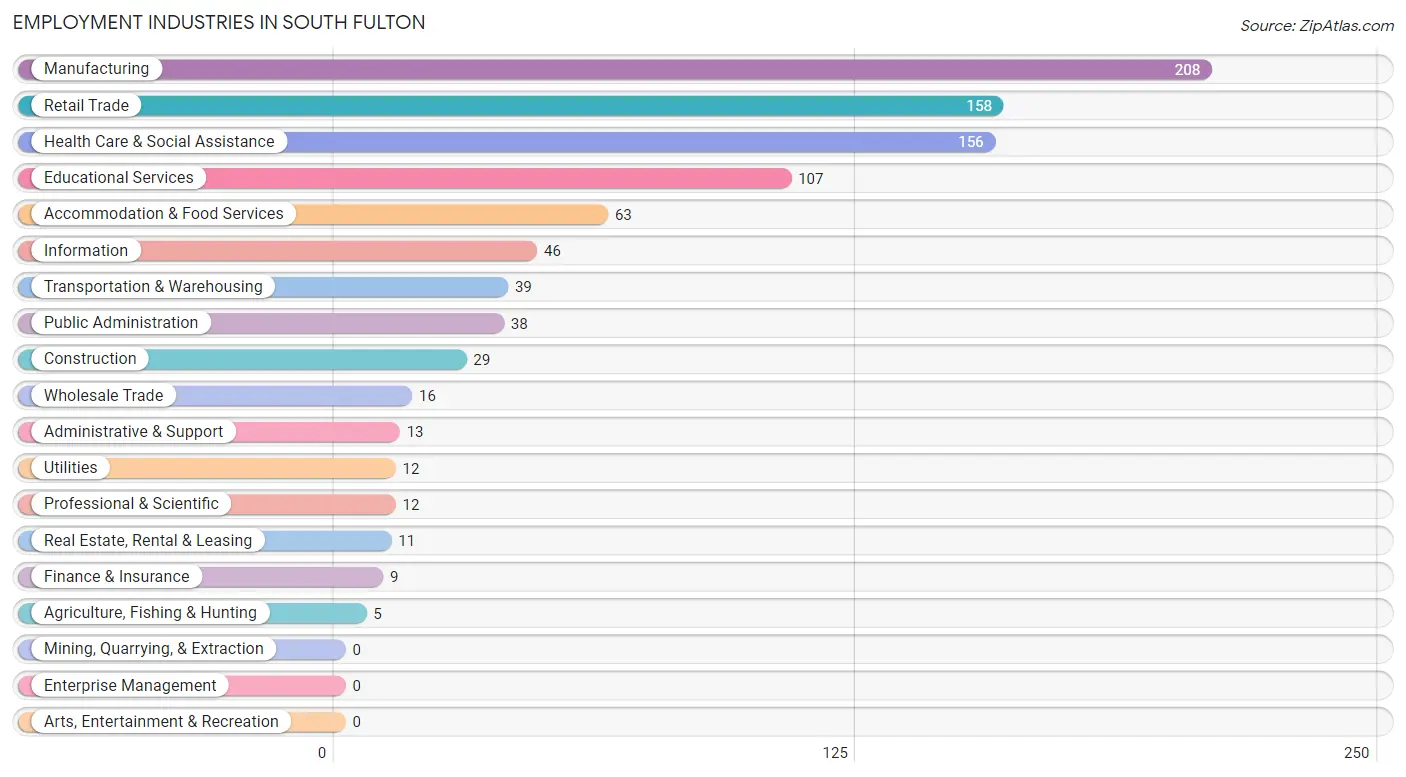
Employment Industries in South Fulton
The major employment industries in South Fulton include Manufacturing (208 | 22.0%), Retail Trade (158 | 16.7%), Health Care & Social Assistance (156 | 16.5%), Educational Services (107 | 11.3%), and Accommodation & Food Services (63 | 6.7%).
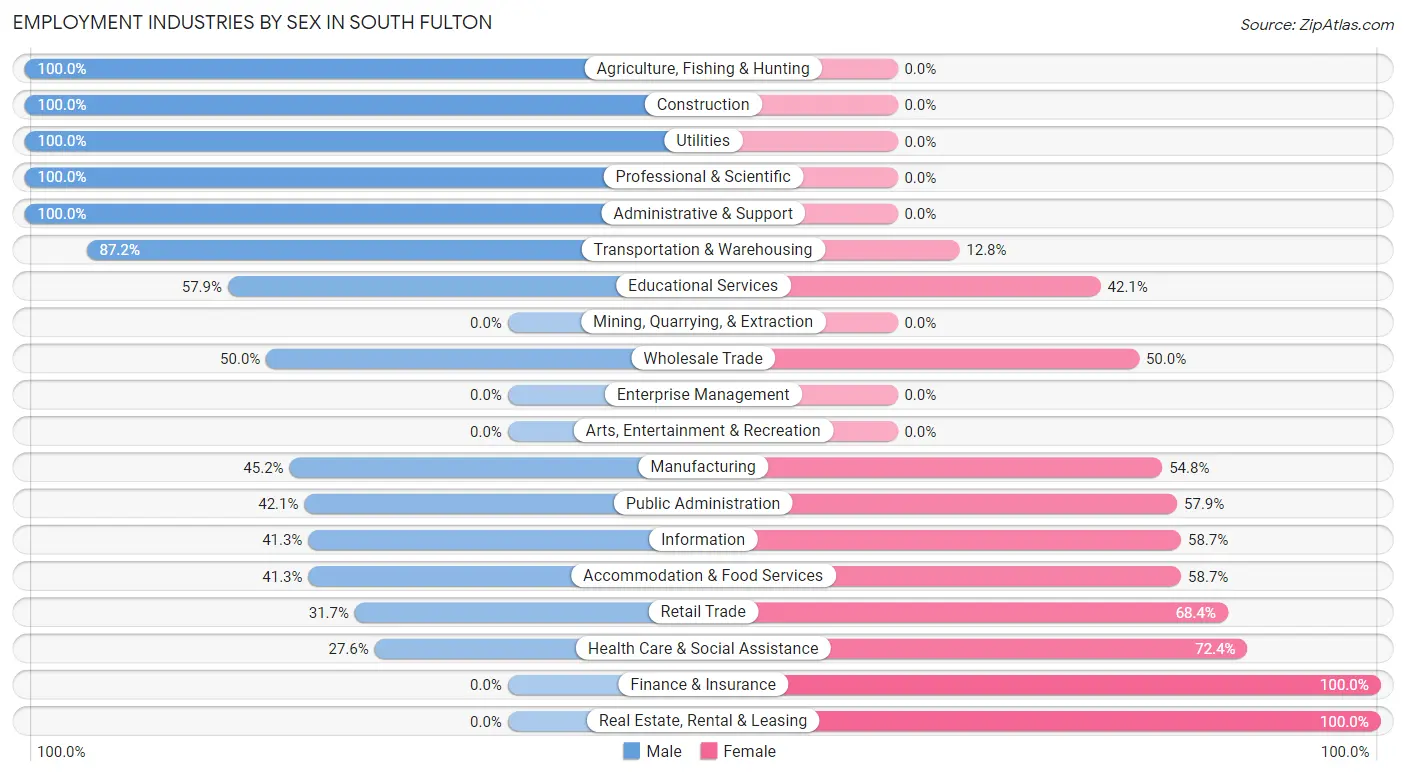
Employment Industries by Sex in South Fulton
The South Fulton industries that see more men than women are Agriculture, Fishing & Hunting (100.0%), Construction (100.0%), and Utilities (100.0%), whereas the industries that tend to have a higher number of women are Finance & Insurance (100.0%), Real Estate, Rental & Leasing (100.0%), and Health Care & Social Assistance (72.4%).
| Industry | Male | Female |
| Agriculture, Fishing & Hunting | 5 (100.0%) | 0 (0.0%) |
| Mining, Quarrying, & Extraction | 0 (0.0%) | 0 (0.0%) |
| Construction | 29 (100.0%) | 0 (0.0%) |
| Manufacturing | 94 (45.2%) | 114 (54.8%) |
| Wholesale Trade | 8 (50.0%) | 8 (50.0%) |
| Retail Trade | 50 (31.7%) | 108 (68.3%) |
| Transportation & Warehousing | 34 (87.2%) | 5 (12.8%) |
| Utilities | 12 (100.0%) | 0 (0.0%) |
| Information | 19 (41.3%) | 27 (58.7%) |
| Finance & Insurance | 0 (0.0%) | 9 (100.0%) |
| Real Estate, Rental & Leasing | 0 (0.0%) | 11 (100.0%) |
| Professional & Scientific | 12 (100.0%) | 0 (0.0%) |
| Enterprise Management | 0 (0.0%) | 0 (0.0%) |
| Administrative & Support | 13 (100.0%) | 0 (0.0%) |
| Educational Services | 62 (57.9%) | 45 (42.1%) |
| Health Care & Social Assistance | 43 (27.6%) | 113 (72.4%) |
| Arts, Entertainment & Recreation | 0 (0.0%) | 0 (0.0%) |
| Accommodation & Food Services | 26 (41.3%) | 37 (58.7%) |
| Public Administration | 16 (42.1%) | 22 (57.9%) |
| Total | 442 (46.7%) | 505 (53.3%) |
Education in South Fulton
School Enrollment in South Fulton
The most common levels of schooling among the 429 students in South Fulton are high school (138 | 32.2%), middle school (109 | 25.4%), and elementary school (97 | 22.6%).
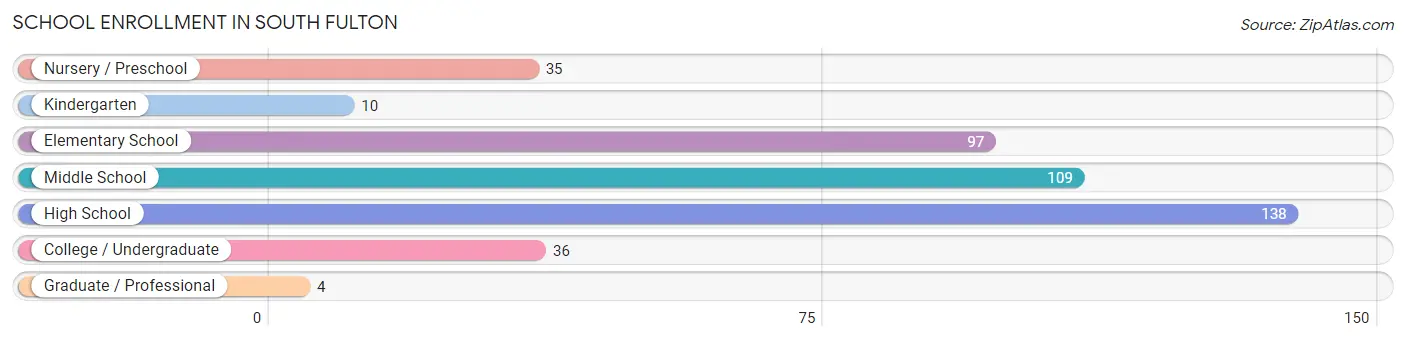
| School Level | # Students | % Students |
| Nursery / Preschool | 35 | 8.2% |
| Kindergarten | 10 | 2.3% |
| Elementary School | 97 | 22.6% |
| Middle School | 109 | 25.4% |
| High School | 138 | 32.2% |
| College / Undergraduate | 36 | 8.4% |
| Graduate / Professional | 4 | 0.9% |
| Total | 429 | 100.0% |
School Enrollment by Age by Funding Source in South Fulton
Out of a total of 429 students who are enrolled in schools in South Fulton, 73 (17.0%) attend a private institution, while the remaining 356 (83.0%) are enrolled in public schools. The age group of 35 years and over has the highest likelihood of being enrolled in private schools, with 4 (100.0% in the age bracket) enrolled. Conversely, the age group of 3 to 4 year olds has the lowest likelihood of being enrolled in a private school, with 3 (100.0% in the age bracket) attending a public institution.
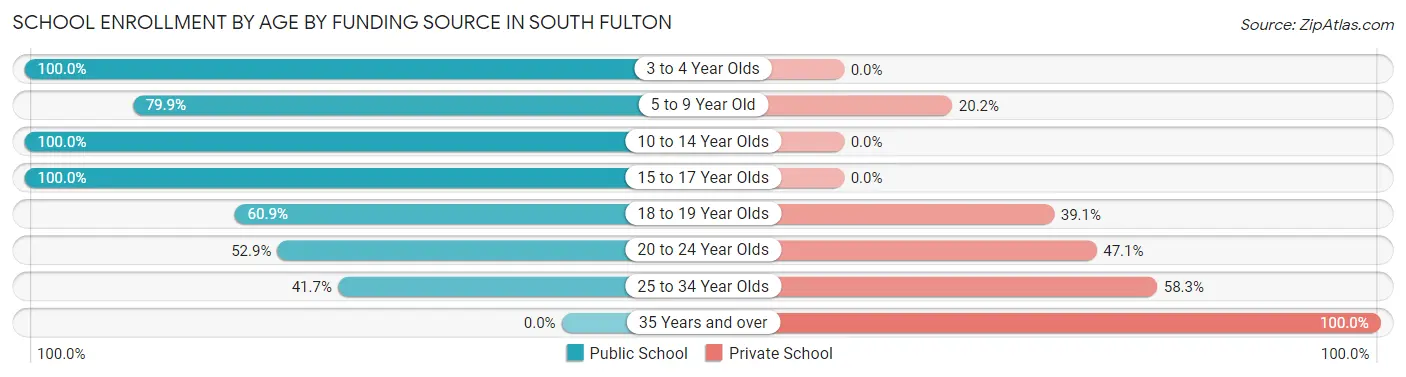
| Age Bracket | Public School | Private School |
| 3 to 4 Year Olds | 3 (100.0%) | 0 (0.0%) |
| 5 to 9 Year Old | 107 (79.8%) | 27 (20.2%) |
| 10 to 14 Year Olds | 124 (100.0%) | 0 (0.0%) |
| 15 to 17 Year Olds | 66 (100.0%) | 0 (0.0%) |
| 18 to 19 Year Olds | 42 (60.9%) | 27 (39.1%) |
| 20 to 24 Year Olds | 9 (52.9%) | 8 (47.1%) |
| 25 to 34 Year Olds | 5 (41.7%) | 7 (58.3%) |
| 35 Years and over | 0 (0.0%) | 4 (100.0%) |
| Total | 356 (83.0%) | 73 (17.0%) |
Educational Attainment by Field of Study in South Fulton
Education (86 | 25.4%), business (51 | 15.0%), bio, nature & agricultural (29 | 8.6%), psychology (28 | 8.3%), and visual & performing arts (27 | 8.0%) are the most common fields of study among 339 individuals in South Fulton who have obtained a bachelor's degree or higher.
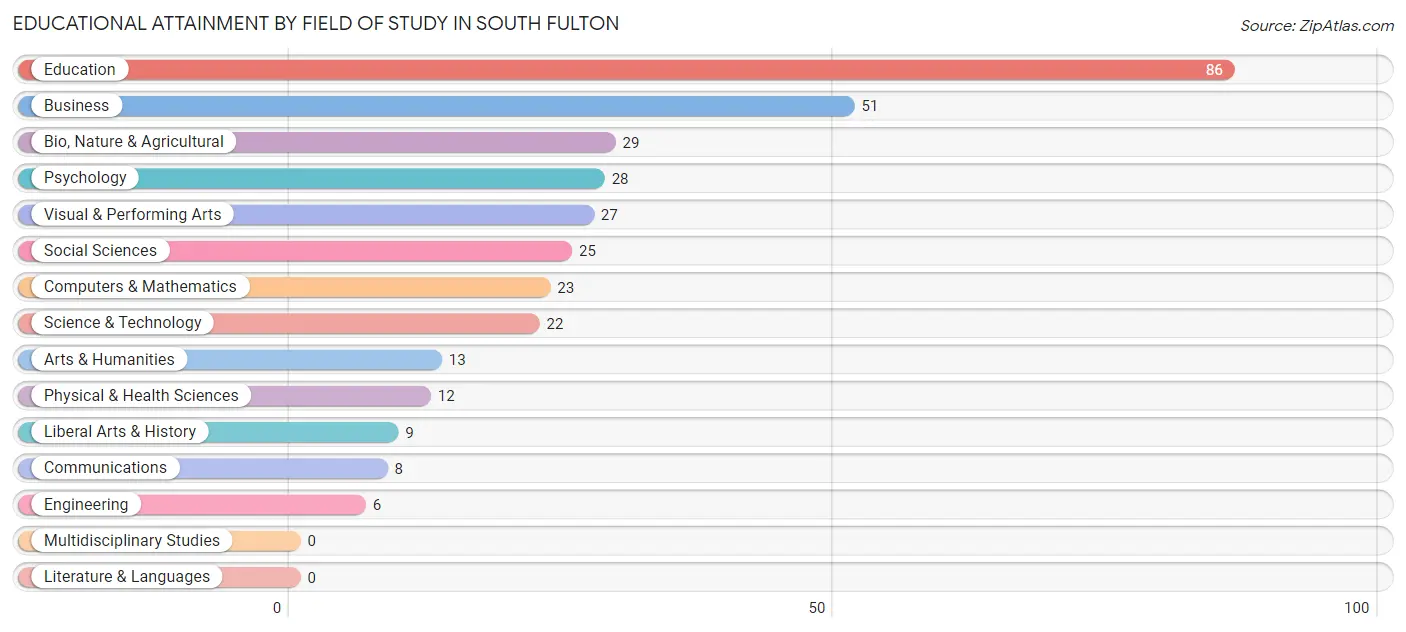
| Field of Study | # Graduates | % Graduates |
| Computers & Mathematics | 23 | 6.8% |
| Bio, Nature & Agricultural | 29 | 8.6% |
| Physical & Health Sciences | 12 | 3.5% |
| Psychology | 28 | 8.3% |
| Social Sciences | 25 | 7.4% |
| Engineering | 6 | 1.8% |
| Multidisciplinary Studies | 0 | 0.0% |
| Science & Technology | 22 | 6.5% |
| Business | 51 | 15.0% |
| Education | 86 | 25.4% |
| Literature & Languages | 0 | 0.0% |
| Liberal Arts & History | 9 | 2.6% |
| Visual & Performing Arts | 27 | 8.0% |
| Communications | 8 | 2.4% |
| Arts & Humanities | 13 | 3.8% |
| Total | 339 | 100.0% |
Transportation & Commute in South Fulton
Vehicle Availability by Sex in South Fulton
The most prevalent vehicle ownership categories in South Fulton are males with 2 vehicles (158, accounting for 34.5%) and females with 2 vehicles (175, making up 30.9%).
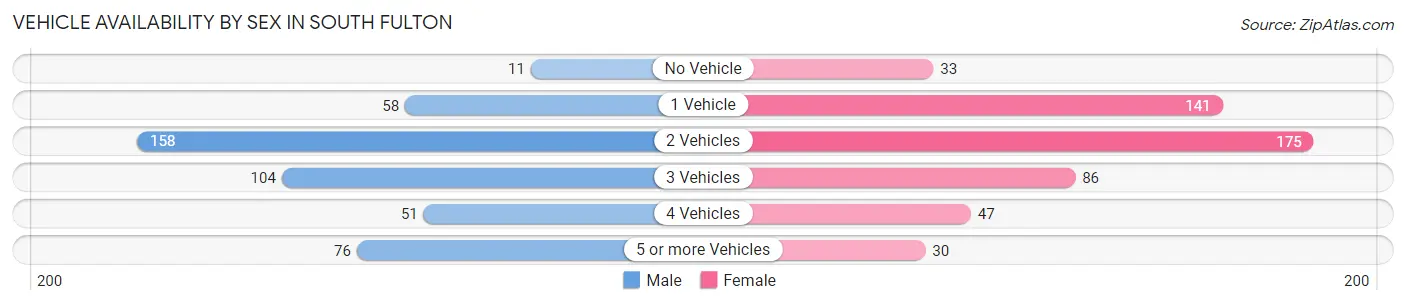
| Vehicles Available | Male | Female |
| No Vehicle | 11 (2.4%) | 33 (6.5%) |
| 1 Vehicle | 58 (12.7%) | 141 (27.5%) |
| 2 Vehicles | 158 (34.5%) | 175 (34.2%) |
| 3 Vehicles | 104 (22.7%) | 86 (16.8%) |
| 4 Vehicles | 51 (11.1%) | 47 (9.2%) |
| 5 or more Vehicles | 76 (16.6%) | 30 (5.9%) |
| Total | 458 (100.0%) | 512 (100.0%) |
Commute Time in South Fulton
The most frequently occuring commute durations in South Fulton are 15 to 19 minutes (280 commuters, 29.6%), 10 to 14 minutes (140 commuters, 14.8%), and 20 to 24 minutes (129 commuters, 13.6%).
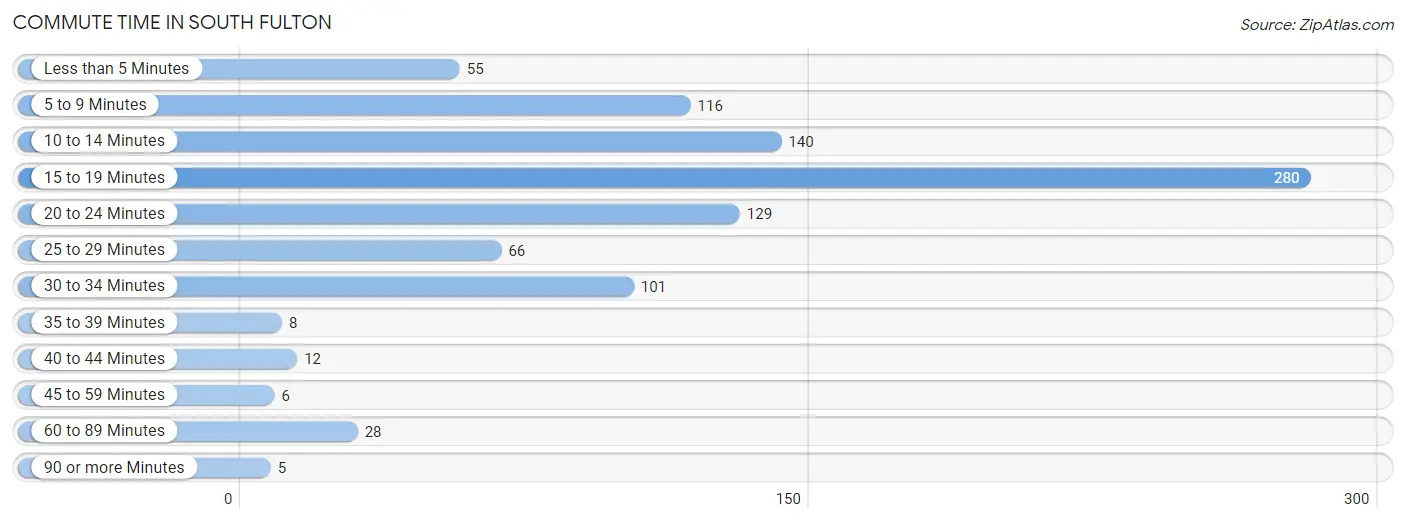
| Commute Time | # Commuters | % Commuters |
| Less than 5 Minutes | 55 | 5.8% |
| 5 to 9 Minutes | 116 | 12.3% |
| 10 to 14 Minutes | 140 | 14.8% |
| 15 to 19 Minutes | 280 | 29.6% |
| 20 to 24 Minutes | 129 | 13.6% |
| 25 to 29 Minutes | 66 | 7.0% |
| 30 to 34 Minutes | 101 | 10.7% |
| 35 to 39 Minutes | 8 | 0.9% |
| 40 to 44 Minutes | 12 | 1.3% |
| 45 to 59 Minutes | 6 | 0.6% |
| 60 to 89 Minutes | 28 | 3.0% |
| 90 or more Minutes | 5 | 0.5% |
Commute Time by Sex in South Fulton
The most common commute times in South Fulton are 15 to 19 minutes (147 commuters, 33.1%) for males and 15 to 19 minutes (133 commuters, 26.5%) for females.
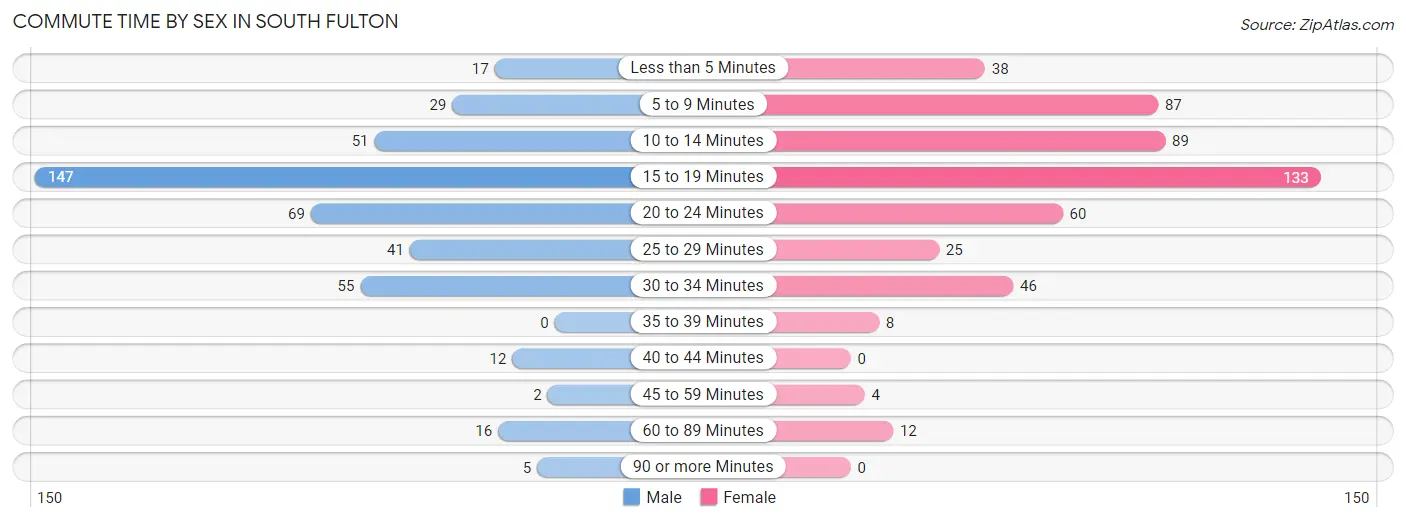
| Commute Time | Male | Female |
| Less than 5 Minutes | 17 (3.8%) | 38 (7.6%) |
| 5 to 9 Minutes | 29 (6.5%) | 87 (17.3%) |
| 10 to 14 Minutes | 51 (11.5%) | 89 (17.7%) |
| 15 to 19 Minutes | 147 (33.1%) | 133 (26.5%) |
| 20 to 24 Minutes | 69 (15.5%) | 60 (11.9%) |
| 25 to 29 Minutes | 41 (9.2%) | 25 (5.0%) |
| 30 to 34 Minutes | 55 (12.4%) | 46 (9.2%) |
| 35 to 39 Minutes | 0 (0.0%) | 8 (1.6%) |
| 40 to 44 Minutes | 12 (2.7%) | 0 (0.0%) |
| 45 to 59 Minutes | 2 (0.4%) | 4 (0.8%) |
| 60 to 89 Minutes | 16 (3.6%) | 12 (2.4%) |
| 90 or more Minutes | 5 (1.1%) | 0 (0.0%) |
Time of Departure to Work by Sex in South Fulton
The most frequent times of departure to work in South Fulton are 7:00 AM to 7:29 AM (90, 20.3%) for males and 12:00 PM to 3:59 PM (65, 13.0%) for females.
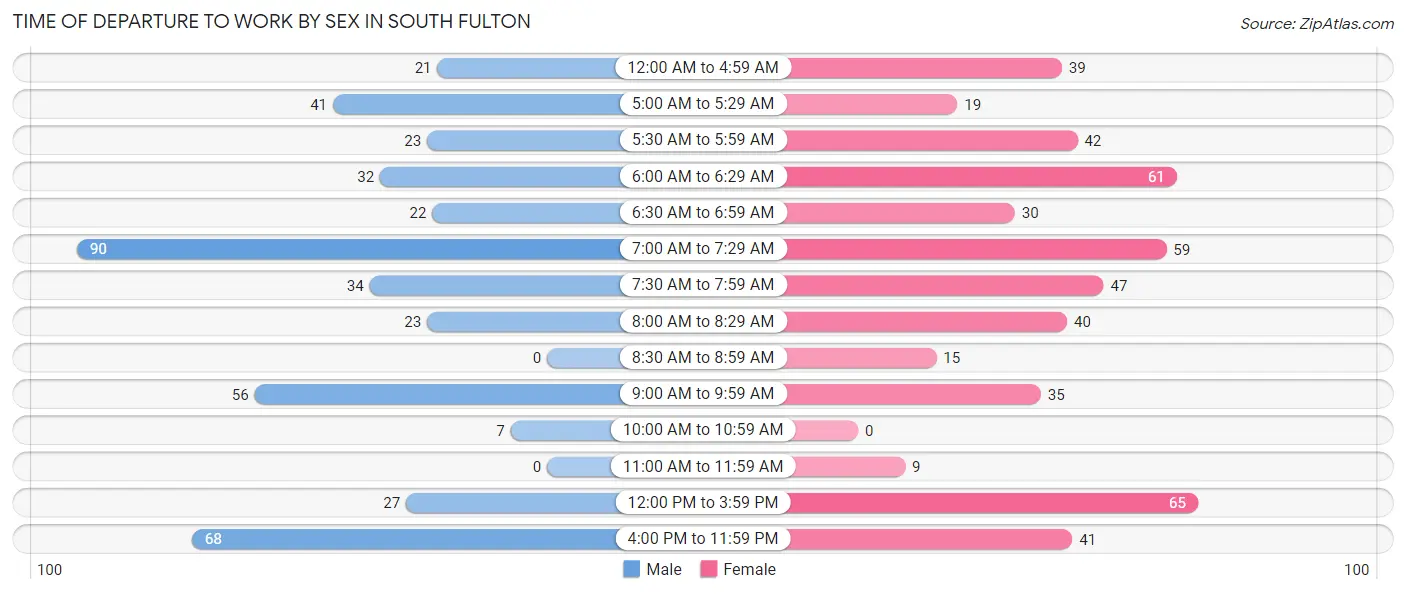
| Time of Departure | Male | Female |
| 12:00 AM to 4:59 AM | 21 (4.7%) | 39 (7.8%) |
| 5:00 AM to 5:29 AM | 41 (9.2%) | 19 (3.8%) |
| 5:30 AM to 5:59 AM | 23 (5.2%) | 42 (8.4%) |
| 6:00 AM to 6:29 AM | 32 (7.2%) | 61 (12.1%) |
| 6:30 AM to 6:59 AM | 22 (5.0%) | 30 (6.0%) |
| 7:00 AM to 7:29 AM | 90 (20.3%) | 59 (11.7%) |
| 7:30 AM to 7:59 AM | 34 (7.7%) | 47 (9.4%) |
| 8:00 AM to 8:29 AM | 23 (5.2%) | 40 (8.0%) |
| 8:30 AM to 8:59 AM | 0 (0.0%) | 15 (3.0%) |
| 9:00 AM to 9:59 AM | 56 (12.6%) | 35 (7.0%) |
| 10:00 AM to 10:59 AM | 7 (1.6%) | 0 (0.0%) |
| 11:00 AM to 11:59 AM | 0 (0.0%) | 9 (1.8%) |
| 12:00 PM to 3:59 PM | 27 (6.1%) | 65 (13.0%) |
| 4:00 PM to 11:59 PM | 68 (15.3%) | 41 (8.2%) |
| Total | 444 (100.0%) | 502 (100.0%) |
Housing Occupancy in South Fulton
Occupancy by Ownership in South Fulton
Of the total 965 dwellings in South Fulton, owner-occupied units account for 493 (51.1%), while renter-occupied units make up 472 (48.9%).
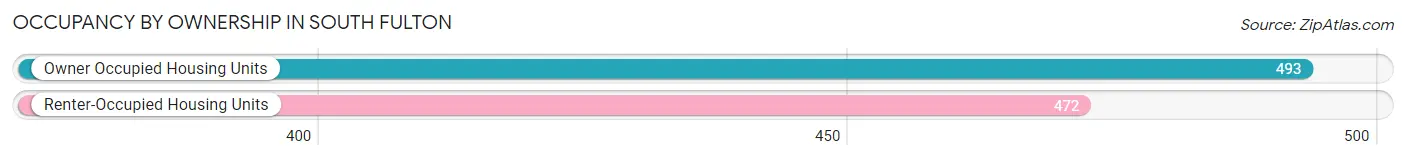
| Occupancy | # Housing Units | % Housing Units |
| Owner Occupied Housing Units | 493 | 51.1% |
| Renter-Occupied Housing Units | 472 | 48.9% |
| Total Occupied Housing Units | 965 | 100.0% |
Occupancy by Household Size in South Fulton
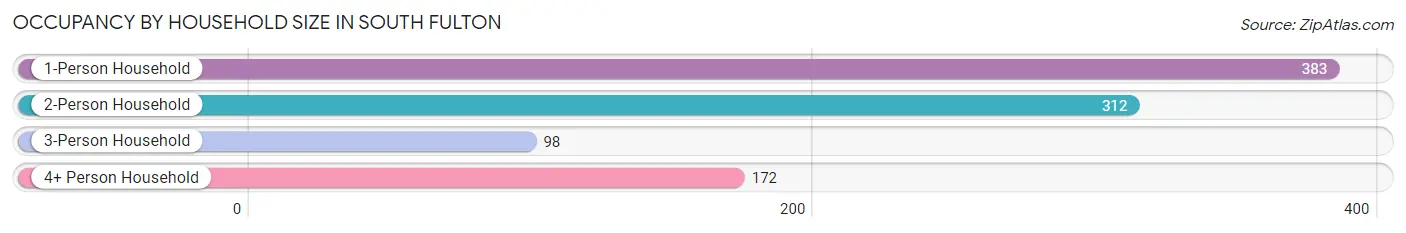
| Household Size | # Housing Units | % Housing Units |
| 1-Person Household | 383 | 39.7% |
| 2-Person Household | 312 | 32.3% |
| 3-Person Household | 98 | 10.2% |
| 4+ Person Household | 172 | 17.8% |
| Total Housing Units | 965 | 100.0% |
Occupancy by Ownership by Household Size in South Fulton
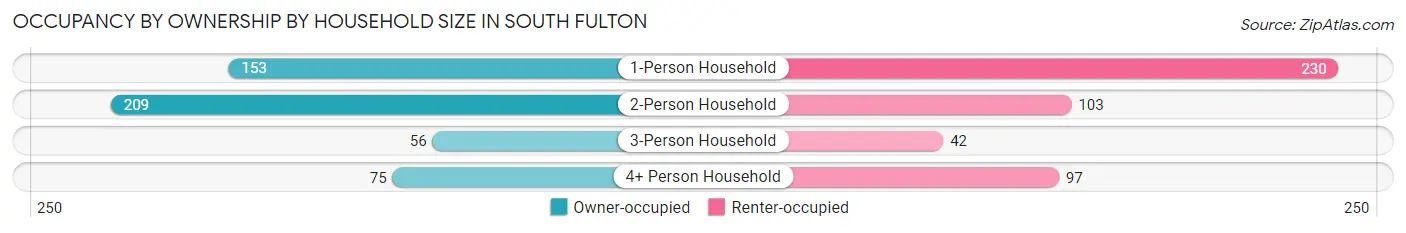
| Household Size | Owner-occupied | Renter-occupied |
| 1-Person Household | 153 (40.0%) | 230 (60.1%) |
| 2-Person Household | 209 (67.0%) | 103 (33.0%) |
| 3-Person Household | 56 (57.1%) | 42 (42.9%) |
| 4+ Person Household | 75 (43.6%) | 97 (56.4%) |
| Total Housing Units | 493 (51.1%) | 472 (48.9%) |
Occupancy by Educational Attainment in South Fulton
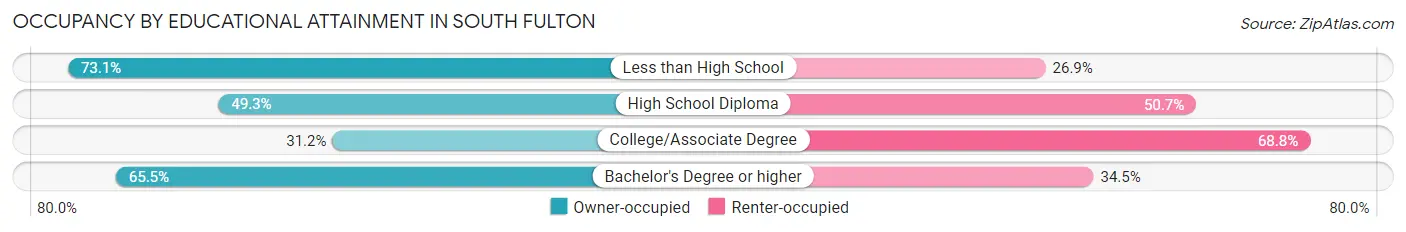
| Household Size | Owner-occupied | Renter-occupied |
| Less than High School | 68 (73.1%) | 25 (26.9%) |
| High School Diploma | 200 (49.3%) | 206 (50.7%) |
| College/Associate Degree | 73 (31.2%) | 161 (68.8%) |
| Bachelor's Degree or higher | 152 (65.5%) | 80 (34.5%) |
Occupancy by Age of Householder in South Fulton
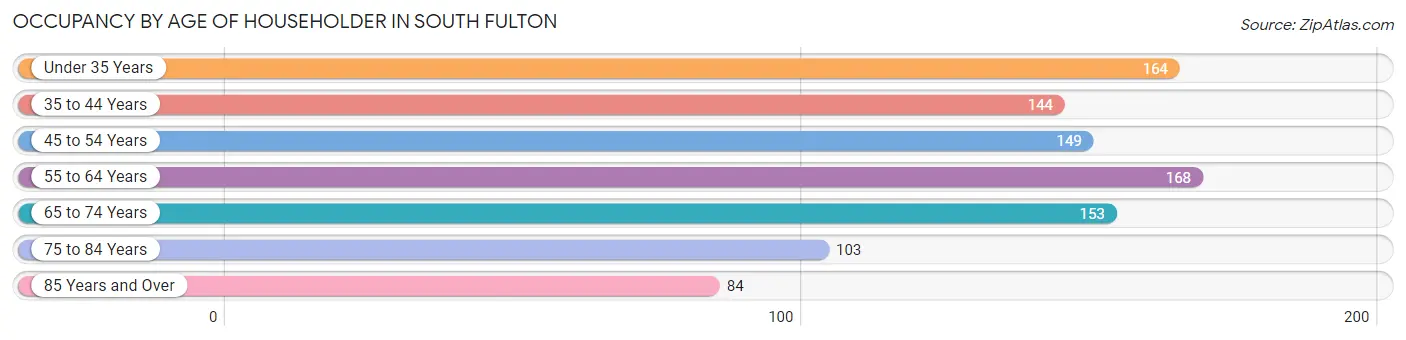
| Age Bracket | # Households | % Households |
| Under 35 Years | 164 | 17.0% |
| 35 to 44 Years | 144 | 14.9% |
| 45 to 54 Years | 149 | 15.4% |
| 55 to 64 Years | 168 | 17.4% |
| 65 to 74 Years | 153 | 15.9% |
| 75 to 84 Years | 103 | 10.7% |
| 85 Years and Over | 84 | 8.7% |
| Total | 965 | 100.0% |
Housing Finances in South Fulton
Median Income by Occupancy in South Fulton
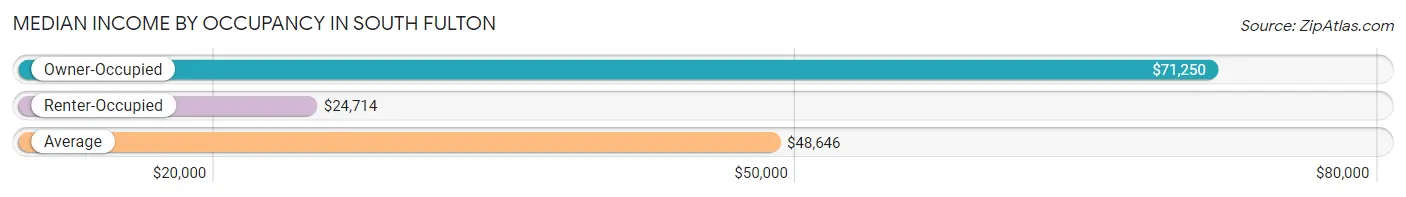
| Occupancy Type | # Households | Median Income |
| Owner-Occupied | 493 (51.1%) | $71,250 |
| Renter-Occupied | 472 (48.9%) | $24,714 |
| Average | 965 (100.0%) | $48,646 |
Occupancy by Householder Income Bracket in South Fulton
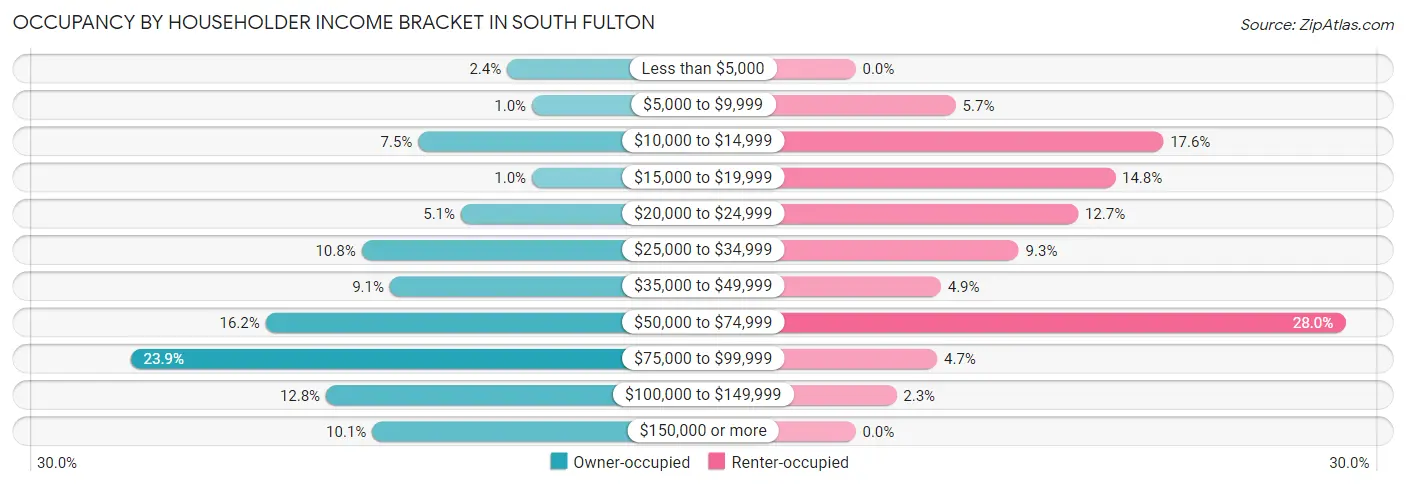
| Income Bracket | Owner-occupied | Renter-occupied |
| Less than $5,000 | 12 (2.4%) | 0 (0.0%) |
| $5,000 to $9,999 | 5 (1.0%) | 27 (5.7%) |
| $10,000 to $14,999 | 37 (7.5%) | 83 (17.6%) |
| $15,000 to $19,999 | 5 (1.0%) | 70 (14.8%) |
| $20,000 to $24,999 | 25 (5.1%) | 60 (12.7%) |
| $25,000 to $34,999 | 53 (10.7%) | 44 (9.3%) |
| $35,000 to $49,999 | 45 (9.1%) | 23 (4.9%) |
| $50,000 to $74,999 | 80 (16.2%) | 132 (28.0%) |
| $75,000 to $99,999 | 118 (23.9%) | 22 (4.7%) |
| $100,000 to $149,999 | 63 (12.8%) | 11 (2.3%) |
| $150,000 or more | 50 (10.1%) | 0 (0.0%) |
| Total | 493 (100.0%) | 472 (100.0%) |
Monthly Housing Cost Tiers in South Fulton
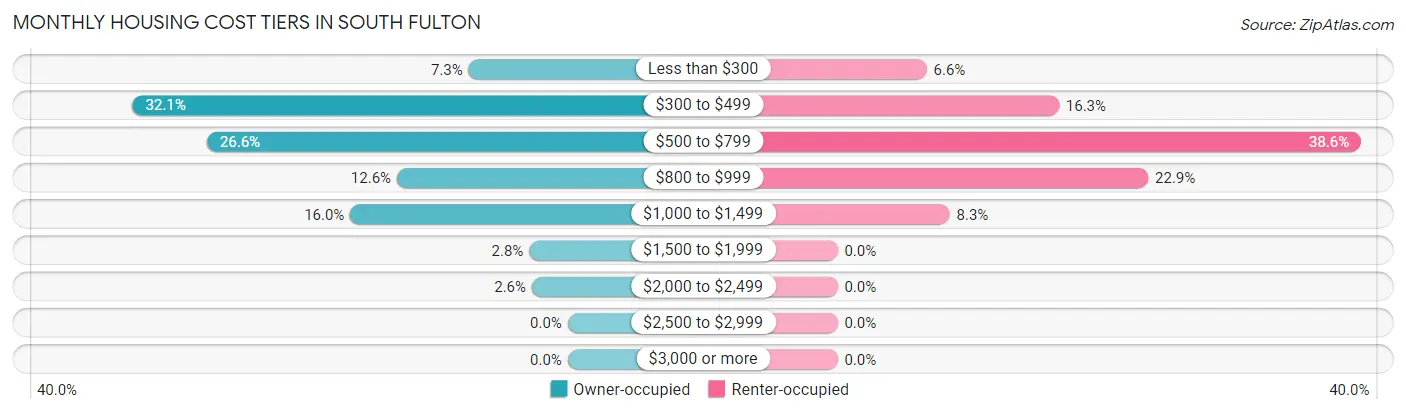
| Monthly Cost | Owner-occupied | Renter-occupied |
| Less than $300 | 36 (7.3%) | 31 (6.6%) |
| $300 to $499 | 158 (32.1%) | 77 (16.3%) |
| $500 to $799 | 131 (26.6%) | 182 (38.6%) |
| $800 to $999 | 62 (12.6%) | 108 (22.9%) |
| $1,000 to $1,499 | 79 (16.0%) | 39 (8.3%) |
| $1,500 to $1,999 | 14 (2.8%) | 0 (0.0%) |
| $2,000 to $2,499 | 13 (2.6%) | 0 (0.0%) |
| $2,500 to $2,999 | 0 (0.0%) | 0 (0.0%) |
| $3,000 or more | 0 (0.0%) | 0 (0.0%) |
| Total | 493 (100.0%) | 472 (100.0%) |
Physical Housing Characteristics in South Fulton
Housing Structures in South Fulton
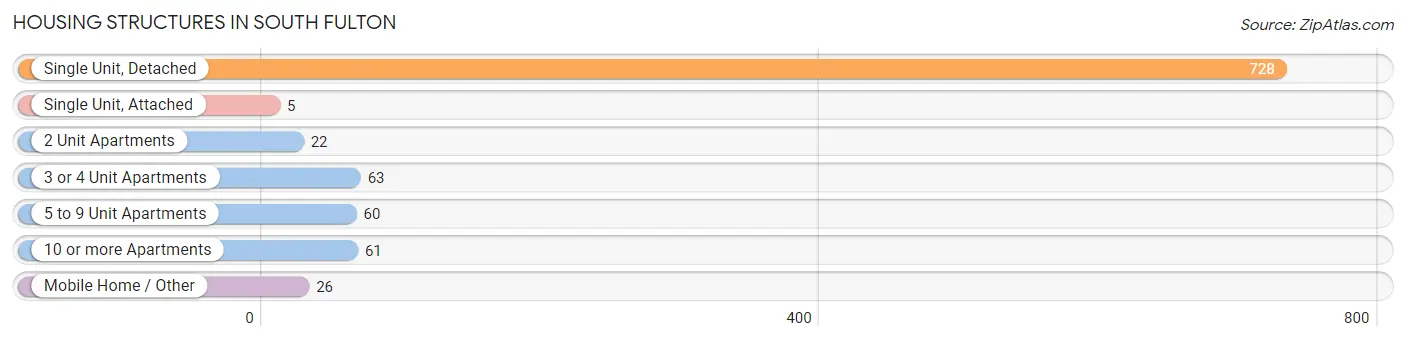
| Structure Type | # Housing Units | % Housing Units |
| Single Unit, Detached | 728 | 75.4% |
| Single Unit, Attached | 5 | 0.5% |
| 2 Unit Apartments | 22 | 2.3% |
| 3 or 4 Unit Apartments | 63 | 6.5% |
| 5 to 9 Unit Apartments | 60 | 6.2% |
| 10 or more Apartments | 61 | 6.3% |
| Mobile Home / Other | 26 | 2.7% |
| Total | 965 | 100.0% |
Housing Structures by Occupancy in South Fulton
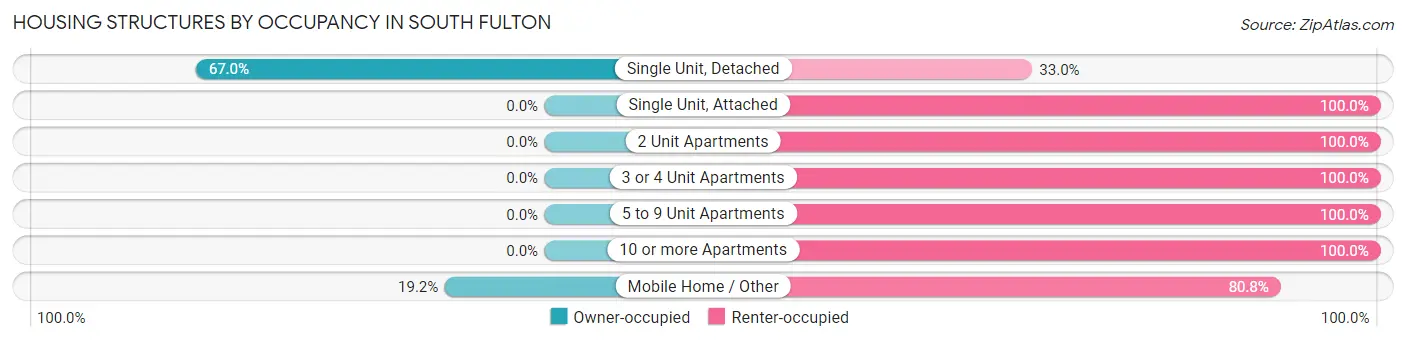
| Structure Type | Owner-occupied | Renter-occupied |
| Single Unit, Detached | 488 (67.0%) | 240 (33.0%) |
| Single Unit, Attached | 0 (0.0%) | 5 (100.0%) |
| 2 Unit Apartments | 0 (0.0%) | 22 (100.0%) |
| 3 or 4 Unit Apartments | 0 (0.0%) | 63 (100.0%) |
| 5 to 9 Unit Apartments | 0 (0.0%) | 60 (100.0%) |
| 10 or more Apartments | 0 (0.0%) | 61 (100.0%) |
| Mobile Home / Other | 5 (19.2%) | 21 (80.8%) |
| Total | 493 (51.1%) | 472 (48.9%) |
Housing Structures by Number of Rooms in South Fulton
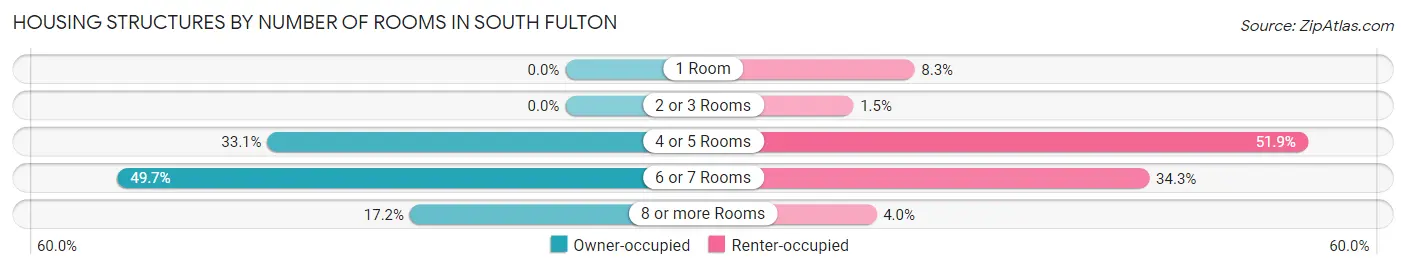
| Number of Rooms | Owner-occupied | Renter-occupied |
| 1 Room | 0 (0.0%) | 39 (8.3%) |
| 2 or 3 Rooms | 0 (0.0%) | 7 (1.5%) |
| 4 or 5 Rooms | 163 (33.1%) | 245 (51.9%) |
| 6 or 7 Rooms | 245 (49.7%) | 162 (34.3%) |
| 8 or more Rooms | 85 (17.2%) | 19 (4.0%) |
| Total | 493 (100.0%) | 472 (100.0%) |
Housing Structure by Heating Type in South Fulton
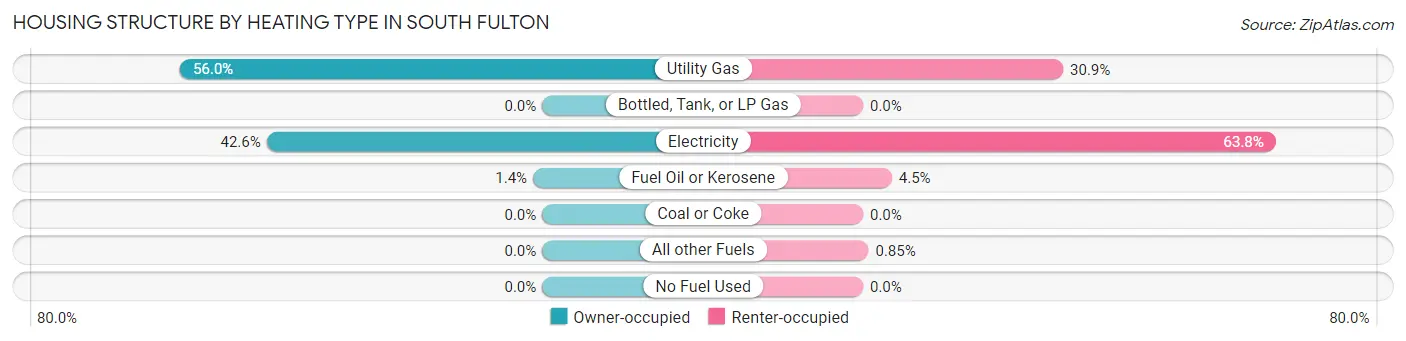
| Heating Type | Owner-occupied | Renter-occupied |
| Utility Gas | 276 (56.0%) | 146 (30.9%) |
| Bottled, Tank, or LP Gas | 0 (0.0%) | 0 (0.0%) |
| Electricity | 210 (42.6%) | 301 (63.8%) |
| Fuel Oil or Kerosene | 7 (1.4%) | 21 (4.4%) |
| Coal or Coke | 0 (0.0%) | 0 (0.0%) |
| All other Fuels | 0 (0.0%) | 4 (0.9%) |
| No Fuel Used | 0 (0.0%) | 0 (0.0%) |
| Total | 493 (100.0%) | 472 (100.0%) |
Household Vehicle Usage in South Fulton
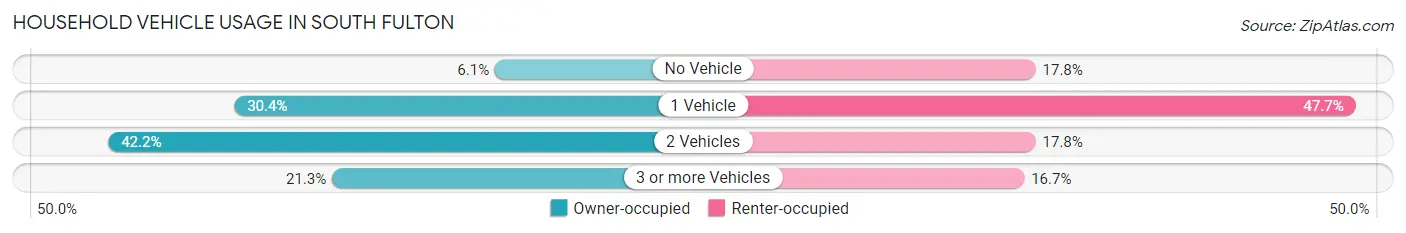
| Vehicles per Household | Owner-occupied | Renter-occupied |
| No Vehicle | 30 (6.1%) | 84 (17.8%) |
| 1 Vehicle | 150 (30.4%) | 225 (47.7%) |
| 2 Vehicles | 208 (42.2%) | 84 (17.8%) |
| 3 or more Vehicles | 105 (21.3%) | 79 (16.7%) |
| Total | 493 (100.0%) | 472 (100.0%) |
Real Estate & Mortgages in South Fulton
Real Estate and Mortgage Overview in South Fulton
| Characteristic | Without Mortgage | With Mortgage |
| Housing Units | 274 | 219 |
| Median Property Value | $75,800 | $113,400 |
| Median Household Income | $39,167 | $41 |
| Monthly Housing Costs | $424 | $0 |
| Real Estate Taxes | $538 | $10 |
Property Value by Mortgage Status in South Fulton
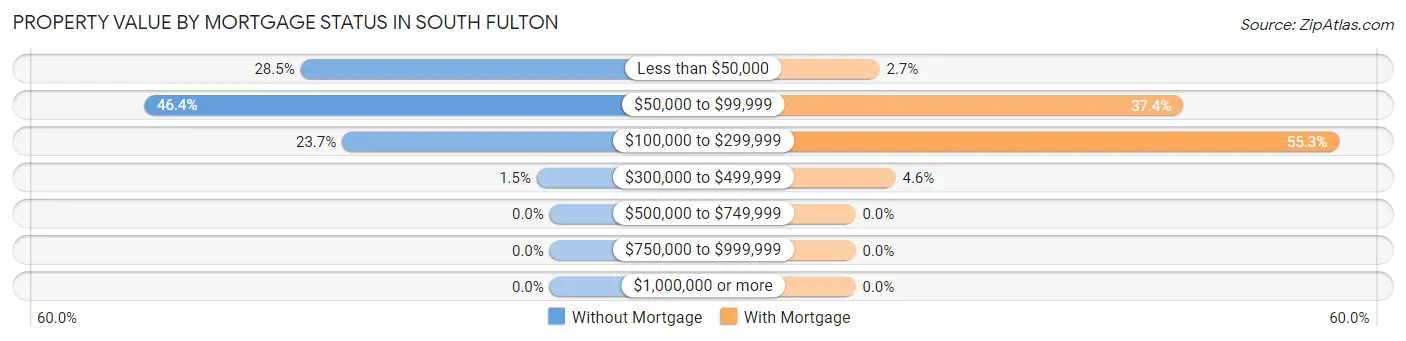
| Property Value | Without Mortgage | With Mortgage |
| Less than $50,000 | 78 (28.5%) | 6 (2.7%) |
| $50,000 to $99,999 | 127 (46.4%) | 82 (37.4%) |
| $100,000 to $299,999 | 65 (23.7%) | 121 (55.2%) |
| $300,000 to $499,999 | 4 (1.5%) | 10 (4.6%) |
| $500,000 to $749,999 | 0 (0.0%) | 0 (0.0%) |
| $750,000 to $999,999 | 0 (0.0%) | 0 (0.0%) |
| $1,000,000 or more | 0 (0.0%) | 0 (0.0%) |
| Total | 274 (100.0%) | 219 (100.0%) |
Household Income by Mortgage Status in South Fulton
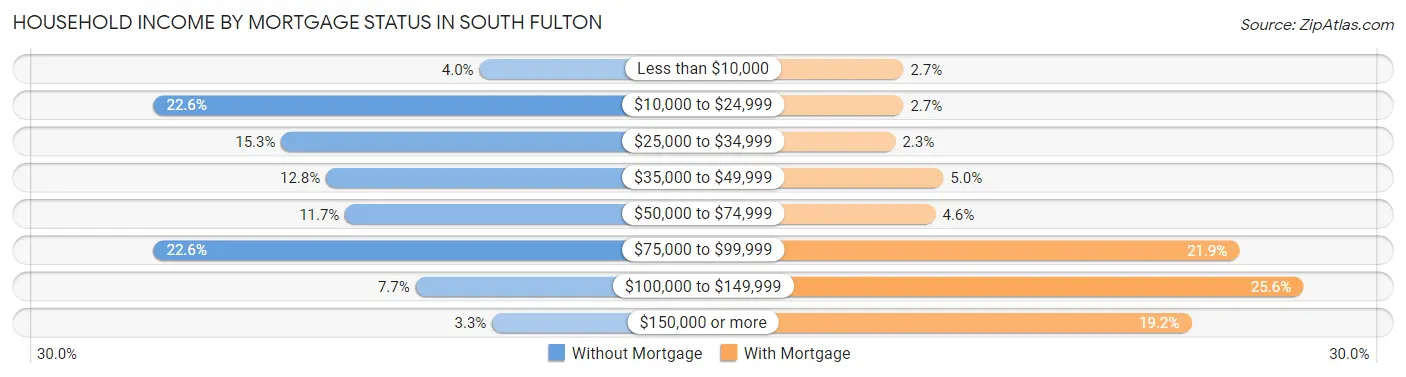
| Household Income | Without Mortgage | With Mortgage |
| Less than $10,000 | 11 (4.0%) | 6 (2.7%) |
| $10,000 to $24,999 | 62 (22.6%) | 6 (2.7%) |
| $25,000 to $34,999 | 42 (15.3%) | 5 (2.3%) |
| $35,000 to $49,999 | 35 (12.8%) | 11 (5.0%) |
| $50,000 to $74,999 | 32 (11.7%) | 10 (4.6%) |
| $75,000 to $99,999 | 62 (22.6%) | 48 (21.9%) |
| $100,000 to $149,999 | 21 (7.7%) | 56 (25.6%) |
| $150,000 or more | 9 (3.3%) | 42 (19.2%) |
| Total | 274 (100.0%) | 219 (100.0%) |
Property Value to Household Income Ratio in South Fulton
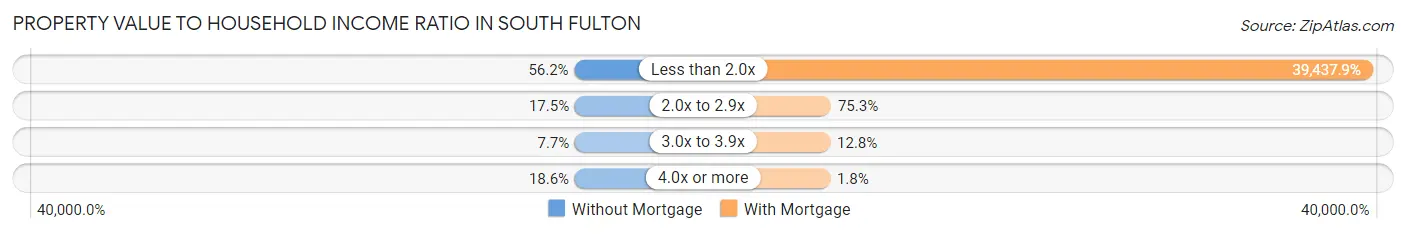
| Value-to-Income Ratio | Without Mortgage | With Mortgage |
| Less than 2.0x | 154 (56.2%) | 86,369 (39,437.9%) |
| 2.0x to 2.9x | 48 (17.5%) | 165 (75.3%) |
| 3.0x to 3.9x | 21 (7.7%) | 28 (12.8%) |
| 4.0x or more | 51 (18.6%) | 4 (1.8%) |
| Total | 274 (100.0%) | 219 (100.0%) |
Real Estate Taxes by Mortgage Status in South Fulton
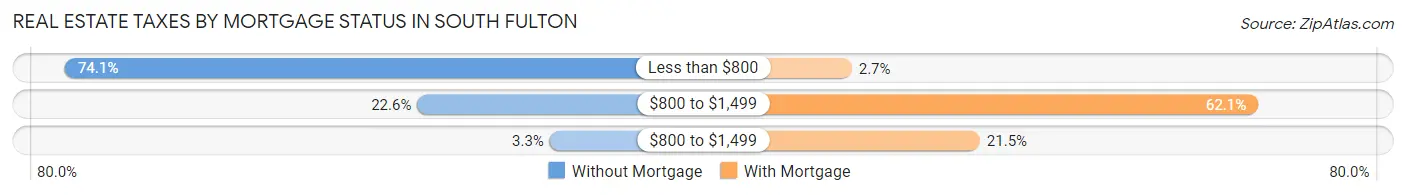
| Property Taxes | Without Mortgage | With Mortgage |
| Less than $800 | 203 (74.1%) | 6 (2.7%) |
| $800 to $1,499 | 62 (22.6%) | 136 (62.1%) |
| $800 to $1,499 | 9 (3.3%) | 47 (21.5%) |
| Total | 274 (100.0%) | 219 (100.0%) |
Health & Disability in South Fulton
Health Insurance Coverage by Age in South Fulton
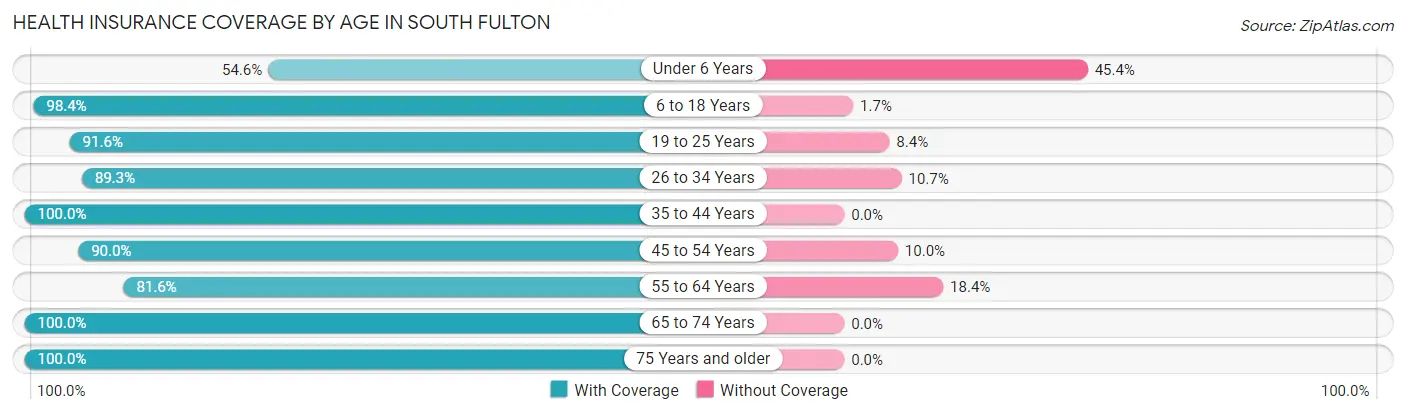
| Age Bracket | With Coverage | Without Coverage |
| Under 6 Years | 166 (54.6%) | 138 (45.4%) |
| 6 to 18 Years | 357 (98.4%) | 6 (1.7%) |
| 19 to 25 Years | 207 (91.6%) | 19 (8.4%) |
| 26 to 34 Years | 159 (89.3%) | 19 (10.7%) |
| 35 to 44 Years | 201 (100.0%) | 0 (0.0%) |
| 45 to 54 Years | 252 (90.0%) | 28 (10.0%) |
| 55 to 64 Years | 199 (81.6%) | 45 (18.4%) |
| 65 to 74 Years | 246 (100.0%) | 0 (0.0%) |
| 75 Years and older | 218 (100.0%) | 0 (0.0%) |
| Total | 2,005 (88.7%) | 255 (11.3%) |
Health Insurance Coverage by Citizenship Status in South Fulton
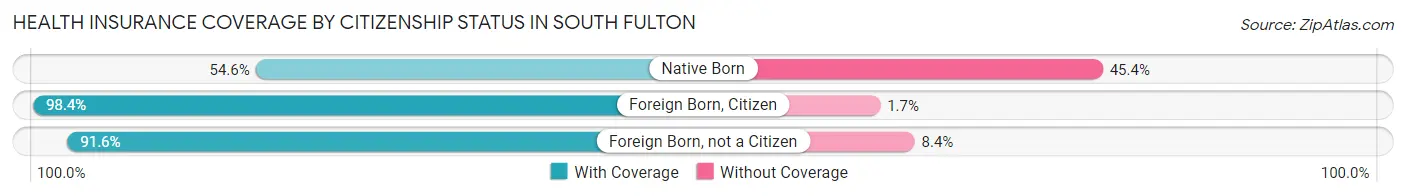
| Citizenship Status | With Coverage | Without Coverage |
| Native Born | 166 (54.6%) | 138 (45.4%) |
| Foreign Born, Citizen | 357 (98.4%) | 6 (1.7%) |
| Foreign Born, not a Citizen | 207 (91.6%) | 19 (8.4%) |
Health Insurance Coverage by Household Income in South Fulton
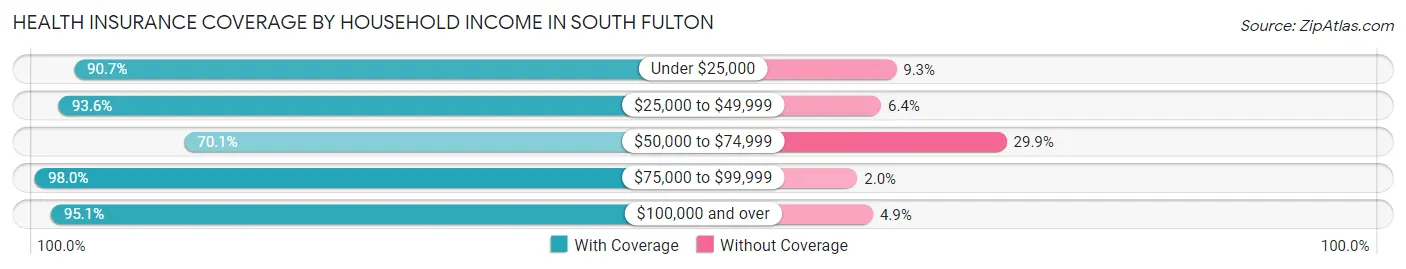
| Household Income | With Coverage | Without Coverage |
| Under $25,000 | 548 (90.7%) | 56 (9.3%) |
| $25,000 to $49,999 | 349 (93.6%) | 24 (6.4%) |
| $50,000 to $74,999 | 344 (70.1%) | 147 (29.9%) |
| $75,000 to $99,999 | 348 (98.0%) | 7 (2.0%) |
| $100,000 and over | 407 (95.1%) | 21 (4.9%) |
Public vs Private Health Insurance Coverage by Age in South Fulton
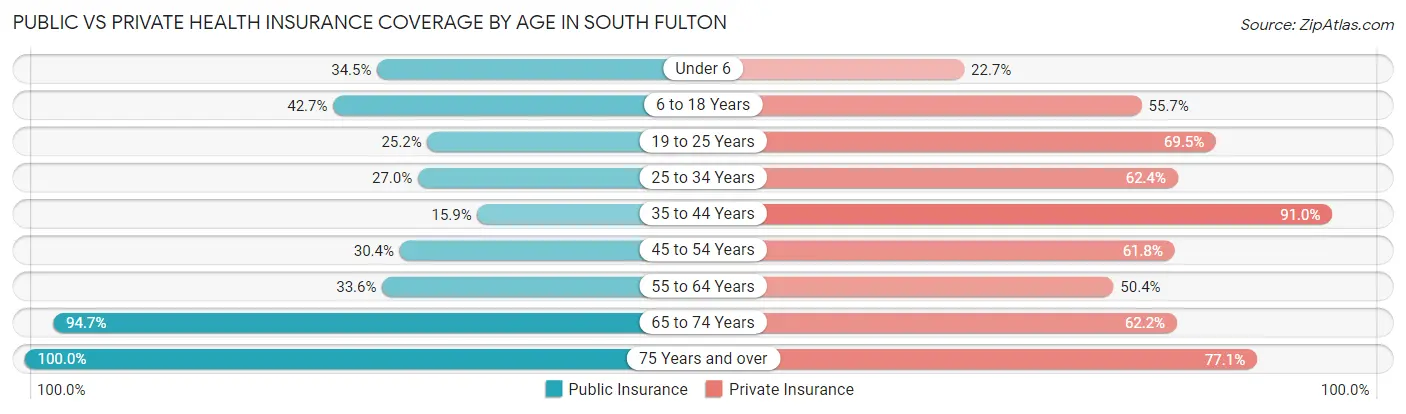
| Age Bracket | Public Insurance | Private Insurance |
| Under 6 | 105 (34.5%) | 69 (22.7%) |
| 6 to 18 Years | 155 (42.7%) | 202 (55.6%) |
| 19 to 25 Years | 57 (25.2%) | 157 (69.5%) |
| 25 to 34 Years | 48 (27.0%) | 111 (62.4%) |
| 35 to 44 Years | 32 (15.9%) | 183 (91.0%) |
| 45 to 54 Years | 85 (30.4%) | 173 (61.8%) |
| 55 to 64 Years | 82 (33.6%) | 123 (50.4%) |
| 65 to 74 Years | 233 (94.7%) | 153 (62.2%) |
| 75 Years and over | 218 (100.0%) | 168 (77.1%) |
| Total | 1,015 (44.9%) | 1,339 (59.3%) |
Disability Status by Sex by Age in South Fulton
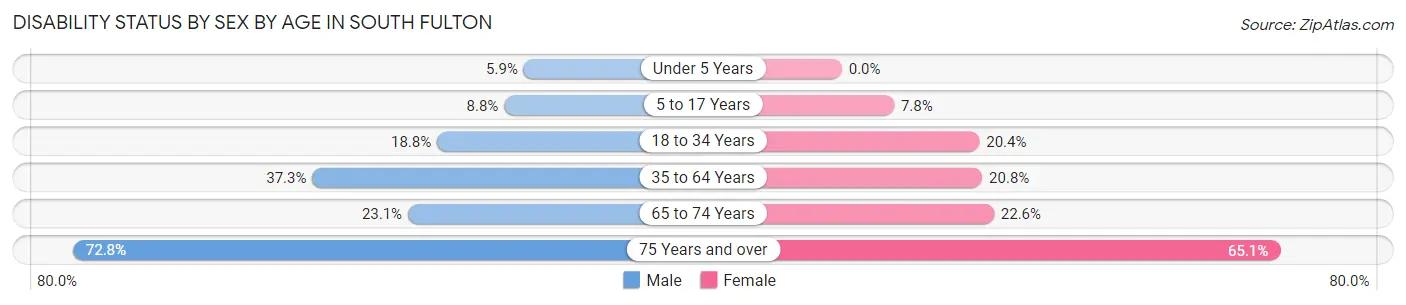
| Age Bracket | Male | Female |
| Under 5 Years | 4 (5.9%) | 0 (0.0%) |
| 5 to 17 Years | 16 (8.8%) | 11 (7.7%) |
| 18 to 34 Years | 45 (18.8%) | 49 (20.4%) |
| 35 to 64 Years | 129 (37.3%) | 79 (20.8%) |
| 65 to 74 Years | 21 (23.1%) | 35 (22.6%) |
| 75 Years and over | 67 (72.8%) | 82 (65.1%) |
Disability Class by Sex by Age in South Fulton
Disability Class: Hearing Difficulty
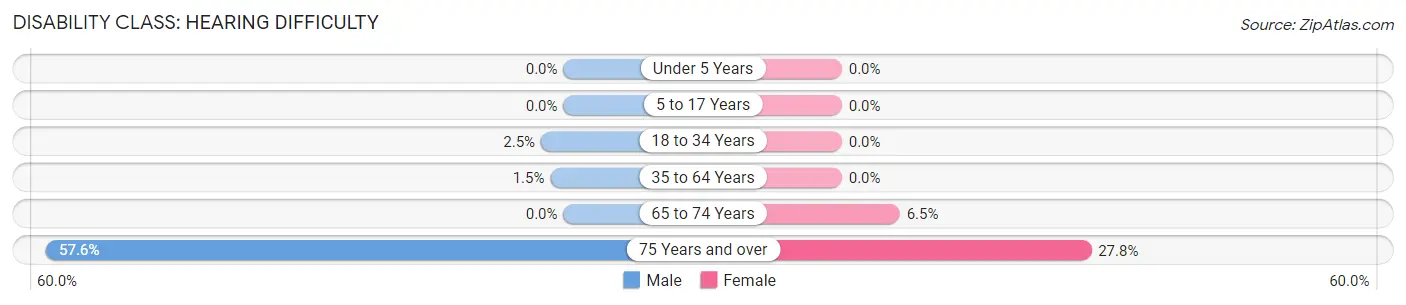
| Age Bracket | Male | Female |
| Under 5 Years | 0 (0.0%) | 0 (0.0%) |
| 5 to 17 Years | 0 (0.0%) | 0 (0.0%) |
| 18 to 34 Years | 6 (2.5%) | 0 (0.0%) |
| 35 to 64 Years | 5 (1.5%) | 0 (0.0%) |
| 65 to 74 Years | 0 (0.0%) | 10 (6.5%) |
| 75 Years and over | 53 (57.6%) | 35 (27.8%) |
Disability Class: Vision Difficulty
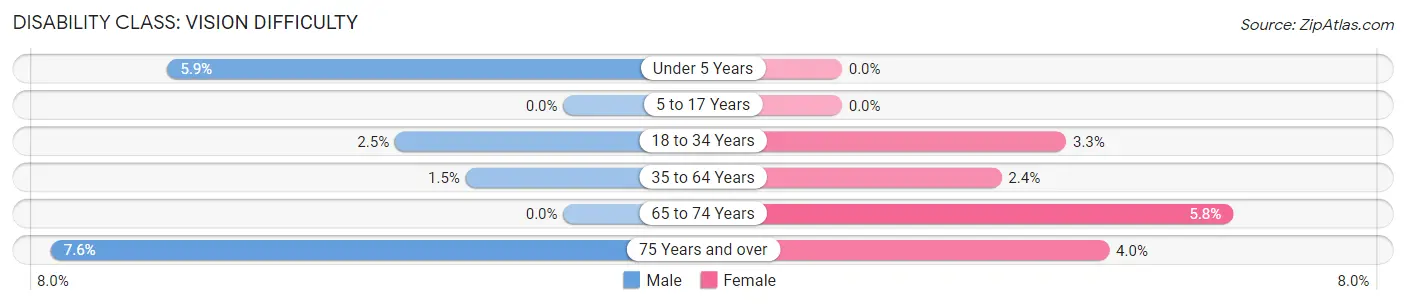
| Age Bracket | Male | Female |
| Under 5 Years | 4 (5.9%) | 0 (0.0%) |
| 5 to 17 Years | 0 (0.0%) | 0 (0.0%) |
| 18 to 34 Years | 6 (2.5%) | 8 (3.3%) |
| 35 to 64 Years | 5 (1.5%) | 9 (2.4%) |
| 65 to 74 Years | 0 (0.0%) | 9 (5.8%) |
| 75 Years and over | 7 (7.6%) | 5 (4.0%) |
Disability Class: Cognitive Difficulty
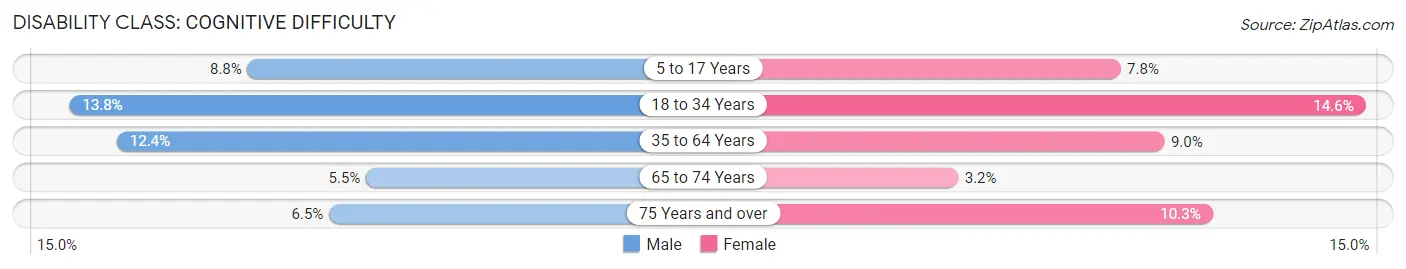
| Age Bracket | Male | Female |
| 5 to 17 Years | 16 (8.8%) | 11 (7.7%) |
| 18 to 34 Years | 33 (13.8%) | 35 (14.6%) |
| 35 to 64 Years | 43 (12.4%) | 34 (9.0%) |
| 65 to 74 Years | 5 (5.5%) | 5 (3.2%) |
| 75 Years and over | 6 (6.5%) | 13 (10.3%) |
Disability Class: Ambulatory Difficulty
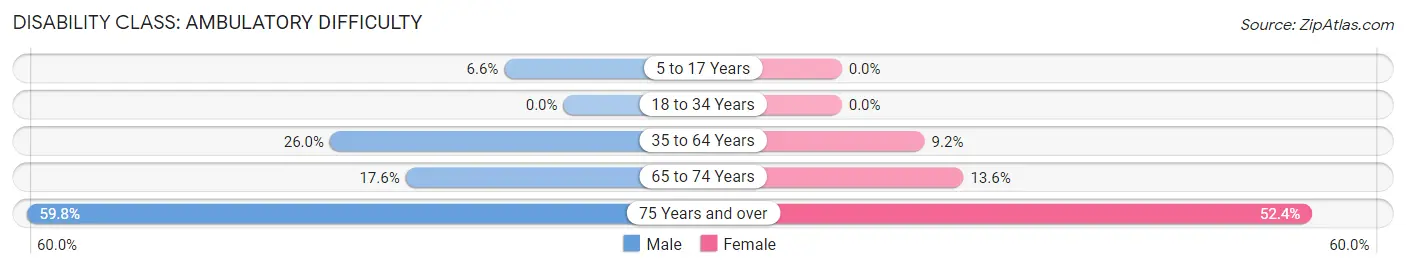
| Age Bracket | Male | Female |
| 5 to 17 Years | 12 (6.6%) | 0 (0.0%) |
| 18 to 34 Years | 0 (0.0%) | 0 (0.0%) |
| 35 to 64 Years | 90 (26.0%) | 35 (9.2%) |
| 65 to 74 Years | 16 (17.6%) | 21 (13.6%) |
| 75 Years and over | 55 (59.8%) | 66 (52.4%) |
Disability Class: Self-Care Difficulty
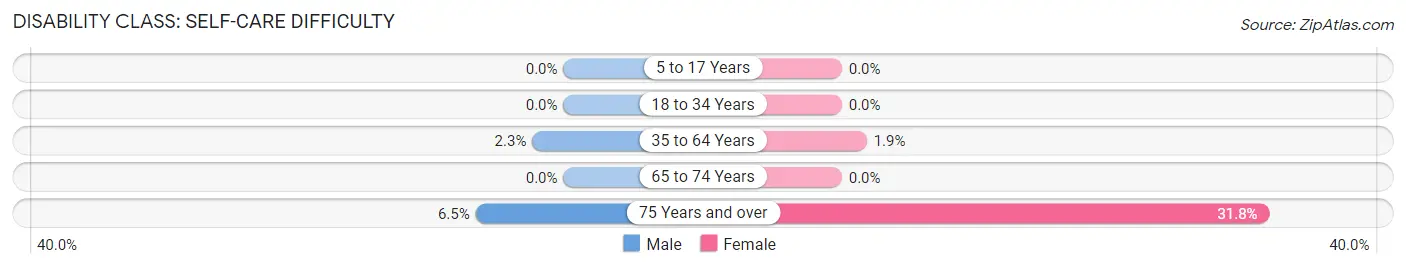
| Age Bracket | Male | Female |
| 5 to 17 Years | 0 (0.0%) | 0 (0.0%) |
| 18 to 34 Years | 0 (0.0%) | 0 (0.0%) |
| 35 to 64 Years | 8 (2.3%) | 7 (1.8%) |
| 65 to 74 Years | 0 (0.0%) | 0 (0.0%) |
| 75 Years and over | 6 (6.5%) | 40 (31.8%) |
Technology Access in South Fulton
Computing Device Access in South Fulton
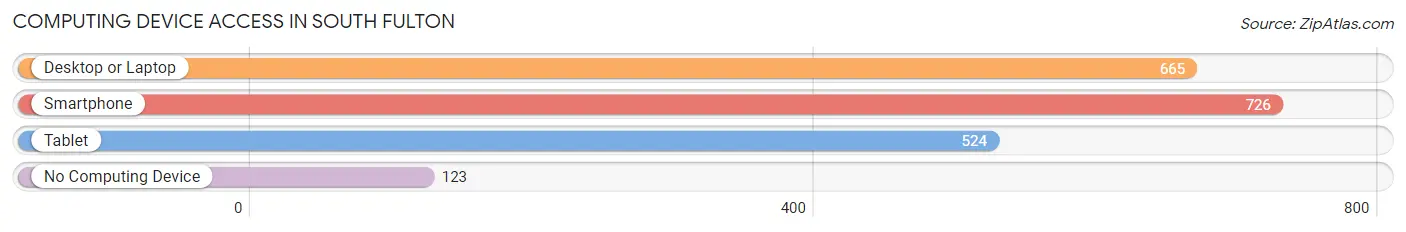
| Device Type | # Households | % Households |
| Desktop or Laptop | 665 | 68.9% |
| Smartphone | 726 | 75.2% |
| Tablet | 524 | 54.3% |
| No Computing Device | 123 | 12.8% |
| Total | 965 | 100.0% |
Internet Access in South Fulton
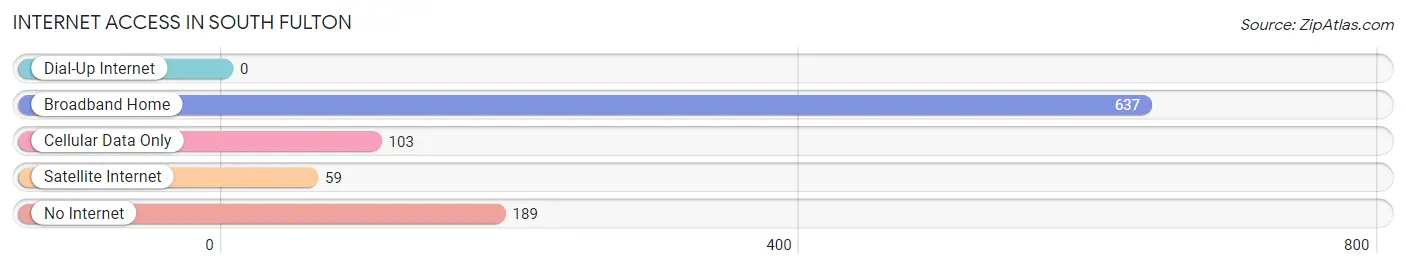
| Internet Type | # Households | % Households |
| Dial-Up Internet | 0 | 0.0% |
| Broadband Home | 637 | 66.0% |
| Cellular Data Only | 103 | 10.7% |
| Satellite Internet | 59 | 6.1% |
| No Internet | 189 | 19.6% |
| Total | 965 | 100.0% |
South Fulton Summary
History
South Fulton, Tennessee is a small city located in Obion County in the northwest corner of the state. It is situated on the banks of the Obion River, and is the county seat of Obion County. The city was founded in 1875 and was originally known as “Fulton Station”. The name was changed to South Fulton in 1882.
The city was originally settled by a group of settlers from Kentucky and Virginia who were looking for a place to settle and start a new life. The settlers were attracted to the area due to its fertile soil and abundant natural resources. The city quickly grew and became a thriving agricultural center. The city was also known for its manufacturing industry, which included a cotton mill, a sawmill, and a gristmill.
The city was also home to a number of churches, including the First Baptist Church, which was founded in 1876. The city also had a number of schools, including the South Fulton High School, which was established in 1891.
The city was also home to a number of businesses, including a bank, a hotel, a general store, and a number of other businesses. The city was also home to a number of fraternal organizations, including the Masons, the Odd Fellows, and the Knights of Pythias.
The city was also home to a number of cultural and recreational activities, including a movie theater, a bowling alley, and a number of parks. The city was also home to a number of festivals, including the Obion County Fair, which was held annually from 1891 to the present day.
The city was also home to a number of notable people, including the author and poet James Agee, who was born in South Fulton in 1909.
Geography
South Fulton is located in the northwest corner of Tennessee, in Obion County. The city is situated on the banks of the Obion River, and is the county seat of Obion County. The city is located approximately 30 miles south of the Kentucky border, and approximately 50 miles north of the Mississippi border.
The city has a total area of 2.2 square miles, all of which is land. The city is located in a humid subtropical climate zone, and has hot, humid summers and mild winters. The average annual temperature is around 64 degrees Fahrenheit, and the average annual precipitation is around 45 inches.
Economy
The economy of South Fulton is largely based on agriculture and manufacturing. The city is home to a number of agricultural businesses, including a number of farms and ranches. The city is also home to a number of manufacturing businesses, including a cotton mill, a sawmill, and a gristmill.
The city is also home to a number of retail businesses, including a number of restaurants, bars, and shops. The city is also home to a number of service businesses, including a number of banks, insurance companies, and real estate agencies.
Demographics
As of the 2010 census, the population of South Fulton was 2,845. The racial makeup of the city was 95.3% White, 2.2% African American, 0.3% Native American, 0.2% Asian, 0.1% Pacific Islander, 0.7% from other races, and 1.4% from two or more races. Hispanic or Latino of any race were 1.7% of the population.
The median income for a household in the city was $30,938, and the median income for a family was $37,813. The per capita income for the city was $17,845. About 17.2% of families and 20.2% of the population were below the poverty line, including 28.3% of those under age 18 and 15.2% of those age 65 or over.
Common Questions
What is Per Capita Income in South Fulton?
Per Capita income in South Fulton is $23,642.
What is the Median Family Income in South Fulton?
Median Family Income in South Fulton is $58,333.
What is the Median Household income in South Fulton?
Median Household Income in South Fulton is $48,646.
What is Income or Wage Gap in South Fulton?
Income or Wage Gap in South Fulton is 38.3%.
Women in South Fulton earn 61.7 cents for every dollar earned by a man.
What is Inequality or Gini Index in South Fulton?
Inequality or Gini Index in South Fulton is 0.42.
What is the Total Population of South Fulton?
Total Population of South Fulton is 2,285.
What is the Total Male Population of South Fulton?
Total Male Population of South Fulton is 1,037.
What is the Total Female Population of South Fulton?
Total Female Population of South Fulton is 1,248.
What is the Ratio of Males per 100 Females in South Fulton?
There are 83.09 Males per 100 Females in South Fulton.
What is the Ratio of Females per 100 Males in South Fulton?
There are 120.35 Females per 100 Males in South Fulton.
What is the Median Population Age in South Fulton?
Median Population Age in South Fulton is 38.7 Years.
What is the Average Family Size in South Fulton
Average Family Size in South Fulton is 3.2 People.
What is the Average Household Size in South Fulton
Average Household Size in South Fulton is 2.4 People.
How Large is the Labor Force in South Fulton?
There are 1,012 People in the Labor Forcein in South Fulton.
What is the Percentage of People in the Labor Force in South Fulton?
57.8% of People are in the Labor Force in South Fulton.
What is the Unemployment Rate in South Fulton?
Unemployment Rate in South Fulton is 4.1%.