Kenton, TN Map & Demographics
Kenton Map
Kenton Overview
$22,754
PER CAPITA INCOME
$44,554
AVG FAMILY INCOME
$39,306
AVG HOUSEHOLD INCOME
37.7%
WAGE / INCOME GAP [ % ]
62.3¢/ $1
WAGE / INCOME GAP [ $ ]
0.44
INEQUALITY / GINI INDEX
1,413
TOTAL POPULATION
722
MALE POPULATION
691
FEMALE POPULATION
104.49
MALES / 100 FEMALES
95.71
FEMALES / 100 MALES
39.6
MEDIAN AGE
3.2
AVG FAMILY SIZE
2.4
AVG HOUSEHOLD SIZE
493
LABOR FORCE [ PEOPLE ]
42.2%
PERCENT IN LABOR FORCE
1.6%
UNEMPLOYMENT RATE
Kenton Zip Codes
Kenton Area Codes
Income in Kenton
Income Overview in Kenton
Per Capita Income in Kenton is $22,754, while median incomes of families and households are $44,554 and $39,306 respectively.
| Characteristic | Number | Measure |
| Per Capita Income | 1,413 | $22,754 |
| Median Family Income | 365 | $44,554 |
| Mean Family Income | 365 | $52,981 |
| Median Household Income | 582 | $39,306 |
| Mean Household Income | 582 | $52,220 |
| Income Deficit | 365 | $0 |
| Wage / Income Gap (%) | 1,413 | 37.69% |
| Wage / Income Gap ($) | 1,413 | 62.31¢ per $1 |
| Gini / Inequality Index | 1,413 | 0.44 |
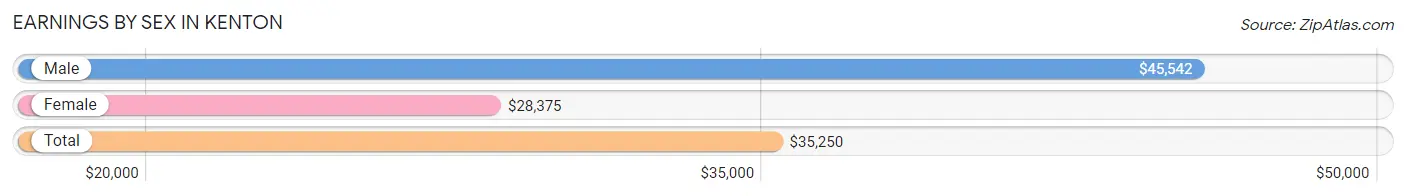
Earnings by Sex in Kenton
Average Earnings in Kenton are $35,250, $45,542 for men and $28,375 for women, a difference of 37.7%.
| Sex | Number | Average Earnings |
| Male | 321 (60.2%) | $45,542 |
| Female | 212 (39.8%) | $28,375 |
| Total | 533 (100.0%) | $35,250 |
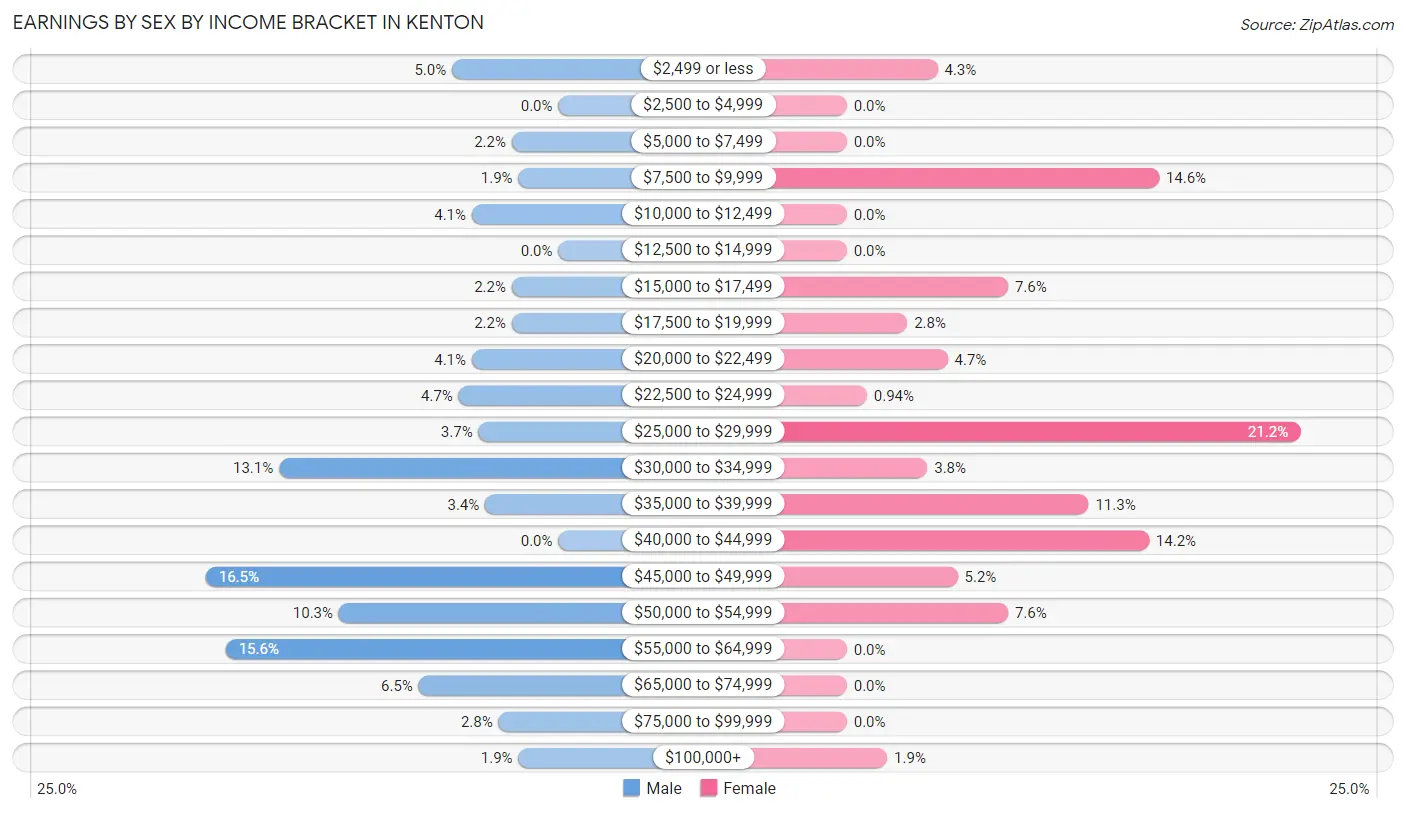
Earnings by Sex by Income Bracket in Kenton
The most common earnings brackets in Kenton are $45,000 to $49,999 for men (53 | 16.5%) and $25,000 to $29,999 for women (45 | 21.2%).
| Income | Male | Female |
| $2,499 or less | 16 (5.0%) | 9 (4.3%) |
| $2,500 to $4,999 | 0 (0.0%) | 0 (0.0%) |
| $5,000 to $7,499 | 7 (2.2%) | 0 (0.0%) |
| $7,500 to $9,999 | 6 (1.9%) | 31 (14.6%) |
| $10,000 to $12,499 | 13 (4.1%) | 0 (0.0%) |
| $12,500 to $14,999 | 0 (0.0%) | 0 (0.0%) |
| $15,000 to $17,499 | 7 (2.2%) | 16 (7.5%) |
| $17,500 to $19,999 | 7 (2.2%) | 6 (2.8%) |
| $20,000 to $22,499 | 13 (4.1%) | 10 (4.7%) |
| $22,500 to $24,999 | 15 (4.7%) | 2 (0.9%) |
| $25,000 to $29,999 | 12 (3.7%) | 45 (21.2%) |
| $30,000 to $34,999 | 42 (13.1%) | 8 (3.8%) |
| $35,000 to $39,999 | 11 (3.4%) | 24 (11.3%) |
| $40,000 to $44,999 | 0 (0.0%) | 30 (14.1%) |
| $45,000 to $49,999 | 53 (16.5%) | 11 (5.2%) |
| $50,000 to $54,999 | 33 (10.3%) | 16 (7.5%) |
| $55,000 to $64,999 | 50 (15.6%) | 0 (0.0%) |
| $65,000 to $74,999 | 21 (6.5%) | 0 (0.0%) |
| $75,000 to $99,999 | 9 (2.8%) | 0 (0.0%) |
| $100,000+ | 6 (1.9%) | 4 (1.9%) |
| Total | 321 (100.0%) | 212 (100.0%) |
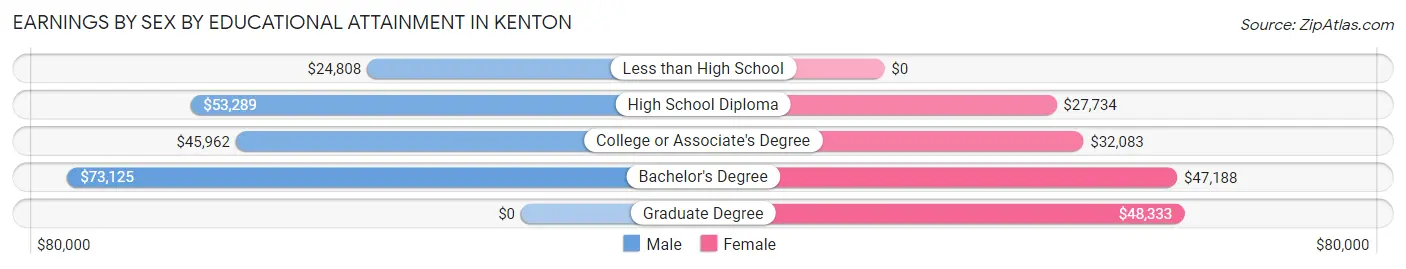
Earnings by Sex by Educational Attainment in Kenton
Average earnings in Kenton are $46,038 for men and $29,438 for women, a difference of 36.1%. Men with an educational attainment of bachelor's degree enjoy the highest average annual earnings of $73,125, while those with less than high school education earn the least with $24,808. Women with an educational attainment of graduate degree earn the most with the average annual earnings of $48,333, while those with high school diploma education have the smallest earnings of $27,734.
| Educational Attainment | Male Income | Female Income |
| Less than High School | $24,808 | $0 |
| High School Diploma | $53,289 | $27,734 |
| College or Associate's Degree | $45,962 | $32,083 |
| Bachelor's Degree | $73,125 | $47,188 |
| Graduate Degree | - | - |
| Total | $46,038 | $29,438 |
Family Income in Kenton
Family Income Brackets in Kenton
According to the Kenton family income data, there are 104 families falling into the $50,000 to $74,999 income range, which is the most common income bracket and makes up 28.5% of all families.
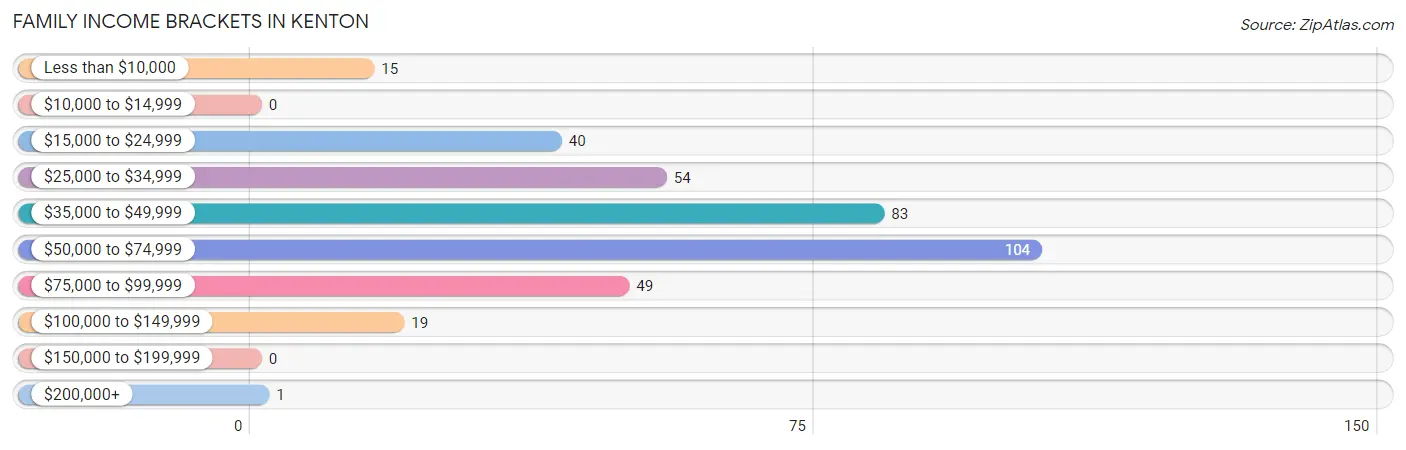
| Income Bracket | # Families | % Families |
| Less than $10,000 | 15 | 4.1% |
| $10,000 to $14,999 | 0 | 0.0% |
| $15,000 to $24,999 | 40 | 11.0% |
| $25,000 to $34,999 | 54 | 14.8% |
| $35,000 to $49,999 | 83 | 22.7% |
| $50,000 to $74,999 | 104 | 28.5% |
| $75,000 to $99,999 | 49 | 13.4% |
| $100,000 to $149,999 | 19 | 5.2% |
| $150,000 to $199,999 | 0 | 0.0% |
| $200,000+ | 1 | 0.3% |
Family Income by Famaliy Size in Kenton
5-person families (15 | 4.1%) account for the highest median family income in Kenton with $95,750 per family, while 3-person families (142 | 38.9%) have the highest median income of $19,520 per family member.
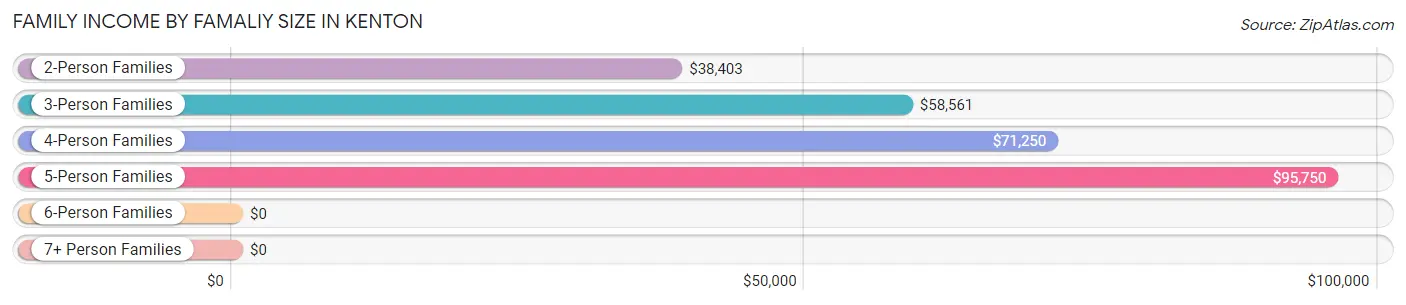
| Income Bracket | # Families | Median Income |
| 2-Person Families | 143 (39.2%) | $38,403 |
| 3-Person Families | 142 (38.9%) | $58,561 |
| 4-Person Families | 36 (9.9%) | $71,250 |
| 5-Person Families | 15 (4.1%) | $95,750 |
| 6-Person Families | 4 (1.1%) | $0 |
| 7+ Person Families | 25 (6.9%) | $0 |
| Total | 365 (100.0%) | $44,554 |
Family Income by Number of Earners in Kenton
The median family income in Kenton is $44,554, with families comprising 3+ earners (9) having the highest median family income of $107,813, while families with no earners (84) have the lowest median family income of $27,500, accounting for 2.5% and 23.0% of families, respectively.
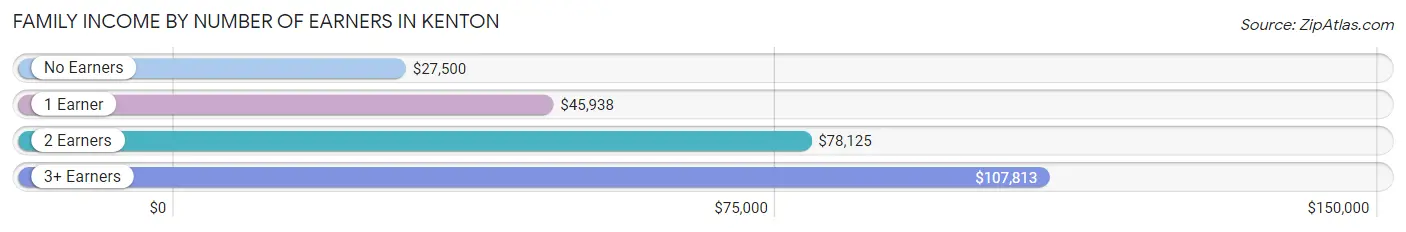
| Number of Earners | # Families | Median Income |
| No Earners | 84 (23.0%) | $27,500 |
| 1 Earner | 185 (50.7%) | $45,938 |
| 2 Earners | 87 (23.8%) | $78,125 |
| 3+ Earners | 9 (2.5%) | $107,813 |
| Total | 365 (100.0%) | $44,554 |
Household Income in Kenton
Household Income Brackets in Kenton
With 137 households falling in the category, the $50,000 to $74,999 income range is the most frequent in Kenton, accounting for 23.5% of all households.
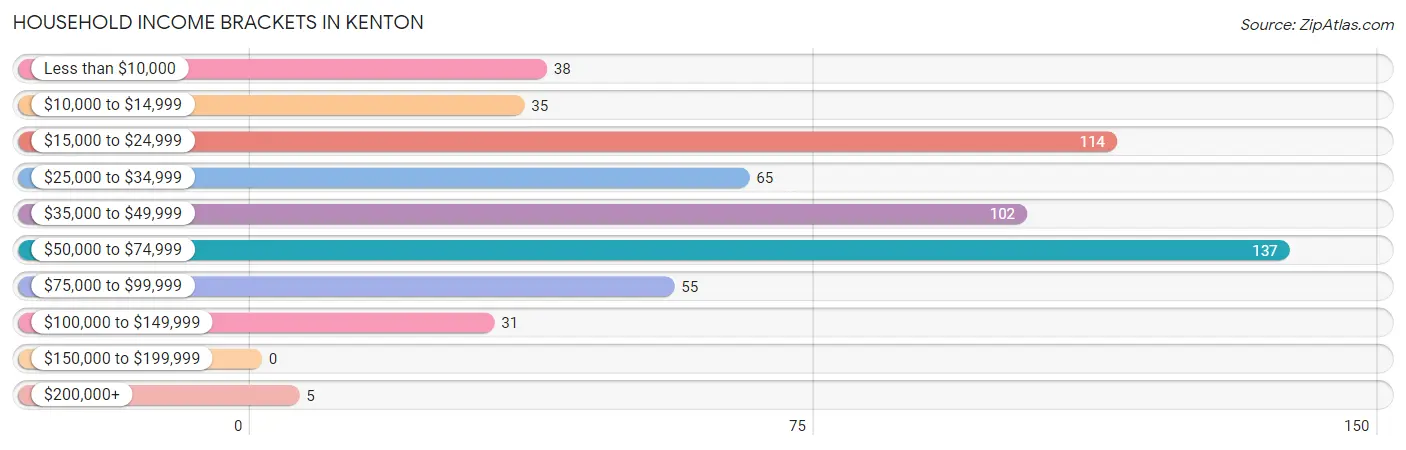
| Income Bracket | # Households | % Households |
| Less than $10,000 | 38 | 6.5% |
| $10,000 to $14,999 | 35 | 6.0% |
| $15,000 to $24,999 | 114 | 19.6% |
| $25,000 to $34,999 | 65 | 11.2% |
| $35,000 to $49,999 | 102 | 17.5% |
| $50,000 to $74,999 | 137 | 23.5% |
| $75,000 to $99,999 | 55 | 9.5% |
| $100,000 to $149,999 | 31 | 5.3% |
| $150,000 to $199,999 | 0 | 0.0% |
| $200,000+ | 5 | 0.9% |
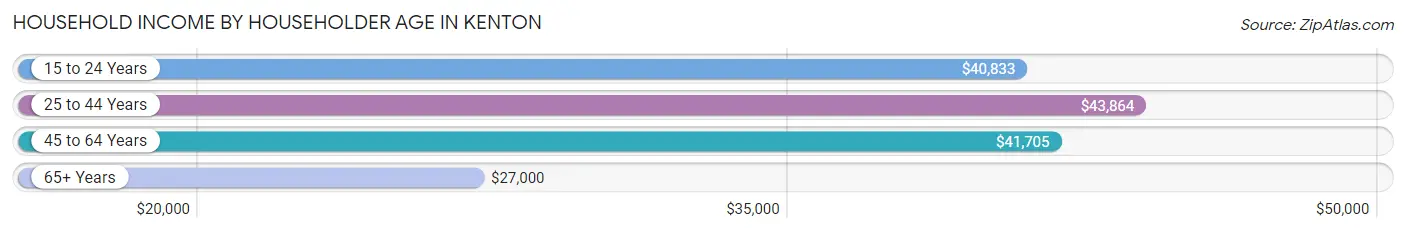
Household Income by Householder Age in Kenton
The median household income in Kenton is $39,306, with the highest median household income of $43,864 found in the 25 to 44 years age bracket for the primary householder. A total of 164 households (28.2%) fall into this category. Meanwhile, the 65+ years age bracket for the primary householder has the lowest median household income of $27,000, with 158 households (27.2%) in this group.
| Income Bracket | # Households | Median Income |
| 15 to 24 Years | 22 (3.8%) | $40,833 |
| 25 to 44 Years | 164 (28.2%) | $43,864 |
| 45 to 64 Years | 238 (40.9%) | $41,705 |
| 65+ Years | 158 (27.2%) | $27,000 |
| Total | 582 (100.0%) | $39,306 |
Poverty in Kenton
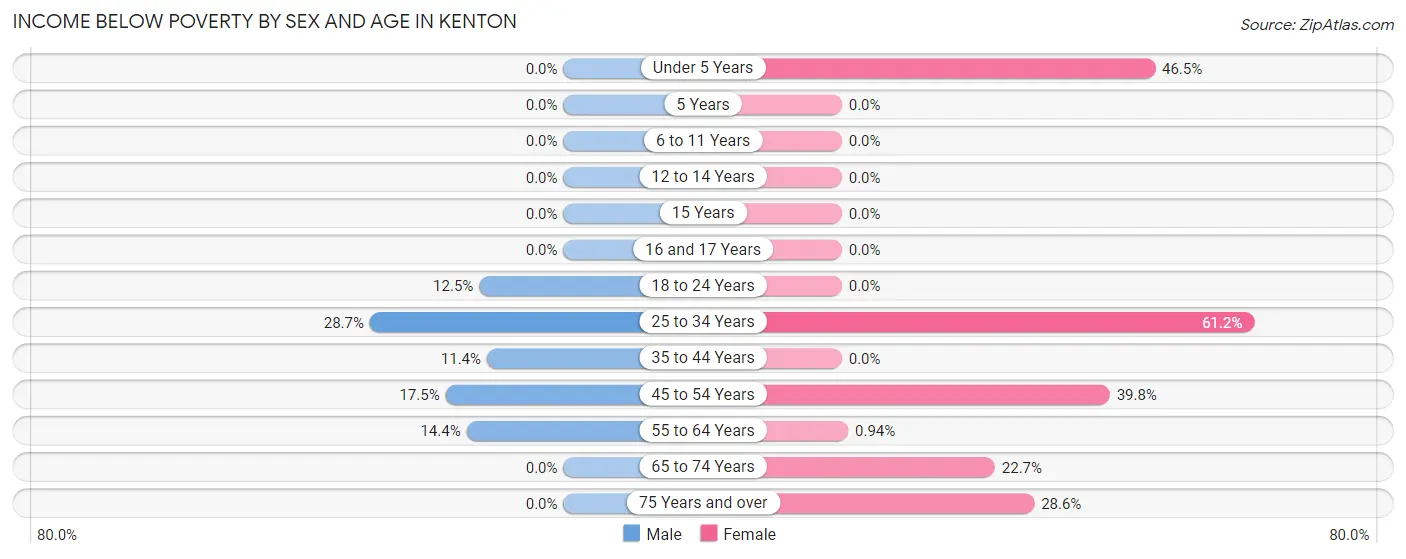
Income Below Poverty by Sex and Age in Kenton
With 12.5% poverty level for males and 25.3% for females among the residents of Kenton, 25 to 34 year old males and 25 to 34 year old females are the most vulnerable to poverty, with 50 males (28.7%) and 79 females (61.2%) in their respective age groups living below the poverty level.
| Age Bracket | Male | Female |
| Under 5 Years | 0 (0.0%) | 20 (46.5%) |
| 5 Years | 0 (0.0%) | 0 (0.0%) |
| 6 to 11 Years | 0 (0.0%) | 0 (0.0%) |
| 12 to 14 Years | 0 (0.0%) | 0 (0.0%) |
| 15 Years | 0 (0.0%) | 0 (0.0%) |
| 16 and 17 Years | 0 (0.0%) | 0 (0.0%) |
| 18 to 24 Years | 6 (12.5%) | 0 (0.0%) |
| 25 to 34 Years | 50 (28.7%) | 79 (61.2%) |
| 35 to 44 Years | 5 (11.4%) | 0 (0.0%) |
| 45 to 54 Years | 7 (17.5%) | 37 (39.8%) |
| 55 to 64 Years | 22 (14.4%) | 1 (0.9%) |
| 65 to 74 Years | 0 (0.0%) | 10 (22.7%) |
| 75 Years and over | 0 (0.0%) | 28 (28.6%) |
| Total | 90 (12.5%) | 175 (25.3%) |
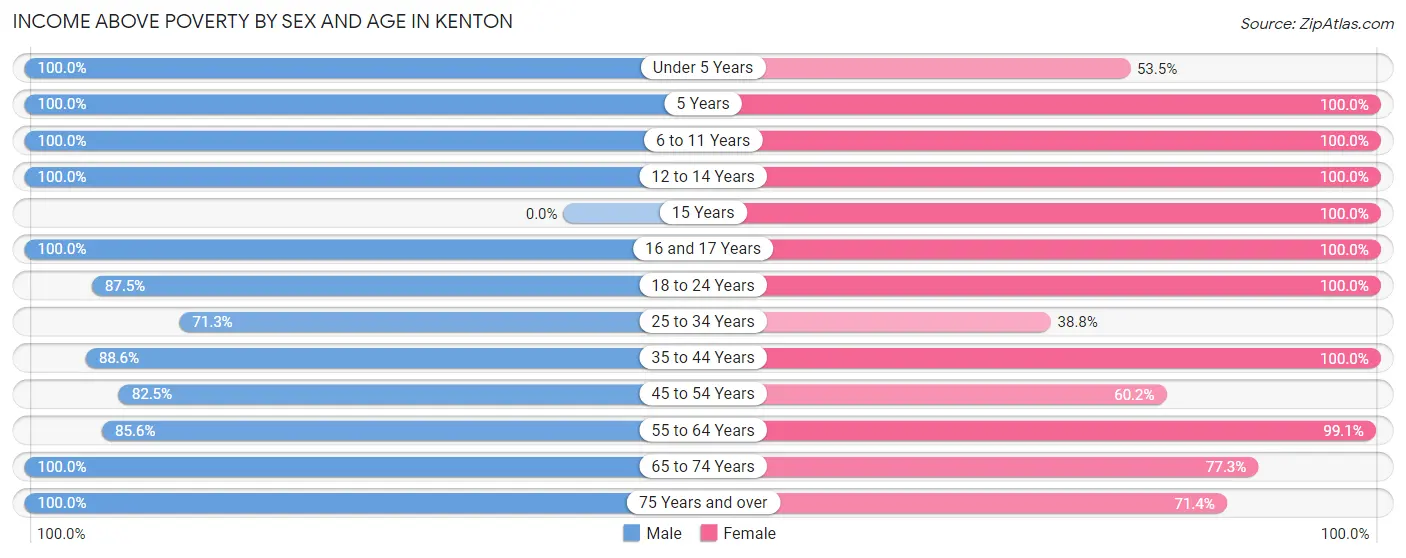
Income Above Poverty by Sex and Age in Kenton
According to the poverty statistics in Kenton, males aged under 5 years and females aged 5 years are the age groups that are most secure financially, with 100.0% of males and 100.0% of females in these age groups living above the poverty line.
| Age Bracket | Male | Female |
| Under 5 Years | 20 (100.0%) | 23 (53.5%) |
| 5 Years | 10 (100.0%) | 11 (100.0%) |
| 6 to 11 Years | 50 (100.0%) | 36 (100.0%) |
| 12 to 14 Years | 44 (100.0%) | 23 (100.0%) |
| 15 Years | 0 (0.0%) | 8 (100.0%) |
| 16 and 17 Years | 8 (100.0%) | 28 (100.0%) |
| 18 to 24 Years | 42 (87.5%) | 15 (100.0%) |
| 25 to 34 Years | 124 (71.3%) | 50 (38.8%) |
| 35 to 44 Years | 39 (88.6%) | 57 (100.0%) |
| 45 to 54 Years | 33 (82.5%) | 56 (60.2%) |
| 55 to 64 Years | 131 (85.6%) | 105 (99.1%) |
| 65 to 74 Years | 50 (100.0%) | 34 (77.3%) |
| 75 Years and over | 81 (100.0%) | 70 (71.4%) |
| Total | 632 (87.5%) | 516 (74.7%) |
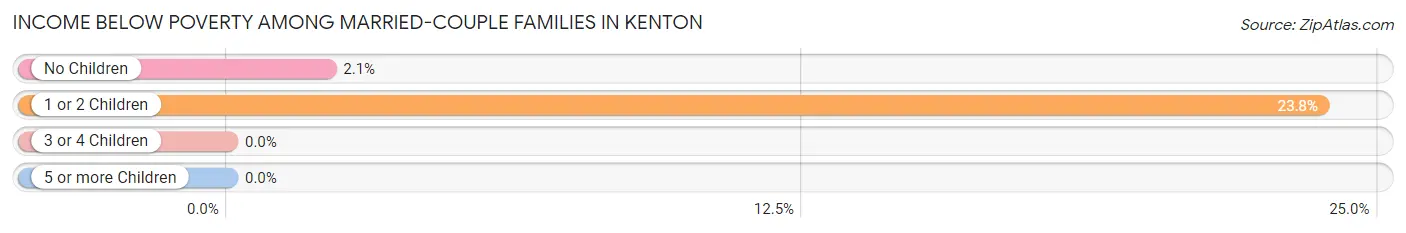
Income Below Poverty Among Married-Couple Families in Kenton
The poverty statistics for married-couple families in Kenton show that 10.5% or 27 of the total 257 families live below the poverty line. Families with 1 or 2 children have the highest poverty rate of 23.8%, comprising of 24 families. On the other hand, families with 3 or 4 children have the lowest poverty rate of 0.0%, which includes 0 families.
| Children | Above Poverty | Below Poverty |
| No Children | 137 (97.9%) | 3 (2.1%) |
| 1 or 2 Children | 77 (76.2%) | 24 (23.8%) |
| 3 or 4 Children | 16 (100.0%) | 0 (0.0%) |
| 5 or more Children | 0 (0.0%) | 0 (0.0%) |
| Total | 230 (89.5%) | 27 (10.5%) |
Income Below Poverty Among Single-Parent Households in Kenton
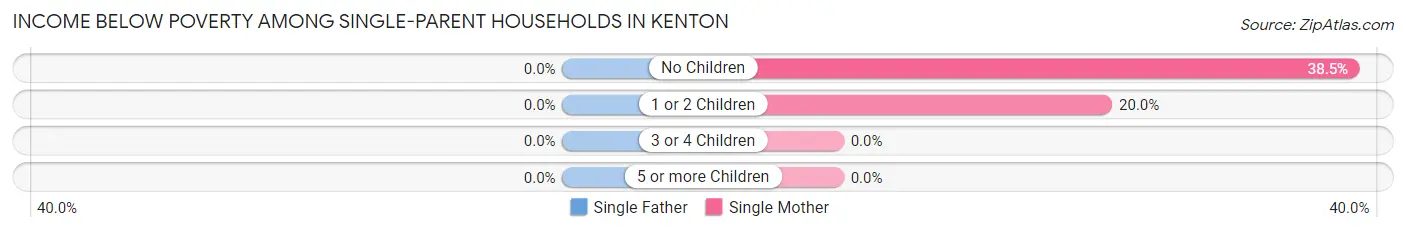
| Children | Single Father | Single Mother |
| No Children | 0 (0.0%) | 5 (38.5%) |
| 1 or 2 Children | 0 (0.0%) | 14 (20.0%) |
| 3 or 4 Children | 0 (0.0%) | 0 (0.0%) |
| 5 or more Children | 0 (0.0%) | 0 (0.0%) |
| Total | 0 (0.0%) | 19 (22.9%) |
Income Below Poverty Among Married-Couple vs Single-Parent Households in Kenton
The poverty data for Kenton shows that 27 of the married-couple family households (10.5%) and 19 of the single-parent households (17.6%) are living below the poverty level. Within the married-couple family households, those with 1 or 2 children have the highest poverty rate, with 24 households (23.8%) falling below the poverty line. Among the single-parent households, those with no children have the highest poverty rate, with 5 household (31.2%) living below poverty.
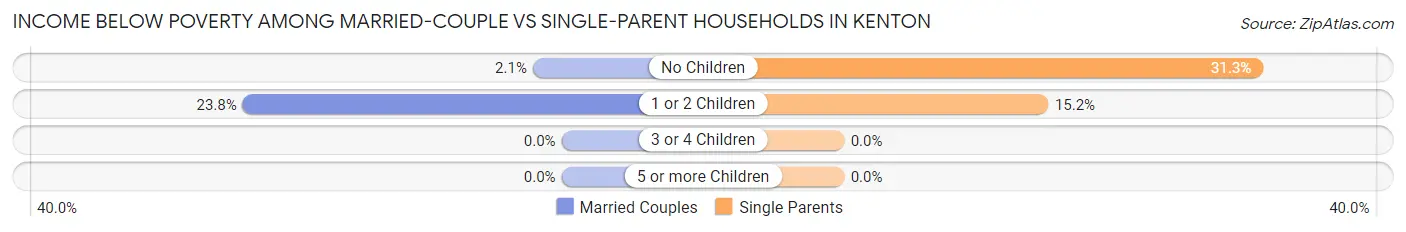
| Children | Married-Couple Families | Single-Parent Households |
| No Children | 3 (2.1%) | 5 (31.2%) |
| 1 or 2 Children | 24 (23.8%) | 14 (15.2%) |
| 3 or 4 Children | 0 (0.0%) | 0 (0.0%) |
| 5 or more Children | 0 (0.0%) | 0 (0.0%) |
| Total | 27 (10.5%) | 19 (17.6%) |
Race in Kenton
The most populous races in Kenton are White / Caucasian (1,016 | 71.9%), Two or more Races (198 | 14.0%), and Black / African American (194 | 13.7%).
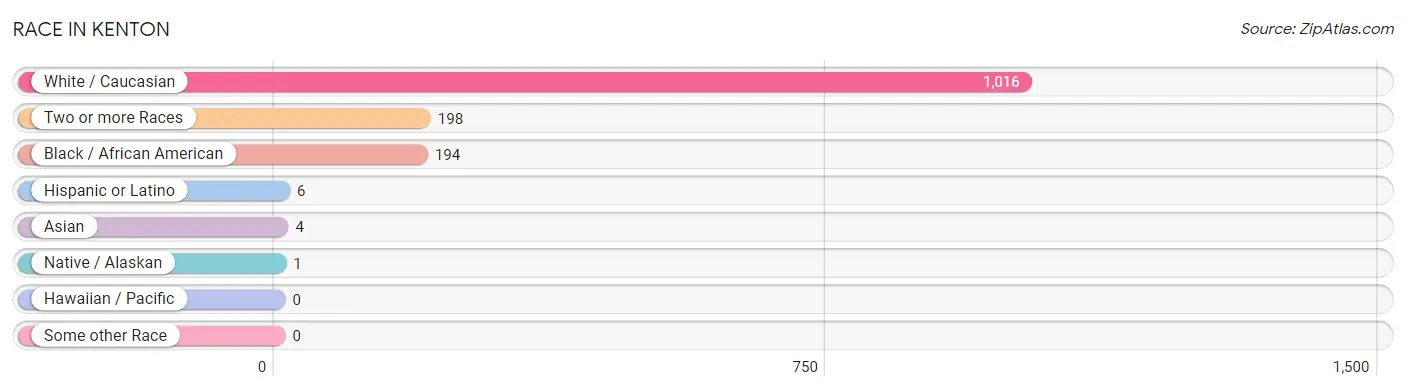
| Race | # Population | % Population |
| Asian | 4 | 0.3% |
| Black / African American | 194 | 13.7% |
| Hawaiian / Pacific | 0 | 0.0% |
| Hispanic or Latino | 6 | 0.4% |
| Native / Alaskan | 1 | 0.1% |
| White / Caucasian | 1,016 | 71.9% |
| Two or more Races | 198 | 14.0% |
| Some other Race | 0 | 0.0% |
| Total | 1,413 | 100.0% |
Ancestry in Kenton
The most populous ancestries reported in Kenton are Irish (293 | 20.7%), German (284 | 20.1%), American (145 | 10.3%), English (126 | 8.9%), and Swedish (26 | 1.8%), together accounting for 61.9% of all Kenton residents.
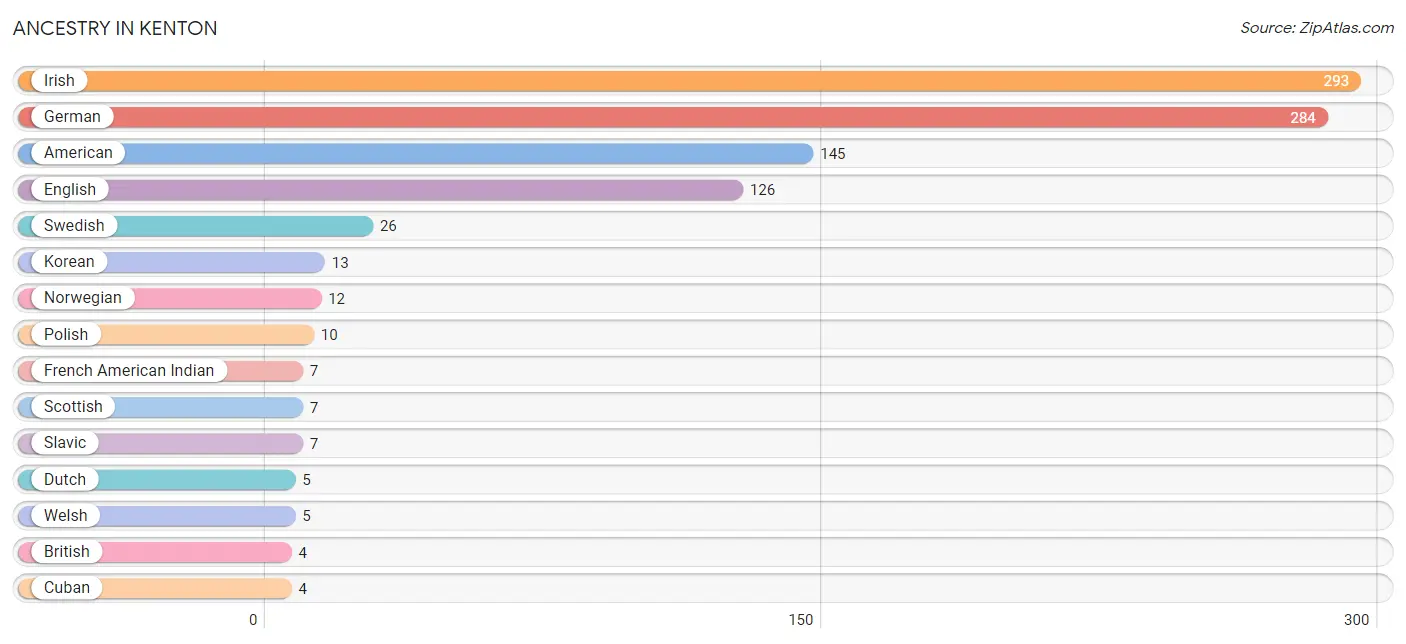
| Ancestry | # Population | % Population |
| American | 145 | 10.3% |
| British | 4 | 0.3% |
| Cherokee | 2 | 0.1% |
| Choctaw | 1 | 0.1% |
| Cuban | 4 | 0.3% |
| Dutch | 5 | 0.4% |
| English | 126 | 8.9% |
| French | 1 | 0.1% |
| French American Indian | 7 | 0.5% |
| German | 284 | 20.1% |
| Irish | 293 | 20.7% |
| Italian | 4 | 0.3% |
| Korean | 13 | 0.9% |
| Mexican | 2 | 0.1% |
| Norwegian | 12 | 0.9% |
| Polish | 10 | 0.7% |
| Russian | 3 | 0.2% |
| Scotch-Irish | 3 | 0.2% |
| Scottish | 7 | 0.5% |
| Slavic | 7 | 0.5% |
| Swedish | 26 | 1.8% |
| Welsh | 5 | 0.4% | View All 22 Rows |
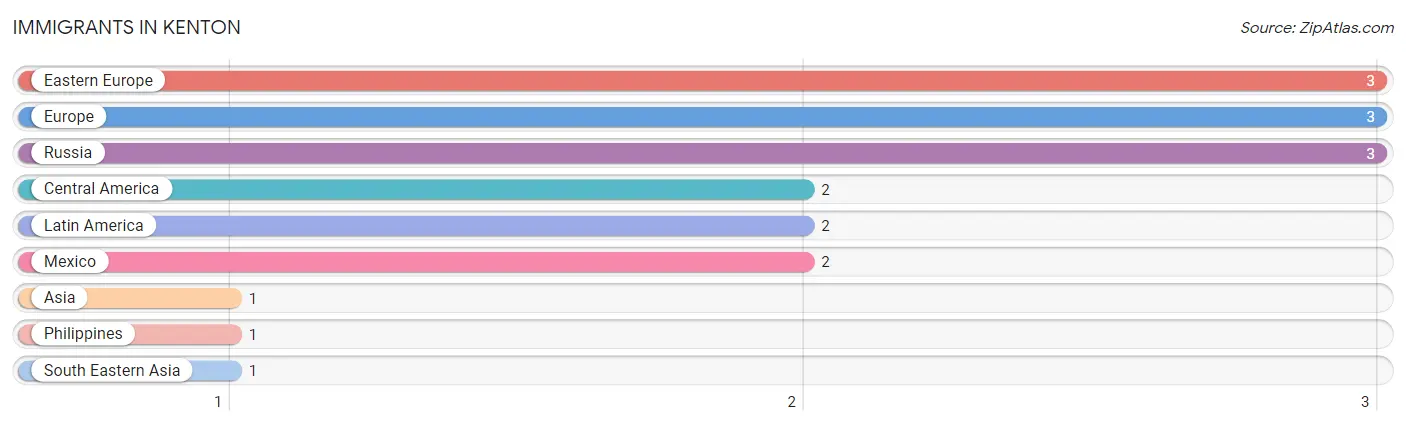
Immigrants in Kenton
The most numerous immigrant groups reported in Kenton came from Eastern Europe (3 | 0.2%), Europe (3 | 0.2%), Russia (3 | 0.2%), Central America (2 | 0.1%), and Latin America (2 | 0.1%), together accounting for 0.9% of all Kenton residents.
| Immigration Origin | # Population | % Population |
| Asia | 1 | 0.1% |
| Central America | 2 | 0.1% |
| Eastern Europe | 3 | 0.2% |
| Europe | 3 | 0.2% |
| Latin America | 2 | 0.1% |
| Mexico | 2 | 0.1% |
| Philippines | 1 | 0.1% |
| Russia | 3 | 0.2% |
| South Eastern Asia | 1 | 0.1% | View All 9 Rows |
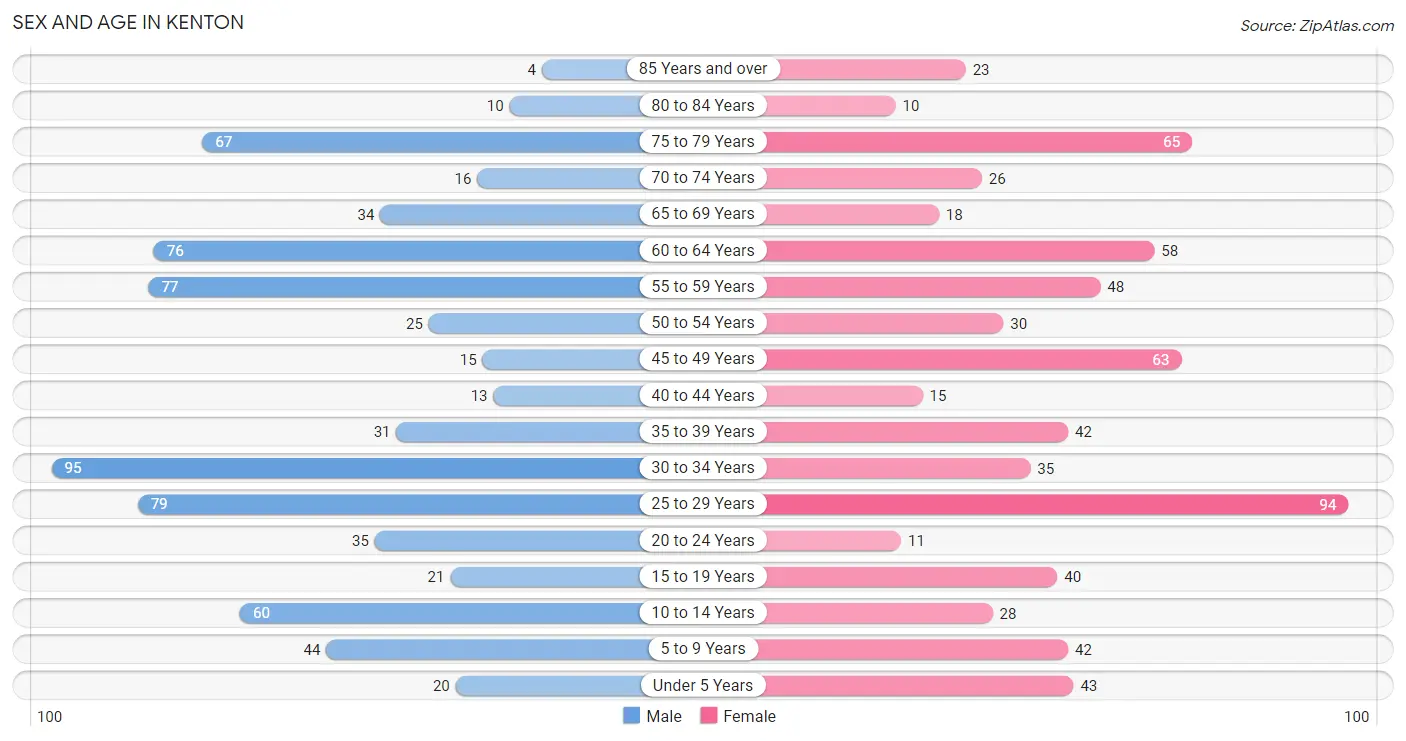
Sex and Age in Kenton
Sex and Age in Kenton
The most populous age groups in Kenton are 30 to 34 Years (95 | 13.2%) for men and 25 to 29 Years (94 | 13.6%) for women.
| Age Bracket | Male | Female |
| Under 5 Years | 20 (2.8%) | 43 (6.2%) |
| 5 to 9 Years | 44 (6.1%) | 42 (6.1%) |
| 10 to 14 Years | 60 (8.3%) | 28 (4.1%) |
| 15 to 19 Years | 21 (2.9%) | 40 (5.8%) |
| 20 to 24 Years | 35 (4.9%) | 11 (1.6%) |
| 25 to 29 Years | 79 (10.9%) | 94 (13.6%) |
| 30 to 34 Years | 95 (13.2%) | 35 (5.1%) |
| 35 to 39 Years | 31 (4.3%) | 42 (6.1%) |
| 40 to 44 Years | 13 (1.8%) | 15 (2.2%) |
| 45 to 49 Years | 15 (2.1%) | 63 (9.1%) |
| 50 to 54 Years | 25 (3.5%) | 30 (4.3%) |
| 55 to 59 Years | 77 (10.7%) | 48 (7.0%) |
| 60 to 64 Years | 76 (10.5%) | 58 (8.4%) |
| 65 to 69 Years | 34 (4.7%) | 18 (2.6%) |
| 70 to 74 Years | 16 (2.2%) | 26 (3.8%) |
| 75 to 79 Years | 67 (9.3%) | 65 (9.4%) |
| 80 to 84 Years | 10 (1.4%) | 10 (1.5%) |
| 85 Years and over | 4 (0.5%) | 23 (3.3%) |
| Total | 722 (100.0%) | 691 (100.0%) |
Families and Households in Kenton
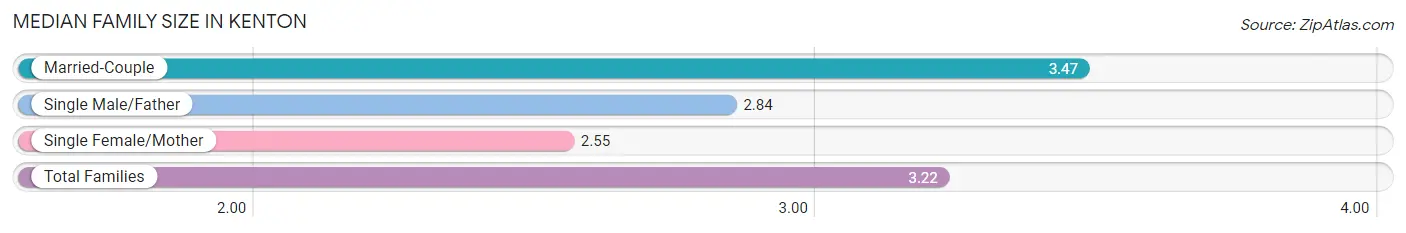
Median Family Size in Kenton
The median family size in Kenton is 3.22 persons per family, with married-couple families (257 | 70.4%) accounting for the largest median family size of 3.47 persons per family. On the other hand, single female/mother families (83 | 22.7%) represent the smallest median family size with 2.55 persons per family.
| Family Type | # Families | Family Size |
| Married-Couple | 257 (70.4%) | 3.47 |
| Single Male/Father | 25 (6.9%) | 2.84 |
| Single Female/Mother | 83 (22.7%) | 2.55 |
| Total Families | 365 (100.0%) | 3.22 |
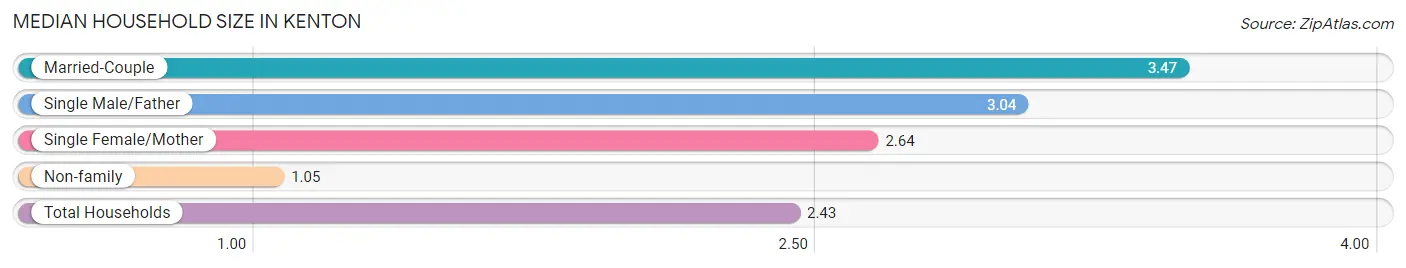
Median Household Size in Kenton
The median household size in Kenton is 2.43 persons per household, with married-couple households (257 | 44.2%) accounting for the largest median household size of 3.47 persons per household. non-family households (217 | 37.3%) represent the smallest median household size with 1.05 persons per household.
| Household Type | # Households | Household Size |
| Married-Couple | 257 (44.2%) | 3.47 |
| Single Male/Father | 25 (4.3%) | 3.04 |
| Single Female/Mother | 83 (14.3%) | 2.64 |
| Non-family | 217 (37.3%) | 1.05 |
| Total Households | 582 (100.0%) | 2.43 |
Household Size by Marriage Status in Kenton
Out of a total of 582 households in Kenton, 365 (62.7%) are family households, while 217 (37.3%) are nonfamily households. The most numerous type of family households are 3-person households, comprising 143, and the most common type of nonfamily households are 1-person households, comprising 204.
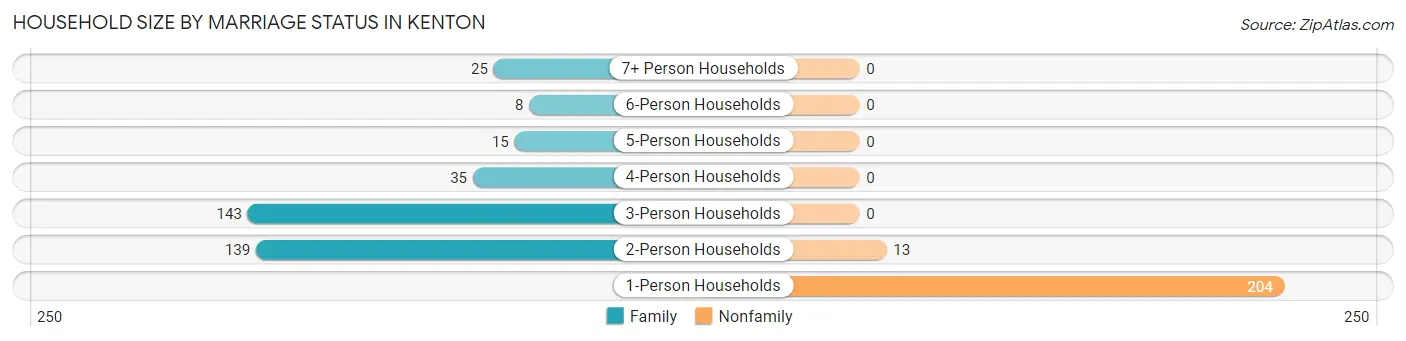
| Household Size | Family Households | Nonfamily Households |
| 1-Person Households | - | 204 (35.0%) |
| 2-Person Households | 139 (23.9%) | 13 (2.2%) |
| 3-Person Households | 143 (24.6%) | 0 (0.0%) |
| 4-Person Households | 35 (6.0%) | 0 (0.0%) |
| 5-Person Households | 15 (2.6%) | 0 (0.0%) |
| 6-Person Households | 8 (1.4%) | 0 (0.0%) |
| 7+ Person Households | 25 (4.3%) | 0 (0.0%) |
| Total | 365 (62.7%) | 217 (37.3%) |
Female Fertility in Kenton
Fertility by Age in Kenton
Average fertility rate in Kenton is 145.0 births per 1,000 women. Women in the age bracket of 20 to 34 years have the highest fertility rate with 314.0 births per 1,000 women. Women in the age bracket of 20 to 34 years acount for 100.0% of all women with births.

| Age Bracket | Women with Births | Births / 1,000 Women |
| 15 to 19 years | 0 (0.0%) | 0.0 |
| 20 to 34 years | 44 (100.0%) | 314.0 |
| 35 to 50 years | 0 (0.0%) | 0.0 |
| Total | 44 (100.0%) | 145.0 |
Fertility by Age by Marriage Status in Kenton
13.6% of women with births (44) in Kenton are married. The highest percentage of unmarried women with births falls into 20 to 34 years age bracket with 86.4% of them unmarried at the time of birth, while the lowest percentage of unmarried women with births belong to 20 to 34 years age bracket with 86.4% of them unmarried.
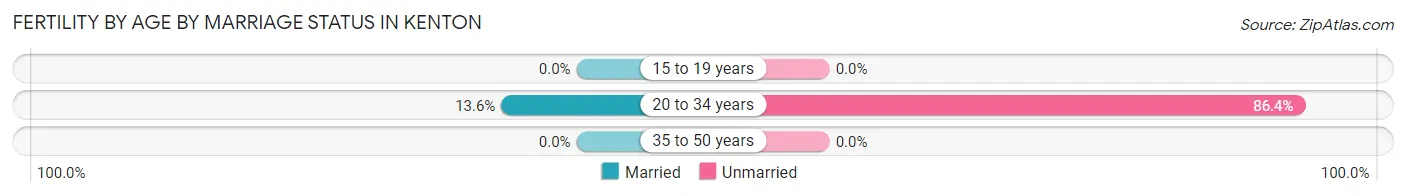
| Age Bracket | Married | Unmarried |
| 15 to 19 years | 0 (0.0%) | 0 (0.0%) |
| 20 to 34 years | 6 (13.6%) | 38 (86.4%) |
| 35 to 50 years | 0 (0.0%) | 0 (0.0%) |
| Total | 6 (13.6%) | 38 (86.4%) |
Fertility by Education in Kenton
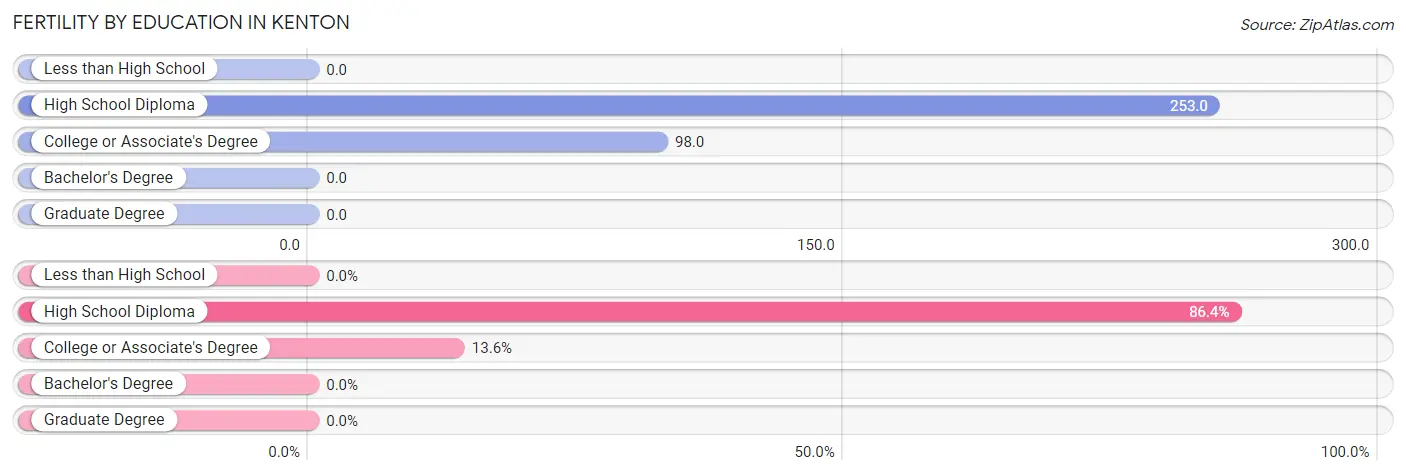
| Educational Attainment | Women with Births | Births / 1,000 Women |
| Less than High School | 0 (0.0%) | 0.0 |
| High School Diploma | 38 (86.4%) | 253.0 |
| College or Associate's Degree | 6 (13.6%) | 98.0 |
| Bachelor's Degree | 0 (0.0%) | 0.0 |
| Graduate Degree | 0 (0.0%) | 0.0 |
| Total | 44 (100.0%) | 145.0 |
Fertility by Education by Marriage Status in Kenton
86.4% of women with births in Kenton are unmarried. Women with the educational attainment of college or associate's degree are most likely to be married with 100.0% of them married at childbirth, while women with the educational attainment of high school diploma are least likely to be married with 100.0% of them unmarried at childbirth.
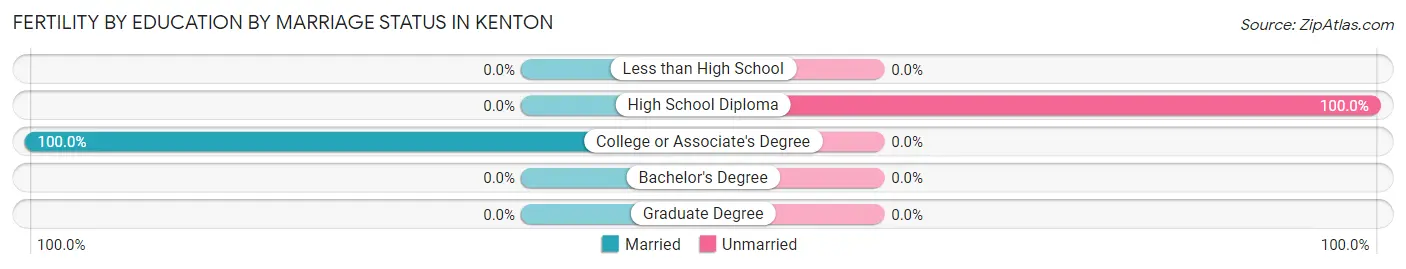
| Educational Attainment | Married | Unmarried |
| Less than High School | 0 (0.0%) | 0 (0.0%) |
| High School Diploma | 0 (0.0%) | 38 (100.0%) |
| College or Associate's Degree | 6 (100.0%) | 0 (0.0%) |
| Bachelor's Degree | 0 (0.0%) | 0 (0.0%) |
| Graduate Degree | 0 (0.0%) | 0 (0.0%) |
| Total | 6 (13.6%) | 38 (86.4%) |
Employment Characteristics in Kenton
Employment by Class of Employer in Kenton
Among the 483 employed individuals in Kenton, private company employees (385 | 79.7%), self-employed (not incorporated) (24 | 5.0%), and local government employees (20 | 4.1%) make up the most common classes of employment.
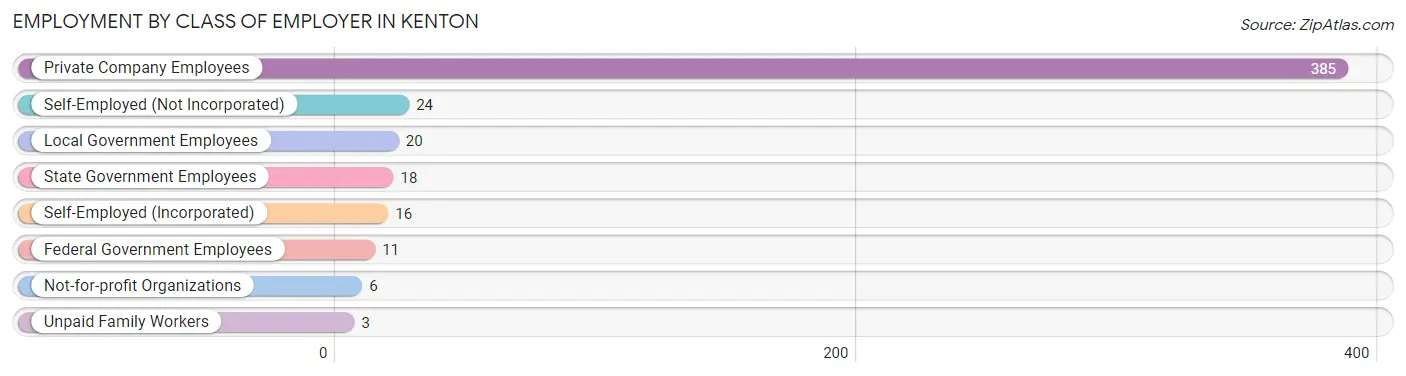
| Employer Class | # Employees | % Employees |
| Private Company Employees | 385 | 79.7% |
| Self-Employed (Incorporated) | 16 | 3.3% |
| Self-Employed (Not Incorporated) | 24 | 5.0% |
| Not-for-profit Organizations | 6 | 1.2% |
| Local Government Employees | 20 | 4.1% |
| State Government Employees | 18 | 3.7% |
| Federal Government Employees | 11 | 2.3% |
| Unpaid Family Workers | 3 | 0.6% |
| Total | 483 | 100.0% |
Employment Status by Age in Kenton
According to the labor force statistics for Kenton, out of the total population over 16 years of age (1,168), 42.2% or 493 individuals are in the labor force, with 1.6% or 8 of them unemployed. The age group with the highest labor force participation rate is 35 to 44 years, with 96.0% or 97 individuals in the labor force. Within the labor force, the 16 to 19 years age range has the highest percentage of unemployed individuals, with 75.0% or 6 of them being unemployed.
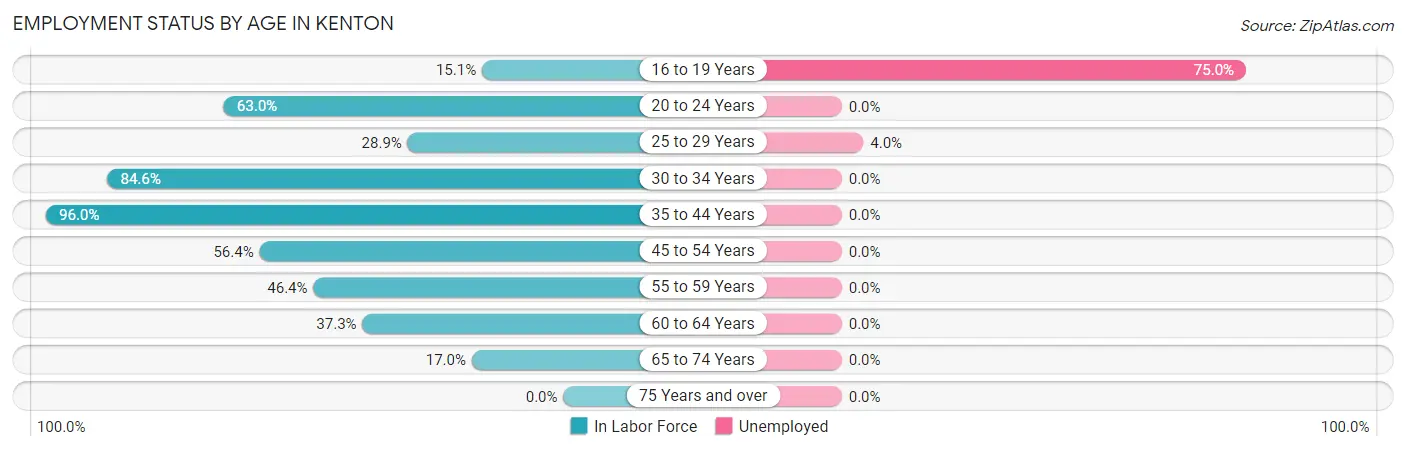
| Age Bracket | In Labor Force | Unemployed |
| 16 to 19 Years | 8 (15.1%) | 6 (75.0%) |
| 20 to 24 Years | 29 (63.0%) | 0 (0.0%) |
| 25 to 29 Years | 50 (28.9%) | 2 (4.0%) |
| 30 to 34 Years | 110 (84.6%) | 0 (0.0%) |
| 35 to 44 Years | 97 (96.0%) | 0 (0.0%) |
| 45 to 54 Years | 75 (56.4%) | 0 (0.0%) |
| 55 to 59 Years | 58 (46.4%) | 0 (0.0%) |
| 60 to 64 Years | 50 (37.3%) | 0 (0.0%) |
| 65 to 74 Years | 16 (17.0%) | 0 (0.0%) |
| 75 Years and over | 0 (0.0%) | 0 (0.0%) |
| Total | 493 (42.2%) | 8 (1.6%) |
Employment Status by Educational Attainment in Kenton
According to labor force statistics for Kenton, 55.3% of individuals (440) out of the total population between 25 and 64 years of age (796) are in the labor force, with 0.5% or 2 of them being unemployed. The group with the highest labor force participation rate are those with the educational attainment of bachelor's degree or higher, with 88.7% or 47 individuals in the labor force. Within the labor force, individuals with high school diploma education have the highest percentage of unemployment, with 0.9% or 2 of them being unemployed.
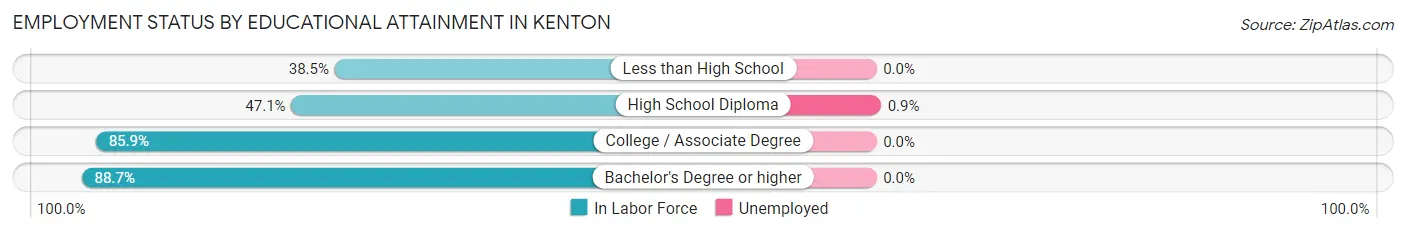
| Educational Attainment | In Labor Force | Unemployed |
| Less than High School | 42 (38.5%) | 0 (0.0%) |
| High School Diploma | 235 (47.1%) | 4 (0.9%) |
| College / Associate Degree | 116 (85.9%) | 0 (0.0%) |
| Bachelor's Degree or higher | 47 (88.7%) | 0 (0.0%) |
| Total | 440 (55.3%) | 4 (0.5%) |
Employment Occupations by Sex in Kenton
Management, Business, Science and Arts Occupations
The most common Management, Business, Science and Arts occupations in Kenton are Community & Social Service (40 | 8.3%), Education Instruction & Library (30 | 6.2%), Management (21 | 4.3%), Education, Arts & Media (10 | 2.1%), and Health Diagnosing & Treating (8 | 1.7%).
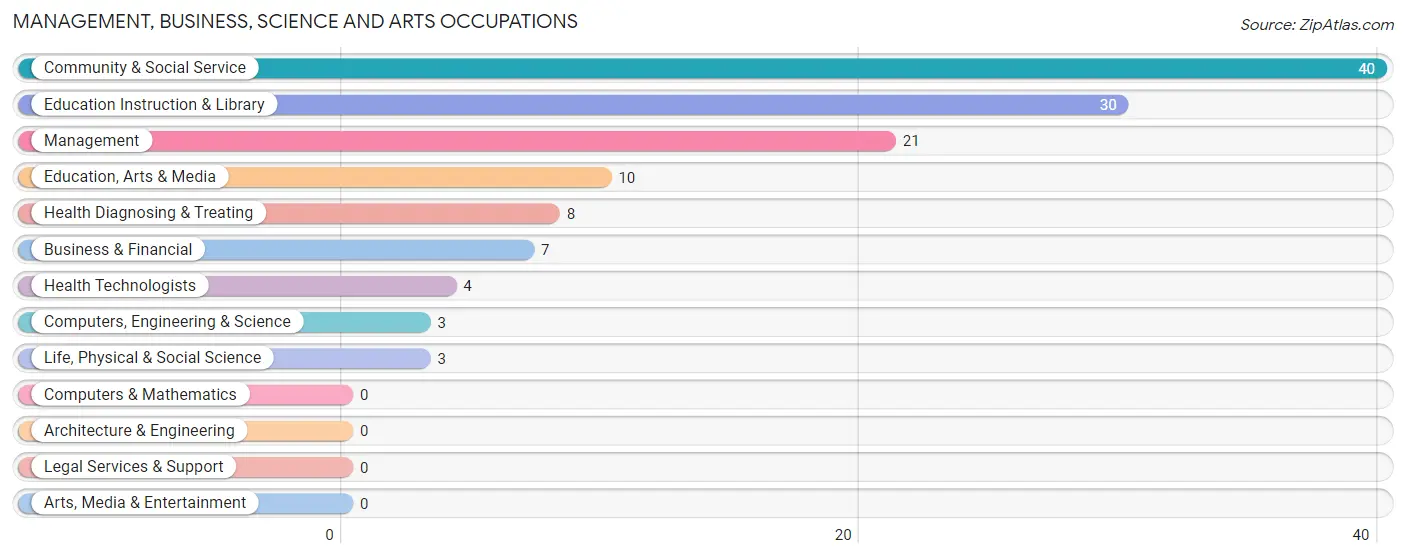
Management, Business, Science and Arts Occupations by Sex
Within the Management, Business, Science and Arts occupations in Kenton, the most male-oriented occupations are Business & Financial (100.0%), Computers, Engineering & Science (100.0%), and Life, Physical & Social Science (100.0%), while the most female-oriented occupations are Education Instruction & Library (100.0%), Community & Social Service (92.5%), and Education, Arts & Media (70.0%).
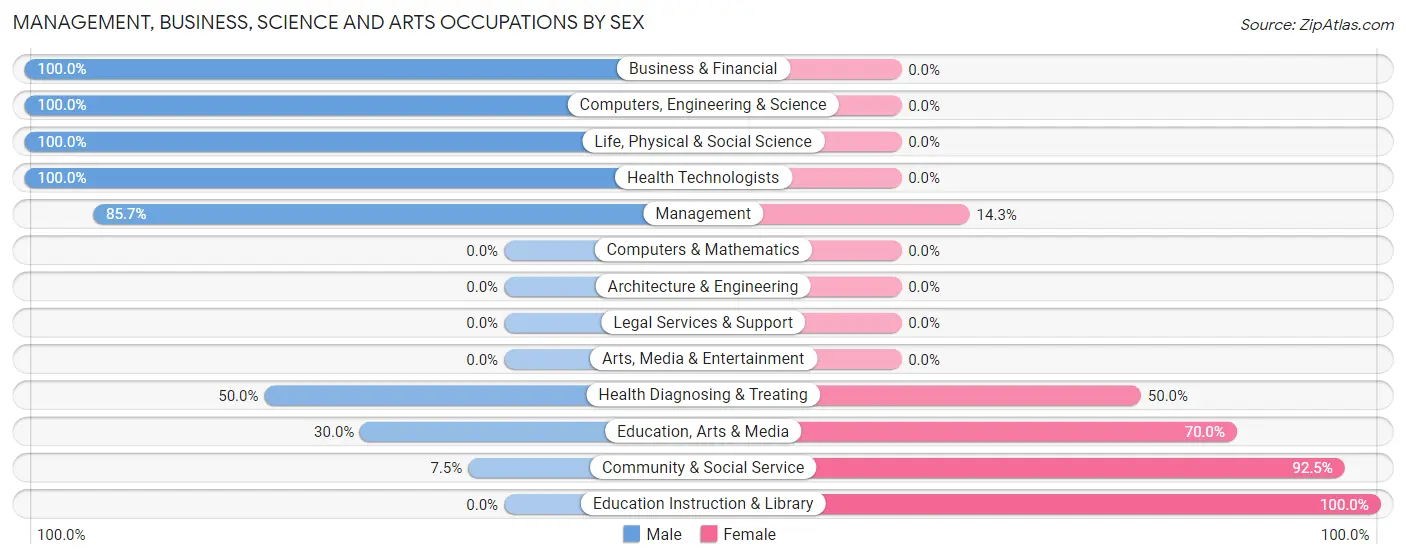
| Occupation | Male | Female |
| Management | 18 (85.7%) | 3 (14.3%) |
| Business & Financial | 7 (100.0%) | 0 (0.0%) |
| Computers, Engineering & Science | 3 (100.0%) | 0 (0.0%) |
| Computers & Mathematics | 0 (0.0%) | 0 (0.0%) |
| Architecture & Engineering | 0 (0.0%) | 0 (0.0%) |
| Life, Physical & Social Science | 3 (100.0%) | 0 (0.0%) |
| Community & Social Service | 3 (7.5%) | 37 (92.5%) |
| Education, Arts & Media | 3 (30.0%) | 7 (70.0%) |
| Legal Services & Support | 0 (0.0%) | 0 (0.0%) |
| Education Instruction & Library | 0 (0.0%) | 30 (100.0%) |
| Arts, Media & Entertainment | 0 (0.0%) | 0 (0.0%) |
| Health Diagnosing & Treating | 4 (50.0%) | 4 (50.0%) |
| Health Technologists | 4 (100.0%) | 0 (0.0%) |
| Total (Category) | 35 (44.3%) | 44 (55.7%) |
| Total (Overall) | 285 (58.8%) | 200 (41.2%) |
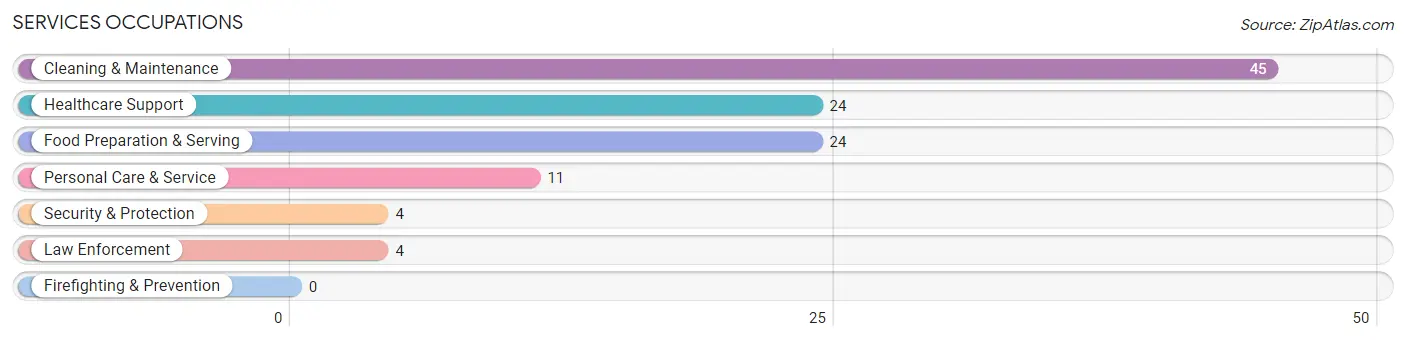
Services Occupations
The most common Services occupations in Kenton are Cleaning & Maintenance (45 | 9.3%), Healthcare Support (24 | 5.0%), Food Preparation & Serving (24 | 5.0%), Personal Care & Service (11 | 2.3%), and Security & Protection (4 | 0.8%).
Services Occupations by Sex
Within the Services occupations in Kenton, the most male-oriented occupations are Cleaning & Maintenance (100.0%), Food Preparation & Serving (62.5%), and Personal Care & Service (27.3%), while the most female-oriented occupations are Healthcare Support (100.0%), Security & Protection (100.0%), and Law Enforcement (100.0%).
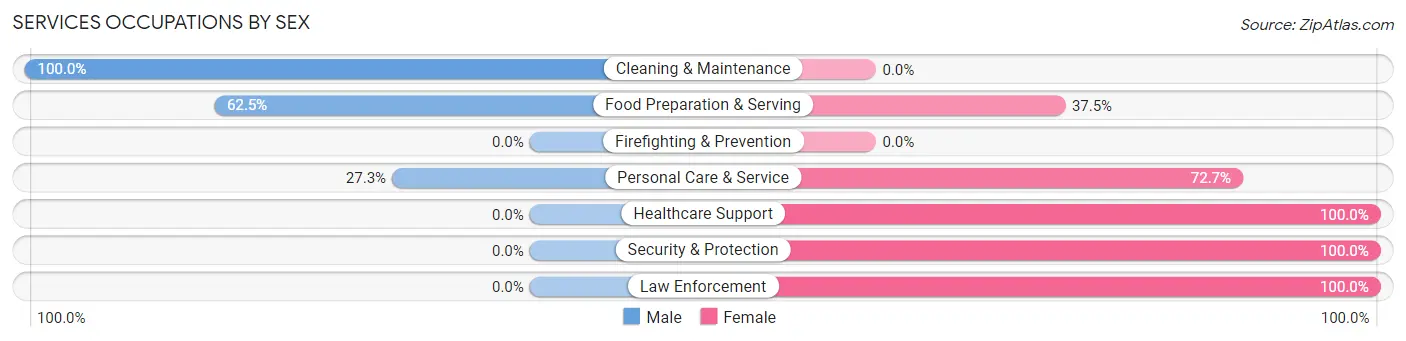
| Occupation | Male | Female |
| Healthcare Support | 0 (0.0%) | 24 (100.0%) |
| Security & Protection | 0 (0.0%) | 4 (100.0%) |
| Firefighting & Prevention | 0 (0.0%) | 0 (0.0%) |
| Law Enforcement | 0 (0.0%) | 4 (100.0%) |
| Food Preparation & Serving | 15 (62.5%) | 9 (37.5%) |
| Cleaning & Maintenance | 45 (100.0%) | 0 (0.0%) |
| Personal Care & Service | 3 (27.3%) | 8 (72.7%) |
| Total (Category) | 63 (58.3%) | 45 (41.7%) |
| Total (Overall) | 285 (58.8%) | 200 (41.2%) |
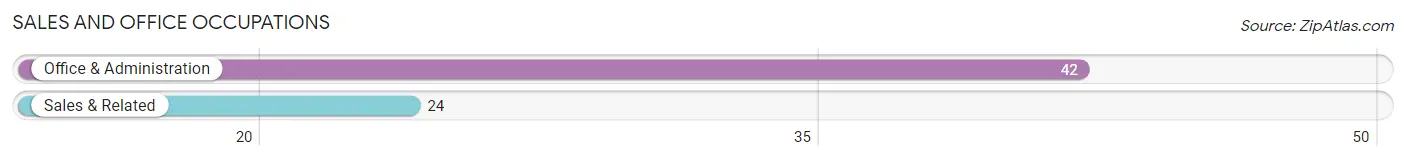
Sales and Office Occupations
The most common Sales and Office occupations in Kenton are Office & Administration (42 | 8.7%), and Sales & Related (24 | 5.0%).
Sales and Office Occupations by Sex
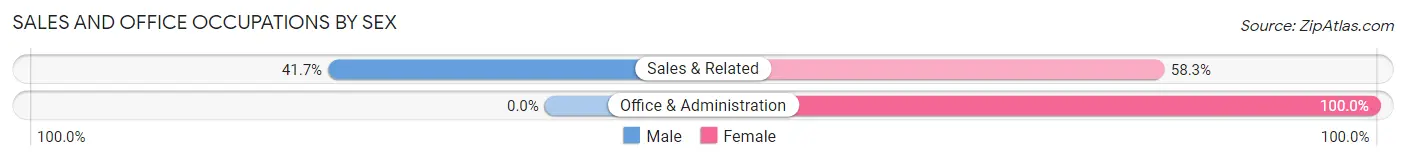
| Occupation | Male | Female |
| Sales & Related | 10 (41.7%) | 14 (58.3%) |
| Office & Administration | 0 (0.0%) | 42 (100.0%) |
| Total (Category) | 10 (15.1%) | 56 (84.9%) |
| Total (Overall) | 285 (58.8%) | 200 (41.2%) |
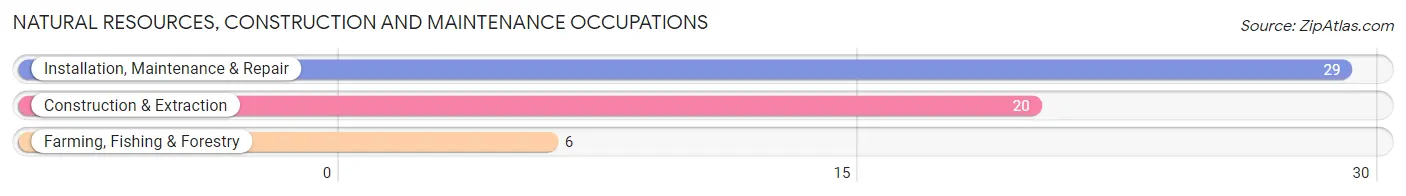
Natural Resources, Construction and Maintenance Occupations
The most common Natural Resources, Construction and Maintenance occupations in Kenton are Installation, Maintenance & Repair (29 | 6.0%), Construction & Extraction (20 | 4.1%), and Farming, Fishing & Forestry (6 | 1.2%).
Natural Resources, Construction and Maintenance Occupations by Sex
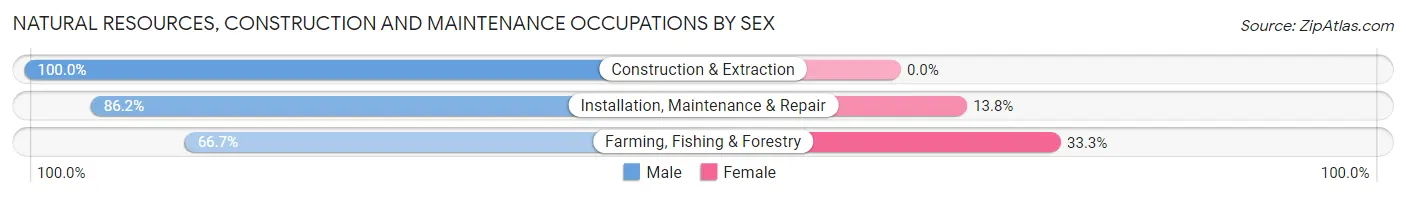
| Occupation | Male | Female |
| Farming, Fishing & Forestry | 4 (66.7%) | 2 (33.3%) |
| Construction & Extraction | 20 (100.0%) | 0 (0.0%) |
| Installation, Maintenance & Repair | 25 (86.2%) | 4 (13.8%) |
| Total (Category) | 49 (89.1%) | 6 (10.9%) |
| Total (Overall) | 285 (58.8%) | 200 (41.2%) |
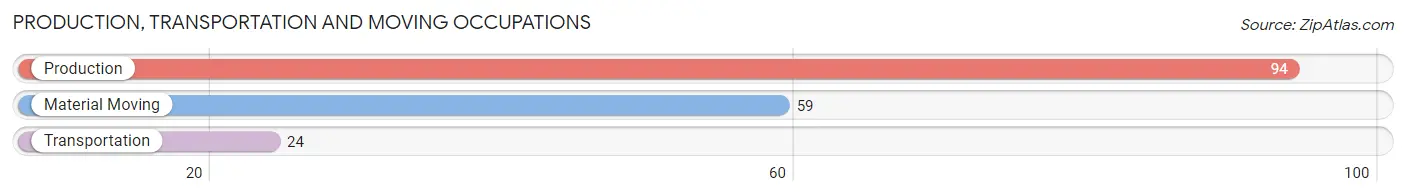
Production, Transportation and Moving Occupations
The most common Production, Transportation and Moving occupations in Kenton are Production (94 | 19.4%), Material Moving (59 | 12.2%), and Transportation (24 | 5.0%).
Production, Transportation and Moving Occupations by Sex
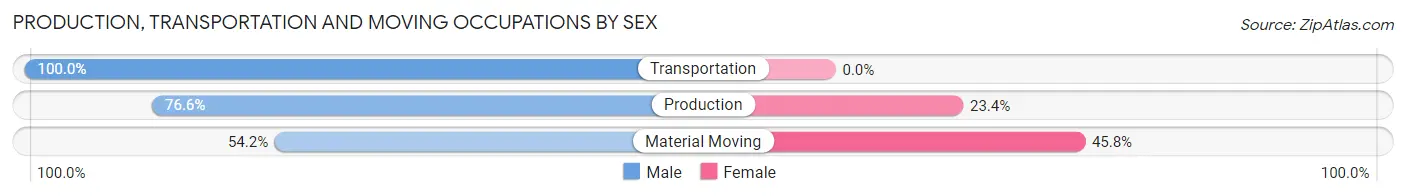
| Occupation | Male | Female |
| Production | 72 (76.6%) | 22 (23.4%) |
| Transportation | 24 (100.0%) | 0 (0.0%) |
| Material Moving | 32 (54.2%) | 27 (45.8%) |
| Total (Category) | 128 (72.3%) | 49 (27.7%) |
| Total (Overall) | 285 (58.8%) | 200 (41.2%) |
Employment Industries by Sex in Kenton
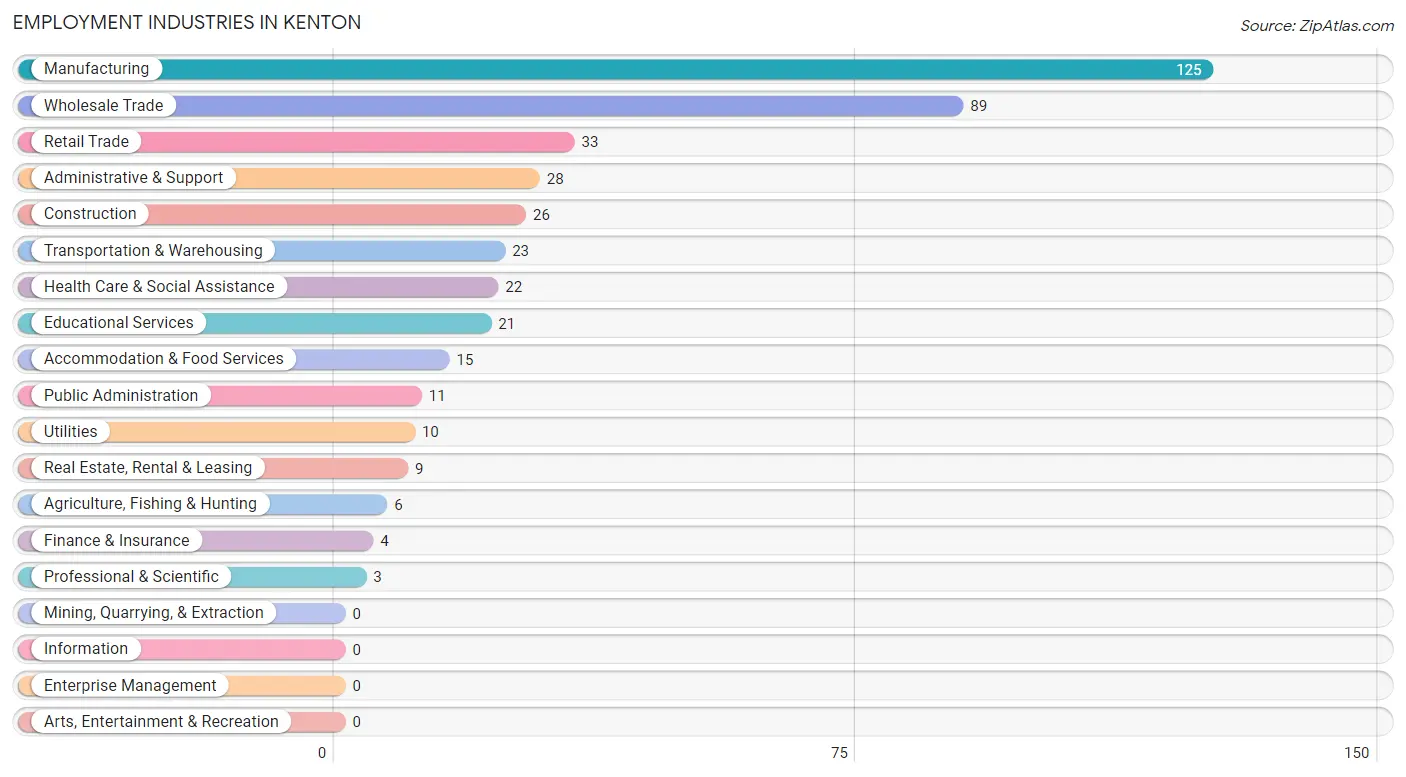
Employment Industries in Kenton
The major employment industries in Kenton include Manufacturing (125 | 25.8%), Wholesale Trade (89 | 18.3%), Retail Trade (33 | 6.8%), Administrative & Support (28 | 5.8%), and Construction (26 | 5.4%).
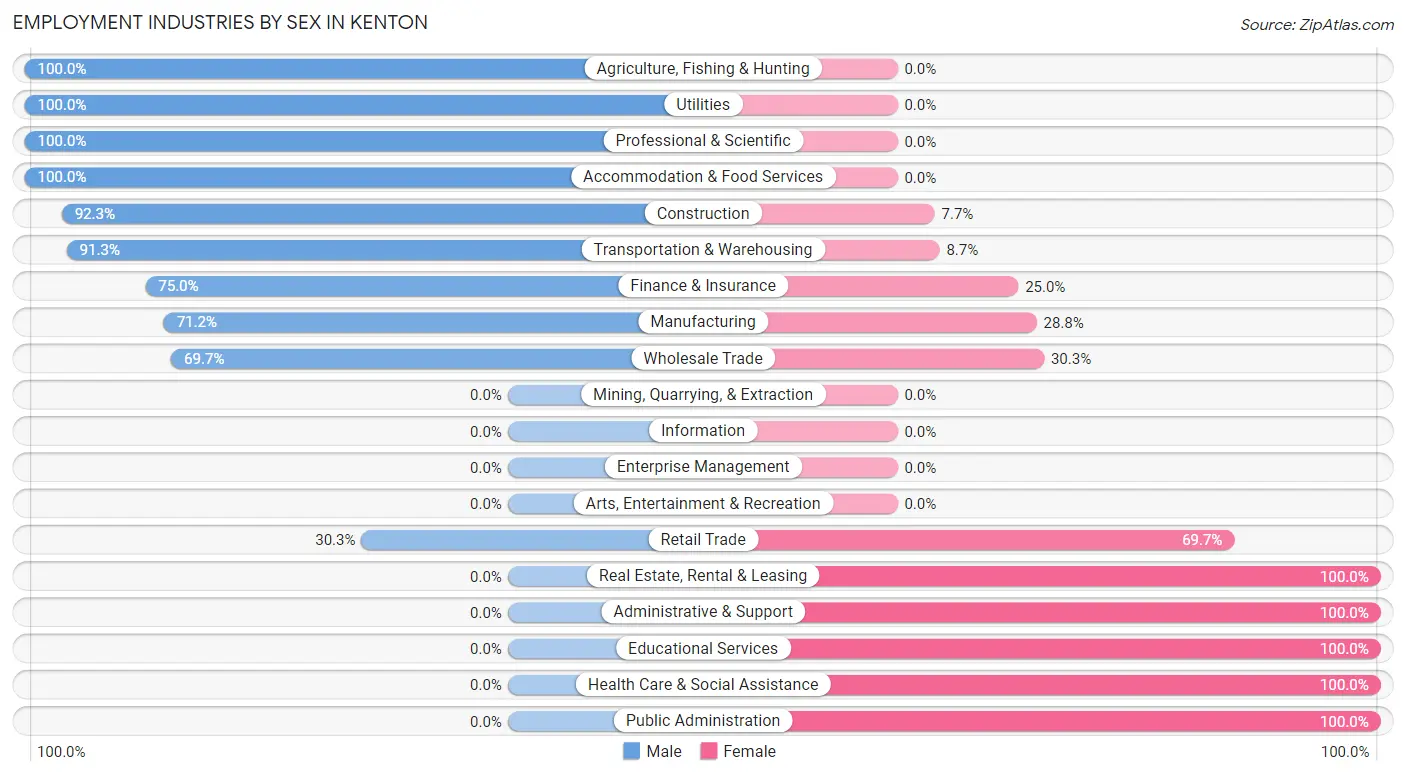
Employment Industries by Sex in Kenton
The Kenton industries that see more men than women are Agriculture, Fishing & Hunting (100.0%), Utilities (100.0%), and Professional & Scientific (100.0%), whereas the industries that tend to have a higher number of women are Real Estate, Rental & Leasing (100.0%), Administrative & Support (100.0%), and Educational Services (100.0%).
| Industry | Male | Female |
| Agriculture, Fishing & Hunting | 6 (100.0%) | 0 (0.0%) |
| Mining, Quarrying, & Extraction | 0 (0.0%) | 0 (0.0%) |
| Construction | 24 (92.3%) | 2 (7.7%) |
| Manufacturing | 89 (71.2%) | 36 (28.8%) |
| Wholesale Trade | 62 (69.7%) | 27 (30.3%) |
| Retail Trade | 10 (30.3%) | 23 (69.7%) |
| Transportation & Warehousing | 21 (91.3%) | 2 (8.7%) |
| Utilities | 10 (100.0%) | 0 (0.0%) |
| Information | 0 (0.0%) | 0 (0.0%) |
| Finance & Insurance | 3 (75.0%) | 1 (25.0%) |
| Real Estate, Rental & Leasing | 0 (0.0%) | 9 (100.0%) |
| Professional & Scientific | 3 (100.0%) | 0 (0.0%) |
| Enterprise Management | 0 (0.0%) | 0 (0.0%) |
| Administrative & Support | 0 (0.0%) | 28 (100.0%) |
| Educational Services | 0 (0.0%) | 21 (100.0%) |
| Health Care & Social Assistance | 0 (0.0%) | 22 (100.0%) |
| Arts, Entertainment & Recreation | 0 (0.0%) | 0 (0.0%) |
| Accommodation & Food Services | 15 (100.0%) | 0 (0.0%) |
| Public Administration | 0 (0.0%) | 11 (100.0%) |
| Total | 285 (58.8%) | 200 (41.2%) |
Education in Kenton
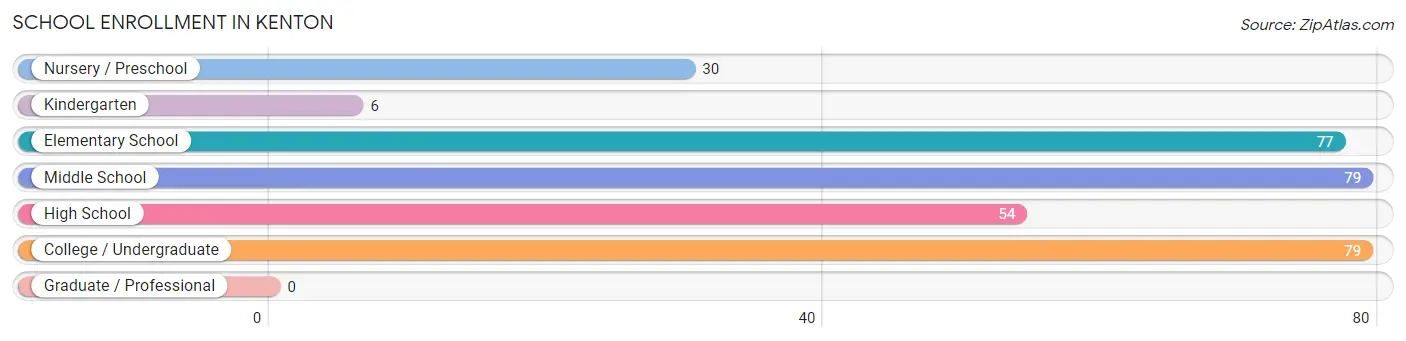
School Enrollment in Kenton
The most common levels of schooling among the 325 students in Kenton are middle school (79 | 24.3%), college / undergraduate (79 | 24.3%), and elementary school (77 | 23.7%).
| School Level | # Students | % Students |
| Nursery / Preschool | 30 | 9.2% |
| Kindergarten | 6 | 1.8% |
| Elementary School | 77 | 23.7% |
| Middle School | 79 | 24.3% |
| High School | 54 | 16.6% |
| College / Undergraduate | 79 | 24.3% |
| Graduate / Professional | 0 | 0.0% |
| Total | 325 | 100.0% |
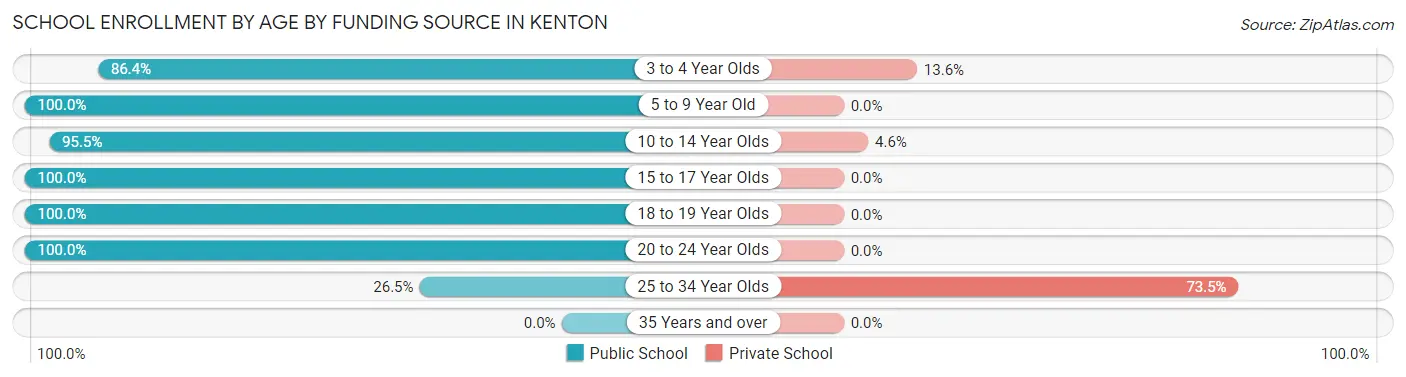
School Enrollment by Age by Funding Source in Kenton
Out of a total of 325 students who are enrolled in schools in Kenton, 57 (17.5%) attend a private institution, while the remaining 268 (82.5%) are enrolled in public schools. The age group of 25 to 34 year olds has the highest likelihood of being enrolled in private schools, with 50 (73.5% in the age bracket) enrolled. Conversely, the age group of 5 to 9 year old has the lowest likelihood of being enrolled in a private school, with 82 (100.0% in the age bracket) attending a public institution.
| Age Bracket | Public School | Private School |
| 3 to 4 Year Olds | 19 (86.4%) | 3 (13.6%) |
| 5 to 9 Year Old | 82 (100.0%) | 0 (0.0%) |
| 10 to 14 Year Olds | 84 (95.5%) | 4 (4.5%) |
| 15 to 17 Year Olds | 44 (100.0%) | 0 (0.0%) |
| 18 to 19 Year Olds | 15 (100.0%) | 0 (0.0%) |
| 20 to 24 Year Olds | 6 (100.0%) | 0 (0.0%) |
| 25 to 34 Year Olds | 18 (26.5%) | 50 (73.5%) |
| 35 Years and over | 0 (0.0%) | 0 (0.0%) |
| Total | 268 (82.5%) | 57 (17.5%) |
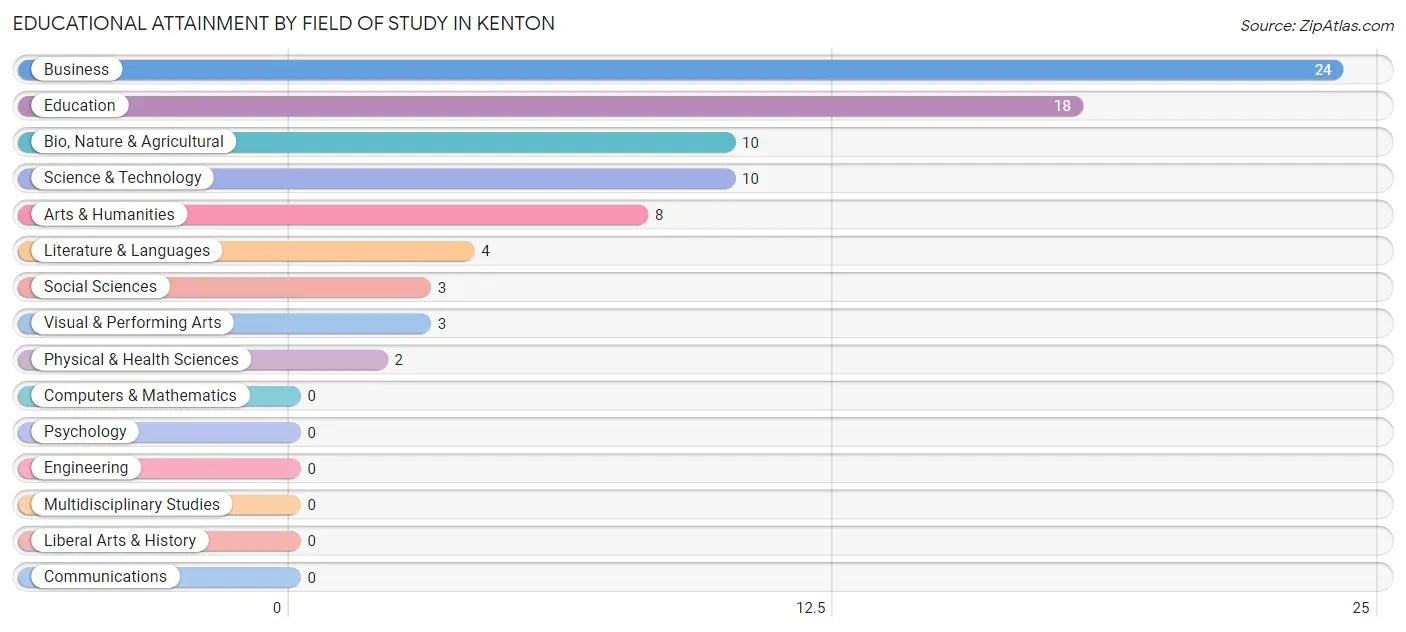
Educational Attainment by Field of Study in Kenton
Business (24 | 29.3%), education (18 | 22.0%), bio, nature & agricultural (10 | 12.2%), science & technology (10 | 12.2%), and arts & humanities (8 | 9.8%) are the most common fields of study among 82 individuals in Kenton who have obtained a bachelor's degree or higher.
| Field of Study | # Graduates | % Graduates |
| Computers & Mathematics | 0 | 0.0% |
| Bio, Nature & Agricultural | 10 | 12.2% |
| Physical & Health Sciences | 2 | 2.4% |
| Psychology | 0 | 0.0% |
| Social Sciences | 3 | 3.7% |
| Engineering | 0 | 0.0% |
| Multidisciplinary Studies | 0 | 0.0% |
| Science & Technology | 10 | 12.2% |
| Business | 24 | 29.3% |
| Education | 18 | 22.0% |
| Literature & Languages | 4 | 4.9% |
| Liberal Arts & History | 0 | 0.0% |
| Visual & Performing Arts | 3 | 3.7% |
| Communications | 0 | 0.0% |
| Arts & Humanities | 8 | 9.8% |
| Total | 82 | 100.0% |
Transportation & Commute in Kenton
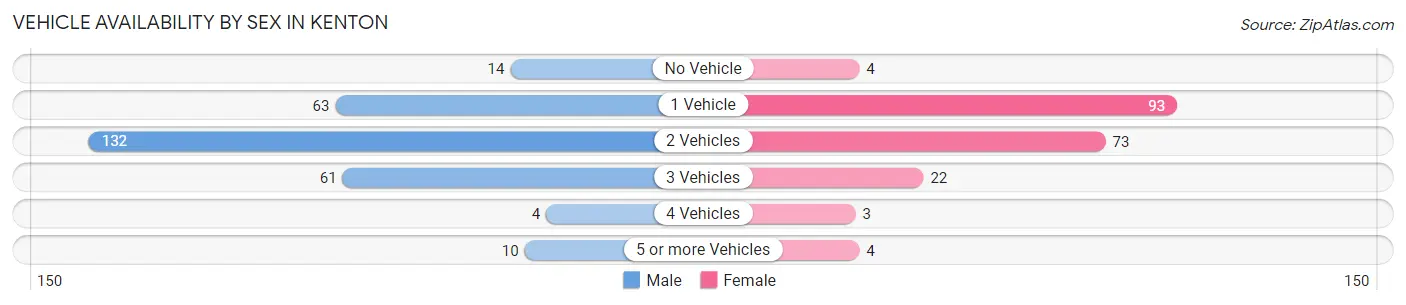
Vehicle Availability by Sex in Kenton
The most prevalent vehicle ownership categories in Kenton are males with 2 vehicles (132, accounting for 46.5%) and females with 2 vehicles (73, making up 66.3%).
| Vehicles Available | Male | Female |
| No Vehicle | 14 (4.9%) | 4 (2.0%) |
| 1 Vehicle | 63 (22.2%) | 93 (46.7%) |
| 2 Vehicles | 132 (46.5%) | 73 (36.7%) |
| 3 Vehicles | 61 (21.5%) | 22 (11.1%) |
| 4 Vehicles | 4 (1.4%) | 3 (1.5%) |
| 5 or more Vehicles | 10 (3.5%) | 4 (2.0%) |
| Total | 284 (100.0%) | 199 (100.0%) |
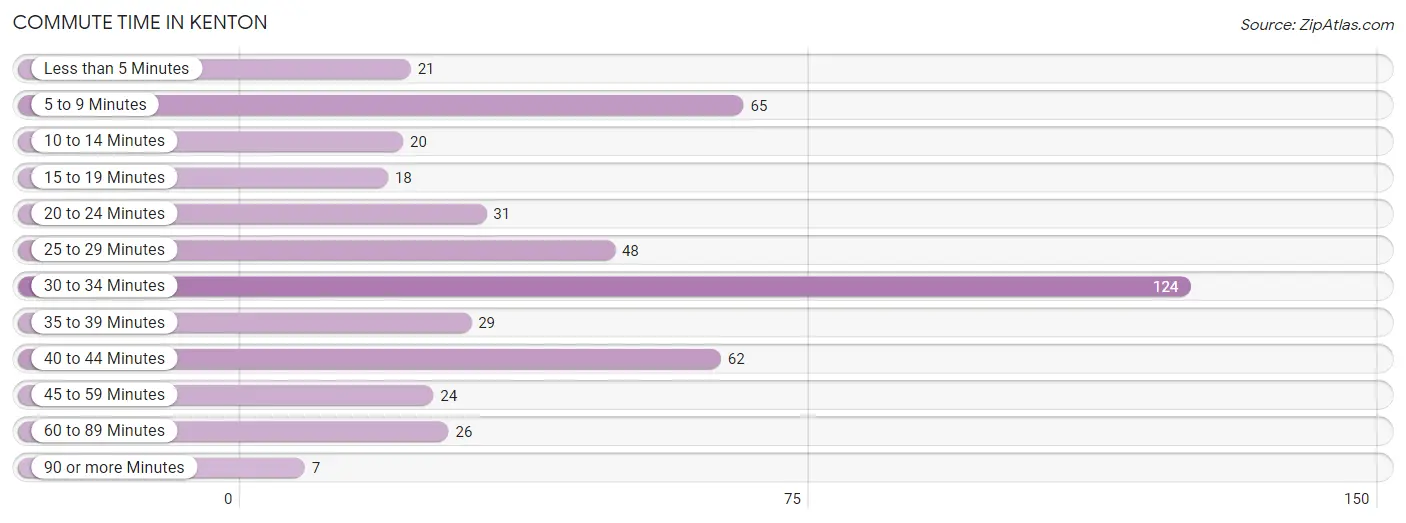
Commute Time in Kenton
The most frequently occuring commute durations in Kenton are 30 to 34 minutes (124 commuters, 26.1%), 5 to 9 minutes (65 commuters, 13.7%), and 40 to 44 minutes (62 commuters, 13.1%).
| Commute Time | # Commuters | % Commuters |
| Less than 5 Minutes | 21 | 4.4% |
| 5 to 9 Minutes | 65 | 13.7% |
| 10 to 14 Minutes | 20 | 4.2% |
| 15 to 19 Minutes | 18 | 3.8% |
| 20 to 24 Minutes | 31 | 6.5% |
| 25 to 29 Minutes | 48 | 10.1% |
| 30 to 34 Minutes | 124 | 26.1% |
| 35 to 39 Minutes | 29 | 6.1% |
| 40 to 44 Minutes | 62 | 13.1% |
| 45 to 59 Minutes | 24 | 5.1% |
| 60 to 89 Minutes | 26 | 5.5% |
| 90 or more Minutes | 7 | 1.5% |
Commute Time by Sex in Kenton
The most common commute times in Kenton are 30 to 34 minutes (66 commuters, 23.6%) for males and 30 to 34 minutes (58 commuters, 29.7%) for females.
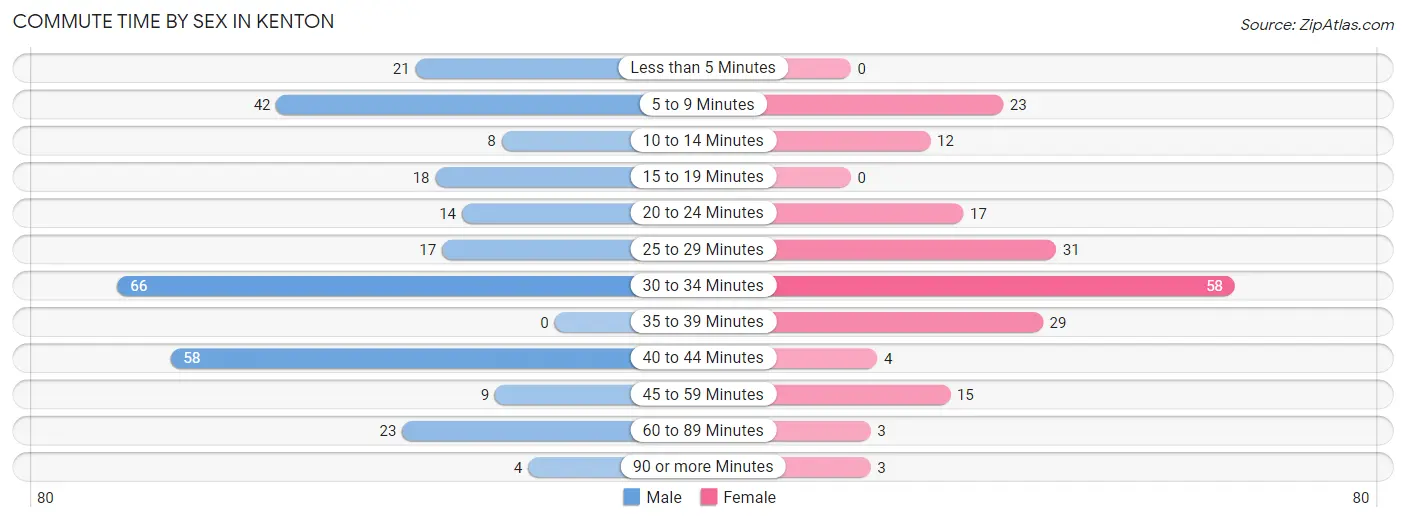
| Commute Time | Male | Female |
| Less than 5 Minutes | 21 (7.5%) | 0 (0.0%) |
| 5 to 9 Minutes | 42 (15.0%) | 23 (11.8%) |
| 10 to 14 Minutes | 8 (2.9%) | 12 (6.1%) |
| 15 to 19 Minutes | 18 (6.4%) | 0 (0.0%) |
| 20 to 24 Minutes | 14 (5.0%) | 17 (8.7%) |
| 25 to 29 Minutes | 17 (6.1%) | 31 (15.9%) |
| 30 to 34 Minutes | 66 (23.6%) | 58 (29.7%) |
| 35 to 39 Minutes | 0 (0.0%) | 29 (14.9%) |
| 40 to 44 Minutes | 58 (20.7%) | 4 (2.1%) |
| 45 to 59 Minutes | 9 (3.2%) | 15 (7.7%) |
| 60 to 89 Minutes | 23 (8.2%) | 3 (1.5%) |
| 90 or more Minutes | 4 (1.4%) | 3 (1.5%) |
Time of Departure to Work by Sex in Kenton
The most frequent times of departure to work in Kenton are 7:30 AM to 7:59 AM (52, 18.6%) for males and 7:00 AM to 7:29 AM (43, 22.1%) for females.
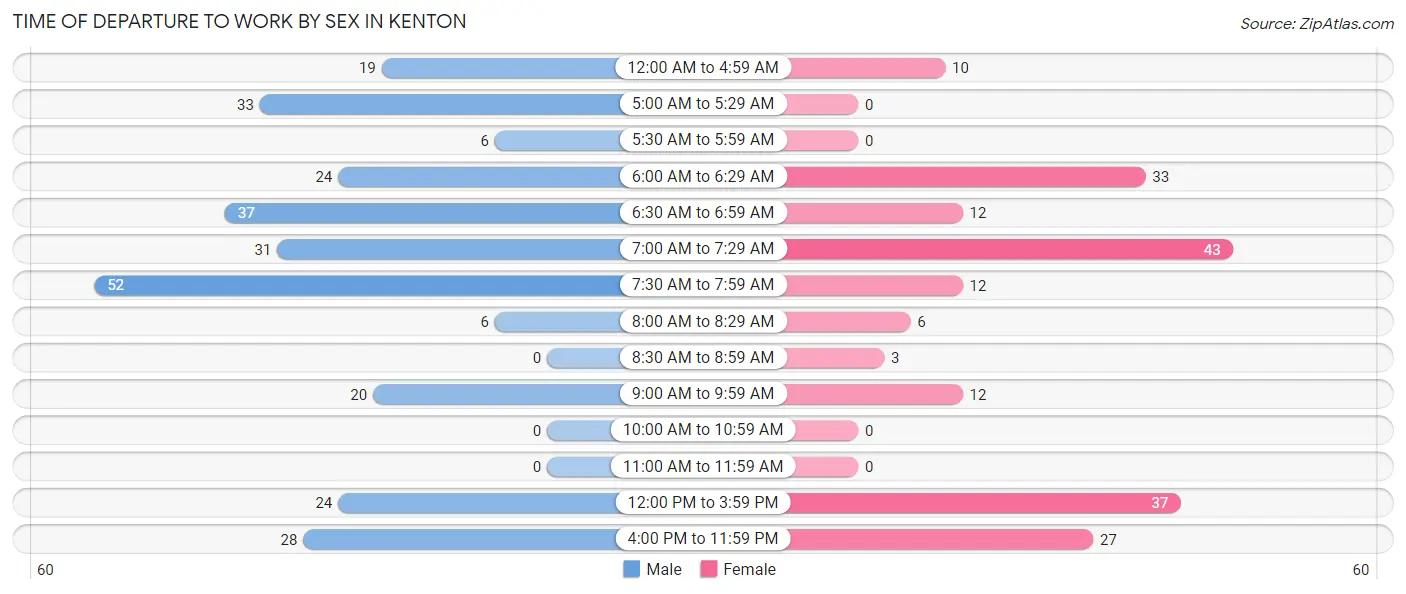
| Time of Departure | Male | Female |
| 12:00 AM to 4:59 AM | 19 (6.8%) | 10 (5.1%) |
| 5:00 AM to 5:29 AM | 33 (11.8%) | 0 (0.0%) |
| 5:30 AM to 5:59 AM | 6 (2.1%) | 0 (0.0%) |
| 6:00 AM to 6:29 AM | 24 (8.6%) | 33 (16.9%) |
| 6:30 AM to 6:59 AM | 37 (13.2%) | 12 (6.1%) |
| 7:00 AM to 7:29 AM | 31 (11.1%) | 43 (22.1%) |
| 7:30 AM to 7:59 AM | 52 (18.6%) | 12 (6.1%) |
| 8:00 AM to 8:29 AM | 6 (2.1%) | 6 (3.1%) |
| 8:30 AM to 8:59 AM | 0 (0.0%) | 3 (1.5%) |
| 9:00 AM to 9:59 AM | 20 (7.1%) | 12 (6.1%) |
| 10:00 AM to 10:59 AM | 0 (0.0%) | 0 (0.0%) |
| 11:00 AM to 11:59 AM | 0 (0.0%) | 0 (0.0%) |
| 12:00 PM to 3:59 PM | 24 (8.6%) | 37 (19.0%) |
| 4:00 PM to 11:59 PM | 28 (10.0%) | 27 (13.9%) |
| Total | 280 (100.0%) | 195 (100.0%) |
Housing Occupancy in Kenton
Occupancy by Ownership in Kenton
Of the total 582 dwellings in Kenton, owner-occupied units account for 354 (60.8%), while renter-occupied units make up 228 (39.2%).
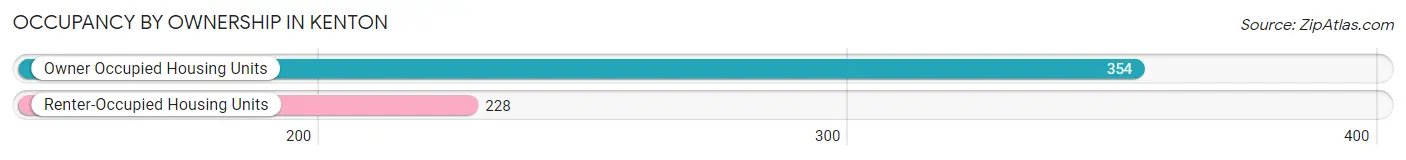
| Occupancy | # Housing Units | % Housing Units |
| Owner Occupied Housing Units | 354 | 60.8% |
| Renter-Occupied Housing Units | 228 | 39.2% |
| Total Occupied Housing Units | 582 | 100.0% |
Occupancy by Household Size in Kenton
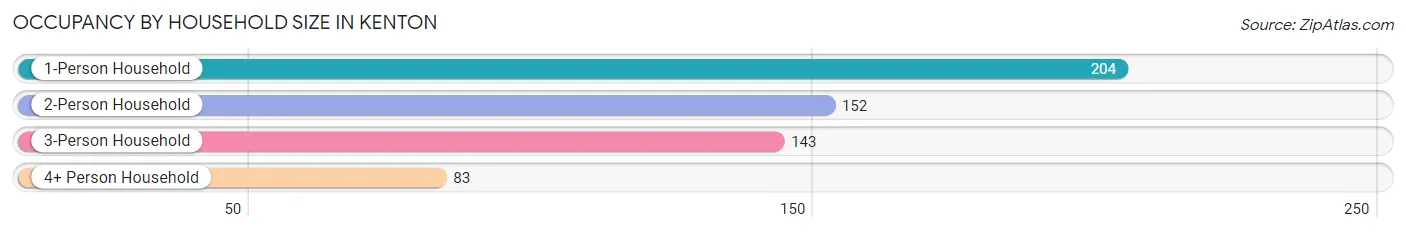
| Household Size | # Housing Units | % Housing Units |
| 1-Person Household | 204 | 35.0% |
| 2-Person Household | 152 | 26.1% |
| 3-Person Household | 143 | 24.6% |
| 4+ Person Household | 83 | 14.3% |
| Total Housing Units | 582 | 100.0% |
Occupancy by Ownership by Household Size in Kenton
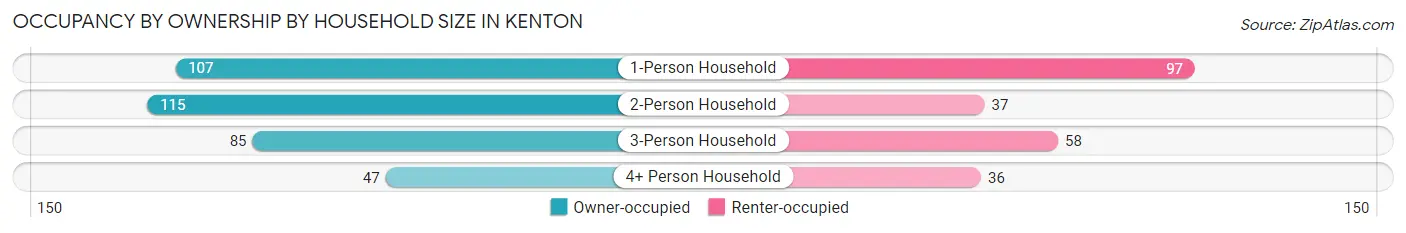
| Household Size | Owner-occupied | Renter-occupied |
| 1-Person Household | 107 (52.4%) | 97 (47.5%) |
| 2-Person Household | 115 (75.7%) | 37 (24.3%) |
| 3-Person Household | 85 (59.4%) | 58 (40.6%) |
| 4+ Person Household | 47 (56.6%) | 36 (43.4%) |
| Total Housing Units | 354 (60.8%) | 228 (39.2%) |
Occupancy by Educational Attainment in Kenton
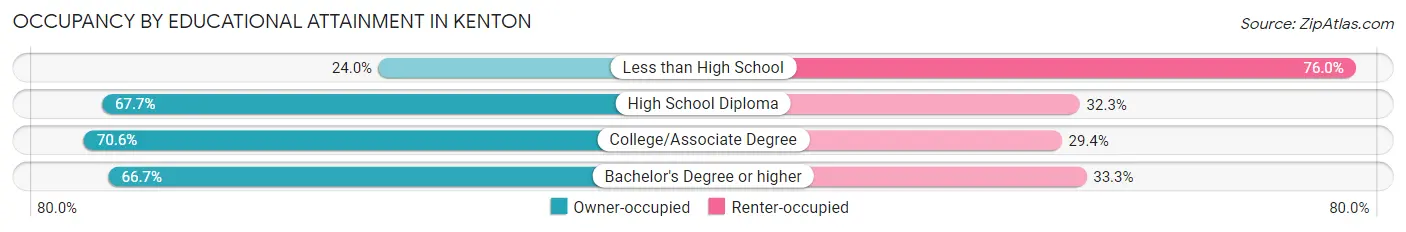
| Household Size | Owner-occupied | Renter-occupied |
| Less than High School | 23 (24.0%) | 73 (76.0%) |
| High School Diploma | 235 (67.7%) | 112 (32.3%) |
| College/Associate Degree | 60 (70.6%) | 25 (29.4%) |
| Bachelor's Degree or higher | 36 (66.7%) | 18 (33.3%) |
Occupancy by Age of Householder in Kenton
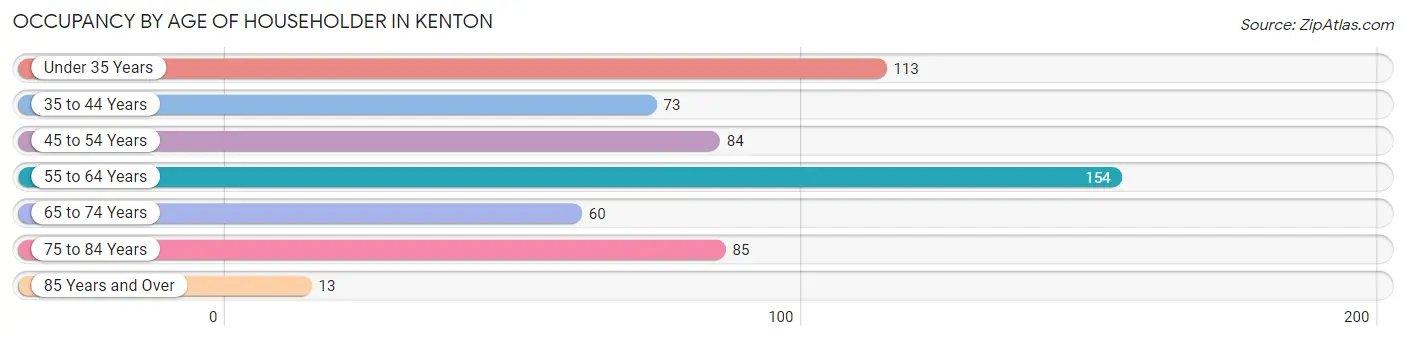
| Age Bracket | # Households | % Households |
| Under 35 Years | 113 | 19.4% |
| 35 to 44 Years | 73 | 12.5% |
| 45 to 54 Years | 84 | 14.4% |
| 55 to 64 Years | 154 | 26.5% |
| 65 to 74 Years | 60 | 10.3% |
| 75 to 84 Years | 85 | 14.6% |
| 85 Years and Over | 13 | 2.2% |
| Total | 582 | 100.0% |
Housing Finances in Kenton
Median Income by Occupancy in Kenton
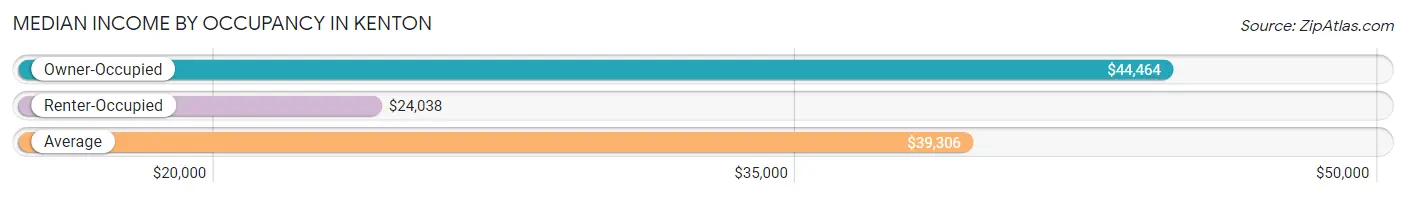
| Occupancy Type | # Households | Median Income |
| Owner-Occupied | 354 (60.8%) | $44,464 |
| Renter-Occupied | 228 (39.2%) | $24,038 |
| Average | 582 (100.0%) | $39,306 |
Occupancy by Householder Income Bracket in Kenton
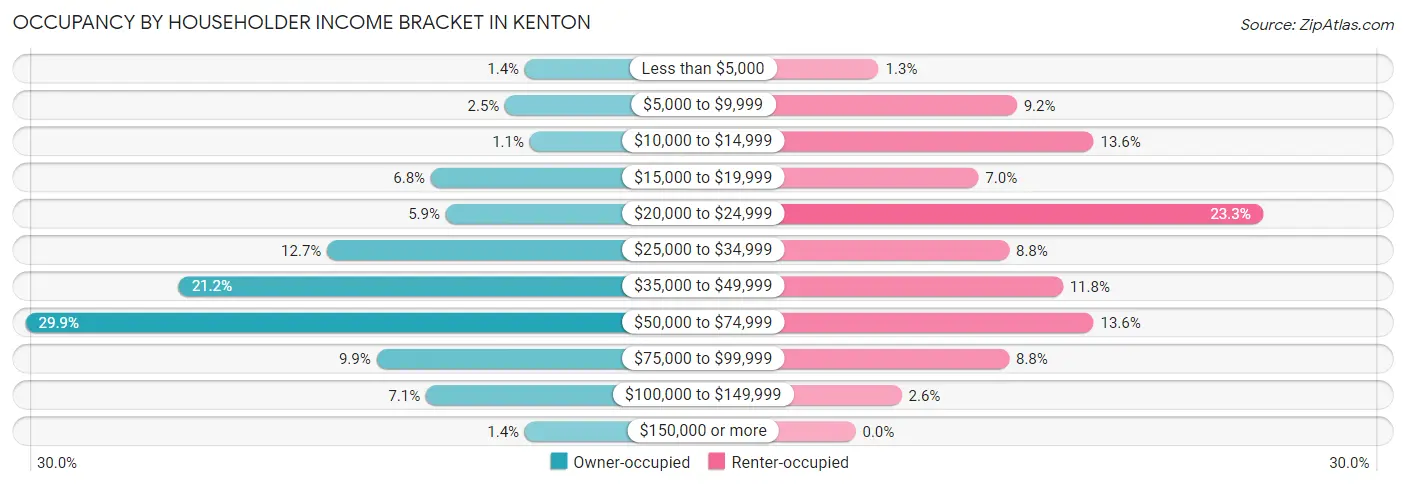
| Income Bracket | Owner-occupied | Renter-occupied |
| Less than $5,000 | 5 (1.4%) | 3 (1.3%) |
| $5,000 to $9,999 | 9 (2.5%) | 21 (9.2%) |
| $10,000 to $14,999 | 4 (1.1%) | 31 (13.6%) |
| $15,000 to $19,999 | 24 (6.8%) | 16 (7.0%) |
| $20,000 to $24,999 | 21 (5.9%) | 53 (23.3%) |
| $25,000 to $34,999 | 45 (12.7%) | 20 (8.8%) |
| $35,000 to $49,999 | 75 (21.2%) | 27 (11.8%) |
| $50,000 to $74,999 | 106 (29.9%) | 31 (13.6%) |
| $75,000 to $99,999 | 35 (9.9%) | 20 (8.8%) |
| $100,000 to $149,999 | 25 (7.1%) | 6 (2.6%) |
| $150,000 or more | 5 (1.4%) | 0 (0.0%) |
| Total | 354 (100.0%) | 228 (100.0%) |
Monthly Housing Cost Tiers in Kenton
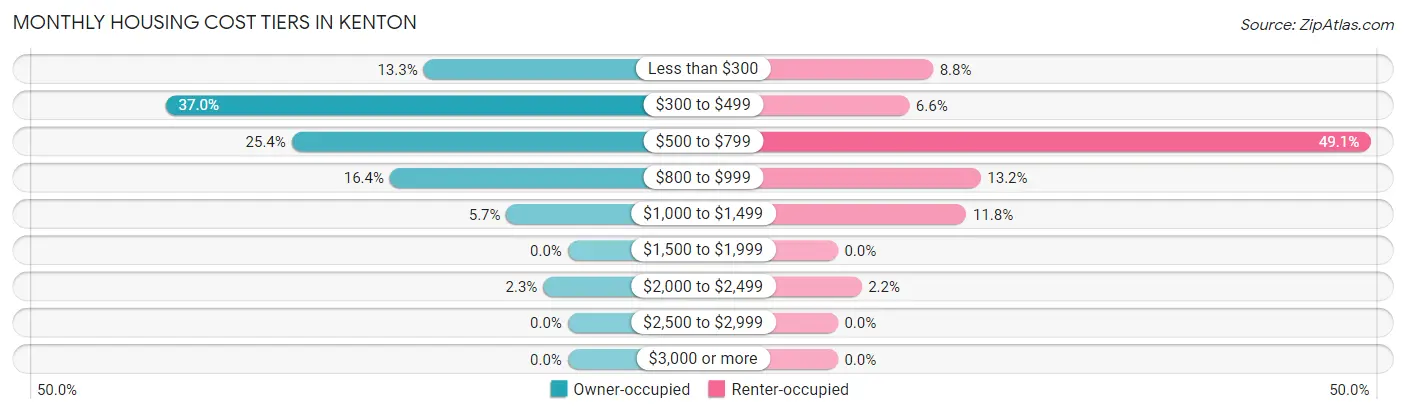
| Monthly Cost | Owner-occupied | Renter-occupied |
| Less than $300 | 47 (13.3%) | 20 (8.8%) |
| $300 to $499 | 131 (37.0%) | 15 (6.6%) |
| $500 to $799 | 90 (25.4%) | 112 (49.1%) |
| $800 to $999 | 58 (16.4%) | 30 (13.2%) |
| $1,000 to $1,499 | 20 (5.7%) | 27 (11.8%) |
| $1,500 to $1,999 | 0 (0.0%) | 0 (0.0%) |
| $2,000 to $2,499 | 8 (2.3%) | 5 (2.2%) |
| $2,500 to $2,999 | 0 (0.0%) | 0 (0.0%) |
| $3,000 or more | 0 (0.0%) | 0 (0.0%) |
| Total | 354 (100.0%) | 228 (100.0%) |
Physical Housing Characteristics in Kenton
Housing Structures in Kenton
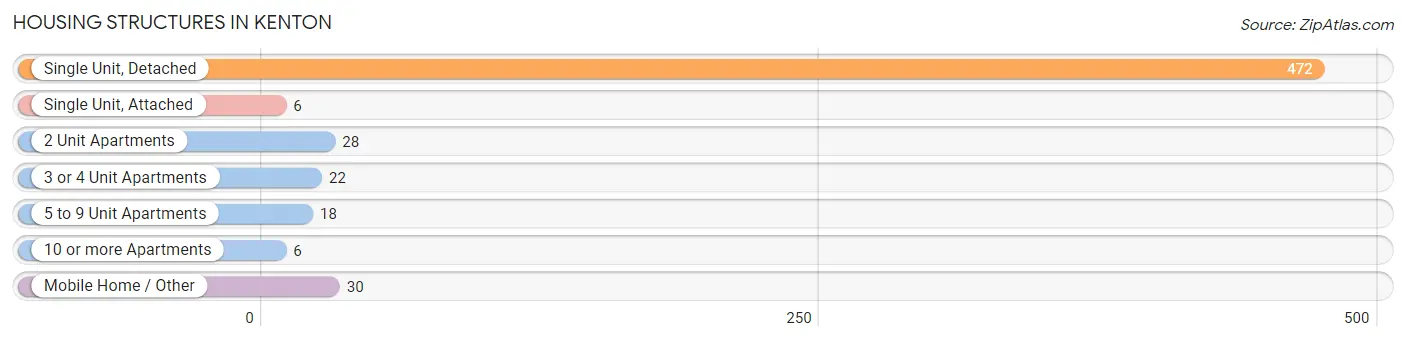
| Structure Type | # Housing Units | % Housing Units |
| Single Unit, Detached | 472 | 81.1% |
| Single Unit, Attached | 6 | 1.0% |
| 2 Unit Apartments | 28 | 4.8% |
| 3 or 4 Unit Apartments | 22 | 3.8% |
| 5 to 9 Unit Apartments | 18 | 3.1% |
| 10 or more Apartments | 6 | 1.0% |
| Mobile Home / Other | 30 | 5.1% |
| Total | 582 | 100.0% |
Housing Structures by Occupancy in Kenton
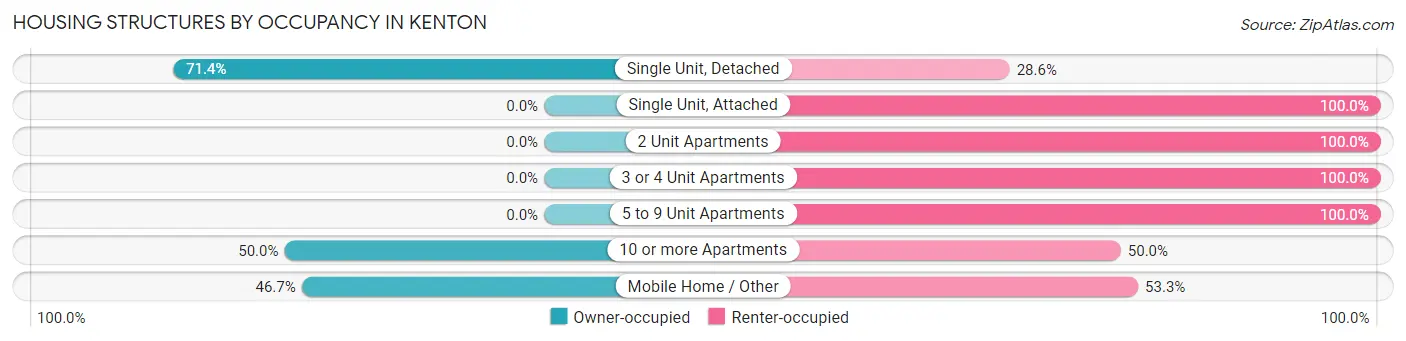
| Structure Type | Owner-occupied | Renter-occupied |
| Single Unit, Detached | 337 (71.4%) | 135 (28.6%) |
| Single Unit, Attached | 0 (0.0%) | 6 (100.0%) |
| 2 Unit Apartments | 0 (0.0%) | 28 (100.0%) |
| 3 or 4 Unit Apartments | 0 (0.0%) | 22 (100.0%) |
| 5 to 9 Unit Apartments | 0 (0.0%) | 18 (100.0%) |
| 10 or more Apartments | 3 (50.0%) | 3 (50.0%) |
| Mobile Home / Other | 14 (46.7%) | 16 (53.3%) |
| Total | 354 (60.8%) | 228 (39.2%) |
Housing Structures by Number of Rooms in Kenton
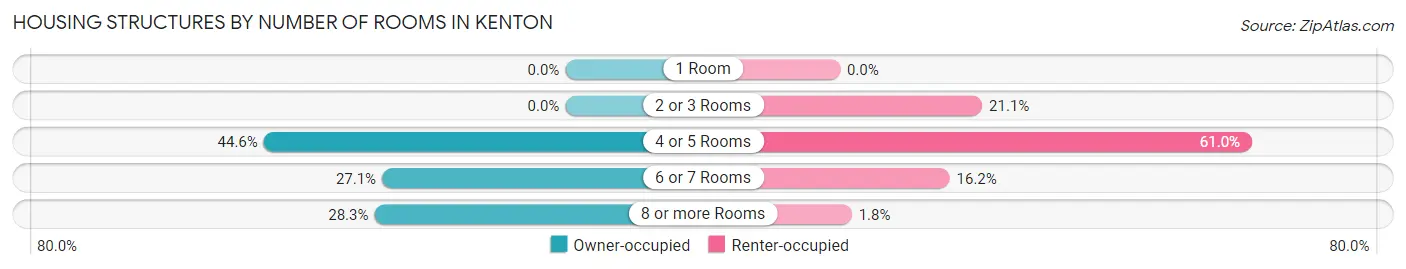
| Number of Rooms | Owner-occupied | Renter-occupied |
| 1 Room | 0 (0.0%) | 0 (0.0%) |
| 2 or 3 Rooms | 0 (0.0%) | 48 (21.0%) |
| 4 or 5 Rooms | 158 (44.6%) | 139 (61.0%) |
| 6 or 7 Rooms | 96 (27.1%) | 37 (16.2%) |
| 8 or more Rooms | 100 (28.2%) | 4 (1.8%) |
| Total | 354 (100.0%) | 228 (100.0%) |
Housing Structure by Heating Type in Kenton
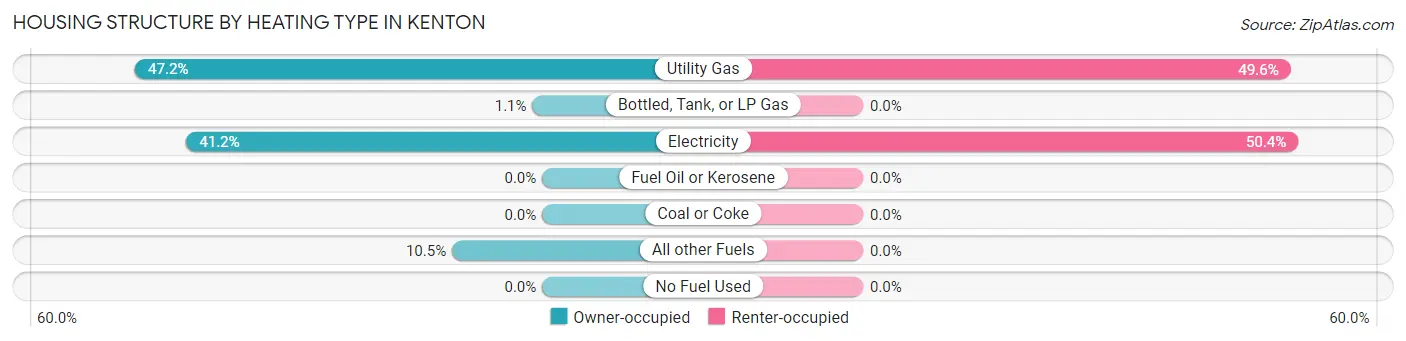
| Heating Type | Owner-occupied | Renter-occupied |
| Utility Gas | 167 (47.2%) | 113 (49.6%) |
| Bottled, Tank, or LP Gas | 4 (1.1%) | 0 (0.0%) |
| Electricity | 146 (41.2%) | 115 (50.4%) |
| Fuel Oil or Kerosene | 0 (0.0%) | 0 (0.0%) |
| Coal or Coke | 0 (0.0%) | 0 (0.0%) |
| All other Fuels | 37 (10.4%) | 0 (0.0%) |
| No Fuel Used | 0 (0.0%) | 0 (0.0%) |
| Total | 354 (100.0%) | 228 (100.0%) |
Household Vehicle Usage in Kenton
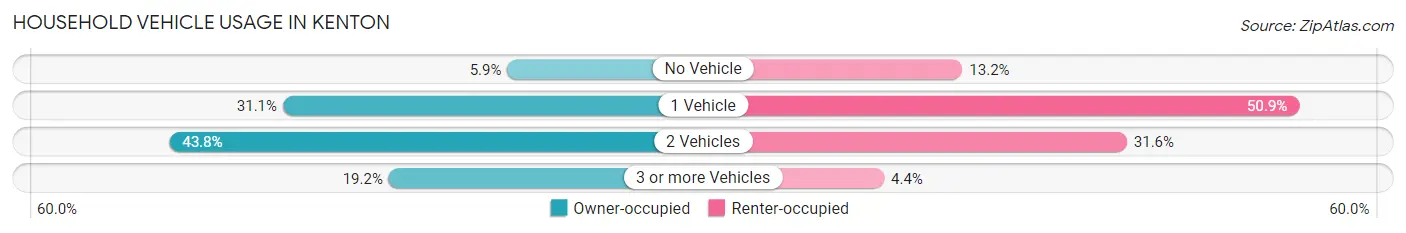
| Vehicles per Household | Owner-occupied | Renter-occupied |
| No Vehicle | 21 (5.9%) | 30 (13.2%) |
| 1 Vehicle | 110 (31.1%) | 116 (50.9%) |
| 2 Vehicles | 155 (43.8%) | 72 (31.6%) |
| 3 or more Vehicles | 68 (19.2%) | 10 (4.4%) |
| Total | 354 (100.0%) | 228 (100.0%) |
Real Estate & Mortgages in Kenton
Real Estate and Mortgage Overview in Kenton
| Characteristic | Without Mortgage | With Mortgage |
| Housing Units | 224 | 130 |
| Median Property Value | $88,400 | $76,700 |
| Median Household Income | $39,737 | $0 |
| Monthly Housing Costs | $416 | $0 |
| Real Estate Taxes | $847 | $10 |
Property Value by Mortgage Status in Kenton
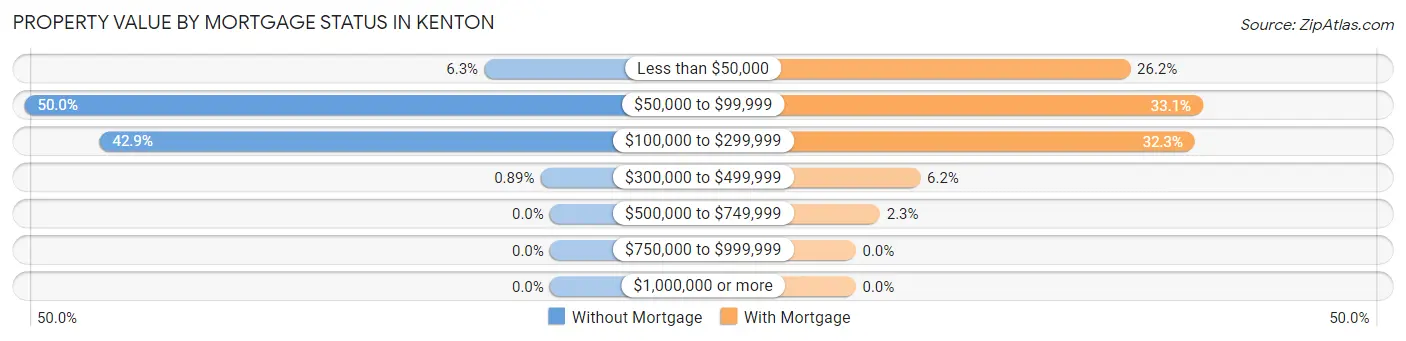
| Property Value | Without Mortgage | With Mortgage |
| Less than $50,000 | 14 (6.2%) | 34 (26.2%) |
| $50,000 to $99,999 | 112 (50.0%) | 43 (33.1%) |
| $100,000 to $299,999 | 96 (42.9%) | 42 (32.3%) |
| $300,000 to $499,999 | 2 (0.9%) | 8 (6.1%) |
| $500,000 to $749,999 | 0 (0.0%) | 3 (2.3%) |
| $750,000 to $999,999 | 0 (0.0%) | 0 (0.0%) |
| $1,000,000 or more | 0 (0.0%) | 0 (0.0%) |
| Total | 224 (100.0%) | 130 (100.0%) |
Household Income by Mortgage Status in Kenton
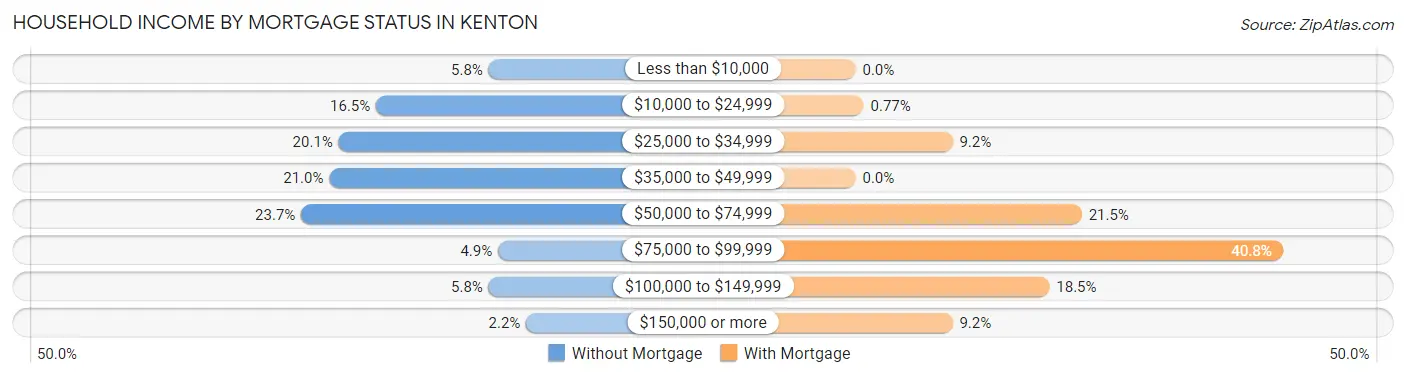
| Household Income | Without Mortgage | With Mortgage |
| Less than $10,000 | 13 (5.8%) | 0 (0.0%) |
| $10,000 to $24,999 | 37 (16.5%) | 1 (0.8%) |
| $25,000 to $34,999 | 45 (20.1%) | 12 (9.2%) |
| $35,000 to $49,999 | 47 (21.0%) | 0 (0.0%) |
| $50,000 to $74,999 | 53 (23.7%) | 28 (21.5%) |
| $75,000 to $99,999 | 11 (4.9%) | 53 (40.8%) |
| $100,000 to $149,999 | 13 (5.8%) | 24 (18.5%) |
| $150,000 or more | 5 (2.2%) | 12 (9.2%) |
| Total | 224 (100.0%) | 130 (100.0%) |
Property Value to Household Income Ratio in Kenton
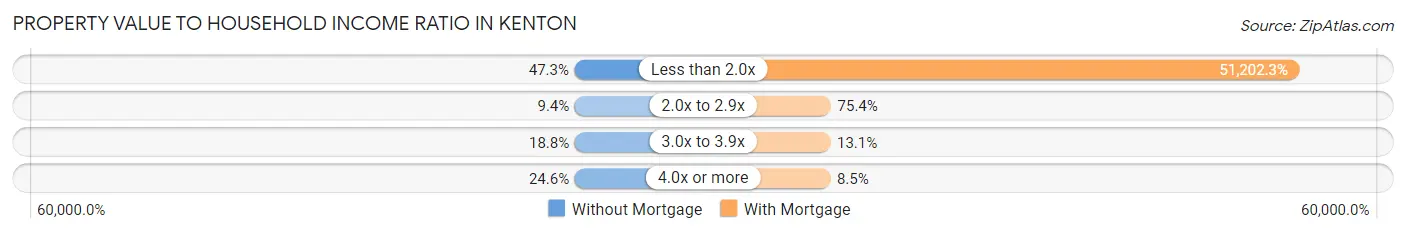
| Value-to-Income Ratio | Without Mortgage | With Mortgage |
| Less than 2.0x | 106 (47.3%) | 66,563 (51,202.3%) |
| 2.0x to 2.9x | 21 (9.4%) | 98 (75.4%) |
| 3.0x to 3.9x | 42 (18.8%) | 17 (13.1%) |
| 4.0x or more | 55 (24.5%) | 11 (8.5%) |
| Total | 224 (100.0%) | 130 (100.0%) |
Real Estate Taxes by Mortgage Status in Kenton
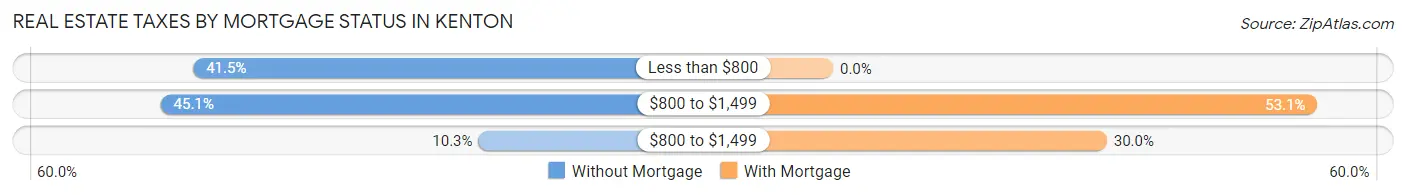
| Property Taxes | Without Mortgage | With Mortgage |
| Less than $800 | 93 (41.5%) | 0 (0.0%) |
| $800 to $1,499 | 101 (45.1%) | 69 (53.1%) |
| $800 to $1,499 | 23 (10.3%) | 39 (30.0%) |
| Total | 224 (100.0%) | 130 (100.0%) |
Health & Disability in Kenton
Health Insurance Coverage by Age in Kenton
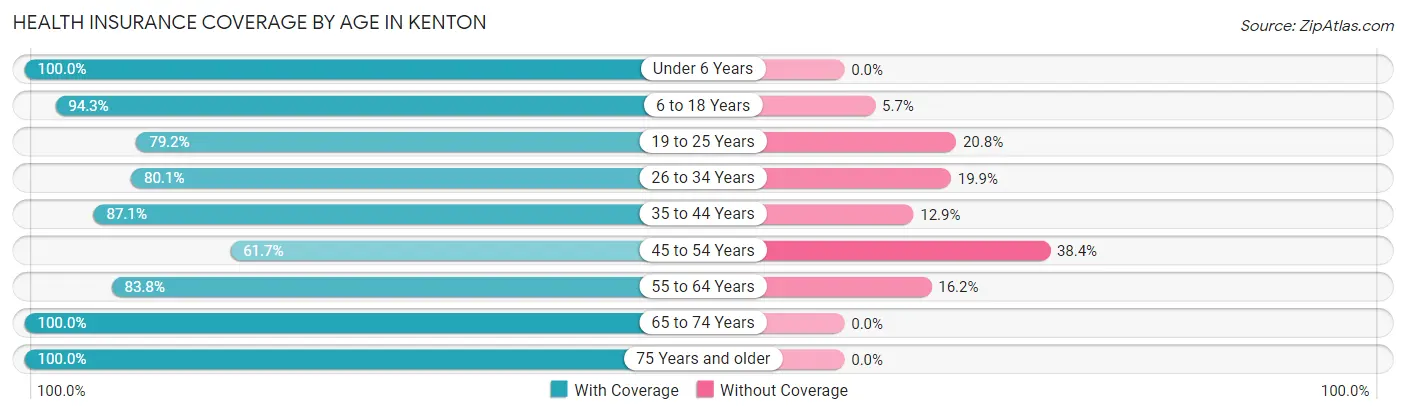
| Age Bracket | With Coverage | Without Coverage |
| Under 6 Years | 84 (100.0%) | 0 (0.0%) |
| 6 to 18 Years | 197 (94.3%) | 12 (5.7%) |
| 19 to 25 Years | 57 (79.2%) | 15 (20.8%) |
| 26 to 34 Years | 226 (80.1%) | 56 (19.9%) |
| 35 to 44 Years | 88 (87.1%) | 13 (12.9%) |
| 45 to 54 Years | 82 (61.7%) | 51 (38.4%) |
| 55 to 64 Years | 217 (83.8%) | 42 (16.2%) |
| 65 to 74 Years | 94 (100.0%) | 0 (0.0%) |
| 75 Years and older | 179 (100.0%) | 0 (0.0%) |
| Total | 1,224 (86.6%) | 189 (13.4%) |
Health Insurance Coverage by Citizenship Status in Kenton
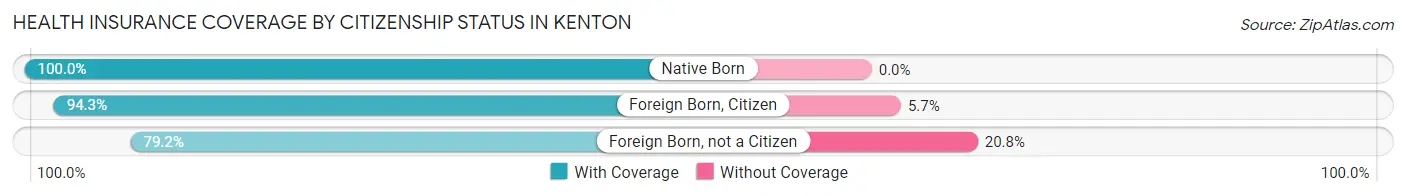
| Citizenship Status | With Coverage | Without Coverage |
| Native Born | 84 (100.0%) | 0 (0.0%) |
| Foreign Born, Citizen | 197 (94.3%) | 12 (5.7%) |
| Foreign Born, not a Citizen | 57 (79.2%) | 15 (20.8%) |
Health Insurance Coverage by Household Income in Kenton
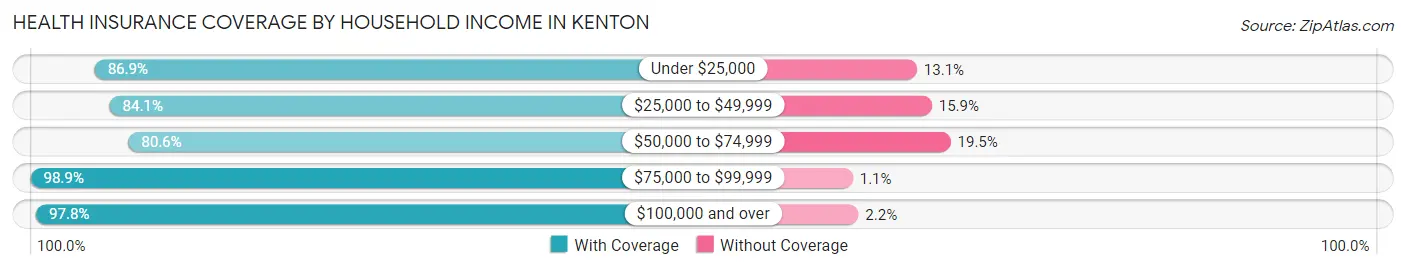
| Household Income | With Coverage | Without Coverage |
| Under $25,000 | 304 (86.9%) | 46 (13.1%) |
| $25,000 to $49,999 | 359 (84.1%) | 68 (15.9%) |
| $50,000 to $74,999 | 294 (80.5%) | 71 (19.5%) |
| $75,000 to $99,999 | 177 (98.9%) | 2 (1.1%) |
| $100,000 and over | 90 (97.8%) | 2 (2.2%) |
Public vs Private Health Insurance Coverage by Age in Kenton
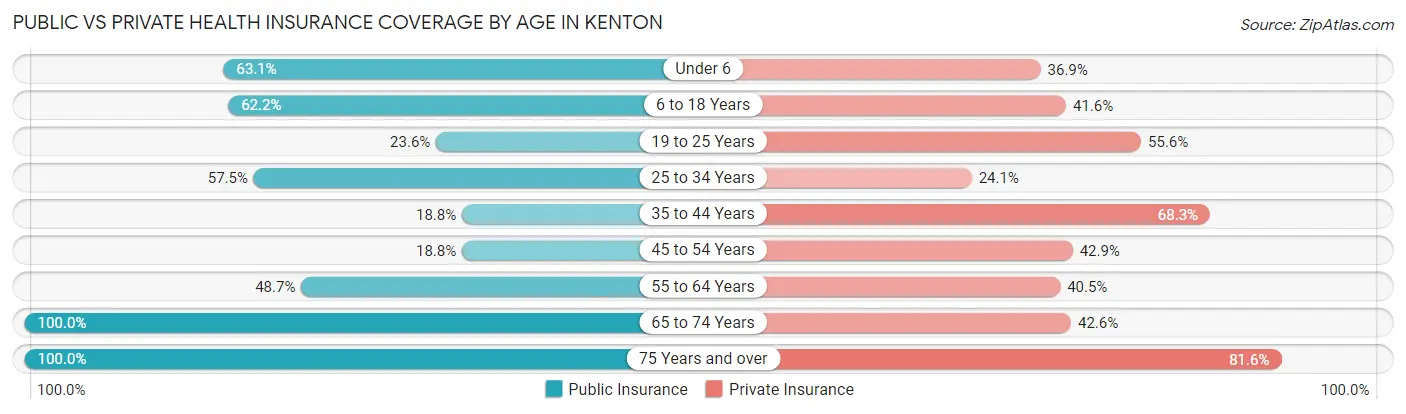
| Age Bracket | Public Insurance | Private Insurance |
| Under 6 | 53 (63.1%) | 31 (36.9%) |
| 6 to 18 Years | 130 (62.2%) | 87 (41.6%) |
| 19 to 25 Years | 17 (23.6%) | 40 (55.6%) |
| 25 to 34 Years | 162 (57.5%) | 68 (24.1%) |
| 35 to 44 Years | 19 (18.8%) | 69 (68.3%) |
| 45 to 54 Years | 25 (18.8%) | 57 (42.9%) |
| 55 to 64 Years | 126 (48.6%) | 105 (40.5%) |
| 65 to 74 Years | 94 (100.0%) | 40 (42.5%) |
| 75 Years and over | 179 (100.0%) | 146 (81.6%) |
| Total | 805 (57.0%) | 643 (45.5%) |
Disability Status by Sex by Age in Kenton
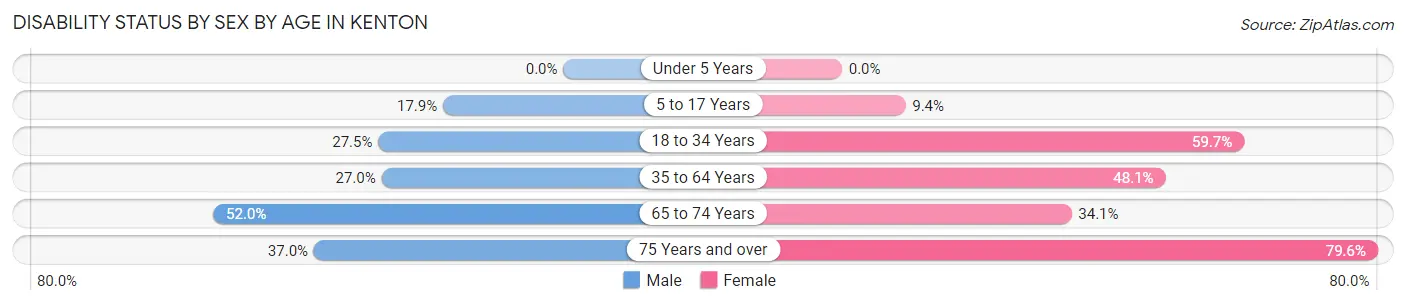
| Age Bracket | Male | Female |
| Under 5 Years | 0 (0.0%) | 0 (0.0%) |
| 5 to 17 Years | 20 (17.9%) | 10 (9.4%) |
| 18 to 34 Years | 61 (27.5%) | 86 (59.7%) |
| 35 to 64 Years | 64 (27.0%) | 123 (48.0%) |
| 65 to 74 Years | 26 (52.0%) | 15 (34.1%) |
| 75 Years and over | 30 (37.0%) | 78 (79.6%) |
Disability Class by Sex by Age in Kenton
Disability Class: Hearing Difficulty
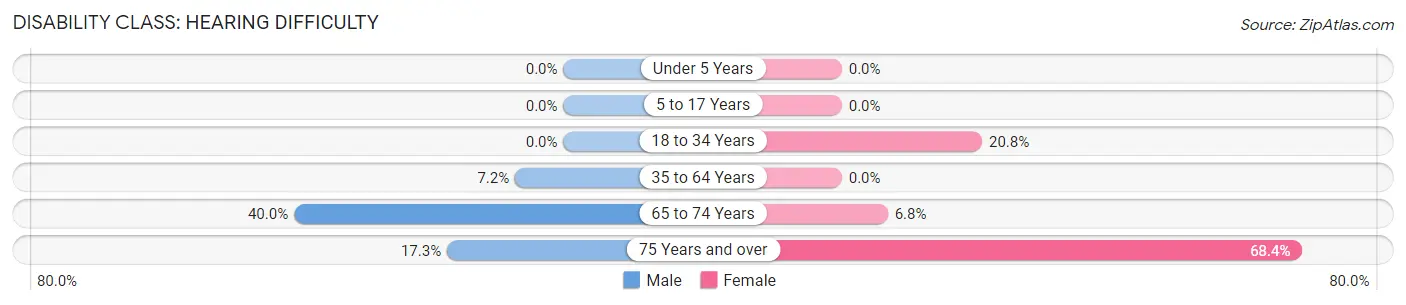
| Age Bracket | Male | Female |
| Under 5 Years | 0 (0.0%) | 0 (0.0%) |
| 5 to 17 Years | 0 (0.0%) | 0 (0.0%) |
| 18 to 34 Years | 0 (0.0%) | 30 (20.8%) |
| 35 to 64 Years | 17 (7.2%) | 0 (0.0%) |
| 65 to 74 Years | 20 (40.0%) | 3 (6.8%) |
| 75 Years and over | 14 (17.3%) | 67 (68.4%) |
Disability Class: Vision Difficulty
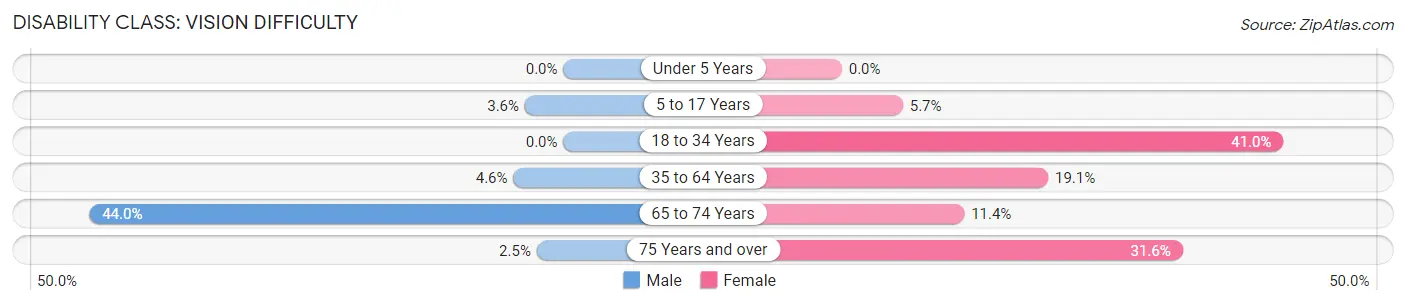
| Age Bracket | Male | Female |
| Under 5 Years | 0 (0.0%) | 0 (0.0%) |
| 5 to 17 Years | 4 (3.6%) | 6 (5.7%) |
| 18 to 34 Years | 0 (0.0%) | 59 (41.0%) |
| 35 to 64 Years | 11 (4.6%) | 49 (19.1%) |
| 65 to 74 Years | 22 (44.0%) | 5 (11.4%) |
| 75 Years and over | 2 (2.5%) | 31 (31.6%) |
Disability Class: Cognitive Difficulty
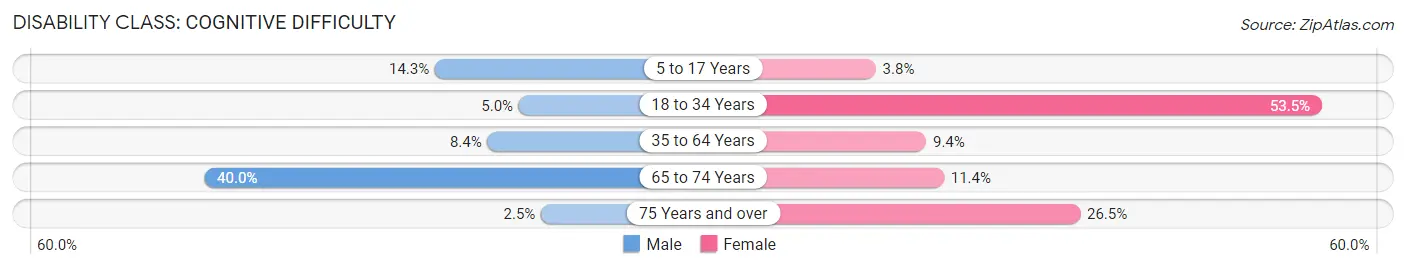
| Age Bracket | Male | Female |
| 5 to 17 Years | 16 (14.3%) | 4 (3.8%) |
| 18 to 34 Years | 11 (5.0%) | 77 (53.5%) |
| 35 to 64 Years | 20 (8.4%) | 24 (9.4%) |
| 65 to 74 Years | 20 (40.0%) | 5 (11.4%) |
| 75 Years and over | 2 (2.5%) | 26 (26.5%) |
Disability Class: Ambulatory Difficulty
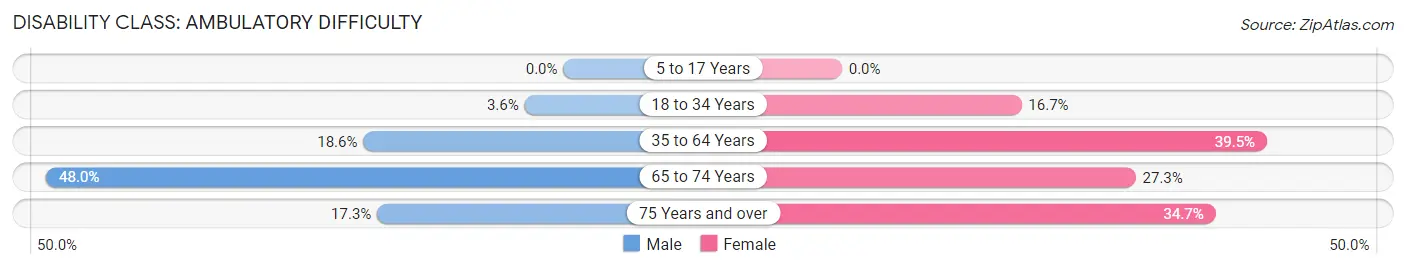
| Age Bracket | Male | Female |
| 5 to 17 Years | 0 (0.0%) | 0 (0.0%) |
| 18 to 34 Years | 8 (3.6%) | 24 (16.7%) |
| 35 to 64 Years | 44 (18.6%) | 101 (39.5%) |
| 65 to 74 Years | 24 (48.0%) | 12 (27.3%) |
| 75 Years and over | 14 (17.3%) | 34 (34.7%) |
Disability Class: Self-Care Difficulty
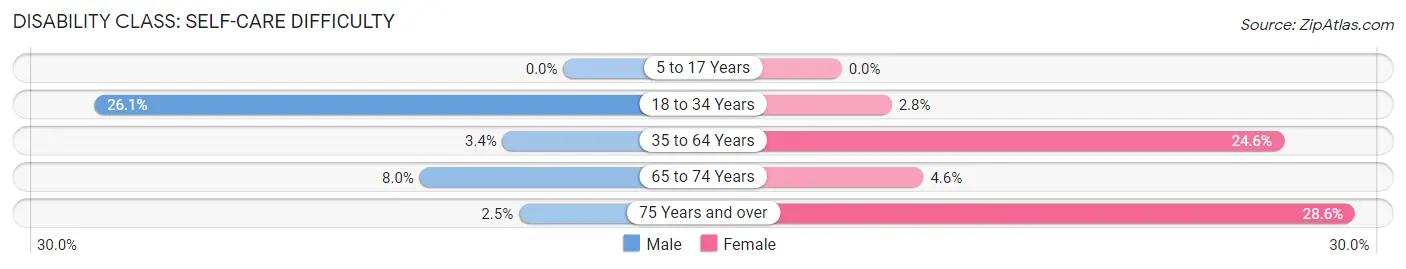
| Age Bracket | Male | Female |
| 5 to 17 Years | 0 (0.0%) | 0 (0.0%) |
| 18 to 34 Years | 58 (26.1%) | 4 (2.8%) |
| 35 to 64 Years | 8 (3.4%) | 63 (24.6%) |
| 65 to 74 Years | 4 (8.0%) | 2 (4.5%) |
| 75 Years and over | 2 (2.5%) | 28 (28.6%) |
Technology Access in Kenton
Computing Device Access in Kenton
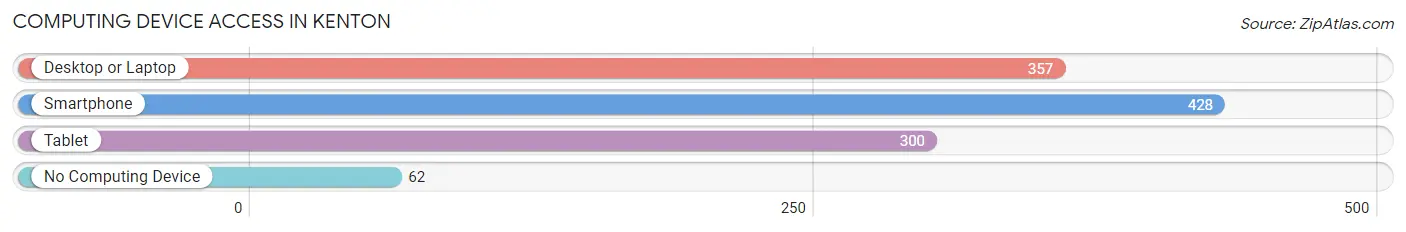
| Device Type | # Households | % Households |
| Desktop or Laptop | 357 | 61.3% |
| Smartphone | 428 | 73.5% |
| Tablet | 300 | 51.5% |
| No Computing Device | 62 | 10.6% |
| Total | 582 | 100.0% |
Internet Access in Kenton
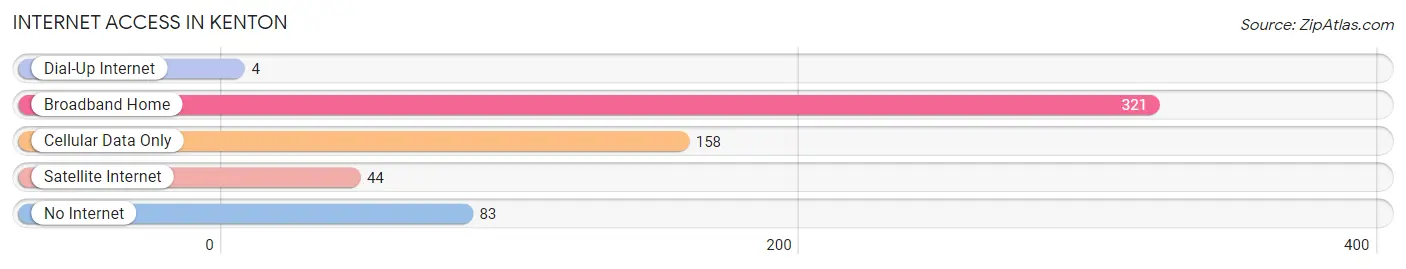
| Internet Type | # Households | % Households |
| Dial-Up Internet | 4 | 0.7% |
| Broadband Home | 321 | 55.1% |
| Cellular Data Only | 158 | 27.2% |
| Satellite Internet | 44 | 7.6% |
| No Internet | 83 | 14.3% |
| Total | 582 | 100.0% |
Kenton Summary
Kenton, Tennessee is a small town located in the northwest corner of the state, in Obion County. It is situated on the banks of the Obion River, and is surrounded by rolling hills and farmland. The town was founded in 1854, and has a population of just over 1,000 people.
Kenton is located in the northwest corner of Tennessee, in Obion County. It is situated on the banks of the Obion River, and is surrounded by rolling hills and farmland. The town was founded in 1854, and has a population of just over 1,000 people. The town is located about 30 miles from the Kentucky border, and is about an hour and a half drive from Memphis.
Kenton is a small, rural town with a rich history. The town was founded in 1854 by a group of settlers from Kentucky. The town was named after the nearby Obion River, which was named after a Native American chief. The town was originally a farming community, and the main crops were cotton, corn, and tobacco. The town also had a thriving lumber industry, and the town was home to several sawmills.
Kenton is a small town with a strong sense of community. The town is home to several churches, including the First Baptist Church, the First United Methodist Church, and the Church of Christ. The town also has a public library, a post office, and a few small businesses. The town is also home to a few small parks, including the Obion River Park and the Kenton City Park.
The economy of Kenton is largely based on agriculture. The town is home to several farms, and the main crops are corn, soybeans, and cotton. The town also has a few small businesses, including a few restaurants, a grocery store, and a few shops. The town is also home to a few manufacturing plants, including a furniture factory and a plastics factory.
The demographics of Kenton are largely white. According to the 2010 census, the town had a population of 1,072 people, of which 97.3% were white, 0.9% were African American, 0.3% were Asian, and 0.5% were Hispanic or Latino. The median household income in Kenton was $37,917, and the median age was 41.7 years.
Kenton is a small, rural town with a rich history and a strong sense of community. The town is home to several churches, a public library, a post office, and a few small businesses. The town is also home to a few small parks, and the main industries are agriculture and manufacturing. The town has a population of just over 1,000 people, and the median household income is $37,917.
Common Questions
What is Per Capita Income in Kenton?
Per Capita income in Kenton is $22,754.
What is the Median Family Income in Kenton?
Median Family Income in Kenton is $44,554.
What is the Median Household income in Kenton?
Median Household Income in Kenton is $39,306.
What is Income or Wage Gap in Kenton?
Income or Wage Gap in Kenton is 37.7%.
Women in Kenton earn 62.3 cents for every dollar earned by a man.
What is Inequality or Gini Index in Kenton?
Inequality or Gini Index in Kenton is 0.44.
What is the Total Population of Kenton?
Total Population of Kenton is 1,413.
What is the Total Male Population of Kenton?
Total Male Population of Kenton is 722.
What is the Total Female Population of Kenton?
Total Female Population of Kenton is 691.
What is the Ratio of Males per 100 Females in Kenton?
There are 104.49 Males per 100 Females in Kenton.
What is the Ratio of Females per 100 Males in Kenton?
There are 95.71 Females per 100 Males in Kenton.
What is the Median Population Age in Kenton?
Median Population Age in Kenton is 39.6 Years.
What is the Average Family Size in Kenton
Average Family Size in Kenton is 3.2 People.
What is the Average Household Size in Kenton
Average Household Size in Kenton is 2.4 People.
How Large is the Labor Force in Kenton?
There are 493 People in the Labor Forcein in Kenton.
What is the Percentage of People in the Labor Force in Kenton?
42.2% of People are in the Labor Force in Kenton.
What is the Unemployment Rate in Kenton?
Unemployment Rate in Kenton is 1.6%.