Selmer, TN Map & Demographics
Selmer Map
Selmer Overview
$21,875
PER CAPITA INCOME
$68,503
AVG FAMILY INCOME
$46,696
AVG HOUSEHOLD INCOME
14.4%
WAGE / INCOME GAP [ % ]
85.6¢/ $1
WAGE / INCOME GAP [ $ ]
0.37
INEQUALITY / GINI INDEX
4,444
TOTAL POPULATION
2,375
MALE POPULATION
2,069
FEMALE POPULATION
114.79
MALES / 100 FEMALES
87.12
FEMALES / 100 MALES
38.6
MEDIAN AGE
3.2
AVG FAMILY SIZE
2.4
AVG HOUSEHOLD SIZE
1,731
LABOR FORCE [ PEOPLE ]
47.8%
PERCENT IN LABOR FORCE
4.6%
UNEMPLOYMENT RATE
Selmer Zip Codes
Selmer Area Codes
Income in Selmer
Income Overview in Selmer
Per Capita Income in Selmer is $21,875, while median incomes of families and households are $68,503 and $46,696 respectively.
| Characteristic | Number | Measure |
| Per Capita Income | 4,444 | $21,875 |
| Median Family Income | 969 | $68,503 |
| Mean Family Income | 969 | $63,472 |
| Median Household Income | 1,783 | $46,696 |
| Mean Household Income | 1,783 | $52,678 |
| Income Deficit | 969 | $0 |
| Wage / Income Gap (%) | 4,444 | 14.38% |
| Wage / Income Gap ($) | 4,444 | 85.62¢ per $1 |
| Gini / Inequality Index | 4,444 | 0.37 |
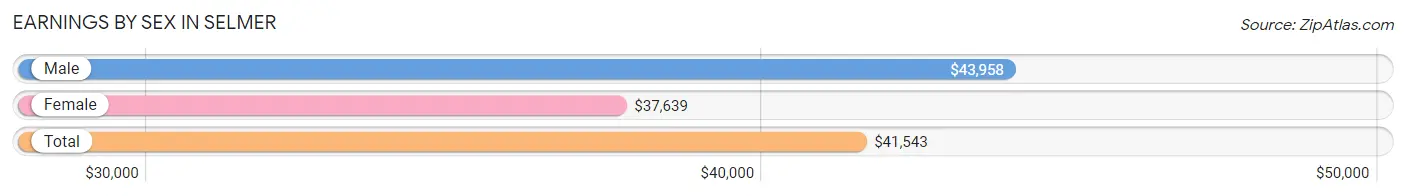
Earnings by Sex in Selmer
Average Earnings in Selmer are $41,543, $43,958 for men and $37,639 for women, a difference of 14.4%.
| Sex | Number | Average Earnings |
| Male | 1,239 (64.6%) | $43,958 |
| Female | 678 (35.4%) | $37,639 |
| Total | 1,917 (100.0%) | $41,543 |
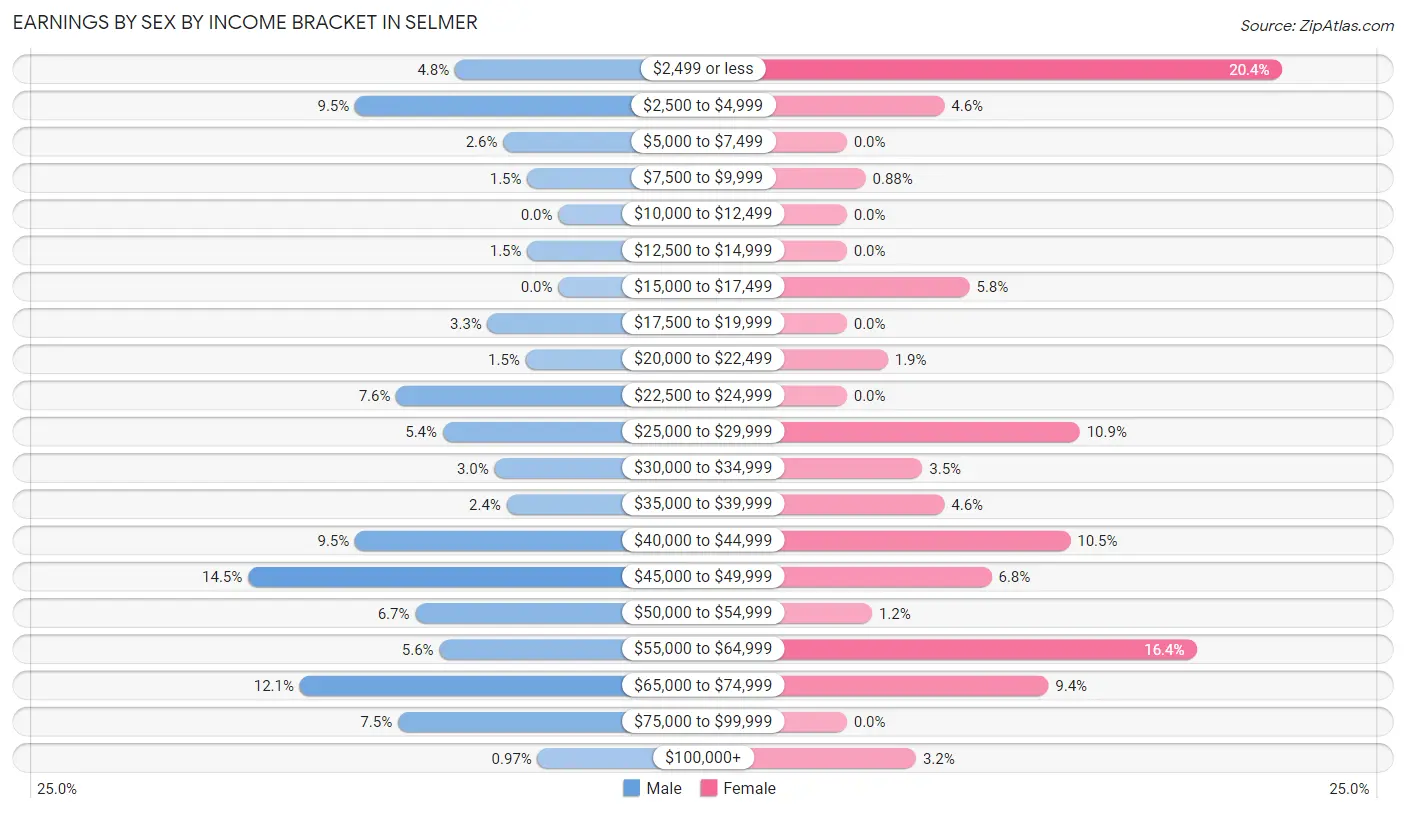
Earnings by Sex by Income Bracket in Selmer
The most common earnings brackets in Selmer are $45,000 to $49,999 for men (180 | 14.5%) and $2,499 or less for women (138 | 20.3%).
| Income | Male | Female |
| $2,499 or less | 60 (4.8%) | 138 (20.3%) |
| $2,500 to $4,999 | 118 (9.5%) | 31 (4.6%) |
| $5,000 to $7,499 | 32 (2.6%) | 0 (0.0%) |
| $7,500 to $9,999 | 18 (1.5%) | 6 (0.9%) |
| $10,000 to $12,499 | 0 (0.0%) | 0 (0.0%) |
| $12,500 to $14,999 | 18 (1.5%) | 0 (0.0%) |
| $15,000 to $17,499 | 0 (0.0%) | 39 (5.8%) |
| $17,500 to $19,999 | 41 (3.3%) | 0 (0.0%) |
| $20,000 to $22,499 | 19 (1.5%) | 13 (1.9%) |
| $22,500 to $24,999 | 94 (7.6%) | 0 (0.0%) |
| $25,000 to $29,999 | 67 (5.4%) | 74 (10.9%) |
| $30,000 to $34,999 | 37 (3.0%) | 24 (3.5%) |
| $35,000 to $39,999 | 30 (2.4%) | 31 (4.6%) |
| $40,000 to $44,999 | 118 (9.5%) | 71 (10.5%) |
| $45,000 to $49,999 | 180 (14.5%) | 46 (6.8%) |
| $50,000 to $54,999 | 83 (6.7%) | 8 (1.2%) |
| $55,000 to $64,999 | 69 (5.6%) | 111 (16.4%) |
| $65,000 to $74,999 | 150 (12.1%) | 64 (9.4%) |
| $75,000 to $99,999 | 93 (7.5%) | 0 (0.0%) |
| $100,000+ | 12 (1.0%) | 22 (3.2%) |
| Total | 1,239 (100.0%) | 678 (100.0%) |
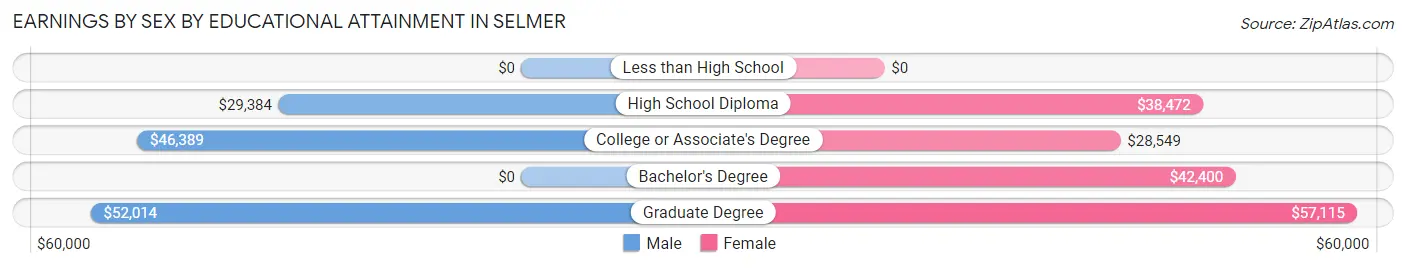
Earnings by Sex by Educational Attainment in Selmer
Average earnings in Selmer are $45,224 for men and $41,528 for women, a difference of 8.2%. Men with an educational attainment of graduate degree enjoy the highest average annual earnings of $52,014, while those with high school diploma education earn the least with $29,384. Women with an educational attainment of graduate degree earn the most with the average annual earnings of $57,115, while those with college or associate's degree education have the smallest earnings of $28,549.
| Educational Attainment | Male Income | Female Income |
| Less than High School | - | - |
| High School Diploma | $29,384 | $38,472 |
| College or Associate's Degree | $46,389 | $28,549 |
| Bachelor's Degree | - | - |
| Graduate Degree | $52,014 | $57,115 |
| Total | $45,224 | $41,528 |
Family Income in Selmer
Family Income Brackets in Selmer
According to the Selmer family income data, there are 277 families falling into the $50,000 to $74,999 income range, which is the most common income bracket and makes up 28.6% of all families.
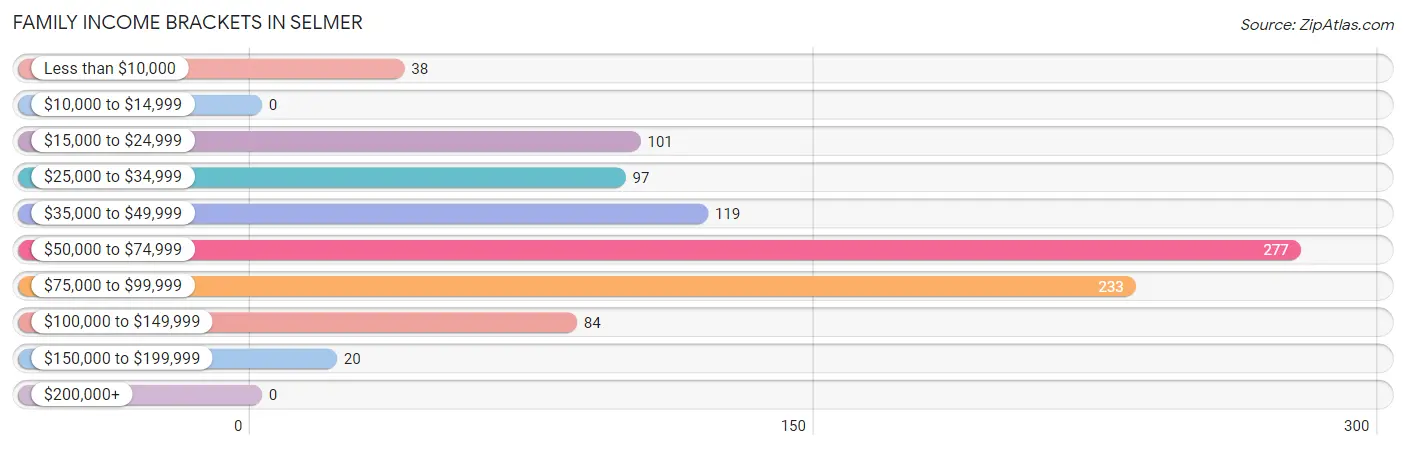
| Income Bracket | # Families | % Families |
| Less than $10,000 | 38 | 3.9% |
| $10,000 to $14,999 | 0 | 0.0% |
| $15,000 to $24,999 | 101 | 10.4% |
| $25,000 to $34,999 | 97 | 10.0% |
| $35,000 to $49,999 | 119 | 12.3% |
| $50,000 to $74,999 | 277 | 28.6% |
| $75,000 to $99,999 | 233 | 24.0% |
| $100,000 to $149,999 | 84 | 8.7% |
| $150,000 to $199,999 | 20 | 2.1% |
| $200,000+ | 0 | 0.0% |
Family Income by Famaliy Size in Selmer
4-person families (142 | 14.6%) account for the highest median family income in Selmer with $82,361 per family, while 2-person families (461 | 47.6%) have the highest median income of $24,964 per family member.
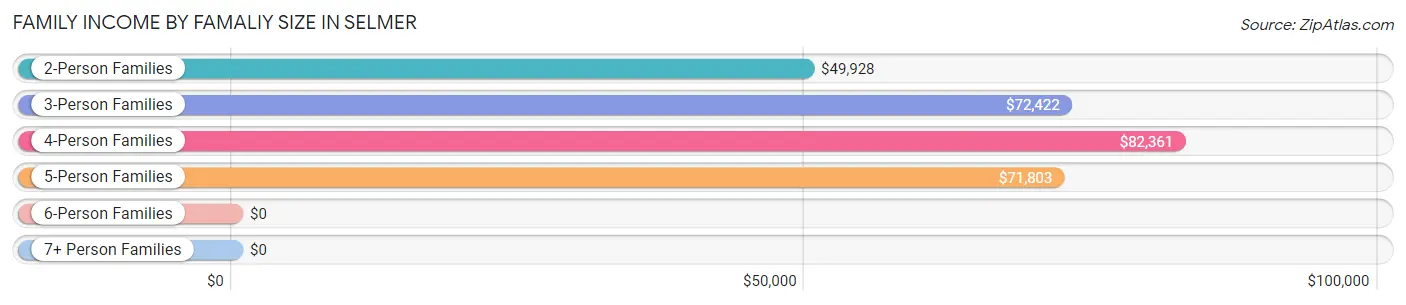
| Income Bracket | # Families | Median Income |
| 2-Person Families | 461 (47.6%) | $49,928 |
| 3-Person Families | 278 (28.7%) | $72,422 |
| 4-Person Families | 142 (14.6%) | $82,361 |
| 5-Person Families | 88 (9.1%) | $71,803 |
| 6-Person Families | 0 (0.0%) | $0 |
| 7+ Person Families | 0 (0.0%) | $0 |
| Total | 969 (100.0%) | $68,503 |
Family Income by Number of Earners in Selmer
The median family income in Selmer is $68,503, with families comprising 3+ earners (90) having the highest median family income of $88,355, while families with no earners (162) have the lowest median family income of $16,514, accounting for 9.3% and 16.7% of families, respectively.
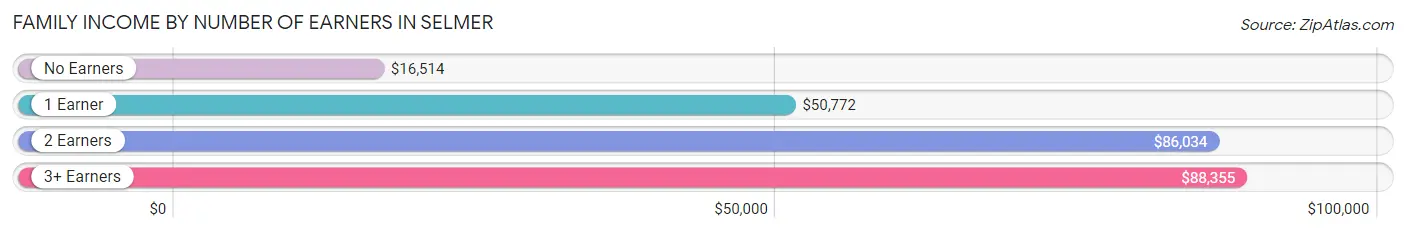
| Number of Earners | # Families | Median Income |
| No Earners | 162 (16.7%) | $16,514 |
| 1 Earner | 405 (41.8%) | $50,772 |
| 2 Earners | 312 (32.2%) | $86,034 |
| 3+ Earners | 90 (9.3%) | $88,355 |
| Total | 969 (100.0%) | $68,503 |
Household Income in Selmer
Household Income Brackets in Selmer
With 332 households falling in the category, the $50,000 to $74,999 income range is the most frequent in Selmer, accounting for 18.6% of all households.
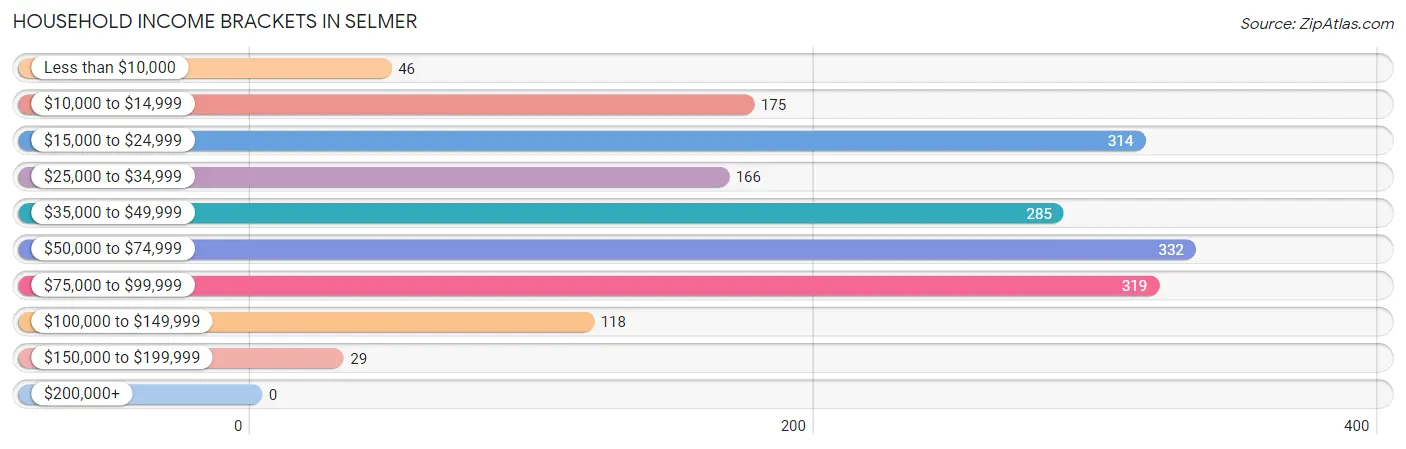
| Income Bracket | # Households | % Households |
| Less than $10,000 | 46 | 2.6% |
| $10,000 to $14,999 | 175 | 9.8% |
| $15,000 to $24,999 | 314 | 17.6% |
| $25,000 to $34,999 | 166 | 9.3% |
| $35,000 to $49,999 | 285 | 16.0% |
| $50,000 to $74,999 | 332 | 18.6% |
| $75,000 to $99,999 | 319 | 17.9% |
| $100,000 to $149,999 | 118 | 6.6% |
| $150,000 to $199,999 | 29 | 1.6% |
| $200,000+ | 0 | 0.0% |
Household Income by Householder Age in Selmer
The median household income in Selmer is $46,696, with the highest median household income of $66,683 found in the 45 to 64 years age bracket for the primary householder. A total of 585 households (32.8%) fall into this category. Meanwhile, the 65+ years age bracket for the primary householder has the lowest median household income of $24,353, with 524 households (29.4%) in this group.
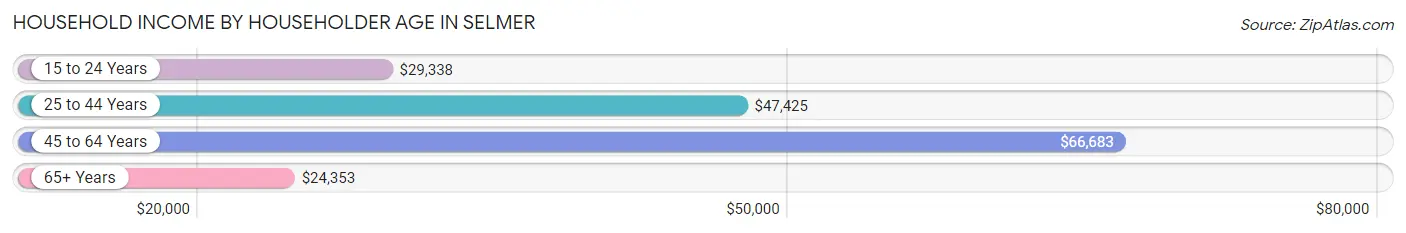
| Income Bracket | # Households | Median Income |
| 15 to 24 Years | 61 (3.4%) | $29,338 |
| 25 to 44 Years | 613 (34.4%) | $47,425 |
| 45 to 64 Years | 585 (32.8%) | $66,683 |
| 65+ Years | 524 (29.4%) | $24,353 |
| Total | 1,783 (100.0%) | $46,696 |
Poverty in Selmer
Income Below Poverty by Sex and Age in Selmer
With 18.1% poverty level for males and 19.0% for females among the residents of Selmer, 55 to 64 year old males and 15 year old females are the most vulnerable to poverty, with 188 males (41.0%) and 17 females (100.0%) in their respective age groups living below the poverty level.
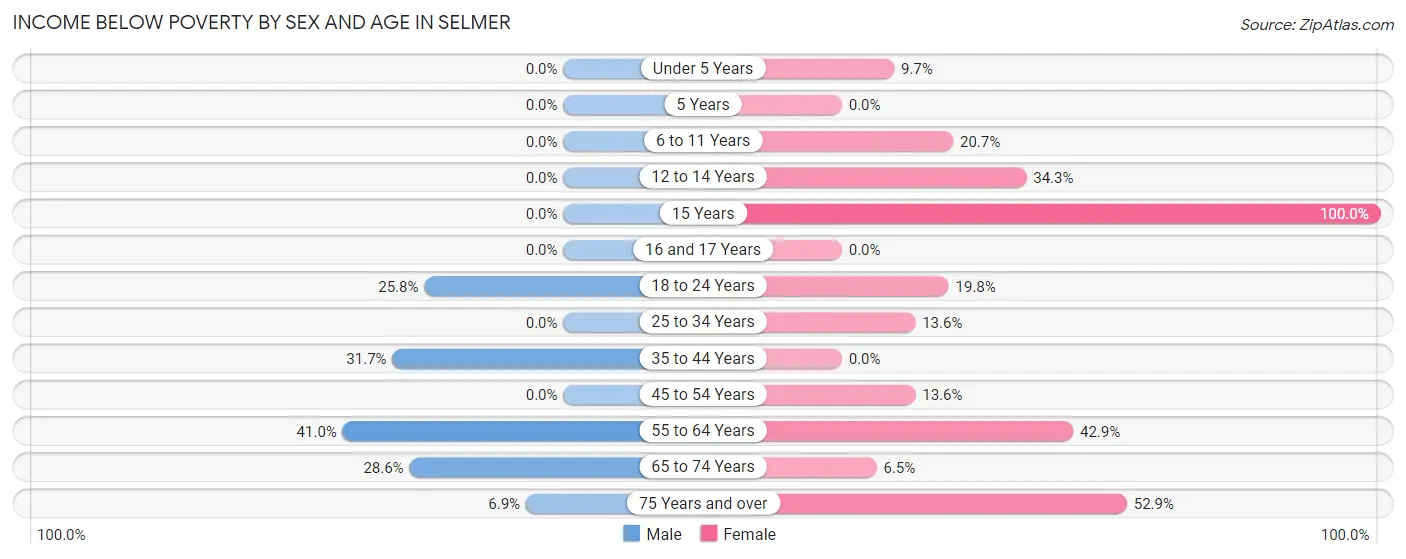
| Age Bracket | Male | Female |
| Under 5 Years | 0 (0.0%) | 16 (9.7%) |
| 5 Years | 0 (0.0%) | 0 (0.0%) |
| 6 to 11 Years | 0 (0.0%) | 19 (20.6%) |
| 12 to 14 Years | 0 (0.0%) | 25 (34.3%) |
| 15 Years | 0 (0.0%) | 17 (100.0%) |
| 16 and 17 Years | 0 (0.0%) | 0 (0.0%) |
| 18 to 24 Years | 48 (25.8%) | 24 (19.8%) |
| 25 to 34 Years | 0 (0.0%) | 56 (13.6%) |
| 35 to 44 Years | 119 (31.7%) | 0 (0.0%) |
| 45 to 54 Years | 0 (0.0%) | 33 (13.6%) |
| 55 to 64 Years | 188 (41.0%) | 82 (42.9%) |
| 65 to 74 Years | 54 (28.6%) | 16 (6.5%) |
| 75 Years and over | 5 (6.9%) | 82 (52.9%) |
| Total | 414 (18.1%) | 370 (19.0%) |
Income Above Poverty by Sex and Age in Selmer
According to the poverty statistics in Selmer, males aged under 5 years and females aged 5 years are the age groups that are most secure financially, with 100.0% of males and 100.0% of females in these age groups living above the poverty line.
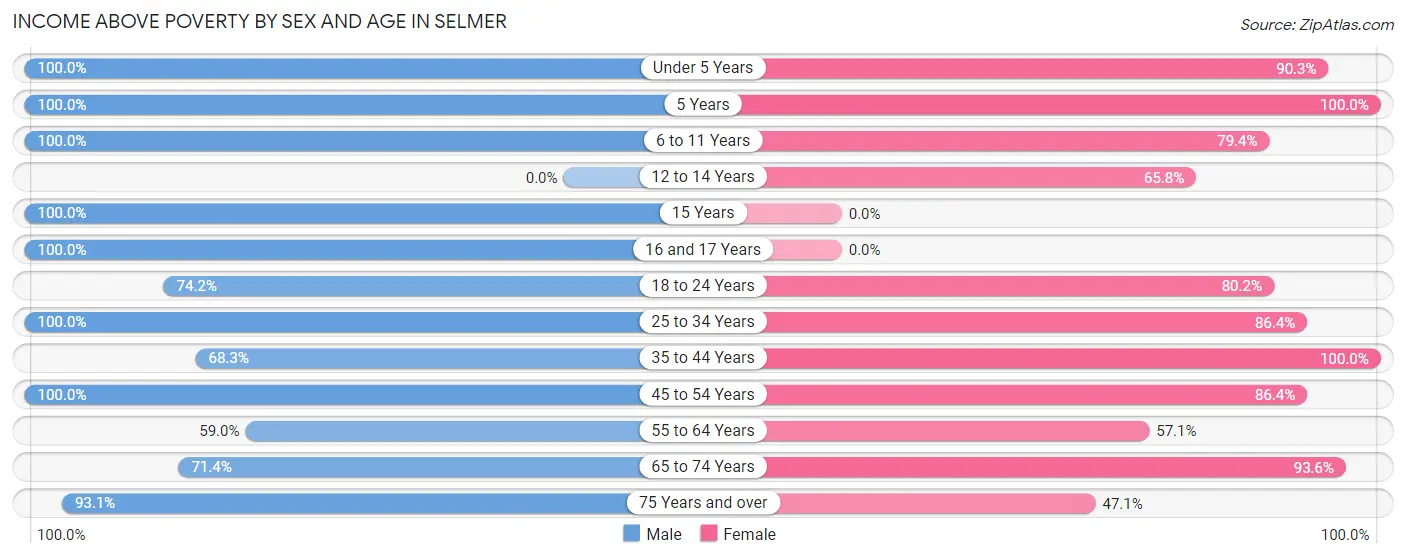
| Age Bracket | Male | Female |
| Under 5 Years | 84 (100.0%) | 149 (90.3%) |
| 5 Years | 27 (100.0%) | 103 (100.0%) |
| 6 to 11 Years | 239 (100.0%) | 73 (79.3%) |
| 12 to 14 Years | 0 (0.0%) | 48 (65.7%) |
| 15 Years | 22 (100.0%) | 0 (0.0%) |
| 16 and 17 Years | 19 (100.0%) | 0 (0.0%) |
| 18 to 24 Years | 138 (74.2%) | 97 (80.2%) |
| 25 to 34 Years | 425 (100.0%) | 355 (86.4%) |
| 35 to 44 Years | 256 (68.3%) | 130 (100.0%) |
| 45 to 54 Years | 192 (100.0%) | 209 (86.4%) |
| 55 to 64 Years | 271 (59.0%) | 109 (57.1%) |
| 65 to 74 Years | 135 (71.4%) | 232 (93.5%) |
| 75 Years and over | 67 (93.1%) | 73 (47.1%) |
| Total | 1,875 (81.9%) | 1,578 (81.0%) |
Income Below Poverty Among Married-Couple Families in Selmer
The poverty statistics for married-couple families in Selmer show that 4.4% or 31 of the total 702 families live below the poverty line. Families with no children have the highest poverty rate of 9.1%, comprising of 31 families. On the other hand, families with 1 or 2 children have the lowest poverty rate of 0.0%, which includes 0 families.
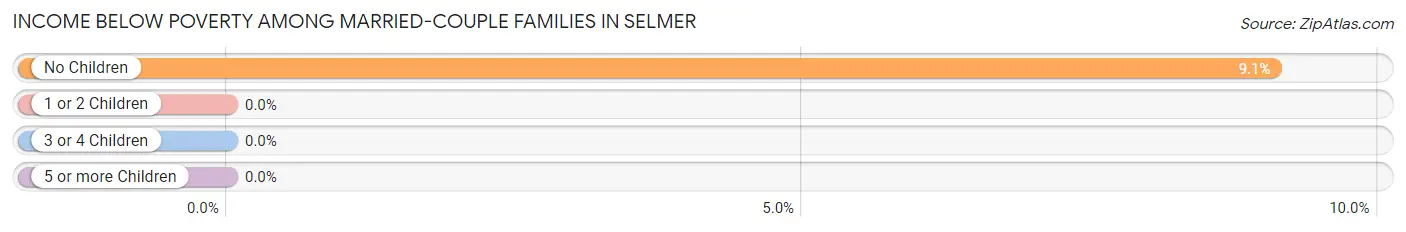
| Children | Above Poverty | Below Poverty |
| No Children | 310 (90.9%) | 31 (9.1%) |
| 1 or 2 Children | 273 (100.0%) | 0 (0.0%) |
| 3 or 4 Children | 88 (100.0%) | 0 (0.0%) |
| 5 or more Children | 0 (0.0%) | 0 (0.0%) |
| Total | 671 (95.6%) | 31 (4.4%) |
Income Below Poverty Among Single-Parent Households in Selmer
According to the poverty data in Selmer, 30.4% or 45 single-father households and 52.9% or 63 single-mother households are living below the poverty line. Among single-father households, those with no children have the highest poverty rate, with 45 households (39.5%) experiencing poverty. Likewise, among single-mother households, those with 1 or 2 children have the highest poverty rate, with 51 households (63.0%) falling below the poverty line.
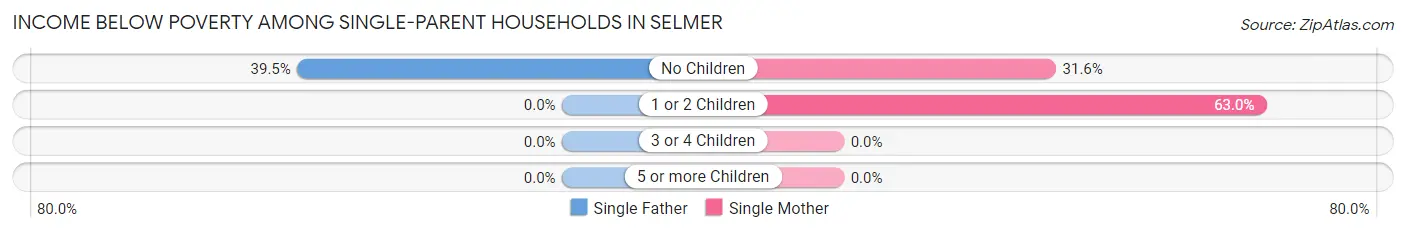
| Children | Single Father | Single Mother |
| No Children | 45 (39.5%) | 12 (31.6%) |
| 1 or 2 Children | 0 (0.0%) | 51 (63.0%) |
| 3 or 4 Children | 0 (0.0%) | 0 (0.0%) |
| 5 or more Children | 0 (0.0%) | 0 (0.0%) |
| Total | 45 (30.4%) | 63 (52.9%) |
Income Below Poverty Among Married-Couple vs Single-Parent Households in Selmer
The poverty data for Selmer shows that 31 of the married-couple family households (4.4%) and 108 of the single-parent households (40.5%) are living below the poverty level. Within the married-couple family households, those with no children have the highest poverty rate, with 31 households (9.1%) falling below the poverty line. Among the single-parent households, those with 1 or 2 children have the highest poverty rate, with 51 household (44.4%) living below poverty.
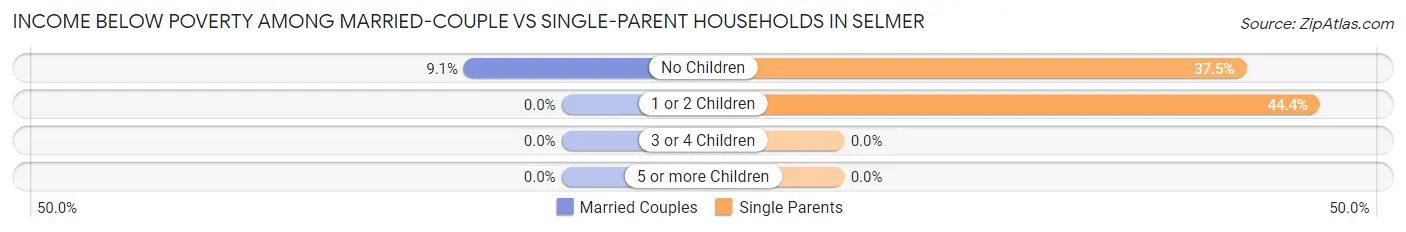
| Children | Married-Couple Families | Single-Parent Households |
| No Children | 31 (9.1%) | 57 (37.5%) |
| 1 or 2 Children | 0 (0.0%) | 51 (44.4%) |
| 3 or 4 Children | 0 (0.0%) | 0 (0.0%) |
| 5 or more Children | 0 (0.0%) | 0 (0.0%) |
| Total | 31 (4.4%) | 108 (40.5%) |
Race in Selmer
The most populous races in Selmer are White / Caucasian (3,622 | 81.5%), Black / African American (695 | 15.6%), and Two or more Races (68 | 1.5%).
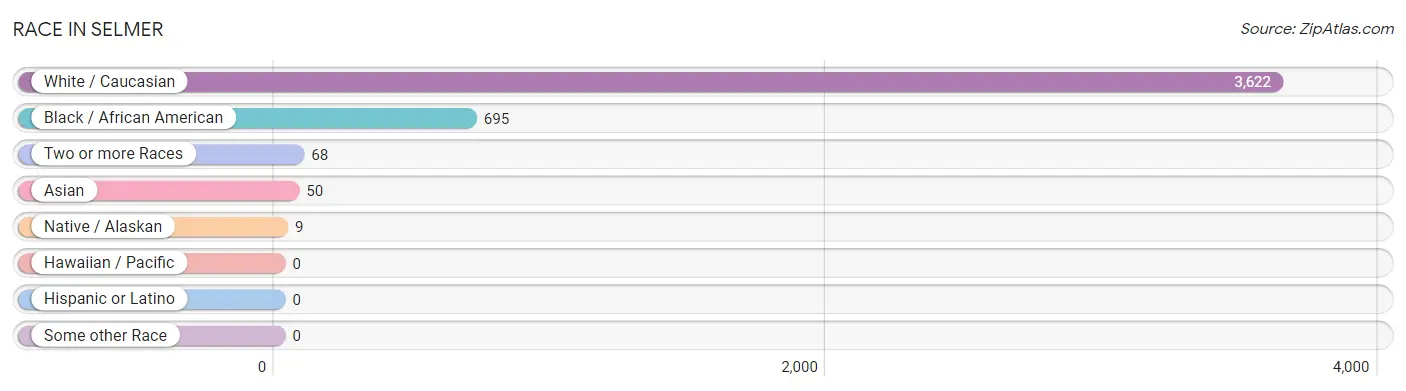
| Race | # Population | % Population |
| Asian | 50 | 1.1% |
| Black / African American | 695 | 15.6% |
| Hawaiian / Pacific | 0 | 0.0% |
| Hispanic or Latino | 0 | 0.0% |
| Native / Alaskan | 9 | 0.2% |
| White / Caucasian | 3,622 | 81.5% |
| Two or more Races | 68 | 1.5% |
| Some other Race | 0 | 0.0% |
| Total | 4,444 | 100.0% |
Ancestry in Selmer
The most populous ancestries reported in Selmer are American (447 | 10.1%), African (427 | 9.6%), Subsaharan African (427 | 9.6%), English (418 | 9.4%), and Irish (267 | 6.0%), together accounting for 44.7% of all Selmer residents.
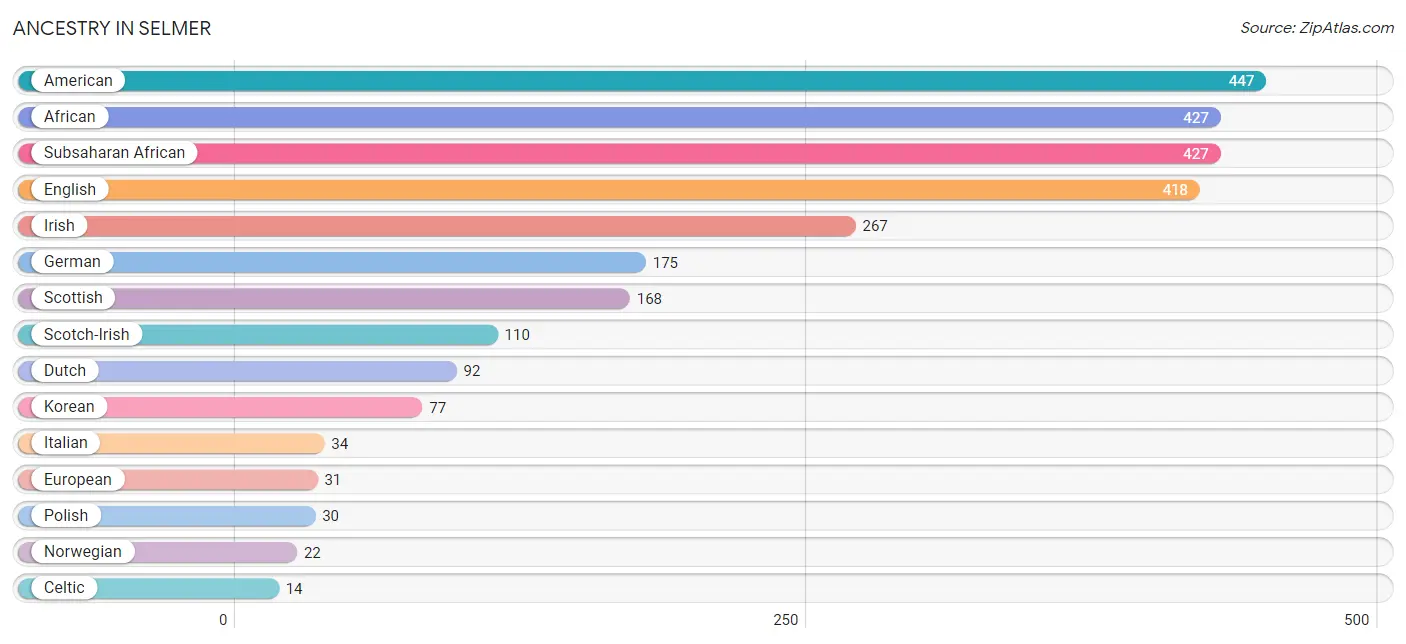
| Ancestry | # Population | % Population |
| African | 427 | 9.6% |
| American | 447 | 10.1% |
| Celtic | 14 | 0.3% |
| Dutch | 92 | 2.1% |
| English | 418 | 9.4% |
| European | 31 | 0.7% |
| French | 8 | 0.2% |
| German | 175 | 3.9% |
| Irish | 267 | 6.0% |
| Italian | 34 | 0.8% |
| Korean | 77 | 1.7% |
| Norwegian | 22 | 0.5% |
| Polish | 30 | 0.7% |
| Scotch-Irish | 110 | 2.5% |
| Scottish | 168 | 3.8% |
| Subsaharan African | 427 | 9.6% | View All 16 Rows |
Immigrants in Selmer
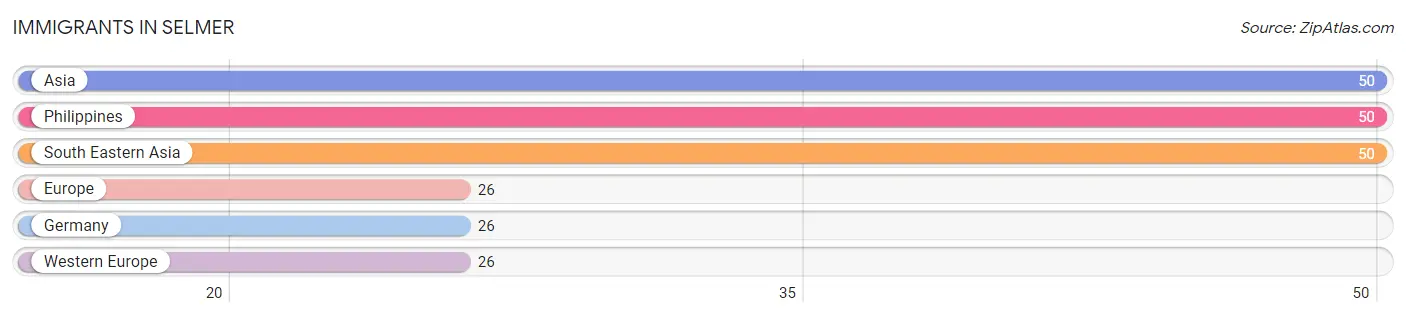
The most numerous immigrant groups reported in Selmer came from Asia (50 | 1.1%), Philippines (50 | 1.1%), South Eastern Asia (50 | 1.1%), Europe (26 | 0.6%), and Germany (26 | 0.6%), together accounting for 4.6% of all Selmer residents.
| Immigration Origin | # Population | % Population |
| Asia | 50 | 1.1% |
| Europe | 26 | 0.6% |
| Germany | 26 | 0.6% |
| Philippines | 50 | 1.1% |
| South Eastern Asia | 50 | 1.1% |
| Western Europe | 26 | 0.6% | View All 6 Rows |
Sex and Age in Selmer
Sex and Age in Selmer
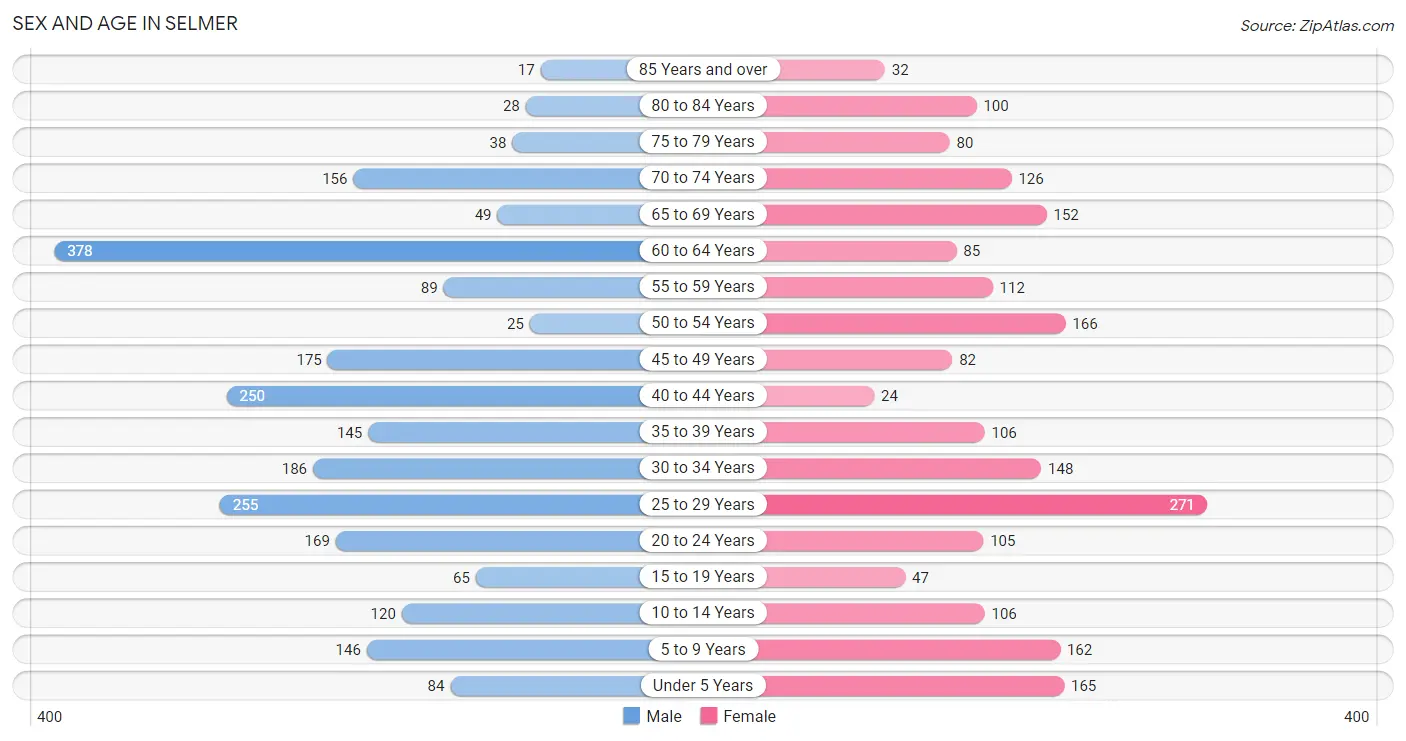
The most populous age groups in Selmer are 60 to 64 Years (378 | 15.9%) for men and 25 to 29 Years (271 | 13.1%) for women.
| Age Bracket | Male | Female |
| Under 5 Years | 84 (3.5%) | 165 (8.0%) |
| 5 to 9 Years | 146 (6.1%) | 162 (7.8%) |
| 10 to 14 Years | 120 (5.1%) | 106 (5.1%) |
| 15 to 19 Years | 65 (2.7%) | 47 (2.3%) |
| 20 to 24 Years | 169 (7.1%) | 105 (5.1%) |
| 25 to 29 Years | 255 (10.7%) | 271 (13.1%) |
| 30 to 34 Years | 186 (7.8%) | 148 (7.1%) |
| 35 to 39 Years | 145 (6.1%) | 106 (5.1%) |
| 40 to 44 Years | 250 (10.5%) | 24 (1.2%) |
| 45 to 49 Years | 175 (7.4%) | 82 (4.0%) |
| 50 to 54 Years | 25 (1.1%) | 166 (8.0%) |
| 55 to 59 Years | 89 (3.7%) | 112 (5.4%) |
| 60 to 64 Years | 378 (15.9%) | 85 (4.1%) |
| 65 to 69 Years | 49 (2.1%) | 152 (7.3%) |
| 70 to 74 Years | 156 (6.6%) | 126 (6.1%) |
| 75 to 79 Years | 38 (1.6%) | 80 (3.9%) |
| 80 to 84 Years | 28 (1.2%) | 100 (4.8%) |
| 85 Years and over | 17 (0.7%) | 32 (1.5%) |
| Total | 2,375 (100.0%) | 2,069 (100.0%) |
Families and Households in Selmer
Median Family Size in Selmer
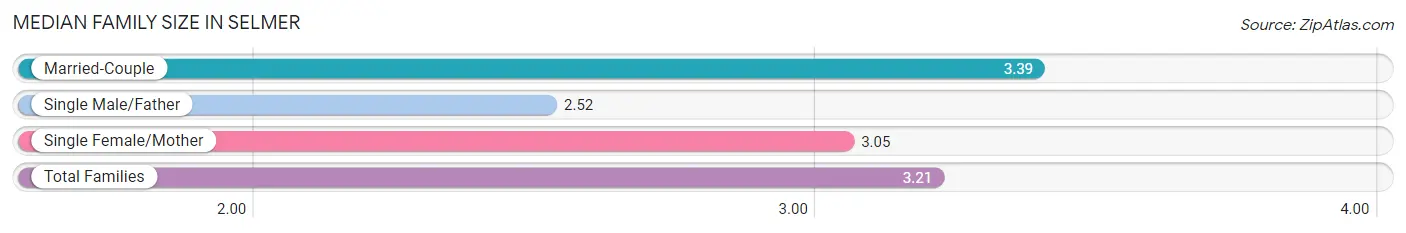
The median family size in Selmer is 3.21 persons per family, with married-couple families (702 | 72.5%) accounting for the largest median family size of 3.39 persons per family. On the other hand, single male/father families (148 | 15.3%) represent the smallest median family size with 2.52 persons per family.
| Family Type | # Families | Family Size |
| Married-Couple | 702 (72.5%) | 3.39 |
| Single Male/Father | 148 (15.3%) | 2.52 |
| Single Female/Mother | 119 (12.3%) | 3.05 |
| Total Families | 969 (100.0%) | 3.21 |
Median Household Size in Selmer
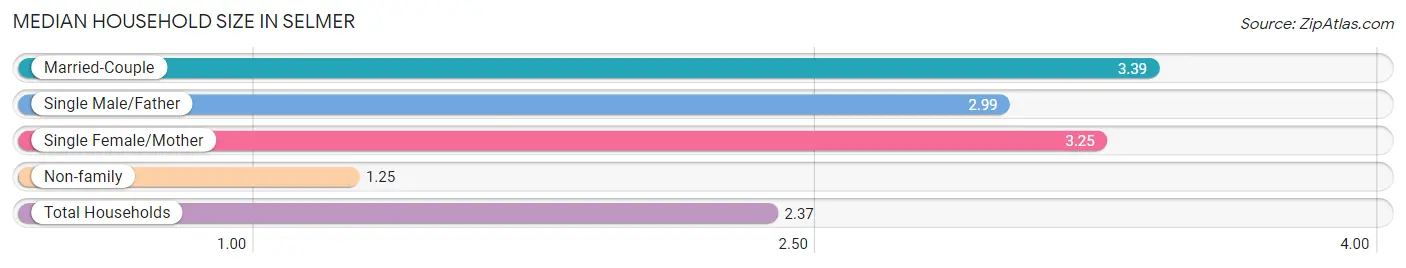
The median household size in Selmer is 2.37 persons per household, with married-couple households (702 | 39.4%) accounting for the largest median household size of 3.39 persons per household. non-family households (814 | 45.7%) represent the smallest median household size with 1.25 persons per household.
| Household Type | # Households | Household Size |
| Married-Couple | 702 (39.4%) | 3.39 |
| Single Male/Father | 148 (8.3%) | 2.99 |
| Single Female/Mother | 119 (6.7%) | 3.25 |
| Non-family | 814 (45.7%) | 1.25 |
| Total Households | 1,783 (100.0%) | 2.37 |
Household Size by Marriage Status in Selmer
Out of a total of 1,783 households in Selmer, 969 (54.3%) are family households, while 814 (45.7%) are nonfamily households. The most numerous type of family households are 2-person households, comprising 426, and the most common type of nonfamily households are 1-person households, comprising 725.
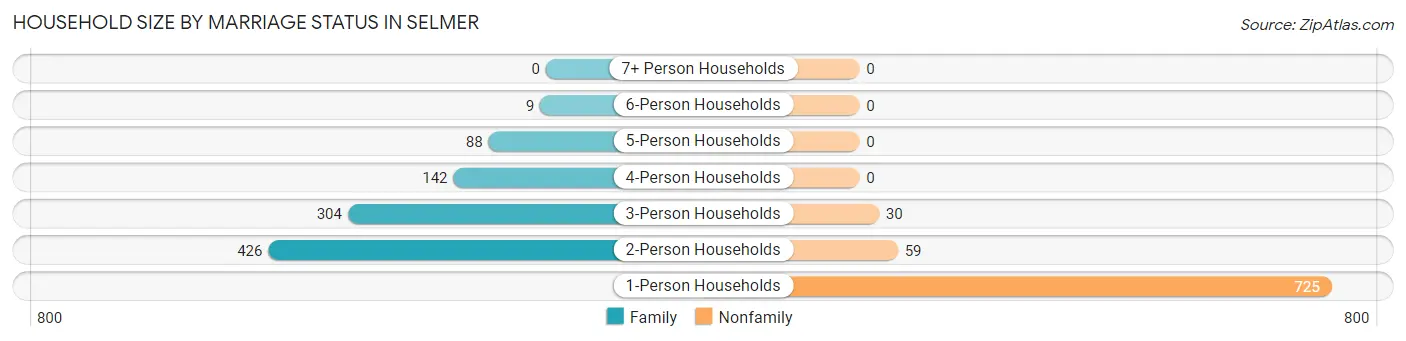
| Household Size | Family Households | Nonfamily Households |
| 1-Person Households | - | 725 (40.7%) |
| 2-Person Households | 426 (23.9%) | 59 (3.3%) |
| 3-Person Households | 304 (17.1%) | 30 (1.7%) |
| 4-Person Households | 142 (8.0%) | 0 (0.0%) |
| 5-Person Households | 88 (4.9%) | 0 (0.0%) |
| 6-Person Households | 9 (0.5%) | 0 (0.0%) |
| 7+ Person Households | 0 (0.0%) | 0 (0.0%) |
| Total | 969 (54.3%) | 814 (45.7%) |
Female Fertility in Selmer
Fertility by Age in Selmer
Average fertility rate in Selmer is 275.0 births per 1,000 women. Women in the age bracket of 20 to 34 years have the highest fertility rate with 380.0 births per 1,000 women. Women in the age bracket of 20 to 34 years acount for 87.7% of all women with births.
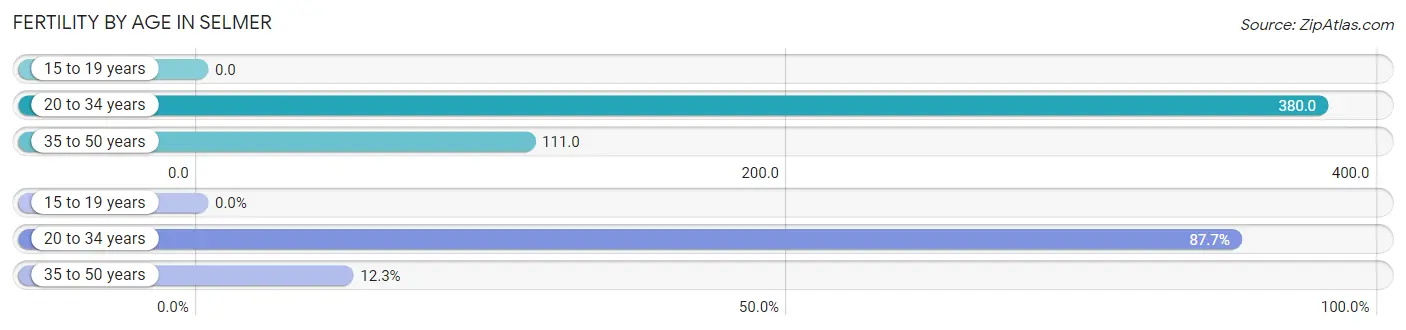
| Age Bracket | Women with Births | Births / 1,000 Women |
| 15 to 19 years | 0 (0.0%) | 0.0 |
| 20 to 34 years | 199 (87.7%) | 380.0 |
| 35 to 50 years | 28 (12.3%) | 111.0 |
| Total | 227 (100.0%) | 275.0 |
Fertility by Age by Marriage Status in Selmer
96.5% of women with births (227) in Selmer are married. The highest percentage of unmarried women with births falls into 20 to 34 years age bracket with 4.0% of them unmarried at the time of birth, while the lowest percentage of unmarried women with births belong to 35 to 50 years age bracket with 0.0% of them unmarried.
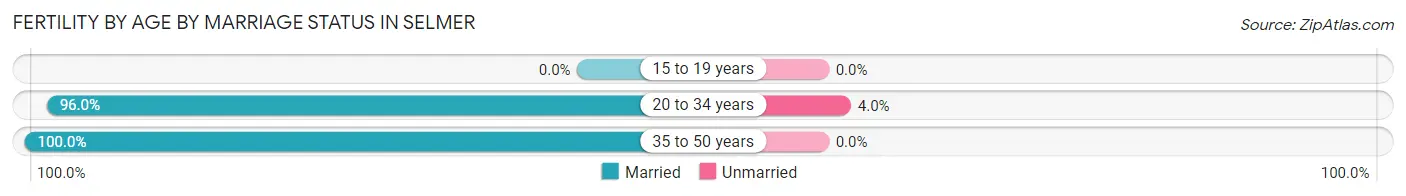
| Age Bracket | Married | Unmarried |
| 15 to 19 years | 0 (0.0%) | 0 (0.0%) |
| 20 to 34 years | 191 (96.0%) | 8 (4.0%) |
| 35 to 50 years | 28 (100.0%) | 0 (0.0%) |
| Total | 219 (96.5%) | 8 (3.5%) |
Fertility by Education in Selmer
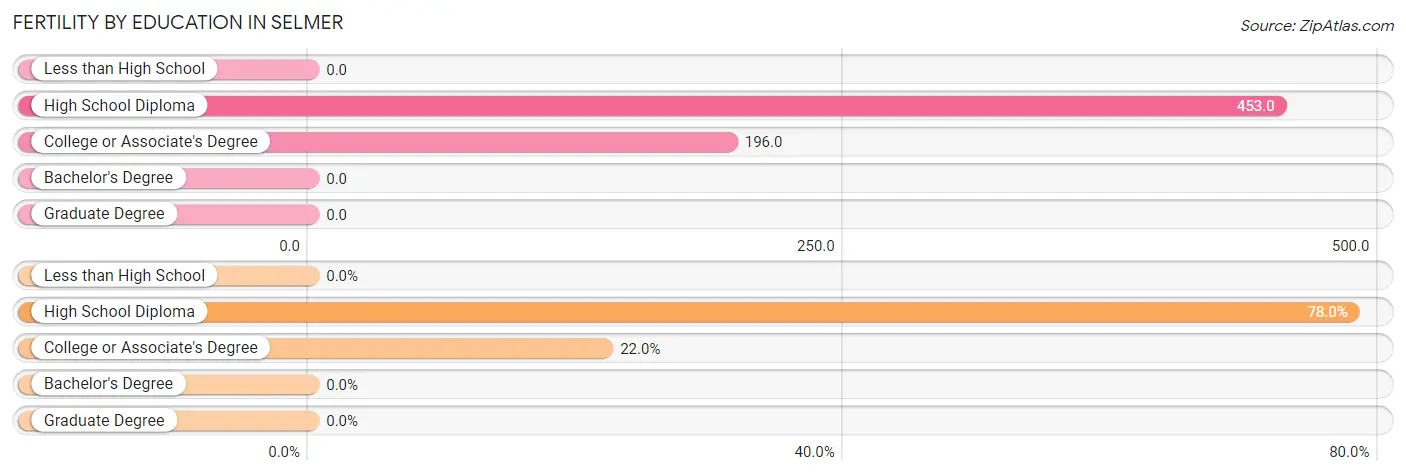
| Educational Attainment | Women with Births | Births / 1,000 Women |
| Less than High School | 0 (0.0%) | 0.0 |
| High School Diploma | 177 (78.0%) | 453.0 |
| College or Associate's Degree | 50 (22.0%) | 196.0 |
| Bachelor's Degree | 0 (0.0%) | 0.0 |
| Graduate Degree | 0 (0.0%) | 0.0 |
| Total | 227 (100.0%) | 275.0 |
Fertility by Education by Marriage Status in Selmer
3.5% of women with births in Selmer are unmarried. Women with the educational attainment of high school diploma are most likely to be married with 100.0% of them married at childbirth, while women with the educational attainment of college or associate's degree are least likely to be married with 16.0% of them unmarried at childbirth.
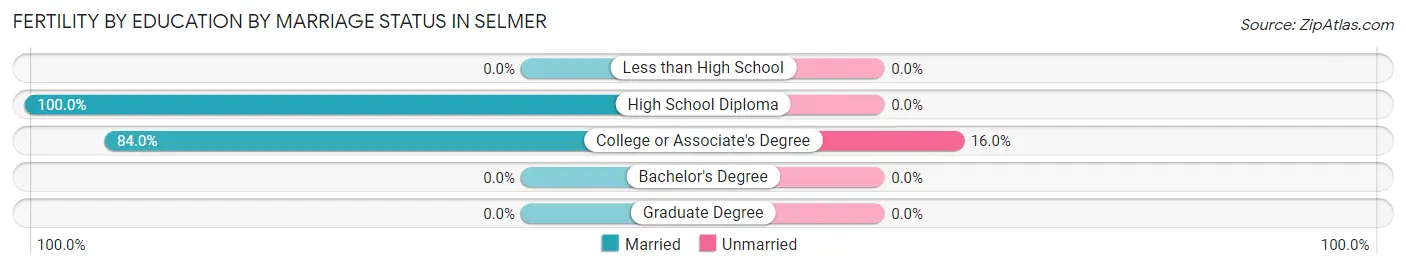
| Educational Attainment | Married | Unmarried |
| Less than High School | 0 (0.0%) | 0 (0.0%) |
| High School Diploma | 177 (100.0%) | 0 (0.0%) |
| College or Associate's Degree | 42 (84.0%) | 8 (16.0%) |
| Bachelor's Degree | 0 (0.0%) | 0 (0.0%) |
| Graduate Degree | 0 (0.0%) | 0 (0.0%) |
| Total | 219 (96.5%) | 8 (3.5%) |
Employment Characteristics in Selmer
Employment by Class of Employer in Selmer
Among the 1,653 employed individuals in Selmer, private company employees (947 | 57.3%), not-for-profit organizations (334 | 20.2%), and local government employees (253 | 15.3%) make up the most common classes of employment.
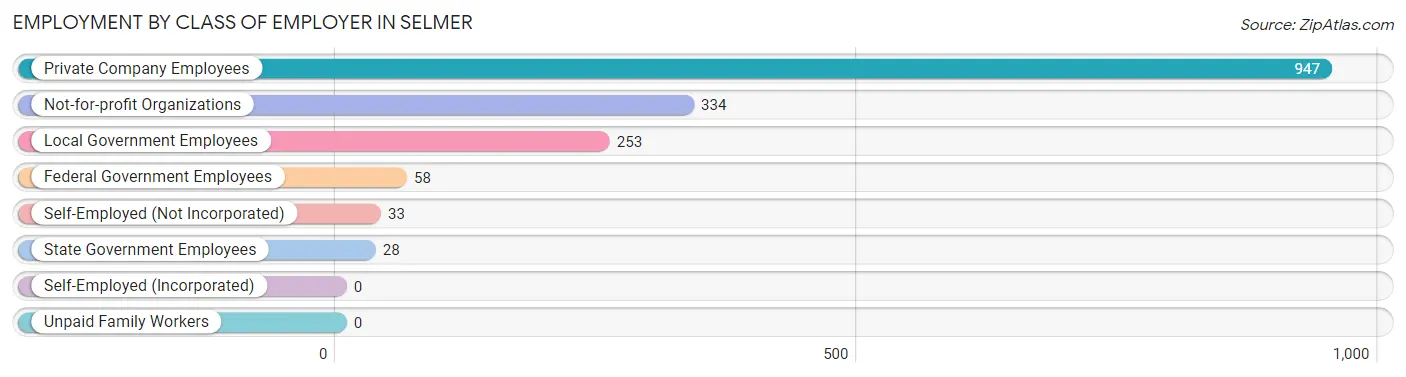
| Employer Class | # Employees | % Employees |
| Private Company Employees | 947 | 57.3% |
| Self-Employed (Incorporated) | 0 | 0.0% |
| Self-Employed (Not Incorporated) | 33 | 2.0% |
| Not-for-profit Organizations | 334 | 20.2% |
| Local Government Employees | 253 | 15.3% |
| State Government Employees | 28 | 1.7% |
| Federal Government Employees | 58 | 3.5% |
| Unpaid Family Workers | 0 | 0.0% |
| Total | 1,653 | 100.0% |
Employment Status by Age in Selmer
According to the labor force statistics for Selmer, out of the total population over 16 years of age (3,622), 47.8% or 1,731 individuals are in the labor force, with 4.6% or 80 of them unemployed. The age group with the highest labor force participation rate is 45 to 54 years, with 74.1% or 332 individuals in the labor force. Within the labor force, the 30 to 34 years age range has the highest percentage of unemployed individuals, with 27.4% or 54 of them being unemployed.
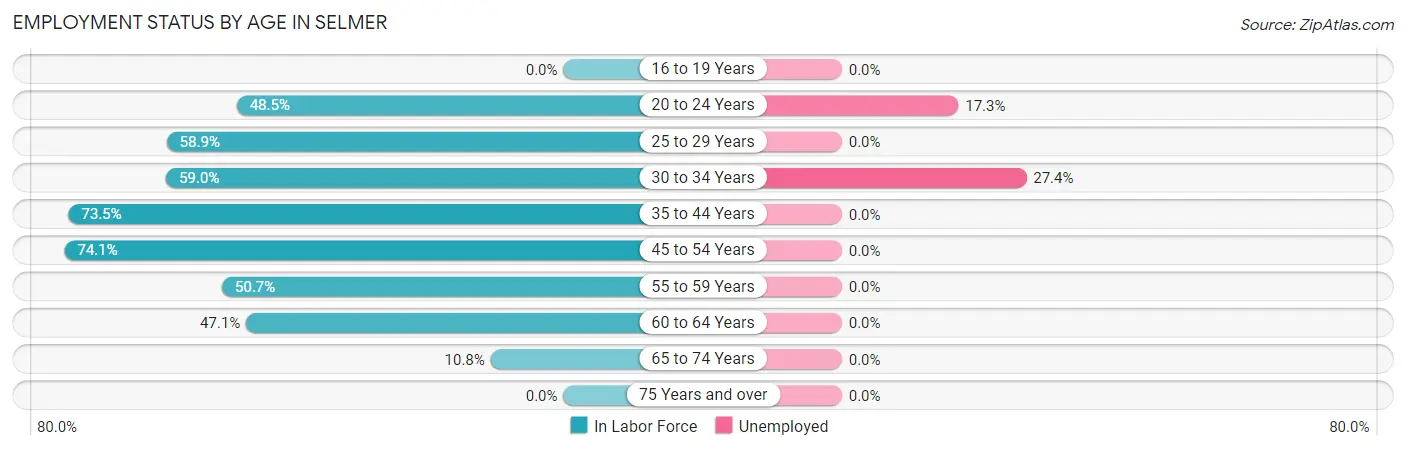
| Age Bracket | In Labor Force | Unemployed |
| 16 to 19 Years | 0 (0.0%) | 0 (0.0%) |
| 20 to 24 Years | 133 (48.5%) | 23 (17.3%) |
| 25 to 29 Years | 310 (58.9%) | 0 (0.0%) |
| 30 to 34 Years | 197 (59.0%) | 54 (27.4%) |
| 35 to 44 Years | 386 (73.5%) | 0 (0.0%) |
| 45 to 54 Years | 332 (74.1%) | 0 (0.0%) |
| 55 to 59 Years | 102 (50.7%) | 0 (0.0%) |
| 60 to 64 Years | 218 (47.1%) | 0 (0.0%) |
| 65 to 74 Years | 52 (10.8%) | 0 (0.0%) |
| 75 Years and over | 0 (0.0%) | 0 (0.0%) |
| Total | 1,731 (47.8%) | 80 (4.6%) |
Employment Status by Educational Attainment in Selmer
According to labor force statistics for Selmer, 61.9% of individuals (1,546) out of the total population between 25 and 64 years of age (2,497) are in the labor force, with 3.6% or 56 of them being unemployed. The group with the highest labor force participation rate are those with the educational attainment of bachelor's degree or higher, with 100.0% or 256 individuals in the labor force. Within the labor force, individuals with high school diploma education have the highest percentage of unemployment, with 8.1% or 54 of them being unemployed.
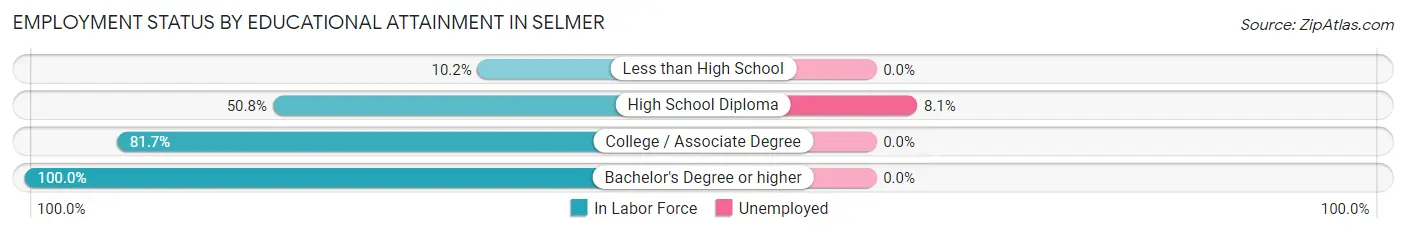
| Educational Attainment | In Labor Force | Unemployed |
| Less than High School | 19 (10.2%) | 0 (0.0%) |
| High School Diploma | 670 (50.8%) | 107 (8.1%) |
| College / Associate Degree | 601 (81.7%) | 0 (0.0%) |
| Bachelor's Degree or higher | 256 (100.0%) | 0 (0.0%) |
| Total | 1,546 (61.9%) | 90 (3.6%) |
Employment Occupations by Sex in Selmer
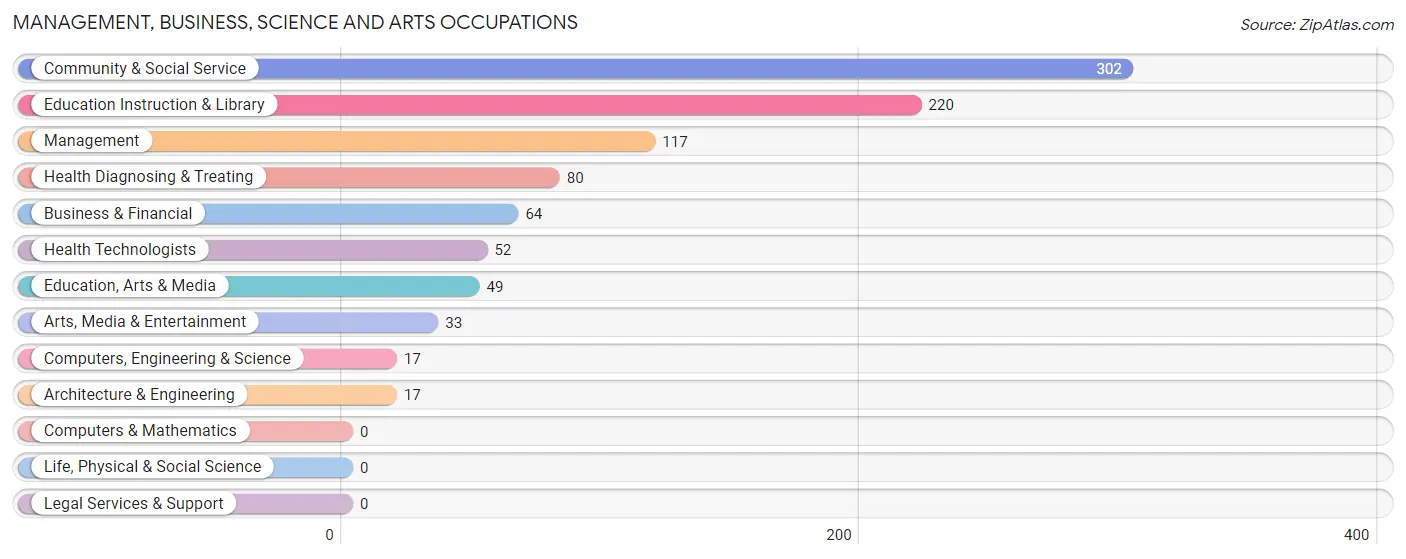
Management, Business, Science and Arts Occupations
The most common Management, Business, Science and Arts occupations in Selmer are Community & Social Service (302 | 18.9%), Education Instruction & Library (220 | 13.8%), Management (117 | 7.3%), Health Diagnosing & Treating (80 | 5.0%), and Business & Financial (64 | 4.0%).
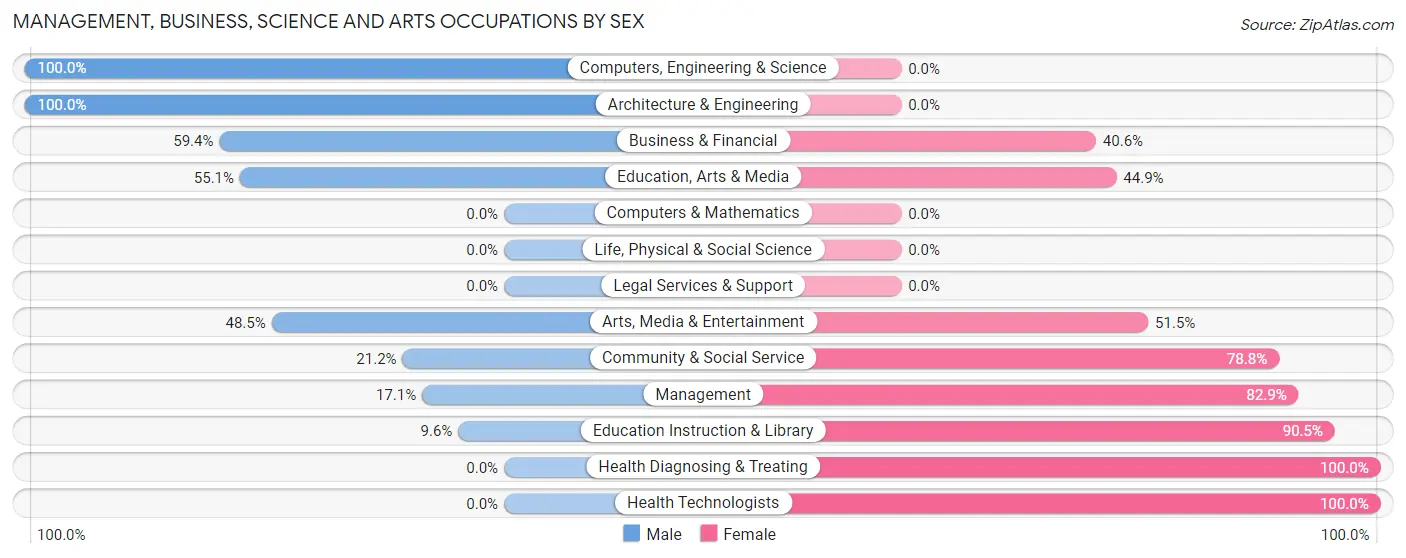
Management, Business, Science and Arts Occupations by Sex
Within the Management, Business, Science and Arts occupations in Selmer, the most male-oriented occupations are Computers, Engineering & Science (100.0%), Architecture & Engineering (100.0%), and Business & Financial (59.4%), while the most female-oriented occupations are Health Diagnosing & Treating (100.0%), Health Technologists (100.0%), and Education Instruction & Library (90.4%).
| Occupation | Male | Female |
| Management | 20 (17.1%) | 97 (82.9%) |
| Business & Financial | 38 (59.4%) | 26 (40.6%) |
| Computers, Engineering & Science | 17 (100.0%) | 0 (0.0%) |
| Computers & Mathematics | 0 (0.0%) | 0 (0.0%) |
| Architecture & Engineering | 17 (100.0%) | 0 (0.0%) |
| Life, Physical & Social Science | 0 (0.0%) | 0 (0.0%) |
| Community & Social Service | 64 (21.2%) | 238 (78.8%) |
| Education, Arts & Media | 27 (55.1%) | 22 (44.9%) |
| Legal Services & Support | 0 (0.0%) | 0 (0.0%) |
| Education Instruction & Library | 21 (9.6%) | 199 (90.4%) |
| Arts, Media & Entertainment | 16 (48.5%) | 17 (51.5%) |
| Health Diagnosing & Treating | 0 (0.0%) | 80 (100.0%) |
| Health Technologists | 0 (0.0%) | 52 (100.0%) |
| Total (Category) | 139 (24.0%) | 441 (76.0%) |
| Total (Overall) | 1,032 (64.7%) | 563 (35.3%) |
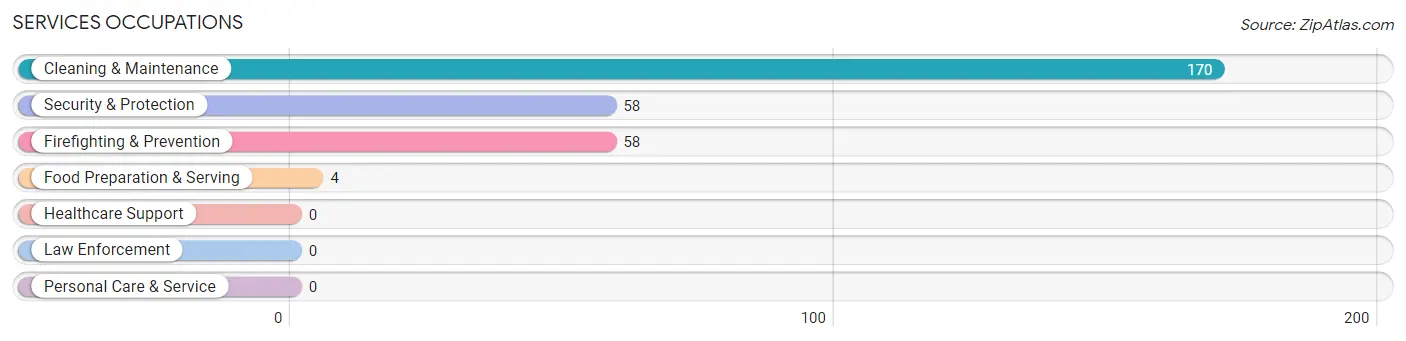
Services Occupations
The most common Services occupations in Selmer are Cleaning & Maintenance (170 | 10.7%), Security & Protection (58 | 3.6%), Firefighting & Prevention (58 | 3.6%), and Food Preparation & Serving (4 | 0.3%).
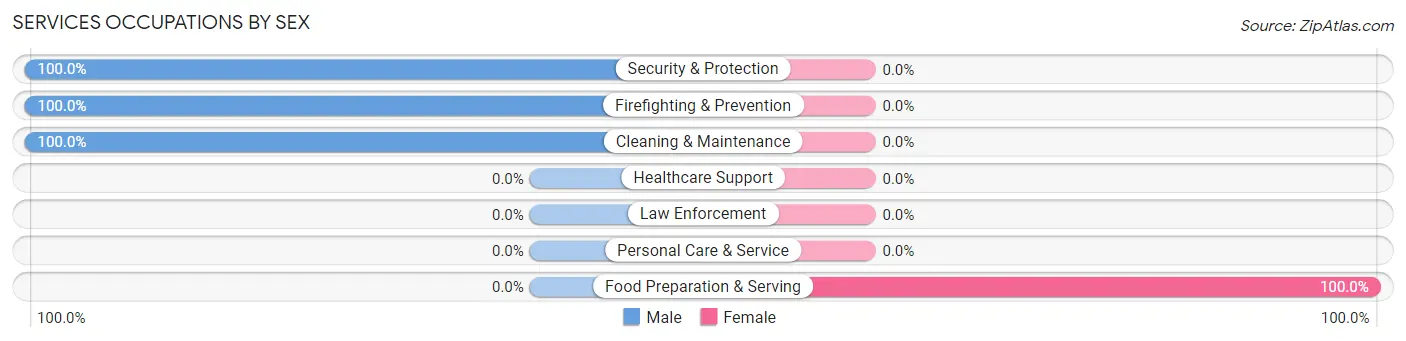
Services Occupations by Sex
| Occupation | Male | Female |
| Healthcare Support | 0 (0.0%) | 0 (0.0%) |
| Security & Protection | 58 (100.0%) | 0 (0.0%) |
| Firefighting & Prevention | 58 (100.0%) | 0 (0.0%) |
| Law Enforcement | 0 (0.0%) | 0 (0.0%) |
| Food Preparation & Serving | 0 (0.0%) | 4 (100.0%) |
| Cleaning & Maintenance | 170 (100.0%) | 0 (0.0%) |
| Personal Care & Service | 0 (0.0%) | 0 (0.0%) |
| Total (Category) | 228 (98.3%) | 4 (1.7%) |
| Total (Overall) | 1,032 (64.7%) | 563 (35.3%) |
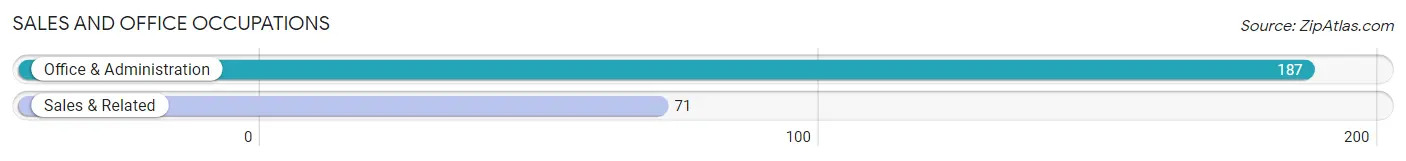
Sales and Office Occupations
The most common Sales and Office occupations in Selmer are Office & Administration (187 | 11.7%), and Sales & Related (71 | 4.4%).
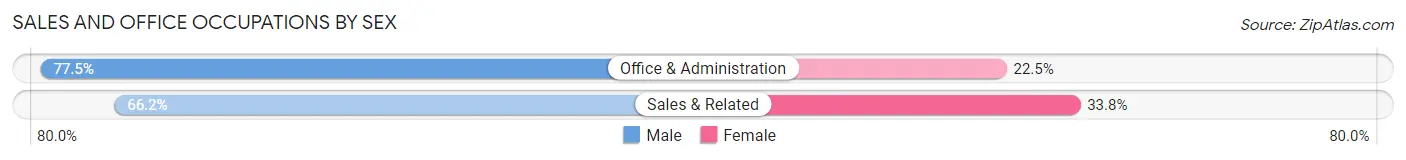
Sales and Office Occupations by Sex
| Occupation | Male | Female |
| Sales & Related | 47 (66.2%) | 24 (33.8%) |
| Office & Administration | 145 (77.5%) | 42 (22.5%) |
| Total (Category) | 192 (74.4%) | 66 (25.6%) |
| Total (Overall) | 1,032 (64.7%) | 563 (35.3%) |
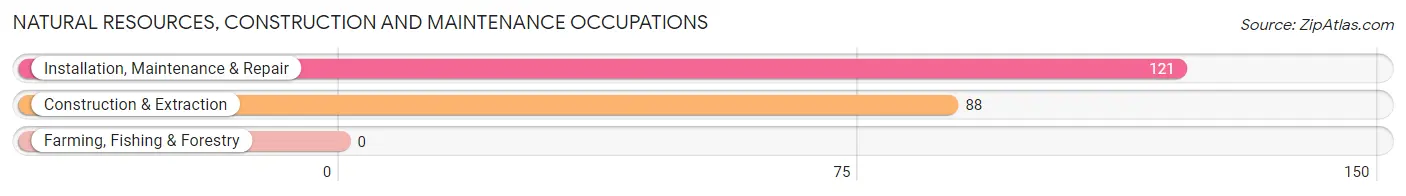
Natural Resources, Construction and Maintenance Occupations
The most common Natural Resources, Construction and Maintenance occupations in Selmer are Installation, Maintenance & Repair (121 | 7.6%), and Construction & Extraction (88 | 5.5%).
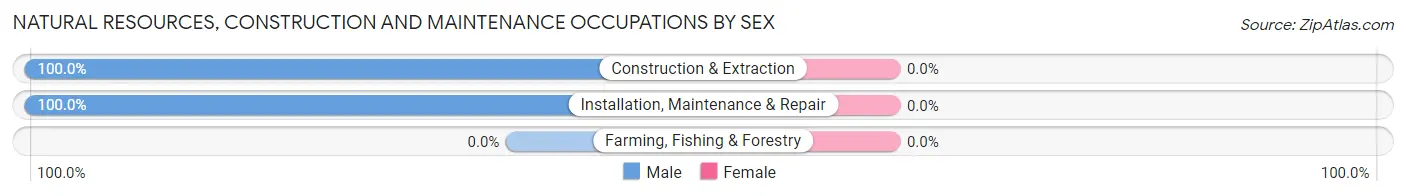
Natural Resources, Construction and Maintenance Occupations by Sex
| Occupation | Male | Female |
| Farming, Fishing & Forestry | 0 (0.0%) | 0 (0.0%) |
| Construction & Extraction | 88 (100.0%) | 0 (0.0%) |
| Installation, Maintenance & Repair | 121 (100.0%) | 0 (0.0%) |
| Total (Category) | 209 (100.0%) | 0 (0.0%) |
| Total (Overall) | 1,032 (64.7%) | 563 (35.3%) |
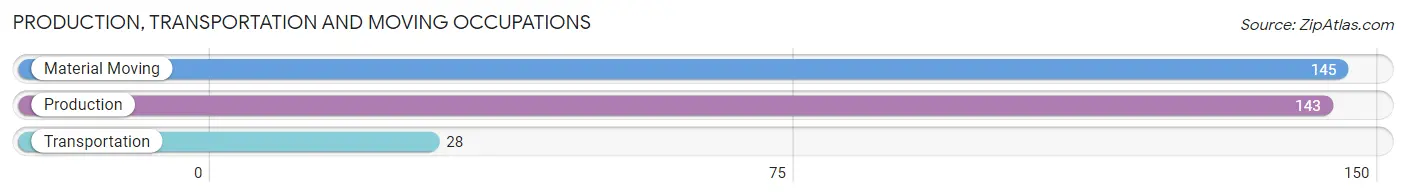
Production, Transportation and Moving Occupations
The most common Production, Transportation and Moving occupations in Selmer are Material Moving (145 | 9.1%), Production (143 | 9.0%), and Transportation (28 | 1.8%).
Production, Transportation and Moving Occupations by Sex
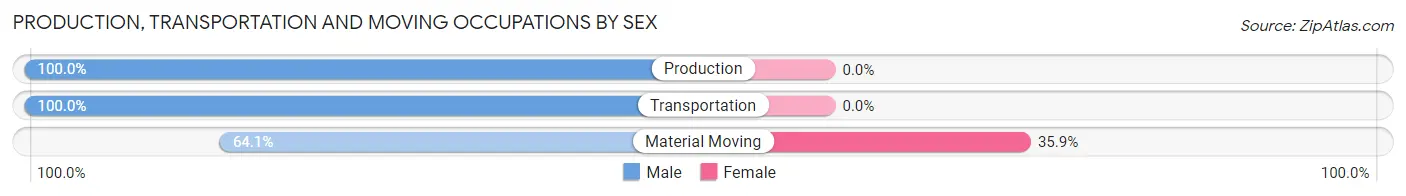
| Occupation | Male | Female |
| Production | 143 (100.0%) | 0 (0.0%) |
| Transportation | 28 (100.0%) | 0 (0.0%) |
| Material Moving | 93 (64.1%) | 52 (35.9%) |
| Total (Category) | 264 (83.5%) | 52 (16.5%) |
| Total (Overall) | 1,032 (64.7%) | 563 (35.3%) |
Employment Industries by Sex in Selmer
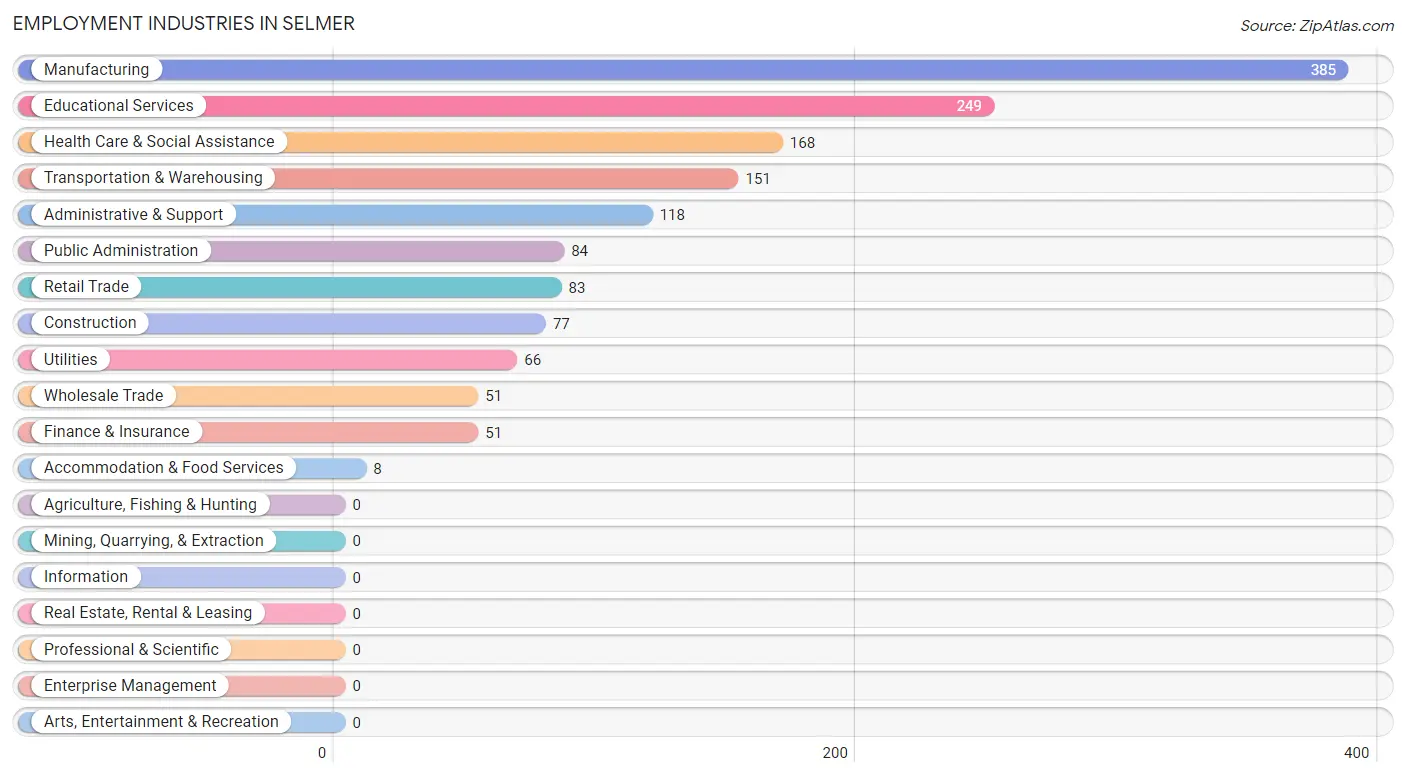
Employment Industries in Selmer
The major employment industries in Selmer include Manufacturing (385 | 24.1%), Educational Services (249 | 15.6%), Health Care & Social Assistance (168 | 10.5%), Transportation & Warehousing (151 | 9.5%), and Administrative & Support (118 | 7.4%).
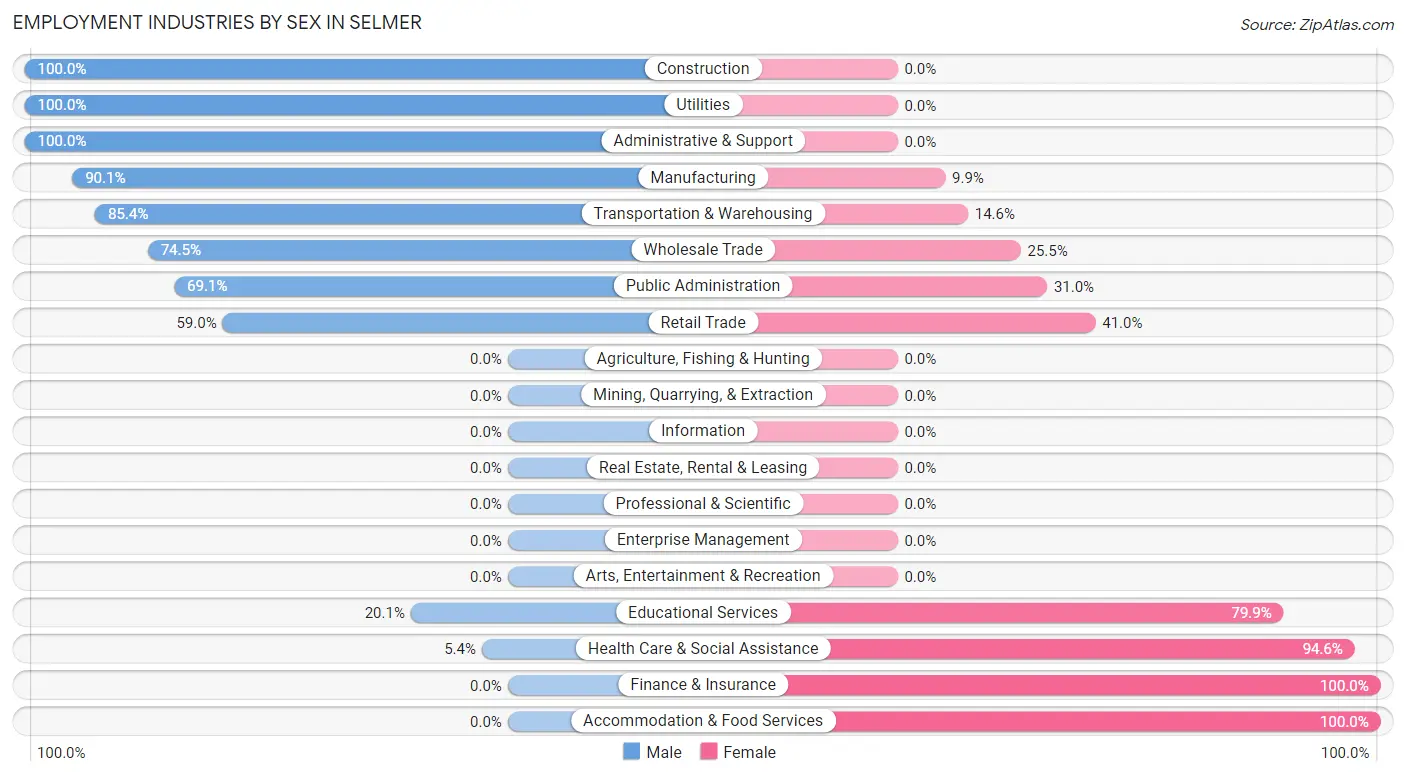
Employment Industries by Sex in Selmer
The Selmer industries that see more men than women are Construction (100.0%), Utilities (100.0%), and Administrative & Support (100.0%), whereas the industries that tend to have a higher number of women are Finance & Insurance (100.0%), Accommodation & Food Services (100.0%), and Health Care & Social Assistance (94.6%).
| Industry | Male | Female |
| Agriculture, Fishing & Hunting | 0 (0.0%) | 0 (0.0%) |
| Mining, Quarrying, & Extraction | 0 (0.0%) | 0 (0.0%) |
| Construction | 77 (100.0%) | 0 (0.0%) |
| Manufacturing | 347 (90.1%) | 38 (9.9%) |
| Wholesale Trade | 38 (74.5%) | 13 (25.5%) |
| Retail Trade | 49 (59.0%) | 34 (41.0%) |
| Transportation & Warehousing | 129 (85.4%) | 22 (14.6%) |
| Utilities | 66 (100.0%) | 0 (0.0%) |
| Information | 0 (0.0%) | 0 (0.0%) |
| Finance & Insurance | 0 (0.0%) | 51 (100.0%) |
| Real Estate, Rental & Leasing | 0 (0.0%) | 0 (0.0%) |
| Professional & Scientific | 0 (0.0%) | 0 (0.0%) |
| Enterprise Management | 0 (0.0%) | 0 (0.0%) |
| Administrative & Support | 118 (100.0%) | 0 (0.0%) |
| Educational Services | 50 (20.1%) | 199 (79.9%) |
| Health Care & Social Assistance | 9 (5.4%) | 159 (94.6%) |
| Arts, Entertainment & Recreation | 0 (0.0%) | 0 (0.0%) |
| Accommodation & Food Services | 0 (0.0%) | 8 (100.0%) |
| Public Administration | 58 (69.1%) | 26 (30.9%) |
| Total | 1,032 (64.7%) | 563 (35.3%) |
Education in Selmer
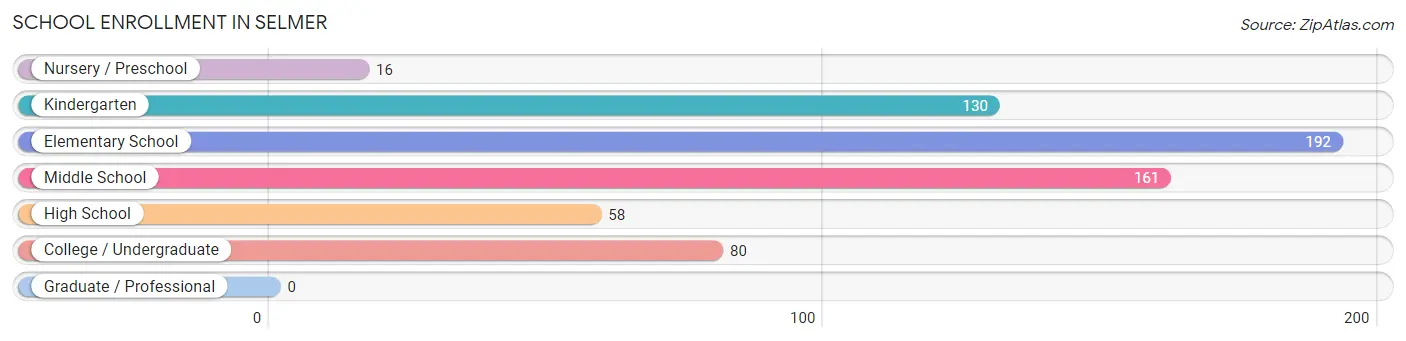
School Enrollment in Selmer
The most common levels of schooling among the 637 students in Selmer are elementary school (192 | 30.1%), middle school (161 | 25.3%), and kindergarten (130 | 20.4%).
| School Level | # Students | % Students |
| Nursery / Preschool | 16 | 2.5% |
| Kindergarten | 130 | 20.4% |
| Elementary School | 192 | 30.1% |
| Middle School | 161 | 25.3% |
| High School | 58 | 9.1% |
| College / Undergraduate | 80 | 12.6% |
| Graduate / Professional | 0 | 0.0% |
| Total | 637 | 100.0% |
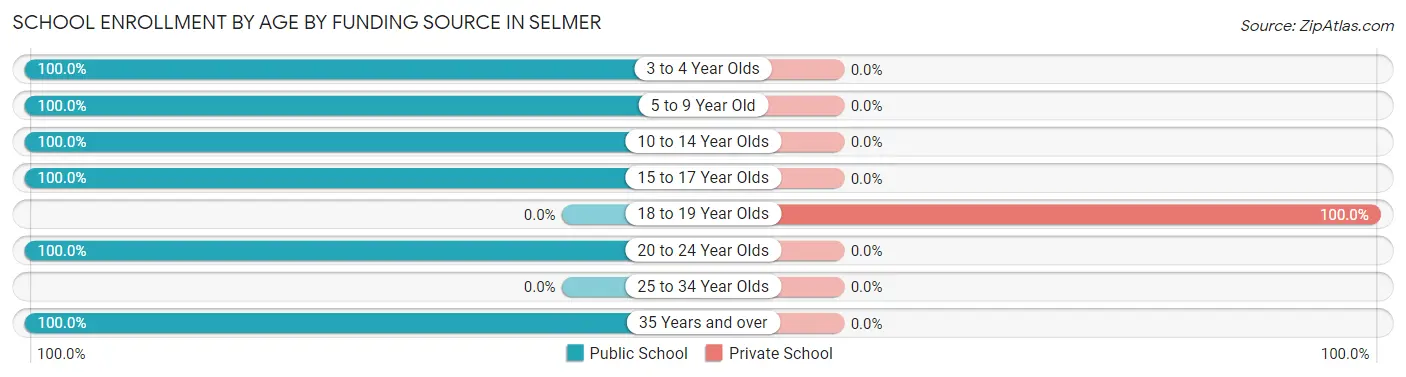
School Enrollment by Age by Funding Source in Selmer
Out of a total of 637 students who are enrolled in schools in Selmer, 24 (3.8%) attend a private institution, while the remaining 613 (96.2%) are enrolled in public schools. The age group of 18 to 19 year olds has the highest likelihood of being enrolled in private schools, with 24 (100.0% in the age bracket) enrolled. Conversely, the age group of 3 to 4 year olds has the lowest likelihood of being enrolled in a private school, with 16 (100.0% in the age bracket) attending a public institution.
| Age Bracket | Public School | Private School |
| 3 to 4 Year Olds | 16 (100.0%) | 0 (0.0%) |
| 5 to 9 Year Old | 308 (100.0%) | 0 (0.0%) |
| 10 to 14 Year Olds | 175 (100.0%) | 0 (0.0%) |
| 15 to 17 Year Olds | 58 (100.0%) | 0 (0.0%) |
| 18 to 19 Year Olds | 0 (0.0%) | 24 (100.0%) |
| 20 to 24 Year Olds | 42 (100.0%) | 0 (0.0%) |
| 25 to 34 Year Olds | 0 (0.0%) | 0 (0.0%) |
| 35 Years and over | 14 (100.0%) | 0 (0.0%) |
| Total | 613 (96.2%) | 24 (3.8%) |
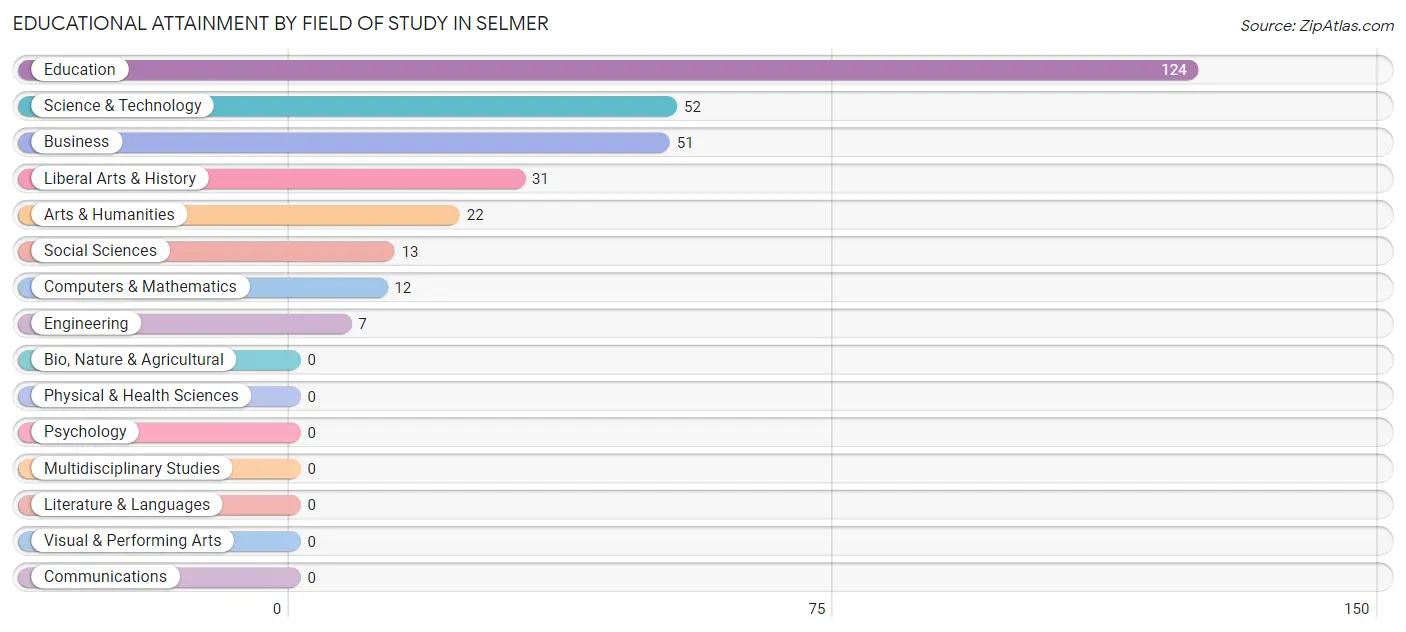
Educational Attainment by Field of Study in Selmer
Education (124 | 39.7%), science & technology (52 | 16.7%), business (51 | 16.4%), liberal arts & history (31 | 9.9%), and arts & humanities (22 | 7.0%) are the most common fields of study among 312 individuals in Selmer who have obtained a bachelor's degree or higher.
| Field of Study | # Graduates | % Graduates |
| Computers & Mathematics | 12 | 3.8% |
| Bio, Nature & Agricultural | 0 | 0.0% |
| Physical & Health Sciences | 0 | 0.0% |
| Psychology | 0 | 0.0% |
| Social Sciences | 13 | 4.2% |
| Engineering | 7 | 2.2% |
| Multidisciplinary Studies | 0 | 0.0% |
| Science & Technology | 52 | 16.7% |
| Business | 51 | 16.4% |
| Education | 124 | 39.7% |
| Literature & Languages | 0 | 0.0% |
| Liberal Arts & History | 31 | 9.9% |
| Visual & Performing Arts | 0 | 0.0% |
| Communications | 0 | 0.0% |
| Arts & Humanities | 22 | 7.0% |
| Total | 312 | 100.0% |
Transportation & Commute in Selmer
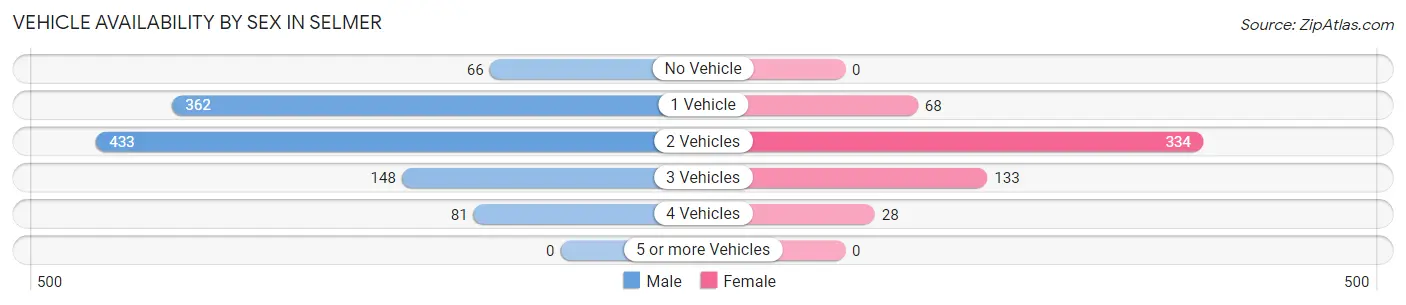
Vehicle Availability by Sex in Selmer
The most prevalent vehicle ownership categories in Selmer are males with 2 vehicles (433, accounting for 39.7%) and females with 2 vehicles (334, making up 76.9%).
| Vehicles Available | Male | Female |
| No Vehicle | 66 (6.1%) | 0 (0.0%) |
| 1 Vehicle | 362 (33.2%) | 68 (12.1%) |
| 2 Vehicles | 433 (39.7%) | 334 (59.3%) |
| 3 Vehicles | 148 (13.6%) | 133 (23.6%) |
| 4 Vehicles | 81 (7.4%) | 28 (5.0%) |
| 5 or more Vehicles | 0 (0.0%) | 0 (0.0%) |
| Total | 1,090 (100.0%) | 563 (100.0%) |
Commute Time in Selmer
The most frequently occuring commute durations in Selmer are 5 to 9 minutes (465 commuters, 28.1%), 10 to 14 minutes (359 commuters, 21.7%), and 30 to 34 minutes (255 commuters, 15.4%).
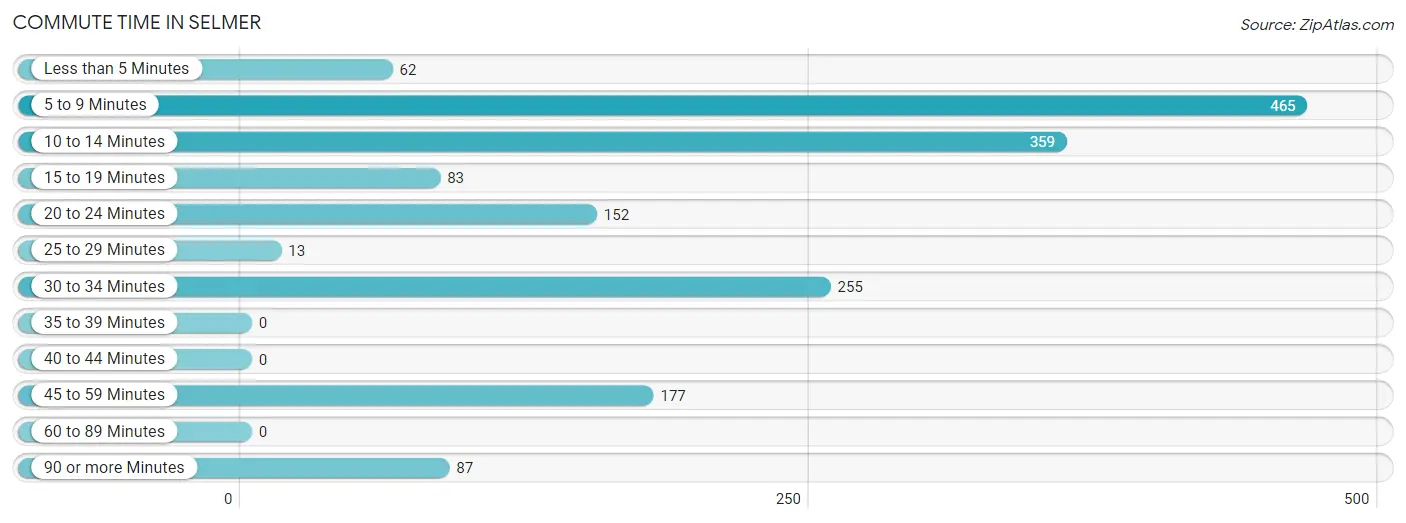
| Commute Time | # Commuters | % Commuters |
| Less than 5 Minutes | 62 | 3.7% |
| 5 to 9 Minutes | 465 | 28.1% |
| 10 to 14 Minutes | 359 | 21.7% |
| 15 to 19 Minutes | 83 | 5.0% |
| 20 to 24 Minutes | 152 | 9.2% |
| 25 to 29 Minutes | 13 | 0.8% |
| 30 to 34 Minutes | 255 | 15.4% |
| 35 to 39 Minutes | 0 | 0.0% |
| 40 to 44 Minutes | 0 | 0.0% |
| 45 to 59 Minutes | 177 | 10.7% |
| 60 to 89 Minutes | 0 | 0.0% |
| 90 or more Minutes | 87 | 5.3% |
Commute Time by Sex in Selmer
The most common commute times in Selmer are 5 to 9 minutes (330 commuters, 30.3%) for males and 10 to 14 minutes (167 commuters, 29.7%) for females.
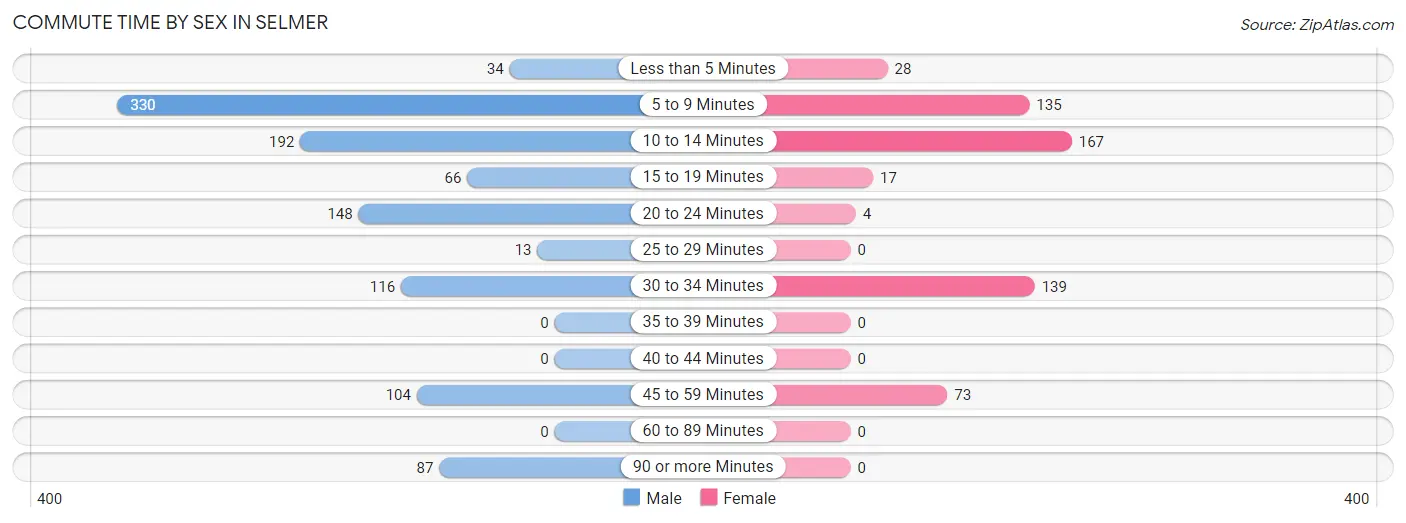
| Commute Time | Male | Female |
| Less than 5 Minutes | 34 (3.1%) | 28 (5.0%) |
| 5 to 9 Minutes | 330 (30.3%) | 135 (24.0%) |
| 10 to 14 Minutes | 192 (17.6%) | 167 (29.7%) |
| 15 to 19 Minutes | 66 (6.1%) | 17 (3.0%) |
| 20 to 24 Minutes | 148 (13.6%) | 4 (0.7%) |
| 25 to 29 Minutes | 13 (1.2%) | 0 (0.0%) |
| 30 to 34 Minutes | 116 (10.6%) | 139 (24.7%) |
| 35 to 39 Minutes | 0 (0.0%) | 0 (0.0%) |
| 40 to 44 Minutes | 0 (0.0%) | 0 (0.0%) |
| 45 to 59 Minutes | 104 (9.5%) | 73 (13.0%) |
| 60 to 89 Minutes | 0 (0.0%) | 0 (0.0%) |
| 90 or more Minutes | 87 (8.0%) | 0 (0.0%) |
Time of Departure to Work by Sex in Selmer
The most frequent times of departure to work in Selmer are 6:00 AM to 6:29 AM (253, 23.2%) for males and 7:30 AM to 7:59 AM (152, 27.0%) for females.
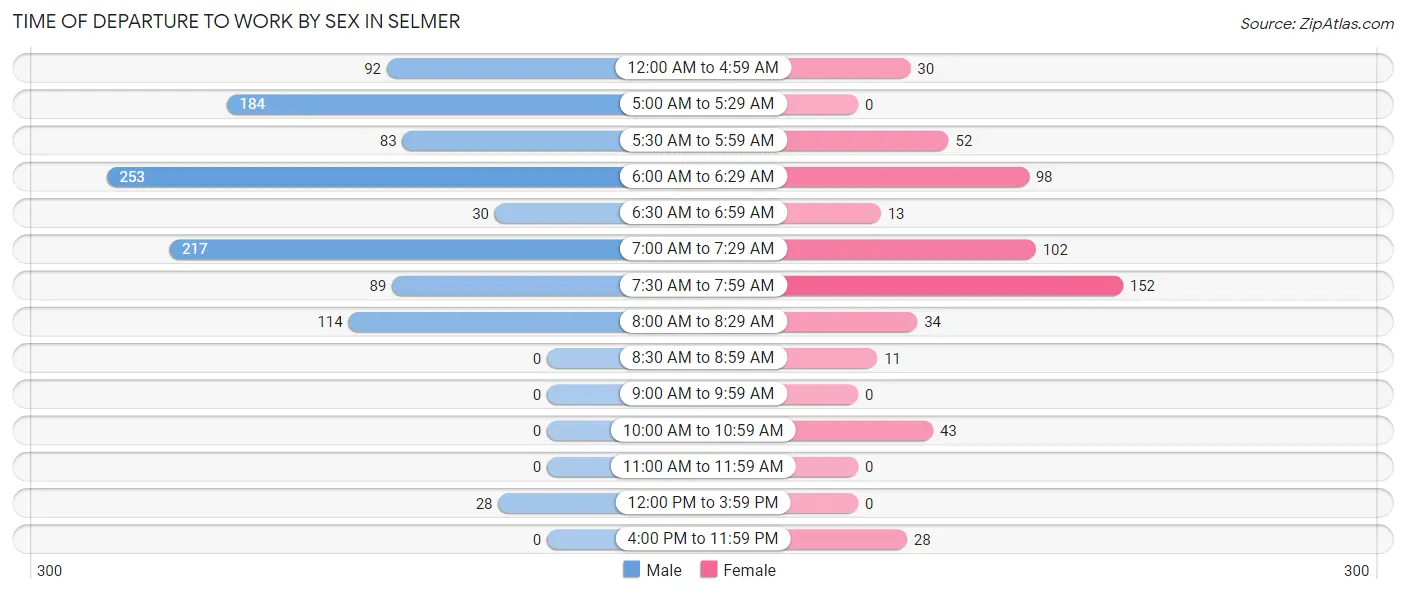
| Time of Departure | Male | Female |
| 12:00 AM to 4:59 AM | 92 (8.4%) | 30 (5.3%) |
| 5:00 AM to 5:29 AM | 184 (16.9%) | 0 (0.0%) |
| 5:30 AM to 5:59 AM | 83 (7.6%) | 52 (9.2%) |
| 6:00 AM to 6:29 AM | 253 (23.2%) | 98 (17.4%) |
| 6:30 AM to 6:59 AM | 30 (2.8%) | 13 (2.3%) |
| 7:00 AM to 7:29 AM | 217 (19.9%) | 102 (18.1%) |
| 7:30 AM to 7:59 AM | 89 (8.2%) | 152 (27.0%) |
| 8:00 AM to 8:29 AM | 114 (10.5%) | 34 (6.0%) |
| 8:30 AM to 8:59 AM | 0 (0.0%) | 11 (1.9%) |
| 9:00 AM to 9:59 AM | 0 (0.0%) | 0 (0.0%) |
| 10:00 AM to 10:59 AM | 0 (0.0%) | 43 (7.6%) |
| 11:00 AM to 11:59 AM | 0 (0.0%) | 0 (0.0%) |
| 12:00 PM to 3:59 PM | 28 (2.6%) | 0 (0.0%) |
| 4:00 PM to 11:59 PM | 0 (0.0%) | 28 (5.0%) |
| Total | 1,090 (100.0%) | 563 (100.0%) |
Housing Occupancy in Selmer
Occupancy by Ownership in Selmer
Of the total 1,783 dwellings in Selmer, owner-occupied units account for 1,275 (71.5%), while renter-occupied units make up 508 (28.5%).
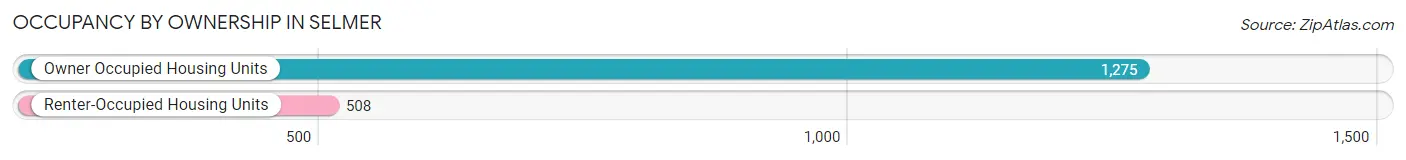
| Occupancy | # Housing Units | % Housing Units |
| Owner Occupied Housing Units | 1,275 | 71.5% |
| Renter-Occupied Housing Units | 508 | 28.5% |
| Total Occupied Housing Units | 1,783 | 100.0% |
Occupancy by Household Size in Selmer

| Household Size | # Housing Units | % Housing Units |
| 1-Person Household | 725 | 40.7% |
| 2-Person Household | 485 | 27.2% |
| 3-Person Household | 334 | 18.7% |
| 4+ Person Household | 239 | 13.4% |
| Total Housing Units | 1,783 | 100.0% |
Occupancy by Ownership by Household Size in Selmer
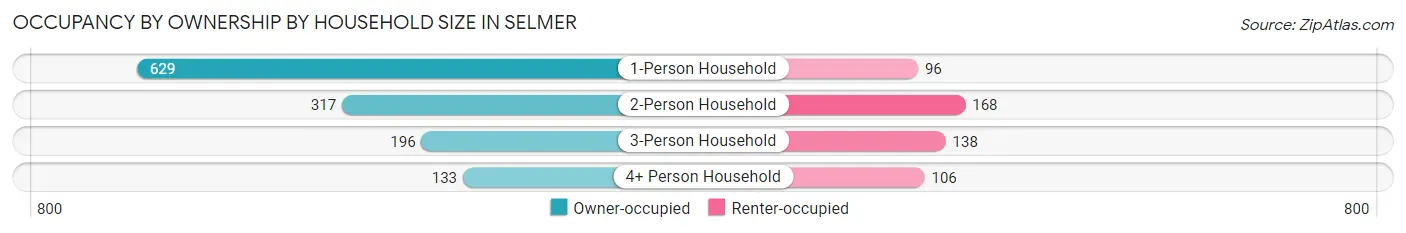
| Household Size | Owner-occupied | Renter-occupied |
| 1-Person Household | 629 (86.8%) | 96 (13.2%) |
| 2-Person Household | 317 (65.4%) | 168 (34.6%) |
| 3-Person Household | 196 (58.7%) | 138 (41.3%) |
| 4+ Person Household | 133 (55.6%) | 106 (44.4%) |
| Total Housing Units | 1,275 (71.5%) | 508 (28.5%) |
Occupancy by Educational Attainment in Selmer
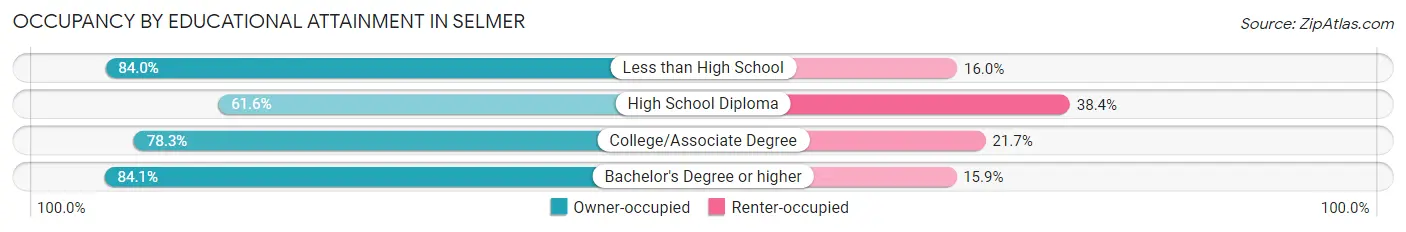
| Household Size | Owner-occupied | Renter-occupied |
| Less than High School | 131 (84.0%) | 25 (16.0%) |
| High School Diploma | 507 (61.6%) | 316 (38.4%) |
| College/Associate Degree | 531 (78.3%) | 147 (21.7%) |
| Bachelor's Degree or higher | 106 (84.1%) | 20 (15.9%) |
Occupancy by Age of Householder in Selmer
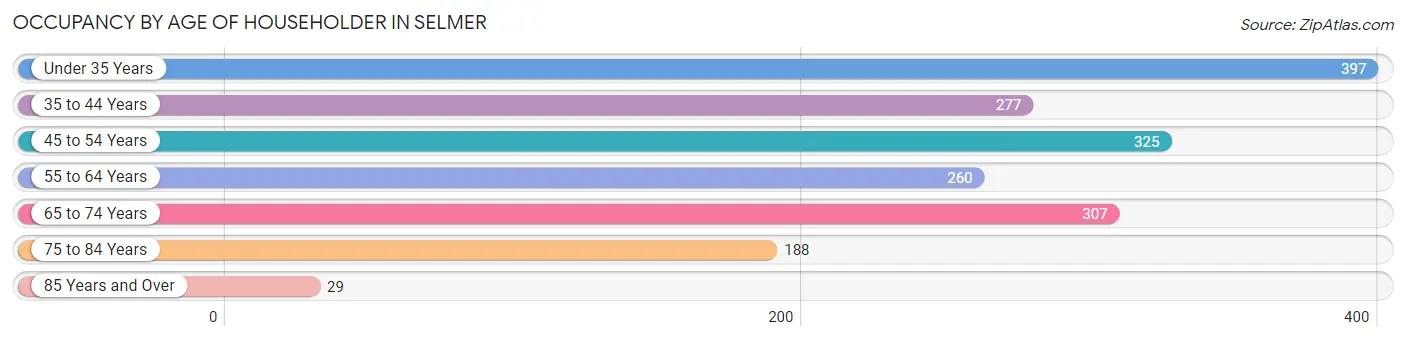
| Age Bracket | # Households | % Households |
| Under 35 Years | 397 | 22.3% |
| 35 to 44 Years | 277 | 15.5% |
| 45 to 54 Years | 325 | 18.2% |
| 55 to 64 Years | 260 | 14.6% |
| 65 to 74 Years | 307 | 17.2% |
| 75 to 84 Years | 188 | 10.5% |
| 85 Years and Over | 29 | 1.6% |
| Total | 1,783 | 100.0% |
Housing Finances in Selmer
Median Income by Occupancy in Selmer
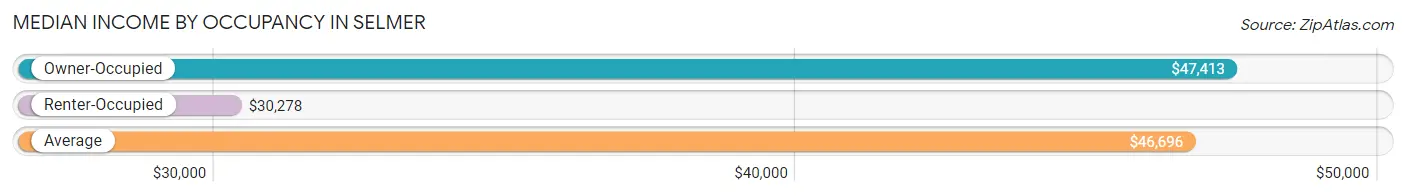
| Occupancy Type | # Households | Median Income |
| Owner-Occupied | 1,275 (71.5%) | $47,413 |
| Renter-Occupied | 508 (28.5%) | $30,278 |
| Average | 1,783 (100.0%) | $46,696 |
Occupancy by Householder Income Bracket in Selmer
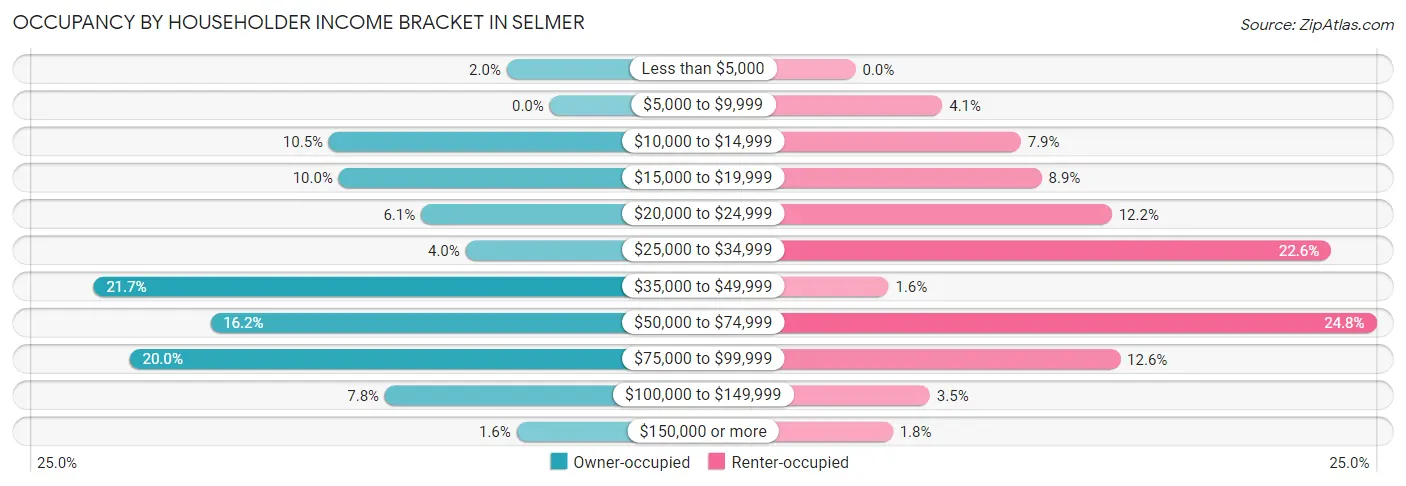
| Income Bracket | Owner-occupied | Renter-occupied |
| Less than $5,000 | 26 (2.0%) | 0 (0.0%) |
| $5,000 to $9,999 | 0 (0.0%) | 21 (4.1%) |
| $10,000 to $14,999 | 134 (10.5%) | 40 (7.9%) |
| $15,000 to $19,999 | 128 (10.0%) | 45 (8.9%) |
| $20,000 to $24,999 | 78 (6.1%) | 62 (12.2%) |
| $25,000 to $34,999 | 51 (4.0%) | 115 (22.6%) |
| $35,000 to $49,999 | 277 (21.7%) | 8 (1.6%) |
| $50,000 to $74,999 | 206 (16.2%) | 126 (24.8%) |
| $75,000 to $99,999 | 255 (20.0%) | 64 (12.6%) |
| $100,000 to $149,999 | 100 (7.8%) | 18 (3.5%) |
| $150,000 or more | 20 (1.6%) | 9 (1.8%) |
| Total | 1,275 (100.0%) | 508 (100.0%) |
Monthly Housing Cost Tiers in Selmer
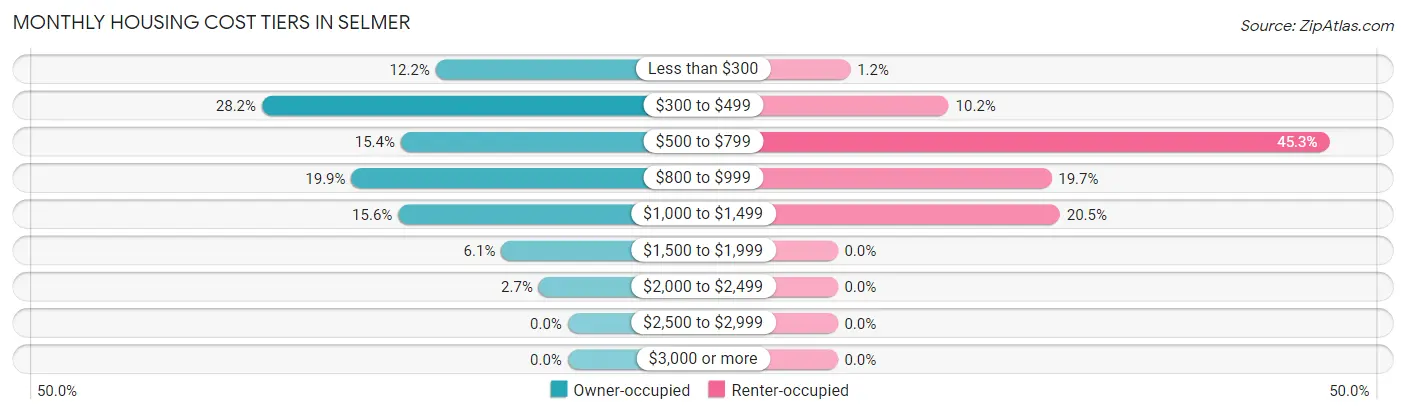
| Monthly Cost | Owner-occupied | Renter-occupied |
| Less than $300 | 155 (12.2%) | 6 (1.2%) |
| $300 to $499 | 359 (28.2%) | 52 (10.2%) |
| $500 to $799 | 196 (15.4%) | 230 (45.3%) |
| $800 to $999 | 254 (19.9%) | 100 (19.7%) |
| $1,000 to $1,499 | 199 (15.6%) | 104 (20.5%) |
| $1,500 to $1,999 | 78 (6.1%) | 0 (0.0%) |
| $2,000 to $2,499 | 34 (2.7%) | 0 (0.0%) |
| $2,500 to $2,999 | 0 (0.0%) | 0 (0.0%) |
| $3,000 or more | 0 (0.0%) | 0 (0.0%) |
| Total | 1,275 (100.0%) | 508 (100.0%) |
Physical Housing Characteristics in Selmer
Housing Structures in Selmer
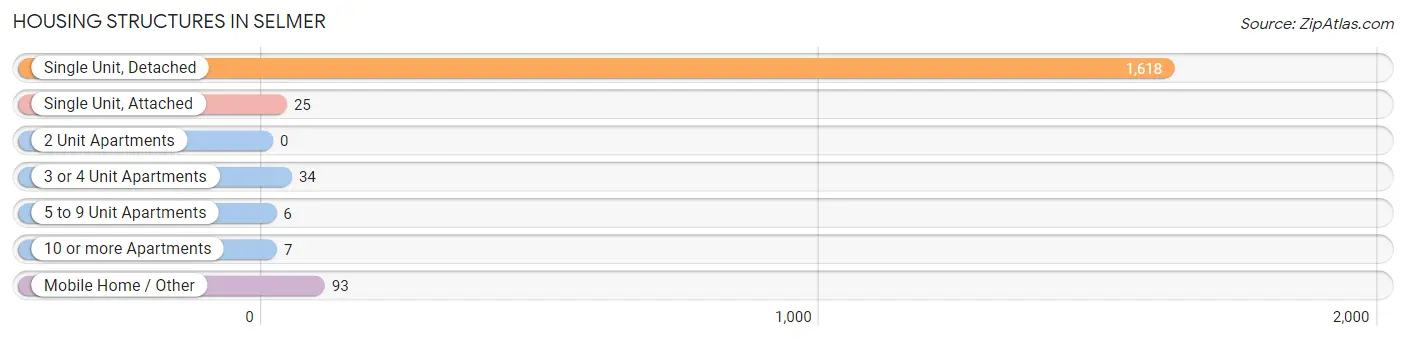
| Structure Type | # Housing Units | % Housing Units |
| Single Unit, Detached | 1,618 | 90.7% |
| Single Unit, Attached | 25 | 1.4% |
| 2 Unit Apartments | 0 | 0.0% |
| 3 or 4 Unit Apartments | 34 | 1.9% |
| 5 to 9 Unit Apartments | 6 | 0.3% |
| 10 or more Apartments | 7 | 0.4% |
| Mobile Home / Other | 93 | 5.2% |
| Total | 1,783 | 100.0% |
Housing Structures by Occupancy in Selmer
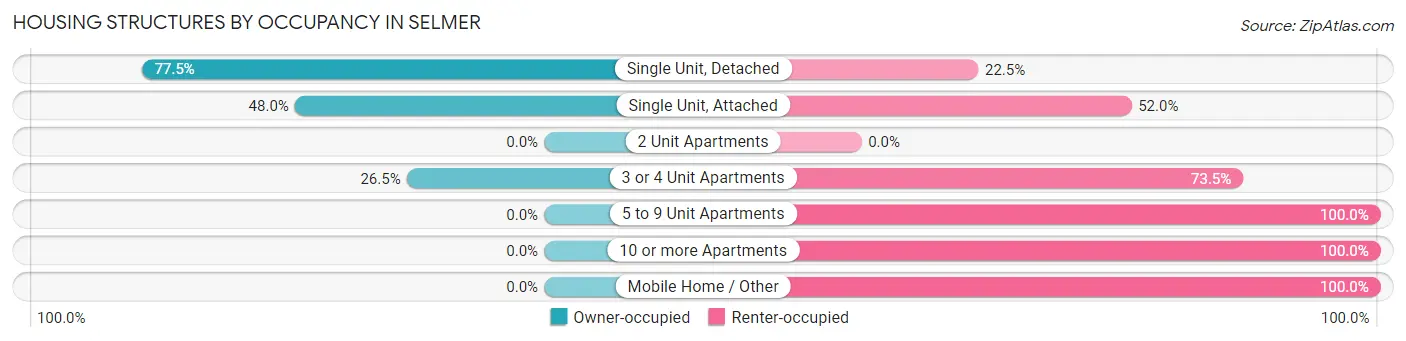
| Structure Type | Owner-occupied | Renter-occupied |
| Single Unit, Detached | 1,254 (77.5%) | 364 (22.5%) |
| Single Unit, Attached | 12 (48.0%) | 13 (52.0%) |
| 2 Unit Apartments | 0 (0.0%) | 0 (0.0%) |
| 3 or 4 Unit Apartments | 9 (26.5%) | 25 (73.5%) |
| 5 to 9 Unit Apartments | 0 (0.0%) | 6 (100.0%) |
| 10 or more Apartments | 0 (0.0%) | 7 (100.0%) |
| Mobile Home / Other | 0 (0.0%) | 93 (100.0%) |
| Total | 1,275 (71.5%) | 508 (28.5%) |
Housing Structures by Number of Rooms in Selmer
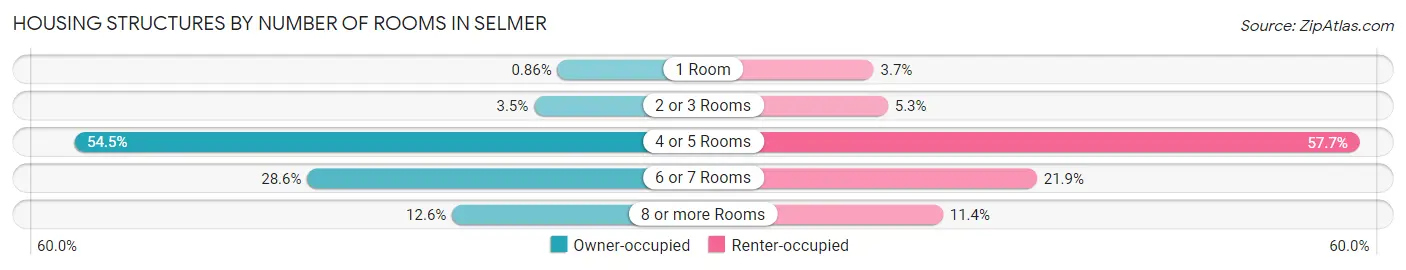
| Number of Rooms | Owner-occupied | Renter-occupied |
| 1 Room | 11 (0.9%) | 19 (3.7%) |
| 2 or 3 Rooms | 44 (3.5%) | 27 (5.3%) |
| 4 or 5 Rooms | 695 (54.5%) | 293 (57.7%) |
| 6 or 7 Rooms | 365 (28.6%) | 111 (21.8%) |
| 8 or more Rooms | 160 (12.6%) | 58 (11.4%) |
| Total | 1,275 (100.0%) | 508 (100.0%) |
Housing Structure by Heating Type in Selmer
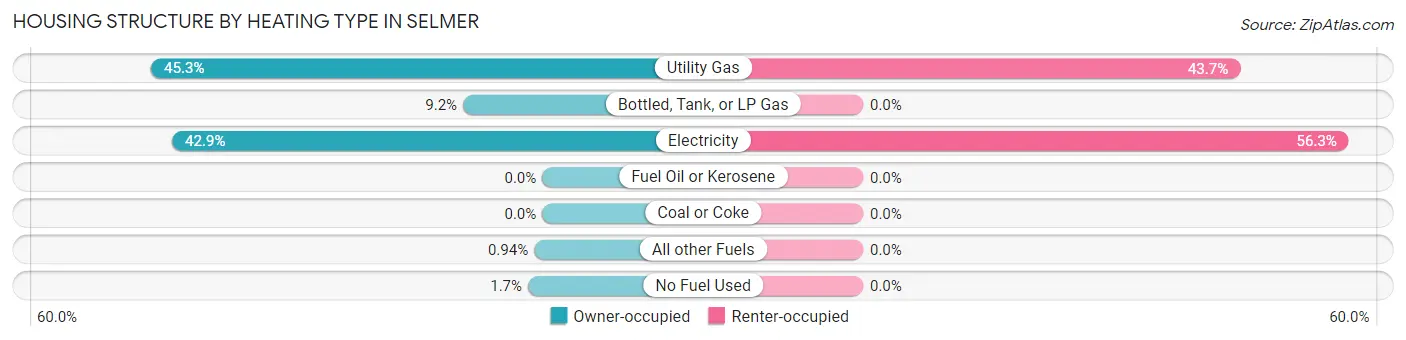
| Heating Type | Owner-occupied | Renter-occupied |
| Utility Gas | 578 (45.3%) | 222 (43.7%) |
| Bottled, Tank, or LP Gas | 117 (9.2%) | 0 (0.0%) |
| Electricity | 547 (42.9%) | 286 (56.3%) |
| Fuel Oil or Kerosene | 0 (0.0%) | 0 (0.0%) |
| Coal or Coke | 0 (0.0%) | 0 (0.0%) |
| All other Fuels | 12 (0.9%) | 0 (0.0%) |
| No Fuel Used | 21 (1.7%) | 0 (0.0%) |
| Total | 1,275 (100.0%) | 508 (100.0%) |
Household Vehicle Usage in Selmer
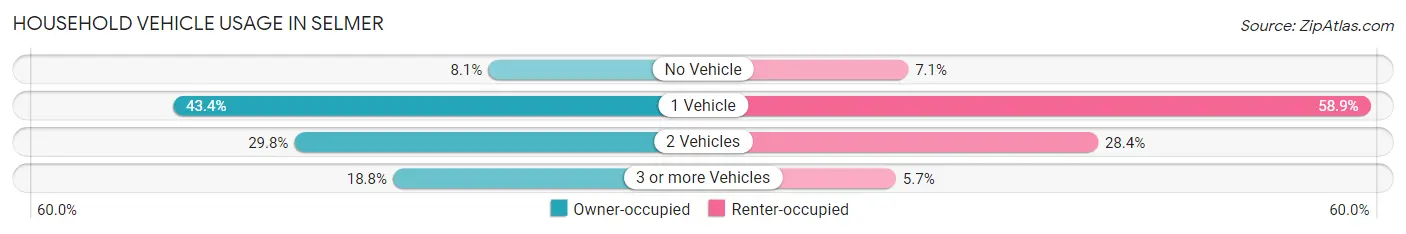
| Vehicles per Household | Owner-occupied | Renter-occupied |
| No Vehicle | 103 (8.1%) | 36 (7.1%) |
| 1 Vehicle | 553 (43.4%) | 299 (58.9%) |
| 2 Vehicles | 380 (29.8%) | 144 (28.3%) |
| 3 or more Vehicles | 239 (18.8%) | 29 (5.7%) |
| Total | 1,275 (100.0%) | 508 (100.0%) |
Real Estate & Mortgages in Selmer
Real Estate and Mortgage Overview in Selmer
| Characteristic | Without Mortgage | With Mortgage |
| Housing Units | 631 | 644 |
| Median Property Value | $90,600 | $96,200 |
| Median Household Income | $36,518 | $0 |
| Monthly Housing Costs | $361 | $0 |
| Real Estate Taxes | $653 | $26 |
Property Value by Mortgage Status in Selmer
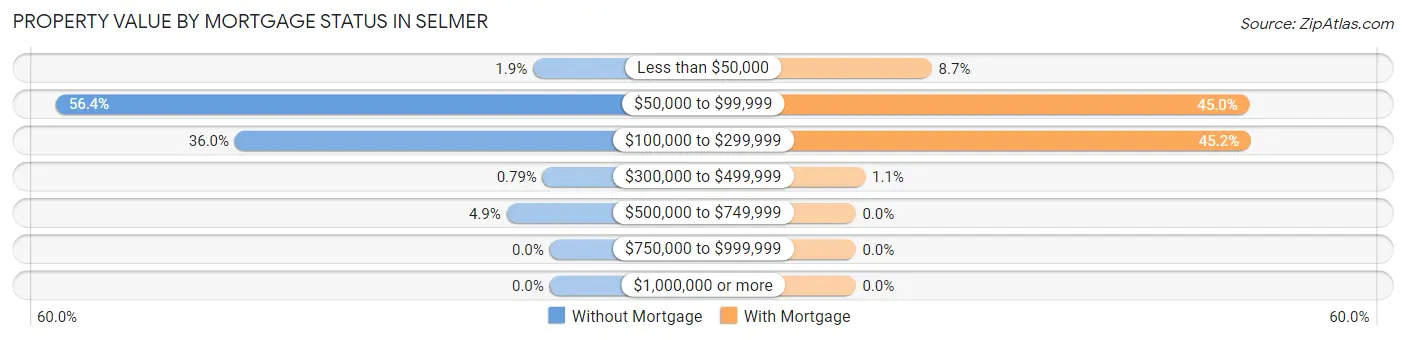
| Property Value | Without Mortgage | With Mortgage |
| Less than $50,000 | 12 (1.9%) | 56 (8.7%) |
| $50,000 to $99,999 | 356 (56.4%) | 290 (45.0%) |
| $100,000 to $299,999 | 227 (36.0%) | 291 (45.2%) |
| $300,000 to $499,999 | 5 (0.8%) | 7 (1.1%) |
| $500,000 to $749,999 | 31 (4.9%) | 0 (0.0%) |
| $750,000 to $999,999 | 0 (0.0%) | 0 (0.0%) |
| $1,000,000 or more | 0 (0.0%) | 0 (0.0%) |
| Total | 631 (100.0%) | 644 (100.0%) |
Household Income by Mortgage Status in Selmer
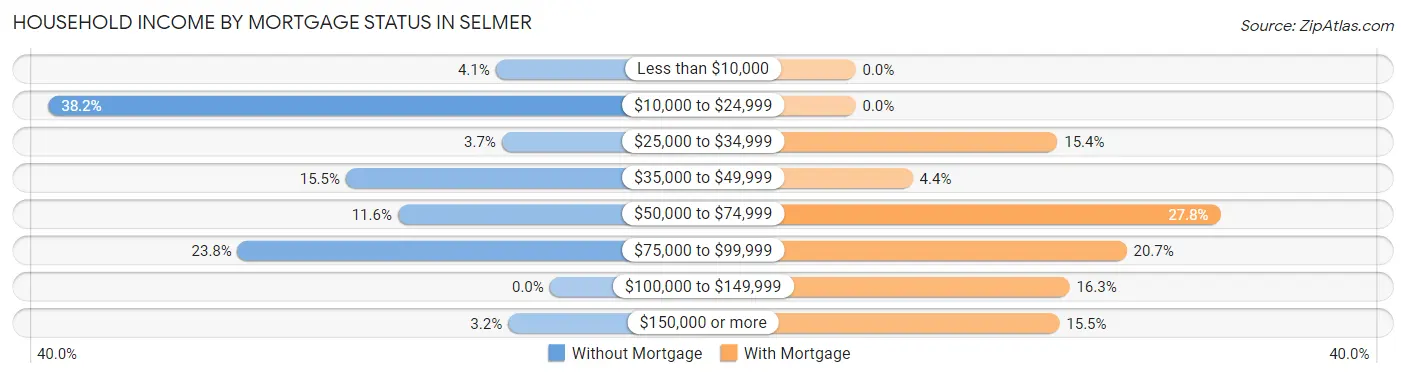
| Household Income | Without Mortgage | With Mortgage |
| Less than $10,000 | 26 (4.1%) | 0 (0.0%) |
| $10,000 to $24,999 | 241 (38.2%) | 0 (0.0%) |
| $25,000 to $34,999 | 23 (3.6%) | 99 (15.4%) |
| $35,000 to $49,999 | 98 (15.5%) | 28 (4.3%) |
| $50,000 to $74,999 | 73 (11.6%) | 179 (27.8%) |
| $75,000 to $99,999 | 150 (23.8%) | 133 (20.6%) |
| $100,000 to $149,999 | 0 (0.0%) | 105 (16.3%) |
| $150,000 or more | 20 (3.2%) | 100 (15.5%) |
| Total | 631 (100.0%) | 644 (100.0%) |
Property Value to Household Income Ratio in Selmer
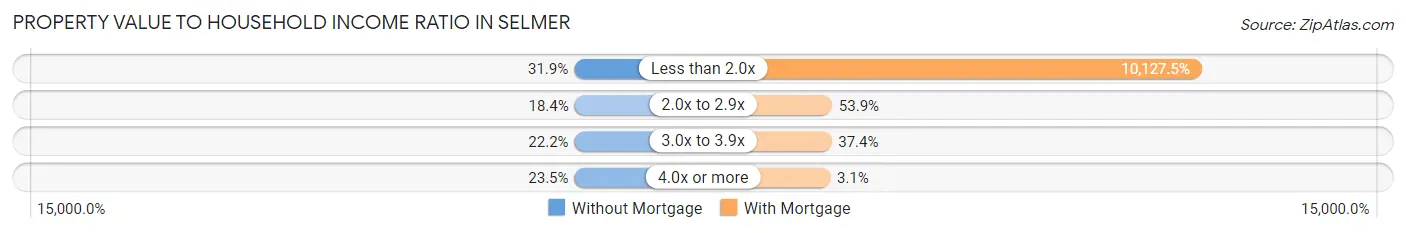
| Value-to-Income Ratio | Without Mortgage | With Mortgage |
| Less than 2.0x | 201 (31.9%) | 65,221 (10,127.5%) |
| 2.0x to 2.9x | 116 (18.4%) | 347 (53.9%) |
| 3.0x to 3.9x | 140 (22.2%) | 241 (37.4%) |
| 4.0x or more | 148 (23.4%) | 20 (3.1%) |
| Total | 631 (100.0%) | 644 (100.0%) |
Real Estate Taxes by Mortgage Status in Selmer
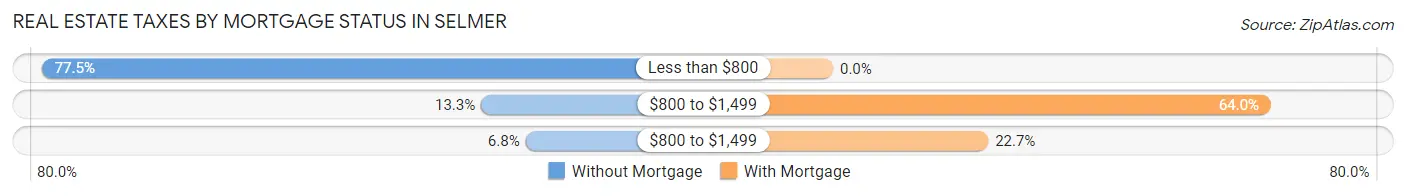
| Property Taxes | Without Mortgage | With Mortgage |
| Less than $800 | 489 (77.5%) | 0 (0.0%) |
| $800 to $1,499 | 84 (13.3%) | 412 (64.0%) |
| $800 to $1,499 | 43 (6.8%) | 146 (22.7%) |
| Total | 631 (100.0%) | 644 (100.0%) |
Health & Disability in Selmer
Health Insurance Coverage by Age in Selmer
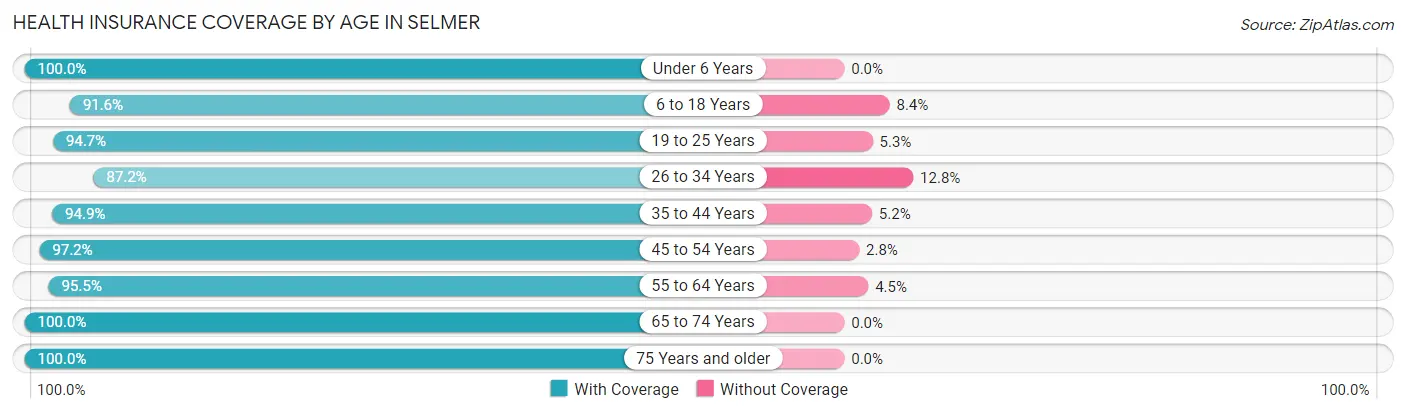
| Age Bracket | With Coverage | Without Coverage |
| Under 6 Years | 379 (100.0%) | 0 (0.0%) |
| 6 to 18 Years | 423 (91.6%) | 39 (8.4%) |
| 19 to 25 Years | 323 (94.7%) | 18 (5.3%) |
| 26 to 34 Years | 699 (87.2%) | 103 (12.8%) |
| 35 to 44 Years | 424 (94.9%) | 23 (5.1%) |
| 45 to 54 Years | 422 (97.2%) | 12 (2.8%) |
| 55 to 64 Years | 621 (95.5%) | 29 (4.5%) |
| 65 to 74 Years | 437 (100.0%) | 0 (0.0%) |
| 75 Years and older | 227 (100.0%) | 0 (0.0%) |
| Total | 3,955 (94.6%) | 224 (5.4%) |
Health Insurance Coverage by Citizenship Status in Selmer
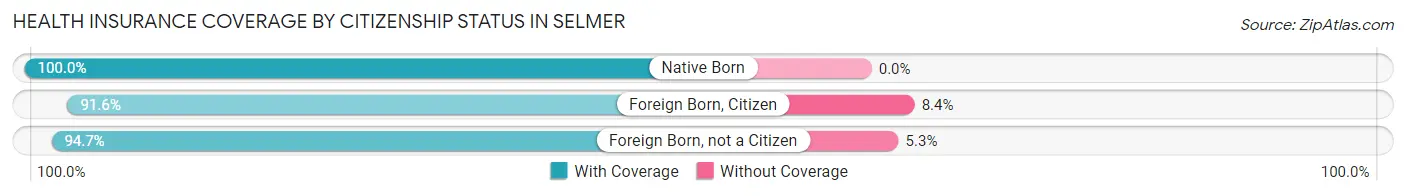
| Citizenship Status | With Coverage | Without Coverage |
| Native Born | 379 (100.0%) | 0 (0.0%) |
| Foreign Born, Citizen | 423 (91.6%) | 39 (8.4%) |
| Foreign Born, not a Citizen | 323 (94.7%) | 18 (5.3%) |
Health Insurance Coverage by Household Income in Selmer
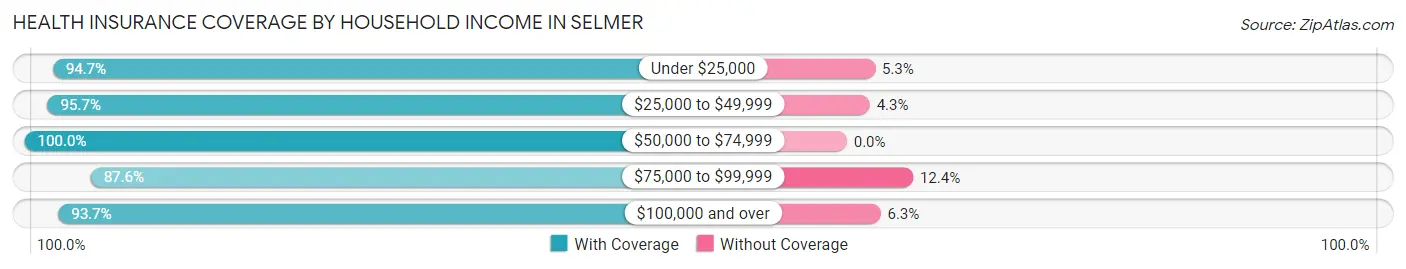
| Household Income | With Coverage | Without Coverage |
| Under $25,000 | 842 (94.7%) | 47 (5.3%) |
| $25,000 to $49,999 | 914 (95.7%) | 41 (4.3%) |
| $50,000 to $74,999 | 998 (100.0%) | 0 (0.0%) |
| $75,000 to $99,999 | 756 (87.6%) | 107 (12.4%) |
| $100,000 and over | 430 (93.7%) | 29 (6.3%) |
Public vs Private Health Insurance Coverage by Age in Selmer
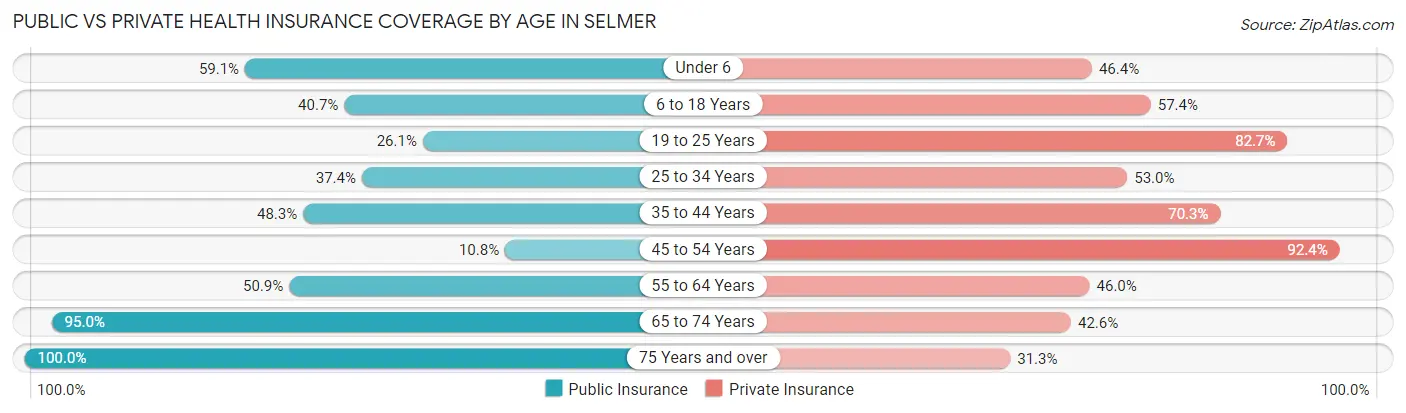
| Age Bracket | Public Insurance | Private Insurance |
| Under 6 | 224 (59.1%) | 176 (46.4%) |
| 6 to 18 Years | 188 (40.7%) | 265 (57.4%) |
| 19 to 25 Years | 89 (26.1%) | 282 (82.7%) |
| 25 to 34 Years | 300 (37.4%) | 425 (53.0%) |
| 35 to 44 Years | 216 (48.3%) | 314 (70.3%) |
| 45 to 54 Years | 47 (10.8%) | 401 (92.4%) |
| 55 to 64 Years | 331 (50.9%) | 299 (46.0%) |
| 65 to 74 Years | 415 (95.0%) | 186 (42.6%) |
| 75 Years and over | 227 (100.0%) | 71 (31.3%) |
| Total | 2,037 (48.7%) | 2,419 (57.9%) |
Disability Status by Sex by Age in Selmer
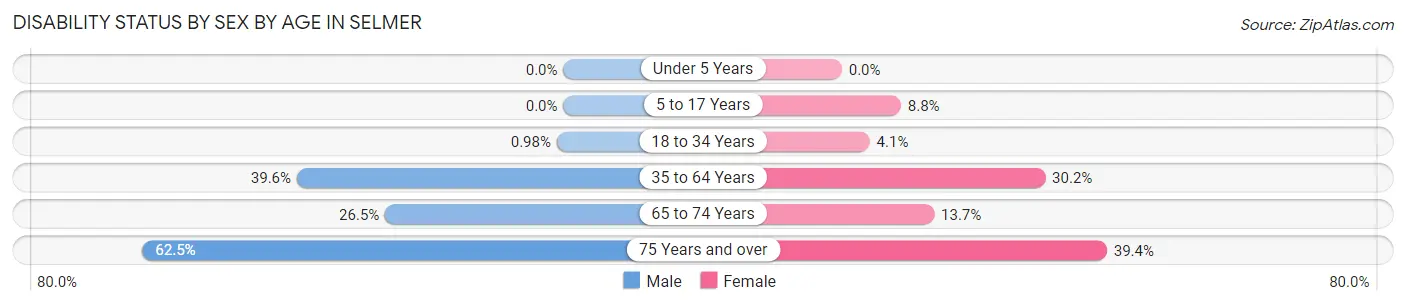
| Age Bracket | Male | Female |
| Under 5 Years | 0 (0.0%) | 0 (0.0%) |
| 5 to 17 Years | 0 (0.0%) | 25 (8.8%) |
| 18 to 34 Years | 6 (1.0%) | 22 (4.1%) |
| 35 to 64 Years | 383 (39.6%) | 170 (30.2%) |
| 65 to 74 Years | 50 (26.5%) | 34 (13.7%) |
| 75 Years and over | 45 (62.5%) | 61 (39.4%) |
Disability Class by Sex by Age in Selmer
Disability Class: Hearing Difficulty
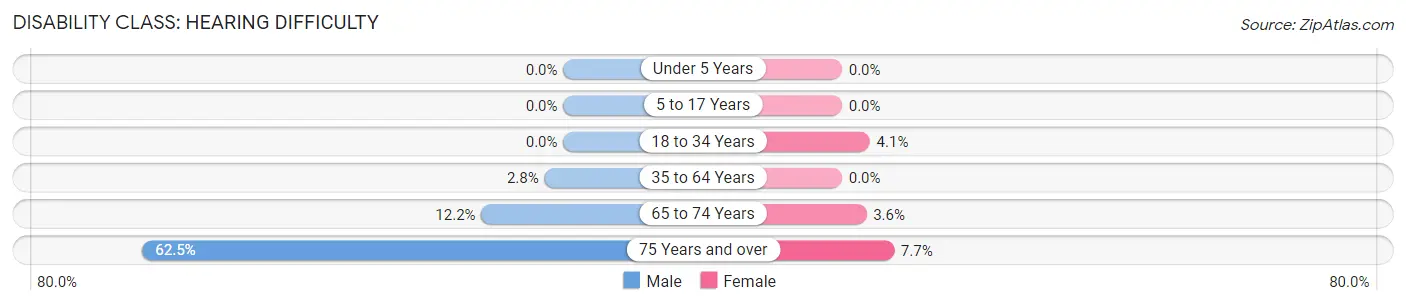
| Age Bracket | Male | Female |
| Under 5 Years | 0 (0.0%) | 0 (0.0%) |
| 5 to 17 Years | 0 (0.0%) | 0 (0.0%) |
| 18 to 34 Years | 0 (0.0%) | 22 (4.1%) |
| 35 to 64 Years | 27 (2.8%) | 0 (0.0%) |
| 65 to 74 Years | 23 (12.2%) | 9 (3.6%) |
| 75 Years and over | 45 (62.5%) | 12 (7.7%) |
Disability Class: Vision Difficulty
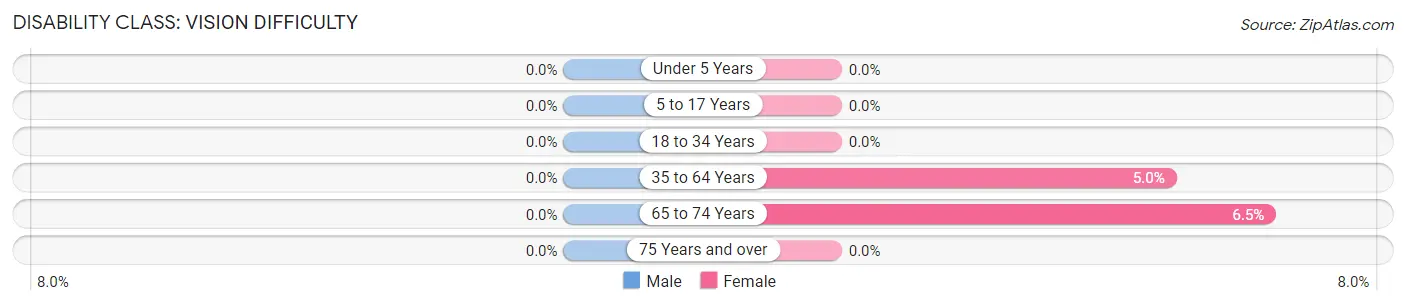
| Age Bracket | Male | Female |
| Under 5 Years | 0 (0.0%) | 0 (0.0%) |
| 5 to 17 Years | 0 (0.0%) | 0 (0.0%) |
| 18 to 34 Years | 0 (0.0%) | 0 (0.0%) |
| 35 to 64 Years | 0 (0.0%) | 28 (5.0%) |
| 65 to 74 Years | 0 (0.0%) | 16 (6.5%) |
| 75 Years and over | 0 (0.0%) | 0 (0.0%) |
Disability Class: Cognitive Difficulty
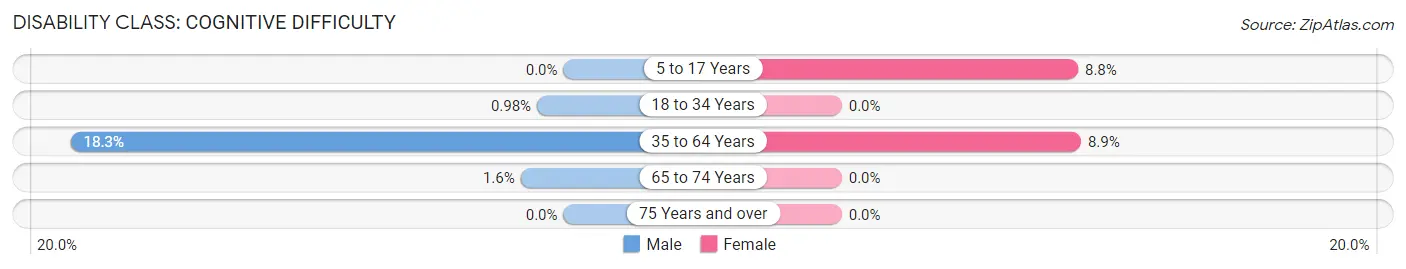
| Age Bracket | Male | Female |
| 5 to 17 Years | 0 (0.0%) | 25 (8.8%) |
| 18 to 34 Years | 6 (1.0%) | 0 (0.0%) |
| 35 to 64 Years | 177 (18.3%) | 50 (8.9%) |
| 65 to 74 Years | 3 (1.6%) | 0 (0.0%) |
| 75 Years and over | 0 (0.0%) | 0 (0.0%) |
Disability Class: Ambulatory Difficulty
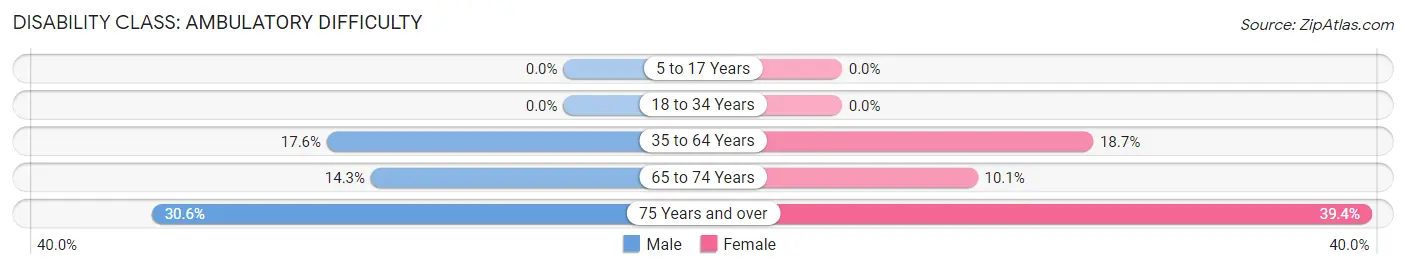
| Age Bracket | Male | Female |
| 5 to 17 Years | 0 (0.0%) | 0 (0.0%) |
| 18 to 34 Years | 0 (0.0%) | 0 (0.0%) |
| 35 to 64 Years | 170 (17.6%) | 105 (18.6%) |
| 65 to 74 Years | 27 (14.3%) | 25 (10.1%) |
| 75 Years and over | 22 (30.6%) | 61 (39.4%) |
Disability Class: Self-Care Difficulty
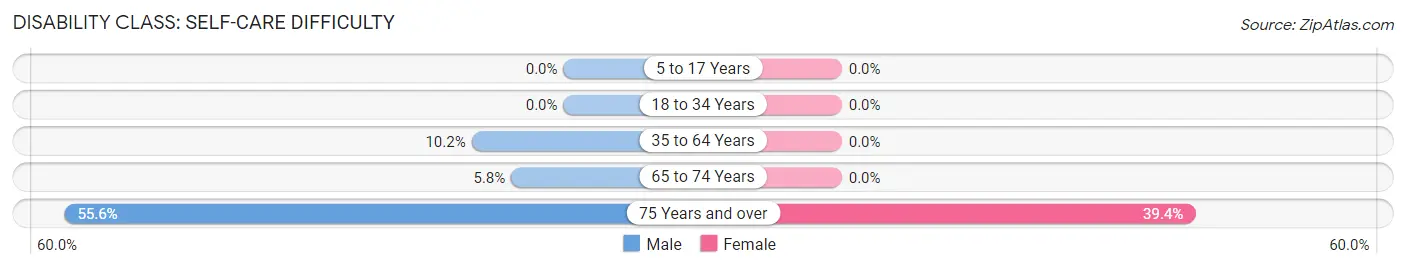
| Age Bracket | Male | Female |
| 5 to 17 Years | 0 (0.0%) | 0 (0.0%) |
| 18 to 34 Years | 0 (0.0%) | 0 (0.0%) |
| 35 to 64 Years | 99 (10.2%) | 0 (0.0%) |
| 65 to 74 Years | 11 (5.8%) | 0 (0.0%) |
| 75 Years and over | 40 (55.6%) | 61 (39.4%) |
Technology Access in Selmer
Computing Device Access in Selmer
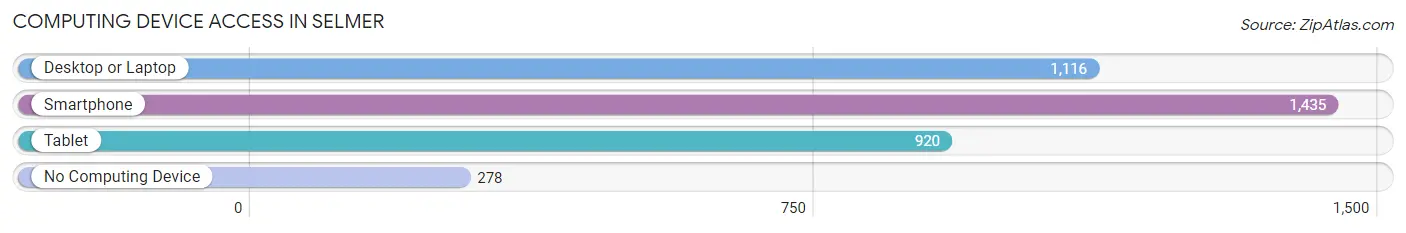
| Device Type | # Households | % Households |
| Desktop or Laptop | 1,116 | 62.6% |
| Smartphone | 1,435 | 80.5% |
| Tablet | 920 | 51.6% |
| No Computing Device | 278 | 15.6% |
| Total | 1,783 | 100.0% |
Internet Access in Selmer
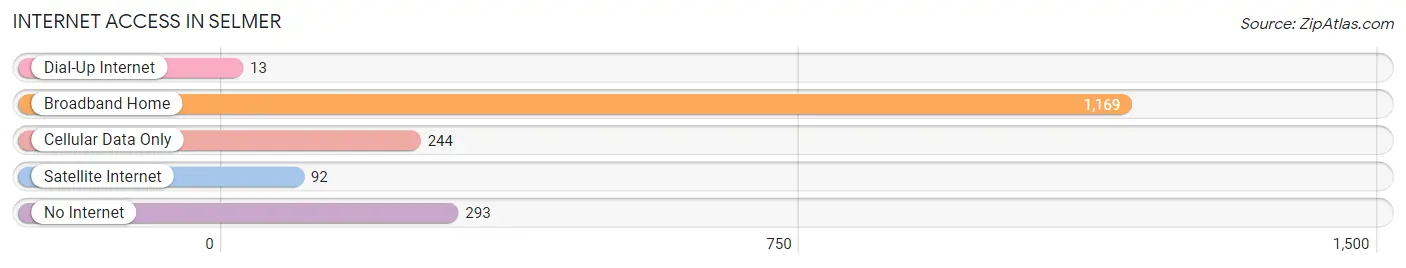
| Internet Type | # Households | % Households |
| Dial-Up Internet | 13 | 0.7% |
| Broadband Home | 1,169 | 65.6% |
| Cellular Data Only | 244 | 13.7% |
| Satellite Internet | 92 | 5.2% |
| No Internet | 293 | 16.4% |
| Total | 1,783 | 100.0% |
Selmer Summary
Selmer is a small town located in McNairy County, Tennessee. It is situated in the southwestern corner of the state, approximately 80 miles east of Memphis and 120 miles west of Nashville. The town has a population of approximately 4,000 people and is the county seat of McNairy County.
History
The area that is now Selmer was first settled in the early 1800s by settlers from North Carolina and Virginia. The town was originally known as “Piney” and was later renamed Selmer in honor of a local doctor, Dr. John Selmer. The town was officially incorporated in 1876.
In the late 1800s, Selmer was a thriving agricultural community. The town was home to several cotton gins, a sawmill, and a gristmill. The town also had a number of stores, churches, and schools.
In the early 1900s, Selmer experienced a period of growth and prosperity. The town was home to several banks, a newspaper, and a number of other businesses. The town also had a number of churches, schools, and a hospital.
Geography
Selmer is located in the southwestern corner of Tennessee, approximately 80 miles east of Memphis and 120 miles west of Nashville. The town is situated in the foothills of the Appalachian Mountains and is surrounded by rolling hills and forests. The town is located near the Hatchie River, which flows through the area.
The climate in Selmer is humid subtropical, with hot summers and mild winters. The average annual temperature is around 64 degrees Fahrenheit. The average annual precipitation is around 48 inches.
Economy
The economy of Selmer is largely based on agriculture. The town is home to several farms, which produce a variety of crops, including cotton, soybeans, corn, and wheat. The town is also home to several manufacturing companies, which produce a variety of products, including furniture, clothing, and automotive parts.
The town is also home to several retail stores, restaurants, and other businesses. The town is also home to a number of medical facilities, including a hospital and several clinics.
Demographics
As of the 2010 census, the population of Selmer was 4,000. The racial makeup of the town was 95.3% White, 2.2% African American, 0.3% Native American, 0.2% Asian, 0.1% Pacific Islander, 0.7% from other races, and 1.4% from two or more races. Hispanic or Latino of any race were 1.7% of the population.
The median household income in Selmer was $30,938, and the median family income was $37,813. The per capita income in Selmer was $17,845. About 17.2% of the population was below the poverty line.
Common Questions
What is Per Capita Income in Selmer?
Per Capita income in Selmer is $21,875.
What is the Median Family Income in Selmer?
Median Family Income in Selmer is $68,503.
What is the Median Household income in Selmer?
Median Household Income in Selmer is $46,696.
What is Income or Wage Gap in Selmer?
Income or Wage Gap in Selmer is 14.4%.
Women in Selmer earn 85.6 cents for every dollar earned by a man.
What is Inequality or Gini Index in Selmer?
Inequality or Gini Index in Selmer is 0.37.
What is the Total Population of Selmer?
Total Population of Selmer is 4,444.
What is the Total Male Population of Selmer?
Total Male Population of Selmer is 2,375.
What is the Total Female Population of Selmer?
Total Female Population of Selmer is 2,069.
What is the Ratio of Males per 100 Females in Selmer?
There are 114.79 Males per 100 Females in Selmer.
What is the Ratio of Females per 100 Males in Selmer?
There are 87.12 Females per 100 Males in Selmer.
What is the Median Population Age in Selmer?
Median Population Age in Selmer is 38.6 Years.
What is the Average Family Size in Selmer
Average Family Size in Selmer is 3.2 People.
What is the Average Household Size in Selmer
Average Household Size in Selmer is 2.4 People.
How Large is the Labor Force in Selmer?
There are 1,731 People in the Labor Forcein in Selmer.
What is the Percentage of People in the Labor Force in Selmer?
47.8% of People are in the Labor Force in Selmer.
What is the Unemployment Rate in Selmer?
Unemployment Rate in Selmer is 4.6%.