Union City, TN Map & Demographics
Union City Map
Union City Overview
$23,959
PER CAPITA INCOME
$70,924
AVG FAMILY INCOME
$42,620
AVG HOUSEHOLD INCOME
17.0%
WAGE / INCOME GAP [ % ]
83.0¢/ $1
WAGE / INCOME GAP [ $ ]
0.46
INEQUALITY / GINI INDEX
11,068
TOTAL POPULATION
5,055
MALE POPULATION
6,013
FEMALE POPULATION
84.07
MALES / 100 FEMALES
118.95
FEMALES / 100 MALES
37.4
MEDIAN AGE
3.2
AVG FAMILY SIZE
2.4
AVG HOUSEHOLD SIZE
5,143
LABOR FORCE [ PEOPLE ]
60.3%
PERCENT IN LABOR FORCE
8.8%
UNEMPLOYMENT RATE
Union City Zip Codes
Union City Area Codes
Income in Union City
Income Overview in Union City
Per Capita Income in Union City is $23,959, while median incomes of families and households are $70,924 and $42,620 respectively.
| Characteristic | Number | Measure |
| Per Capita Income | 11,068 | $23,959 |
| Median Family Income | 2,557 | $70,924 |
| Mean Family Income | 2,557 | $76,555 |
| Median Household Income | 4,423 | $42,620 |
| Mean Household Income | 4,423 | $58,537 |
| Income Deficit | 2,557 | $0 |
| Wage / Income Gap (%) | 11,068 | 17.00% |
| Wage / Income Gap ($) | 11,068 | 83.00¢ per $1 |
| Gini / Inequality Index | 11,068 | 0.46 |
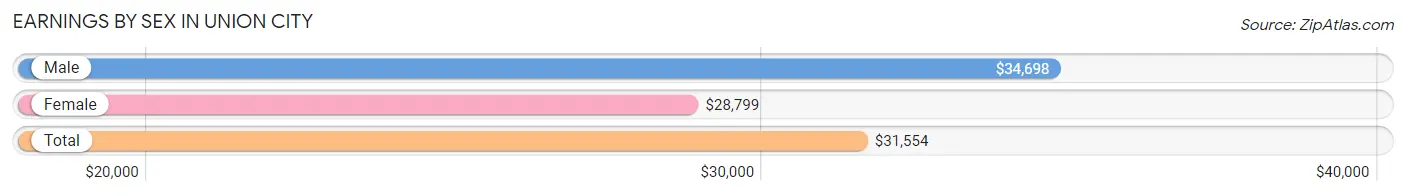
Earnings by Sex in Union City
Average Earnings in Union City are $31,554, $34,698 for men and $28,799 for women, a difference of 17.0%.
| Sex | Number | Average Earnings |
| Male | 2,487 (46.5%) | $34,698 |
| Female | 2,857 (53.5%) | $28,799 |
| Total | 5,344 (100.0%) | $31,554 |
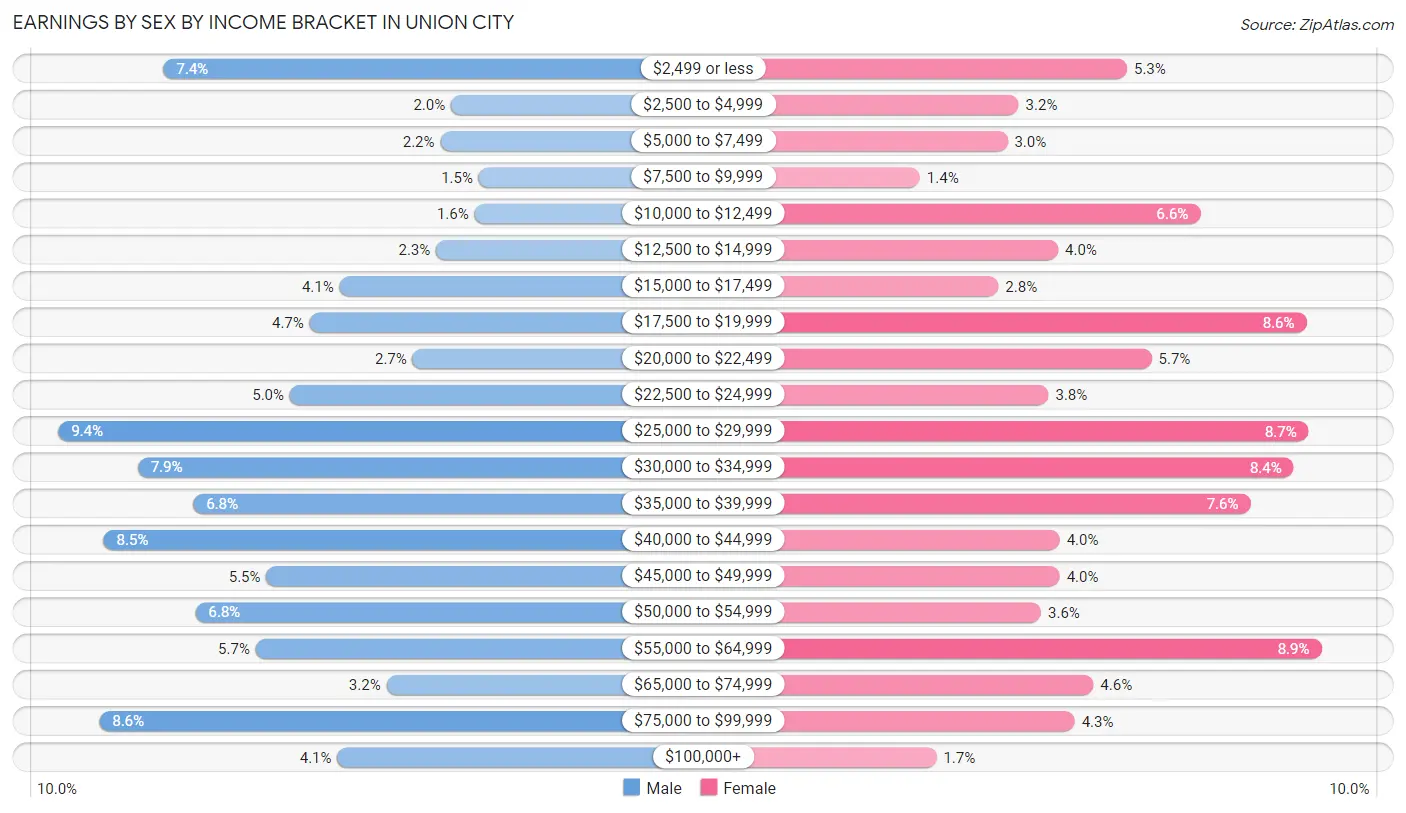
Earnings by Sex by Income Bracket in Union City
The most common earnings brackets in Union City are $25,000 to $29,999 for men (233 | 9.4%) and $55,000 to $64,999 for women (254 | 8.9%).
| Income | Male | Female |
| $2,499 or less | 184 (7.4%) | 150 (5.2%) |
| $2,500 to $4,999 | 50 (2.0%) | 92 (3.2%) |
| $5,000 to $7,499 | 55 (2.2%) | 86 (3.0%) |
| $7,500 to $9,999 | 37 (1.5%) | 39 (1.4%) |
| $10,000 to $12,499 | 39 (1.6%) | 189 (6.6%) |
| $12,500 to $14,999 | 57 (2.3%) | 113 (4.0%) |
| $15,000 to $17,499 | 102 (4.1%) | 81 (2.8%) |
| $17,500 to $19,999 | 116 (4.7%) | 246 (8.6%) |
| $20,000 to $22,499 | 68 (2.7%) | 163 (5.7%) |
| $22,500 to $24,999 | 125 (5.0%) | 108 (3.8%) |
| $25,000 to $29,999 | 233 (9.4%) | 247 (8.6%) |
| $30,000 to $34,999 | 196 (7.9%) | 239 (8.4%) |
| $35,000 to $39,999 | 170 (6.8%) | 216 (7.6%) |
| $40,000 to $44,999 | 212 (8.5%) | 114 (4.0%) |
| $45,000 to $49,999 | 136 (5.5%) | 114 (4.0%) |
| $50,000 to $54,999 | 169 (6.8%) | 104 (3.6%) |
| $55,000 to $64,999 | 141 (5.7%) | 254 (8.9%) |
| $65,000 to $74,999 | 80 (3.2%) | 132 (4.6%) |
| $75,000 to $99,999 | 214 (8.6%) | 122 (4.3%) |
| $100,000+ | 103 (4.1%) | 48 (1.7%) |
| Total | 2,487 (100.0%) | 2,857 (100.0%) |
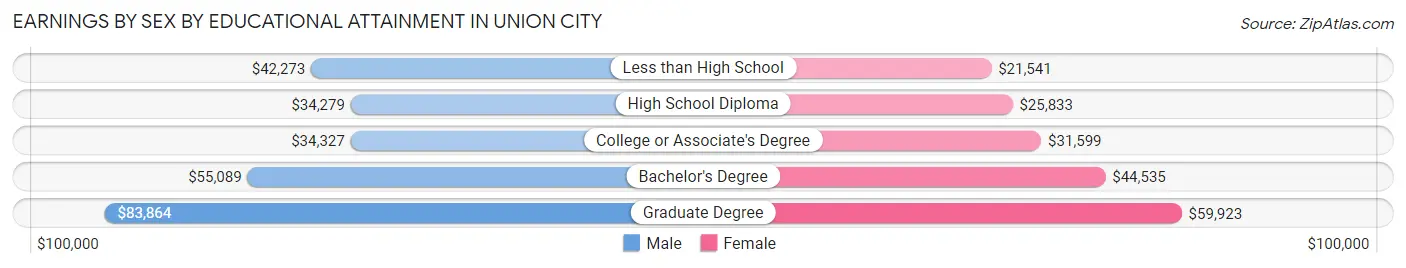
Earnings by Sex by Educational Attainment in Union City
Average earnings in Union City are $39,286 for men and $31,321 for women, a difference of 20.3%. Men with an educational attainment of graduate degree enjoy the highest average annual earnings of $83,864, while those with high school diploma education earn the least with $34,279. Women with an educational attainment of graduate degree earn the most with the average annual earnings of $59,923, while those with less than high school education have the smallest earnings of $21,541.
| Educational Attainment | Male Income | Female Income |
| Less than High School | $42,273 | $21,541 |
| High School Diploma | $34,279 | $25,833 |
| College or Associate's Degree | $34,327 | $31,599 |
| Bachelor's Degree | $55,089 | $44,535 |
| Graduate Degree | $83,864 | $59,923 |
| Total | $39,286 | $31,321 |
Family Income in Union City
Family Income Brackets in Union City
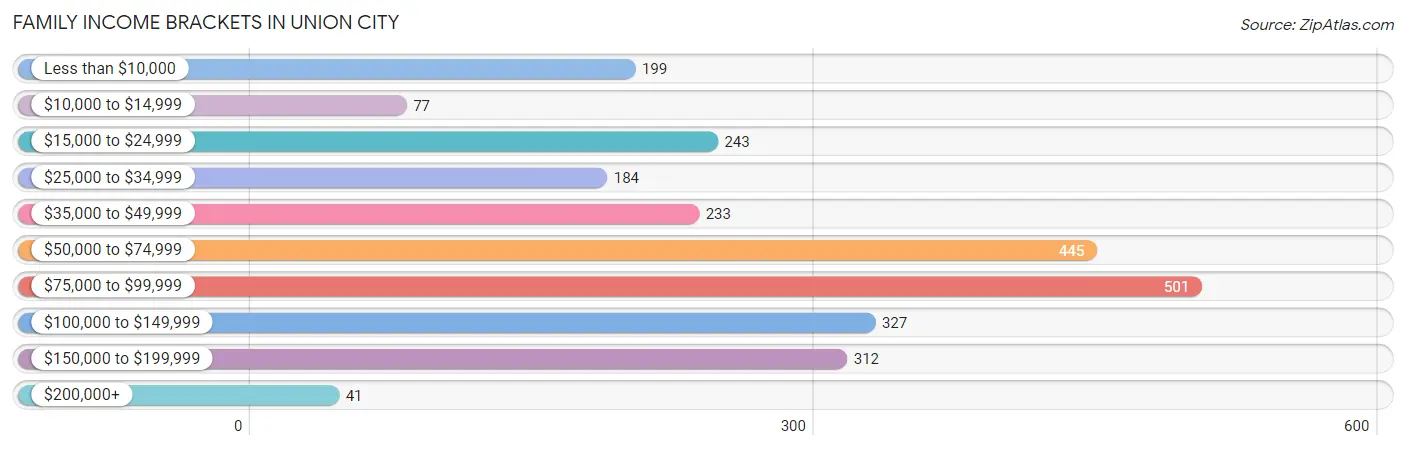
According to the Union City family income data, there are 501 families falling into the $75,000 to $99,999 income range, which is the most common income bracket and makes up 19.6% of all families. Conversely, the $200,000+ income bracket is the least frequent group with only 41 families (1.6%) belonging to this category.
| Income Bracket | # Families | % Families |
| Less than $10,000 | 199 | 7.8% |
| $10,000 to $14,999 | 77 | 3.0% |
| $15,000 to $24,999 | 243 | 9.5% |
| $25,000 to $34,999 | 184 | 7.2% |
| $35,000 to $49,999 | 233 | 9.1% |
| $50,000 to $74,999 | 445 | 17.4% |
| $75,000 to $99,999 | 501 | 19.6% |
| $100,000 to $149,999 | 327 | 12.8% |
| $150,000 to $199,999 | 312 | 12.2% |
| $200,000+ | 41 | 1.6% |
Family Income by Famaliy Size in Union City
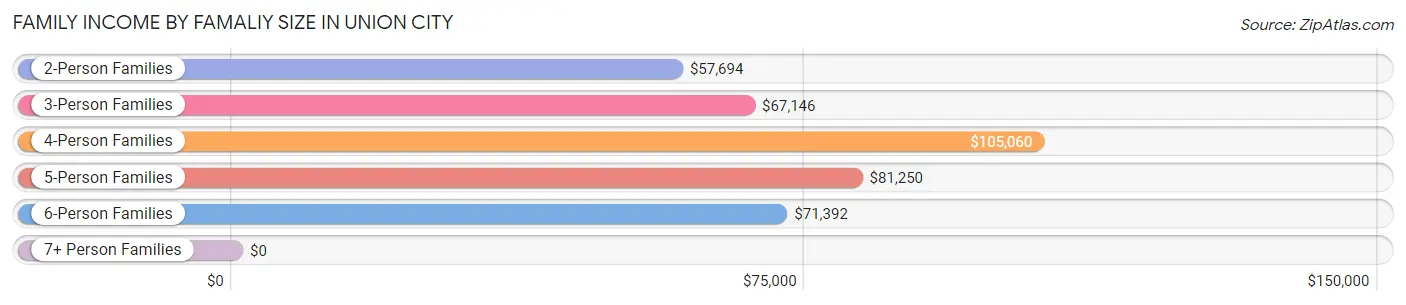
4-person families (613 | 24.0%) account for the highest median family income in Union City with $105,060 per family, while 2-person families (1,017 | 39.8%) have the highest median income of $28,847 per family member.
| Income Bracket | # Families | Median Income |
| 2-Person Families | 1,017 (39.8%) | $57,694 |
| 3-Person Families | 643 (25.2%) | $67,146 |
| 4-Person Families | 613 (24.0%) | $105,060 |
| 5-Person Families | 203 (7.9%) | $81,250 |
| 6-Person Families | 81 (3.2%) | $71,392 |
| 7+ Person Families | 0 (0.0%) | $0 |
| Total | 2,557 (100.0%) | $70,924 |
Family Income by Number of Earners in Union City
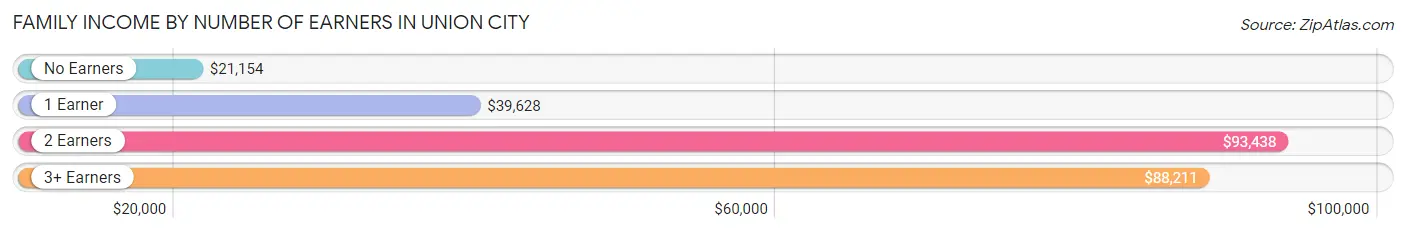
The median family income in Union City is $70,924, with families comprising 2 earners (1,113) having the highest median family income of $93,438, while families with no earners (506) have the lowest median family income of $21,154, accounting for 43.5% and 19.8% of families, respectively.
| Number of Earners | # Families | Median Income |
| No Earners | 506 (19.8%) | $21,154 |
| 1 Earner | 695 (27.2%) | $39,628 |
| 2 Earners | 1,113 (43.5%) | $93,438 |
| 3+ Earners | 243 (9.5%) | $88,211 |
| Total | 2,557 (100.0%) | $70,924 |
Household Income in Union City
Household Income Brackets in Union City
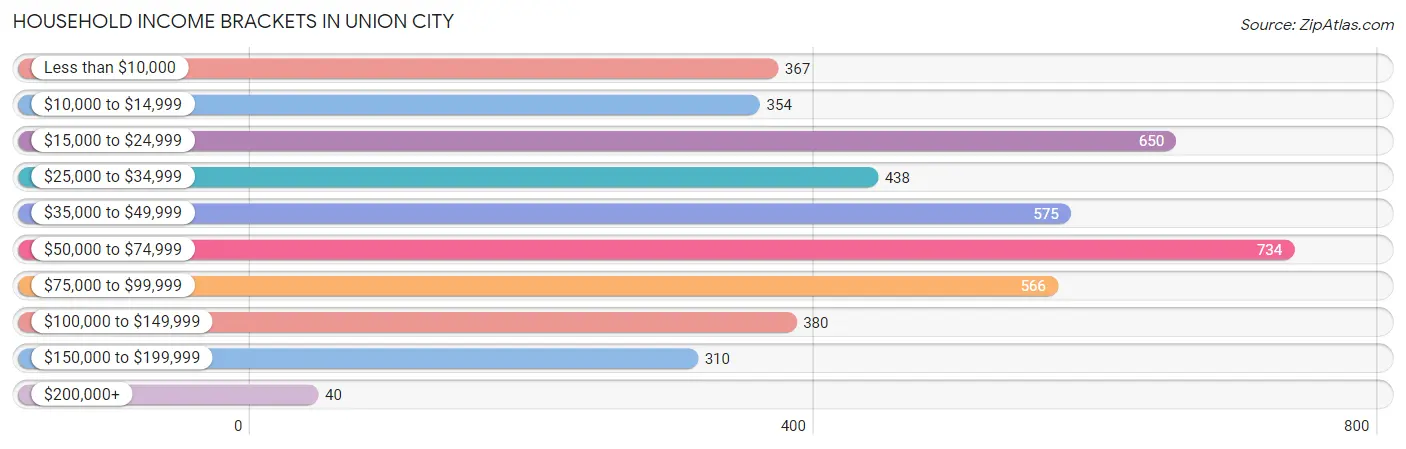
With 734 households falling in the category, the $50,000 to $74,999 income range is the most frequent in Union City, accounting for 16.6% of all households. In contrast, only 40 households (0.9%) fall into the $200,000+ income bracket, making it the least populous group.
| Income Bracket | # Households | % Households |
| Less than $10,000 | 367 | 8.3% |
| $10,000 to $14,999 | 354 | 8.0% |
| $15,000 to $24,999 | 650 | 14.7% |
| $25,000 to $34,999 | 438 | 9.9% |
| $35,000 to $49,999 | 575 | 13.0% |
| $50,000 to $74,999 | 734 | 16.6% |
| $75,000 to $99,999 | 566 | 12.8% |
| $100,000 to $149,999 | 380 | 8.6% |
| $150,000 to $199,999 | 310 | 7.0% |
| $200,000+ | 40 | 0.9% |
Household Income by Householder Age in Union City
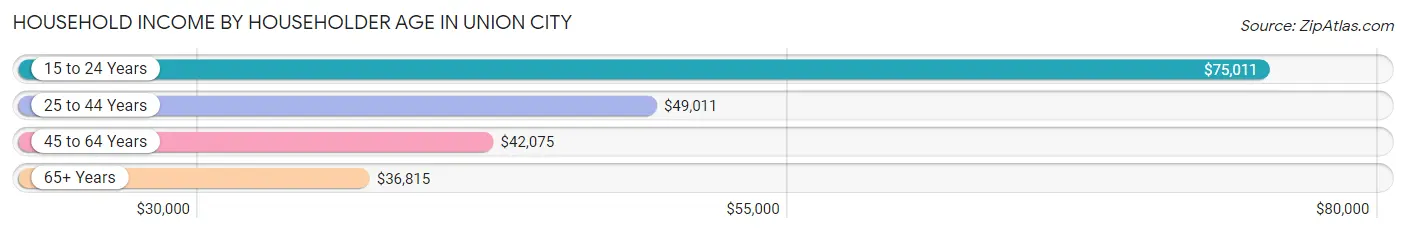
The median household income in Union City is $42,620, with the highest median household income of $75,011 found in the 15 to 24 years age bracket for the primary householder. A total of 217 households (4.9%) fall into this category. Meanwhile, the 65+ years age bracket for the primary householder has the lowest median household income of $36,815, with 1,319 households (29.8%) in this group.
| Income Bracket | # Households | Median Income |
| 15 to 24 Years | 217 (4.9%) | $75,011 |
| 25 to 44 Years | 1,613 (36.5%) | $49,011 |
| 45 to 64 Years | 1,274 (28.8%) | $42,075 |
| 65+ Years | 1,319 (29.8%) | $36,815 |
| Total | 4,423 (100.0%) | $42,620 |
Poverty in Union City
Income Below Poverty by Sex and Age in Union City
With 18.1% poverty level for males and 24.2% for females among the residents of Union City, 5 year old males and 5 year old females are the most vulnerable to poverty, with 30 males (42.9%) and 52 females (68.4%) in their respective age groups living below the poverty level.
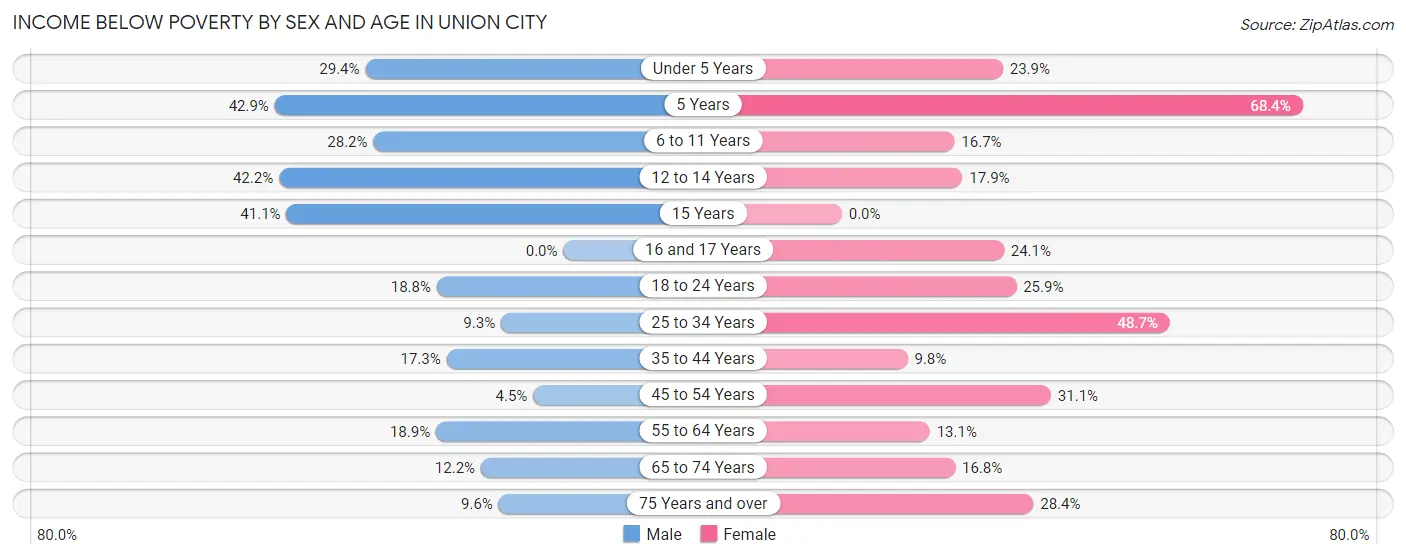
| Age Bracket | Male | Female |
| Under 5 Years | 112 (29.4%) | 66 (23.9%) |
| 5 Years | 30 (42.9%) | 52 (68.4%) |
| 6 to 11 Years | 180 (28.2%) | 52 (16.7%) |
| 12 to 14 Years | 87 (42.2%) | 65 (17.9%) |
| 15 Years | 44 (41.1%) | 0 (0.0%) |
| 16 and 17 Years | 0 (0.0%) | 38 (24.0%) |
| 18 to 24 Years | 59 (18.8%) | 144 (25.9%) |
| 25 to 34 Years | 54 (9.3%) | 424 (48.7%) |
| 35 to 44 Years | 124 (17.3%) | 77 (9.8%) |
| 45 to 54 Years | 24 (4.5%) | 172 (31.0%) |
| 55 to 64 Years | 83 (18.9%) | 91 (13.1%) |
| 65 to 74 Years | 66 (12.2%) | 118 (16.8%) |
| 75 Years and over | 19 (9.6%) | 126 (28.4%) |
| Total | 882 (18.1%) | 1,425 (24.2%) |
Income Above Poverty by Sex and Age in Union City
According to the poverty statistics in Union City, males aged 16 and 17 years and females aged 15 years are the age groups that are most secure financially, with 100.0% of males and 100.0% of females in these age groups living above the poverty line.
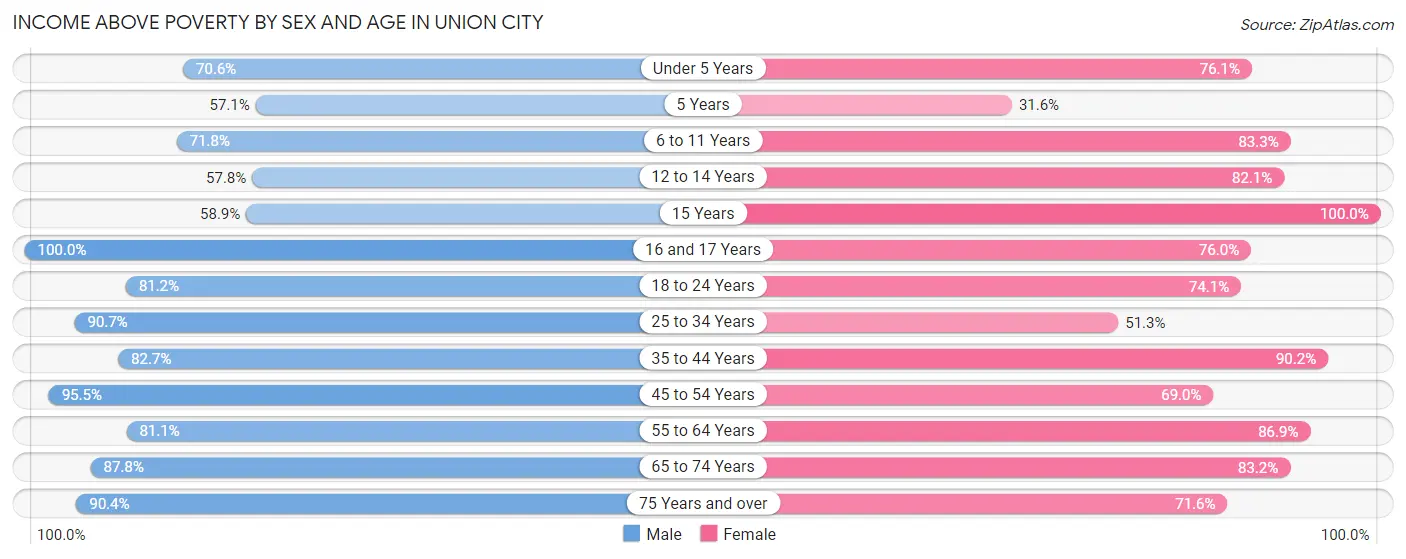
| Age Bracket | Male | Female |
| Under 5 Years | 269 (70.6%) | 210 (76.1%) |
| 5 Years | 40 (57.1%) | 24 (31.6%) |
| 6 to 11 Years | 458 (71.8%) | 259 (83.3%) |
| 12 to 14 Years | 119 (57.8%) | 298 (82.1%) |
| 15 Years | 63 (58.9%) | 85 (100.0%) |
| 16 and 17 Years | 147 (100.0%) | 120 (75.9%) |
| 18 to 24 Years | 255 (81.2%) | 412 (74.1%) |
| 25 to 34 Years | 529 (90.7%) | 447 (51.3%) |
| 35 to 44 Years | 591 (82.7%) | 712 (90.2%) |
| 45 to 54 Years | 512 (95.5%) | 382 (69.0%) |
| 55 to 64 Years | 356 (81.1%) | 606 (86.9%) |
| 65 to 74 Years | 473 (87.8%) | 584 (83.2%) |
| 75 Years and over | 179 (90.4%) | 317 (71.6%) |
| Total | 3,991 (81.9%) | 4,456 (75.8%) |
Income Below Poverty Among Married-Couple Families in Union City
The poverty statistics for married-couple families in Union City show that 5.1% or 92 of the total 1,814 families live below the poverty line. Families with 1 or 2 children have the highest poverty rate of 8.1%, comprising of 71 families. On the other hand, families with 3 or 4 children have the lowest poverty rate of 0.0%, which includes 0 families.
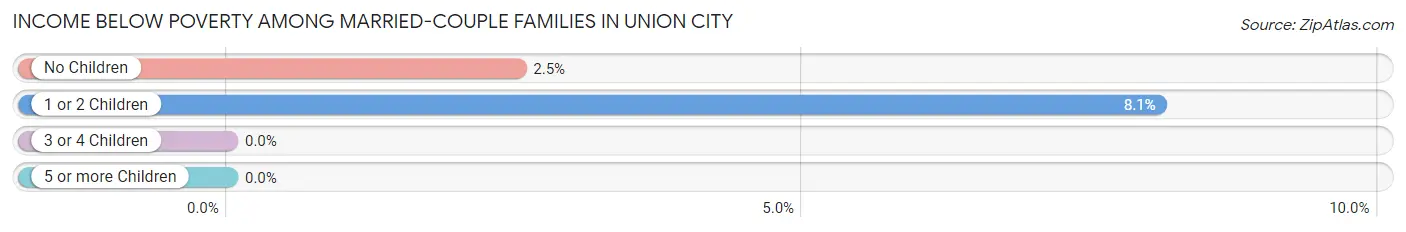
| Children | Above Poverty | Below Poverty |
| No Children | 817 (97.5%) | 21 (2.5%) |
| 1 or 2 Children | 807 (91.9%) | 71 (8.1%) |
| 3 or 4 Children | 98 (100.0%) | 0 (0.0%) |
| 5 or more Children | 0 (0.0%) | 0 (0.0%) |
| Total | 1,722 (94.9%) | 92 (5.1%) |
Income Below Poverty Among Single-Parent Households in Union City
According to the poverty data in Union City, 36.7% or 40 single-father households and 41.3% or 262 single-mother households are living below the poverty line. Among single-father households, those with no children have the highest poverty rate, with 40 households (42.1%) experiencing poverty. Likewise, among single-mother households, those with 3 or 4 children have the highest poverty rate, with 65 households (59.6%) falling below the poverty line.
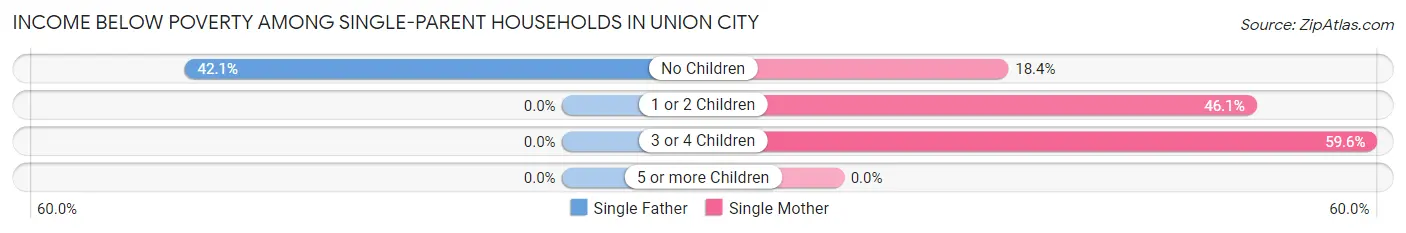
| Children | Single Father | Single Mother |
| No Children | 40 (42.1%) | 30 (18.4%) |
| 1 or 2 Children | 0 (0.0%) | 167 (46.1%) |
| 3 or 4 Children | 0 (0.0%) | 65 (59.6%) |
| 5 or more Children | 0 (0.0%) | 0 (0.0%) |
| Total | 40 (36.7%) | 262 (41.3%) |
Income Below Poverty Among Married-Couple vs Single-Parent Households in Union City
The poverty data for Union City shows that 92 of the married-couple family households (5.1%) and 302 of the single-parent households (40.6%) are living below the poverty level. Within the married-couple family households, those with 1 or 2 children have the highest poverty rate, with 71 households (8.1%) falling below the poverty line. Among the single-parent households, those with 3 or 4 children have the highest poverty rate, with 65 household (59.6%) living below poverty.
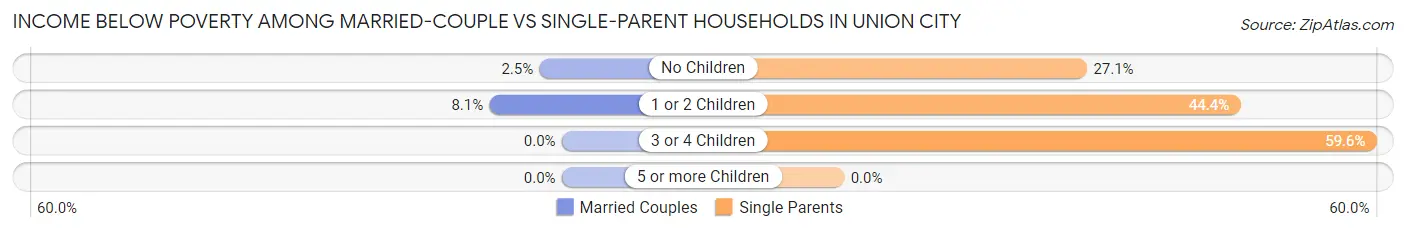
| Children | Married-Couple Families | Single-Parent Households |
| No Children | 21 (2.5%) | 70 (27.1%) |
| 1 or 2 Children | 71 (8.1%) | 167 (44.4%) |
| 3 or 4 Children | 0 (0.0%) | 65 (59.6%) |
| 5 or more Children | 0 (0.0%) | 0 (0.0%) |
| Total | 92 (5.1%) | 302 (40.6%) |
Race in Union City
The most populous races in Union City are White / Caucasian (7,406 | 66.9%), Black / African American (2,484 | 22.4%), and Hispanic or Latino (927 | 8.4%).
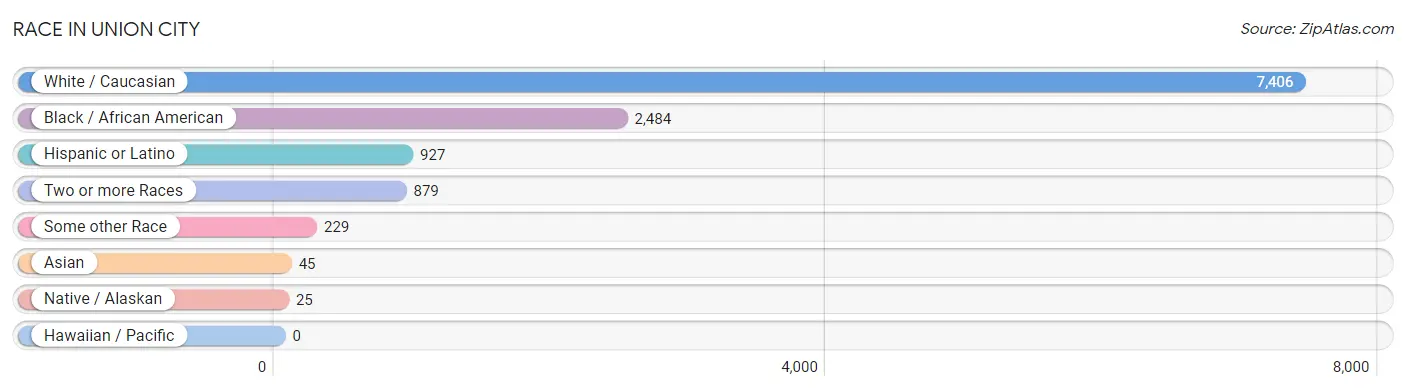
| Race | # Population | % Population |
| Asian | 45 | 0.4% |
| Black / African American | 2,484 | 22.4% |
| Hawaiian / Pacific | 0 | 0.0% |
| Hispanic or Latino | 927 | 8.4% |
| Native / Alaskan | 25 | 0.2% |
| White / Caucasian | 7,406 | 66.9% |
| Two or more Races | 879 | 7.9% |
| Some other Race | 229 | 2.1% |
| Total | 11,068 | 100.0% |
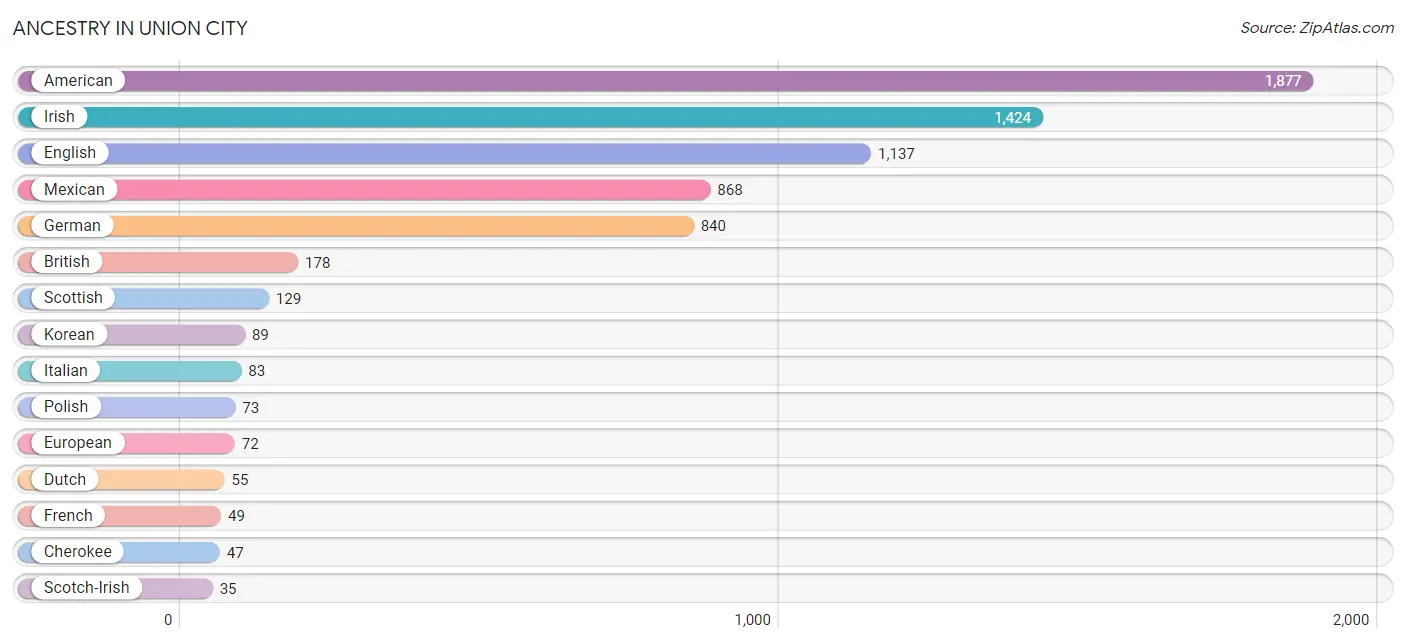
Ancestry in Union City
The most populous ancestries reported in Union City are American (1,877 | 17.0%), Irish (1,424 | 12.9%), English (1,137 | 10.3%), Mexican (868 | 7.8%), and German (840 | 7.6%), together accounting for 55.5% of all Union City residents.
| Ancestry | # Population | % Population |
| American | 1,877 | 17.0% |
| British | 178 | 1.6% |
| Canadian | 9 | 0.1% |
| Cherokee | 47 | 0.4% |
| Choctaw | 1 | 0.0% |
| Colombian | 17 | 0.2% |
| Creek | 5 | 0.1% |
| Cuban | 16 | 0.1% |
| Dutch | 55 | 0.5% |
| English | 1,137 | 10.3% |
| European | 72 | 0.6% |
| French | 49 | 0.4% |
| French Canadian | 8 | 0.1% |
| German | 840 | 7.6% |
| Haitian | 6 | 0.1% |
| Indian (Asian) | 24 | 0.2% |
| Irish | 1,424 | 12.9% |
| Italian | 83 | 0.7% |
| Korean | 89 | 0.8% |
| Lithuanian | 13 | 0.1% |
| Malaysian | 5 | 0.1% |
| Mexican | 868 | 7.8% |
| Pakistani | 6 | 0.1% |
| Polish | 73 | 0.7% |
| Puerto Rican | 15 | 0.1% |
| Scotch-Irish | 35 | 0.3% |
| Scottish | 129 | 1.2% |
| South American | 17 | 0.2% |
| Spanish | 3 | 0.0% |
| Swedish | 15 | 0.1% |
| Swiss | 6 | 0.1% | View All 31 Rows |
Immigrants in Union City
The most numerous immigrant groups reported in Union City came from Latin America (457 | 4.1%), Central America (440 | 4.0%), Mexico (270 | 2.4%), Guatemala (162 | 1.5%), and Asia (34 | 0.3%), together accounting for 12.3% of all Union City residents.
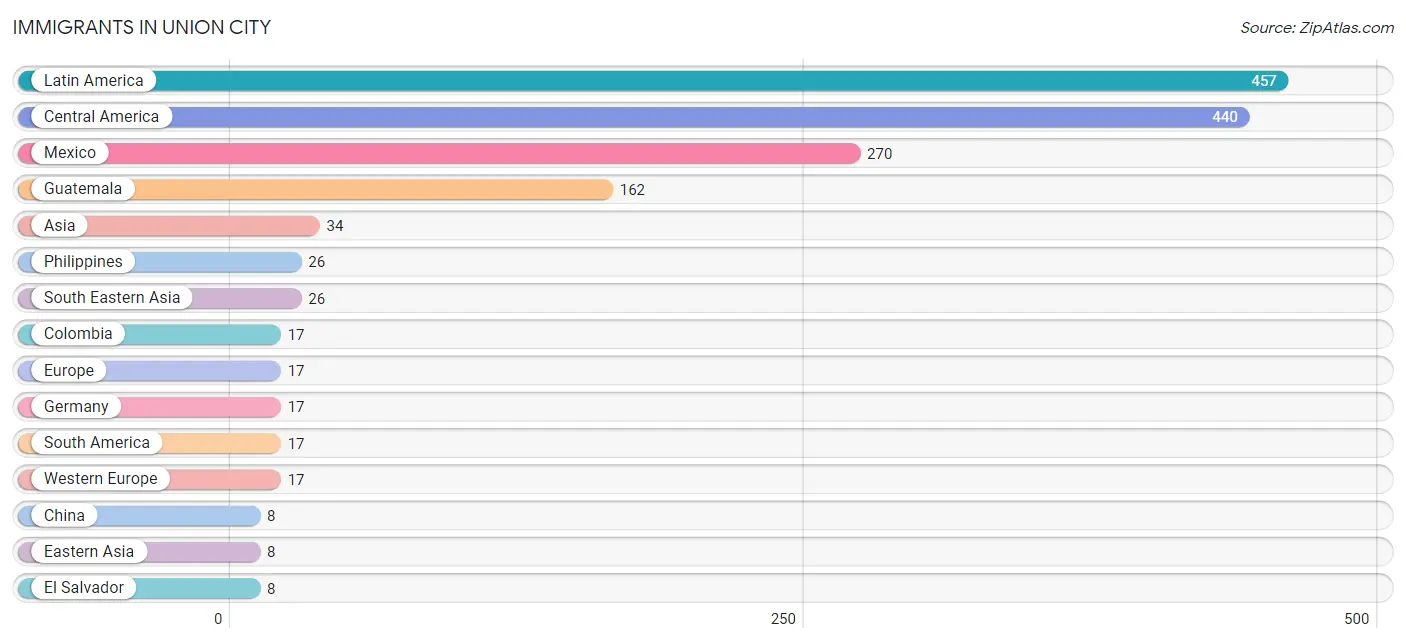
| Immigration Origin | # Population | % Population |
| Asia | 34 | 0.3% |
| Central America | 440 | 4.0% |
| China | 8 | 0.1% |
| Colombia | 17 | 0.2% |
| Eastern Asia | 8 | 0.1% |
| El Salvador | 8 | 0.1% |
| Europe | 17 | 0.2% |
| Germany | 17 | 0.2% |
| Guatemala | 162 | 1.5% |
| Latin America | 457 | 4.1% |
| Mexico | 270 | 2.4% |
| Philippines | 26 | 0.2% |
| South America | 17 | 0.2% |
| South Eastern Asia | 26 | 0.2% |
| Western Europe | 17 | 0.2% | View All 15 Rows |
Sex and Age in Union City
Sex and Age in Union City
The most populous age groups in Union City are 40 to 44 Years (591 | 11.7%) for men and 25 to 29 Years (457 | 7.6%) for women.
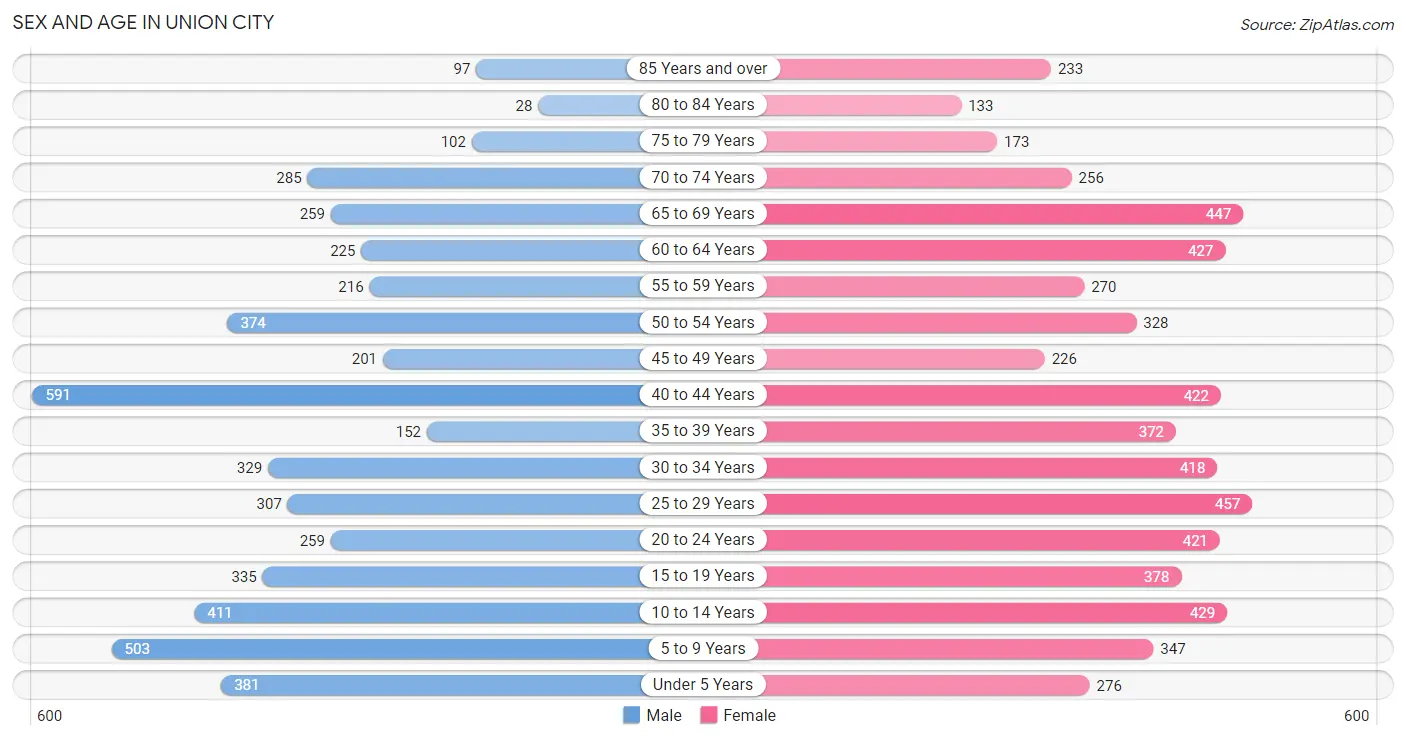
| Age Bracket | Male | Female |
| Under 5 Years | 381 (7.5%) | 276 (4.6%) |
| 5 to 9 Years | 503 (10.0%) | 347 (5.8%) |
| 10 to 14 Years | 411 (8.1%) | 429 (7.1%) |
| 15 to 19 Years | 335 (6.6%) | 378 (6.3%) |
| 20 to 24 Years | 259 (5.1%) | 421 (7.0%) |
| 25 to 29 Years | 307 (6.1%) | 457 (7.6%) |
| 30 to 34 Years | 329 (6.5%) | 418 (7.0%) |
| 35 to 39 Years | 152 (3.0%) | 372 (6.2%) |
| 40 to 44 Years | 591 (11.7%) | 422 (7.0%) |
| 45 to 49 Years | 201 (4.0%) | 226 (3.8%) |
| 50 to 54 Years | 374 (7.4%) | 328 (5.4%) |
| 55 to 59 Years | 216 (4.3%) | 270 (4.5%) |
| 60 to 64 Years | 225 (4.4%) | 427 (7.1%) |
| 65 to 69 Years | 259 (5.1%) | 447 (7.4%) |
| 70 to 74 Years | 285 (5.6%) | 256 (4.3%) |
| 75 to 79 Years | 102 (2.0%) | 173 (2.9%) |
| 80 to 84 Years | 28 (0.5%) | 133 (2.2%) |
| 85 Years and over | 97 (1.9%) | 233 (3.9%) |
| Total | 5,055 (100.0%) | 6,013 (100.0%) |
Families and Households in Union City
Median Family Size in Union City
The median family size in Union City is 3.25 persons per family, with single female/mother families (634 | 24.8%) accounting for the largest median family size of 3.43 persons per family. On the other hand, single male/father families (109 | 4.3%) represent the smallest median family size with 2.67 persons per family.
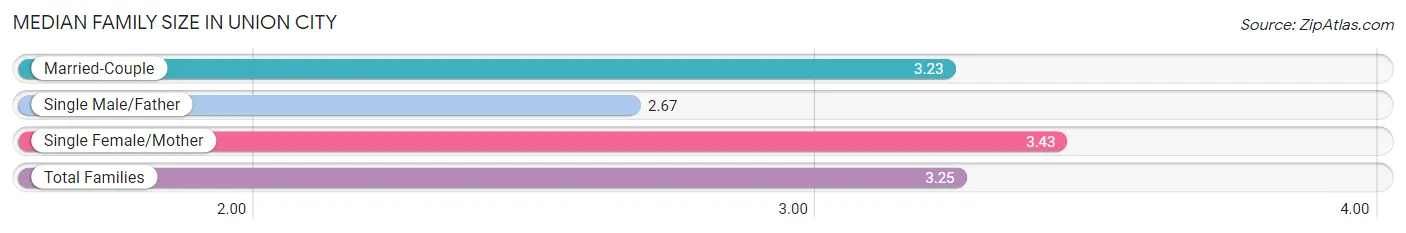
| Family Type | # Families | Family Size |
| Married-Couple | 1,814 (70.9%) | 3.23 |
| Single Male/Father | 109 (4.3%) | 2.67 |
| Single Female/Mother | 634 (24.8%) | 3.43 |
| Total Families | 2,557 (100.0%) | 3.25 |
Median Household Size in Union City
The median household size in Union City is 2.43 persons per household, with single female/mother households (634 | 14.3%) accounting for the largest median household size of 3.66 persons per household. non-family households (1,866 | 42.2%) represent the smallest median household size with 1.17 persons per household.
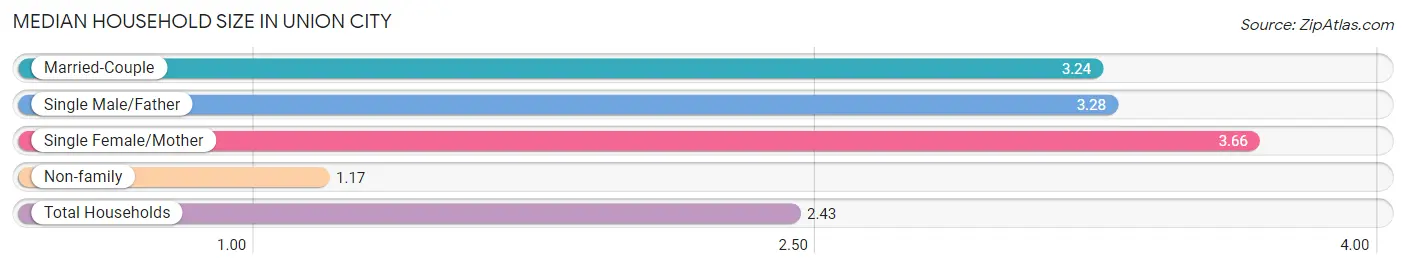
| Household Type | # Households | Household Size |
| Married-Couple | 1,814 (41.0%) | 3.24 |
| Single Male/Father | 109 (2.5%) | 3.28 |
| Single Female/Mother | 634 (14.3%) | 3.66 |
| Non-family | 1,866 (42.2%) | 1.17 |
| Total Households | 4,423 (100.0%) | 2.43 |
Household Size by Marriage Status in Union City
Out of a total of 4,423 households in Union City, 2,557 (57.8%) are family households, while 1,866 (42.2%) are nonfamily households. The most numerous type of family households are 2-person households, comprising 951, and the most common type of nonfamily households are 1-person households, comprising 1,579.
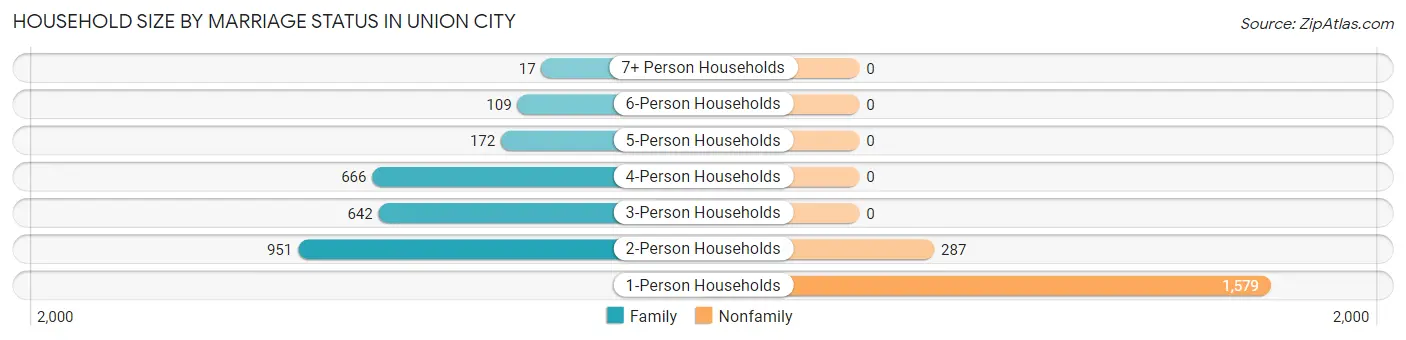
| Household Size | Family Households | Nonfamily Households |
| 1-Person Households | - | 1,579 (35.7%) |
| 2-Person Households | 951 (21.5%) | 287 (6.5%) |
| 3-Person Households | 642 (14.5%) | 0 (0.0%) |
| 4-Person Households | 666 (15.1%) | 0 (0.0%) |
| 5-Person Households | 172 (3.9%) | 0 (0.0%) |
| 6-Person Households | 109 (2.5%) | 0 (0.0%) |
| 7+ Person Households | 17 (0.4%) | 0 (0.0%) |
| Total | 2,557 (57.8%) | 1,866 (42.2%) |
Female Fertility in Union City
Fertility by Age in Union City
Average fertility rate in Union City is 51.0 births per 1,000 women. Women in the age bracket of 20 to 34 years have the highest fertility rate with 79.0 births per 1,000 women. Women in the age bracket of 20 to 34 years acount for 72.5% of all women with births.
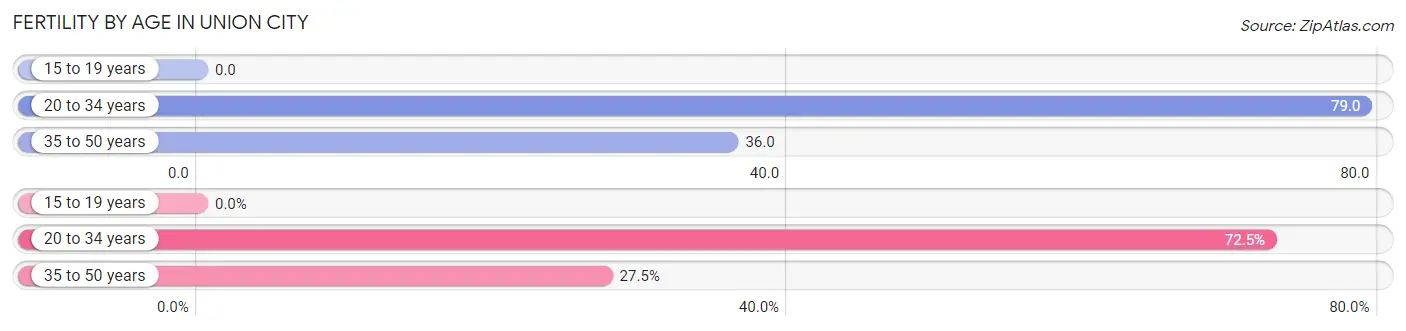
| Age Bracket | Women with Births | Births / 1,000 Women |
| 15 to 19 years | 0 (0.0%) | 0.0 |
| 20 to 34 years | 103 (72.5%) | 79.0 |
| 35 to 50 years | 39 (27.5%) | 36.0 |
| Total | 142 (100.0%) | 51.0 |
Fertility by Age by Marriage Status in Union City
40.8% of women with births (142) in Union City are married. The highest percentage of unmarried women with births falls into 35 to 50 years age bracket with 66.7% of them unmarried at the time of birth, while the lowest percentage of unmarried women with births belong to 20 to 34 years age bracket with 56.3% of them unmarried.
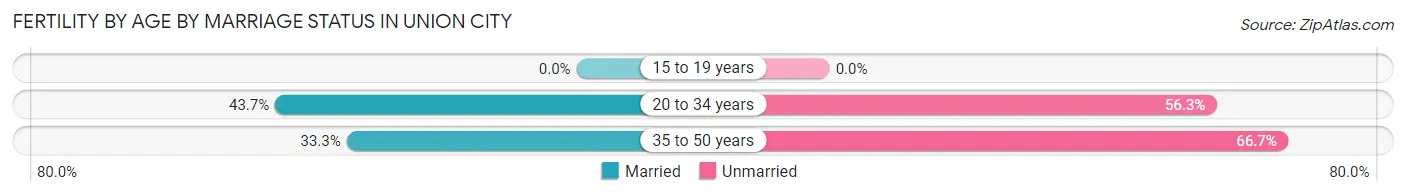
| Age Bracket | Married | Unmarried |
| 15 to 19 years | 0 (0.0%) | 0 (0.0%) |
| 20 to 34 years | 45 (43.7%) | 58 (56.3%) |
| 35 to 50 years | 13 (33.3%) | 26 (66.7%) |
| Total | 58 (40.8%) | 84 (59.2%) |
Fertility by Education in Union City
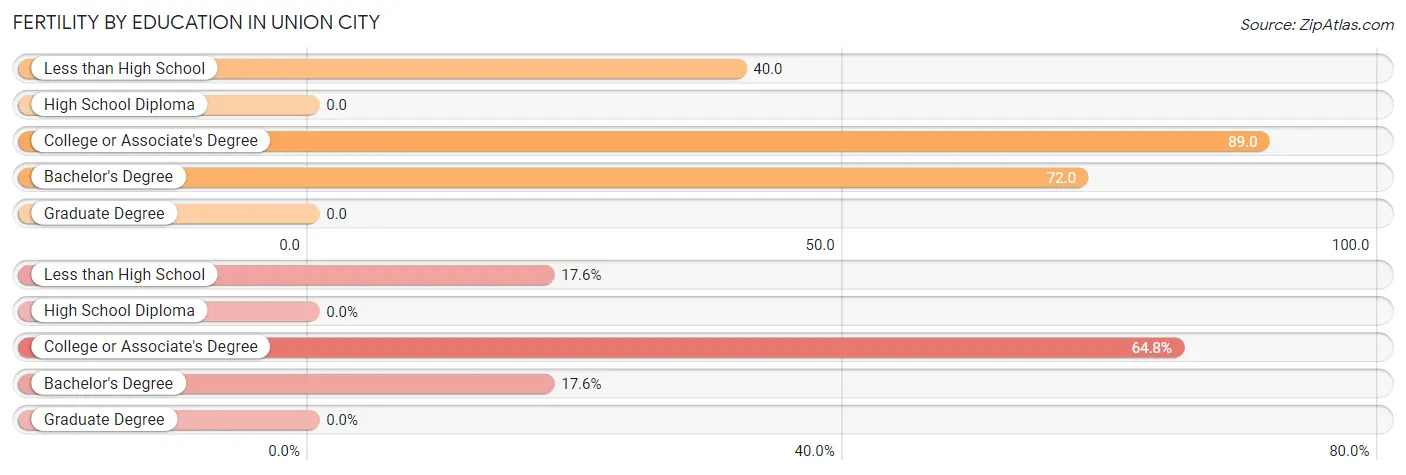
| Educational Attainment | Women with Births | Births / 1,000 Women |
| Less than High School | 25 (17.6%) | 40.0 |
| High School Diploma | 0 (0.0%) | 0.0 |
| College or Associate's Degree | 92 (64.8%) | 89.0 |
| Bachelor's Degree | 25 (17.6%) | 72.0 |
| Graduate Degree | 0 (0.0%) | 0.0 |
| Total | 142 (100.0%) | 51.0 |
Fertility by Education by Marriage Status in Union City
59.2% of women with births in Union City are unmarried. Women with the educational attainment of bachelor's degree are most likely to be married with 100.0% of them married at childbirth, while women with the educational attainment of less than high school are least likely to be married with 100.0% of them unmarried at childbirth.
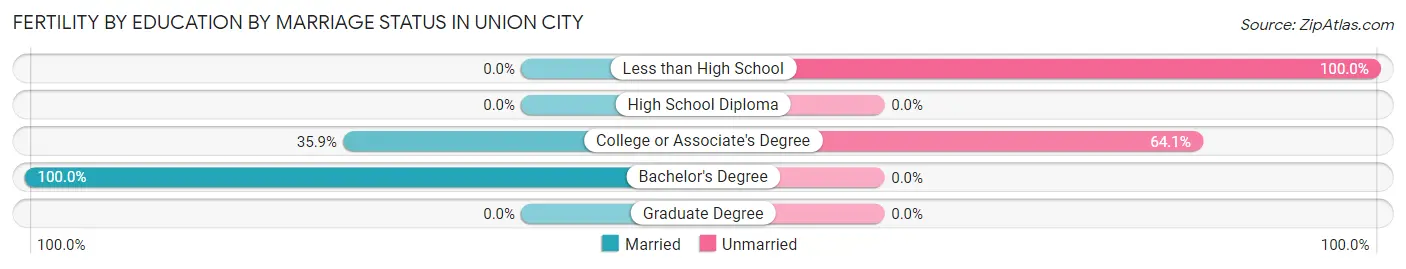
| Educational Attainment | Married | Unmarried |
| Less than High School | 0 (0.0%) | 25 (100.0%) |
| High School Diploma | 0 (0.0%) | 0 (0.0%) |
| College or Associate's Degree | 33 (35.9%) | 59 (64.1%) |
| Bachelor's Degree | 25 (100.0%) | 0 (0.0%) |
| Graduate Degree | 0 (0.0%) | 0 (0.0%) |
| Total | 58 (40.8%) | 84 (59.2%) |
Employment Characteristics in Union City
Employment by Class of Employer in Union City
Among the 4,616 employed individuals in Union City, private company employees (3,412 | 73.9%), local government employees (343 | 7.4%), and not-for-profit organizations (330 | 7.1%) make up the most common classes of employment.
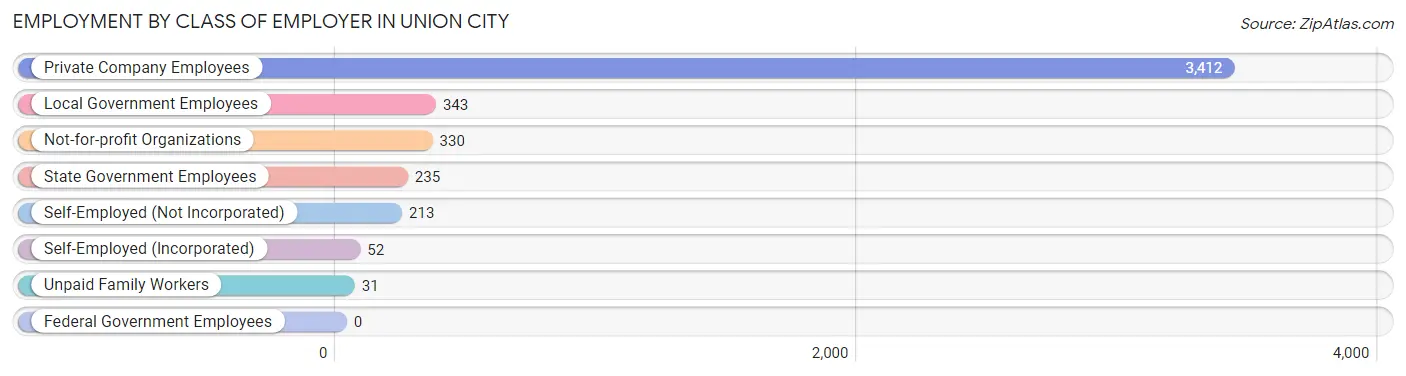
| Employer Class | # Employees | % Employees |
| Private Company Employees | 3,412 | 73.9% |
| Self-Employed (Incorporated) | 52 | 1.1% |
| Self-Employed (Not Incorporated) | 213 | 4.6% |
| Not-for-profit Organizations | 330 | 7.1% |
| Local Government Employees | 343 | 7.4% |
| State Government Employees | 235 | 5.1% |
| Federal Government Employees | 0 | 0.0% |
| Unpaid Family Workers | 31 | 0.7% |
| Total | 4,616 | 100.0% |
Employment Status by Age in Union City
According to the labor force statistics for Union City, out of the total population over 16 years of age (8,529), 60.3% or 5,143 individuals are in the labor force, with 8.8% or 453 of them unemployed. The age group with the highest labor force participation rate is 35 to 44 years, with 81.7% or 1,256 individuals in the labor force. Within the labor force, the 20 to 24 years age range has the highest percentage of unemployed individuals, with 34.3% or 190 of them being unemployed.
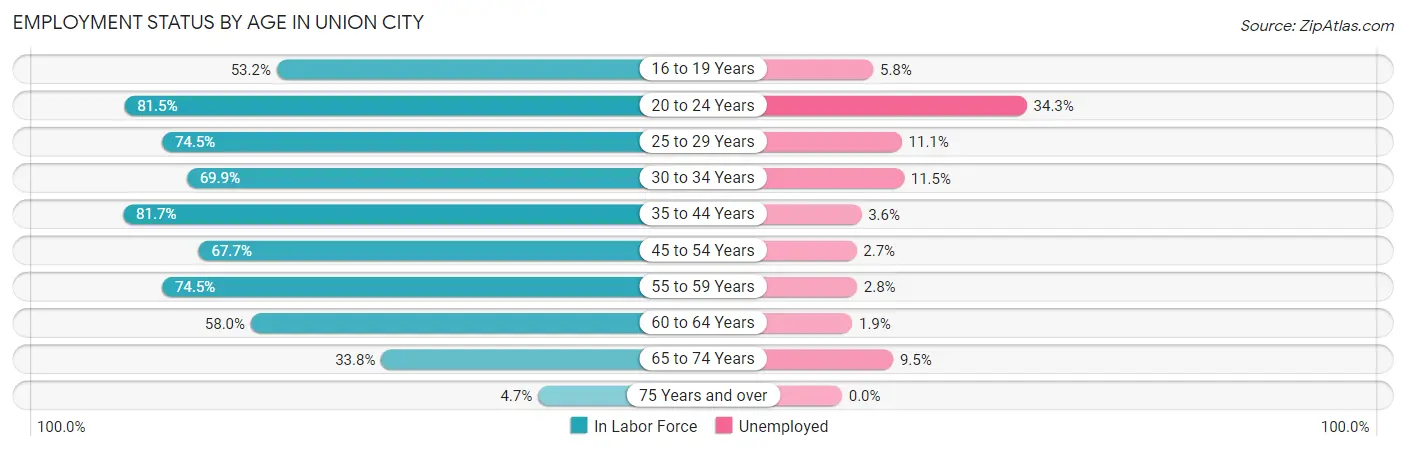
| Age Bracket | In Labor Force | Unemployed |
| 16 to 19 Years | 277 (53.2%) | 16 (5.8%) |
| 20 to 24 Years | 554 (81.5%) | 190 (34.3%) |
| 25 to 29 Years | 569 (74.5%) | 63 (11.1%) |
| 30 to 34 Years | 522 (69.9%) | 60 (11.5%) |
| 35 to 44 Years | 1,256 (81.7%) | 45 (3.6%) |
| 45 to 54 Years | 764 (67.7%) | 21 (2.7%) |
| 55 to 59 Years | 362 (74.5%) | 10 (2.8%) |
| 60 to 64 Years | 378 (58.0%) | 7 (1.9%) |
| 65 to 74 Years | 421 (33.8%) | 40 (9.5%) |
| 75 Years and over | 36 (4.7%) | 0 (0.0%) |
| Total | 5,143 (60.3%) | 453 (8.8%) |
Employment Status by Educational Attainment in Union City
According to labor force statistics for Union City, 72.5% of individuals (3,853) out of the total population between 25 and 64 years of age (5,315) are in the labor force, with 5.3% or 204 of them being unemployed. The group with the highest labor force participation rate are those with the educational attainment of bachelor's degree or higher, with 92.6% or 1,007 individuals in the labor force. Within the labor force, individuals with college / associate degree education have the highest percentage of unemployment, with 10.4% or 103 of them being unemployed.
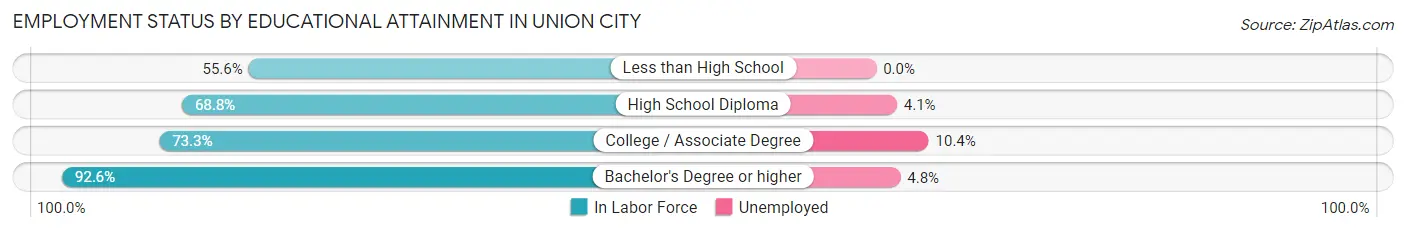
| Educational Attainment | In Labor Force | Unemployed |
| Less than High School | 529 (55.6%) | 0 (0.0%) |
| High School Diploma | 1,329 (68.8%) | 79 (4.1%) |
| College / Associate Degree | 986 (73.3%) | 140 (10.4%) |
| Bachelor's Degree or higher | 1,007 (92.6%) | 52 (4.8%) |
| Total | 3,853 (72.5%) | 282 (5.3%) |
Employment Occupations by Sex in Union City
Management, Business, Science and Arts Occupations
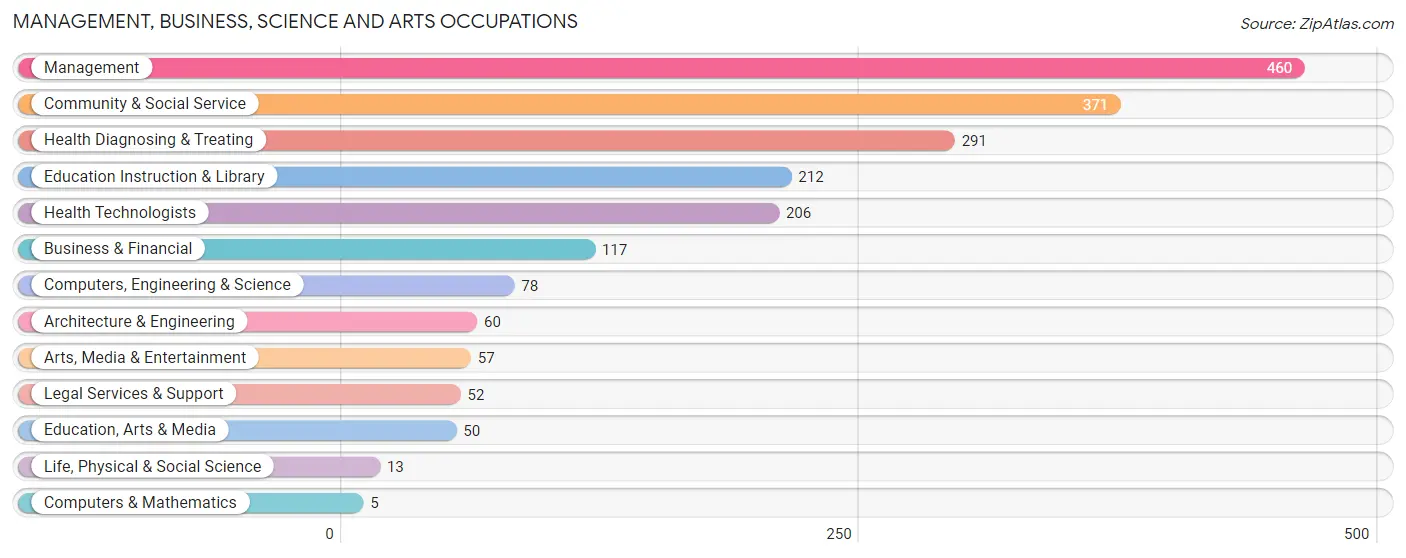
The most common Management, Business, Science and Arts occupations in Union City are Management (460 | 9.8%), Community & Social Service (371 | 7.9%), Health Diagnosing & Treating (291 | 6.2%), Education Instruction & Library (212 | 4.5%), and Health Technologists (206 | 4.4%).
Management, Business, Science and Arts Occupations by Sex
Within the Management, Business, Science and Arts occupations in Union City, the most male-oriented occupations are Computers, Engineering & Science (100.0%), Computers & Mathematics (100.0%), and Architecture & Engineering (100.0%), while the most female-oriented occupations are Health Technologists (93.7%), Health Diagnosing & Treating (91.4%), and Education Instruction & Library (73.1%).
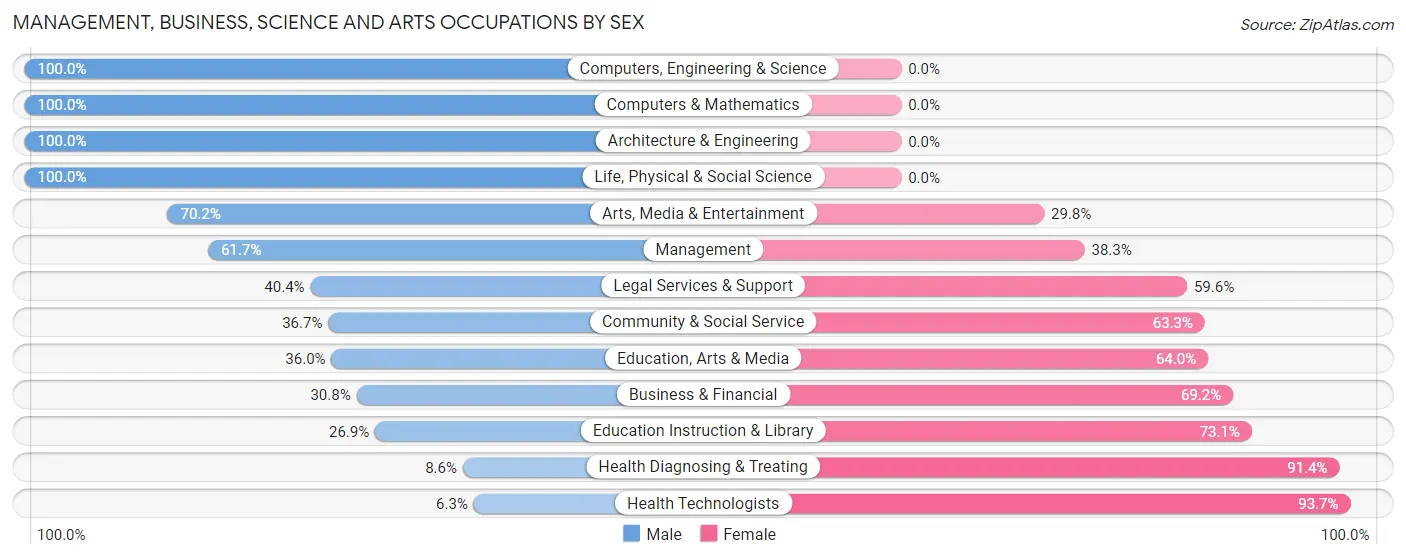
| Occupation | Male | Female |
| Management | 284 (61.7%) | 176 (38.3%) |
| Business & Financial | 36 (30.8%) | 81 (69.2%) |
| Computers, Engineering & Science | 78 (100.0%) | 0 (0.0%) |
| Computers & Mathematics | 5 (100.0%) | 0 (0.0%) |
| Architecture & Engineering | 60 (100.0%) | 0 (0.0%) |
| Life, Physical & Social Science | 13 (100.0%) | 0 (0.0%) |
| Community & Social Service | 136 (36.7%) | 235 (63.3%) |
| Education, Arts & Media | 18 (36.0%) | 32 (64.0%) |
| Legal Services & Support | 21 (40.4%) | 31 (59.6%) |
| Education Instruction & Library | 57 (26.9%) | 155 (73.1%) |
| Arts, Media & Entertainment | 40 (70.2%) | 17 (29.8%) |
| Health Diagnosing & Treating | 25 (8.6%) | 266 (91.4%) |
| Health Technologists | 13 (6.3%) | 193 (93.7%) |
| Total (Category) | 559 (42.4%) | 758 (57.6%) |
| Total (Overall) | 2,238 (47.7%) | 2,450 (52.3%) |
Services Occupations
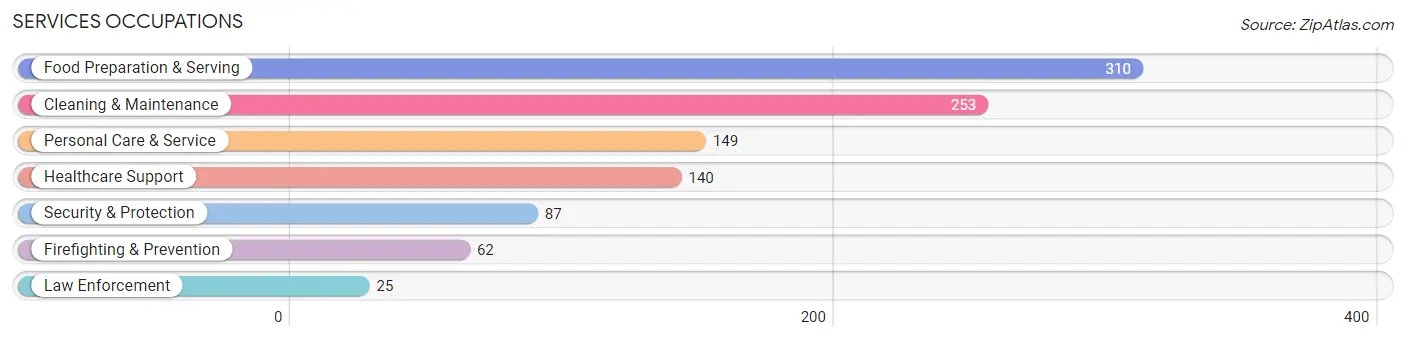
The most common Services occupations in Union City are Food Preparation & Serving (310 | 6.6%), Cleaning & Maintenance (253 | 5.4%), Personal Care & Service (149 | 3.2%), Healthcare Support (140 | 3.0%), and Security & Protection (87 | 1.9%).
Services Occupations by Sex
Within the Services occupations in Union City, the most male-oriented occupations are Firefighting & Prevention (100.0%), Security & Protection (85.1%), and Cleaning & Maintenance (69.2%), while the most female-oriented occupations are Healthcare Support (100.0%), Personal Care & Service (100.0%), and Law Enforcement (52.0%).
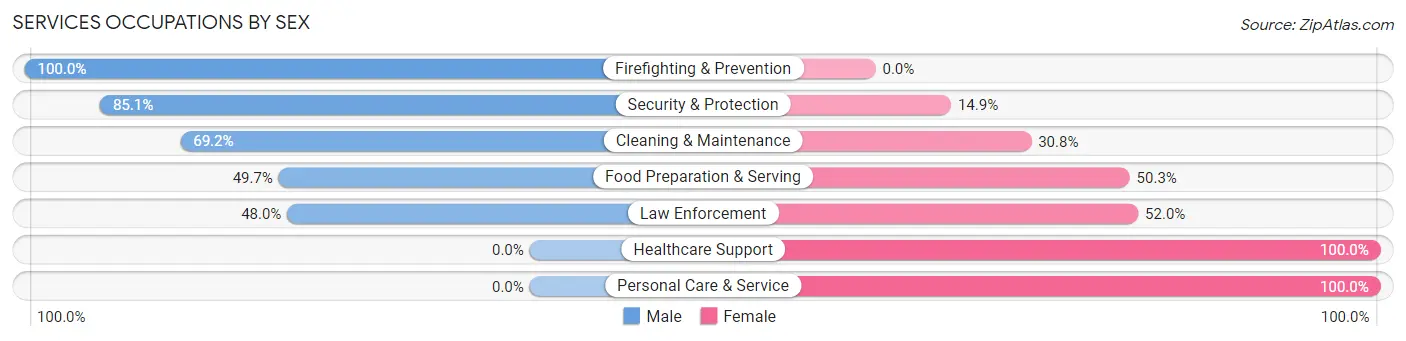
| Occupation | Male | Female |
| Healthcare Support | 0 (0.0%) | 140 (100.0%) |
| Security & Protection | 74 (85.1%) | 13 (14.9%) |
| Firefighting & Prevention | 62 (100.0%) | 0 (0.0%) |
| Law Enforcement | 12 (48.0%) | 13 (52.0%) |
| Food Preparation & Serving | 154 (49.7%) | 156 (50.3%) |
| Cleaning & Maintenance | 175 (69.2%) | 78 (30.8%) |
| Personal Care & Service | 0 (0.0%) | 149 (100.0%) |
| Total (Category) | 403 (42.9%) | 536 (57.1%) |
| Total (Overall) | 2,238 (47.7%) | 2,450 (52.3%) |
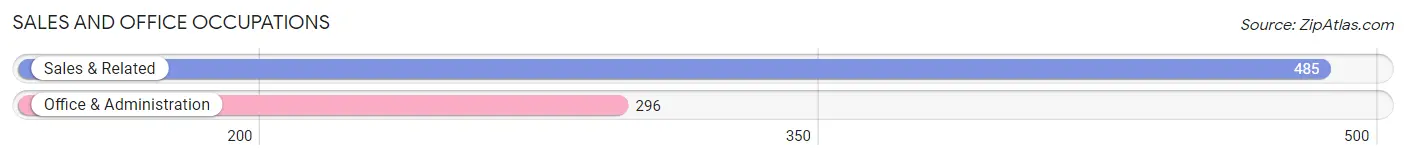
Sales and Office Occupations
The most common Sales and Office occupations in Union City are Sales & Related (485 | 10.3%), and Office & Administration (296 | 6.3%).
Sales and Office Occupations by Sex
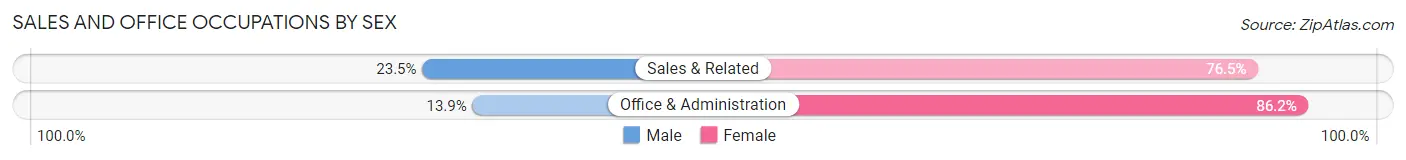
| Occupation | Male | Female |
| Sales & Related | 114 (23.5%) | 371 (76.5%) |
| Office & Administration | 41 (13.9%) | 255 (86.2%) |
| Total (Category) | 155 (19.9%) | 626 (80.1%) |
| Total (Overall) | 2,238 (47.7%) | 2,450 (52.3%) |
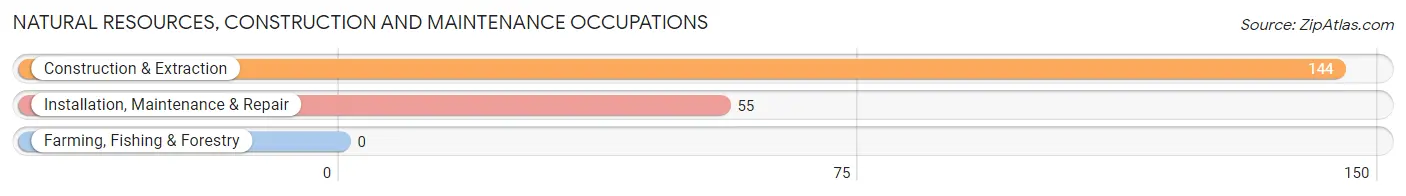
Natural Resources, Construction and Maintenance Occupations
The most common Natural Resources, Construction and Maintenance occupations in Union City are Construction & Extraction (144 | 3.1%), and Installation, Maintenance & Repair (55 | 1.2%).
Natural Resources, Construction and Maintenance Occupations by Sex
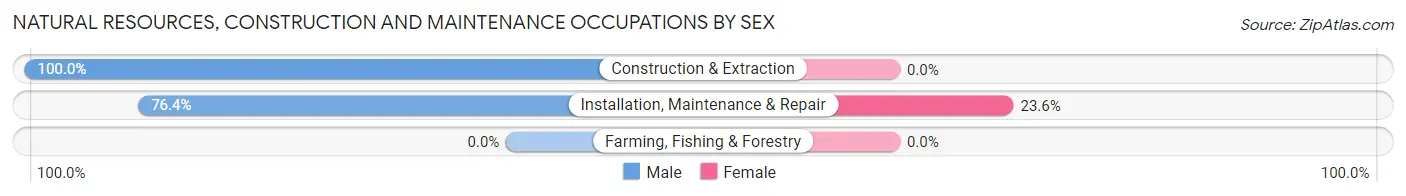
| Occupation | Male | Female |
| Farming, Fishing & Forestry | 0 (0.0%) | 0 (0.0%) |
| Construction & Extraction | 144 (100.0%) | 0 (0.0%) |
| Installation, Maintenance & Repair | 42 (76.4%) | 13 (23.6%) |
| Total (Category) | 186 (93.5%) | 13 (6.5%) |
| Total (Overall) | 2,238 (47.7%) | 2,450 (52.3%) |
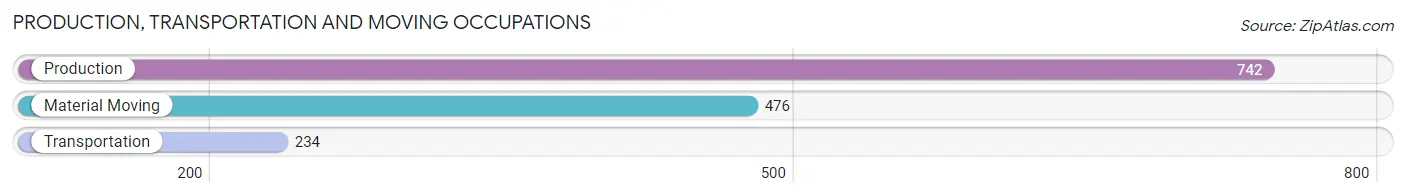
Production, Transportation and Moving Occupations
The most common Production, Transportation and Moving occupations in Union City are Production (742 | 15.8%), Material Moving (476 | 10.2%), and Transportation (234 | 5.0%).
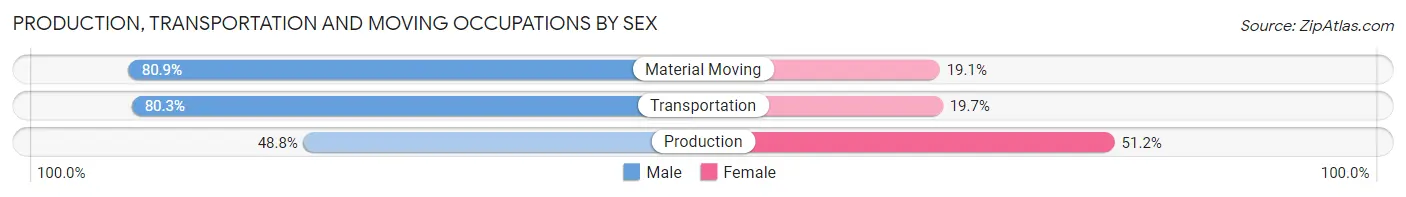
Production, Transportation and Moving Occupations by Sex
| Occupation | Male | Female |
| Production | 362 (48.8%) | 380 (51.2%) |
| Transportation | 188 (80.3%) | 46 (19.7%) |
| Material Moving | 385 (80.9%) | 91 (19.1%) |
| Total (Category) | 935 (64.4%) | 517 (35.6%) |
| Total (Overall) | 2,238 (47.7%) | 2,450 (52.3%) |
Employment Industries by Sex in Union City
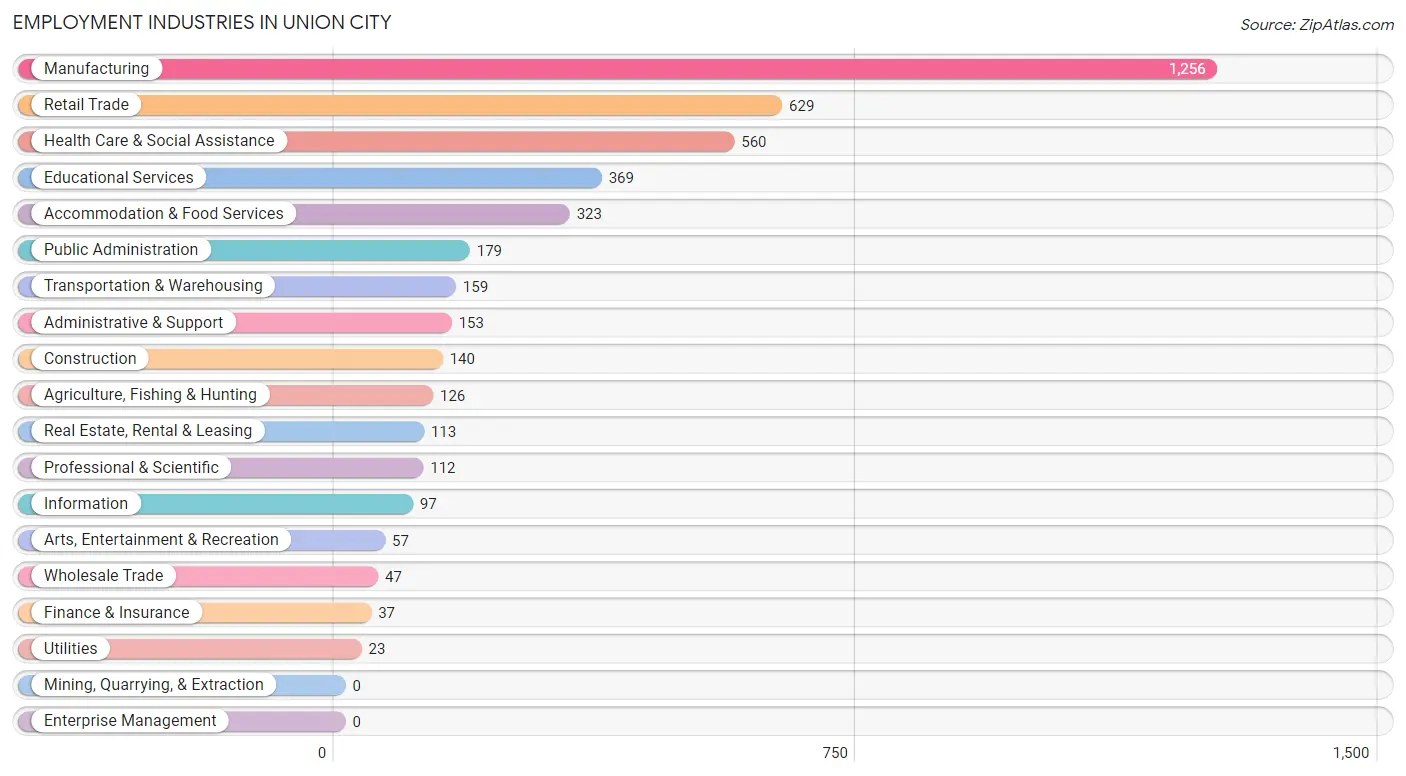
Employment Industries in Union City
The major employment industries in Union City include Manufacturing (1,256 | 26.8%), Retail Trade (629 | 13.4%), Health Care & Social Assistance (560 | 11.9%), Educational Services (369 | 7.9%), and Accommodation & Food Services (323 | 6.9%).
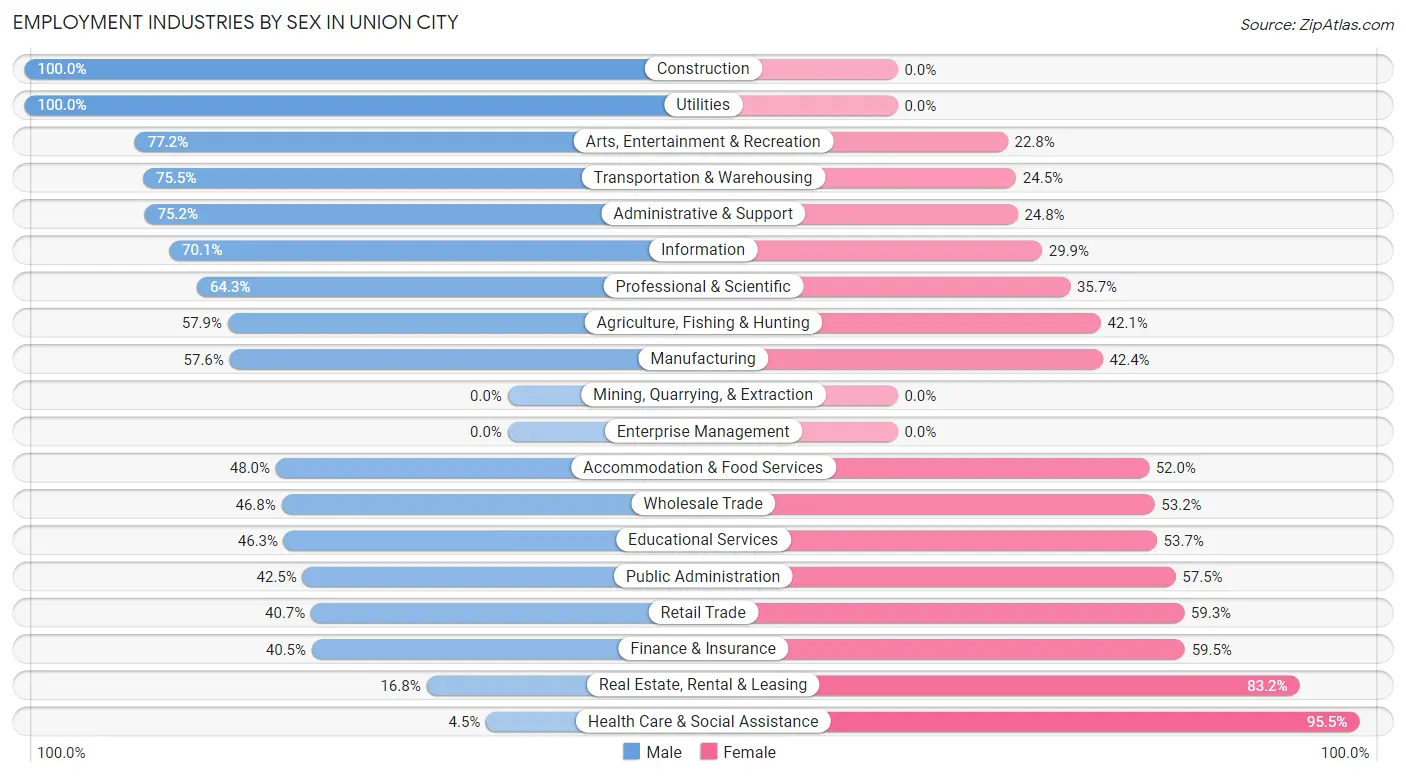
Employment Industries by Sex in Union City
The Union City industries that see more men than women are Construction (100.0%), Utilities (100.0%), and Arts, Entertainment & Recreation (77.2%), whereas the industries that tend to have a higher number of women are Health Care & Social Assistance (95.5%), Real Estate, Rental & Leasing (83.2%), and Finance & Insurance (59.5%).
| Industry | Male | Female |
| Agriculture, Fishing & Hunting | 73 (57.9%) | 53 (42.1%) |
| Mining, Quarrying, & Extraction | 0 (0.0%) | 0 (0.0%) |
| Construction | 140 (100.0%) | 0 (0.0%) |
| Manufacturing | 723 (57.6%) | 533 (42.4%) |
| Wholesale Trade | 22 (46.8%) | 25 (53.2%) |
| Retail Trade | 256 (40.7%) | 373 (59.3%) |
| Transportation & Warehousing | 120 (75.5%) | 39 (24.5%) |
| Utilities | 23 (100.0%) | 0 (0.0%) |
| Information | 68 (70.1%) | 29 (29.9%) |
| Finance & Insurance | 15 (40.5%) | 22 (59.5%) |
| Real Estate, Rental & Leasing | 19 (16.8%) | 94 (83.2%) |
| Professional & Scientific | 72 (64.3%) | 40 (35.7%) |
| Enterprise Management | 0 (0.0%) | 0 (0.0%) |
| Administrative & Support | 115 (75.2%) | 38 (24.8%) |
| Educational Services | 171 (46.3%) | 198 (53.7%) |
| Health Care & Social Assistance | 25 (4.5%) | 535 (95.5%) |
| Arts, Entertainment & Recreation | 44 (77.2%) | 13 (22.8%) |
| Accommodation & Food Services | 155 (48.0%) | 168 (52.0%) |
| Public Administration | 76 (42.5%) | 103 (57.5%) |
| Total | 2,238 (47.7%) | 2,450 (52.3%) |
Education in Union City
School Enrollment in Union City
The most common levels of schooling among the 2,473 students in Union City are high school (649 | 26.2%), elementary school (625 | 25.3%), and middle school (618 | 25.0%).
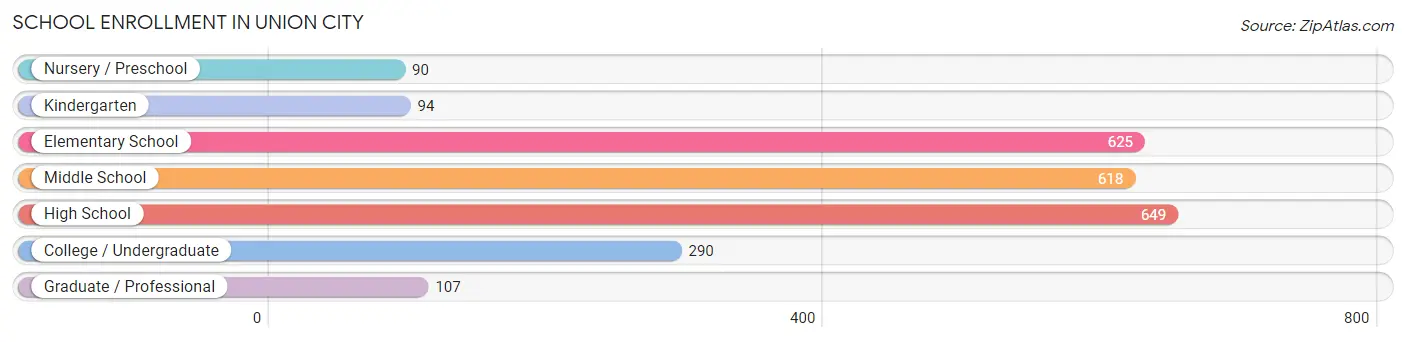
| School Level | # Students | % Students |
| Nursery / Preschool | 90 | 3.6% |
| Kindergarten | 94 | 3.8% |
| Elementary School | 625 | 25.3% |
| Middle School | 618 | 25.0% |
| High School | 649 | 26.2% |
| College / Undergraduate | 290 | 11.7% |
| Graduate / Professional | 107 | 4.3% |
| Total | 2,473 | 100.0% |
School Enrollment by Age by Funding Source in Union City
Out of a total of 2,473 students who are enrolled in schools in Union City, 111 (4.5%) attend a private institution, while the remaining 2,362 (95.5%) are enrolled in public schools. The age group of 18 to 19 year olds has the highest likelihood of being enrolled in private schools, with 38 (86.4% in the age bracket) enrolled. Conversely, the age group of 3 to 4 year olds has the lowest likelihood of being enrolled in a private school, with 41 (100.0% in the age bracket) attending a public institution.
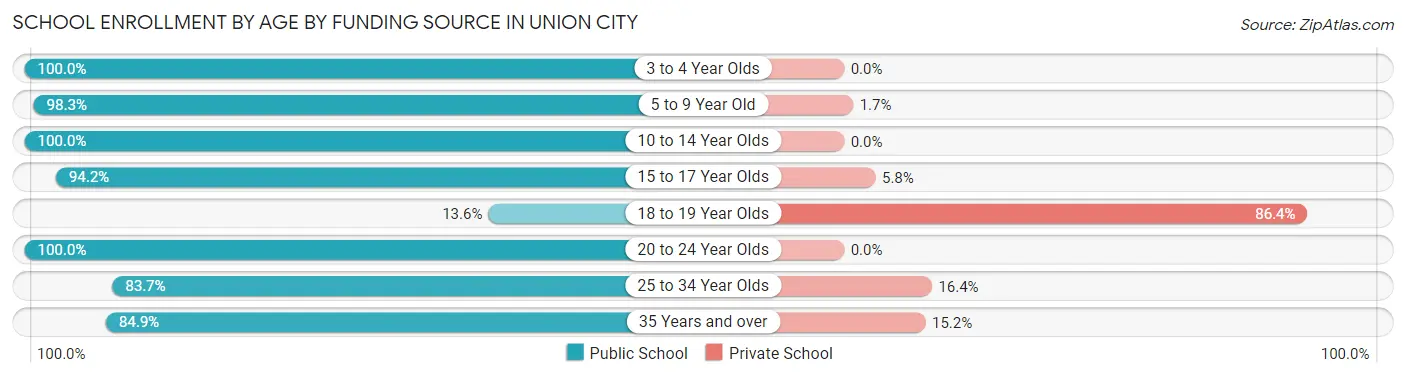
| Age Bracket | Public School | Private School |
| 3 to 4 Year Olds | 41 (100.0%) | 0 (0.0%) |
| 5 to 9 Year Old | 700 (98.3%) | 12 (1.7%) |
| 10 to 14 Year Olds | 784 (100.0%) | 0 (0.0%) |
| 15 to 17 Year Olds | 468 (94.2%) | 29 (5.8%) |
| 18 to 19 Year Olds | 6 (13.6%) | 38 (86.4%) |
| 20 to 24 Year Olds | 192 (100.0%) | 0 (0.0%) |
| 25 to 34 Year Olds | 87 (83.7%) | 17 (16.4%) |
| 35 Years and over | 84 (84.9%) | 15 (15.1%) |
| Total | 2,362 (95.5%) | 111 (4.5%) |
Educational Attainment by Field of Study in Union City
Education (467 | 31.2%), business (245 | 16.4%), arts & humanities (195 | 13.0%), science & technology (142 | 9.5%), and social sciences (79 | 5.3%) are the most common fields of study among 1,496 individuals in Union City who have obtained a bachelor's degree or higher.
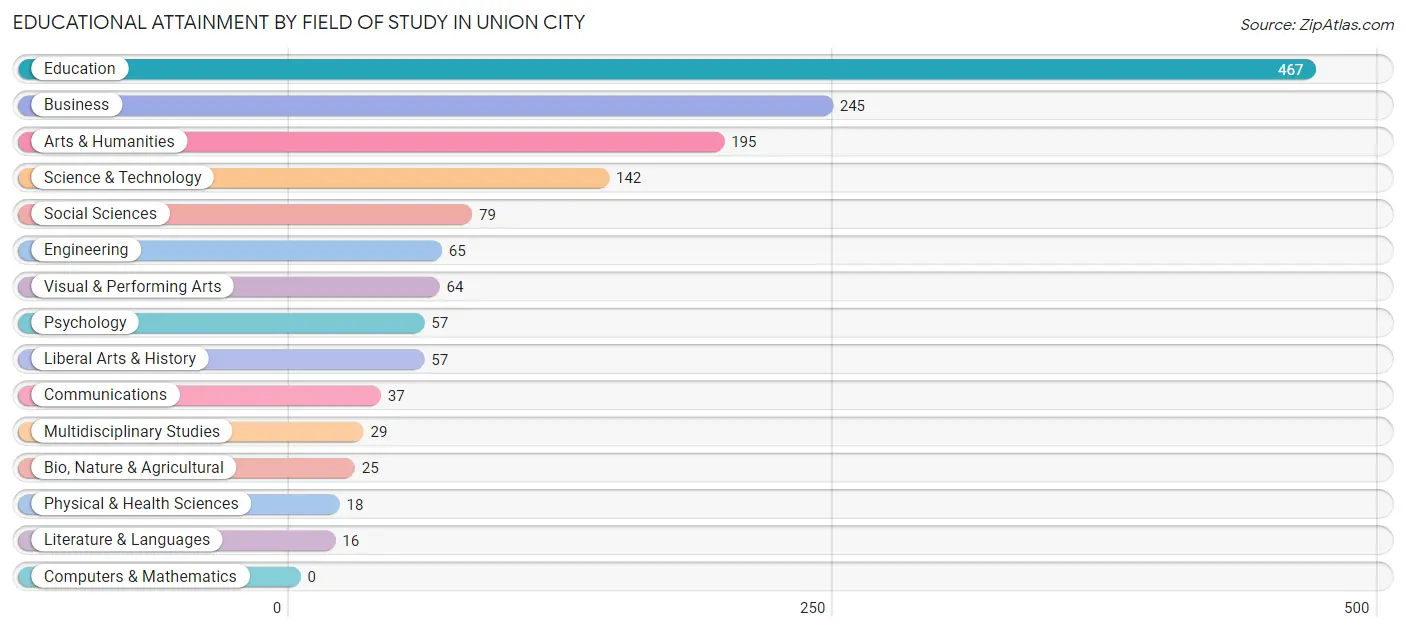
| Field of Study | # Graduates | % Graduates |
| Computers & Mathematics | 0 | 0.0% |
| Bio, Nature & Agricultural | 25 | 1.7% |
| Physical & Health Sciences | 18 | 1.2% |
| Psychology | 57 | 3.8% |
| Social Sciences | 79 | 5.3% |
| Engineering | 65 | 4.3% |
| Multidisciplinary Studies | 29 | 1.9% |
| Science & Technology | 142 | 9.5% |
| Business | 245 | 16.4% |
| Education | 467 | 31.2% |
| Literature & Languages | 16 | 1.1% |
| Liberal Arts & History | 57 | 3.8% |
| Visual & Performing Arts | 64 | 4.3% |
| Communications | 37 | 2.5% |
| Arts & Humanities | 195 | 13.0% |
| Total | 1,496 | 100.0% |
Transportation & Commute in Union City
Vehicle Availability by Sex in Union City
The most prevalent vehicle ownership categories in Union City are males with 2 vehicles (973, accounting for 44.3%) and females with 2 vehicles (965, making up 40.2%).
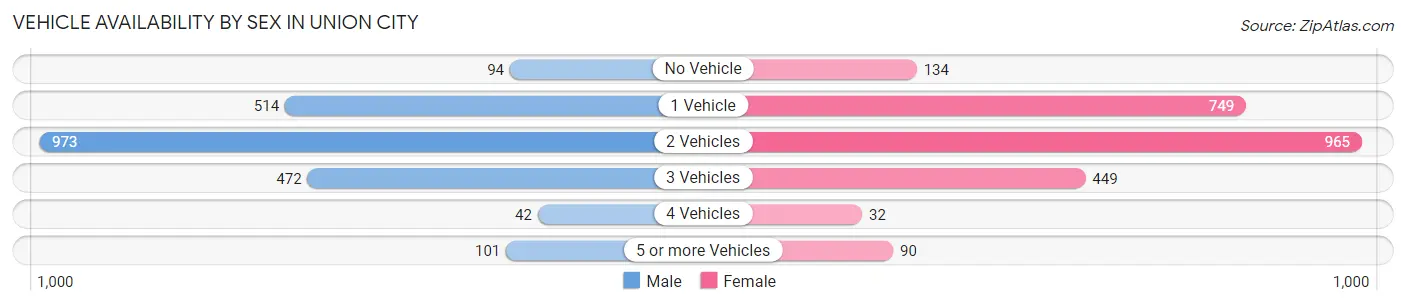
| Vehicles Available | Male | Female |
| No Vehicle | 94 (4.3%) | 134 (5.5%) |
| 1 Vehicle | 514 (23.4%) | 749 (31.0%) |
| 2 Vehicles | 973 (44.3%) | 965 (39.9%) |
| 3 Vehicles | 472 (21.5%) | 449 (18.6%) |
| 4 Vehicles | 42 (1.9%) | 32 (1.3%) |
| 5 or more Vehicles | 101 (4.6%) | 90 (3.7%) |
| Total | 2,196 (100.0%) | 2,419 (100.0%) |
Commute Time in Union City
The most frequently occuring commute durations in Union City are 10 to 14 minutes (1,010 commuters, 22.7%), 5 to 9 minutes (968 commuters, 21.7%), and 15 to 19 minutes (731 commuters, 16.4%).
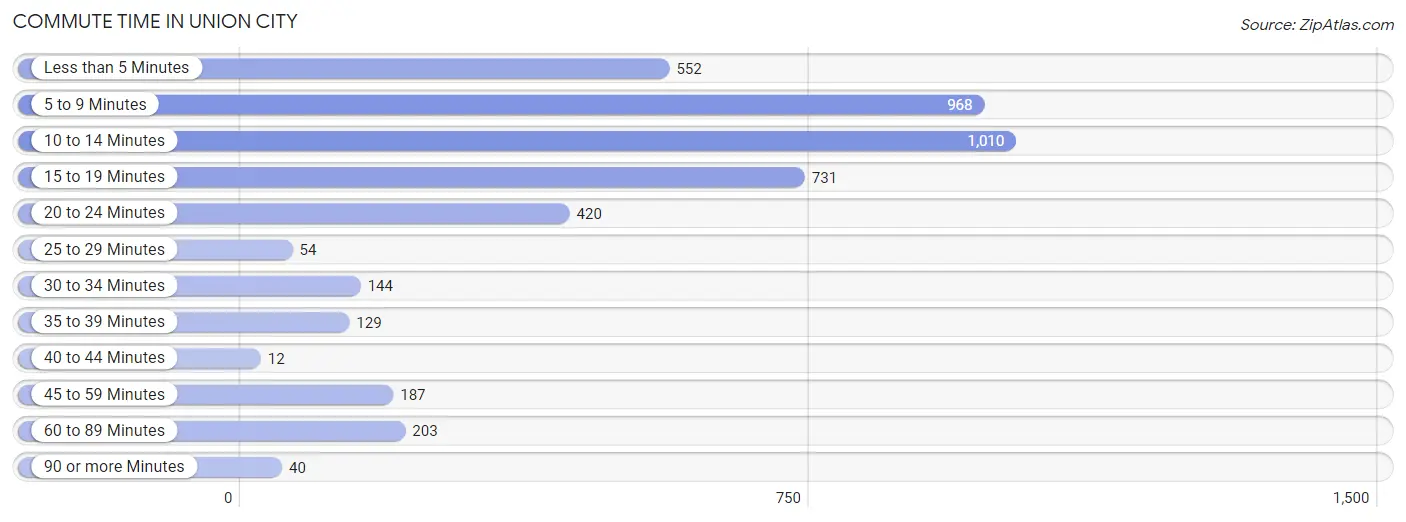
| Commute Time | # Commuters | % Commuters |
| Less than 5 Minutes | 552 | 12.4% |
| 5 to 9 Minutes | 968 | 21.7% |
| 10 to 14 Minutes | 1,010 | 22.7% |
| 15 to 19 Minutes | 731 | 16.4% |
| 20 to 24 Minutes | 420 | 9.4% |
| 25 to 29 Minutes | 54 | 1.2% |
| 30 to 34 Minutes | 144 | 3.2% |
| 35 to 39 Minutes | 129 | 2.9% |
| 40 to 44 Minutes | 12 | 0.3% |
| 45 to 59 Minutes | 187 | 4.2% |
| 60 to 89 Minutes | 203 | 4.6% |
| 90 or more Minutes | 40 | 0.9% |
Commute Time by Sex in Union City
The most common commute times in Union City are 10 to 14 minutes (554 commuters, 25.2%) for males and 5 to 9 minutes (574 commuters, 25.5%) for females.
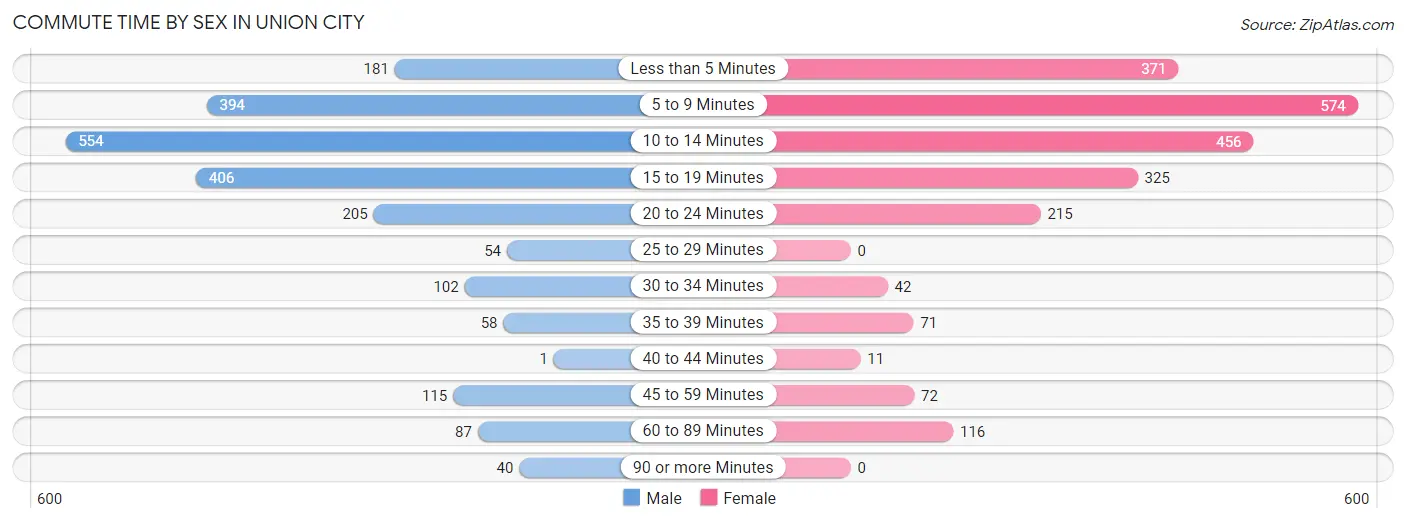
| Commute Time | Male | Female |
| Less than 5 Minutes | 181 (8.2%) | 371 (16.5%) |
| 5 to 9 Minutes | 394 (17.9%) | 574 (25.5%) |
| 10 to 14 Minutes | 554 (25.2%) | 456 (20.2%) |
| 15 to 19 Minutes | 406 (18.5%) | 325 (14.4%) |
| 20 to 24 Minutes | 205 (9.3%) | 215 (9.5%) |
| 25 to 29 Minutes | 54 (2.5%) | 0 (0.0%) |
| 30 to 34 Minutes | 102 (4.6%) | 42 (1.9%) |
| 35 to 39 Minutes | 58 (2.6%) | 71 (3.2%) |
| 40 to 44 Minutes | 1 (0.1%) | 11 (0.5%) |
| 45 to 59 Minutes | 115 (5.2%) | 72 (3.2%) |
| 60 to 89 Minutes | 87 (4.0%) | 116 (5.1%) |
| 90 or more Minutes | 40 (1.8%) | 0 (0.0%) |
Time of Departure to Work by Sex in Union City
The most frequent times of departure to work in Union City are 6:30 AM to 6:59 AM (438, 19.9%) for males and 7:00 AM to 7:29 AM (429, 19.0%) for females.
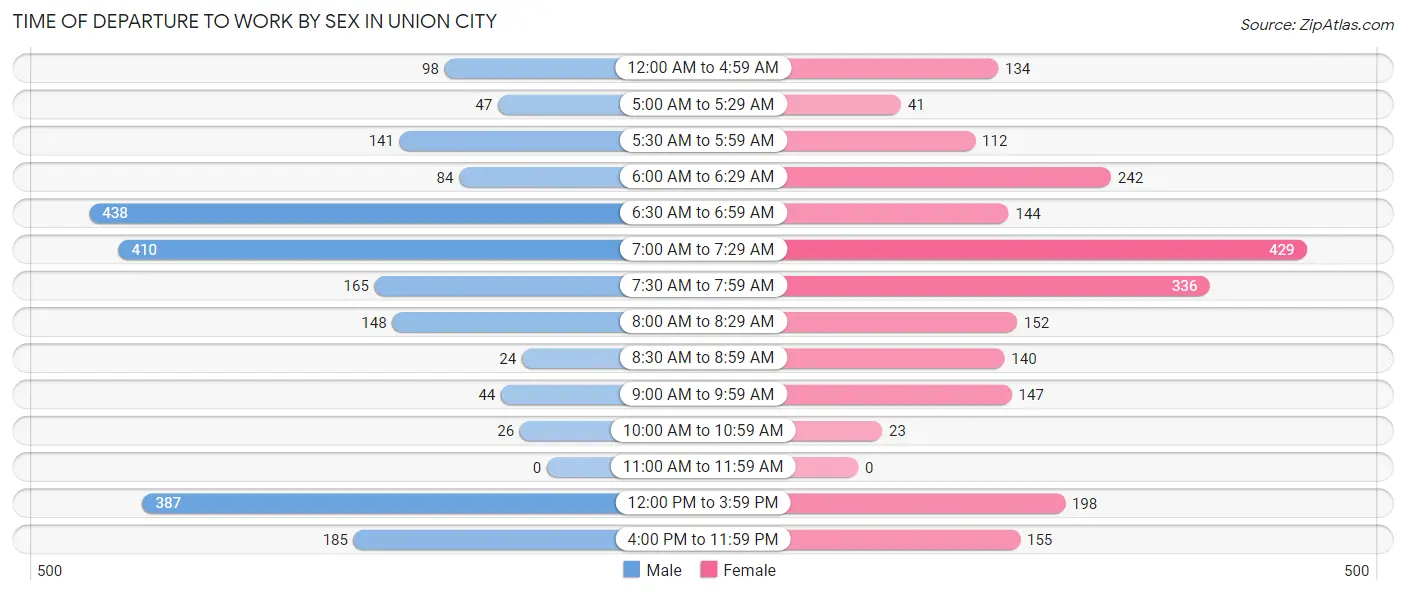
| Time of Departure | Male | Female |
| 12:00 AM to 4:59 AM | 98 (4.5%) | 134 (5.9%) |
| 5:00 AM to 5:29 AM | 47 (2.1%) | 41 (1.8%) |
| 5:30 AM to 5:59 AM | 141 (6.4%) | 112 (5.0%) |
| 6:00 AM to 6:29 AM | 84 (3.8%) | 242 (10.7%) |
| 6:30 AM to 6:59 AM | 438 (19.9%) | 144 (6.4%) |
| 7:00 AM to 7:29 AM | 410 (18.7%) | 429 (19.0%) |
| 7:30 AM to 7:59 AM | 165 (7.5%) | 336 (14.9%) |
| 8:00 AM to 8:29 AM | 148 (6.7%) | 152 (6.8%) |
| 8:30 AM to 8:59 AM | 24 (1.1%) | 140 (6.2%) |
| 9:00 AM to 9:59 AM | 44 (2.0%) | 147 (6.5%) |
| 10:00 AM to 10:59 AM | 26 (1.2%) | 23 (1.0%) |
| 11:00 AM to 11:59 AM | 0 (0.0%) | 0 (0.0%) |
| 12:00 PM to 3:59 PM | 387 (17.6%) | 198 (8.8%) |
| 4:00 PM to 11:59 PM | 185 (8.4%) | 155 (6.9%) |
| Total | 2,197 (100.0%) | 2,253 (100.0%) |
Housing Occupancy in Union City
Occupancy by Ownership in Union City
Of the total 4,423 dwellings in Union City, owner-occupied units account for 2,266 (51.2%), while renter-occupied units make up 2,157 (48.8%).
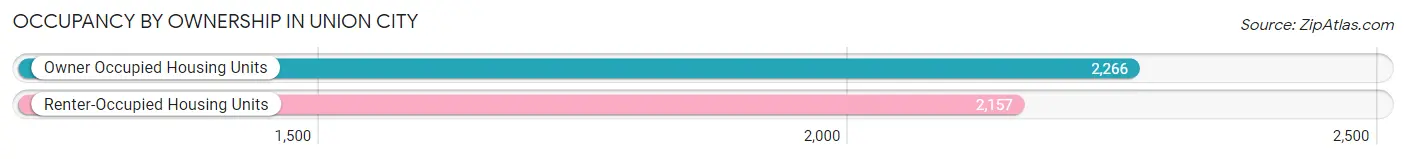
| Occupancy | # Housing Units | % Housing Units |
| Owner Occupied Housing Units | 2,266 | 51.2% |
| Renter-Occupied Housing Units | 2,157 | 48.8% |
| Total Occupied Housing Units | 4,423 | 100.0% |
Occupancy by Household Size in Union City
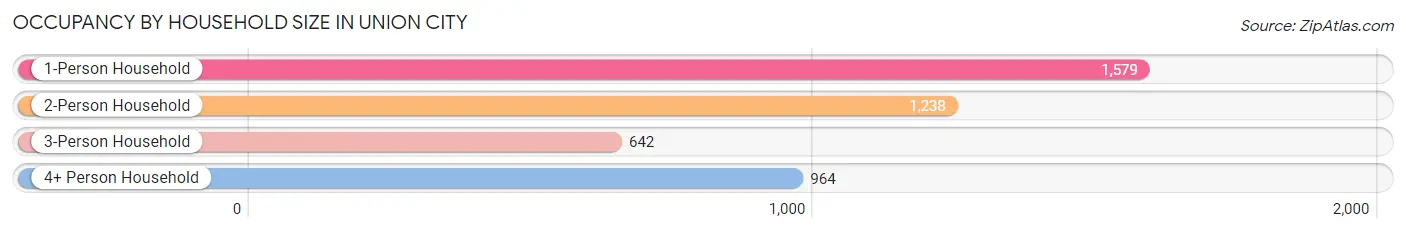
| Household Size | # Housing Units | % Housing Units |
| 1-Person Household | 1,579 | 35.7% |
| 2-Person Household | 1,238 | 28.0% |
| 3-Person Household | 642 | 14.5% |
| 4+ Person Household | 964 | 21.8% |
| Total Housing Units | 4,423 | 100.0% |
Occupancy by Ownership by Household Size in Union City
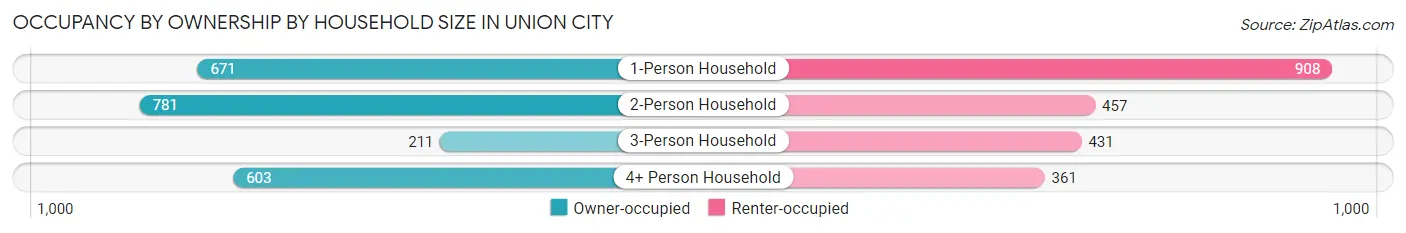
| Household Size | Owner-occupied | Renter-occupied |
| 1-Person Household | 671 (42.5%) | 908 (57.5%) |
| 2-Person Household | 781 (63.1%) | 457 (36.9%) |
| 3-Person Household | 211 (32.9%) | 431 (67.1%) |
| 4+ Person Household | 603 (62.5%) | 361 (37.4%) |
| Total Housing Units | 2,266 (51.2%) | 2,157 (48.8%) |
Occupancy by Educational Attainment in Union City
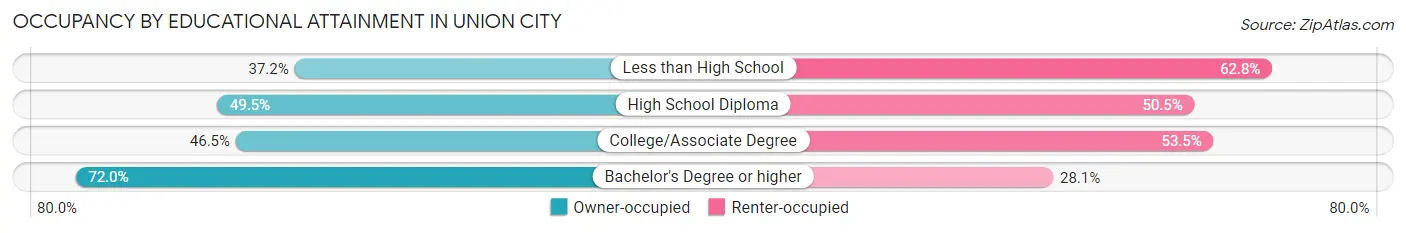
| Household Size | Owner-occupied | Renter-occupied |
| Less than High School | 222 (37.2%) | 375 (62.8%) |
| High School Diploma | 691 (49.5%) | 705 (50.5%) |
| College/Associate Degree | 722 (46.5%) | 831 (53.5%) |
| Bachelor's Degree or higher | 631 (72.0%) | 246 (28.1%) |
Occupancy by Age of Householder in Union City
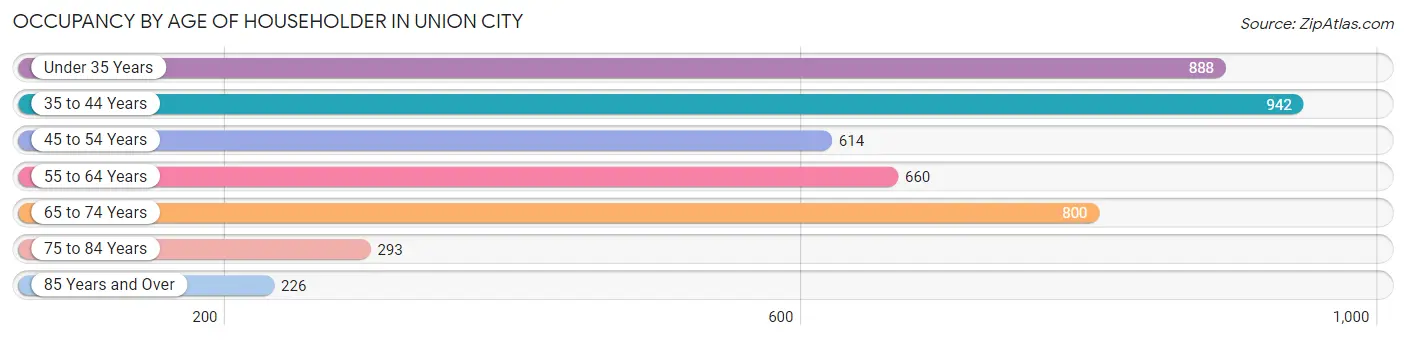
| Age Bracket | # Households | % Households |
| Under 35 Years | 888 | 20.1% |
| 35 to 44 Years | 942 | 21.3% |
| 45 to 54 Years | 614 | 13.9% |
| 55 to 64 Years | 660 | 14.9% |
| 65 to 74 Years | 800 | 18.1% |
| 75 to 84 Years | 293 | 6.6% |
| 85 Years and Over | 226 | 5.1% |
| Total | 4,423 | 100.0% |
Housing Finances in Union City
Median Income by Occupancy in Union City
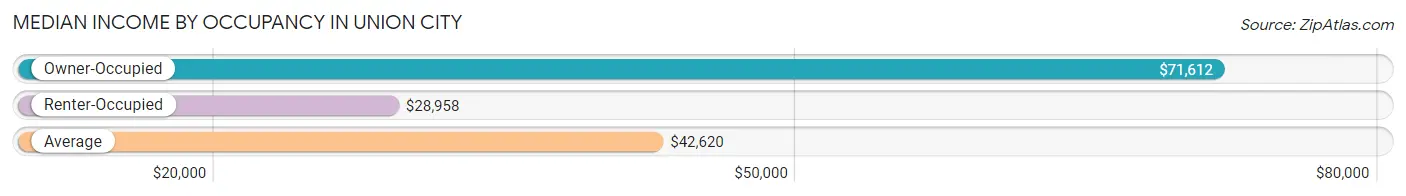
| Occupancy Type | # Households | Median Income |
| Owner-Occupied | 2,266 (51.2%) | $71,612 |
| Renter-Occupied | 2,157 (48.8%) | $28,958 |
| Average | 4,423 (100.0%) | $42,620 |
Occupancy by Householder Income Bracket in Union City
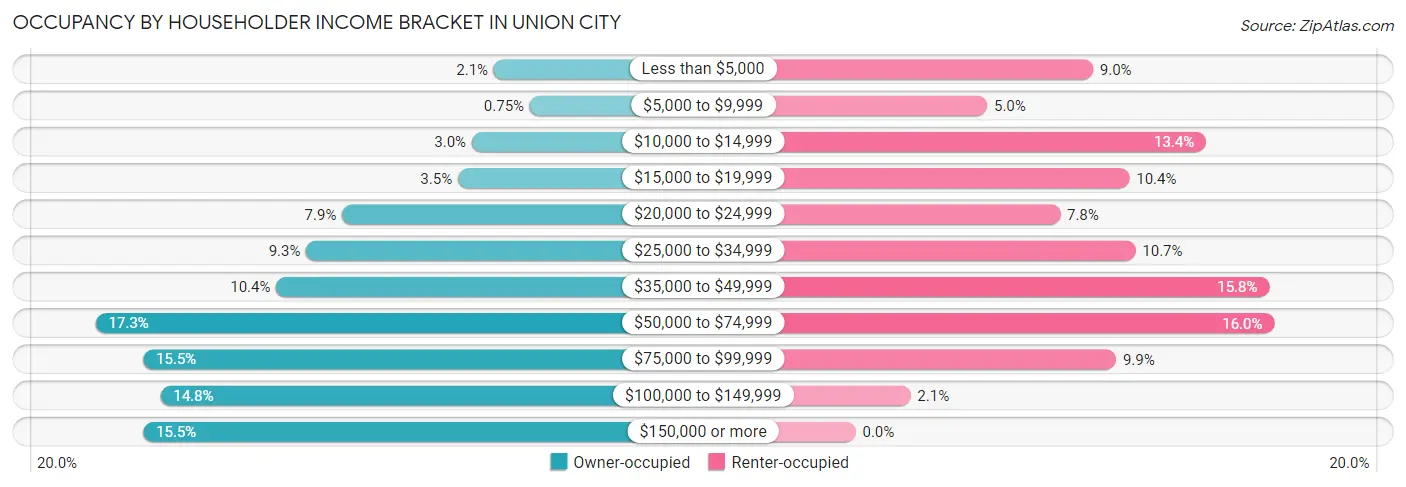
| Income Bracket | Owner-occupied | Renter-occupied |
| Less than $5,000 | 48 (2.1%) | 195 (9.0%) |
| $5,000 to $9,999 | 17 (0.7%) | 108 (5.0%) |
| $10,000 to $14,999 | 67 (3.0%) | 288 (13.4%) |
| $15,000 to $19,999 | 79 (3.5%) | 225 (10.4%) |
| $20,000 to $24,999 | 179 (7.9%) | 168 (7.8%) |
| $25,000 to $34,999 | 210 (9.3%) | 230 (10.7%) |
| $35,000 to $49,999 | 236 (10.4%) | 340 (15.8%) |
| $50,000 to $74,999 | 392 (17.3%) | 344 (16.0%) |
| $75,000 to $99,999 | 351 (15.5%) | 214 (9.9%) |
| $100,000 to $149,999 | 336 (14.8%) | 45 (2.1%) |
| $150,000 or more | 351 (15.5%) | 0 (0.0%) |
| Total | 2,266 (100.0%) | 2,157 (100.0%) |
Monthly Housing Cost Tiers in Union City
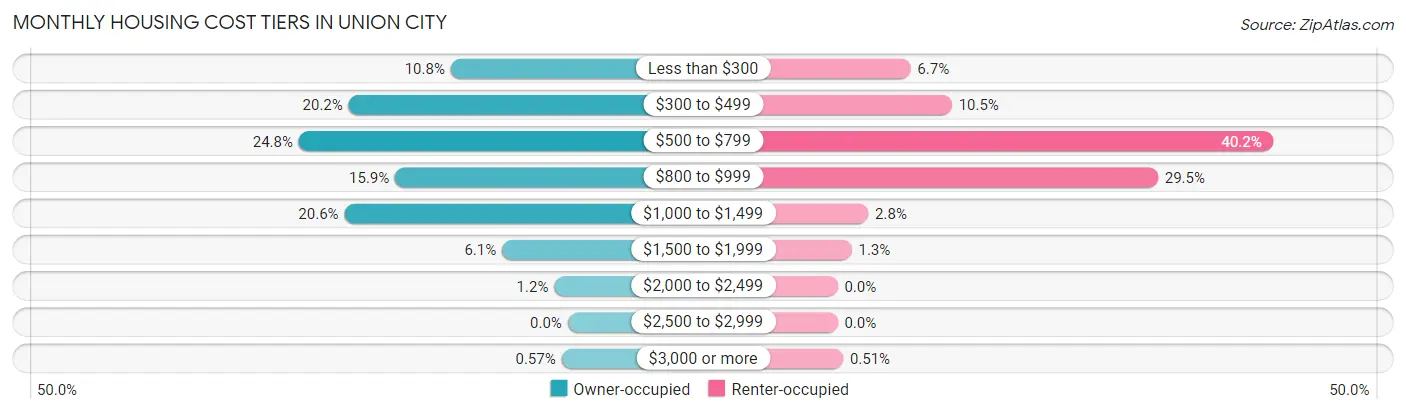
| Monthly Cost | Owner-occupied | Renter-occupied |
| Less than $300 | 244 (10.8%) | 145 (6.7%) |
| $300 to $499 | 457 (20.2%) | 227 (10.5%) |
| $500 to $799 | 561 (24.8%) | 866 (40.2%) |
| $800 to $999 | 360 (15.9%) | 636 (29.5%) |
| $1,000 to $1,499 | 466 (20.6%) | 61 (2.8%) |
| $1,500 to $1,999 | 137 (6.0%) | 28 (1.3%) |
| $2,000 to $2,499 | 28 (1.2%) | 0 (0.0%) |
| $2,500 to $2,999 | 0 (0.0%) | 0 (0.0%) |
| $3,000 or more | 13 (0.6%) | 11 (0.5%) |
| Total | 2,266 (100.0%) | 2,157 (100.0%) |
Physical Housing Characteristics in Union City
Housing Structures in Union City
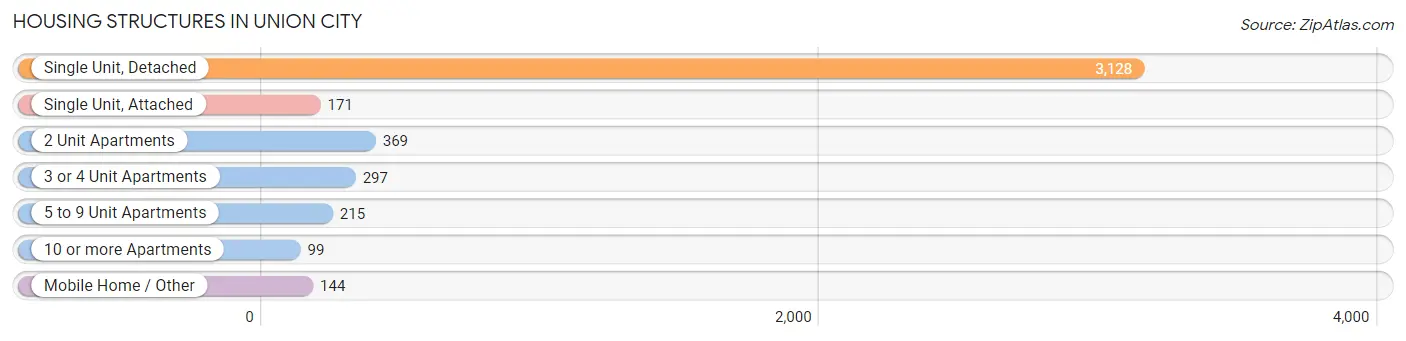
| Structure Type | # Housing Units | % Housing Units |
| Single Unit, Detached | 3,128 | 70.7% |
| Single Unit, Attached | 171 | 3.9% |
| 2 Unit Apartments | 369 | 8.3% |
| 3 or 4 Unit Apartments | 297 | 6.7% |
| 5 to 9 Unit Apartments | 215 | 4.9% |
| 10 or more Apartments | 99 | 2.2% |
| Mobile Home / Other | 144 | 3.3% |
| Total | 4,423 | 100.0% |
Housing Structures by Occupancy in Union City
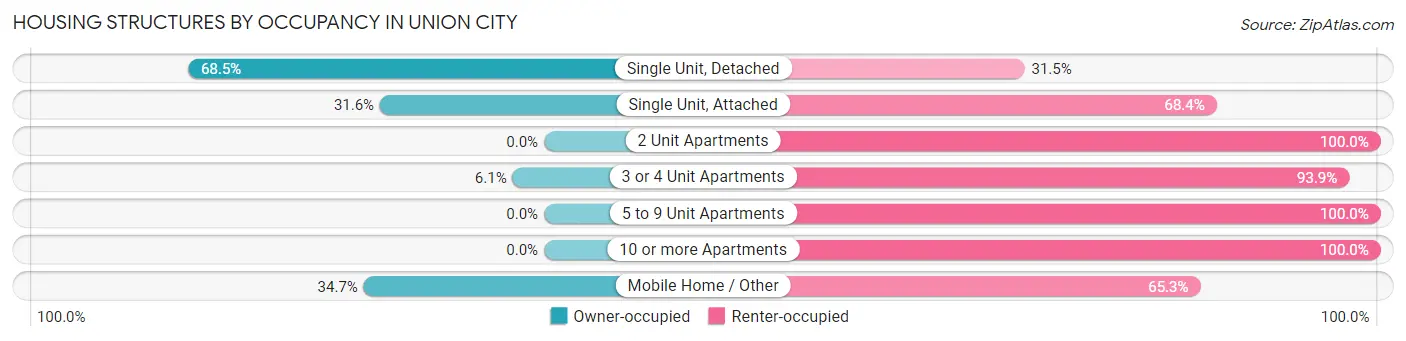
| Structure Type | Owner-occupied | Renter-occupied |
| Single Unit, Detached | 2,144 (68.5%) | 984 (31.5%) |
| Single Unit, Attached | 54 (31.6%) | 117 (68.4%) |
| 2 Unit Apartments | 0 (0.0%) | 369 (100.0%) |
| 3 or 4 Unit Apartments | 18 (6.1%) | 279 (93.9%) |
| 5 to 9 Unit Apartments | 0 (0.0%) | 215 (100.0%) |
| 10 or more Apartments | 0 (0.0%) | 99 (100.0%) |
| Mobile Home / Other | 50 (34.7%) | 94 (65.3%) |
| Total | 2,266 (51.2%) | 2,157 (48.8%) |
Housing Structures by Number of Rooms in Union City
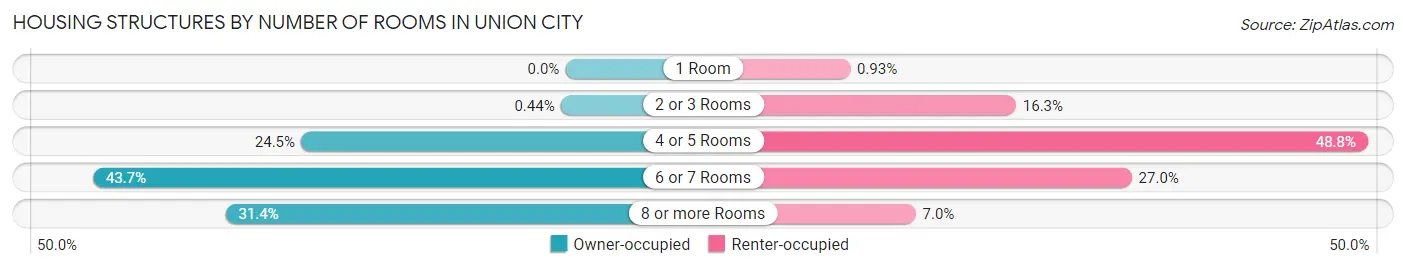
| Number of Rooms | Owner-occupied | Renter-occupied |
| 1 Room | 0 (0.0%) | 20 (0.9%) |
| 2 or 3 Rooms | 10 (0.4%) | 351 (16.3%) |
| 4 or 5 Rooms | 554 (24.4%) | 1,053 (48.8%) |
| 6 or 7 Rooms | 990 (43.7%) | 582 (27.0%) |
| 8 or more Rooms | 712 (31.4%) | 151 (7.0%) |
| Total | 2,266 (100.0%) | 2,157 (100.0%) |
Housing Structure by Heating Type in Union City
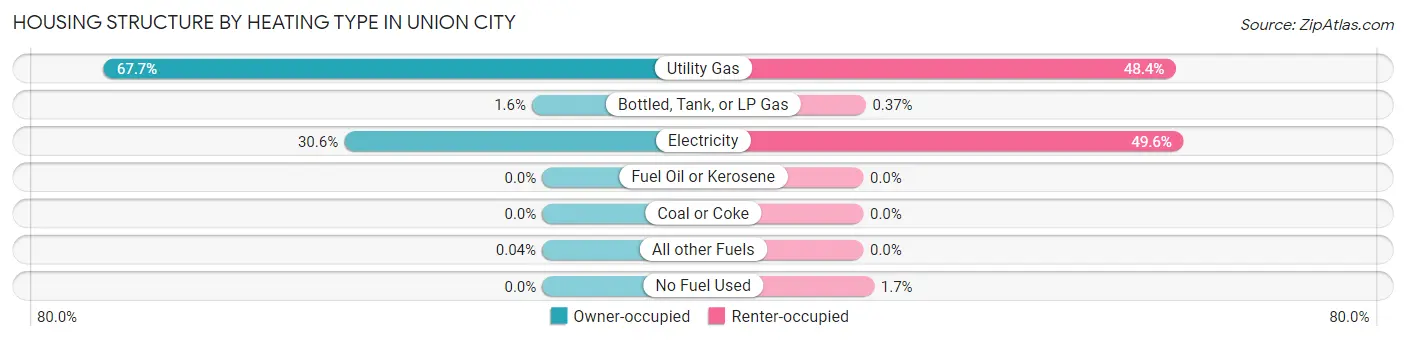
| Heating Type | Owner-occupied | Renter-occupied |
| Utility Gas | 1,535 (67.7%) | 1,044 (48.4%) |
| Bottled, Tank, or LP Gas | 36 (1.6%) | 8 (0.4%) |
| Electricity | 694 (30.6%) | 1,069 (49.6%) |
| Fuel Oil or Kerosene | 0 (0.0%) | 0 (0.0%) |
| Coal or Coke | 0 (0.0%) | 0 (0.0%) |
| All other Fuels | 1 (0.0%) | 0 (0.0%) |
| No Fuel Used | 0 (0.0%) | 36 (1.7%) |
| Total | 2,266 (100.0%) | 2,157 (100.0%) |
Household Vehicle Usage in Union City
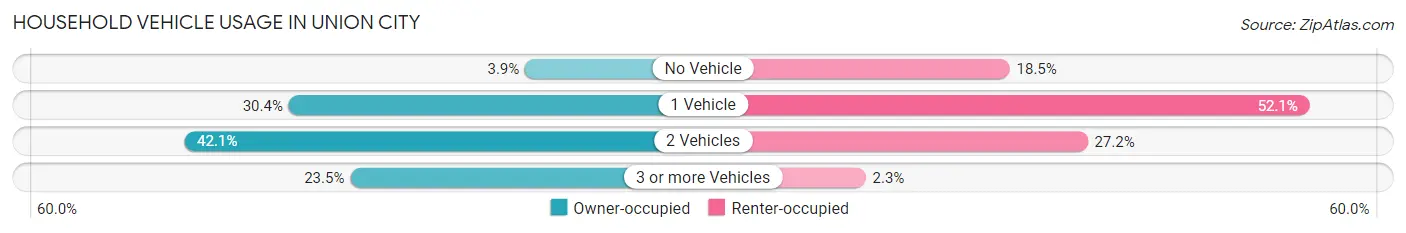
| Vehicles per Household | Owner-occupied | Renter-occupied |
| No Vehicle | 89 (3.9%) | 398 (18.4%) |
| 1 Vehicle | 689 (30.4%) | 1,123 (52.1%) |
| 2 Vehicles | 955 (42.1%) | 586 (27.2%) |
| 3 or more Vehicles | 533 (23.5%) | 50 (2.3%) |
| Total | 2,266 (100.0%) | 2,157 (100.0%) |
Real Estate & Mortgages in Union City
Real Estate and Mortgage Overview in Union City
| Characteristic | Without Mortgage | With Mortgage |
| Housing Units | 929 | 1,337 |
| Median Property Value | $132,100 | $137,400 |
| Median Household Income | $43,750 | $327 |
| Monthly Housing Costs | $425 | $13 |
| Real Estate Taxes | $1,073 | $0 |
Property Value by Mortgage Status in Union City
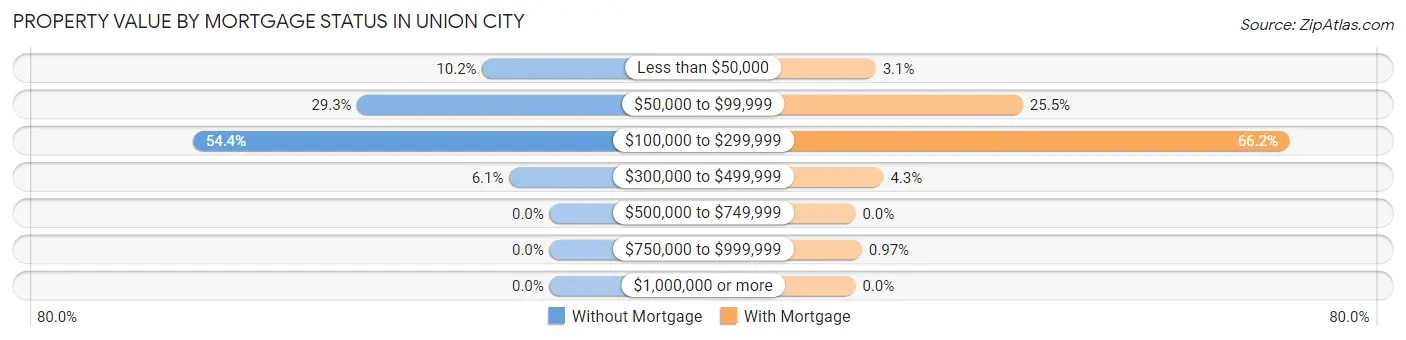
| Property Value | Without Mortgage | With Mortgage |
| Less than $50,000 | 95 (10.2%) | 41 (3.1%) |
| $50,000 to $99,999 | 272 (29.3%) | 341 (25.5%) |
| $100,000 to $299,999 | 505 (54.4%) | 885 (66.2%) |
| $300,000 to $499,999 | 57 (6.1%) | 57 (4.3%) |
| $500,000 to $749,999 | 0 (0.0%) | 0 (0.0%) |
| $750,000 to $999,999 | 0 (0.0%) | 13 (1.0%) |
| $1,000,000 or more | 0 (0.0%) | 0 (0.0%) |
| Total | 929 (100.0%) | 1,337 (100.0%) |
Household Income by Mortgage Status in Union City
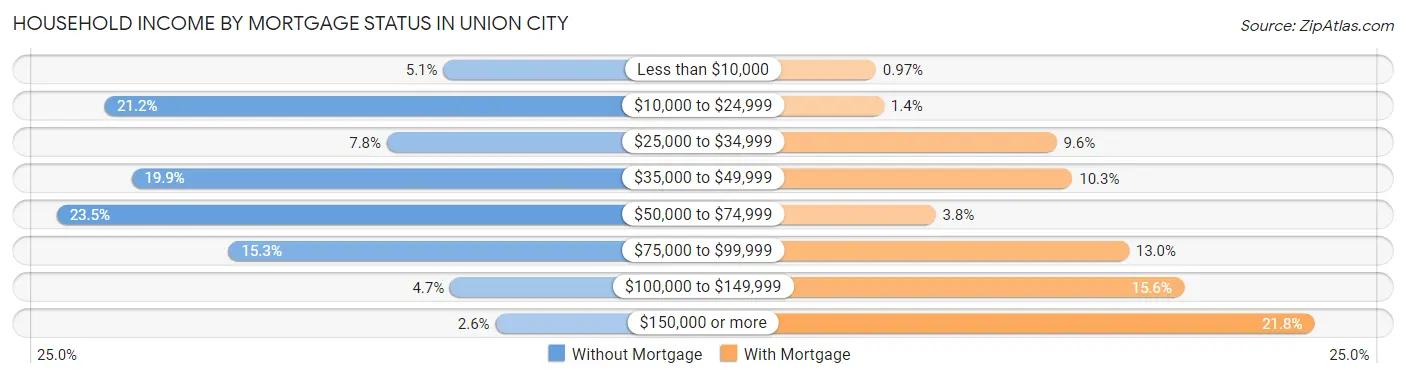
| Household Income | Without Mortgage | With Mortgage |
| Less than $10,000 | 47 (5.1%) | 13 (1.0%) |
| $10,000 to $24,999 | 197 (21.2%) | 18 (1.3%) |
| $25,000 to $34,999 | 72 (7.7%) | 128 (9.6%) |
| $35,000 to $49,999 | 185 (19.9%) | 138 (10.3%) |
| $50,000 to $74,999 | 218 (23.5%) | 51 (3.8%) |
| $75,000 to $99,999 | 142 (15.3%) | 174 (13.0%) |
| $100,000 to $149,999 | 44 (4.7%) | 209 (15.6%) |
| $150,000 or more | 24 (2.6%) | 292 (21.8%) |
| Total | 929 (100.0%) | 1,337 (100.0%) |
Property Value to Household Income Ratio in Union City
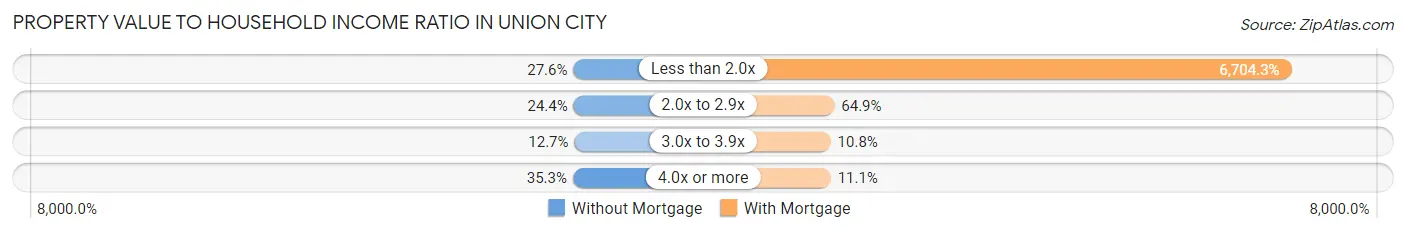
| Value-to-Income Ratio | Without Mortgage | With Mortgage |
| Less than 2.0x | 256 (27.6%) | 89,637 (6,704.3%) |
| 2.0x to 2.9x | 227 (24.4%) | 868 (64.9%) |
| 3.0x to 3.9x | 118 (12.7%) | 144 (10.8%) |
| 4.0x or more | 328 (35.3%) | 148 (11.1%) |
| Total | 929 (100.0%) | 1,337 (100.0%) |
Real Estate Taxes by Mortgage Status in Union City
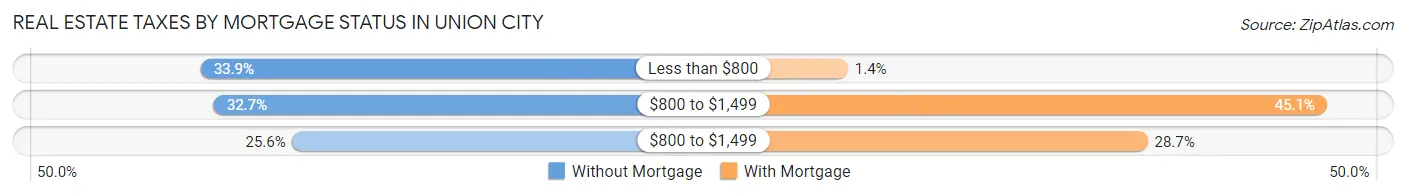
| Property Taxes | Without Mortgage | With Mortgage |
| Less than $800 | 315 (33.9%) | 18 (1.3%) |
| $800 to $1,499 | 304 (32.7%) | 603 (45.1%) |
| $800 to $1,499 | 238 (25.6%) | 384 (28.7%) |
| Total | 929 (100.0%) | 1,337 (100.0%) |
Health & Disability in Union City
Health Insurance Coverage by Age in Union City
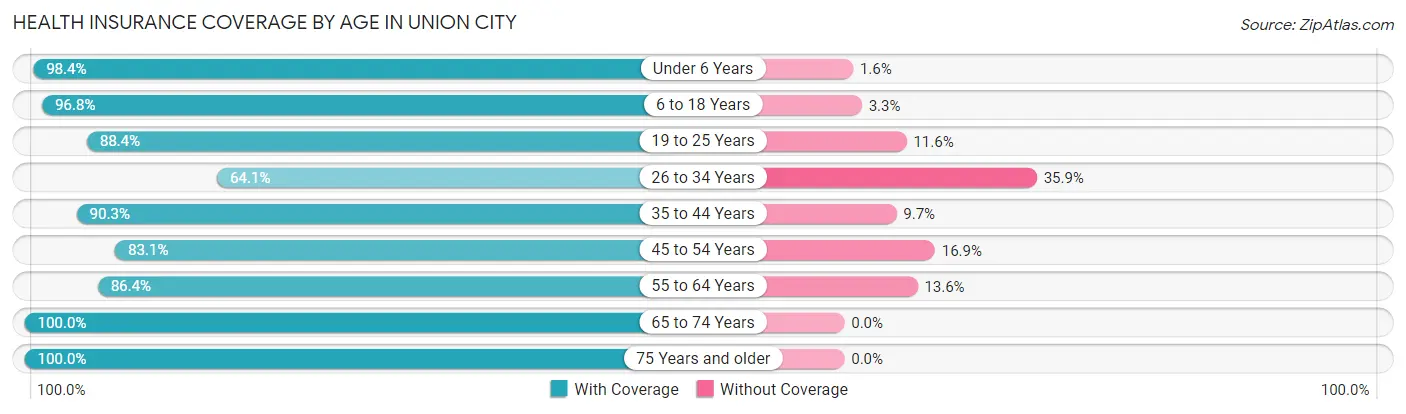
| Age Bracket | With Coverage | Without Coverage |
| Under 6 Years | 790 (98.4%) | 13 (1.6%) |
| 6 to 18 Years | 2,140 (96.8%) | 72 (3.3%) |
| 19 to 25 Years | 701 (88.4%) | 92 (11.6%) |
| 26 to 34 Years | 872 (64.1%) | 488 (35.9%) |
| 35 to 44 Years | 1,358 (90.3%) | 146 (9.7%) |
| 45 to 54 Years | 906 (83.1%) | 184 (16.9%) |
| 55 to 64 Years | 981 (86.4%) | 155 (13.6%) |
| 65 to 74 Years | 1,241 (100.0%) | 0 (0.0%) |
| 75 Years and older | 641 (100.0%) | 0 (0.0%) |
| Total | 9,630 (89.3%) | 1,150 (10.7%) |
Health Insurance Coverage by Citizenship Status in Union City
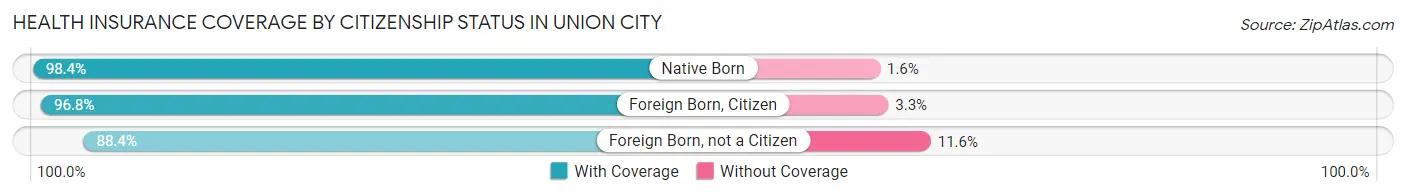
| Citizenship Status | With Coverage | Without Coverage |
| Native Born | 790 (98.4%) | 13 (1.6%) |
| Foreign Born, Citizen | 2,140 (96.8%) | 72 (3.3%) |
| Foreign Born, not a Citizen | 701 (88.4%) | 92 (11.6%) |
Health Insurance Coverage by Household Income in Union City
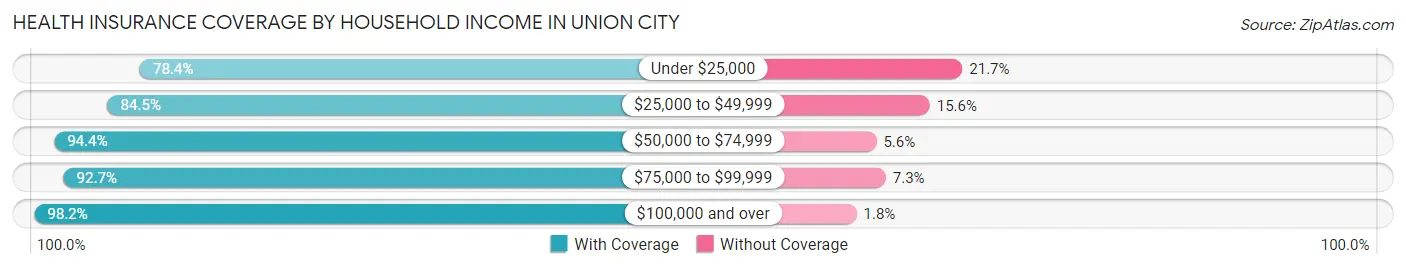
| Household Income | With Coverage | Without Coverage |
| Under $25,000 | 2,037 (78.3%) | 563 (21.6%) |
| $25,000 to $49,999 | 1,727 (84.5%) | 318 (15.5%) |
| $50,000 to $74,999 | 1,666 (94.4%) | 98 (5.6%) |
| $75,000 to $99,999 | 1,494 (92.7%) | 118 (7.3%) |
| $100,000 and over | 2,678 (98.2%) | 50 (1.8%) |
Public vs Private Health Insurance Coverage by Age in Union City
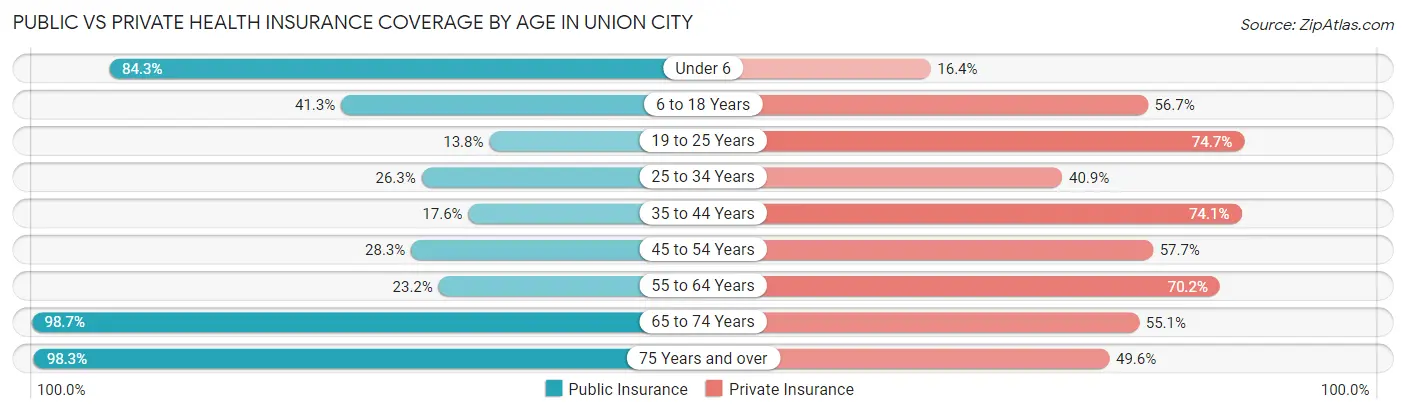
| Age Bracket | Public Insurance | Private Insurance |
| Under 6 | 677 (84.3%) | 132 (16.4%) |
| 6 to 18 Years | 913 (41.3%) | 1,255 (56.7%) |
| 19 to 25 Years | 109 (13.8%) | 592 (74.7%) |
| 25 to 34 Years | 358 (26.3%) | 556 (40.9%) |
| 35 to 44 Years | 265 (17.6%) | 1,115 (74.1%) |
| 45 to 54 Years | 308 (28.3%) | 629 (57.7%) |
| 55 to 64 Years | 263 (23.2%) | 797 (70.2%) |
| 65 to 74 Years | 1,225 (98.7%) | 684 (55.1%) |
| 75 Years and over | 630 (98.3%) | 318 (49.6%) |
| Total | 4,748 (44.0%) | 6,078 (56.4%) |
Disability Status by Sex by Age in Union City
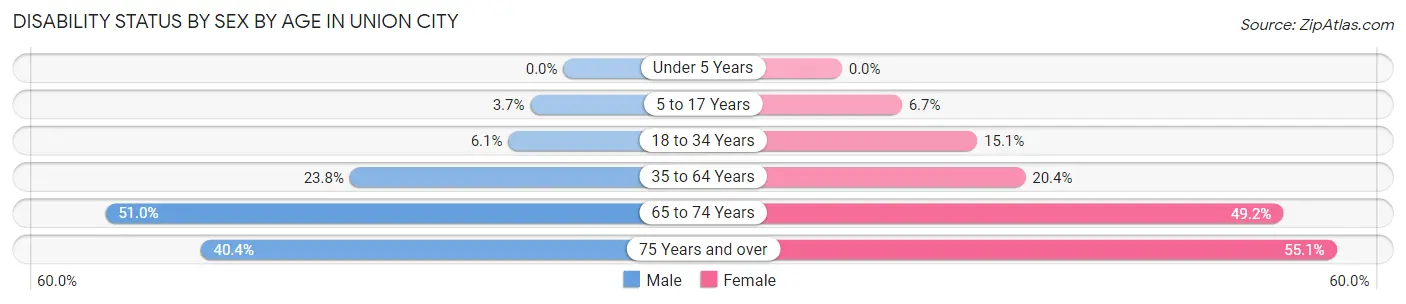
| Age Bracket | Male | Female |
| Under 5 Years | 0 (0.0%) | 0 (0.0%) |
| 5 to 17 Years | 43 (3.7%) | 68 (6.7%) |
| 18 to 34 Years | 55 (6.1%) | 215 (15.1%) |
| 35 to 64 Years | 402 (23.8%) | 417 (20.4%) |
| 65 to 74 Years | 275 (51.0%) | 345 (49.1%) |
| 75 Years and over | 80 (40.4%) | 244 (55.1%) |
Disability Class by Sex by Age in Union City
Disability Class: Hearing Difficulty
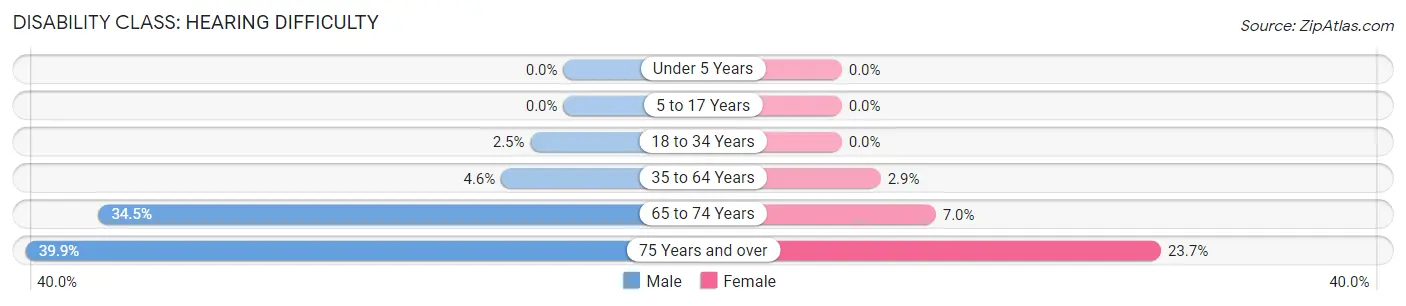
| Age Bracket | Male | Female |
| Under 5 Years | 0 (0.0%) | 0 (0.0%) |
| 5 to 17 Years | 0 (0.0%) | 0 (0.0%) |
| 18 to 34 Years | 22 (2.5%) | 0 (0.0%) |
| 35 to 64 Years | 78 (4.6%) | 59 (2.9%) |
| 65 to 74 Years | 186 (34.5%) | 49 (7.0%) |
| 75 Years and over | 79 (39.9%) | 105 (23.7%) |
Disability Class: Vision Difficulty
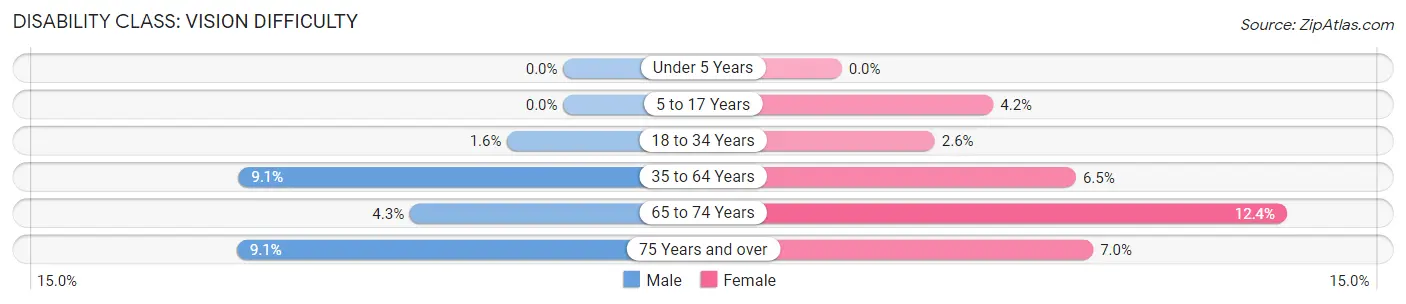
| Age Bracket | Male | Female |
| Under 5 Years | 0 (0.0%) | 0 (0.0%) |
| 5 to 17 Years | 0 (0.0%) | 43 (4.2%) |
| 18 to 34 Years | 14 (1.6%) | 37 (2.6%) |
| 35 to 64 Years | 153 (9.0%) | 133 (6.5%) |
| 65 to 74 Years | 23 (4.3%) | 87 (12.4%) |
| 75 Years and over | 18 (9.1%) | 31 (7.0%) |
Disability Class: Cognitive Difficulty
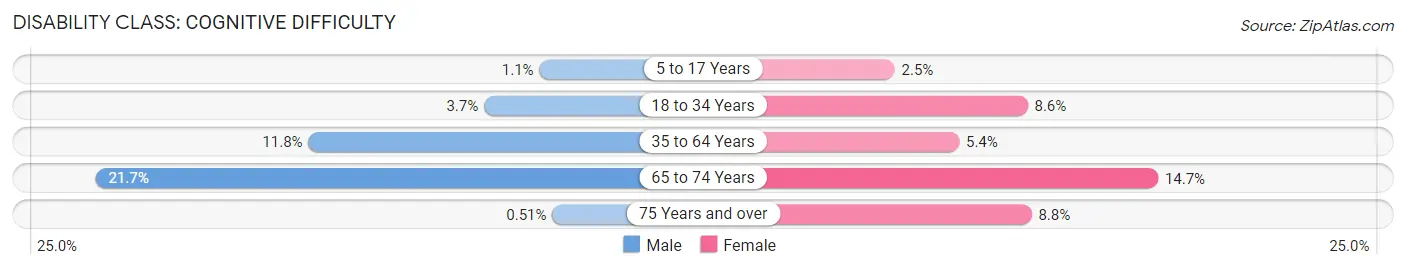
| Age Bracket | Male | Female |
| 5 to 17 Years | 13 (1.1%) | 25 (2.5%) |
| 18 to 34 Years | 33 (3.7%) | 123 (8.6%) |
| 35 to 64 Years | 200 (11.8%) | 111 (5.4%) |
| 65 to 74 Years | 117 (21.7%) | 103 (14.7%) |
| 75 Years and over | 1 (0.5%) | 39 (8.8%) |
Disability Class: Ambulatory Difficulty
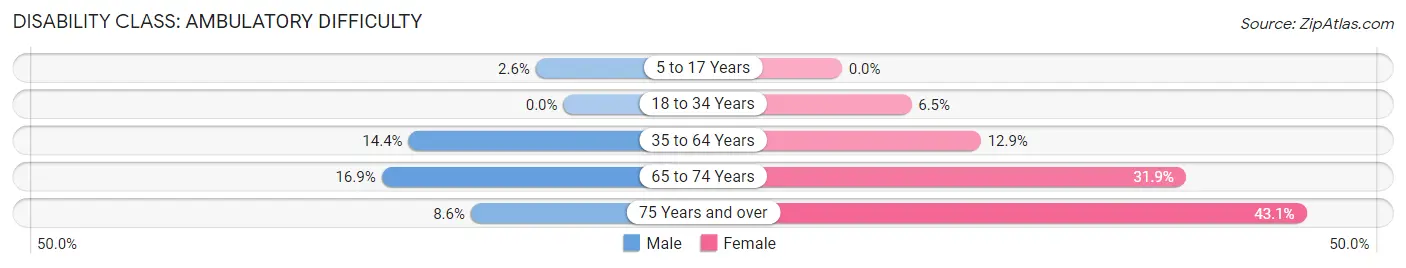
| Age Bracket | Male | Female |
| 5 to 17 Years | 30 (2.6%) | 0 (0.0%) |
| 18 to 34 Years | 0 (0.0%) | 92 (6.5%) |
| 35 to 64 Years | 243 (14.4%) | 263 (12.9%) |
| 65 to 74 Years | 91 (16.9%) | 224 (31.9%) |
| 75 Years and over | 17 (8.6%) | 191 (43.1%) |
Disability Class: Self-Care Difficulty
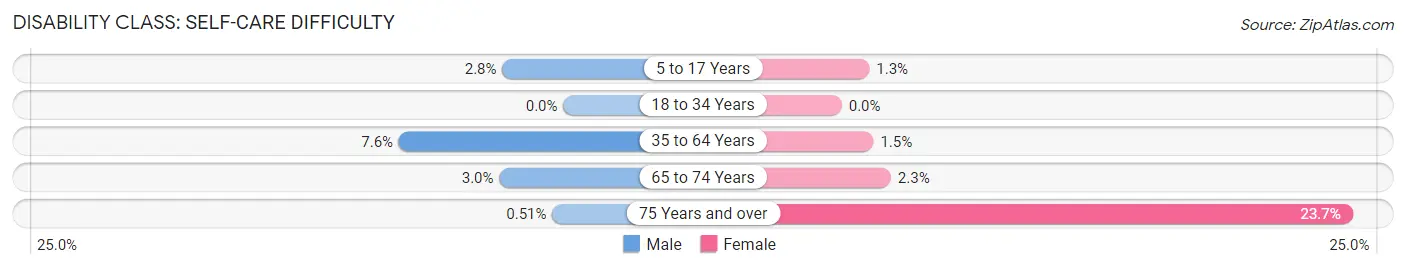
| Age Bracket | Male | Female |
| 5 to 17 Years | 33 (2.8%) | 13 (1.3%) |
| 18 to 34 Years | 0 (0.0%) | 0 (0.0%) |
| 35 to 64 Years | 129 (7.6%) | 30 (1.5%) |
| 65 to 74 Years | 16 (3.0%) | 16 (2.3%) |
| 75 Years and over | 1 (0.5%) | 105 (23.7%) |
Technology Access in Union City
Computing Device Access in Union City
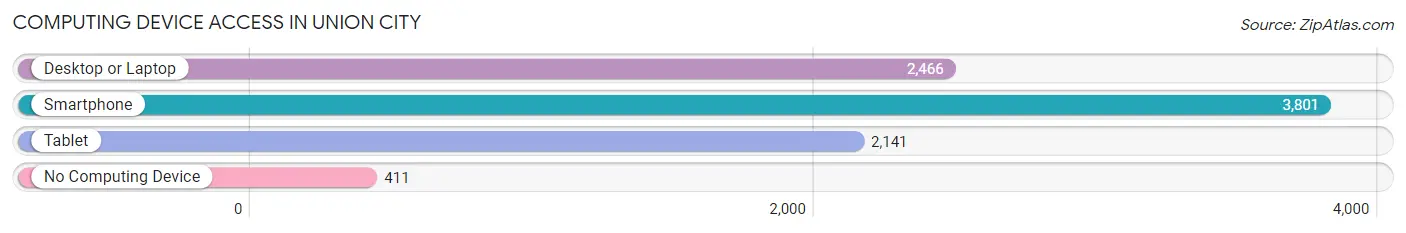
| Device Type | # Households | % Households |
| Desktop or Laptop | 2,466 | 55.7% |
| Smartphone | 3,801 | 85.9% |
| Tablet | 2,141 | 48.4% |
| No Computing Device | 411 | 9.3% |
| Total | 4,423 | 100.0% |
Internet Access in Union City
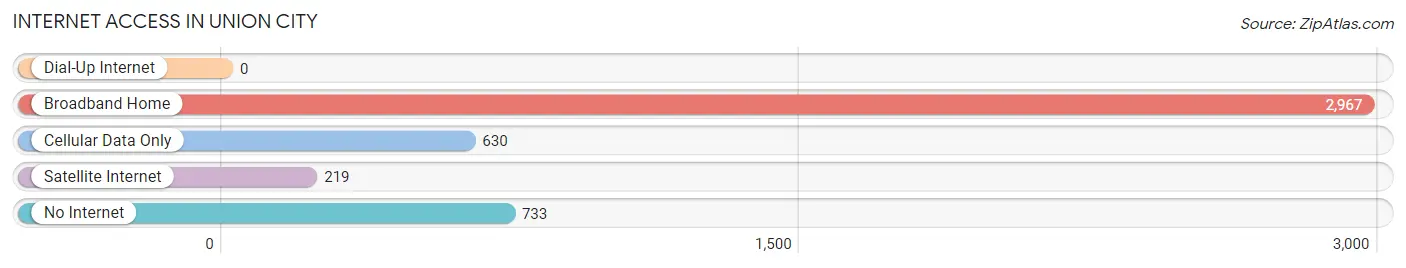
| Internet Type | # Households | % Households |
| Dial-Up Internet | 0 | 0.0% |
| Broadband Home | 2,967 | 67.1% |
| Cellular Data Only | 630 | 14.2% |
| Satellite Internet | 219 | 5.0% |
| No Internet | 733 | 16.6% |
| Total | 4,423 | 100.0% |
Union City Summary
Introduction
Union City is a city located in Obion County, Tennessee. It is the county seat of Obion County and is located along the Kentucky-Tennessee border. The city is situated in the northwest corner of Tennessee, approximately 30 miles north of Jackson, Tennessee and approximately 30 miles south of Paducah, Kentucky. Union City is the largest city in Obion County and is the principal city of the Union City, TN-KY Micropolitan Statistical Area, which includes all of Obion County, Tennessee and Fulton County, Kentucky.
History
Union City was founded in 1854 by the Union Land Company, which was formed by a group of investors from New York. The city was named after the Union Land Company and was originally known as Union Depot. The city was incorporated in 1859 and was the first city in Obion County.
The city was an important railroad hub during the Civil War and was the site of several battles. Union City was also the site of the Battle of Obion River, which was fought in 1862.
The city experienced a period of growth and prosperity in the late 19th and early 20th centuries. The city was home to several manufacturing plants, including a cotton mill, a shoe factory, and a furniture factory. The city also had a thriving business district, which included several banks, stores, and restaurants.
Geography
Union City is located in the northwest corner of Tennessee, approximately 30 miles north of Jackson, Tennessee and approximately 30 miles south of Paducah, Kentucky. The city is situated in the Obion River Valley and is surrounded by rolling hills and farmland. The city is located at the intersection of Interstate 40 and U.S. Route 51.
The city has a total area of 8.3 square miles, of which 8.2 square miles is land and 0.1 square miles is water. The city is located in the Central Time Zone and has a humid subtropical climate.
Economy
Union City has a diversified economy that is based on manufacturing, retail, and healthcare. The city is home to several manufacturing plants, including a cotton mill, a shoe factory, and a furniture factory. The city also has a thriving retail sector, which includes several banks, stores, and restaurants.
The city is also home to several healthcare facilities, including a hospital, a nursing home, and several medical clinics. The city is also home to several educational institutions, including a community college and a vocational school.
Demographics
As of the 2010 census, the city had a population of 10,895. The racial makeup of the city was 79.2% White, 17.3% African American, 0.4% Native American, 0.7% Asian, 0.1% Pacific Islander, 0.7% from other races, and 1.6% from two or more races. Hispanic or Latino of any race were 2.2% of the population.
The median income for a household in the city was $30,945, and the median income for a family was $37,945. The per capita income for the city was $17,845. About 17.3% of families and 20.2% of the population were below the poverty line, including 28.2% of those under age 18 and 16.2% of those age 65 or over.
Conclusion
Union City is a city located in Obion County, Tennessee. It is the county seat of Obion County and is located along the Kentucky-Tennessee border. The city is situated in the northwest corner of Tennessee, approximately 30 miles north of Jackson, Tennessee and approximately 30 miles south of Paducah, Kentucky. Union City is the largest city in Obion County and is the principal city of the Union City, TN-KY Micropolitan Statistical Area, which includes all of Obion County, Tennessee and Fulton County, Kentucky. The city has a diversified economy that is based on manufacturing, retail, and healthcare. As of the 2010 census, the city had a population of 10,895. The median income for a household in the city was $30,945, and the median income for a family was $37,945. The per capita income for the city was $17,845.
Common Questions
What is Per Capita Income in Union City?
Per Capita income in Union City is $23,959.
What is the Median Family Income in Union City?
Median Family Income in Union City is $70,924.
What is the Median Household income in Union City?
Median Household Income in Union City is $42,620.
What is Income or Wage Gap in Union City?
Income or Wage Gap in Union City is 17.0%.
Women in Union City earn 83.0 cents for every dollar earned by a man.
What is Inequality or Gini Index in Union City?
Inequality or Gini Index in Union City is 0.46.
What is the Total Population of Union City?
Total Population of Union City is 11,068.
What is the Total Male Population of Union City?
Total Male Population of Union City is 5,055.
What is the Total Female Population of Union City?
Total Female Population of Union City is 6,013.
What is the Ratio of Males per 100 Females in Union City?
There are 84.07 Males per 100 Females in Union City.
What is the Ratio of Females per 100 Males in Union City?
There are 118.95 Females per 100 Males in Union City.
What is the Median Population Age in Union City?
Median Population Age in Union City is 37.4 Years.
What is the Average Family Size in Union City
Average Family Size in Union City is 3.2 People.
What is the Average Household Size in Union City
Average Household Size in Union City is 2.4 People.
How Large is the Labor Force in Union City?
There are 5,143 People in the Labor Forcein in Union City.
What is the Percentage of People in the Labor Force in Union City?
60.3% of People are in the Labor Force in Union City.
What is the Unemployment Rate in Union City?
Unemployment Rate in Union City is 8.8%.