Lewisburg, TN Map & Demographics
Lewisburg Map
Lewisburg Overview
$26,266
PER CAPITA INCOME
$61,035
AVG FAMILY INCOME
$45,938
AVG HOUSEHOLD INCOME
24.6%
WAGE / INCOME GAP [ % ]
75.4¢/ $1
WAGE / INCOME GAP [ $ ]
$8,860
FAMILY INCOME DEFICIT
0.46
INEQUALITY / GINI INDEX
12,376
TOTAL POPULATION
6,201
MALE POPULATION
6,175
FEMALE POPULATION
100.42
MALES / 100 FEMALES
99.58
FEMALES / 100 MALES
33.0
MEDIAN AGE
3.3
AVG FAMILY SIZE
2.6
AVG HOUSEHOLD SIZE
5,678
LABOR FORCE [ PEOPLE ]
59.2%
PERCENT IN LABOR FORCE
7.9%
UNEMPLOYMENT RATE
Lewisburg Zip Codes
Lewisburg Area Codes
Income in Lewisburg
Income Overview in Lewisburg
Per Capita Income in Lewisburg is $26,266, while median incomes of families and households are $61,035 and $45,938 respectively.
| Characteristic | Number | Measure |
| Per Capita Income | 12,376 | $26,266 |
| Median Family Income | 2,873 | $61,035 |
| Mean Family Income | 2,873 | $75,302 |
| Median Household Income | 4,649 | $45,938 |
| Mean Household Income | 4,649 | $65,296 |
| Income Deficit | 2,873 | $8,860 |
| Wage / Income Gap (%) | 12,376 | 24.64% |
| Wage / Income Gap ($) | 12,376 | 75.36¢ per $1 |
| Gini / Inequality Index | 12,376 | 0.46 |
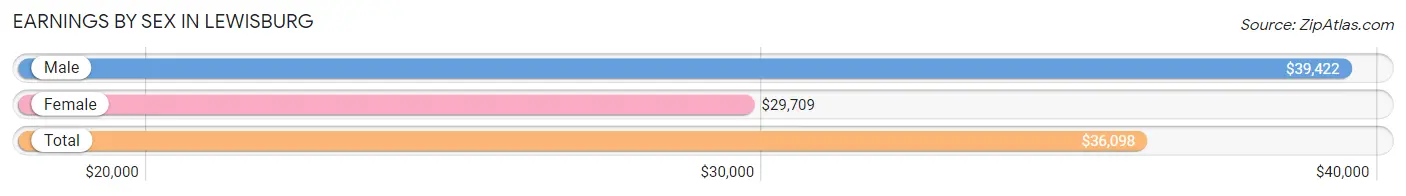
Earnings by Sex in Lewisburg
Average Earnings in Lewisburg are $36,098, $39,422 for men and $29,709 for women, a difference of 24.6%.
| Sex | Number | Average Earnings |
| Male | 3,078 (54.4%) | $39,422 |
| Female | 2,575 (45.6%) | $29,709 |
| Total | 5,653 (100.0%) | $36,098 |
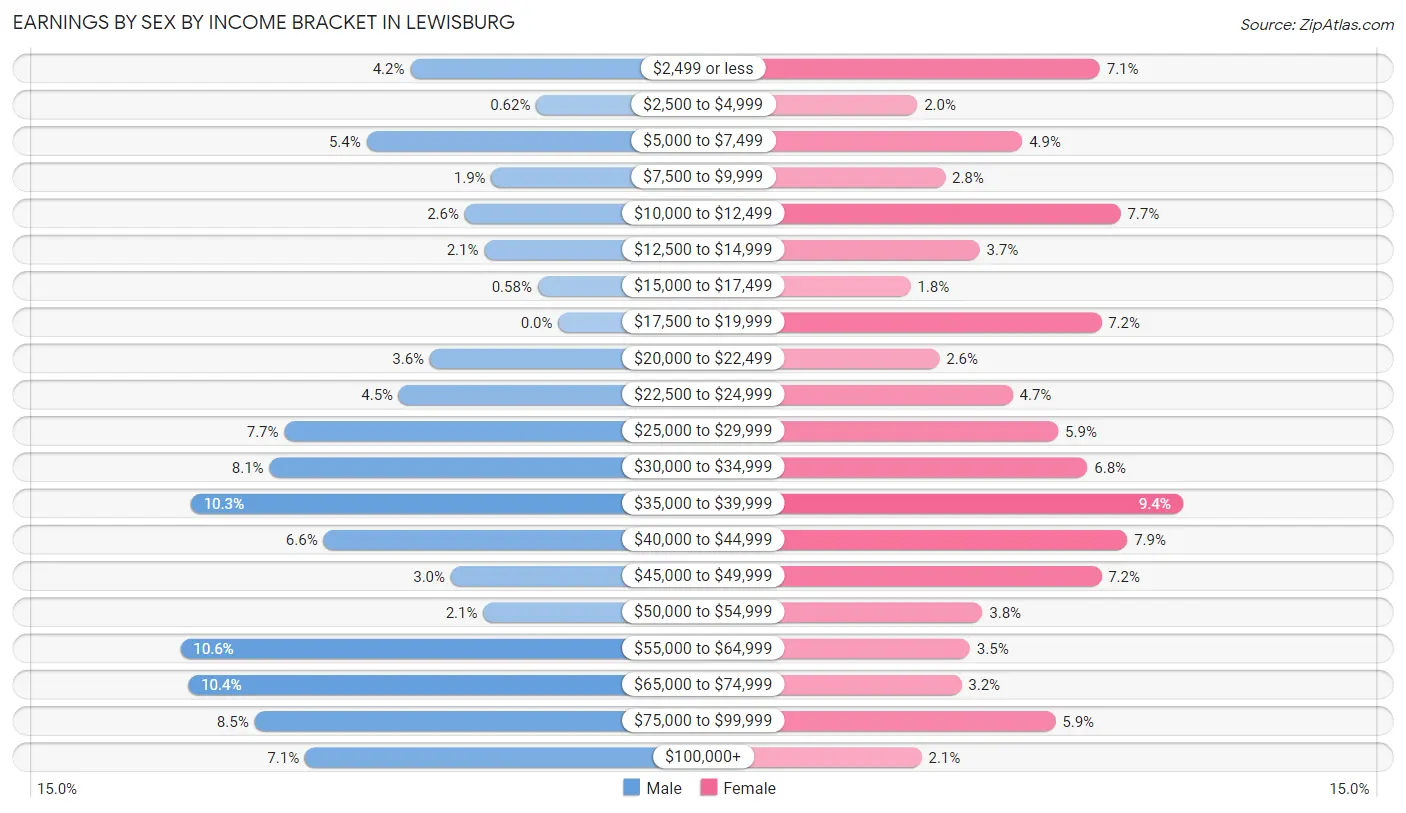
Earnings by Sex by Income Bracket in Lewisburg
The most common earnings brackets in Lewisburg are $55,000 to $64,999 for men (327 | 10.6%) and $35,000 to $39,999 for women (243 | 9.4%).
| Income | Male | Female |
| $2,499 or less | 128 (4.2%) | 183 (7.1%) |
| $2,500 to $4,999 | 19 (0.6%) | 51 (2.0%) |
| $5,000 to $7,499 | 166 (5.4%) | 127 (4.9%) |
| $7,500 to $9,999 | 58 (1.9%) | 71 (2.8%) |
| $10,000 to $12,499 | 81 (2.6%) | 198 (7.7%) |
| $12,500 to $14,999 | 64 (2.1%) | 96 (3.7%) |
| $15,000 to $17,499 | 18 (0.6%) | 46 (1.8%) |
| $17,500 to $19,999 | 0 (0.0%) | 184 (7.1%) |
| $20,000 to $22,499 | 111 (3.6%) | 67 (2.6%) |
| $22,500 to $24,999 | 138 (4.5%) | 120 (4.7%) |
| $25,000 to $29,999 | 237 (7.7%) | 153 (5.9%) |
| $30,000 to $34,999 | 250 (8.1%) | 174 (6.8%) |
| $35,000 to $39,999 | 318 (10.3%) | 243 (9.4%) |
| $40,000 to $44,999 | 203 (6.6%) | 203 (7.9%) |
| $45,000 to $49,999 | 93 (3.0%) | 184 (7.1%) |
| $50,000 to $54,999 | 65 (2.1%) | 98 (3.8%) |
| $55,000 to $64,999 | 327 (10.6%) | 89 (3.5%) |
| $65,000 to $74,999 | 320 (10.4%) | 83 (3.2%) |
| $75,000 to $99,999 | 263 (8.5%) | 151 (5.9%) |
| $100,000+ | 219 (7.1%) | 54 (2.1%) |
| Total | 3,078 (100.0%) | 2,575 (100.0%) |
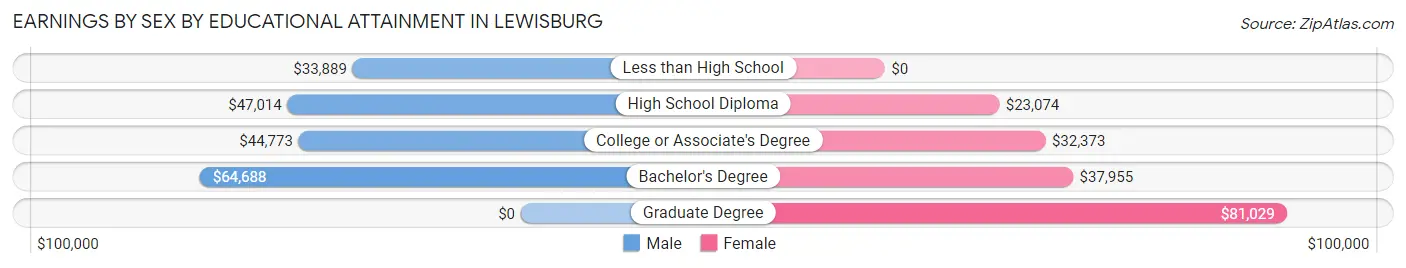
Earnings by Sex by Educational Attainment in Lewisburg
Average earnings in Lewisburg are $44,063 for men and $32,459 for women, a difference of 26.3%. Men with an educational attainment of bachelor's degree enjoy the highest average annual earnings of $64,688, while those with less than high school education earn the least with $33,889. Women with an educational attainment of graduate degree earn the most with the average annual earnings of $81,029, while those with high school diploma education have the smallest earnings of $23,074.
| Educational Attainment | Male Income | Female Income |
| Less than High School | $33,889 | $0 |
| High School Diploma | $47,014 | $23,074 |
| College or Associate's Degree | $44,773 | $32,373 |
| Bachelor's Degree | $64,688 | $37,955 |
| Graduate Degree | - | - |
| Total | $44,063 | $32,459 |
Family Income in Lewisburg
Family Income Brackets in Lewisburg
According to the Lewisburg family income data, there are 563 families falling into the $50,000 to $74,999 income range, which is the most common income bracket and makes up 19.6% of all families. Conversely, the $200,000+ income bracket is the least frequent group with only 118 families (4.1%) belonging to this category.
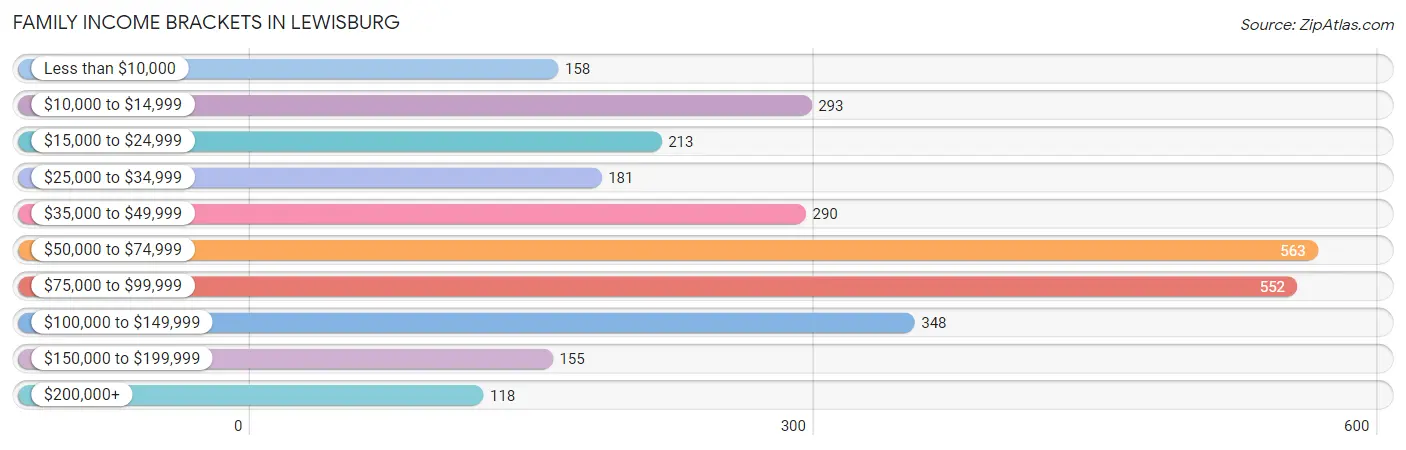
| Income Bracket | # Families | % Families |
| Less than $10,000 | 158 | 5.5% |
| $10,000 to $14,999 | 293 | 10.2% |
| $15,000 to $24,999 | 213 | 7.4% |
| $25,000 to $34,999 | 181 | 6.3% |
| $35,000 to $49,999 | 290 | 10.1% |
| $50,000 to $74,999 | 563 | 19.6% |
| $75,000 to $99,999 | 552 | 19.2% |
| $100,000 to $149,999 | 348 | 12.1% |
| $150,000 to $199,999 | 155 | 5.4% |
| $200,000+ | 118 | 4.1% |
Family Income by Famaliy Size in Lewisburg
4-person families (442 | 15.4%) account for the highest median family income in Lewisburg with $82,656 per family, while 2-person families (1,378 | 48.0%) have the highest median income of $27,776 per family member.
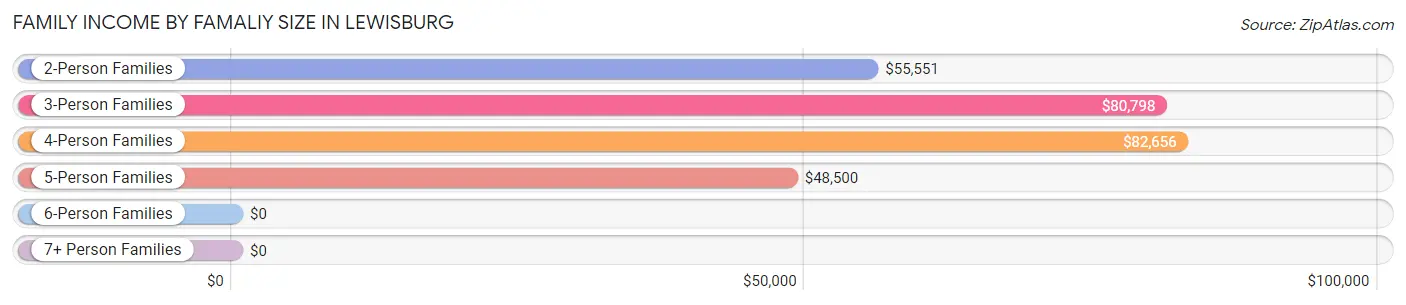
| Income Bracket | # Families | Median Income |
| 2-Person Families | 1,378 (48.0%) | $55,551 |
| 3-Person Families | 620 (21.6%) | $80,798 |
| 4-Person Families | 442 (15.4%) | $82,656 |
| 5-Person Families | 314 (10.9%) | $48,500 |
| 6-Person Families | 90 (3.1%) | $0 |
| 7+ Person Families | 29 (1.0%) | $0 |
| Total | 2,873 (100.0%) | $61,035 |
Family Income by Number of Earners in Lewisburg
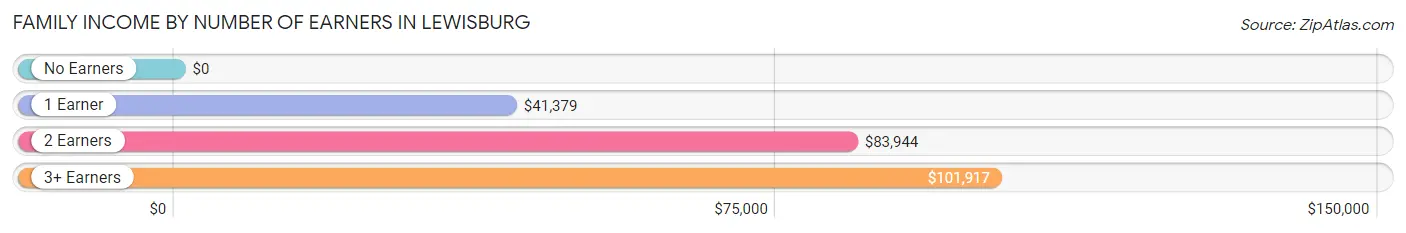
| Number of Earners | # Families | Median Income |
| No Earners | 439 (15.3%) | $0 |
| 1 Earner | 1,194 (41.6%) | $41,379 |
| 2 Earners | 951 (33.1%) | $83,944 |
| 3+ Earners | 289 (10.1%) | $101,917 |
| Total | 2,873 (100.0%) | $61,035 |
Household Income in Lewisburg
Household Income Brackets in Lewisburg
With 860 households falling in the category, the $35,000 to $49,999 income range is the most frequent in Lewisburg, accounting for 18.5% of all households. In contrast, only 149 households (3.2%) fall into the $200,000+ income bracket, making it the least populous group.
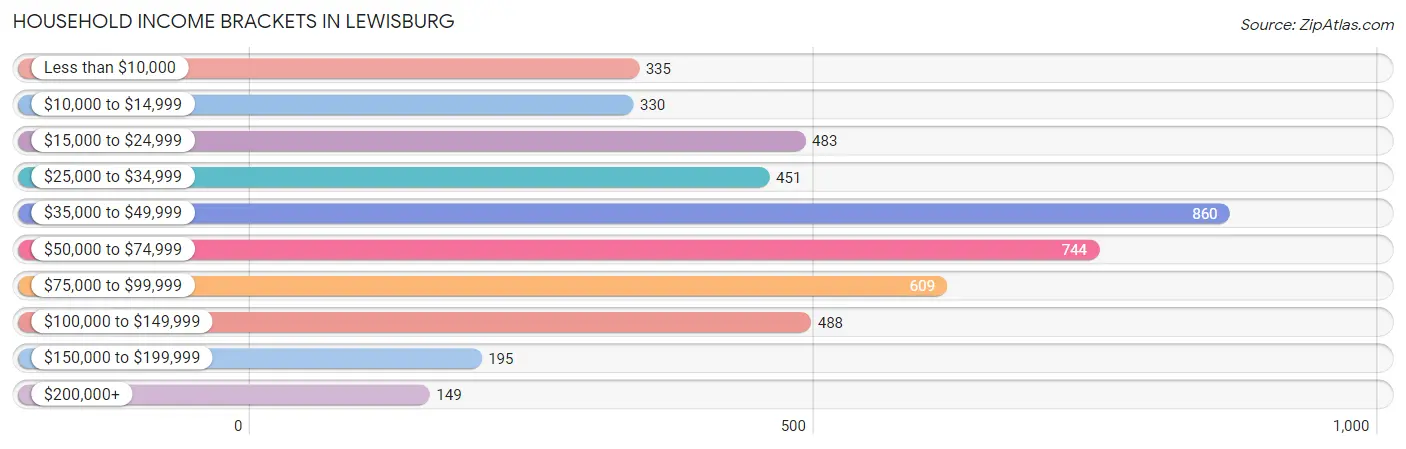
| Income Bracket | # Households | % Households |
| Less than $10,000 | 335 | 7.2% |
| $10,000 to $14,999 | 330 | 7.1% |
| $15,000 to $24,999 | 483 | 10.4% |
| $25,000 to $34,999 | 451 | 9.7% |
| $35,000 to $49,999 | 860 | 18.5% |
| $50,000 to $74,999 | 744 | 16.0% |
| $75,000 to $99,999 | 609 | 13.1% |
| $100,000 to $149,999 | 488 | 10.5% |
| $150,000 to $199,999 | 195 | 4.2% |
| $200,000+ | 149 | 3.2% |
Household Income by Householder Age in Lewisburg
The median household income in Lewisburg is $45,938, with the highest median household income of $55,363 found in the 45 to 64 years age bracket for the primary householder. A total of 1,621 households (34.9%) fall into this category. Meanwhile, the 15 to 24 years age bracket for the primary householder has the lowest median household income of $23,375, with 129 households (2.8%) in this group.
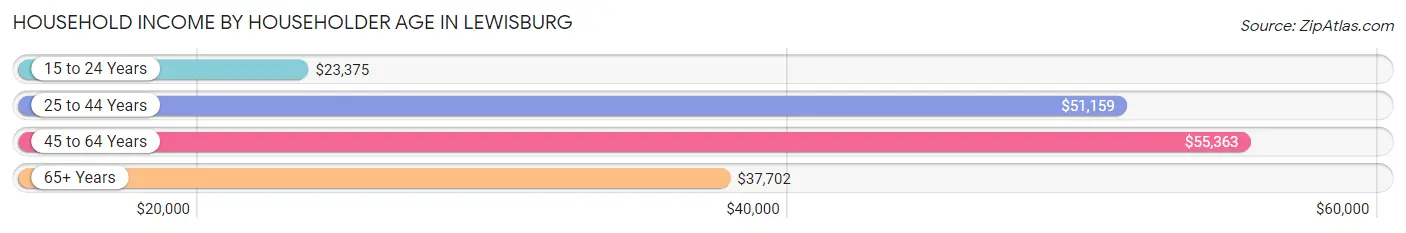
| Income Bracket | # Households | Median Income |
| 15 to 24 Years | 129 (2.8%) | $23,375 |
| 25 to 44 Years | 1,668 (35.9%) | $51,159 |
| 45 to 64 Years | 1,621 (34.9%) | $55,363 |
| 65+ Years | 1,231 (26.5%) | $37,702 |
| Total | 4,649 (100.0%) | $45,938 |
Poverty in Lewisburg
Income Below Poverty by Sex and Age in Lewisburg
With 21.8% poverty level for males and 27.5% for females among the residents of Lewisburg, 16 and 17 year old males and 5 year old females are the most vulnerable to poverty, with 130 males (63.4%) and 38 females (70.4%) in their respective age groups living below the poverty level.
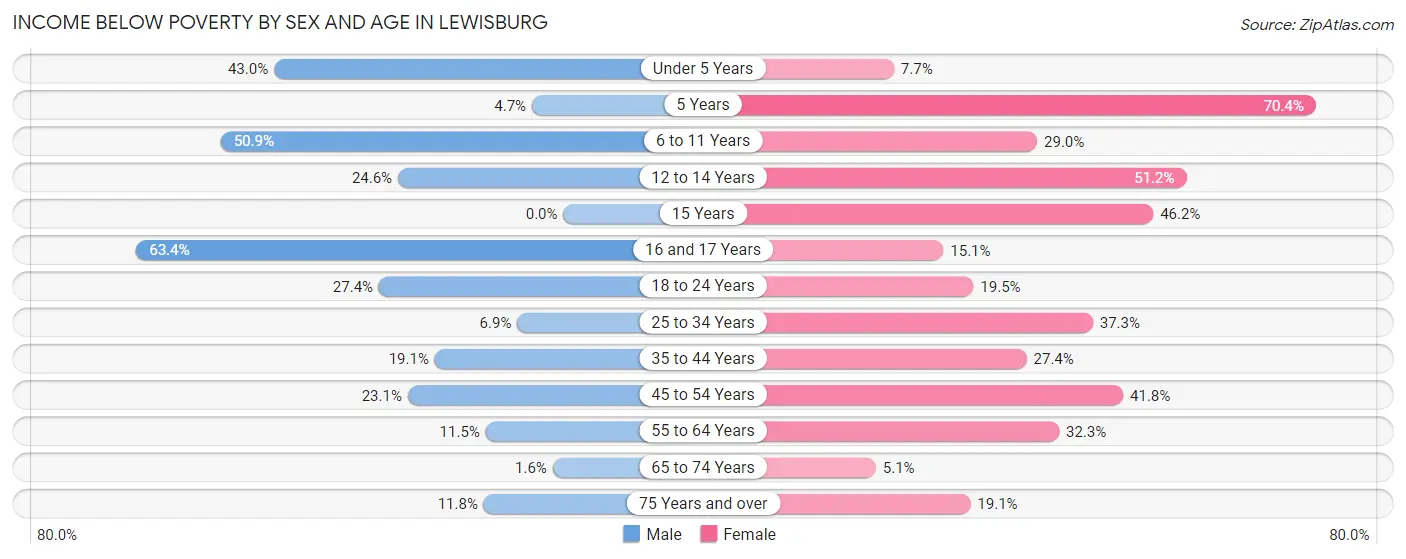
| Age Bracket | Male | Female |
| Under 5 Years | 165 (43.0%) | 25 (7.7%) |
| 5 Years | 5 (4.7%) | 38 (70.4%) |
| 6 to 11 Years | 320 (50.9%) | 134 (29.0%) |
| 12 to 14 Years | 70 (24.6%) | 89 (51.1%) |
| 15 Years | 0 (0.0%) | 43 (46.2%) |
| 16 and 17 Years | 130 (63.4%) | 30 (15.1%) |
| 18 to 24 Years | 163 (27.4%) | 120 (19.5%) |
| 25 to 34 Years | 60 (6.9%) | 420 (37.3%) |
| 35 to 44 Years | 131 (19.1%) | 180 (27.4%) |
| 45 to 54 Years | 113 (23.1%) | 203 (41.8%) |
| 55 to 64 Years | 77 (11.5%) | 264 (32.3%) |
| 65 to 74 Years | 9 (1.6%) | 30 (5.1%) |
| 75 Years and over | 37 (11.8%) | 81 (19.1%) |
| Total | 1,280 (21.8%) | 1,657 (27.5%) |
Income Above Poverty by Sex and Age in Lewisburg
According to the poverty statistics in Lewisburg, males aged 15 years and females aged 65 to 74 years are the age groups that are most secure financially, with 100.0% of males and 94.9% of females in these age groups living above the poverty line.
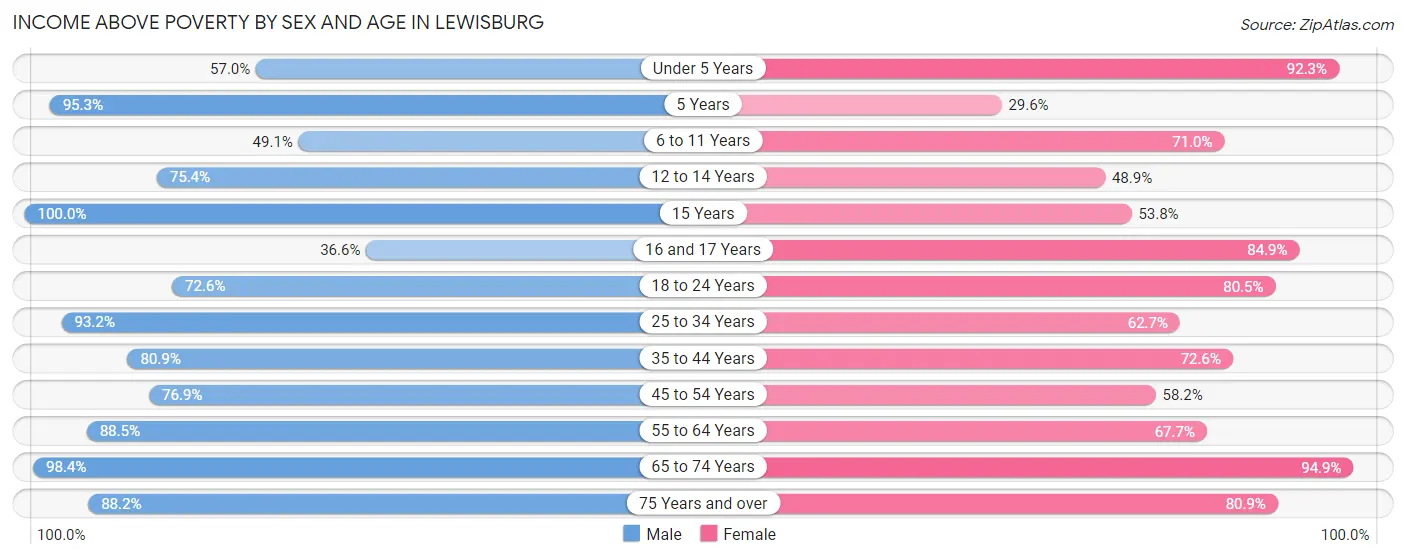
| Age Bracket | Male | Female |
| Under 5 Years | 219 (57.0%) | 298 (92.3%) |
| 5 Years | 102 (95.3%) | 16 (29.6%) |
| 6 to 11 Years | 309 (49.1%) | 328 (71.0%) |
| 12 to 14 Years | 215 (75.4%) | 85 (48.8%) |
| 15 Years | 61 (100.0%) | 50 (53.8%) |
| 16 and 17 Years | 75 (36.6%) | 169 (84.9%) |
| 18 to 24 Years | 432 (72.6%) | 494 (80.5%) |
| 25 to 34 Years | 816 (93.1%) | 707 (62.7%) |
| 35 to 44 Years | 555 (80.9%) | 476 (72.6%) |
| 45 to 54 Years | 376 (76.9%) | 283 (58.2%) |
| 55 to 64 Years | 590 (88.5%) | 554 (67.7%) |
| 65 to 74 Years | 560 (98.4%) | 563 (94.9%) |
| 75 Years and over | 276 (88.2%) | 343 (80.9%) |
| Total | 4,586 (78.2%) | 4,366 (72.5%) |
Income Below Poverty Among Married-Couple Families in Lewisburg
The poverty statistics for married-couple families in Lewisburg show that 15.5% or 304 of the total 1,967 families live below the poverty line. Families with 3 or 4 children have the highest poverty rate of 57.5%, comprising of 103 families. On the other hand, families with 5 or more children have the lowest poverty rate of 0.0%, which includes 0 families.
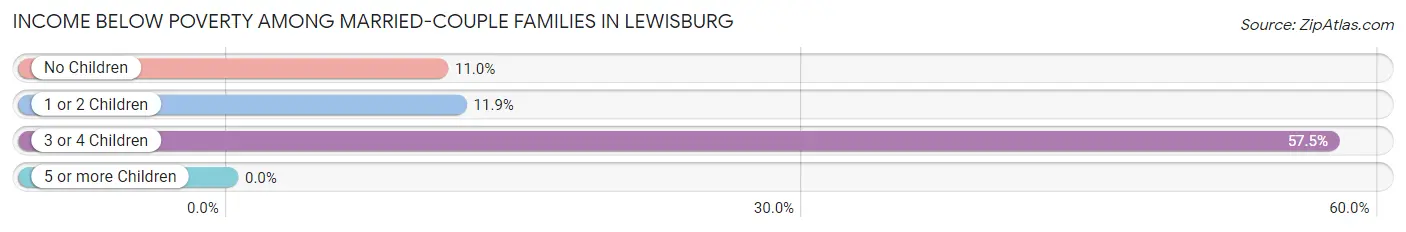
| Children | Above Poverty | Below Poverty |
| No Children | 1,031 (89.0%) | 127 (11.0%) |
| 1 or 2 Children | 546 (88.1%) | 74 (11.9%) |
| 3 or 4 Children | 76 (42.5%) | 103 (57.5%) |
| 5 or more Children | 10 (100.0%) | 0 (0.0%) |
| Total | 1,663 (84.5%) | 304 (15.5%) |
Income Below Poverty Among Single-Parent Households in Lewisburg
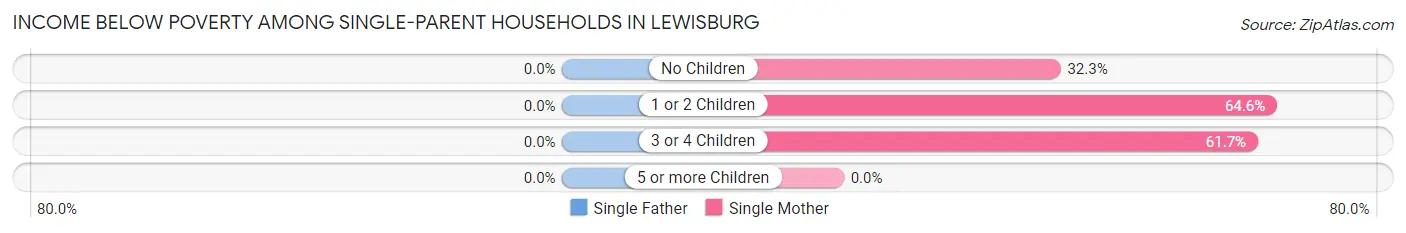
| Children | Single Father | Single Mother |
| No Children | 0 (0.0%) | 21 (32.3%) |
| 1 or 2 Children | 0 (0.0%) | 330 (64.6%) |
| 3 or 4 Children | 0 (0.0%) | 79 (61.7%) |
| 5 or more Children | 0 (0.0%) | 0 (0.0%) |
| Total | 0 (0.0%) | 430 (59.5%) |
Income Below Poverty Among Married-Couple vs Single-Parent Households in Lewisburg
The poverty data for Lewisburg shows that 304 of the married-couple family households (15.5%) and 430 of the single-parent households (47.5%) are living below the poverty level. Within the married-couple family households, those with 3 or 4 children have the highest poverty rate, with 103 households (57.5%) falling below the poverty line. Among the single-parent households, those with 1 or 2 children have the highest poverty rate, with 330 household (59.9%) living below poverty.
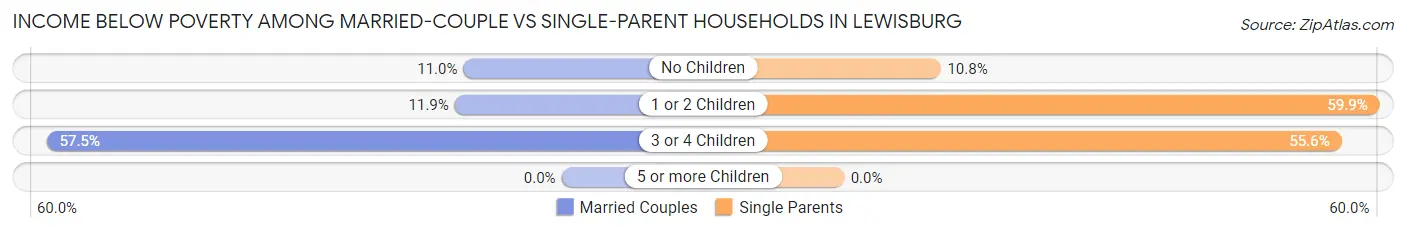
| Children | Married-Couple Families | Single-Parent Households |
| No Children | 127 (11.0%) | 21 (10.8%) |
| 1 or 2 Children | 74 (11.9%) | 330 (59.9%) |
| 3 or 4 Children | 103 (57.5%) | 79 (55.6%) |
| 5 or more Children | 0 (0.0%) | 0 (0.0%) |
| Total | 304 (15.5%) | 430 (47.5%) |
Race in Lewisburg
The most populous races in Lewisburg are White / Caucasian (10,376 | 83.8%), Hispanic or Latino (1,553 | 12.6%), and Black / African American (1,313 | 10.6%).
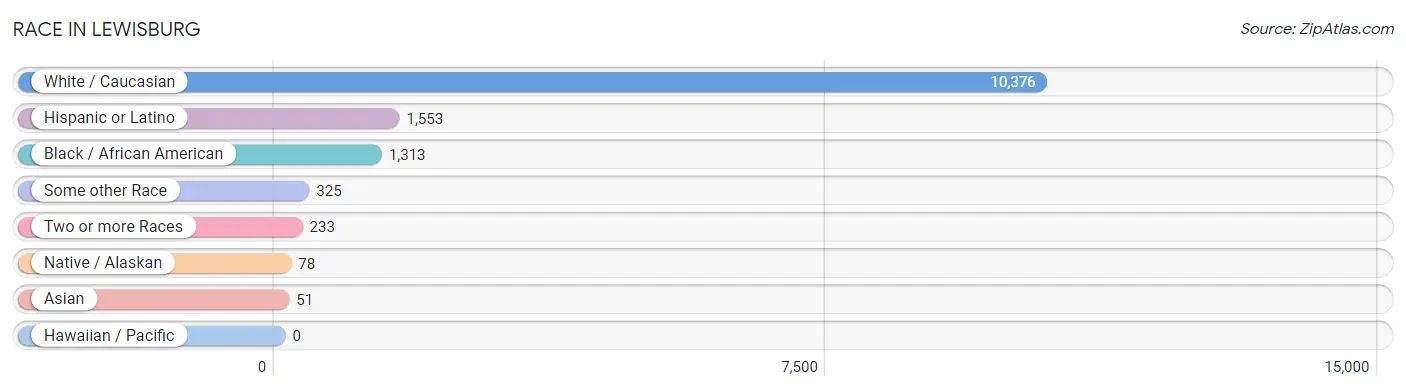
| Race | # Population | % Population |
| Asian | 51 | 0.4% |
| Black / African American | 1,313 | 10.6% |
| Hawaiian / Pacific | 0 | 0.0% |
| Hispanic or Latino | 1,553 | 12.6% |
| Native / Alaskan | 78 | 0.6% |
| White / Caucasian | 10,376 | 83.8% |
| Two or more Races | 233 | 1.9% |
| Some other Race | 325 | 2.6% |
| Total | 12,376 | 100.0% |
Ancestry in Lewisburg
The most populous ancestries reported in Lewisburg are American (3,421 | 27.6%), Mexican (1,374 | 11.1%), Irish (1,211 | 9.8%), English (891 | 7.2%), and German (722 | 5.8%), together accounting for 61.6% of all Lewisburg residents.
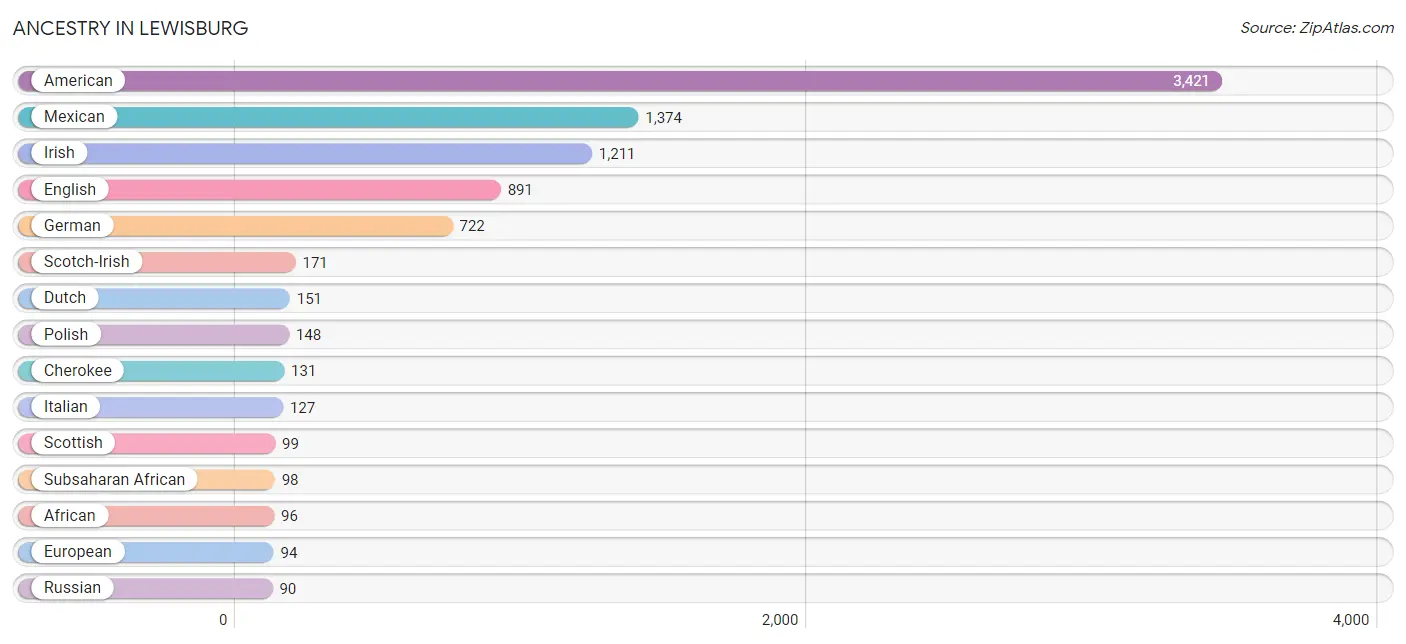
| Ancestry | # Population | % Population |
| African | 96 | 0.8% |
| American | 3,421 | 27.6% |
| Arab | 12 | 0.1% |
| Armenian | 24 | 0.2% |
| Central American | 62 | 0.5% |
| Cherokee | 131 | 1.1% |
| Colombian | 63 | 0.5% |
| Dutch | 151 | 1.2% |
| English | 891 | 7.2% |
| European | 94 | 0.8% |
| French | 88 | 0.7% |
| German | 722 | 5.8% |
| Greek | 8 | 0.1% |
| Haitian | 28 | 0.2% |
| Hungarian | 3 | 0.0% |
| Indian (Asian) | 19 | 0.2% |
| Irish | 1,211 | 9.8% |
| Italian | 127 | 1.0% |
| Korean | 30 | 0.2% |
| Lebanese | 12 | 0.1% |
| Malaysian | 34 | 0.3% |
| Mexican | 1,374 | 11.1% |
| Native Hawaiian | 19 | 0.2% |
| Navajo | 59 | 0.5% |
| Nicaraguan | 62 | 0.5% |
| Northern European | 9 | 0.1% |
| Norwegian | 69 | 0.6% |
| Polish | 148 | 1.2% |
| Portuguese | 23 | 0.2% |
| Puerto Rican | 1 | 0.0% |
| Russian | 90 | 0.7% |
| Scandinavian | 8 | 0.1% |
| Scotch-Irish | 171 | 1.4% |
| Scottish | 99 | 0.8% |
| South American | 63 | 0.5% |
| Subsaharan African | 98 | 0.8% |
| Swedish | 35 | 0.3% |
| Ugandan | 2 | 0.0% |
| Welsh | 35 | 0.3% | View All 39 Rows |
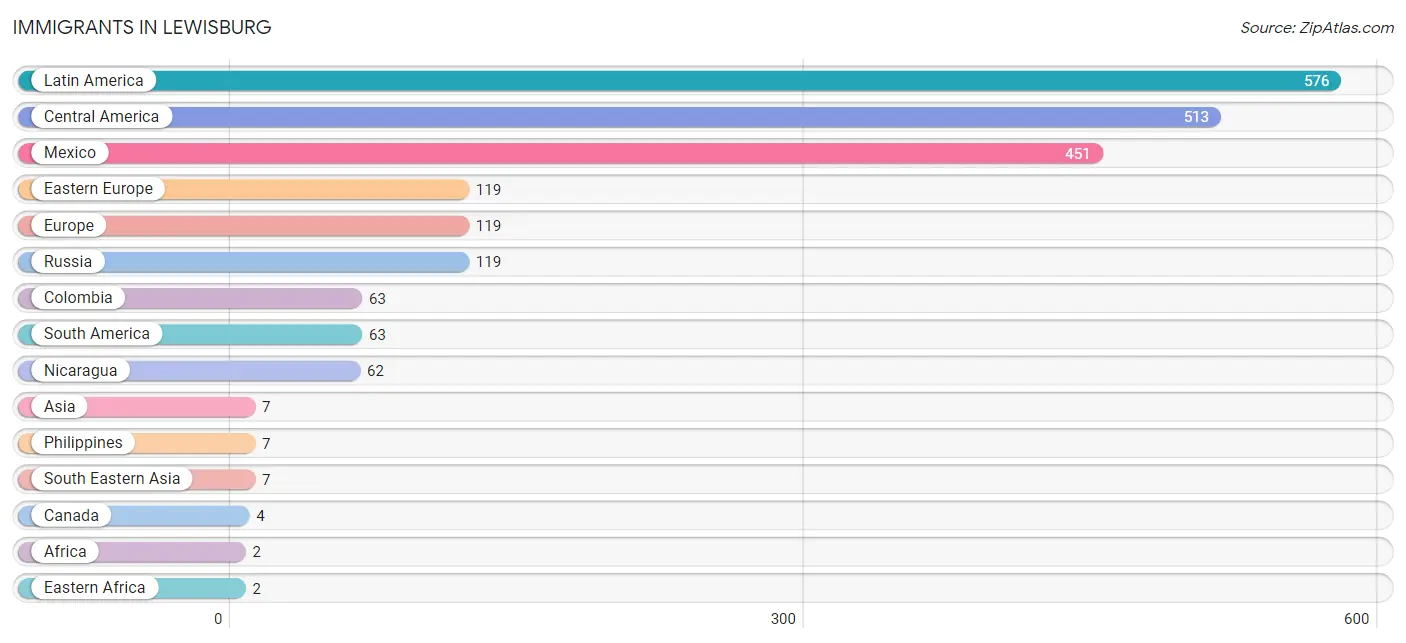
Immigrants in Lewisburg
The most numerous immigrant groups reported in Lewisburg came from Latin America (576 | 4.6%), Central America (513 | 4.2%), Mexico (451 | 3.6%), Eastern Europe (119 | 1.0%), and Europe (119 | 1.0%), together accounting for 14.4% of all Lewisburg residents.
| Immigration Origin | # Population | % Population |
| Africa | 2 | 0.0% |
| Asia | 7 | 0.1% |
| Canada | 4 | 0.0% |
| Central America | 513 | 4.2% |
| Colombia | 63 | 0.5% |
| Eastern Africa | 2 | 0.0% |
| Eastern Europe | 119 | 1.0% |
| Europe | 119 | 1.0% |
| Latin America | 576 | 4.6% |
| Mexico | 451 | 3.6% |
| Nicaragua | 62 | 0.5% |
| Philippines | 7 | 0.1% |
| Russia | 119 | 1.0% |
| South America | 63 | 0.5% |
| South Eastern Asia | 7 | 0.1% |
| Uganda | 2 | 0.0% | View All 16 Rows |
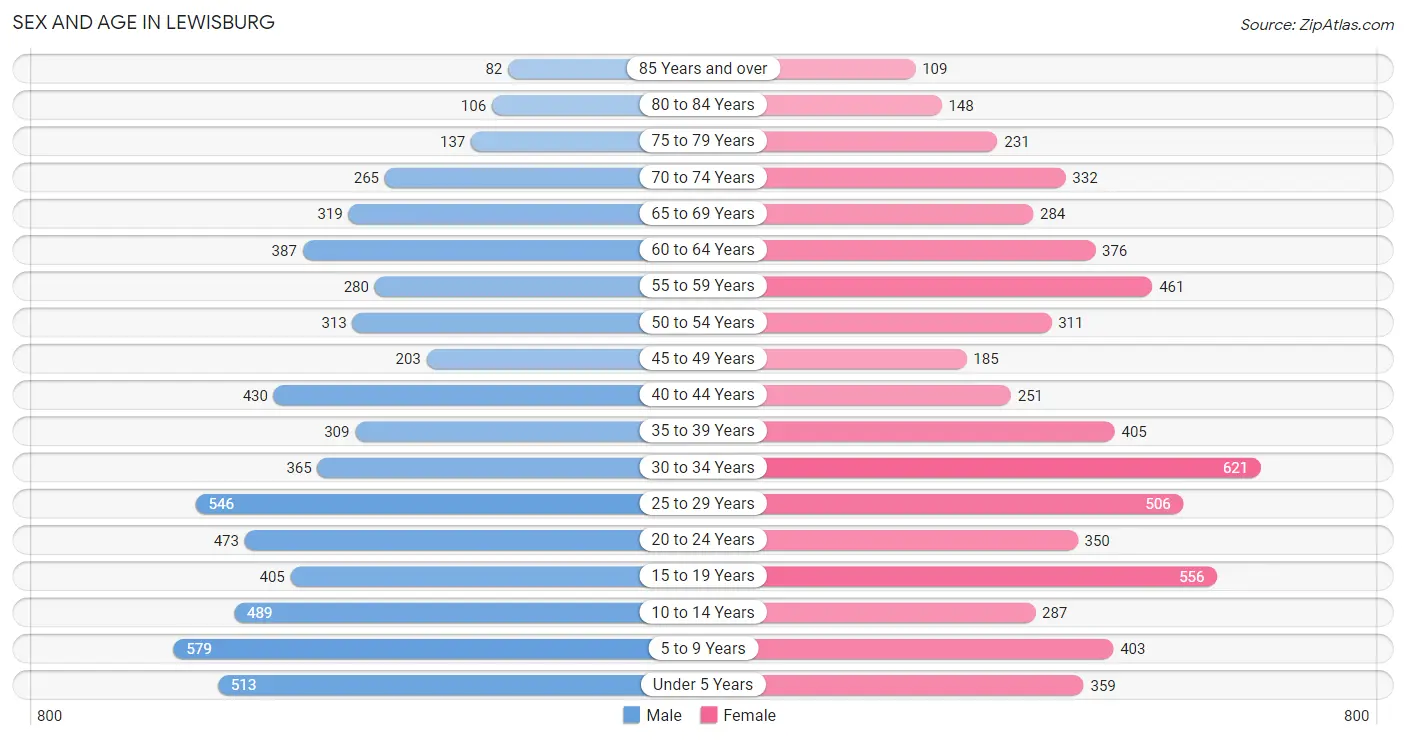
Sex and Age in Lewisburg
Sex and Age in Lewisburg
The most populous age groups in Lewisburg are 5 to 9 Years (579 | 9.3%) for men and 30 to 34 Years (621 | 10.1%) for women.
| Age Bracket | Male | Female |
| Under 5 Years | 513 (8.3%) | 359 (5.8%) |
| 5 to 9 Years | 579 (9.3%) | 403 (6.5%) |
| 10 to 14 Years | 489 (7.9%) | 287 (4.6%) |
| 15 to 19 Years | 405 (6.5%) | 556 (9.0%) |
| 20 to 24 Years | 473 (7.6%) | 350 (5.7%) |
| 25 to 29 Years | 546 (8.8%) | 506 (8.2%) |
| 30 to 34 Years | 365 (5.9%) | 621 (10.1%) |
| 35 to 39 Years | 309 (5.0%) | 405 (6.6%) |
| 40 to 44 Years | 430 (6.9%) | 251 (4.1%) |
| 45 to 49 Years | 203 (3.3%) | 185 (3.0%) |
| 50 to 54 Years | 313 (5.1%) | 311 (5.0%) |
| 55 to 59 Years | 280 (4.5%) | 461 (7.5%) |
| 60 to 64 Years | 387 (6.2%) | 376 (6.1%) |
| 65 to 69 Years | 319 (5.1%) | 284 (4.6%) |
| 70 to 74 Years | 265 (4.3%) | 332 (5.4%) |
| 75 to 79 Years | 137 (2.2%) | 231 (3.7%) |
| 80 to 84 Years | 106 (1.7%) | 148 (2.4%) |
| 85 Years and over | 82 (1.3%) | 109 (1.8%) |
| Total | 6,201 (100.0%) | 6,175 (100.0%) |
Families and Households in Lewisburg
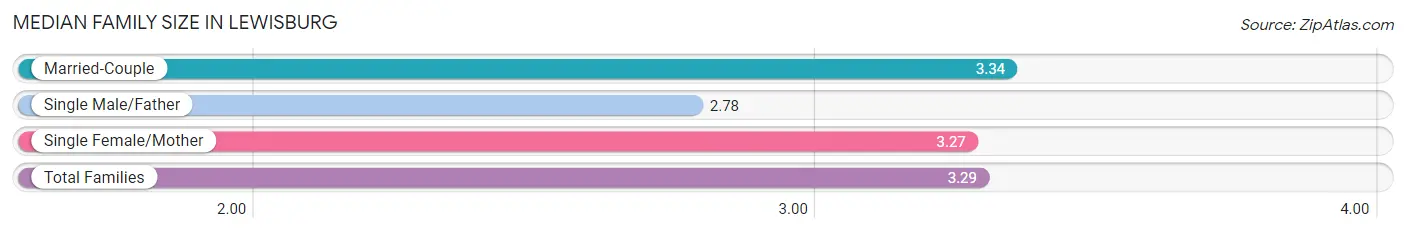
Median Family Size in Lewisburg
The median family size in Lewisburg is 3.29 persons per family, with married-couple families (1,967 | 68.5%) accounting for the largest median family size of 3.34 persons per family. On the other hand, single male/father families (183 | 6.4%) represent the smallest median family size with 2.78 persons per family.
| Family Type | # Families | Family Size |
| Married-Couple | 1,967 (68.5%) | 3.34 |
| Single Male/Father | 183 (6.4%) | 2.78 |
| Single Female/Mother | 723 (25.2%) | 3.27 |
| Total Families | 2,873 (100.0%) | 3.29 |
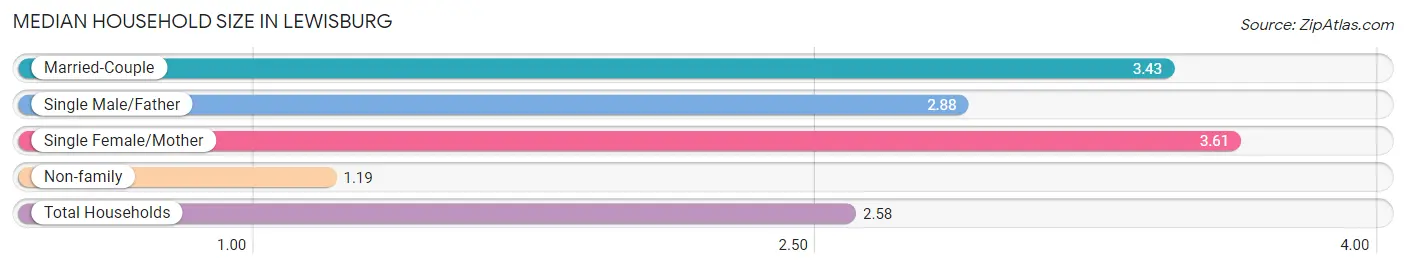
Median Household Size in Lewisburg
The median household size in Lewisburg is 2.58 persons per household, with single female/mother households (723 | 15.5%) accounting for the largest median household size of 3.61 persons per household. non-family households (1,776 | 38.2%) represent the smallest median household size with 1.19 persons per household.
| Household Type | # Households | Household Size |
| Married-Couple | 1,967 (42.3%) | 3.43 |
| Single Male/Father | 183 (3.9%) | 2.88 |
| Single Female/Mother | 723 (15.5%) | 3.61 |
| Non-family | 1,776 (38.2%) | 1.19 |
| Total Households | 4,649 (100.0%) | 2.58 |
Household Size by Marriage Status in Lewisburg
Out of a total of 4,649 households in Lewisburg, 2,873 (61.8%) are family households, while 1,776 (38.2%) are nonfamily households. The most numerous type of family households are 2-person households, comprising 1,192, and the most common type of nonfamily households are 1-person households, comprising 1,533.
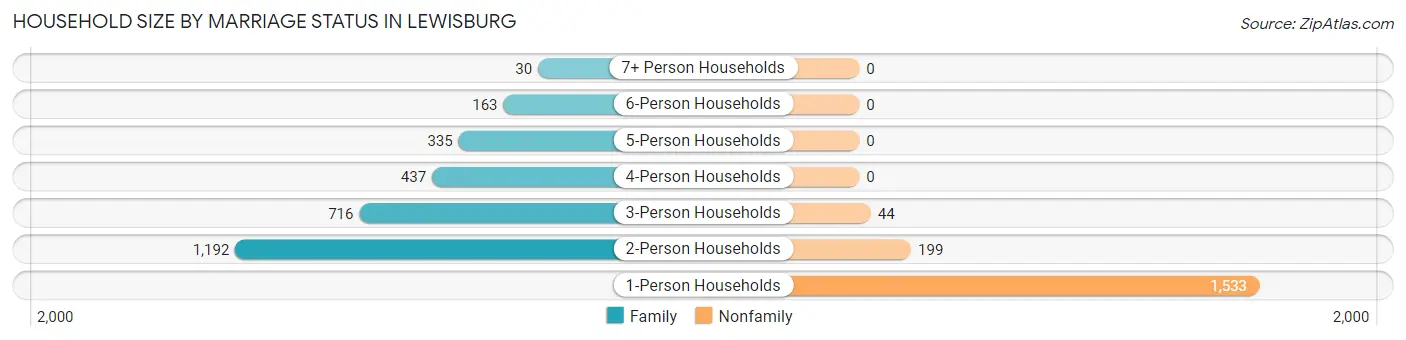
| Household Size | Family Households | Nonfamily Households |
| 1-Person Households | - | 1,533 (33.0%) |
| 2-Person Households | 1,192 (25.6%) | 199 (4.3%) |
| 3-Person Households | 716 (15.4%) | 44 (0.9%) |
| 4-Person Households | 437 (9.4%) | 0 (0.0%) |
| 5-Person Households | 335 (7.2%) | 0 (0.0%) |
| 6-Person Households | 163 (3.5%) | 0 (0.0%) |
| 7+ Person Households | 30 (0.6%) | 0 (0.0%) |
| Total | 2,873 (61.8%) | 1,776 (38.2%) |
Female Fertility in Lewisburg
Fertility by Age in Lewisburg
Average fertility rate in Lewisburg is 64.0 births per 1,000 women. Women in the age bracket of 15 to 19 years have the highest fertility rate with 138.0 births per 1,000 women. Women in the age bracket of 20 to 34 years acount for 48.2% of all women with births.
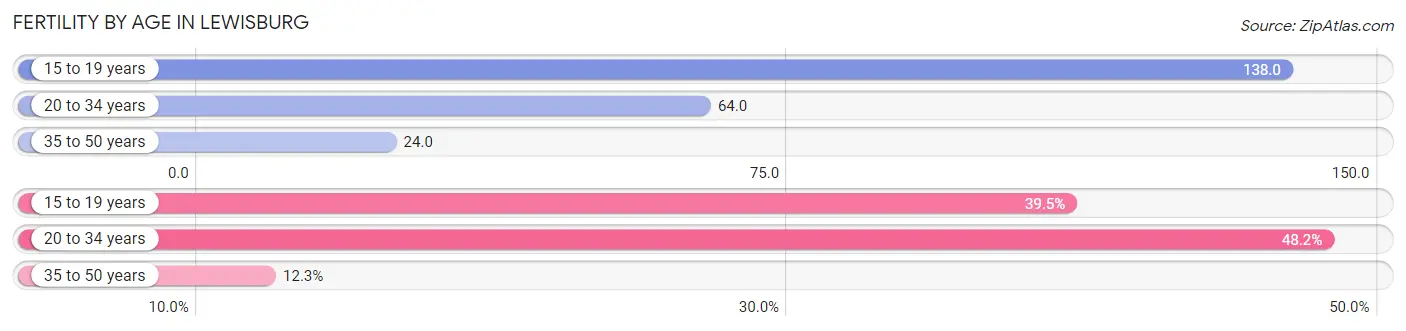
| Age Bracket | Women with Births | Births / 1,000 Women |
| 15 to 19 years | 77 (39.5%) | 138.0 |
| 20 to 34 years | 94 (48.2%) | 64.0 |
| 35 to 50 years | 24 (12.3%) | 24.0 |
| Total | 195 (100.0%) | 64.0 |
Fertility by Age by Marriage Status in Lewisburg
50.8% of women with births (195) in Lewisburg are married. The highest percentage of unmarried women with births falls into 15 to 19 years age bracket with 100.0% of them unmarried at the time of birth, while the lowest percentage of unmarried women with births belong to 35 to 50 years age bracket with 0.0% of them unmarried.
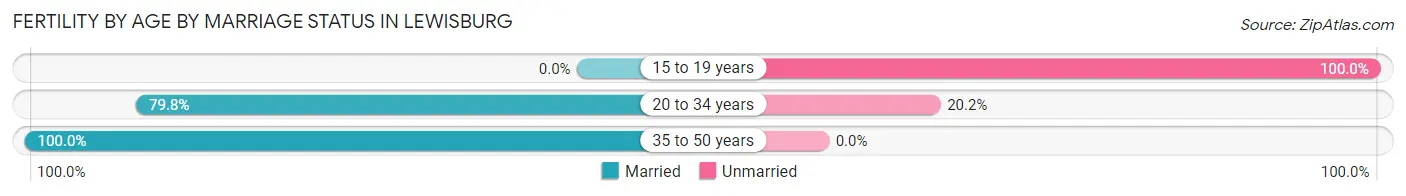
| Age Bracket | Married | Unmarried |
| 15 to 19 years | 0 (0.0%) | 77 (100.0%) |
| 20 to 34 years | 75 (79.8%) | 19 (20.2%) |
| 35 to 50 years | 24 (100.0%) | 0 (0.0%) |
| Total | 99 (50.8%) | 96 (49.2%) |
Fertility by Education in Lewisburg
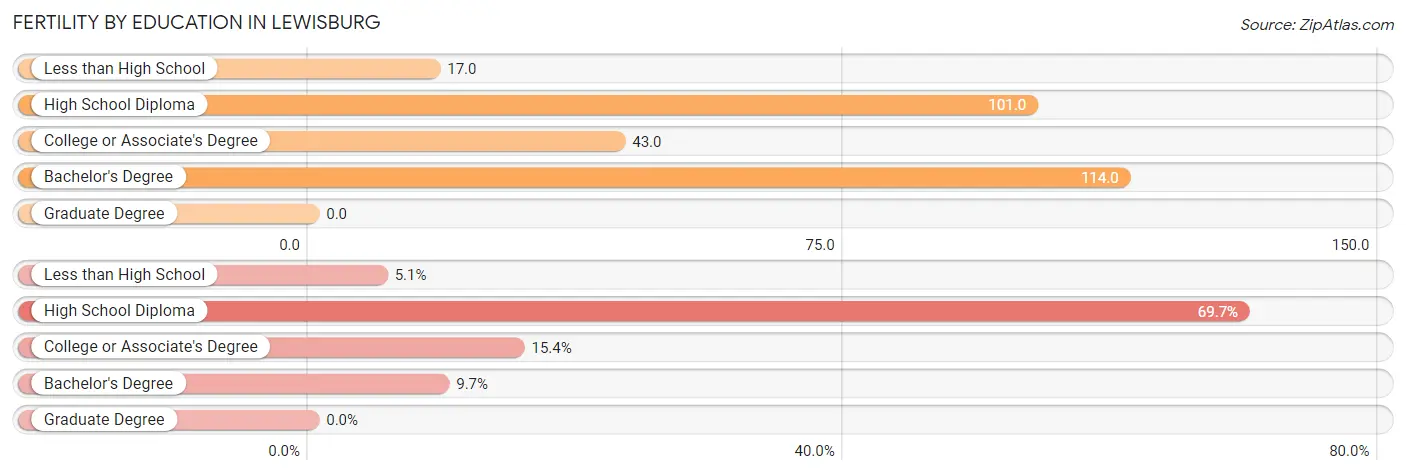
| Educational Attainment | Women with Births | Births / 1,000 Women |
| Less than High School | 10 (5.1%) | 17.0 |
| High School Diploma | 136 (69.7%) | 101.0 |
| College or Associate's Degree | 30 (15.4%) | 43.0 |
| Bachelor's Degree | 19 (9.7%) | 114.0 |
| Graduate Degree | 0 (0.0%) | 0.0 |
| Total | 195 (100.0%) | 64.0 |
Fertility by Education by Marriage Status in Lewisburg
49.2% of women with births in Lewisburg are unmarried. Women with the educational attainment of less than high school are most likely to be married with 100.0% of them married at childbirth, while women with the educational attainment of college or associate's degree are least likely to be married with 63.3% of them unmarried at childbirth.
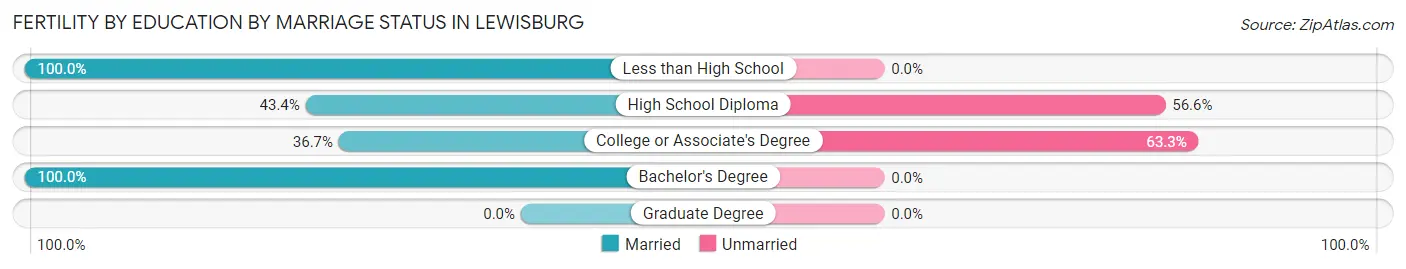
| Educational Attainment | Married | Unmarried |
| Less than High School | 10 (100.0%) | 0 (0.0%) |
| High School Diploma | 59 (43.4%) | 77 (56.6%) |
| College or Associate's Degree | 11 (36.7%) | 19 (63.3%) |
| Bachelor's Degree | 19 (100.0%) | 0 (0.0%) |
| Graduate Degree | 0 (0.0%) | 0 (0.0%) |
| Total | 99 (50.8%) | 96 (49.2%) |
Employment Characteristics in Lewisburg
Employment by Class of Employer in Lewisburg
Among the 4,913 employed individuals in Lewisburg, private company employees (3,521 | 71.7%), local government employees (580 | 11.8%), and self-employed (not incorporated) (290 | 5.9%) make up the most common classes of employment.
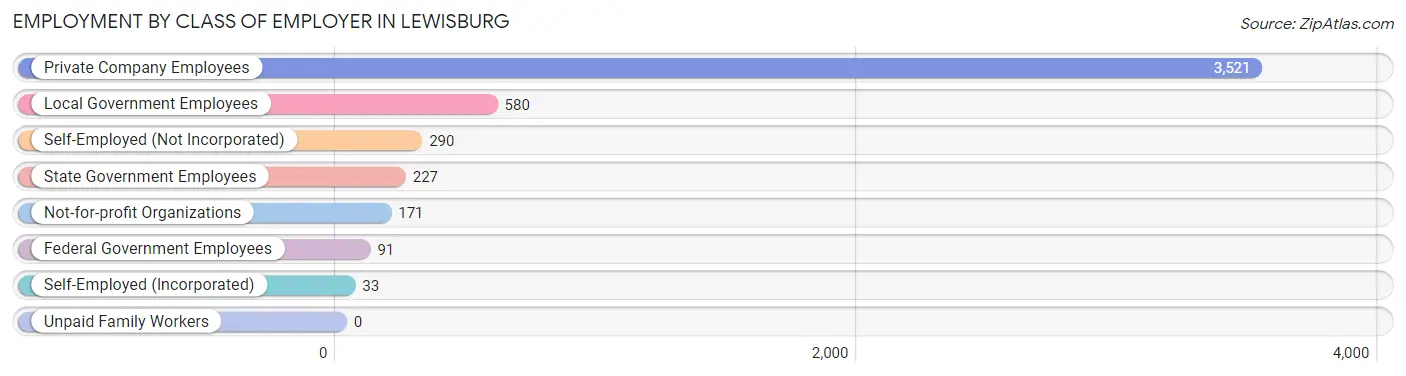
| Employer Class | # Employees | % Employees |
| Private Company Employees | 3,521 | 71.7% |
| Self-Employed (Incorporated) | 33 | 0.7% |
| Self-Employed (Not Incorporated) | 290 | 5.9% |
| Not-for-profit Organizations | 171 | 3.5% |
| Local Government Employees | 580 | 11.8% |
| State Government Employees | 227 | 4.6% |
| Federal Government Employees | 91 | 1.8% |
| Unpaid Family Workers | 0 | 0.0% |
| Total | 4,913 | 100.0% |
Employment Status by Age in Lewisburg
According to the labor force statistics for Lewisburg, out of the total population over 16 years of age (9,592), 59.2% or 5,678 individuals are in the labor force, with 7.9% or 449 of them unemployed. The age group with the highest labor force participation rate is 25 to 29 years, with 89.2% or 938 individuals in the labor force. Within the labor force, the 16 to 19 years age range has the highest percentage of unemployed individuals, with 43.6% or 193 of them being unemployed.
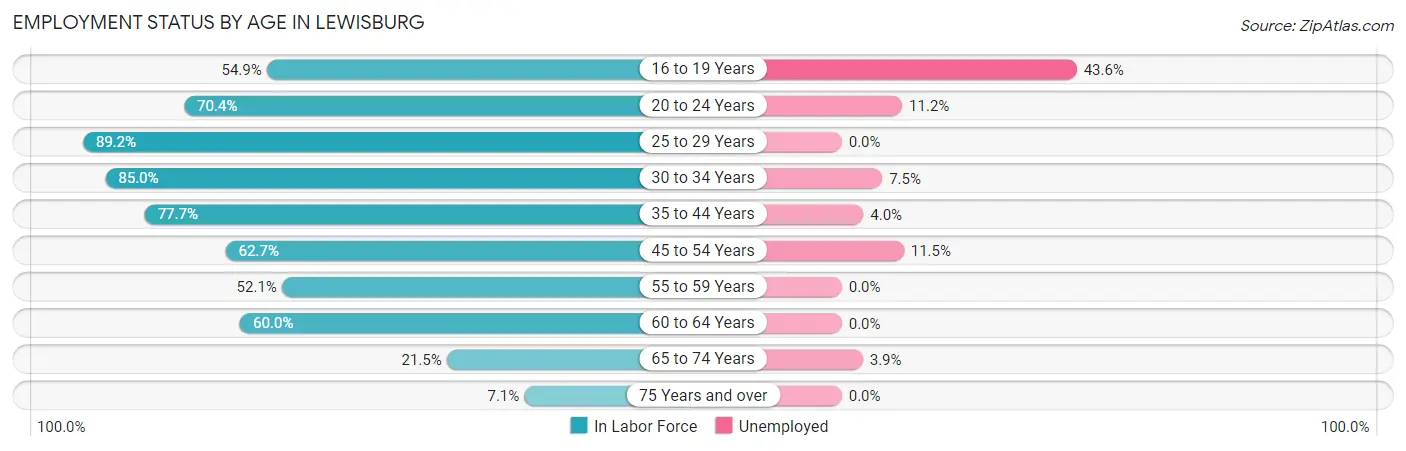
| Age Bracket | In Labor Force | Unemployed |
| 16 to 19 Years | 443 (54.9%) | 193 (43.6%) |
| 20 to 24 Years | 579 (70.4%) | 65 (11.2%) |
| 25 to 29 Years | 938 (89.2%) | 0 (0.0%) |
| 30 to 34 Years | 838 (85.0%) | 63 (7.5%) |
| 35 to 44 Years | 1,084 (77.7%) | 43 (4.0%) |
| 45 to 54 Years | 635 (62.7%) | 73 (11.5%) |
| 55 to 59 Years | 386 (52.1%) | 0 (0.0%) |
| 60 to 64 Years | 458 (60.0%) | 0 (0.0%) |
| 65 to 74 Years | 258 (21.5%) | 10 (3.9%) |
| 75 Years and over | 58 (7.1%) | 0 (0.0%) |
| Total | 5,678 (59.2%) | 449 (7.9%) |
Employment Status by Educational Attainment in Lewisburg
According to labor force statistics for Lewisburg, 72.9% of individuals (4,337) out of the total population between 25 and 64 years of age (5,949) are in the labor force, with 4.1% or 178 of them being unemployed. The group with the highest labor force participation rate are those with the educational attainment of bachelor's degree or higher, with 82.8% or 811 individuals in the labor force. Within the labor force, individuals with high school diploma education have the highest percentage of unemployment, with 6.4% or 123 of them being unemployed.
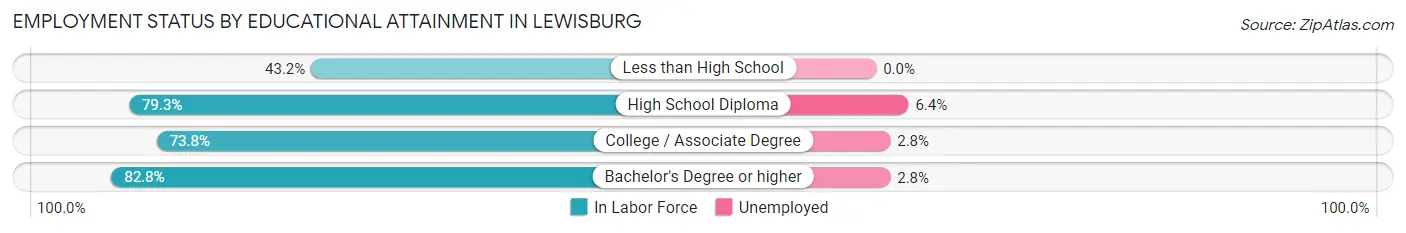
| Educational Attainment | In Labor Force | Unemployed |
| Less than High School | 386 (43.2%) | 0 (0.0%) |
| High School Diploma | 1,918 (79.3%) | 155 (6.4%) |
| College / Associate Degree | 1,223 (73.8%) | 46 (2.8%) |
| Bachelor's Degree or higher | 811 (82.8%) | 27 (2.8%) |
| Total | 4,337 (72.9%) | 244 (4.1%) |
Employment Occupations by Sex in Lewisburg
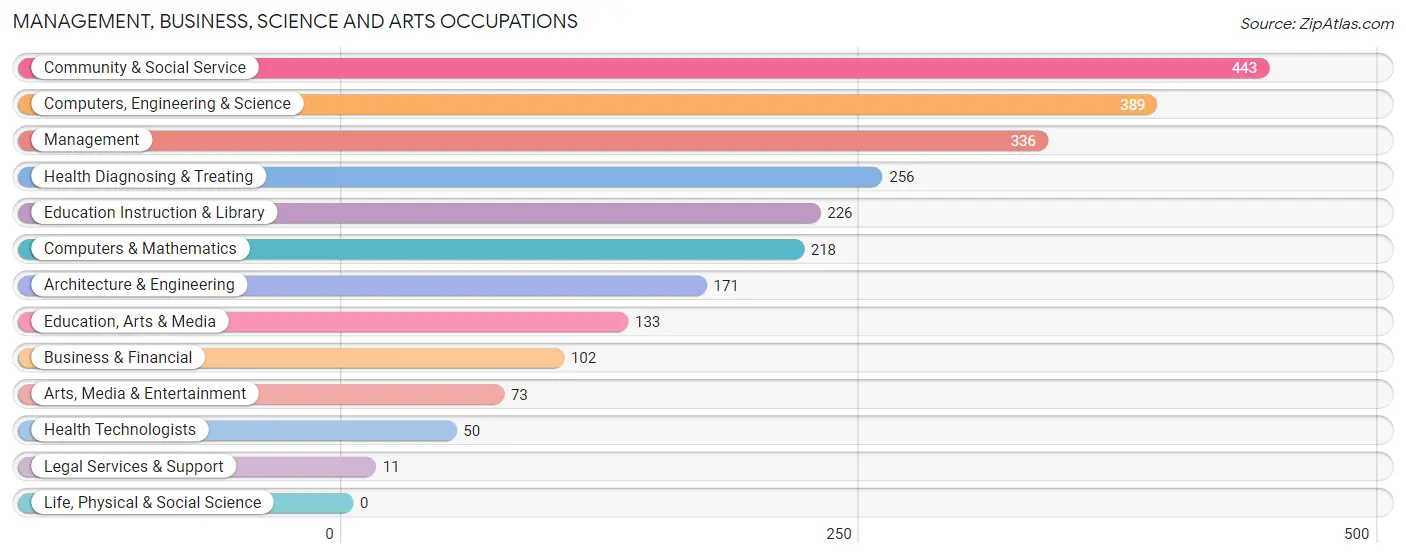
Management, Business, Science and Arts Occupations
The most common Management, Business, Science and Arts occupations in Lewisburg are Community & Social Service (443 | 8.5%), Computers, Engineering & Science (389 | 7.4%), Management (336 | 6.4%), Health Diagnosing & Treating (256 | 4.9%), and Education Instruction & Library (226 | 4.3%).
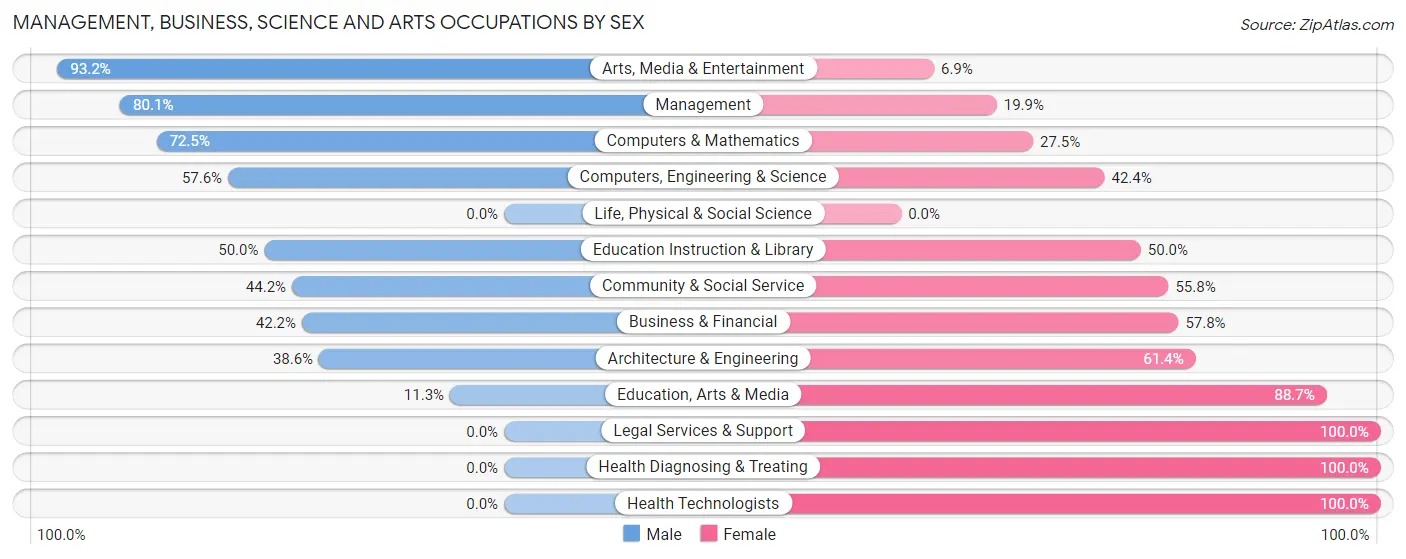
Management, Business, Science and Arts Occupations by Sex
Within the Management, Business, Science and Arts occupations in Lewisburg, the most male-oriented occupations are Arts, Media & Entertainment (93.1%), Management (80.1%), and Computers & Mathematics (72.5%), while the most female-oriented occupations are Legal Services & Support (100.0%), Health Diagnosing & Treating (100.0%), and Health Technologists (100.0%).
| Occupation | Male | Female |
| Management | 269 (80.1%) | 67 (19.9%) |
| Business & Financial | 43 (42.2%) | 59 (57.8%) |
| Computers, Engineering & Science | 224 (57.6%) | 165 (42.4%) |
| Computers & Mathematics | 158 (72.5%) | 60 (27.5%) |
| Architecture & Engineering | 66 (38.6%) | 105 (61.4%) |
| Life, Physical & Social Science | 0 (0.0%) | 0 (0.0%) |
| Community & Social Service | 196 (44.2%) | 247 (55.8%) |
| Education, Arts & Media | 15 (11.3%) | 118 (88.7%) |
| Legal Services & Support | 0 (0.0%) | 11 (100.0%) |
| Education Instruction & Library | 113 (50.0%) | 113 (50.0%) |
| Arts, Media & Entertainment | 68 (93.1%) | 5 (6.9%) |
| Health Diagnosing & Treating | 0 (0.0%) | 256 (100.0%) |
| Health Technologists | 0 (0.0%) | 50 (100.0%) |
| Total (Category) | 732 (48.0%) | 794 (52.0%) |
| Total (Overall) | 2,854 (54.7%) | 2,367 (45.3%) |
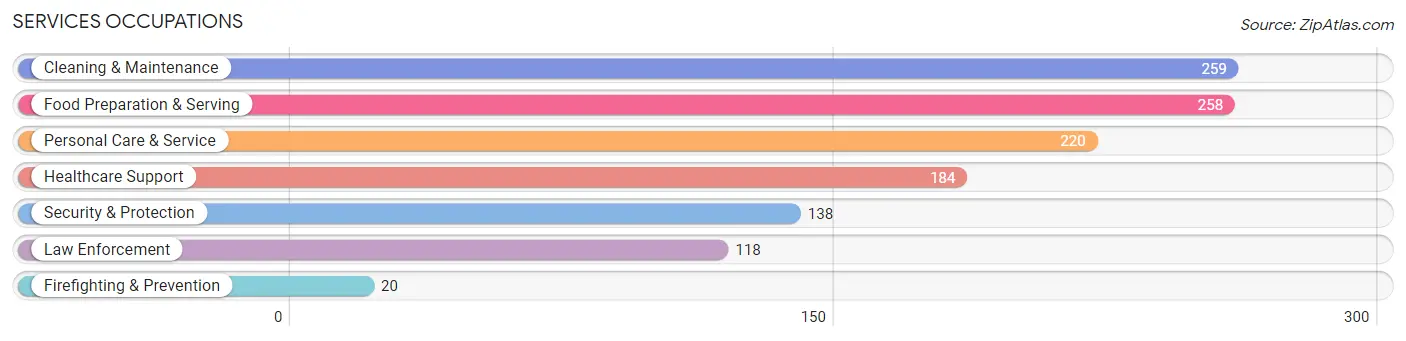
Services Occupations
The most common Services occupations in Lewisburg are Cleaning & Maintenance (259 | 5.0%), Food Preparation & Serving (258 | 4.9%), Personal Care & Service (220 | 4.2%), Healthcare Support (184 | 3.5%), and Security & Protection (138 | 2.6%).
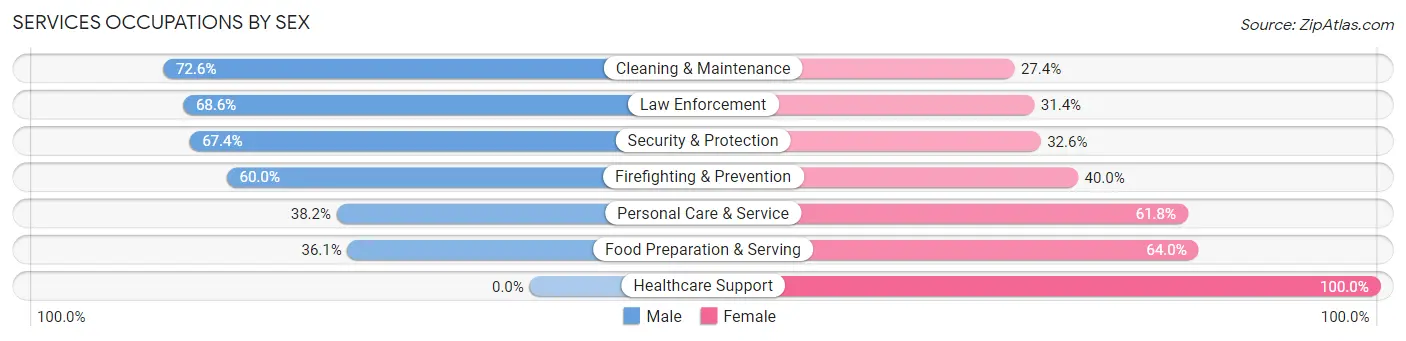
Services Occupations by Sex
Within the Services occupations in Lewisburg, the most male-oriented occupations are Cleaning & Maintenance (72.6%), Law Enforcement (68.6%), and Security & Protection (67.4%), while the most female-oriented occupations are Healthcare Support (100.0%), Food Preparation & Serving (63.9%), and Personal Care & Service (61.8%).
| Occupation | Male | Female |
| Healthcare Support | 0 (0.0%) | 184 (100.0%) |
| Security & Protection | 93 (67.4%) | 45 (32.6%) |
| Firefighting & Prevention | 12 (60.0%) | 8 (40.0%) |
| Law Enforcement | 81 (68.6%) | 37 (31.4%) |
| Food Preparation & Serving | 93 (36.0%) | 165 (63.9%) |
| Cleaning & Maintenance | 188 (72.6%) | 71 (27.4%) |
| Personal Care & Service | 84 (38.2%) | 136 (61.8%) |
| Total (Category) | 458 (43.2%) | 601 (56.8%) |
| Total (Overall) | 2,854 (54.7%) | 2,367 (45.3%) |
Sales and Office Occupations
The most common Sales and Office occupations in Lewisburg are Office & Administration (585 | 11.2%), and Sales & Related (281 | 5.4%).
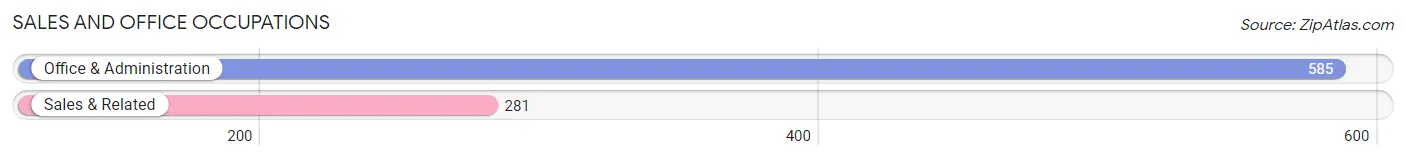
Sales and Office Occupations by Sex
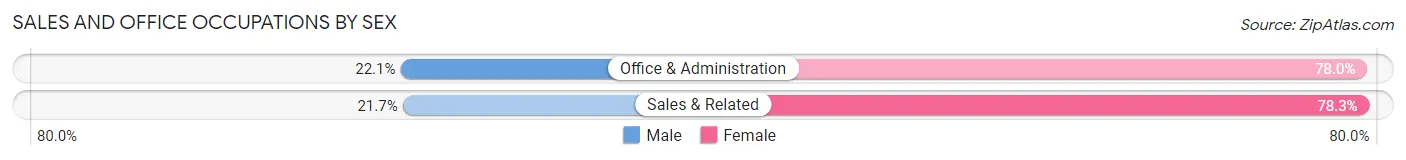
| Occupation | Male | Female |
| Sales & Related | 61 (21.7%) | 220 (78.3%) |
| Office & Administration | 129 (22.1%) | 456 (77.9%) |
| Total (Category) | 190 (21.9%) | 676 (78.1%) |
| Total (Overall) | 2,854 (54.7%) | 2,367 (45.3%) |
Natural Resources, Construction and Maintenance Occupations
The most common Natural Resources, Construction and Maintenance occupations in Lewisburg are Construction & Extraction (391 | 7.5%), Installation, Maintenance & Repair (203 | 3.9%), and Farming, Fishing & Forestry (11 | 0.2%).
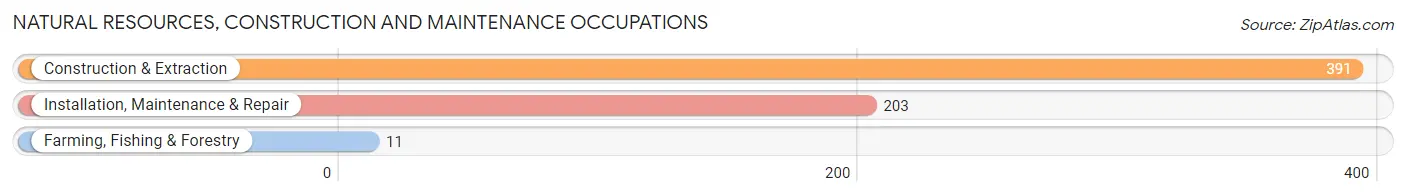
Natural Resources, Construction and Maintenance Occupations by Sex
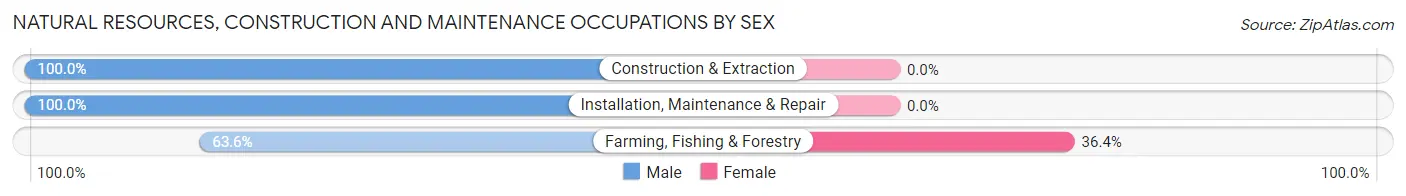
| Occupation | Male | Female |
| Farming, Fishing & Forestry | 7 (63.6%) | 4 (36.4%) |
| Construction & Extraction | 391 (100.0%) | 0 (0.0%) |
| Installation, Maintenance & Repair | 203 (100.0%) | 0 (0.0%) |
| Total (Category) | 601 (99.3%) | 4 (0.7%) |
| Total (Overall) | 2,854 (54.7%) | 2,367 (45.3%) |
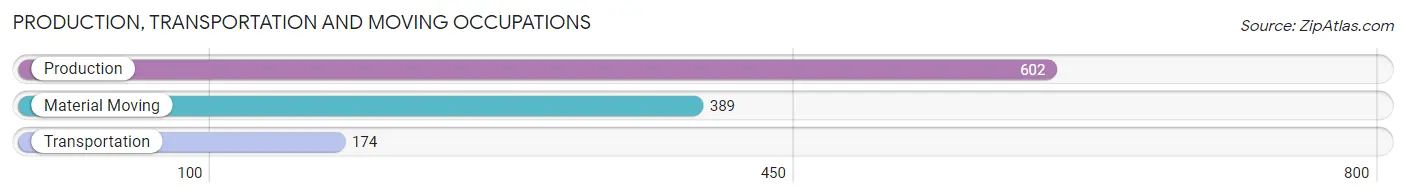
Production, Transportation and Moving Occupations
The most common Production, Transportation and Moving occupations in Lewisburg are Production (602 | 11.5%), Material Moving (389 | 7.4%), and Transportation (174 | 3.3%).
Production, Transportation and Moving Occupations by Sex
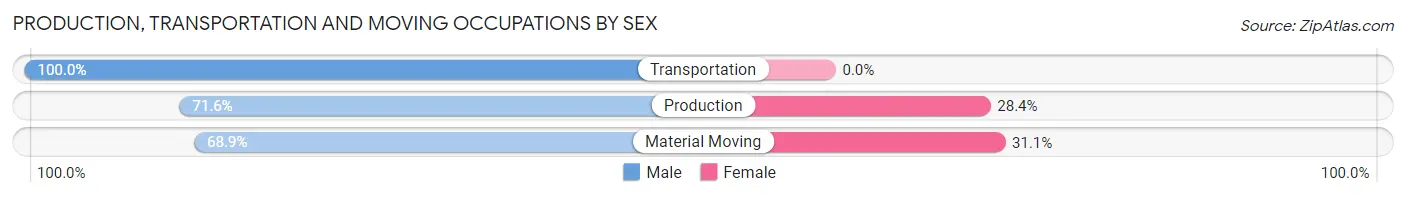
| Occupation | Male | Female |
| Production | 431 (71.6%) | 171 (28.4%) |
| Transportation | 174 (100.0%) | 0 (0.0%) |
| Material Moving | 268 (68.9%) | 121 (31.1%) |
| Total (Category) | 873 (74.9%) | 292 (25.1%) |
| Total (Overall) | 2,854 (54.7%) | 2,367 (45.3%) |
Employment Industries by Sex in Lewisburg
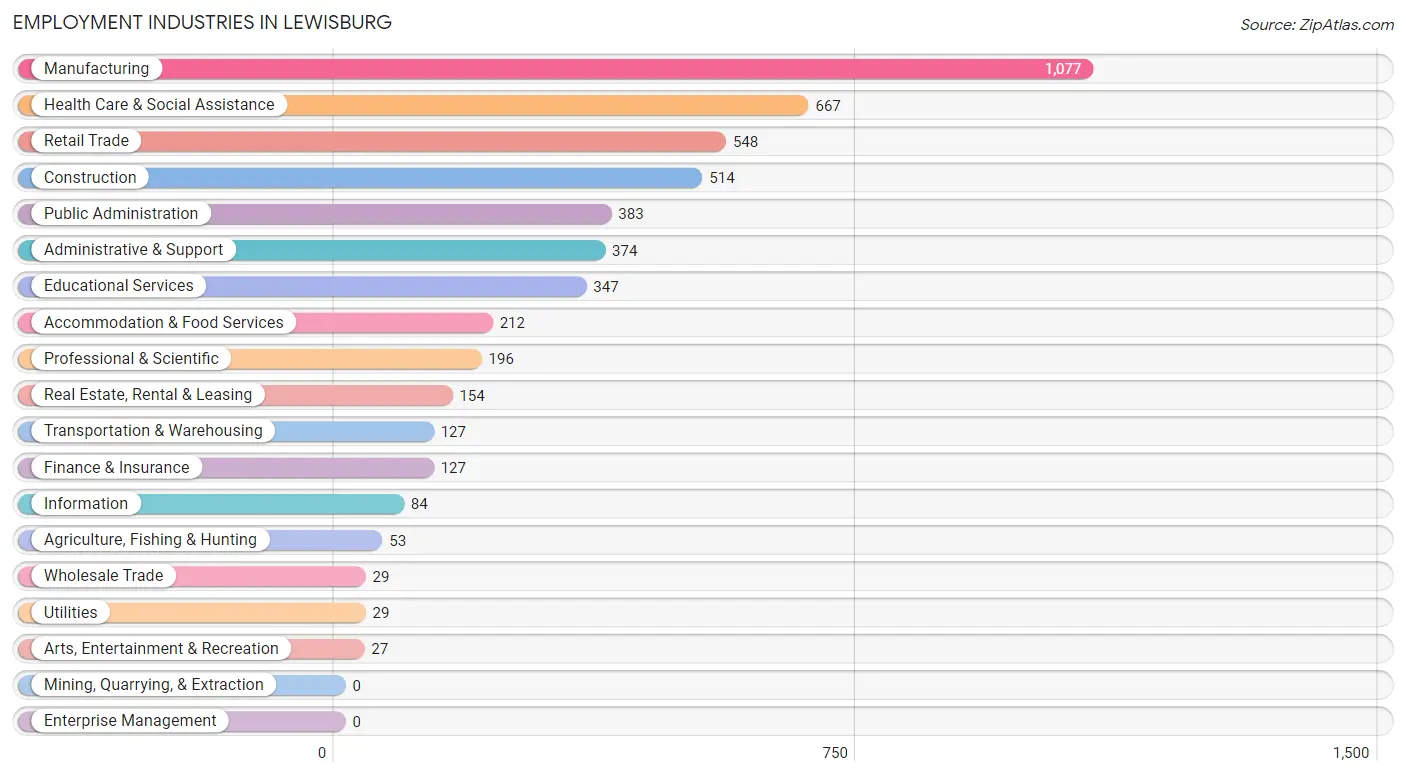
Employment Industries in Lewisburg
The major employment industries in Lewisburg include Manufacturing (1,077 | 20.6%), Health Care & Social Assistance (667 | 12.8%), Retail Trade (548 | 10.5%), Construction (514 | 9.8%), and Public Administration (383 | 7.3%).
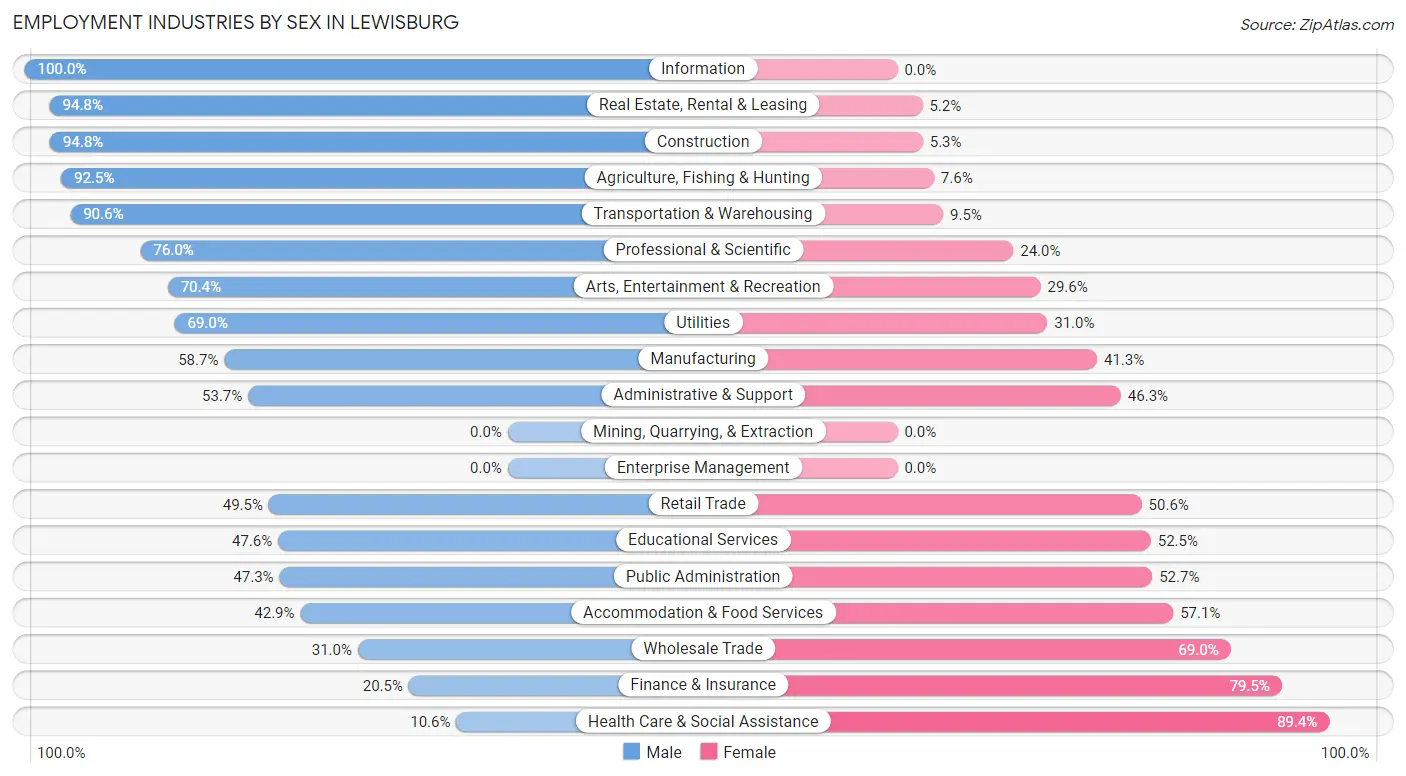
Employment Industries by Sex in Lewisburg
The Lewisburg industries that see more men than women are Information (100.0%), Real Estate, Rental & Leasing (94.8%), and Construction (94.8%), whereas the industries that tend to have a higher number of women are Health Care & Social Assistance (89.4%), Finance & Insurance (79.5%), and Wholesale Trade (69.0%).
| Industry | Male | Female |
| Agriculture, Fishing & Hunting | 49 (92.4%) | 4 (7.5%) |
| Mining, Quarrying, & Extraction | 0 (0.0%) | 0 (0.0%) |
| Construction | 487 (94.8%) | 27 (5.2%) |
| Manufacturing | 632 (58.7%) | 445 (41.3%) |
| Wholesale Trade | 9 (31.0%) | 20 (69.0%) |
| Retail Trade | 271 (49.4%) | 277 (50.5%) |
| Transportation & Warehousing | 115 (90.5%) | 12 (9.5%) |
| Utilities | 20 (69.0%) | 9 (31.0%) |
| Information | 84 (100.0%) | 0 (0.0%) |
| Finance & Insurance | 26 (20.5%) | 101 (79.5%) |
| Real Estate, Rental & Leasing | 146 (94.8%) | 8 (5.2%) |
| Professional & Scientific | 149 (76.0%) | 47 (24.0%) |
| Enterprise Management | 0 (0.0%) | 0 (0.0%) |
| Administrative & Support | 201 (53.7%) | 173 (46.3%) |
| Educational Services | 165 (47.5%) | 182 (52.4%) |
| Health Care & Social Assistance | 71 (10.6%) | 596 (89.4%) |
| Arts, Entertainment & Recreation | 19 (70.4%) | 8 (29.6%) |
| Accommodation & Food Services | 91 (42.9%) | 121 (57.1%) |
| Public Administration | 181 (47.3%) | 202 (52.7%) |
| Total | 2,854 (54.7%) | 2,367 (45.3%) |
Education in Lewisburg
School Enrollment in Lewisburg
The most common levels of schooling among the 2,747 students in Lewisburg are elementary school (819 | 29.8%), high school (617 | 22.5%), and middle school (465 | 16.9%).
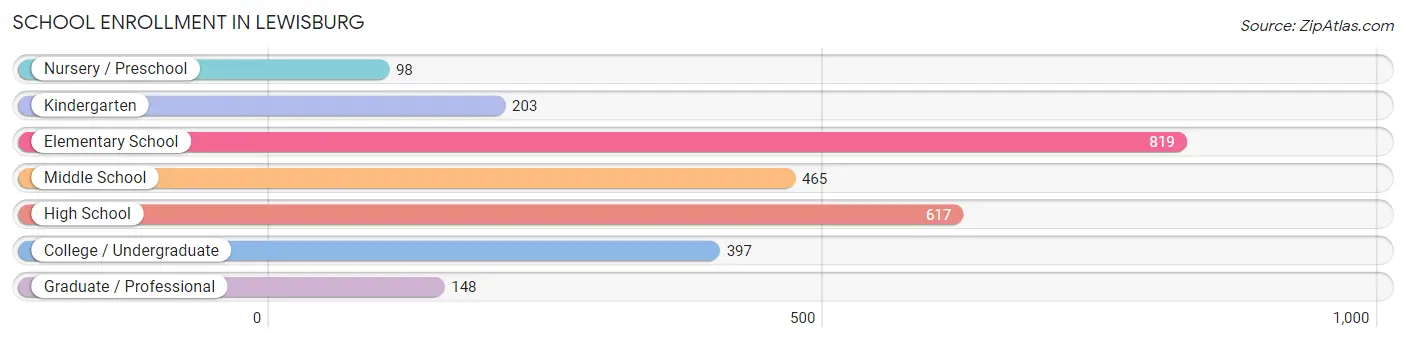
| School Level | # Students | % Students |
| Nursery / Preschool | 98 | 3.6% |
| Kindergarten | 203 | 7.4% |
| Elementary School | 819 | 29.8% |
| Middle School | 465 | 16.9% |
| High School | 617 | 22.5% |
| College / Undergraduate | 397 | 14.4% |
| Graduate / Professional | 148 | 5.4% |
| Total | 2,747 | 100.0% |
School Enrollment by Age by Funding Source in Lewisburg
Out of a total of 2,747 students who are enrolled in schools in Lewisburg, 275 (10.0%) attend a private institution, while the remaining 2,472 (90.0%) are enrolled in public schools. The age group of 20 to 24 year olds has the highest likelihood of being enrolled in private schools, with 37 (22.8% in the age bracket) enrolled. Conversely, the age group of 3 to 4 year olds has the lowest likelihood of being enrolled in a private school, with 56 (100.0% in the age bracket) attending a public institution.
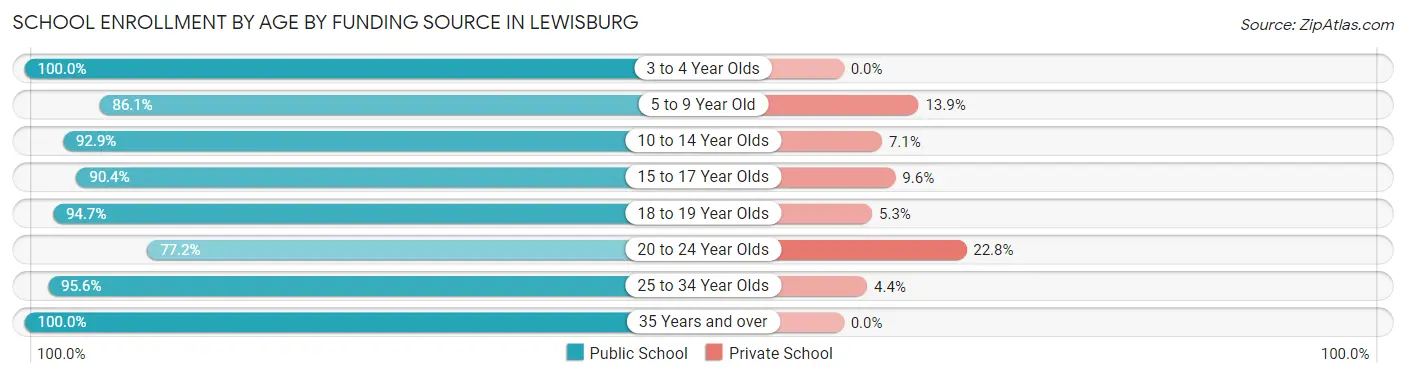
| Age Bracket | Public School | Private School |
| 3 to 4 Year Olds | 56 (100.0%) | 0 (0.0%) |
| 5 to 9 Year Old | 790 (86.1%) | 128 (13.9%) |
| 10 to 14 Year Olds | 585 (92.9%) | 45 (7.1%) |
| 15 to 17 Year Olds | 431 (90.4%) | 46 (9.6%) |
| 18 to 19 Year Olds | 215 (94.7%) | 12 (5.3%) |
| 20 to 24 Year Olds | 125 (77.2%) | 37 (22.8%) |
| 25 to 34 Year Olds | 175 (95.6%) | 8 (4.4%) |
| 35 Years and over | 94 (100.0%) | 0 (0.0%) |
| Total | 2,472 (90.0%) | 275 (10.0%) |
Educational Attainment by Field of Study in Lewisburg
Arts & humanities (182 | 13.3%), education (171 | 12.5%), business (154 | 11.3%), science & technology (142 | 10.4%), and social sciences (108 | 7.9%) are the most common fields of study among 1,365 individuals in Lewisburg who have obtained a bachelor's degree or higher.
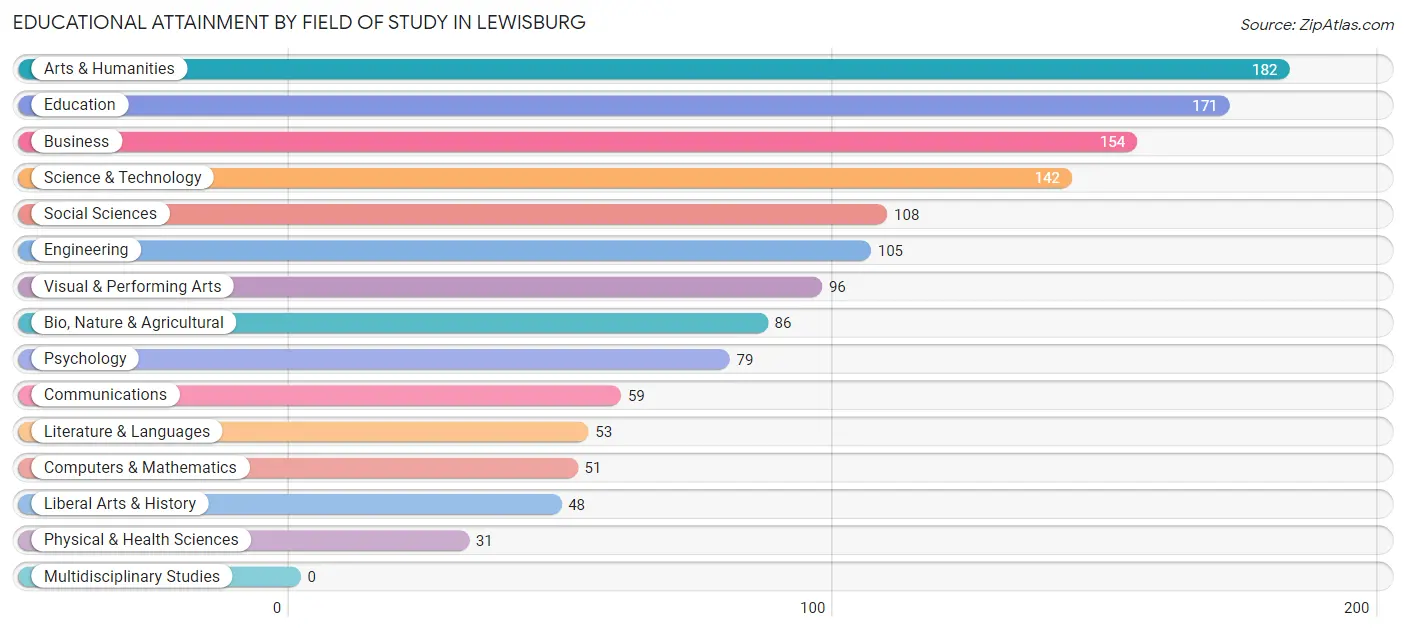
| Field of Study | # Graduates | % Graduates |
| Computers & Mathematics | 51 | 3.7% |
| Bio, Nature & Agricultural | 86 | 6.3% |
| Physical & Health Sciences | 31 | 2.3% |
| Psychology | 79 | 5.8% |
| Social Sciences | 108 | 7.9% |
| Engineering | 105 | 7.7% |
| Multidisciplinary Studies | 0 | 0.0% |
| Science & Technology | 142 | 10.4% |
| Business | 154 | 11.3% |
| Education | 171 | 12.5% |
| Literature & Languages | 53 | 3.9% |
| Liberal Arts & History | 48 | 3.5% |
| Visual & Performing Arts | 96 | 7.0% |
| Communications | 59 | 4.3% |
| Arts & Humanities | 182 | 13.3% |
| Total | 1,365 | 100.0% |
Transportation & Commute in Lewisburg
Vehicle Availability by Sex in Lewisburg
The most prevalent vehicle ownership categories in Lewisburg are males with 2 vehicles (1,294, accounting for 47.2%) and females with 2 vehicles (1,006, making up 60.0%).
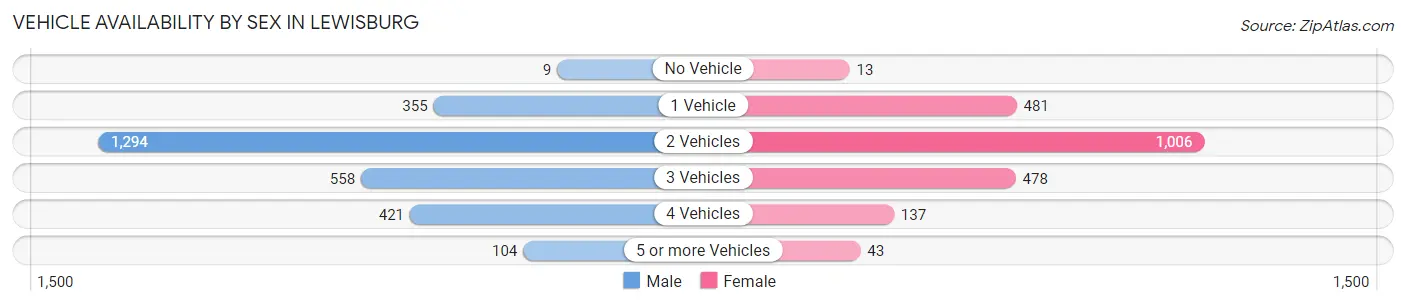
| Vehicles Available | Male | Female |
| No Vehicle | 9 (0.3%) | 13 (0.6%) |
| 1 Vehicle | 355 (13.0%) | 481 (22.3%) |
| 2 Vehicles | 1,294 (47.2%) | 1,006 (46.6%) |
| 3 Vehicles | 558 (20.4%) | 478 (22.2%) |
| 4 Vehicles | 421 (15.4%) | 137 (6.4%) |
| 5 or more Vehicles | 104 (3.8%) | 43 (2.0%) |
| Total | 2,741 (100.0%) | 2,158 (100.0%) |
Commute Time in Lewisburg
The most frequently occuring commute durations in Lewisburg are 5 to 9 minutes (1,003 commuters, 21.8%), 10 to 14 minutes (784 commuters, 17.0%), and 15 to 19 minutes (531 commuters, 11.5%).
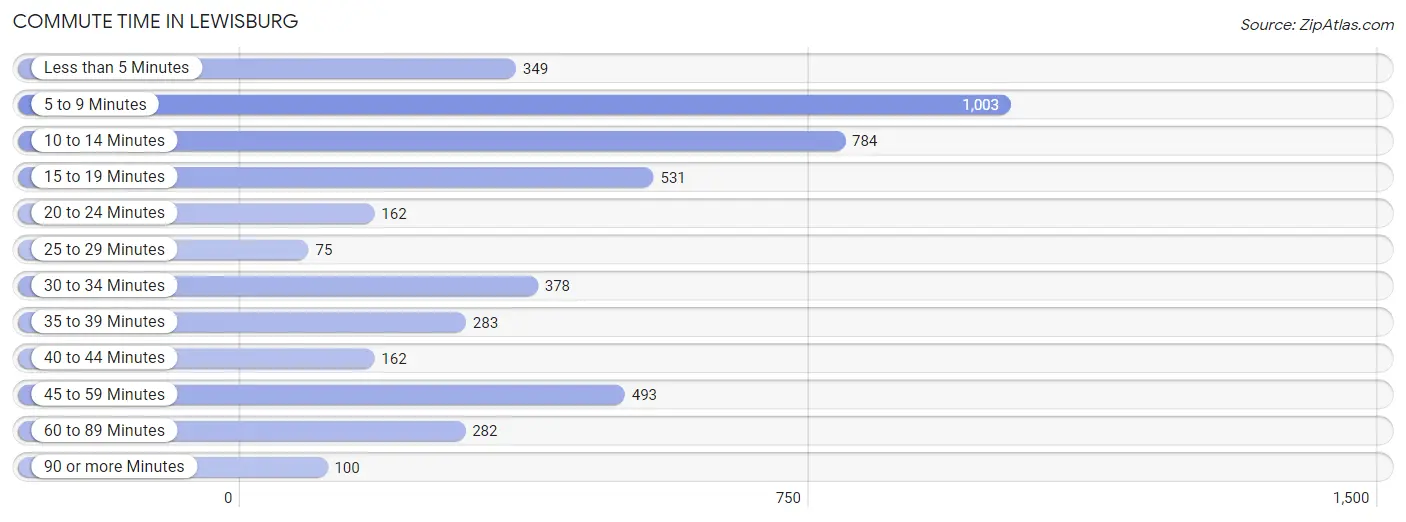
| Commute Time | # Commuters | % Commuters |
| Less than 5 Minutes | 349 | 7.6% |
| 5 to 9 Minutes | 1,003 | 21.8% |
| 10 to 14 Minutes | 784 | 17.0% |
| 15 to 19 Minutes | 531 | 11.5% |
| 20 to 24 Minutes | 162 | 3.5% |
| 25 to 29 Minutes | 75 | 1.6% |
| 30 to 34 Minutes | 378 | 8.2% |
| 35 to 39 Minutes | 283 | 6.1% |
| 40 to 44 Minutes | 162 | 3.5% |
| 45 to 59 Minutes | 493 | 10.7% |
| 60 to 89 Minutes | 282 | 6.1% |
| 90 or more Minutes | 100 | 2.2% |
Commute Time by Sex in Lewisburg
The most common commute times in Lewisburg are 5 to 9 minutes (612 commuters, 23.2%) for males and 5 to 9 minutes (391 commuters, 19.9%) for females.
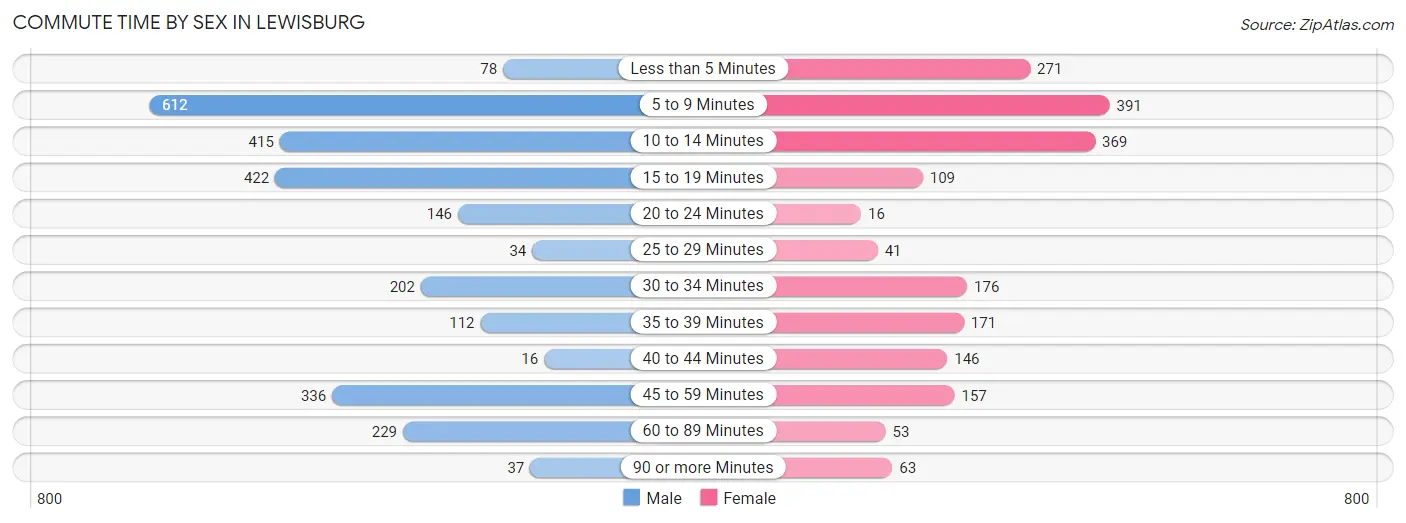
| Commute Time | Male | Female |
| Less than 5 Minutes | 78 (3.0%) | 271 (13.8%) |
| 5 to 9 Minutes | 612 (23.2%) | 391 (19.9%) |
| 10 to 14 Minutes | 415 (15.7%) | 369 (18.8%) |
| 15 to 19 Minutes | 422 (16.0%) | 109 (5.6%) |
| 20 to 24 Minutes | 146 (5.5%) | 16 (0.8%) |
| 25 to 29 Minutes | 34 (1.3%) | 41 (2.1%) |
| 30 to 34 Minutes | 202 (7.6%) | 176 (9.0%) |
| 35 to 39 Minutes | 112 (4.2%) | 171 (8.7%) |
| 40 to 44 Minutes | 16 (0.6%) | 146 (7.4%) |
| 45 to 59 Minutes | 336 (12.7%) | 157 (8.0%) |
| 60 to 89 Minutes | 229 (8.7%) | 53 (2.7%) |
| 90 or more Minutes | 37 (1.4%) | 63 (3.2%) |
Time of Departure to Work by Sex in Lewisburg
The most frequent times of departure to work in Lewisburg are 6:00 AM to 6:29 AM (477, 18.1%) for males and 6:30 AM to 6:59 AM (276, 14.1%) for females.
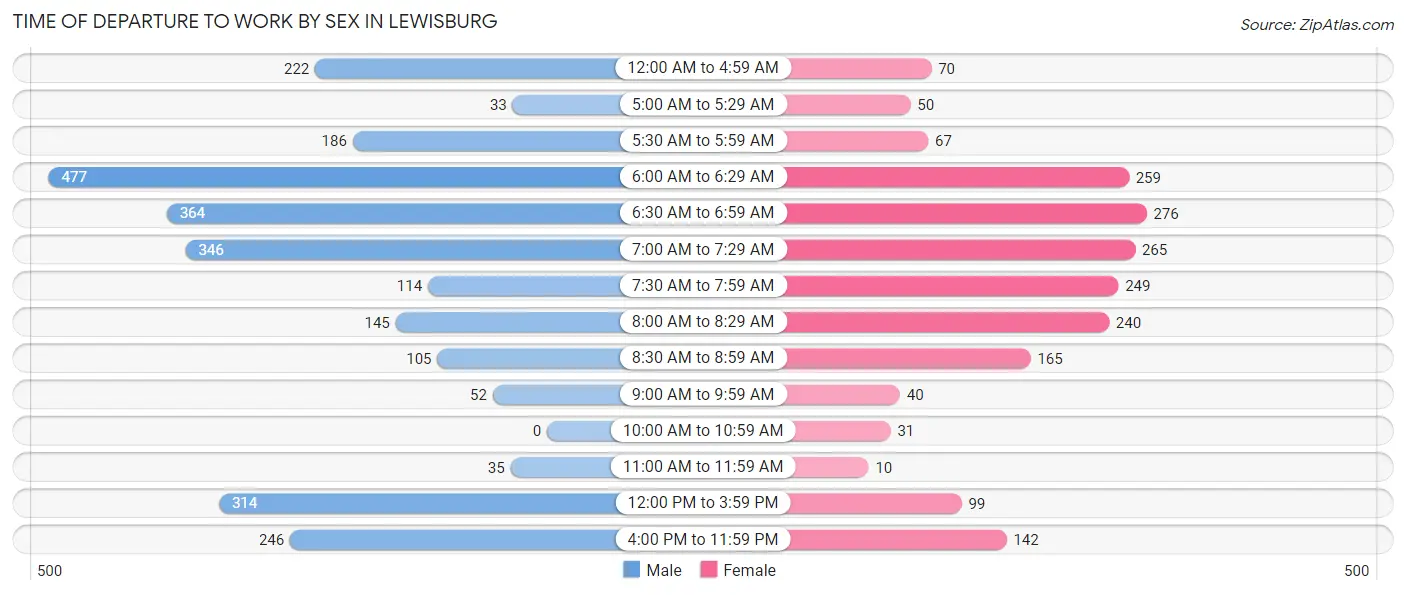
| Time of Departure | Male | Female |
| 12:00 AM to 4:59 AM | 222 (8.4%) | 70 (3.6%) |
| 5:00 AM to 5:29 AM | 33 (1.3%) | 50 (2.5%) |
| 5:30 AM to 5:59 AM | 186 (7.0%) | 67 (3.4%) |
| 6:00 AM to 6:29 AM | 477 (18.1%) | 259 (13.2%) |
| 6:30 AM to 6:59 AM | 364 (13.8%) | 276 (14.1%) |
| 7:00 AM to 7:29 AM | 346 (13.1%) | 265 (13.5%) |
| 7:30 AM to 7:59 AM | 114 (4.3%) | 249 (12.7%) |
| 8:00 AM to 8:29 AM | 145 (5.5%) | 240 (12.2%) |
| 8:30 AM to 8:59 AM | 105 (4.0%) | 165 (8.4%) |
| 9:00 AM to 9:59 AM | 52 (2.0%) | 40 (2.0%) |
| 10:00 AM to 10:59 AM | 0 (0.0%) | 31 (1.6%) |
| 11:00 AM to 11:59 AM | 35 (1.3%) | 10 (0.5%) |
| 12:00 PM to 3:59 PM | 314 (11.9%) | 99 (5.0%) |
| 4:00 PM to 11:59 PM | 246 (9.3%) | 142 (7.2%) |
| Total | 2,639 (100.0%) | 1,963 (100.0%) |
Housing Occupancy in Lewisburg
Occupancy by Ownership in Lewisburg
Of the total 4,649 dwellings in Lewisburg, owner-occupied units account for 2,833 (60.9%), while renter-occupied units make up 1,816 (39.1%).
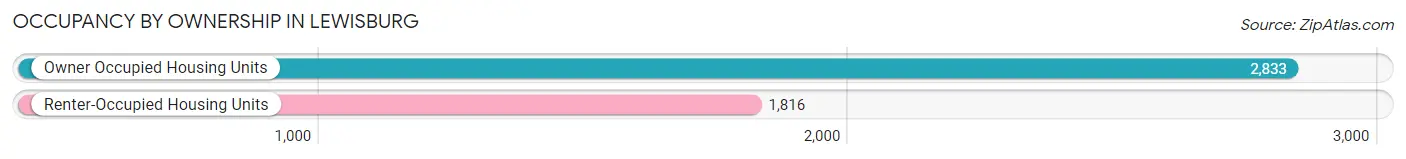
| Occupancy | # Housing Units | % Housing Units |
| Owner Occupied Housing Units | 2,833 | 60.9% |
| Renter-Occupied Housing Units | 1,816 | 39.1% |
| Total Occupied Housing Units | 4,649 | 100.0% |
Occupancy by Household Size in Lewisburg
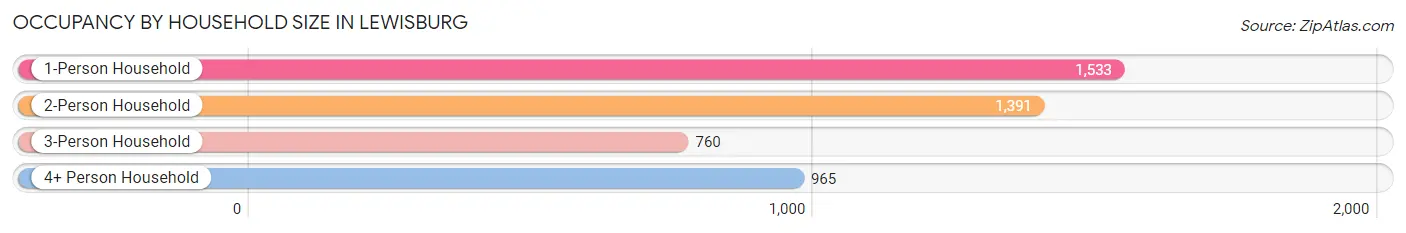
| Household Size | # Housing Units | % Housing Units |
| 1-Person Household | 1,533 | 33.0% |
| 2-Person Household | 1,391 | 29.9% |
| 3-Person Household | 760 | 16.4% |
| 4+ Person Household | 965 | 20.8% |
| Total Housing Units | 4,649 | 100.0% |
Occupancy by Ownership by Household Size in Lewisburg
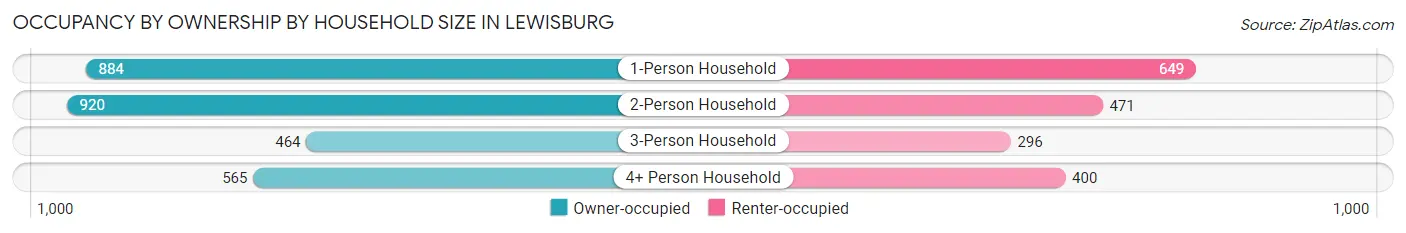
| Household Size | Owner-occupied | Renter-occupied |
| 1-Person Household | 884 (57.7%) | 649 (42.3%) |
| 2-Person Household | 920 (66.1%) | 471 (33.9%) |
| 3-Person Household | 464 (61.1%) | 296 (39.0%) |
| 4+ Person Household | 565 (58.6%) | 400 (41.4%) |
| Total Housing Units | 2,833 (60.9%) | 1,816 (39.1%) |
Occupancy by Educational Attainment in Lewisburg
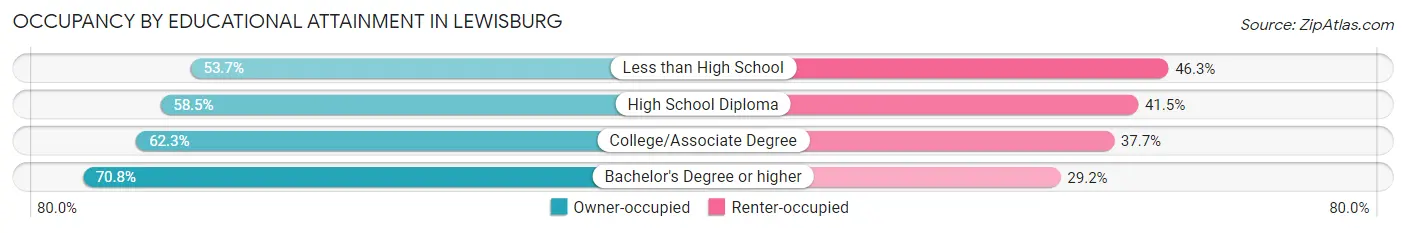
| Household Size | Owner-occupied | Renter-occupied |
| Less than High School | 357 (53.7%) | 308 (46.3%) |
| High School Diploma | 970 (58.5%) | 689 (41.5%) |
| College/Associate Degree | 1,024 (62.3%) | 620 (37.7%) |
| Bachelor's Degree or higher | 482 (70.8%) | 199 (29.2%) |
Occupancy by Age of Householder in Lewisburg
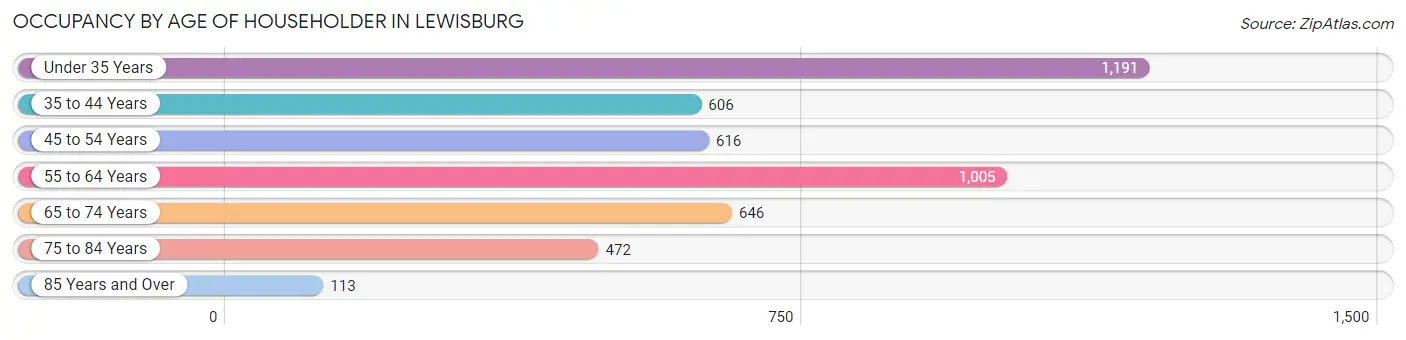
| Age Bracket | # Households | % Households |
| Under 35 Years | 1,191 | 25.6% |
| 35 to 44 Years | 606 | 13.0% |
| 45 to 54 Years | 616 | 13.3% |
| 55 to 64 Years | 1,005 | 21.6% |
| 65 to 74 Years | 646 | 13.9% |
| 75 to 84 Years | 472 | 10.2% |
| 85 Years and Over | 113 | 2.4% |
| Total | 4,649 | 100.0% |
Housing Finances in Lewisburg
Median Income by Occupancy in Lewisburg
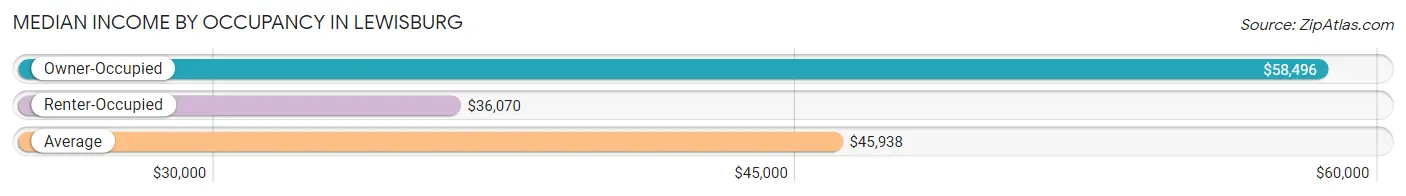
| Occupancy Type | # Households | Median Income |
| Owner-Occupied | 2,833 (60.9%) | $58,496 |
| Renter-Occupied | 1,816 (39.1%) | $36,070 |
| Average | 4,649 (100.0%) | $45,938 |
Occupancy by Householder Income Bracket in Lewisburg
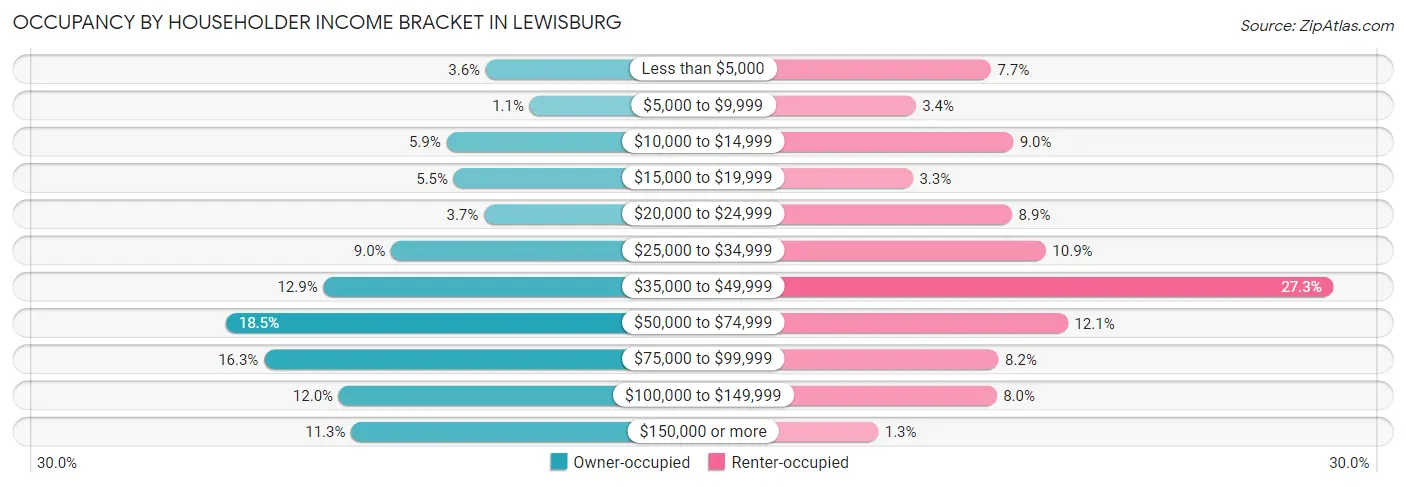
| Income Bracket | Owner-occupied | Renter-occupied |
| Less than $5,000 | 103 (3.6%) | 140 (7.7%) |
| $5,000 to $9,999 | 32 (1.1%) | 62 (3.4%) |
| $10,000 to $14,999 | 167 (5.9%) | 163 (9.0%) |
| $15,000 to $19,999 | 155 (5.5%) | 59 (3.3%) |
| $20,000 to $24,999 | 106 (3.7%) | 162 (8.9%) |
| $25,000 to $34,999 | 256 (9.0%) | 197 (10.8%) |
| $35,000 to $49,999 | 366 (12.9%) | 496 (27.3%) |
| $50,000 to $74,999 | 524 (18.5%) | 220 (12.1%) |
| $75,000 to $99,999 | 462 (16.3%) | 148 (8.2%) |
| $100,000 to $149,999 | 341 (12.0%) | 146 (8.0%) |
| $150,000 or more | 321 (11.3%) | 23 (1.3%) |
| Total | 2,833 (100.0%) | 1,816 (100.0%) |
Monthly Housing Cost Tiers in Lewisburg
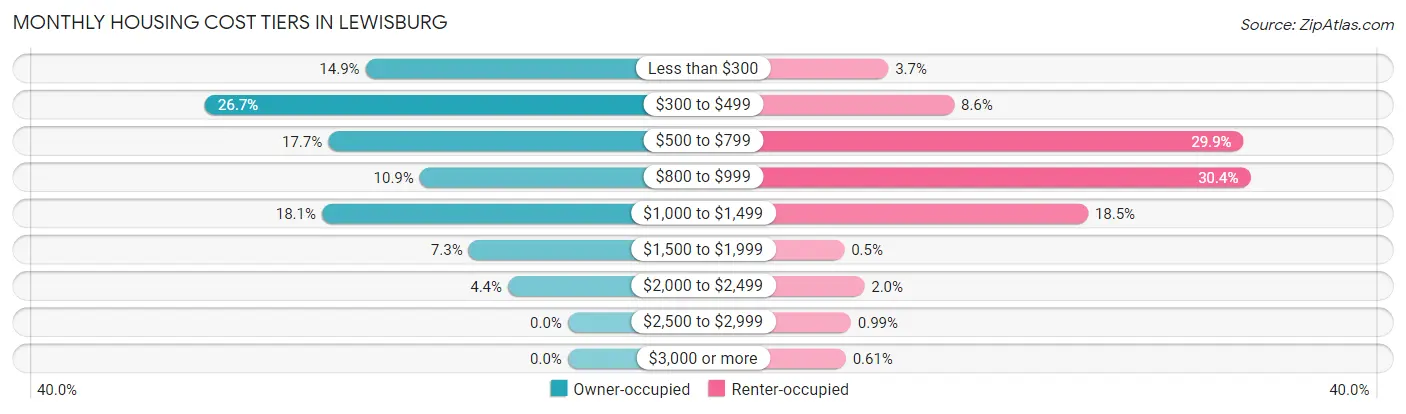
| Monthly Cost | Owner-occupied | Renter-occupied |
| Less than $300 | 422 (14.9%) | 68 (3.7%) |
| $300 to $499 | 757 (26.7%) | 156 (8.6%) |
| $500 to $799 | 500 (17.6%) | 543 (29.9%) |
| $800 to $999 | 309 (10.9%) | 552 (30.4%) |
| $1,000 to $1,499 | 513 (18.1%) | 335 (18.4%) |
| $1,500 to $1,999 | 207 (7.3%) | 9 (0.5%) |
| $2,000 to $2,499 | 125 (4.4%) | 36 (2.0%) |
| $2,500 to $2,999 | 0 (0.0%) | 18 (1.0%) |
| $3,000 or more | 0 (0.0%) | 11 (0.6%) |
| Total | 2,833 (100.0%) | 1,816 (100.0%) |
Physical Housing Characteristics in Lewisburg
Housing Structures in Lewisburg
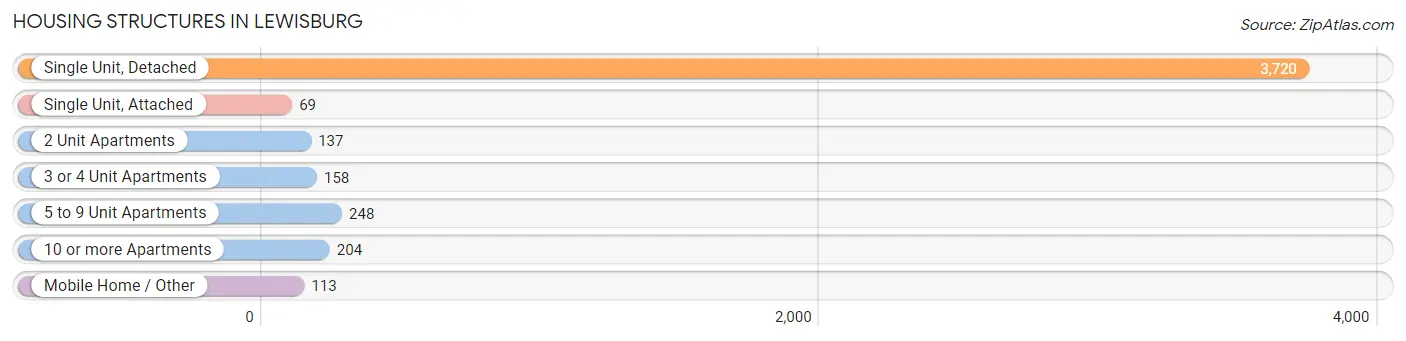
| Structure Type | # Housing Units | % Housing Units |
| Single Unit, Detached | 3,720 | 80.0% |
| Single Unit, Attached | 69 | 1.5% |
| 2 Unit Apartments | 137 | 2.9% |
| 3 or 4 Unit Apartments | 158 | 3.4% |
| 5 to 9 Unit Apartments | 248 | 5.3% |
| 10 or more Apartments | 204 | 4.4% |
| Mobile Home / Other | 113 | 2.4% |
| Total | 4,649 | 100.0% |
Housing Structures by Occupancy in Lewisburg
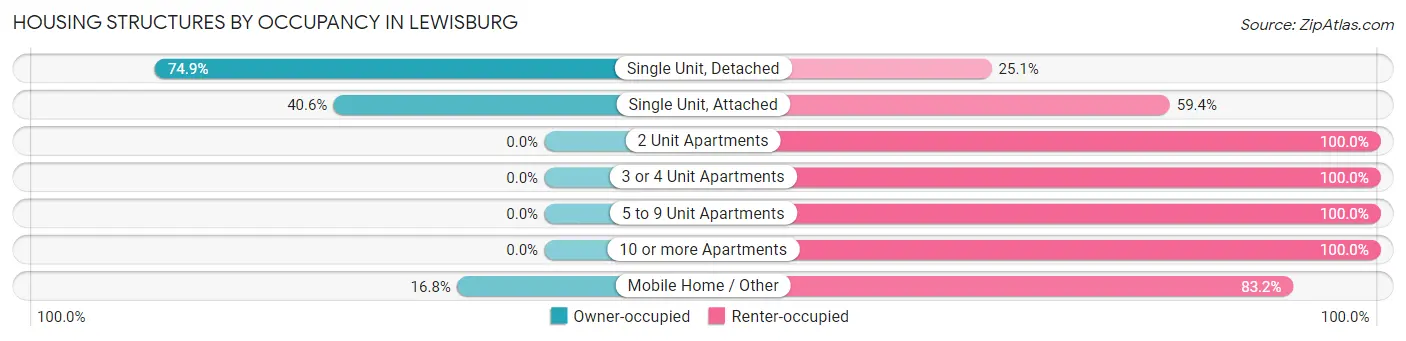
| Structure Type | Owner-occupied | Renter-occupied |
| Single Unit, Detached | 2,786 (74.9%) | 934 (25.1%) |
| Single Unit, Attached | 28 (40.6%) | 41 (59.4%) |
| 2 Unit Apartments | 0 (0.0%) | 137 (100.0%) |
| 3 or 4 Unit Apartments | 0 (0.0%) | 158 (100.0%) |
| 5 to 9 Unit Apartments | 0 (0.0%) | 248 (100.0%) |
| 10 or more Apartments | 0 (0.0%) | 204 (100.0%) |
| Mobile Home / Other | 19 (16.8%) | 94 (83.2%) |
| Total | 2,833 (60.9%) | 1,816 (39.1%) |
Housing Structures by Number of Rooms in Lewisburg
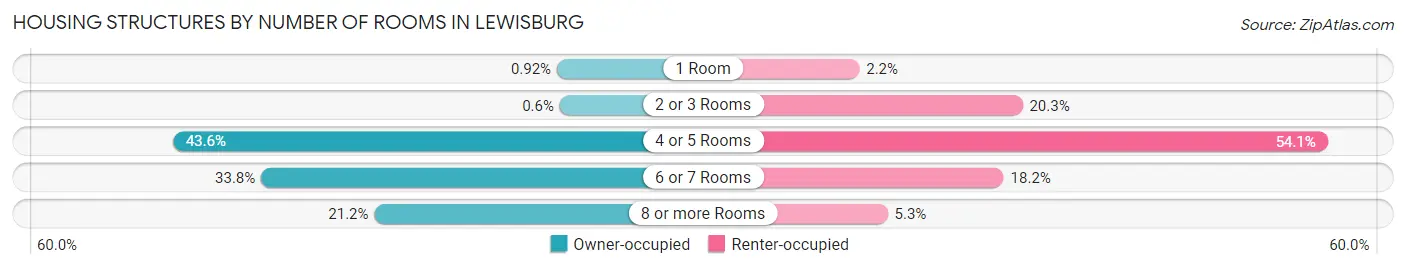
| Number of Rooms | Owner-occupied | Renter-occupied |
| 1 Room | 26 (0.9%) | 39 (2.1%) |
| 2 or 3 Rooms | 17 (0.6%) | 368 (20.3%) |
| 4 or 5 Rooms | 1,234 (43.6%) | 983 (54.1%) |
| 6 or 7 Rooms | 956 (33.8%) | 330 (18.2%) |
| 8 or more Rooms | 600 (21.2%) | 96 (5.3%) |
| Total | 2,833 (100.0%) | 1,816 (100.0%) |
Housing Structure by Heating Type in Lewisburg
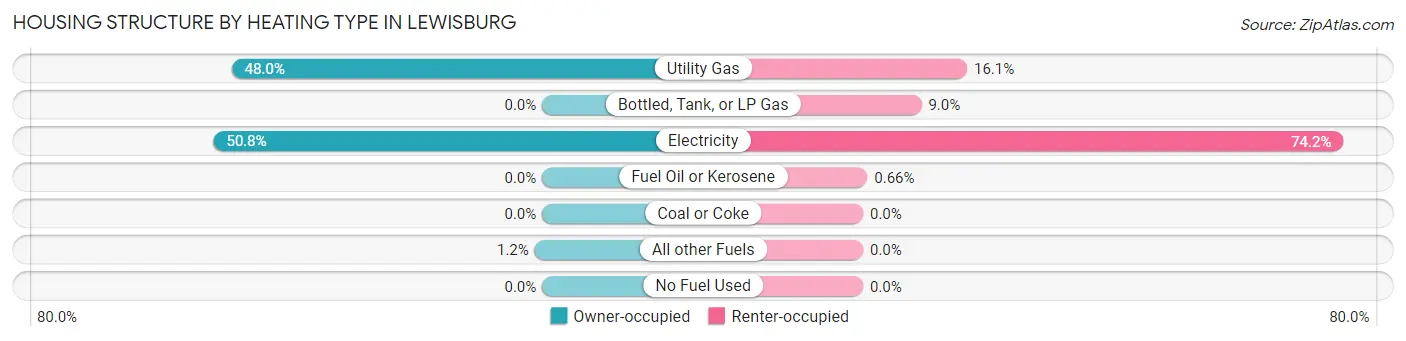
| Heating Type | Owner-occupied | Renter-occupied |
| Utility Gas | 1,360 (48.0%) | 292 (16.1%) |
| Bottled, Tank, or LP Gas | 0 (0.0%) | 164 (9.0%) |
| Electricity | 1,440 (50.8%) | 1,348 (74.2%) |
| Fuel Oil or Kerosene | 0 (0.0%) | 12 (0.7%) |
| Coal or Coke | 0 (0.0%) | 0 (0.0%) |
| All other Fuels | 33 (1.2%) | 0 (0.0%) |
| No Fuel Used | 0 (0.0%) | 0 (0.0%) |
| Total | 2,833 (100.0%) | 1,816 (100.0%) |
Household Vehicle Usage in Lewisburg
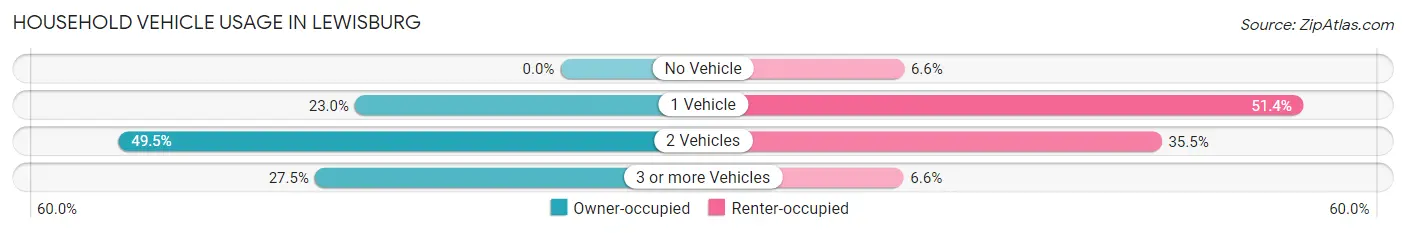
| Vehicles per Household | Owner-occupied | Renter-occupied |
| No Vehicle | 0 (0.0%) | 120 (6.6%) |
| 1 Vehicle | 652 (23.0%) | 933 (51.4%) |
| 2 Vehicles | 1,402 (49.5%) | 644 (35.5%) |
| 3 or more Vehicles | 779 (27.5%) | 119 (6.6%) |
| Total | 2,833 (100.0%) | 1,816 (100.0%) |
Real Estate & Mortgages in Lewisburg
Real Estate and Mortgage Overview in Lewisburg
| Characteristic | Without Mortgage | With Mortgage |
| Housing Units | 1,410 | 1,423 |
| Median Property Value | $141,100 | $178,200 |
| Median Household Income | $54,697 | $181 |
| Monthly Housing Costs | $391 | $0 |
| Real Estate Taxes | $1,209 | $5 |
Property Value by Mortgage Status in Lewisburg
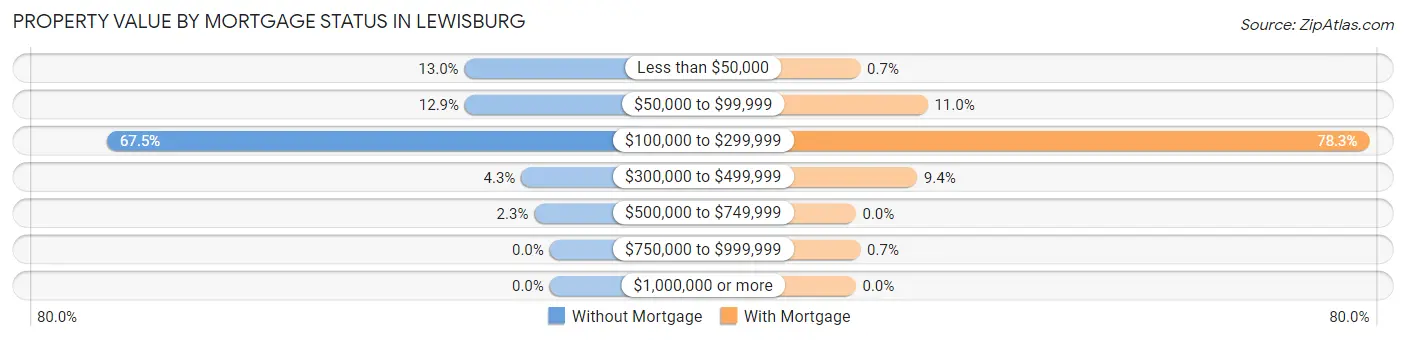
| Property Value | Without Mortgage | With Mortgage |
| Less than $50,000 | 183 (13.0%) | 10 (0.7%) |
| $50,000 to $99,999 | 182 (12.9%) | 156 (11.0%) |
| $100,000 to $299,999 | 951 (67.4%) | 1,114 (78.3%) |
| $300,000 to $499,999 | 61 (4.3%) | 133 (9.3%) |
| $500,000 to $749,999 | 33 (2.3%) | 0 (0.0%) |
| $750,000 to $999,999 | 0 (0.0%) | 10 (0.7%) |
| $1,000,000 or more | 0 (0.0%) | 0 (0.0%) |
| Total | 1,410 (100.0%) | 1,423 (100.0%) |
Household Income by Mortgage Status in Lewisburg
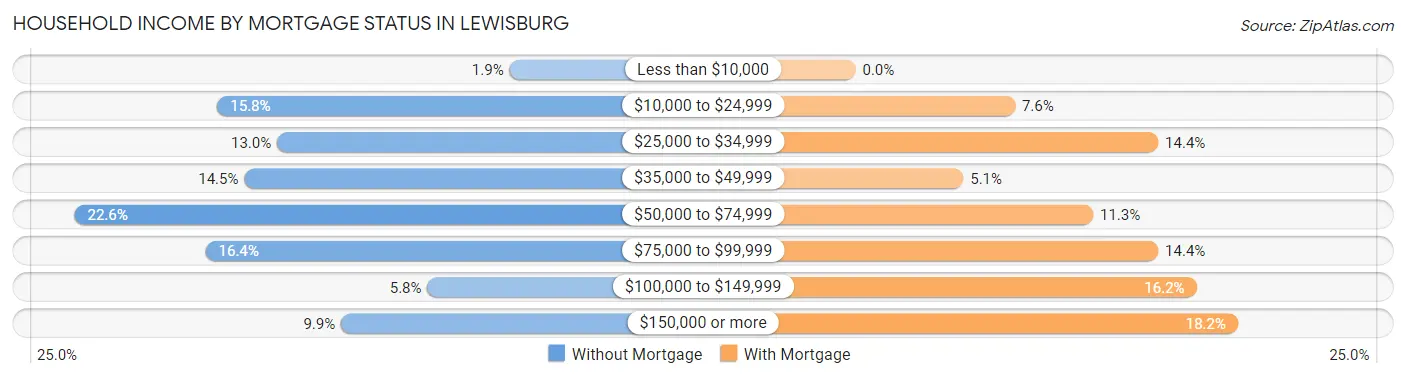
| Household Income | Without Mortgage | With Mortgage |
| Less than $10,000 | 27 (1.9%) | 0 (0.0%) |
| $10,000 to $24,999 | 223 (15.8%) | 108 (7.6%) |
| $25,000 to $34,999 | 183 (13.0%) | 205 (14.4%) |
| $35,000 to $49,999 | 205 (14.5%) | 73 (5.1%) |
| $50,000 to $74,999 | 319 (22.6%) | 161 (11.3%) |
| $75,000 to $99,999 | 231 (16.4%) | 205 (14.4%) |
| $100,000 to $149,999 | 82 (5.8%) | 231 (16.2%) |
| $150,000 or more | 140 (9.9%) | 259 (18.2%) |
| Total | 1,410 (100.0%) | 1,423 (100.0%) |
Property Value to Household Income Ratio in Lewisburg
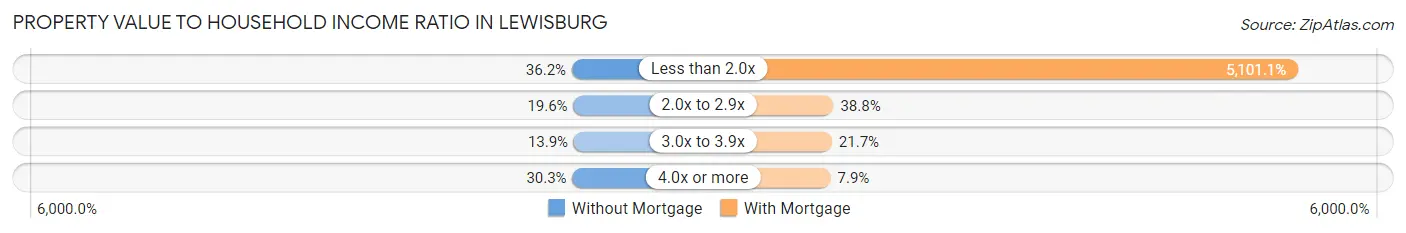
| Value-to-Income Ratio | Without Mortgage | With Mortgage |
| Less than 2.0x | 511 (36.2%) | 72,589 (5,101.1%) |
| 2.0x to 2.9x | 276 (19.6%) | 552 (38.8%) |
| 3.0x to 3.9x | 196 (13.9%) | 309 (21.7%) |
| 4.0x or more | 427 (30.3%) | 112 (7.9%) |
| Total | 1,410 (100.0%) | 1,423 (100.0%) |
Real Estate Taxes by Mortgage Status in Lewisburg
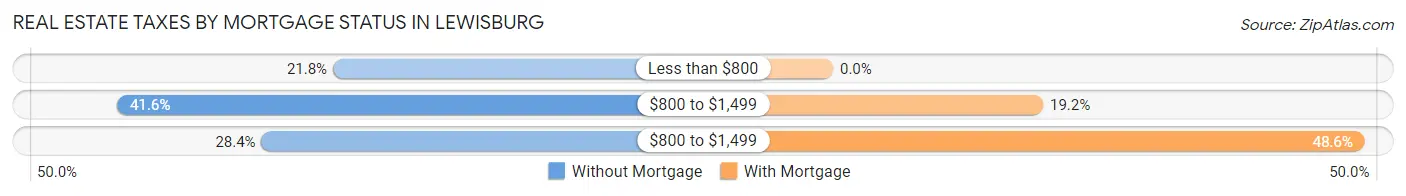
| Property Taxes | Without Mortgage | With Mortgage |
| Less than $800 | 308 (21.8%) | 0 (0.0%) |
| $800 to $1,499 | 586 (41.6%) | 273 (19.2%) |
| $800 to $1,499 | 400 (28.4%) | 691 (48.6%) |
| Total | 1,410 (100.0%) | 1,423 (100.0%) |
Health & Disability in Lewisburg
Health Insurance Coverage by Age in Lewisburg
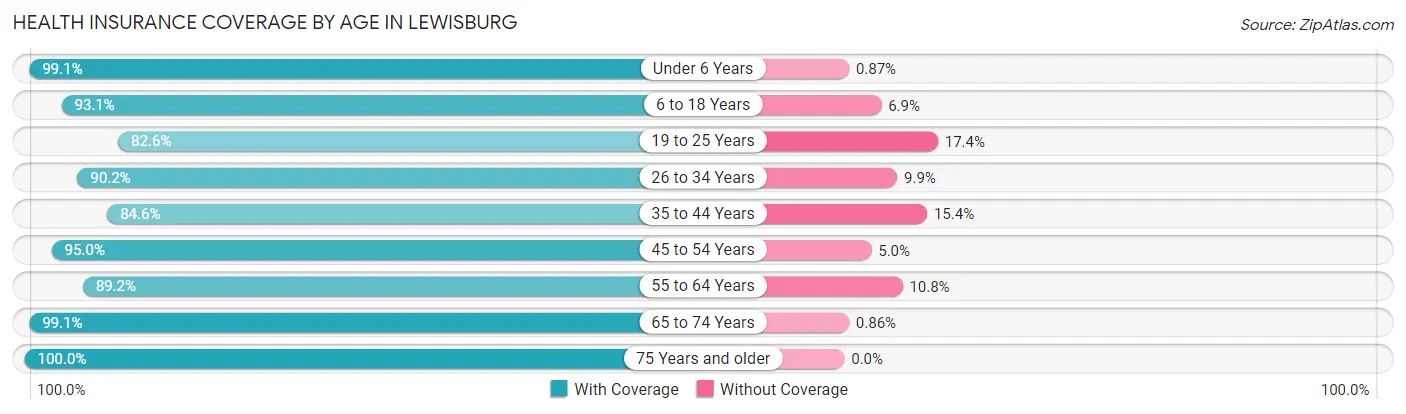
| Age Bracket | With Coverage | Without Coverage |
| Under 6 Years | 1,024 (99.1%) | 9 (0.9%) |
| 6 to 18 Years | 2,248 (93.1%) | 166 (6.9%) |
| 19 to 25 Years | 1,089 (82.6%) | 230 (17.4%) |
| 26 to 34 Years | 1,464 (90.1%) | 160 (9.9%) |
| 35 to 44 Years | 1,135 (84.6%) | 207 (15.4%) |
| 45 to 54 Years | 926 (95.0%) | 49 (5.0%) |
| 55 to 64 Years | 1,324 (89.2%) | 161 (10.8%) |
| 65 to 74 Years | 1,152 (99.1%) | 10 (0.9%) |
| 75 Years and older | 737 (100.0%) | 0 (0.0%) |
| Total | 11,099 (91.8%) | 992 (8.2%) |
Health Insurance Coverage by Citizenship Status in Lewisburg
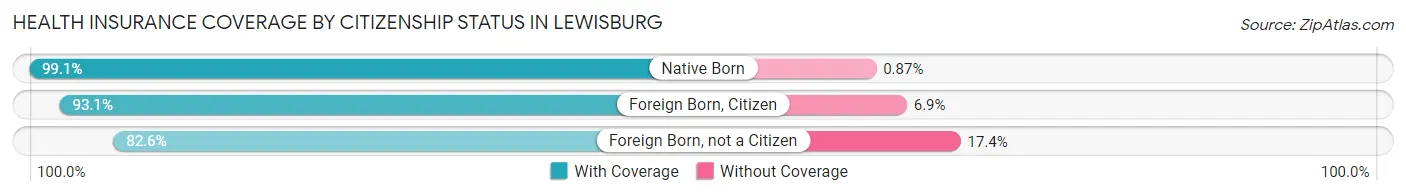
| Citizenship Status | With Coverage | Without Coverage |
| Native Born | 1,024 (99.1%) | 9 (0.9%) |
| Foreign Born, Citizen | 2,248 (93.1%) | 166 (6.9%) |
| Foreign Born, not a Citizen | 1,089 (82.6%) | 230 (17.4%) |
Health Insurance Coverage by Household Income in Lewisburg
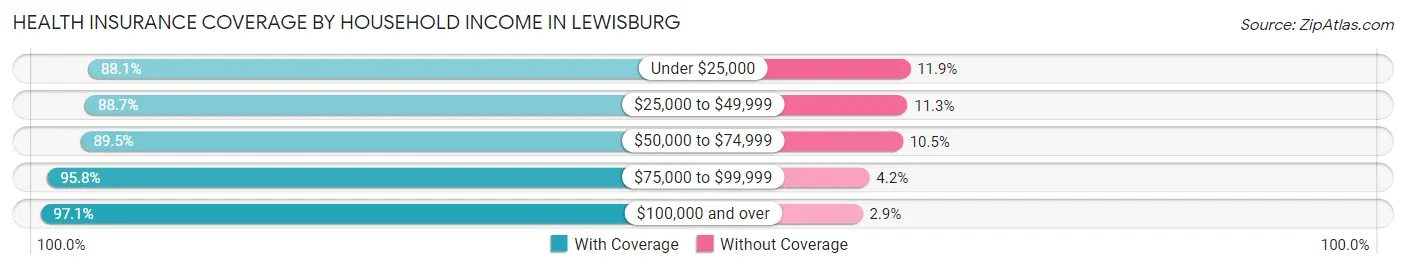
| Household Income | With Coverage | Without Coverage |
| Under $25,000 | 2,010 (88.1%) | 271 (11.9%) |
| $25,000 to $49,999 | 2,504 (88.7%) | 320 (11.3%) |
| $50,000 to $74,999 | 1,830 (89.5%) | 214 (10.5%) |
| $75,000 to $99,999 | 1,874 (95.8%) | 83 (4.2%) |
| $100,000 and over | 2,811 (97.1%) | 85 (2.9%) |
Public vs Private Health Insurance Coverage by Age in Lewisburg
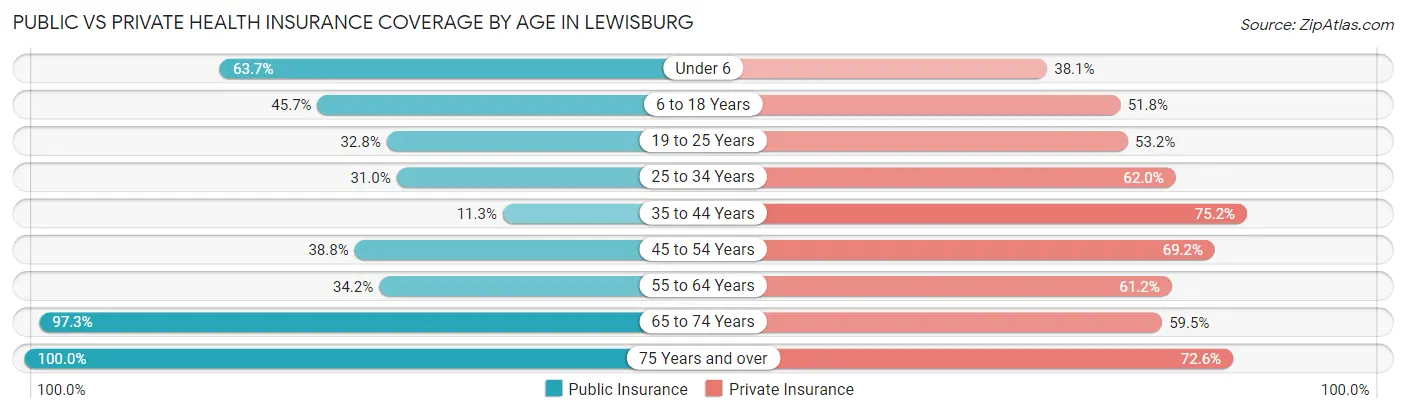
| Age Bracket | Public Insurance | Private Insurance |
| Under 6 | 658 (63.7%) | 394 (38.1%) |
| 6 to 18 Years | 1,102 (45.7%) | 1,250 (51.8%) |
| 19 to 25 Years | 433 (32.8%) | 701 (53.1%) |
| 25 to 34 Years | 503 (31.0%) | 1,006 (62.0%) |
| 35 to 44 Years | 151 (11.3%) | 1,009 (75.2%) |
| 45 to 54 Years | 378 (38.8%) | 675 (69.2%) |
| 55 to 64 Years | 508 (34.2%) | 909 (61.2%) |
| 65 to 74 Years | 1,130 (97.3%) | 691 (59.5%) |
| 75 Years and over | 737 (100.0%) | 535 (72.6%) |
| Total | 5,600 (46.3%) | 7,170 (59.3%) |
Disability Status by Sex by Age in Lewisburg
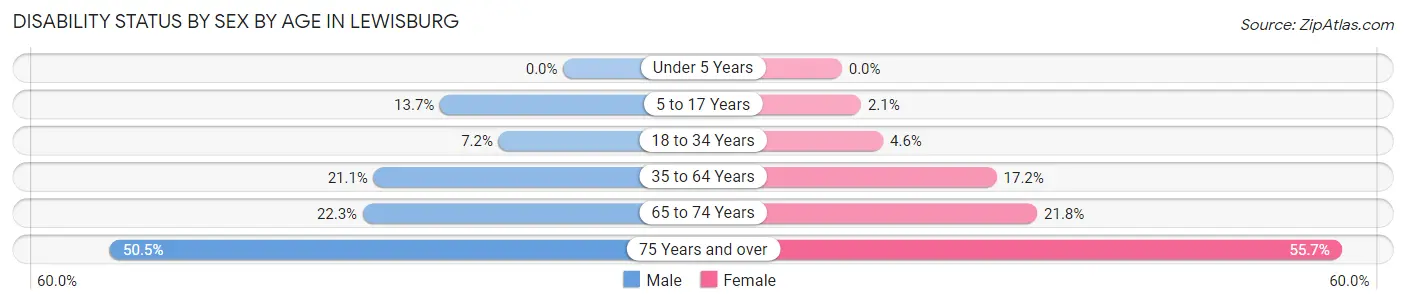
| Age Bracket | Male | Female |
| Under 5 Years | 0 (0.0%) | 0 (0.0%) |
| 5 to 17 Years | 183 (13.7%) | 21 (2.1%) |
| 18 to 34 Years | 105 (7.2%) | 80 (4.6%) |
| 35 to 64 Years | 389 (21.1%) | 338 (17.2%) |
| 65 to 74 Years | 127 (22.3%) | 129 (21.7%) |
| 75 Years and over | 158 (50.5%) | 236 (55.7%) |
Disability Class by Sex by Age in Lewisburg
Disability Class: Hearing Difficulty
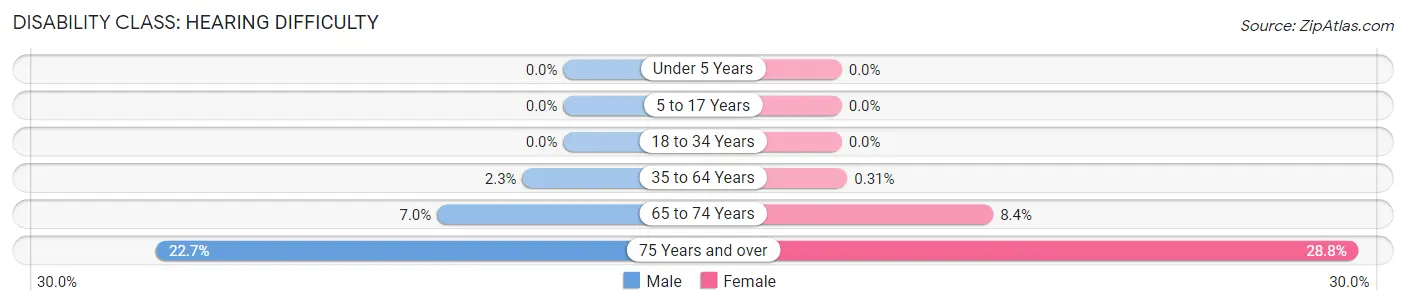
| Age Bracket | Male | Female |
| Under 5 Years | 0 (0.0%) | 0 (0.0%) |
| 5 to 17 Years | 0 (0.0%) | 0 (0.0%) |
| 18 to 34 Years | 0 (0.0%) | 0 (0.0%) |
| 35 to 64 Years | 42 (2.3%) | 6 (0.3%) |
| 65 to 74 Years | 40 (7.0%) | 50 (8.4%) |
| 75 Years and over | 71 (22.7%) | 122 (28.8%) |
Disability Class: Vision Difficulty
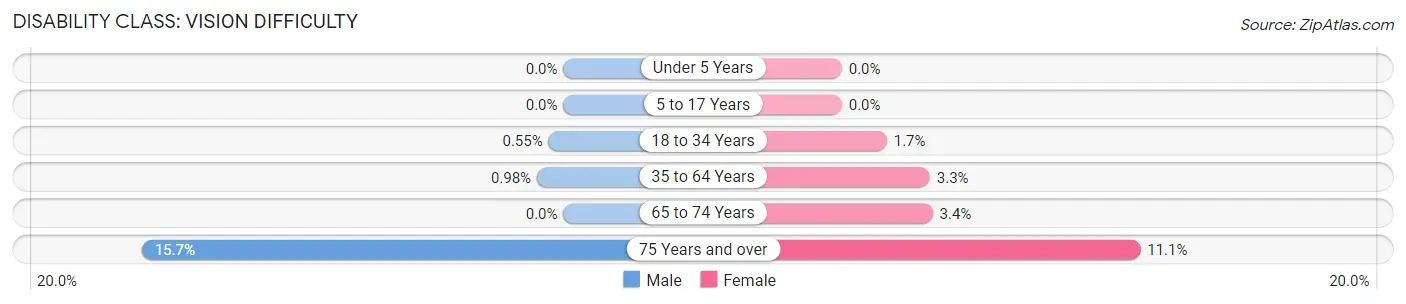
| Age Bracket | Male | Female |
| Under 5 Years | 0 (0.0%) | 0 (0.0%) |
| 5 to 17 Years | 0 (0.0%) | 0 (0.0%) |
| 18 to 34 Years | 8 (0.5%) | 29 (1.7%) |
| 35 to 64 Years | 18 (1.0%) | 64 (3.3%) |
| 65 to 74 Years | 0 (0.0%) | 20 (3.4%) |
| 75 Years and over | 49 (15.7%) | 47 (11.1%) |
Disability Class: Cognitive Difficulty
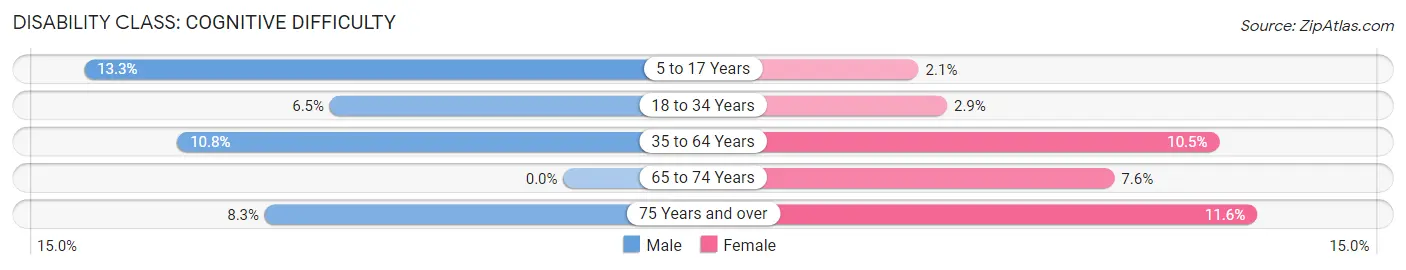
| Age Bracket | Male | Female |
| 5 to 17 Years | 178 (13.3%) | 21 (2.1%) |
| 18 to 34 Years | 95 (6.5%) | 51 (2.9%) |
| 35 to 64 Years | 198 (10.7%) | 206 (10.5%) |
| 65 to 74 Years | 0 (0.0%) | 45 (7.6%) |
| 75 Years and over | 26 (8.3%) | 49 (11.6%) |
Disability Class: Ambulatory Difficulty
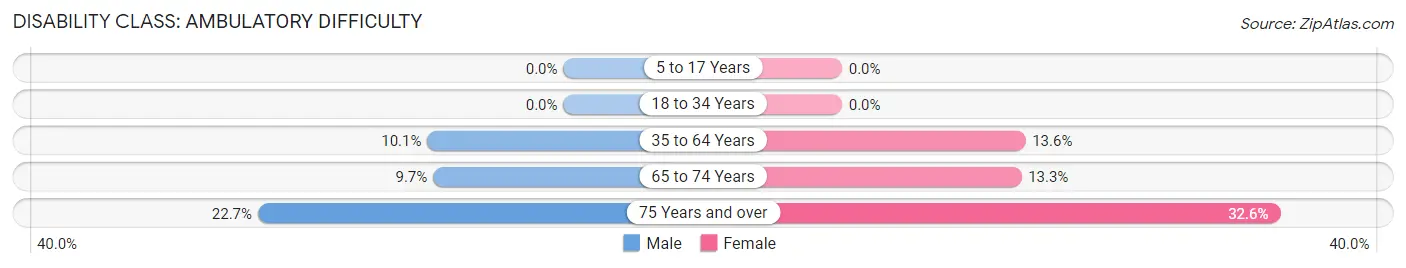
| Age Bracket | Male | Female |
| 5 to 17 Years | 0 (0.0%) | 0 (0.0%) |
| 18 to 34 Years | 0 (0.0%) | 0 (0.0%) |
| 35 to 64 Years | 186 (10.1%) | 267 (13.6%) |
| 65 to 74 Years | 55 (9.7%) | 79 (13.3%) |
| 75 Years and over | 71 (22.7%) | 138 (32.6%) |
Disability Class: Self-Care Difficulty
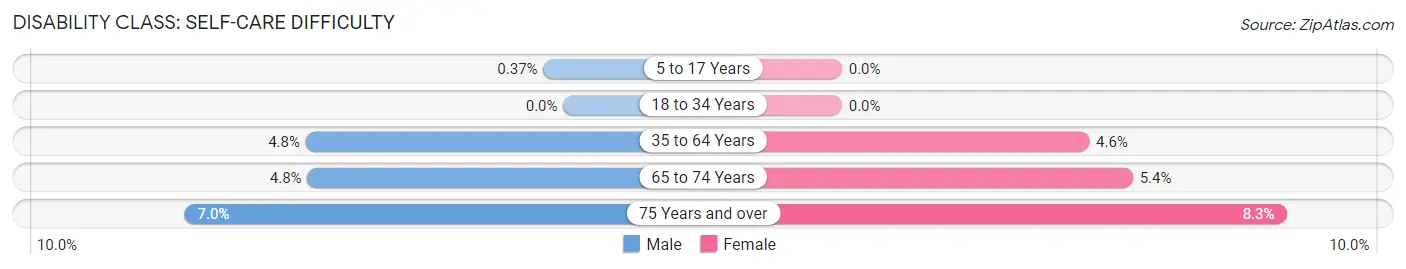
| Age Bracket | Male | Female |
| 5 to 17 Years | 5 (0.4%) | 0 (0.0%) |
| 18 to 34 Years | 0 (0.0%) | 0 (0.0%) |
| 35 to 64 Years | 88 (4.8%) | 90 (4.6%) |
| 65 to 74 Years | 27 (4.8%) | 32 (5.4%) |
| 75 Years and over | 22 (7.0%) | 35 (8.3%) |
Technology Access in Lewisburg
Computing Device Access in Lewisburg
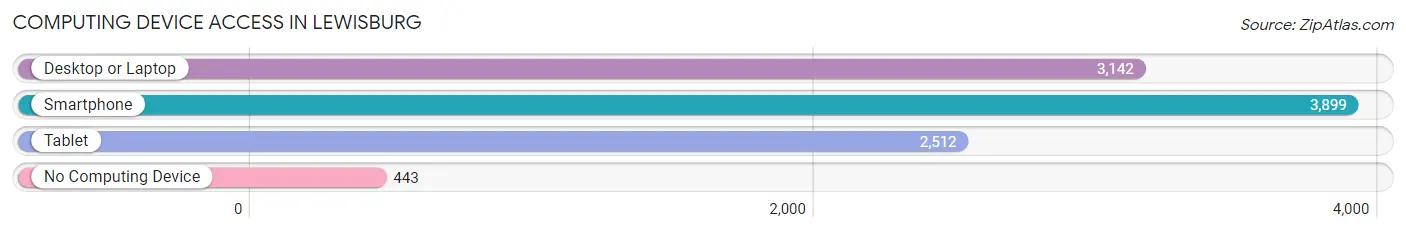
| Device Type | # Households | % Households |
| Desktop or Laptop | 3,142 | 67.6% |
| Smartphone | 3,899 | 83.9% |
| Tablet | 2,512 | 54.0% |
| No Computing Device | 443 | 9.5% |
| Total | 4,649 | 100.0% |
Internet Access in Lewisburg
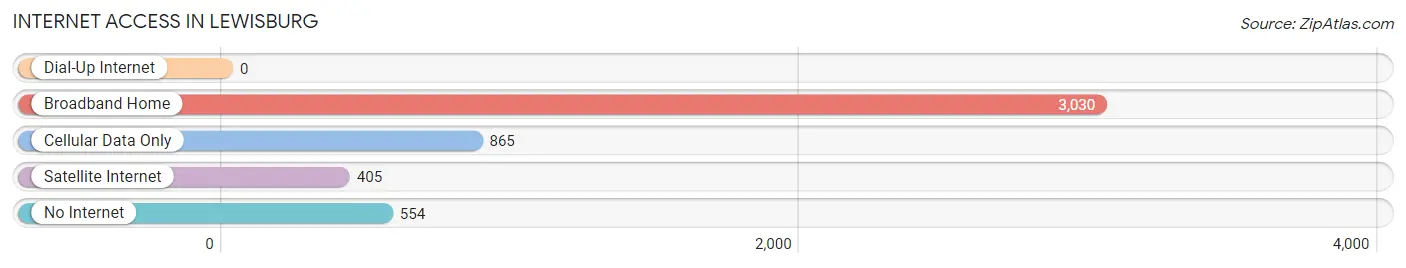
| Internet Type | # Households | % Households |
| Dial-Up Internet | 0 | 0.0% |
| Broadband Home | 3,030 | 65.2% |
| Cellular Data Only | 865 | 18.6% |
| Satellite Internet | 405 | 8.7% |
| No Internet | 554 | 11.9% |
| Total | 4,649 | 100.0% |
Lewisburg Summary
Lewisburg, Tennessee is a small city located in Marshall County, Tennessee. It is the county seat of Marshall County and is located about 50 miles south of Nashville. The city has a population of 11,100 people as of the 2020 census.
History
The area that is now Lewisburg was first settled in the early 1800s by settlers from Virginia and North Carolina. The city was named after General Andrew Lewis, who fought in the Revolutionary War. The city was officially incorporated in 1837.
In the late 1800s, Lewisburg became a major center for the production of cotton and tobacco. The city was also home to several manufacturing companies, including a cotton mill, a tobacco factory, and a furniture factory.
In the early 1900s, Lewisburg was a major stop on the Nashville, Chattanooga and St. Louis Railway. The city was also home to several schools, including the Lewisburg Female Institute, which was founded in 1852.
Geography
Lewisburg is located in the central part of Marshall County, Tennessee. The city is situated on the banks of the Duck River, which flows through the city. The city is surrounded by rolling hills and is located about 50 miles south of Nashville.
The climate in Lewisburg is humid subtropical, with hot summers and mild winters. The average annual temperature is around 62 degrees Fahrenheit. The average annual precipitation is around 45 inches.
Economy
The economy of Lewisburg is largely based on manufacturing and agriculture. The city is home to several manufacturing companies, including a cotton mill, a tobacco factory, and a furniture factory. The city is also home to several agricultural businesses, including a dairy farm and a poultry farm.
The city is also home to several retail stores, restaurants, and other businesses. The city is also home to several educational institutions, including Marshall County High School, Lewisburg High School, and Marshall County Community College.
Demographics
As of the 2020 census, the population of Lewisburg was 11,100 people. The racial makeup of the city was 87.3% White, 8.2% African American, 0.7% Native American, 0.7% Asian, 0.1% Pacific Islander, and 2.9% from other races. The median household income was $37,945, and the median family income was $45,945.
Conclusion
Lewisburg, Tennessee is a small city located in Marshall County, Tennessee. It is the county seat of Marshall County and is located about 50 miles south of Nashville. The city has a population of 11,100 people as of the 2020 census. The economy of Lewisburg is largely based on manufacturing and agriculture, and the city is home to several educational institutions. The racial makeup of the city is 87.3% White, 8.2% African American, 0.7% Native American, 0.7% Asian, 0.1% Pacific Islander, and 2.9% from other races. The median household income was $37,945, and the median family income was $45,945.
Common Questions
What is Per Capita Income in Lewisburg?
Per Capita income in Lewisburg is $26,266.
What is the Median Family Income in Lewisburg?
Median Family Income in Lewisburg is $61,035.
What is the Median Household income in Lewisburg?
Median Household Income in Lewisburg is $45,938.
What is Income or Wage Gap in Lewisburg?
Income or Wage Gap in Lewisburg is 24.6%.
Women in Lewisburg earn 75.4 cents for every dollar earned by a man.
What is Family Income Deficit in Lewisburg?
Family Income Deficit in Lewisburg is $8,860.
Families that are below poverty line in Lewisburg earn $8,860 less on average than the poverty threshold level.
What is Inequality or Gini Index in Lewisburg?
Inequality or Gini Index in Lewisburg is 0.46.
What is the Total Population of Lewisburg?
Total Population of Lewisburg is 12,376.
What is the Total Male Population of Lewisburg?
Total Male Population of Lewisburg is 6,201.
What is the Total Female Population of Lewisburg?
Total Female Population of Lewisburg is 6,175.
What is the Ratio of Males per 100 Females in Lewisburg?
There are 100.42 Males per 100 Females in Lewisburg.
What is the Ratio of Females per 100 Males in Lewisburg?
There are 99.58 Females per 100 Males in Lewisburg.
What is the Median Population Age in Lewisburg?
Median Population Age in Lewisburg is 33.0 Years.
What is the Average Family Size in Lewisburg
Average Family Size in Lewisburg is 3.3 People.
What is the Average Household Size in Lewisburg
Average Household Size in Lewisburg is 2.6 People.
How Large is the Labor Force in Lewisburg?
There are 5,678 People in the Labor Forcein in Lewisburg.
What is the Percentage of People in the Labor Force in Lewisburg?
59.2% of People are in the Labor Force in Lewisburg.
What is the Unemployment Rate in Lewisburg?
Unemployment Rate in Lewisburg is 7.9%.