Bristol, TN Map & Demographics
Bristol Map
Bristol Overview
$31,202
PER CAPITA INCOME
$64,044
AVG FAMILY INCOME
$49,130
AVG HOUSEHOLD INCOME
25.8%
WAGE / INCOME GAP [ % ]
74.2¢/ $1
WAGE / INCOME GAP [ $ ]
$9,668
FAMILY INCOME DEFICIT
0.47
INEQUALITY / GINI INDEX
27,307
TOTAL POPULATION
12,822
MALE POPULATION
14,485
FEMALE POPULATION
88.52
MALES / 100 FEMALES
112.97
FEMALES / 100 MALES
40.2
MEDIAN AGE
2.9
AVG FAMILY SIZE
2.2
AVG HOUSEHOLD SIZE
12,747
LABOR FORCE [ PEOPLE ]
57.9%
PERCENT IN LABOR FORCE
8.8%
UNEMPLOYMENT RATE
Bristol Zip Codes
Bristol Area Codes
Income in Bristol
Income Overview in Bristol
Per Capita Income in Bristol is $31,202, while median incomes of families and households are $64,044 and $49,130 respectively.
| Characteristic | Number | Measure |
| Per Capita Income | 27,307 | $31,202 |
| Median Family Income | 7,123 | $64,044 |
| Mean Family Income | 7,123 | $86,564 |
| Median Household Income | 11,865 | $49,130 |
| Mean Household Income | 11,865 | $71,119 |
| Income Deficit | 7,123 | $9,668 |
| Wage / Income Gap (%) | 27,307 | 25.85% |
| Wage / Income Gap ($) | 27,307 | 74.15¢ per $1 |
| Gini / Inequality Index | 27,307 | 0.47 |
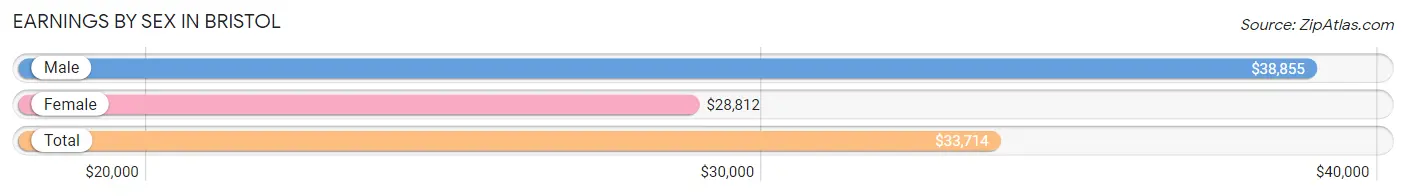
Earnings by Sex in Bristol
Average Earnings in Bristol are $33,714, $38,855 for men and $28,812 for women, a difference of 25.9%.
| Sex | Number | Average Earnings |
| Male | 6,810 (51.9%) | $38,855 |
| Female | 6,300 (48.0%) | $28,812 |
| Total | 13,110 (100.0%) | $33,714 |
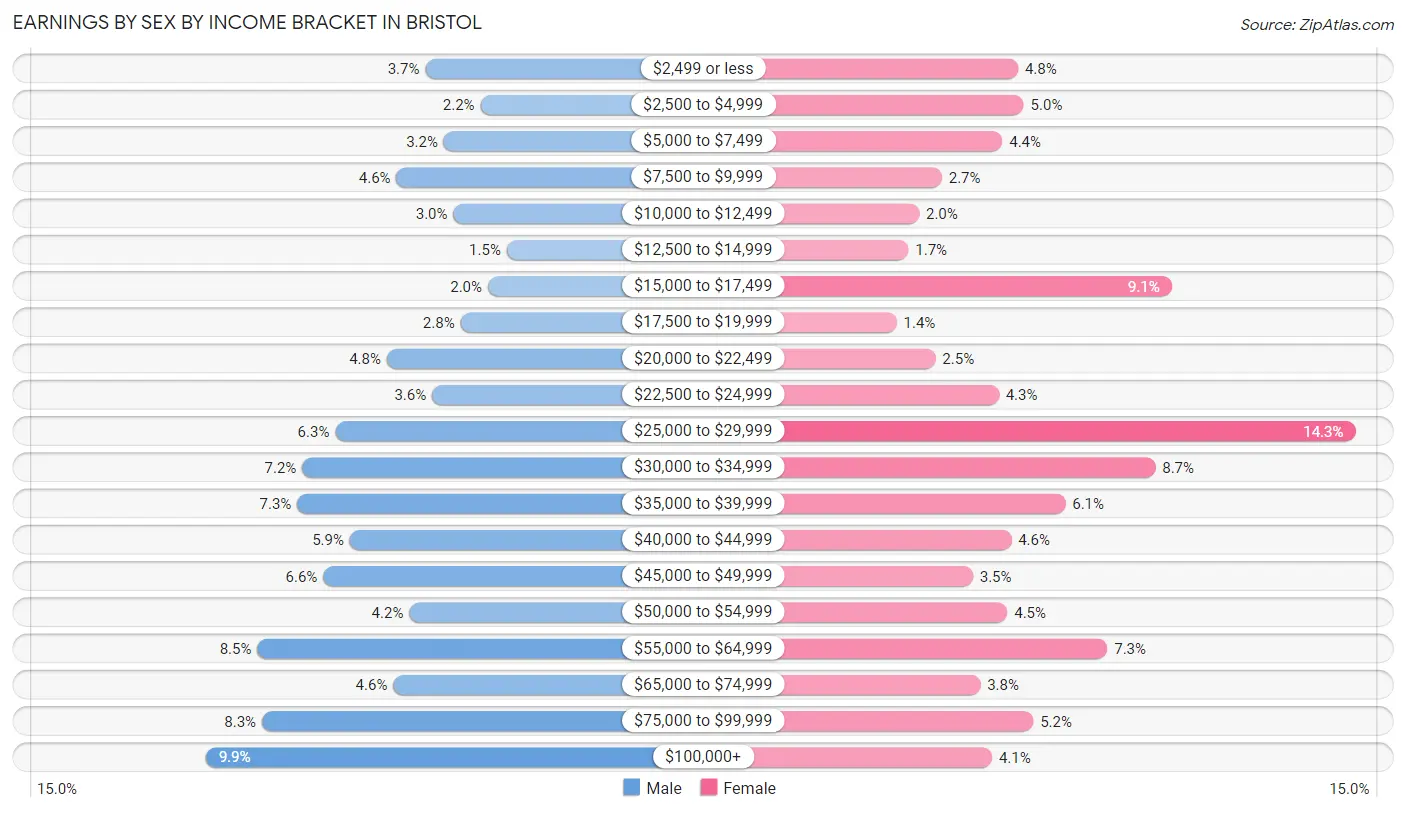
Earnings by Sex by Income Bracket in Bristol
The most common earnings brackets in Bristol are $100,000+ for men (675 | 9.9%) and $25,000 to $29,999 for women (900 | 14.3%).
| Income | Male | Female |
| $2,499 or less | 255 (3.7%) | 303 (4.8%) |
| $2,500 to $4,999 | 149 (2.2%) | 313 (5.0%) |
| $5,000 to $7,499 | 219 (3.2%) | 275 (4.4%) |
| $7,500 to $9,999 | 310 (4.5%) | 168 (2.7%) |
| $10,000 to $12,499 | 201 (2.9%) | 128 (2.0%) |
| $12,500 to $14,999 | 99 (1.5%) | 109 (1.7%) |
| $15,000 to $17,499 | 135 (2.0%) | 575 (9.1%) |
| $17,500 to $19,999 | 187 (2.8%) | 88 (1.4%) |
| $20,000 to $22,499 | 328 (4.8%) | 157 (2.5%) |
| $22,500 to $24,999 | 242 (3.5%) | 269 (4.3%) |
| $25,000 to $29,999 | 427 (6.3%) | 900 (14.3%) |
| $30,000 to $34,999 | 490 (7.2%) | 546 (8.7%) |
| $35,000 to $39,999 | 500 (7.3%) | 387 (6.1%) |
| $40,000 to $44,999 | 399 (5.9%) | 291 (4.6%) |
| $45,000 to $49,999 | 450 (6.6%) | 223 (3.5%) |
| $50,000 to $54,999 | 285 (4.2%) | 284 (4.5%) |
| $55,000 to $64,999 | 576 (8.5%) | 461 (7.3%) |
| $65,000 to $74,999 | 316 (4.6%) | 236 (3.7%) |
| $75,000 to $99,999 | 567 (8.3%) | 330 (5.2%) |
| $100,000+ | 675 (9.9%) | 257 (4.1%) |
| Total | 6,810 (100.0%) | 6,300 (100.0%) |
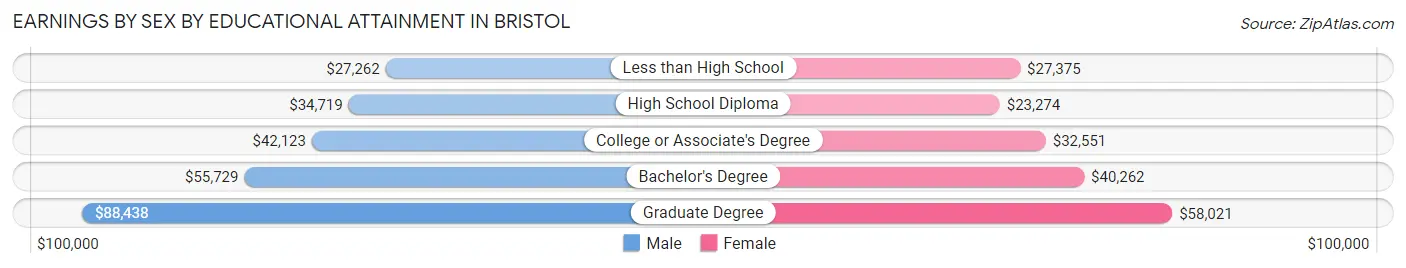
Earnings by Sex by Educational Attainment in Bristol
Average earnings in Bristol are $44,951 for men and $32,699 for women, a difference of 27.3%. Men with an educational attainment of graduate degree enjoy the highest average annual earnings of $88,438, while those with less than high school education earn the least with $27,262. Women with an educational attainment of graduate degree earn the most with the average annual earnings of $58,021, while those with high school diploma education have the smallest earnings of $23,274.
| Educational Attainment | Male Income | Female Income |
| Less than High School | $27,262 | $27,375 |
| High School Diploma | $34,719 | $23,274 |
| College or Associate's Degree | $42,123 | $32,551 |
| Bachelor's Degree | $55,729 | $40,262 |
| Graduate Degree | $88,438 | $58,021 |
| Total | $44,951 | $32,699 |
Family Income in Bristol
Family Income Brackets in Bristol
According to the Bristol family income data, there are 1,346 families falling into the $100,000 to $149,999 income range, which is the most common income bracket and makes up 18.9% of all families. Conversely, the $10,000 to $14,999 income bracket is the least frequent group with only 164 families (2.3%) belonging to this category.
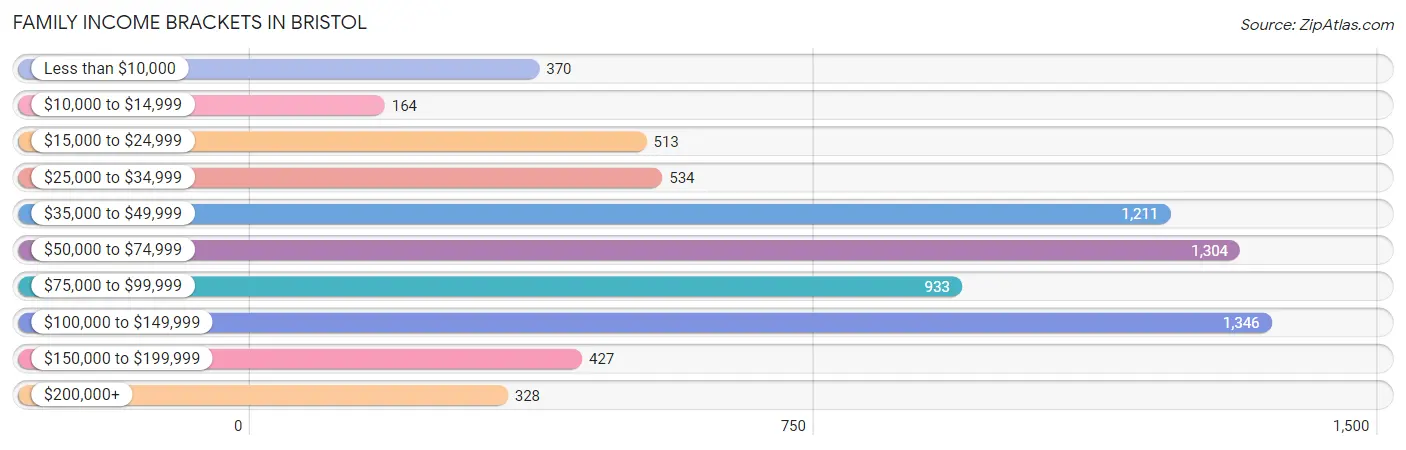
| Income Bracket | # Families | % Families |
| Less than $10,000 | 370 | 5.2% |
| $10,000 to $14,999 | 164 | 2.3% |
| $15,000 to $24,999 | 513 | 7.2% |
| $25,000 to $34,999 | 534 | 7.5% |
| $35,000 to $49,999 | 1,211 | 17.0% |
| $50,000 to $74,999 | 1,304 | 18.3% |
| $75,000 to $99,999 | 933 | 13.1% |
| $100,000 to $149,999 | 1,346 | 18.9% |
| $150,000 to $199,999 | 427 | 6.0% |
| $200,000+ | 328 | 4.6% |
Family Income by Famaliy Size in Bristol
6-person families (208 | 2.9%) account for the highest median family income in Bristol with $100,433 per family, while 2-person families (3,843 | 53.9%) have the highest median income of $30,059 per family member.
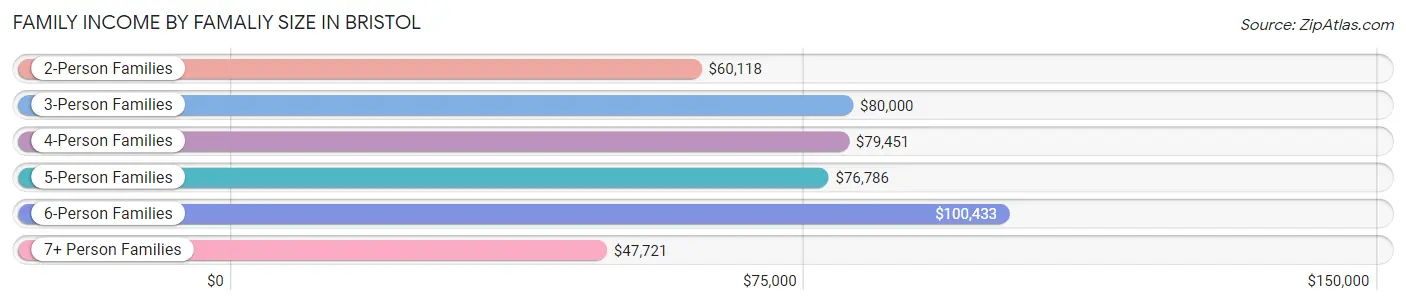
| Income Bracket | # Families | Median Income |
| 2-Person Families | 3,843 (53.9%) | $60,118 |
| 3-Person Families | 1,456 (20.4%) | $80,000 |
| 4-Person Families | 1,118 (15.7%) | $79,451 |
| 5-Person Families | 370 (5.2%) | $76,786 |
| 6-Person Families | 208 (2.9%) | $100,433 |
| 7+ Person Families | 128 (1.8%) | $47,721 |
| Total | 7,123 (100.0%) | $64,044 |
Family Income by Number of Earners in Bristol
The median family income in Bristol is $64,044, with families comprising 3+ earners (483) having the highest median family income of $106,972, while families with no earners (1,465) have the lowest median family income of $40,234, accounting for 6.8% and 20.6% of families, respectively.
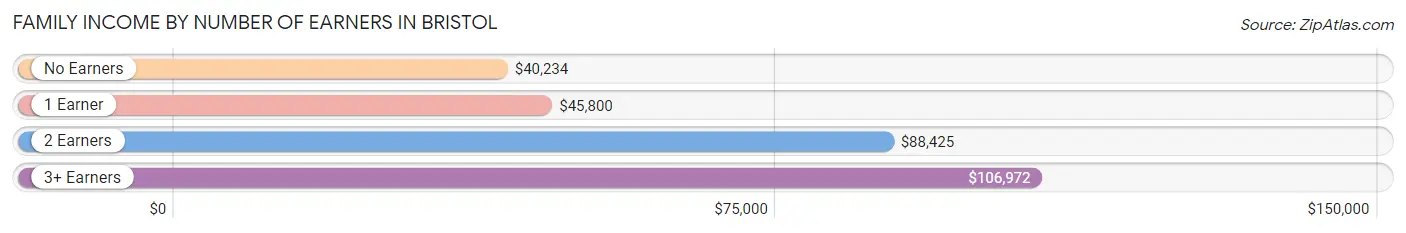
| Number of Earners | # Families | Median Income |
| No Earners | 1,465 (20.6%) | $40,234 |
| 1 Earner | 2,626 (36.9%) | $45,800 |
| 2 Earners | 2,549 (35.8%) | $88,425 |
| 3+ Earners | 483 (6.8%) | $106,972 |
| Total | 7,123 (100.0%) | $64,044 |
Household Income in Bristol
Household Income Brackets in Bristol
With 2,017 households falling in the category, the $35,000 to $49,999 income range is the most frequent in Bristol, accounting for 17.0% of all households. In contrast, only 427 households (3.6%) fall into the $200,000+ income bracket, making it the least populous group.
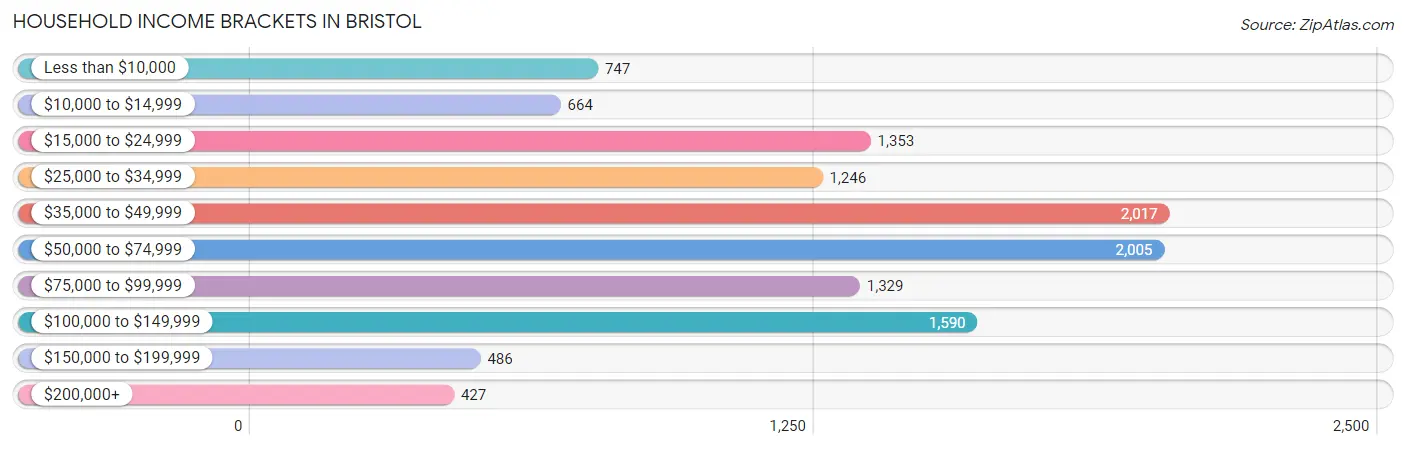
| Income Bracket | # Households | % Households |
| Less than $10,000 | 747 | 6.3% |
| $10,000 to $14,999 | 664 | 5.6% |
| $15,000 to $24,999 | 1,353 | 11.4% |
| $25,000 to $34,999 | 1,246 | 10.5% |
| $35,000 to $49,999 | 2,017 | 17.0% |
| $50,000 to $74,999 | 2,005 | 16.9% |
| $75,000 to $99,999 | 1,329 | 11.2% |
| $100,000 to $149,999 | 1,590 | 13.4% |
| $150,000 to $199,999 | 486 | 4.1% |
| $200,000+ | 427 | 3.6% |
Household Income by Householder Age in Bristol
The median household income in Bristol is $49,130, with the highest median household income of $57,750 found in the 45 to 64 years age bracket for the primary householder. A total of 4,324 households (36.4%) fall into this category. Meanwhile, the 65+ years age bracket for the primary householder has the lowest median household income of $39,115, with 3,435 households (28.9%) in this group.
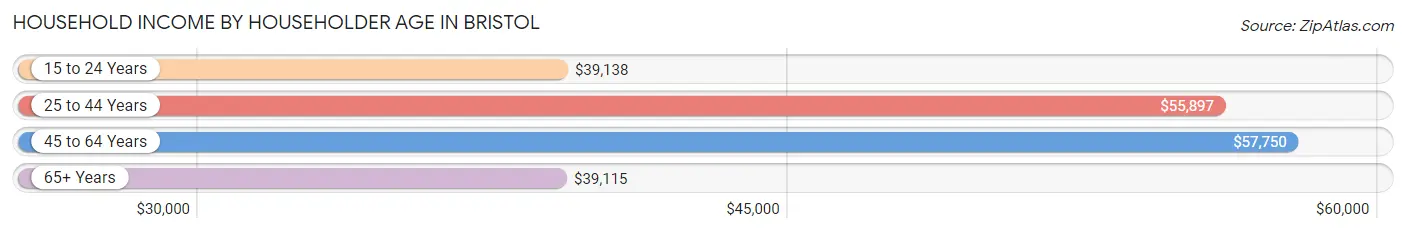
| Income Bracket | # Households | Median Income |
| 15 to 24 Years | 676 (5.7%) | $39,138 |
| 25 to 44 Years | 3,430 (28.9%) | $55,897 |
| 45 to 64 Years | 4,324 (36.4%) | $57,750 |
| 65+ Years | 3,435 (28.9%) | $39,115 |
| Total | 11,865 (100.0%) | $49,130 |
Poverty in Bristol
Income Below Poverty by Sex and Age in Bristol
With 14.5% poverty level for males and 20.4% for females among the residents of Bristol, 15 year old males and under 5 year old females are the most vulnerable to poverty, with 87 males (43.7%) and 327 females (40.7%) in their respective age groups living below the poverty level.
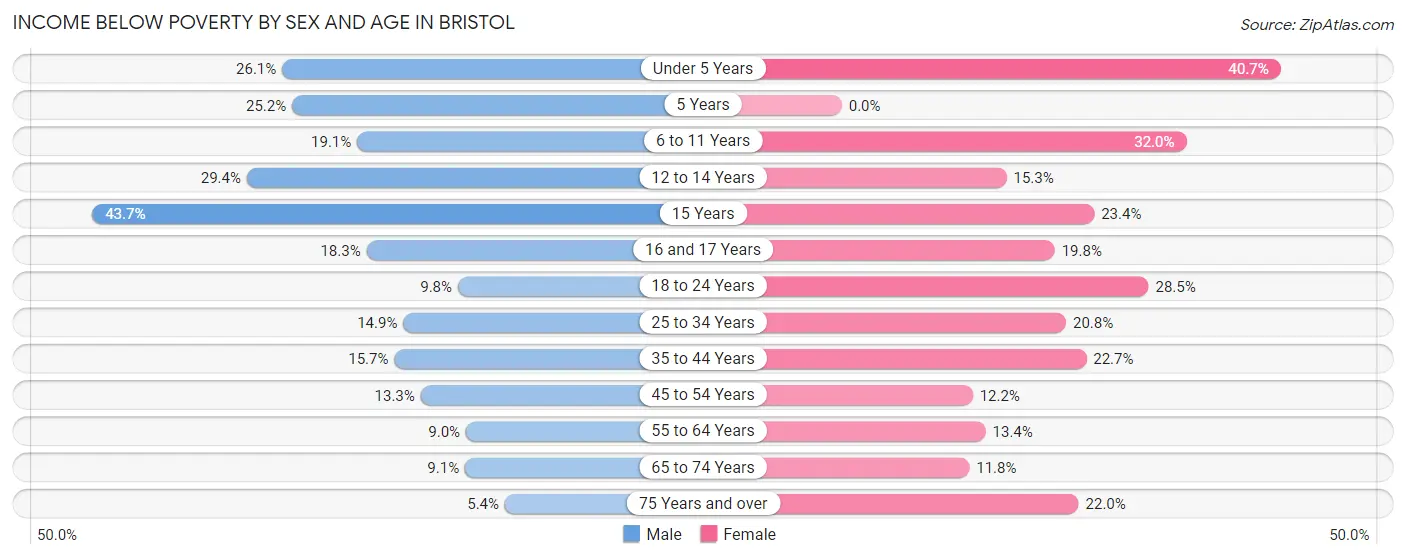
| Age Bracket | Male | Female |
| Under 5 Years | 225 (26.1%) | 327 (40.7%) |
| 5 Years | 35 (25.2%) | 0 (0.0%) |
| 6 to 11 Years | 188 (19.1%) | 375 (32.0%) |
| 12 to 14 Years | 124 (29.4%) | 61 (15.3%) |
| 15 Years | 87 (43.7%) | 41 (23.4%) |
| 16 and 17 Years | 55 (18.3%) | 66 (19.8%) |
| 18 to 24 Years | 101 (9.8%) | 351 (28.5%) |
| 25 to 34 Years | 286 (14.9%) | 392 (20.8%) |
| 35 to 44 Years | 217 (15.7%) | 329 (22.7%) |
| 45 to 54 Years | 202 (13.3%) | 215 (12.1%) |
| 55 to 64 Years | 152 (9.0%) | 278 (13.4%) |
| 65 to 74 Years | 116 (9.1%) | 183 (11.8%) |
| 75 Years and over | 49 (5.4%) | 284 (22.0%) |
| Total | 1,837 (14.5%) | 2,902 (20.4%) |
Income Above Poverty by Sex and Age in Bristol
According to the poverty statistics in Bristol, males aged 75 years and over and females aged 5 years are the age groups that are most secure financially, with 94.6% of males and 100.0% of females in these age groups living above the poverty line.
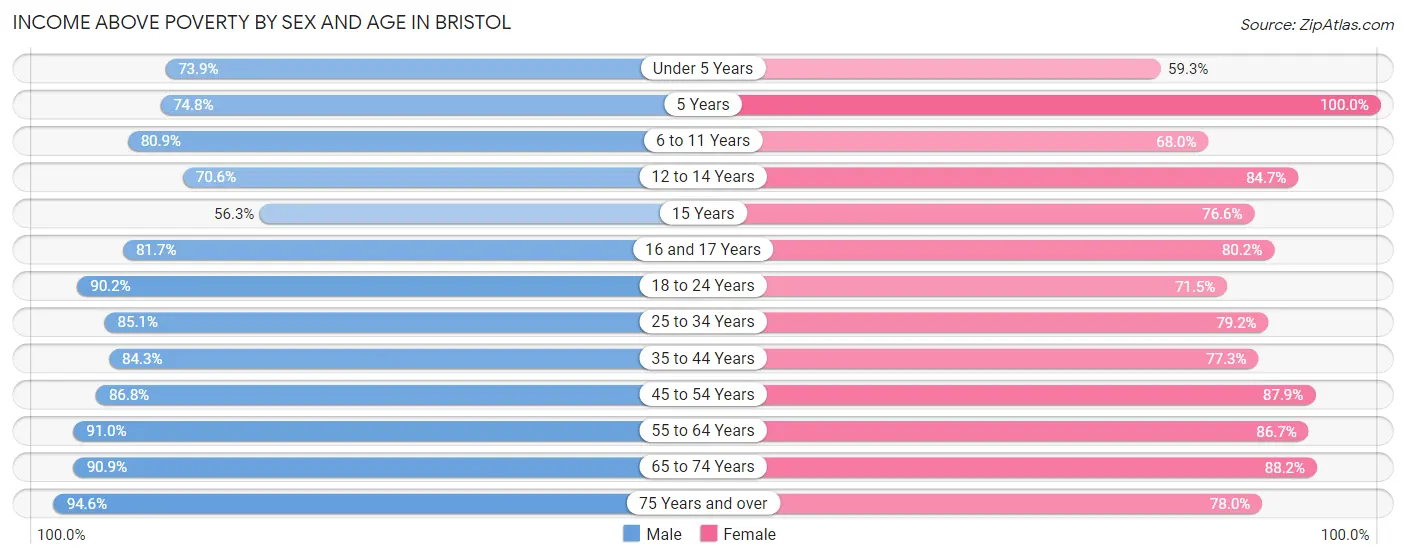
| Age Bracket | Male | Female |
| Under 5 Years | 637 (73.9%) | 476 (59.3%) |
| 5 Years | 104 (74.8%) | 75 (100.0%) |
| 6 to 11 Years | 794 (80.9%) | 798 (68.0%) |
| 12 to 14 Years | 298 (70.6%) | 338 (84.7%) |
| 15 Years | 112 (56.3%) | 134 (76.6%) |
| 16 and 17 Years | 246 (81.7%) | 268 (80.2%) |
| 18 to 24 Years | 931 (90.2%) | 882 (71.5%) |
| 25 to 34 Years | 1,639 (85.1%) | 1,492 (79.2%) |
| 35 to 44 Years | 1,166 (84.3%) | 1,121 (77.3%) |
| 45 to 54 Years | 1,322 (86.8%) | 1,554 (87.8%) |
| 55 to 64 Years | 1,530 (91.0%) | 1,804 (86.7%) |
| 65 to 74 Years | 1,154 (90.9%) | 1,364 (88.2%) |
| 75 Years and over | 854 (94.6%) | 1,008 (78.0%) |
| Total | 10,787 (85.5%) | 11,314 (79.6%) |
Income Below Poverty Among Married-Couple Families in Bristol
The poverty statistics for married-couple families in Bristol show that 7.2% or 343 of the total 4,792 families live below the poverty line. Families with 5 or more children have the highest poverty rate of 68.8%, comprising of 53 families. On the other hand, families with no children have the lowest poverty rate of 4.5%, which includes 129 families.
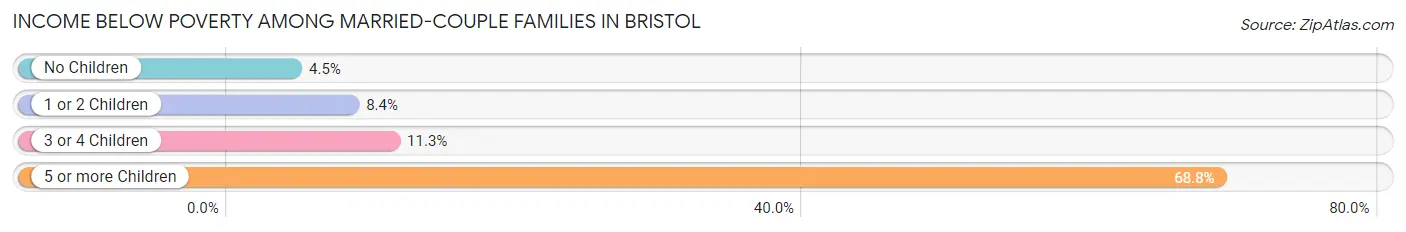
| Children | Above Poverty | Below Poverty |
| No Children | 2,762 (95.5%) | 129 (4.5%) |
| 1 or 2 Children | 1,443 (91.6%) | 133 (8.4%) |
| 3 or 4 Children | 220 (88.7%) | 28 (11.3%) |
| 5 or more Children | 24 (31.2%) | 53 (68.8%) |
| Total | 4,449 (92.8%) | 343 (7.2%) |
Income Below Poverty Among Single-Parent Households in Bristol
According to the poverty data in Bristol, 18.8% or 111 single-father households and 35.1% or 610 single-mother households are living below the poverty line. Among single-father households, those with 3 or 4 children have the highest poverty rate, with 22 households (40.0%) experiencing poverty. Likewise, among single-mother households, those with 5 or more children have the highest poverty rate, with 38 households (100.0%) falling below the poverty line.
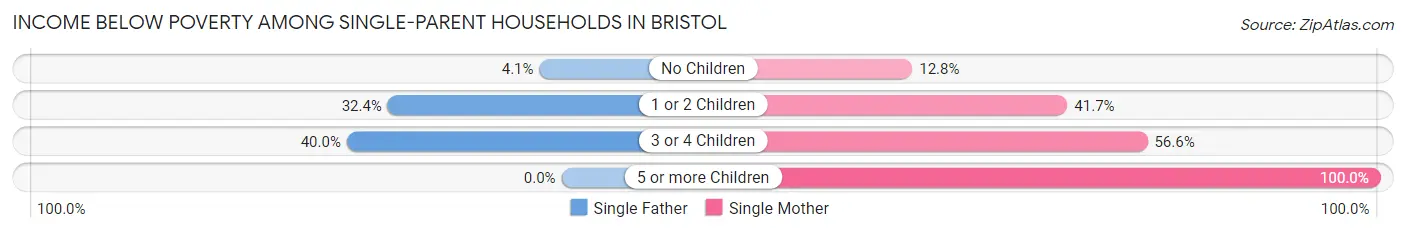
| Children | Single Father | Single Mother |
| No Children | 11 (4.1%) | 69 (12.8%) |
| 1 or 2 Children | 78 (32.4%) | 430 (41.7%) |
| 3 or 4 Children | 22 (40.0%) | 73 (56.6%) |
| 5 or more Children | 0 (0.0%) | 38 (100.0%) |
| Total | 111 (18.8%) | 610 (35.1%) |
Income Below Poverty Among Married-Couple vs Single-Parent Households in Bristol
The poverty data for Bristol shows that 343 of the married-couple family households (7.2%) and 721 of the single-parent households (30.9%) are living below the poverty level. Within the married-couple family households, those with 5 or more children have the highest poverty rate, with 53 households (68.8%) falling below the poverty line. Among the single-parent households, those with 5 or more children have the highest poverty rate, with 38 household (56.7%) living below poverty.
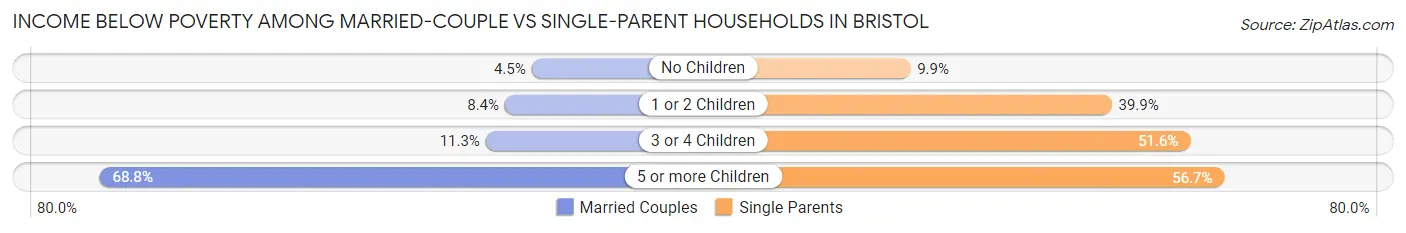
| Children | Married-Couple Families | Single-Parent Households |
| No Children | 129 (4.5%) | 80 (9.9%) |
| 1 or 2 Children | 133 (8.4%) | 508 (39.9%) |
| 3 or 4 Children | 28 (11.3%) | 95 (51.6%) |
| 5 or more Children | 53 (68.8%) | 38 (56.7%) |
| Total | 343 (7.2%) | 721 (30.9%) |
Race in Bristol
The most populous races in Bristol are White / Caucasian (24,721 | 90.5%), Two or more Races (1,424 | 5.2%), and Hispanic or Latino (964 | 3.5%).
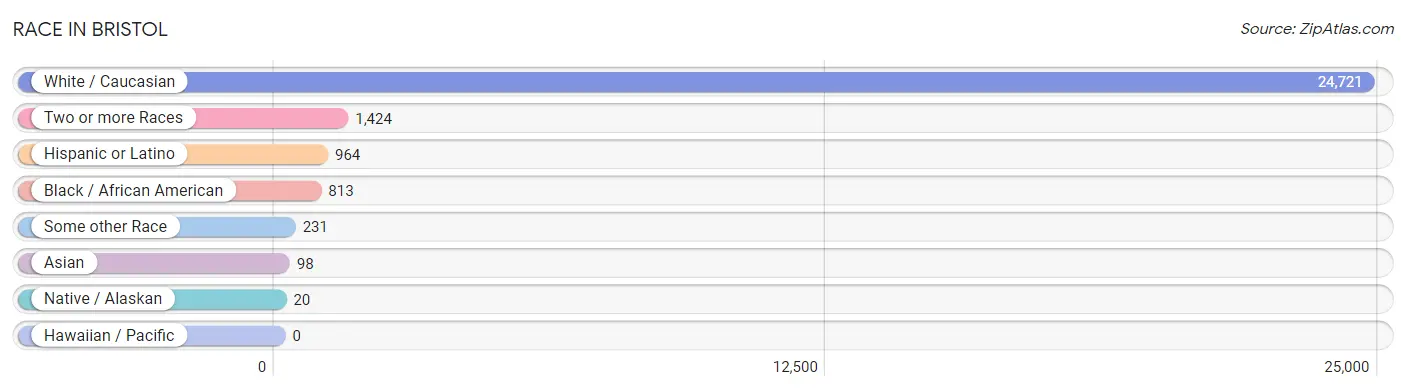
| Race | # Population | % Population |
| Asian | 98 | 0.4% |
| Black / African American | 813 | 3.0% |
| Hawaiian / Pacific | 0 | 0.0% |
| Hispanic or Latino | 964 | 3.5% |
| Native / Alaskan | 20 | 0.1% |
| White / Caucasian | 24,721 | 90.5% |
| Two or more Races | 1,424 | 5.2% |
| Some other Race | 231 | 0.9% |
| Total | 27,307 | 100.0% |
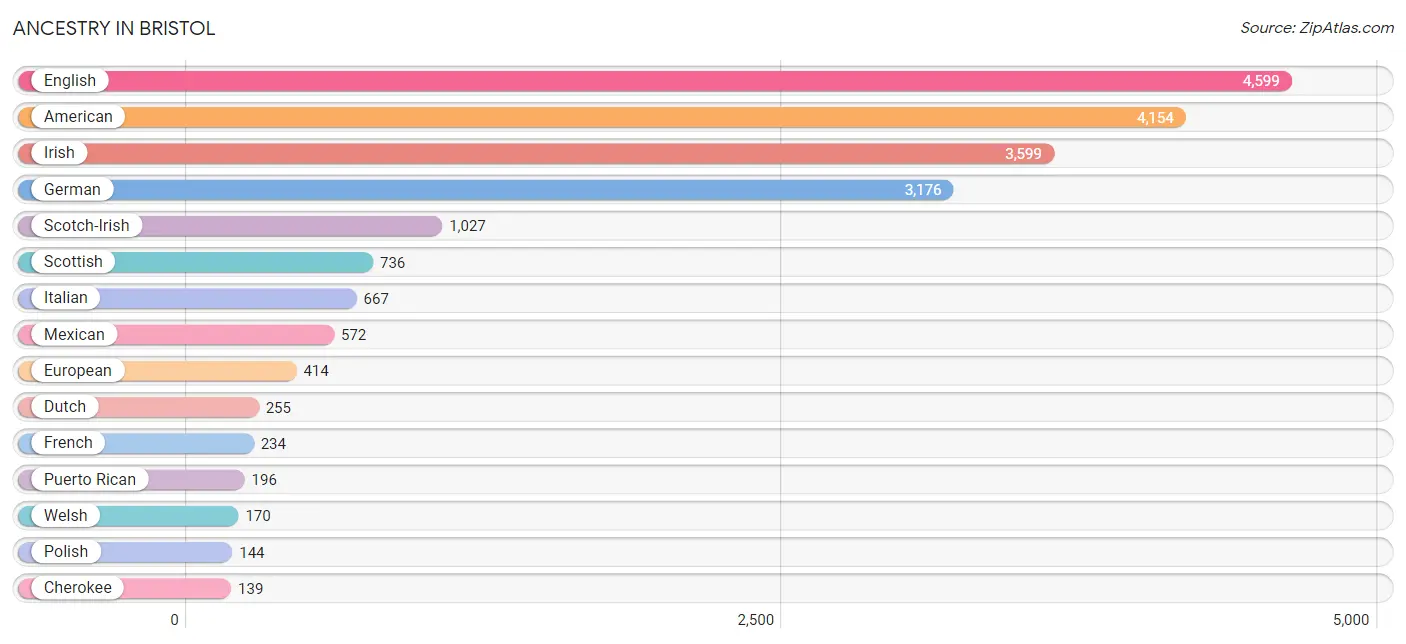
Ancestry in Bristol
The most populous ancestries reported in Bristol are English (4,599 | 16.8%), American (4,154 | 15.2%), Irish (3,599 | 13.2%), German (3,176 | 11.6%), and Scotch-Irish (1,027 | 3.8%), together accounting for 60.6% of all Bristol residents.
| Ancestry | # Population | % Population |
| African | 78 | 0.3% |
| Albanian | 11 | 0.0% |
| American | 4,154 | 15.2% |
| Arab | 34 | 0.1% |
| Assyrian / Chaldean / Syriac | 47 | 0.2% |
| Australian | 25 | 0.1% |
| Austrian | 18 | 0.1% |
| Bhutanese | 39 | 0.1% |
| Blackfeet | 14 | 0.1% |
| Bolivian | 33 | 0.1% |
| British | 109 | 0.4% |
| Bulgarian | 52 | 0.2% |
| Burmese | 33 | 0.1% |
| Canadian | 12 | 0.0% |
| Central American | 36 | 0.1% |
| Cherokee | 139 | 0.5% |
| Chippewa | 4 | 0.0% |
| Croatian | 15 | 0.1% |
| Cuban | 43 | 0.2% |
| Cypriot | 15 | 0.1% |
| Czech | 55 | 0.2% |
| Danish | 24 | 0.1% |
| Dutch | 255 | 0.9% |
| Eastern European | 28 | 0.1% |
| English | 4,599 | 16.8% |
| Ethiopian | 4 | 0.0% |
| European | 414 | 1.5% |
| Finnish | 42 | 0.2% |
| French | 234 | 0.9% |
| French Canadian | 15 | 0.1% |
| German | 3,176 | 11.6% |
| Greek | 48 | 0.2% |
| Honduran | 17 | 0.1% |
| Hungarian | 44 | 0.2% |
| Indian (Asian) | 22 | 0.1% |
| Iranian | 20 | 0.1% |
| Irish | 3,599 | 13.2% |
| Italian | 667 | 2.4% |
| Jamaican | 80 | 0.3% |
| Korean | 33 | 0.1% |
| Lebanese | 15 | 0.1% |
| Lithuanian | 7 | 0.0% |
| Lumbee | 7 | 0.0% |
| Macedonian | 5 | 0.0% |
| Mexican | 572 | 2.1% |
| Northern European | 54 | 0.2% |
| Norwegian | 60 | 0.2% |
| Pakistani | 4 | 0.0% |
| Polish | 144 | 0.5% |
| Portuguese | 11 | 0.0% |
| Puerto Rican | 196 | 0.7% |
| Romanian | 14 | 0.1% |
| Russian | 50 | 0.2% |
| Scandinavian | 27 | 0.1% |
| Scotch-Irish | 1,027 | 3.8% |
| Scottish | 736 | 2.7% |
| Seminole | 1 | 0.0% |
| Sioux | 10 | 0.0% |
| Slovak | 23 | 0.1% |
| South American | 48 | 0.2% |
| Spaniard | 2 | 0.0% |
| Spanish | 45 | 0.2% |
| Sri Lankan | 6 | 0.0% |
| Subsaharan African | 82 | 0.3% |
| Swedish | 100 | 0.4% |
| Swiss | 49 | 0.2% |
| Thai | 52 | 0.2% |
| Trinidadian and Tobagonian | 5 | 0.0% |
| Ukrainian | 33 | 0.1% |
| Uruguayan | 15 | 0.1% |
| Welsh | 170 | 0.6% |
| Yugoslavian | 9 | 0.0% | View All 72 Rows |
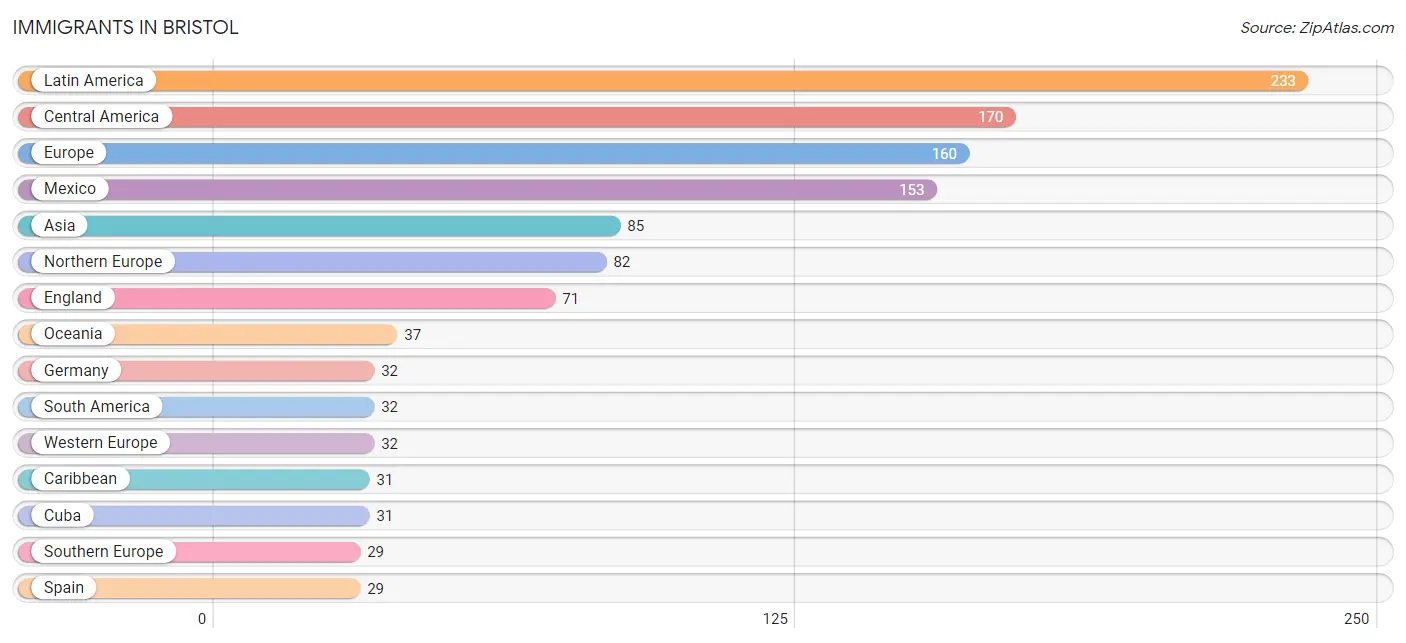
Immigrants in Bristol
The most numerous immigrant groups reported in Bristol came from Latin America (233 | 0.9%), Central America (170 | 0.6%), Europe (160 | 0.6%), Mexico (153 | 0.6%), and Asia (85 | 0.3%), together accounting for 2.9% of all Bristol residents.
| Immigration Origin | # Population | % Population |
| Asia | 85 | 0.3% |
| Australia | 26 | 0.1% |
| Bosnia and Herzegovina | 9 | 0.0% |
| Canada | 20 | 0.1% |
| Caribbean | 31 | 0.1% |
| Central America | 170 | 0.6% |
| China | 11 | 0.0% |
| Colombia | 9 | 0.0% |
| Croatia | 8 | 0.0% |
| Cuba | 31 | 0.1% |
| Eastern Asia | 17 | 0.1% |
| Eastern Europe | 17 | 0.1% |
| England | 71 | 0.3% |
| Europe | 160 | 0.6% |
| Germany | 32 | 0.1% |
| Guyana | 23 | 0.1% |
| Honduras | 17 | 0.1% |
| India | 6 | 0.0% |
| Iran | 20 | 0.1% |
| Korea | 6 | 0.0% |
| Latin America | 233 | 0.9% |
| Mexico | 153 | 0.6% |
| Northern Europe | 82 | 0.3% |
| Oceania | 37 | 0.1% |
| Philippines | 23 | 0.1% |
| South America | 32 | 0.1% |
| South Central Asia | 26 | 0.1% |
| South Eastern Asia | 27 | 0.1% |
| Southern Europe | 29 | 0.1% |
| Spain | 29 | 0.1% |
| Thailand | 4 | 0.0% |
| Western Asia | 15 | 0.1% |
| Western Europe | 32 | 0.1% | View All 33 Rows |
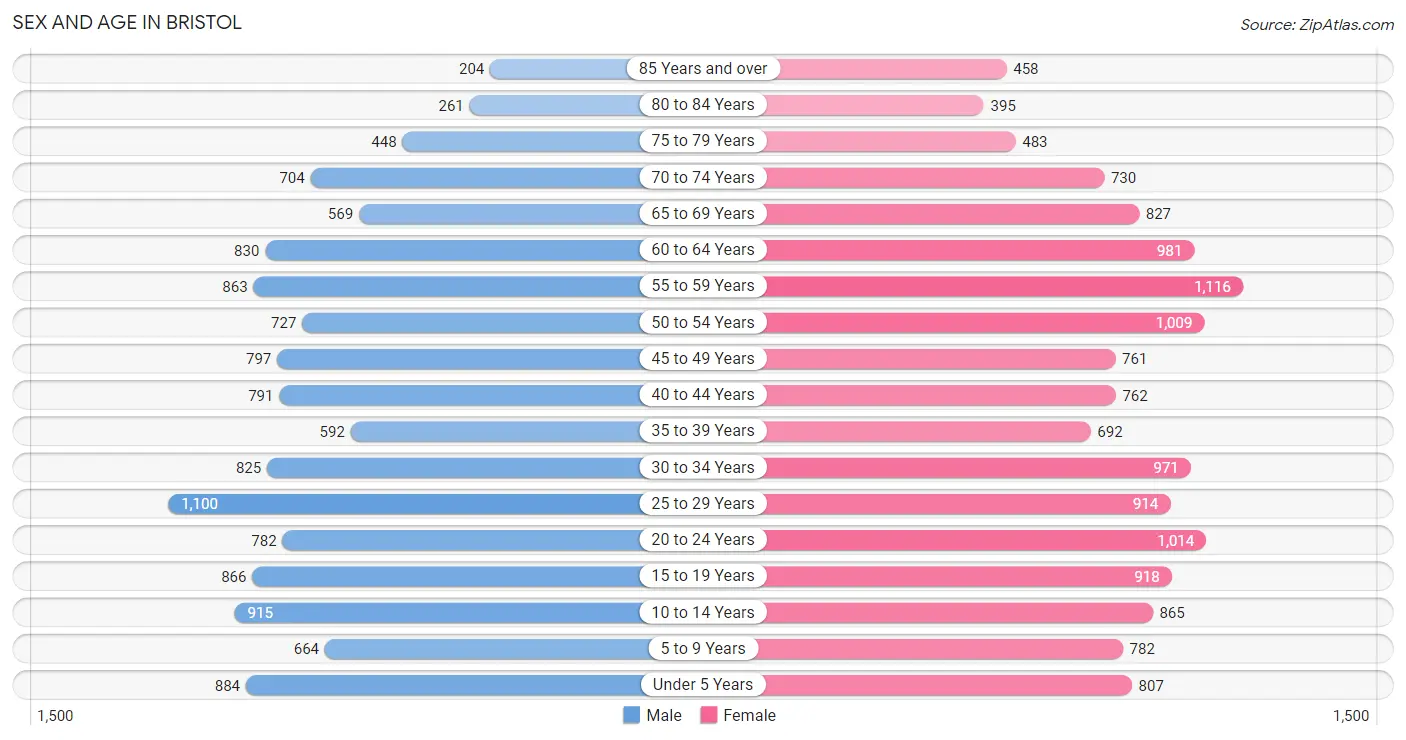
Sex and Age in Bristol
Sex and Age in Bristol
The most populous age groups in Bristol are 25 to 29 Years (1,100 | 8.6%) for men and 55 to 59 Years (1,116 | 7.7%) for women.
| Age Bracket | Male | Female |
| Under 5 Years | 884 (6.9%) | 807 (5.6%) |
| 5 to 9 Years | 664 (5.2%) | 782 (5.4%) |
| 10 to 14 Years | 915 (7.1%) | 865 (6.0%) |
| 15 to 19 Years | 866 (6.8%) | 918 (6.3%) |
| 20 to 24 Years | 782 (6.1%) | 1,014 (7.0%) |
| 25 to 29 Years | 1,100 (8.6%) | 914 (6.3%) |
| 30 to 34 Years | 825 (6.4%) | 971 (6.7%) |
| 35 to 39 Years | 592 (4.6%) | 692 (4.8%) |
| 40 to 44 Years | 791 (6.2%) | 762 (5.3%) |
| 45 to 49 Years | 797 (6.2%) | 761 (5.2%) |
| 50 to 54 Years | 727 (5.7%) | 1,009 (7.0%) |
| 55 to 59 Years | 863 (6.7%) | 1,116 (7.7%) |
| 60 to 64 Years | 830 (6.5%) | 981 (6.8%) |
| 65 to 69 Years | 569 (4.4%) | 827 (5.7%) |
| 70 to 74 Years | 704 (5.5%) | 730 (5.0%) |
| 75 to 79 Years | 448 (3.5%) | 483 (3.3%) |
| 80 to 84 Years | 261 (2.0%) | 395 (2.7%) |
| 85 Years and over | 204 (1.6%) | 458 (3.2%) |
| Total | 12,822 (100.0%) | 14,485 (100.0%) |
Families and Households in Bristol
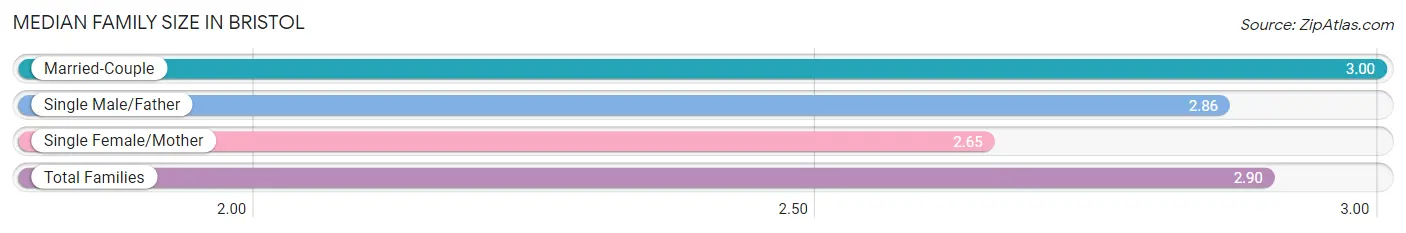
Median Family Size in Bristol
The median family size in Bristol is 2.90 persons per family, with married-couple families (4,792 | 67.3%) accounting for the largest median family size of 3 persons per family. On the other hand, single female/mother families (1,739 | 24.4%) represent the smallest median family size with 2.65 persons per family.
| Family Type | # Families | Family Size |
| Married-Couple | 4,792 (67.3%) | 3.00 |
| Single Male/Father | 592 (8.3%) | 2.86 |
| Single Female/Mother | 1,739 (24.4%) | 2.65 |
| Total Families | 7,123 (100.0%) | 2.90 |
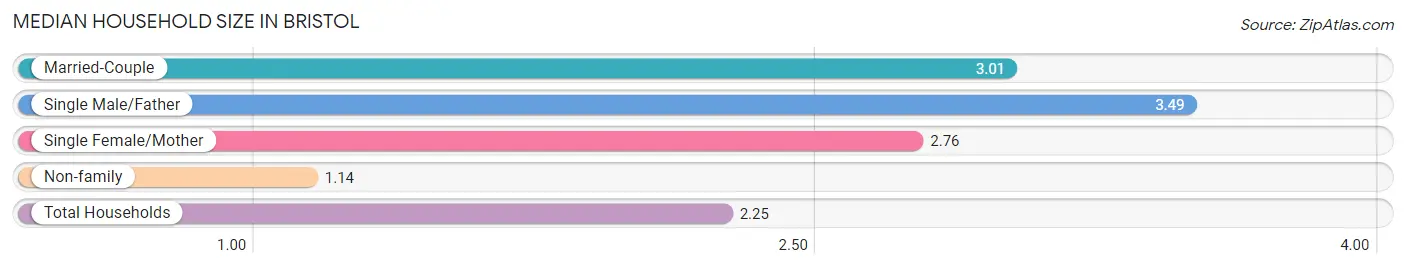
Median Household Size in Bristol
The median household size in Bristol is 2.25 persons per household, with single male/father households (592 | 5.0%) accounting for the largest median household size of 3.49 persons per household. non-family households (4,742 | 40.0%) represent the smallest median household size with 1.14 persons per household.
| Household Type | # Households | Household Size |
| Married-Couple | 4,792 (40.4%) | 3.01 |
| Single Male/Father | 592 (5.0%) | 3.49 |
| Single Female/Mother | 1,739 (14.7%) | 2.76 |
| Non-family | 4,742 (40.0%) | 1.14 |
| Total Households | 11,865 (100.0%) | 2.25 |
Household Size by Marriage Status in Bristol
Out of a total of 11,865 households in Bristol, 7,123 (60.0%) are family households, while 4,742 (40.0%) are nonfamily households. The most numerous type of family households are 2-person households, comprising 3,668, and the most common type of nonfamily households are 1-person households, comprising 4,249.
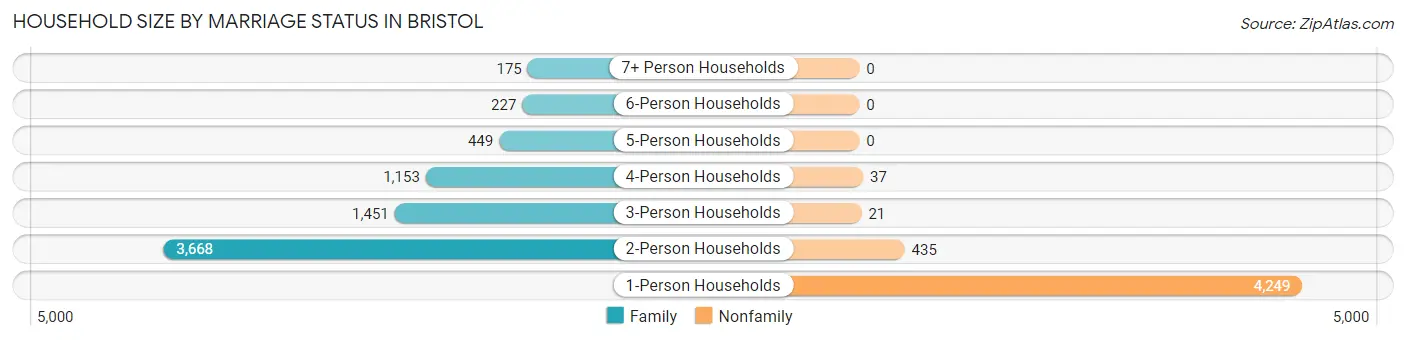
| Household Size | Family Households | Nonfamily Households |
| 1-Person Households | - | 4,249 (35.8%) |
| 2-Person Households | 3,668 (30.9%) | 435 (3.7%) |
| 3-Person Households | 1,451 (12.2%) | 21 (0.2%) |
| 4-Person Households | 1,153 (9.7%) | 37 (0.3%) |
| 5-Person Households | 449 (3.8%) | 0 (0.0%) |
| 6-Person Households | 227 (1.9%) | 0 (0.0%) |
| 7+ Person Households | 175 (1.5%) | 0 (0.0%) |
| Total | 7,123 (60.0%) | 4,742 (40.0%) |
Female Fertility in Bristol
Fertility by Age in Bristol
Average fertility rate in Bristol is 46.0 births per 1,000 women. Women in the age bracket of 20 to 34 years have the highest fertility rate with 85.0 births per 1,000 women. Women in the age bracket of 20 to 34 years acount for 85.4% of all women with births.
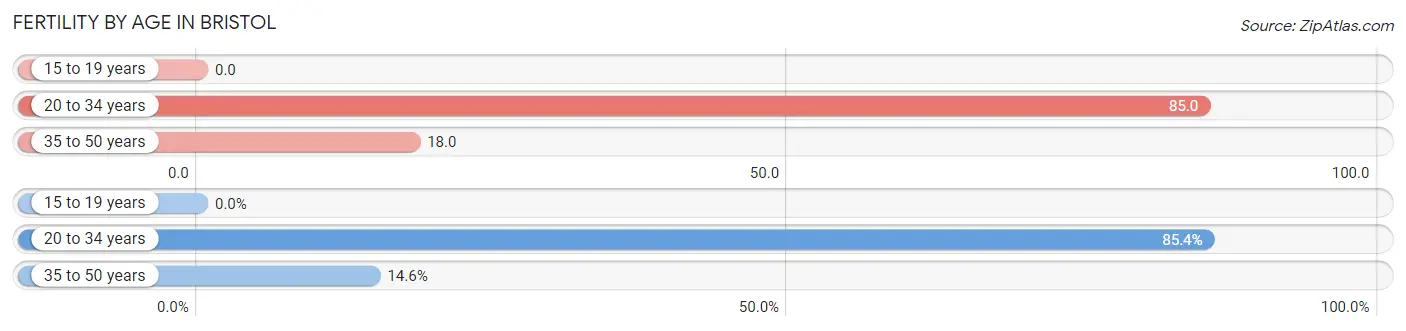
| Age Bracket | Women with Births | Births / 1,000 Women |
| 15 to 19 years | 0 (0.0%) | 0.0 |
| 20 to 34 years | 245 (85.4%) | 85.0 |
| 35 to 50 years | 42 (14.6%) | 18.0 |
| Total | 287 (100.0%) | 46.0 |
Fertility by Age by Marriage Status in Bristol
56.8% of women with births (287) in Bristol are married. The highest percentage of unmarried women with births falls into 20 to 34 years age bracket with 50.6% of them unmarried at the time of birth, while the lowest percentage of unmarried women with births belong to 35 to 50 years age bracket with 0.0% of them unmarried.
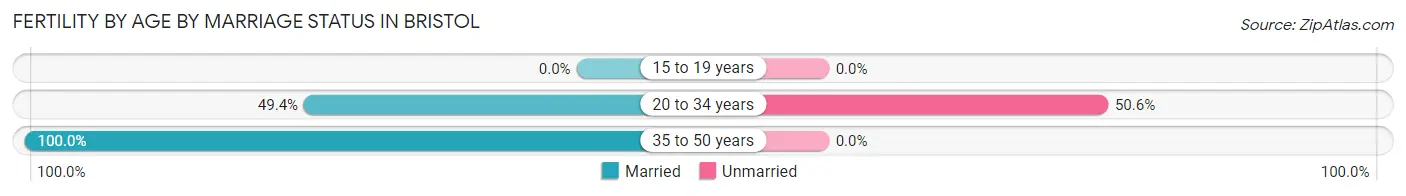
| Age Bracket | Married | Unmarried |
| 15 to 19 years | 0 (0.0%) | 0 (0.0%) |
| 20 to 34 years | 121 (49.4%) | 124 (50.6%) |
| 35 to 50 years | 42 (100.0%) | 0 (0.0%) |
| Total | 163 (56.8%) | 124 (43.2%) |
Fertility by Education in Bristol
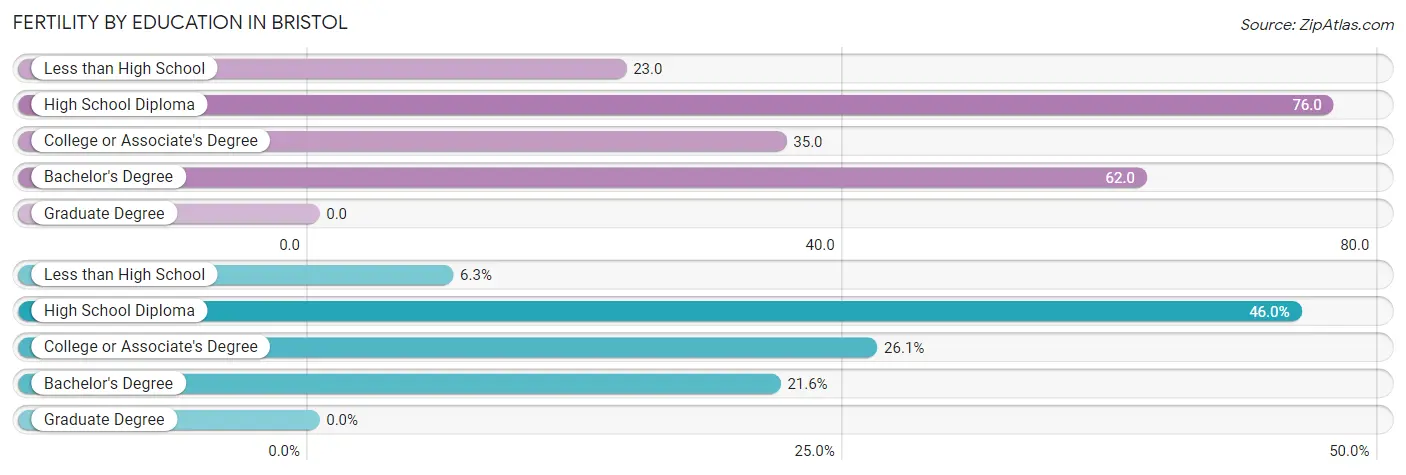
| Educational Attainment | Women with Births | Births / 1,000 Women |
| Less than High School | 18 (6.3%) | 23.0 |
| High School Diploma | 132 (46.0%) | 76.0 |
| College or Associate's Degree | 75 (26.1%) | 35.0 |
| Bachelor's Degree | 62 (21.6%) | 62.0 |
| Graduate Degree | 0 (0.0%) | 0.0 |
| Total | 287 (100.0%) | 46.0 |
Fertility by Education by Marriage Status in Bristol
43.2% of women with births in Bristol are unmarried. Women with the educational attainment of bachelor's degree are most likely to be married with 100.0% of them married at childbirth, while women with the educational attainment of less than high school are least likely to be married with 100.0% of them unmarried at childbirth.
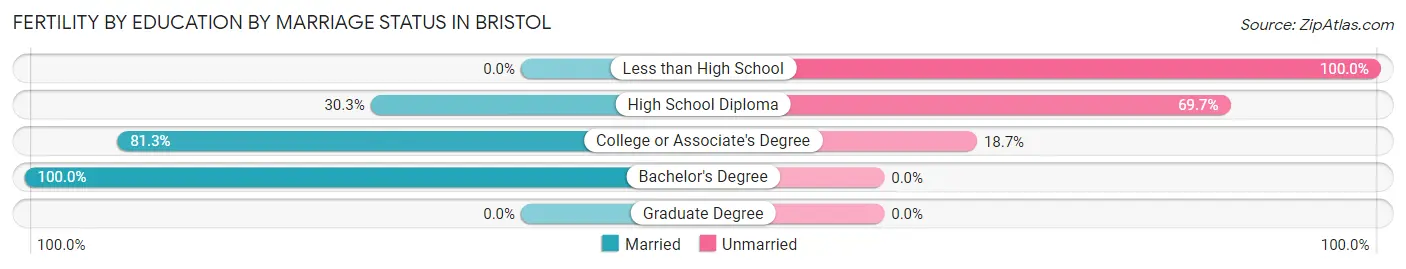
| Educational Attainment | Married | Unmarried |
| Less than High School | 0 (0.0%) | 18 (100.0%) |
| High School Diploma | 40 (30.3%) | 92 (69.7%) |
| College or Associate's Degree | 61 (81.3%) | 14 (18.7%) |
| Bachelor's Degree | 62 (100.0%) | 0 (0.0%) |
| Graduate Degree | 0 (0.0%) | 0 (0.0%) |
| Total | 163 (56.8%) | 124 (43.2%) |
Employment Characteristics in Bristol
Employment by Class of Employer in Bristol
Among the 11,574 employed individuals in Bristol, private company employees (8,496 | 73.4%), not-for-profit organizations (834 | 7.2%), and local government employees (780 | 6.7%) make up the most common classes of employment.
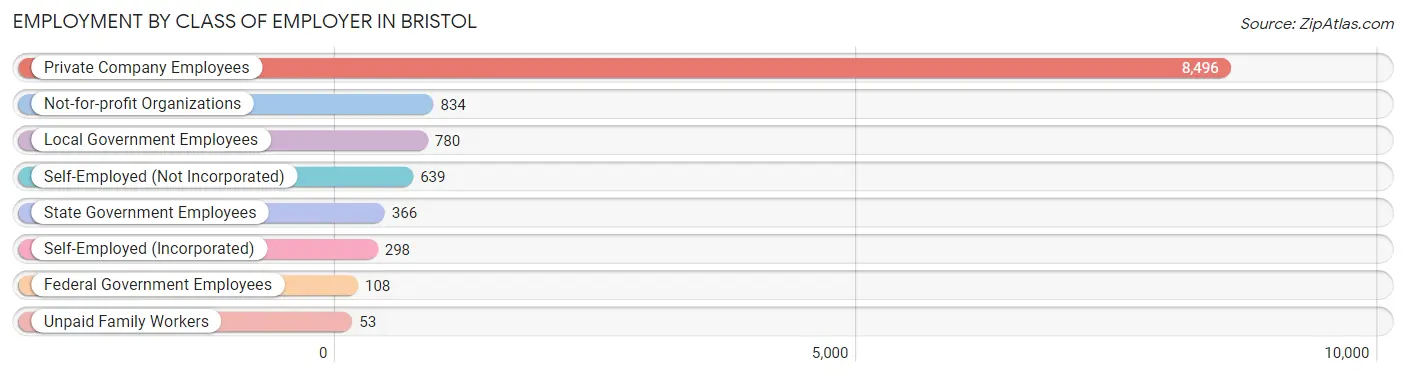
| Employer Class | # Employees | % Employees |
| Private Company Employees | 8,496 | 73.4% |
| Self-Employed (Incorporated) | 298 | 2.6% |
| Self-Employed (Not Incorporated) | 639 | 5.5% |
| Not-for-profit Organizations | 834 | 7.2% |
| Local Government Employees | 780 | 6.7% |
| State Government Employees | 366 | 3.2% |
| Federal Government Employees | 108 | 0.9% |
| Unpaid Family Workers | 53 | 0.5% |
| Total | 11,574 | 100.0% |
Employment Status by Age in Bristol
According to the labor force statistics for Bristol, out of the total population over 16 years of age (22,016), 57.9% or 12,747 individuals are in the labor force, with 8.8% or 1,122 of them unemployed. The age group with the highest labor force participation rate is 30 to 34 years, with 84.9% or 1,525 individuals in the labor force. Within the labor force, the 20 to 24 years age range has the highest percentage of unemployed individuals, with 22.1% or 293 of them being unemployed.
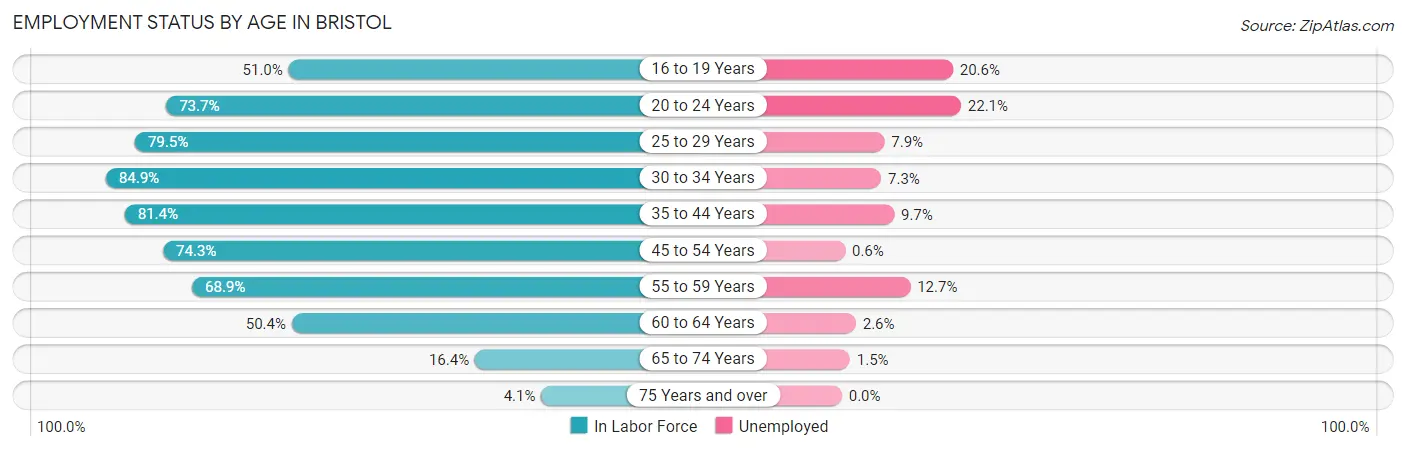
| Age Bracket | In Labor Force | Unemployed |
| 16 to 19 Years | 719 (51.0%) | 148 (20.6%) |
| 20 to 24 Years | 1,324 (73.7%) | 293 (22.1%) |
| 25 to 29 Years | 1,601 (79.5%) | 126 (7.9%) |
| 30 to 34 Years | 1,525 (84.9%) | 111 (7.3%) |
| 35 to 44 Years | 2,309 (81.4%) | 224 (9.7%) |
| 45 to 54 Years | 2,447 (74.3%) | 15 (0.6%) |
| 55 to 59 Years | 1,364 (68.9%) | 173 (12.7%) |
| 60 to 64 Years | 913 (50.4%) | 24 (2.6%) |
| 65 to 74 Years | 464 (16.4%) | 7 (1.5%) |
| 75 Years and over | 92 (4.1%) | 0 (0.0%) |
| Total | 12,747 (57.9%) | 1,122 (8.8%) |
Employment Status by Educational Attainment in Bristol
According to labor force statistics for Bristol, 74.0% of individuals (10,161) out of the total population between 25 and 64 years of age (13,731) are in the labor force, with 6.6% or 671 of them being unemployed. The group with the highest labor force participation rate are those with the educational attainment of bachelor's degree or higher, with 81.3% or 3,314 individuals in the labor force. Within the labor force, individuals with college / associate degree education have the highest percentage of unemployment, with 12.4% or 417 of them being unemployed.
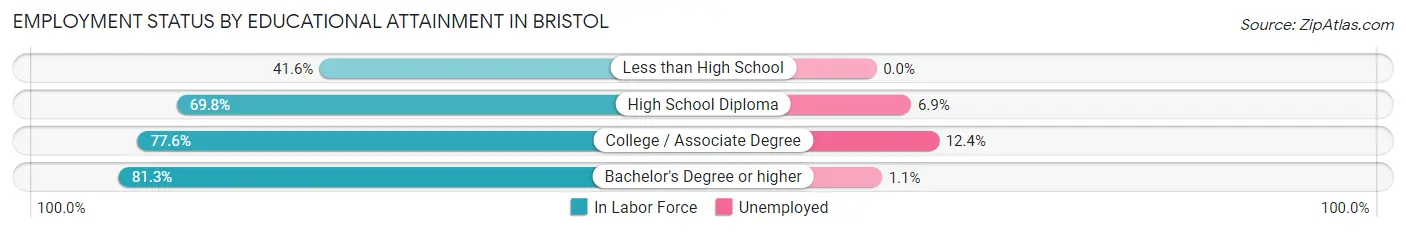
| Educational Attainment | In Labor Force | Unemployed |
| Less than High School | 346 (41.6%) | 0 (0.0%) |
| High School Diploma | 3,136 (69.8%) | 310 (6.9%) |
| College / Associate Degree | 3,360 (77.6%) | 537 (12.4%) |
| Bachelor's Degree or higher | 3,314 (81.3%) | 45 (1.1%) |
| Total | 10,161 (74.0%) | 906 (6.6%) |
Employment Occupations by Sex in Bristol
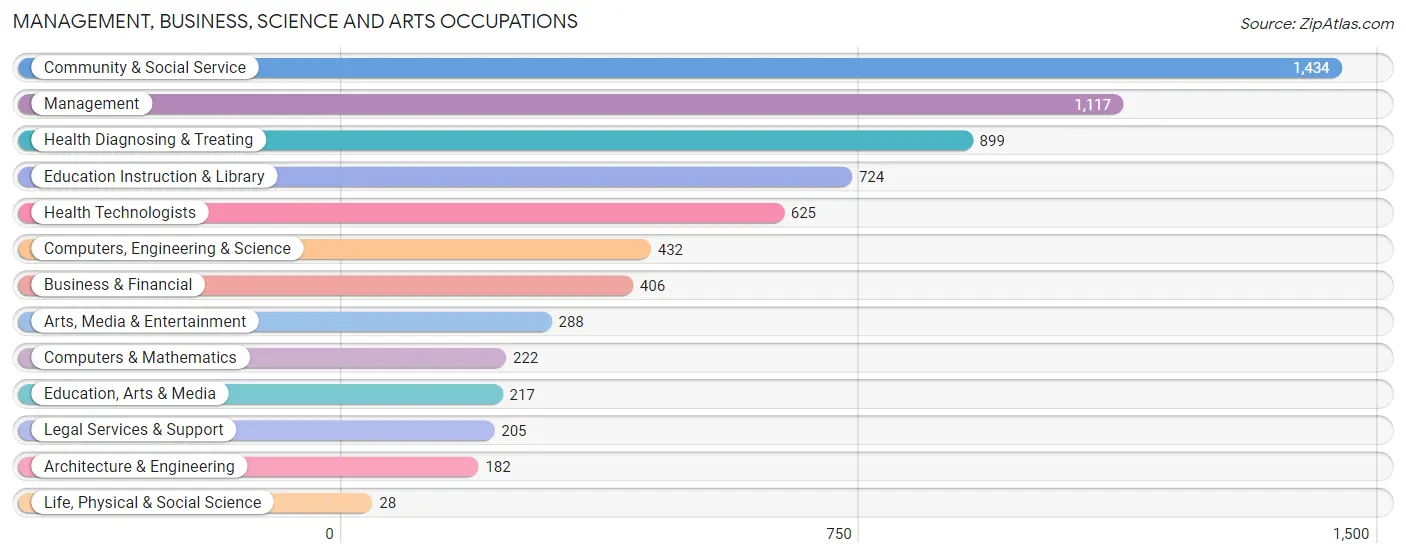
Management, Business, Science and Arts Occupations
The most common Management, Business, Science and Arts occupations in Bristol are Community & Social Service (1,434 | 12.3%), Management (1,117 | 9.6%), Health Diagnosing & Treating (899 | 7.7%), Education Instruction & Library (724 | 6.2%), and Health Technologists (625 | 5.4%).
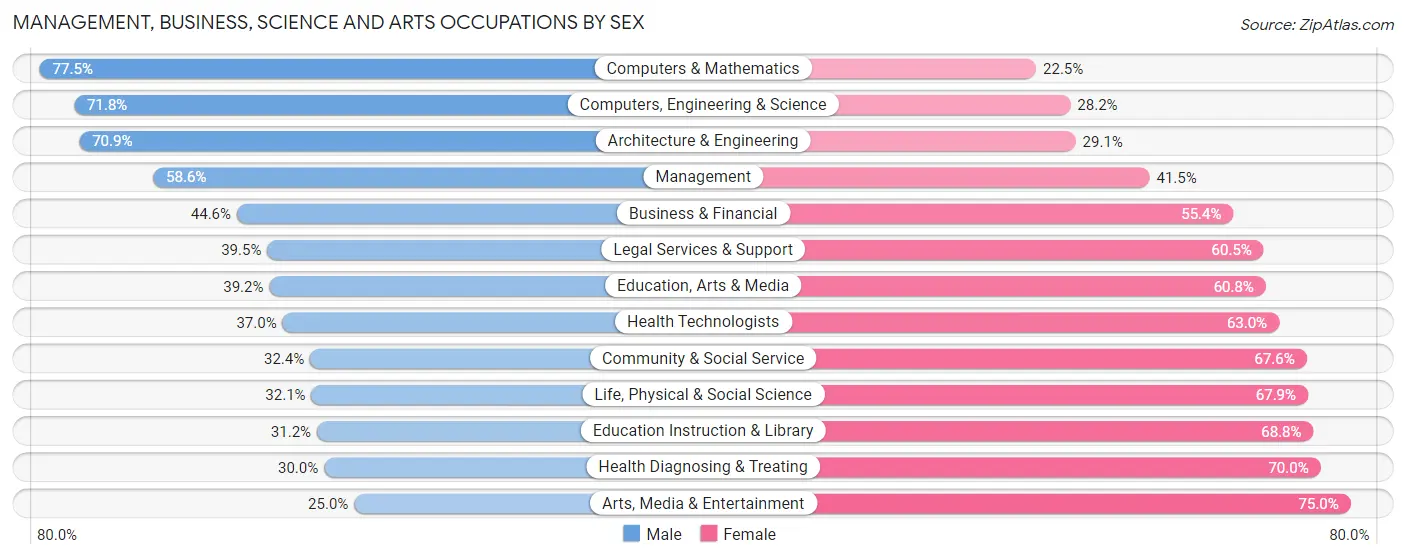
Management, Business, Science and Arts Occupations by Sex
Within the Management, Business, Science and Arts occupations in Bristol, the most male-oriented occupations are Computers & Mathematics (77.5%), Computers, Engineering & Science (71.8%), and Architecture & Engineering (70.9%), while the most female-oriented occupations are Arts, Media & Entertainment (75.0%), Health Diagnosing & Treating (70.0%), and Education Instruction & Library (68.8%).
| Occupation | Male | Female |
| Management | 654 (58.6%) | 463 (41.4%) |
| Business & Financial | 181 (44.6%) | 225 (55.4%) |
| Computers, Engineering & Science | 310 (71.8%) | 122 (28.2%) |
| Computers & Mathematics | 172 (77.5%) | 50 (22.5%) |
| Architecture & Engineering | 129 (70.9%) | 53 (29.1%) |
| Life, Physical & Social Science | 9 (32.1%) | 19 (67.9%) |
| Community & Social Service | 464 (32.4%) | 970 (67.6%) |
| Education, Arts & Media | 85 (39.2%) | 132 (60.8%) |
| Legal Services & Support | 81 (39.5%) | 124 (60.5%) |
| Education Instruction & Library | 226 (31.2%) | 498 (68.8%) |
| Arts, Media & Entertainment | 72 (25.0%) | 216 (75.0%) |
| Health Diagnosing & Treating | 270 (30.0%) | 629 (70.0%) |
| Health Technologists | 231 (37.0%) | 394 (63.0%) |
| Total (Category) | 1,879 (43.8%) | 2,409 (56.2%) |
| Total (Overall) | 6,173 (53.1%) | 5,448 (46.9%) |
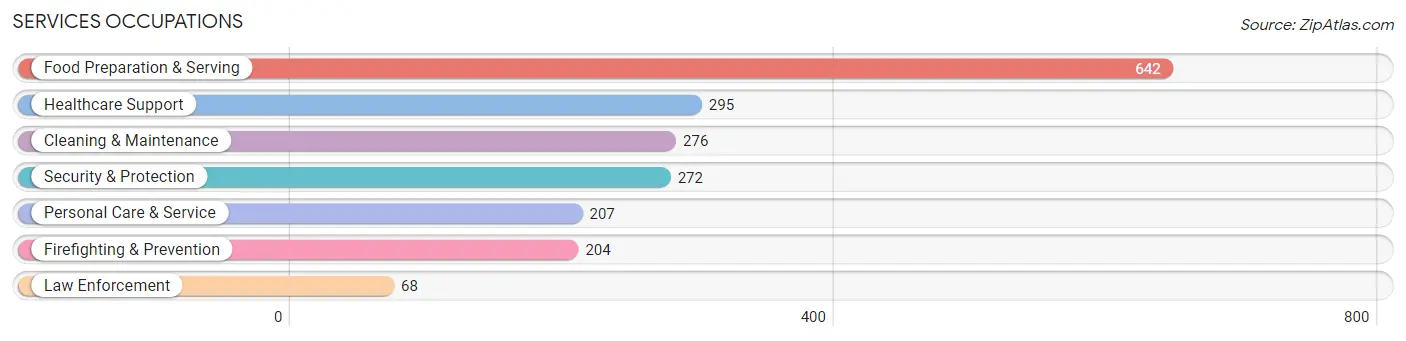
Services Occupations
The most common Services occupations in Bristol are Food Preparation & Serving (642 | 5.5%), Healthcare Support (295 | 2.5%), Cleaning & Maintenance (276 | 2.4%), Security & Protection (272 | 2.3%), and Personal Care & Service (207 | 1.8%).
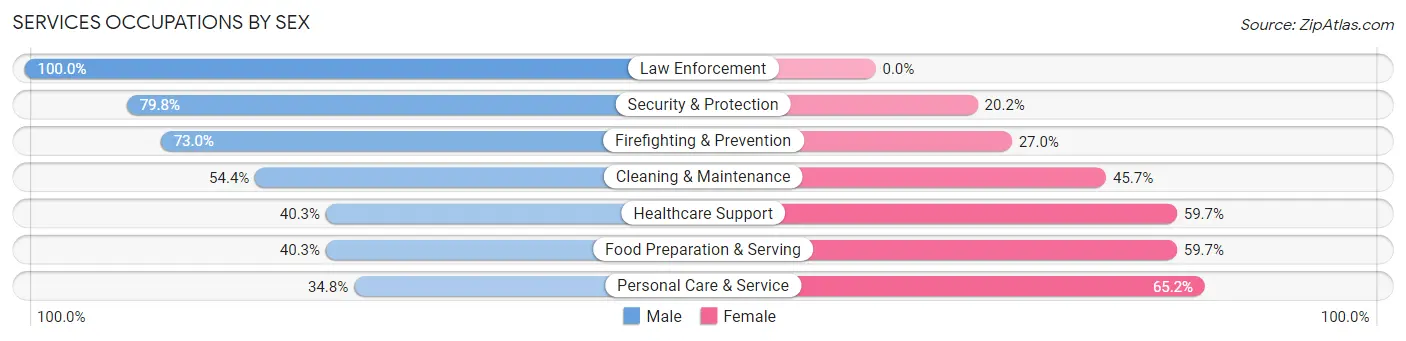
Services Occupations by Sex
Within the Services occupations in Bristol, the most male-oriented occupations are Law Enforcement (100.0%), Security & Protection (79.8%), and Firefighting & Prevention (73.0%), while the most female-oriented occupations are Personal Care & Service (65.2%), Healthcare Support (59.7%), and Food Preparation & Serving (59.7%).
| Occupation | Male | Female |
| Healthcare Support | 119 (40.3%) | 176 (59.7%) |
| Security & Protection | 217 (79.8%) | 55 (20.2%) |
| Firefighting & Prevention | 149 (73.0%) | 55 (27.0%) |
| Law Enforcement | 68 (100.0%) | 0 (0.0%) |
| Food Preparation & Serving | 259 (40.3%) | 383 (59.7%) |
| Cleaning & Maintenance | 150 (54.3%) | 126 (45.7%) |
| Personal Care & Service | 72 (34.8%) | 135 (65.2%) |
| Total (Category) | 817 (48.3%) | 875 (51.7%) |
| Total (Overall) | 6,173 (53.1%) | 5,448 (46.9%) |
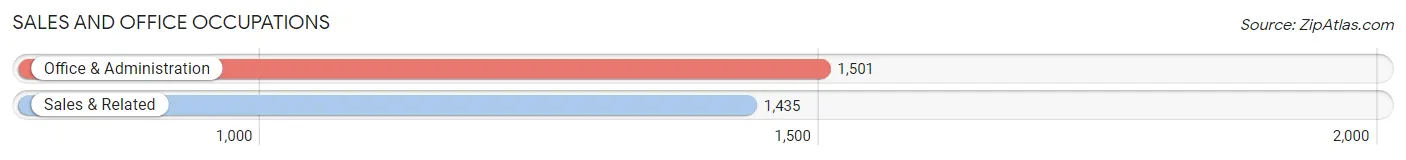
Sales and Office Occupations
The most common Sales and Office occupations in Bristol are Office & Administration (1,501 | 12.9%), and Sales & Related (1,435 | 12.3%).
Sales and Office Occupations by Sex
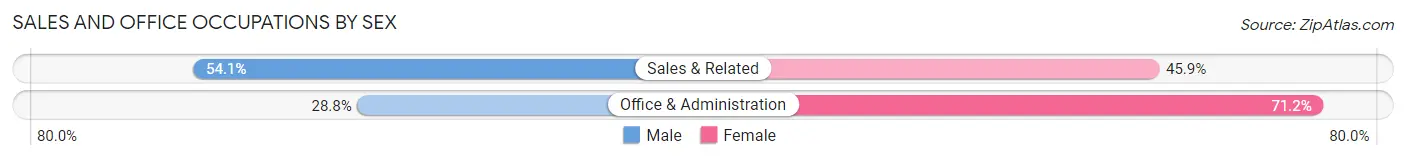
| Occupation | Male | Female |
| Sales & Related | 776 (54.1%) | 659 (45.9%) |
| Office & Administration | 432 (28.8%) | 1,069 (71.2%) |
| Total (Category) | 1,208 (41.1%) | 1,728 (58.9%) |
| Total (Overall) | 6,173 (53.1%) | 5,448 (46.9%) |
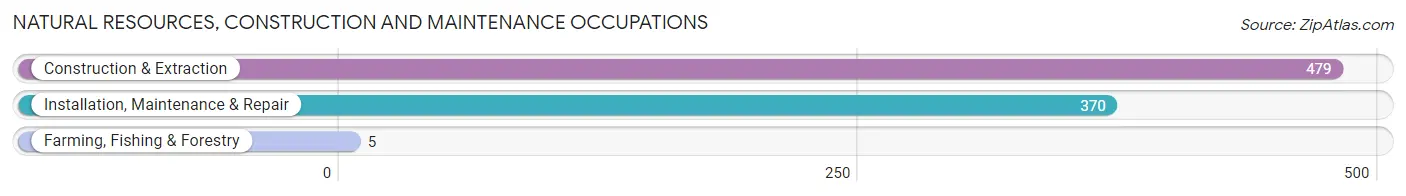
Natural Resources, Construction and Maintenance Occupations
The most common Natural Resources, Construction and Maintenance occupations in Bristol are Construction & Extraction (479 | 4.1%), Installation, Maintenance & Repair (370 | 3.2%), and Farming, Fishing & Forestry (5 | 0.0%).
Natural Resources, Construction and Maintenance Occupations by Sex
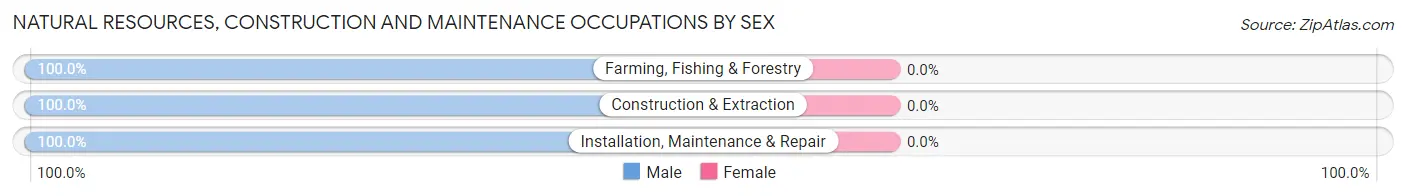
| Occupation | Male | Female |
| Farming, Fishing & Forestry | 5 (100.0%) | 0 (0.0%) |
| Construction & Extraction | 479 (100.0%) | 0 (0.0%) |
| Installation, Maintenance & Repair | 370 (100.0%) | 0 (0.0%) |
| Total (Category) | 854 (100.0%) | 0 (0.0%) |
| Total (Overall) | 6,173 (53.1%) | 5,448 (46.9%) |
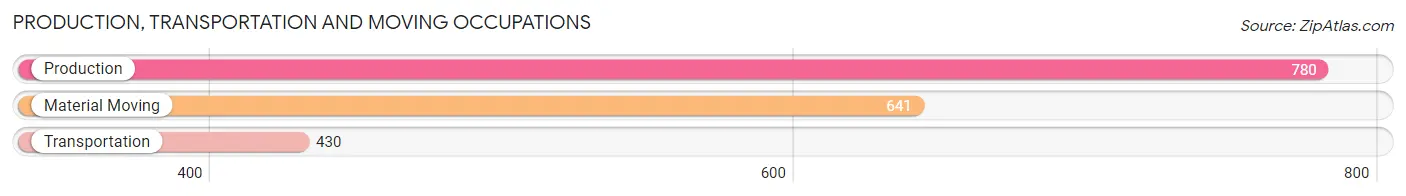
Production, Transportation and Moving Occupations
The most common Production, Transportation and Moving occupations in Bristol are Production (780 | 6.7%), Material Moving (641 | 5.5%), and Transportation (430 | 3.7%).
Production, Transportation and Moving Occupations by Sex
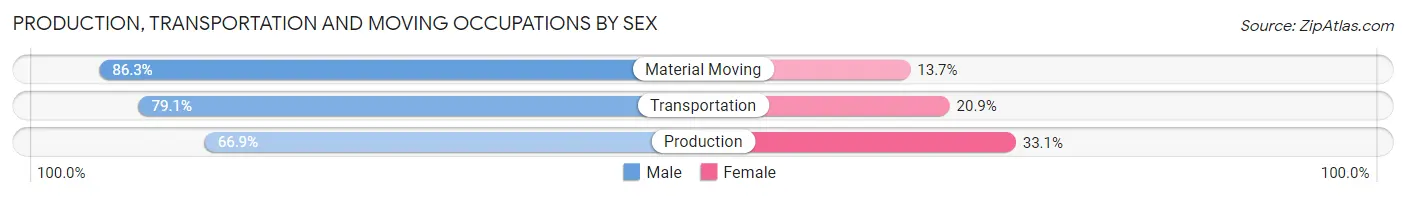
| Occupation | Male | Female |
| Production | 522 (66.9%) | 258 (33.1%) |
| Transportation | 340 (79.1%) | 90 (20.9%) |
| Material Moving | 553 (86.3%) | 88 (13.7%) |
| Total (Category) | 1,415 (76.4%) | 436 (23.5%) |
| Total (Overall) | 6,173 (53.1%) | 5,448 (46.9%) |
Employment Industries by Sex in Bristol
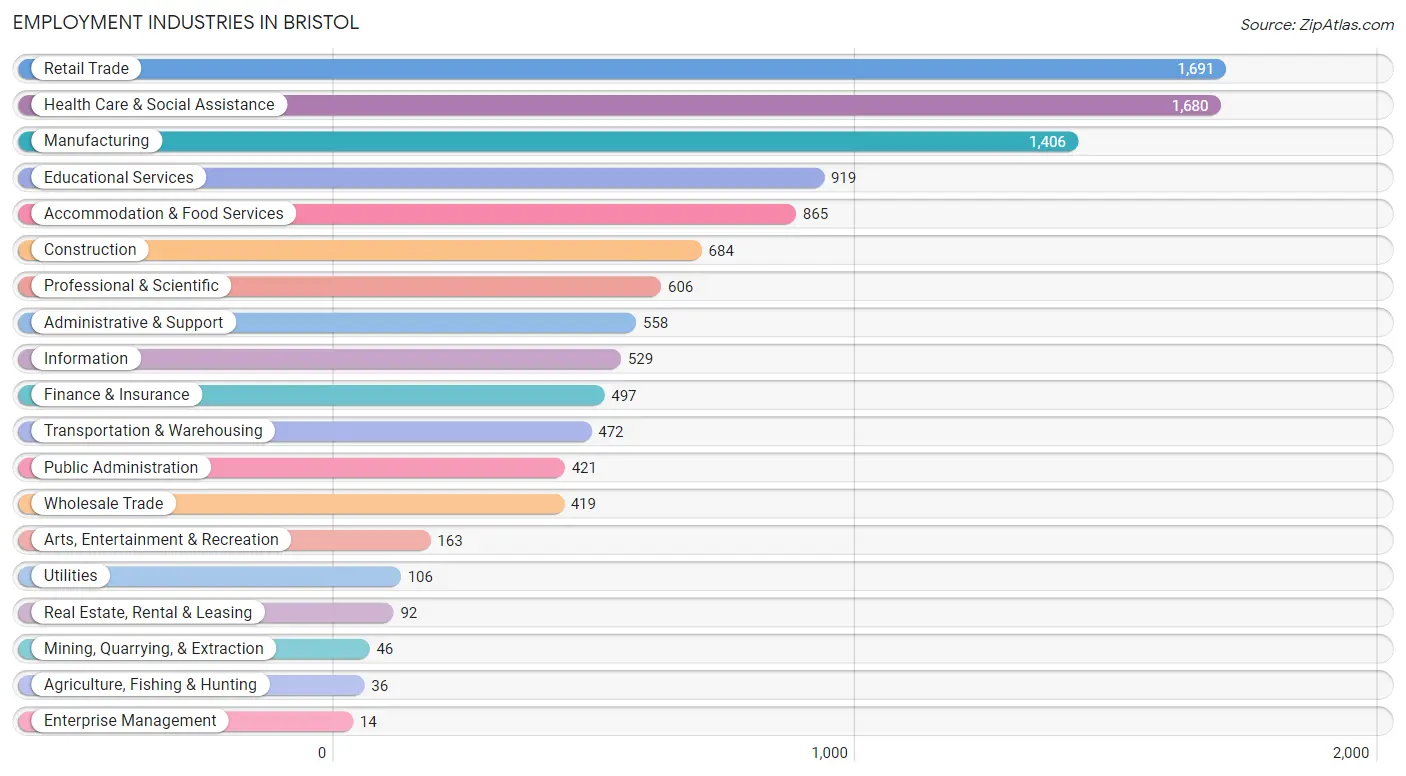
Employment Industries in Bristol
The major employment industries in Bristol include Retail Trade (1,691 | 14.5%), Health Care & Social Assistance (1,680 | 14.5%), Manufacturing (1,406 | 12.1%), Educational Services (919 | 7.9%), and Accommodation & Food Services (865 | 7.4%).
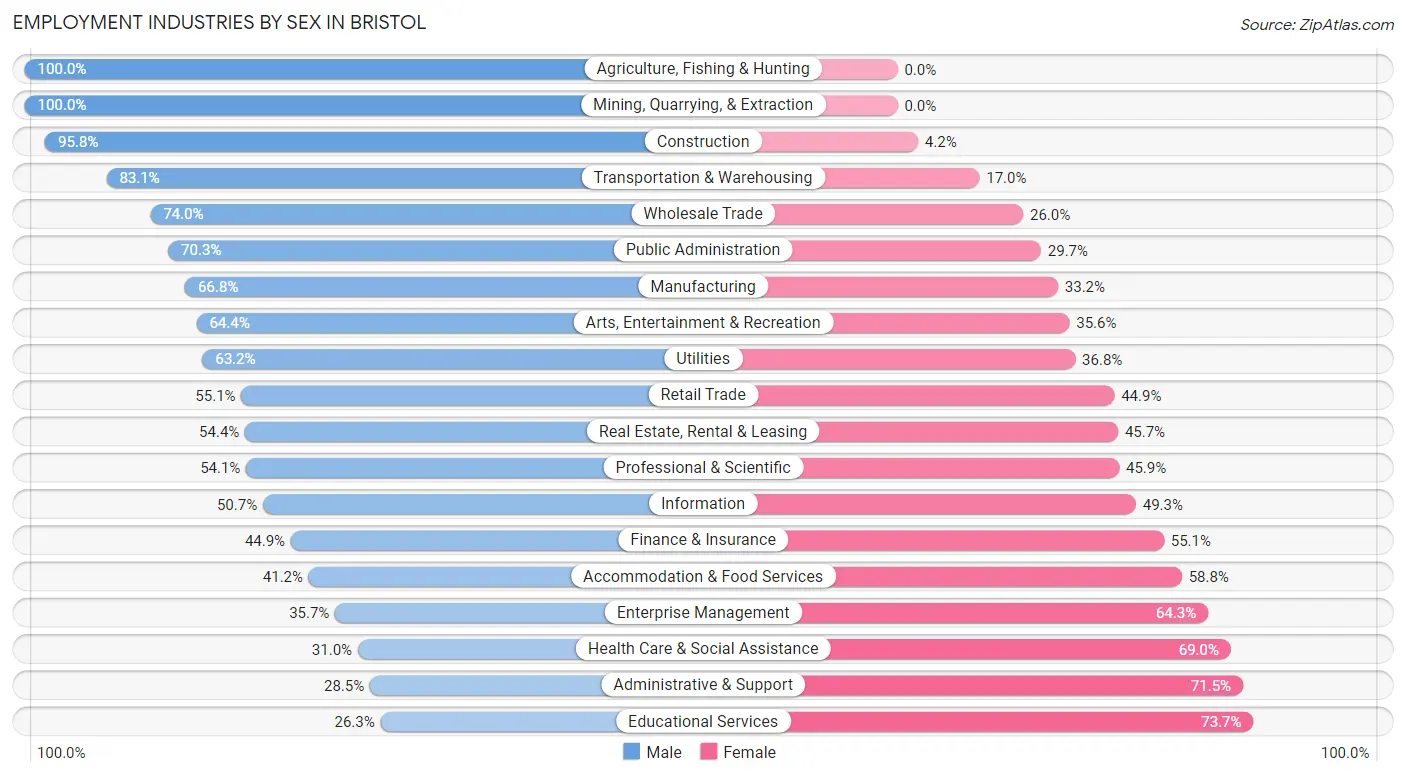
Employment Industries by Sex in Bristol
The Bristol industries that see more men than women are Agriculture, Fishing & Hunting (100.0%), Mining, Quarrying, & Extraction (100.0%), and Construction (95.8%), whereas the industries that tend to have a higher number of women are Educational Services (73.7%), Administrative & Support (71.5%), and Health Care & Social Assistance (69.0%).
| Industry | Male | Female |
| Agriculture, Fishing & Hunting | 36 (100.0%) | 0 (0.0%) |
| Mining, Quarrying, & Extraction | 46 (100.0%) | 0 (0.0%) |
| Construction | 655 (95.8%) | 29 (4.2%) |
| Manufacturing | 939 (66.8%) | 467 (33.2%) |
| Wholesale Trade | 310 (74.0%) | 109 (26.0%) |
| Retail Trade | 932 (55.1%) | 759 (44.9%) |
| Transportation & Warehousing | 392 (83.1%) | 80 (17.0%) |
| Utilities | 67 (63.2%) | 39 (36.8%) |
| Information | 268 (50.7%) | 261 (49.3%) |
| Finance & Insurance | 223 (44.9%) | 274 (55.1%) |
| Real Estate, Rental & Leasing | 50 (54.3%) | 42 (45.7%) |
| Professional & Scientific | 328 (54.1%) | 278 (45.9%) |
| Enterprise Management | 5 (35.7%) | 9 (64.3%) |
| Administrative & Support | 159 (28.5%) | 399 (71.5%) |
| Educational Services | 242 (26.3%) | 677 (73.7%) |
| Health Care & Social Assistance | 521 (31.0%) | 1,159 (69.0%) |
| Arts, Entertainment & Recreation | 105 (64.4%) | 58 (35.6%) |
| Accommodation & Food Services | 356 (41.2%) | 509 (58.8%) |
| Public Administration | 296 (70.3%) | 125 (29.7%) |
| Total | 6,173 (53.1%) | 5,448 (46.9%) |
Education in Bristol
School Enrollment in Bristol
The most common levels of schooling among the 5,966 students in Bristol are middle school (1,416 | 23.7%), high school (1,312 | 22.0%), and elementary school (1,266 | 21.2%).
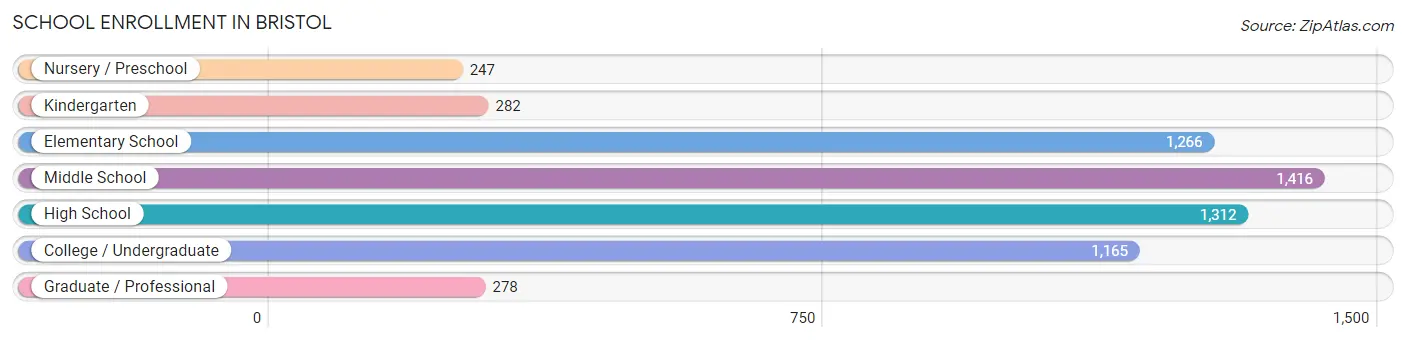
| School Level | # Students | % Students |
| Nursery / Preschool | 247 | 4.1% |
| Kindergarten | 282 | 4.7% |
| Elementary School | 1,266 | 21.2% |
| Middle School | 1,416 | 23.7% |
| High School | 1,312 | 22.0% |
| College / Undergraduate | 1,165 | 19.5% |
| Graduate / Professional | 278 | 4.7% |
| Total | 5,966 | 100.0% |
School Enrollment by Age by Funding Source in Bristol
Out of a total of 5,966 students who are enrolled in schools in Bristol, 961 (16.1%) attend a private institution, while the remaining 5,005 (83.9%) are enrolled in public schools. The age group of 3 to 4 year olds has the highest likelihood of being enrolled in private schools, with 109 (46.0% in the age bracket) enrolled. Conversely, the age group of 15 to 17 year olds has the lowest likelihood of being enrolled in a private school, with 939 (94.1% in the age bracket) attending a public institution.
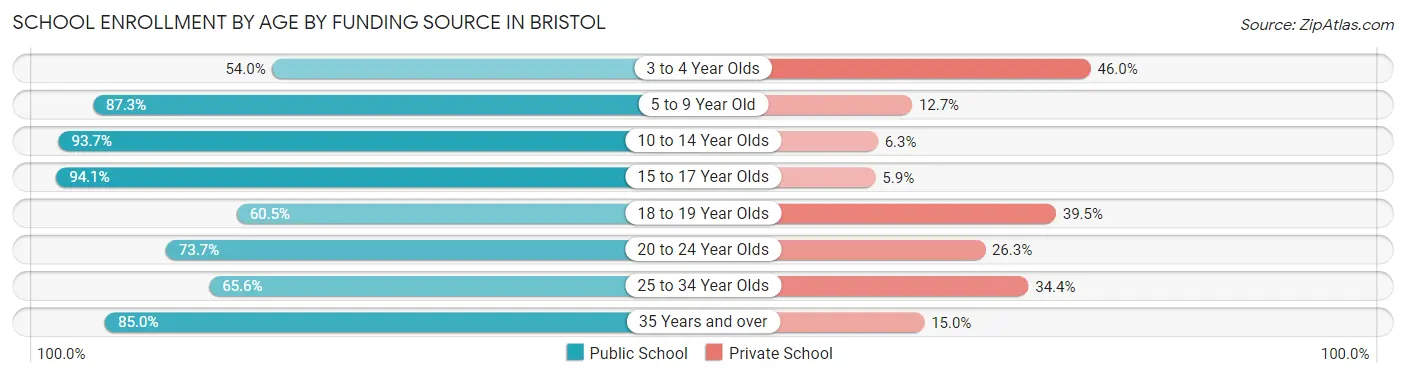
| Age Bracket | Public School | Private School |
| 3 to 4 Year Olds | 128 (54.0%) | 109 (46.0%) |
| 5 to 9 Year Old | 1,187 (87.3%) | 173 (12.7%) |
| 10 to 14 Year Olds | 1,640 (93.7%) | 111 (6.3%) |
| 15 to 17 Year Olds | 939 (94.1%) | 59 (5.9%) |
| 18 to 19 Year Olds | 346 (60.5%) | 226 (39.5%) |
| 20 to 24 Year Olds | 459 (73.7%) | 164 (26.3%) |
| 25 to 34 Year Olds | 187 (65.6%) | 98 (34.4%) |
| 35 Years and over | 119 (85.0%) | 21 (15.0%) |
| Total | 5,005 (83.9%) | 961 (16.1%) |
Educational Attainment by Field of Study in Bristol
Business (1,246 | 20.4%), science & technology (906 | 14.8%), education (688 | 11.3%), arts & humanities (414 | 6.8%), and social sciences (380 | 6.2%) are the most common fields of study among 6,117 individuals in Bristol who have obtained a bachelor's degree or higher.
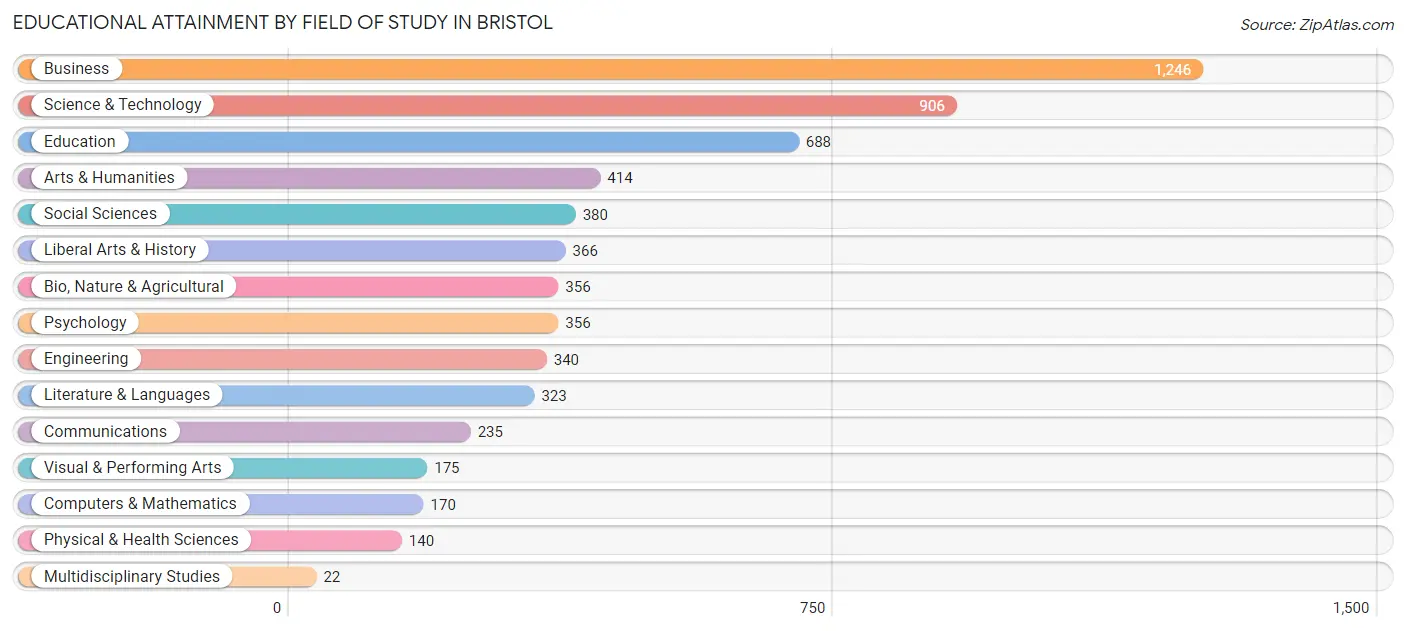
| Field of Study | # Graduates | % Graduates |
| Computers & Mathematics | 170 | 2.8% |
| Bio, Nature & Agricultural | 356 | 5.8% |
| Physical & Health Sciences | 140 | 2.3% |
| Psychology | 356 | 5.8% |
| Social Sciences | 380 | 6.2% |
| Engineering | 340 | 5.6% |
| Multidisciplinary Studies | 22 | 0.4% |
| Science & Technology | 906 | 14.8% |
| Business | 1,246 | 20.4% |
| Education | 688 | 11.3% |
| Literature & Languages | 323 | 5.3% |
| Liberal Arts & History | 366 | 6.0% |
| Visual & Performing Arts | 175 | 2.9% |
| Communications | 235 | 3.8% |
| Arts & Humanities | 414 | 6.8% |
| Total | 6,117 | 100.0% |
Transportation & Commute in Bristol
Vehicle Availability by Sex in Bristol
The most prevalent vehicle ownership categories in Bristol are males with 2 vehicles (2,519, accounting for 41.0%) and females with 2 vehicles (2,089, making up 47.4%).
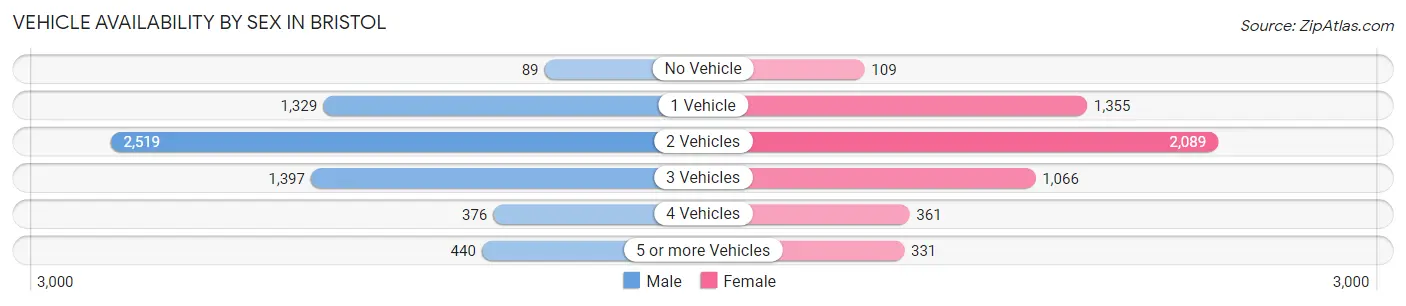
| Vehicles Available | Male | Female |
| No Vehicle | 89 (1.5%) | 109 (2.1%) |
| 1 Vehicle | 1,329 (21.6%) | 1,355 (25.5%) |
| 2 Vehicles | 2,519 (41.0%) | 2,089 (39.3%) |
| 3 Vehicles | 1,397 (22.7%) | 1,066 (20.1%) |
| 4 Vehicles | 376 (6.1%) | 361 (6.8%) |
| 5 or more Vehicles | 440 (7.1%) | 331 (6.2%) |
| Total | 6,150 (100.0%) | 5,311 (100.0%) |
Commute Time in Bristol
The most frequently occuring commute durations in Bristol are 10 to 14 minutes (1,957 commuters, 18.5%), 15 to 19 minutes (1,919 commuters, 18.1%), and 5 to 9 minutes (1,456 commuters, 13.7%).
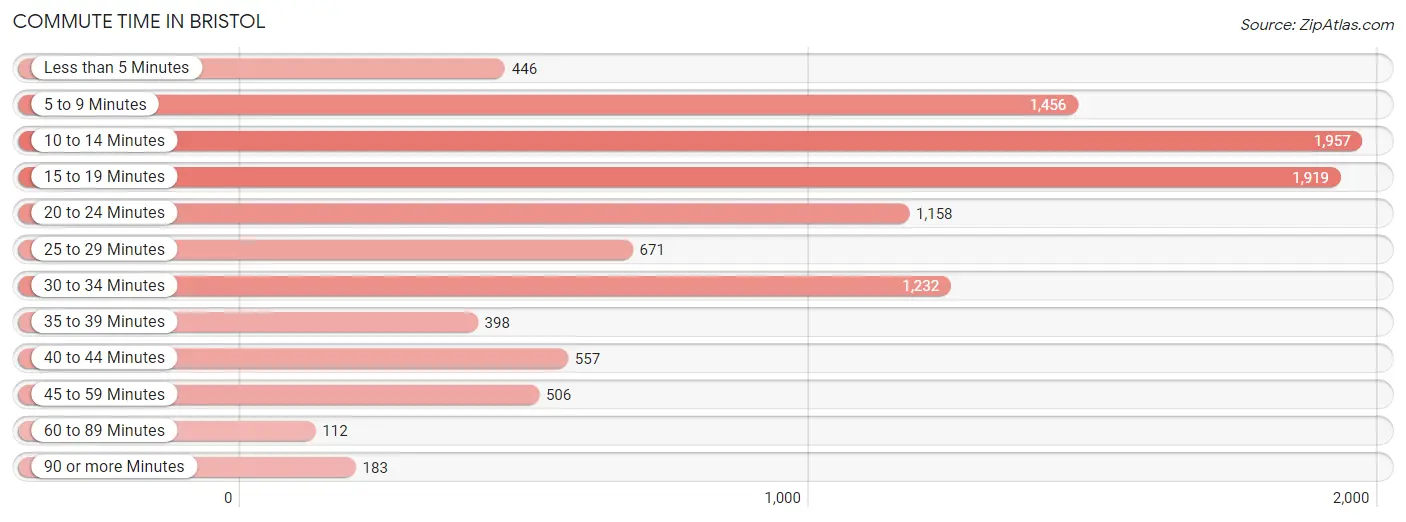
| Commute Time | # Commuters | % Commuters |
| Less than 5 Minutes | 446 | 4.2% |
| 5 to 9 Minutes | 1,456 | 13.7% |
| 10 to 14 Minutes | 1,957 | 18.5% |
| 15 to 19 Minutes | 1,919 | 18.1% |
| 20 to 24 Minutes | 1,158 | 10.9% |
| 25 to 29 Minutes | 671 | 6.3% |
| 30 to 34 Minutes | 1,232 | 11.6% |
| 35 to 39 Minutes | 398 | 3.8% |
| 40 to 44 Minutes | 557 | 5.3% |
| 45 to 59 Minutes | 506 | 4.8% |
| 60 to 89 Minutes | 112 | 1.1% |
| 90 or more Minutes | 183 | 1.7% |
Commute Time by Sex in Bristol
The most common commute times in Bristol are 10 to 14 minutes (1,052 commuters, 18.3%) for males and 15 to 19 minutes (1,029 commuters, 21.2%) for females.
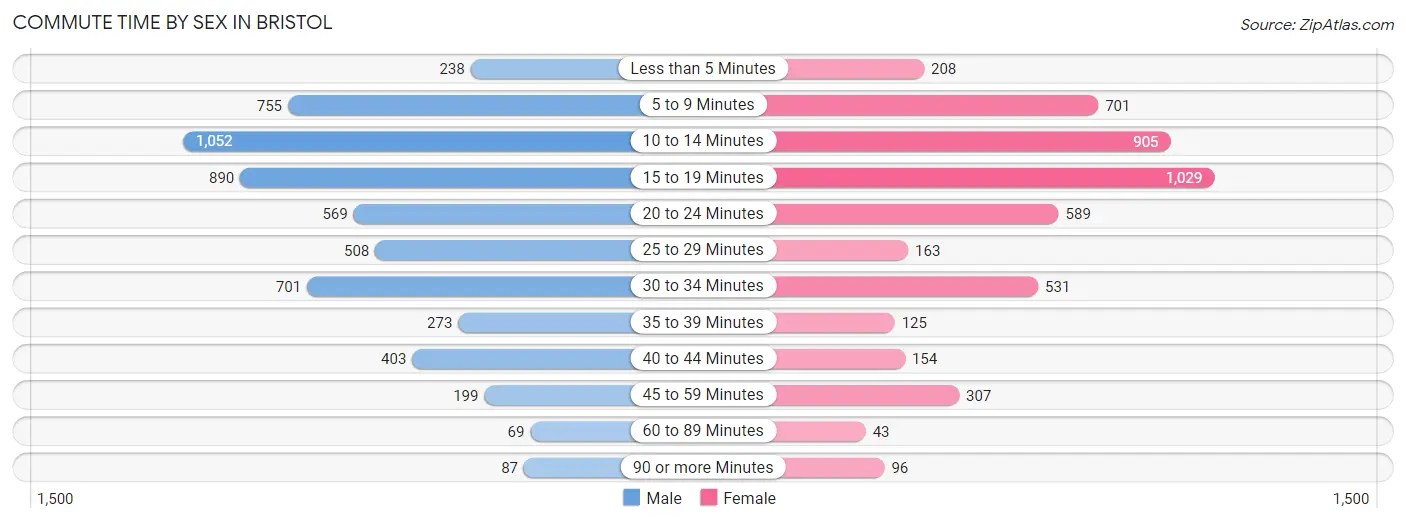
| Commute Time | Male | Female |
| Less than 5 Minutes | 238 (4.1%) | 208 (4.3%) |
| 5 to 9 Minutes | 755 (13.1%) | 701 (14.4%) |
| 10 to 14 Minutes | 1,052 (18.3%) | 905 (18.7%) |
| 15 to 19 Minutes | 890 (15.5%) | 1,029 (21.2%) |
| 20 to 24 Minutes | 569 (9.9%) | 589 (12.1%) |
| 25 to 29 Minutes | 508 (8.8%) | 163 (3.4%) |
| 30 to 34 Minutes | 701 (12.2%) | 531 (11.0%) |
| 35 to 39 Minutes | 273 (4.8%) | 125 (2.6%) |
| 40 to 44 Minutes | 403 (7.0%) | 154 (3.2%) |
| 45 to 59 Minutes | 199 (3.5%) | 307 (6.3%) |
| 60 to 89 Minutes | 69 (1.2%) | 43 (0.9%) |
| 90 or more Minutes | 87 (1.5%) | 96 (2.0%) |
Time of Departure to Work by Sex in Bristol
The most frequent times of departure to work in Bristol are 7:00 AM to 7:29 AM (834, 14.5%) for males and 7:30 AM to 7:59 AM (922, 19.0%) for females.
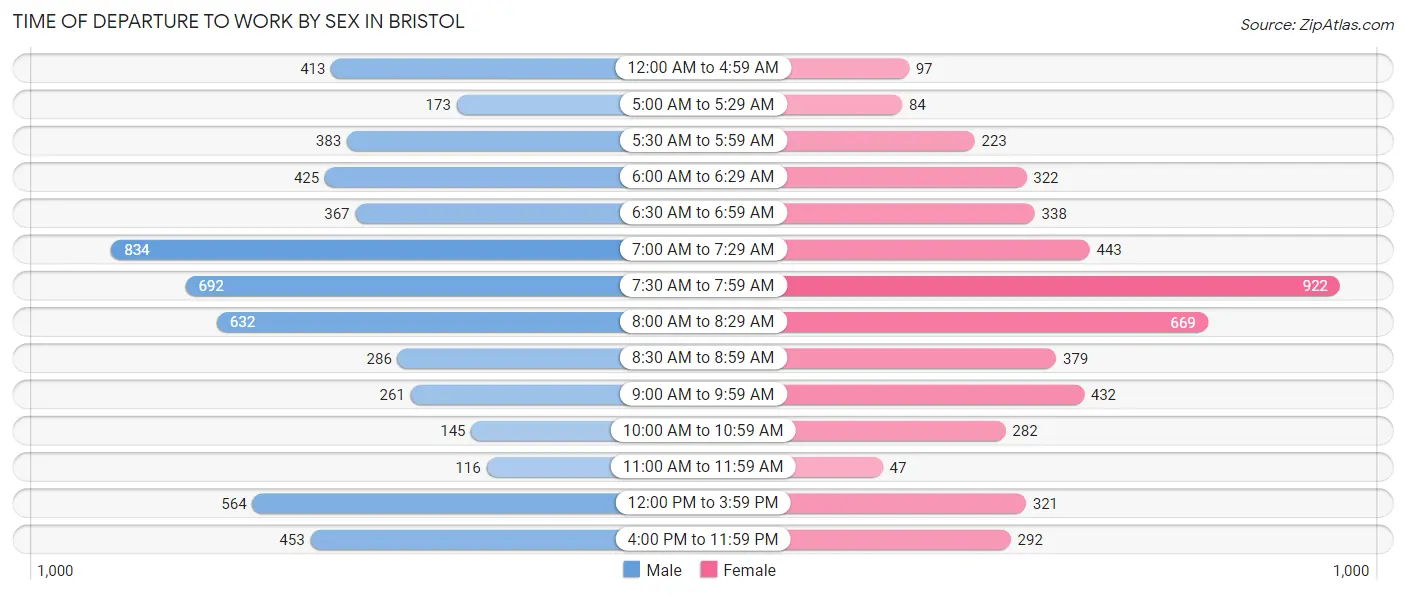
| Time of Departure | Male | Female |
| 12:00 AM to 4:59 AM | 413 (7.2%) | 97 (2.0%) |
| 5:00 AM to 5:29 AM | 173 (3.0%) | 84 (1.7%) |
| 5:30 AM to 5:59 AM | 383 (6.7%) | 223 (4.6%) |
| 6:00 AM to 6:29 AM | 425 (7.4%) | 322 (6.6%) |
| 6:30 AM to 6:59 AM | 367 (6.4%) | 338 (7.0%) |
| 7:00 AM to 7:29 AM | 834 (14.5%) | 443 (9.1%) |
| 7:30 AM to 7:59 AM | 692 (12.0%) | 922 (19.0%) |
| 8:00 AM to 8:29 AM | 632 (11.0%) | 669 (13.8%) |
| 8:30 AM to 8:59 AM | 286 (5.0%) | 379 (7.8%) |
| 9:00 AM to 9:59 AM | 261 (4.5%) | 432 (8.9%) |
| 10:00 AM to 10:59 AM | 145 (2.5%) | 282 (5.8%) |
| 11:00 AM to 11:59 AM | 116 (2.0%) | 47 (1.0%) |
| 12:00 PM to 3:59 PM | 564 (9.8%) | 321 (6.6%) |
| 4:00 PM to 11:59 PM | 453 (7.9%) | 292 (6.0%) |
| Total | 5,744 (100.0%) | 4,851 (100.0%) |
Housing Occupancy in Bristol
Occupancy by Ownership in Bristol
Of the total 11,865 dwellings in Bristol, owner-occupied units account for 7,821 (65.9%), while renter-occupied units make up 4,044 (34.1%).
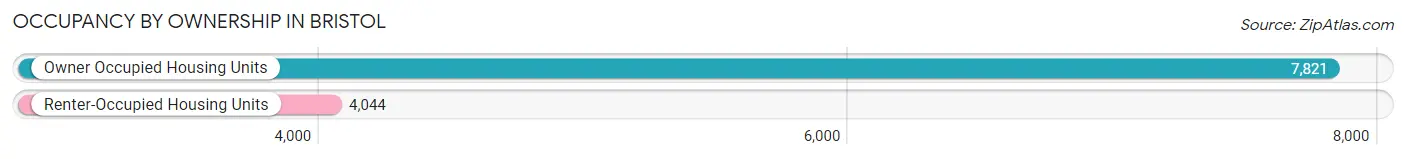
| Occupancy | # Housing Units | % Housing Units |
| Owner Occupied Housing Units | 7,821 | 65.9% |
| Renter-Occupied Housing Units | 4,044 | 34.1% |
| Total Occupied Housing Units | 11,865 | 100.0% |
Occupancy by Household Size in Bristol
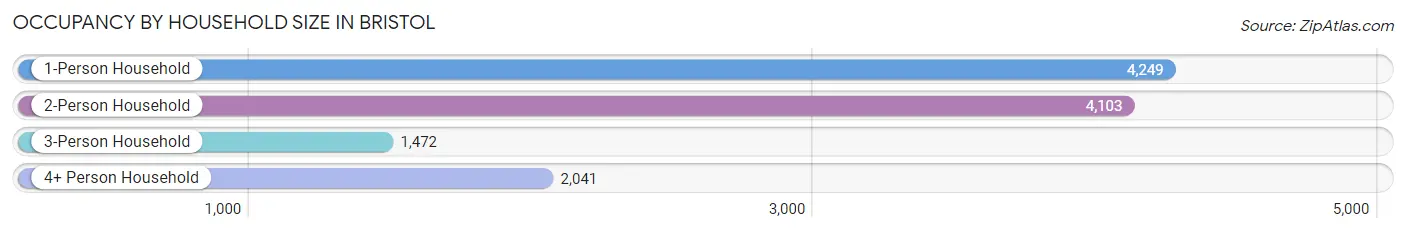
| Household Size | # Housing Units | % Housing Units |
| 1-Person Household | 4,249 | 35.8% |
| 2-Person Household | 4,103 | 34.6% |
| 3-Person Household | 1,472 | 12.4% |
| 4+ Person Household | 2,041 | 17.2% |
| Total Housing Units | 11,865 | 100.0% |
Occupancy by Ownership by Household Size in Bristol
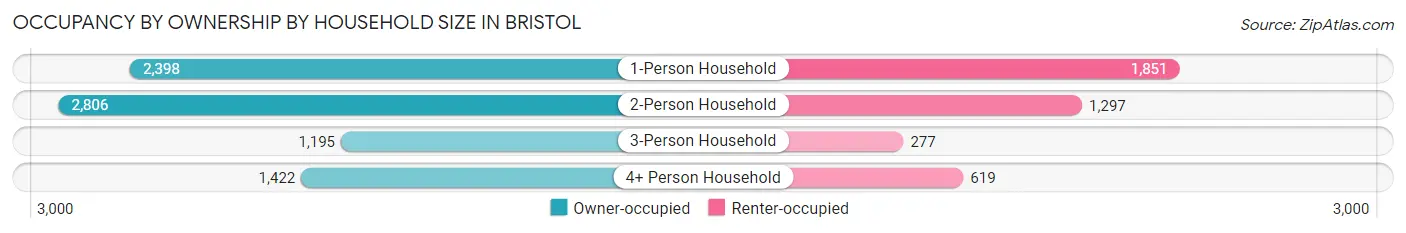
| Household Size | Owner-occupied | Renter-occupied |
| 1-Person Household | 2,398 (56.4%) | 1,851 (43.6%) |
| 2-Person Household | 2,806 (68.4%) | 1,297 (31.6%) |
| 3-Person Household | 1,195 (81.2%) | 277 (18.8%) |
| 4+ Person Household | 1,422 (69.7%) | 619 (30.3%) |
| Total Housing Units | 7,821 (65.9%) | 4,044 (34.1%) |
Occupancy by Educational Attainment in Bristol
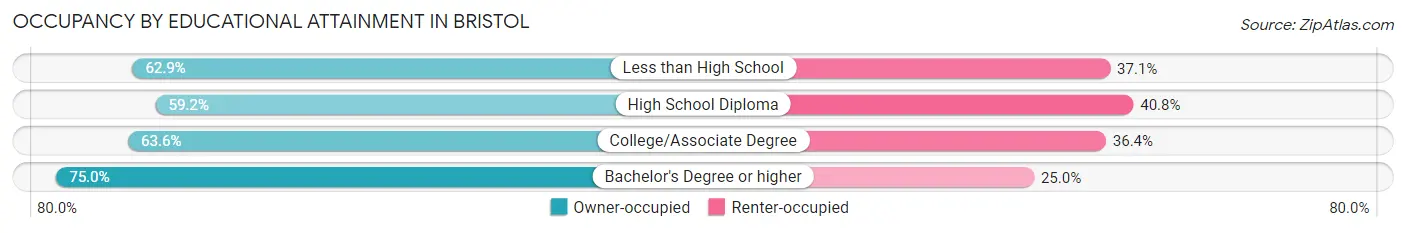
| Household Size | Owner-occupied | Renter-occupied |
| Less than High School | 461 (62.9%) | 272 (37.1%) |
| High School Diploma | 2,093 (59.2%) | 1,441 (40.8%) |
| College/Associate Degree | 2,392 (63.6%) | 1,371 (36.4%) |
| Bachelor's Degree or higher | 2,875 (75.0%) | 960 (25.0%) |
Occupancy by Age of Householder in Bristol
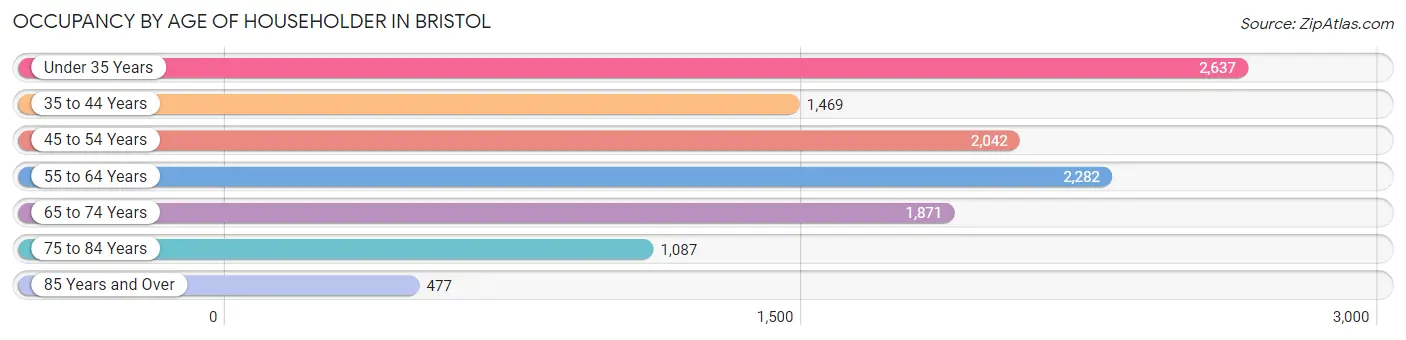
| Age Bracket | # Households | % Households |
| Under 35 Years | 2,637 | 22.2% |
| 35 to 44 Years | 1,469 | 12.4% |
| 45 to 54 Years | 2,042 | 17.2% |
| 55 to 64 Years | 2,282 | 19.2% |
| 65 to 74 Years | 1,871 | 15.8% |
| 75 to 84 Years | 1,087 | 9.2% |
| 85 Years and Over | 477 | 4.0% |
| Total | 11,865 | 100.0% |
Housing Finances in Bristol
Median Income by Occupancy in Bristol
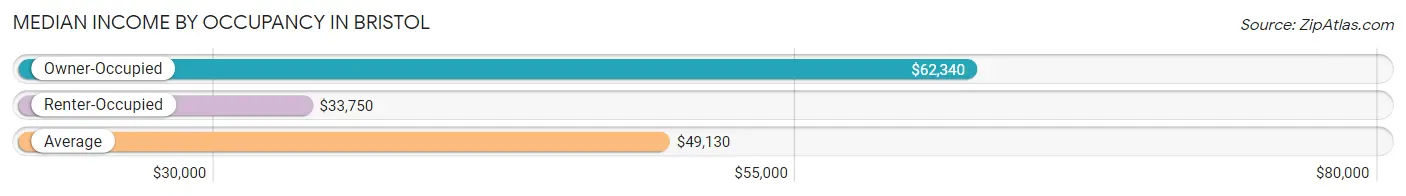
| Occupancy Type | # Households | Median Income |
| Owner-Occupied | 7,821 (65.9%) | $62,340 |
| Renter-Occupied | 4,044 (34.1%) | $33,750 |
| Average | 11,865 (100.0%) | $49,130 |
Occupancy by Householder Income Bracket in Bristol
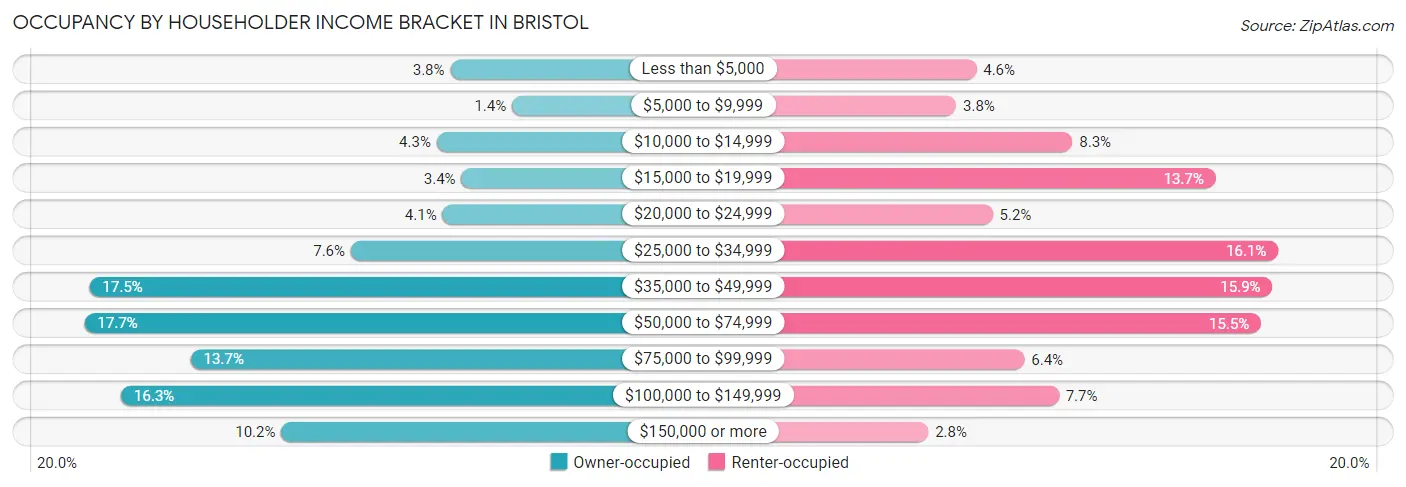
| Income Bracket | Owner-occupied | Renter-occupied |
| Less than $5,000 | 296 (3.8%) | 186 (4.6%) |
| $5,000 to $9,999 | 112 (1.4%) | 155 (3.8%) |
| $10,000 to $14,999 | 336 (4.3%) | 334 (8.3%) |
| $15,000 to $19,999 | 263 (3.4%) | 555 (13.7%) |
| $20,000 to $24,999 | 319 (4.1%) | 211 (5.2%) |
| $25,000 to $34,999 | 592 (7.6%) | 651 (16.1%) |
| $35,000 to $49,999 | 1,371 (17.5%) | 642 (15.9%) |
| $50,000 to $74,999 | 1,386 (17.7%) | 625 (15.4%) |
| $75,000 to $99,999 | 1,070 (13.7%) | 260 (6.4%) |
| $100,000 to $149,999 | 1,277 (16.3%) | 313 (7.7%) |
| $150,000 or more | 799 (10.2%) | 112 (2.8%) |
| Total | 7,821 (100.0%) | 4,044 (100.0%) |
Monthly Housing Cost Tiers in Bristol
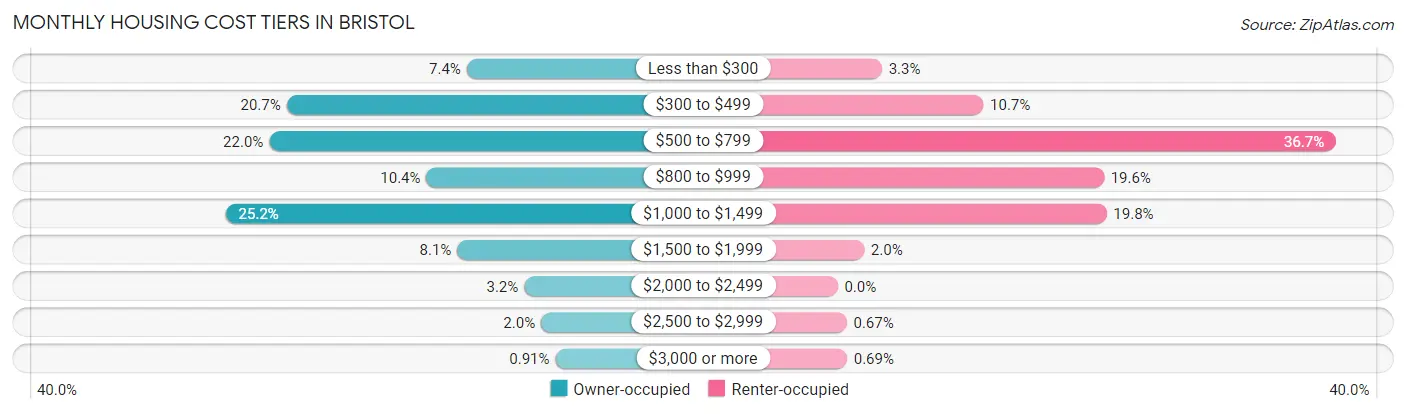
| Monthly Cost | Owner-occupied | Renter-occupied |
| Less than $300 | 582 (7.4%) | 132 (3.3%) |
| $300 to $499 | 1,620 (20.7%) | 434 (10.7%) |
| $500 to $799 | 1,720 (22.0%) | 1,485 (36.7%) |
| $800 to $999 | 814 (10.4%) | 793 (19.6%) |
| $1,000 to $1,499 | 1,972 (25.2%) | 801 (19.8%) |
| $1,500 to $1,999 | 637 (8.1%) | 79 (1.9%) |
| $2,000 to $2,499 | 251 (3.2%) | 0 (0.0%) |
| $2,500 to $2,999 | 154 (2.0%) | 27 (0.7%) |
| $3,000 or more | 71 (0.9%) | 28 (0.7%) |
| Total | 7,821 (100.0%) | 4,044 (100.0%) |
Physical Housing Characteristics in Bristol
Housing Structures in Bristol
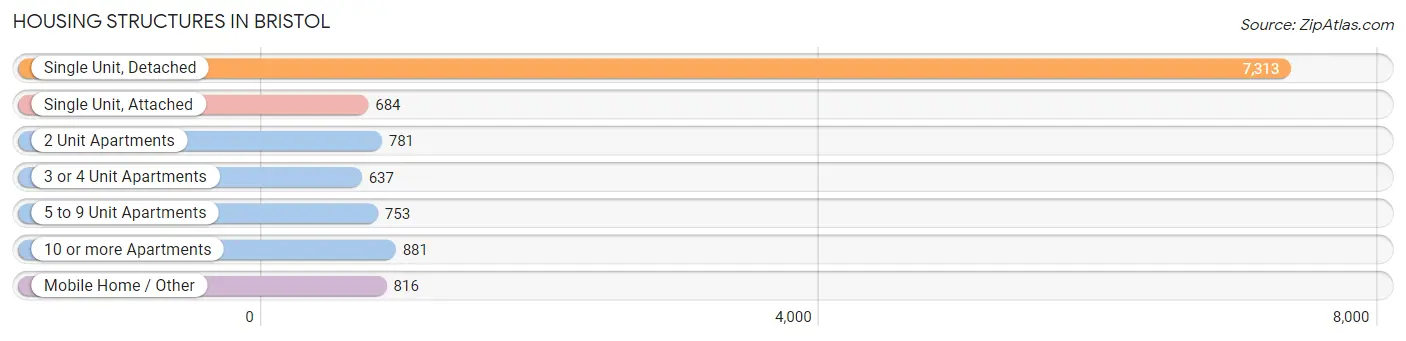
| Structure Type | # Housing Units | % Housing Units |
| Single Unit, Detached | 7,313 | 61.6% |
| Single Unit, Attached | 684 | 5.8% |
| 2 Unit Apartments | 781 | 6.6% |
| 3 or 4 Unit Apartments | 637 | 5.4% |
| 5 to 9 Unit Apartments | 753 | 6.4% |
| 10 or more Apartments | 881 | 7.4% |
| Mobile Home / Other | 816 | 6.9% |
| Total | 11,865 | 100.0% |
Housing Structures by Occupancy in Bristol
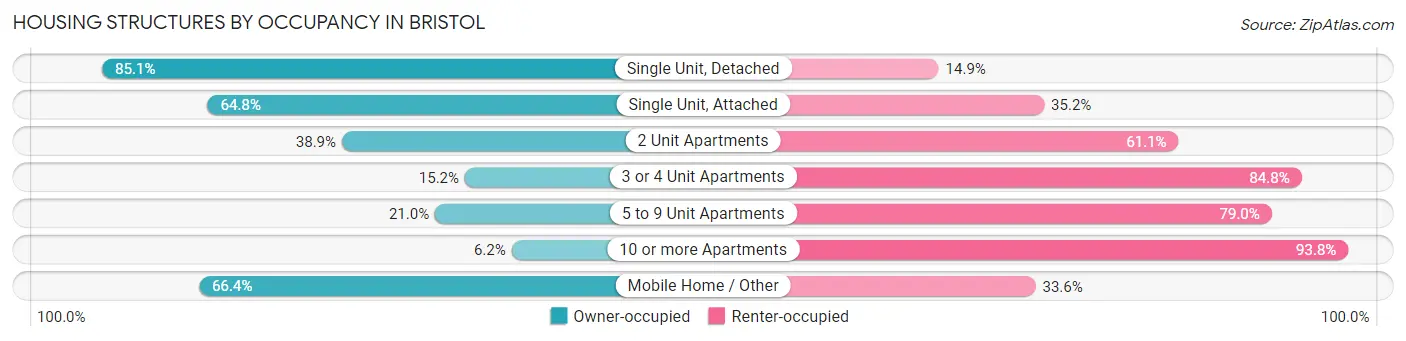
| Structure Type | Owner-occupied | Renter-occupied |
| Single Unit, Detached | 6,222 (85.1%) | 1,091 (14.9%) |
| Single Unit, Attached | 443 (64.8%) | 241 (35.2%) |
| 2 Unit Apartments | 304 (38.9%) | 477 (61.1%) |
| 3 or 4 Unit Apartments | 97 (15.2%) | 540 (84.8%) |
| 5 to 9 Unit Apartments | 158 (21.0%) | 595 (79.0%) |
| 10 or more Apartments | 55 (6.2%) | 826 (93.8%) |
| Mobile Home / Other | 542 (66.4%) | 274 (33.6%) |
| Total | 7,821 (65.9%) | 4,044 (34.1%) |
Housing Structures by Number of Rooms in Bristol
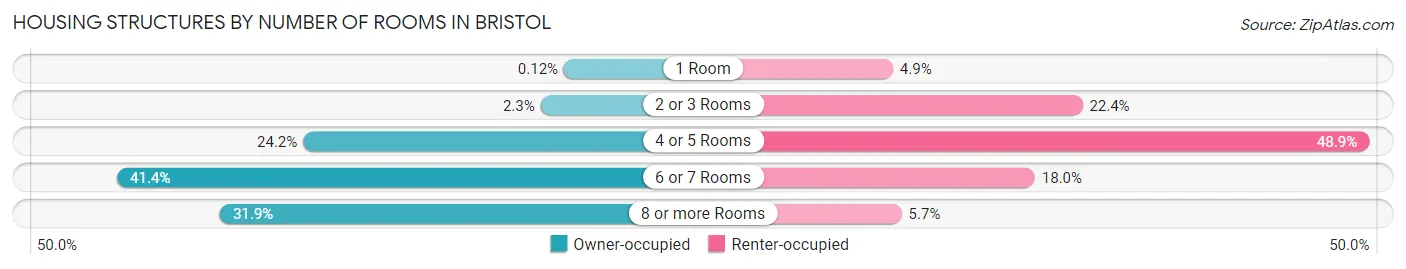
| Number of Rooms | Owner-occupied | Renter-occupied |
| 1 Room | 9 (0.1%) | 198 (4.9%) |
| 2 or 3 Rooms | 178 (2.3%) | 907 (22.4%) |
| 4 or 5 Rooms | 1,896 (24.2%) | 1,979 (48.9%) |
| 6 or 7 Rooms | 3,241 (41.4%) | 729 (18.0%) |
| 8 or more Rooms | 2,497 (31.9%) | 231 (5.7%) |
| Total | 7,821 (100.0%) | 4,044 (100.0%) |
Housing Structure by Heating Type in Bristol
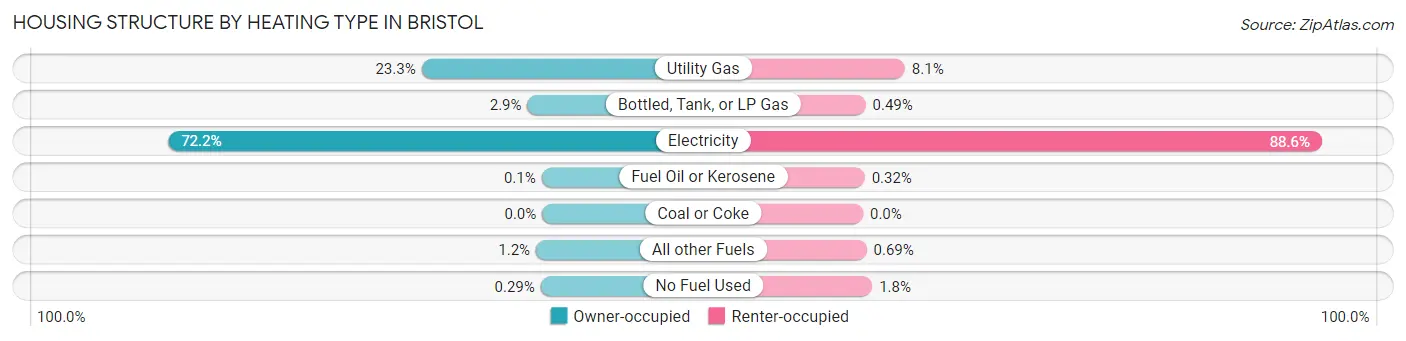
| Heating Type | Owner-occupied | Renter-occupied |
| Utility Gas | 1,823 (23.3%) | 327 (8.1%) |
| Bottled, Tank, or LP Gas | 223 (2.9%) | 20 (0.5%) |
| Electricity | 5,650 (72.2%) | 3,584 (88.6%) |
| Fuel Oil or Kerosene | 8 (0.1%) | 13 (0.3%) |
| Coal or Coke | 0 (0.0%) | 0 (0.0%) |
| All other Fuels | 94 (1.2%) | 28 (0.7%) |
| No Fuel Used | 23 (0.3%) | 72 (1.8%) |
| Total | 7,821 (100.0%) | 4,044 (100.0%) |
Household Vehicle Usage in Bristol
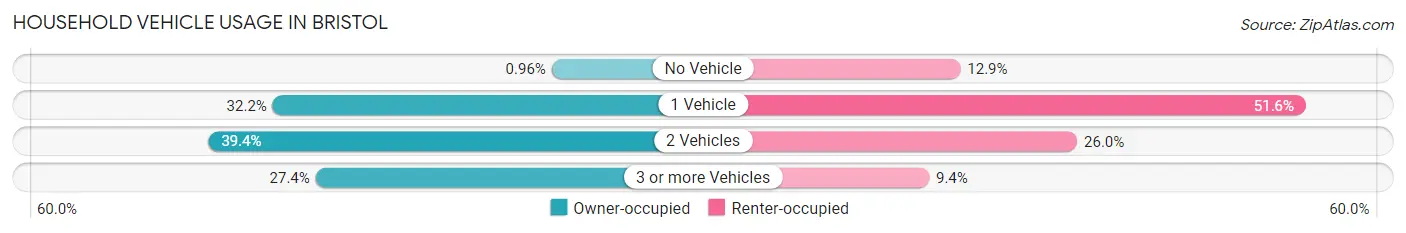
| Vehicles per Household | Owner-occupied | Renter-occupied |
| No Vehicle | 75 (1.0%) | 523 (12.9%) |
| 1 Vehicle | 2,519 (32.2%) | 2,088 (51.6%) |
| 2 Vehicles | 3,084 (39.4%) | 1,052 (26.0%) |
| 3 or more Vehicles | 2,143 (27.4%) | 381 (9.4%) |
| Total | 7,821 (100.0%) | 4,044 (100.0%) |
Real Estate & Mortgages in Bristol
Real Estate and Mortgage Overview in Bristol
| Characteristic | Without Mortgage | With Mortgage |
| Housing Units | 3,515 | 4,306 |
| Median Property Value | $156,900 | $174,700 |
| Median Household Income | $54,344 | $466 |
| Monthly Housing Costs | $441 | $71 |
| Real Estate Taxes | $1,414 | $84 |
Property Value by Mortgage Status in Bristol
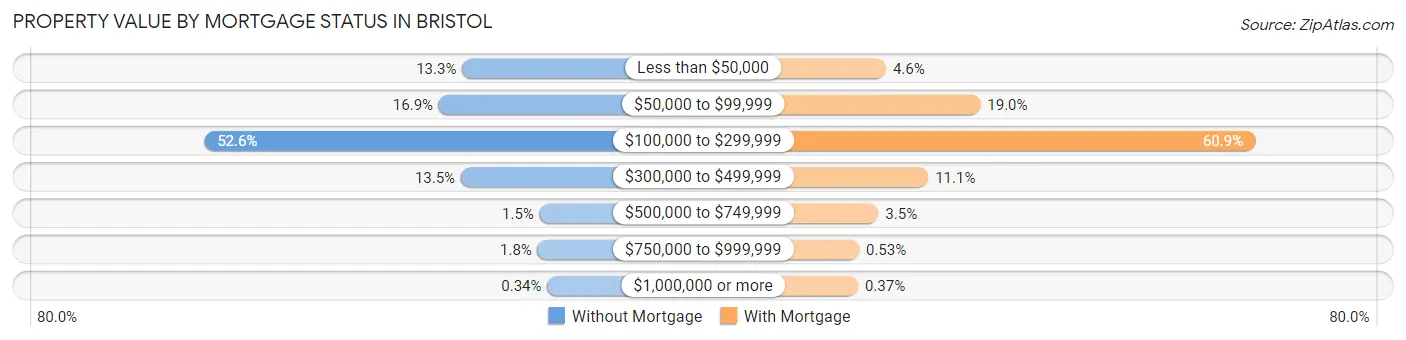
| Property Value | Without Mortgage | With Mortgage |
| Less than $50,000 | 468 (13.3%) | 200 (4.6%) |
| $50,000 to $99,999 | 593 (16.9%) | 819 (19.0%) |
| $100,000 to $299,999 | 1,850 (52.6%) | 2,621 (60.9%) |
| $300,000 to $499,999 | 475 (13.5%) | 477 (11.1%) |
| $500,000 to $749,999 | 53 (1.5%) | 150 (3.5%) |
| $750,000 to $999,999 | 64 (1.8%) | 23 (0.5%) |
| $1,000,000 or more | 12 (0.3%) | 16 (0.4%) |
| Total | 3,515 (100.0%) | 4,306 (100.0%) |
Household Income by Mortgage Status in Bristol
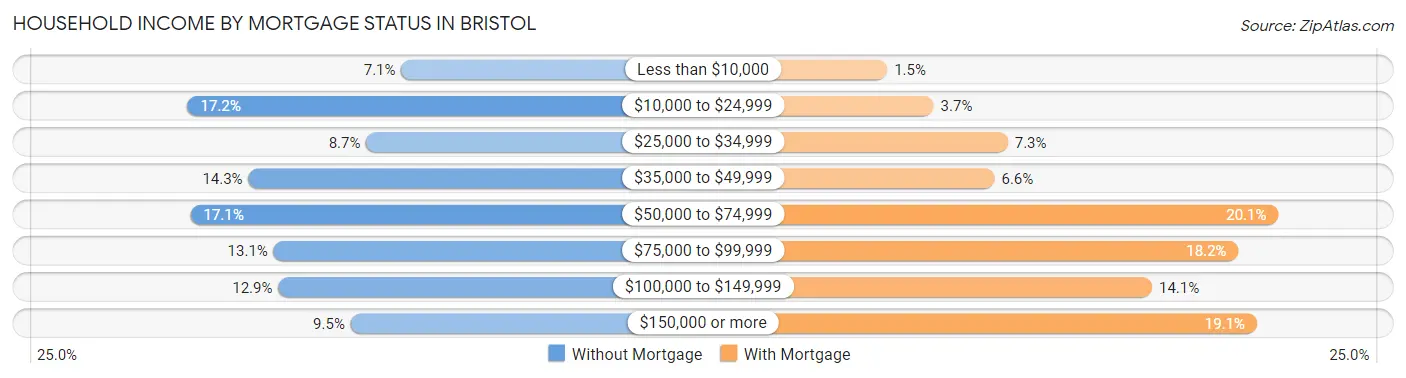
| Household Income | Without Mortgage | With Mortgage |
| Less than $10,000 | 248 (7.1%) | 65 (1.5%) |
| $10,000 to $24,999 | 606 (17.2%) | 160 (3.7%) |
| $25,000 to $34,999 | 307 (8.7%) | 312 (7.2%) |
| $35,000 to $49,999 | 504 (14.3%) | 285 (6.6%) |
| $50,000 to $74,999 | 601 (17.1%) | 867 (20.1%) |
| $75,000 to $99,999 | 462 (13.1%) | 785 (18.2%) |
| $100,000 to $149,999 | 454 (12.9%) | 608 (14.1%) |
| $150,000 or more | 333 (9.5%) | 823 (19.1%) |
| Total | 3,515 (100.0%) | 4,306 (100.0%) |
Property Value to Household Income Ratio in Bristol
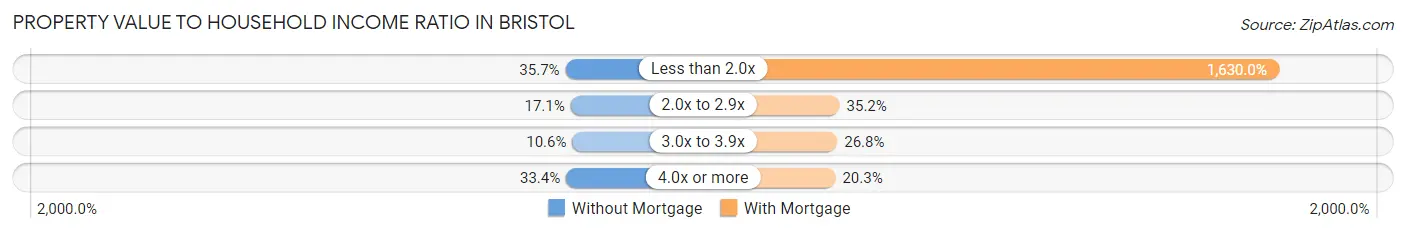
| Value-to-Income Ratio | Without Mortgage | With Mortgage |
| Less than 2.0x | 1,253 (35.6%) | 70,188 (1,630.0%) |
| 2.0x to 2.9x | 601 (17.1%) | 1,517 (35.2%) |
| 3.0x to 3.9x | 373 (10.6%) | 1,153 (26.8%) |
| 4.0x or more | 1,173 (33.4%) | 872 (20.3%) |
| Total | 3,515 (100.0%) | 4,306 (100.0%) |
Real Estate Taxes by Mortgage Status in Bristol
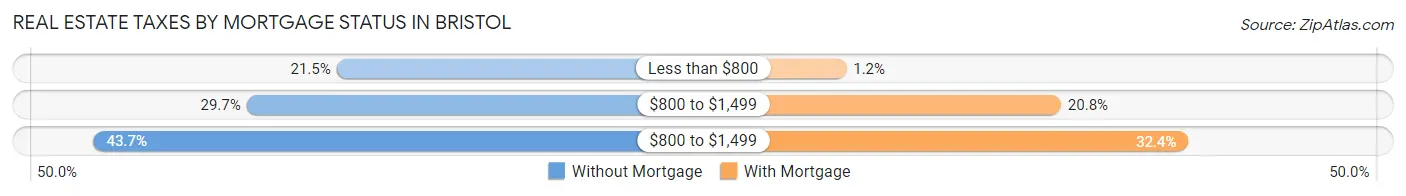
| Property Taxes | Without Mortgage | With Mortgage |
| Less than $800 | 756 (21.5%) | 52 (1.2%) |
| $800 to $1,499 | 1,045 (29.7%) | 896 (20.8%) |
| $800 to $1,499 | 1,536 (43.7%) | 1,397 (32.4%) |
| Total | 3,515 (100.0%) | 4,306 (100.0%) |
Health & Disability in Bristol
Health Insurance Coverage by Age in Bristol
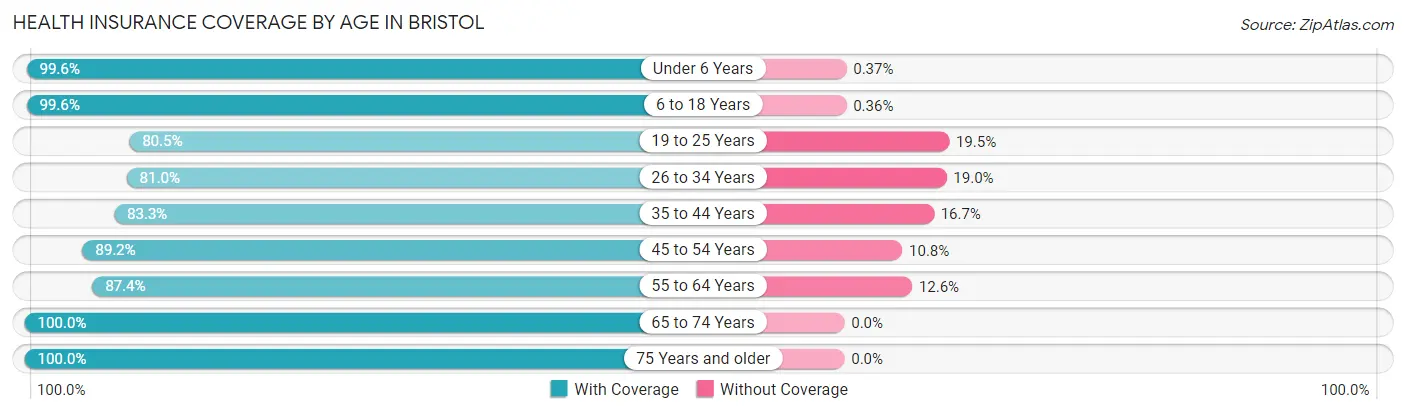
| Age Bracket | With Coverage | Without Coverage |
| Under 6 Years | 1,898 (99.6%) | 7 (0.4%) |
| 6 to 18 Years | 4,431 (99.6%) | 16 (0.4%) |
| 19 to 25 Years | 1,917 (80.5%) | 465 (19.5%) |
| 26 to 34 Years | 2,892 (81.0%) | 680 (19.0%) |
| 35 to 44 Years | 2,345 (83.3%) | 469 (16.7%) |
| 45 to 54 Years | 2,938 (89.2%) | 355 (10.8%) |
| 55 to 64 Years | 3,289 (87.4%) | 475 (12.6%) |
| 65 to 74 Years | 2,817 (100.0%) | 0 (0.0%) |
| 75 Years and older | 2,195 (100.0%) | 0 (0.0%) |
| Total | 24,722 (90.9%) | 2,467 (9.1%) |
Health Insurance Coverage by Citizenship Status in Bristol
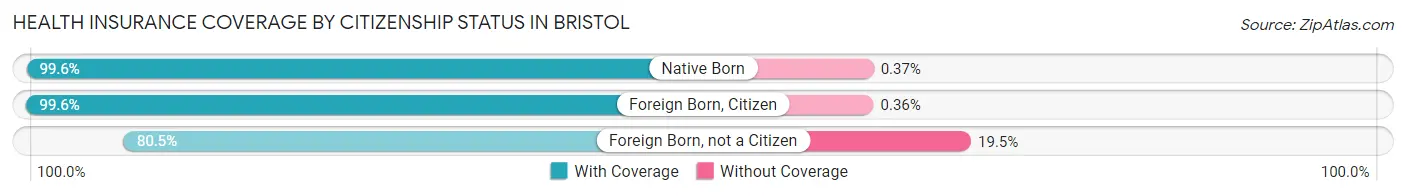
| Citizenship Status | With Coverage | Without Coverage |
| Native Born | 1,898 (99.6%) | 7 (0.4%) |
| Foreign Born, Citizen | 4,431 (99.6%) | 16 (0.4%) |
| Foreign Born, not a Citizen | 1,917 (80.5%) | 465 (19.5%) |
Health Insurance Coverage by Household Income in Bristol
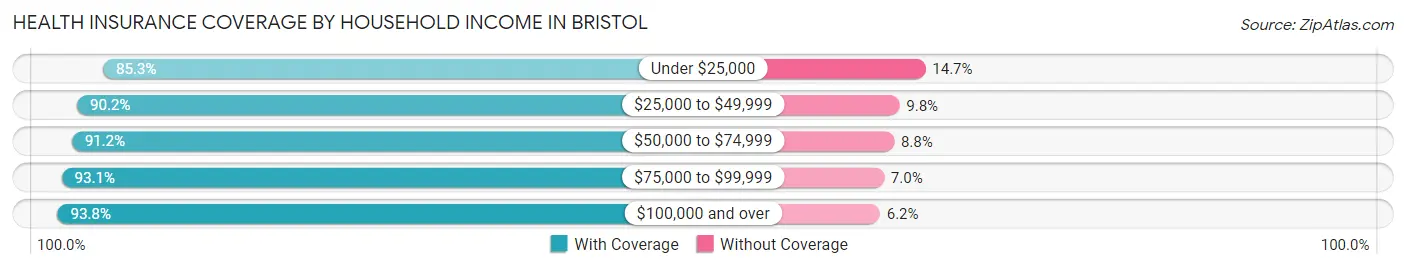
| Household Income | With Coverage | Without Coverage |
| Under $25,000 | 3,576 (85.3%) | 617 (14.7%) |
| $25,000 to $49,999 | 6,124 (90.2%) | 668 (9.8%) |
| $50,000 to $74,999 | 4,257 (91.2%) | 413 (8.8%) |
| $75,000 to $99,999 | 3,295 (93.0%) | 246 (7.0%) |
| $100,000 and over | 7,014 (93.8%) | 462 (6.2%) |
Public vs Private Health Insurance Coverage by Age in Bristol
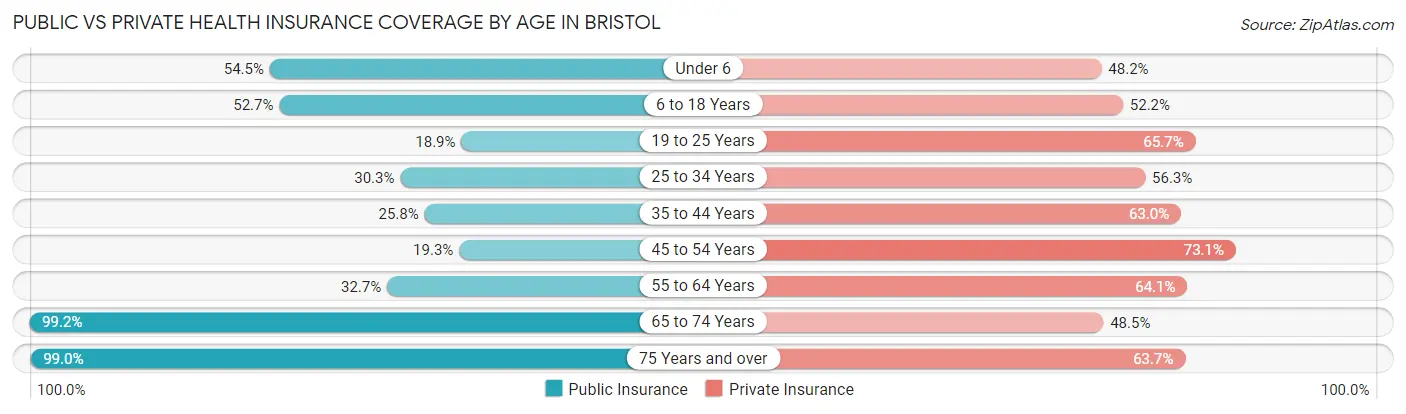
| Age Bracket | Public Insurance | Private Insurance |
| Under 6 | 1,038 (54.5%) | 918 (48.2%) |
| 6 to 18 Years | 2,345 (52.7%) | 2,320 (52.2%) |
| 19 to 25 Years | 451 (18.9%) | 1,564 (65.7%) |
| 25 to 34 Years | 1,081 (30.3%) | 2,011 (56.3%) |
| 35 to 44 Years | 725 (25.8%) | 1,772 (63.0%) |
| 45 to 54 Years | 637 (19.3%) | 2,408 (73.1%) |
| 55 to 64 Years | 1,232 (32.7%) | 2,414 (64.1%) |
| 65 to 74 Years | 2,794 (99.2%) | 1,367 (48.5%) |
| 75 Years and over | 2,172 (99.0%) | 1,399 (63.7%) |
| Total | 12,475 (45.9%) | 16,173 (59.5%) |
Disability Status by Sex by Age in Bristol
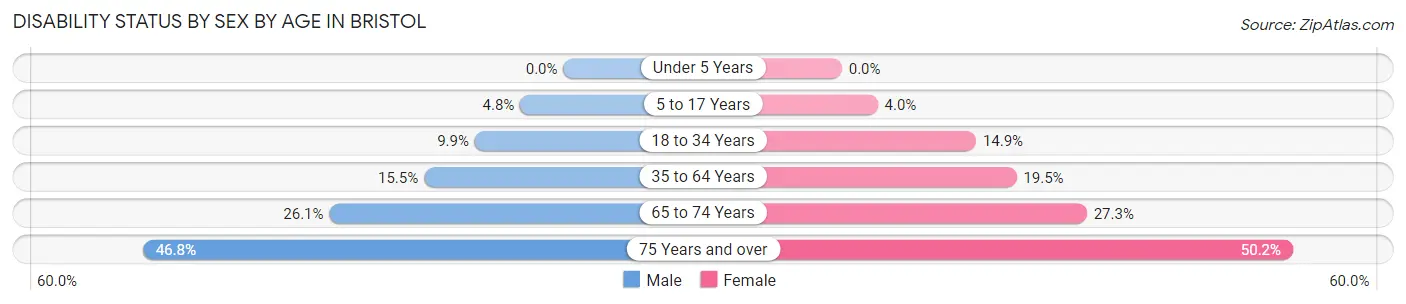
| Age Bracket | Male | Female |
| Under 5 Years | 0 (0.0%) | 0 (0.0%) |
| 5 to 17 Years | 100 (4.8%) | 86 (4.0%) |
| 18 to 34 Years | 303 (9.9%) | 494 (14.9%) |
| 35 to 64 Years | 709 (15.5%) | 1,031 (19.5%) |
| 65 to 74 Years | 331 (26.1%) | 422 (27.3%) |
| 75 Years and over | 423 (46.8%) | 649 (50.2%) |
Disability Class by Sex by Age in Bristol
Disability Class: Hearing Difficulty
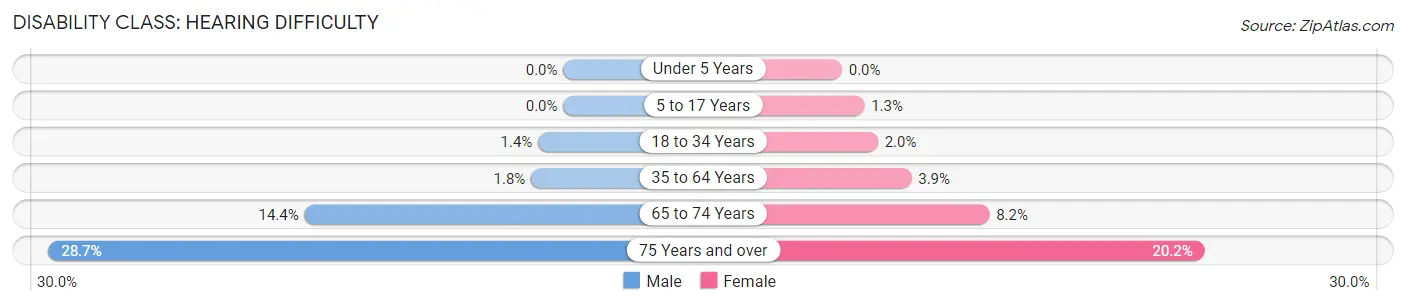
| Age Bracket | Male | Female |
| Under 5 Years | 0 (0.0%) | 0 (0.0%) |
| 5 to 17 Years | 0 (0.0%) | 27 (1.3%) |
| 18 to 34 Years | 43 (1.4%) | 66 (2.0%) |
| 35 to 64 Years | 82 (1.8%) | 205 (3.9%) |
| 65 to 74 Years | 183 (14.4%) | 127 (8.2%) |
| 75 Years and over | 259 (28.7%) | 261 (20.2%) |
Disability Class: Vision Difficulty
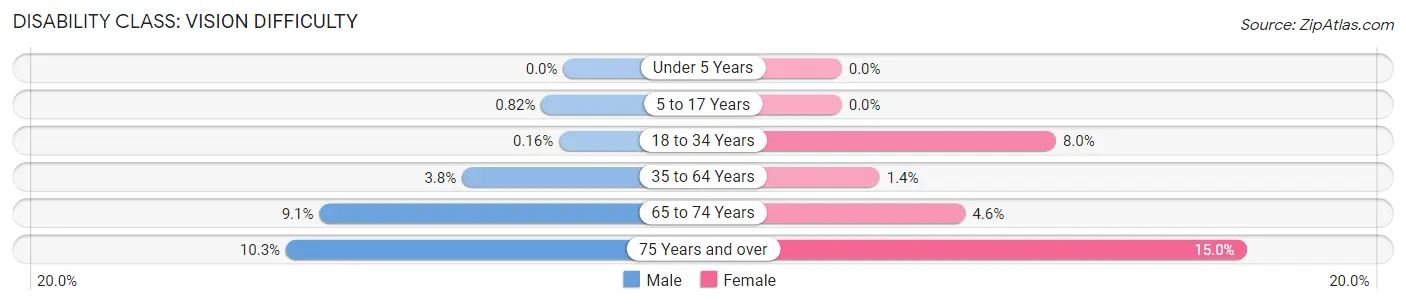
| Age Bracket | Male | Female |
| Under 5 Years | 0 (0.0%) | 0 (0.0%) |
| 5 to 17 Years | 17 (0.8%) | 0 (0.0%) |
| 18 to 34 Years | 5 (0.2%) | 263 (8.0%) |
| 35 to 64 Years | 172 (3.8%) | 75 (1.4%) |
| 65 to 74 Years | 115 (9.1%) | 71 (4.6%) |
| 75 Years and over | 93 (10.3%) | 194 (15.0%) |
Disability Class: Cognitive Difficulty
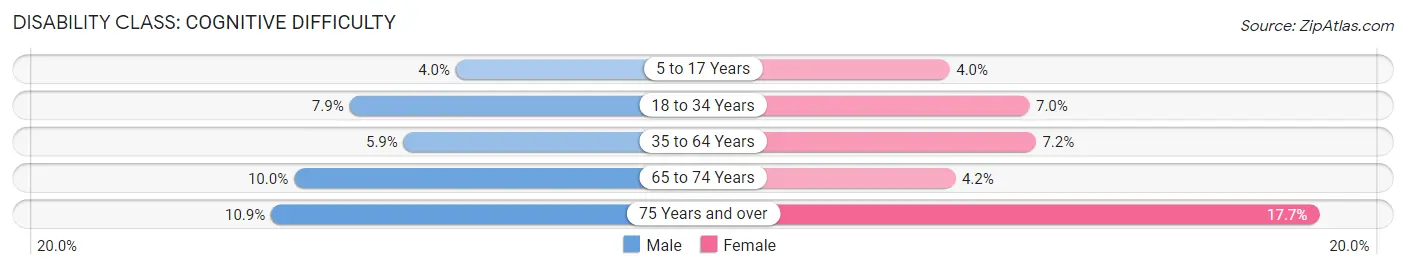
| Age Bracket | Male | Female |
| 5 to 17 Years | 83 (4.0%) | 86 (4.0%) |
| 18 to 34 Years | 244 (7.9%) | 230 (7.0%) |
| 35 to 64 Years | 271 (5.9%) | 381 (7.2%) |
| 65 to 74 Years | 127 (10.0%) | 65 (4.2%) |
| 75 Years and over | 98 (10.8%) | 229 (17.7%) |
Disability Class: Ambulatory Difficulty
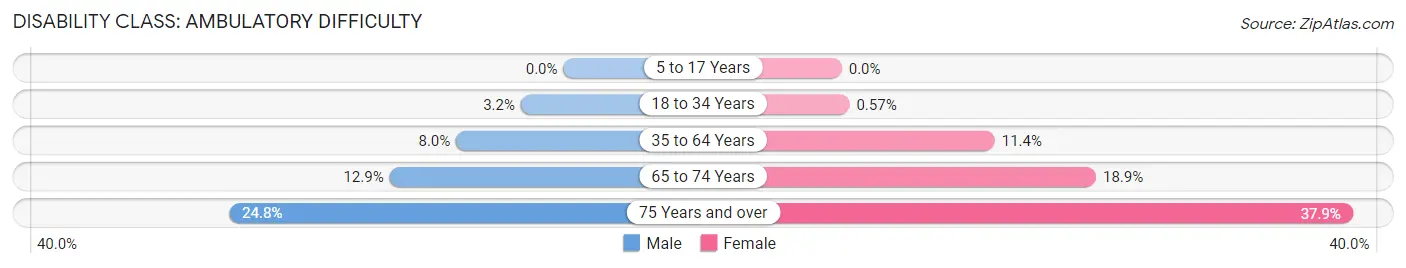
| Age Bracket | Male | Female |
| 5 to 17 Years | 0 (0.0%) | 0 (0.0%) |
| 18 to 34 Years | 97 (3.2%) | 19 (0.6%) |
| 35 to 64 Years | 364 (8.0%) | 602 (11.4%) |
| 65 to 74 Years | 164 (12.9%) | 292 (18.9%) |
| 75 Years and over | 224 (24.8%) | 490 (37.9%) |
Disability Class: Self-Care Difficulty
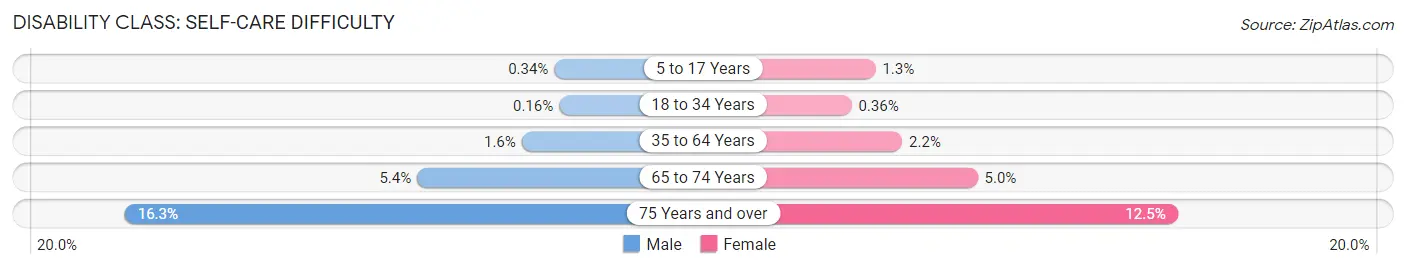
| Age Bracket | Male | Female |
| 5 to 17 Years | 7 (0.3%) | 27 (1.3%) |
| 18 to 34 Years | 5 (0.2%) | 12 (0.4%) |
| 35 to 64 Years | 71 (1.5%) | 119 (2.2%) |
| 65 to 74 Years | 69 (5.4%) | 78 (5.0%) |
| 75 Years and over | 147 (16.3%) | 161 (12.5%) |
Technology Access in Bristol
Computing Device Access in Bristol
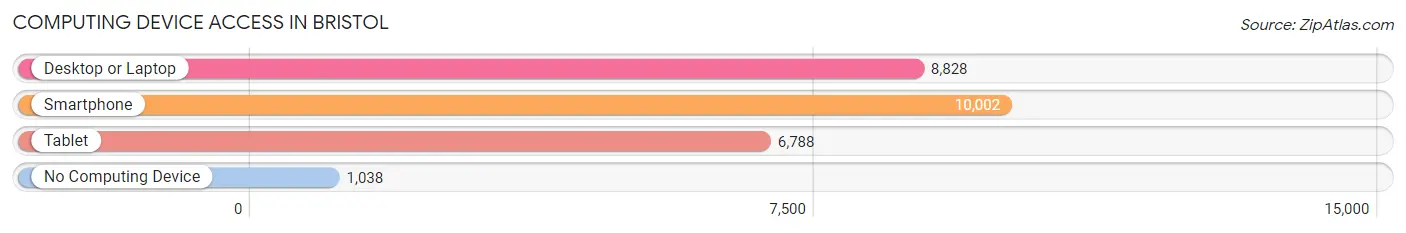
| Device Type | # Households | % Households |
| Desktop or Laptop | 8,828 | 74.4% |
| Smartphone | 10,002 | 84.3% |
| Tablet | 6,788 | 57.2% |
| No Computing Device | 1,038 | 8.7% |
| Total | 11,865 | 100.0% |
Internet Access in Bristol
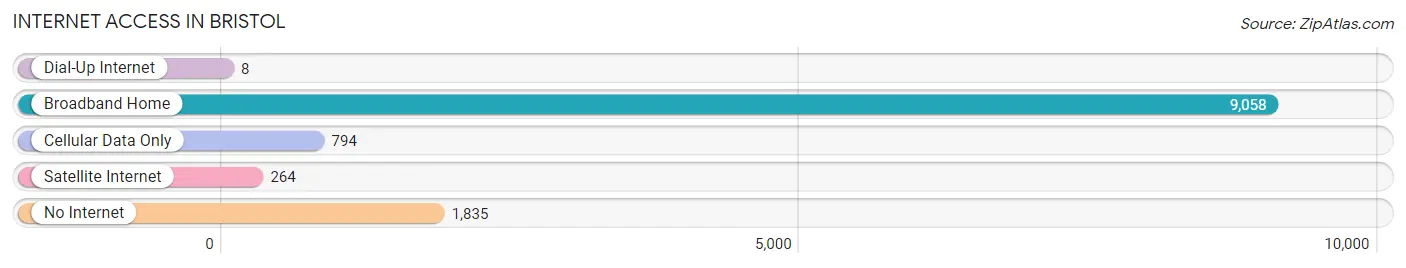
| Internet Type | # Households | % Households |
| Dial-Up Internet | 8 | 0.1% |
| Broadband Home | 9,058 | 76.3% |
| Cellular Data Only | 794 | 6.7% |
| Satellite Internet | 264 | 2.2% |
| No Internet | 1,835 | 15.5% |
| Total | 11,865 | 100.0% |
Bristol Summary
Bristol, Tennessee is a city located in the northeastern corner of the state, near the border of Virginia and North Carolina. It is the twin city of Bristol, Virginia, and together they form the twin cities of Bristol, Tennessee-Virginia, which is the birthplace of country music. The city is located in Sullivan County and is part of the Kingsport-Bristol-Bristol, TN-VA Metropolitan Statistical Area, which is a component of the Johnson City-Kingsport-Bristol, TN-VA Combined Statistical Area.
Geography
Bristol is located in the Appalachian Mountains of northeastern Tennessee, near the border of Virginia and North Carolina. The city is situated at the junction of two rivers, the Holston and the South Fork Holston, which form the Tennessee-Virginia border. The city is located at an elevation of 1,945 feet (592 m) above sea level. The city has a total area of 16.2 square miles (41.8 km2), of which 16.1 square miles (41.6 km2) is land and 0.1 square miles (0.2 km2) is water.
Economy
Bristol is a major industrial center in the region, with a diverse economy that includes manufacturing, retail, healthcare, and tourism. The city is home to several large employers, including Eastman Chemical Company, Bristol Tennessee Essential Services, and Bristol Regional Medical Center. The city is also home to several smaller businesses, including restaurants, shops, and other services.
Demographics
As of the 2010 census, the city had a population of 26,702. The racial makeup of the city was 87.3% White, 8.2% African American, 0.3% Native American, 0.7% Asian, 0.1% Pacific Islander, 1.3% from other races, and 2.3% from two or more races. Hispanic or Latino of any race were 3.2% of the population.
The median income for a household in the city was $32,917, and the median income for a family was $41,945. Males had a median income of $30,917 versus $22,917 for females. The per capita income for the city was $17,945. About 13.2% of families and 16.7% of the population were below the poverty line, including 22.2% of those under age 18 and 11.2% of those age 65 or over.
Conclusion
Bristol, Tennessee is a city located in the northeastern corner of the state, near the border of Virginia and North Carolina. It is the twin city of Bristol, Virginia, and together they form the twin cities of Bristol, Tennessee-Virginia, which is the birthplace of country music. The city is located in Sullivan County and is part of the Kingsport-Bristol-Bristol, TN-VA Metropolitan Statistical Area, which is a component of the Johnson City-Kingsport-Bristol, TN-VA Combined Statistical Area. The city has a diverse economy that includes manufacturing, retail, healthcare, and tourism. As of the 2010 census, the city had a population of 26,702, with a median income for a household of $32,917 and a median income for a family of $41,945.
Common Questions
What is Per Capita Income in Bristol?
Per Capita income in Bristol is $31,202.
What is the Median Family Income in Bristol?
Median Family Income in Bristol is $64,044.
What is the Median Household income in Bristol?
Median Household Income in Bristol is $49,130.
What is Income or Wage Gap in Bristol?
Income or Wage Gap in Bristol is 25.8%.
Women in Bristol earn 74.2 cents for every dollar earned by a man.
What is Family Income Deficit in Bristol?
Family Income Deficit in Bristol is $9,668.
Families that are below poverty line in Bristol earn $9,668 less on average than the poverty threshold level.
What is Inequality or Gini Index in Bristol?
Inequality or Gini Index in Bristol is 0.47.
What is the Total Population of Bristol?
Total Population of Bristol is 27,307.
What is the Total Male Population of Bristol?
Total Male Population of Bristol is 12,822.
What is the Total Female Population of Bristol?
Total Female Population of Bristol is 14,485.
What is the Ratio of Males per 100 Females in Bristol?
There are 88.52 Males per 100 Females in Bristol.
What is the Ratio of Females per 100 Males in Bristol?
There are 112.97 Females per 100 Males in Bristol.
What is the Median Population Age in Bristol?
Median Population Age in Bristol is 40.2 Years.
What is the Average Family Size in Bristol
Average Family Size in Bristol is 2.9 People.
What is the Average Household Size in Bristol
Average Household Size in Bristol is 2.2 People.
How Large is the Labor Force in Bristol?
There are 12,747 People in the Labor Forcein in Bristol.
What is the Percentage of People in the Labor Force in Bristol?
57.9% of People are in the Labor Force in Bristol.
What is the Unemployment Rate in Bristol?
Unemployment Rate in Bristol is 8.8%.