Mountain City, TN Map & Demographics
Mountain City Map
Mountain City Overview
$22,866
PER CAPITA INCOME
$57,750
AVG FAMILY INCOME
$32,383
AVG HOUSEHOLD INCOME
7.3%
WAGE / INCOME GAP [ % ]
92.7¢/ $1
WAGE / INCOME GAP [ $ ]
0.47
INEQUALITY / GINI INDEX
2,396
TOTAL POPULATION
1,183
MALE POPULATION
1,213
FEMALE POPULATION
97.53
MALES / 100 FEMALES
102.54
FEMALES / 100 MALES
51.0
MEDIAN AGE
3.0
AVG FAMILY SIZE
2.1
AVG HOUSEHOLD SIZE
835
LABOR FORCE [ PEOPLE ]
41.8%
PERCENT IN LABOR FORCE
9.1%
UNEMPLOYMENT RATE
Mountain City Zip Codes
Mountain City Area Codes
Income in Mountain City
Income Overview in Mountain City
Per Capita Income in Mountain City is $22,866, while median incomes of families and households are $57,750 and $32,383 respectively.
| Characteristic | Number | Measure |
| Per Capita Income | 2,396 | $22,866 |
| Median Family Income | 527 | $57,750 |
| Mean Family Income | 527 | $63,740 |
| Median Household Income | 1,049 | $32,383 |
| Mean Household Income | 1,049 | $48,115 |
| Income Deficit | 527 | $0 |
| Wage / Income Gap (%) | 2,396 | 7.29% |
| Wage / Income Gap ($) | 2,396 | 92.71¢ per $1 |
| Gini / Inequality Index | 2,396 | 0.47 |
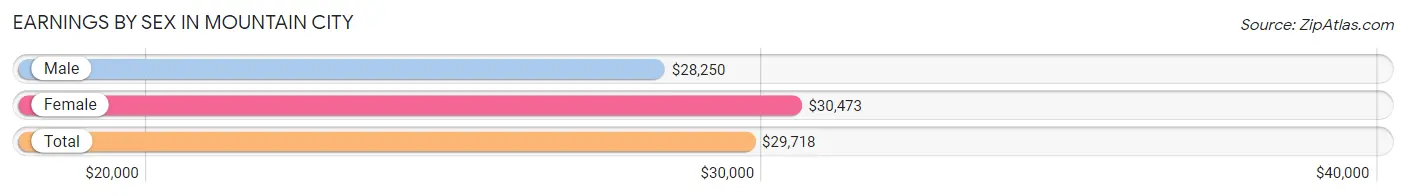
Earnings by Sex in Mountain City
Average Earnings in Mountain City are $29,718, $28,250 for men and $30,473 for women, a difference of 7.3%.
| Sex | Number | Average Earnings |
| Male | 503 (57.1%) | $28,250 |
| Female | 378 (42.9%) | $30,473 |
| Total | 881 (100.0%) | $29,718 |
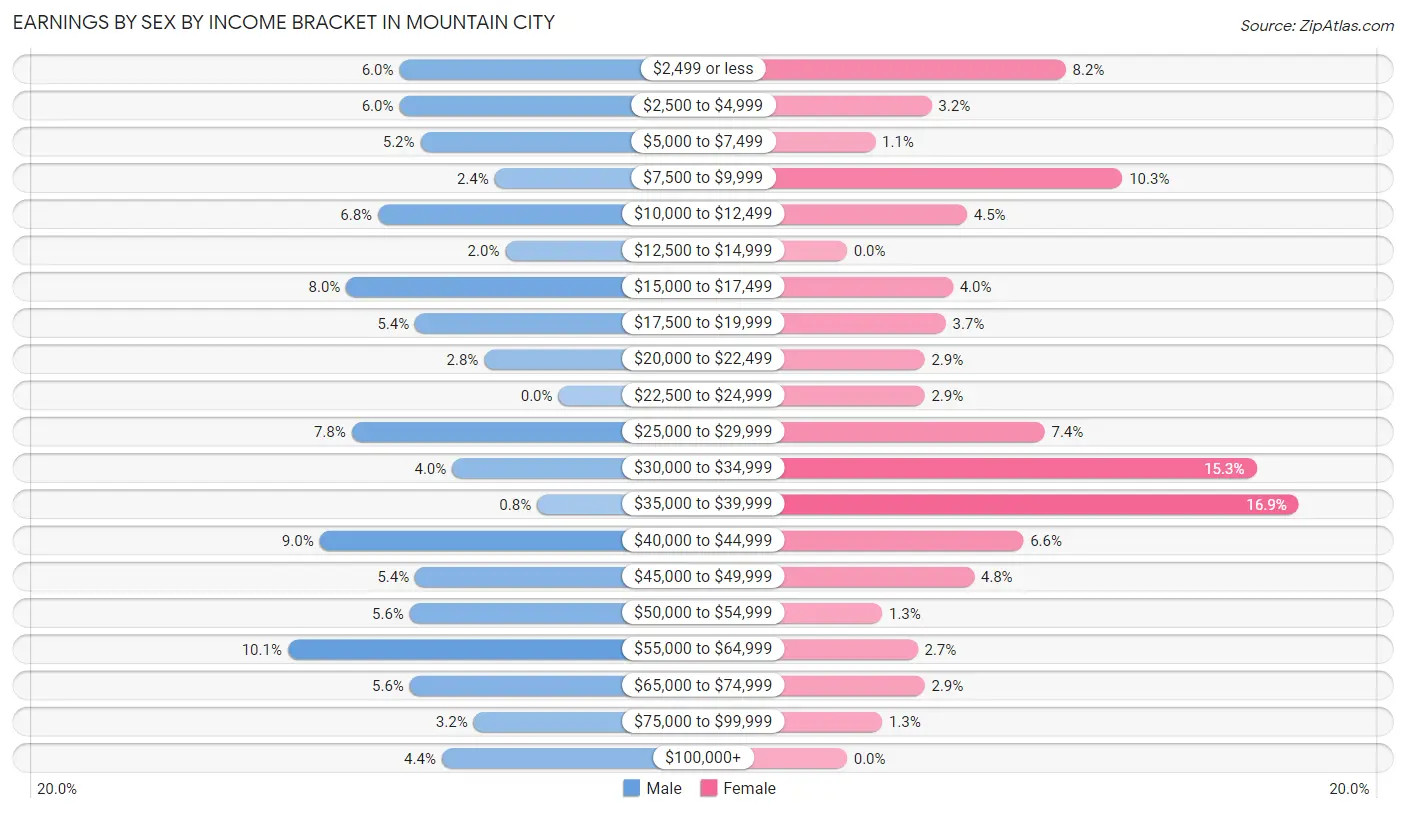
Earnings by Sex by Income Bracket in Mountain City
The most common earnings brackets in Mountain City are $55,000 to $64,999 for men (51 | 10.1%) and $35,000 to $39,999 for women (64 | 16.9%).
| Income | Male | Female |
| $2,499 or less | 30 (6.0%) | 31 (8.2%) |
| $2,500 to $4,999 | 30 (6.0%) | 12 (3.2%) |
| $5,000 to $7,499 | 26 (5.2%) | 4 (1.1%) |
| $7,500 to $9,999 | 12 (2.4%) | 39 (10.3%) |
| $10,000 to $12,499 | 34 (6.8%) | 17 (4.5%) |
| $12,500 to $14,999 | 10 (2.0%) | 0 (0.0%) |
| $15,000 to $17,499 | 40 (8.0%) | 15 (4.0%) |
| $17,500 to $19,999 | 27 (5.4%) | 14 (3.7%) |
| $20,000 to $22,499 | 14 (2.8%) | 11 (2.9%) |
| $22,500 to $24,999 | 0 (0.0%) | 11 (2.9%) |
| $25,000 to $29,999 | 39 (7.7%) | 28 (7.4%) |
| $30,000 to $34,999 | 20 (4.0%) | 58 (15.3%) |
| $35,000 to $39,999 | 4 (0.8%) | 64 (16.9%) |
| $40,000 to $44,999 | 45 (8.9%) | 25 (6.6%) |
| $45,000 to $49,999 | 27 (5.4%) | 18 (4.8%) |
| $50,000 to $54,999 | 28 (5.6%) | 5 (1.3%) |
| $55,000 to $64,999 | 51 (10.1%) | 10 (2.6%) |
| $65,000 to $74,999 | 28 (5.6%) | 11 (2.9%) |
| $75,000 to $99,999 | 16 (3.2%) | 5 (1.3%) |
| $100,000+ | 22 (4.4%) | 0 (0.0%) |
| Total | 503 (100.0%) | 378 (100.0%) |
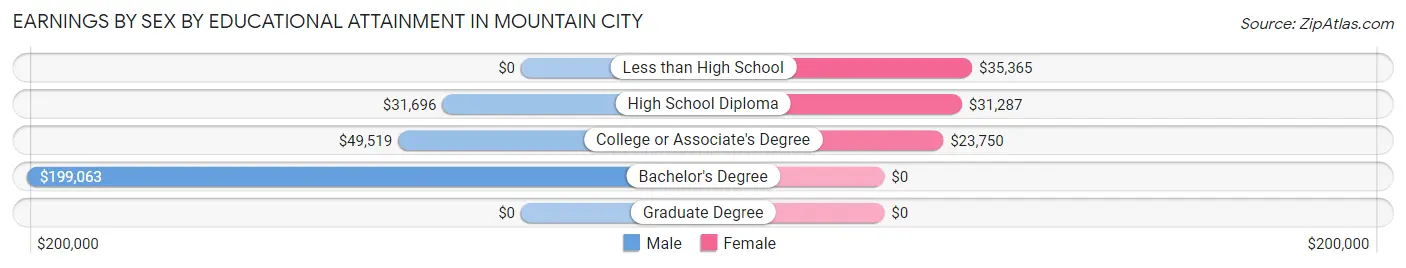
Earnings by Sex by Educational Attainment in Mountain City
Average earnings in Mountain City are $30,446 for men and $31,115 for women, a difference of 2.1%. Men with an educational attainment of bachelor's degree enjoy the highest average annual earnings of $199,063, while those with high school diploma education earn the least with $31,696. Women with an educational attainment of less than high school earn the most with the average annual earnings of $35,365, while those with college or associate's degree education have the smallest earnings of $23,750.
| Educational Attainment | Male Income | Female Income |
| Less than High School | - | - |
| High School Diploma | $31,696 | $31,287 |
| College or Associate's Degree | $49,519 | $23,750 |
| Bachelor's Degree | $199,063 | $0 |
| Graduate Degree | - | - |
| Total | $30,446 | $31,115 |
Family Income in Mountain City
Family Income Brackets in Mountain City
According to the Mountain City family income data, there are 143 families falling into the $50,000 to $74,999 income range, which is the most common income bracket and makes up 27.1% of all families. Conversely, the $150,000 to $199,999 income bracket is the least frequent group with only 8 families (1.5%) belonging to this category.
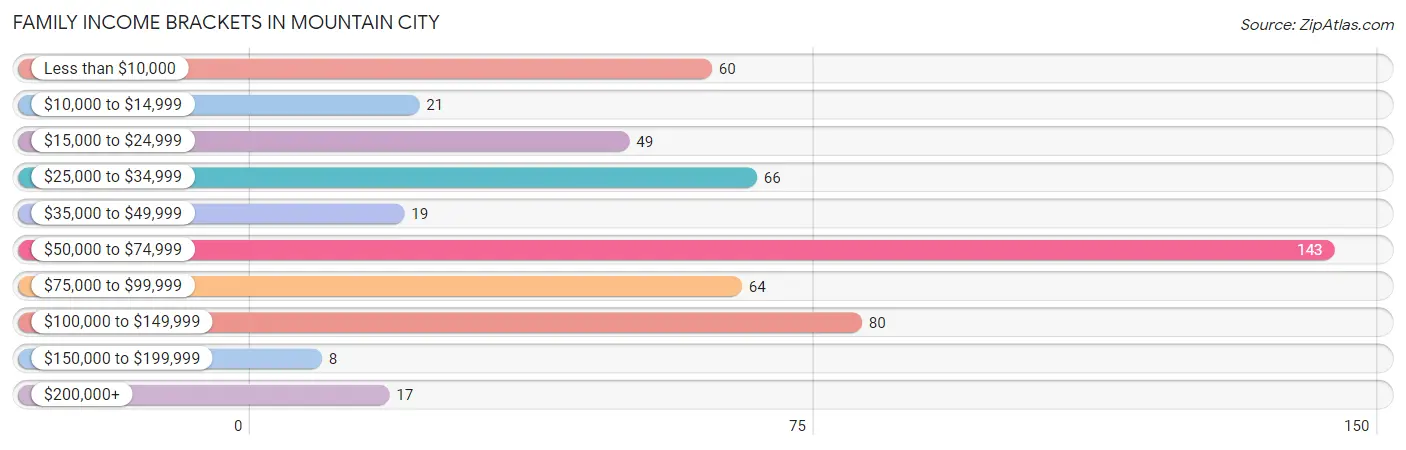
| Income Bracket | # Families | % Families |
| Less than $10,000 | 60 | 11.4% |
| $10,000 to $14,999 | 21 | 4.0% |
| $15,000 to $24,999 | 49 | 9.3% |
| $25,000 to $34,999 | 66 | 12.5% |
| $35,000 to $49,999 | 19 | 3.6% |
| $50,000 to $74,999 | 143 | 27.1% |
| $75,000 to $99,999 | 64 | 12.1% |
| $100,000 to $149,999 | 80 | 15.2% |
| $150,000 to $199,999 | 8 | 1.5% |
| $200,000+ | 17 | 3.2% |
Family Income by Famaliy Size in Mountain City
3-person families (101 | 19.2%) account for the highest median family income in Mountain City with $67,614 per family, while 2-person families (280 | 53.1%) have the highest median income of $26,875 per family member.
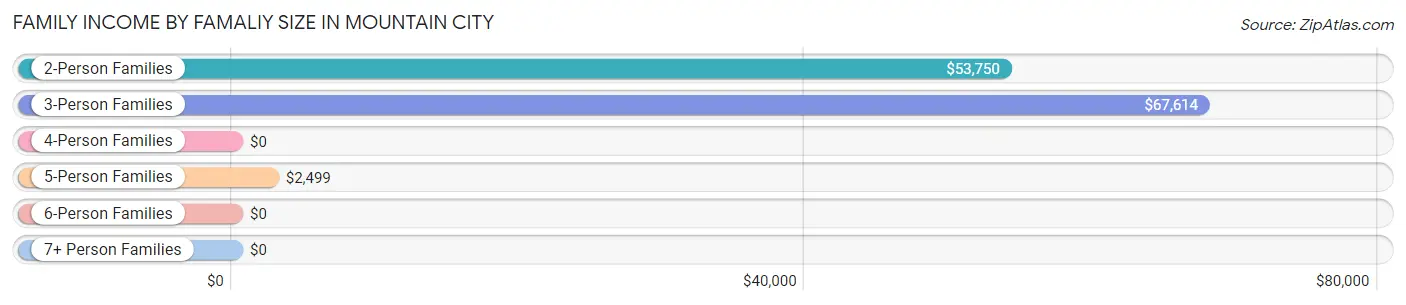
| Income Bracket | # Families | Median Income |
| 2-Person Families | 280 (53.1%) | $53,750 |
| 3-Person Families | 101 (19.2%) | $67,614 |
| 4-Person Families | 68 (12.9%) | $0 |
| 5-Person Families | 41 (7.8%) | $2,499 |
| 6-Person Families | 19 (3.6%) | $0 |
| 7+ Person Families | 18 (3.4%) | $0 |
| Total | 527 (100.0%) | $57,750 |
Family Income by Number of Earners in Mountain City
The median family income in Mountain City is $57,750, with families comprising 3+ earners (60) having the highest median family income of $112,656, while families with no earners (201) have the lowest median family income of $30,917, accounting for 11.4% and 38.1% of families, respectively.
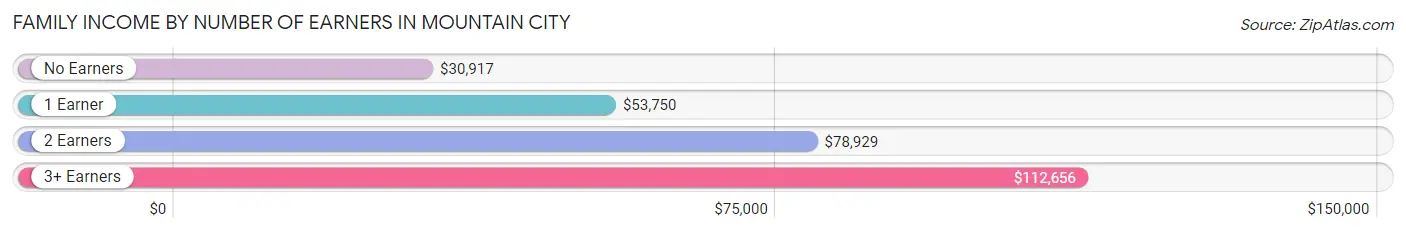
| Number of Earners | # Families | Median Income |
| No Earners | 201 (38.1%) | $30,917 |
| 1 Earner | 174 (33.0%) | $53,750 |
| 2 Earners | 92 (17.5%) | $78,929 |
| 3+ Earners | 60 (11.4%) | $112,656 |
| Total | 527 (100.0%) | $57,750 |
Household Income in Mountain City
Household Income Brackets in Mountain City
With 171 households falling in the category, the $50,000 to $74,999 income range is the most frequent in Mountain City, accounting for 16.3% of all households. In contrast, only 16 households (1.5%) fall into the $150,000 to $199,999 income bracket, making it the least populous group.
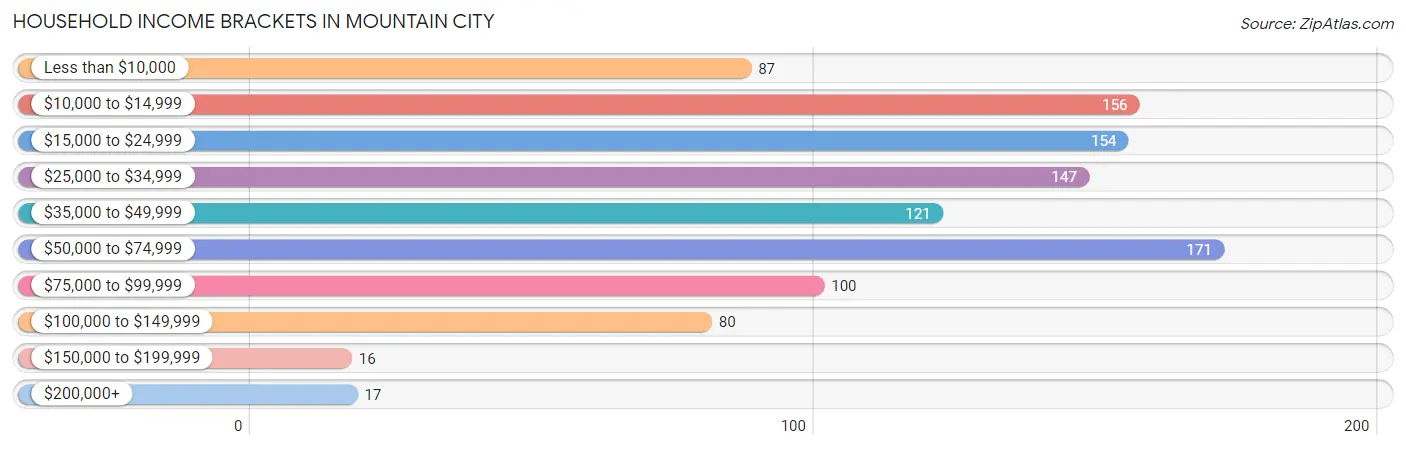
| Income Bracket | # Households | % Households |
| Less than $10,000 | 87 | 8.3% |
| $10,000 to $14,999 | 156 | 14.9% |
| $15,000 to $24,999 | 154 | 14.7% |
| $25,000 to $34,999 | 147 | 14.0% |
| $35,000 to $49,999 | 121 | 11.5% |
| $50,000 to $74,999 | 171 | 16.3% |
| $75,000 to $99,999 | 100 | 9.5% |
| $100,000 to $149,999 | 80 | 7.6% |
| $150,000 to $199,999 | 16 | 1.5% |
| $200,000+ | 17 | 1.6% |
Household Income by Householder Age in Mountain City
The median household income in Mountain City is $32,383, with the highest median household income of $39,479 found in the 25 to 44 years age bracket for the primary householder. A total of 185 households (17.6%) fall into this category. Meanwhile, the 15 to 24 years age bracket for the primary householder has the lowest median household income of $0, with 26 households (2.5%) in this group.
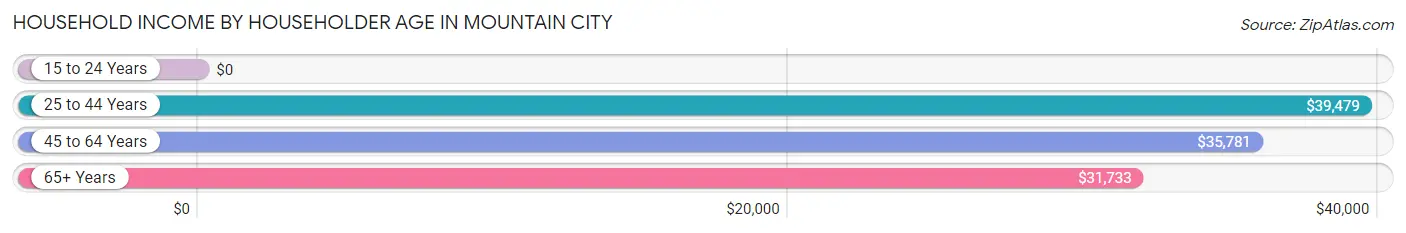
| Income Bracket | # Households | Median Income |
| 15 to 24 Years | 26 (2.5%) | $0 |
| 25 to 44 Years | 185 (17.6%) | $39,479 |
| 45 to 64 Years | 418 (39.9%) | $35,781 |
| 65+ Years | 420 (40.0%) | $31,733 |
| Total | 1,049 (100.0%) | $32,383 |
Poverty in Mountain City
Income Below Poverty by Sex and Age in Mountain City
With 23.5% poverty level for males and 37.4% for females among the residents of Mountain City, 12 to 14 year old males and 5 year old females are the most vulnerable to poverty, with 28 males (65.1%) and 12 females (100.0%) in their respective age groups living below the poverty level.
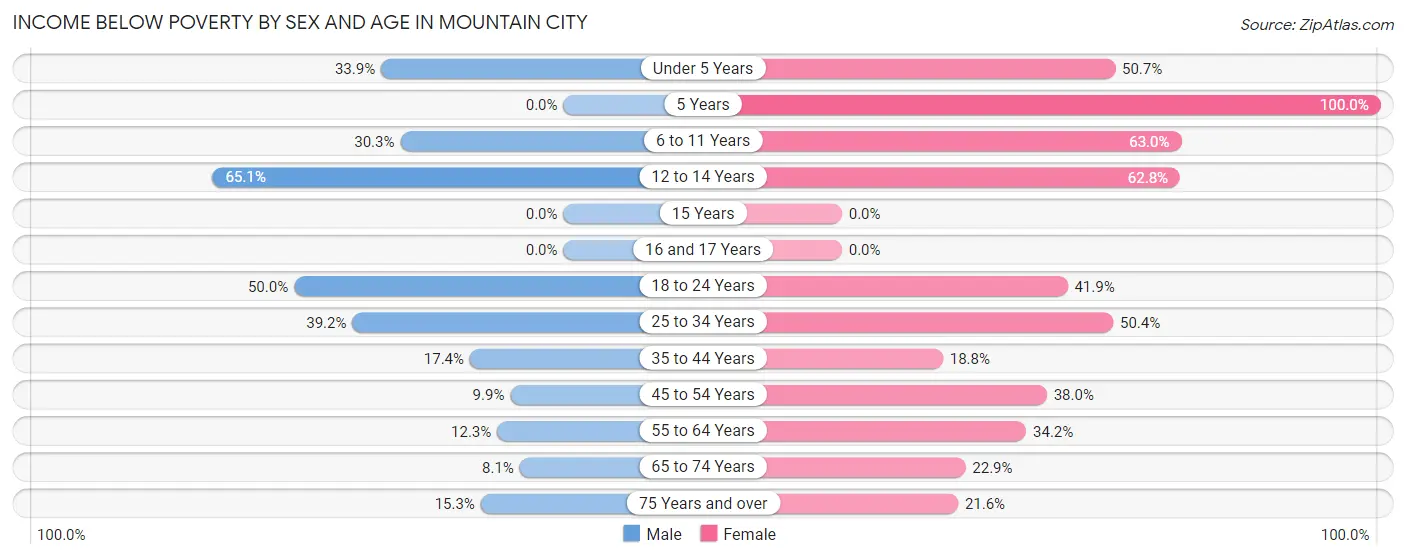
| Age Bracket | Male | Female |
| Under 5 Years | 22 (33.9%) | 35 (50.7%) |
| 5 Years | 0 (0.0%) | 12 (100.0%) |
| 6 to 11 Years | 23 (30.3%) | 46 (63.0%) |
| 12 to 14 Years | 28 (65.1%) | 32 (62.7%) |
| 15 Years | 0 (0.0%) | 0 (0.0%) |
| 16 and 17 Years | 0 (0.0%) | 0 (0.0%) |
| 18 to 24 Years | 23 (50.0%) | 31 (41.9%) |
| 25 to 34 Years | 67 (39.2%) | 72 (50.3%) |
| 35 to 44 Years | 17 (17.3%) | 12 (18.8%) |
| 45 to 54 Years | 7 (9.9%) | 35 (38.0%) |
| 55 to 64 Years | 23 (12.3%) | 78 (34.2%) |
| 65 to 74 Years | 6 (8.1%) | 39 (22.9%) |
| 75 Years and over | 25 (15.3%) | 36 (21.6%) |
| Total | 241 (23.5%) | 428 (37.4%) |
Income Above Poverty by Sex and Age in Mountain City
According to the poverty statistics in Mountain City, males aged 15 years and females aged 35 to 44 years are the age groups that are most secure financially, with 100.0% of males and 81.2% of females in these age groups living above the poverty line.
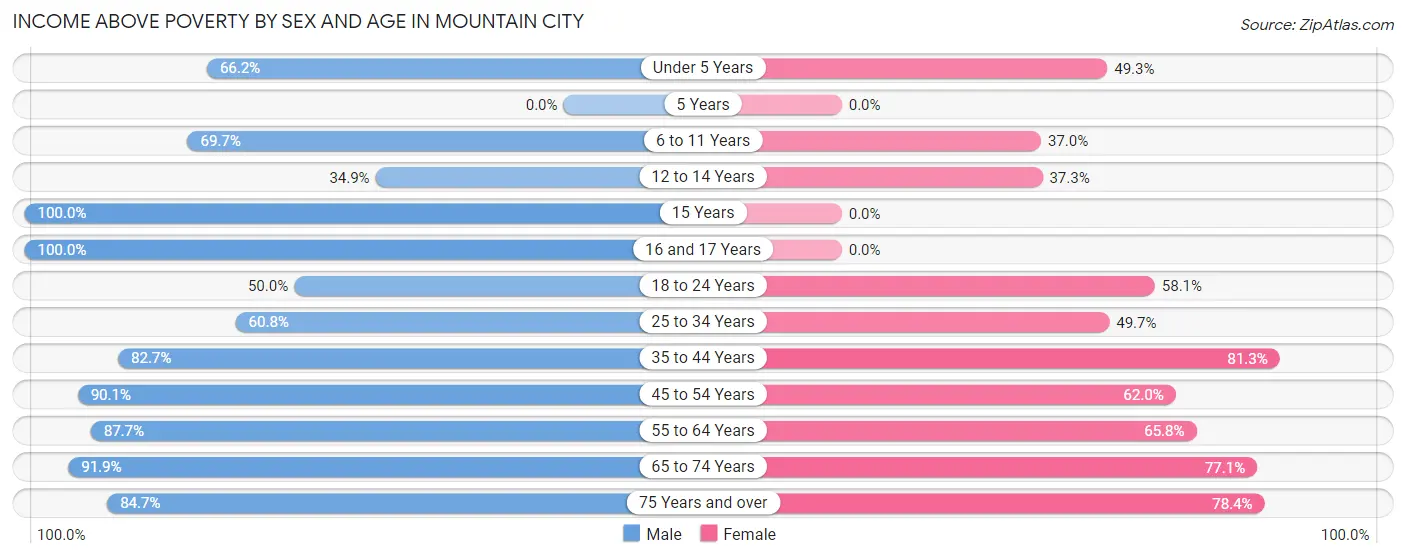
| Age Bracket | Male | Female |
| Under 5 Years | 43 (66.1%) | 34 (49.3%) |
| 5 Years | 0 (0.0%) | 0 (0.0%) |
| 6 to 11 Years | 53 (69.7%) | 27 (37.0%) |
| 12 to 14 Years | 15 (34.9%) | 19 (37.2%) |
| 15 Years | 6 (100.0%) | 0 (0.0%) |
| 16 and 17 Years | 26 (100.0%) | 0 (0.0%) |
| 18 to 24 Years | 23 (50.0%) | 43 (58.1%) |
| 25 to 34 Years | 104 (60.8%) | 71 (49.6%) |
| 35 to 44 Years | 81 (82.7%) | 52 (81.2%) |
| 45 to 54 Years | 64 (90.1%) | 57 (62.0%) |
| 55 to 64 Years | 164 (87.7%) | 150 (65.8%) |
| 65 to 74 Years | 68 (91.9%) | 131 (77.1%) |
| 75 Years and over | 138 (84.7%) | 131 (78.4%) |
| Total | 785 (76.5%) | 715 (62.5%) |
Income Below Poverty Among Married-Couple Families in Mountain City
The poverty statistics for married-couple families in Mountain City show that 7.8% or 28 of the total 358 families live below the poverty line. Families with 3 or 4 children have the highest poverty rate of 54.5%, comprising of 6 families. On the other hand, families with 5 or more children have the lowest poverty rate of 0.0%, which includes 0 families.
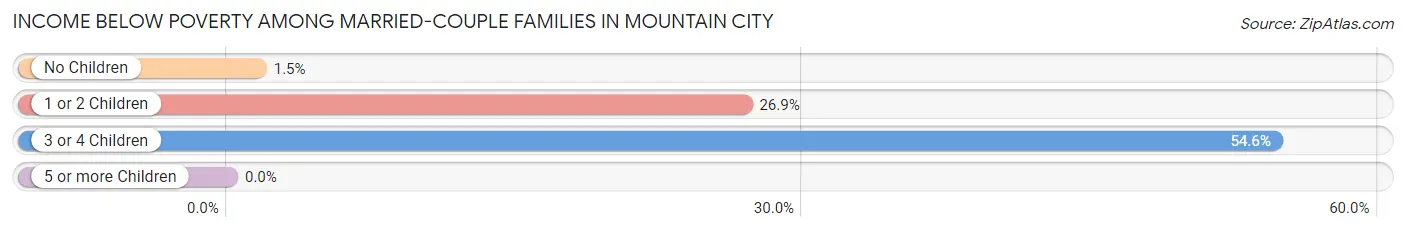
| Children | Above Poverty | Below Poverty |
| No Children | 263 (98.5%) | 4 (1.5%) |
| 1 or 2 Children | 49 (73.1%) | 18 (26.9%) |
| 3 or 4 Children | 5 (45.5%) | 6 (54.5%) |
| 5 or more Children | 13 (100.0%) | 0 (0.0%) |
| Total | 330 (92.2%) | 28 (7.8%) |
Income Below Poverty Among Single-Parent Households in Mountain City
According to the poverty data in Mountain City, 20.0% or 7 single-father households and 76.9% or 103 single-mother households are living below the poverty line. Among single-father households, those with no children have the highest poverty rate, with 7 households (58.3%) experiencing poverty. Likewise, among single-mother households, those with 3 or 4 children have the highest poverty rate, with 48 households (100.0%) falling below the poverty line.
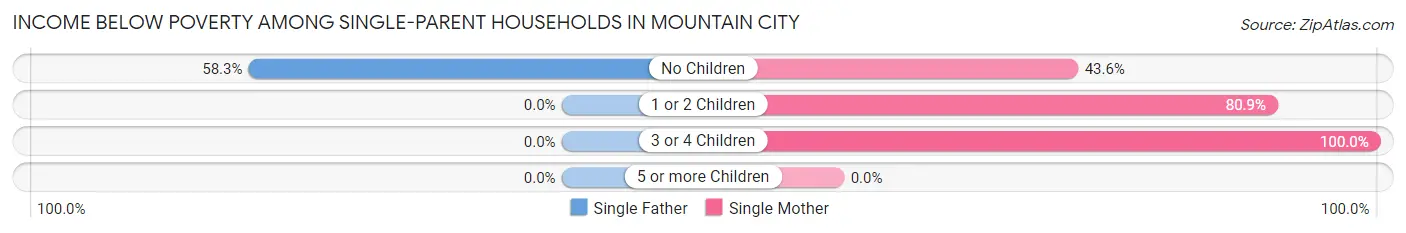
| Children | Single Father | Single Mother |
| No Children | 7 (58.3%) | 17 (43.6%) |
| 1 or 2 Children | 0 (0.0%) | 38 (80.8%) |
| 3 or 4 Children | 0 (0.0%) | 48 (100.0%) |
| 5 or more Children | 0 (0.0%) | 0 (0.0%) |
| Total | 7 (20.0%) | 103 (76.9%) |
Income Below Poverty Among Married-Couple vs Single-Parent Households in Mountain City
The poverty data for Mountain City shows that 28 of the married-couple family households (7.8%) and 110 of the single-parent households (65.1%) are living below the poverty level. Within the married-couple family households, those with 3 or 4 children have the highest poverty rate, with 6 households (54.5%) falling below the poverty line. Among the single-parent households, those with 3 or 4 children have the highest poverty rate, with 48 household (100.0%) living below poverty.
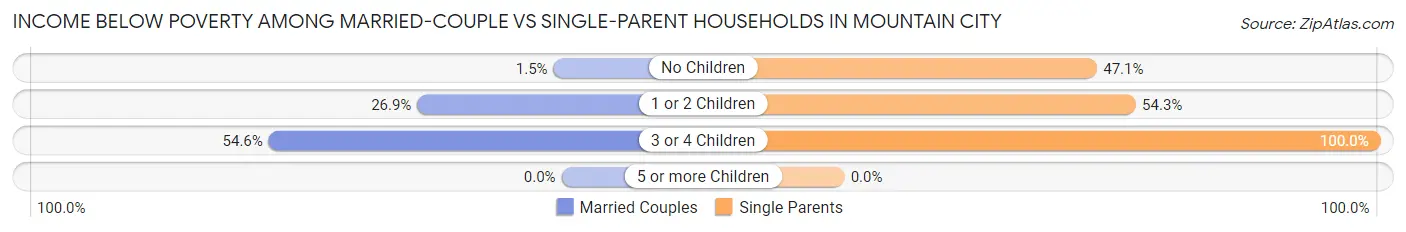
| Children | Married-Couple Families | Single-Parent Households |
| No Children | 4 (1.5%) | 24 (47.1%) |
| 1 or 2 Children | 18 (26.9%) | 38 (54.3%) |
| 3 or 4 Children | 6 (54.5%) | 48 (100.0%) |
| 5 or more Children | 0 (0.0%) | 0 (0.0%) |
| Total | 28 (7.8%) | 110 (65.1%) |
Race in Mountain City
The most populous races in Mountain City are White / Caucasian (2,092 | 87.3%), Two or more Races (189 | 7.9%), and Hispanic or Latino (128 | 5.3%).
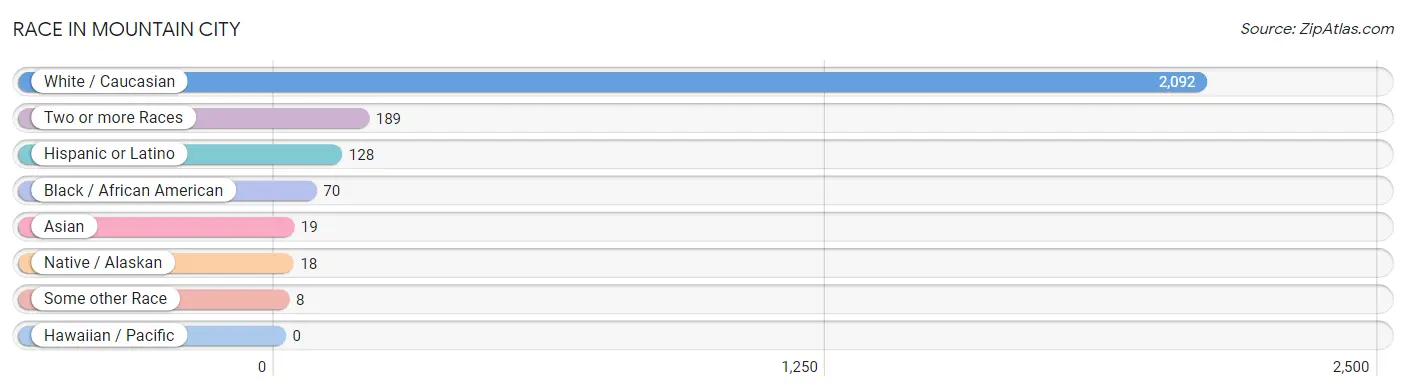
| Race | # Population | % Population |
| Asian | 19 | 0.8% |
| Black / African American | 70 | 2.9% |
| Hawaiian / Pacific | 0 | 0.0% |
| Hispanic or Latino | 128 | 5.3% |
| Native / Alaskan | 18 | 0.7% |
| White / Caucasian | 2,092 | 87.3% |
| Two or more Races | 189 | 7.9% |
| Some other Race | 8 | 0.3% |
| Total | 2,396 | 100.0% |
Ancestry in Mountain City
The most populous ancestries reported in Mountain City are American (469 | 19.6%), German (365 | 15.2%), English (259 | 10.8%), Italian (184 | 7.7%), and Irish (102 | 4.3%), together accounting for 57.5% of all Mountain City residents.
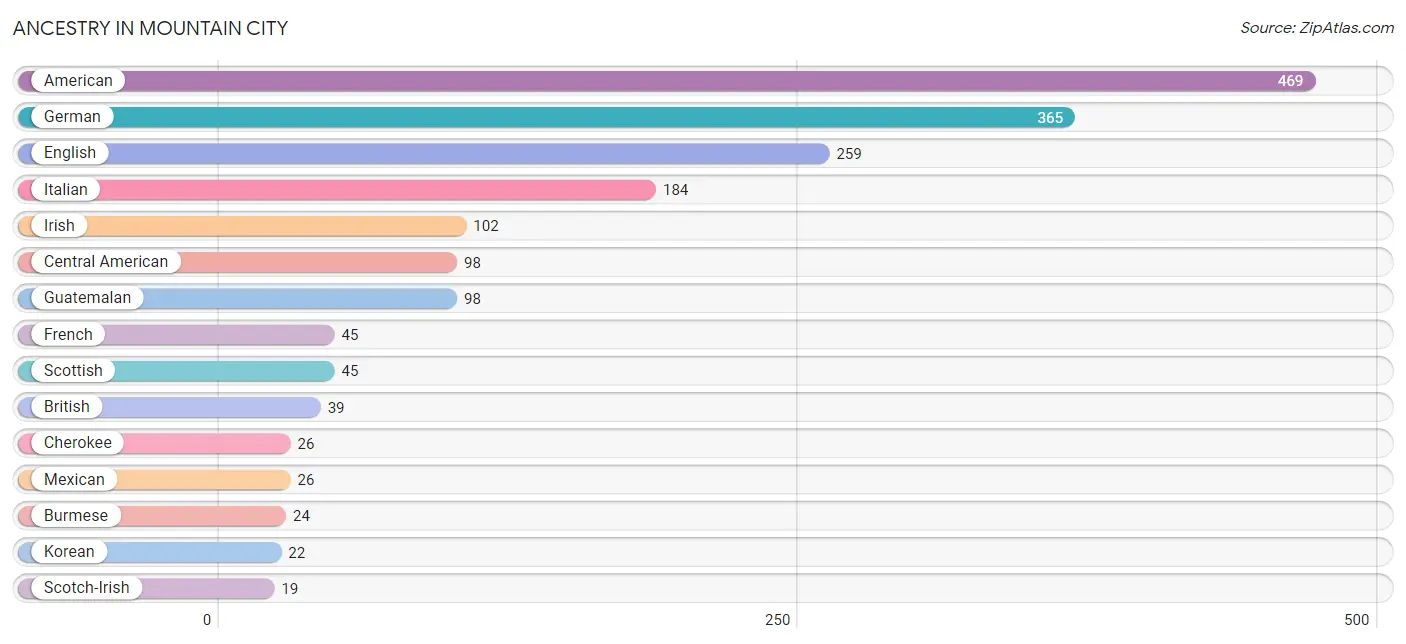
| Ancestry | # Population | % Population |
| American | 469 | 19.6% |
| British | 39 | 1.6% |
| Burmese | 24 | 1.0% |
| Central American | 98 | 4.1% |
| Cherokee | 26 | 1.1% |
| Dutch | 8 | 0.3% |
| English | 259 | 10.8% |
| European | 18 | 0.7% |
| French | 45 | 1.9% |
| German | 365 | 15.2% |
| Guatemalan | 98 | 4.1% |
| Irish | 102 | 4.3% |
| Italian | 184 | 7.7% |
| Korean | 22 | 0.9% |
| Mexican | 26 | 1.1% |
| Norwegian | 6 | 0.3% |
| Pennsylvania German | 16 | 0.7% |
| Puerto Rican | 4 | 0.2% |
| Scotch-Irish | 19 | 0.8% |
| Scottish | 45 | 1.9% | View All 20 Rows |
Immigrants in Mountain City
The most numerous immigrant groups reported in Mountain City came from Central America (28 | 1.2%), Latin America (28 | 1.2%), Guatemala (24 | 1.0%), Asia (23 | 1.0%), and Eastern Asia (14 | 0.6%), together accounting for 4.9% of all Mountain City residents.
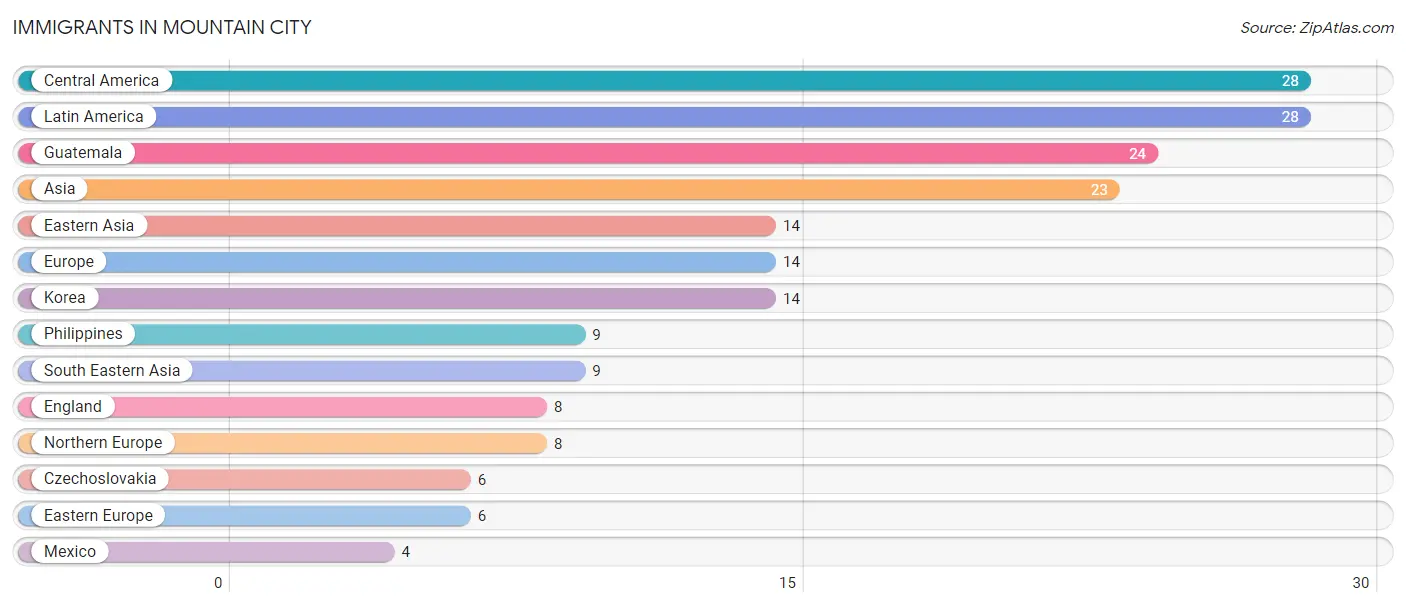
| Immigration Origin | # Population | % Population |
| Asia | 23 | 1.0% |
| Central America | 28 | 1.2% |
| Czechoslovakia | 6 | 0.3% |
| Eastern Asia | 14 | 0.6% |
| Eastern Europe | 6 | 0.3% |
| England | 8 | 0.3% |
| Europe | 14 | 0.6% |
| Guatemala | 24 | 1.0% |
| Korea | 14 | 0.6% |
| Latin America | 28 | 1.2% |
| Mexico | 4 | 0.2% |
| Northern Europe | 8 | 0.3% |
| Philippines | 9 | 0.4% |
| South Eastern Asia | 9 | 0.4% | View All 14 Rows |
Sex and Age in Mountain City
Sex and Age in Mountain City
The most populous age groups in Mountain City are 30 to 34 Years (133 | 11.2%) for men and 60 to 64 Years (145 | 11.9%) for women.
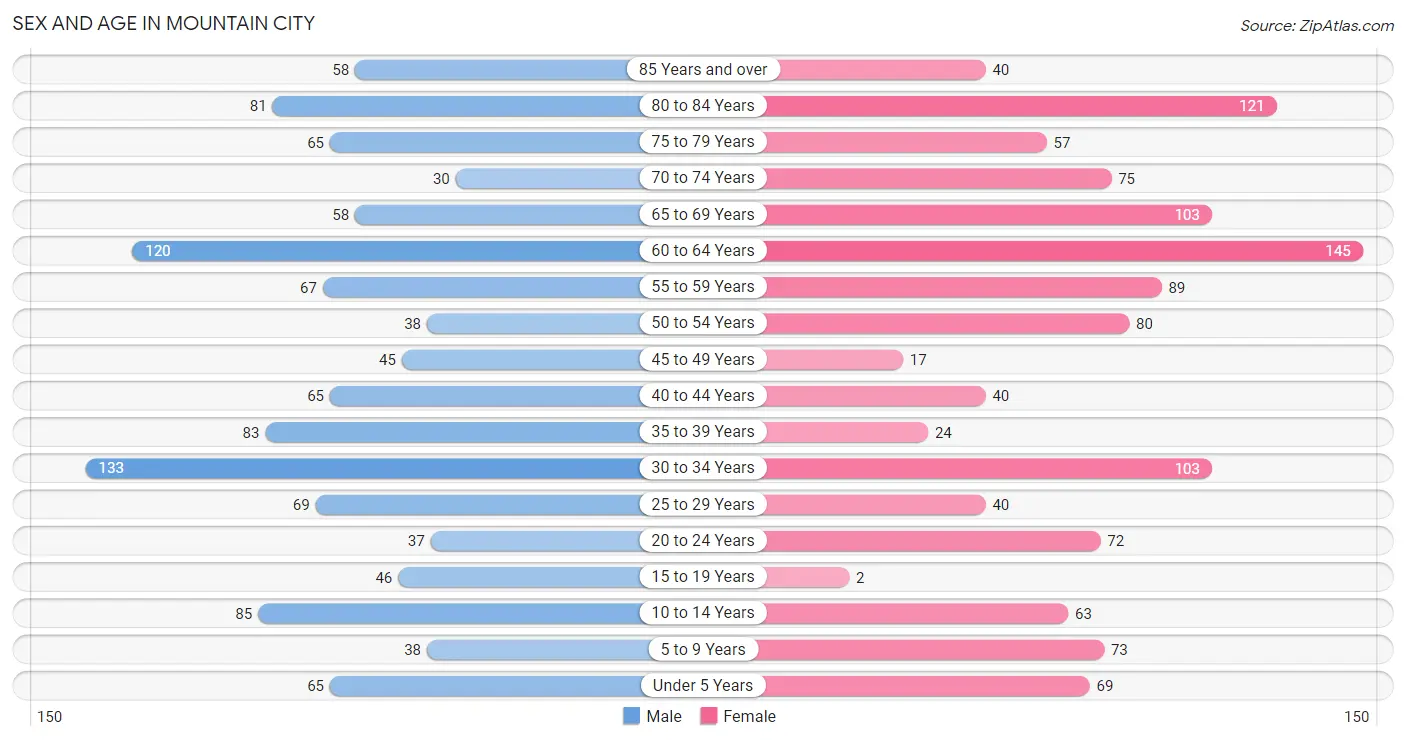
| Age Bracket | Male | Female |
| Under 5 Years | 65 (5.5%) | 69 (5.7%) |
| 5 to 9 Years | 38 (3.2%) | 73 (6.0%) |
| 10 to 14 Years | 85 (7.2%) | 63 (5.2%) |
| 15 to 19 Years | 46 (3.9%) | 2 (0.2%) |
| 20 to 24 Years | 37 (3.1%) | 72 (5.9%) |
| 25 to 29 Years | 69 (5.8%) | 40 (3.3%) |
| 30 to 34 Years | 133 (11.2%) | 103 (8.5%) |
| 35 to 39 Years | 83 (7.0%) | 24 (2.0%) |
| 40 to 44 Years | 65 (5.5%) | 40 (3.3%) |
| 45 to 49 Years | 45 (3.8%) | 17 (1.4%) |
| 50 to 54 Years | 38 (3.2%) | 80 (6.6%) |
| 55 to 59 Years | 67 (5.7%) | 89 (7.3%) |
| 60 to 64 Years | 120 (10.1%) | 145 (11.9%) |
| 65 to 69 Years | 58 (4.9%) | 103 (8.5%) |
| 70 to 74 Years | 30 (2.5%) | 75 (6.2%) |
| 75 to 79 Years | 65 (5.5%) | 57 (4.7%) |
| 80 to 84 Years | 81 (6.9%) | 121 (10.0%) |
| 85 Years and over | 58 (4.9%) | 40 (3.3%) |
| Total | 1,183 (100.0%) | 1,213 (100.0%) |
Families and Households in Mountain City
Median Family Size in Mountain City
The median family size in Mountain City is 2.98 persons per family, with married-couple families (358 | 67.9%) accounting for the largest median family size of 3.16 persons per family. On the other hand, single male/father families (35 | 6.6%) represent the smallest median family size with 1.94 persons per family.
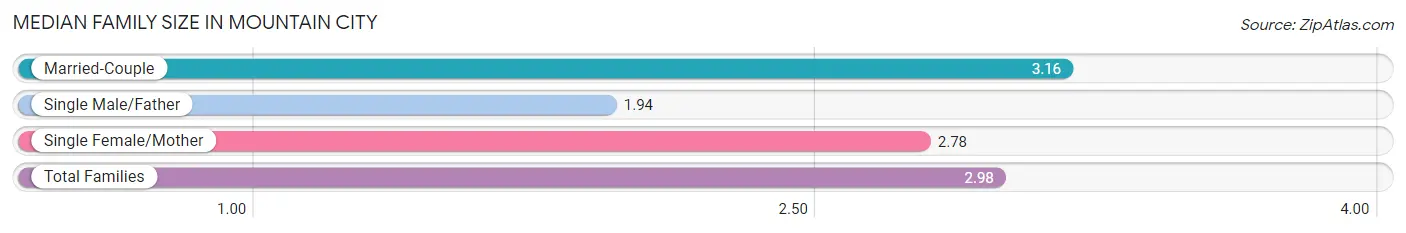
| Family Type | # Families | Family Size |
| Married-Couple | 358 (67.9%) | 3.16 |
| Single Male/Father | 35 (6.6%) | 1.94 |
| Single Female/Mother | 134 (25.4%) | 2.78 |
| Total Families | 527 (100.0%) | 2.98 |
Median Household Size in Mountain City
The median household size in Mountain City is 2.07 persons per household, with married-couple households (358 | 34.1%) accounting for the largest median household size of 3.2 persons per household. non-family households (522 | 49.8%) represent the smallest median household size with 1.05 persons per household.
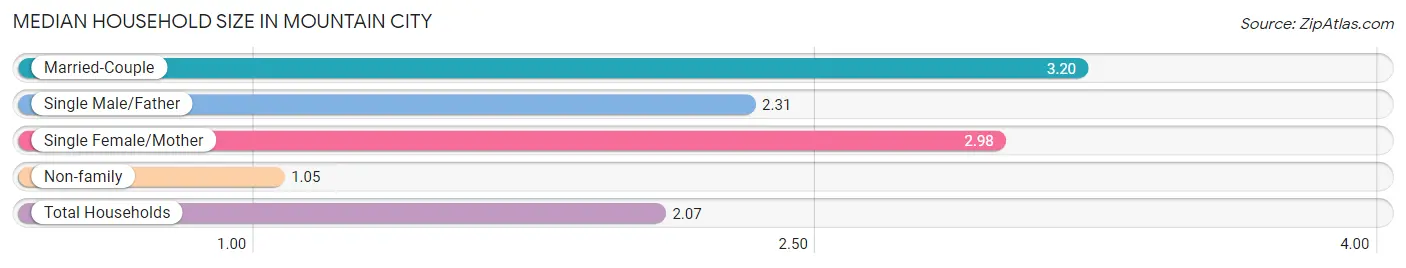
| Household Type | # Households | Household Size |
| Married-Couple | 358 (34.1%) | 3.20 |
| Single Male/Father | 35 (3.3%) | 2.31 |
| Single Female/Mother | 134 (12.8%) | 2.98 |
| Non-family | 522 (49.8%) | 1.05 |
| Total Households | 1,049 (100.0%) | 2.07 |
Household Size by Marriage Status in Mountain City
Out of a total of 1,049 households in Mountain City, 527 (50.2%) are family households, while 522 (49.8%) are nonfamily households. The most numerous type of family households are 2-person households, comprising 273, and the most common type of nonfamily households are 1-person households, comprising 498.
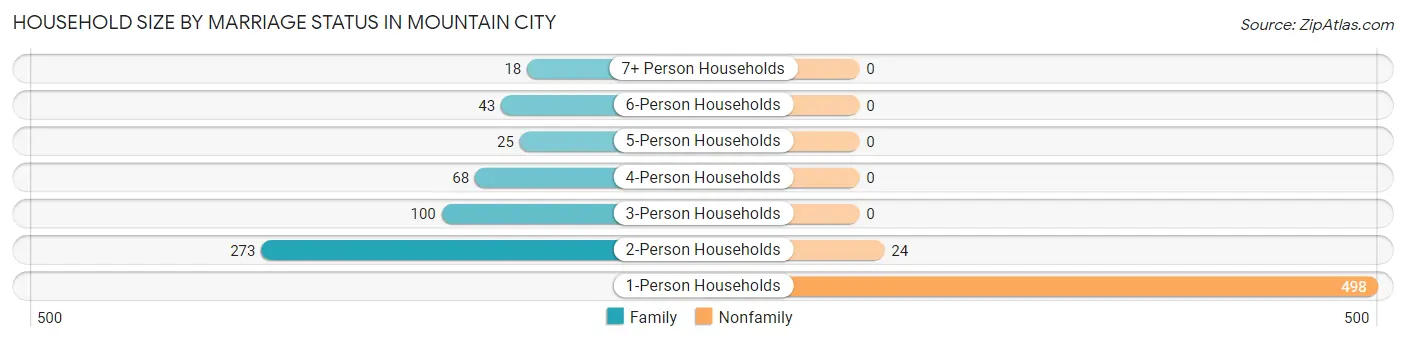
| Household Size | Family Households | Nonfamily Households |
| 1-Person Households | - | 498 (47.5%) |
| 2-Person Households | 273 (26.0%) | 24 (2.3%) |
| 3-Person Households | 100 (9.5%) | 0 (0.0%) |
| 4-Person Households | 68 (6.5%) | 0 (0.0%) |
| 5-Person Households | 25 (2.4%) | 0 (0.0%) |
| 6-Person Households | 43 (4.1%) | 0 (0.0%) |
| 7+ Person Households | 18 (1.7%) | 0 (0.0%) |
| Total | 527 (50.2%) | 522 (49.8%) |
Female Fertility in Mountain City
Fertility by Age in Mountain City
Average fertility rate in Mountain City is 207.0 births per 1,000 women. Women in the age bracket of 20 to 34 years have the highest fertility rate with 293.0 births per 1,000 women. Women in the age bracket of 20 to 34 years acount for 100.0% of all women with births.
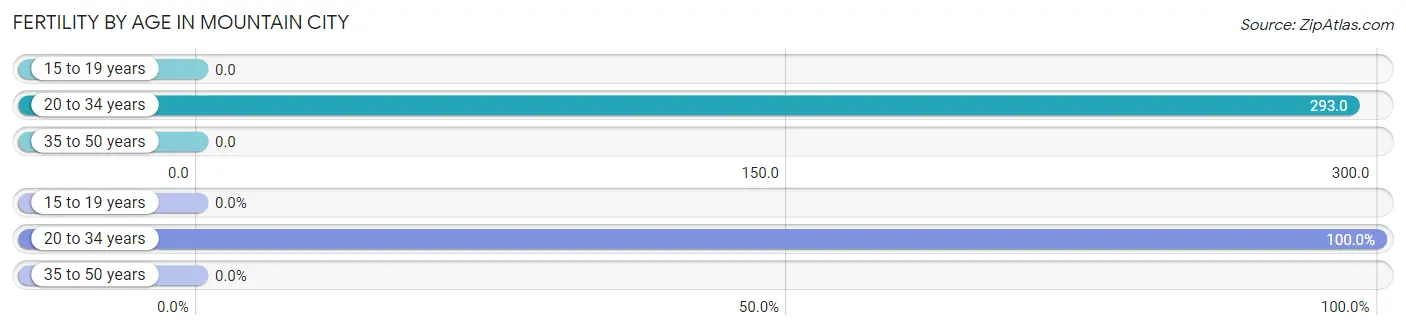
| Age Bracket | Women with Births | Births / 1,000 Women |
| 15 to 19 years | 0 (0.0%) | 0.0 |
| 20 to 34 years | 63 (100.0%) | 293.0 |
| 35 to 50 years | 0 (0.0%) | 0.0 |
| Total | 63 (100.0%) | 207.0 |
Fertility by Age by Marriage Status in Mountain City
14.3% of women with births (63) in Mountain City are married. The highest percentage of unmarried women with births falls into 20 to 34 years age bracket with 85.7% of them unmarried at the time of birth, while the lowest percentage of unmarried women with births belong to 20 to 34 years age bracket with 85.7% of them unmarried.
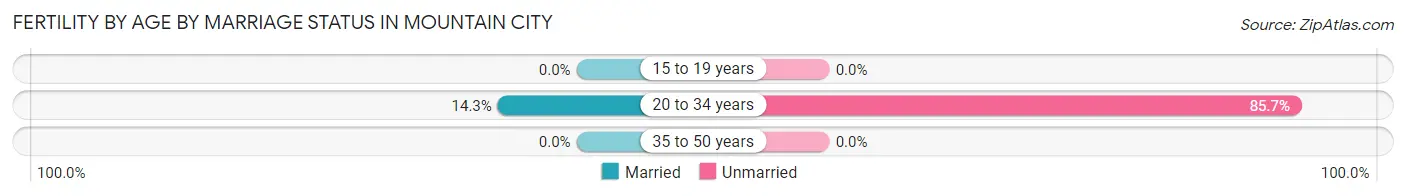
| Age Bracket | Married | Unmarried |
| 15 to 19 years | 0 (0.0%) | 0 (0.0%) |
| 20 to 34 years | 9 (14.3%) | 54 (85.7%) |
| 35 to 50 years | 0 (0.0%) | 0 (0.0%) |
| Total | 9 (14.3%) | 54 (85.7%) |
Fertility by Education in Mountain City
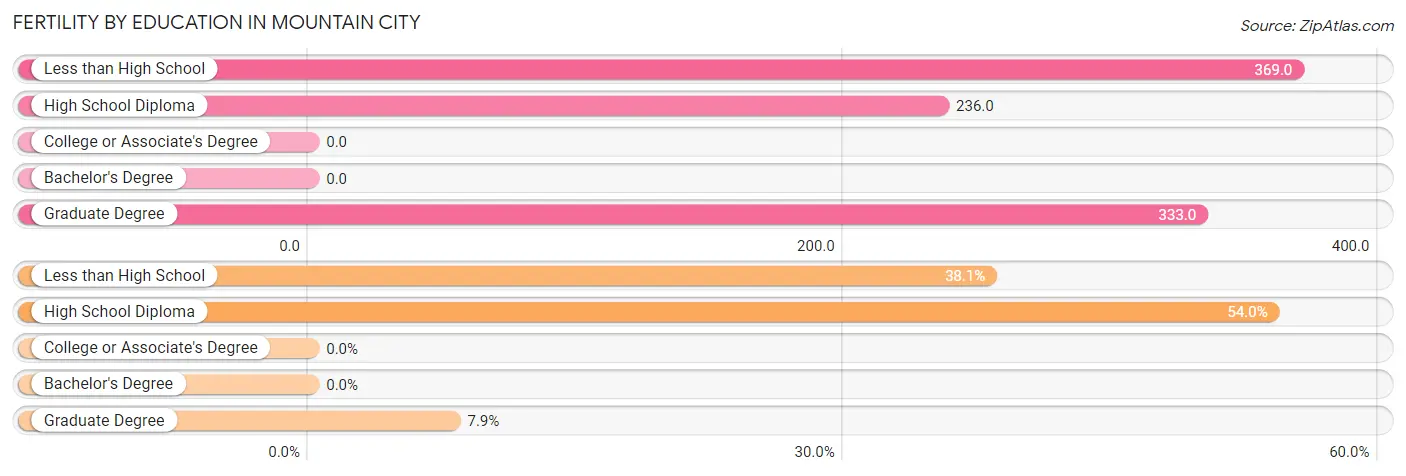
| Educational Attainment | Women with Births | Births / 1,000 Women |
| Less than High School | 24 (38.1%) | 369.0 |
| High School Diploma | 34 (54.0%) | 236.0 |
| College or Associate's Degree | 0 (0.0%) | 0.0 |
| Bachelor's Degree | 0 (0.0%) | 0.0 |
| Graduate Degree | 5 (7.9%) | 333.0 |
| Total | 63 (100.0%) | 207.0 |
Fertility by Education by Marriage Status in Mountain City
85.7% of women with births in Mountain City are unmarried. Women with the educational attainment of graduate degree are most likely to be married with 100.0% of them married at childbirth, while women with the educational attainment of less than high school are least likely to be married with 100.0% of them unmarried at childbirth.
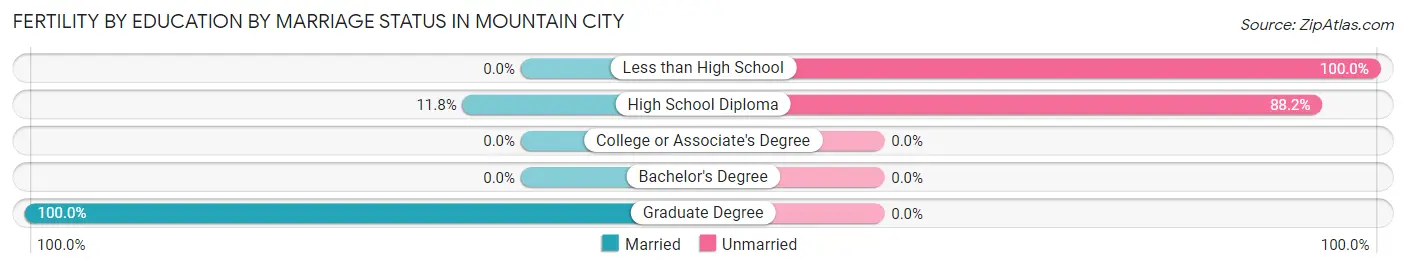
| Educational Attainment | Married | Unmarried |
| Less than High School | 0 (0.0%) | 24 (100.0%) |
| High School Diploma | 4 (11.8%) | 30 (88.2%) |
| College or Associate's Degree | 0 (0.0%) | 0 (0.0%) |
| Bachelor's Degree | 0 (0.0%) | 0 (0.0%) |
| Graduate Degree | 5 (100.0%) | 0 (0.0%) |
| Total | 9 (14.3%) | 54 (85.7%) |
Employment Characteristics in Mountain City
Employment by Class of Employer in Mountain City
Among the 720 employed individuals in Mountain City, private company employees (464 | 64.4%), local government employees (75 | 10.4%), and not-for-profit organizations (69 | 9.6%) make up the most common classes of employment.
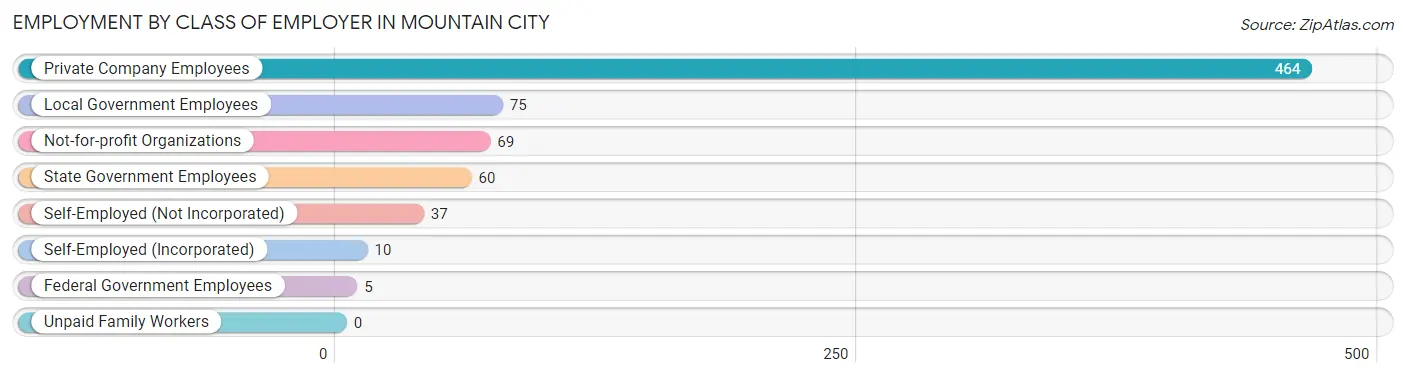
| Employer Class | # Employees | % Employees |
| Private Company Employees | 464 | 64.4% |
| Self-Employed (Incorporated) | 10 | 1.4% |
| Self-Employed (Not Incorporated) | 37 | 5.1% |
| Not-for-profit Organizations | 69 | 9.6% |
| Local Government Employees | 75 | 10.4% |
| State Government Employees | 60 | 8.3% |
| Federal Government Employees | 5 | 0.7% |
| Unpaid Family Workers | 0 | 0.0% |
| Total | 720 | 100.0% |
Employment Status by Age in Mountain City
According to the labor force statistics for Mountain City, out of the total population over 16 years of age (1,997), 41.8% or 835 individuals are in the labor force, with 9.1% or 76 of them unemployed. The age group with the highest labor force participation rate is 20 to 24 years, with 77.1% or 84 individuals in the labor force. Within the labor force, the 20 to 24 years age range has the highest percentage of unemployed individuals, with 20.2% or 17 of them being unemployed.
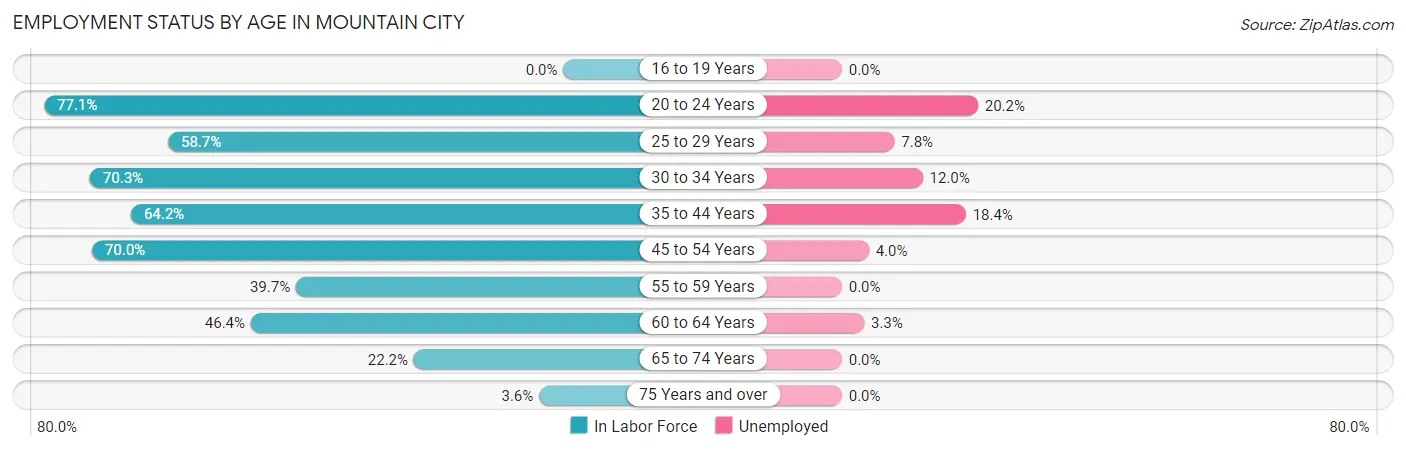
| Age Bracket | In Labor Force | Unemployed |
| 16 to 19 Years | 0 (0.0%) | 0 (0.0%) |
| 20 to 24 Years | 84 (77.1%) | 17 (20.2%) |
| 25 to 29 Years | 64 (58.7%) | 5 (7.8%) |
| 30 to 34 Years | 166 (70.3%) | 20 (12.0%) |
| 35 to 44 Years | 136 (64.2%) | 25 (18.4%) |
| 45 to 54 Years | 126 (70.0%) | 5 (4.0%) |
| 55 to 59 Years | 62 (39.7%) | 0 (0.0%) |
| 60 to 64 Years | 123 (46.4%) | 4 (3.3%) |
| 65 to 74 Years | 59 (22.2%) | 0 (0.0%) |
| 75 Years and over | 15 (3.6%) | 0 (0.0%) |
| Total | 835 (41.8%) | 76 (9.1%) |
Employment Status by Educational Attainment in Mountain City
According to labor force statistics for Mountain City, 58.5% of individuals (677) out of the total population between 25 and 64 years of age (1,158) are in the labor force, with 8.7% or 59 of them being unemployed. The group with the highest labor force participation rate are those with the educational attainment of bachelor's degree or higher, with 77.3% or 68 individuals in the labor force. Within the labor force, individuals with college / associate degree education have the highest percentage of unemployment, with 9.4% or 15 of them being unemployed.
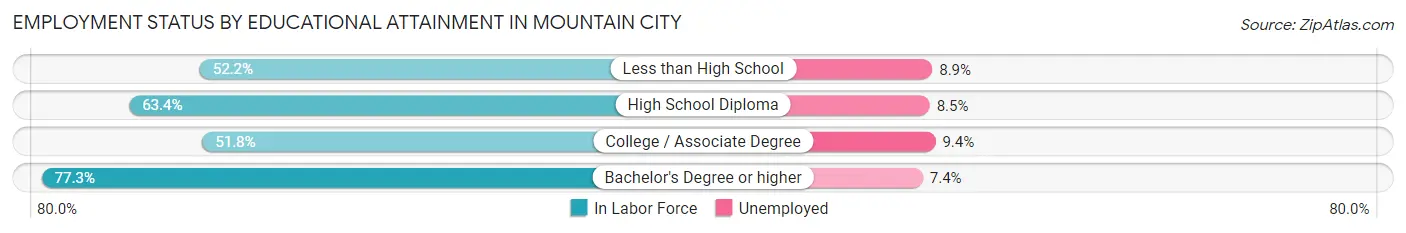
| Educational Attainment | In Labor Force | Unemployed |
| Less than High School | 157 (52.2%) | 27 (8.9%) |
| High School Diploma | 293 (63.4%) | 39 (8.5%) |
| College / Associate Degree | 159 (51.8%) | 29 (9.4%) |
| Bachelor's Degree or higher | 68 (77.3%) | 7 (7.4%) |
| Total | 677 (58.5%) | 101 (8.7%) |
Employment Occupations by Sex in Mountain City
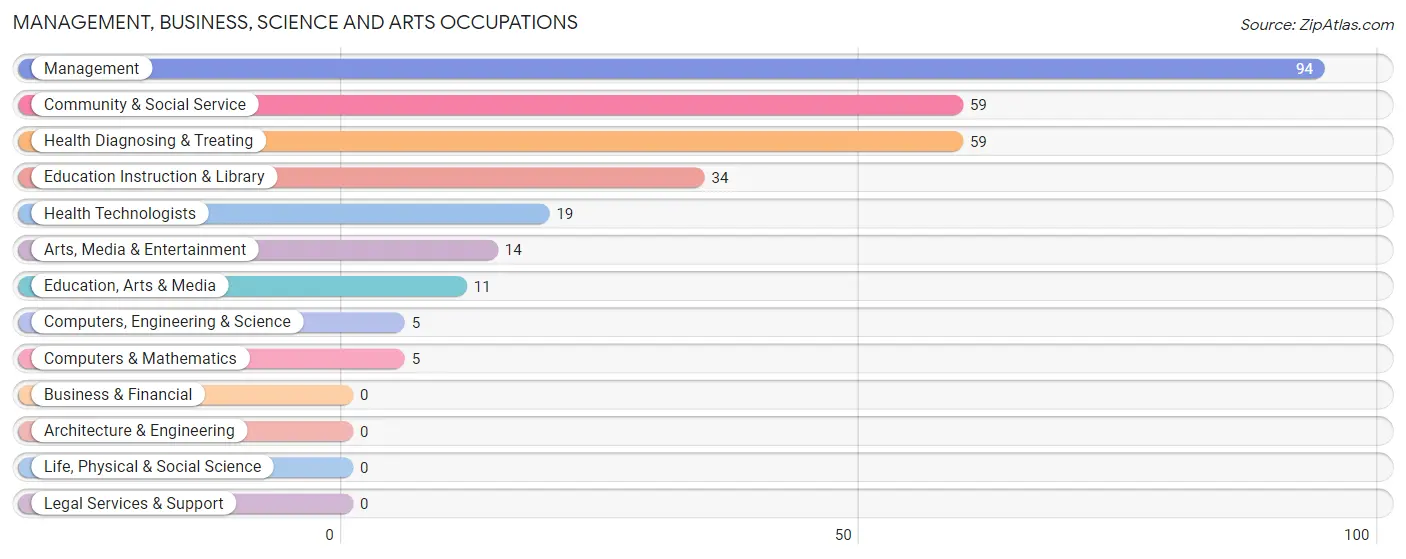
Management, Business, Science and Arts Occupations
The most common Management, Business, Science and Arts occupations in Mountain City are Management (94 | 12.4%), Community & Social Service (59 | 7.8%), Health Diagnosing & Treating (59 | 7.8%), Education Instruction & Library (34 | 4.5%), and Health Technologists (19 | 2.5%).
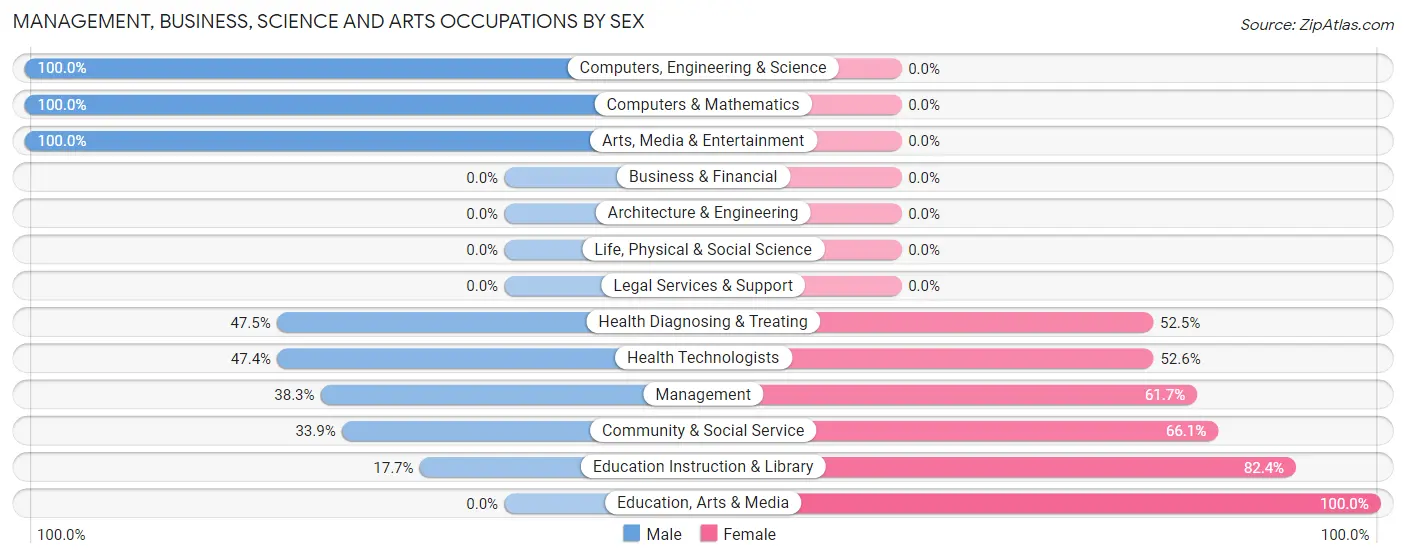
Management, Business, Science and Arts Occupations by Sex
Within the Management, Business, Science and Arts occupations in Mountain City, the most male-oriented occupations are Computers, Engineering & Science (100.0%), Computers & Mathematics (100.0%), and Arts, Media & Entertainment (100.0%), while the most female-oriented occupations are Education, Arts & Media (100.0%), Education Instruction & Library (82.4%), and Community & Social Service (66.1%).
| Occupation | Male | Female |
| Management | 36 (38.3%) | 58 (61.7%) |
| Business & Financial | 0 (0.0%) | 0 (0.0%) |
| Computers, Engineering & Science | 5 (100.0%) | 0 (0.0%) |
| Computers & Mathematics | 5 (100.0%) | 0 (0.0%) |
| Architecture & Engineering | 0 (0.0%) | 0 (0.0%) |
| Life, Physical & Social Science | 0 (0.0%) | 0 (0.0%) |
| Community & Social Service | 20 (33.9%) | 39 (66.1%) |
| Education, Arts & Media | 0 (0.0%) | 11 (100.0%) |
| Legal Services & Support | 0 (0.0%) | 0 (0.0%) |
| Education Instruction & Library | 6 (17.6%) | 28 (82.4%) |
| Arts, Media & Entertainment | 14 (100.0%) | 0 (0.0%) |
| Health Diagnosing & Treating | 28 (47.5%) | 31 (52.5%) |
| Health Technologists | 9 (47.4%) | 10 (52.6%) |
| Total (Category) | 89 (41.0%) | 128 (59.0%) |
| Total (Overall) | 416 (54.8%) | 343 (45.2%) |
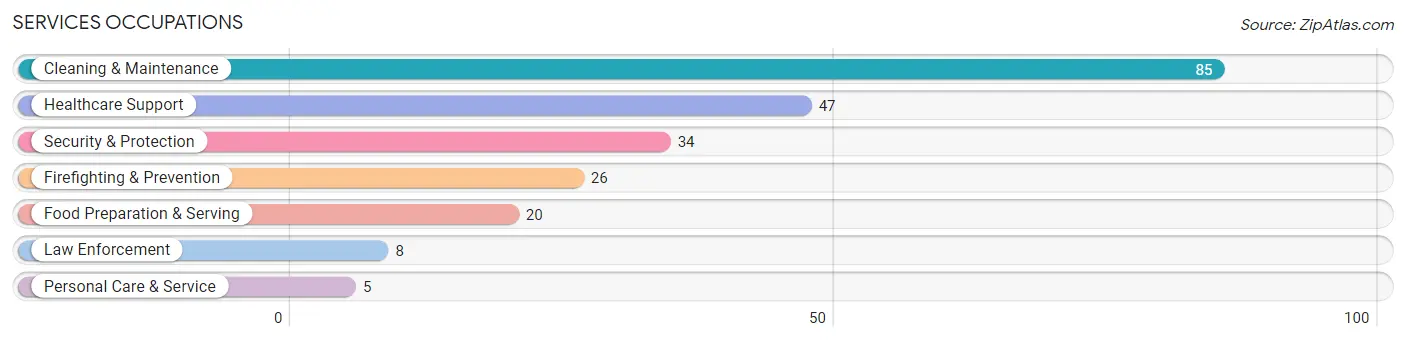
Services Occupations
The most common Services occupations in Mountain City are Cleaning & Maintenance (85 | 11.2%), Healthcare Support (47 | 6.2%), Security & Protection (34 | 4.5%), Firefighting & Prevention (26 | 3.4%), and Food Preparation & Serving (20 | 2.6%).
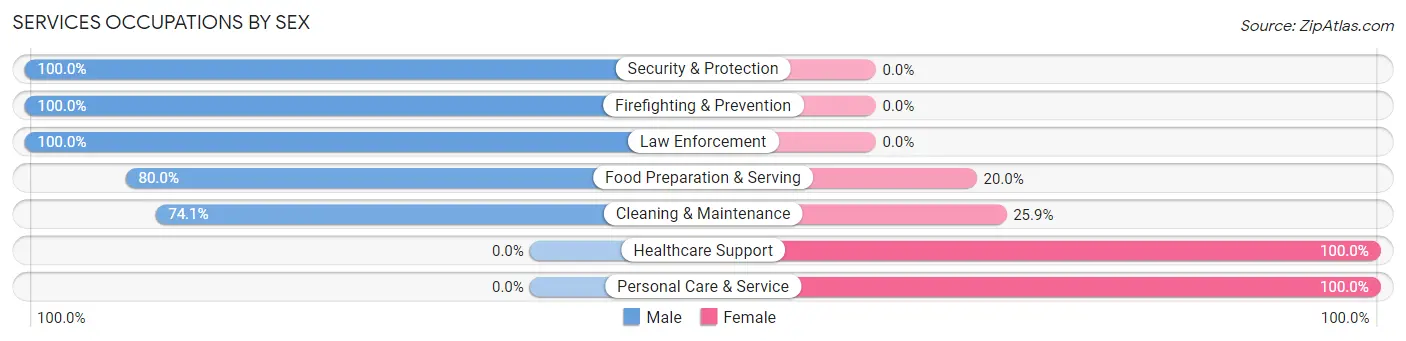
Services Occupations by Sex
Within the Services occupations in Mountain City, the most male-oriented occupations are Security & Protection (100.0%), Firefighting & Prevention (100.0%), and Law Enforcement (100.0%), while the most female-oriented occupations are Healthcare Support (100.0%), Personal Care & Service (100.0%), and Cleaning & Maintenance (25.9%).
| Occupation | Male | Female |
| Healthcare Support | 0 (0.0%) | 47 (100.0%) |
| Security & Protection | 34 (100.0%) | 0 (0.0%) |
| Firefighting & Prevention | 26 (100.0%) | 0 (0.0%) |
| Law Enforcement | 8 (100.0%) | 0 (0.0%) |
| Food Preparation & Serving | 16 (80.0%) | 4 (20.0%) |
| Cleaning & Maintenance | 63 (74.1%) | 22 (25.9%) |
| Personal Care & Service | 0 (0.0%) | 5 (100.0%) |
| Total (Category) | 113 (59.2%) | 78 (40.8%) |
| Total (Overall) | 416 (54.8%) | 343 (45.2%) |
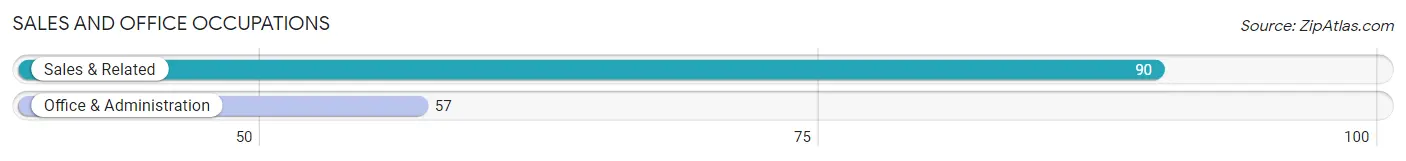
Sales and Office Occupations
The most common Sales and Office occupations in Mountain City are Sales & Related (90 | 11.9%), and Office & Administration (57 | 7.5%).
Sales and Office Occupations by Sex
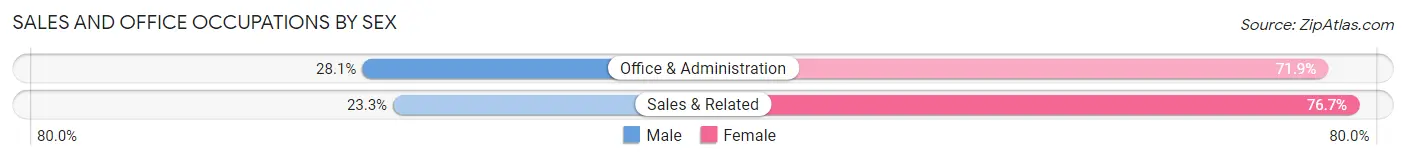
| Occupation | Male | Female |
| Sales & Related | 21 (23.3%) | 69 (76.7%) |
| Office & Administration | 16 (28.1%) | 41 (71.9%) |
| Total (Category) | 37 (25.2%) | 110 (74.8%) |
| Total (Overall) | 416 (54.8%) | 343 (45.2%) |
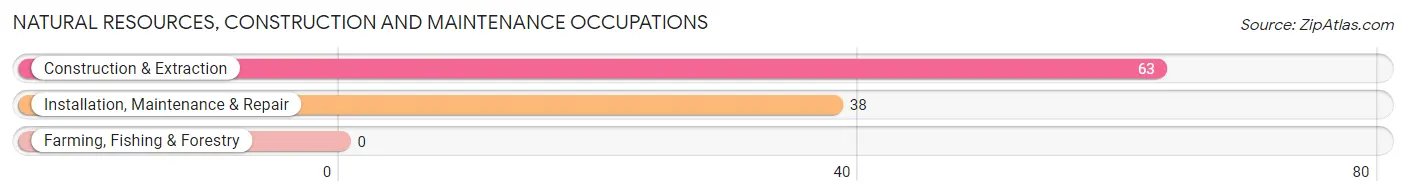
Natural Resources, Construction and Maintenance Occupations
The most common Natural Resources, Construction and Maintenance occupations in Mountain City are Construction & Extraction (63 | 8.3%), and Installation, Maintenance & Repair (38 | 5.0%).
Natural Resources, Construction and Maintenance Occupations by Sex
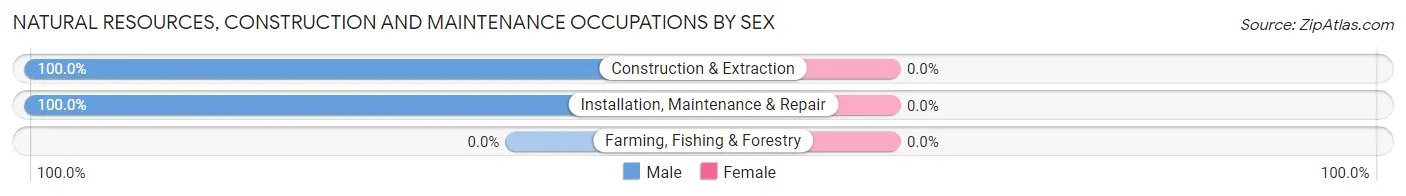
| Occupation | Male | Female |
| Farming, Fishing & Forestry | 0 (0.0%) | 0 (0.0%) |
| Construction & Extraction | 63 (100.0%) | 0 (0.0%) |
| Installation, Maintenance & Repair | 38 (100.0%) | 0 (0.0%) |
| Total (Category) | 101 (100.0%) | 0 (0.0%) |
| Total (Overall) | 416 (54.8%) | 343 (45.2%) |
Production, Transportation and Moving Occupations
The most common Production, Transportation and Moving occupations in Mountain City are Production (60 | 7.9%), Material Moving (34 | 4.5%), and Transportation (9 | 1.2%).
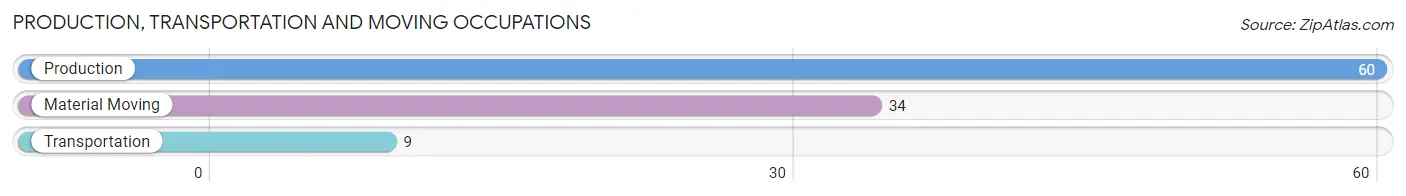
Production, Transportation and Moving Occupations by Sex
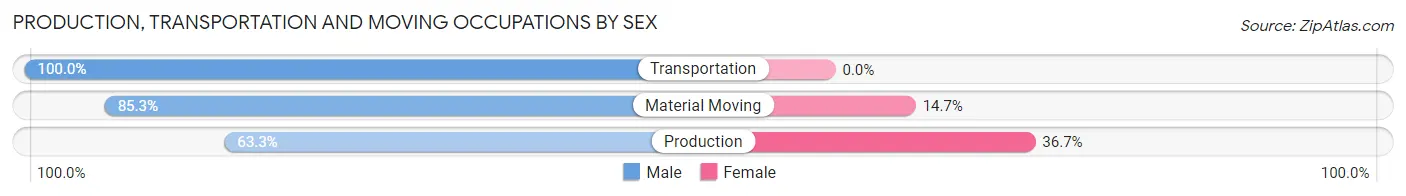
| Occupation | Male | Female |
| Production | 38 (63.3%) | 22 (36.7%) |
| Transportation | 9 (100.0%) | 0 (0.0%) |
| Material Moving | 29 (85.3%) | 5 (14.7%) |
| Total (Category) | 76 (73.8%) | 27 (26.2%) |
| Total (Overall) | 416 (54.8%) | 343 (45.2%) |
Employment Industries by Sex in Mountain City
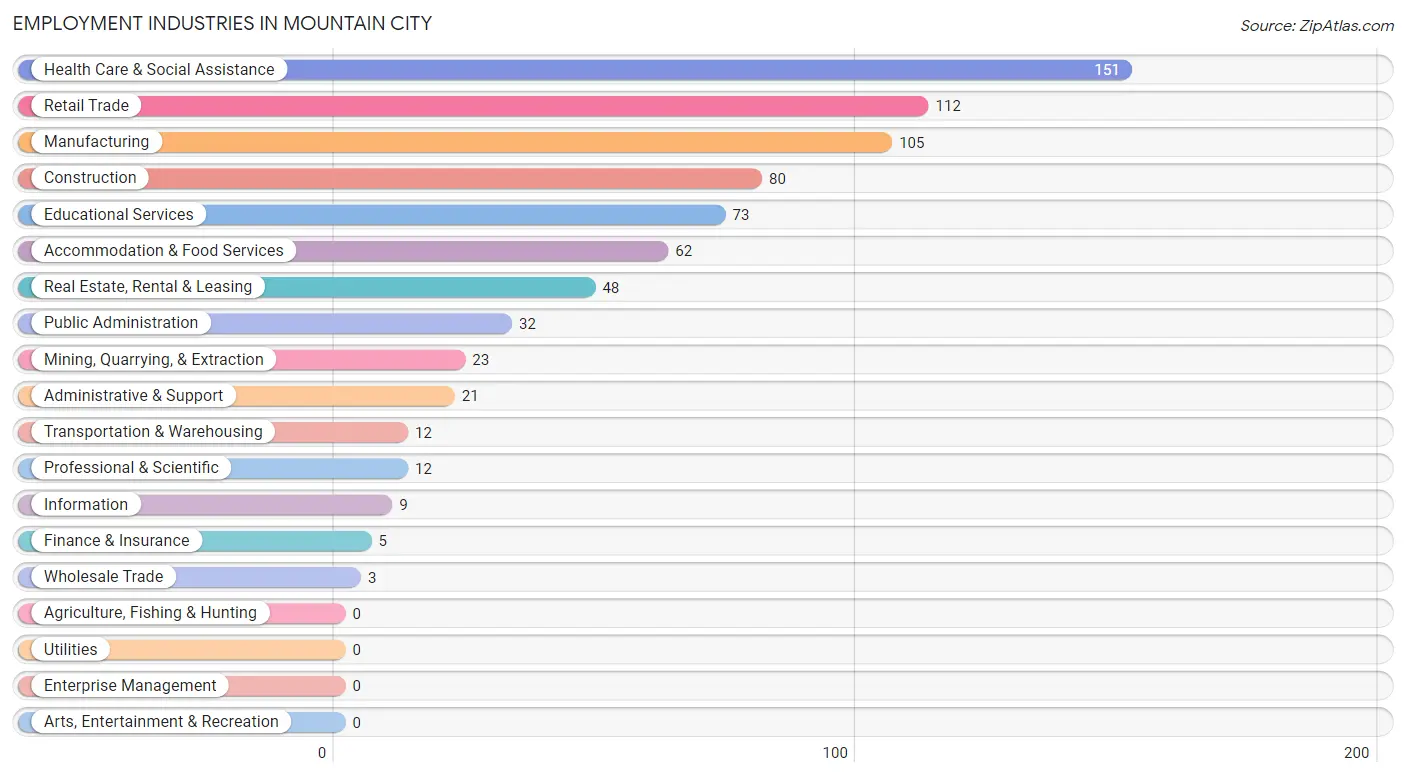
Employment Industries in Mountain City
The major employment industries in Mountain City include Health Care & Social Assistance (151 | 19.9%), Retail Trade (112 | 14.8%), Manufacturing (105 | 13.8%), Construction (80 | 10.5%), and Educational Services (73 | 9.6%).
Employment Industries by Sex in Mountain City
The Mountain City industries that see more men than women are Mining, Quarrying, & Extraction (100.0%), Wholesale Trade (100.0%), and Information (100.0%), whereas the industries that tend to have a higher number of women are Finance & Insurance (100.0%), Real Estate, Rental & Leasing (100.0%), and Retail Trade (66.1%).
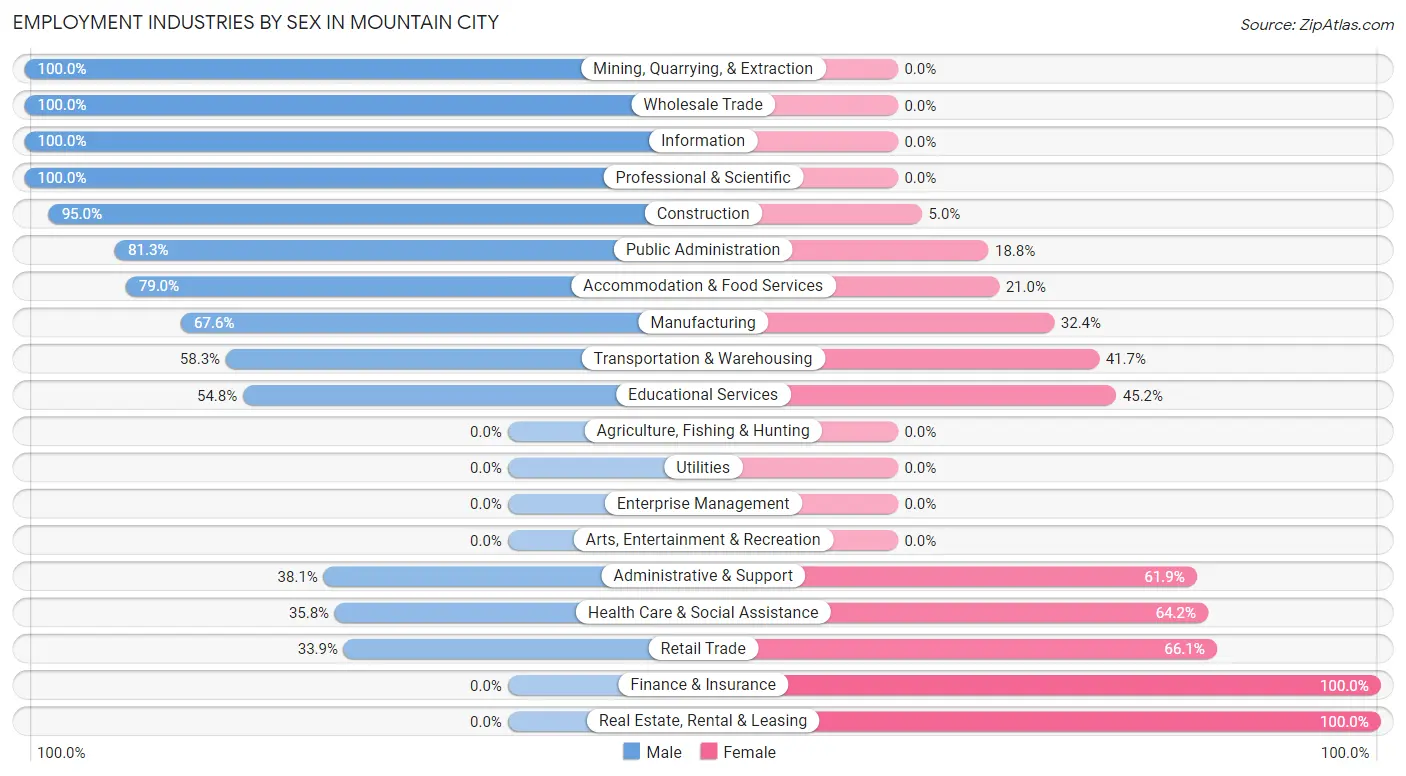
| Industry | Male | Female |
| Agriculture, Fishing & Hunting | 0 (0.0%) | 0 (0.0%) |
| Mining, Quarrying, & Extraction | 23 (100.0%) | 0 (0.0%) |
| Construction | 76 (95.0%) | 4 (5.0%) |
| Manufacturing | 71 (67.6%) | 34 (32.4%) |
| Wholesale Trade | 3 (100.0%) | 0 (0.0%) |
| Retail Trade | 38 (33.9%) | 74 (66.1%) |
| Transportation & Warehousing | 7 (58.3%) | 5 (41.7%) |
| Utilities | 0 (0.0%) | 0 (0.0%) |
| Information | 9 (100.0%) | 0 (0.0%) |
| Finance & Insurance | 0 (0.0%) | 5 (100.0%) |
| Real Estate, Rental & Leasing | 0 (0.0%) | 48 (100.0%) |
| Professional & Scientific | 12 (100.0%) | 0 (0.0%) |
| Enterprise Management | 0 (0.0%) | 0 (0.0%) |
| Administrative & Support | 8 (38.1%) | 13 (61.9%) |
| Educational Services | 40 (54.8%) | 33 (45.2%) |
| Health Care & Social Assistance | 54 (35.8%) | 97 (64.2%) |
| Arts, Entertainment & Recreation | 0 (0.0%) | 0 (0.0%) |
| Accommodation & Food Services | 49 (79.0%) | 13 (21.0%) |
| Public Administration | 26 (81.2%) | 6 (18.8%) |
| Total | 416 (54.8%) | 343 (45.2%) |
Education in Mountain City
School Enrollment in Mountain City
The most common levels of schooling among the 357 students in Mountain City are elementary school (105 | 29.4%), middle school (105 | 29.4%), and high school (79 | 22.1%).
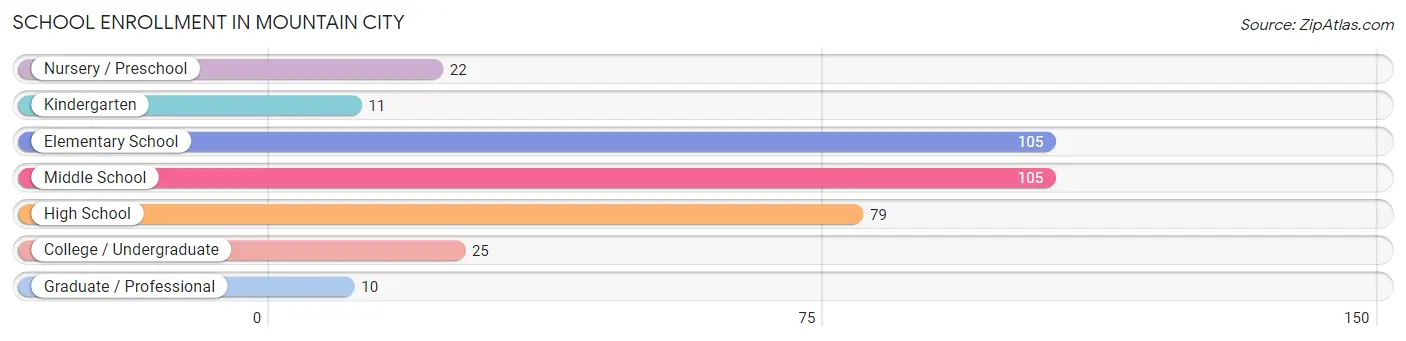
| School Level | # Students | % Students |
| Nursery / Preschool | 22 | 6.2% |
| Kindergarten | 11 | 3.1% |
| Elementary School | 105 | 29.4% |
| Middle School | 105 | 29.4% |
| High School | 79 | 22.1% |
| College / Undergraduate | 25 | 7.0% |
| Graduate / Professional | 10 | 2.8% |
| Total | 357 | 100.0% |
School Enrollment by Age by Funding Source in Mountain City
Out of a total of 357 students who are enrolled in schools in Mountain City, 59 (16.5%) attend a private institution, while the remaining 298 (83.5%) are enrolled in public schools. The age group of 35 years and over has the highest likelihood of being enrolled in private schools, with 10 (71.4% in the age bracket) enrolled. Conversely, the age group of 15 to 17 year olds has the lowest likelihood of being enrolled in a private school, with 32 (100.0% in the age bracket) attending a public institution.
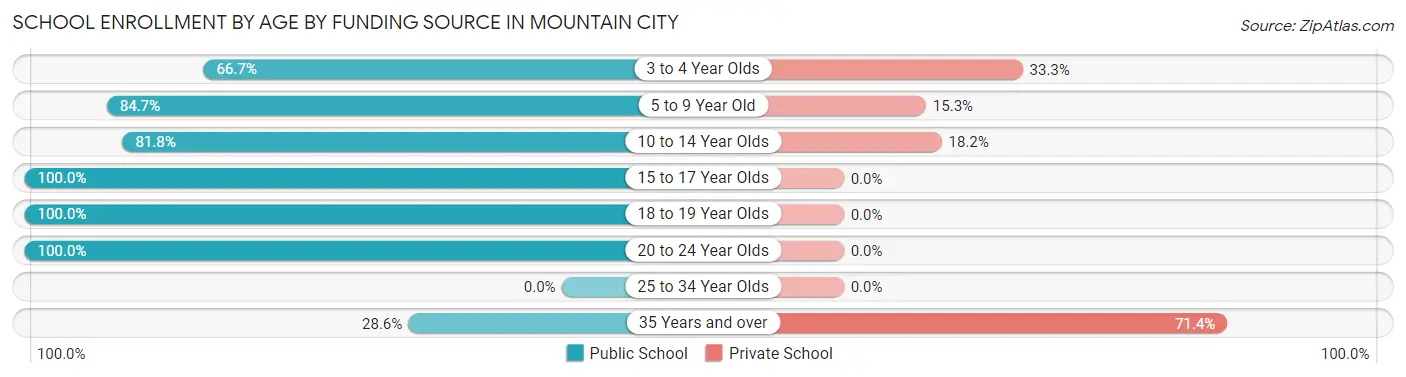
| Age Bracket | Public School | Private School |
| 3 to 4 Year Olds | 10 (66.7%) | 5 (33.3%) |
| 5 to 9 Year Old | 94 (84.7%) | 17 (15.3%) |
| 10 to 14 Year Olds | 121 (81.8%) | 27 (18.2%) |
| 15 to 17 Year Olds | 32 (100.0%) | 0 (0.0%) |
| 18 to 19 Year Olds | 16 (100.0%) | 0 (0.0%) |
| 20 to 24 Year Olds | 21 (100.0%) | 0 (0.0%) |
| 25 to 34 Year Olds | 0 (0.0%) | 0 (0.0%) |
| 35 Years and over | 4 (28.6%) | 10 (71.4%) |
| Total | 298 (83.5%) | 59 (16.5%) |
Educational Attainment by Field of Study in Mountain City
Education (48 | 27.1%), science & technology (31 | 17.5%), arts & humanities (28 | 15.8%), business (27 | 15.2%), and bio, nature & agricultural (10 | 5.7%) are the most common fields of study among 177 individuals in Mountain City who have obtained a bachelor's degree or higher.
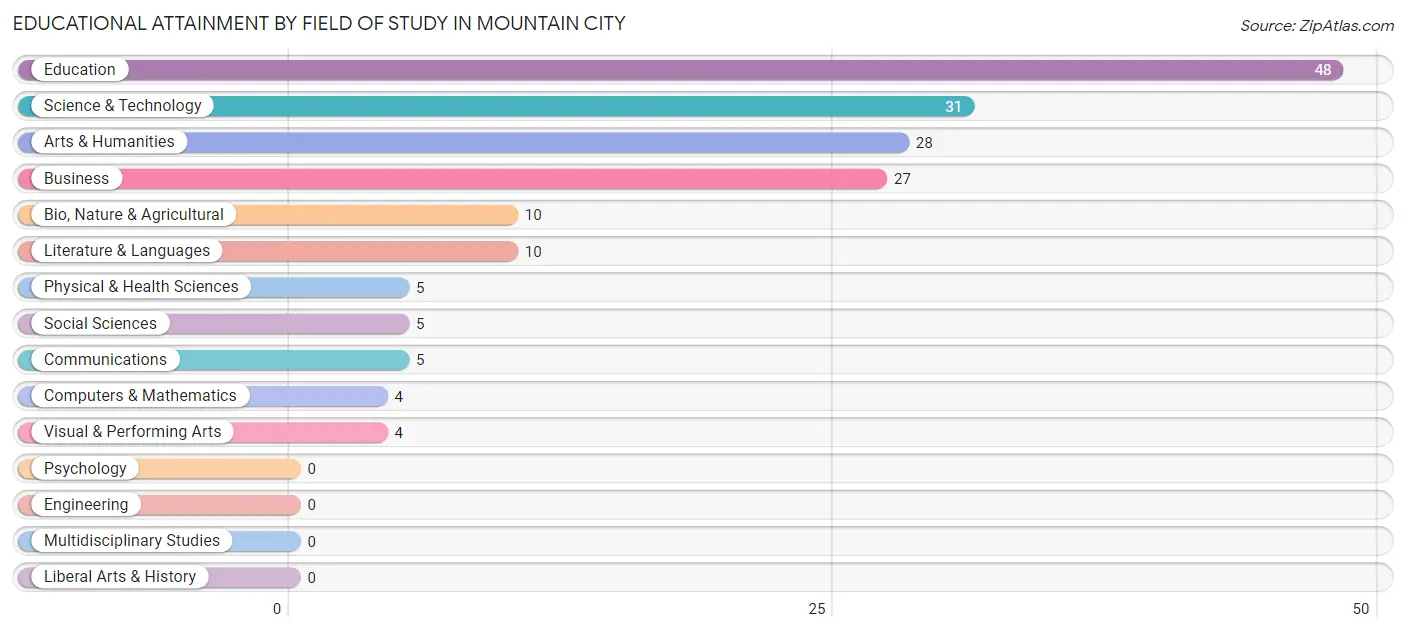
| Field of Study | # Graduates | % Graduates |
| Computers & Mathematics | 4 | 2.3% |
| Bio, Nature & Agricultural | 10 | 5.7% |
| Physical & Health Sciences | 5 | 2.8% |
| Psychology | 0 | 0.0% |
| Social Sciences | 5 | 2.8% |
| Engineering | 0 | 0.0% |
| Multidisciplinary Studies | 0 | 0.0% |
| Science & Technology | 31 | 17.5% |
| Business | 27 | 15.2% |
| Education | 48 | 27.1% |
| Literature & Languages | 10 | 5.7% |
| Liberal Arts & History | 0 | 0.0% |
| Visual & Performing Arts | 4 | 2.3% |
| Communications | 5 | 2.8% |
| Arts & Humanities | 28 | 15.8% |
| Total | 177 | 100.0% |
Transportation & Commute in Mountain City
Vehicle Availability by Sex in Mountain City
The most prevalent vehicle ownership categories in Mountain City are males with 2 vehicles (160, accounting for 39.4%) and females with 2 vehicles (75, making up 51.0%).
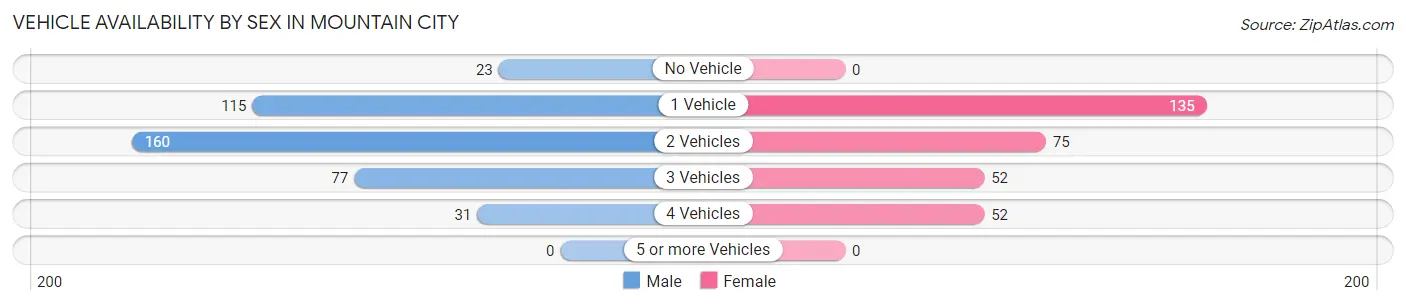
| Vehicles Available | Male | Female |
| No Vehicle | 23 (5.7%) | 0 (0.0%) |
| 1 Vehicle | 115 (28.3%) | 135 (43.0%) |
| 2 Vehicles | 160 (39.4%) | 75 (23.9%) |
| 3 Vehicles | 77 (19.0%) | 52 (16.6%) |
| 4 Vehicles | 31 (7.6%) | 52 (16.6%) |
| 5 or more Vehicles | 0 (0.0%) | 0 (0.0%) |
| Total | 406 (100.0%) | 314 (100.0%) |
Commute Time in Mountain City
The most frequently occuring commute durations in Mountain City are 10 to 14 minutes (138 commuters, 20.6%), 5 to 9 minutes (134 commuters, 20.0%), and 45 to 59 minutes (83 commuters, 12.4%).
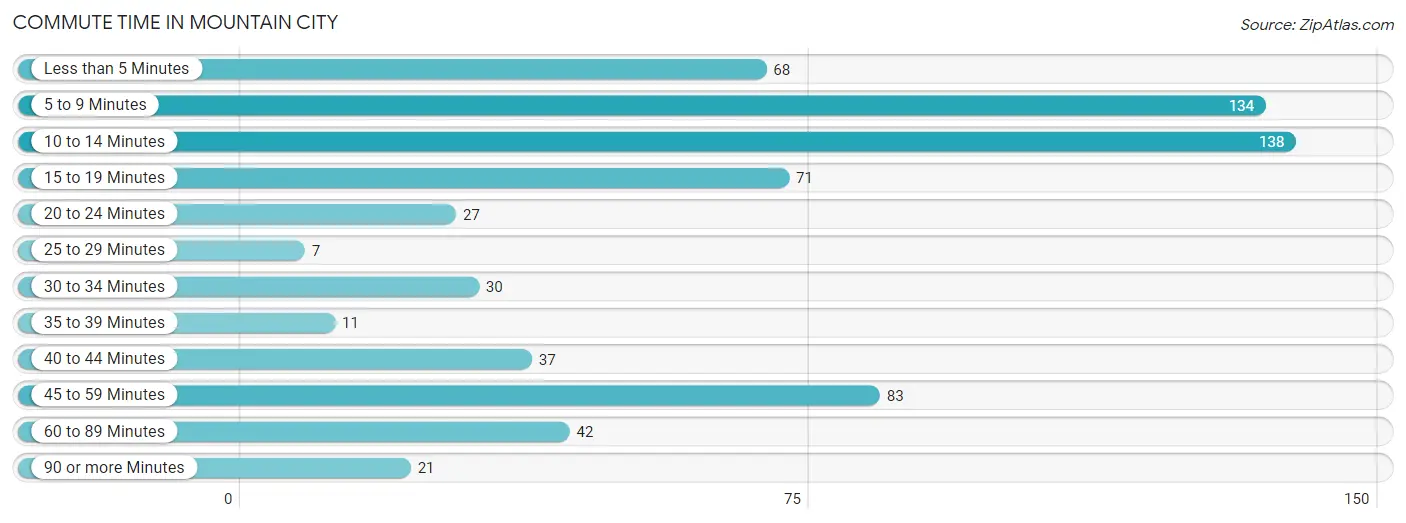
| Commute Time | # Commuters | % Commuters |
| Less than 5 Minutes | 68 | 10.2% |
| 5 to 9 Minutes | 134 | 20.0% |
| 10 to 14 Minutes | 138 | 20.6% |
| 15 to 19 Minutes | 71 | 10.6% |
| 20 to 24 Minutes | 27 | 4.0% |
| 25 to 29 Minutes | 7 | 1.1% |
| 30 to 34 Minutes | 30 | 4.5% |
| 35 to 39 Minutes | 11 | 1.6% |
| 40 to 44 Minutes | 37 | 5.5% |
| 45 to 59 Minutes | 83 | 12.4% |
| 60 to 89 Minutes | 42 | 6.3% |
| 90 or more Minutes | 21 | 3.1% |
Commute Time by Sex in Mountain City
The most common commute times in Mountain City are 10 to 14 minutes (103 commuters, 27.5%) for males and 5 to 9 minutes (91 commuters, 30.8%) for females.
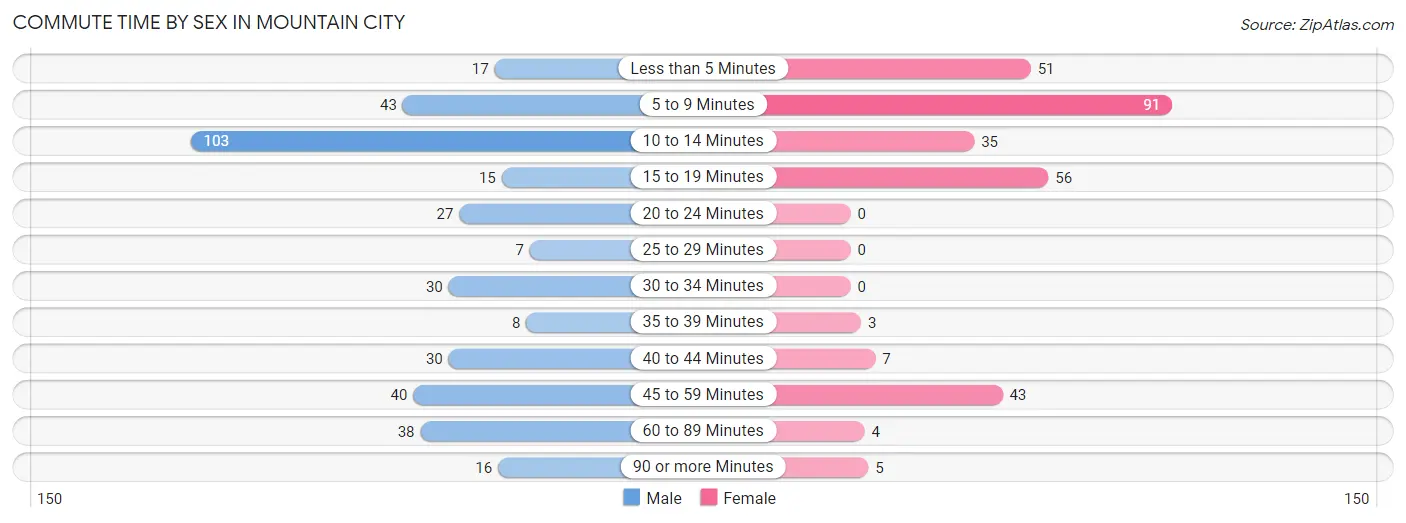
| Commute Time | Male | Female |
| Less than 5 Minutes | 17 (4.5%) | 51 (17.3%) |
| 5 to 9 Minutes | 43 (11.5%) | 91 (30.8%) |
| 10 to 14 Minutes | 103 (27.5%) | 35 (11.9%) |
| 15 to 19 Minutes | 15 (4.0%) | 56 (19.0%) |
| 20 to 24 Minutes | 27 (7.2%) | 0 (0.0%) |
| 25 to 29 Minutes | 7 (1.9%) | 0 (0.0%) |
| 30 to 34 Minutes | 30 (8.0%) | 0 (0.0%) |
| 35 to 39 Minutes | 8 (2.1%) | 3 (1.0%) |
| 40 to 44 Minutes | 30 (8.0%) | 7 (2.4%) |
| 45 to 59 Minutes | 40 (10.7%) | 43 (14.6%) |
| 60 to 89 Minutes | 38 (10.2%) | 4 (1.4%) |
| 90 or more Minutes | 16 (4.3%) | 5 (1.7%) |
Time of Departure to Work by Sex in Mountain City
The most frequent times of departure to work in Mountain City are 6:30 AM to 6:59 AM (79, 21.1%) for males and 7:00 AM to 7:29 AM (112, 38.0%) for females.
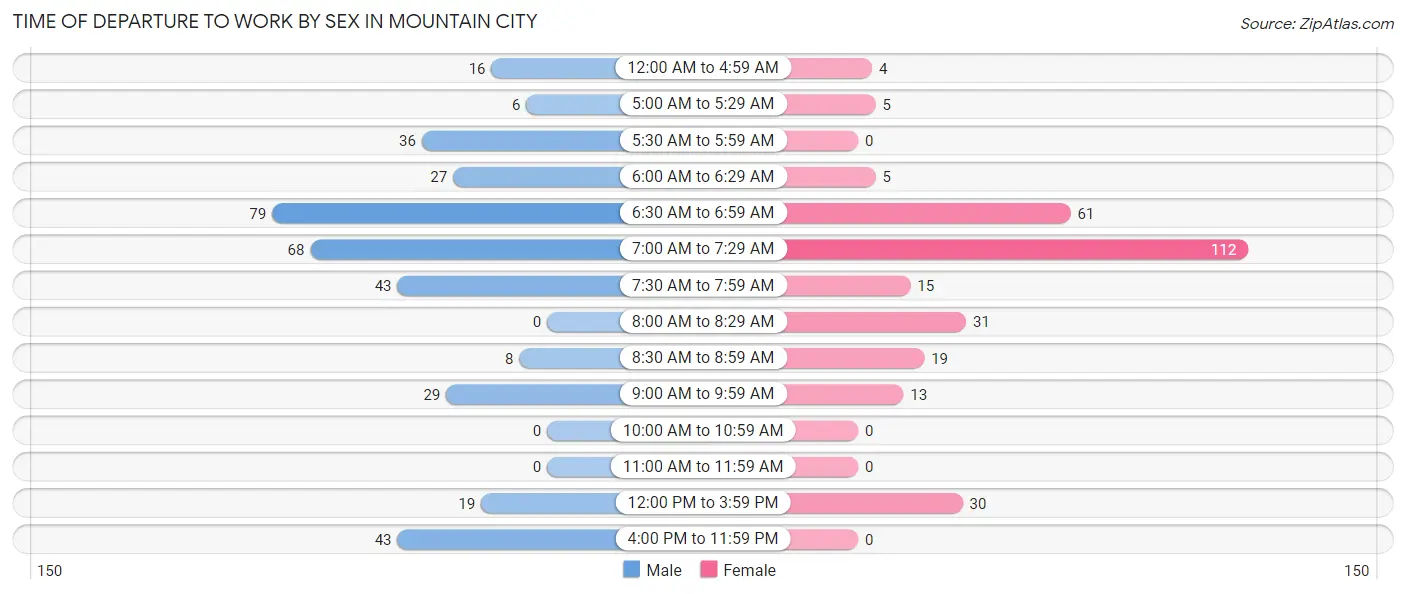
| Time of Departure | Male | Female |
| 12:00 AM to 4:59 AM | 16 (4.3%) | 4 (1.4%) |
| 5:00 AM to 5:29 AM | 6 (1.6%) | 5 (1.7%) |
| 5:30 AM to 5:59 AM | 36 (9.6%) | 0 (0.0%) |
| 6:00 AM to 6:29 AM | 27 (7.2%) | 5 (1.7%) |
| 6:30 AM to 6:59 AM | 79 (21.1%) | 61 (20.7%) |
| 7:00 AM to 7:29 AM | 68 (18.2%) | 112 (38.0%) |
| 7:30 AM to 7:59 AM | 43 (11.5%) | 15 (5.1%) |
| 8:00 AM to 8:29 AM | 0 (0.0%) | 31 (10.5%) |
| 8:30 AM to 8:59 AM | 8 (2.1%) | 19 (6.4%) |
| 9:00 AM to 9:59 AM | 29 (7.7%) | 13 (4.4%) |
| 10:00 AM to 10:59 AM | 0 (0.0%) | 0 (0.0%) |
| 11:00 AM to 11:59 AM | 0 (0.0%) | 0 (0.0%) |
| 12:00 PM to 3:59 PM | 19 (5.1%) | 30 (10.2%) |
| 4:00 PM to 11:59 PM | 43 (11.5%) | 0 (0.0%) |
| Total | 374 (100.0%) | 295 (100.0%) |
Housing Occupancy in Mountain City
Occupancy by Ownership in Mountain City
Of the total 1,049 dwellings in Mountain City, owner-occupied units account for 588 (56.0%), while renter-occupied units make up 461 (44.0%).
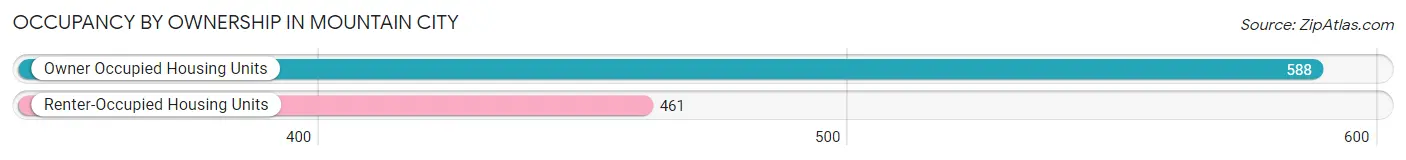
| Occupancy | # Housing Units | % Housing Units |
| Owner Occupied Housing Units | 588 | 56.0% |
| Renter-Occupied Housing Units | 461 | 44.0% |
| Total Occupied Housing Units | 1,049 | 100.0% |
Occupancy by Household Size in Mountain City
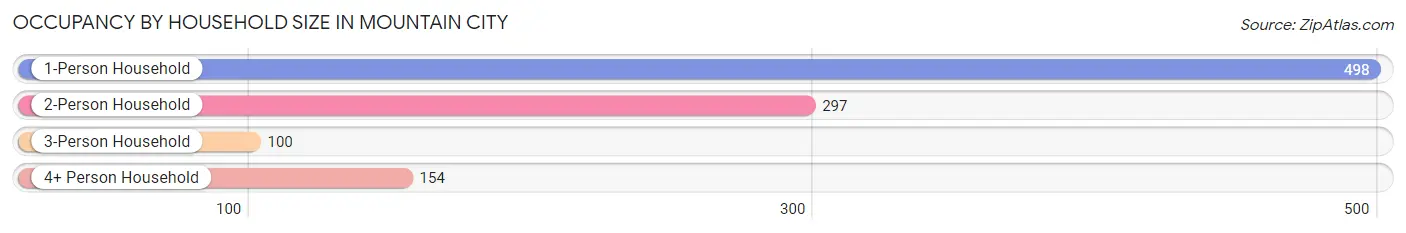
| Household Size | # Housing Units | % Housing Units |
| 1-Person Household | 498 | 47.5% |
| 2-Person Household | 297 | 28.3% |
| 3-Person Household | 100 | 9.5% |
| 4+ Person Household | 154 | 14.7% |
| Total Housing Units | 1,049 | 100.0% |
Occupancy by Ownership by Household Size in Mountain City
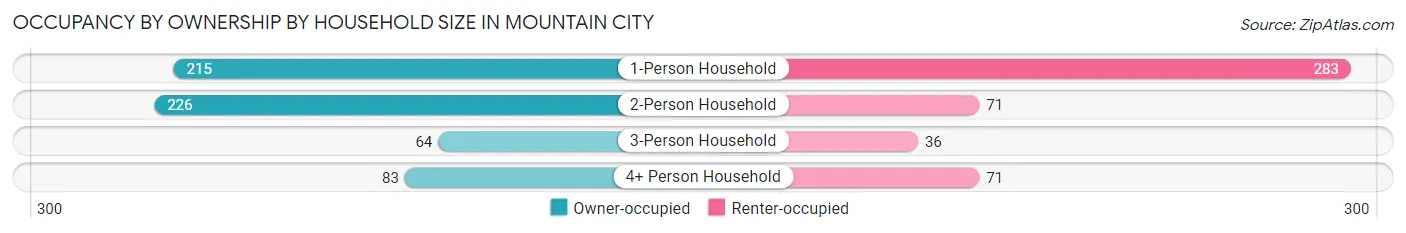
| Household Size | Owner-occupied | Renter-occupied |
| 1-Person Household | 215 (43.2%) | 283 (56.8%) |
| 2-Person Household | 226 (76.1%) | 71 (23.9%) |
| 3-Person Household | 64 (64.0%) | 36 (36.0%) |
| 4+ Person Household | 83 (53.9%) | 71 (46.1%) |
| Total Housing Units | 588 (56.0%) | 461 (44.0%) |
Occupancy by Educational Attainment in Mountain City
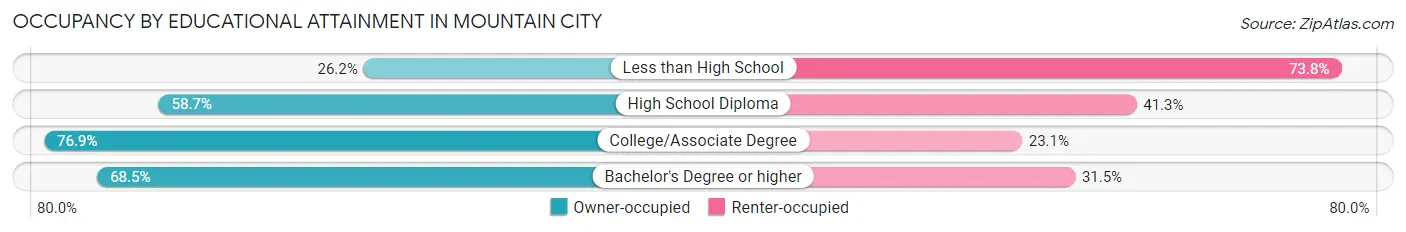
| Household Size | Owner-occupied | Renter-occupied |
| Less than High School | 74 (26.2%) | 208 (73.8%) |
| High School Diploma | 215 (58.7%) | 151 (41.3%) |
| College/Associate Degree | 223 (76.9%) | 67 (23.1%) |
| Bachelor's Degree or higher | 76 (68.5%) | 35 (31.5%) |
Occupancy by Age of Householder in Mountain City
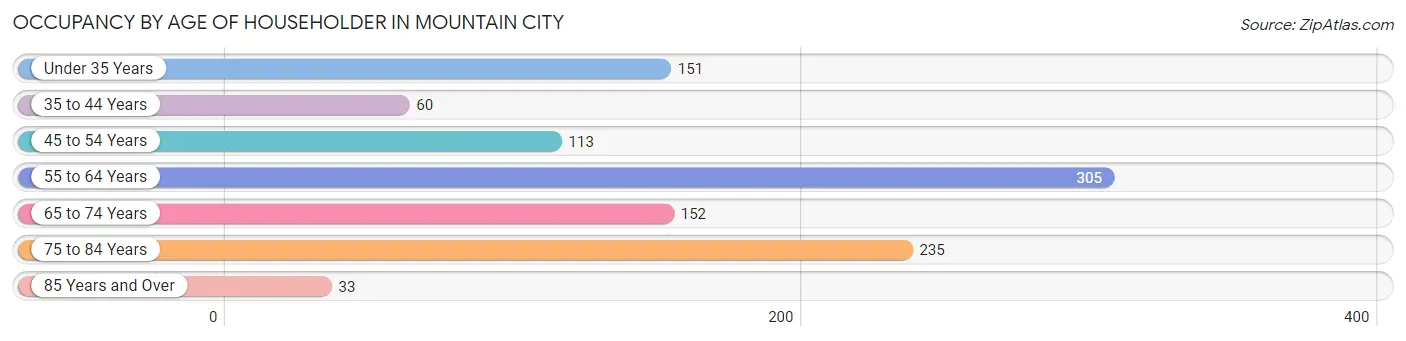
| Age Bracket | # Households | % Households |
| Under 35 Years | 151 | 14.4% |
| 35 to 44 Years | 60 | 5.7% |
| 45 to 54 Years | 113 | 10.8% |
| 55 to 64 Years | 305 | 29.1% |
| 65 to 74 Years | 152 | 14.5% |
| 75 to 84 Years | 235 | 22.4% |
| 85 Years and Over | 33 | 3.2% |
| Total | 1,049 | 100.0% |
Housing Finances in Mountain City
Median Income by Occupancy in Mountain City
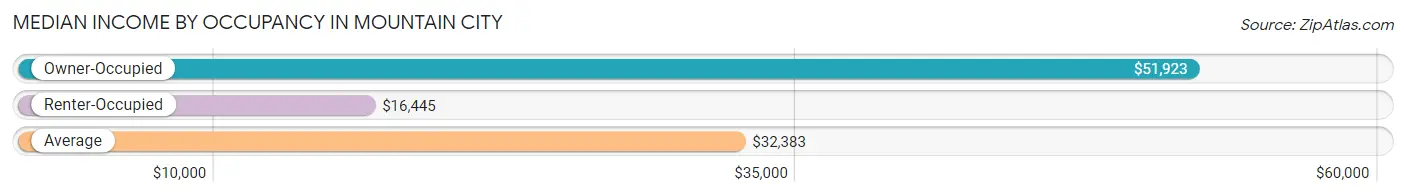
| Occupancy Type | # Households | Median Income |
| Owner-Occupied | 588 (56.0%) | $51,923 |
| Renter-Occupied | 461 (44.0%) | $16,445 |
| Average | 1,049 (100.0%) | $32,383 |
Occupancy by Householder Income Bracket in Mountain City
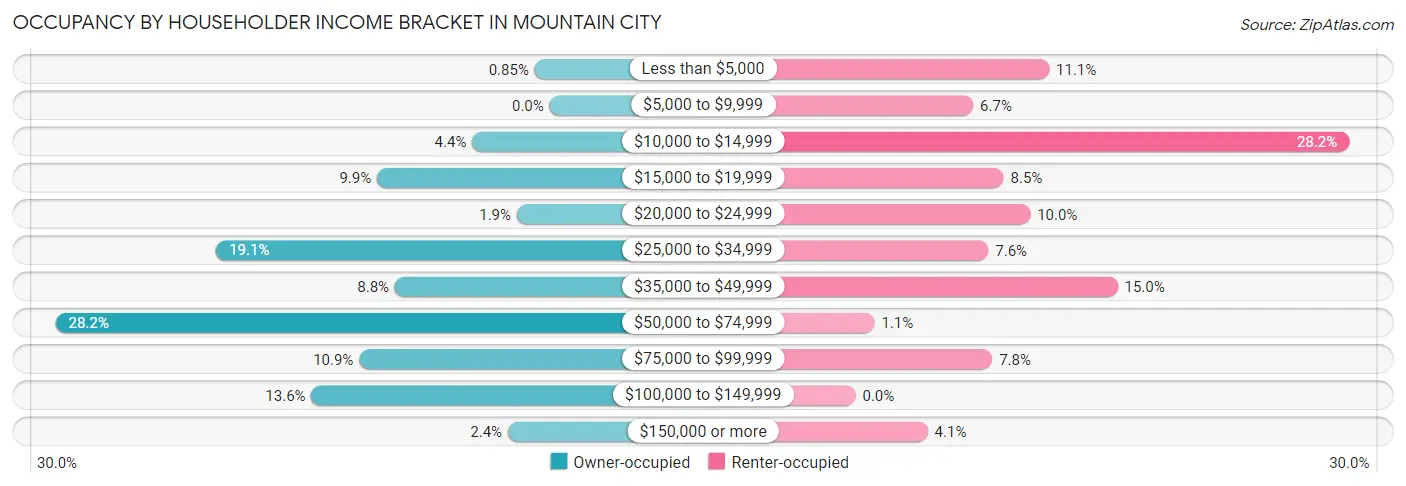
| Income Bracket | Owner-occupied | Renter-occupied |
| Less than $5,000 | 5 (0.9%) | 51 (11.1%) |
| $5,000 to $9,999 | 0 (0.0%) | 31 (6.7%) |
| $10,000 to $14,999 | 26 (4.4%) | 130 (28.2%) |
| $15,000 to $19,999 | 58 (9.9%) | 39 (8.5%) |
| $20,000 to $24,999 | 11 (1.9%) | 46 (10.0%) |
| $25,000 to $34,999 | 112 (19.1%) | 35 (7.6%) |
| $35,000 to $49,999 | 52 (8.8%) | 69 (15.0%) |
| $50,000 to $74,999 | 166 (28.2%) | 5 (1.1%) |
| $75,000 to $99,999 | 64 (10.9%) | 36 (7.8%) |
| $100,000 to $149,999 | 80 (13.6%) | 0 (0.0%) |
| $150,000 or more | 14 (2.4%) | 19 (4.1%) |
| Total | 588 (100.0%) | 461 (100.0%) |
Monthly Housing Cost Tiers in Mountain City
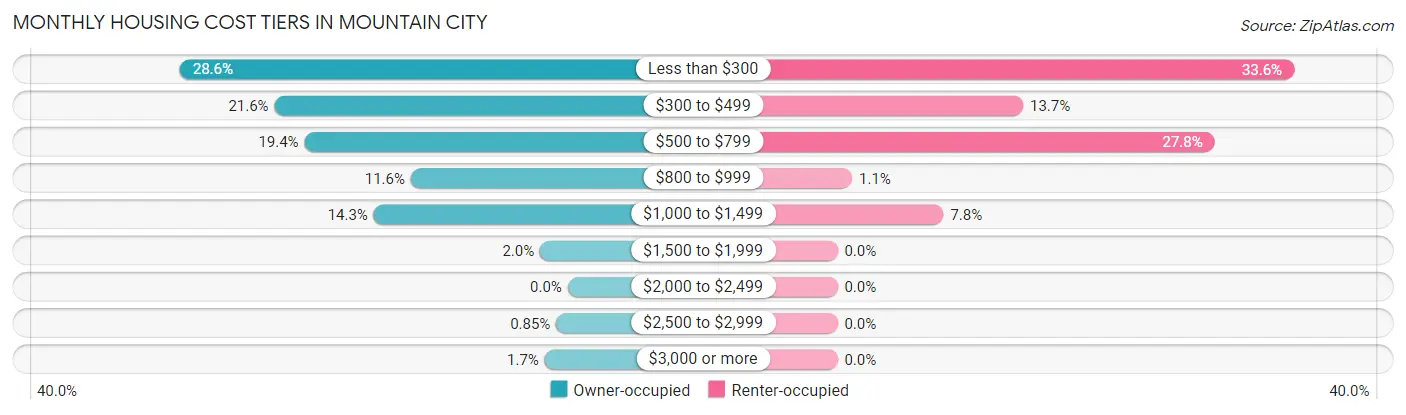
| Monthly Cost | Owner-occupied | Renter-occupied |
| Less than $300 | 168 (28.6%) | 155 (33.6%) |
| $300 to $499 | 127 (21.6%) | 63 (13.7%) |
| $500 to $799 | 114 (19.4%) | 128 (27.8%) |
| $800 to $999 | 68 (11.6%) | 5 (1.1%) |
| $1,000 to $1,499 | 84 (14.3%) | 36 (7.8%) |
| $1,500 to $1,999 | 12 (2.0%) | 0 (0.0%) |
| $2,000 to $2,499 | 0 (0.0%) | 0 (0.0%) |
| $2,500 to $2,999 | 5 (0.9%) | 0 (0.0%) |
| $3,000 or more | 10 (1.7%) | 0 (0.0%) |
| Total | 588 (100.0%) | 461 (100.0%) |
Physical Housing Characteristics in Mountain City
Housing Structures in Mountain City
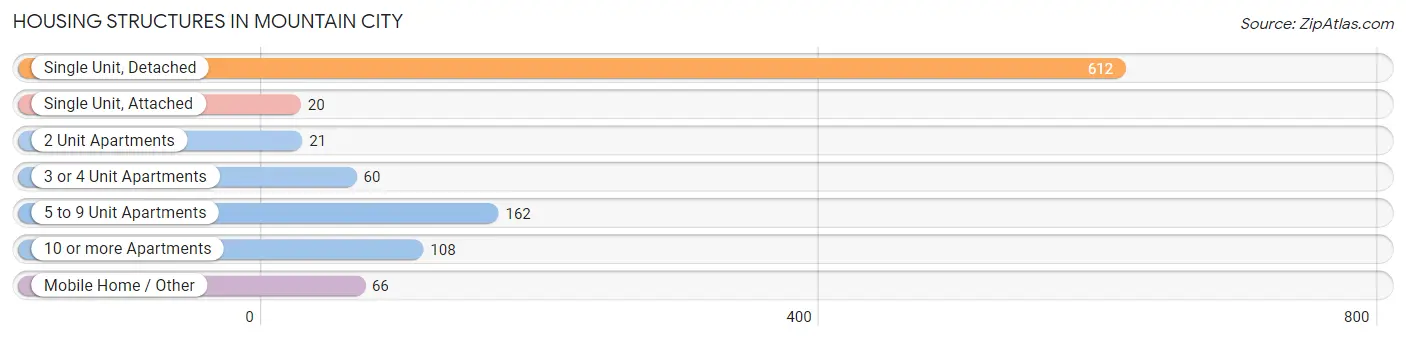
| Structure Type | # Housing Units | % Housing Units |
| Single Unit, Detached | 612 | 58.3% |
| Single Unit, Attached | 20 | 1.9% |
| 2 Unit Apartments | 21 | 2.0% |
| 3 or 4 Unit Apartments | 60 | 5.7% |
| 5 to 9 Unit Apartments | 162 | 15.4% |
| 10 or more Apartments | 108 | 10.3% |
| Mobile Home / Other | 66 | 6.3% |
| Total | 1,049 | 100.0% |
Housing Structures by Occupancy in Mountain City
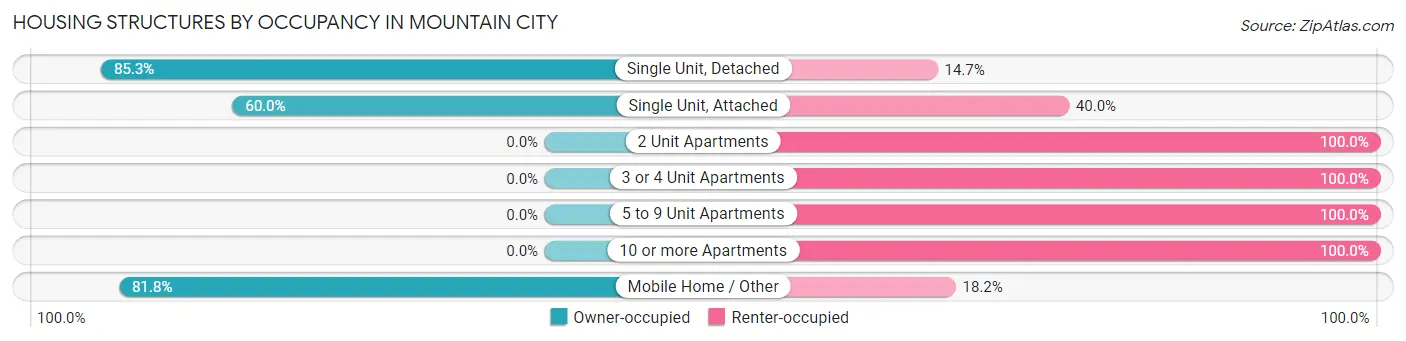
| Structure Type | Owner-occupied | Renter-occupied |
| Single Unit, Detached | 522 (85.3%) | 90 (14.7%) |
| Single Unit, Attached | 12 (60.0%) | 8 (40.0%) |
| 2 Unit Apartments | 0 (0.0%) | 21 (100.0%) |
| 3 or 4 Unit Apartments | 0 (0.0%) | 60 (100.0%) |
| 5 to 9 Unit Apartments | 0 (0.0%) | 162 (100.0%) |
| 10 or more Apartments | 0 (0.0%) | 108 (100.0%) |
| Mobile Home / Other | 54 (81.8%) | 12 (18.2%) |
| Total | 588 (56.0%) | 461 (44.0%) |
Housing Structures by Number of Rooms in Mountain City
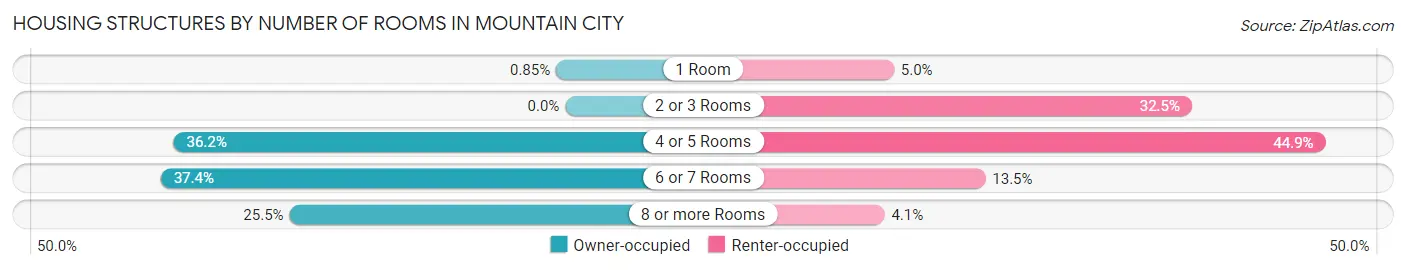
| Number of Rooms | Owner-occupied | Renter-occupied |
| 1 Room | 5 (0.9%) | 23 (5.0%) |
| 2 or 3 Rooms | 0 (0.0%) | 150 (32.5%) |
| 4 or 5 Rooms | 213 (36.2%) | 207 (44.9%) |
| 6 or 7 Rooms | 220 (37.4%) | 62 (13.5%) |
| 8 or more Rooms | 150 (25.5%) | 19 (4.1%) |
| Total | 588 (100.0%) | 461 (100.0%) |
Housing Structure by Heating Type in Mountain City
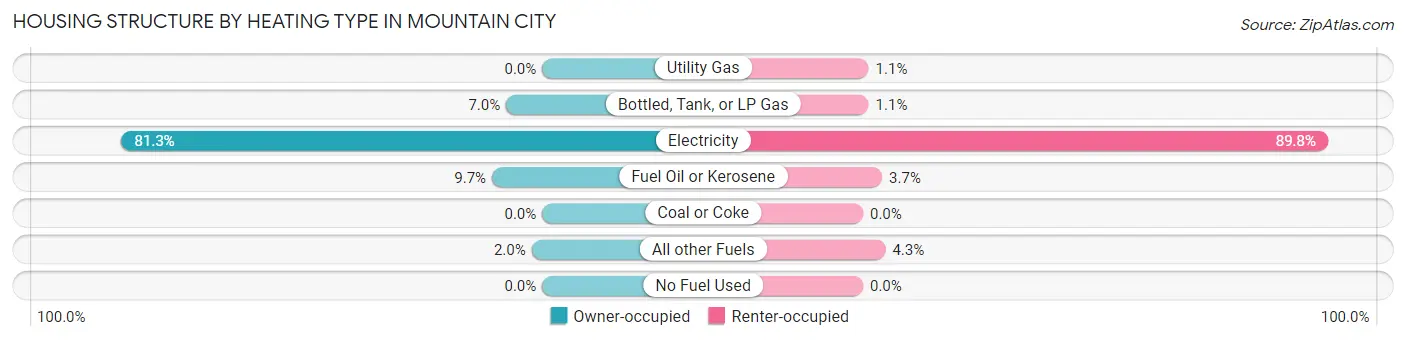
| Heating Type | Owner-occupied | Renter-occupied |
| Utility Gas | 0 (0.0%) | 5 (1.1%) |
| Bottled, Tank, or LP Gas | 41 (7.0%) | 5 (1.1%) |
| Electricity | 478 (81.3%) | 414 (89.8%) |
| Fuel Oil or Kerosene | 57 (9.7%) | 17 (3.7%) |
| Coal or Coke | 0 (0.0%) | 0 (0.0%) |
| All other Fuels | 12 (2.0%) | 20 (4.3%) |
| No Fuel Used | 0 (0.0%) | 0 (0.0%) |
| Total | 588 (100.0%) | 461 (100.0%) |
Household Vehicle Usage in Mountain City
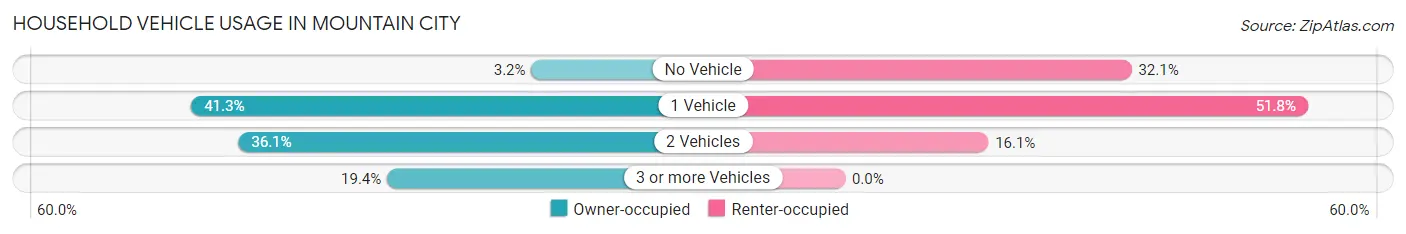
| Vehicles per Household | Owner-occupied | Renter-occupied |
| No Vehicle | 19 (3.2%) | 148 (32.1%) |
| 1 Vehicle | 243 (41.3%) | 239 (51.8%) |
| 2 Vehicles | 212 (36.0%) | 74 (16.1%) |
| 3 or more Vehicles | 114 (19.4%) | 0 (0.0%) |
| Total | 588 (100.0%) | 461 (100.0%) |
Real Estate & Mortgages in Mountain City
Real Estate and Mortgage Overview in Mountain City
| Characteristic | Without Mortgage | With Mortgage |
| Housing Units | 327 | 261 |
| Median Property Value | $141,700 | $161,300 |
| Median Household Income | $38,594 | $10 |
| Monthly Housing Costs | $297 | $10 |
| Real Estate Taxes | $517 | $46 |
Property Value by Mortgage Status in Mountain City
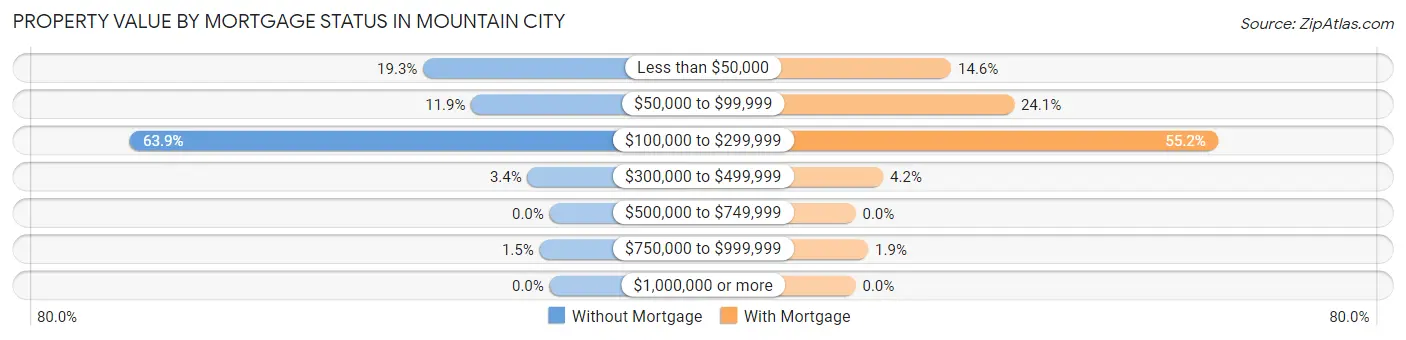
| Property Value | Without Mortgage | With Mortgage |
| Less than $50,000 | 63 (19.3%) | 38 (14.6%) |
| $50,000 to $99,999 | 39 (11.9%) | 63 (24.1%) |
| $100,000 to $299,999 | 209 (63.9%) | 144 (55.2%) |
| $300,000 to $499,999 | 11 (3.4%) | 11 (4.2%) |
| $500,000 to $749,999 | 0 (0.0%) | 0 (0.0%) |
| $750,000 to $999,999 | 5 (1.5%) | 5 (1.9%) |
| $1,000,000 or more | 0 (0.0%) | 0 (0.0%) |
| Total | 327 (100.0%) | 261 (100.0%) |
Household Income by Mortgage Status in Mountain City
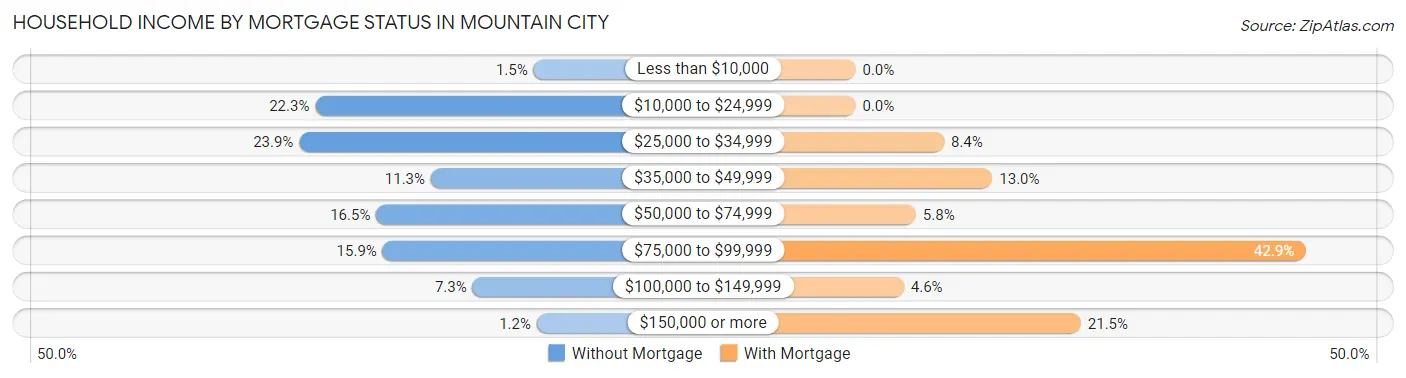
| Household Income | Without Mortgage | With Mortgage |
| Less than $10,000 | 5 (1.5%) | 0 (0.0%) |
| $10,000 to $24,999 | 73 (22.3%) | 0 (0.0%) |
| $25,000 to $34,999 | 78 (23.8%) | 22 (8.4%) |
| $35,000 to $49,999 | 37 (11.3%) | 34 (13.0%) |
| $50,000 to $74,999 | 54 (16.5%) | 15 (5.8%) |
| $75,000 to $99,999 | 52 (15.9%) | 112 (42.9%) |
| $100,000 to $149,999 | 24 (7.3%) | 12 (4.6%) |
| $150,000 or more | 4 (1.2%) | 56 (21.5%) |
| Total | 327 (100.0%) | 261 (100.0%) |
Property Value to Household Income Ratio in Mountain City
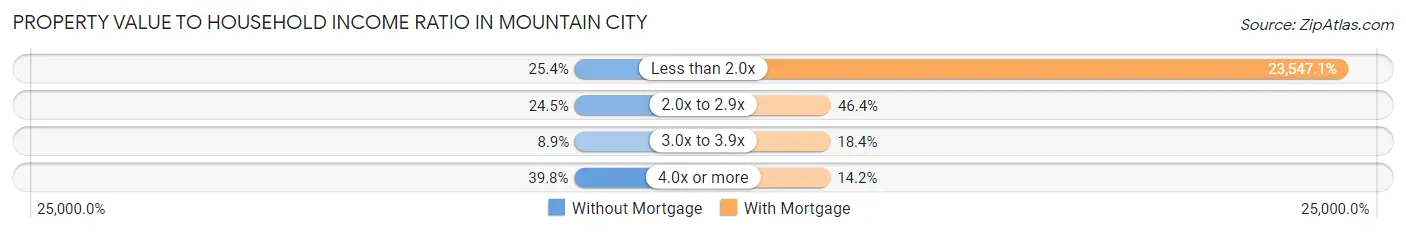
| Value-to-Income Ratio | Without Mortgage | With Mortgage |
| Less than 2.0x | 83 (25.4%) | 61,458 (23,547.1%) |
| 2.0x to 2.9x | 80 (24.5%) | 121 (46.4%) |
| 3.0x to 3.9x | 29 (8.9%) | 48 (18.4%) |
| 4.0x or more | 130 (39.8%) | 37 (14.2%) |
| Total | 327 (100.0%) | 261 (100.0%) |
Real Estate Taxes by Mortgage Status in Mountain City
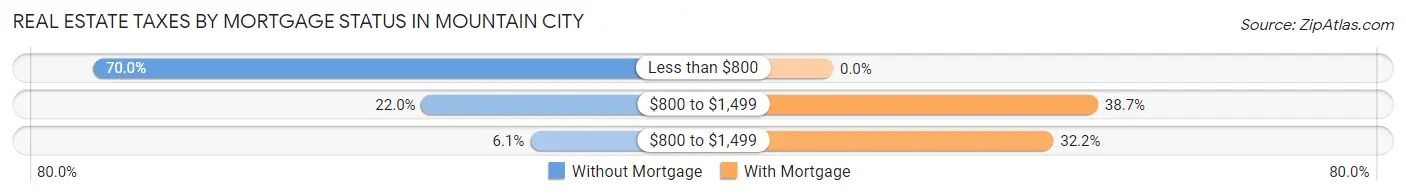
| Property Taxes | Without Mortgage | With Mortgage |
| Less than $800 | 229 (70.0%) | 0 (0.0%) |
| $800 to $1,499 | 72 (22.0%) | 101 (38.7%) |
| $800 to $1,499 | 20 (6.1%) | 84 (32.2%) |
| Total | 327 (100.0%) | 261 (100.0%) |
Health & Disability in Mountain City
Health Insurance Coverage by Age in Mountain City
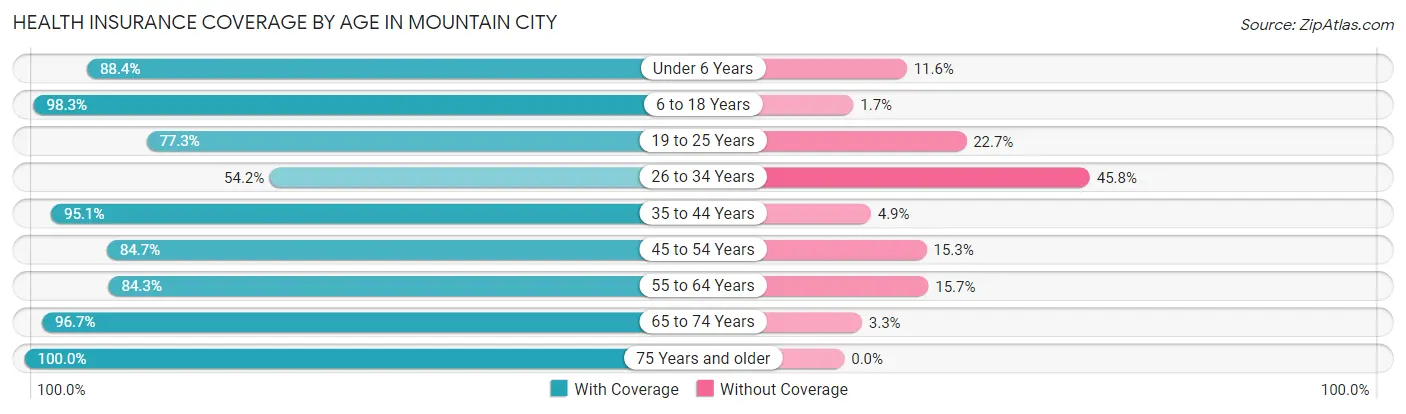
| Age Bracket | With Coverage | Without Coverage |
| Under 6 Years | 129 (88.4%) | 17 (11.6%) |
| 6 to 18 Years | 290 (98.3%) | 5 (1.7%) |
| 19 to 25 Years | 85 (77.3%) | 25 (22.7%) |
| 26 to 34 Years | 167 (54.2%) | 141 (45.8%) |
| 35 to 44 Years | 154 (95.1%) | 8 (4.9%) |
| 45 to 54 Years | 138 (84.7%) | 25 (15.3%) |
| 55 to 64 Years | 350 (84.3%) | 65 (15.7%) |
| 65 to 74 Years | 236 (96.7%) | 8 (3.3%) |
| 75 Years and older | 330 (100.0%) | 0 (0.0%) |
| Total | 1,879 (86.5%) | 294 (13.5%) |
Health Insurance Coverage by Citizenship Status in Mountain City
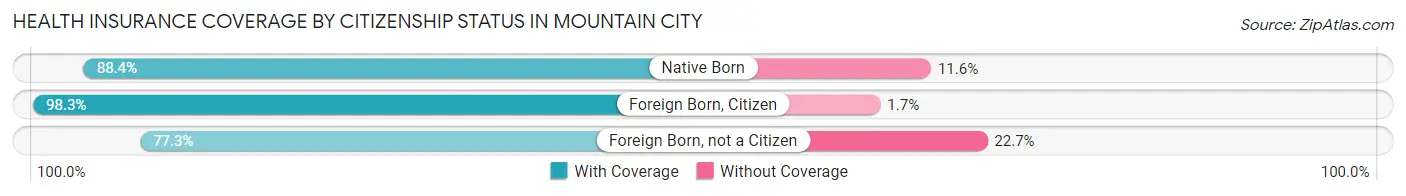
| Citizenship Status | With Coverage | Without Coverage |
| Native Born | 129 (88.4%) | 17 (11.6%) |
| Foreign Born, Citizen | 290 (98.3%) | 5 (1.7%) |
| Foreign Born, not a Citizen | 85 (77.3%) | 25 (22.7%) |
Health Insurance Coverage by Household Income in Mountain City
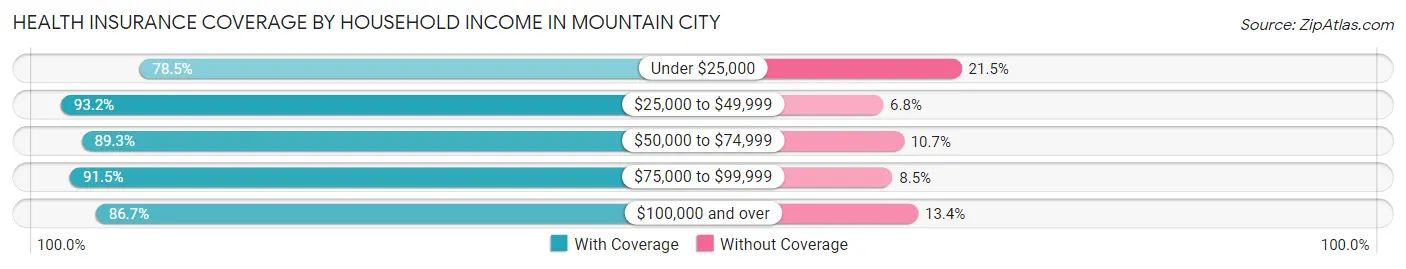
| Household Income | With Coverage | Without Coverage |
| Under $25,000 | 536 (78.5%) | 147 (21.5%) |
| $25,000 to $49,999 | 383 (93.2%) | 28 (6.8%) |
| $50,000 to $74,999 | 385 (89.3%) | 46 (10.7%) |
| $75,000 to $99,999 | 257 (91.5%) | 24 (8.5%) |
| $100,000 and over | 318 (86.7%) | 49 (13.4%) |
Public vs Private Health Insurance Coverage by Age in Mountain City
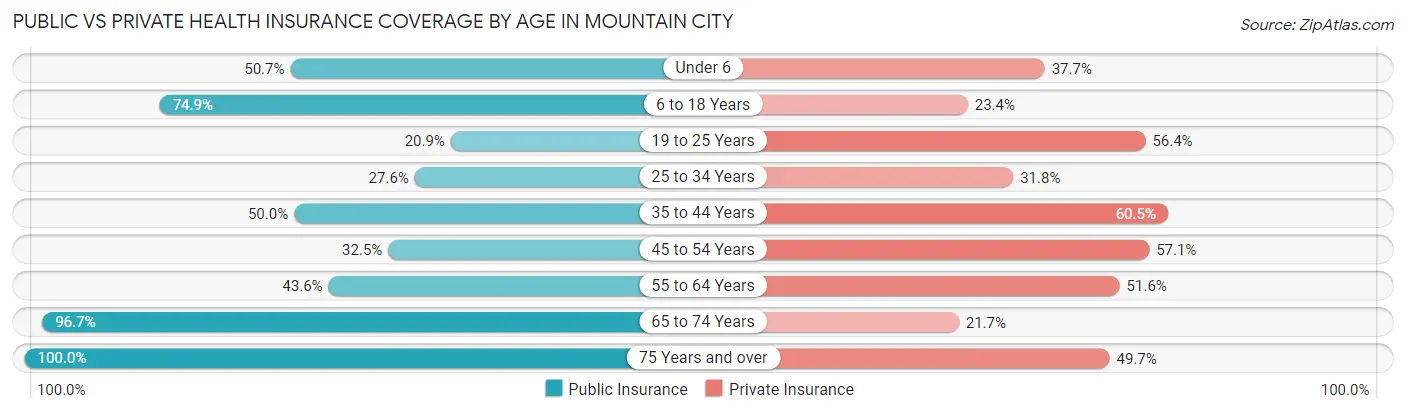
| Age Bracket | Public Insurance | Private Insurance |
| Under 6 | 74 (50.7%) | 55 (37.7%) |
| 6 to 18 Years | 221 (74.9%) | 69 (23.4%) |
| 19 to 25 Years | 23 (20.9%) | 62 (56.4%) |
| 25 to 34 Years | 85 (27.6%) | 98 (31.8%) |
| 35 to 44 Years | 81 (50.0%) | 98 (60.5%) |
| 45 to 54 Years | 53 (32.5%) | 93 (57.1%) |
| 55 to 64 Years | 181 (43.6%) | 214 (51.6%) |
| 65 to 74 Years | 236 (96.7%) | 53 (21.7%) |
| 75 Years and over | 330 (100.0%) | 164 (49.7%) |
| Total | 1,284 (59.1%) | 906 (41.7%) |
Disability Status by Sex by Age in Mountain City
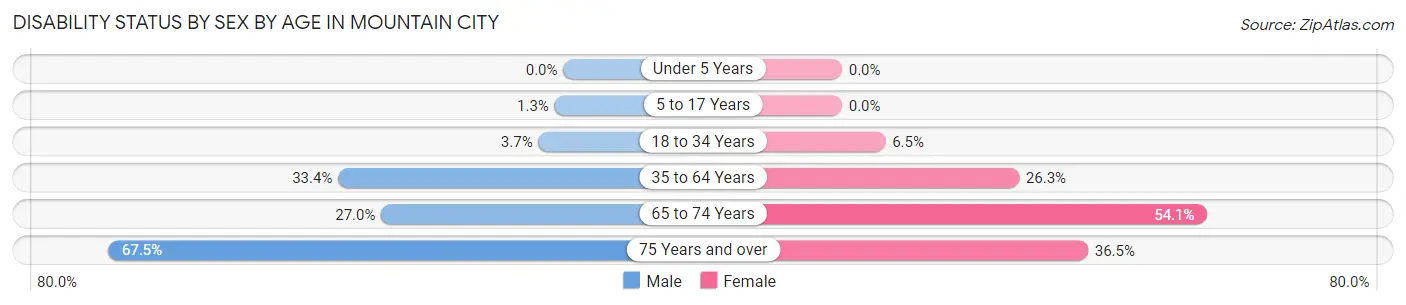
| Age Bracket | Male | Female |
| Under 5 Years | 0 (0.0%) | 0 (0.0%) |
| 5 to 17 Years | 2 (1.3%) | 0 (0.0%) |
| 18 to 34 Years | 8 (3.7%) | 14 (6.5%) |
| 35 to 64 Years | 119 (33.4%) | 101 (26.3%) |
| 65 to 74 Years | 20 (27.0%) | 92 (54.1%) |
| 75 Years and over | 110 (67.5%) | 61 (36.5%) |
Disability Class by Sex by Age in Mountain City
Disability Class: Hearing Difficulty
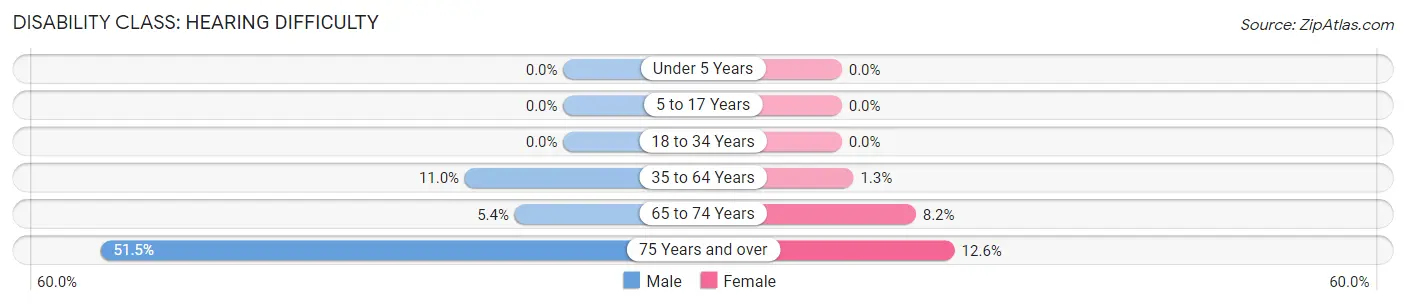
| Age Bracket | Male | Female |
| Under 5 Years | 0 (0.0%) | 0 (0.0%) |
| 5 to 17 Years | 0 (0.0%) | 0 (0.0%) |
| 18 to 34 Years | 0 (0.0%) | 0 (0.0%) |
| 35 to 64 Years | 39 (11.0%) | 5 (1.3%) |
| 65 to 74 Years | 4 (5.4%) | 14 (8.2%) |
| 75 Years and over | 84 (51.5%) | 21 (12.6%) |
Disability Class: Vision Difficulty
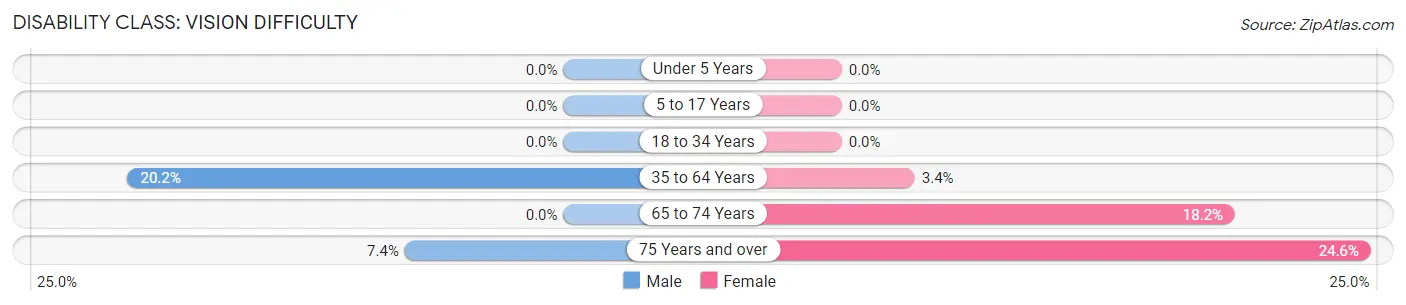
| Age Bracket | Male | Female |
| Under 5 Years | 0 (0.0%) | 0 (0.0%) |
| 5 to 17 Years | 0 (0.0%) | 0 (0.0%) |
| 18 to 34 Years | 0 (0.0%) | 0 (0.0%) |
| 35 to 64 Years | 72 (20.2%) | 13 (3.4%) |
| 65 to 74 Years | 0 (0.0%) | 31 (18.2%) |
| 75 Years and over | 12 (7.4%) | 41 (24.5%) |
Disability Class: Cognitive Difficulty
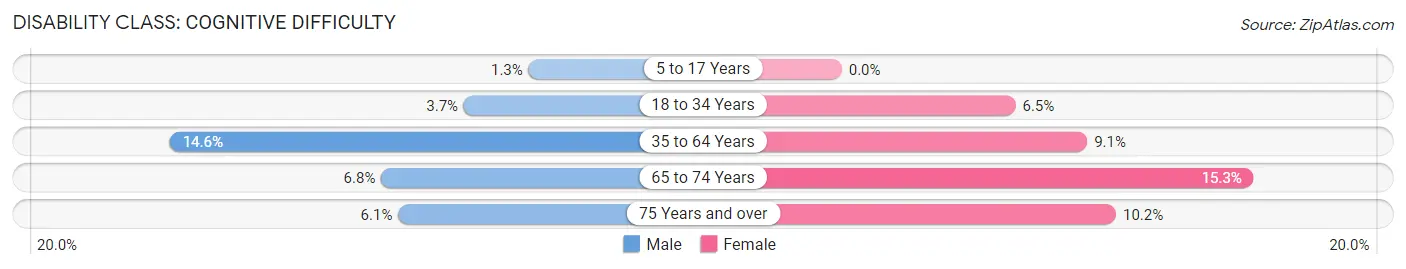
| Age Bracket | Male | Female |
| 5 to 17 Years | 2 (1.3%) | 0 (0.0%) |
| 18 to 34 Years | 8 (3.7%) | 14 (6.5%) |
| 35 to 64 Years | 52 (14.6%) | 35 (9.1%) |
| 65 to 74 Years | 5 (6.8%) | 26 (15.3%) |
| 75 Years and over | 10 (6.1%) | 17 (10.2%) |
Disability Class: Ambulatory Difficulty
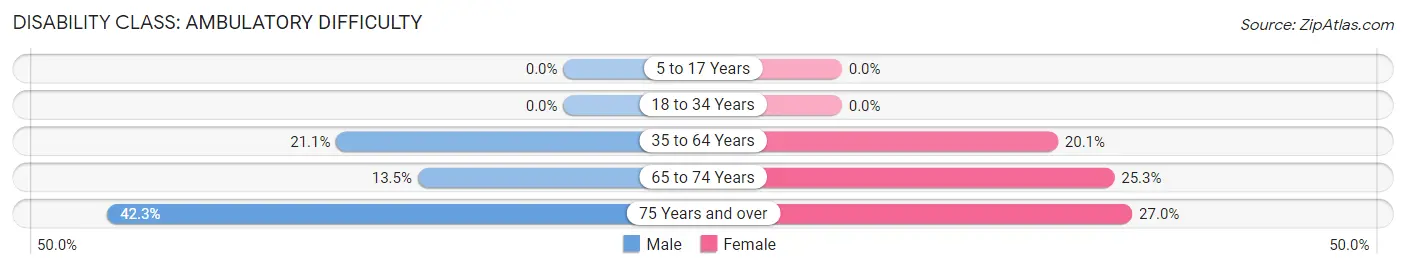
| Age Bracket | Male | Female |
| 5 to 17 Years | 0 (0.0%) | 0 (0.0%) |
| 18 to 34 Years | 0 (0.0%) | 0 (0.0%) |
| 35 to 64 Years | 75 (21.1%) | 77 (20.1%) |
| 65 to 74 Years | 10 (13.5%) | 43 (25.3%) |
| 75 Years and over | 69 (42.3%) | 45 (27.0%) |
Disability Class: Self-Care Difficulty
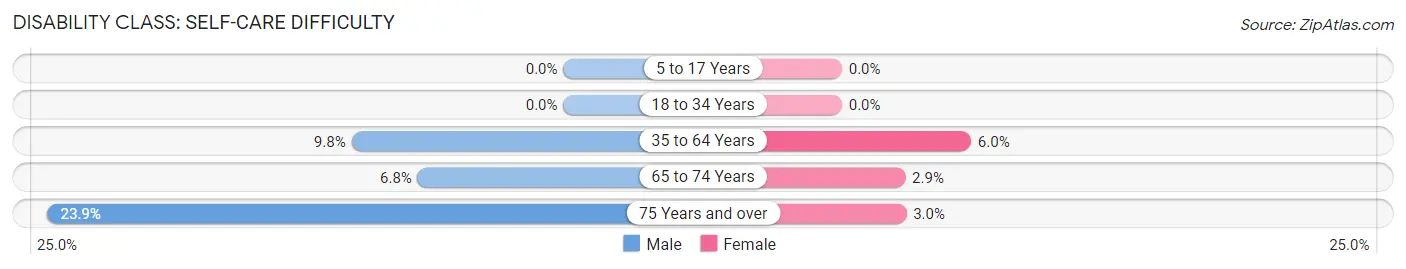
| Age Bracket | Male | Female |
| 5 to 17 Years | 0 (0.0%) | 0 (0.0%) |
| 18 to 34 Years | 0 (0.0%) | 0 (0.0%) |
| 35 to 64 Years | 35 (9.8%) | 23 (6.0%) |
| 65 to 74 Years | 5 (6.8%) | 5 (2.9%) |
| 75 Years and over | 39 (23.9%) | 5 (3.0%) |
Technology Access in Mountain City
Computing Device Access in Mountain City
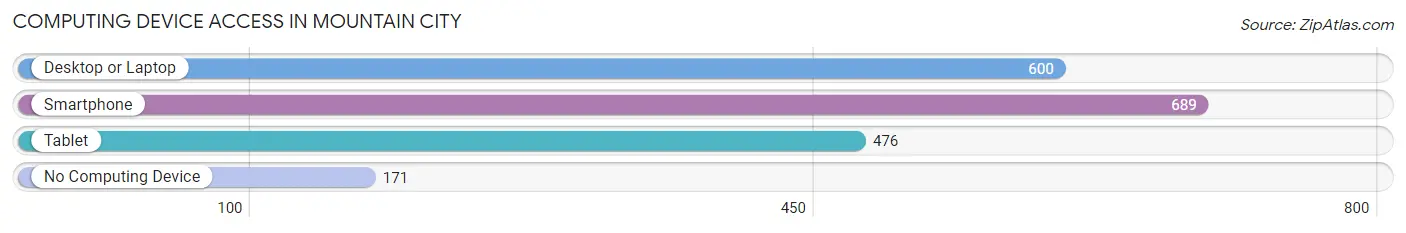
| Device Type | # Households | % Households |
| Desktop or Laptop | 600 | 57.2% |
| Smartphone | 689 | 65.7% |
| Tablet | 476 | 45.4% |
| No Computing Device | 171 | 16.3% |
| Total | 1,049 | 100.0% |
Internet Access in Mountain City
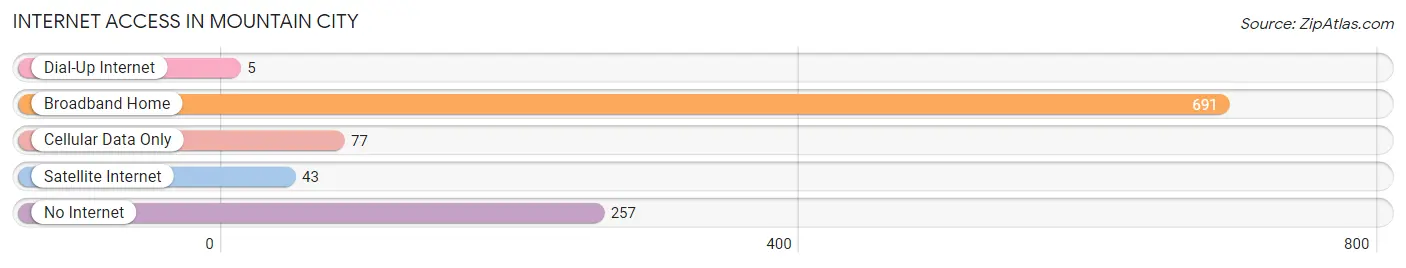
| Internet Type | # Households | % Households |
| Dial-Up Internet | 5 | 0.5% |
| Broadband Home | 691 | 65.9% |
| Cellular Data Only | 77 | 7.3% |
| Satellite Internet | 43 | 4.1% |
| No Internet | 257 | 24.5% |
| Total | 1,049 | 100.0% |
Mountain City Summary
Mountain City is a small town located in the northeastern corner of Tennessee, in Johnson County. It is situated in the foothills of the Appalachian Mountains, and is the county seat of Johnson County. The town has a population of approximately 2,500 people, and is known for its rural charm and friendly atmosphere.
History
Mountain City was founded in 1856 by a group of settlers from North Carolina. The town was originally named Taylorsville, after the first settler, William Taylor. The town was renamed Mountain City in 1868, after the nearby mountain range.
The town was an important stop on the East Tennessee and Virginia Railroad, which connected the town to the larger cities of Knoxville and Bristol. The railroad brought economic growth to the area, and the town quickly grew in size and population.
In the late 19th century, Mountain City was a popular tourist destination, due to its scenic beauty and mild climate. The town was also known for its mineral springs, which were believed to have healing properties.
Geography
Mountain City is located in the northeastern corner of Tennessee, in Johnson County. It is situated in the foothills of the Appalachian Mountains, and is surrounded by the Cherokee National Forest. The town is located at an elevation of 1,890 feet, and has a total area of 2.2 square miles.
The town is located near the North Carolina border, and is approximately 30 miles from Boone, North Carolina. The nearest major city is Knoxville, which is located approximately 75 miles to the south.
Climate
Mountain City has a humid subtropical climate, with hot, humid summers and mild winters. The average annual temperature is 57 degrees Fahrenheit, and the average annual precipitation is 44 inches.
Economy
Mountain City’s economy is largely based on tourism and agriculture. The town is home to several tourist attractions, including the Mountain City Arts and Crafts Fair, which is held annually in August. The town is also home to several wineries, and is a popular destination for wine tasting.
Agriculture is also an important part of the local economy. The town is home to several farms, which produce a variety of crops, including corn, soybeans, and hay.
Demographics
As of the 2010 census, Mountain City had a population of 2,541 people. The racial makeup of the town was 97.3% White, 0.7% African American, 0.2% Native American, 0.3% Asian, 0.1% Pacific Islander, and 1.4% from other races.
The median household income in Mountain City was $30,938, and the median family income was $37,813. The per capita income was $17,845. Approximately 17.3% of the population was below the poverty line.
Common Questions
What is Per Capita Income in Mountain City?
Per Capita income in Mountain City is $22,866.
What is the Median Family Income in Mountain City?
Median Family Income in Mountain City is $57,750.
What is the Median Household income in Mountain City?
Median Household Income in Mountain City is $32,383.
What is Income or Wage Gap in Mountain City?
Income or Wage Gap in Mountain City is 7.3%.
Women in Mountain City earn 92.7 cents for every dollar earned by a man.
What is Inequality or Gini Index in Mountain City?
Inequality or Gini Index in Mountain City is 0.47.
What is the Total Population of Mountain City?
Total Population of Mountain City is 2,396.
What is the Total Male Population of Mountain City?
Total Male Population of Mountain City is 1,183.
What is the Total Female Population of Mountain City?
Total Female Population of Mountain City is 1,213.
What is the Ratio of Males per 100 Females in Mountain City?
There are 97.53 Males per 100 Females in Mountain City.
What is the Ratio of Females per 100 Males in Mountain City?
There are 102.54 Females per 100 Males in Mountain City.
What is the Median Population Age in Mountain City?
Median Population Age in Mountain City is 51.0 Years.
What is the Average Family Size in Mountain City
Average Family Size in Mountain City is 3.0 People.
What is the Average Household Size in Mountain City
Average Household Size in Mountain City is 2.1 People.
How Large is the Labor Force in Mountain City?
There are 835 People in the Labor Forcein in Mountain City.
What is the Percentage of People in the Labor Force in Mountain City?
41.8% of People are in the Labor Force in Mountain City.
What is the Unemployment Rate in Mountain City?
Unemployment Rate in Mountain City is 9.1%.