Siler City, NC Map & Demographics
Siler City Map
Siler City Overview
$27,875
PER CAPITA INCOME
$49,900
AVG FAMILY INCOME
$48,374
AVG HOUSEHOLD INCOME
3.4%
WAGE / INCOME GAP [ % ]
96.6¢/ $1
WAGE / INCOME GAP [ $ ]
0.53
INEQUALITY / GINI INDEX
7,847
TOTAL POPULATION
3,623
MALE POPULATION
4,224
FEMALE POPULATION
85.77
MALES / 100 FEMALES
116.59
FEMALES / 100 MALES
37.3
MEDIAN AGE
3.3
AVG FAMILY SIZE
2.7
AVG HOUSEHOLD SIZE
3,645
LABOR FORCE [ PEOPLE ]
60.4%
PERCENT IN LABOR FORCE
2.8%
UNEMPLOYMENT RATE
Siler City Zip Codes
Siler City Area Codes
Income in Siler City
Income Overview in Siler City
Per Capita Income in Siler City is $27,875, while median incomes of families and households are $49,900 and $48,374 respectively.
| Characteristic | Number | Measure |
| Per Capita Income | 7,847 | $27,875 |
| Median Family Income | 1,712 | $49,900 |
| Mean Family Income | 1,712 | $81,347 |
| Median Household Income | 2,805 | $48,374 |
| Mean Household Income | 2,805 | $73,261 |
| Income Deficit | 1,712 | $0 |
| Wage / Income Gap (%) | 7,847 | 3.39% |
| Wage / Income Gap ($) | 7,847 | 96.61¢ per $1 |
| Gini / Inequality Index | 7,847 | 0.53 |
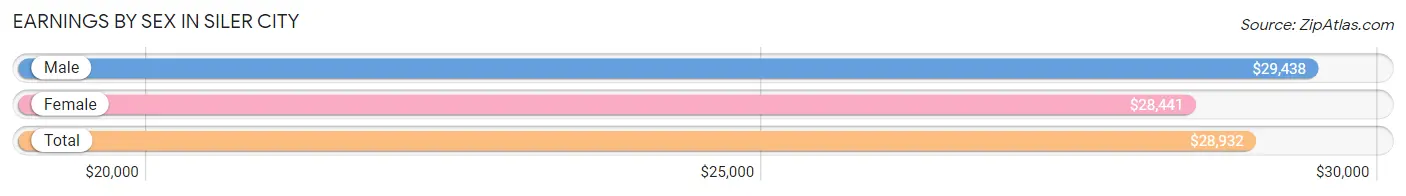
Earnings by Sex in Siler City
Average Earnings in Siler City are $28,932, $29,438 for men and $28,441 for women, a difference of 3.4%.
| Sex | Number | Average Earnings |
| Male | 2,104 (57.1%) | $29,438 |
| Female | 1,583 (42.9%) | $28,441 |
| Total | 3,687 (100.0%) | $28,932 |
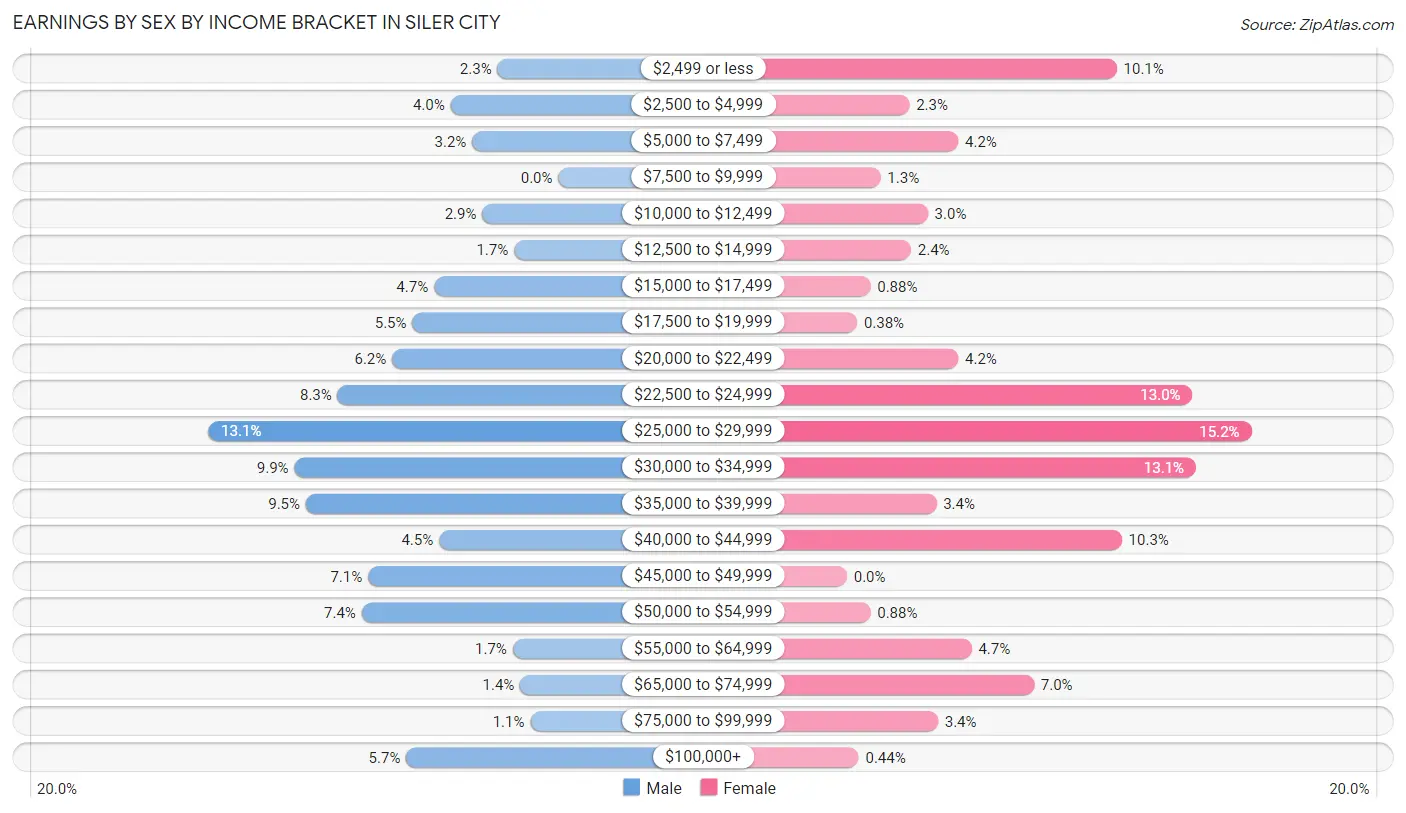
Earnings by Sex by Income Bracket in Siler City
The most common earnings brackets in Siler City are $25,000 to $29,999 for men (276 | 13.1%) and $25,000 to $29,999 for women (240 | 15.2%).
| Income | Male | Female |
| $2,499 or less | 48 (2.3%) | 160 (10.1%) |
| $2,500 to $4,999 | 85 (4.0%) | 37 (2.3%) |
| $5,000 to $7,499 | 68 (3.2%) | 66 (4.2%) |
| $7,500 to $9,999 | 0 (0.0%) | 20 (1.3%) |
| $10,000 to $12,499 | 60 (2.9%) | 48 (3.0%) |
| $12,500 to $14,999 | 35 (1.7%) | 38 (2.4%) |
| $15,000 to $17,499 | 98 (4.7%) | 14 (0.9%) |
| $17,500 to $19,999 | 115 (5.5%) | 6 (0.4%) |
| $20,000 to $22,499 | 131 (6.2%) | 66 (4.2%) |
| $22,500 to $24,999 | 174 (8.3%) | 205 (13.0%) |
| $25,000 to $29,999 | 276 (13.1%) | 240 (15.2%) |
| $30,000 to $34,999 | 208 (9.9%) | 207 (13.1%) |
| $35,000 to $39,999 | 199 (9.5%) | 53 (3.4%) |
| $40,000 to $44,999 | 94 (4.5%) | 163 (10.3%) |
| $45,000 to $49,999 | 150 (7.1%) | 0 (0.0%) |
| $50,000 to $54,999 | 155 (7.4%) | 14 (0.9%) |
| $55,000 to $64,999 | 36 (1.7%) | 74 (4.7%) |
| $65,000 to $74,999 | 30 (1.4%) | 111 (7.0%) |
| $75,000 to $99,999 | 22 (1.1%) | 54 (3.4%) |
| $100,000+ | 120 (5.7%) | 7 (0.4%) |
| Total | 2,104 (100.0%) | 1,583 (100.0%) |
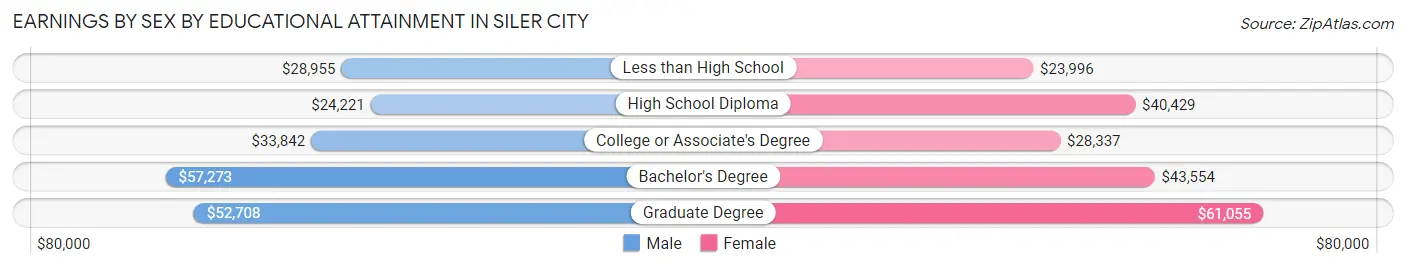
Earnings by Sex by Educational Attainment in Siler City
Average earnings in Siler City are $32,736 for men and $28,411 for women, a difference of 13.2%. Men with an educational attainment of bachelor's degree enjoy the highest average annual earnings of $57,273, while those with high school diploma education earn the least with $24,221. Women with an educational attainment of graduate degree earn the most with the average annual earnings of $61,055, while those with less than high school education have the smallest earnings of $23,996.
| Educational Attainment | Male Income | Female Income |
| Less than High School | $28,955 | $23,996 |
| High School Diploma | $24,221 | $40,429 |
| College or Associate's Degree | $33,842 | $28,337 |
| Bachelor's Degree | $57,273 | $43,554 |
| Graduate Degree | $52,708 | $61,055 |
| Total | $32,736 | $28,411 |
Family Income in Siler City
Family Income Brackets in Siler City
According to the Siler City family income data, there are 491 families falling into the $50,000 to $74,999 income range, which is the most common income bracket and makes up 28.7% of all families. Conversely, the $150,000 to $199,999 income bracket is the least frequent group with only 31 families (1.8%) belonging to this category.
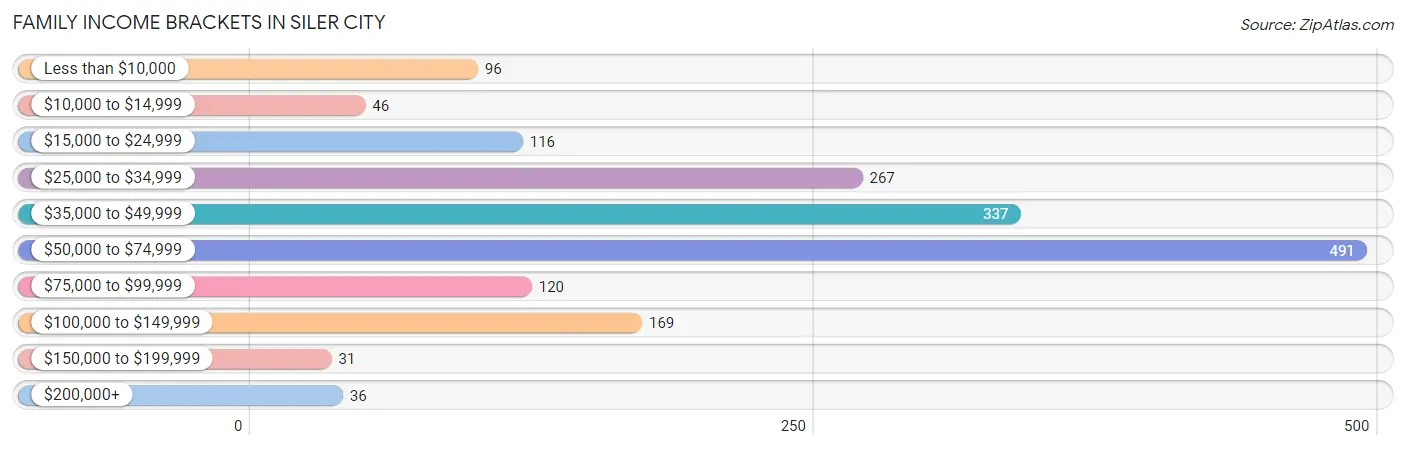
| Income Bracket | # Families | % Families |
| Less than $10,000 | 96 | 5.6% |
| $10,000 to $14,999 | 46 | 2.7% |
| $15,000 to $24,999 | 116 | 6.8% |
| $25,000 to $34,999 | 267 | 15.6% |
| $35,000 to $49,999 | 337 | 19.7% |
| $50,000 to $74,999 | 491 | 28.7% |
| $75,000 to $99,999 | 120 | 7.0% |
| $100,000 to $149,999 | 169 | 9.9% |
| $150,000 to $199,999 | 31 | 1.8% |
| $200,000+ | 36 | 2.1% |
Family Income by Famaliy Size in Siler City
3-person families (464 | 27.1%) account for the highest median family income in Siler City with $65,357 per family, while 2-person families (576 | 33.6%) have the highest median income of $28,058 per family member.
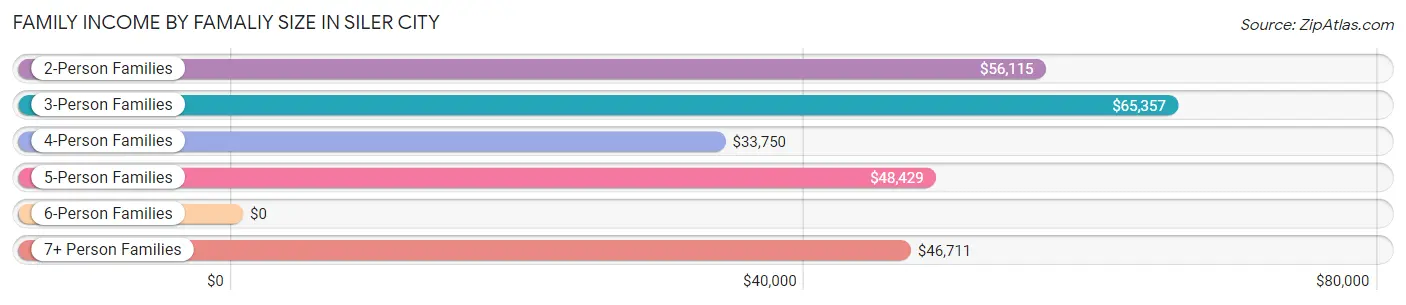
| Income Bracket | # Families | Median Income |
| 2-Person Families | 576 (33.6%) | $56,115 |
| 3-Person Families | 464 (27.1%) | $65,357 |
| 4-Person Families | 98 (5.7%) | $33,750 |
| 5-Person Families | 434 (25.4%) | $48,429 |
| 6-Person Families | 78 (4.6%) | $0 |
| 7+ Person Families | 62 (3.6%) | $46,711 |
| Total | 1,712 (100.0%) | $49,900 |
Family Income by Number of Earners in Siler City
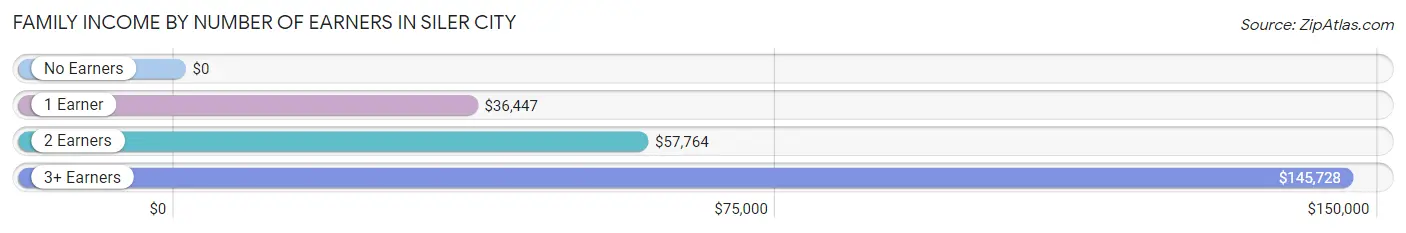
| Number of Earners | # Families | Median Income |
| No Earners | 175 (10.2%) | $0 |
| 1 Earner | 550 (32.1%) | $36,447 |
| 2 Earners | 824 (48.1%) | $57,764 |
| 3+ Earners | 163 (9.5%) | $145,728 |
| Total | 1,712 (100.0%) | $49,900 |
Household Income in Siler City
Household Income Brackets in Siler City
With 586 households falling in the category, the $50,000 to $74,999 income range is the most frequent in Siler City, accounting for 20.9% of all households. In contrast, only 87 households (3.1%) fall into the $200,000+ income bracket, making it the least populous group.
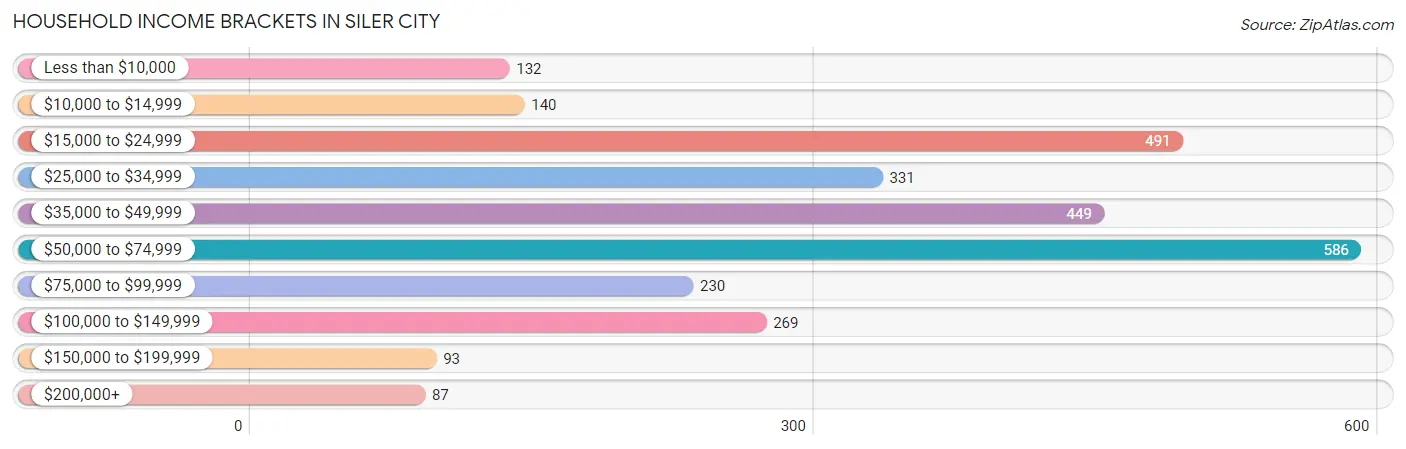
| Income Bracket | # Households | % Households |
| Less than $10,000 | 132 | 4.7% |
| $10,000 to $14,999 | 140 | 5.0% |
| $15,000 to $24,999 | 491 | 17.5% |
| $25,000 to $34,999 | 331 | 11.8% |
| $35,000 to $49,999 | 449 | 16.0% |
| $50,000 to $74,999 | 586 | 20.9% |
| $75,000 to $99,999 | 230 | 8.2% |
| $100,000 to $149,999 | 269 | 9.6% |
| $150,000 to $199,999 | 93 | 3.3% |
| $200,000+ | 87 | 3.1% |
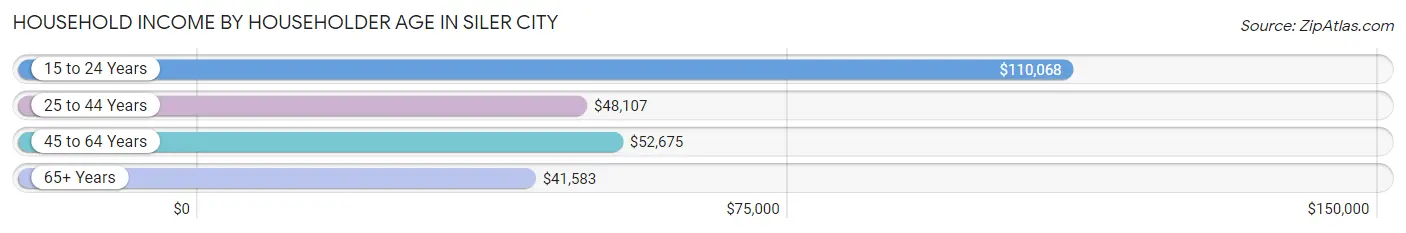
Household Income by Householder Age in Siler City
The median household income in Siler City is $48,374, with the highest median household income of $110,068 found in the 15 to 24 years age bracket for the primary householder. A total of 162 households (5.8%) fall into this category. Meanwhile, the 65+ years age bracket for the primary householder has the lowest median household income of $41,583, with 775 households (27.6%) in this group.
| Income Bracket | # Households | Median Income |
| 15 to 24 Years | 162 (5.8%) | $110,068 |
| 25 to 44 Years | 880 (31.4%) | $48,107 |
| 45 to 64 Years | 988 (35.2%) | $52,675 |
| 65+ Years | 775 (27.6%) | $41,583 |
| Total | 2,805 (100.0%) | $48,374 |
Poverty in Siler City
Income Below Poverty by Sex and Age in Siler City
With 27.0% poverty level for males and 30.5% for females among the residents of Siler City, 15 year old males and 12 to 14 year old females are the most vulnerable to poverty, with 34 males (58.6%) and 86 females (72.9%) in their respective age groups living below the poverty level.
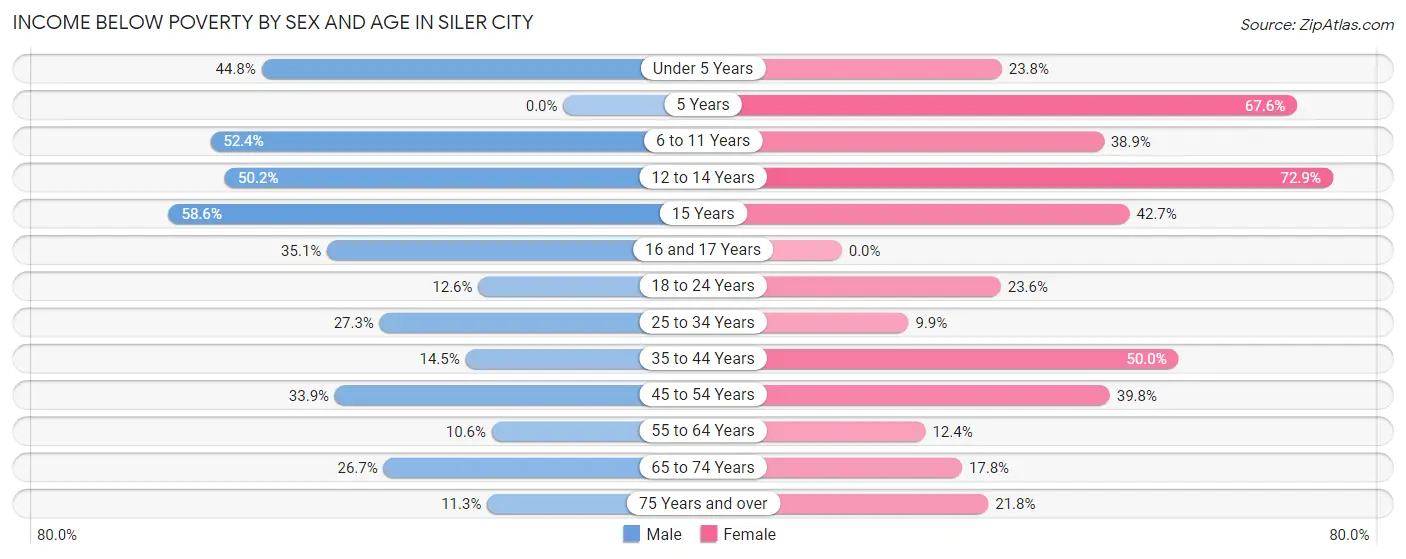
| Age Bracket | Male | Female |
| Under 5 Years | 69 (44.8%) | 43 (23.8%) |
| 5 Years | 0 (0.0%) | 98 (67.6%) |
| 6 to 11 Years | 119 (52.4%) | 203 (38.9%) |
| 12 to 14 Years | 115 (50.2%) | 86 (72.9%) |
| 15 Years | 34 (58.6%) | 47 (42.7%) |
| 16 and 17 Years | 47 (35.1%) | 0 (0.0%) |
| 18 to 24 Years | 27 (12.6%) | 115 (23.6%) |
| 25 to 34 Years | 99 (27.3%) | 40 (9.9%) |
| 35 to 44 Years | 95 (14.5%) | 268 (50.0%) |
| 45 to 54 Years | 231 (33.9%) | 162 (39.8%) |
| 55 to 64 Years | 48 (10.6%) | 43 (12.4%) |
| 65 to 74 Years | 55 (26.7%) | 48 (17.8%) |
| 75 Years and over | 20 (11.3%) | 77 (21.7%) |
| Total | 959 (27.0%) | 1,230 (30.5%) |
Income Above Poverty by Sex and Age in Siler City
According to the poverty statistics in Siler City, males aged 55 to 64 years and females aged 16 and 17 years are the age groups that are most secure financially, with 89.4% of males and 100.0% of females in these age groups living above the poverty line.
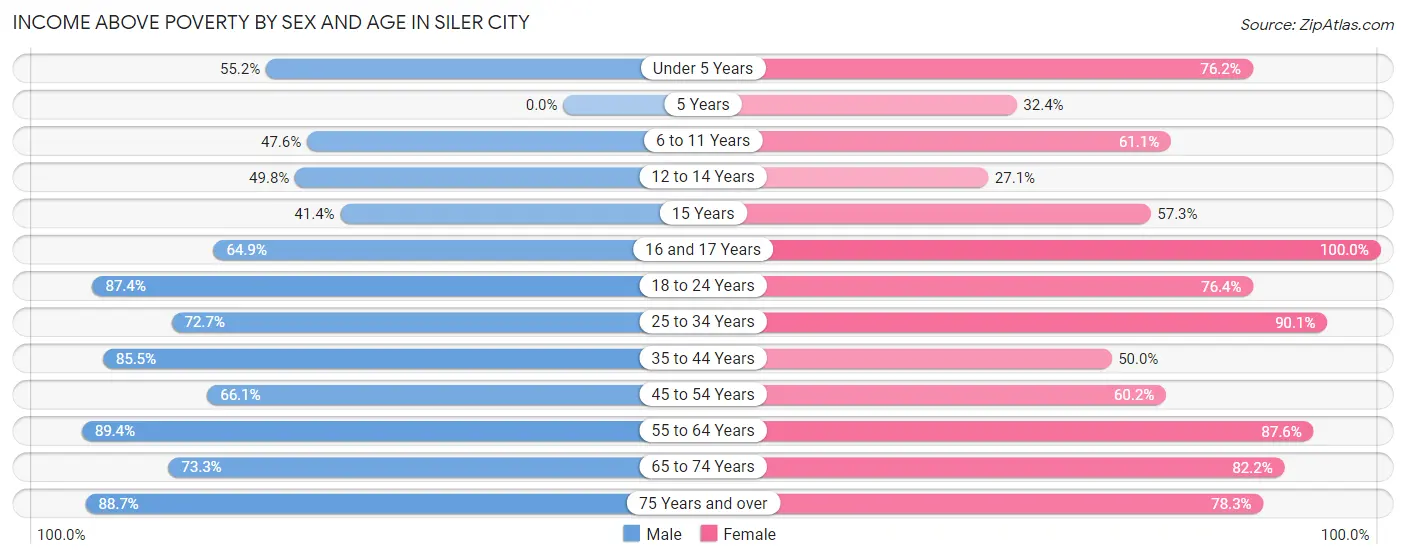
| Age Bracket | Male | Female |
| Under 5 Years | 85 (55.2%) | 138 (76.2%) |
| 5 Years | 0 (0.0%) | 47 (32.4%) |
| 6 to 11 Years | 108 (47.6%) | 319 (61.1%) |
| 12 to 14 Years | 114 (49.8%) | 32 (27.1%) |
| 15 Years | 24 (41.4%) | 63 (57.3%) |
| 16 and 17 Years | 87 (64.9%) | 158 (100.0%) |
| 18 to 24 Years | 187 (87.4%) | 372 (76.4%) |
| 25 to 34 Years | 264 (72.7%) | 364 (90.1%) |
| 35 to 44 Years | 559 (85.5%) | 268 (50.0%) |
| 45 to 54 Years | 450 (66.1%) | 245 (60.2%) |
| 55 to 64 Years | 404 (89.4%) | 303 (87.6%) |
| 65 to 74 Years | 151 (73.3%) | 221 (82.2%) |
| 75 Years and over | 157 (88.7%) | 277 (78.2%) |
| Total | 2,590 (73.0%) | 2,807 (69.5%) |
Income Below Poverty Among Married-Couple Families in Siler City
The poverty statistics for married-couple families in Siler City show that 18.1% or 192 of the total 1,059 families live below the poverty line. Families with 3 or 4 children have the highest poverty rate of 71.5%, comprising of 93 families. On the other hand, families with no children have the lowest poverty rate of 0.0%, which includes 0 families.
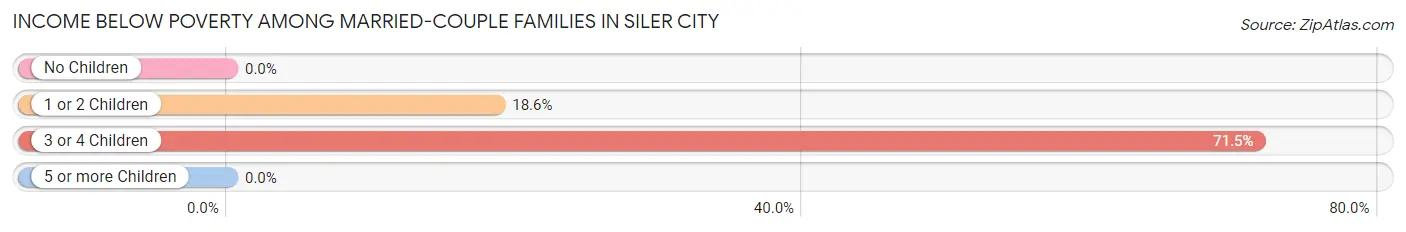
| Children | Above Poverty | Below Poverty |
| No Children | 372 (100.0%) | 0 (0.0%) |
| 1 or 2 Children | 433 (81.4%) | 99 (18.6%) |
| 3 or 4 Children | 37 (28.5%) | 93 (71.5%) |
| 5 or more Children | 25 (100.0%) | 0 (0.0%) |
| Total | 867 (81.9%) | 192 (18.1%) |
Income Below Poverty Among Single-Parent Households in Siler City
According to the poverty data in Siler City, 14.7% or 18 single-father households and 38.8% or 206 single-mother households are living below the poverty line. Among single-father households, those with 5 or more children have the highest poverty rate, with 18 households (100.0%) experiencing poverty. Likewise, among single-mother households, those with 1 or 2 children have the highest poverty rate, with 140 households (67.3%) falling below the poverty line.
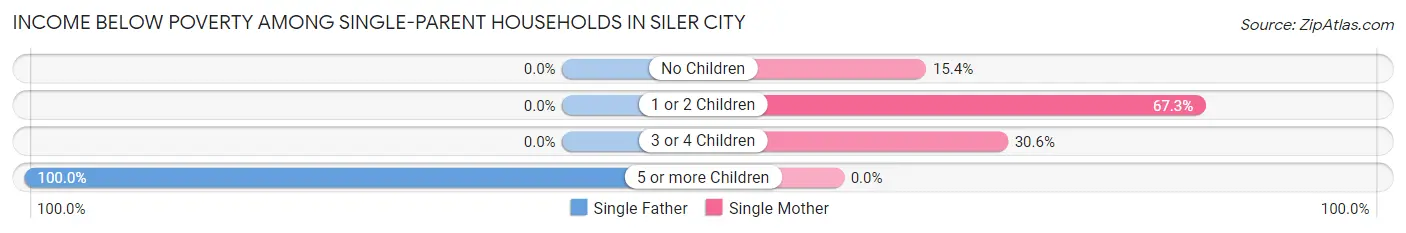
| Children | Single Father | Single Mother |
| No Children | 0 (0.0%) | 33 (15.3%) |
| 1 or 2 Children | 0 (0.0%) | 140 (67.3%) |
| 3 or 4 Children | 0 (0.0%) | 33 (30.6%) |
| 5 or more Children | 18 (100.0%) | 0 (0.0%) |
| Total | 18 (14.7%) | 206 (38.8%) |
Income Below Poverty Among Married-Couple vs Single-Parent Households in Siler City
The poverty data for Siler City shows that 192 of the married-couple family households (18.1%) and 224 of the single-parent households (34.3%) are living below the poverty level. Within the married-couple family households, those with 3 or 4 children have the highest poverty rate, with 93 households (71.5%) falling below the poverty line. Among the single-parent households, those with 5 or more children have the highest poverty rate, with 18 household (100.0%) living below poverty.
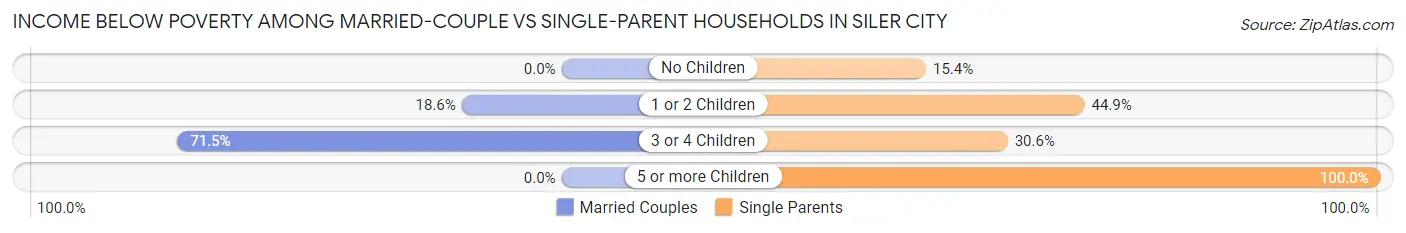
| Children | Married-Couple Families | Single-Parent Households |
| No Children | 0 (0.0%) | 33 (15.3%) |
| 1 or 2 Children | 99 (18.6%) | 140 (44.9%) |
| 3 or 4 Children | 93 (71.5%) | 33 (30.6%) |
| 5 or more Children | 0 (0.0%) | 18 (100.0%) |
| Total | 192 (18.1%) | 224 (34.3%) |
Race in Siler City
The most populous races in Siler City are Hispanic or Latino (3,929 | 50.1%), White / Caucasian (3,540 | 45.1%), and Some other Race (2,397 | 30.5%).
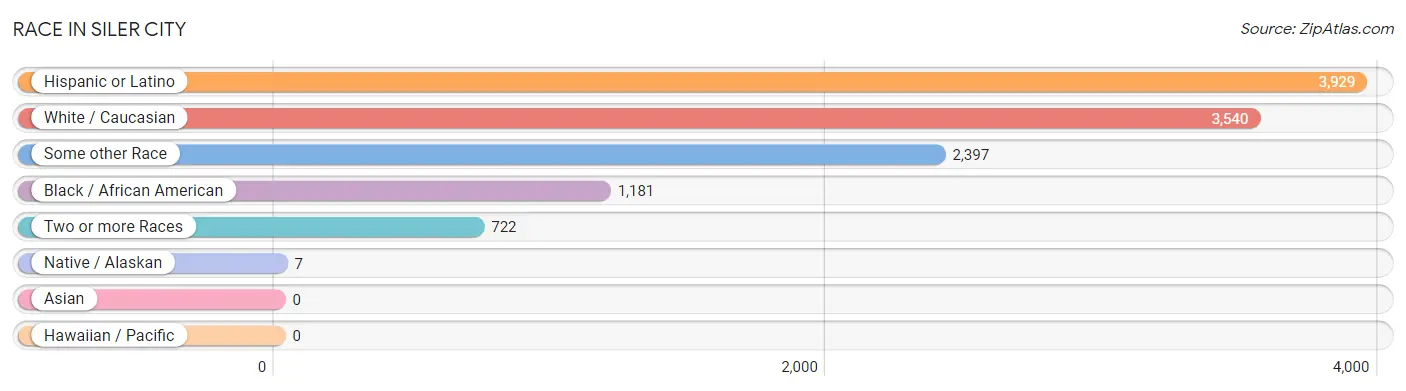
| Race | # Population | % Population |
| Asian | 0 | 0.0% |
| Black / African American | 1,181 | 15.0% |
| Hawaiian / Pacific | 0 | 0.0% |
| Hispanic or Latino | 3,929 | 50.1% |
| Native / Alaskan | 7 | 0.1% |
| White / Caucasian | 3,540 | 45.1% |
| Two or more Races | 722 | 9.2% |
| Some other Race | 2,397 | 30.5% |
| Total | 7,847 | 100.0% |
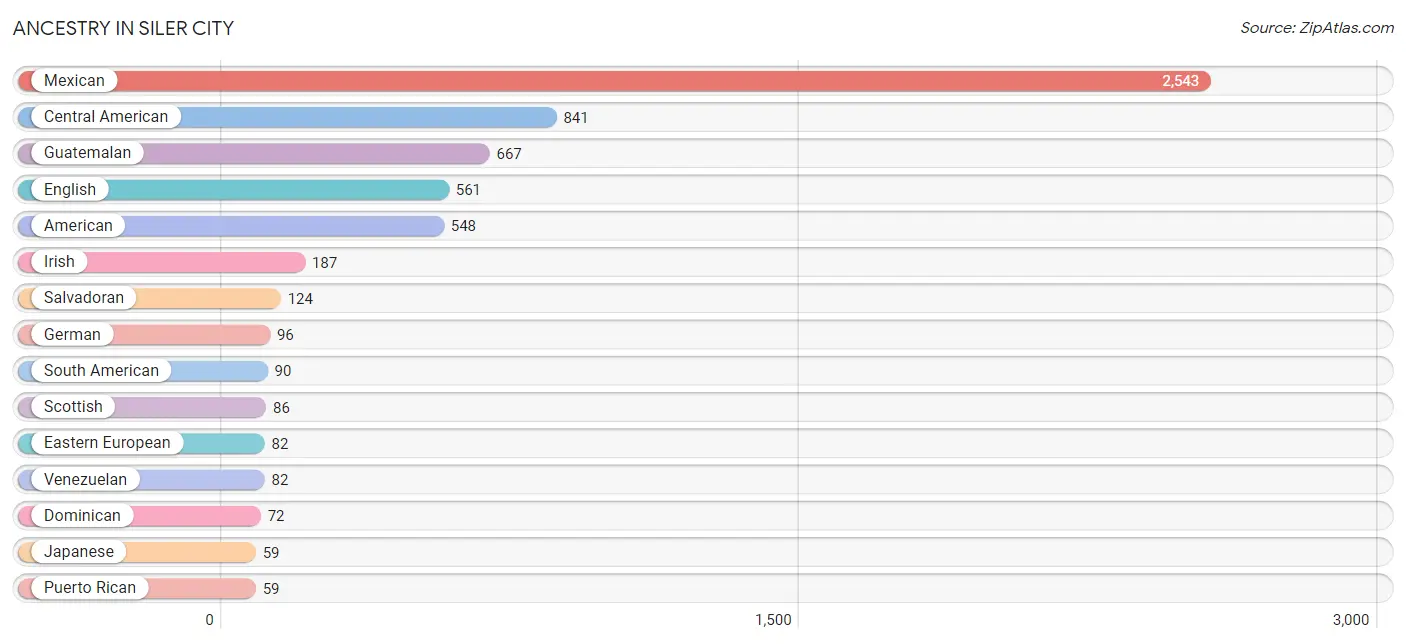
Ancestry in Siler City
The most populous ancestries reported in Siler City are Mexican (2,543 | 32.4%), Central American (841 | 10.7%), Guatemalan (667 | 8.5%), English (561 | 7.1%), and American (548 | 7.0%), together accounting for 65.8% of all Siler City residents.
| Ancestry | # Population | % Population |
| African | 9 | 0.1% |
| American | 548 | 7.0% |
| Austrian | 7 | 0.1% |
| Blackfeet | 14 | 0.2% |
| British | 26 | 0.3% |
| Central American | 841 | 10.7% |
| Cherokee | 34 | 0.4% |
| Colombian | 8 | 0.1% |
| Dominican | 72 | 0.9% |
| Dutch | 40 | 0.5% |
| Eastern European | 82 | 1.0% |
| English | 561 | 7.1% |
| European | 51 | 0.6% |
| French | 37 | 0.5% |
| German | 96 | 1.2% |
| Guatemalan | 667 | 8.5% |
| Honduran | 50 | 0.6% |
| Irish | 187 | 2.4% |
| Italian | 33 | 0.4% |
| Japanese | 59 | 0.7% |
| Mexican | 2,543 | 32.4% |
| Mexican American Indian | 7 | 0.1% |
| Polish | 38 | 0.5% |
| Puerto Rican | 59 | 0.7% |
| Salvadoran | 124 | 1.6% |
| Scandinavian | 6 | 0.1% |
| Scotch-Irish | 42 | 0.5% |
| Scottish | 86 | 1.1% |
| South American | 90 | 1.1% |
| Subsaharan African | 9 | 0.1% |
| Venezuelan | 82 | 1.0% | View All 31 Rows |
Immigrants in Siler City
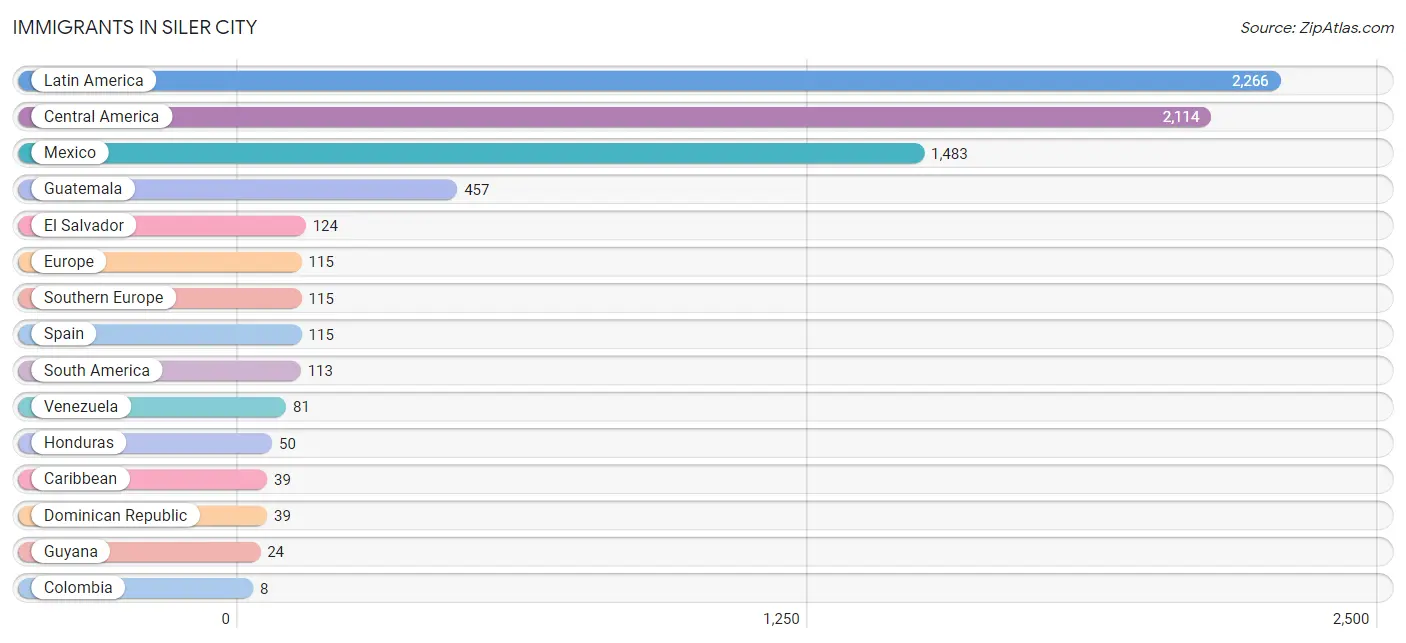
The most numerous immigrant groups reported in Siler City came from Latin America (2,266 | 28.9%), Central America (2,114 | 26.9%), Mexico (1,483 | 18.9%), Guatemala (457 | 5.8%), and El Salvador (124 | 1.6%), together accounting for 82.1% of all Siler City residents.
| Immigration Origin | # Population | % Population |
| Caribbean | 39 | 0.5% |
| Central America | 2,114 | 26.9% |
| Colombia | 8 | 0.1% |
| Dominican Republic | 39 | 0.5% |
| El Salvador | 124 | 1.6% |
| Europe | 115 | 1.5% |
| Guatemala | 457 | 5.8% |
| Guyana | 24 | 0.3% |
| Honduras | 50 | 0.6% |
| Latin America | 2,266 | 28.9% |
| Mexico | 1,483 | 18.9% |
| South America | 113 | 1.4% |
| Southern Europe | 115 | 1.5% |
| Spain | 115 | 1.5% |
| Venezuela | 81 | 1.0% | View All 15 Rows |
Sex and Age in Siler City
Sex and Age in Siler City
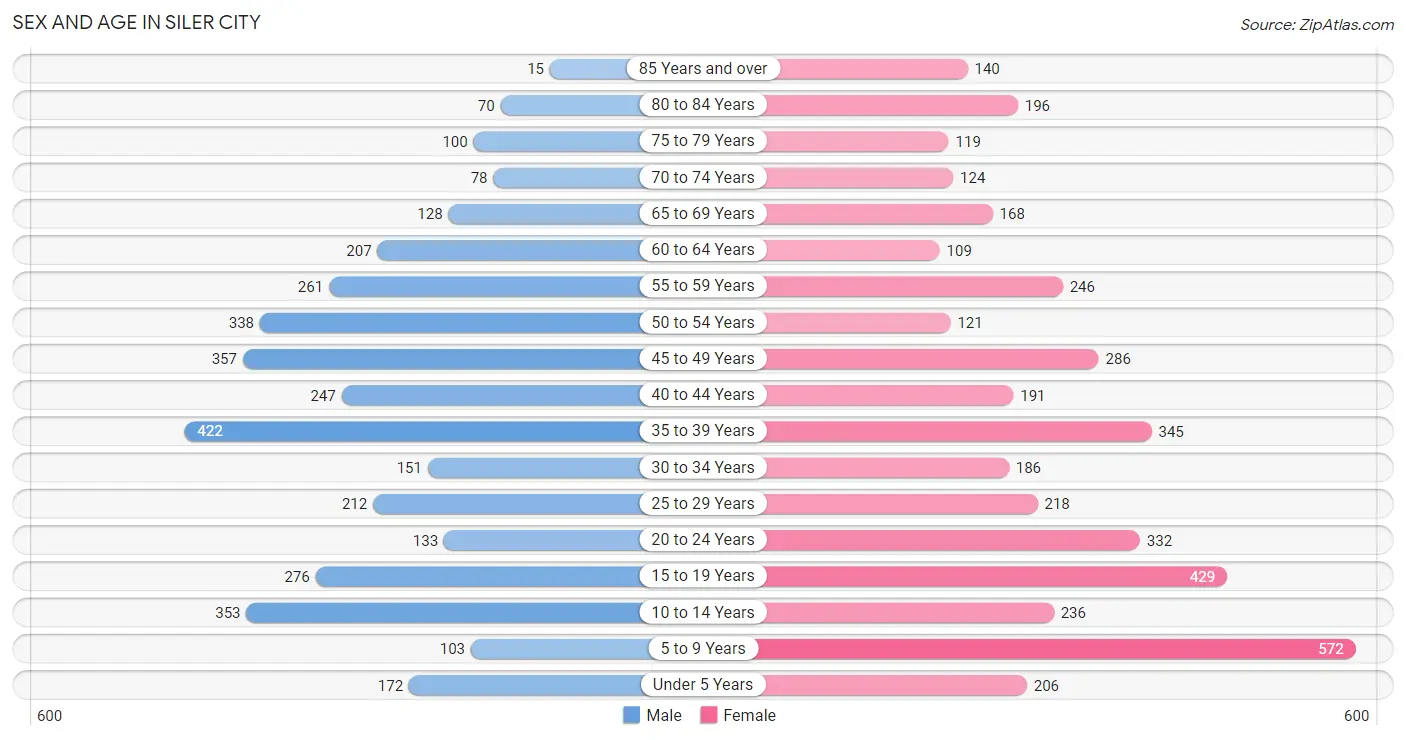
The most populous age groups in Siler City are 35 to 39 Years (422 | 11.7%) for men and 5 to 9 Years (572 | 13.5%) for women.
| Age Bracket | Male | Female |
| Under 5 Years | 172 (4.8%) | 206 (4.9%) |
| 5 to 9 Years | 103 (2.8%) | 572 (13.5%) |
| 10 to 14 Years | 353 (9.7%) | 236 (5.6%) |
| 15 to 19 Years | 276 (7.6%) | 429 (10.2%) |
| 20 to 24 Years | 133 (3.7%) | 332 (7.9%) |
| 25 to 29 Years | 212 (5.9%) | 218 (5.2%) |
| 30 to 34 Years | 151 (4.2%) | 186 (4.4%) |
| 35 to 39 Years | 422 (11.7%) | 345 (8.2%) |
| 40 to 44 Years | 247 (6.8%) | 191 (4.5%) |
| 45 to 49 Years | 357 (9.9%) | 286 (6.8%) |
| 50 to 54 Years | 338 (9.3%) | 121 (2.9%) |
| 55 to 59 Years | 261 (7.2%) | 246 (5.8%) |
| 60 to 64 Years | 207 (5.7%) | 109 (2.6%) |
| 65 to 69 Years | 128 (3.5%) | 168 (4.0%) |
| 70 to 74 Years | 78 (2.1%) | 124 (2.9%) |
| 75 to 79 Years | 100 (2.8%) | 119 (2.8%) |
| 80 to 84 Years | 70 (1.9%) | 196 (4.6%) |
| 85 Years and over | 15 (0.4%) | 140 (3.3%) |
| Total | 3,623 (100.0%) | 4,224 (100.0%) |
Families and Households in Siler City
Median Family Size in Siler City
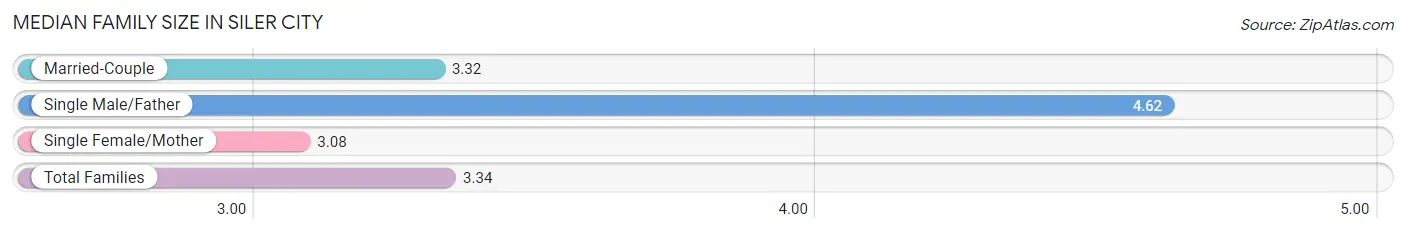
The median family size in Siler City is 3.34 persons per family, with single male/father families (122 | 7.1%) accounting for the largest median family size of 4.62 persons per family. On the other hand, single female/mother families (531 | 31.0%) represent the smallest median family size with 3.08 persons per family.
| Family Type | # Families | Family Size |
| Married-Couple | 1,059 (61.9%) | 3.32 |
| Single Male/Father | 122 (7.1%) | 4.62 |
| Single Female/Mother | 531 (31.0%) | 3.08 |
| Total Families | 1,712 (100.0%) | 3.34 |
Median Household Size in Siler City
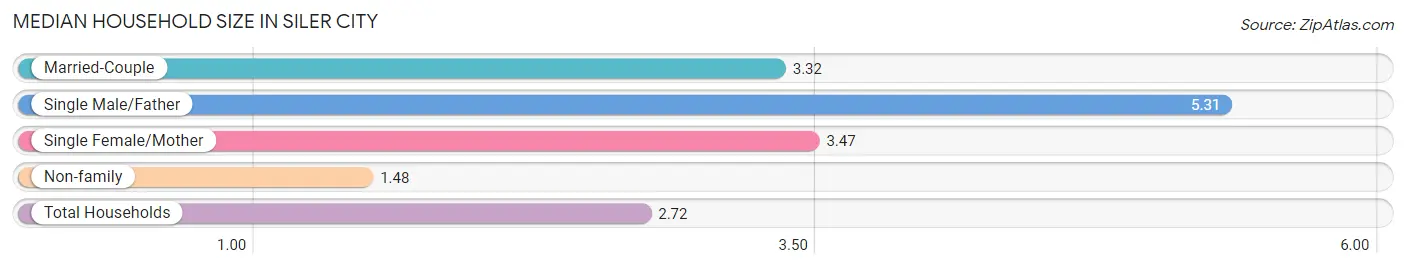
The median household size in Siler City is 2.72 persons per household, with single male/father households (122 | 4.3%) accounting for the largest median household size of 5.31 persons per household. non-family households (1,093 | 39.0%) represent the smallest median household size with 1.48 persons per household.
| Household Type | # Households | Household Size |
| Married-Couple | 1,059 (37.8%) | 3.32 |
| Single Male/Father | 122 (4.3%) | 5.31 |
| Single Female/Mother | 531 (18.9%) | 3.47 |
| Non-family | 1,093 (39.0%) | 1.48 |
| Total Households | 2,805 (100.0%) | 2.72 |
Household Size by Marriage Status in Siler City
Out of a total of 2,805 households in Siler City, 1,712 (61.0%) are family households, while 1,093 (39.0%) are nonfamily households. The most numerous type of family households are 3-person households, comprising 506, and the most common type of nonfamily households are 1-person households, comprising 836.
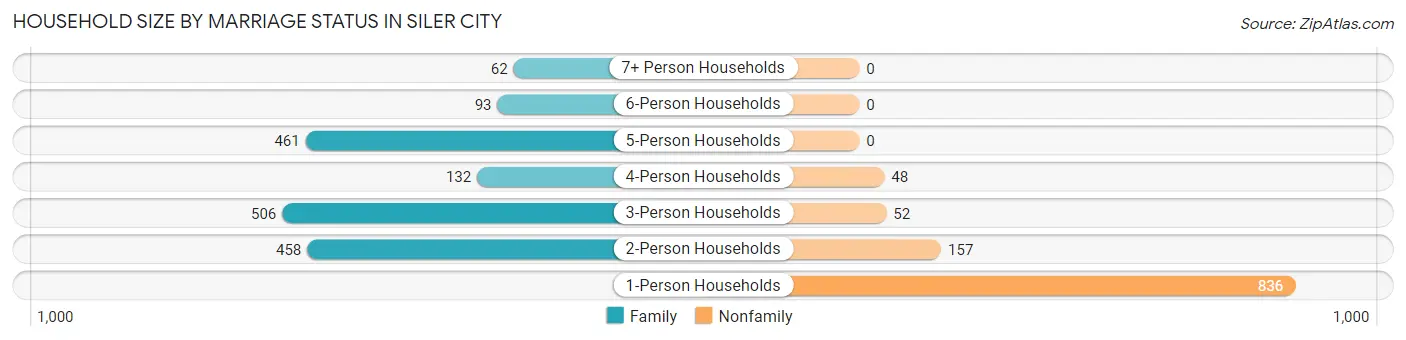
| Household Size | Family Households | Nonfamily Households |
| 1-Person Households | - | 836 (29.8%) |
| 2-Person Households | 458 (16.3%) | 157 (5.6%) |
| 3-Person Households | 506 (18.0%) | 52 (1.8%) |
| 4-Person Households | 132 (4.7%) | 48 (1.7%) |
| 5-Person Households | 461 (16.4%) | 0 (0.0%) |
| 6-Person Households | 93 (3.3%) | 0 (0.0%) |
| 7+ Person Households | 62 (2.2%) | 0 (0.0%) |
| Total | 1,712 (61.0%) | 1,093 (39.0%) |
Female Fertility in Siler City
Fertility by Age in Siler City
Average fertility rate in Siler City is 108.0 births per 1,000 women. Women in the age bracket of 20 to 34 years have the highest fertility rate with 182.0 births per 1,000 women. Women in the age bracket of 20 to 34 years acount for 62.3% of all women with births.
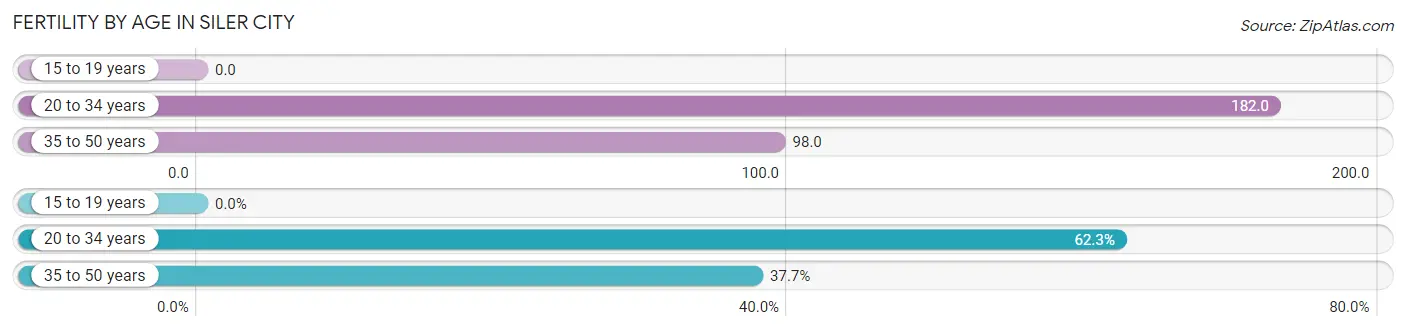
| Age Bracket | Women with Births | Births / 1,000 Women |
| 15 to 19 years | 0 (0.0%) | 0.0 |
| 20 to 34 years | 134 (62.3%) | 182.0 |
| 35 to 50 years | 81 (37.7%) | 98.0 |
| Total | 215 (100.0%) | 108.0 |
Fertility by Age by Marriage Status in Siler City
33.5% of women with births (215) in Siler City are married. The highest percentage of unmarried women with births falls into 20 to 34 years age bracket with 90.3% of them unmarried at the time of birth, while the lowest percentage of unmarried women with births belong to 35 to 50 years age bracket with 27.2% of them unmarried.
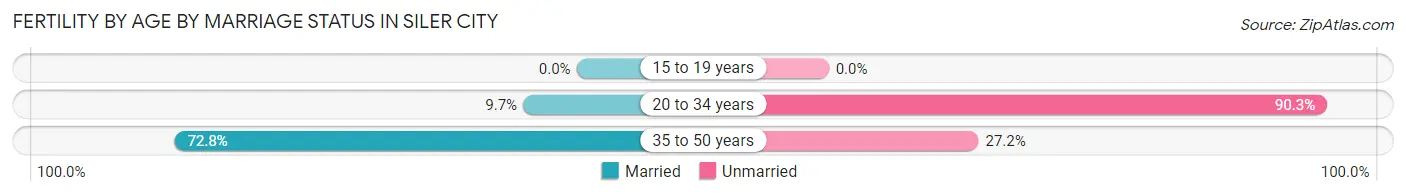
| Age Bracket | Married | Unmarried |
| 15 to 19 years | 0 (0.0%) | 0 (0.0%) |
| 20 to 34 years | 13 (9.7%) | 121 (90.3%) |
| 35 to 50 years | 59 (72.8%) | 22 (27.2%) |
| Total | 72 (33.5%) | 143 (66.5%) |
Fertility by Education in Siler City
Average fertility rate in Siler City is 108.0 births per 1,000 women. Women with the education attainment of graduate degree have the highest fertility rate of 1,000.0 births per 1,000 women, while women with the education attainment of college or associate's degree have the lowest fertility at 25.0 births per 1,000 women. Women with the education attainment of high school diploma represent 32.6% of all women with births.
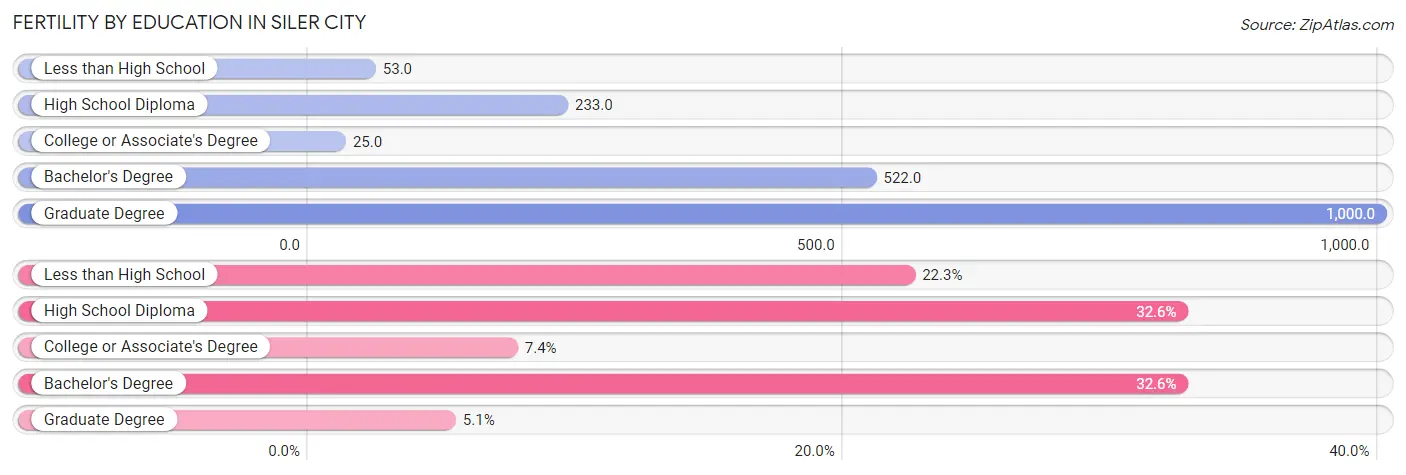
| Educational Attainment | Women with Births | Births / 1,000 Women |
| Less than High School | 48 (22.3%) | 53.0 |
| High School Diploma | 70 (32.6%) | 233.0 |
| College or Associate's Degree | 16 (7.4%) | 25.0 |
| Bachelor's Degree | 70 (32.6%) | 522.0 |
| Graduate Degree | 11 (5.1%) | 1,000.0 |
| Total | 215 (100.0%) | 108.0 |
Fertility by Education by Marriage Status in Siler City
66.5% of women with births in Siler City are unmarried. Women with the educational attainment of less than high school are most likely to be married with 100.0% of them married at childbirth, while women with the educational attainment of college or associate's degree are least likely to be married with 100.0% of them unmarried at childbirth.
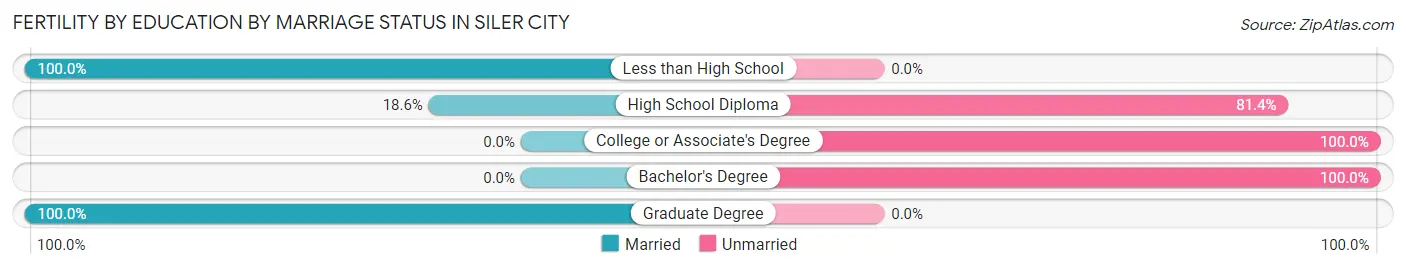
| Educational Attainment | Married | Unmarried |
| Less than High School | 48 (100.0%) | 0 (0.0%) |
| High School Diploma | 13 (18.6%) | 57 (81.4%) |
| College or Associate's Degree | 0 (0.0%) | 16 (100.0%) |
| Bachelor's Degree | 0 (0.0%) | 70 (100.0%) |
| Graduate Degree | 11 (100.0%) | 0 (0.0%) |
| Total | 72 (33.5%) | 143 (66.5%) |
Employment Characteristics in Siler City
Employment by Class of Employer in Siler City
Among the 3,468 employed individuals in Siler City, private company employees (2,406 | 69.4%), not-for-profit organizations (315 | 9.1%), and self-employed (incorporated) (212 | 6.1%) make up the most common classes of employment.
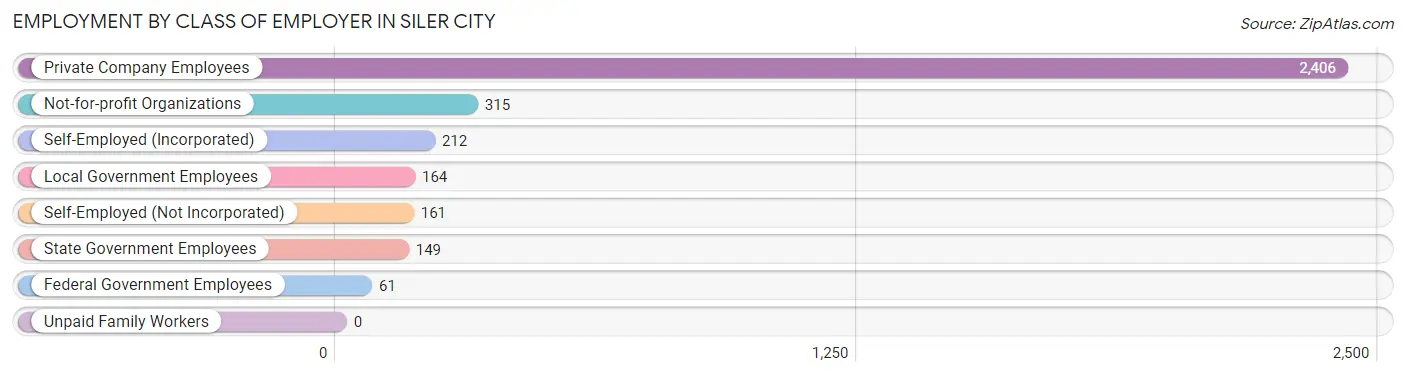
| Employer Class | # Employees | % Employees |
| Private Company Employees | 2,406 | 69.4% |
| Self-Employed (Incorporated) | 212 | 6.1% |
| Self-Employed (Not Incorporated) | 161 | 4.6% |
| Not-for-profit Organizations | 315 | 9.1% |
| Local Government Employees | 164 | 4.7% |
| State Government Employees | 149 | 4.3% |
| Federal Government Employees | 61 | 1.8% |
| Unpaid Family Workers | 0 | 0.0% |
| Total | 3,468 | 100.0% |
Employment Status by Age in Siler City
According to the labor force statistics for Siler City, out of the total population over 16 years of age (6,035), 60.4% or 3,645 individuals are in the labor force, with 2.8% or 102 of them unemployed. The age group with the highest labor force participation rate is 25 to 29 years, with 100.0% or 430 individuals in the labor force. Within the labor force, the 16 to 19 years age range has the highest percentage of unemployed individuals, with 19.7% or 34 of them being unemployed.
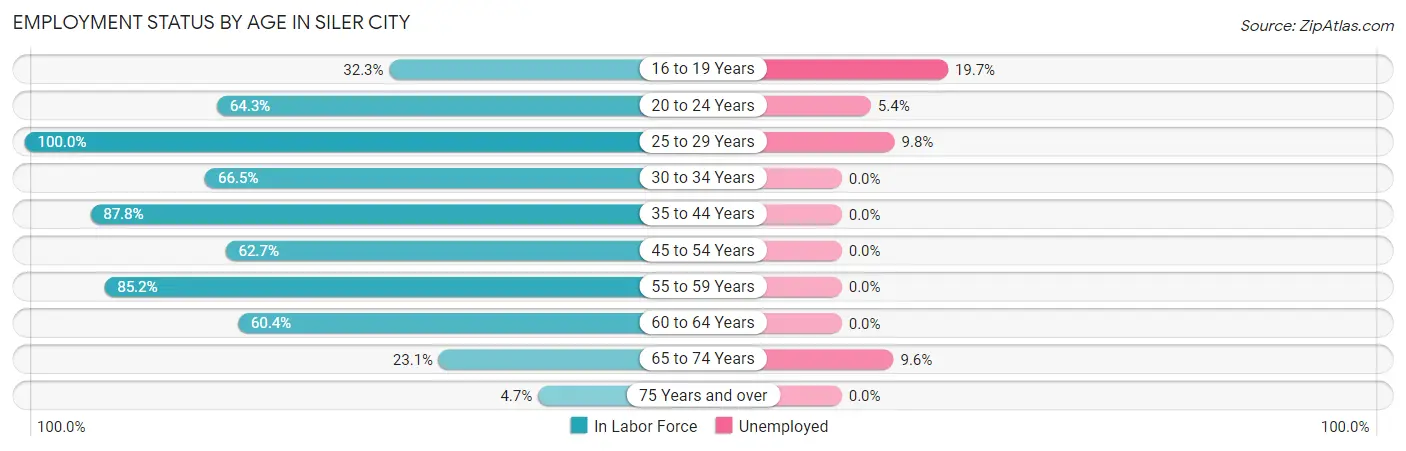
| Age Bracket | In Labor Force | Unemployed |
| 16 to 19 Years | 173 (32.3%) | 34 (19.7%) |
| 20 to 24 Years | 299 (64.3%) | 16 (5.4%) |
| 25 to 29 Years | 430 (100.0%) | 42 (9.8%) |
| 30 to 34 Years | 224 (66.5%) | 0 (0.0%) |
| 35 to 44 Years | 1,058 (87.8%) | 0 (0.0%) |
| 45 to 54 Years | 691 (62.7%) | 0 (0.0%) |
| 55 to 59 Years | 432 (85.2%) | 0 (0.0%) |
| 60 to 64 Years | 191 (60.4%) | 0 (0.0%) |
| 65 to 74 Years | 115 (23.1%) | 11 (9.6%) |
| 75 Years and over | 30 (4.7%) | 0 (0.0%) |
| Total | 3,645 (60.4%) | 102 (2.8%) |
Employment Status by Educational Attainment in Siler City
According to labor force statistics for Siler City, 77.6% of individuals (3,024) out of the total population between 25 and 64 years of age (3,897) are in the labor force, with 1.4% or 42 of them being unemployed. The group with the highest labor force participation rate are those with the educational attainment of bachelor's degree or higher, with 90.2% or 505 individuals in the labor force. Within the labor force, individuals with high school diploma education have the highest percentage of unemployment, with 3.8% or 24 of them being unemployed.
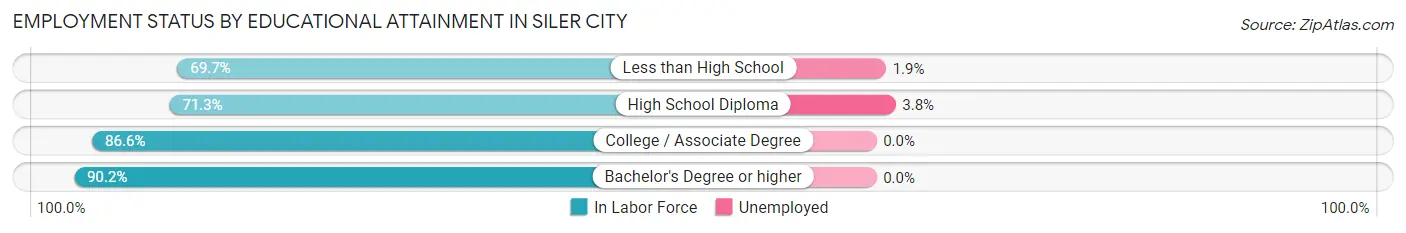
| Educational Attainment | In Labor Force | Unemployed |
| Less than High School | 962 (69.7%) | 26 (1.9%) |
| High School Diploma | 633 (71.3%) | 34 (3.8%) |
| College / Associate Degree | 926 (86.6%) | 0 (0.0%) |
| Bachelor's Degree or higher | 505 (90.2%) | 0 (0.0%) |
| Total | 3,024 (77.6%) | 55 (1.4%) |
Employment Occupations by Sex in Siler City
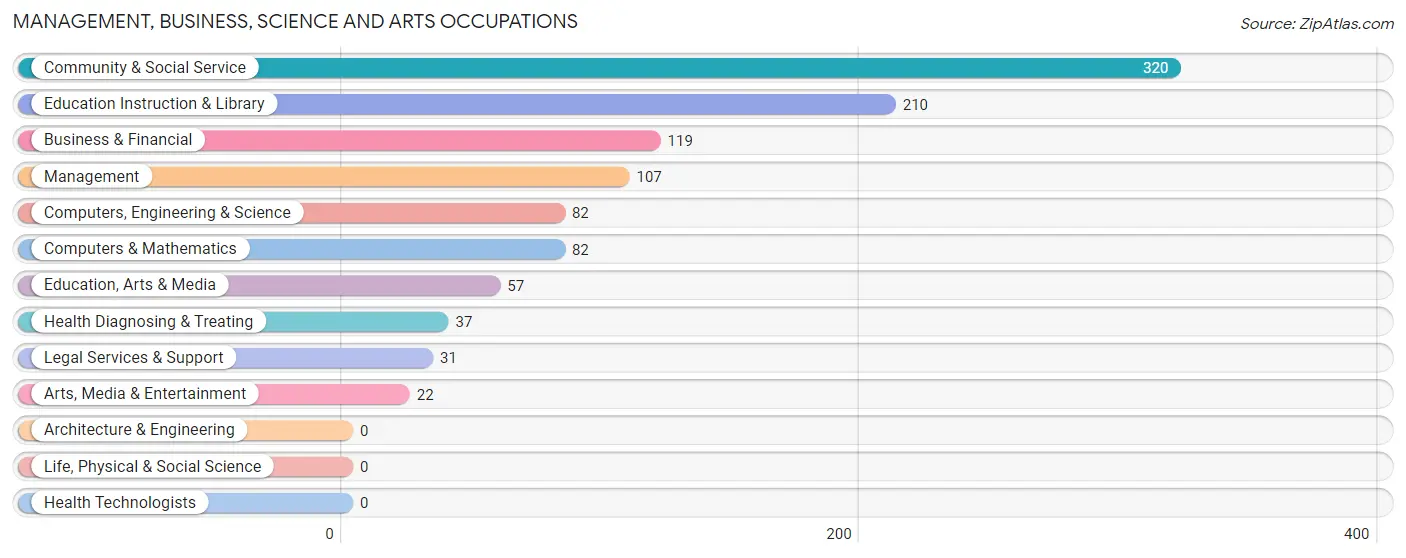
Management, Business, Science and Arts Occupations
The most common Management, Business, Science and Arts occupations in Siler City are Community & Social Service (320 | 9.0%), Education Instruction & Library (210 | 5.9%), Business & Financial (119 | 3.4%), Management (107 | 3.0%), and Computers, Engineering & Science (82 | 2.3%).
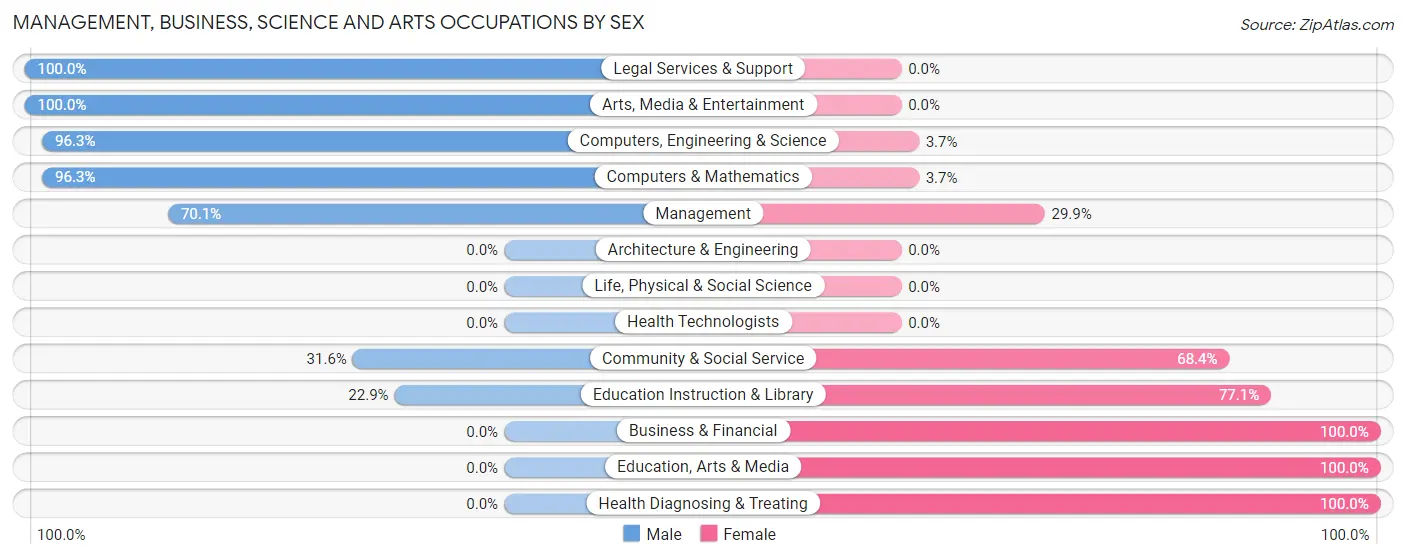
Management, Business, Science and Arts Occupations by Sex
Within the Management, Business, Science and Arts occupations in Siler City, the most male-oriented occupations are Legal Services & Support (100.0%), Arts, Media & Entertainment (100.0%), and Computers, Engineering & Science (96.3%), while the most female-oriented occupations are Business & Financial (100.0%), Education, Arts & Media (100.0%), and Health Diagnosing & Treating (100.0%).
| Occupation | Male | Female |
| Management | 75 (70.1%) | 32 (29.9%) |
| Business & Financial | 0 (0.0%) | 119 (100.0%) |
| Computers, Engineering & Science | 79 (96.3%) | 3 (3.7%) |
| Computers & Mathematics | 79 (96.3%) | 3 (3.7%) |
| Architecture & Engineering | 0 (0.0%) | 0 (0.0%) |
| Life, Physical & Social Science | 0 (0.0%) | 0 (0.0%) |
| Community & Social Service | 101 (31.6%) | 219 (68.4%) |
| Education, Arts & Media | 0 (0.0%) | 57 (100.0%) |
| Legal Services & Support | 31 (100.0%) | 0 (0.0%) |
| Education Instruction & Library | 48 (22.9%) | 162 (77.1%) |
| Arts, Media & Entertainment | 22 (100.0%) | 0 (0.0%) |
| Health Diagnosing & Treating | 0 (0.0%) | 37 (100.0%) |
| Health Technologists | 0 (0.0%) | 0 (0.0%) |
| Total (Category) | 255 (38.4%) | 410 (61.7%) |
| Total (Overall) | 2,002 (56.6%) | 1,538 (43.4%) |
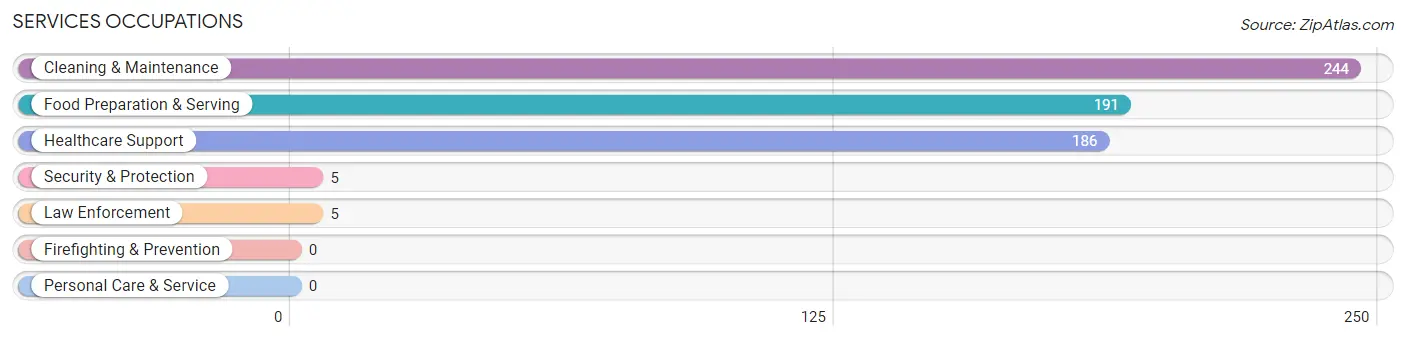
Services Occupations
The most common Services occupations in Siler City are Cleaning & Maintenance (244 | 6.9%), Food Preparation & Serving (191 | 5.4%), Healthcare Support (186 | 5.2%), Security & Protection (5 | 0.1%), and Law Enforcement (5 | 0.1%).
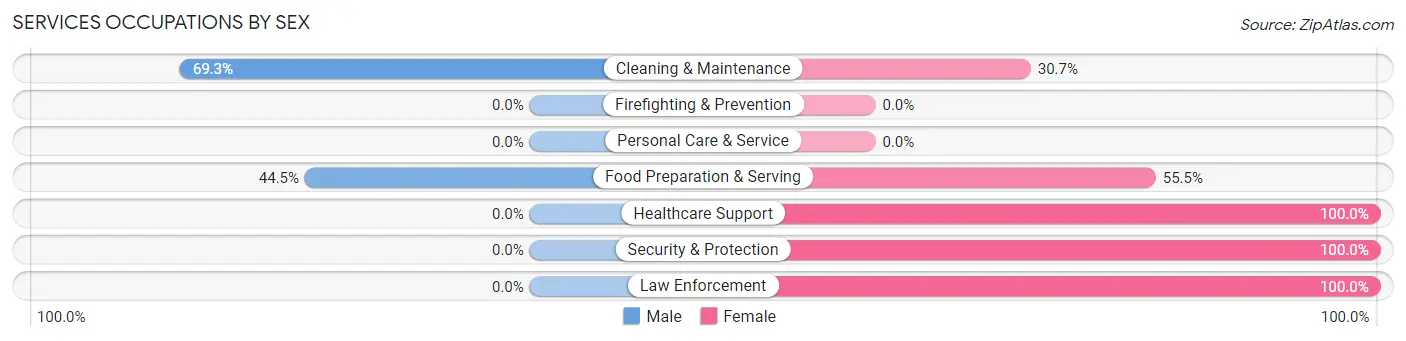
Services Occupations by Sex
Within the Services occupations in Siler City, the most male-oriented occupations are Cleaning & Maintenance (69.3%), and Food Preparation & Serving (44.5%), while the most female-oriented occupations are Healthcare Support (100.0%), Security & Protection (100.0%), and Law Enforcement (100.0%).
| Occupation | Male | Female |
| Healthcare Support | 0 (0.0%) | 186 (100.0%) |
| Security & Protection | 0 (0.0%) | 5 (100.0%) |
| Firefighting & Prevention | 0 (0.0%) | 0 (0.0%) |
| Law Enforcement | 0 (0.0%) | 5 (100.0%) |
| Food Preparation & Serving | 85 (44.5%) | 106 (55.5%) |
| Cleaning & Maintenance | 169 (69.3%) | 75 (30.7%) |
| Personal Care & Service | 0 (0.0%) | 0 (0.0%) |
| Total (Category) | 254 (40.6%) | 372 (59.4%) |
| Total (Overall) | 2,002 (56.6%) | 1,538 (43.4%) |
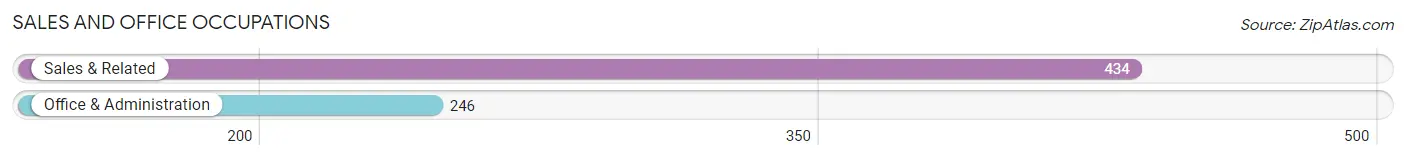
Sales and Office Occupations
The most common Sales and Office occupations in Siler City are Sales & Related (434 | 12.3%), and Office & Administration (246 | 7.0%).
Sales and Office Occupations by Sex

| Occupation | Male | Female |
| Sales & Related | 267 (61.5%) | 167 (38.5%) |
| Office & Administration | 132 (53.7%) | 114 (46.3%) |
| Total (Category) | 399 (58.7%) | 281 (41.3%) |
| Total (Overall) | 2,002 (56.6%) | 1,538 (43.4%) |
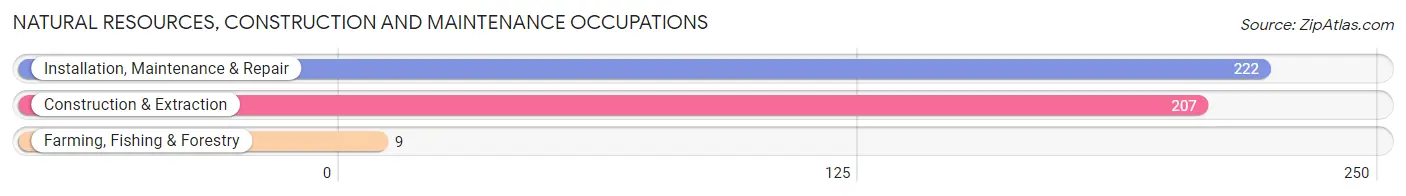
Natural Resources, Construction and Maintenance Occupations
The most common Natural Resources, Construction and Maintenance occupations in Siler City are Installation, Maintenance & Repair (222 | 6.3%), Construction & Extraction (207 | 5.9%), and Farming, Fishing & Forestry (9 | 0.3%).
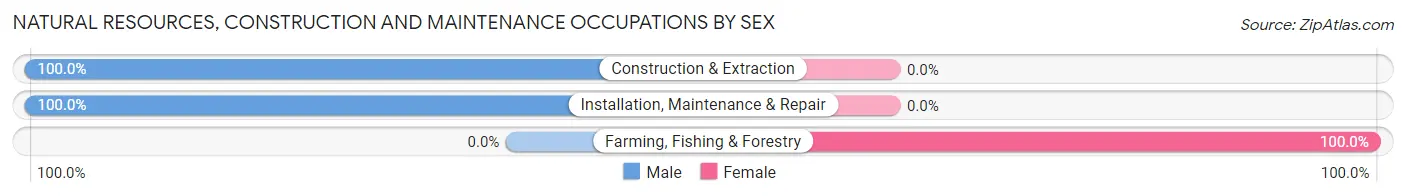
Natural Resources, Construction and Maintenance Occupations by Sex
| Occupation | Male | Female |
| Farming, Fishing & Forestry | 0 (0.0%) | 9 (100.0%) |
| Construction & Extraction | 207 (100.0%) | 0 (0.0%) |
| Installation, Maintenance & Repair | 222 (100.0%) | 0 (0.0%) |
| Total (Category) | 429 (98.0%) | 9 (2.1%) |
| Total (Overall) | 2,002 (56.6%) | 1,538 (43.4%) |
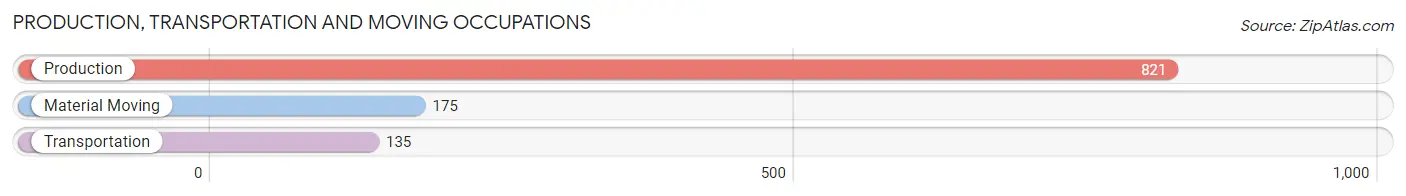
Production, Transportation and Moving Occupations
The most common Production, Transportation and Moving occupations in Siler City are Production (821 | 23.2%), Material Moving (175 | 4.9%), and Transportation (135 | 3.8%).
Production, Transportation and Moving Occupations by Sex
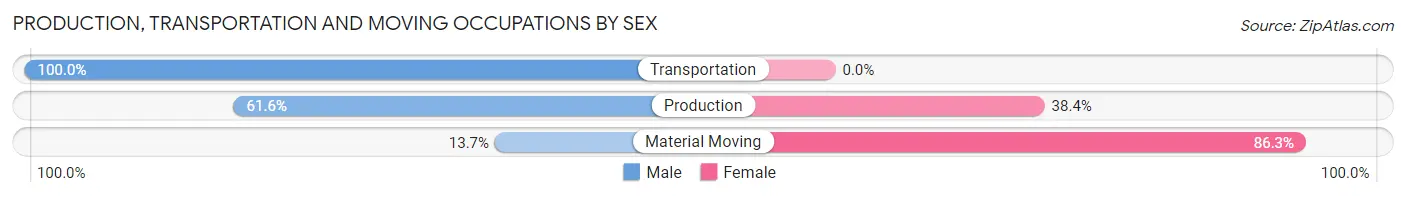
| Occupation | Male | Female |
| Production | 506 (61.6%) | 315 (38.4%) |
| Transportation | 135 (100.0%) | 0 (0.0%) |
| Material Moving | 24 (13.7%) | 151 (86.3%) |
| Total (Category) | 665 (58.8%) | 466 (41.2%) |
| Total (Overall) | 2,002 (56.6%) | 1,538 (43.4%) |
Employment Industries by Sex in Siler City
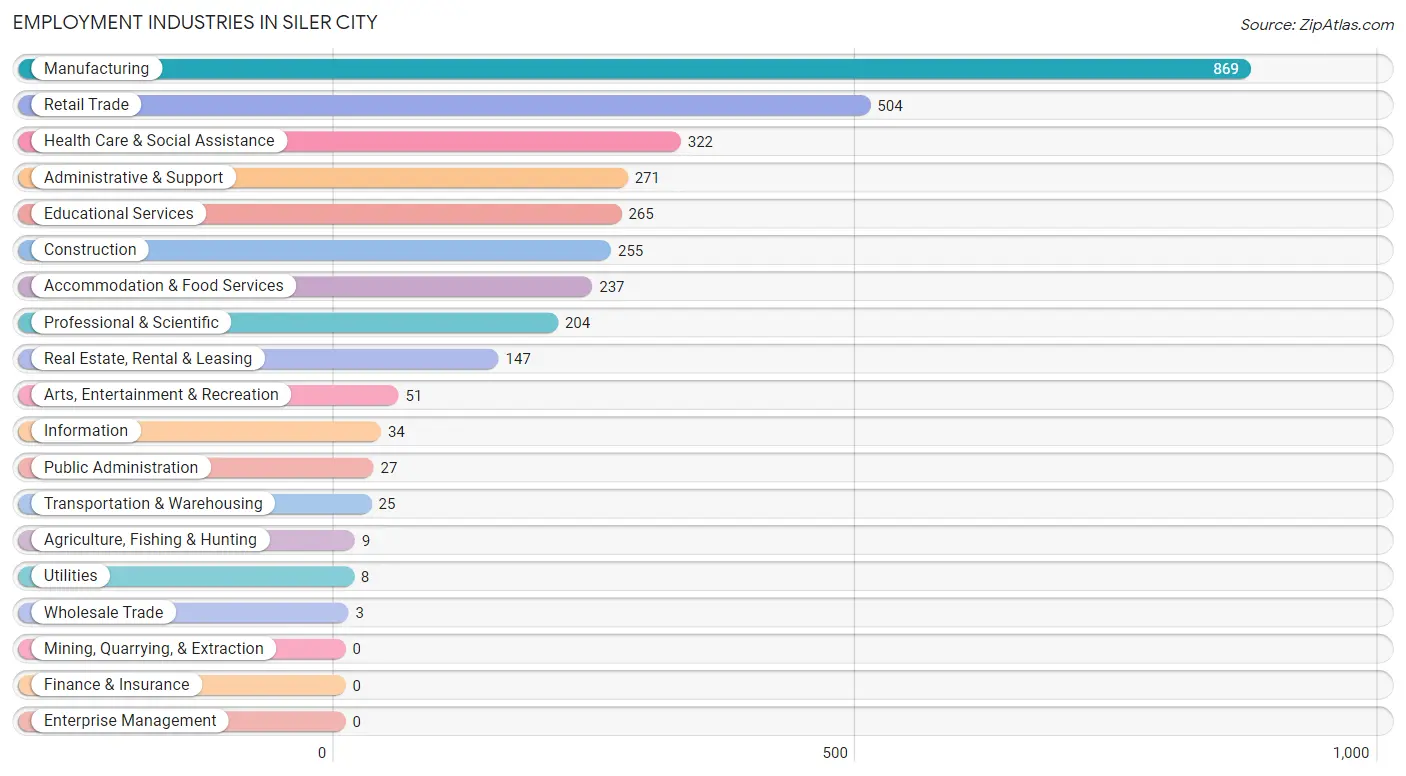
Employment Industries in Siler City
The major employment industries in Siler City include Manufacturing (869 | 24.5%), Retail Trade (504 | 14.2%), Health Care & Social Assistance (322 | 9.1%), Administrative & Support (271 | 7.7%), and Educational Services (265 | 7.5%).
Employment Industries by Sex in Siler City
The Siler City industries that see more men than women are Utilities (100.0%), Information (100.0%), and Real Estate, Rental & Leasing (100.0%), whereas the industries that tend to have a higher number of women are Agriculture, Fishing & Hunting (100.0%), Wholesale Trade (100.0%), and Transportation & Warehousing (100.0%).
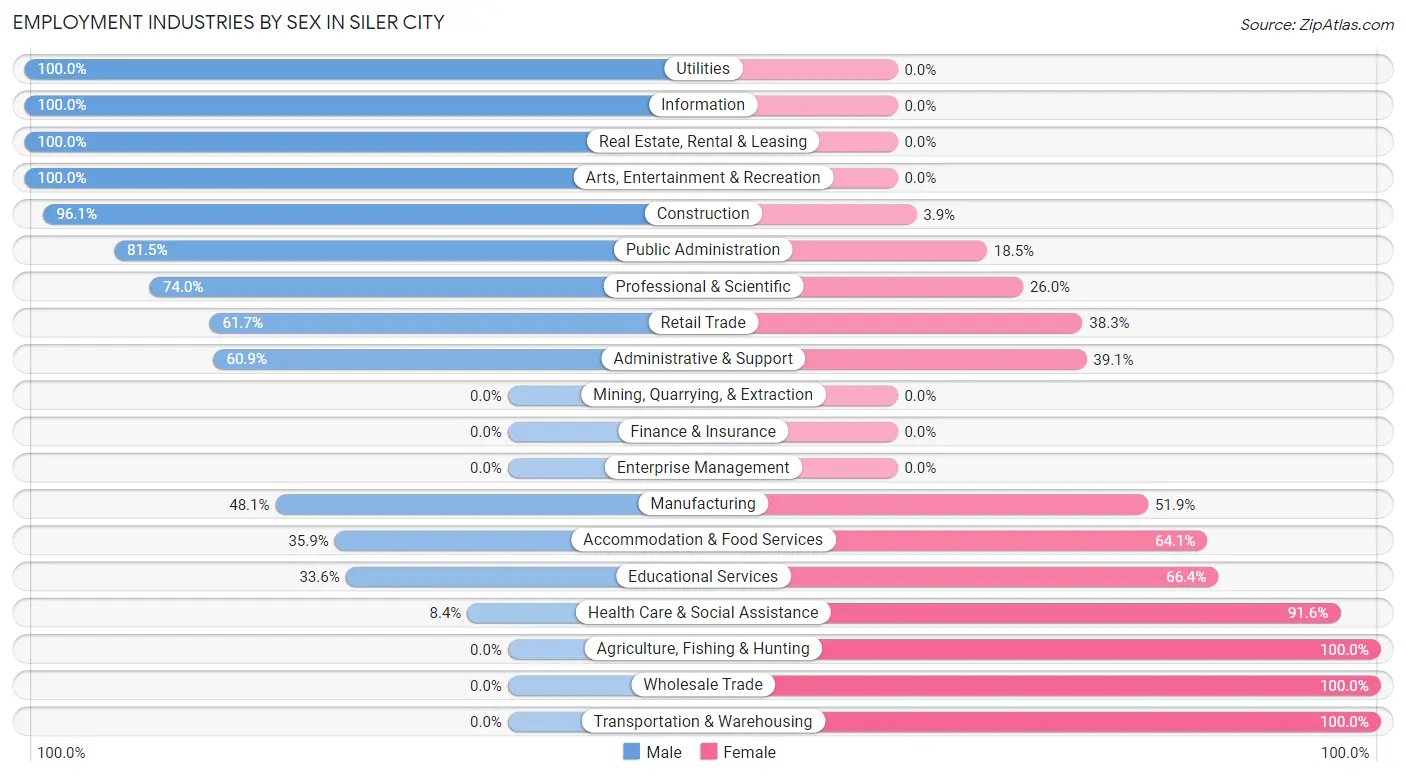
| Industry | Male | Female |
| Agriculture, Fishing & Hunting | 0 (0.0%) | 9 (100.0%) |
| Mining, Quarrying, & Extraction | 0 (0.0%) | 0 (0.0%) |
| Construction | 245 (96.1%) | 10 (3.9%) |
| Manufacturing | 418 (48.1%) | 451 (51.9%) |
| Wholesale Trade | 0 (0.0%) | 3 (100.0%) |
| Retail Trade | 311 (61.7%) | 193 (38.3%) |
| Transportation & Warehousing | 0 (0.0%) | 25 (100.0%) |
| Utilities | 8 (100.0%) | 0 (0.0%) |
| Information | 34 (100.0%) | 0 (0.0%) |
| Finance & Insurance | 0 (0.0%) | 0 (0.0%) |
| Real Estate, Rental & Leasing | 147 (100.0%) | 0 (0.0%) |
| Professional & Scientific | 151 (74.0%) | 53 (26.0%) |
| Enterprise Management | 0 (0.0%) | 0 (0.0%) |
| Administrative & Support | 165 (60.9%) | 106 (39.1%) |
| Educational Services | 89 (33.6%) | 176 (66.4%) |
| Health Care & Social Assistance | 27 (8.4%) | 295 (91.6%) |
| Arts, Entertainment & Recreation | 51 (100.0%) | 0 (0.0%) |
| Accommodation & Food Services | 85 (35.9%) | 152 (64.1%) |
| Public Administration | 22 (81.5%) | 5 (18.5%) |
| Total | 2,002 (56.6%) | 1,538 (43.4%) |
Education in Siler City
School Enrollment in Siler City
The most common levels of schooling among the 2,187 students in Siler City are high school (624 | 28.5%), elementary school (529 | 24.2%), and middle school (506 | 23.1%).
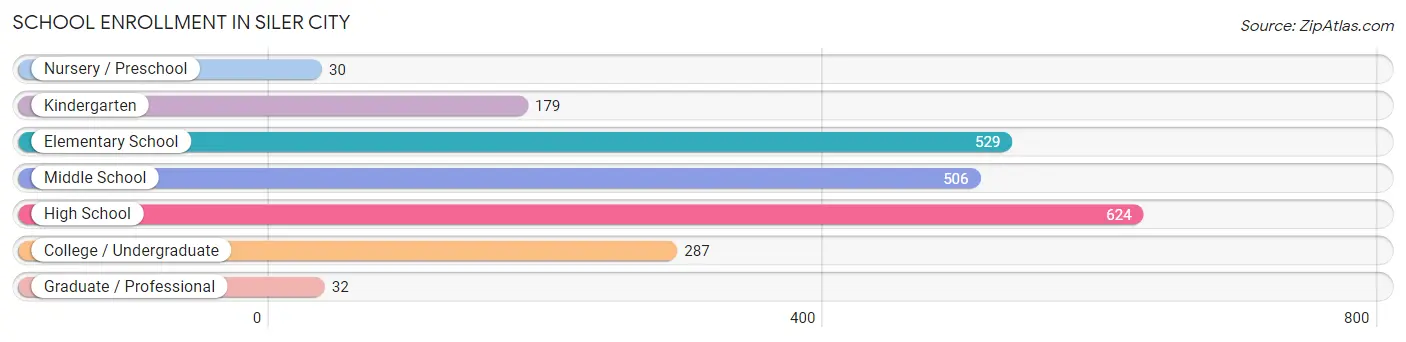
| School Level | # Students | % Students |
| Nursery / Preschool | 30 | 1.4% |
| Kindergarten | 179 | 8.2% |
| Elementary School | 529 | 24.2% |
| Middle School | 506 | 23.1% |
| High School | 624 | 28.5% |
| College / Undergraduate | 287 | 13.1% |
| Graduate / Professional | 32 | 1.5% |
| Total | 2,187 | 100.0% |
School Enrollment by Age by Funding Source in Siler City
Out of a total of 2,187 students who are enrolled in schools in Siler City, 48 (2.2%) attend a private institution, while the remaining 2,139 (97.8%) are enrolled in public schools. The age group of 10 to 14 year olds has the highest likelihood of being enrolled in private schools, with 32 (5.4% in the age bracket) enrolled. Conversely, the age group of 3 to 4 year olds has the lowest likelihood of being enrolled in a private school, with 30 (100.0% in the age bracket) attending a public institution.
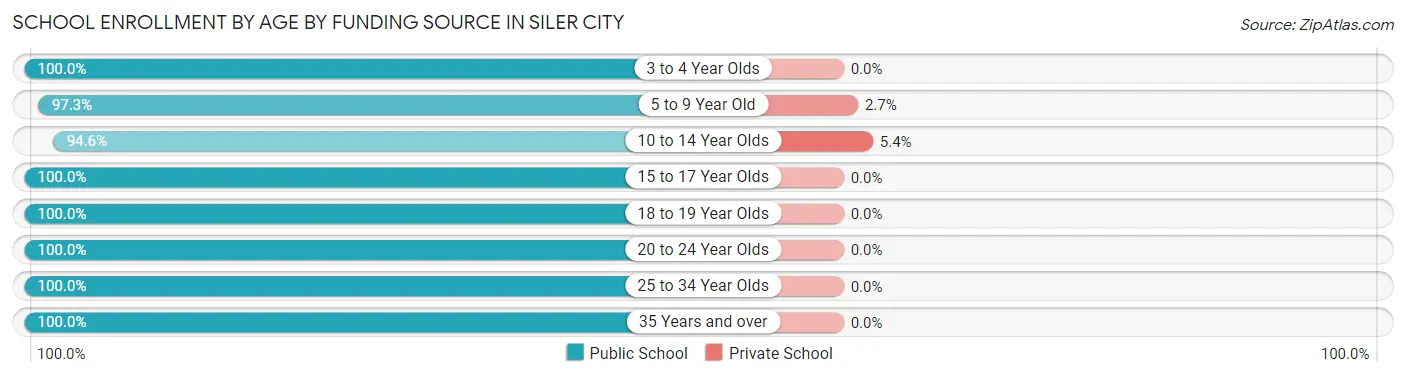
| Age Bracket | Public School | Private School |
| 3 to 4 Year Olds | 30 (100.0%) | 0 (0.0%) |
| 5 to 9 Year Old | 623 (97.3%) | 17 (2.7%) |
| 10 to 14 Year Olds | 557 (94.6%) | 32 (5.4%) |
| 15 to 17 Year Olds | 463 (100.0%) | 0 (0.0%) |
| 18 to 19 Year Olds | 209 (100.0%) | 0 (0.0%) |
| 20 to 24 Year Olds | 134 (100.0%) | 0 (0.0%) |
| 25 to 34 Year Olds | 18 (100.0%) | 0 (0.0%) |
| 35 Years and over | 104 (100.0%) | 0 (0.0%) |
| Total | 2,139 (97.8%) | 48 (2.2%) |
Educational Attainment by Field of Study in Siler City
Science & technology (148 | 16.5%), business (141 | 15.7%), social sciences (115 | 12.8%), education (104 | 11.6%), and literature & languages (89 | 9.9%) are the most common fields of study among 896 individuals in Siler City who have obtained a bachelor's degree or higher.
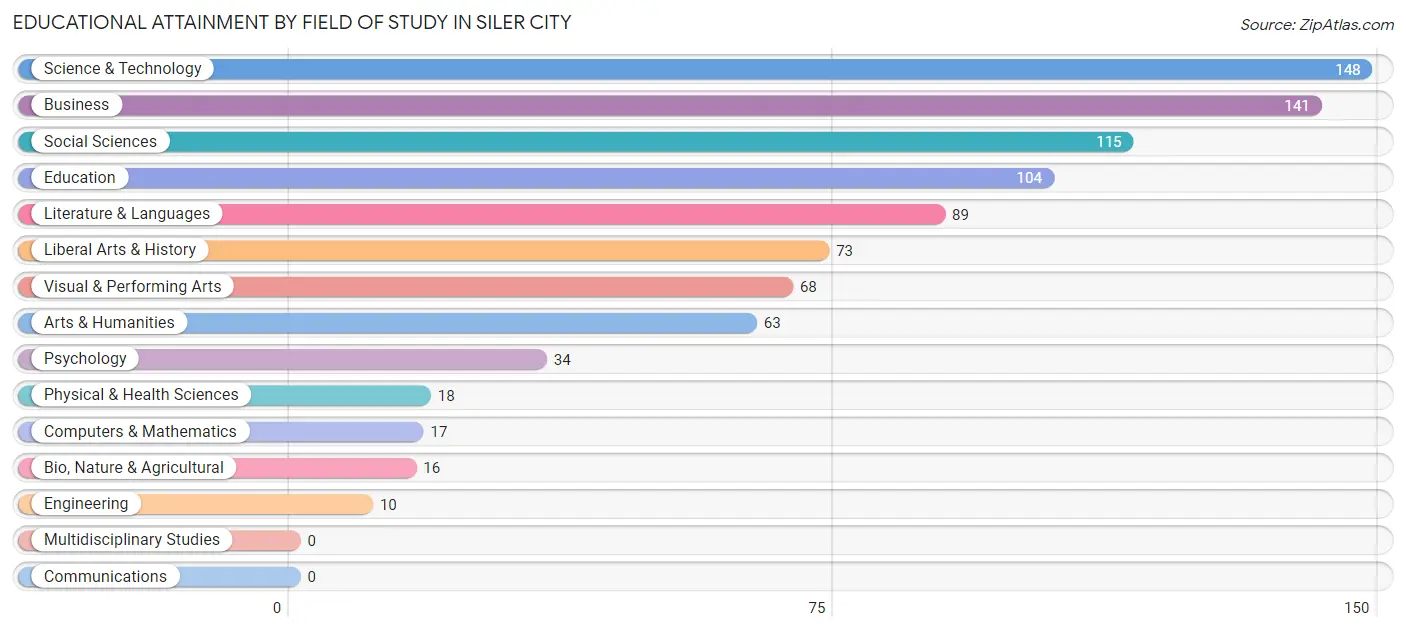
| Field of Study | # Graduates | % Graduates |
| Computers & Mathematics | 17 | 1.9% |
| Bio, Nature & Agricultural | 16 | 1.8% |
| Physical & Health Sciences | 18 | 2.0% |
| Psychology | 34 | 3.8% |
| Social Sciences | 115 | 12.8% |
| Engineering | 10 | 1.1% |
| Multidisciplinary Studies | 0 | 0.0% |
| Science & Technology | 148 | 16.5% |
| Business | 141 | 15.7% |
| Education | 104 | 11.6% |
| Literature & Languages | 89 | 9.9% |
| Liberal Arts & History | 73 | 8.2% |
| Visual & Performing Arts | 68 | 7.6% |
| Communications | 0 | 0.0% |
| Arts & Humanities | 63 | 7.0% |
| Total | 896 | 100.0% |
Transportation & Commute in Siler City
Vehicle Availability by Sex in Siler City
The most prevalent vehicle ownership categories in Siler City are males with 2 vehicles (912, accounting for 45.6%) and females with 2 vehicles (701, making up 62.2%).
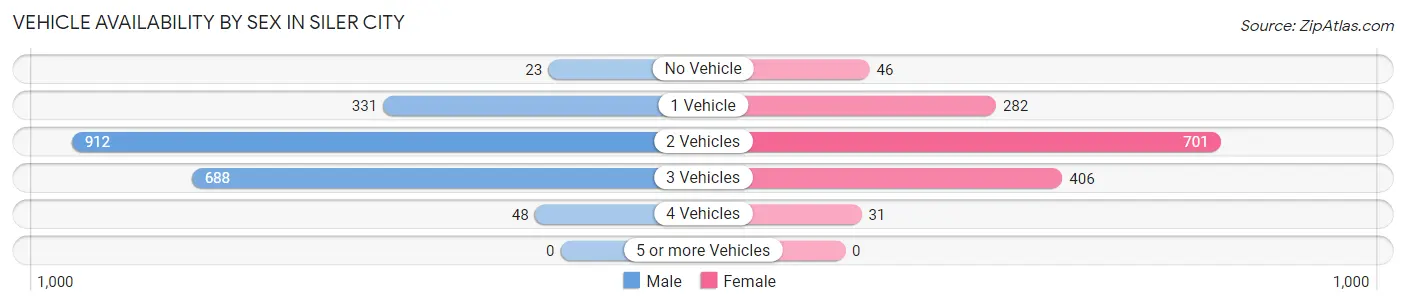
| Vehicles Available | Male | Female |
| No Vehicle | 23 (1.1%) | 46 (3.1%) |
| 1 Vehicle | 331 (16.5%) | 282 (19.2%) |
| 2 Vehicles | 912 (45.6%) | 701 (47.8%) |
| 3 Vehicles | 688 (34.4%) | 406 (27.7%) |
| 4 Vehicles | 48 (2.4%) | 31 (2.1%) |
| 5 or more Vehicles | 0 (0.0%) | 0 (0.0%) |
| Total | 2,002 (100.0%) | 1,466 (100.0%) |
Commute Time in Siler City
The most frequently occuring commute durations in Siler City are 10 to 14 minutes (758 commuters, 22.4%), 5 to 9 minutes (490 commuters, 14.4%), and 25 to 29 minutes (398 commuters, 11.7%).
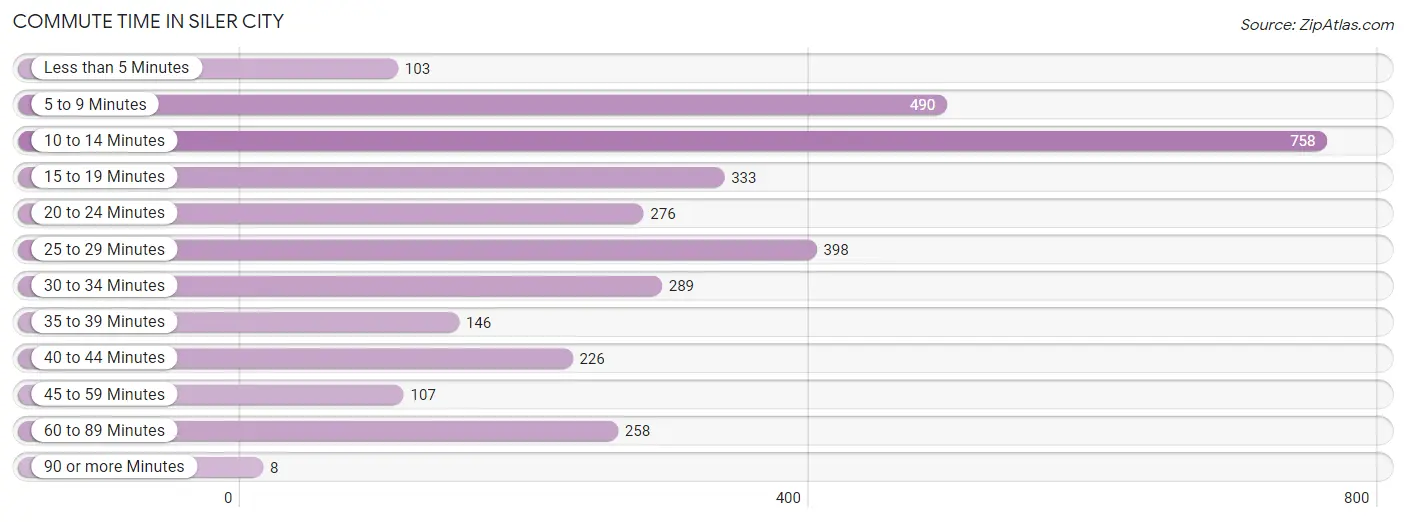
| Commute Time | # Commuters | % Commuters |
| Less than 5 Minutes | 103 | 3.0% |
| 5 to 9 Minutes | 490 | 14.4% |
| 10 to 14 Minutes | 758 | 22.4% |
| 15 to 19 Minutes | 333 | 9.8% |
| 20 to 24 Minutes | 276 | 8.1% |
| 25 to 29 Minutes | 398 | 11.7% |
| 30 to 34 Minutes | 289 | 8.5% |
| 35 to 39 Minutes | 146 | 4.3% |
| 40 to 44 Minutes | 226 | 6.7% |
| 45 to 59 Minutes | 107 | 3.2% |
| 60 to 89 Minutes | 258 | 7.6% |
| 90 or more Minutes | 8 | 0.2% |
Commute Time by Sex in Siler City
The most common commute times in Siler City are 10 to 14 minutes (388 commuters, 19.7%) for males and 10 to 14 minutes (370 commuters, 26.0%) for females.
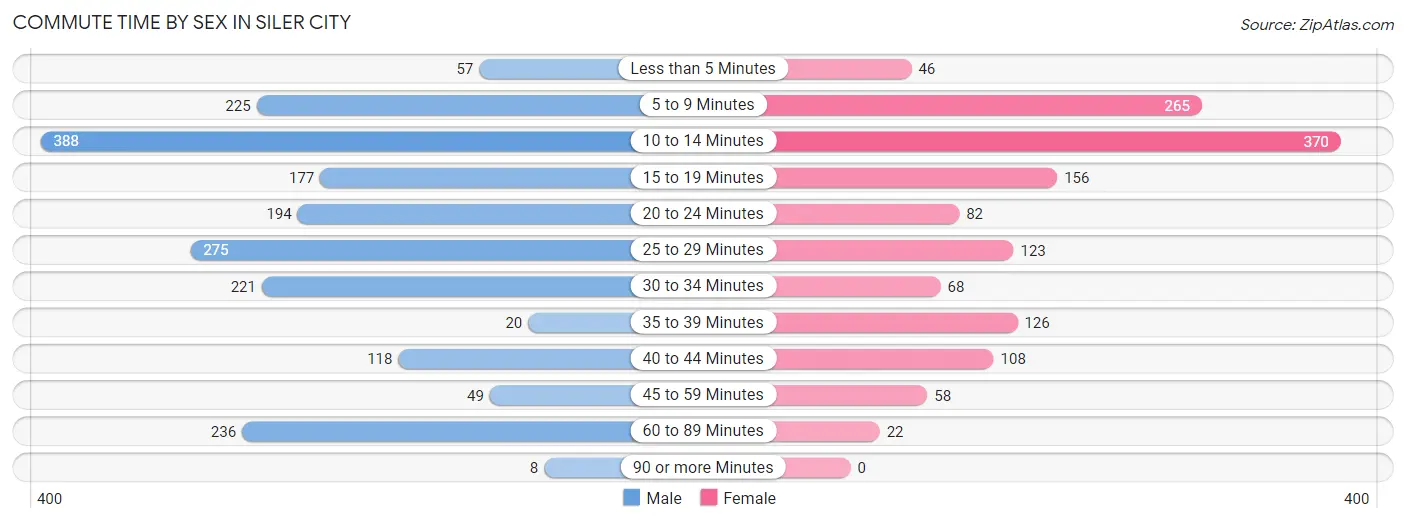
| Commute Time | Male | Female |
| Less than 5 Minutes | 57 (2.9%) | 46 (3.2%) |
| 5 to 9 Minutes | 225 (11.4%) | 265 (18.6%) |
| 10 to 14 Minutes | 388 (19.7%) | 370 (26.0%) |
| 15 to 19 Minutes | 177 (9.0%) | 156 (11.0%) |
| 20 to 24 Minutes | 194 (9.9%) | 82 (5.8%) |
| 25 to 29 Minutes | 275 (14.0%) | 123 (8.6%) |
| 30 to 34 Minutes | 221 (11.2%) | 68 (4.8%) |
| 35 to 39 Minutes | 20 (1.0%) | 126 (8.8%) |
| 40 to 44 Minutes | 118 (6.0%) | 108 (7.6%) |
| 45 to 59 Minutes | 49 (2.5%) | 58 (4.1%) |
| 60 to 89 Minutes | 236 (12.0%) | 22 (1.5%) |
| 90 or more Minutes | 8 (0.4%) | 0 (0.0%) |
Time of Departure to Work by Sex in Siler City
The most frequent times of departure to work in Siler City are 7:00 AM to 7:29 AM (440, 22.4%) for males and 12:00 PM to 3:59 PM (348, 24.4%) for females.
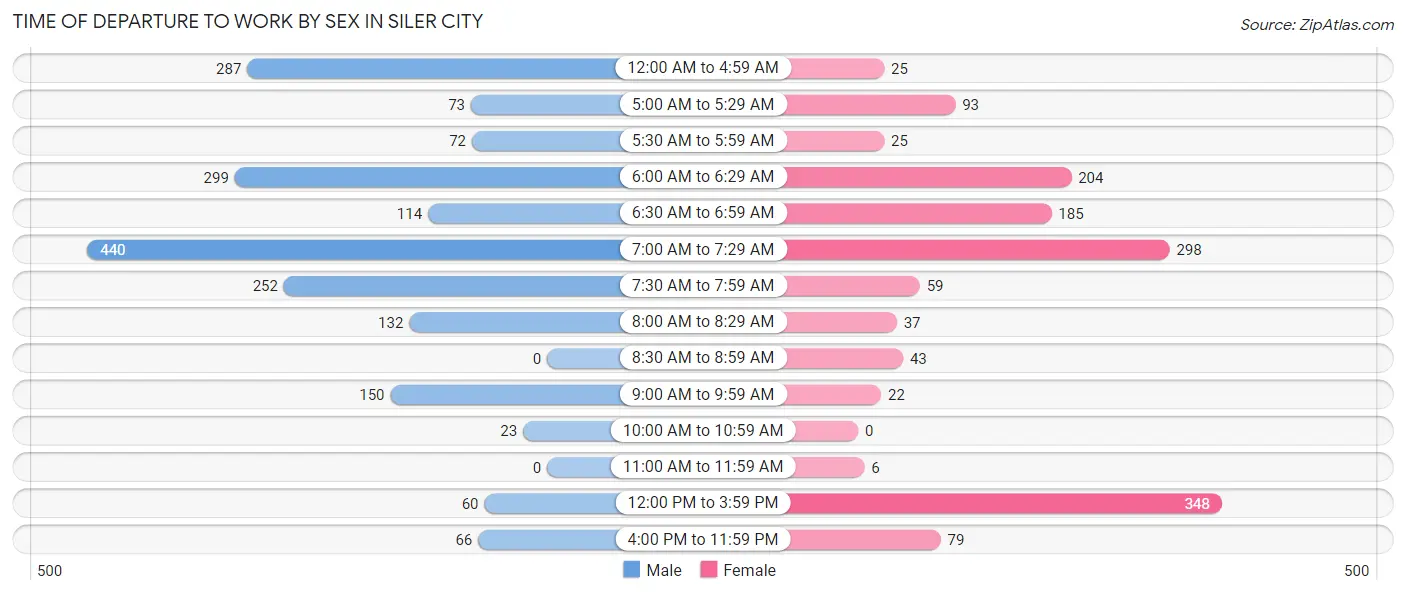
| Time of Departure | Male | Female |
| 12:00 AM to 4:59 AM | 287 (14.6%) | 25 (1.8%) |
| 5:00 AM to 5:29 AM | 73 (3.7%) | 93 (6.5%) |
| 5:30 AM to 5:59 AM | 72 (3.7%) | 25 (1.8%) |
| 6:00 AM to 6:29 AM | 299 (15.2%) | 204 (14.3%) |
| 6:30 AM to 6:59 AM | 114 (5.8%) | 185 (13.0%) |
| 7:00 AM to 7:29 AM | 440 (22.4%) | 298 (20.9%) |
| 7:30 AM to 7:59 AM | 252 (12.8%) | 59 (4.1%) |
| 8:00 AM to 8:29 AM | 132 (6.7%) | 37 (2.6%) |
| 8:30 AM to 8:59 AM | 0 (0.0%) | 43 (3.0%) |
| 9:00 AM to 9:59 AM | 150 (7.6%) | 22 (1.5%) |
| 10:00 AM to 10:59 AM | 23 (1.2%) | 0 (0.0%) |
| 11:00 AM to 11:59 AM | 0 (0.0%) | 6 (0.4%) |
| 12:00 PM to 3:59 PM | 60 (3.0%) | 348 (24.4%) |
| 4:00 PM to 11:59 PM | 66 (3.4%) | 79 (5.6%) |
| Total | 1,968 (100.0%) | 1,424 (100.0%) |
Housing Occupancy in Siler City
Occupancy by Ownership in Siler City
Of the total 2,805 dwellings in Siler City, owner-occupied units account for 1,655 (59.0%), while renter-occupied units make up 1,150 (41.0%).
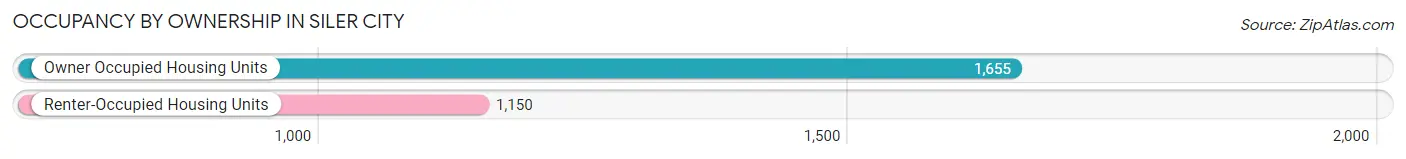
| Occupancy | # Housing Units | % Housing Units |
| Owner Occupied Housing Units | 1,655 | 59.0% |
| Renter-Occupied Housing Units | 1,150 | 41.0% |
| Total Occupied Housing Units | 2,805 | 100.0% |
Occupancy by Household Size in Siler City
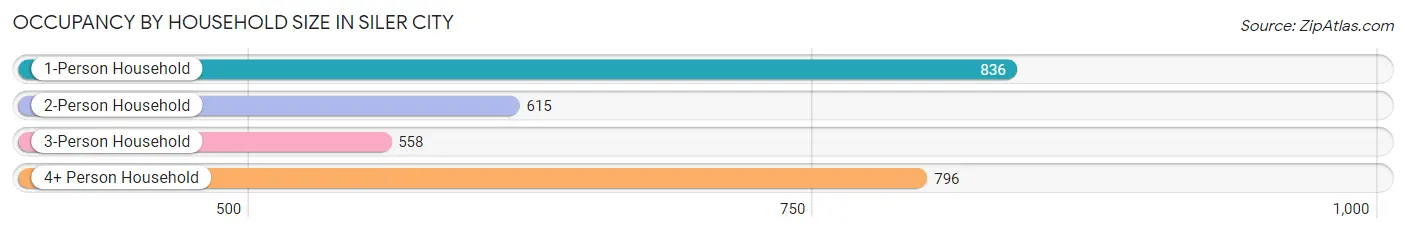
| Household Size | # Housing Units | % Housing Units |
| 1-Person Household | 836 | 29.8% |
| 2-Person Household | 615 | 21.9% |
| 3-Person Household | 558 | 19.9% |
| 4+ Person Household | 796 | 28.4% |
| Total Housing Units | 2,805 | 100.0% |
Occupancy by Ownership by Household Size in Siler City
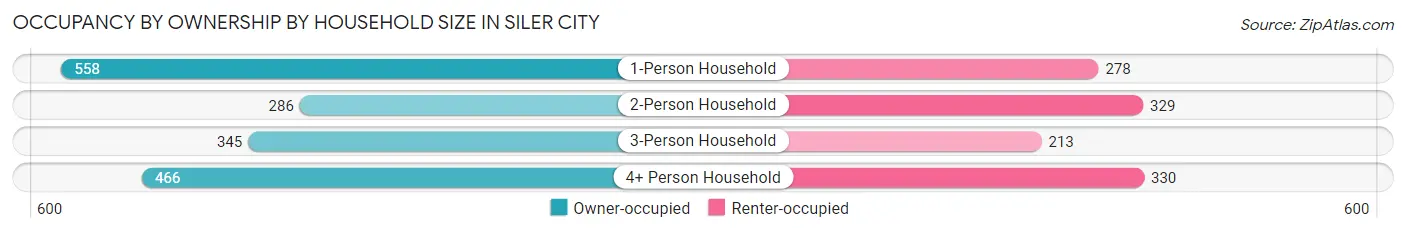
| Household Size | Owner-occupied | Renter-occupied |
| 1-Person Household | 558 (66.7%) | 278 (33.3%) |
| 2-Person Household | 286 (46.5%) | 329 (53.5%) |
| 3-Person Household | 345 (61.8%) | 213 (38.2%) |
| 4+ Person Household | 466 (58.5%) | 330 (41.5%) |
| Total Housing Units | 1,655 (59.0%) | 1,150 (41.0%) |
Occupancy by Educational Attainment in Siler City
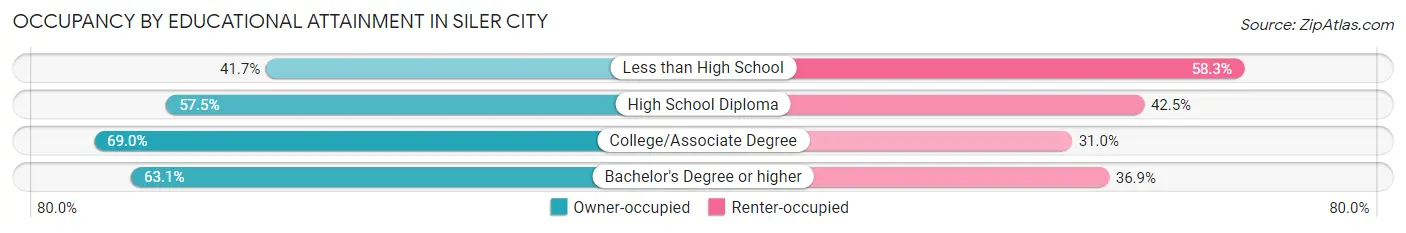
| Household Size | Owner-occupied | Renter-occupied |
| Less than High School | 259 (41.7%) | 362 (58.3%) |
| High School Diploma | 401 (57.5%) | 296 (42.5%) |
| College/Associate Degree | 665 (69.0%) | 299 (31.0%) |
| Bachelor's Degree or higher | 330 (63.1%) | 193 (36.9%) |
Occupancy by Age of Householder in Siler City
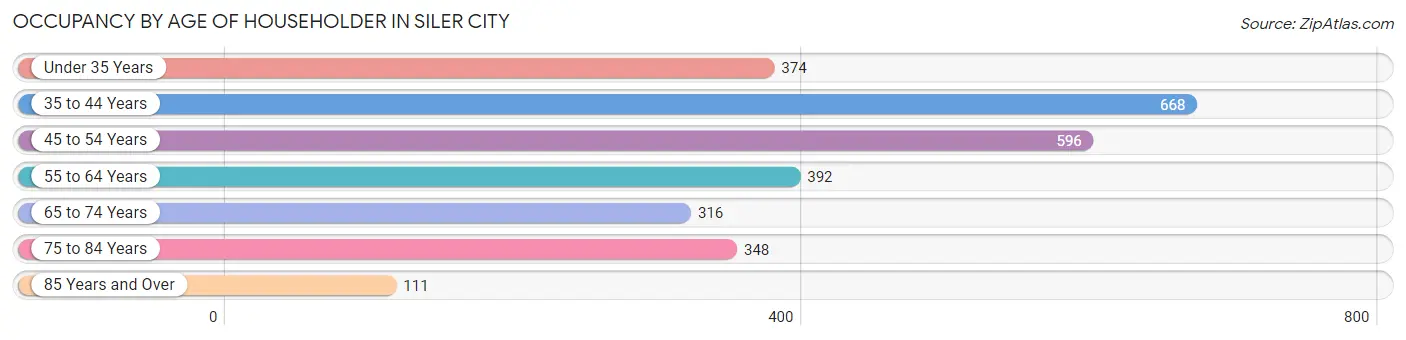
| Age Bracket | # Households | % Households |
| Under 35 Years | 374 | 13.3% |
| 35 to 44 Years | 668 | 23.8% |
| 45 to 54 Years | 596 | 21.2% |
| 55 to 64 Years | 392 | 14.0% |
| 65 to 74 Years | 316 | 11.3% |
| 75 to 84 Years | 348 | 12.4% |
| 85 Years and Over | 111 | 4.0% |
| Total | 2,805 | 100.0% |
Housing Finances in Siler City
Median Income by Occupancy in Siler City
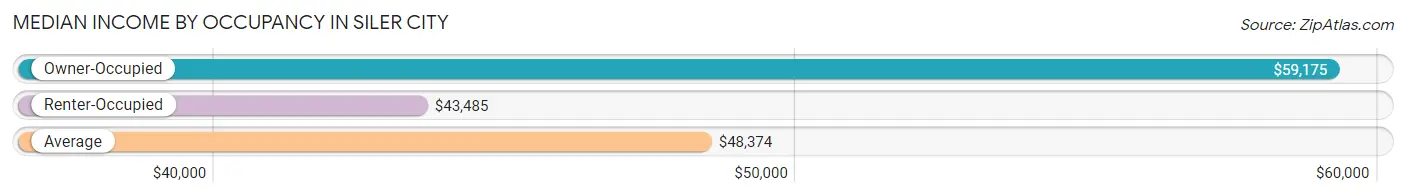
| Occupancy Type | # Households | Median Income |
| Owner-Occupied | 1,655 (59.0%) | $59,175 |
| Renter-Occupied | 1,150 (41.0%) | $43,485 |
| Average | 2,805 (100.0%) | $48,374 |
Occupancy by Householder Income Bracket in Siler City
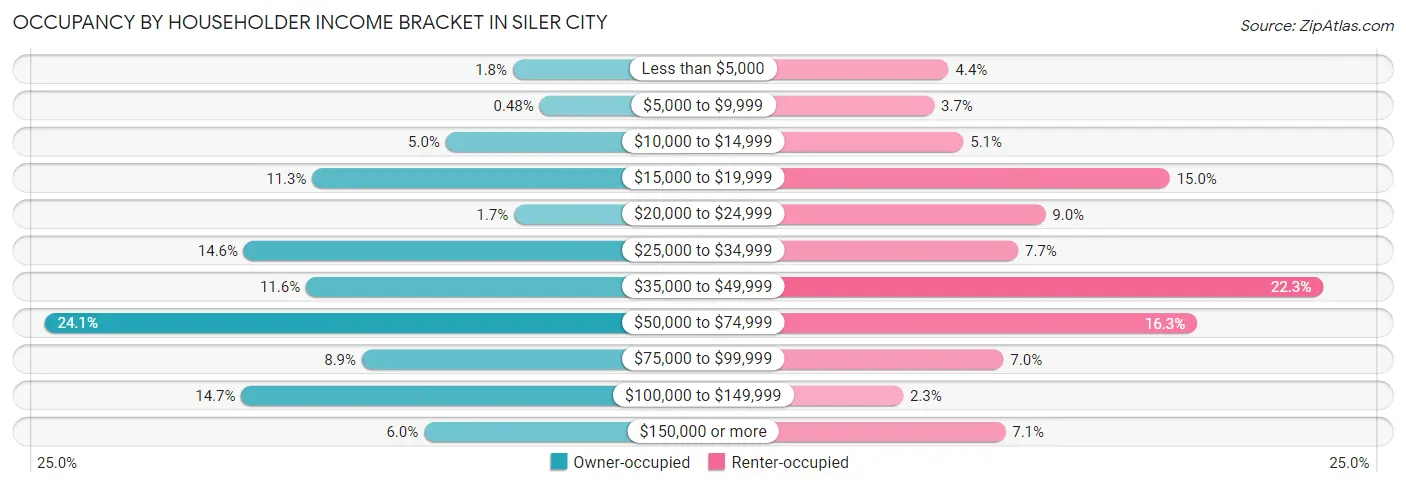
| Income Bracket | Owner-occupied | Renter-occupied |
| Less than $5,000 | 29 (1.8%) | 51 (4.4%) |
| $5,000 to $9,999 | 8 (0.5%) | 43 (3.7%) |
| $10,000 to $14,999 | 82 (5.0%) | 59 (5.1%) |
| $15,000 to $19,999 | 187 (11.3%) | 172 (15.0%) |
| $20,000 to $24,999 | 28 (1.7%) | 104 (9.0%) |
| $25,000 to $34,999 | 241 (14.6%) | 89 (7.7%) |
| $35,000 to $49,999 | 192 (11.6%) | 256 (22.3%) |
| $50,000 to $74,999 | 398 (24.0%) | 187 (16.3%) |
| $75,000 to $99,999 | 148 (8.9%) | 81 (7.0%) |
| $100,000 to $149,999 | 243 (14.7%) | 26 (2.3%) |
| $150,000 or more | 99 (6.0%) | 82 (7.1%) |
| Total | 1,655 (100.0%) | 1,150 (100.0%) |
Monthly Housing Cost Tiers in Siler City
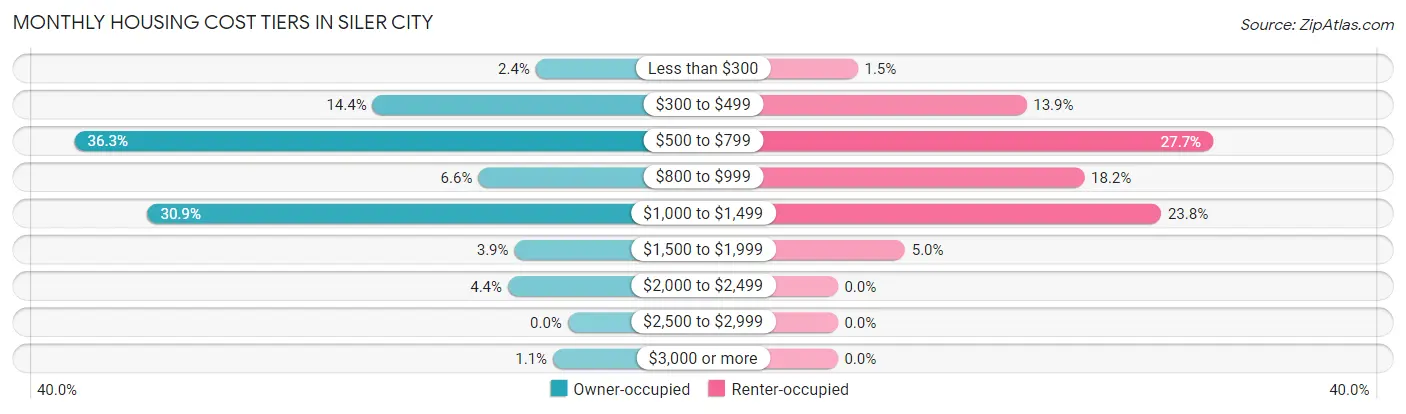
| Monthly Cost | Owner-occupied | Renter-occupied |
| Less than $300 | 39 (2.4%) | 17 (1.5%) |
| $300 to $499 | 238 (14.4%) | 160 (13.9%) |
| $500 to $799 | 601 (36.3%) | 318 (27.7%) |
| $800 to $999 | 109 (6.6%) | 209 (18.2%) |
| $1,000 to $1,499 | 512 (30.9%) | 274 (23.8%) |
| $1,500 to $1,999 | 65 (3.9%) | 57 (5.0%) |
| $2,000 to $2,499 | 73 (4.4%) | 0 (0.0%) |
| $2,500 to $2,999 | 0 (0.0%) | 0 (0.0%) |
| $3,000 or more | 18 (1.1%) | 0 (0.0%) |
| Total | 1,655 (100.0%) | 1,150 (100.0%) |
Physical Housing Characteristics in Siler City
Housing Structures in Siler City
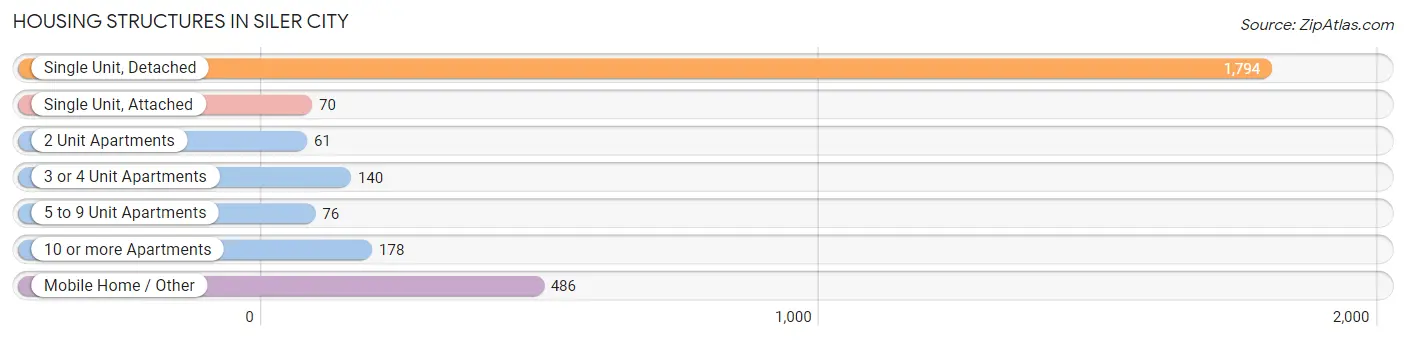
| Structure Type | # Housing Units | % Housing Units |
| Single Unit, Detached | 1,794 | 64.0% |
| Single Unit, Attached | 70 | 2.5% |
| 2 Unit Apartments | 61 | 2.2% |
| 3 or 4 Unit Apartments | 140 | 5.0% |
| 5 to 9 Unit Apartments | 76 | 2.7% |
| 10 or more Apartments | 178 | 6.4% |
| Mobile Home / Other | 486 | 17.3% |
| Total | 2,805 | 100.0% |
Housing Structures by Occupancy in Siler City
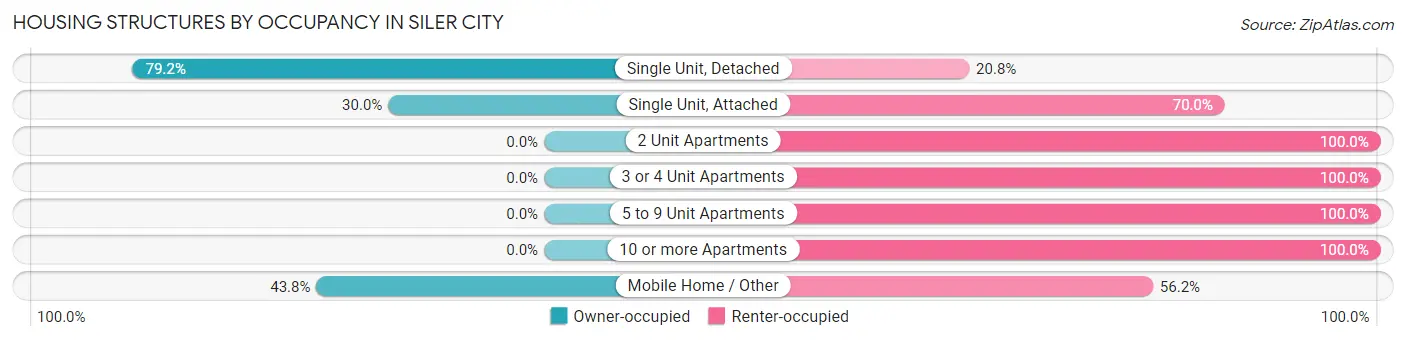
| Structure Type | Owner-occupied | Renter-occupied |
| Single Unit, Detached | 1,421 (79.2%) | 373 (20.8%) |
| Single Unit, Attached | 21 (30.0%) | 49 (70.0%) |
| 2 Unit Apartments | 0 (0.0%) | 61 (100.0%) |
| 3 or 4 Unit Apartments | 0 (0.0%) | 140 (100.0%) |
| 5 to 9 Unit Apartments | 0 (0.0%) | 76 (100.0%) |
| 10 or more Apartments | 0 (0.0%) | 178 (100.0%) |
| Mobile Home / Other | 213 (43.8%) | 273 (56.2%) |
| Total | 1,655 (59.0%) | 1,150 (41.0%) |
Housing Structures by Number of Rooms in Siler City
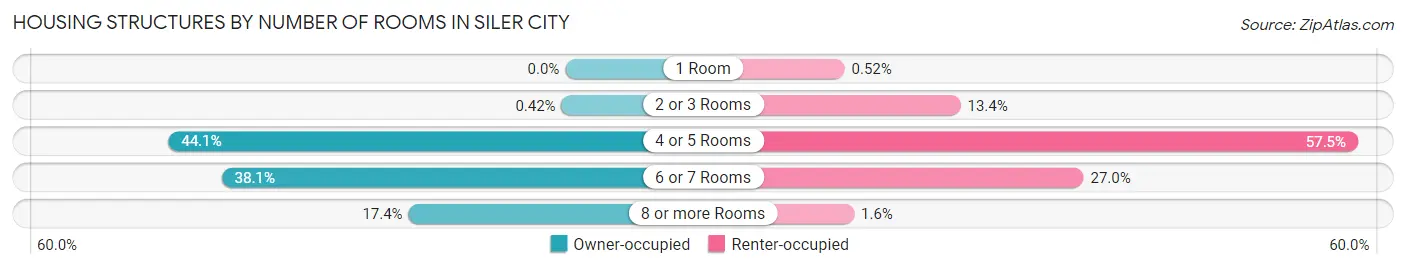
| Number of Rooms | Owner-occupied | Renter-occupied |
| 1 Room | 0 (0.0%) | 6 (0.5%) |
| 2 or 3 Rooms | 7 (0.4%) | 154 (13.4%) |
| 4 or 5 Rooms | 729 (44.1%) | 661 (57.5%) |
| 6 or 7 Rooms | 631 (38.1%) | 311 (27.0%) |
| 8 or more Rooms | 288 (17.4%) | 18 (1.6%) |
| Total | 1,655 (100.0%) | 1,150 (100.0%) |
Housing Structure by Heating Type in Siler City
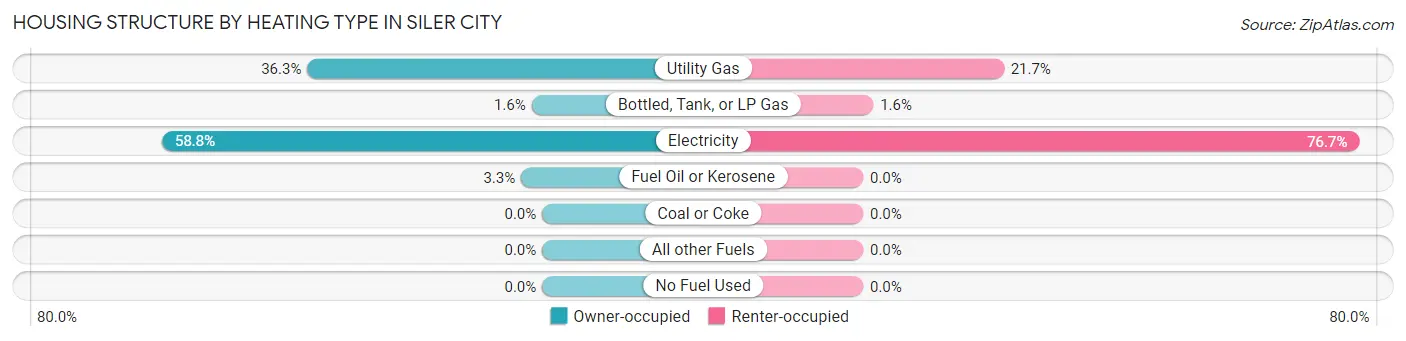
| Heating Type | Owner-occupied | Renter-occupied |
| Utility Gas | 601 (36.3%) | 250 (21.7%) |
| Bottled, Tank, or LP Gas | 27 (1.6%) | 18 (1.6%) |
| Electricity | 973 (58.8%) | 882 (76.7%) |
| Fuel Oil or Kerosene | 54 (3.3%) | 0 (0.0%) |
| Coal or Coke | 0 (0.0%) | 0 (0.0%) |
| All other Fuels | 0 (0.0%) | 0 (0.0%) |
| No Fuel Used | 0 (0.0%) | 0 (0.0%) |
| Total | 1,655 (100.0%) | 1,150 (100.0%) |
Household Vehicle Usage in Siler City
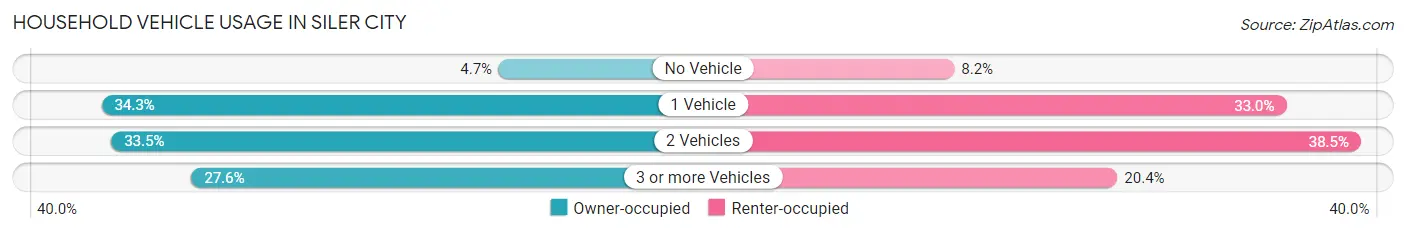
| Vehicles per Household | Owner-occupied | Renter-occupied |
| No Vehicle | 77 (4.6%) | 94 (8.2%) |
| 1 Vehicle | 567 (34.3%) | 379 (33.0%) |
| 2 Vehicles | 555 (33.5%) | 443 (38.5%) |
| 3 or more Vehicles | 456 (27.6%) | 234 (20.3%) |
| Total | 1,655 (100.0%) | 1,150 (100.0%) |
Real Estate & Mortgages in Siler City
Real Estate and Mortgage Overview in Siler City
| Characteristic | Without Mortgage | With Mortgage |
| Housing Units | 784 | 871 |
| Median Property Value | $132,900 | $151,400 |
| Median Household Income | $27,010 | $27 |
| Monthly Housing Costs | $546 | $0 |
| Real Estate Taxes | $1,242 | $0 |
Property Value by Mortgage Status in Siler City
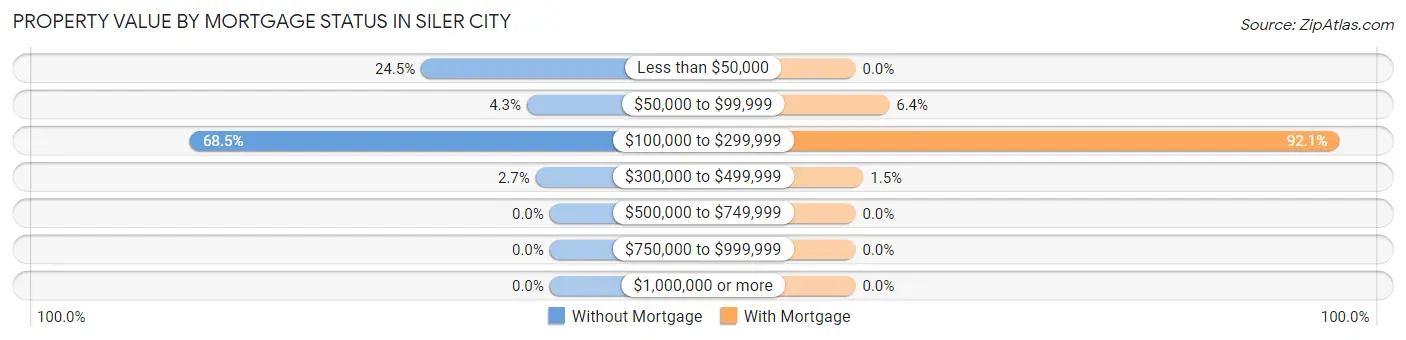
| Property Value | Without Mortgage | With Mortgage |
| Less than $50,000 | 192 (24.5%) | 0 (0.0%) |
| $50,000 to $99,999 | 34 (4.3%) | 56 (6.4%) |
| $100,000 to $299,999 | 537 (68.5%) | 802 (92.1%) |
| $300,000 to $499,999 | 21 (2.7%) | 13 (1.5%) |
| $500,000 to $749,999 | 0 (0.0%) | 0 (0.0%) |
| $750,000 to $999,999 | 0 (0.0%) | 0 (0.0%) |
| $1,000,000 or more | 0 (0.0%) | 0 (0.0%) |
| Total | 784 (100.0%) | 871 (100.0%) |
Household Income by Mortgage Status in Siler City
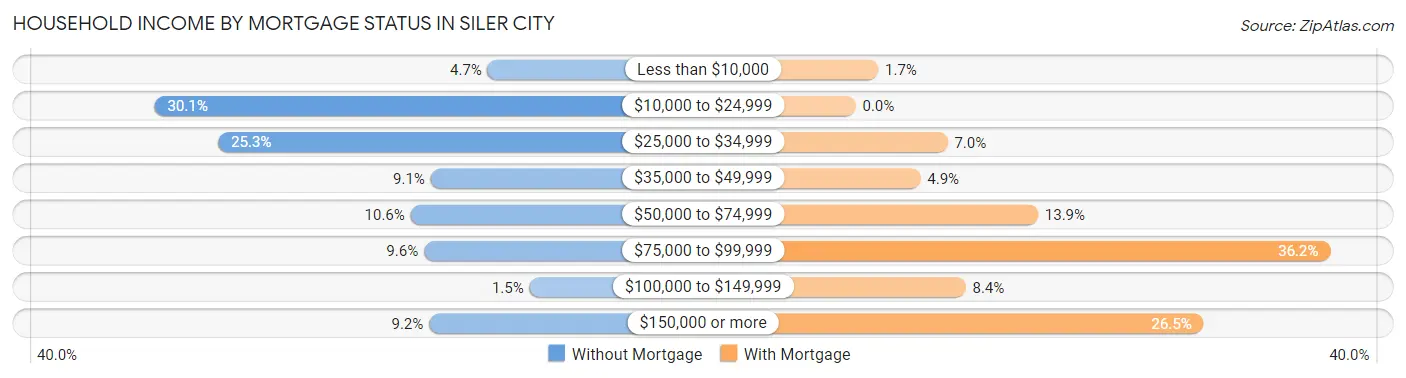
| Household Income | Without Mortgage | With Mortgage |
| Less than $10,000 | 37 (4.7%) | 15 (1.7%) |
| $10,000 to $24,999 | 236 (30.1%) | 0 (0.0%) |
| $25,000 to $34,999 | 198 (25.3%) | 61 (7.0%) |
| $35,000 to $49,999 | 71 (9.1%) | 43 (4.9%) |
| $50,000 to $74,999 | 83 (10.6%) | 121 (13.9%) |
| $75,000 to $99,999 | 75 (9.6%) | 315 (36.2%) |
| $100,000 to $149,999 | 12 (1.5%) | 73 (8.4%) |
| $150,000 or more | 72 (9.2%) | 231 (26.5%) |
| Total | 784 (100.0%) | 871 (100.0%) |
Property Value to Household Income Ratio in Siler City
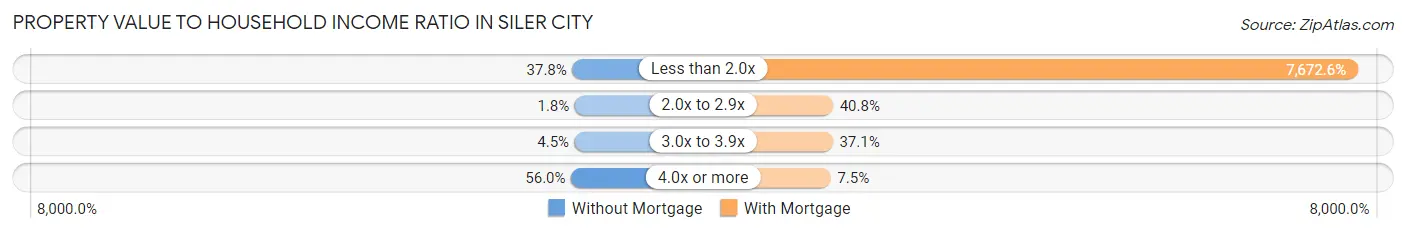
| Value-to-Income Ratio | Without Mortgage | With Mortgage |
| Less than 2.0x | 296 (37.8%) | 66,828 (7,672.6%) |
| 2.0x to 2.9x | 14 (1.8%) | 355 (40.8%) |
| 3.0x to 3.9x | 35 (4.5%) | 323 (37.1%) |
| 4.0x or more | 439 (56.0%) | 65 (7.5%) |
| Total | 784 (100.0%) | 871 (100.0%) |
Real Estate Taxes by Mortgage Status in Siler City
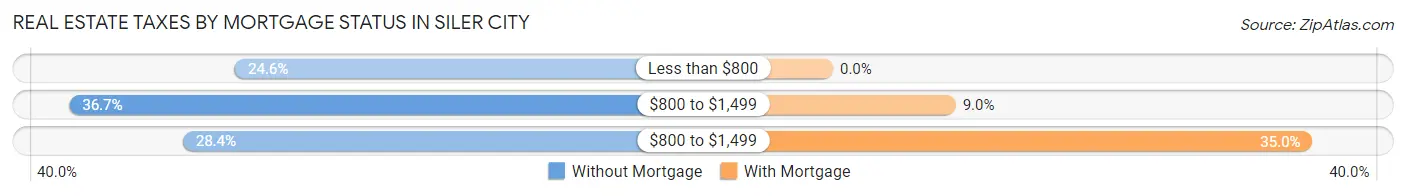
| Property Taxes | Without Mortgage | With Mortgage |
| Less than $800 | 193 (24.6%) | 0 (0.0%) |
| $800 to $1,499 | 288 (36.7%) | 78 (9.0%) |
| $800 to $1,499 | 223 (28.4%) | 305 (35.0%) |
| Total | 784 (100.0%) | 871 (100.0%) |
Health & Disability in Siler City
Health Insurance Coverage by Age in Siler City
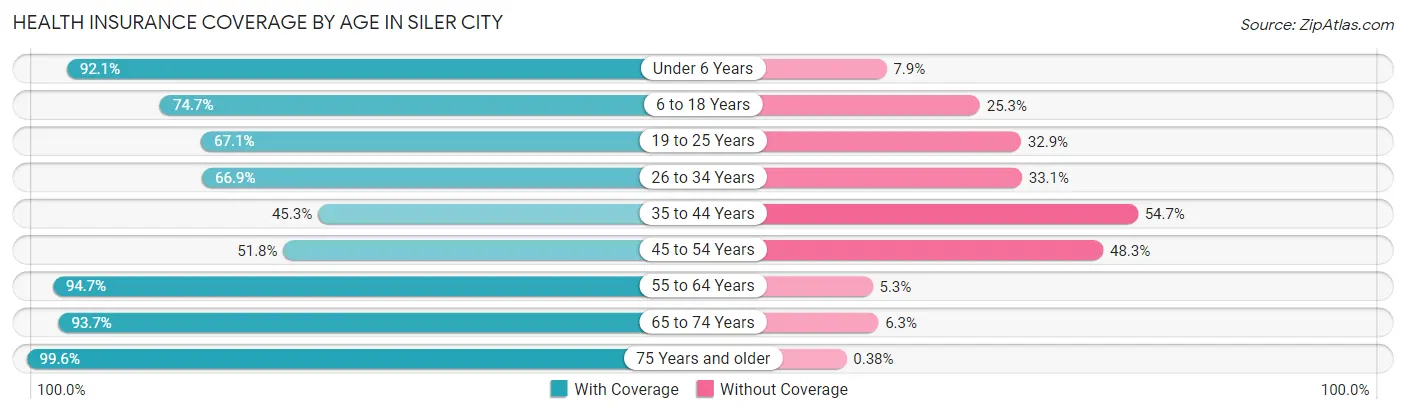
| Age Bracket | With Coverage | Without Coverage |
| Under 6 Years | 480 (92.1%) | 41 (7.9%) |
| 6 to 18 Years | 1,319 (74.7%) | 446 (25.3%) |
| 19 to 25 Years | 385 (67.1%) | 189 (32.9%) |
| 26 to 34 Years | 473 (66.9%) | 234 (33.1%) |
| 35 to 44 Years | 539 (45.3%) | 651 (54.7%) |
| 45 to 54 Years | 563 (51.7%) | 525 (48.2%) |
| 55 to 64 Years | 756 (94.7%) | 42 (5.3%) |
| 65 to 74 Years | 445 (93.7%) | 30 (6.3%) |
| 75 Years and older | 529 (99.6%) | 2 (0.4%) |
| Total | 5,489 (71.8%) | 2,160 (28.2%) |
Health Insurance Coverage by Citizenship Status in Siler City
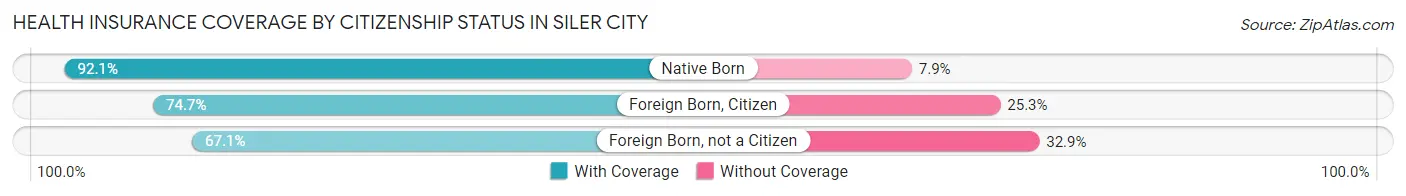
| Citizenship Status | With Coverage | Without Coverage |
| Native Born | 480 (92.1%) | 41 (7.9%) |
| Foreign Born, Citizen | 1,319 (74.7%) | 446 (25.3%) |
| Foreign Born, not a Citizen | 385 (67.1%) | 189 (32.9%) |
Health Insurance Coverage by Household Income in Siler City
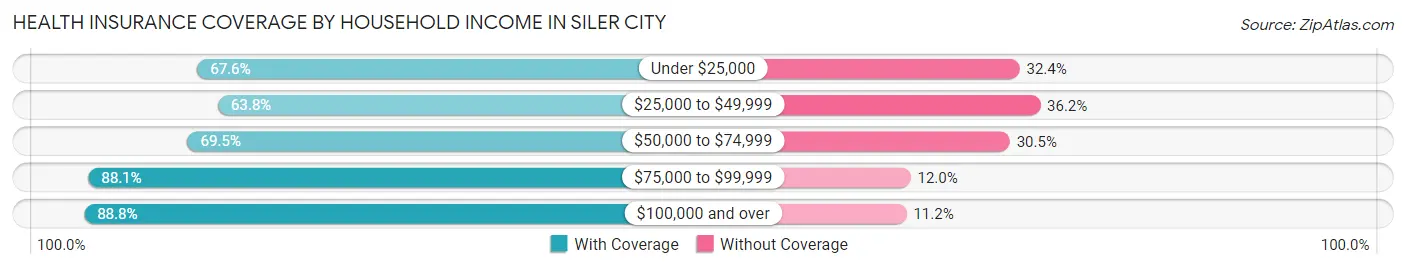
| Household Income | With Coverage | Without Coverage |
| Under $25,000 | 899 (67.6%) | 430 (32.4%) |
| $25,000 to $49,999 | 1,856 (63.8%) | 1,054 (36.2%) |
| $50,000 to $74,999 | 1,049 (69.5%) | 461 (30.5%) |
| $75,000 to $99,999 | 619 (88.0%) | 84 (11.9%) |
| $100,000 and over | 1,041 (88.8%) | 131 (11.2%) |
Public vs Private Health Insurance Coverage by Age in Siler City
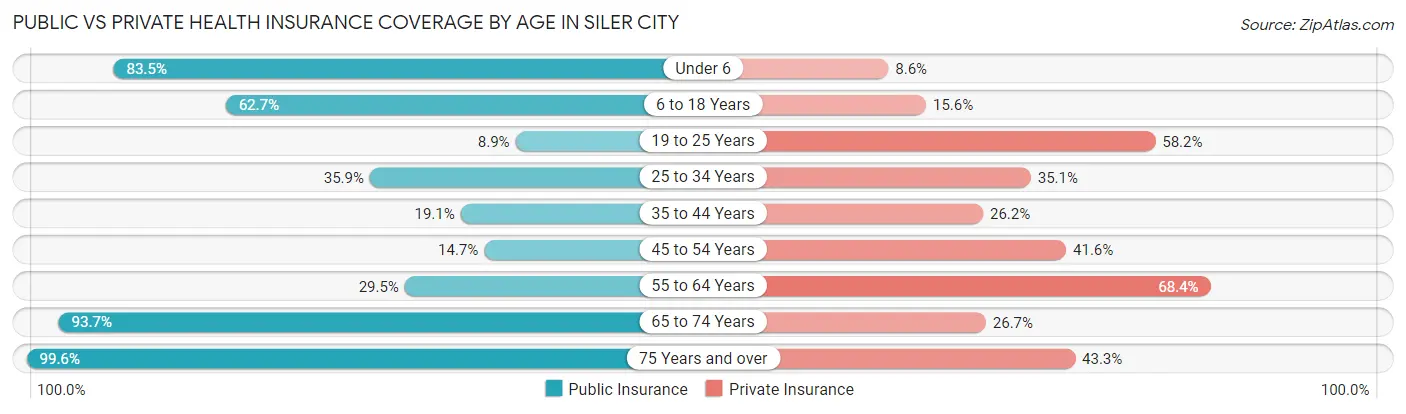
| Age Bracket | Public Insurance | Private Insurance |
| Under 6 | 435 (83.5%) | 45 (8.6%) |
| 6 to 18 Years | 1,106 (62.7%) | 276 (15.6%) |
| 19 to 25 Years | 51 (8.9%) | 334 (58.2%) |
| 25 to 34 Years | 254 (35.9%) | 248 (35.1%) |
| 35 to 44 Years | 227 (19.1%) | 312 (26.2%) |
| 45 to 54 Years | 160 (14.7%) | 453 (41.6%) |
| 55 to 64 Years | 235 (29.4%) | 546 (68.4%) |
| 65 to 74 Years | 445 (93.7%) | 127 (26.7%) |
| 75 Years and over | 529 (99.6%) | 230 (43.3%) |
| Total | 3,442 (45.0%) | 2,571 (33.6%) |
Disability Status by Sex by Age in Siler City
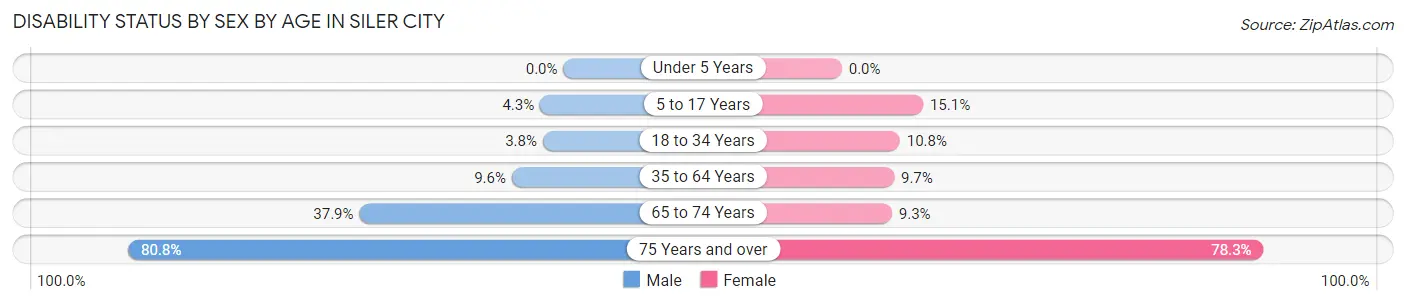
| Age Bracket | Male | Female |
| Under 5 Years | 0 (0.0%) | 0 (0.0%) |
| 5 to 17 Years | 28 (4.3%) | 162 (15.1%) |
| 18 to 34 Years | 22 (3.8%) | 96 (10.8%) |
| 35 to 64 Years | 171 (9.6%) | 125 (9.7%) |
| 65 to 74 Years | 78 (37.9%) | 25 (9.3%) |
| 75 Years and over | 143 (80.8%) | 277 (78.2%) |
Disability Class by Sex by Age in Siler City
Disability Class: Hearing Difficulty
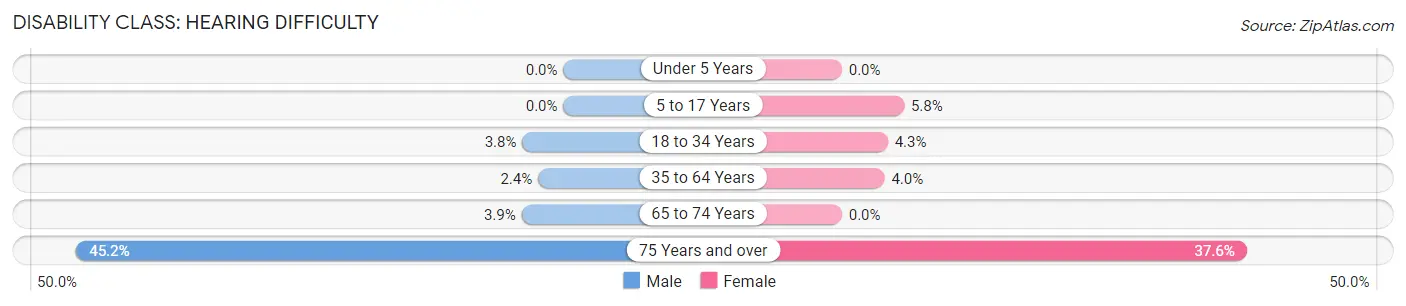
| Age Bracket | Male | Female |
| Under 5 Years | 0 (0.0%) | 0 (0.0%) |
| 5 to 17 Years | 0 (0.0%) | 62 (5.8%) |
| 18 to 34 Years | 22 (3.8%) | 38 (4.3%) |
| 35 to 64 Years | 42 (2.4%) | 51 (4.0%) |
| 65 to 74 Years | 8 (3.9%) | 0 (0.0%) |
| 75 Years and over | 80 (45.2%) | 133 (37.6%) |
Disability Class: Vision Difficulty
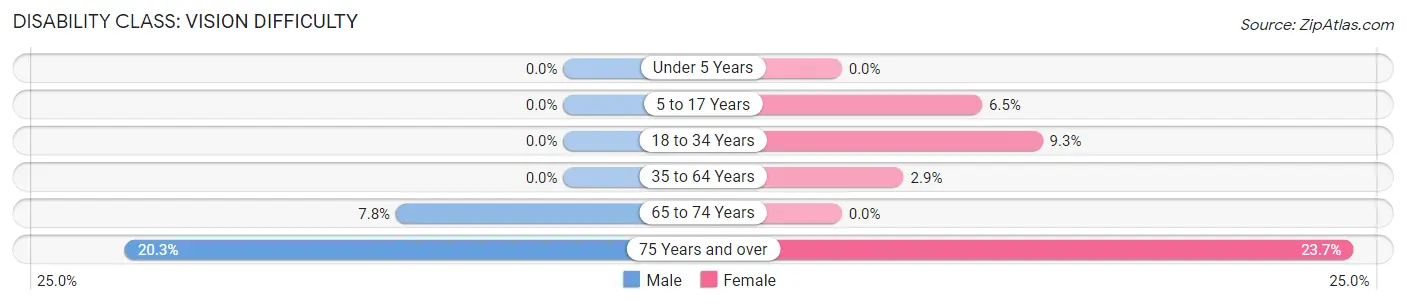
| Age Bracket | Male | Female |
| Under 5 Years | 0 (0.0%) | 0 (0.0%) |
| 5 to 17 Years | 0 (0.0%) | 70 (6.5%) |
| 18 to 34 Years | 0 (0.0%) | 83 (9.3%) |
| 35 to 64 Years | 0 (0.0%) | 37 (2.9%) |
| 65 to 74 Years | 16 (7.8%) | 0 (0.0%) |
| 75 Years and over | 36 (20.3%) | 84 (23.7%) |
Disability Class: Cognitive Difficulty
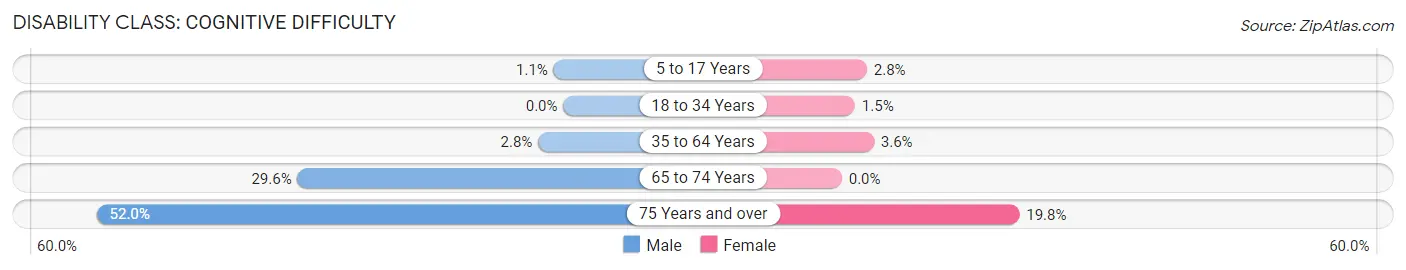
| Age Bracket | Male | Female |
| 5 to 17 Years | 7 (1.1%) | 30 (2.8%) |
| 18 to 34 Years | 0 (0.0%) | 13 (1.5%) |
| 35 to 64 Years | 50 (2.8%) | 46 (3.6%) |
| 65 to 74 Years | 61 (29.6%) | 0 (0.0%) |
| 75 Years and over | 92 (52.0%) | 70 (19.8%) |
Disability Class: Ambulatory Difficulty
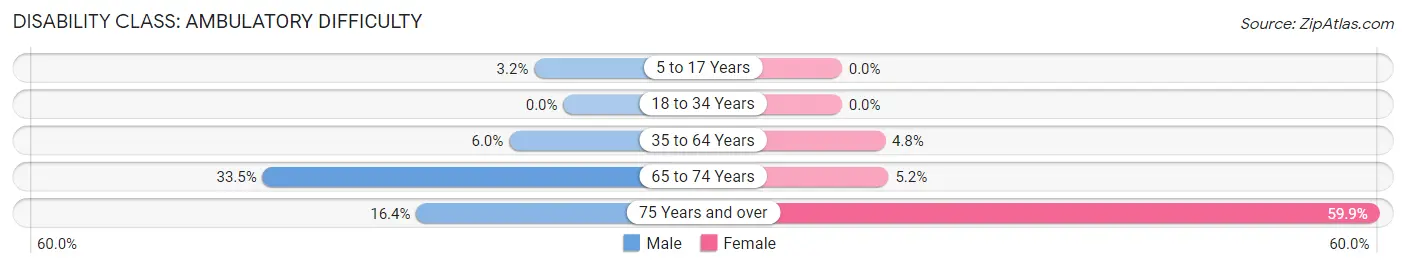
| Age Bracket | Male | Female |
| 5 to 17 Years | 21 (3.2%) | 0 (0.0%) |
| 18 to 34 Years | 0 (0.0%) | 0 (0.0%) |
| 35 to 64 Years | 108 (6.0%) | 62 (4.8%) |
| 65 to 74 Years | 69 (33.5%) | 14 (5.2%) |
| 75 Years and over | 29 (16.4%) | 212 (59.9%) |
Disability Class: Self-Care Difficulty
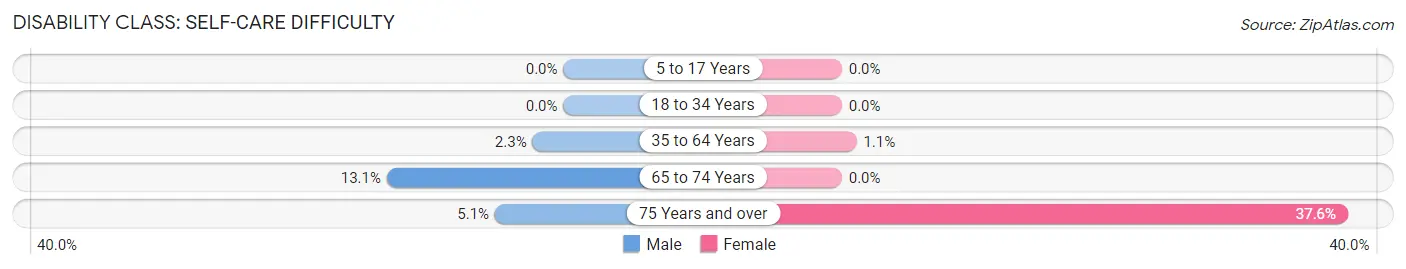
| Age Bracket | Male | Female |
| 5 to 17 Years | 0 (0.0%) | 0 (0.0%) |
| 18 to 34 Years | 0 (0.0%) | 0 (0.0%) |
| 35 to 64 Years | 41 (2.3%) | 14 (1.1%) |
| 65 to 74 Years | 27 (13.1%) | 0 (0.0%) |
| 75 Years and over | 9 (5.1%) | 133 (37.6%) |
Technology Access in Siler City
Computing Device Access in Siler City
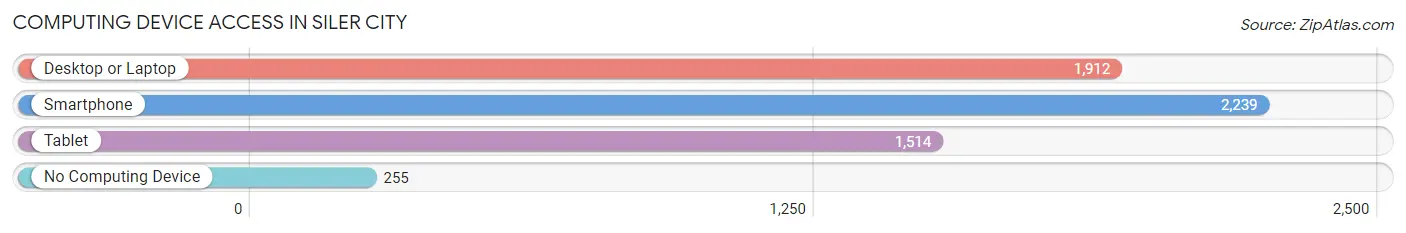
| Device Type | # Households | % Households |
| Desktop or Laptop | 1,912 | 68.2% |
| Smartphone | 2,239 | 79.8% |
| Tablet | 1,514 | 54.0% |
| No Computing Device | 255 | 9.1% |
| Total | 2,805 | 100.0% |
Internet Access in Siler City
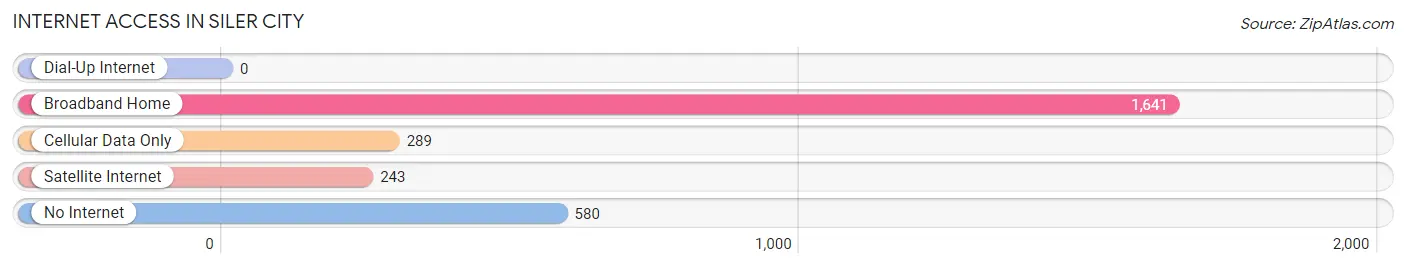
| Internet Type | # Households | % Households |
| Dial-Up Internet | 0 | 0.0% |
| Broadband Home | 1,641 | 58.5% |
| Cellular Data Only | 289 | 10.3% |
| Satellite Internet | 243 | 8.7% |
| No Internet | 580 | 20.7% |
| Total | 2,805 | 100.0% |
Siler City Summary
Siler City is a small town located in Chatham County, North Carolina. It is situated in the heart of the North Carolina Piedmont region, approximately 50 miles southwest of Raleigh. The town was founded in 1856 and named after the Siler family, who were early settlers in the area. The population of Siler City was 8,072 as of the 2010 census.
Geography
Siler City is located at 35°45'25" North, 79°31'17" West (35.7569, -79.5214). It is situated in the North Carolina Piedmont region, approximately 50 miles southwest of Raleigh. The town is located in the center of Chatham County, and is bordered by the towns of Pittsboro, Goldston, and Bear Creek. The town is situated on the banks of the Haw River, which flows through the center of town. The terrain of the area is generally flat, with rolling hills to the east and west.
Climate
Siler City has a humid subtropical climate, with hot, humid summers and mild winters. The average annual temperature is 61°F (16°C), with an average high of 79°F (26°C) in July and an average low of 43°F (6°C) in January. The average annual precipitation is 45 inches (114 cm).
Demographics
As of the 2010 census, the population of Siler City was 8,072. The racial makeup of the town was 68.3% White, 24.3% African American, 0.3% Native American, 0.7% Asian, 0.1% Pacific Islander, 4.7% from other races, and 1.4% from two or more races. Hispanic or Latino of any race were 8.7% of the population.
Economy
Siler City is a small town with a diverse economy. The town is home to a variety of businesses, including manufacturing, retail, and service industries. The largest employers in the town are Tyson Foods, Inc., Chatham Manufacturing, and Siler City Country Club. The town is also home to several small businesses, including restaurants, shops, and professional services.
The town is served by the Chatham County Airport, which is located just outside of town. The airport offers daily flights to Charlotte, Raleigh, and other destinations.
History
Siler City was founded in 1856 and named after the Siler family, who were early settlers in the area. The town was originally a farming community, but began to grow in the late 19th century with the arrival of the railroad. The town was incorporated in 1887 and has since grown to become a small but vibrant community.
In the early 20th century, Siler City was a major center for the textile industry. The town was home to several large mills, which provided employment for many of the town’s residents. The mills began to close in the late 20th century, and the town’s economy shifted to focus on other industries.
Today, Siler City is a small but vibrant town. The town is home to a variety of businesses, including manufacturing, retail, and service industries. The town is also home to several small businesses, including restaurants, shops, and professional services. The town is served by the Chatham County Airport, which offers daily flights to Charlotte, Raleigh, and other destinations.
Common Questions
What is Per Capita Income in Siler City?
Per Capita income in Siler City is $27,875.
What is the Median Family Income in Siler City?
Median Family Income in Siler City is $49,900.
What is the Median Household income in Siler City?
Median Household Income in Siler City is $48,374.
What is Income or Wage Gap in Siler City?
Income or Wage Gap in Siler City is 3.4%.
Women in Siler City earn 96.6 cents for every dollar earned by a man.
What is Inequality or Gini Index in Siler City?
Inequality or Gini Index in Siler City is 0.53.
What is the Total Population of Siler City?
Total Population of Siler City is 7,847.
What is the Total Male Population of Siler City?
Total Male Population of Siler City is 3,623.
What is the Total Female Population of Siler City?
Total Female Population of Siler City is 4,224.
What is the Ratio of Males per 100 Females in Siler City?
There are 85.77 Males per 100 Females in Siler City.
What is the Ratio of Females per 100 Males in Siler City?
There are 116.59 Females per 100 Males in Siler City.
What is the Median Population Age in Siler City?
Median Population Age in Siler City is 37.3 Years.
What is the Average Family Size in Siler City
Average Family Size in Siler City is 3.3 People.
What is the Average Household Size in Siler City
Average Household Size in Siler City is 2.7 People.
How Large is the Labor Force in Siler City?
There are 3,645 People in the Labor Forcein in Siler City.
What is the Percentage of People in the Labor Force in Siler City?
60.4% of People are in the Labor Force in Siler City.
What is the Unemployment Rate in Siler City?
Unemployment Rate in Siler City is 2.8%.