Drexel, NC Map & Demographics
Drexel Map
Drexel Overview
$31,555
PER CAPITA INCOME
$68,451
AVG FAMILY INCOME
$59,052
AVG HOUSEHOLD INCOME
26.0%
WAGE / INCOME GAP [ % ]
74.0¢/ $1
WAGE / INCOME GAP [ $ ]
0.37
INEQUALITY / GINI INDEX
1,768
TOTAL POPULATION
924
MALE POPULATION
844
FEMALE POPULATION
109.48
MALES / 100 FEMALES
91.34
FEMALES / 100 MALES
47.6
MEDIAN AGE
2.7
AVG FAMILY SIZE
2.3
AVG HOUSEHOLD SIZE
854
LABOR FORCE [ PEOPLE ]
55.7%
PERCENT IN LABOR FORCE
4.6%
UNEMPLOYMENT RATE
Drexel Zip Codes
Drexel Area Codes
Income in Drexel
Income Overview in Drexel
Per Capita Income in Drexel is $31,555, while median incomes of families and households are $68,451 and $59,052 respectively.
| Characteristic | Number | Measure |
| Per Capita Income | 1,768 | $31,555 |
| Median Family Income | 475 | $68,451 |
| Mean Family Income | 475 | $81,199 |
| Median Household Income | 730 | $59,052 |
| Mean Household Income | 730 | $68,959 |
| Income Deficit | 475 | $0 |
| Wage / Income Gap (%) | 1,768 | 26.04% |
| Wage / Income Gap ($) | 1,768 | 73.96¢ per $1 |
| Gini / Inequality Index | 1,768 | 0.37 |
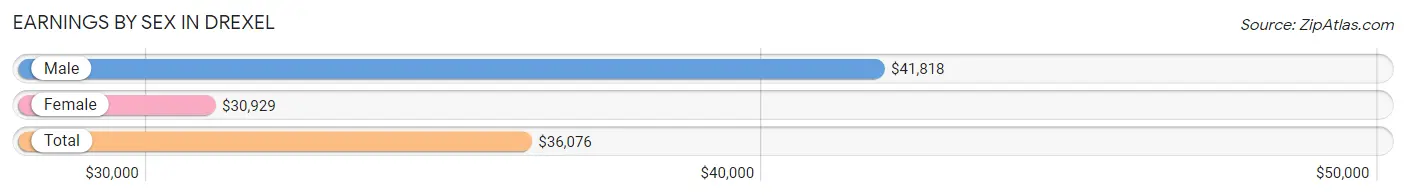
Earnings by Sex in Drexel
Average Earnings in Drexel are $36,076, $41,818 for men and $30,929 for women, a difference of 26.0%.
| Sex | Number | Average Earnings |
| Male | 506 (57.5%) | $41,818 |
| Female | 374 (42.5%) | $30,929 |
| Total | 880 (100.0%) | $36,076 |
Earnings by Sex by Income Bracket in Drexel
The most common earnings brackets in Drexel are $75,000 to $99,999 for men (67 | 13.2%) and $35,000 to $39,999 for women (66 | 17.6%).
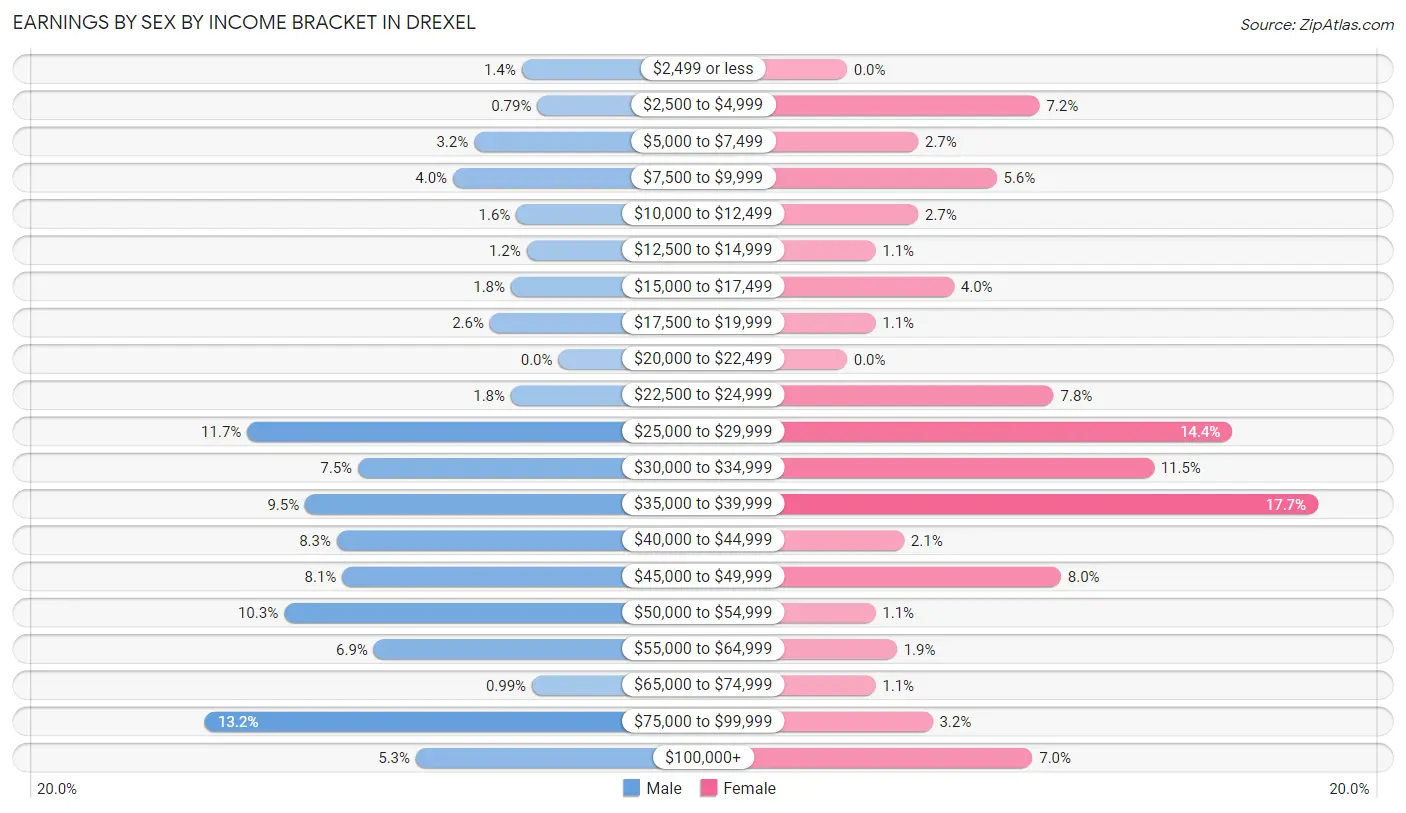
| Income | Male | Female |
| $2,499 or less | 7 (1.4%) | 0 (0.0%) |
| $2,500 to $4,999 | 4 (0.8%) | 27 (7.2%) |
| $5,000 to $7,499 | 16 (3.2%) | 10 (2.7%) |
| $7,500 to $9,999 | 20 (4.0%) | 21 (5.6%) |
| $10,000 to $12,499 | 8 (1.6%) | 10 (2.7%) |
| $12,500 to $14,999 | 6 (1.2%) | 4 (1.1%) |
| $15,000 to $17,499 | 9 (1.8%) | 15 (4.0%) |
| $17,500 to $19,999 | 13 (2.6%) | 4 (1.1%) |
| $20,000 to $22,499 | 0 (0.0%) | 0 (0.0%) |
| $22,500 to $24,999 | 9 (1.8%) | 29 (7.7%) |
| $25,000 to $29,999 | 59 (11.7%) | 54 (14.4%) |
| $30,000 to $34,999 | 38 (7.5%) | 43 (11.5%) |
| $35,000 to $39,999 | 48 (9.5%) | 66 (17.6%) |
| $40,000 to $44,999 | 42 (8.3%) | 8 (2.1%) |
| $45,000 to $49,999 | 41 (8.1%) | 30 (8.0%) |
| $50,000 to $54,999 | 52 (10.3%) | 4 (1.1%) |
| $55,000 to $64,999 | 35 (6.9%) | 7 (1.9%) |
| $65,000 to $74,999 | 5 (1.0%) | 4 (1.1%) |
| $75,000 to $99,999 | 67 (13.2%) | 12 (3.2%) |
| $100,000+ | 27 (5.3%) | 26 (7.0%) |
| Total | 506 (100.0%) | 374 (100.0%) |
Earnings by Sex by Educational Attainment in Drexel
Average earnings in Drexel are $44,563 for men and $31,857 for women, a difference of 28.5%. Men with an educational attainment of college or associate's degree enjoy the highest average annual earnings of $56,765, while those with less than high school education earn the least with $28,702. Women with an educational attainment of graduate degree earn the most with the average annual earnings of $106,806, while those with high school diploma education have the smallest earnings of $23,684.
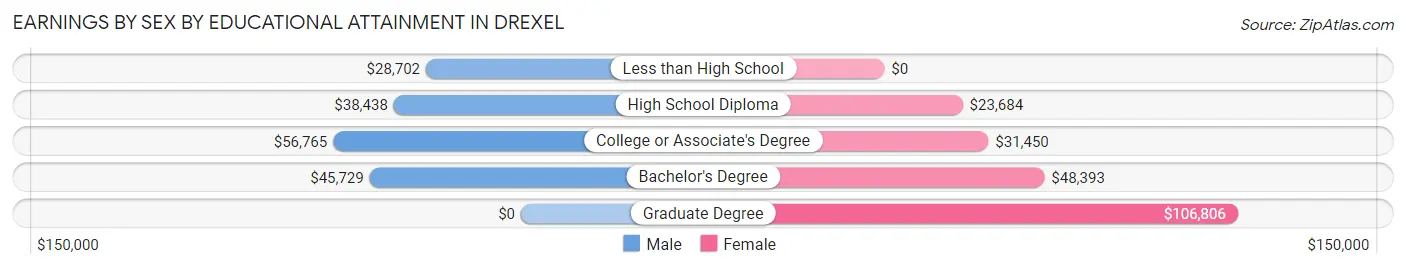
| Educational Attainment | Male Income | Female Income |
| Less than High School | $28,702 | $0 |
| High School Diploma | $38,438 | $23,684 |
| College or Associate's Degree | $56,765 | $31,450 |
| Bachelor's Degree | $45,729 | $48,393 |
| Graduate Degree | - | - |
| Total | $44,563 | $31,857 |
Family Income in Drexel
Family Income Brackets in Drexel
According to the Drexel family income data, there are 123 families falling into the $50,000 to $74,999 income range, which is the most common income bracket and makes up 25.9% of all families.
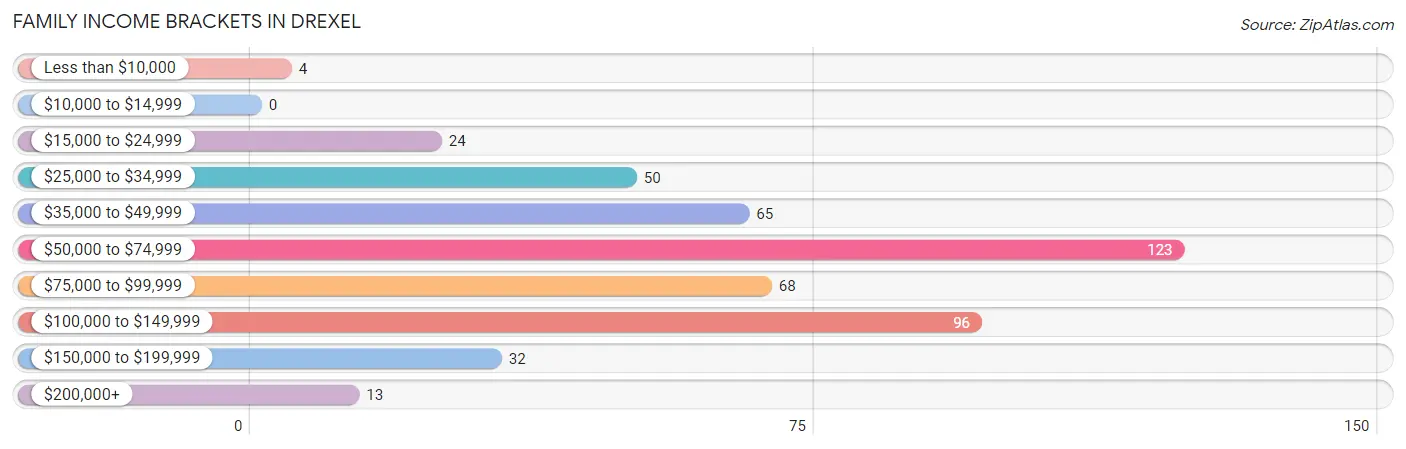
| Income Bracket | # Families | % Families |
| Less than $10,000 | 4 | 0.8% |
| $10,000 to $14,999 | 0 | 0.0% |
| $15,000 to $24,999 | 24 | 5.1% |
| $25,000 to $34,999 | 50 | 10.5% |
| $35,000 to $49,999 | 65 | 13.7% |
| $50,000 to $74,999 | 123 | 25.9% |
| $75,000 to $99,999 | 68 | 14.3% |
| $100,000 to $149,999 | 96 | 20.2% |
| $150,000 to $199,999 | 32 | 6.7% |
| $200,000+ | 13 | 2.7% |
Family Income by Famaliy Size in Drexel
5-person families (25 | 5.3%) account for the highest median family income in Drexel with $104,250 per family, while 2-person families (311 | 65.5%) have the highest median income of $33,764 per family member.
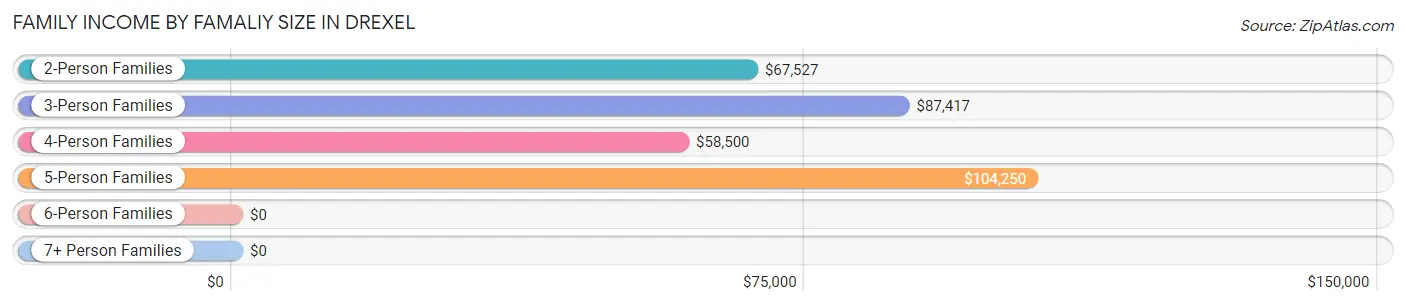
| Income Bracket | # Families | Median Income |
| 2-Person Families | 311 (65.5%) | $67,527 |
| 3-Person Families | 83 (17.5%) | $87,417 |
| 4-Person Families | 56 (11.8%) | $58,500 |
| 5-Person Families | 25 (5.3%) | $104,250 |
| 6-Person Families | 0 (0.0%) | $0 |
| 7+ Person Families | 0 (0.0%) | $0 |
| Total | 475 (100.0%) | $68,451 |
Family Income by Number of Earners in Drexel
The median family income in Drexel is $68,451, with families comprising 3+ earners (29) having the highest median family income of $123,092, while families with 1 earner (183) have the lowest median family income of $46,146, accounting for 6.1% and 38.5% of families, respectively.
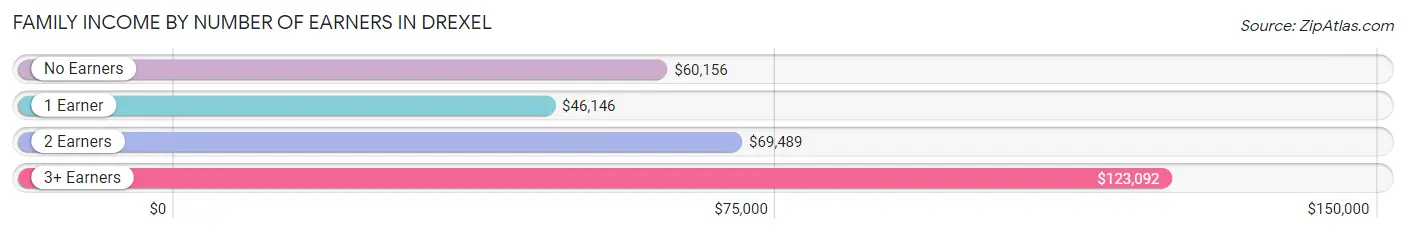
| Number of Earners | # Families | Median Income |
| No Earners | 89 (18.7%) | $60,156 |
| 1 Earner | 183 (38.5%) | $46,146 |
| 2 Earners | 174 (36.6%) | $69,489 |
| 3+ Earners | 29 (6.1%) | $123,092 |
| Total | 475 (100.0%) | $68,451 |
Household Income in Drexel
Household Income Brackets in Drexel
With 191 households falling in the category, the $50,000 to $74,999 income range is the most frequent in Drexel, accounting for 26.2% of all households. In contrast, only 13 households (1.8%) fall into the $200,000+ income bracket, making it the least populous group.
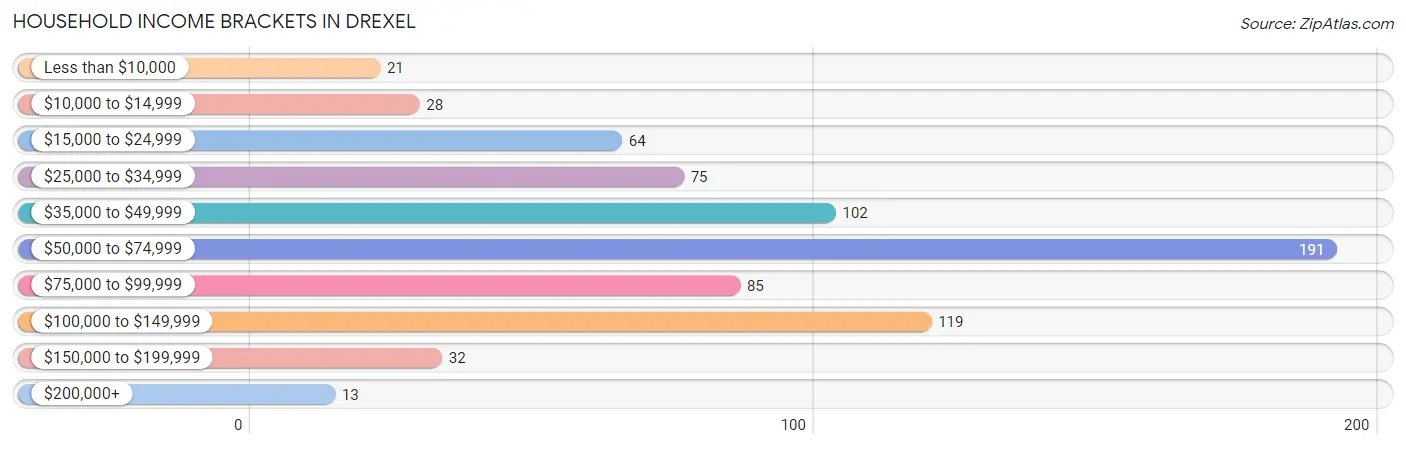
| Income Bracket | # Households | % Households |
| Less than $10,000 | 21 | 2.9% |
| $10,000 to $14,999 | 28 | 3.8% |
| $15,000 to $24,999 | 64 | 8.8% |
| $25,000 to $34,999 | 75 | 10.3% |
| $35,000 to $49,999 | 102 | 14.0% |
| $50,000 to $74,999 | 191 | 26.2% |
| $75,000 to $99,999 | 85 | 11.6% |
| $100,000 to $149,999 | 119 | 16.3% |
| $150,000 to $199,999 | 32 | 4.4% |
| $200,000+ | 13 | 1.8% |
Household Income by Householder Age in Drexel
The median household income in Drexel is $59,052, with the highest median household income of $67,500 found in the 25 to 44 years age bracket for the primary householder. A total of 226 households (31.0%) fall into this category. Meanwhile, the 15 to 24 years age bracket for the primary householder has the lowest median household income of $0, with 20 households (2.7%) in this group.
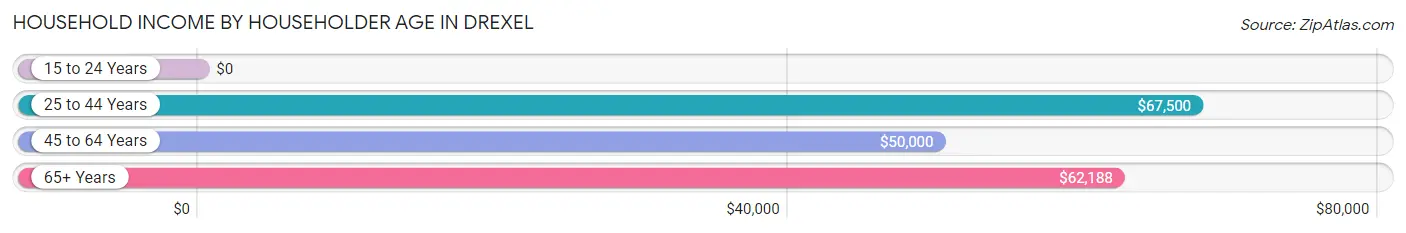
| Income Bracket | # Households | Median Income |
| 15 to 24 Years | 20 (2.7%) | $0 |
| 25 to 44 Years | 226 (31.0%) | $67,500 |
| 45 to 64 Years | 232 (31.8%) | $50,000 |
| 65+ Years | 252 (34.5%) | $62,188 |
| Total | 730 (100.0%) | $59,052 |
Poverty in Drexel
Income Below Poverty by Sex and Age in Drexel
With 9.2% poverty level for males and 8.8% for females among the residents of Drexel, 55 to 64 year old males and 16 and 17 year old females are the most vulnerable to poverty, with 19 males (21.3%) and 8 females (100.0%) in their respective age groups living below the poverty level.
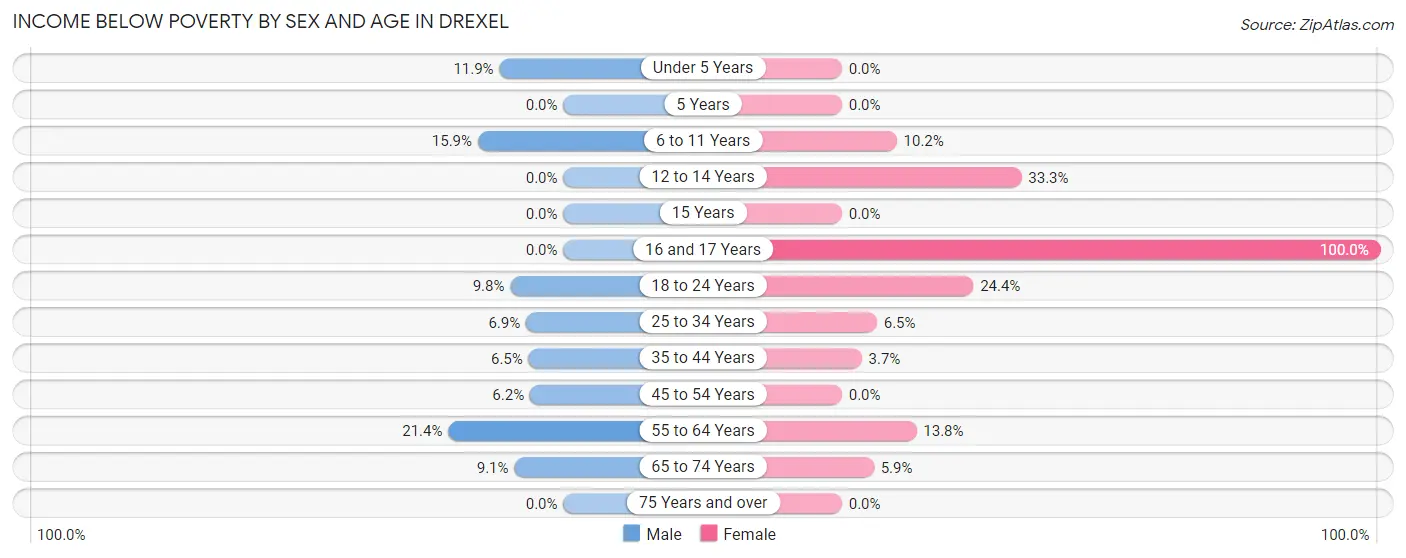
| Age Bracket | Male | Female |
| Under 5 Years | 7 (11.9%) | 0 (0.0%) |
| 5 Years | 0 (0.0%) | 0 (0.0%) |
| 6 to 11 Years | 10 (15.9%) | 6 (10.2%) |
| 12 to 14 Years | 0 (0.0%) | 5 (33.3%) |
| 15 Years | 0 (0.0%) | 0 (0.0%) |
| 16 and 17 Years | 0 (0.0%) | 8 (100.0%) |
| 18 to 24 Years | 6 (9.8%) | 10 (24.4%) |
| 25 to 34 Years | 9 (6.9%) | 8 (6.5%) |
| 35 to 44 Years | 4 (6.5%) | 4 (3.7%) |
| 45 to 54 Years | 12 (6.2%) | 0 (0.0%) |
| 55 to 64 Years | 19 (21.3%) | 22 (13.8%) |
| 65 to 74 Years | 13 (9.1%) | 7 (5.9%) |
| 75 Years and over | 0 (0.0%) | 0 (0.0%) |
| Total | 80 (9.2%) | 70 (8.8%) |
Income Above Poverty by Sex and Age in Drexel
According to the poverty statistics in Drexel, males aged 12 to 14 years and females aged under 5 years are the age groups that are most secure financially, with 100.0% of males and 100.0% of females in these age groups living above the poverty line.
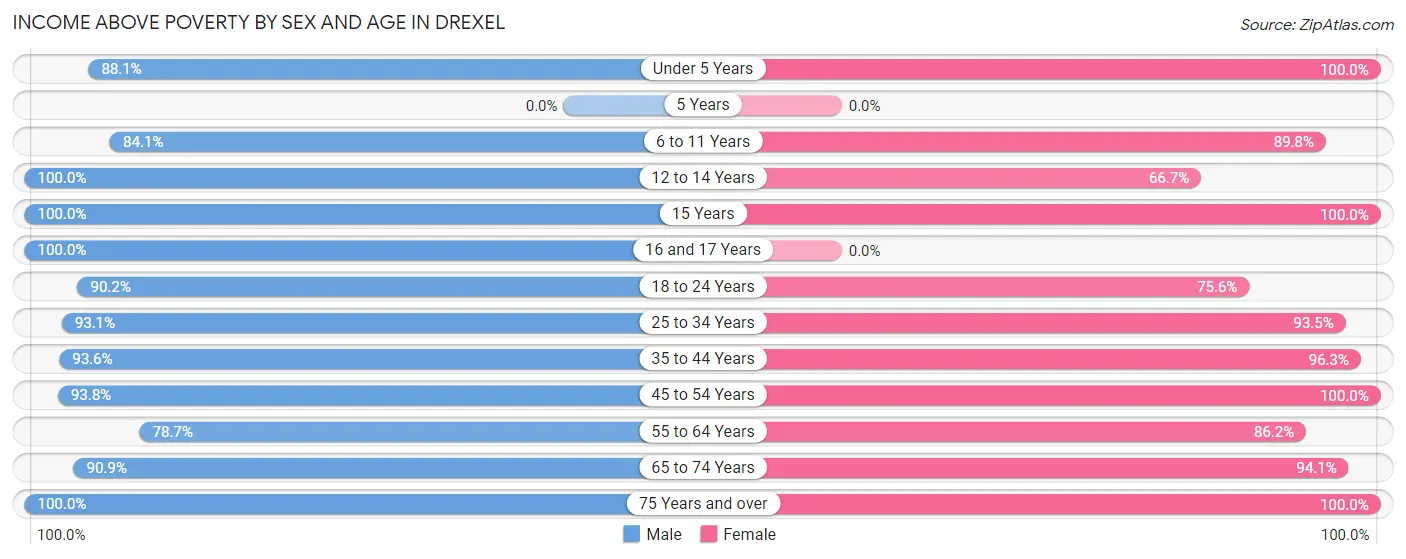
| Age Bracket | Male | Female |
| Under 5 Years | 52 (88.1%) | 19 (100.0%) |
| 5 Years | 0 (0.0%) | 0 (0.0%) |
| 6 to 11 Years | 53 (84.1%) | 53 (89.8%) |
| 12 to 14 Years | 14 (100.0%) | 10 (66.7%) |
| 15 Years | 3 (100.0%) | 3 (100.0%) |
| 16 and 17 Years | 7 (100.0%) | 0 (0.0%) |
| 18 to 24 Years | 55 (90.2%) | 31 (75.6%) |
| 25 to 34 Years | 121 (93.1%) | 115 (93.5%) |
| 35 to 44 Years | 58 (93.5%) | 105 (96.3%) |
| 45 to 54 Years | 182 (93.8%) | 54 (100.0%) |
| 55 to 64 Years | 70 (78.6%) | 137 (86.2%) |
| 65 to 74 Years | 130 (90.9%) | 111 (94.1%) |
| 75 Years and over | 40 (100.0%) | 87 (100.0%) |
| Total | 785 (90.7%) | 725 (91.2%) |
Income Below Poverty Among Married-Couple Families in Drexel
The poverty statistics for married-couple families in Drexel show that 4.4% or 15 of the total 343 families live below the poverty line. Families with 1 or 2 children have the highest poverty rate of 7.5%, comprising of 8 families. On the other hand, families with 3 or 4 children have the lowest poverty rate of 0.0%, which includes 0 families.
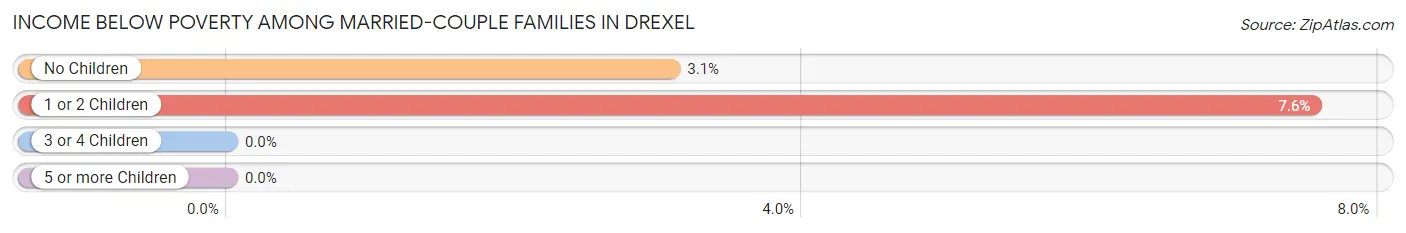
| Children | Above Poverty | Below Poverty |
| No Children | 220 (96.9%) | 7 (3.1%) |
| 1 or 2 Children | 98 (92.4%) | 8 (7.5%) |
| 3 or 4 Children | 10 (100.0%) | 0 (0.0%) |
| 5 or more Children | 0 (0.0%) | 0 (0.0%) |
| Total | 328 (95.6%) | 15 (4.4%) |
Income Below Poverty Among Single-Parent Households in Drexel
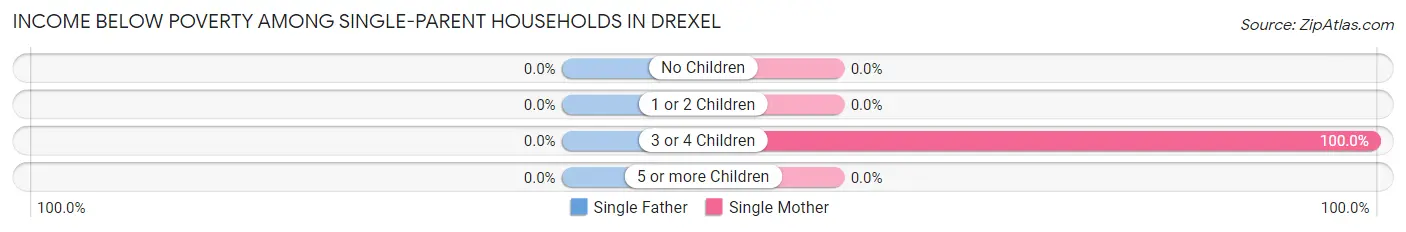
| Children | Single Father | Single Mother |
| No Children | 0 (0.0%) | 0 (0.0%) |
| 1 or 2 Children | 0 (0.0%) | 0 (0.0%) |
| 3 or 4 Children | 0 (0.0%) | 4 (100.0%) |
| 5 or more Children | 0 (0.0%) | 0 (0.0%) |
| Total | 0 (0.0%) | 4 (3.7%) |
Income Below Poverty Among Married-Couple vs Single-Parent Households in Drexel
The poverty data for Drexel shows that 15 of the married-couple family households (4.4%) and 4 of the single-parent households (3.0%) are living below the poverty level. Within the married-couple family households, those with 1 or 2 children have the highest poverty rate, with 8 households (7.5%) falling below the poverty line. Among the single-parent households, those with 3 or 4 children have the highest poverty rate, with 4 household (100.0%) living below poverty.
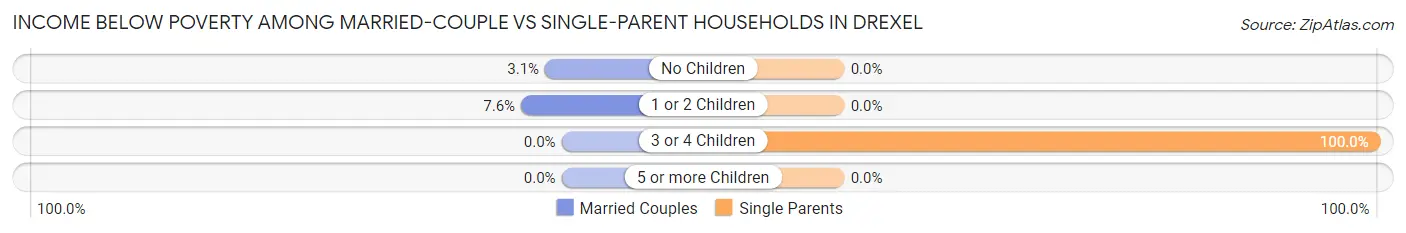
| Children | Married-Couple Families | Single-Parent Households |
| No Children | 7 (3.1%) | 0 (0.0%) |
| 1 or 2 Children | 8 (7.5%) | 0 (0.0%) |
| 3 or 4 Children | 0 (0.0%) | 4 (100.0%) |
| 5 or more Children | 0 (0.0%) | 0 (0.0%) |
| Total | 15 (4.4%) | 4 (3.0%) |
Race in Drexel
The most populous races in Drexel are White / Caucasian (1,544 | 87.3%), Black / African American (93 | 5.3%), and Asian (50 | 2.8%).
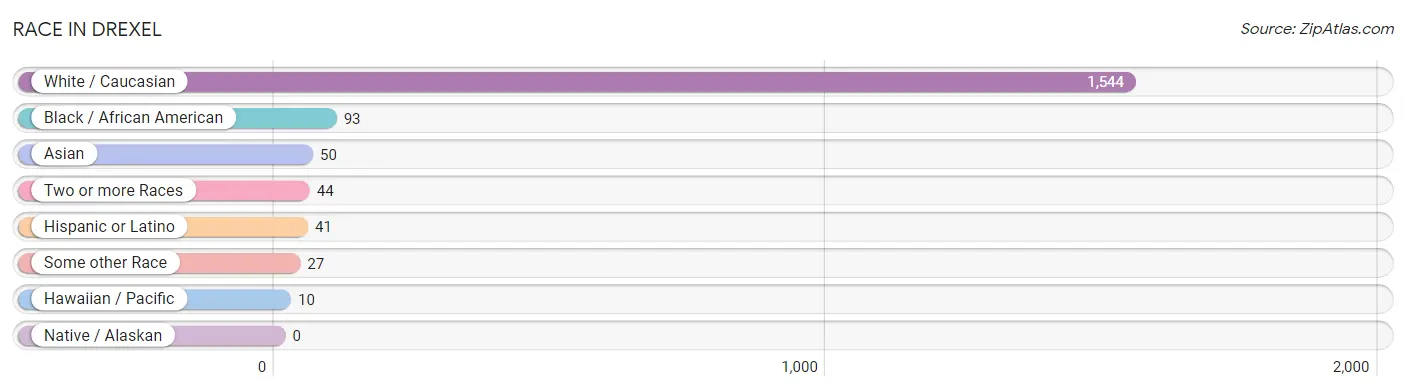
| Race | # Population | % Population |
| Asian | 50 | 2.8% |
| Black / African American | 93 | 5.3% |
| Hawaiian / Pacific | 10 | 0.6% |
| Hispanic or Latino | 41 | 2.3% |
| Native / Alaskan | 0 | 0.0% |
| White / Caucasian | 1,544 | 87.3% |
| Two or more Races | 44 | 2.5% |
| Some other Race | 27 | 1.5% |
| Total | 1,768 | 100.0% |
Ancestry in Drexel
The most populous ancestries reported in Drexel are American (591 | 33.4%), Irish (222 | 12.6%), German (176 | 10.0%), English (167 | 9.5%), and Scottish (36 | 2.0%), together accounting for 67.4% of all Drexel residents.
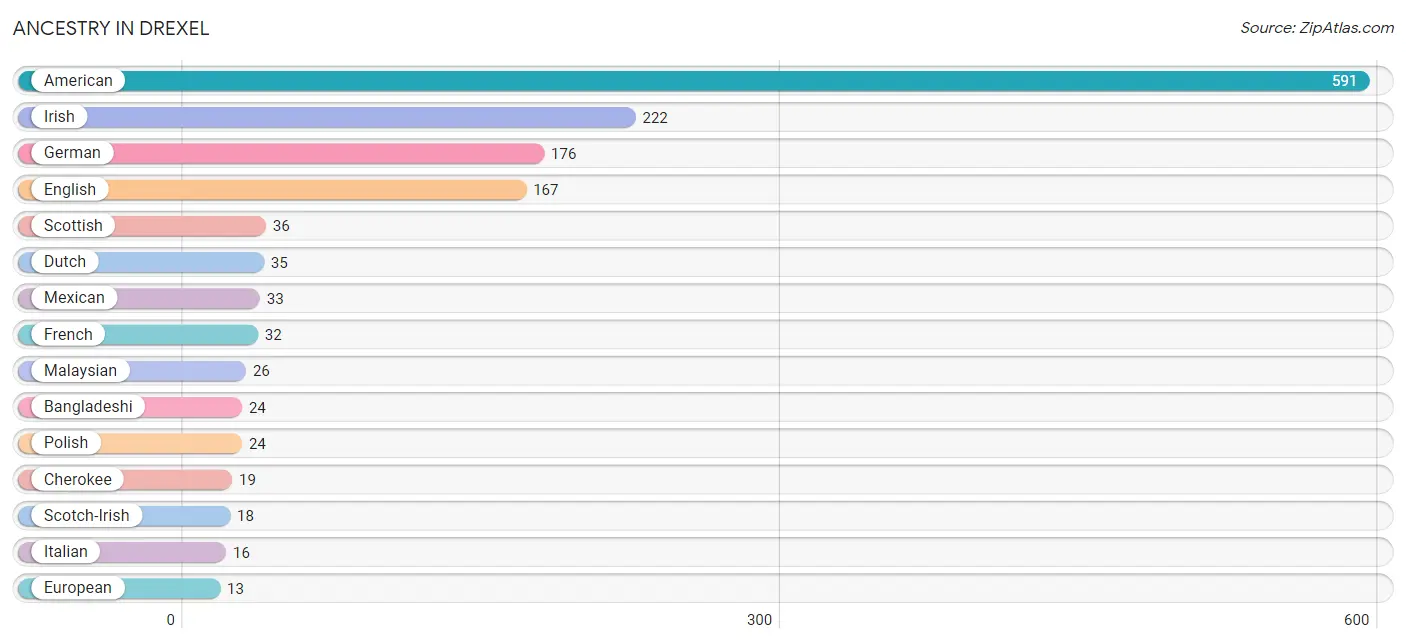
| Ancestry | # Population | % Population |
| American | 591 | 33.4% |
| Bangladeshi | 24 | 1.4% |
| Belgian | 4 | 0.2% |
| Canadian | 9 | 0.5% |
| Cherokee | 19 | 1.1% |
| Chippewa | 2 | 0.1% |
| Colombian | 2 | 0.1% |
| Dominican | 6 | 0.3% |
| Dutch | 35 | 2.0% |
| English | 167 | 9.5% |
| European | 13 | 0.7% |
| French | 32 | 1.8% |
| French Canadian | 2 | 0.1% |
| German | 176 | 10.0% |
| Irish | 222 | 12.6% |
| Italian | 16 | 0.9% |
| Malaysian | 26 | 1.5% |
| Mexican | 33 | 1.9% |
| Native Hawaiian | 10 | 0.6% |
| Norwegian | 3 | 0.2% |
| Polish | 24 | 1.4% |
| Scotch-Irish | 18 | 1.0% |
| Scottish | 36 | 2.0% |
| South American | 2 | 0.1% |
| Welsh | 8 | 0.4% | View All 25 Rows |
Immigrants in Drexel
The most numerous immigrant groups reported in Drexel came from Asia (30 | 1.7%), South Eastern Asia (30 | 1.7%), Thailand (19 | 1.1%), Latin America (16 | 0.9%), and Caribbean (12 | 0.7%), together accounting for 6.1% of all Drexel residents.
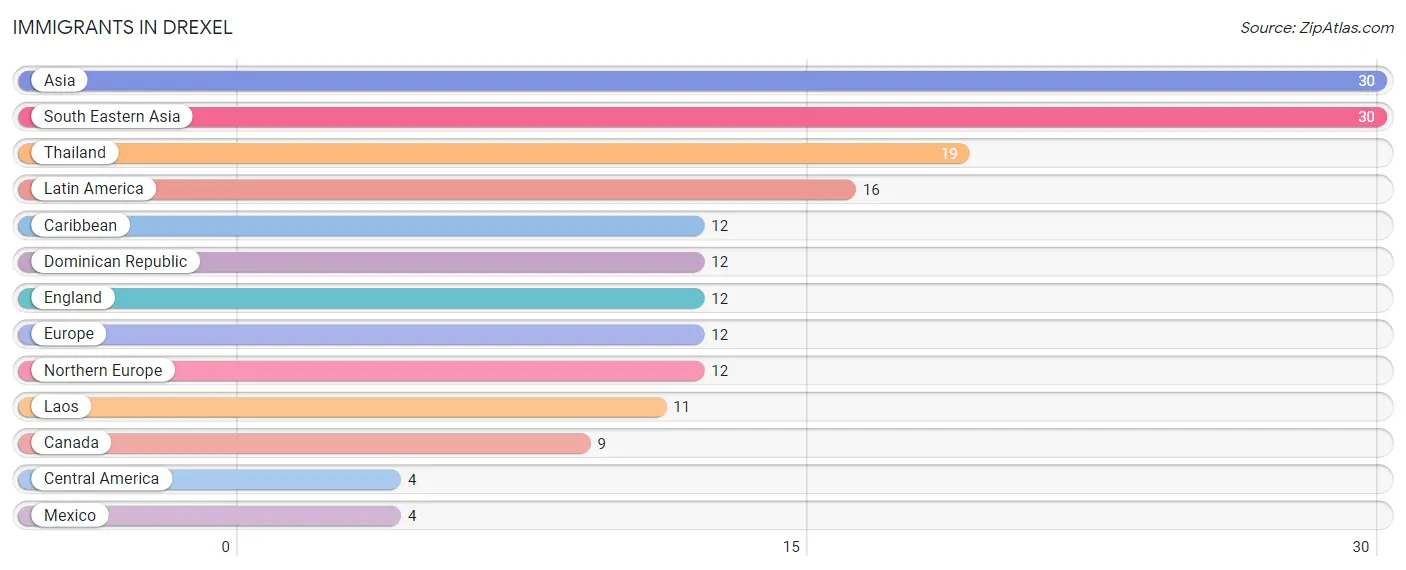
| Immigration Origin | # Population | % Population |
| Asia | 30 | 1.7% |
| Canada | 9 | 0.5% |
| Caribbean | 12 | 0.7% |
| Central America | 4 | 0.2% |
| Dominican Republic | 12 | 0.7% |
| England | 12 | 0.7% |
| Europe | 12 | 0.7% |
| Laos | 11 | 0.6% |
| Latin America | 16 | 0.9% |
| Mexico | 4 | 0.2% |
| Northern Europe | 12 | 0.7% |
| South Eastern Asia | 30 | 1.7% |
| Thailand | 19 | 1.1% | View All 13 Rows |
Sex and Age in Drexel
Sex and Age in Drexel
The most populous age groups in Drexel are 45 to 49 Years (135 | 14.6%) for men and 60 to 64 Years (122 | 14.4%) for women.
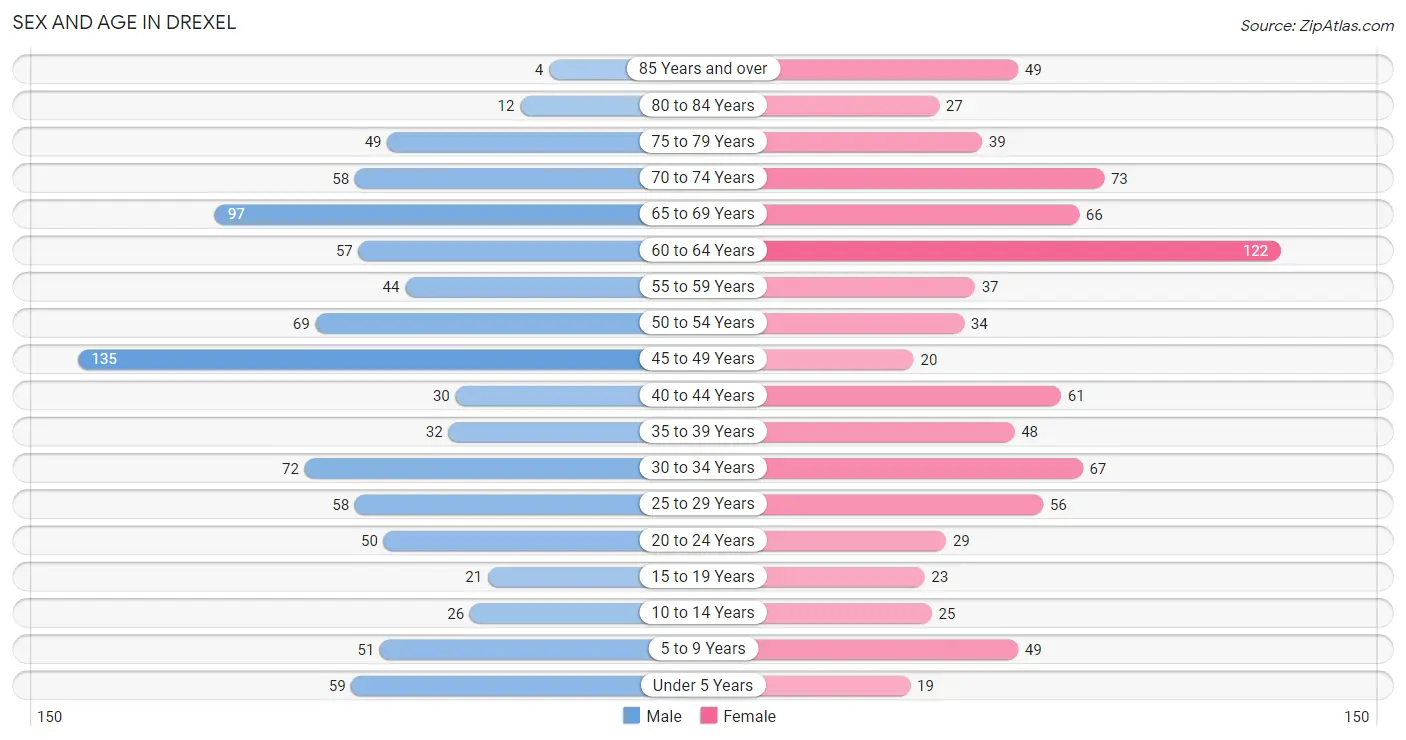
| Age Bracket | Male | Female |
| Under 5 Years | 59 (6.4%) | 19 (2.2%) |
| 5 to 9 Years | 51 (5.5%) | 49 (5.8%) |
| 10 to 14 Years | 26 (2.8%) | 25 (3.0%) |
| 15 to 19 Years | 21 (2.3%) | 23 (2.7%) |
| 20 to 24 Years | 50 (5.4%) | 29 (3.4%) |
| 25 to 29 Years | 58 (6.3%) | 56 (6.6%) |
| 30 to 34 Years | 72 (7.8%) | 67 (7.9%) |
| 35 to 39 Years | 32 (3.5%) | 48 (5.7%) |
| 40 to 44 Years | 30 (3.3%) | 61 (7.2%) |
| 45 to 49 Years | 135 (14.6%) | 20 (2.4%) |
| 50 to 54 Years | 69 (7.5%) | 34 (4.0%) |
| 55 to 59 Years | 44 (4.8%) | 37 (4.4%) |
| 60 to 64 Years | 57 (6.2%) | 122 (14.4%) |
| 65 to 69 Years | 97 (10.5%) | 66 (7.8%) |
| 70 to 74 Years | 58 (6.3%) | 73 (8.6%) |
| 75 to 79 Years | 49 (5.3%) | 39 (4.6%) |
| 80 to 84 Years | 12 (1.3%) | 27 (3.2%) |
| 85 Years and over | 4 (0.4%) | 49 (5.8%) |
| Total | 924 (100.0%) | 844 (100.0%) |
Families and Households in Drexel
Median Family Size in Drexel
The median family size in Drexel is 2.69 persons per family, with married-couple families (343 | 72.2%) accounting for the largest median family size of 2.83 persons per family. On the other hand, single female/mother families (107 | 22.5%) represent the smallest median family size with 2.30 persons per family.
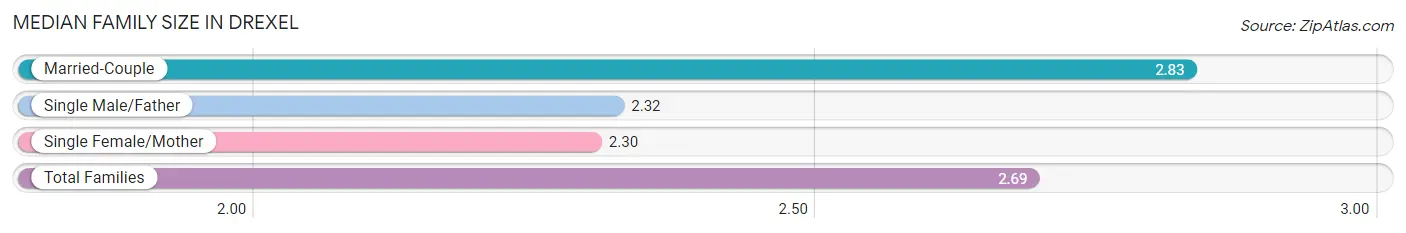
| Family Type | # Families | Family Size |
| Married-Couple | 343 (72.2%) | 2.83 |
| Single Male/Father | 25 (5.3%) | 2.32 |
| Single Female/Mother | 107 (22.5%) | 2.30 |
| Total Families | 475 (100.0%) | 2.69 |
Median Household Size in Drexel
The median household size in Drexel is 2.27 persons per household, with married-couple households (343 | 47.0%) accounting for the largest median household size of 2.83 persons per household. non-family households (255 | 34.9%) represent the smallest median household size with 1.33 persons per household.
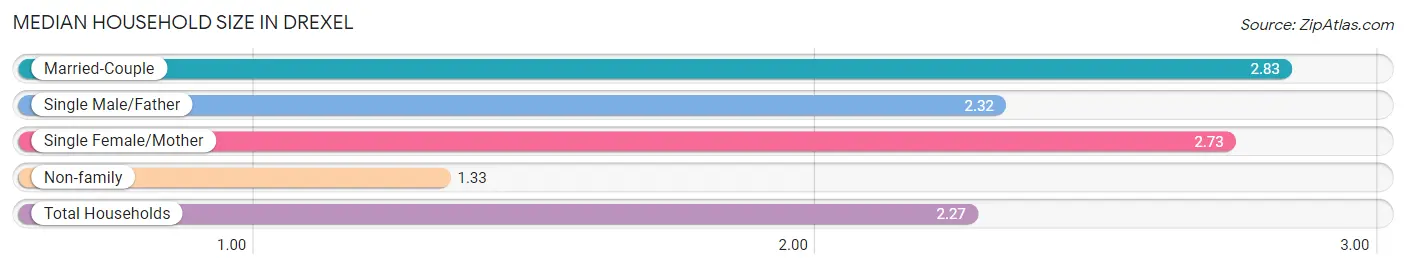
| Household Type | # Households | Household Size |
| Married-Couple | 343 (47.0%) | 2.83 |
| Single Male/Father | 25 (3.4%) | 2.32 |
| Single Female/Mother | 107 (14.7%) | 2.73 |
| Non-family | 255 (34.9%) | 1.33 |
| Total Households | 730 (100.0%) | 2.27 |
Household Size by Marriage Status in Drexel
Out of a total of 730 households in Drexel, 475 (65.1%) are family households, while 255 (34.9%) are nonfamily households. The most numerous type of family households are 2-person households, comprising 269, and the most common type of nonfamily households are 1-person households, comprising 192.
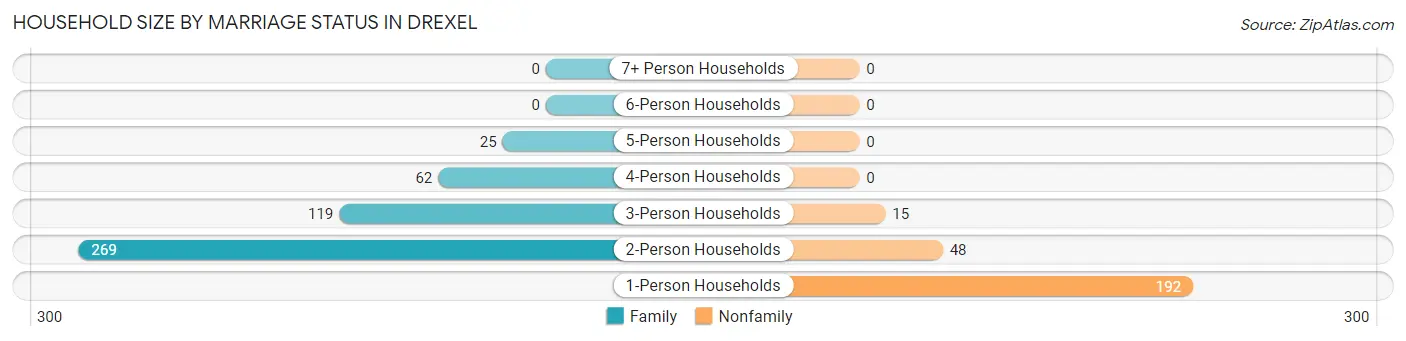
| Household Size | Family Households | Nonfamily Households |
| 1-Person Households | - | 192 (26.3%) |
| 2-Person Households | 269 (36.8%) | 48 (6.6%) |
| 3-Person Households | 119 (16.3%) | 15 (2.1%) |
| 4-Person Households | 62 (8.5%) | 0 (0.0%) |
| 5-Person Households | 25 (3.4%) | 0 (0.0%) |
| 6-Person Households | 0 (0.0%) | 0 (0.0%) |
| 7+ Person Households | 0 (0.0%) | 0 (0.0%) |
| Total | 475 (65.1%) | 255 (34.9%) |
Female Fertility in Drexel
Fertility by Age in Drexel
Average fertility rate in Drexel is 171.0 births per 1,000 women. Women in the age bracket of 20 to 34 years have the highest fertility rate with 368.0 births per 1,000 women. Women in the age bracket of 20 to 34 years acount for 100.0% of all women with births.
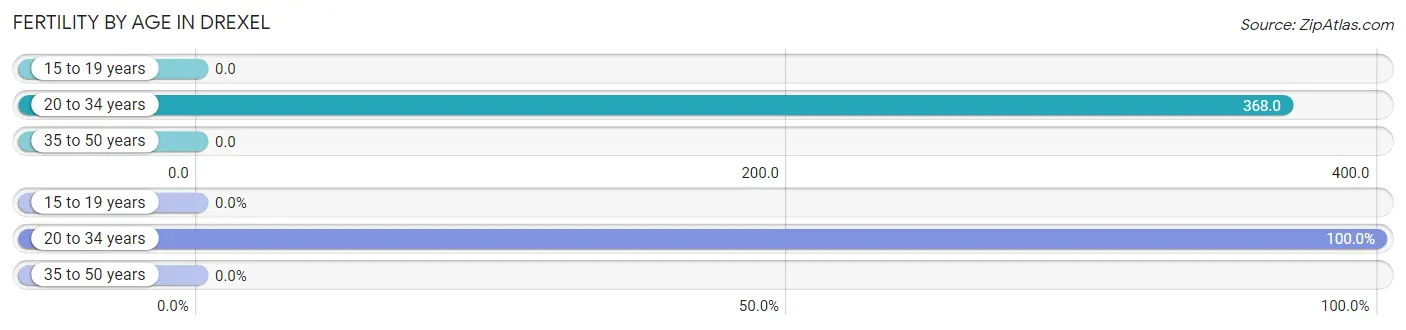
| Age Bracket | Women with Births | Births / 1,000 Women |
| 15 to 19 years | 0 (0.0%) | 0.0 |
| 20 to 34 years | 56 (100.0%) | 368.0 |
| 35 to 50 years | 0 (0.0%) | 0.0 |
| Total | 56 (100.0%) | 171.0 |
Fertility by Age by Marriage Status in Drexel
48.2% of women with births (56) in Drexel are married. The highest percentage of unmarried women with births falls into 20 to 34 years age bracket with 51.8% of them unmarried at the time of birth, while the lowest percentage of unmarried women with births belong to 20 to 34 years age bracket with 51.8% of them unmarried.
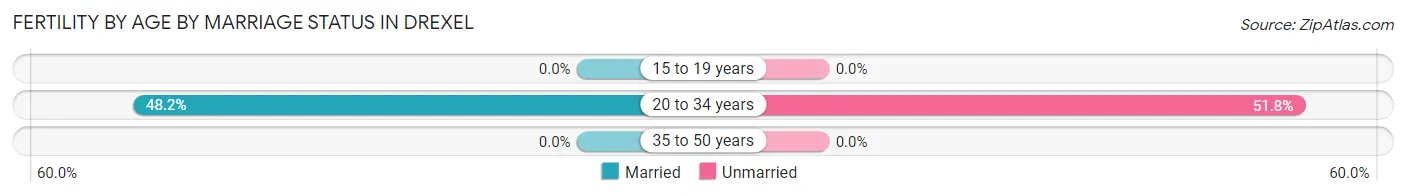
| Age Bracket | Married | Unmarried |
| 15 to 19 years | 0 (0.0%) | 0 (0.0%) |
| 20 to 34 years | 27 (48.2%) | 29 (51.8%) |
| 35 to 50 years | 0 (0.0%) | 0 (0.0%) |
| Total | 27 (48.2%) | 29 (51.8%) |
Fertility by Education in Drexel
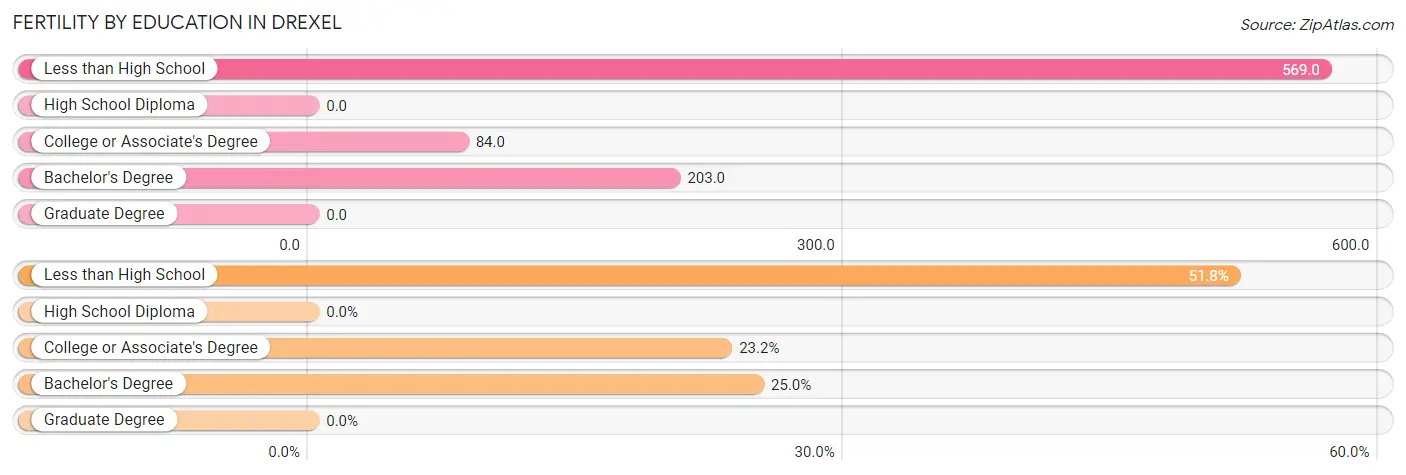
| Educational Attainment | Women with Births | Births / 1,000 Women |
| Less than High School | 29 (51.8%) | 569.0 |
| High School Diploma | 0 (0.0%) | 0.0 |
| College or Associate's Degree | 13 (23.2%) | 84.0 |
| Bachelor's Degree | 14 (25.0%) | 203.0 |
| Graduate Degree | 0 (0.0%) | 0.0 |
| Total | 56 (100.0%) | 171.0 |
Fertility by Education by Marriage Status in Drexel
51.8% of women with births in Drexel are unmarried. Women with the educational attainment of college or associate's degree are most likely to be married with 100.0% of them married at childbirth, while women with the educational attainment of less than high school are least likely to be married with 100.0% of them unmarried at childbirth.
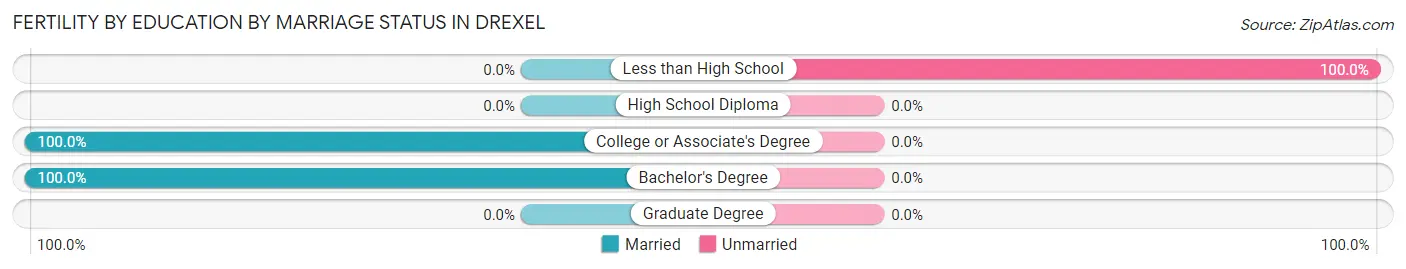
| Educational Attainment | Married | Unmarried |
| Less than High School | 0 (0.0%) | 29 (100.0%) |
| High School Diploma | 0 (0.0%) | 0 (0.0%) |
| College or Associate's Degree | 13 (100.0%) | 0 (0.0%) |
| Bachelor's Degree | 14 (100.0%) | 0 (0.0%) |
| Graduate Degree | 0 (0.0%) | 0 (0.0%) |
| Total | 27 (48.2%) | 29 (51.8%) |
Employment Characteristics in Drexel
Employment by Class of Employer in Drexel
Among the 804 employed individuals in Drexel, private company employees (591 | 73.5%), state government employees (72 | 9.0%), and not-for-profit organizations (47 | 5.9%) make up the most common classes of employment.
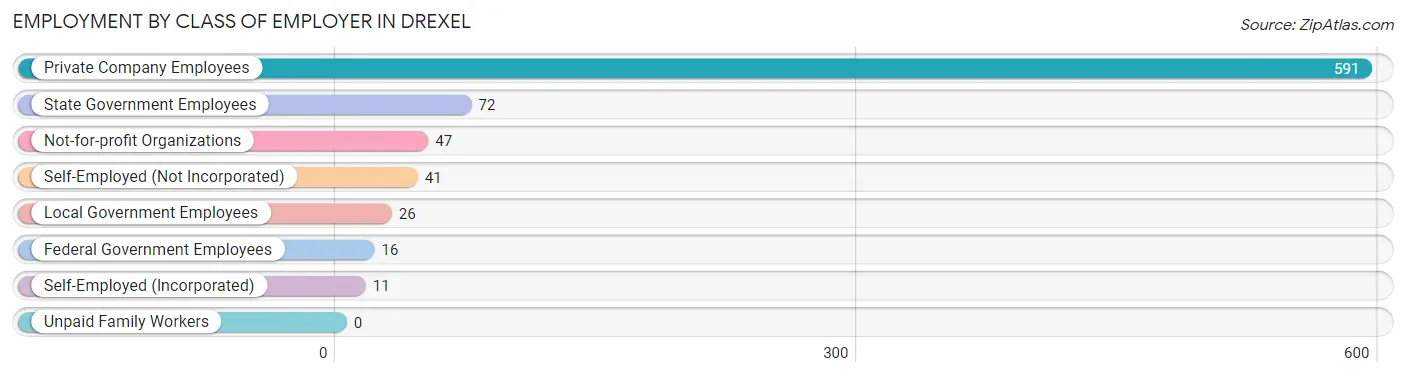
| Employer Class | # Employees | % Employees |
| Private Company Employees | 591 | 73.5% |
| Self-Employed (Incorporated) | 11 | 1.4% |
| Self-Employed (Not Incorporated) | 41 | 5.1% |
| Not-for-profit Organizations | 47 | 5.9% |
| Local Government Employees | 26 | 3.2% |
| State Government Employees | 72 | 9.0% |
| Federal Government Employees | 16 | 2.0% |
| Unpaid Family Workers | 0 | 0.0% |
| Total | 804 | 100.0% |
Employment Status by Age in Drexel
According to the labor force statistics for Drexel, out of the total population over 16 years of age (1,533), 55.7% or 854 individuals are in the labor force, with 4.6% or 39 of them unemployed. The age group with the highest labor force participation rate is 20 to 24 years, with 100.0% or 79 individuals in the labor force. Within the labor force, the 20 to 24 years age range has the highest percentage of unemployed individuals, with 12.7% or 10 of them being unemployed.
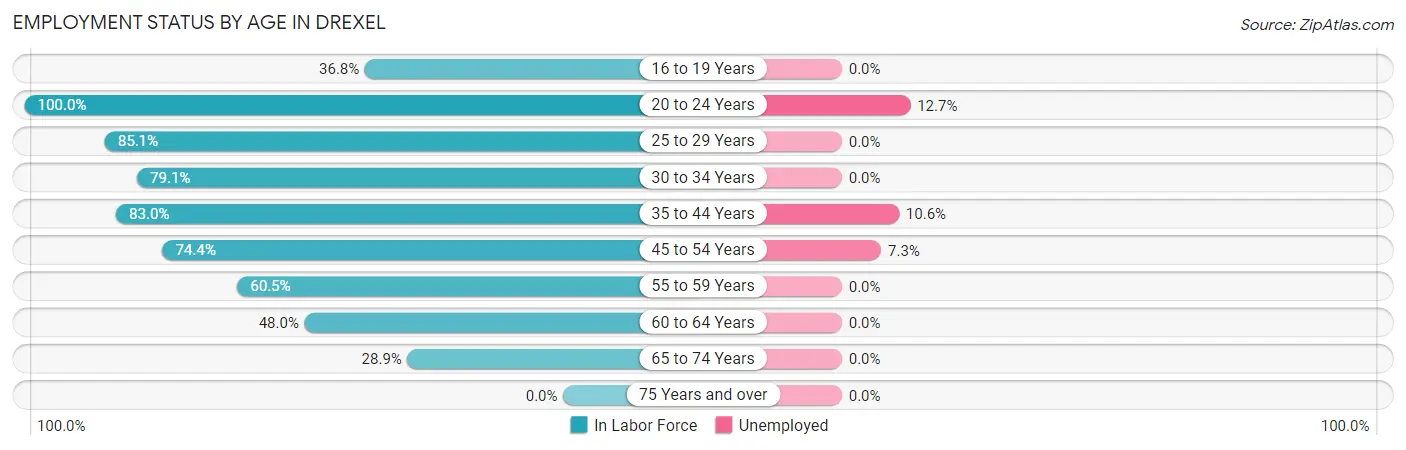
| Age Bracket | In Labor Force | Unemployed |
| 16 to 19 Years | 14 (36.8%) | 0 (0.0%) |
| 20 to 24 Years | 79 (100.0%) | 10 (12.7%) |
| 25 to 29 Years | 97 (85.1%) | 0 (0.0%) |
| 30 to 34 Years | 110 (79.1%) | 0 (0.0%) |
| 35 to 44 Years | 142 (83.0%) | 15 (10.6%) |
| 45 to 54 Years | 192 (74.4%) | 14 (7.3%) |
| 55 to 59 Years | 49 (60.5%) | 0 (0.0%) |
| 60 to 64 Years | 86 (48.0%) | 0 (0.0%) |
| 65 to 74 Years | 85 (28.9%) | 0 (0.0%) |
| 75 Years and over | 0 (0.0%) | 0 (0.0%) |
| Total | 854 (55.7%) | 39 (4.6%) |
Employment Status by Educational Attainment in Drexel
According to labor force statistics for Drexel, 71.8% of individuals (676) out of the total population between 25 and 64 years of age (942) are in the labor force, with 4.3% or 29 of them being unemployed. The group with the highest labor force participation rate are those with the educational attainment of college / associate degree, with 79.6% or 312 individuals in the labor force. Within the labor force, individuals with less than high school education have the highest percentage of unemployment, with 23.1% or 12 of them being unemployed.
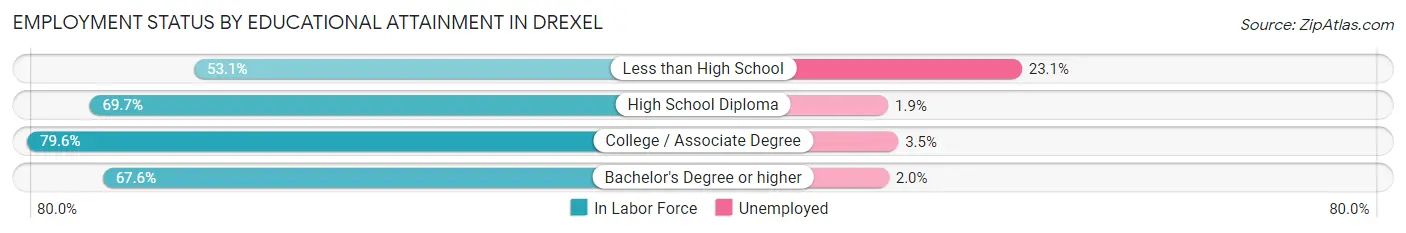
| Educational Attainment | In Labor Force | Unemployed |
| Less than High School | 52 (53.1%) | 23 (23.1%) |
| High School Diploma | 212 (69.7%) | 6 (1.9%) |
| College / Associate Degree | 312 (79.6%) | 14 (3.5%) |
| Bachelor's Degree or higher | 100 (67.6%) | 3 (2.0%) |
| Total | 676 (71.8%) | 41 (4.3%) |
Employment Occupations by Sex in Drexel
Management, Business, Science and Arts Occupations
The most common Management, Business, Science and Arts occupations in Drexel are Health Diagnosing & Treating (77 | 9.5%), Community & Social Service (71 | 8.7%), Management (57 | 7.0%), Business & Financial (48 | 5.9%), and Health Technologists (45 | 5.5%).
Management, Business, Science and Arts Occupations by Sex
Within the Management, Business, Science and Arts occupations in Drexel, the most male-oriented occupations are Computers, Engineering & Science (100.0%), Computers & Mathematics (100.0%), and Architecture & Engineering (100.0%), while the most female-oriented occupations are Education Instruction & Library (86.5%), Health Technologists (84.4%), and Management (73.7%).
| Occupation | Male | Female |
| Management | 15 (26.3%) | 42 (73.7%) |
| Business & Financial | 14 (29.2%) | 34 (70.8%) |
| Computers, Engineering & Science | 24 (100.0%) | 0 (0.0%) |
| Computers & Mathematics | 16 (100.0%) | 0 (0.0%) |
| Architecture & Engineering | 4 (100.0%) | 0 (0.0%) |
| Life, Physical & Social Science | 4 (100.0%) | 0 (0.0%) |
| Community & Social Service | 25 (35.2%) | 46 (64.8%) |
| Education, Arts & Media | 20 (58.8%) | 14 (41.2%) |
| Legal Services & Support | 0 (0.0%) | 0 (0.0%) |
| Education Instruction & Library | 5 (13.5%) | 32 (86.5%) |
| Arts, Media & Entertainment | 0 (0.0%) | 0 (0.0%) |
| Health Diagnosing & Treating | 25 (32.5%) | 52 (67.5%) |
| Health Technologists | 7 (15.6%) | 38 (84.4%) |
| Total (Category) | 103 (37.2%) | 174 (62.8%) |
| Total (Overall) | 460 (56.4%) | 355 (43.6%) |
Services Occupations
The most common Services occupations in Drexel are Healthcare Support (51 | 6.3%), Cleaning & Maintenance (26 | 3.2%), Food Preparation & Serving (24 | 2.9%), Security & Protection (16 | 2.0%), and Law Enforcement (16 | 2.0%).
Services Occupations by Sex
Within the Services occupations in Drexel, the most male-oriented occupations are Cleaning & Maintenance (65.4%), Security & Protection (56.2%), and Law Enforcement (56.2%), while the most female-oriented occupations are Personal Care & Service (100.0%), Healthcare Support (78.4%), and Food Preparation & Serving (50.0%).
| Occupation | Male | Female |
| Healthcare Support | 11 (21.6%) | 40 (78.4%) |
| Security & Protection | 9 (56.2%) | 7 (43.8%) |
| Firefighting & Prevention | 0 (0.0%) | 0 (0.0%) |
| Law Enforcement | 9 (56.2%) | 7 (43.8%) |
| Food Preparation & Serving | 12 (50.0%) | 12 (50.0%) |
| Cleaning & Maintenance | 17 (65.4%) | 9 (34.6%) |
| Personal Care & Service | 0 (0.0%) | 12 (100.0%) |
| Total (Category) | 49 (38.0%) | 80 (62.0%) |
| Total (Overall) | 460 (56.4%) | 355 (43.6%) |
Sales and Office Occupations
The most common Sales and Office occupations in Drexel are Office & Administration (47 | 5.8%), and Sales & Related (30 | 3.7%).
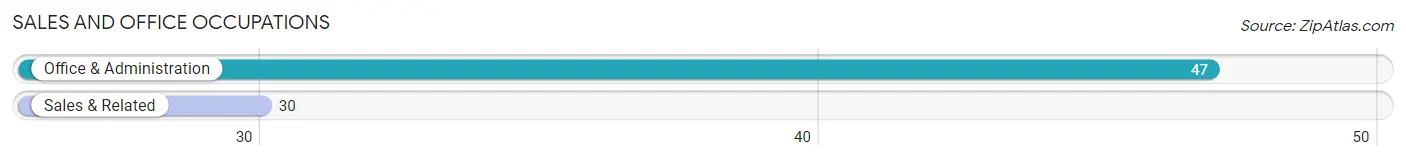
Sales and Office Occupations by Sex
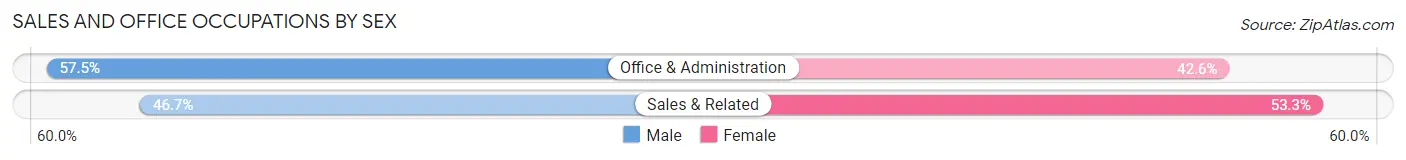
| Occupation | Male | Female |
| Sales & Related | 14 (46.7%) | 16 (53.3%) |
| Office & Administration | 27 (57.5%) | 20 (42.5%) |
| Total (Category) | 41 (53.2%) | 36 (46.8%) |
| Total (Overall) | 460 (56.4%) | 355 (43.6%) |
Natural Resources, Construction and Maintenance Occupations
The most common Natural Resources, Construction and Maintenance occupations in Drexel are Installation, Maintenance & Repair (107 | 13.1%), and Construction & Extraction (45 | 5.5%).
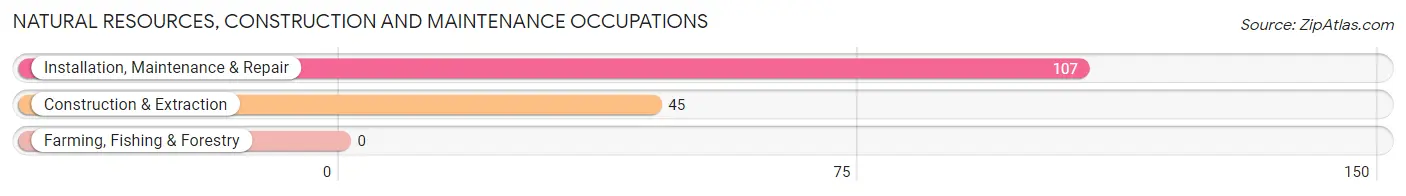
Natural Resources, Construction and Maintenance Occupations by Sex
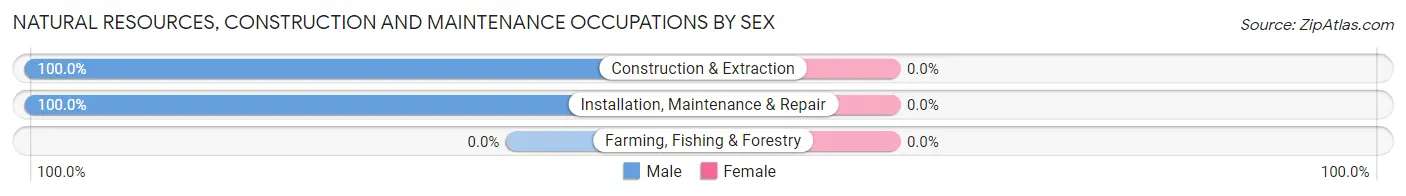
| Occupation | Male | Female |
| Farming, Fishing & Forestry | 0 (0.0%) | 0 (0.0%) |
| Construction & Extraction | 45 (100.0%) | 0 (0.0%) |
| Installation, Maintenance & Repair | 107 (100.0%) | 0 (0.0%) |
| Total (Category) | 152 (100.0%) | 0 (0.0%) |
| Total (Overall) | 460 (56.4%) | 355 (43.6%) |
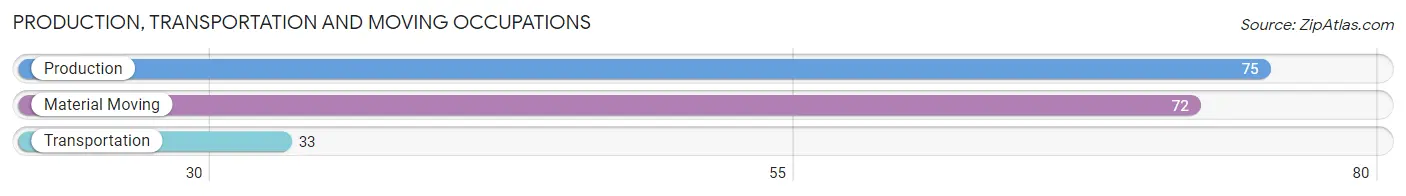
Production, Transportation and Moving Occupations
The most common Production, Transportation and Moving occupations in Drexel are Production (75 | 9.2%), Material Moving (72 | 8.8%), and Transportation (33 | 4.1%).
Production, Transportation and Moving Occupations by Sex
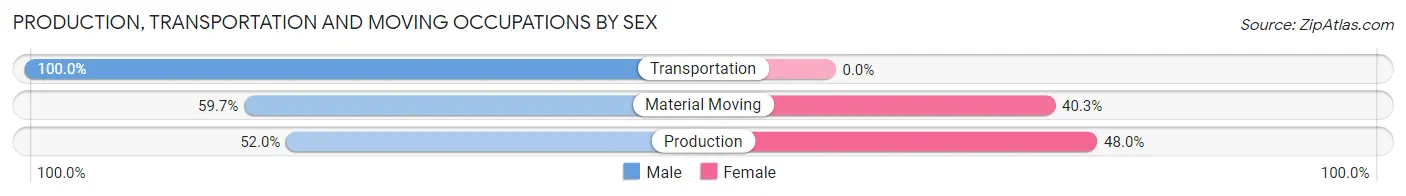
| Occupation | Male | Female |
| Production | 39 (52.0%) | 36 (48.0%) |
| Transportation | 33 (100.0%) | 0 (0.0%) |
| Material Moving | 43 (59.7%) | 29 (40.3%) |
| Total (Category) | 115 (63.9%) | 65 (36.1%) |
| Total (Overall) | 460 (56.4%) | 355 (43.6%) |
Employment Industries by Sex in Drexel
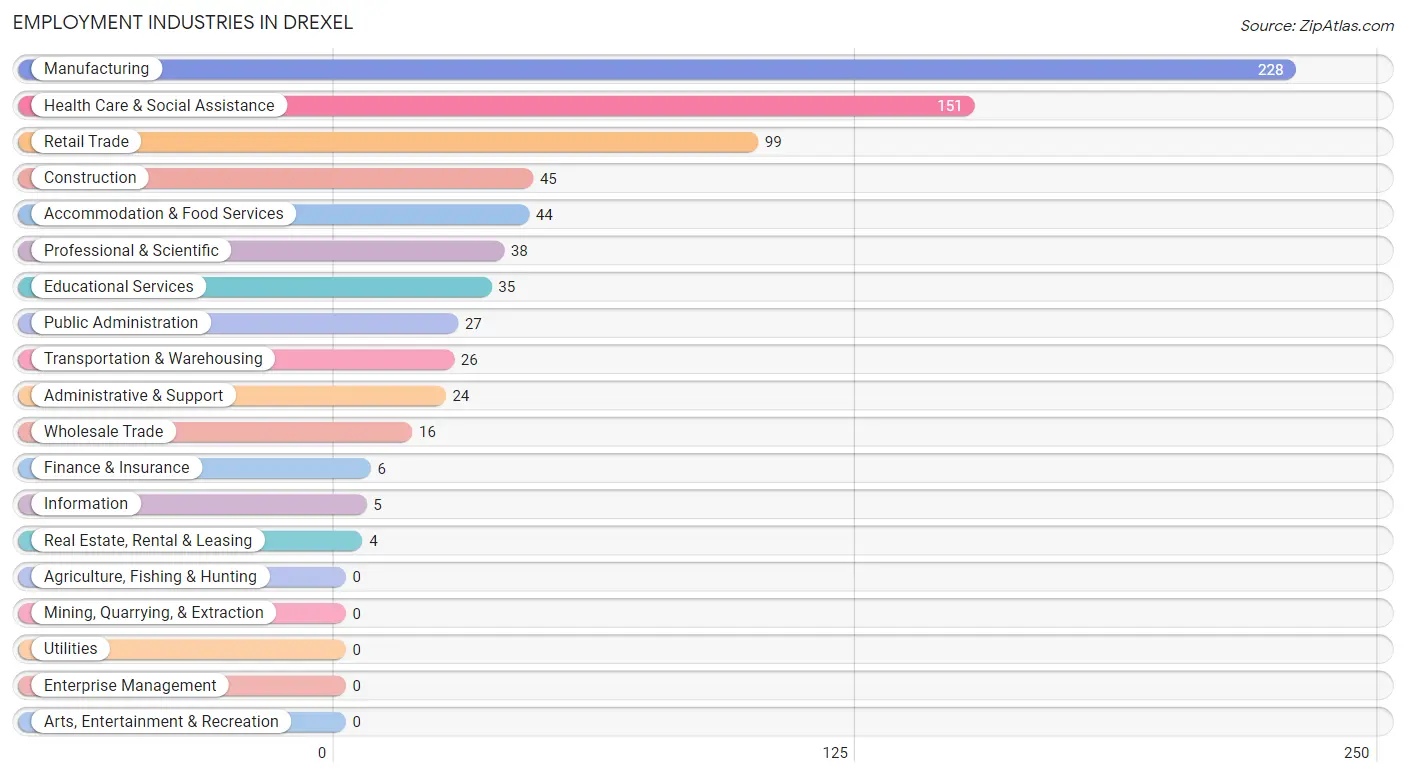
Employment Industries in Drexel
The major employment industries in Drexel include Manufacturing (228 | 28.0%), Health Care & Social Assistance (151 | 18.5%), Retail Trade (99 | 12.1%), Construction (45 | 5.5%), and Accommodation & Food Services (44 | 5.4%).
Employment Industries by Sex in Drexel
The Drexel industries that see more men than women are Construction (100.0%), Transportation & Warehousing (100.0%), and Information (100.0%), whereas the industries that tend to have a higher number of women are Educational Services (100.0%), Health Care & Social Assistance (77.5%), and Accommodation & Food Services (72.7%).
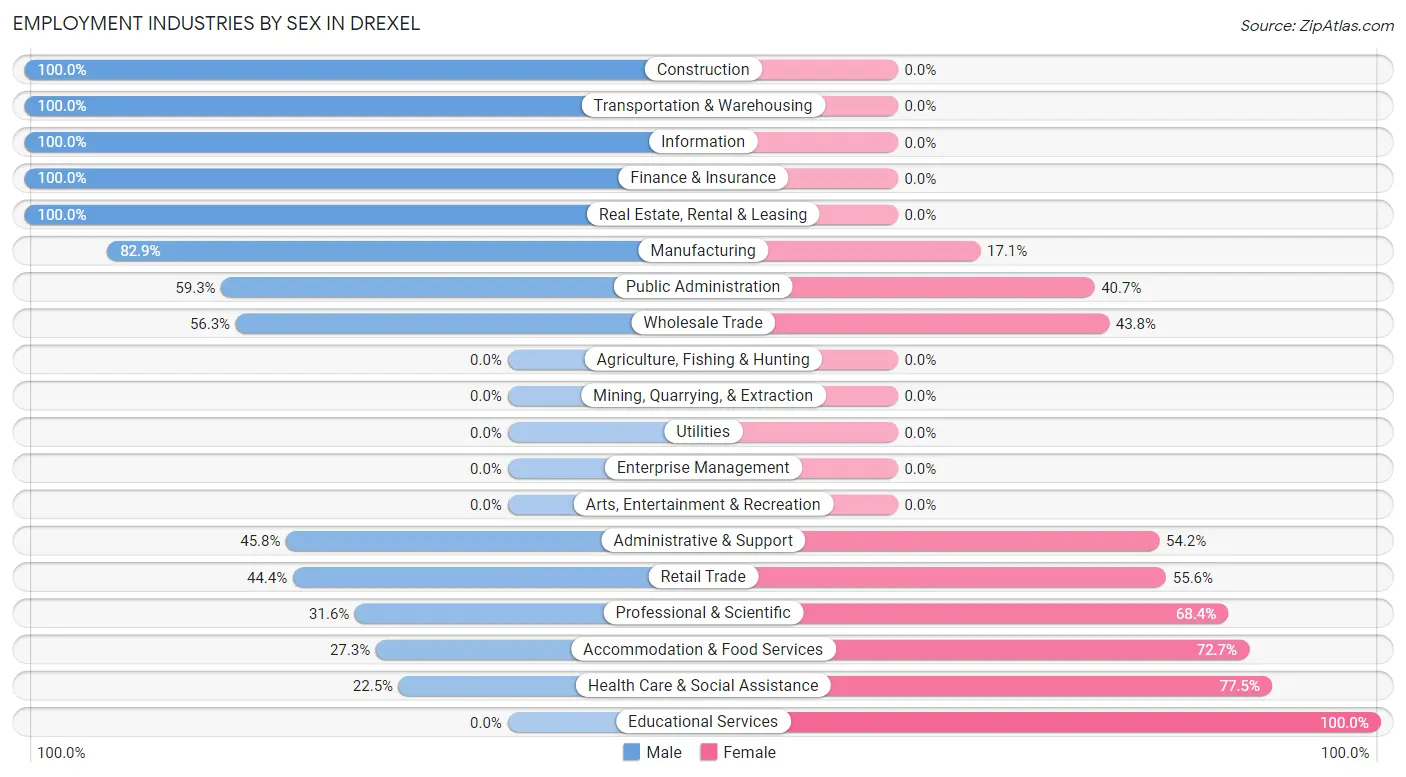
| Industry | Male | Female |
| Agriculture, Fishing & Hunting | 0 (0.0%) | 0 (0.0%) |
| Mining, Quarrying, & Extraction | 0 (0.0%) | 0 (0.0%) |
| Construction | 45 (100.0%) | 0 (0.0%) |
| Manufacturing | 189 (82.9%) | 39 (17.1%) |
| Wholesale Trade | 9 (56.2%) | 7 (43.8%) |
| Retail Trade | 44 (44.4%) | 55 (55.6%) |
| Transportation & Warehousing | 26 (100.0%) | 0 (0.0%) |
| Utilities | 0 (0.0%) | 0 (0.0%) |
| Information | 5 (100.0%) | 0 (0.0%) |
| Finance & Insurance | 6 (100.0%) | 0 (0.0%) |
| Real Estate, Rental & Leasing | 4 (100.0%) | 0 (0.0%) |
| Professional & Scientific | 12 (31.6%) | 26 (68.4%) |
| Enterprise Management | 0 (0.0%) | 0 (0.0%) |
| Administrative & Support | 11 (45.8%) | 13 (54.2%) |
| Educational Services | 0 (0.0%) | 35 (100.0%) |
| Health Care & Social Assistance | 34 (22.5%) | 117 (77.5%) |
| Arts, Entertainment & Recreation | 0 (0.0%) | 0 (0.0%) |
| Accommodation & Food Services | 12 (27.3%) | 32 (72.7%) |
| Public Administration | 16 (59.3%) | 11 (40.7%) |
| Total | 460 (56.4%) | 355 (43.6%) |
Education in Drexel
School Enrollment in Drexel
The most common levels of schooling among the 221 students in Drexel are elementary school (92 | 41.6%), high school (39 | 17.6%), and middle school (32 | 14.5%).
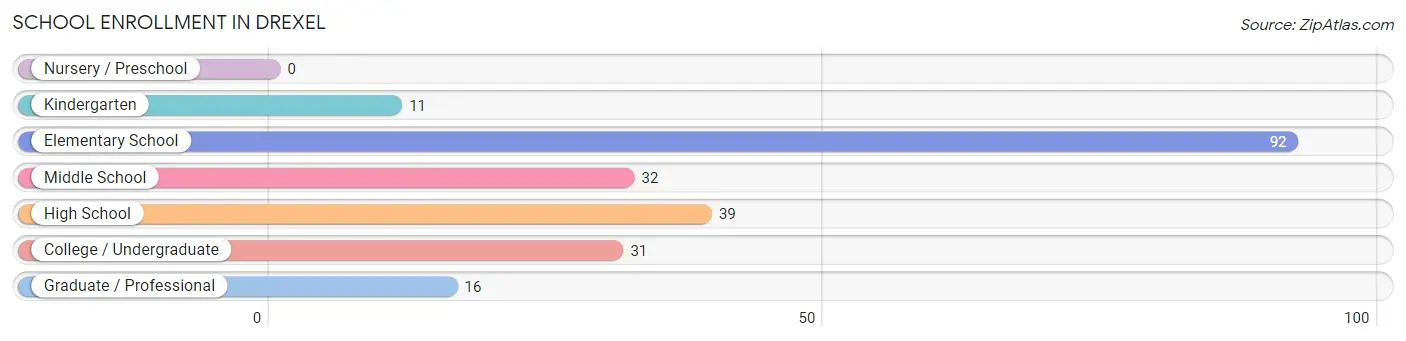
| School Level | # Students | % Students |
| Nursery / Preschool | 0 | 0.0% |
| Kindergarten | 11 | 5.0% |
| Elementary School | 92 | 41.6% |
| Middle School | 32 | 14.5% |
| High School | 39 | 17.6% |
| College / Undergraduate | 31 | 14.0% |
| Graduate / Professional | 16 | 7.2% |
| Total | 221 | 100.0% |
School Enrollment by Age by Funding Source in Drexel
Out of a total of 221 students who are enrolled in schools in Drexel, 8 (3.6%) attend a private institution, while the remaining 213 (96.4%) are enrolled in public schools. The age group of 5 to 9 year old has the highest likelihood of being enrolled in private schools, with 8 (8.0% in the age bracket) enrolled. Conversely, the age group of 10 to 14 year olds has the lowest likelihood of being enrolled in a private school, with 41 (100.0% in the age bracket) attending a public institution.
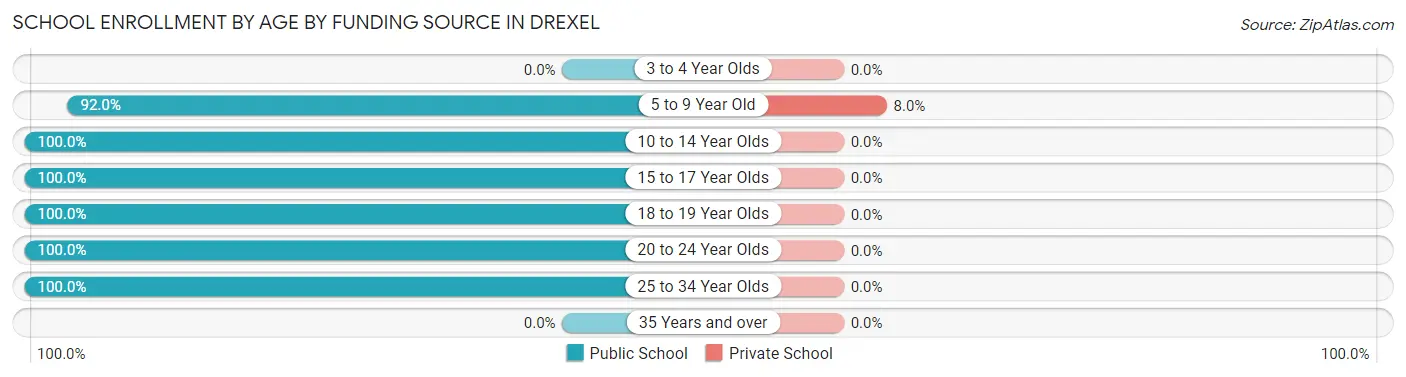
| Age Bracket | Public School | Private School |
| 3 to 4 Year Olds | 0 (0.0%) | 0 (0.0%) |
| 5 to 9 Year Old | 92 (92.0%) | 8 (8.0%) |
| 10 to 14 Year Olds | 41 (100.0%) | 0 (0.0%) |
| 15 to 17 Year Olds | 21 (100.0%) | 0 (0.0%) |
| 18 to 19 Year Olds | 17 (100.0%) | 0 (0.0%) |
| 20 to 24 Year Olds | 22 (100.0%) | 0 (0.0%) |
| 25 to 34 Year Olds | 20 (100.0%) | 0 (0.0%) |
| 35 Years and over | 0 (0.0%) | 0 (0.0%) |
| Total | 213 (96.4%) | 8 (3.6%) |
Educational Attainment by Field of Study in Drexel
Education (79 | 25.4%), science & technology (55 | 17.7%), business (36 | 11.6%), psychology (32 | 10.3%), and arts & humanities (31 | 10.0%) are the most common fields of study among 311 individuals in Drexel who have obtained a bachelor's degree or higher.
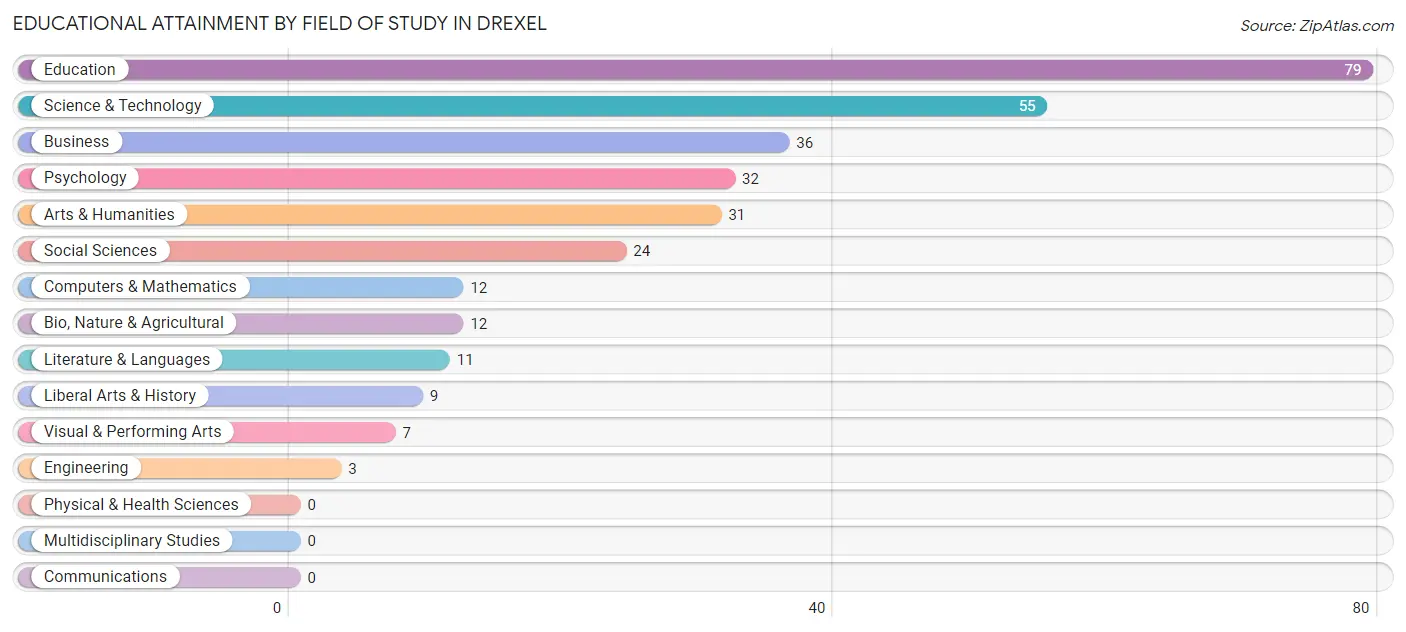
| Field of Study | # Graduates | % Graduates |
| Computers & Mathematics | 12 | 3.9% |
| Bio, Nature & Agricultural | 12 | 3.9% |
| Physical & Health Sciences | 0 | 0.0% |
| Psychology | 32 | 10.3% |
| Social Sciences | 24 | 7.7% |
| Engineering | 3 | 1.0% |
| Multidisciplinary Studies | 0 | 0.0% |
| Science & Technology | 55 | 17.7% |
| Business | 36 | 11.6% |
| Education | 79 | 25.4% |
| Literature & Languages | 11 | 3.5% |
| Liberal Arts & History | 9 | 2.9% |
| Visual & Performing Arts | 7 | 2.2% |
| Communications | 0 | 0.0% |
| Arts & Humanities | 31 | 10.0% |
| Total | 311 | 100.0% |
Transportation & Commute in Drexel
Vehicle Availability by Sex in Drexel
The most prevalent vehicle ownership categories in Drexel are males with 2 vehicles (169, accounting for 37.1%) and females with 2 vehicles (165, making up 48.6%).
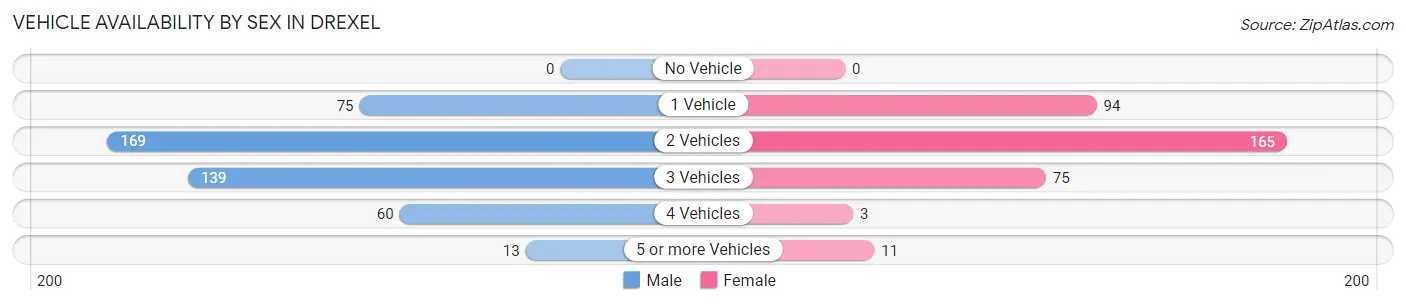
| Vehicles Available | Male | Female |
| No Vehicle | 0 (0.0%) | 0 (0.0%) |
| 1 Vehicle | 75 (16.5%) | 94 (27.0%) |
| 2 Vehicles | 169 (37.1%) | 165 (47.4%) |
| 3 Vehicles | 139 (30.5%) | 75 (21.5%) |
| 4 Vehicles | 60 (13.2%) | 3 (0.9%) |
| 5 or more Vehicles | 13 (2.9%) | 11 (3.2%) |
| Total | 456 (100.0%) | 348 (100.0%) |
Commute Time in Drexel
The most frequently occuring commute durations in Drexel are 15 to 19 minutes (230 commuters, 29.9%), 10 to 14 minutes (177 commuters, 23.0%), and 30 to 34 minutes (110 commuters, 14.3%).
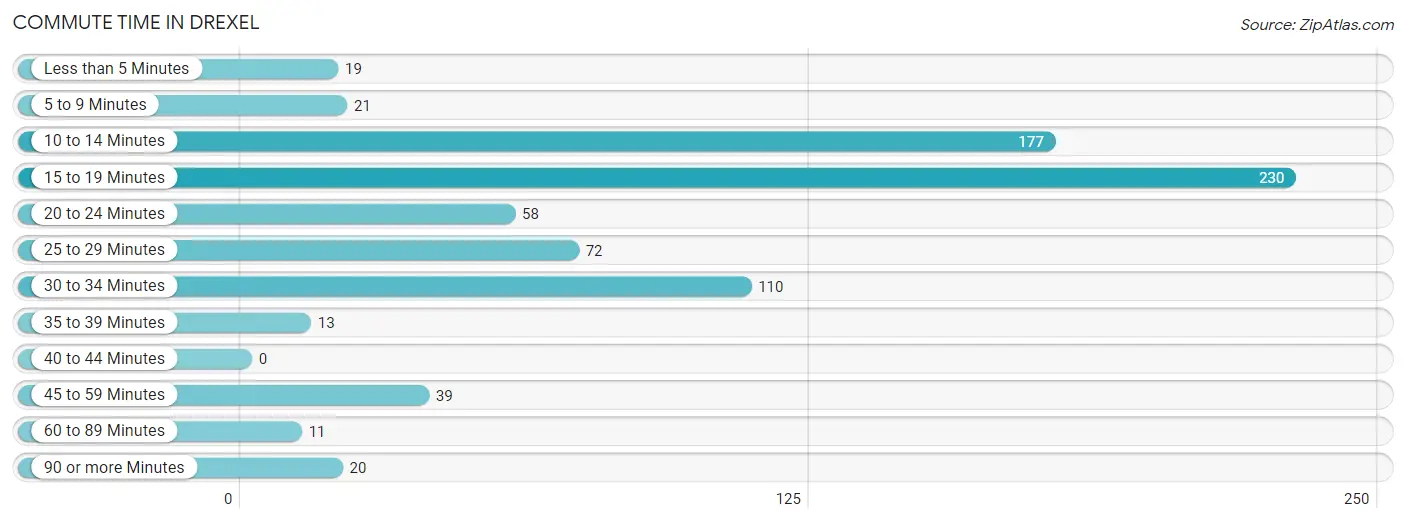
| Commute Time | # Commuters | % Commuters |
| Less than 5 Minutes | 19 | 2.5% |
| 5 to 9 Minutes | 21 | 2.7% |
| 10 to 14 Minutes | 177 | 23.0% |
| 15 to 19 Minutes | 230 | 29.9% |
| 20 to 24 Minutes | 58 | 7.5% |
| 25 to 29 Minutes | 72 | 9.3% |
| 30 to 34 Minutes | 110 | 14.3% |
| 35 to 39 Minutes | 13 | 1.7% |
| 40 to 44 Minutes | 0 | 0.0% |
| 45 to 59 Minutes | 39 | 5.1% |
| 60 to 89 Minutes | 11 | 1.4% |
| 90 or more Minutes | 20 | 2.6% |
Commute Time by Sex in Drexel
The most common commute times in Drexel are 15 to 19 minutes (121 commuters, 27.6%) for males and 15 to 19 minutes (109 commuters, 32.8%) for females.
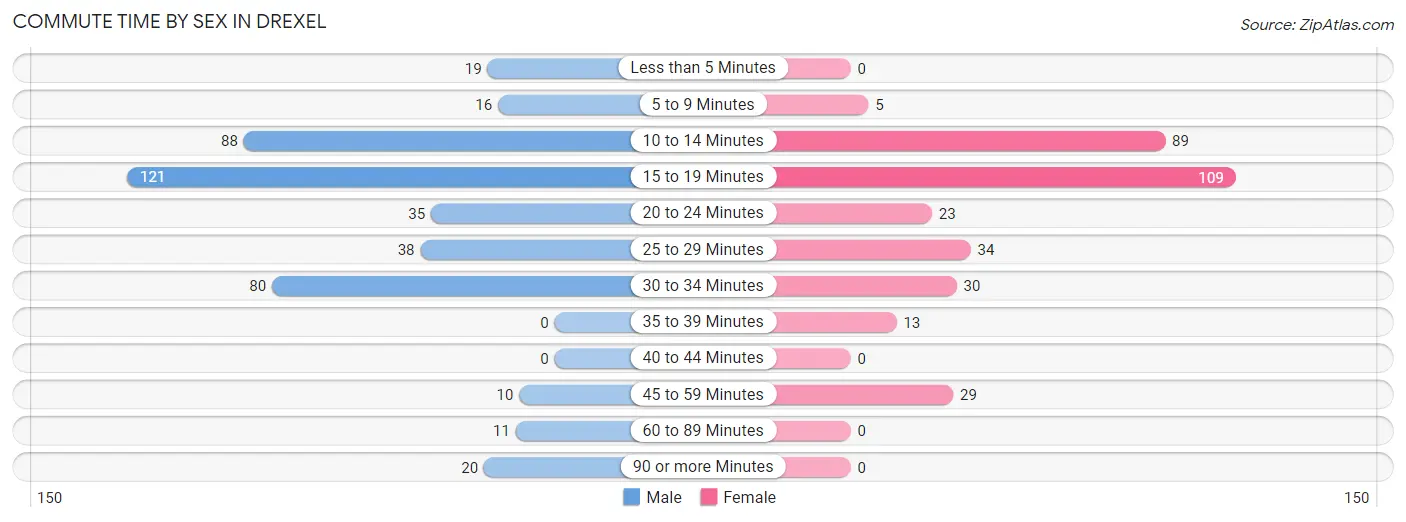
| Commute Time | Male | Female |
| Less than 5 Minutes | 19 (4.3%) | 0 (0.0%) |
| 5 to 9 Minutes | 16 (3.6%) | 5 (1.5%) |
| 10 to 14 Minutes | 88 (20.1%) | 89 (26.8%) |
| 15 to 19 Minutes | 121 (27.6%) | 109 (32.8%) |
| 20 to 24 Minutes | 35 (8.0%) | 23 (6.9%) |
| 25 to 29 Minutes | 38 (8.7%) | 34 (10.2%) |
| 30 to 34 Minutes | 80 (18.3%) | 30 (9.0%) |
| 35 to 39 Minutes | 0 (0.0%) | 13 (3.9%) |
| 40 to 44 Minutes | 0 (0.0%) | 0 (0.0%) |
| 45 to 59 Minutes | 10 (2.3%) | 29 (8.7%) |
| 60 to 89 Minutes | 11 (2.5%) | 0 (0.0%) |
| 90 or more Minutes | 20 (4.6%) | 0 (0.0%) |
Time of Departure to Work by Sex in Drexel
The most frequent times of departure to work in Drexel are 5:30 AM to 5:59 AM (83, 19.0%) for males and 12:00 PM to 3:59 PM (57, 17.2%) for females.
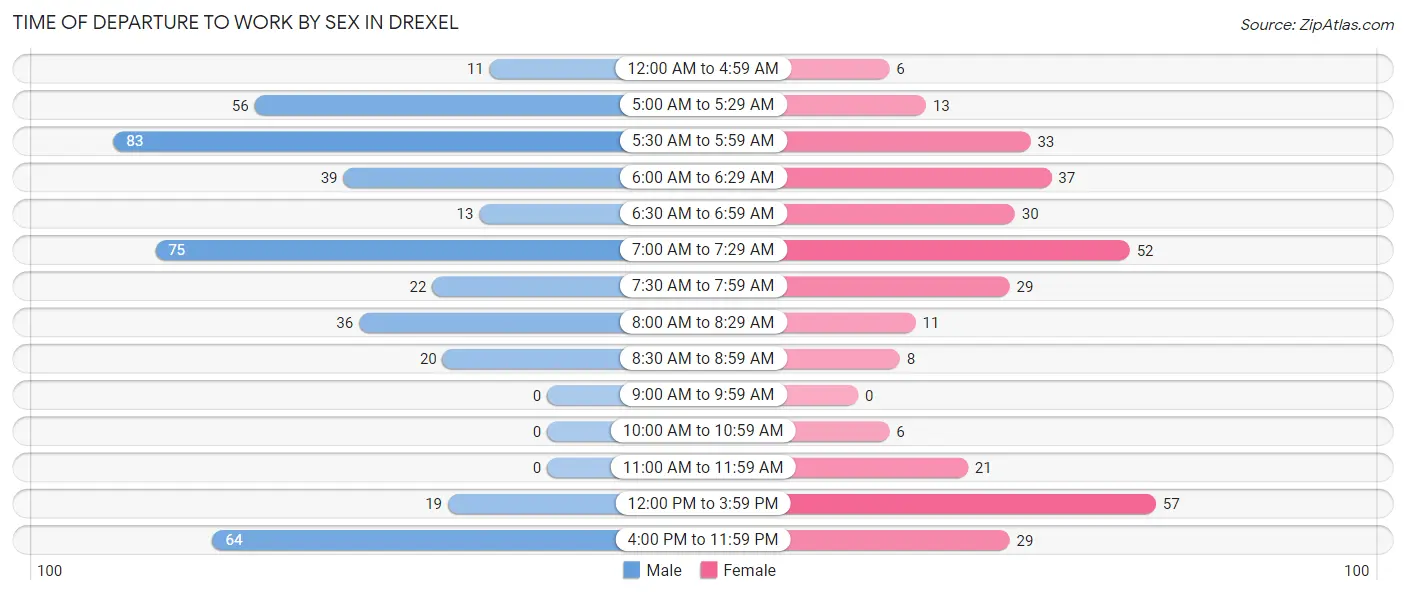
| Time of Departure | Male | Female |
| 12:00 AM to 4:59 AM | 11 (2.5%) | 6 (1.8%) |
| 5:00 AM to 5:29 AM | 56 (12.8%) | 13 (3.9%) |
| 5:30 AM to 5:59 AM | 83 (19.0%) | 33 (9.9%) |
| 6:00 AM to 6:29 AM | 39 (8.9%) | 37 (11.1%) |
| 6:30 AM to 6:59 AM | 13 (3.0%) | 30 (9.0%) |
| 7:00 AM to 7:29 AM | 75 (17.1%) | 52 (15.7%) |
| 7:30 AM to 7:59 AM | 22 (5.0%) | 29 (8.7%) |
| 8:00 AM to 8:29 AM | 36 (8.2%) | 11 (3.3%) |
| 8:30 AM to 8:59 AM | 20 (4.6%) | 8 (2.4%) |
| 9:00 AM to 9:59 AM | 0 (0.0%) | 0 (0.0%) |
| 10:00 AM to 10:59 AM | 0 (0.0%) | 6 (1.8%) |
| 11:00 AM to 11:59 AM | 0 (0.0%) | 21 (6.3%) |
| 12:00 PM to 3:59 PM | 19 (4.3%) | 57 (17.2%) |
| 4:00 PM to 11:59 PM | 64 (14.6%) | 29 (8.7%) |
| Total | 438 (100.0%) | 332 (100.0%) |
Housing Occupancy in Drexel
Occupancy by Ownership in Drexel
Of the total 730 dwellings in Drexel, owner-occupied units account for 532 (72.9%), while renter-occupied units make up 198 (27.1%).
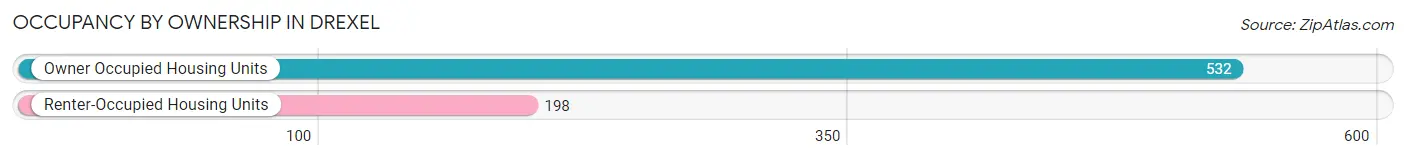
| Occupancy | # Housing Units | % Housing Units |
| Owner Occupied Housing Units | 532 | 72.9% |
| Renter-Occupied Housing Units | 198 | 27.1% |
| Total Occupied Housing Units | 730 | 100.0% |
Occupancy by Household Size in Drexel
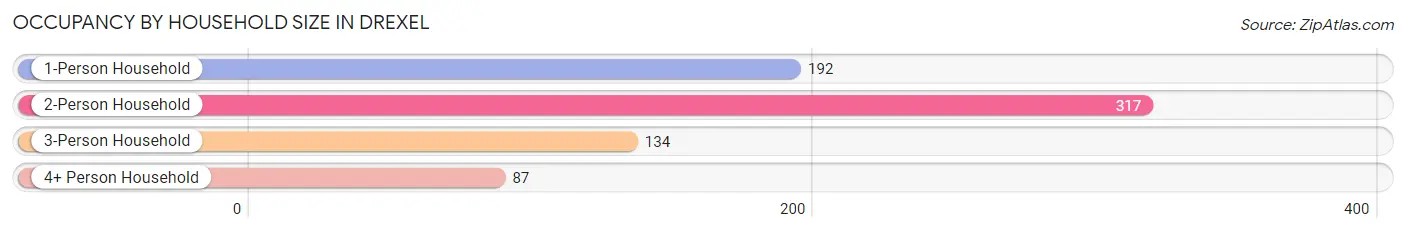
| Household Size | # Housing Units | % Housing Units |
| 1-Person Household | 192 | 26.3% |
| 2-Person Household | 317 | 43.4% |
| 3-Person Household | 134 | 18.4% |
| 4+ Person Household | 87 | 11.9% |
| Total Housing Units | 730 | 100.0% |
Occupancy by Ownership by Household Size in Drexel
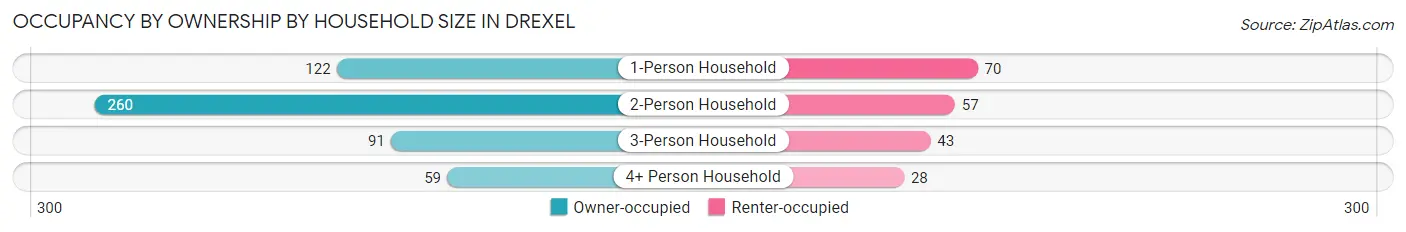
| Household Size | Owner-occupied | Renter-occupied |
| 1-Person Household | 122 (63.5%) | 70 (36.5%) |
| 2-Person Household | 260 (82.0%) | 57 (18.0%) |
| 3-Person Household | 91 (67.9%) | 43 (32.1%) |
| 4+ Person Household | 59 (67.8%) | 28 (32.2%) |
| Total Housing Units | 532 (72.9%) | 198 (27.1%) |
Occupancy by Educational Attainment in Drexel
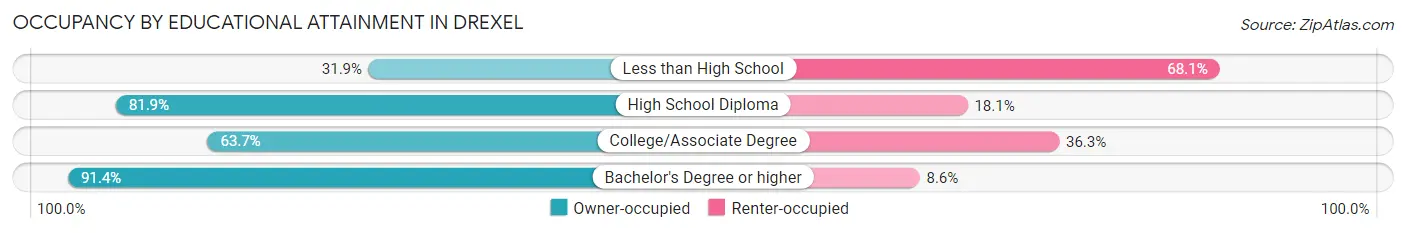
| Household Size | Owner-occupied | Renter-occupied |
| Less than High School | 23 (31.9%) | 49 (68.1%) |
| High School Diploma | 172 (81.9%) | 38 (18.1%) |
| College/Associate Degree | 167 (63.7%) | 95 (36.3%) |
| Bachelor's Degree or higher | 170 (91.4%) | 16 (8.6%) |
Occupancy by Age of Householder in Drexel
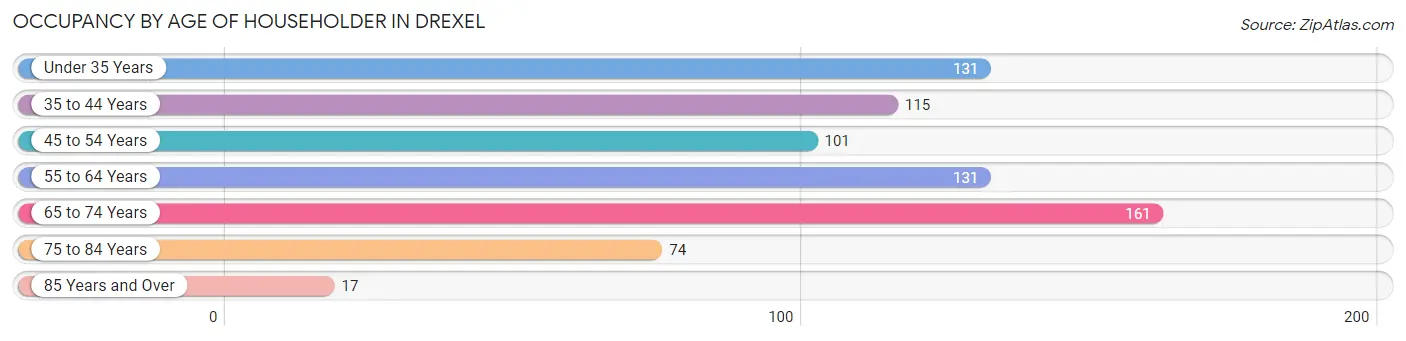
| Age Bracket | # Households | % Households |
| Under 35 Years | 131 | 17.9% |
| 35 to 44 Years | 115 | 15.8% |
| 45 to 54 Years | 101 | 13.8% |
| 55 to 64 Years | 131 | 17.9% |
| 65 to 74 Years | 161 | 22.1% |
| 75 to 84 Years | 74 | 10.1% |
| 85 Years and Over | 17 | 2.3% |
| Total | 730 | 100.0% |
Housing Finances in Drexel
Median Income by Occupancy in Drexel
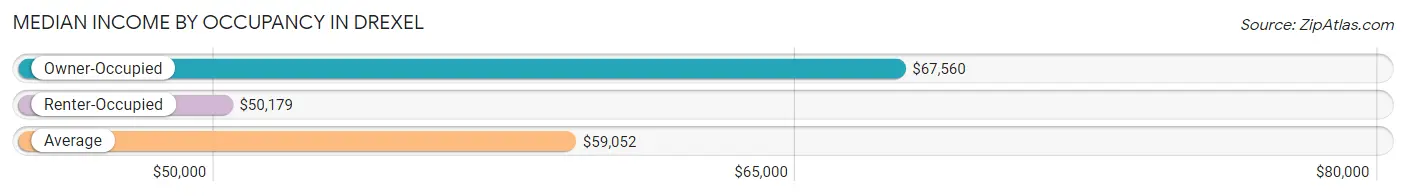
| Occupancy Type | # Households | Median Income |
| Owner-Occupied | 532 (72.9%) | $67,560 |
| Renter-Occupied | 198 (27.1%) | $50,179 |
| Average | 730 (100.0%) | $59,052 |
Occupancy by Householder Income Bracket in Drexel
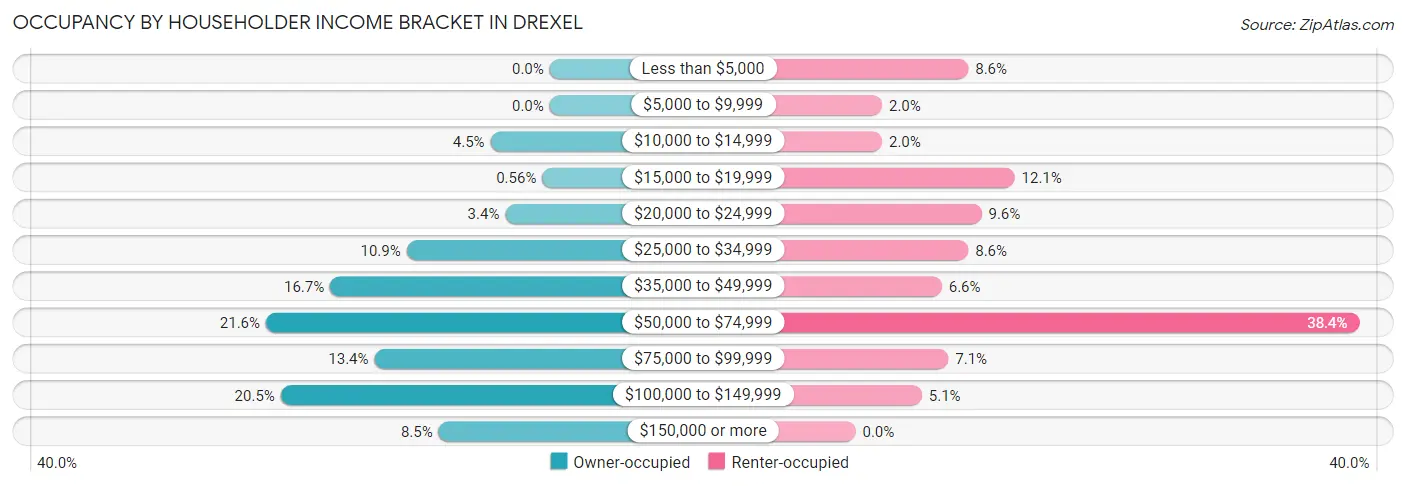
| Income Bracket | Owner-occupied | Renter-occupied |
| Less than $5,000 | 0 (0.0%) | 17 (8.6%) |
| $5,000 to $9,999 | 0 (0.0%) | 4 (2.0%) |
| $10,000 to $14,999 | 24 (4.5%) | 4 (2.0%) |
| $15,000 to $19,999 | 3 (0.6%) | 24 (12.1%) |
| $20,000 to $24,999 | 18 (3.4%) | 19 (9.6%) |
| $25,000 to $34,999 | 58 (10.9%) | 17 (8.6%) |
| $35,000 to $49,999 | 89 (16.7%) | 13 (6.6%) |
| $50,000 to $74,999 | 115 (21.6%) | 76 (38.4%) |
| $75,000 to $99,999 | 71 (13.4%) | 14 (7.1%) |
| $100,000 to $149,999 | 109 (20.5%) | 10 (5.1%) |
| $150,000 or more | 45 (8.5%) | 0 (0.0%) |
| Total | 532 (100.0%) | 198 (100.0%) |
Monthly Housing Cost Tiers in Drexel
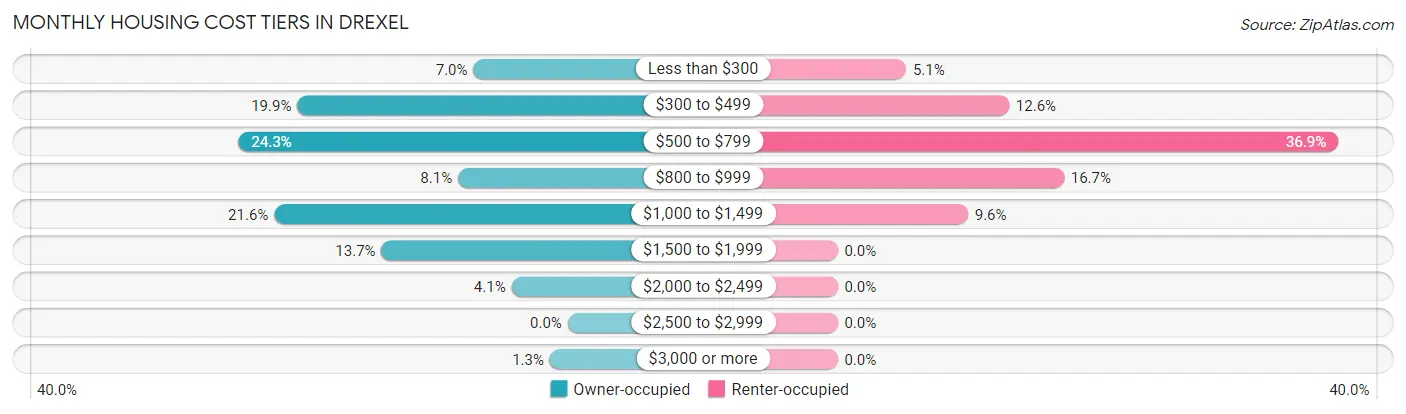
| Monthly Cost | Owner-occupied | Renter-occupied |
| Less than $300 | 37 (7.0%) | 10 (5.1%) |
| $300 to $499 | 106 (19.9%) | 25 (12.6%) |
| $500 to $799 | 129 (24.2%) | 73 (36.9%) |
| $800 to $999 | 43 (8.1%) | 33 (16.7%) |
| $1,000 to $1,499 | 115 (21.6%) | 19 (9.6%) |
| $1,500 to $1,999 | 73 (13.7%) | 0 (0.0%) |
| $2,000 to $2,499 | 22 (4.1%) | 0 (0.0%) |
| $2,500 to $2,999 | 0 (0.0%) | 0 (0.0%) |
| $3,000 or more | 7 (1.3%) | 0 (0.0%) |
| Total | 532 (100.0%) | 198 (100.0%) |
Physical Housing Characteristics in Drexel
Housing Structures in Drexel
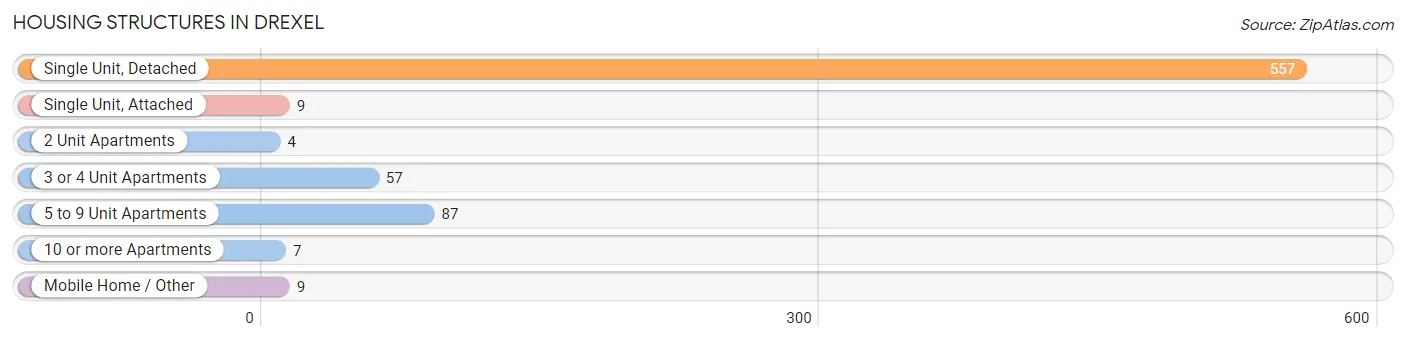
| Structure Type | # Housing Units | % Housing Units |
| Single Unit, Detached | 557 | 76.3% |
| Single Unit, Attached | 9 | 1.2% |
| 2 Unit Apartments | 4 | 0.5% |
| 3 or 4 Unit Apartments | 57 | 7.8% |
| 5 to 9 Unit Apartments | 87 | 11.9% |
| 10 or more Apartments | 7 | 1.0% |
| Mobile Home / Other | 9 | 1.2% |
| Total | 730 | 100.0% |
Housing Structures by Occupancy in Drexel
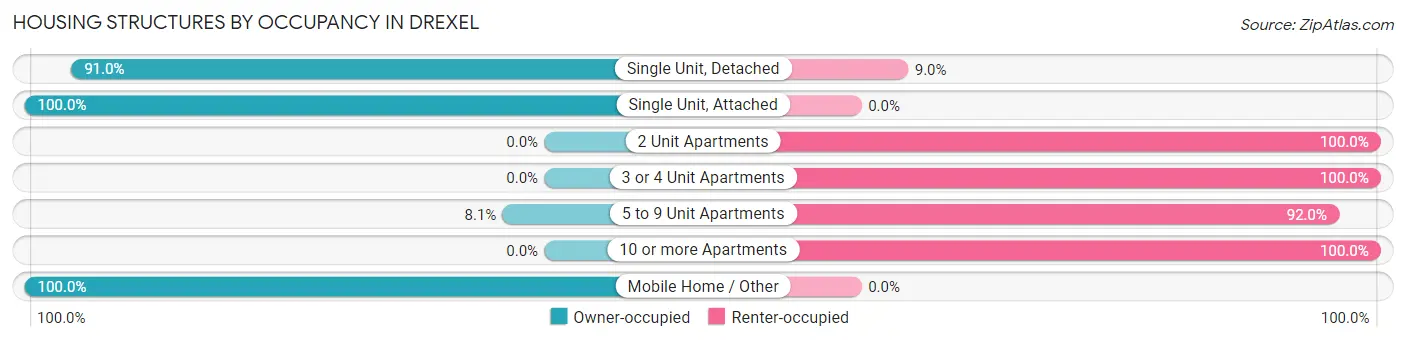
| Structure Type | Owner-occupied | Renter-occupied |
| Single Unit, Detached | 507 (91.0%) | 50 (9.0%) |
| Single Unit, Attached | 9 (100.0%) | 0 (0.0%) |
| 2 Unit Apartments | 0 (0.0%) | 4 (100.0%) |
| 3 or 4 Unit Apartments | 0 (0.0%) | 57 (100.0%) |
| 5 to 9 Unit Apartments | 7 (8.1%) | 80 (91.9%) |
| 10 or more Apartments | 0 (0.0%) | 7 (100.0%) |
| Mobile Home / Other | 9 (100.0%) | 0 (0.0%) |
| Total | 532 (72.9%) | 198 (27.1%) |
Housing Structures by Number of Rooms in Drexel
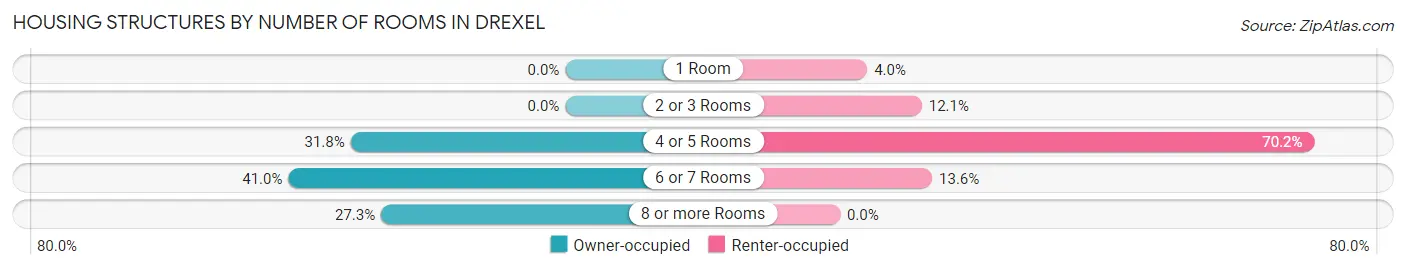
| Number of Rooms | Owner-occupied | Renter-occupied |
| 1 Room | 0 (0.0%) | 8 (4.0%) |
| 2 or 3 Rooms | 0 (0.0%) | 24 (12.1%) |
| 4 or 5 Rooms | 169 (31.8%) | 139 (70.2%) |
| 6 or 7 Rooms | 218 (41.0%) | 27 (13.6%) |
| 8 or more Rooms | 145 (27.3%) | 0 (0.0%) |
| Total | 532 (100.0%) | 198 (100.0%) |
Housing Structure by Heating Type in Drexel
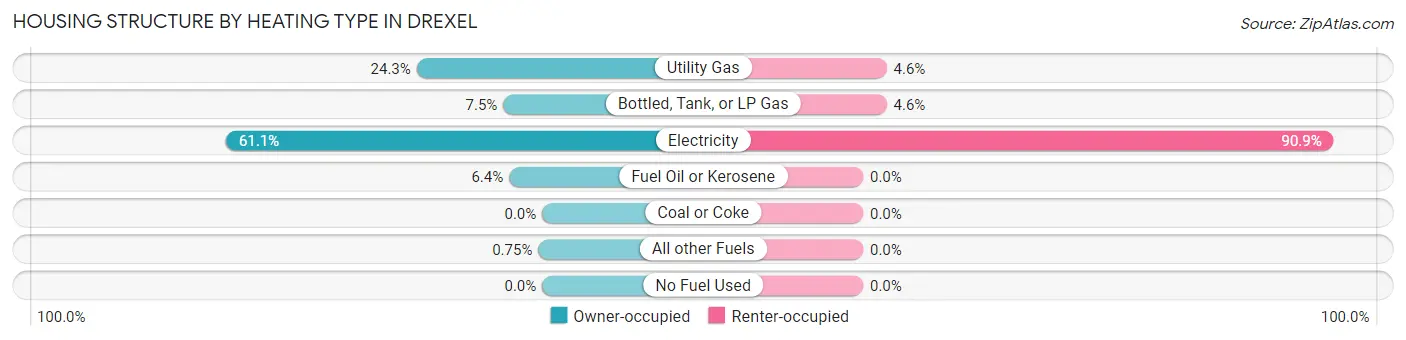
| Heating Type | Owner-occupied | Renter-occupied |
| Utility Gas | 129 (24.2%) | 9 (4.5%) |
| Bottled, Tank, or LP Gas | 40 (7.5%) | 9 (4.5%) |
| Electricity | 325 (61.1%) | 180 (90.9%) |
| Fuel Oil or Kerosene | 34 (6.4%) | 0 (0.0%) |
| Coal or Coke | 0 (0.0%) | 0 (0.0%) |
| All other Fuels | 4 (0.7%) | 0 (0.0%) |
| No Fuel Used | 0 (0.0%) | 0 (0.0%) |
| Total | 532 (100.0%) | 198 (100.0%) |
Household Vehicle Usage in Drexel
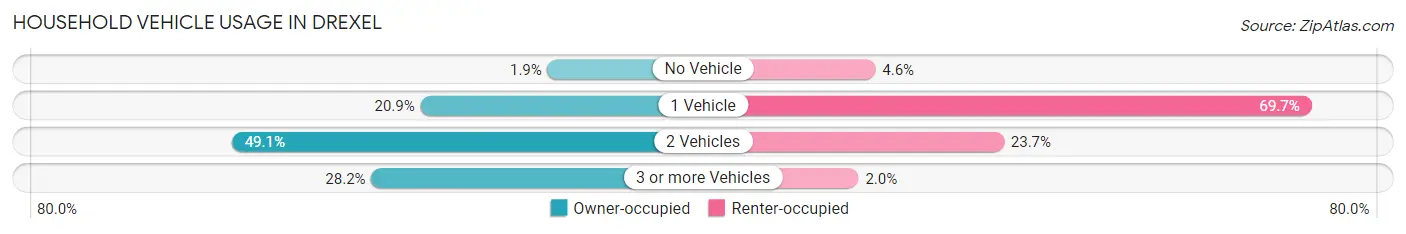
| Vehicles per Household | Owner-occupied | Renter-occupied |
| No Vehicle | 10 (1.9%) | 9 (4.5%) |
| 1 Vehicle | 111 (20.9%) | 138 (69.7%) |
| 2 Vehicles | 261 (49.1%) | 47 (23.7%) |
| 3 or more Vehicles | 150 (28.2%) | 4 (2.0%) |
| Total | 532 (100.0%) | 198 (100.0%) |
Real Estate & Mortgages in Drexel
Real Estate and Mortgage Overview in Drexel
| Characteristic | Without Mortgage | With Mortgage |
| Housing Units | 215 | 317 |
| Median Property Value | $182,100 | $171,200 |
| Median Household Income | $45,729 | $37 |
| Monthly Housing Costs | $448 | $7 |
| Real Estate Taxes | $1,355 | $0 |
Property Value by Mortgage Status in Drexel
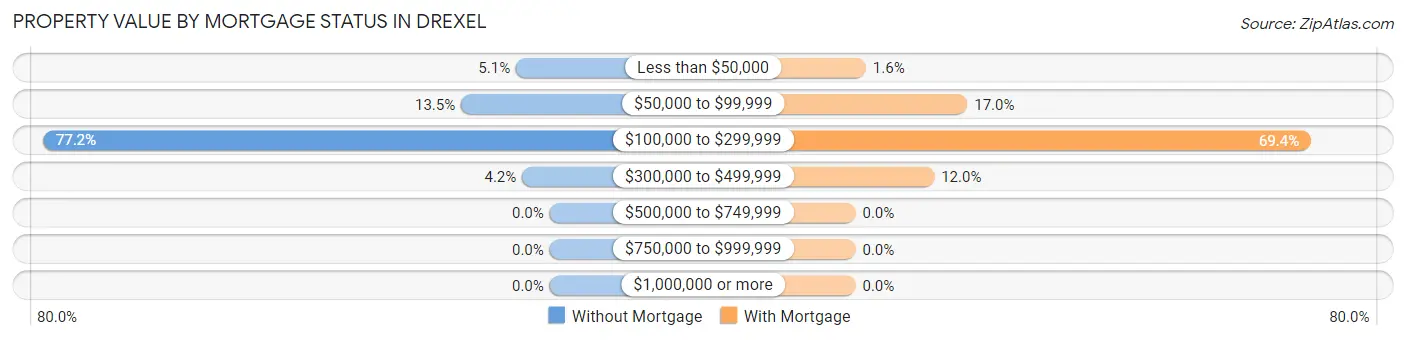
| Property Value | Without Mortgage | With Mortgage |
| Less than $50,000 | 11 (5.1%) | 5 (1.6%) |
| $50,000 to $99,999 | 29 (13.5%) | 54 (17.0%) |
| $100,000 to $299,999 | 166 (77.2%) | 220 (69.4%) |
| $300,000 to $499,999 | 9 (4.2%) | 38 (12.0%) |
| $500,000 to $749,999 | 0 (0.0%) | 0 (0.0%) |
| $750,000 to $999,999 | 0 (0.0%) | 0 (0.0%) |
| $1,000,000 or more | 0 (0.0%) | 0 (0.0%) |
| Total | 215 (100.0%) | 317 (100.0%) |
Household Income by Mortgage Status in Drexel
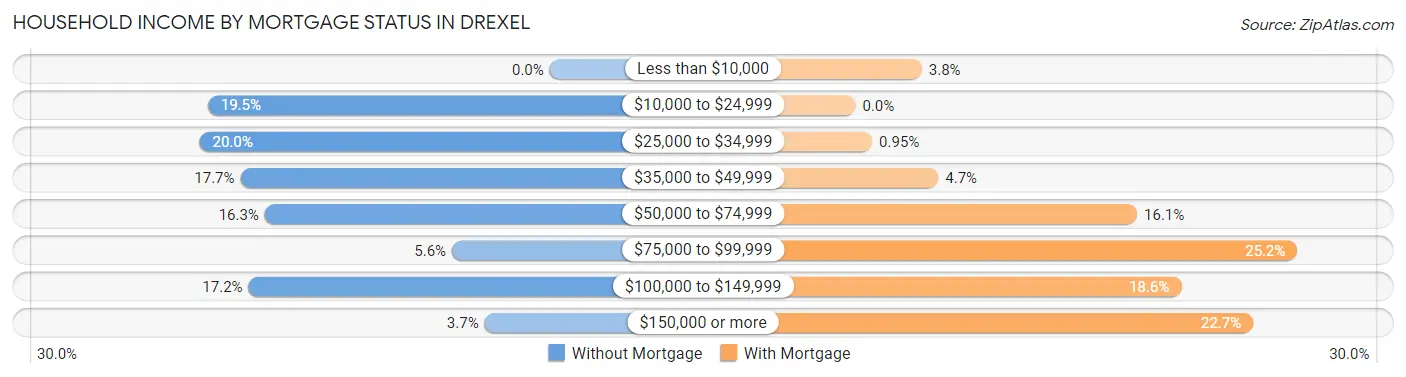
| Household Income | Without Mortgage | With Mortgage |
| Less than $10,000 | 0 (0.0%) | 12 (3.8%) |
| $10,000 to $24,999 | 42 (19.5%) | 0 (0.0%) |
| $25,000 to $34,999 | 43 (20.0%) | 3 (0.9%) |
| $35,000 to $49,999 | 38 (17.7%) | 15 (4.7%) |
| $50,000 to $74,999 | 35 (16.3%) | 51 (16.1%) |
| $75,000 to $99,999 | 12 (5.6%) | 80 (25.2%) |
| $100,000 to $149,999 | 37 (17.2%) | 59 (18.6%) |
| $150,000 or more | 8 (3.7%) | 72 (22.7%) |
| Total | 215 (100.0%) | 317 (100.0%) |
Property Value to Household Income Ratio in Drexel
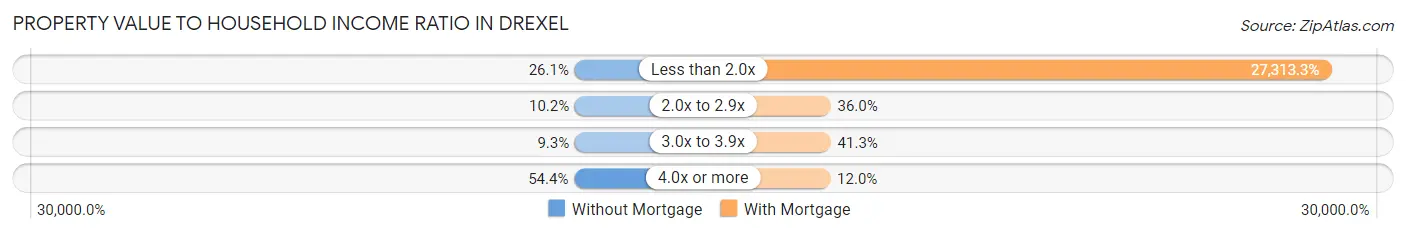
| Value-to-Income Ratio | Without Mortgage | With Mortgage |
| Less than 2.0x | 56 (26.1%) | 86,583 (27,313.2%) |
| 2.0x to 2.9x | 22 (10.2%) | 114 (36.0%) |
| 3.0x to 3.9x | 20 (9.3%) | 131 (41.3%) |
| 4.0x or more | 117 (54.4%) | 38 (12.0%) |
| Total | 215 (100.0%) | 317 (100.0%) |
Real Estate Taxes by Mortgage Status in Drexel
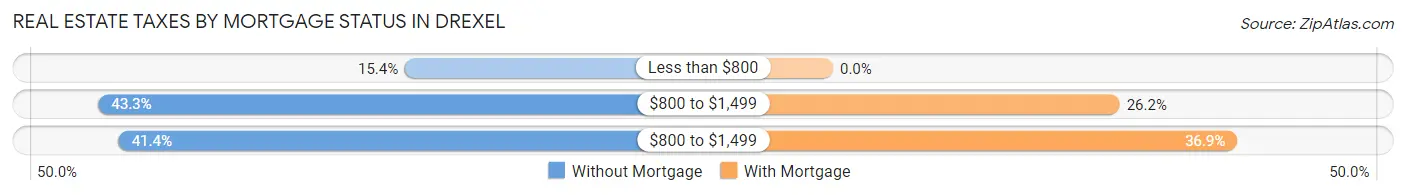
| Property Taxes | Without Mortgage | With Mortgage |
| Less than $800 | 33 (15.3%) | 0 (0.0%) |
| $800 to $1,499 | 93 (43.3%) | 83 (26.2%) |
| $800 to $1,499 | 89 (41.4%) | 117 (36.9%) |
| Total | 215 (100.0%) | 317 (100.0%) |
Health & Disability in Drexel
Health Insurance Coverage by Age in Drexel
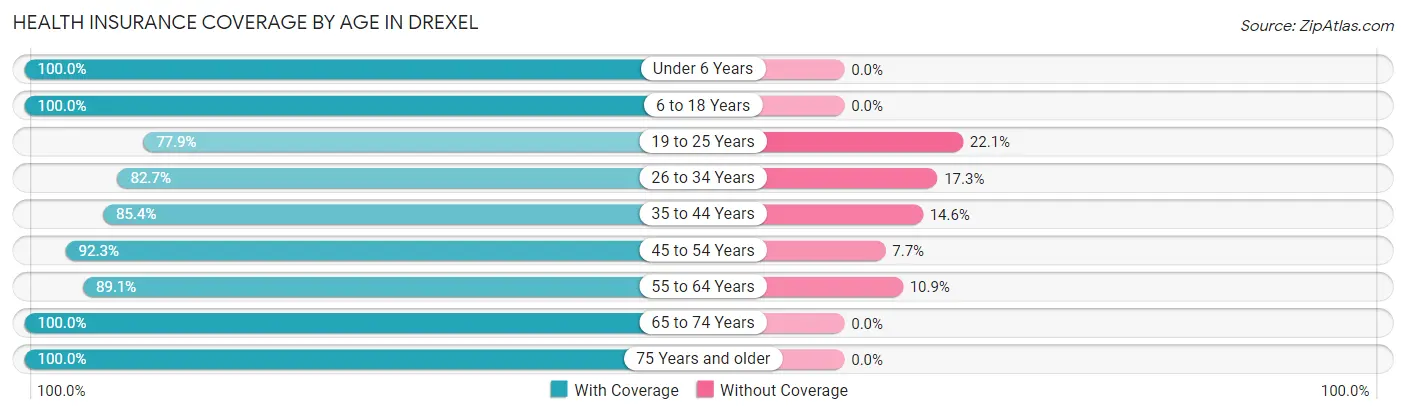
| Age Bracket | With Coverage | Without Coverage |
| Under 6 Years | 78 (100.0%) | 0 (0.0%) |
| 6 to 18 Years | 189 (100.0%) | 0 (0.0%) |
| 19 to 25 Years | 88 (77.9%) | 25 (22.1%) |
| 26 to 34 Years | 186 (82.7%) | 39 (17.3%) |
| 35 to 44 Years | 146 (85.4%) | 25 (14.6%) |
| 45 to 54 Years | 229 (92.3%) | 19 (7.7%) |
| 55 to 64 Years | 221 (89.1%) | 27 (10.9%) |
| 65 to 74 Years | 261 (100.0%) | 0 (0.0%) |
| 75 Years and older | 127 (100.0%) | 0 (0.0%) |
| Total | 1,525 (91.9%) | 135 (8.1%) |
Health Insurance Coverage by Citizenship Status in Drexel
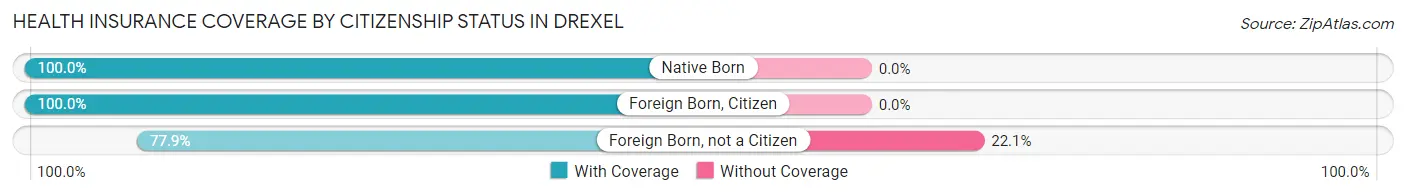
| Citizenship Status | With Coverage | Without Coverage |
| Native Born | 78 (100.0%) | 0 (0.0%) |
| Foreign Born, Citizen | 189 (100.0%) | 0 (0.0%) |
| Foreign Born, not a Citizen | 88 (77.9%) | 25 (22.1%) |
Health Insurance Coverage by Household Income in Drexel
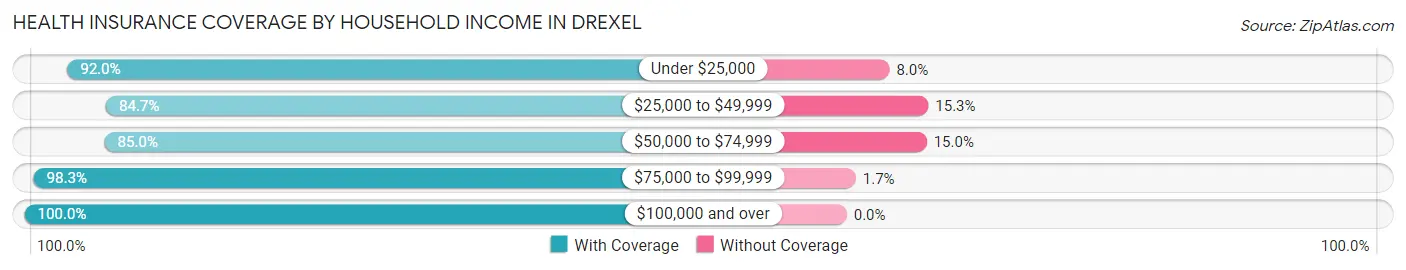
| Household Income | With Coverage | Without Coverage |
| Under $25,000 | 161 (92.0%) | 14 (8.0%) |
| $25,000 to $49,999 | 255 (84.7%) | 46 (15.3%) |
| $50,000 to $74,999 | 403 (85.0%) | 71 (15.0%) |
| $75,000 to $99,999 | 231 (98.3%) | 4 (1.7%) |
| $100,000 and over | 475 (100.0%) | 0 (0.0%) |
Public vs Private Health Insurance Coverage by Age in Drexel
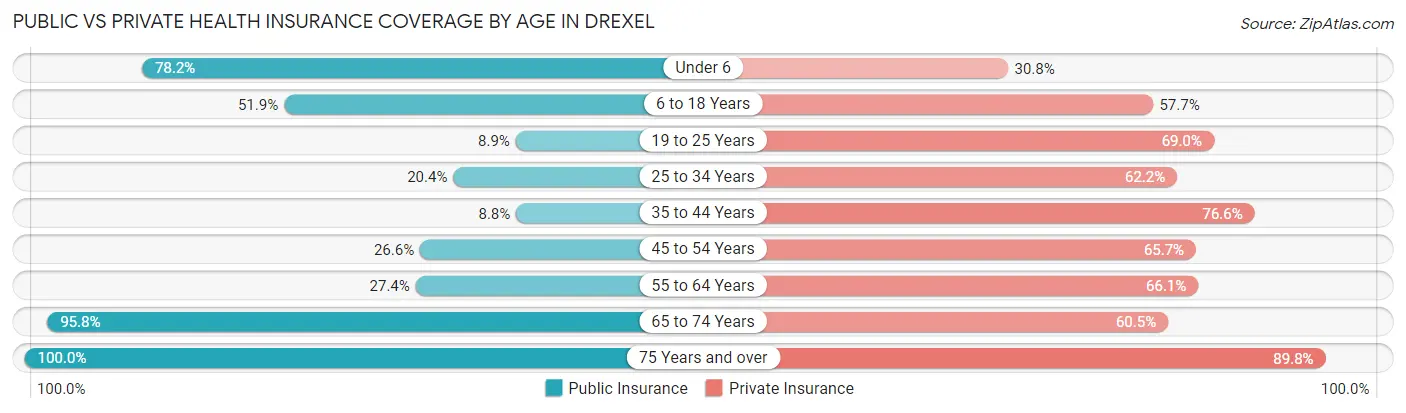
| Age Bracket | Public Insurance | Private Insurance |
| Under 6 | 61 (78.2%) | 24 (30.8%) |
| 6 to 18 Years | 98 (51.8%) | 109 (57.7%) |
| 19 to 25 Years | 10 (8.8%) | 78 (69.0%) |
| 25 to 34 Years | 46 (20.4%) | 140 (62.2%) |
| 35 to 44 Years | 15 (8.8%) | 131 (76.6%) |
| 45 to 54 Years | 66 (26.6%) | 163 (65.7%) |
| 55 to 64 Years | 68 (27.4%) | 164 (66.1%) |
| 65 to 74 Years | 250 (95.8%) | 158 (60.5%) |
| 75 Years and over | 127 (100.0%) | 114 (89.8%) |
| Total | 741 (44.6%) | 1,081 (65.1%) |
Disability Status by Sex by Age in Drexel
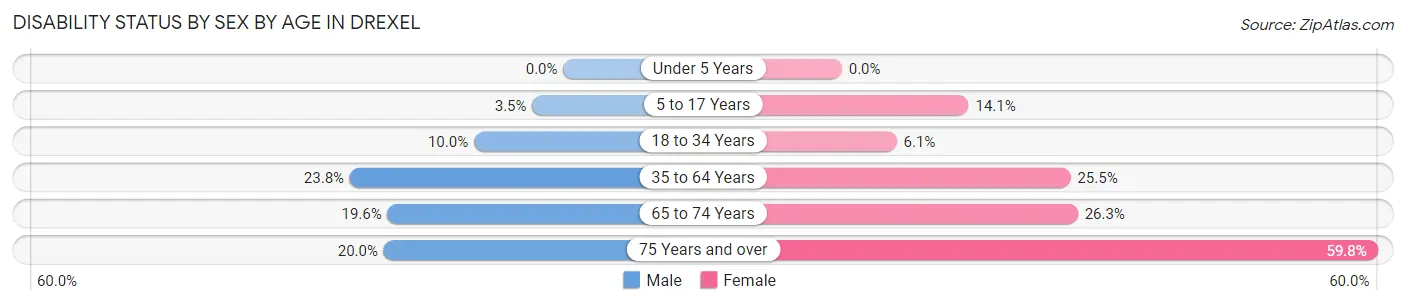
| Age Bracket | Male | Female |
| Under 5 Years | 0 (0.0%) | 0 (0.0%) |
| 5 to 17 Years | 3 (3.5%) | 12 (14.1%) |
| 18 to 34 Years | 19 (10.0%) | 10 (6.1%) |
| 35 to 64 Years | 82 (23.8%) | 82 (25.5%) |
| 65 to 74 Years | 28 (19.6%) | 31 (26.3%) |
| 75 Years and over | 8 (20.0%) | 52 (59.8%) |
Disability Class by Sex by Age in Drexel
Disability Class: Hearing Difficulty
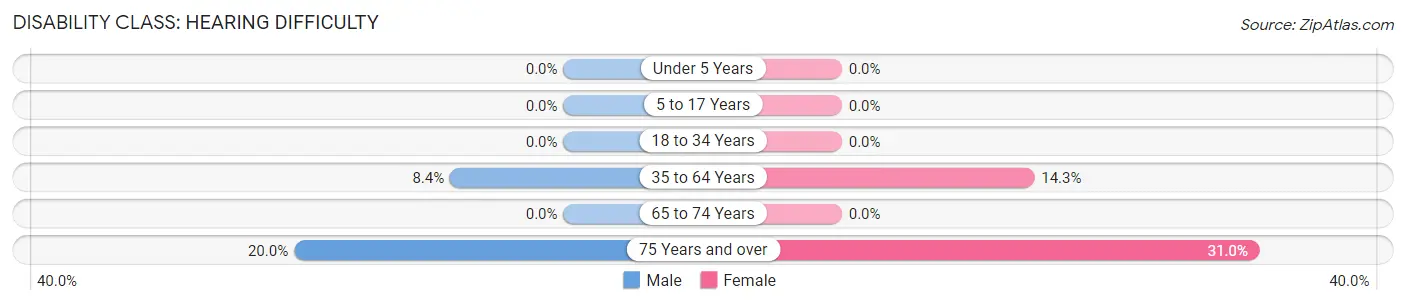
| Age Bracket | Male | Female |
| Under 5 Years | 0 (0.0%) | 0 (0.0%) |
| 5 to 17 Years | 0 (0.0%) | 0 (0.0%) |
| 18 to 34 Years | 0 (0.0%) | 0 (0.0%) |
| 35 to 64 Years | 29 (8.4%) | 46 (14.3%) |
| 65 to 74 Years | 0 (0.0%) | 0 (0.0%) |
| 75 Years and over | 8 (20.0%) | 27 (31.0%) |
Disability Class: Vision Difficulty
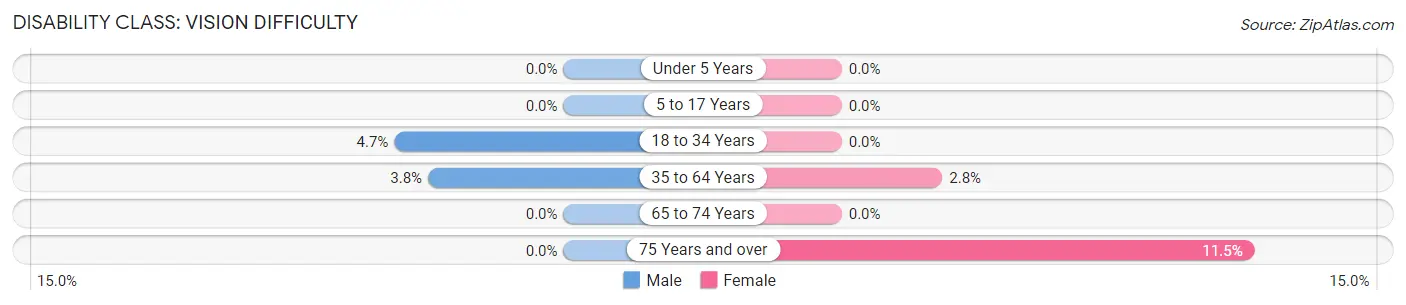
| Age Bracket | Male | Female |
| Under 5 Years | 0 (0.0%) | 0 (0.0%) |
| 5 to 17 Years | 0 (0.0%) | 0 (0.0%) |
| 18 to 34 Years | 9 (4.7%) | 0 (0.0%) |
| 35 to 64 Years | 13 (3.8%) | 9 (2.8%) |
| 65 to 74 Years | 0 (0.0%) | 0 (0.0%) |
| 75 Years and over | 0 (0.0%) | 10 (11.5%) |
Disability Class: Cognitive Difficulty
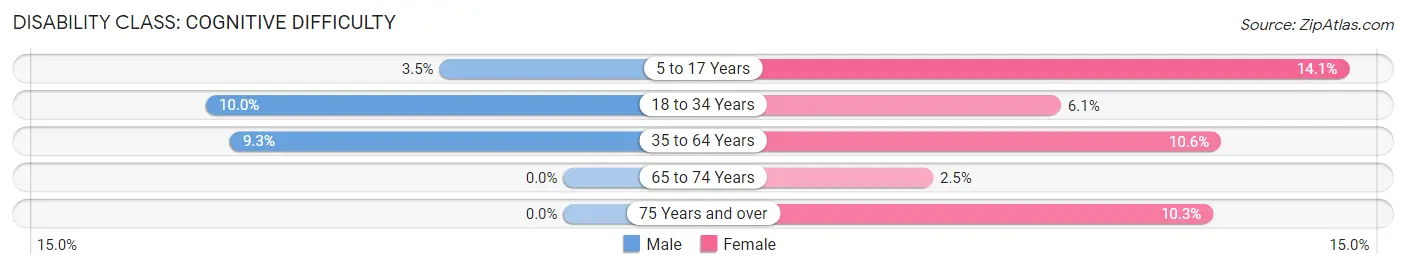
| Age Bracket | Male | Female |
| 5 to 17 Years | 3 (3.5%) | 12 (14.1%) |
| 18 to 34 Years | 19 (10.0%) | 10 (6.1%) |
| 35 to 64 Years | 32 (9.3%) | 34 (10.6%) |
| 65 to 74 Years | 0 (0.0%) | 3 (2.5%) |
| 75 Years and over | 0 (0.0%) | 9 (10.3%) |
Disability Class: Ambulatory Difficulty
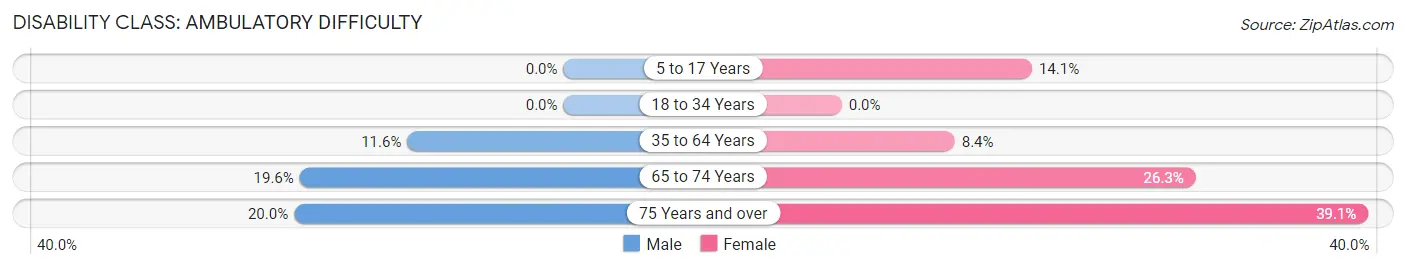
| Age Bracket | Male | Female |
| 5 to 17 Years | 0 (0.0%) | 12 (14.1%) |
| 18 to 34 Years | 0 (0.0%) | 0 (0.0%) |
| 35 to 64 Years | 40 (11.6%) | 27 (8.4%) |
| 65 to 74 Years | 28 (19.6%) | 31 (26.3%) |
| 75 Years and over | 8 (20.0%) | 34 (39.1%) |
Disability Class: Self-Care Difficulty
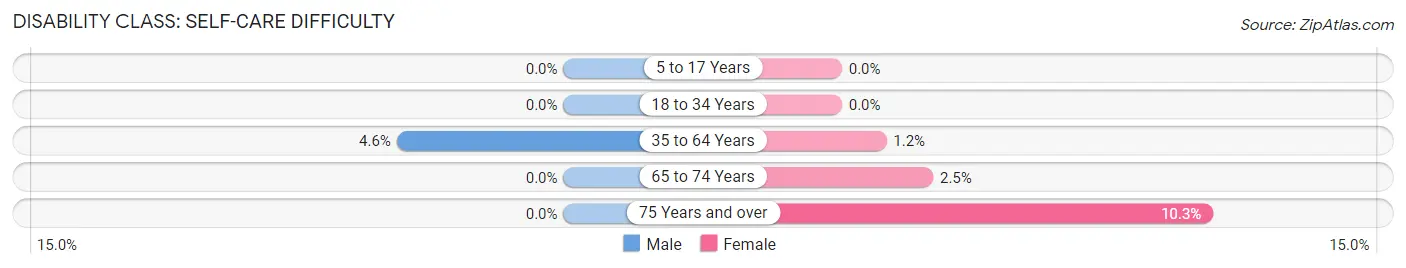
| Age Bracket | Male | Female |
| 5 to 17 Years | 0 (0.0%) | 0 (0.0%) |
| 18 to 34 Years | 0 (0.0%) | 0 (0.0%) |
| 35 to 64 Years | 16 (4.6%) | 4 (1.2%) |
| 65 to 74 Years | 0 (0.0%) | 3 (2.5%) |
| 75 Years and over | 0 (0.0%) | 9 (10.3%) |
Technology Access in Drexel
Computing Device Access in Drexel
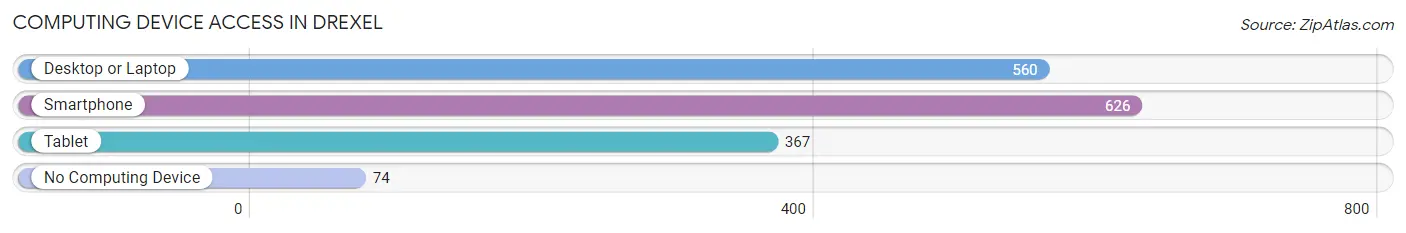
| Device Type | # Households | % Households |
| Desktop or Laptop | 560 | 76.7% |
| Smartphone | 626 | 85.8% |
| Tablet | 367 | 50.3% |
| No Computing Device | 74 | 10.1% |
| Total | 730 | 100.0% |
Internet Access in Drexel
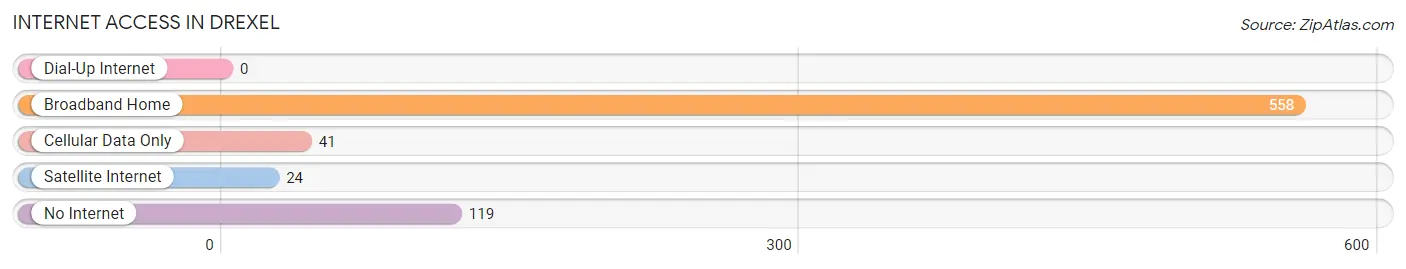
| Internet Type | # Households | % Households |
| Dial-Up Internet | 0 | 0.0% |
| Broadband Home | 558 | 76.4% |
| Cellular Data Only | 41 | 5.6% |
| Satellite Internet | 24 | 3.3% |
| No Internet | 119 | 16.3% |
| Total | 730 | 100.0% |
Drexel Summary
Drexel is a small town located in Burke County, North Carolina. It is situated in the foothills of the Blue Ridge Mountains, about 25 miles east of Asheville. The town was founded in 1891 and named after the Drexel Furniture Company, which was located in nearby Morganton. The town has a population of approximately 1,500 people and is home to a variety of businesses, including a grocery store, a hardware store, a pharmacy, and a few restaurants.
Geography
Drexel is located in the foothills of the Blue Ridge Mountains, about 25 miles east of Asheville. The town is situated at an elevation of 1,400 feet and is surrounded by the Catawba River to the north and the South Mountains to the south. The town is located in a valley, with the surrounding mountains providing a picturesque backdrop. The town is also located near several popular tourist attractions, including Lake James, Linville Falls, and Grandfather Mountain.
Economy
Drexel’s economy is largely based on tourism and small businesses. The town is home to a variety of businesses, including a grocery store, a hardware store, a pharmacy, and a few restaurants. The town also has a few small manufacturing companies, such as a furniture factory and a textile mill. The town is also home to a few small farms, which produce a variety of crops, including corn, soybeans, and tobacco.
Demographics
As of the 2010 census, the population of Drexel was 1,500 people. The town is predominantly white, with approximately 90% of the population being Caucasian. The remaining 10% of the population is made up of African Americans, Hispanics, and Native Americans. The median household income in Drexel is $35,000, and the median age is 40 years old.
History
Drexel was founded in 1891 and named after the Drexel Furniture Company, which was located in nearby Morganton. The town was originally a small farming community, but it began to grow in the early 20th century when the railroad was built through the area. The town was also home to a few small manufacturing companies, such as a furniture factory and a textile mill. The town experienced a period of decline in the mid-20th century, but it has since seen a resurgence in recent years due to its proximity to Asheville and other popular tourist attractions.
Conclusion
Drexel is a small town located in Burke County, North Carolina. It is situated in the foothills of the Blue Ridge Mountains, about 25 miles east of Asheville. The town was founded in 1891 and named after the Drexel Furniture Company, which was located in nearby Morganton. The town has a population of approximately 1,500 people and is home to a variety of businesses, including a grocery store, a hardware store, a pharmacy, and a few restaurants. The town’s economy is largely based on tourism and small businesses, and the town is also home to a few small manufacturing companies and farms. The town is predominantly white, with approximately 90% of the population being Caucasian. The median household income in Drexel is $35,000, and the median age is 40 years old.
Common Questions
What is Per Capita Income in Drexel?
Per Capita income in Drexel is $31,555.
What is the Median Family Income in Drexel?
Median Family Income in Drexel is $68,451.
What is the Median Household income in Drexel?
Median Household Income in Drexel is $59,052.
What is Income or Wage Gap in Drexel?
Income or Wage Gap in Drexel is 26.0%.
Women in Drexel earn 74.0 cents for every dollar earned by a man.
What is Inequality or Gini Index in Drexel?
Inequality or Gini Index in Drexel is 0.37.
What is the Total Population of Drexel?
Total Population of Drexel is 1,768.
What is the Total Male Population of Drexel?
Total Male Population of Drexel is 924.
What is the Total Female Population of Drexel?
Total Female Population of Drexel is 844.
What is the Ratio of Males per 100 Females in Drexel?
There are 109.48 Males per 100 Females in Drexel.
What is the Ratio of Females per 100 Males in Drexel?
There are 91.34 Females per 100 Males in Drexel.
What is the Median Population Age in Drexel?
Median Population Age in Drexel is 47.6 Years.
What is the Average Family Size in Drexel
Average Family Size in Drexel is 2.7 People.
What is the Average Household Size in Drexel
Average Household Size in Drexel is 2.3 People.
How Large is the Labor Force in Drexel?
There are 854 People in the Labor Forcein in Drexel.
What is the Percentage of People in the Labor Force in Drexel?
55.7% of People are in the Labor Force in Drexel.
What is the Unemployment Rate in Drexel?
Unemployment Rate in Drexel is 4.6%.