Troutman, NC Map & Demographics
Troutman Map
Troutman Overview
$37,562
PER CAPITA INCOME
$101,481
AVG FAMILY INCOME
$74,219
AVG HOUSEHOLD INCOME
43.7%
WAGE / INCOME GAP [ % ]
56.3¢/ $1
WAGE / INCOME GAP [ $ ]
0.41
INEQUALITY / GINI INDEX
3,689
TOTAL POPULATION
1,778
MALE POPULATION
1,911
FEMALE POPULATION
93.04
MALES / 100 FEMALES
107.48
FEMALES / 100 MALES
35.3
MEDIAN AGE
3.4
AVG FAMILY SIZE
2.7
AVG HOUSEHOLD SIZE
1,932
LABOR FORCE [ PEOPLE ]
72.3%
PERCENT IN LABOR FORCE
8.9%
UNEMPLOYMENT RATE
Troutman Zip Codes
Income in Troutman
Income Overview in Troutman
Per Capita Income in Troutman is $37,562, while median incomes of families and households are $101,481 and $74,219 respectively.
| Characteristic | Number | Measure |
| Per Capita Income | 3,689 | $37,562 |
| Median Family Income | 946 | $101,481 |
| Mean Family Income | 946 | $119,179 |
| Median Household Income | 1,376 | $74,219 |
| Mean Household Income | 1,376 | $97,702 |
| Income Deficit | 946 | $0 |
| Wage / Income Gap (%) | 3,689 | 43.74% |
| Wage / Income Gap ($) | 3,689 | 56.26¢ per $1 |
| Gini / Inequality Index | 3,689 | 0.41 |
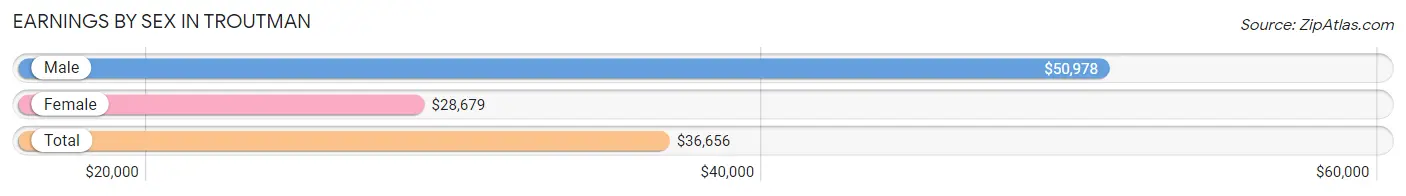
Earnings by Sex in Troutman
Average Earnings in Troutman are $36,656, $50,978 for men and $28,679 for women, a difference of 43.7%.
| Sex | Number | Average Earnings |
| Male | 934 (46.7%) | $50,978 |
| Female | 1,068 (53.3%) | $28,679 |
| Total | 2,002 (100.0%) | $36,656 |
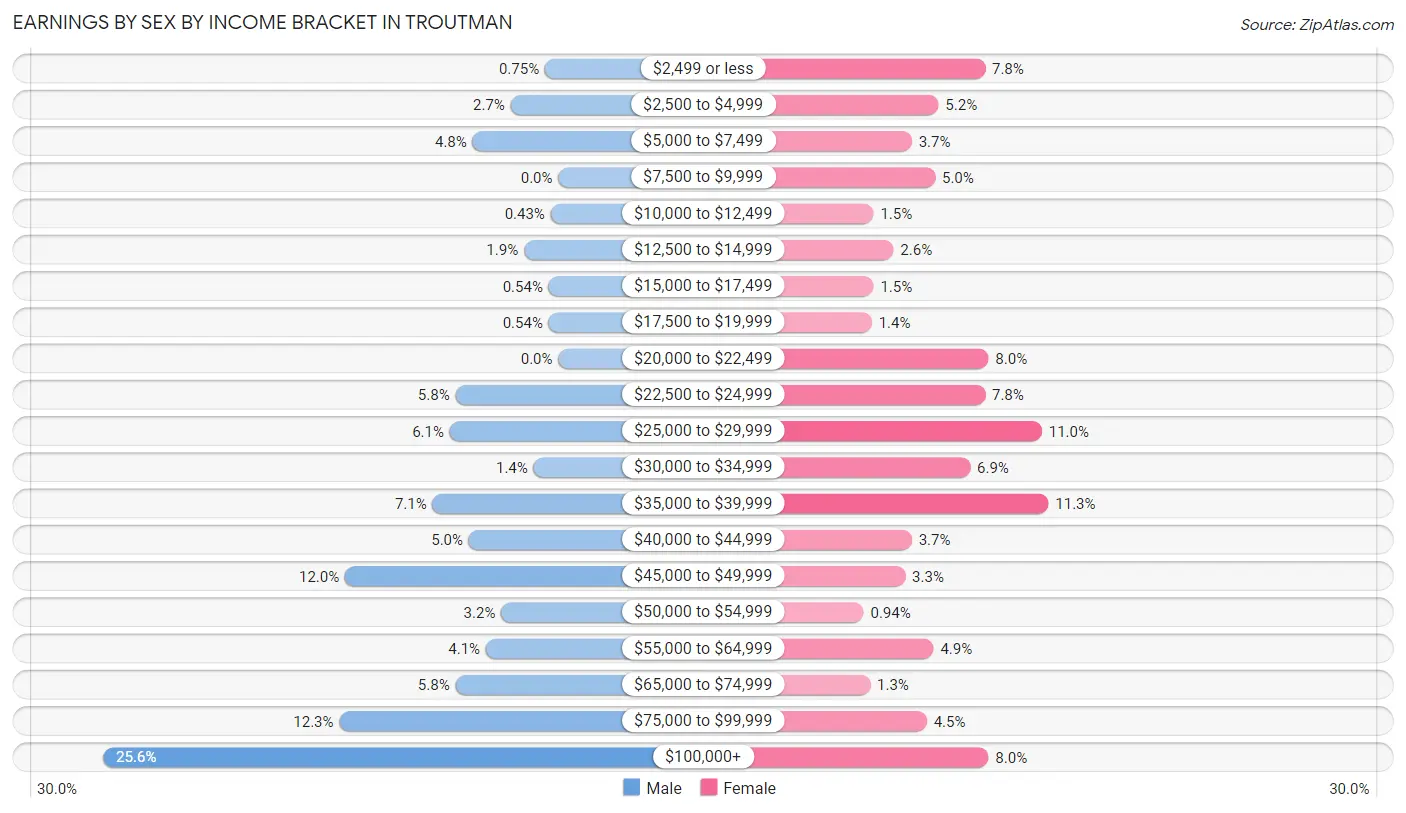
Earnings by Sex by Income Bracket in Troutman
The most common earnings brackets in Troutman are $100,000+ for men (239 | 25.6%) and $35,000 to $39,999 for women (121 | 11.3%).
| Income | Male | Female |
| $2,499 or less | 7 (0.7%) | 83 (7.8%) |
| $2,500 to $4,999 | 25 (2.7%) | 55 (5.1%) |
| $5,000 to $7,499 | 45 (4.8%) | 39 (3.6%) |
| $7,500 to $9,999 | 0 (0.0%) | 53 (5.0%) |
| $10,000 to $12,499 | 4 (0.4%) | 16 (1.5%) |
| $12,500 to $14,999 | 18 (1.9%) | 28 (2.6%) |
| $15,000 to $17,499 | 5 (0.5%) | 16 (1.5%) |
| $17,500 to $19,999 | 5 (0.5%) | 15 (1.4%) |
| $20,000 to $22,499 | 0 (0.0%) | 85 (8.0%) |
| $22,500 to $24,999 | 54 (5.8%) | 83 (7.8%) |
| $25,000 to $29,999 | 57 (6.1%) | 117 (11.0%) |
| $30,000 to $34,999 | 13 (1.4%) | 74 (6.9%) |
| $35,000 to $39,999 | 66 (7.1%) | 121 (11.3%) |
| $40,000 to $44,999 | 47 (5.0%) | 39 (3.6%) |
| $45,000 to $49,999 | 112 (12.0%) | 35 (3.3%) |
| $50,000 to $54,999 | 30 (3.2%) | 10 (0.9%) |
| $55,000 to $64,999 | 38 (4.1%) | 52 (4.9%) |
| $65,000 to $74,999 | 54 (5.8%) | 14 (1.3%) |
| $75,000 to $99,999 | 115 (12.3%) | 48 (4.5%) |
| $100,000+ | 239 (25.6%) | 85 (8.0%) |
| Total | 934 (100.0%) | 1,068 (100.0%) |
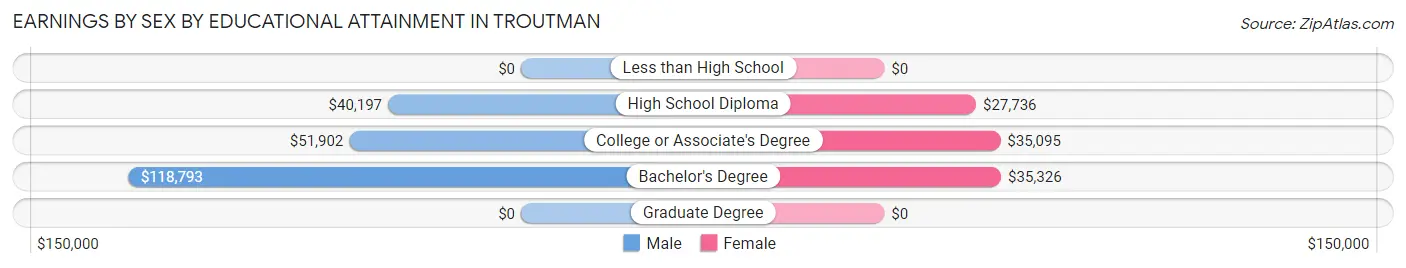
Earnings by Sex by Educational Attainment in Troutman
Average earnings in Troutman are $66,250 for men and $29,800 for women, a difference of 55.0%. Men with an educational attainment of bachelor's degree enjoy the highest average annual earnings of $118,793, while those with high school diploma education earn the least with $40,197. Women with an educational attainment of bachelor's degree earn the most with the average annual earnings of $35,326, while those with high school diploma education have the smallest earnings of $27,736.
| Educational Attainment | Male Income | Female Income |
| Less than High School | - | - |
| High School Diploma | $40,197 | $27,736 |
| College or Associate's Degree | $51,902 | $35,095 |
| Bachelor's Degree | $118,793 | $35,326 |
| Graduate Degree | - | - |
| Total | $66,250 | $29,800 |
Family Income in Troutman
Family Income Brackets in Troutman
According to the Troutman family income data, there are 215 families falling into the $100,000 to $149,999 income range, which is the most common income bracket and makes up 22.7% of all families. Conversely, the $35,000 to $49,999 income bracket is the least frequent group with only 6 families (0.6%) belonging to this category.
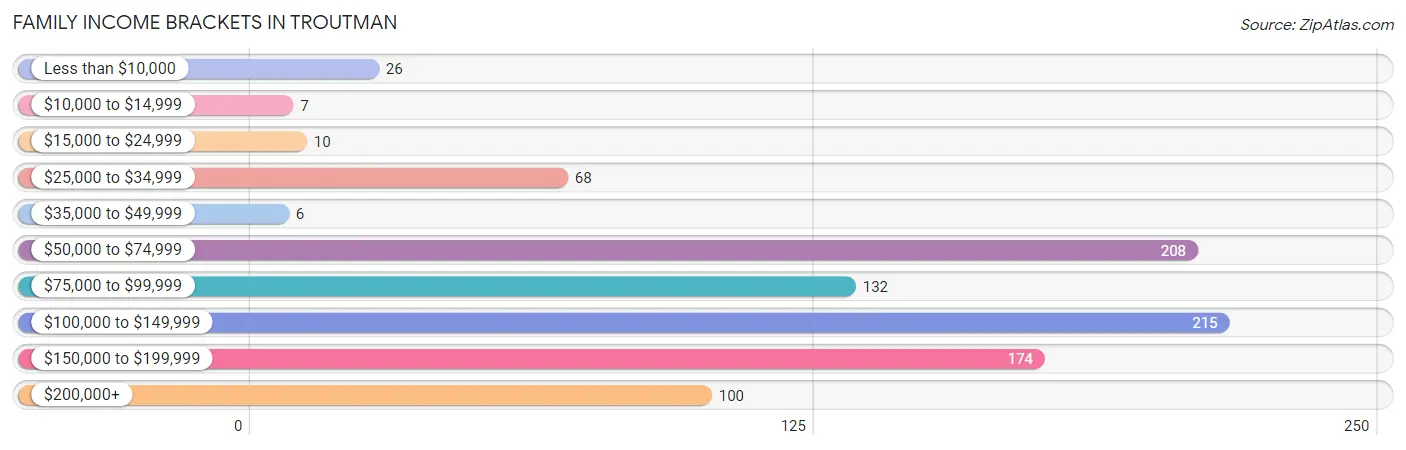
| Income Bracket | # Families | % Families |
| Less than $10,000 | 26 | 2.7% |
| $10,000 to $14,999 | 7 | 0.7% |
| $15,000 to $24,999 | 10 | 1.1% |
| $25,000 to $34,999 | 68 | 7.2% |
| $35,000 to $49,999 | 6 | 0.6% |
| $50,000 to $74,999 | 208 | 22.0% |
| $75,000 to $99,999 | 132 | 14.0% |
| $100,000 to $149,999 | 215 | 22.7% |
| $150,000 to $199,999 | 174 | 18.4% |
| $200,000+ | 100 | 10.6% |
Family Income by Famaliy Size in Troutman
5-person families (56 | 5.9%) account for the highest median family income in Troutman with $173,056 per family, while 2-person families (339 | 35.8%) have the highest median income of $42,344 per family member.
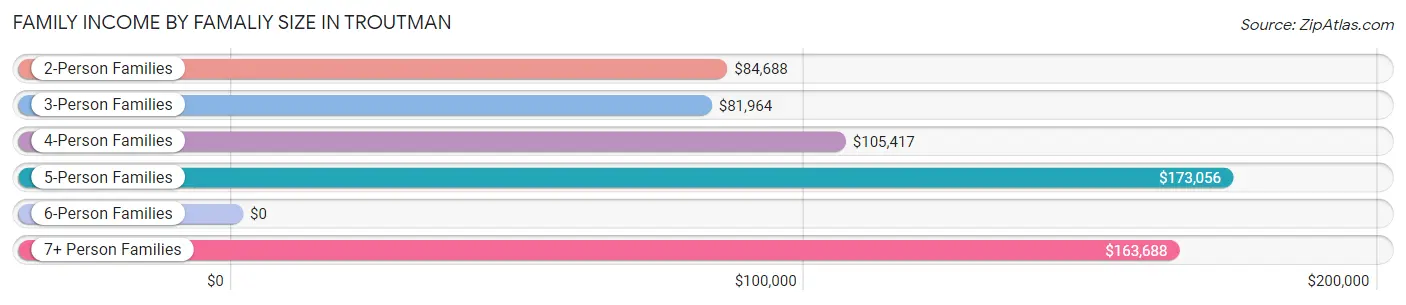
| Income Bracket | # Families | Median Income |
| 2-Person Families | 339 (35.8%) | $84,688 |
| 3-Person Families | 279 (29.5%) | $81,964 |
| 4-Person Families | 238 (25.2%) | $105,417 |
| 5-Person Families | 56 (5.9%) | $173,056 |
| 6-Person Families | 5 (0.5%) | $0 |
| 7+ Person Families | 29 (3.1%) | $163,688 |
| Total | 946 (100.0%) | $101,481 |
Family Income by Number of Earners in Troutman
The median family income in Troutman is $101,481, with families comprising 2 earners (490) having the highest median family income of $109,375, while families with no earners (67) have the lowest median family income of $75,250, accounting for 51.8% and 7.1% of families, respectively.
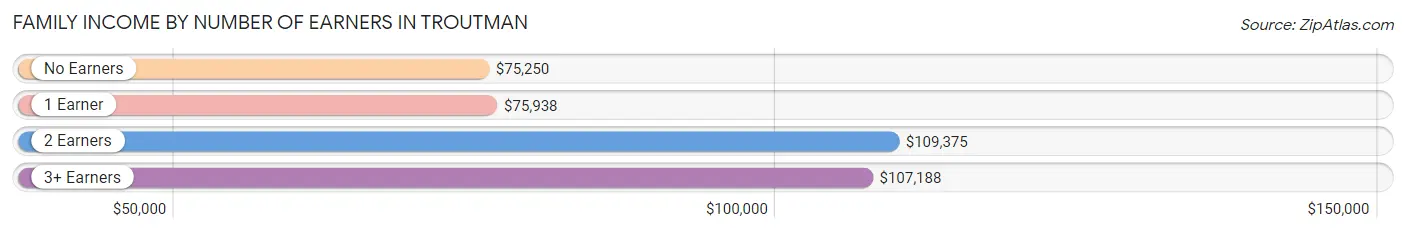
| Number of Earners | # Families | Median Income |
| No Earners | 67 (7.1%) | $75,250 |
| 1 Earner | 277 (29.3%) | $75,938 |
| 2 Earners | 490 (51.8%) | $109,375 |
| 3+ Earners | 112 (11.8%) | $107,188 |
| Total | 946 (100.0%) | $101,481 |
Household Income in Troutman
Household Income Brackets in Troutman
With 286 households falling in the category, the $50,000 to $74,999 income range is the most frequent in Troutman, accounting for 20.8% of all households. In contrast, only 7 households (0.5%) fall into the $10,000 to $14,999 income bracket, making it the least populous group.
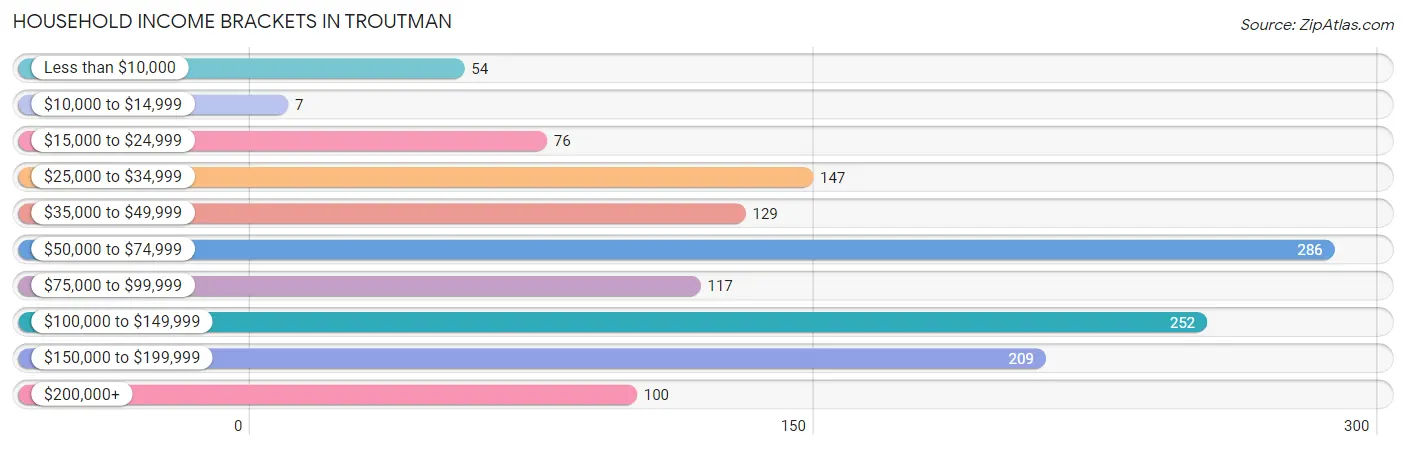
| Income Bracket | # Households | % Households |
| Less than $10,000 | 54 | 3.9% |
| $10,000 to $14,999 | 7 | 0.5% |
| $15,000 to $24,999 | 76 | 5.5% |
| $25,000 to $34,999 | 147 | 10.7% |
| $35,000 to $49,999 | 129 | 9.4% |
| $50,000 to $74,999 | 286 | 20.8% |
| $75,000 to $99,999 | 117 | 8.5% |
| $100,000 to $149,999 | 252 | 18.3% |
| $150,000 to $199,999 | 209 | 15.2% |
| $200,000+ | 100 | 7.3% |
Household Income by Householder Age in Troutman
The median household income in Troutman is $74,219, with the highest median household income of $102,829 found in the 25 to 44 years age bracket for the primary householder. A total of 583 households (42.4%) fall into this category. Meanwhile, the 15 to 24 years age bracket for the primary householder has the lowest median household income of $0, with 29 households (2.1%) in this group.
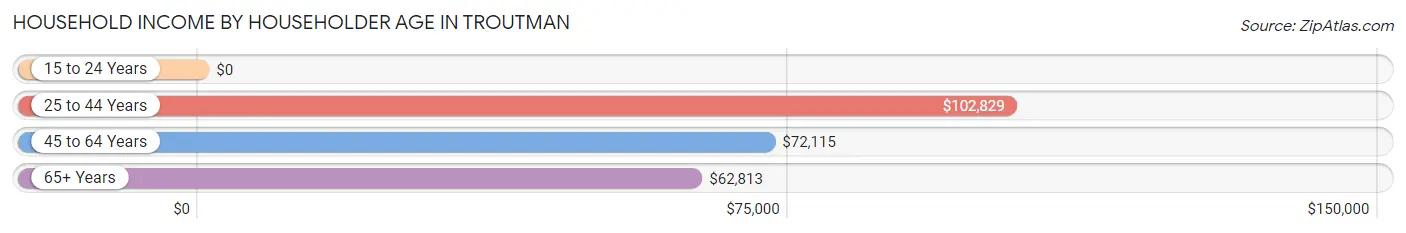
| Income Bracket | # Households | Median Income |
| 15 to 24 Years | 29 (2.1%) | $0 |
| 25 to 44 Years | 583 (42.4%) | $102,829 |
| 45 to 64 Years | 484 (35.2%) | $72,115 |
| 65+ Years | 280 (20.3%) | $62,813 |
| Total | 1,376 (100.0%) | $74,219 |
Poverty in Troutman
Income Below Poverty by Sex and Age in Troutman
With 4.3% poverty level for males and 4.0% for females among the residents of Troutman, 55 to 64 year old males and 12 to 14 year old females are the most vulnerable to poverty, with 35 males (18.2%) and 29 females (29.0%) in their respective age groups living below the poverty level.
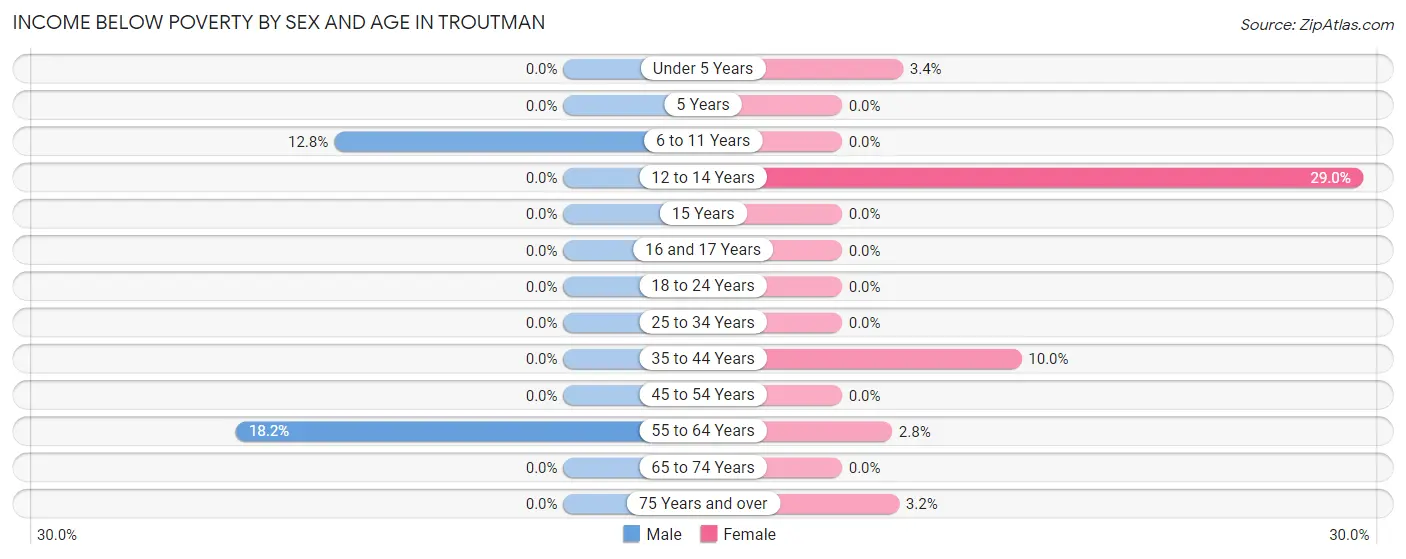
| Age Bracket | Male | Female |
| Under 5 Years | 0 (0.0%) | 5 (3.4%) |
| 5 Years | 0 (0.0%) | 0 (0.0%) |
| 6 to 11 Years | 41 (12.8%) | 0 (0.0%) |
| 12 to 14 Years | 0 (0.0%) | 29 (29.0%) |
| 15 Years | 0 (0.0%) | 0 (0.0%) |
| 16 and 17 Years | 0 (0.0%) | 0 (0.0%) |
| 18 to 24 Years | 0 (0.0%) | 0 (0.0%) |
| 25 to 34 Years | 0 (0.0%) | 0 (0.0%) |
| 35 to 44 Years | 0 (0.0%) | 30 (10.0%) |
| 45 to 54 Years | 0 (0.0%) | 0 (0.0%) |
| 55 to 64 Years | 35 (18.2%) | 7 (2.8%) |
| 65 to 74 Years | 0 (0.0%) | 0 (0.0%) |
| 75 Years and over | 0 (0.0%) | 5 (3.2%) |
| Total | 76 (4.3%) | 76 (4.0%) |
Income Above Poverty by Sex and Age in Troutman
According to the poverty statistics in Troutman, males aged under 5 years and females aged 5 years are the age groups that are most secure financially, with 100.0% of males and 100.0% of females in these age groups living above the poverty line.
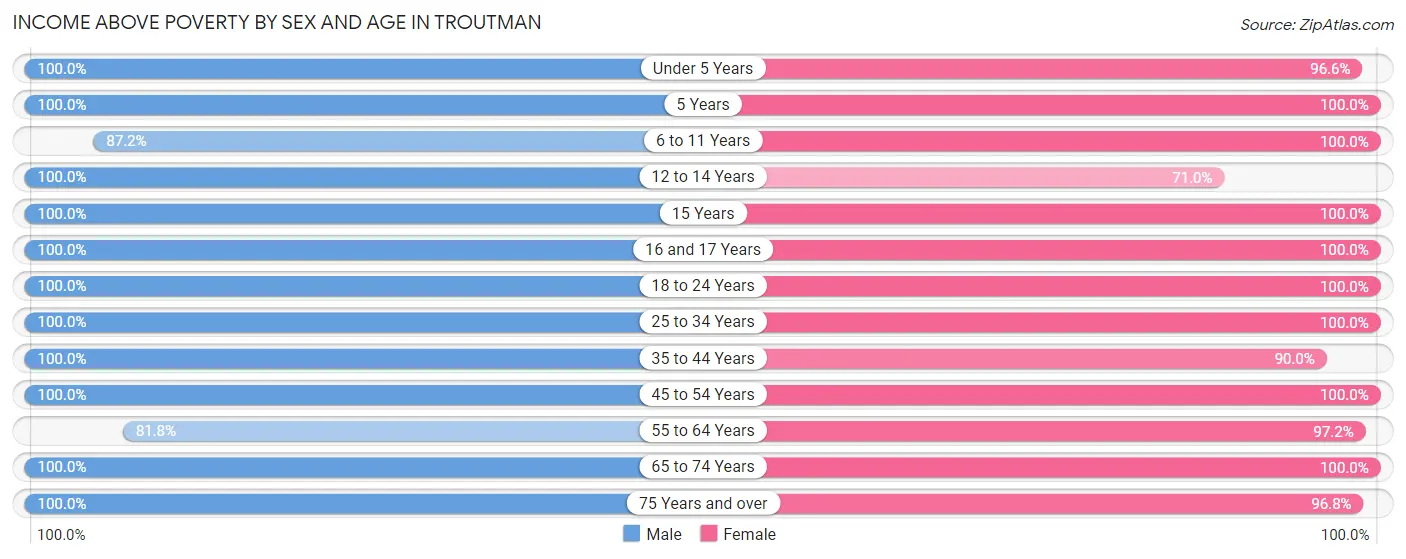
| Age Bracket | Male | Female |
| Under 5 Years | 258 (100.0%) | 142 (96.6%) |
| 5 Years | 9 (100.0%) | 34 (100.0%) |
| 6 to 11 Years | 280 (87.2%) | 98 (100.0%) |
| 12 to 14 Years | 13 (100.0%) | 71 (71.0%) |
| 15 Years | 7 (100.0%) | 25 (100.0%) |
| 16 and 17 Years | 40 (100.0%) | 40 (100.0%) |
| 18 to 24 Years | 97 (100.0%) | 105 (100.0%) |
| 25 to 34 Years | 225 (100.0%) | 300 (100.0%) |
| 35 to 44 Years | 285 (100.0%) | 270 (90.0%) |
| 45 to 54 Years | 176 (100.0%) | 277 (100.0%) |
| 55 to 64 Years | 157 (81.8%) | 244 (97.2%) |
| 65 to 74 Years | 100 (100.0%) | 75 (100.0%) |
| 75 Years and over | 50 (100.0%) | 152 (96.8%) |
| Total | 1,697 (95.7%) | 1,833 (96.0%) |
Income Below Poverty Among Married-Couple Families in Troutman
The poverty statistics for married-couple families in Troutman show that 1.0% or 7 of the total 708 families live below the poverty line. Families with no children have the highest poverty rate of 2.0%, comprising of 7 families. On the other hand, families with 1 or 2 children have the lowest poverty rate of 0.0%, which includes 0 families.
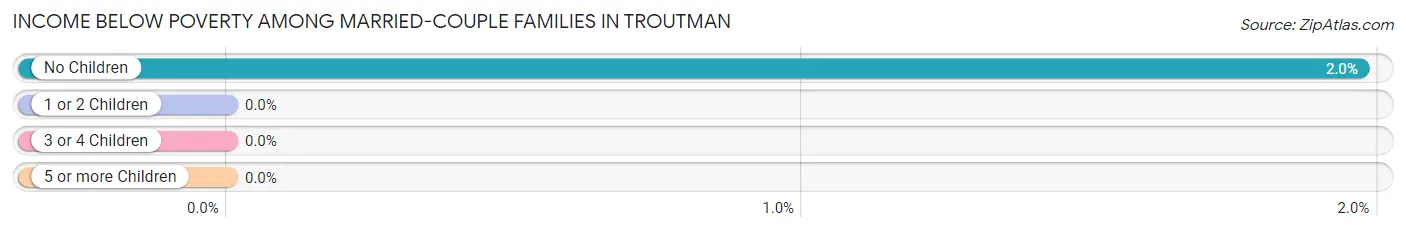
| Children | Above Poverty | Below Poverty |
| No Children | 348 (98.0%) | 7 (2.0%) |
| 1 or 2 Children | 288 (100.0%) | 0 (0.0%) |
| 3 or 4 Children | 60 (100.0%) | 0 (0.0%) |
| 5 or more Children | 5 (100.0%) | 0 (0.0%) |
| Total | 701 (99.0%) | 7 (1.0%) |
Income Below Poverty Among Single-Parent Households in Troutman
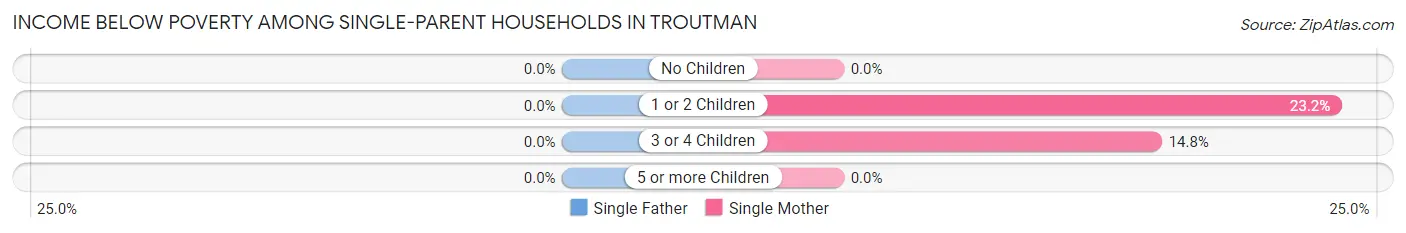
| Children | Single Father | Single Mother |
| No Children | 0 (0.0%) | 0 (0.0%) |
| 1 or 2 Children | 0 (0.0%) | 26 (23.2%) |
| 3 or 4 Children | 0 (0.0%) | 4 (14.8%) |
| 5 or more Children | 0 (0.0%) | 0 (0.0%) |
| Total | 0 (0.0%) | 30 (16.1%) |
Income Below Poverty Among Married-Couple vs Single-Parent Households in Troutman
The poverty data for Troutman shows that 7 of the married-couple family households (1.0%) and 30 of the single-parent households (12.6%) are living below the poverty level. Within the married-couple family households, those with no children have the highest poverty rate, with 7 households (2.0%) falling below the poverty line. Among the single-parent households, those with 1 or 2 children have the highest poverty rate, with 26 household (17.4%) living below poverty.
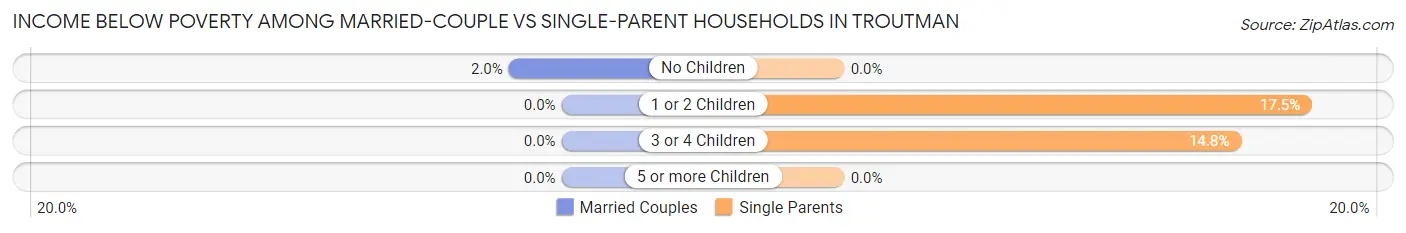
| Children | Married-Couple Families | Single-Parent Households |
| No Children | 7 (2.0%) | 0 (0.0%) |
| 1 or 2 Children | 0 (0.0%) | 26 (17.4%) |
| 3 or 4 Children | 0 (0.0%) | 4 (14.8%) |
| 5 or more Children | 0 (0.0%) | 0 (0.0%) |
| Total | 7 (1.0%) | 30 (12.6%) |
Race in Troutman
The most populous races in Troutman are White / Caucasian (2,636 | 71.5%), Black / African American (672 | 18.2%), and Two or more Races (257 | 7.0%).
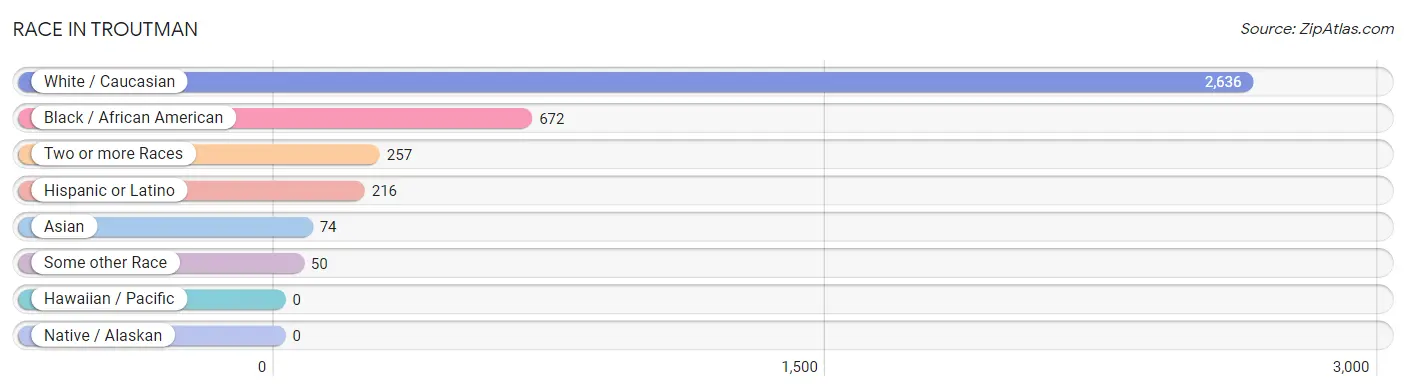
| Race | # Population | % Population |
| Asian | 74 | 2.0% |
| Black / African American | 672 | 18.2% |
| Hawaiian / Pacific | 0 | 0.0% |
| Hispanic or Latino | 216 | 5.9% |
| Native / Alaskan | 0 | 0.0% |
| White / Caucasian | 2,636 | 71.5% |
| Two or more Races | 257 | 7.0% |
| Some other Race | 50 | 1.4% |
| Total | 3,689 | 100.0% |
Ancestry in Troutman
The most populous ancestries reported in Troutman are English (458 | 12.4%), German (455 | 12.3%), Irish (348 | 9.4%), American (302 | 8.2%), and Italian (166 | 4.5%), together accounting for 46.9% of all Troutman residents.
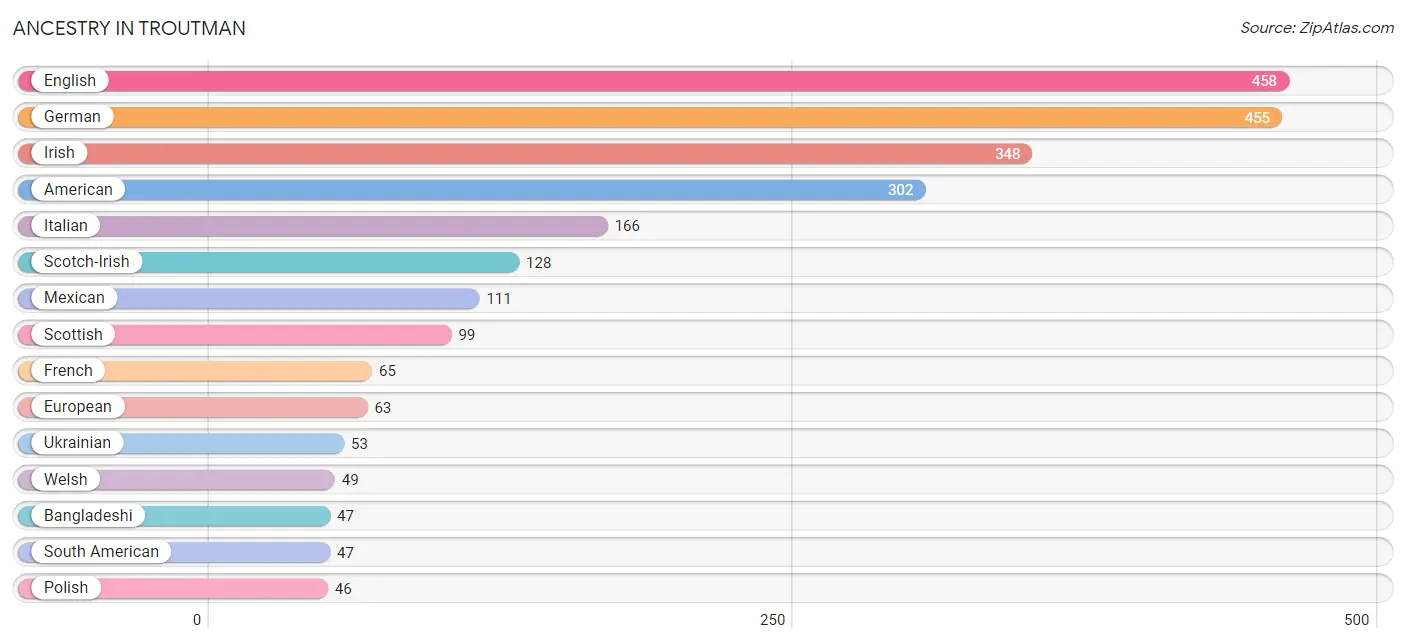
| Ancestry | # Population | % Population |
| African | 37 | 1.0% |
| American | 302 | 8.2% |
| Bangladeshi | 47 | 1.3% |
| Basque | 3 | 0.1% |
| Belgian | 10 | 0.3% |
| Bhutanese | 12 | 0.3% |
| British | 17 | 0.5% |
| Burmese | 12 | 0.3% |
| Central American | 4 | 0.1% |
| Croatian | 5 | 0.1% |
| Cuban | 12 | 0.3% |
| Czech | 5 | 0.1% |
| Czechoslovakian | 16 | 0.4% |
| Danish | 7 | 0.2% |
| Dominican | 19 | 0.5% |
| Dutch | 29 | 0.8% |
| Ecuadorian | 24 | 0.6% |
| English | 458 | 12.4% |
| European | 63 | 1.7% |
| French | 65 | 1.8% |
| French Canadian | 8 | 0.2% |
| German | 455 | 12.3% |
| Hungarian | 5 | 0.1% |
| Indian (Asian) | 8 | 0.2% |
| Irish | 348 | 9.4% |
| Italian | 166 | 4.5% |
| Mexican | 111 | 3.0% |
| Mexican American Indian | 3 | 0.1% |
| Nicaraguan | 4 | 0.1% |
| Norwegian | 16 | 0.4% |
| Polish | 46 | 1.3% |
| Portuguese | 6 | 0.2% |
| Puerto Rican | 16 | 0.4% |
| Russian | 16 | 0.4% |
| Scotch-Irish | 128 | 3.5% |
| Scottish | 99 | 2.7% |
| Slovak | 8 | 0.2% |
| Slovene | 5 | 0.1% |
| South American | 47 | 1.3% |
| Spanish | 7 | 0.2% |
| Subsaharan African | 37 | 1.0% |
| Swedish | 5 | 0.1% |
| Swiss | 16 | 0.4% |
| Ukrainian | 53 | 1.4% |
| Venezuelan | 23 | 0.6% |
| Welsh | 49 | 1.3% | View All 46 Rows |
Immigrants in Troutman
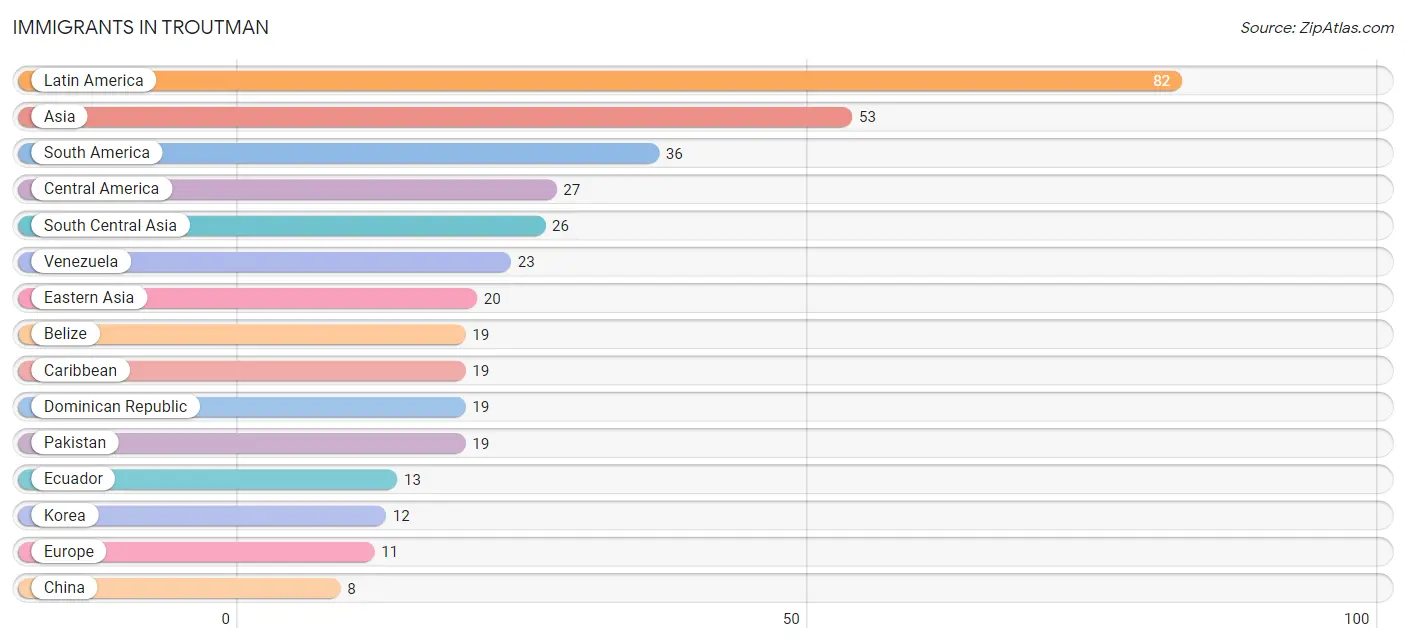
The most numerous immigrant groups reported in Troutman came from Latin America (82 | 2.2%), Asia (53 | 1.4%), South America (36 | 1.0%), Central America (27 | 0.7%), and South Central Asia (26 | 0.7%), together accounting for 6.1% of all Troutman residents.
| Immigration Origin | # Population | % Population |
| Asia | 53 | 1.4% |
| Belize | 19 | 0.5% |
| Caribbean | 19 | 0.5% |
| Central America | 27 | 0.7% |
| China | 8 | 0.2% |
| Dominican Republic | 19 | 0.5% |
| Eastern Asia | 20 | 0.5% |
| Eastern Europe | 6 | 0.2% |
| Ecuador | 13 | 0.4% |
| England | 5 | 0.1% |
| Europe | 11 | 0.3% |
| Kazakhstan | 7 | 0.2% |
| Korea | 12 | 0.3% |
| Latin America | 82 | 2.2% |
| Mexico | 4 | 0.1% |
| Nicaragua | 4 | 0.1% |
| Northern Europe | 5 | 0.1% |
| Pakistan | 19 | 0.5% |
| South America | 36 | 1.0% |
| South Central Asia | 26 | 0.7% |
| South Eastern Asia | 7 | 0.2% |
| Thailand | 7 | 0.2% |
| Ukraine | 6 | 0.2% |
| Venezuela | 23 | 0.6% | View All 24 Rows |
Sex and Age in Troutman
Sex and Age in Troutman
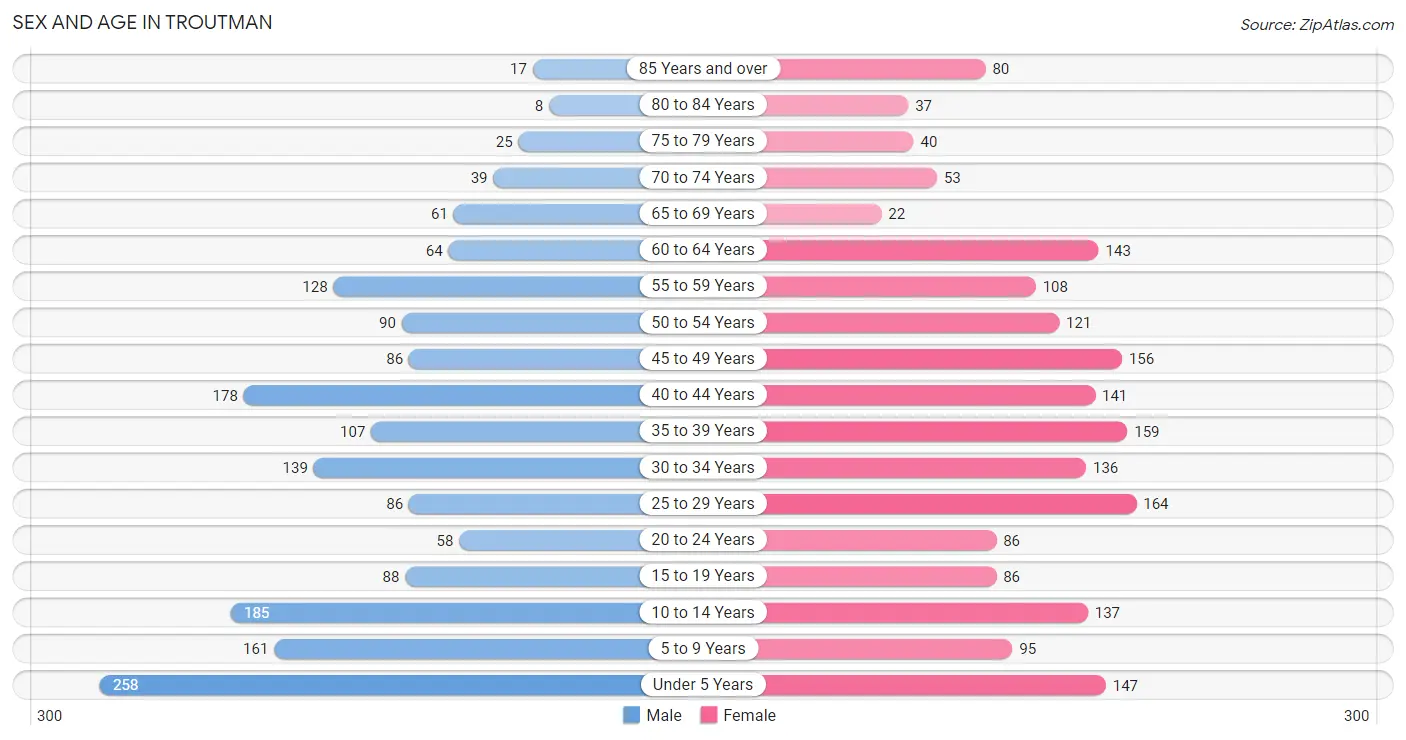
The most populous age groups in Troutman are Under 5 Years (258 | 14.5%) for men and 25 to 29 Years (164 | 8.6%) for women.
| Age Bracket | Male | Female |
| Under 5 Years | 258 (14.5%) | 147 (7.7%) |
| 5 to 9 Years | 161 (9.1%) | 95 (5.0%) |
| 10 to 14 Years | 185 (10.4%) | 137 (7.2%) |
| 15 to 19 Years | 88 (5.0%) | 86 (4.5%) |
| 20 to 24 Years | 58 (3.3%) | 86 (4.5%) |
| 25 to 29 Years | 86 (4.8%) | 164 (8.6%) |
| 30 to 34 Years | 139 (7.8%) | 136 (7.1%) |
| 35 to 39 Years | 107 (6.0%) | 159 (8.3%) |
| 40 to 44 Years | 178 (10.0%) | 141 (7.4%) |
| 45 to 49 Years | 86 (4.8%) | 156 (8.2%) |
| 50 to 54 Years | 90 (5.1%) | 121 (6.3%) |
| 55 to 59 Years | 128 (7.2%) | 108 (5.7%) |
| 60 to 64 Years | 64 (3.6%) | 143 (7.5%) |
| 65 to 69 Years | 61 (3.4%) | 22 (1.1%) |
| 70 to 74 Years | 39 (2.2%) | 53 (2.8%) |
| 75 to 79 Years | 25 (1.4%) | 40 (2.1%) |
| 80 to 84 Years | 8 (0.4%) | 37 (1.9%) |
| 85 Years and over | 17 (1.0%) | 80 (4.2%) |
| Total | 1,778 (100.0%) | 1,911 (100.0%) |
Families and Households in Troutman
Median Family Size in Troutman
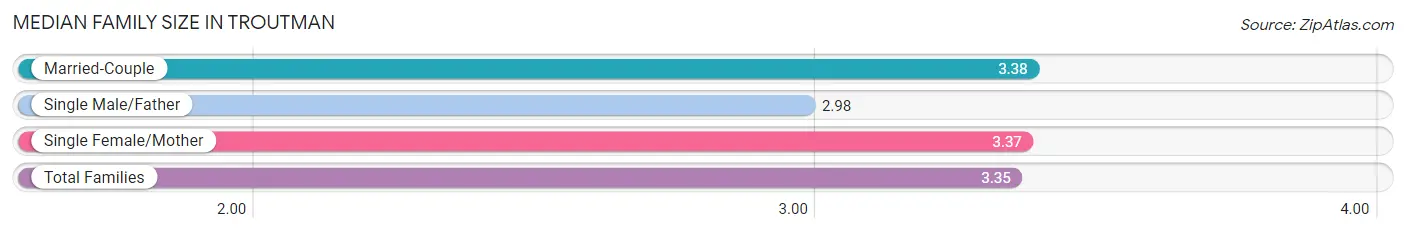
The median family size in Troutman is 3.35 persons per family, with married-couple families (708 | 74.8%) accounting for the largest median family size of 3.38 persons per family. On the other hand, single male/father families (52 | 5.5%) represent the smallest median family size with 2.98 persons per family.
| Family Type | # Families | Family Size |
| Married-Couple | 708 (74.8%) | 3.38 |
| Single Male/Father | 52 (5.5%) | 2.98 |
| Single Female/Mother | 186 (19.7%) | 3.37 |
| Total Families | 946 (100.0%) | 3.35 |
Median Household Size in Troutman
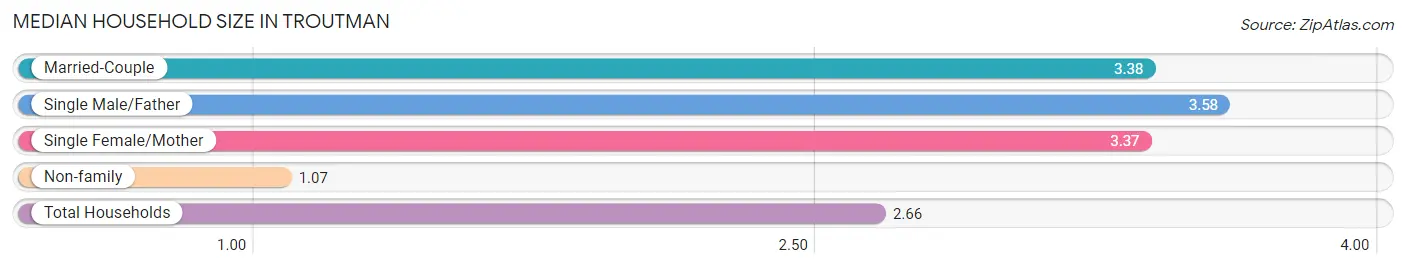
The median household size in Troutman is 2.66 persons per household, with single male/father households (52 | 3.8%) accounting for the largest median household size of 3.58 persons per household. non-family households (430 | 31.2%) represent the smallest median household size with 1.07 persons per household.
| Household Type | # Households | Household Size |
| Married-Couple | 708 (51.4%) | 3.38 |
| Single Male/Father | 52 (3.8%) | 3.58 |
| Single Female/Mother | 186 (13.5%) | 3.37 |
| Non-family | 430 (31.2%) | 1.07 |
| Total Households | 1,376 (100.0%) | 2.66 |
Household Size by Marriage Status in Troutman
Out of a total of 1,376 households in Troutman, 946 (68.8%) are family households, while 430 (31.2%) are nonfamily households. The most numerous type of family households are 2-person households, comprising 339, and the most common type of nonfamily households are 1-person households, comprising 399.
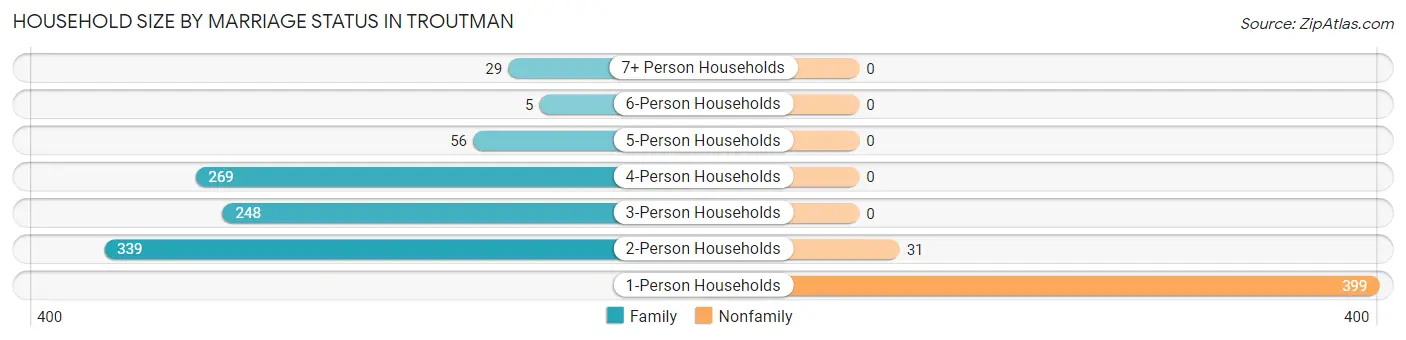
| Household Size | Family Households | Nonfamily Households |
| 1-Person Households | - | 399 (29.0%) |
| 2-Person Households | 339 (24.6%) | 31 (2.2%) |
| 3-Person Households | 248 (18.0%) | 0 (0.0%) |
| 4-Person Households | 269 (19.6%) | 0 (0.0%) |
| 5-Person Households | 56 (4.1%) | 0 (0.0%) |
| 6-Person Households | 5 (0.4%) | 0 (0.0%) |
| 7+ Person Households | 29 (2.1%) | 0 (0.0%) |
| Total | 946 (68.8%) | 430 (31.2%) |
Female Fertility in Troutman
Fertility by Age in Troutman
Average fertility rate in Troutman is 46.0 births per 1,000 women. Women in the age bracket of 20 to 34 years have the highest fertility rate with 114.0 births per 1,000 women. Women in the age bracket of 20 to 34 years acount for 100.0% of all women with births.
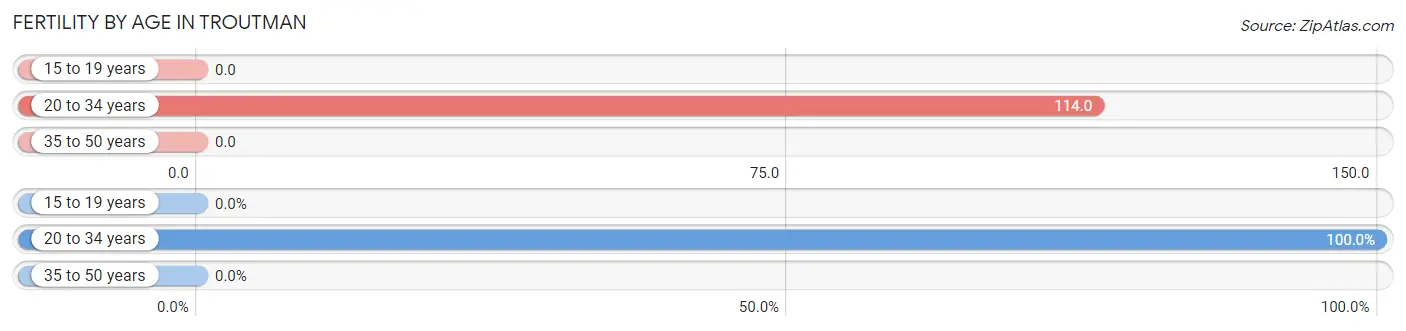
| Age Bracket | Women with Births | Births / 1,000 Women |
| 15 to 19 years | 0 (0.0%) | 0.0 |
| 20 to 34 years | 44 (100.0%) | 114.0 |
| 35 to 50 years | 0 (0.0%) | 0.0 |
| Total | 44 (100.0%) | 46.0 |
Fertility by Age by Marriage Status in Troutman
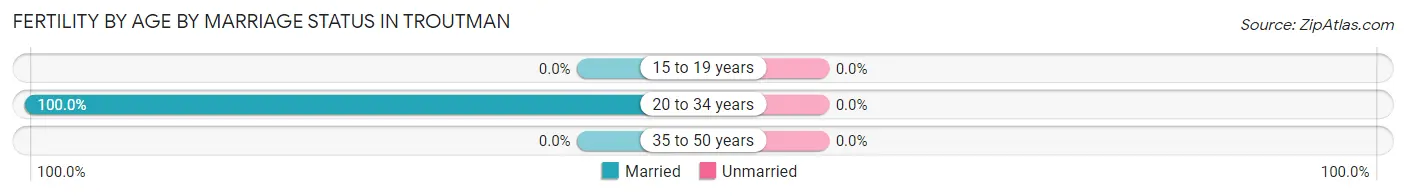
| Age Bracket | Married | Unmarried |
| 15 to 19 years | 0 (0.0%) | 0 (0.0%) |
| 20 to 34 years | 44 (100.0%) | 0 (0.0%) |
| 35 to 50 years | 0 (0.0%) | 0 (0.0%) |
| Total | 44 (100.0%) | 0 (0.0%) |
Fertility by Education in Troutman
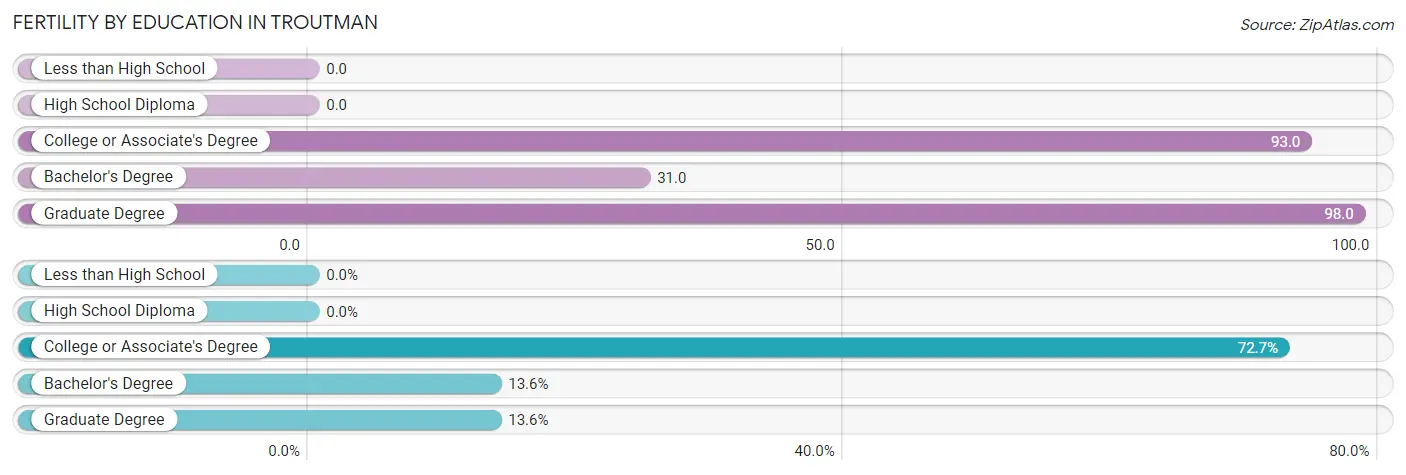
| Educational Attainment | Women with Births | Births / 1,000 Women |
| Less than High School | 0 (0.0%) | 0.0 |
| High School Diploma | 0 (0.0%) | 0.0 |
| College or Associate's Degree | 32 (72.7%) | 93.0 |
| Bachelor's Degree | 6 (13.6%) | 31.0 |
| Graduate Degree | 6 (13.6%) | 98.0 |
| Total | 44 (100.0%) | 46.0 |
Fertility by Education by Marriage Status in Troutman
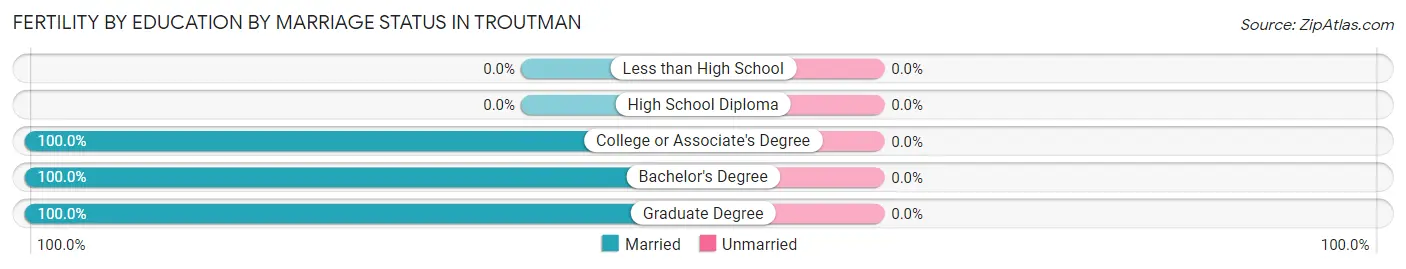
| Educational Attainment | Married | Unmarried |
| Less than High School | 0 (0.0%) | 0 (0.0%) |
| High School Diploma | 0 (0.0%) | 0 (0.0%) |
| College or Associate's Degree | 32 (100.0%) | 0 (0.0%) |
| Bachelor's Degree | 6 (100.0%) | 0 (0.0%) |
| Graduate Degree | 6 (100.0%) | 0 (0.0%) |
| Total | 44 (100.0%) | 0 (0.0%) |
Employment Characteristics in Troutman
Employment by Class of Employer in Troutman
Among the 1,737 employed individuals in Troutman, private company employees (1,133 | 65.2%), self-employed (not incorporated) (228 | 13.1%), and not-for-profit organizations (162 | 9.3%) make up the most common classes of employment.
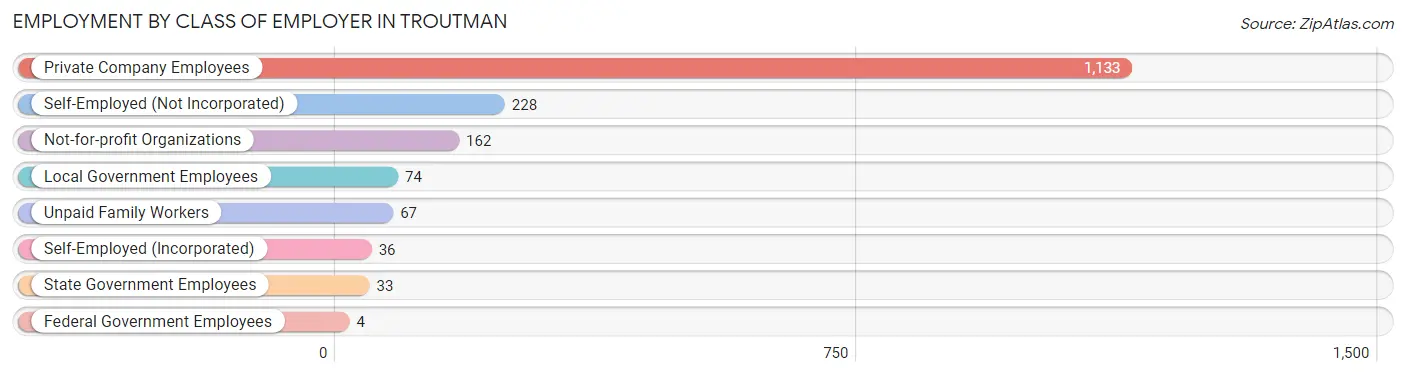
| Employer Class | # Employees | % Employees |
| Private Company Employees | 1,133 | 65.2% |
| Self-Employed (Incorporated) | 36 | 2.1% |
| Self-Employed (Not Incorporated) | 228 | 13.1% |
| Not-for-profit Organizations | 162 | 9.3% |
| Local Government Employees | 74 | 4.3% |
| State Government Employees | 33 | 1.9% |
| Federal Government Employees | 4 | 0.2% |
| Unpaid Family Workers | 67 | 3.9% |
| Total | 1,737 | 100.0% |
Employment Status by Age in Troutman
According to the labor force statistics for Troutman, out of the total population over 16 years of age (2,672), 72.3% or 1,932 individuals are in the labor force, with 8.9% or 172 of them unemployed. The age group with the highest labor force participation rate is 35 to 44 years, with 92.3% or 540 individuals in the labor force. Within the labor force, the 16 to 19 years age range has the highest percentage of unemployed individuals, with 31.3% or 25 of them being unemployed.
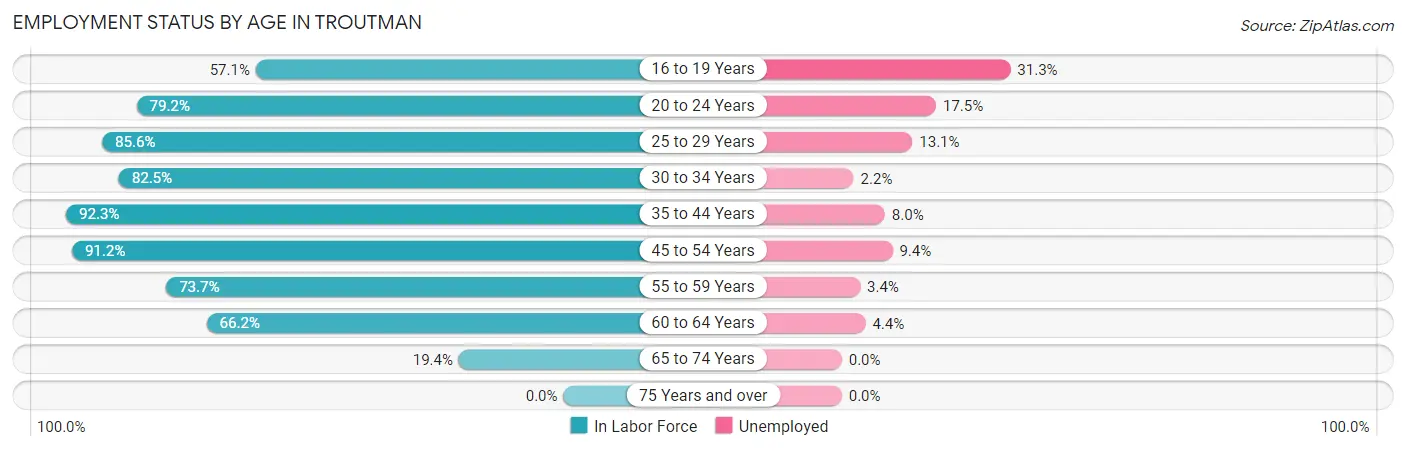
| Age Bracket | In Labor Force | Unemployed |
| 16 to 19 Years | 80 (57.1%) | 25 (31.3%) |
| 20 to 24 Years | 114 (79.2%) | 20 (17.5%) |
| 25 to 29 Years | 214 (85.6%) | 28 (13.1%) |
| 30 to 34 Years | 227 (82.5%) | 5 (2.2%) |
| 35 to 44 Years | 540 (92.3%) | 43 (8.0%) |
| 45 to 54 Years | 413 (91.2%) | 39 (9.4%) |
| 55 to 59 Years | 174 (73.7%) | 6 (3.4%) |
| 60 to 64 Years | 137 (66.2%) | 6 (4.4%) |
| 65 to 74 Years | 34 (19.4%) | 0 (0.0%) |
| 75 Years and over | 0 (0.0%) | 0 (0.0%) |
| Total | 1,932 (72.3%) | 172 (8.9%) |
Employment Status by Educational Attainment in Troutman
According to labor force statistics for Troutman, 85.0% of individuals (1,705) out of the total population between 25 and 64 years of age (2,006) are in the labor force, with 7.4% or 126 of them being unemployed. The group with the highest labor force participation rate are those with the educational attainment of bachelor's degree or higher, with 91.4% or 676 individuals in the labor force. Within the labor force, individuals with less than high school education have the highest percentage of unemployment, with 15.6% or 7 of them being unemployed.
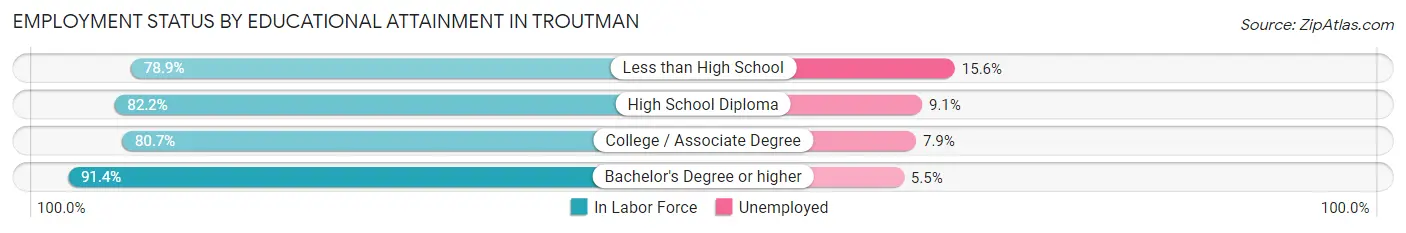
| Educational Attainment | In Labor Force | Unemployed |
| Less than High School | 45 (78.9%) | 9 (15.6%) |
| High School Diploma | 440 (82.2%) | 49 (9.1%) |
| College / Associate Degree | 544 (80.7%) | 53 (7.9%) |
| Bachelor's Degree or higher | 676 (91.4%) | 41 (5.5%) |
| Total | 1,705 (85.0%) | 148 (7.4%) |
Employment Occupations by Sex in Troutman
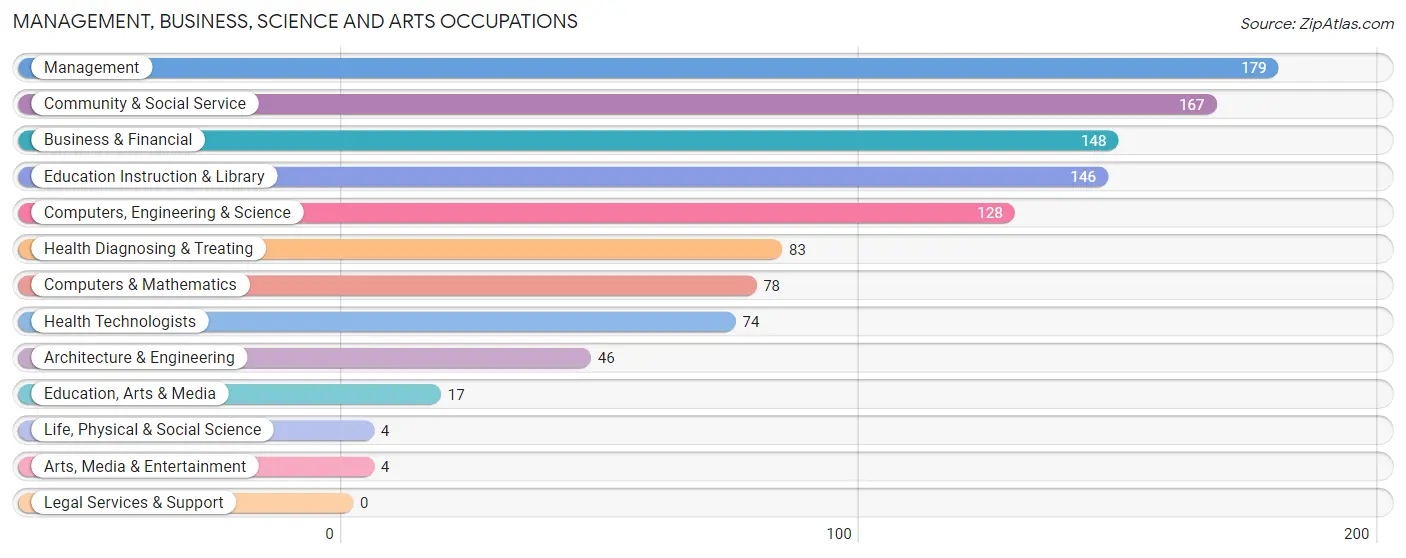
Management, Business, Science and Arts Occupations
The most common Management, Business, Science and Arts occupations in Troutman are Management (179 | 10.2%), Community & Social Service (167 | 9.5%), Business & Financial (148 | 8.4%), Education Instruction & Library (146 | 8.3%), and Computers, Engineering & Science (128 | 7.3%).
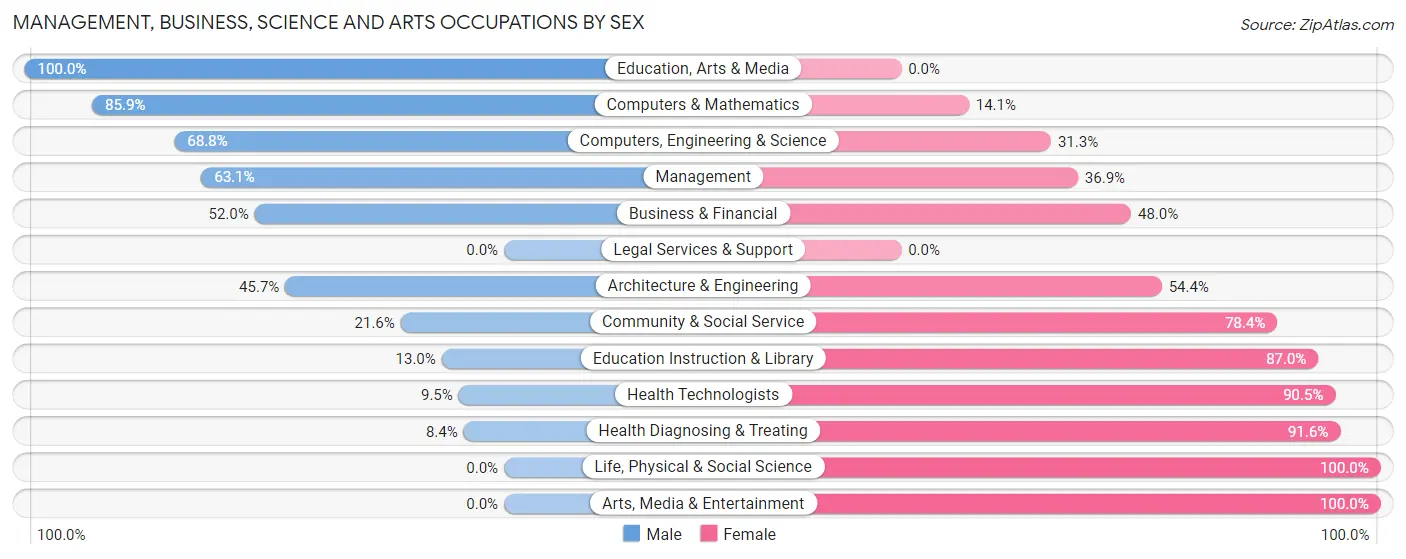
Management, Business, Science and Arts Occupations by Sex
Within the Management, Business, Science and Arts occupations in Troutman, the most male-oriented occupations are Education, Arts & Media (100.0%), Computers & Mathematics (85.9%), and Computers, Engineering & Science (68.8%), while the most female-oriented occupations are Life, Physical & Social Science (100.0%), Arts, Media & Entertainment (100.0%), and Health Diagnosing & Treating (91.6%).
| Occupation | Male | Female |
| Management | 113 (63.1%) | 66 (36.9%) |
| Business & Financial | 77 (52.0%) | 71 (48.0%) |
| Computers, Engineering & Science | 88 (68.8%) | 40 (31.2%) |
| Computers & Mathematics | 67 (85.9%) | 11 (14.1%) |
| Architecture & Engineering | 21 (45.7%) | 25 (54.3%) |
| Life, Physical & Social Science | 0 (0.0%) | 4 (100.0%) |
| Community & Social Service | 36 (21.6%) | 131 (78.4%) |
| Education, Arts & Media | 17 (100.0%) | 0 (0.0%) |
| Legal Services & Support | 0 (0.0%) | 0 (0.0%) |
| Education Instruction & Library | 19 (13.0%) | 127 (87.0%) |
| Arts, Media & Entertainment | 0 (0.0%) | 4 (100.0%) |
| Health Diagnosing & Treating | 7 (8.4%) | 76 (91.6%) |
| Health Technologists | 7 (9.5%) | 67 (90.5%) |
| Total (Category) | 321 (45.5%) | 384 (54.5%) |
| Total (Overall) | 842 (47.8%) | 919 (52.2%) |
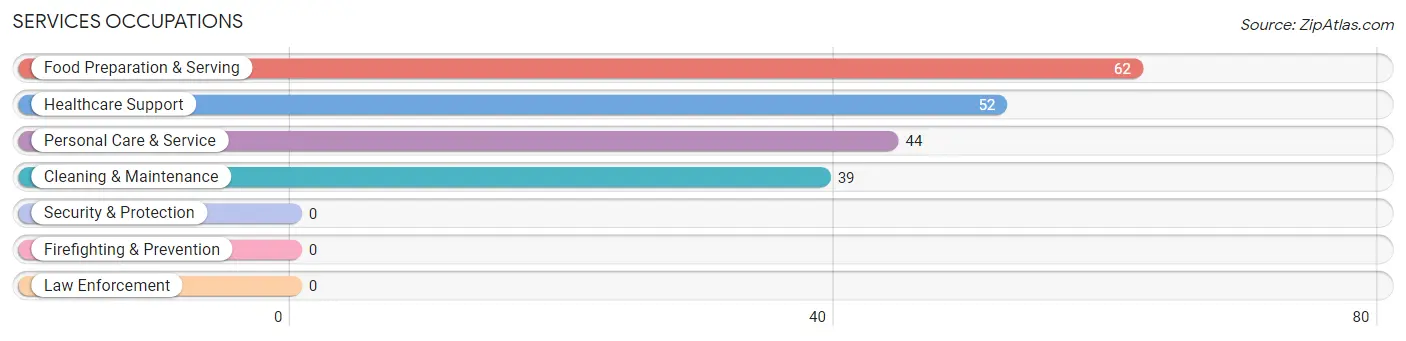
Services Occupations
The most common Services occupations in Troutman are Food Preparation & Serving (62 | 3.5%), Healthcare Support (52 | 2.9%), Personal Care & Service (44 | 2.5%), and Cleaning & Maintenance (39 | 2.2%).
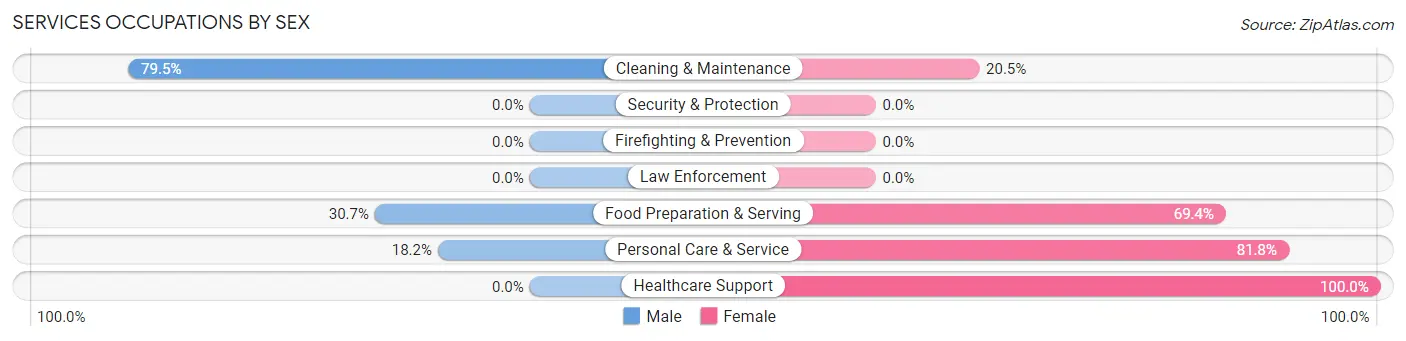
Services Occupations by Sex
Within the Services occupations in Troutman, the most male-oriented occupations are Cleaning & Maintenance (79.5%), Food Preparation & Serving (30.6%), and Personal Care & Service (18.2%), while the most female-oriented occupations are Healthcare Support (100.0%), Personal Care & Service (81.8%), and Food Preparation & Serving (69.4%).
| Occupation | Male | Female |
| Healthcare Support | 0 (0.0%) | 52 (100.0%) |
| Security & Protection | 0 (0.0%) | 0 (0.0%) |
| Firefighting & Prevention | 0 (0.0%) | 0 (0.0%) |
| Law Enforcement | 0 (0.0%) | 0 (0.0%) |
| Food Preparation & Serving | 19 (30.6%) | 43 (69.4%) |
| Cleaning & Maintenance | 31 (79.5%) | 8 (20.5%) |
| Personal Care & Service | 8 (18.2%) | 36 (81.8%) |
| Total (Category) | 58 (29.4%) | 139 (70.6%) |
| Total (Overall) | 842 (47.8%) | 919 (52.2%) |
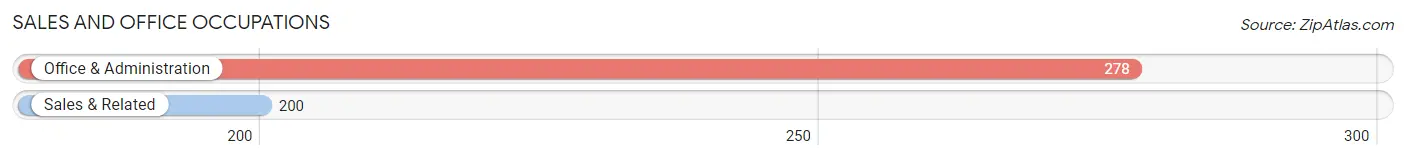
Sales and Office Occupations
The most common Sales and Office occupations in Troutman are Office & Administration (278 | 15.8%), and Sales & Related (200 | 11.4%).
Sales and Office Occupations by Sex
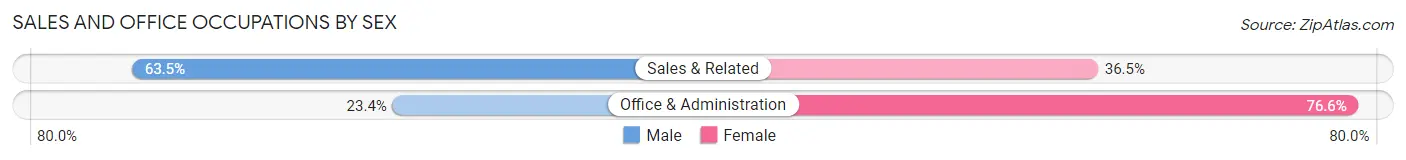
| Occupation | Male | Female |
| Sales & Related | 127 (63.5%) | 73 (36.5%) |
| Office & Administration | 65 (23.4%) | 213 (76.6%) |
| Total (Category) | 192 (40.2%) | 286 (59.8%) |
| Total (Overall) | 842 (47.8%) | 919 (52.2%) |
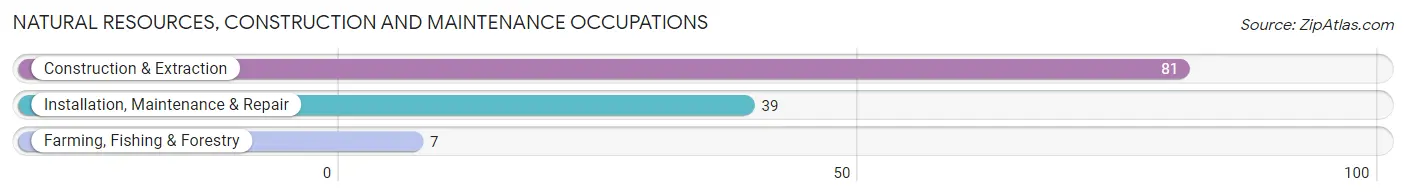
Natural Resources, Construction and Maintenance Occupations
The most common Natural Resources, Construction and Maintenance occupations in Troutman are Construction & Extraction (81 | 4.6%), Installation, Maintenance & Repair (39 | 2.2%), and Farming, Fishing & Forestry (7 | 0.4%).
Natural Resources, Construction and Maintenance Occupations by Sex
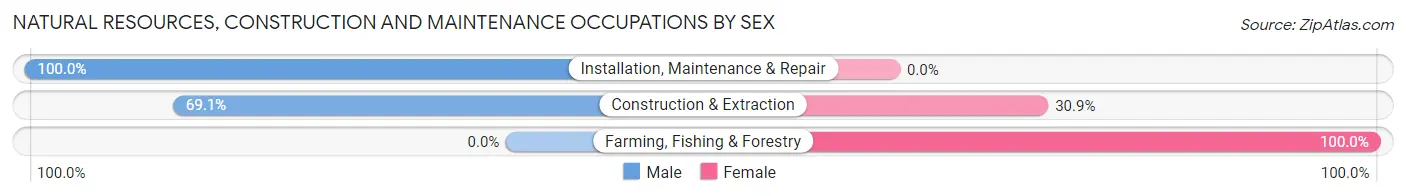
| Occupation | Male | Female |
| Farming, Fishing & Forestry | 0 (0.0%) | 7 (100.0%) |
| Construction & Extraction | 56 (69.1%) | 25 (30.9%) |
| Installation, Maintenance & Repair | 39 (100.0%) | 0 (0.0%) |
| Total (Category) | 95 (74.8%) | 32 (25.2%) |
| Total (Overall) | 842 (47.8%) | 919 (52.2%) |
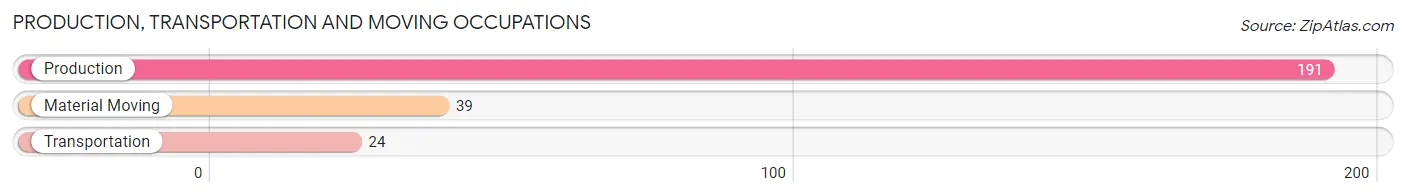
Production, Transportation and Moving Occupations
The most common Production, Transportation and Moving occupations in Troutman are Production (191 | 10.8%), Material Moving (39 | 2.2%), and Transportation (24 | 1.4%).
Production, Transportation and Moving Occupations by Sex
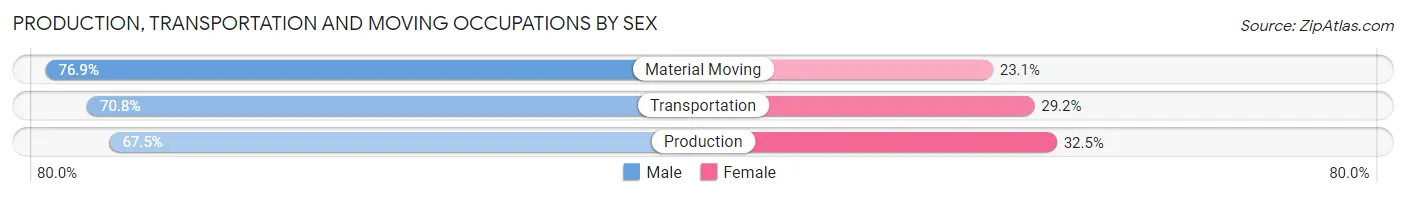
| Occupation | Male | Female |
| Production | 129 (67.5%) | 62 (32.5%) |
| Transportation | 17 (70.8%) | 7 (29.2%) |
| Material Moving | 30 (76.9%) | 9 (23.1%) |
| Total (Category) | 176 (69.3%) | 78 (30.7%) |
| Total (Overall) | 842 (47.8%) | 919 (52.2%) |
Employment Industries by Sex in Troutman
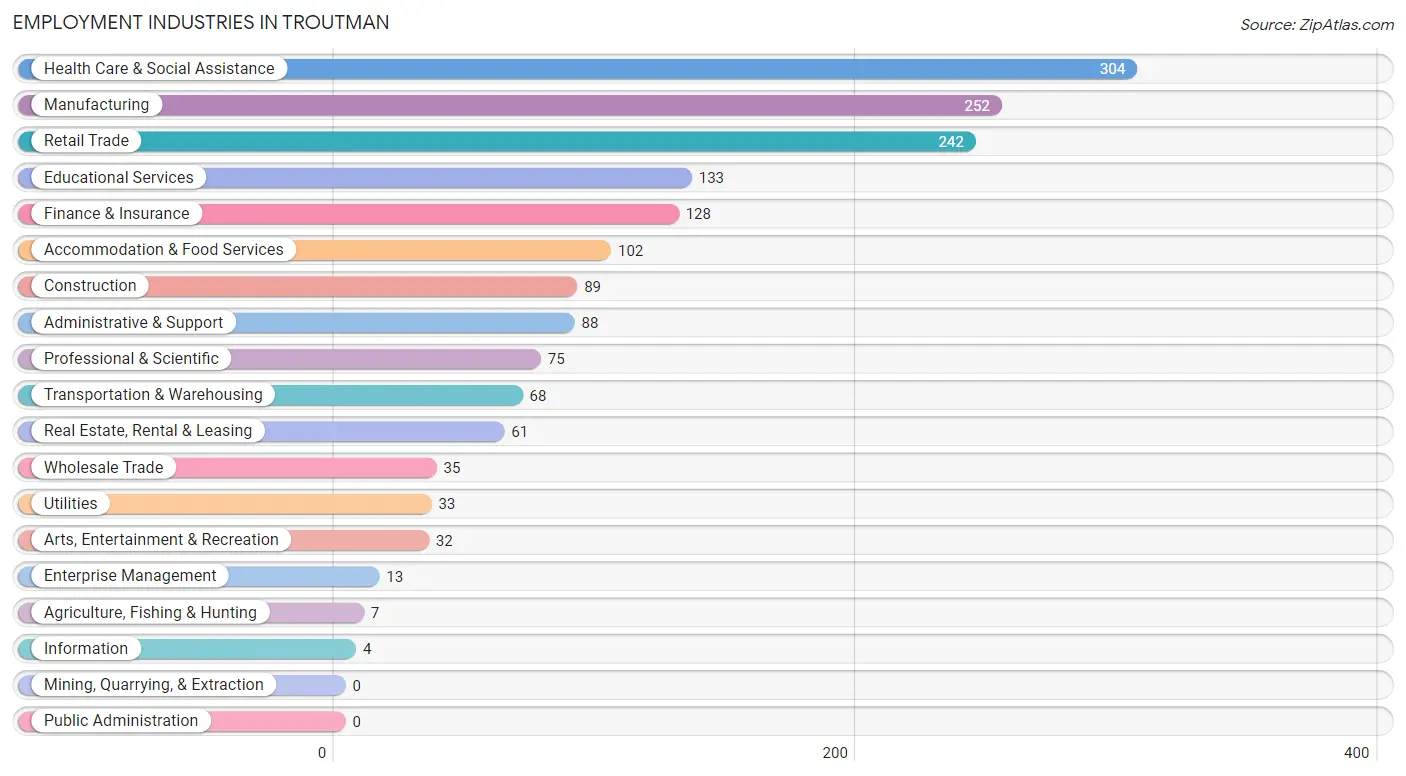
Employment Industries in Troutman
The major employment industries in Troutman include Health Care & Social Assistance (304 | 17.3%), Manufacturing (252 | 14.3%), Retail Trade (242 | 13.7%), Educational Services (133 | 7.5%), and Finance & Insurance (128 | 7.3%).
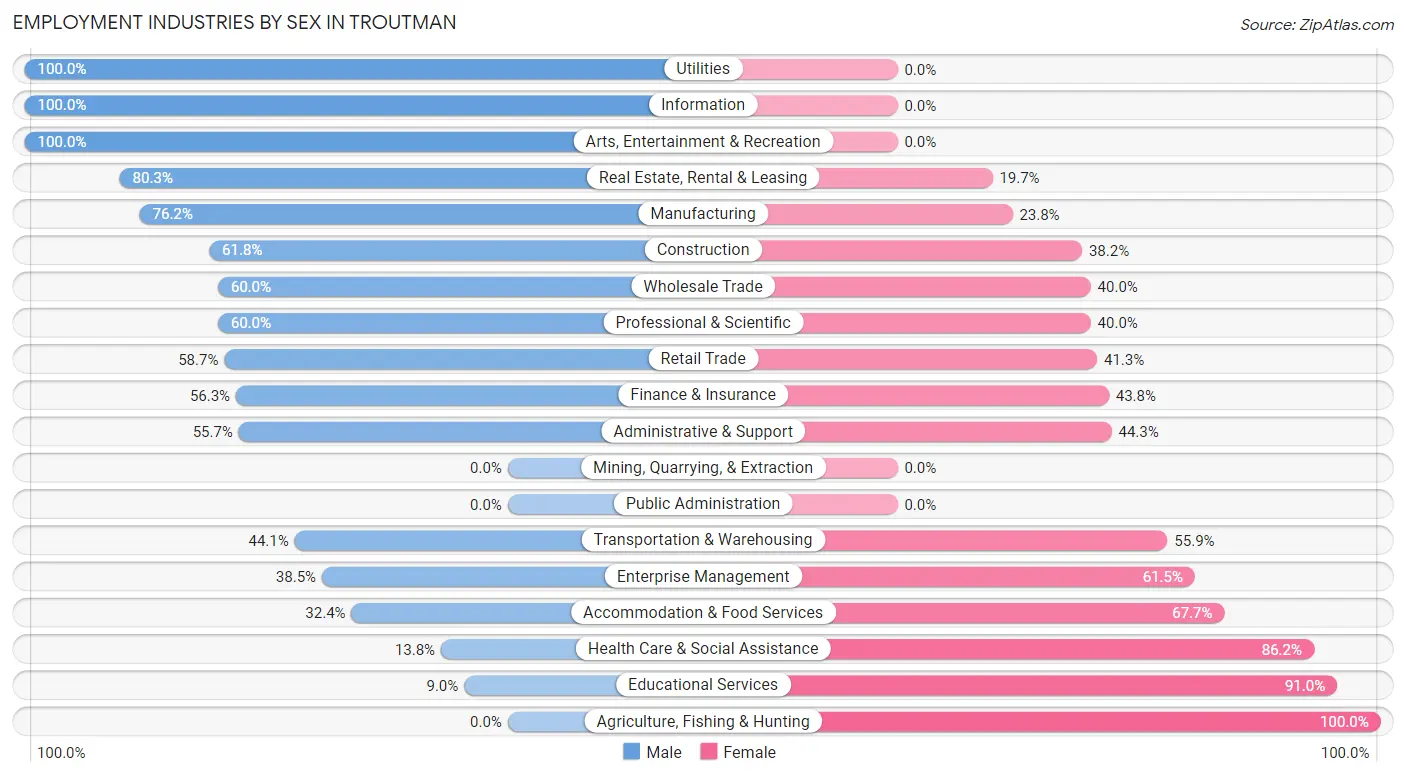
Employment Industries by Sex in Troutman
The Troutman industries that see more men than women are Utilities (100.0%), Information (100.0%), and Arts, Entertainment & Recreation (100.0%), whereas the industries that tend to have a higher number of women are Agriculture, Fishing & Hunting (100.0%), Educational Services (91.0%), and Health Care & Social Assistance (86.2%).
| Industry | Male | Female |
| Agriculture, Fishing & Hunting | 0 (0.0%) | 7 (100.0%) |
| Mining, Quarrying, & Extraction | 0 (0.0%) | 0 (0.0%) |
| Construction | 55 (61.8%) | 34 (38.2%) |
| Manufacturing | 192 (76.2%) | 60 (23.8%) |
| Wholesale Trade | 21 (60.0%) | 14 (40.0%) |
| Retail Trade | 142 (58.7%) | 100 (41.3%) |
| Transportation & Warehousing | 30 (44.1%) | 38 (55.9%) |
| Utilities | 33 (100.0%) | 0 (0.0%) |
| Information | 4 (100.0%) | 0 (0.0%) |
| Finance & Insurance | 72 (56.2%) | 56 (43.8%) |
| Real Estate, Rental & Leasing | 49 (80.3%) | 12 (19.7%) |
| Professional & Scientific | 45 (60.0%) | 30 (40.0%) |
| Enterprise Management | 5 (38.5%) | 8 (61.5%) |
| Administrative & Support | 49 (55.7%) | 39 (44.3%) |
| Educational Services | 12 (9.0%) | 121 (91.0%) |
| Health Care & Social Assistance | 42 (13.8%) | 262 (86.2%) |
| Arts, Entertainment & Recreation | 32 (100.0%) | 0 (0.0%) |
| Accommodation & Food Services | 33 (32.4%) | 69 (67.6%) |
| Public Administration | 0 (0.0%) | 0 (0.0%) |
| Total | 842 (47.8%) | 919 (52.2%) |
Education in Troutman
School Enrollment in Troutman
The most common levels of schooling among the 951 students in Troutman are elementary school (241 | 25.3%), high school (200 | 21.0%), and middle school (198 | 20.8%).
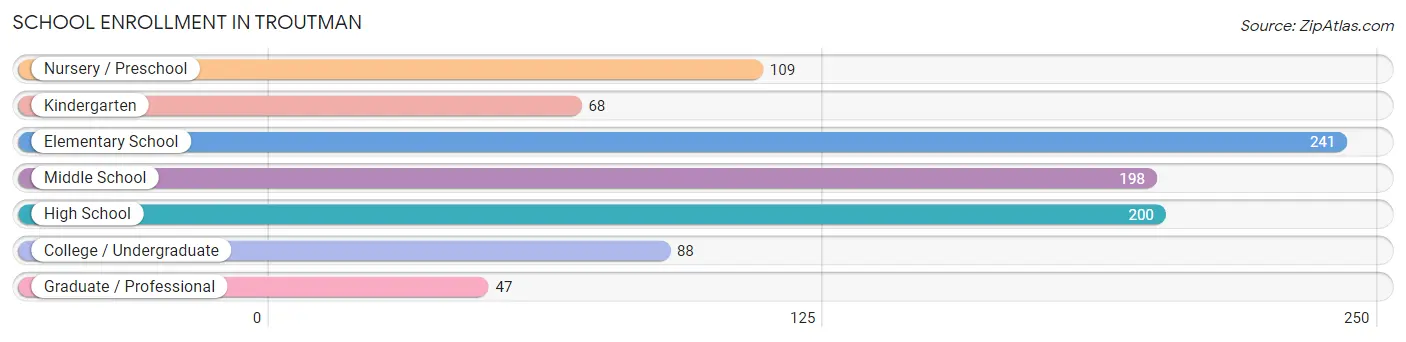
| School Level | # Students | % Students |
| Nursery / Preschool | 109 | 11.5% |
| Kindergarten | 68 | 7.1% |
| Elementary School | 241 | 25.3% |
| Middle School | 198 | 20.8% |
| High School | 200 | 21.0% |
| College / Undergraduate | 88 | 9.2% |
| Graduate / Professional | 47 | 4.9% |
| Total | 951 | 100.0% |
School Enrollment by Age by Funding Source in Troutman
Out of a total of 951 students who are enrolled in schools in Troutman, 194 (20.4%) attend a private institution, while the remaining 757 (79.6%) are enrolled in public schools. The age group of 35 years and over has the highest likelihood of being enrolled in private schools, with 33 (73.3% in the age bracket) enrolled. Conversely, the age group of 18 to 19 year olds has the lowest likelihood of being enrolled in a private school, with 33 (100.0% in the age bracket) attending a public institution.
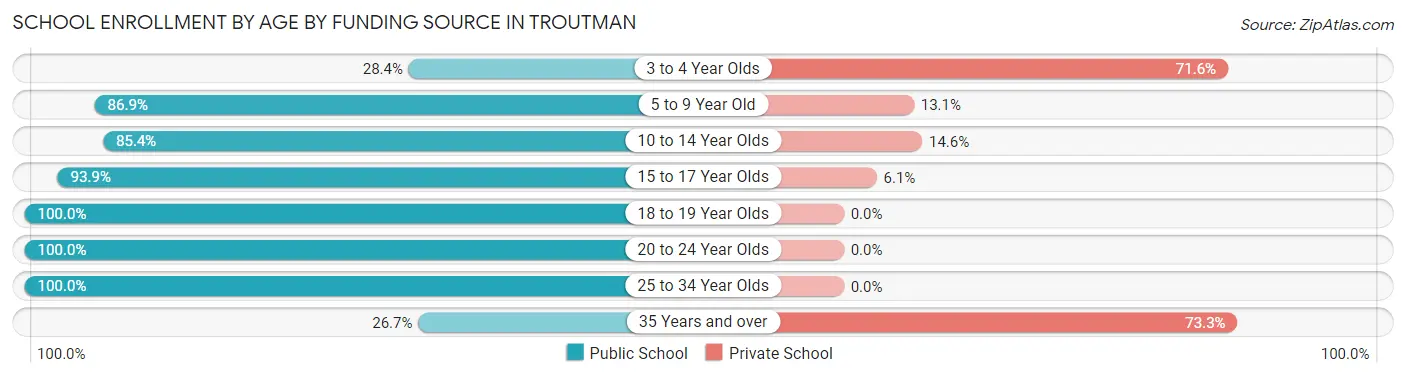
| Age Bracket | Public School | Private School |
| 3 to 4 Year Olds | 31 (28.4%) | 78 (71.6%) |
| 5 to 9 Year Old | 193 (86.9%) | 29 (13.1%) |
| 10 to 14 Year Olds | 275 (85.4%) | 47 (14.6%) |
| 15 to 17 Year Olds | 107 (93.9%) | 7 (6.1%) |
| 18 to 19 Year Olds | 33 (100.0%) | 0 (0.0%) |
| 20 to 24 Year Olds | 38 (100.0%) | 0 (0.0%) |
| 25 to 34 Year Olds | 68 (100.0%) | 0 (0.0%) |
| 35 Years and over | 12 (26.7%) | 33 (73.3%) |
| Total | 757 (79.6%) | 194 (20.4%) |
Educational Attainment by Field of Study in Troutman
Business (222 | 24.1%), education (142 | 15.4%), social sciences (125 | 13.6%), computers & mathematics (74 | 8.0%), and arts & humanities (68 | 7.4%) are the most common fields of study among 921 individuals in Troutman who have obtained a bachelor's degree or higher.
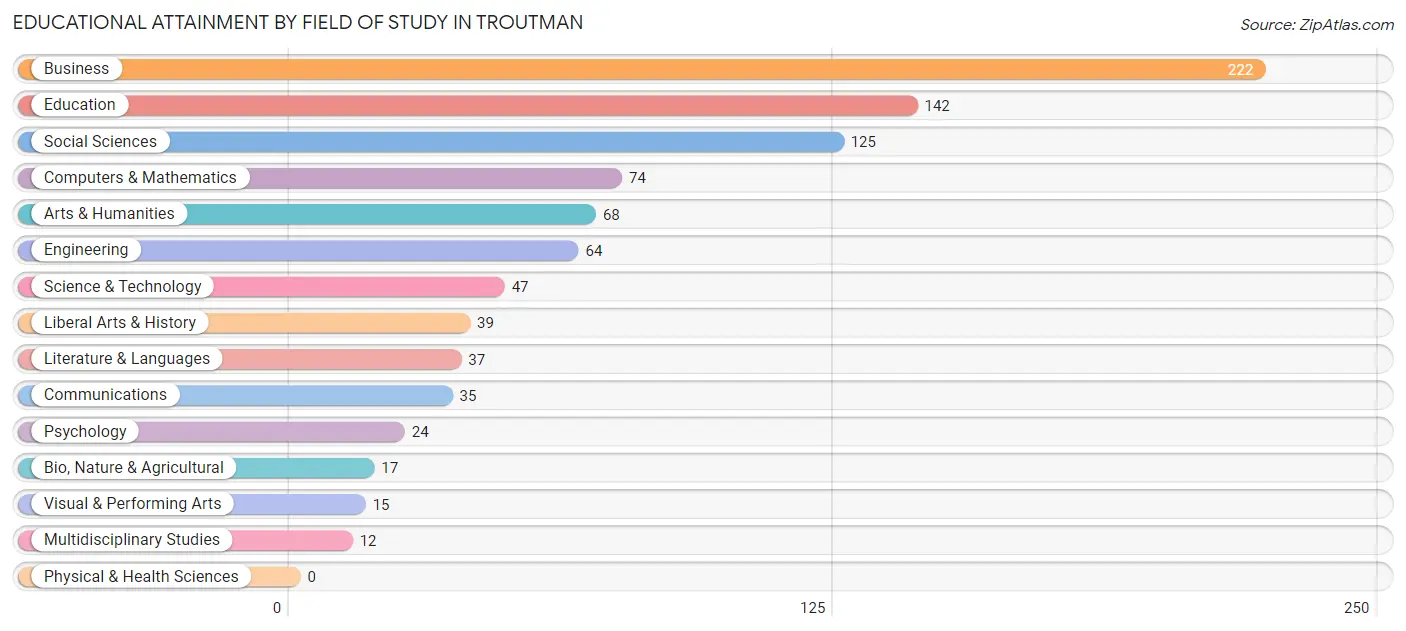
| Field of Study | # Graduates | % Graduates |
| Computers & Mathematics | 74 | 8.0% |
| Bio, Nature & Agricultural | 17 | 1.8% |
| Physical & Health Sciences | 0 | 0.0% |
| Psychology | 24 | 2.6% |
| Social Sciences | 125 | 13.6% |
| Engineering | 64 | 7.0% |
| Multidisciplinary Studies | 12 | 1.3% |
| Science & Technology | 47 | 5.1% |
| Business | 222 | 24.1% |
| Education | 142 | 15.4% |
| Literature & Languages | 37 | 4.0% |
| Liberal Arts & History | 39 | 4.2% |
| Visual & Performing Arts | 15 | 1.6% |
| Communications | 35 | 3.8% |
| Arts & Humanities | 68 | 7.4% |
| Total | 921 | 100.0% |
Transportation & Commute in Troutman
Vehicle Availability by Sex in Troutman
The most prevalent vehicle ownership categories in Troutman are males with 2 vehicles (465, accounting for 55.5%) and females with 2 vehicles (492, making up 51.7%).
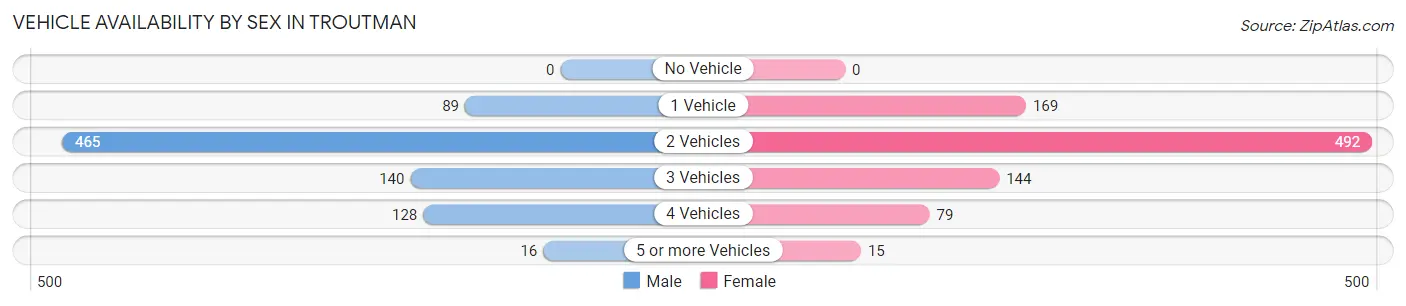
| Vehicles Available | Male | Female |
| No Vehicle | 0 (0.0%) | 0 (0.0%) |
| 1 Vehicle | 89 (10.6%) | 169 (18.8%) |
| 2 Vehicles | 465 (55.5%) | 492 (54.7%) |
| 3 Vehicles | 140 (16.7%) | 144 (16.0%) |
| 4 Vehicles | 128 (15.3%) | 79 (8.8%) |
| 5 or more Vehicles | 16 (1.9%) | 15 (1.7%) |
| Total | 838 (100.0%) | 899 (100.0%) |
Commute Time in Troutman
The most frequently occuring commute durations in Troutman are 15 to 19 minutes (489 commuters, 35.2%), 20 to 24 minutes (233 commuters, 16.8%), and 10 to 14 minutes (150 commuters, 10.8%).
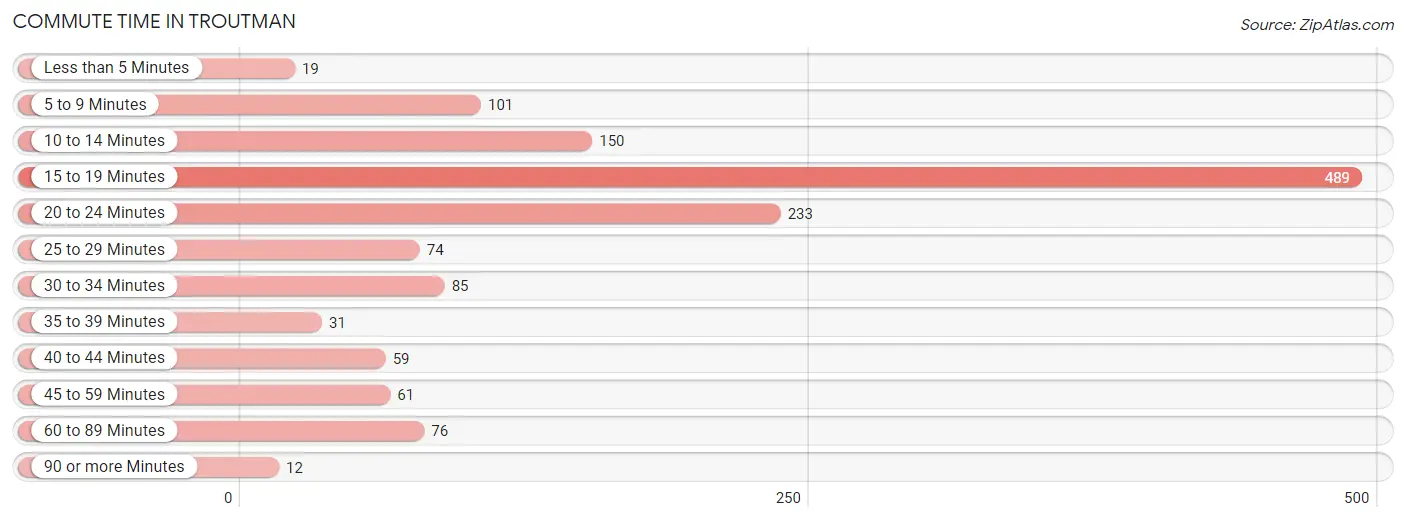
| Commute Time | # Commuters | % Commuters |
| Less than 5 Minutes | 19 | 1.4% |
| 5 to 9 Minutes | 101 | 7.3% |
| 10 to 14 Minutes | 150 | 10.8% |
| 15 to 19 Minutes | 489 | 35.2% |
| 20 to 24 Minutes | 233 | 16.8% |
| 25 to 29 Minutes | 74 | 5.3% |
| 30 to 34 Minutes | 85 | 6.1% |
| 35 to 39 Minutes | 31 | 2.2% |
| 40 to 44 Minutes | 59 | 4.2% |
| 45 to 59 Minutes | 61 | 4.4% |
| 60 to 89 Minutes | 76 | 5.5% |
| 90 or more Minutes | 12 | 0.9% |
Commute Time by Sex in Troutman
The most common commute times in Troutman are 15 to 19 minutes (218 commuters, 30.4%) for males and 15 to 19 minutes (271 commuters, 40.3%) for females.
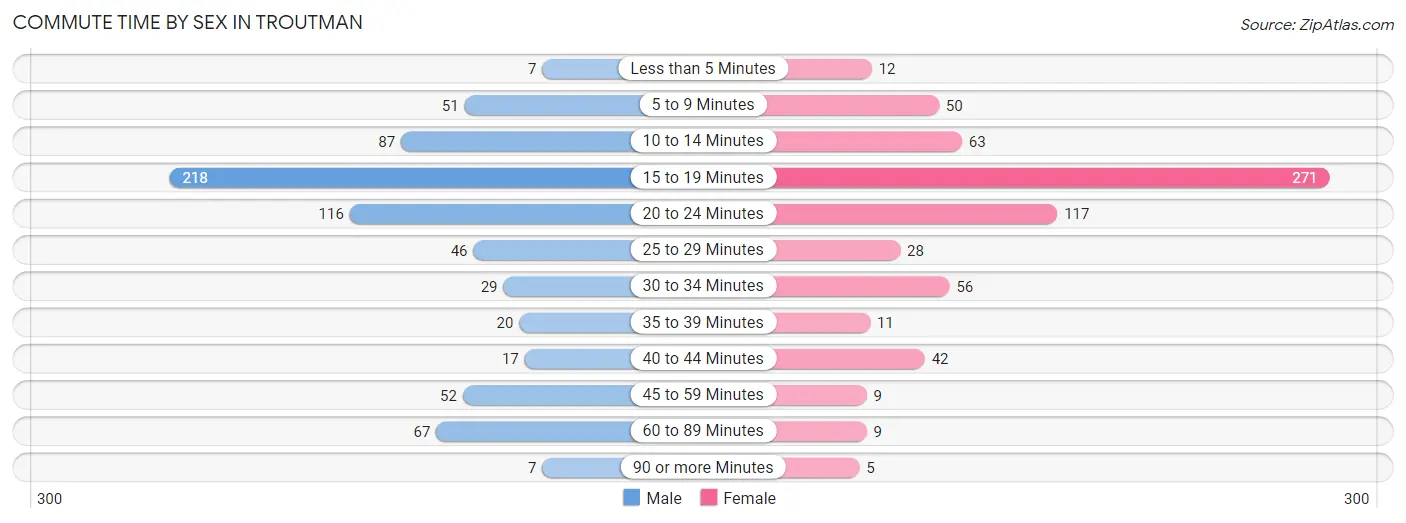
| Commute Time | Male | Female |
| Less than 5 Minutes | 7 (1.0%) | 12 (1.8%) |
| 5 to 9 Minutes | 51 (7.1%) | 50 (7.4%) |
| 10 to 14 Minutes | 87 (12.1%) | 63 (9.4%) |
| 15 to 19 Minutes | 218 (30.4%) | 271 (40.3%) |
| 20 to 24 Minutes | 116 (16.2%) | 117 (17.4%) |
| 25 to 29 Minutes | 46 (6.4%) | 28 (4.2%) |
| 30 to 34 Minutes | 29 (4.0%) | 56 (8.3%) |
| 35 to 39 Minutes | 20 (2.8%) | 11 (1.6%) |
| 40 to 44 Minutes | 17 (2.4%) | 42 (6.2%) |
| 45 to 59 Minutes | 52 (7.2%) | 9 (1.3%) |
| 60 to 89 Minutes | 67 (9.3%) | 9 (1.3%) |
| 90 or more Minutes | 7 (1.0%) | 5 (0.7%) |
Time of Departure to Work by Sex in Troutman
The most frequent times of departure to work in Troutman are 7:00 AM to 7:29 AM (132, 18.4%) for males and 7:00 AM to 7:29 AM (148, 22.0%) for females.
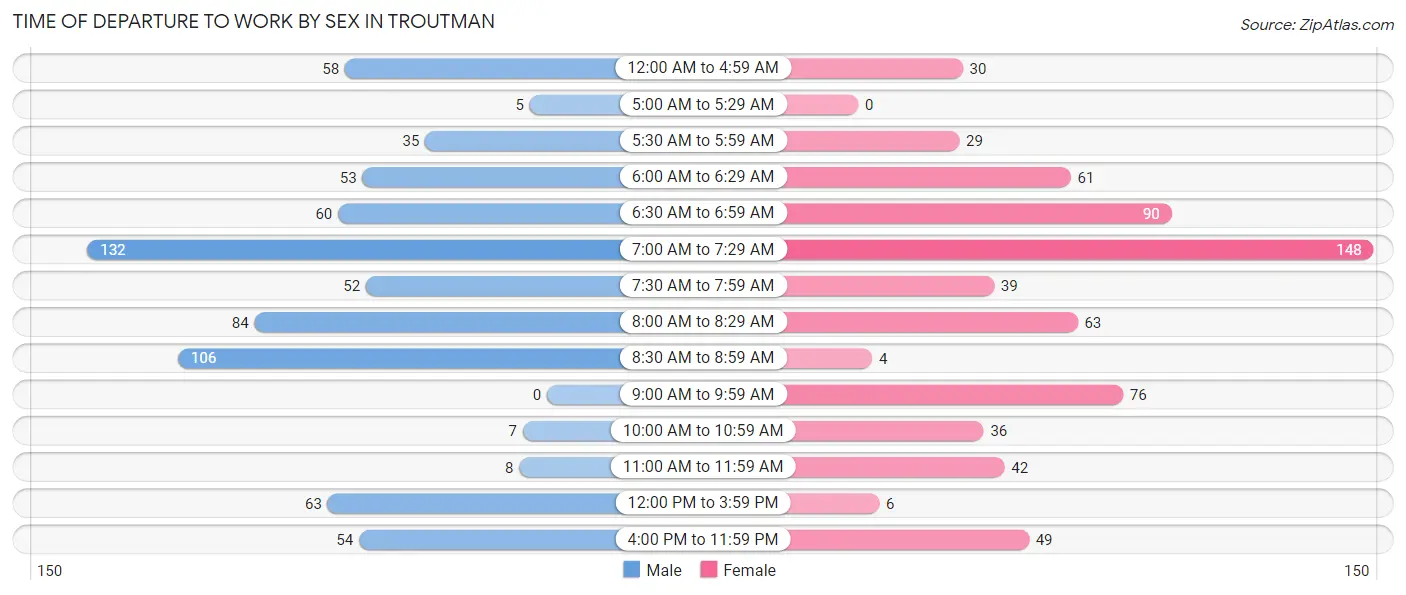
| Time of Departure | Male | Female |
| 12:00 AM to 4:59 AM | 58 (8.1%) | 30 (4.5%) |
| 5:00 AM to 5:29 AM | 5 (0.7%) | 0 (0.0%) |
| 5:30 AM to 5:59 AM | 35 (4.9%) | 29 (4.3%) |
| 6:00 AM to 6:29 AM | 53 (7.4%) | 61 (9.1%) |
| 6:30 AM to 6:59 AM | 60 (8.4%) | 90 (13.4%) |
| 7:00 AM to 7:29 AM | 132 (18.4%) | 148 (22.0%) |
| 7:30 AM to 7:59 AM | 52 (7.2%) | 39 (5.8%) |
| 8:00 AM to 8:29 AM | 84 (11.7%) | 63 (9.4%) |
| 8:30 AM to 8:59 AM | 106 (14.8%) | 4 (0.6%) |
| 9:00 AM to 9:59 AM | 0 (0.0%) | 76 (11.3%) |
| 10:00 AM to 10:59 AM | 7 (1.0%) | 36 (5.3%) |
| 11:00 AM to 11:59 AM | 8 (1.1%) | 42 (6.2%) |
| 12:00 PM to 3:59 PM | 63 (8.8%) | 6 (0.9%) |
| 4:00 PM to 11:59 PM | 54 (7.5%) | 49 (7.3%) |
| Total | 717 (100.0%) | 673 (100.0%) |
Housing Occupancy in Troutman
Occupancy by Ownership in Troutman
Of the total 1,376 dwellings in Troutman, owner-occupied units account for 988 (71.8%), while renter-occupied units make up 388 (28.2%).
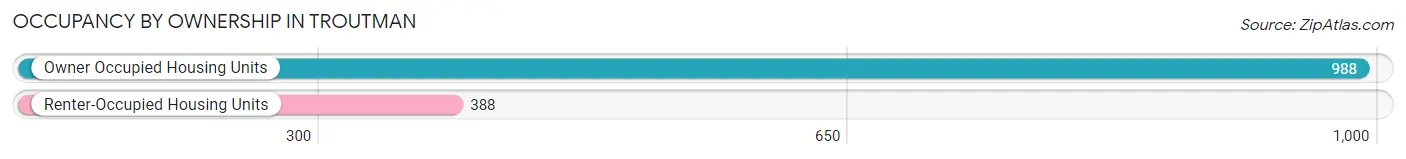
| Occupancy | # Housing Units | % Housing Units |
| Owner Occupied Housing Units | 988 | 71.8% |
| Renter-Occupied Housing Units | 388 | 28.2% |
| Total Occupied Housing Units | 1,376 | 100.0% |
Occupancy by Household Size in Troutman
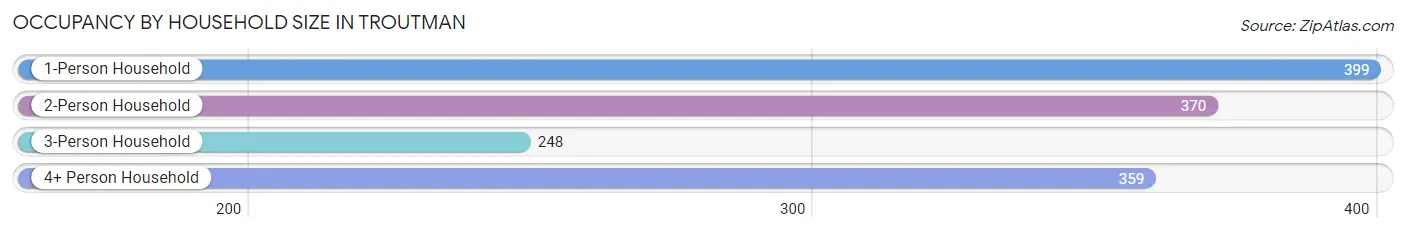
| Household Size | # Housing Units | % Housing Units |
| 1-Person Household | 399 | 29.0% |
| 2-Person Household | 370 | 26.9% |
| 3-Person Household | 248 | 18.0% |
| 4+ Person Household | 359 | 26.1% |
| Total Housing Units | 1,376 | 100.0% |
Occupancy by Ownership by Household Size in Troutman
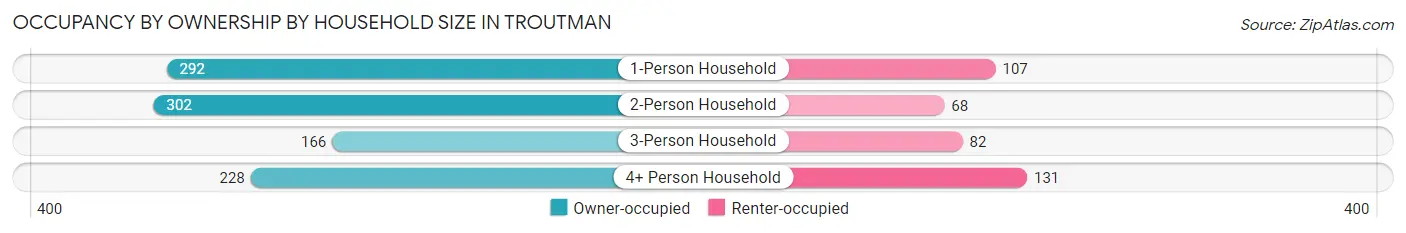
| Household Size | Owner-occupied | Renter-occupied |
| 1-Person Household | 292 (73.2%) | 107 (26.8%) |
| 2-Person Household | 302 (81.6%) | 68 (18.4%) |
| 3-Person Household | 166 (66.9%) | 82 (33.1%) |
| 4+ Person Household | 228 (63.5%) | 131 (36.5%) |
| Total Housing Units | 988 (71.8%) | 388 (28.2%) |
Occupancy by Educational Attainment in Troutman
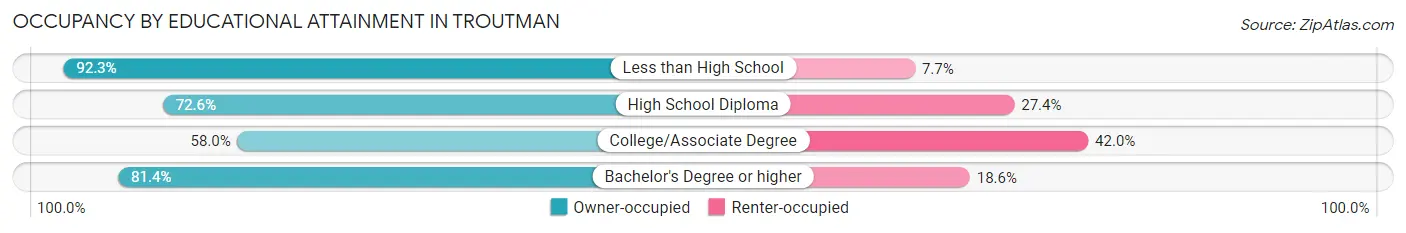
| Household Size | Owner-occupied | Renter-occupied |
| Less than High School | 72 (92.3%) | 6 (7.7%) |
| High School Diploma | 228 (72.6%) | 86 (27.4%) |
| College/Associate Degree | 280 (58.0%) | 203 (42.0%) |
| Bachelor's Degree or higher | 408 (81.4%) | 93 (18.6%) |
Occupancy by Age of Householder in Troutman
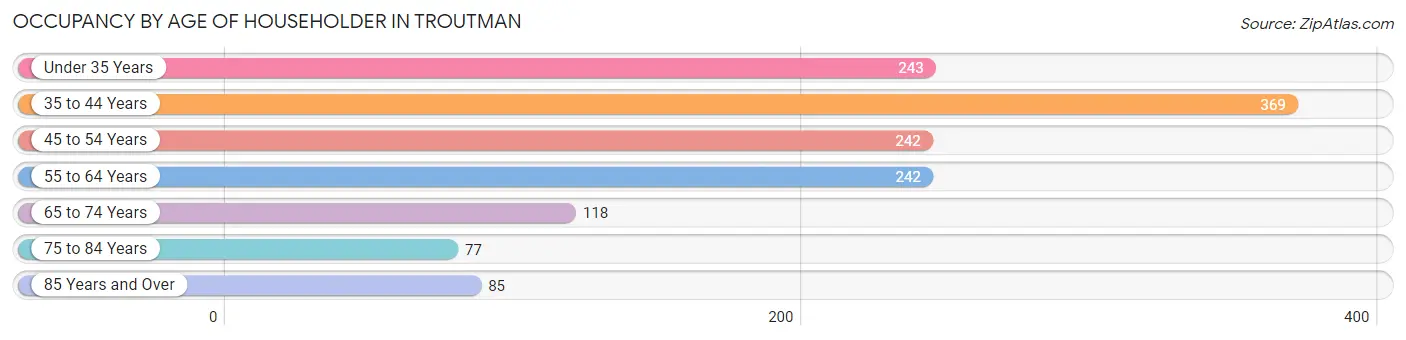
| Age Bracket | # Households | % Households |
| Under 35 Years | 243 | 17.7% |
| 35 to 44 Years | 369 | 26.8% |
| 45 to 54 Years | 242 | 17.6% |
| 55 to 64 Years | 242 | 17.6% |
| 65 to 74 Years | 118 | 8.6% |
| 75 to 84 Years | 77 | 5.6% |
| 85 Years and Over | 85 | 6.2% |
| Total | 1,376 | 100.0% |
Housing Finances in Troutman
Median Income by Occupancy in Troutman
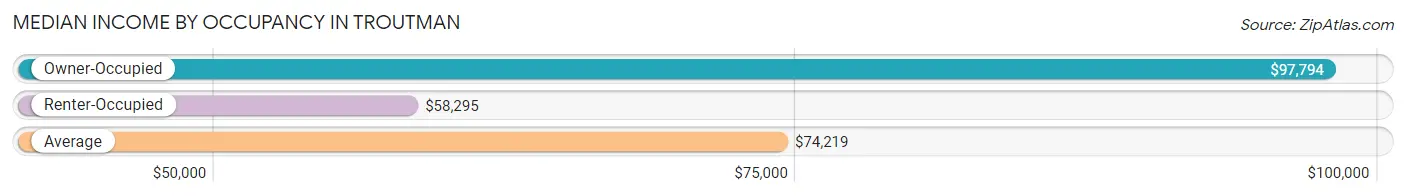
| Occupancy Type | # Households | Median Income |
| Owner-Occupied | 988 (71.8%) | $97,794 |
| Renter-Occupied | 388 (28.2%) | $58,295 |
| Average | 1,376 (100.0%) | $74,219 |
Occupancy by Householder Income Bracket in Troutman
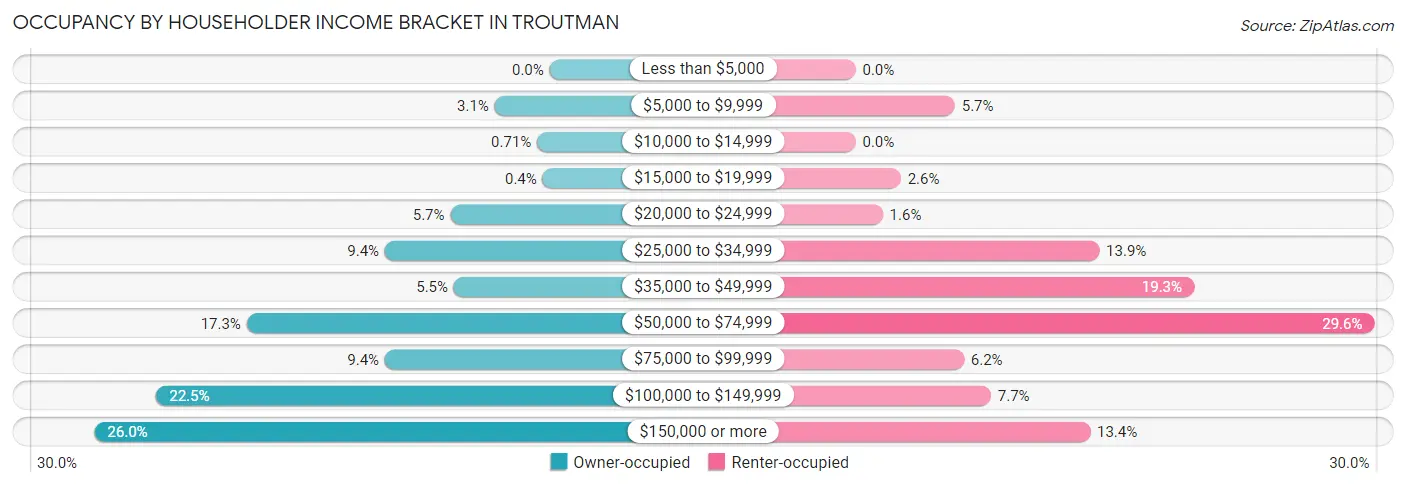
| Income Bracket | Owner-occupied | Renter-occupied |
| Less than $5,000 | 0 (0.0%) | 0 (0.0%) |
| $5,000 to $9,999 | 31 (3.1%) | 22 (5.7%) |
| $10,000 to $14,999 | 7 (0.7%) | 0 (0.0%) |
| $15,000 to $19,999 | 4 (0.4%) | 10 (2.6%) |
| $20,000 to $24,999 | 56 (5.7%) | 6 (1.5%) |
| $25,000 to $34,999 | 93 (9.4%) | 54 (13.9%) |
| $35,000 to $49,999 | 54 (5.5%) | 75 (19.3%) |
| $50,000 to $74,999 | 171 (17.3%) | 115 (29.6%) |
| $75,000 to $99,999 | 93 (9.4%) | 24 (6.2%) |
| $100,000 to $149,999 | 222 (22.5%) | 30 (7.7%) |
| $150,000 or more | 257 (26.0%) | 52 (13.4%) |
| Total | 988 (100.0%) | 388 (100.0%) |
Monthly Housing Cost Tiers in Troutman
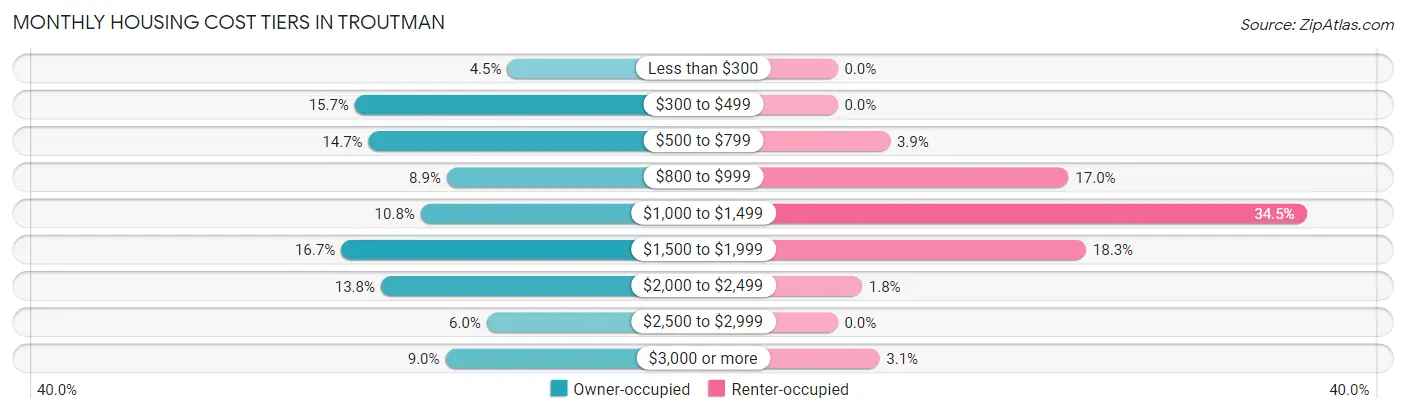
| Monthly Cost | Owner-occupied | Renter-occupied |
| Less than $300 | 44 (4.4%) | 0 (0.0%) |
| $300 to $499 | 155 (15.7%) | 0 (0.0%) |
| $500 to $799 | 145 (14.7%) | 15 (3.9%) |
| $800 to $999 | 88 (8.9%) | 66 (17.0%) |
| $1,000 to $1,499 | 107 (10.8%) | 134 (34.5%) |
| $1,500 to $1,999 | 165 (16.7%) | 71 (18.3%) |
| $2,000 to $2,499 | 136 (13.8%) | 7 (1.8%) |
| $2,500 to $2,999 | 59 (6.0%) | 0 (0.0%) |
| $3,000 or more | 89 (9.0%) | 12 (3.1%) |
| Total | 988 (100.0%) | 388 (100.0%) |
Physical Housing Characteristics in Troutman
Housing Structures in Troutman
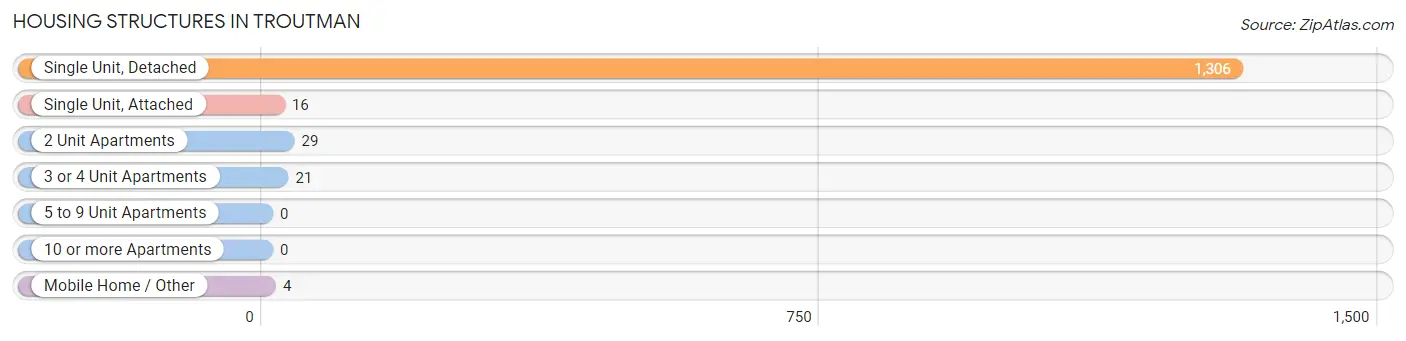
| Structure Type | # Housing Units | % Housing Units |
| Single Unit, Detached | 1,306 | 94.9% |
| Single Unit, Attached | 16 | 1.2% |
| 2 Unit Apartments | 29 | 2.1% |
| 3 or 4 Unit Apartments | 21 | 1.5% |
| 5 to 9 Unit Apartments | 0 | 0.0% |
| 10 or more Apartments | 0 | 0.0% |
| Mobile Home / Other | 4 | 0.3% |
| Total | 1,376 | 100.0% |
Housing Structures by Occupancy in Troutman
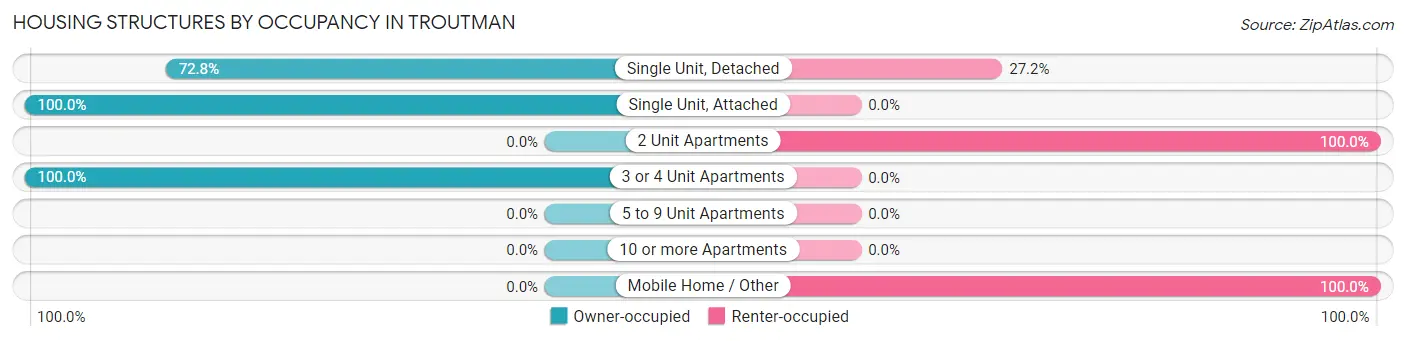
| Structure Type | Owner-occupied | Renter-occupied |
| Single Unit, Detached | 951 (72.8%) | 355 (27.2%) |
| Single Unit, Attached | 16 (100.0%) | 0 (0.0%) |
| 2 Unit Apartments | 0 (0.0%) | 29 (100.0%) |
| 3 or 4 Unit Apartments | 21 (100.0%) | 0 (0.0%) |
| 5 to 9 Unit Apartments | 0 (0.0%) | 0 (0.0%) |
| 10 or more Apartments | 0 (0.0%) | 0 (0.0%) |
| Mobile Home / Other | 0 (0.0%) | 4 (100.0%) |
| Total | 988 (71.8%) | 388 (28.2%) |
Housing Structures by Number of Rooms in Troutman
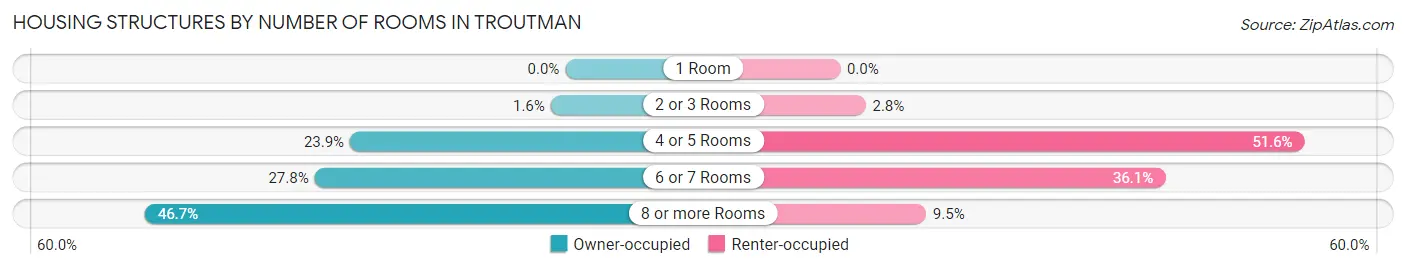
| Number of Rooms | Owner-occupied | Renter-occupied |
| 1 Room | 0 (0.0%) | 0 (0.0%) |
| 2 or 3 Rooms | 16 (1.6%) | 11 (2.8%) |
| 4 or 5 Rooms | 236 (23.9%) | 200 (51.5%) |
| 6 or 7 Rooms | 275 (27.8%) | 140 (36.1%) |
| 8 or more Rooms | 461 (46.7%) | 37 (9.5%) |
| Total | 988 (100.0%) | 388 (100.0%) |
Housing Structure by Heating Type in Troutman
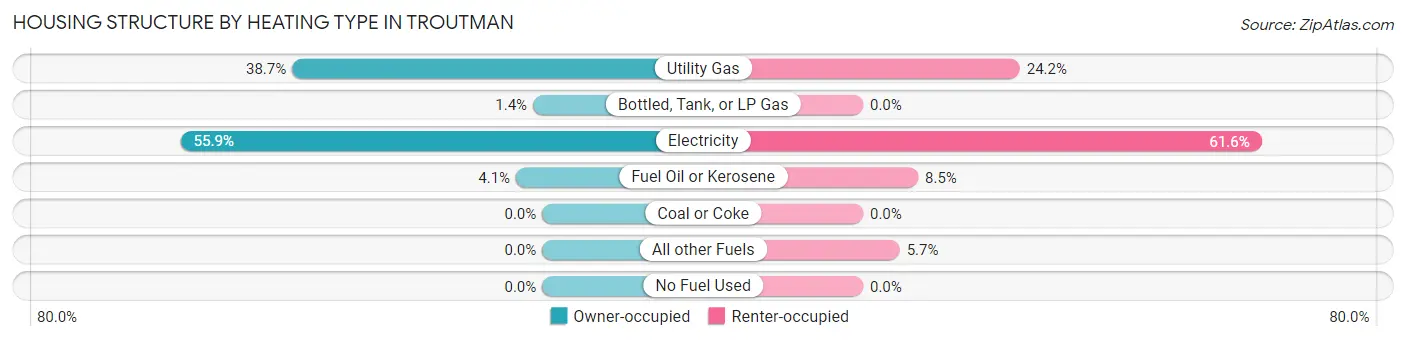
| Heating Type | Owner-occupied | Renter-occupied |
| Utility Gas | 382 (38.7%) | 94 (24.2%) |
| Bottled, Tank, or LP Gas | 14 (1.4%) | 0 (0.0%) |
| Electricity | 552 (55.9%) | 239 (61.6%) |
| Fuel Oil or Kerosene | 40 (4.1%) | 33 (8.5%) |
| Coal or Coke | 0 (0.0%) | 0 (0.0%) |
| All other Fuels | 0 (0.0%) | 22 (5.7%) |
| No Fuel Used | 0 (0.0%) | 0 (0.0%) |
| Total | 988 (100.0%) | 388 (100.0%) |
Household Vehicle Usage in Troutman
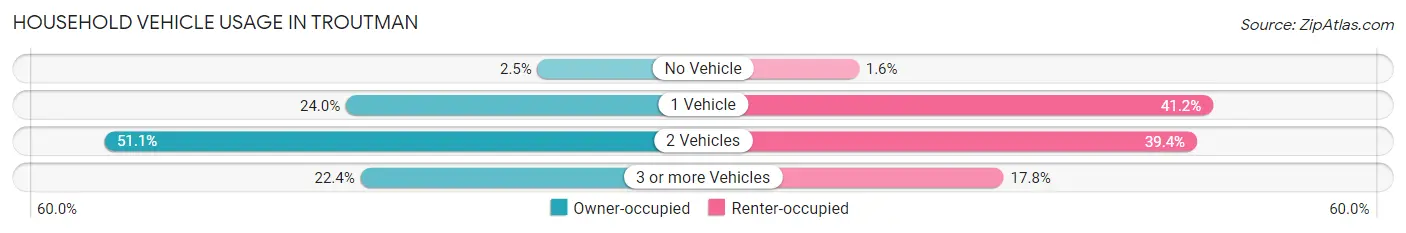
| Vehicles per Household | Owner-occupied | Renter-occupied |
| No Vehicle | 25 (2.5%) | 6 (1.5%) |
| 1 Vehicle | 237 (24.0%) | 160 (41.2%) |
| 2 Vehicles | 505 (51.1%) | 153 (39.4%) |
| 3 or more Vehicles | 221 (22.4%) | 69 (17.8%) |
| Total | 988 (100.0%) | 388 (100.0%) |
Real Estate & Mortgages in Troutman
Real Estate and Mortgage Overview in Troutman
| Characteristic | Without Mortgage | With Mortgage |
| Housing Units | 304 | 684 |
| Median Property Value | $200,000 | $332,100 |
| Median Household Income | $54,643 | $245 |
| Monthly Housing Costs | $396 | $89 |
| Real Estate Taxes | $1,404 | $6 |
Property Value by Mortgage Status in Troutman
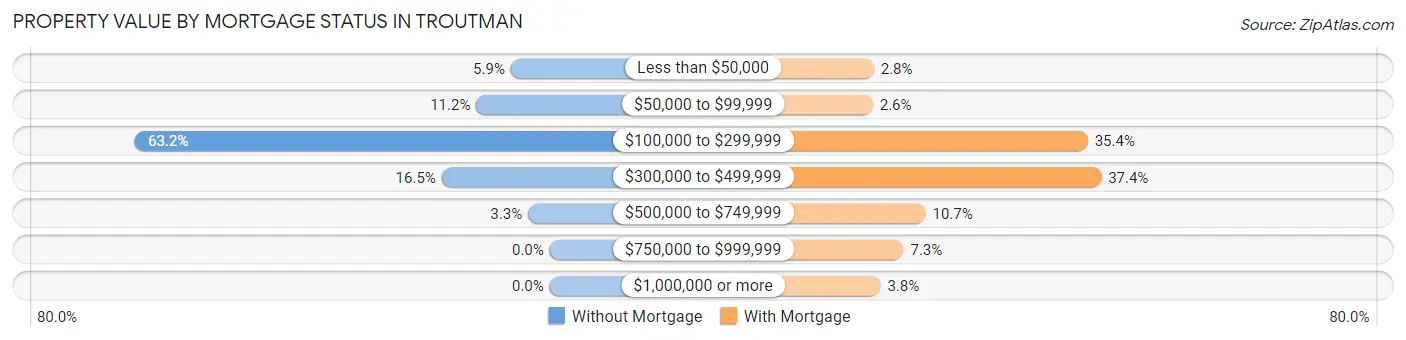
| Property Value | Without Mortgage | With Mortgage |
| Less than $50,000 | 18 (5.9%) | 19 (2.8%) |
| $50,000 to $99,999 | 34 (11.2%) | 18 (2.6%) |
| $100,000 to $299,999 | 192 (63.2%) | 242 (35.4%) |
| $300,000 to $499,999 | 50 (16.5%) | 256 (37.4%) |
| $500,000 to $749,999 | 10 (3.3%) | 73 (10.7%) |
| $750,000 to $999,999 | 0 (0.0%) | 50 (7.3%) |
| $1,000,000 or more | 0 (0.0%) | 26 (3.8%) |
| Total | 304 (100.0%) | 684 (100.0%) |
Household Income by Mortgage Status in Troutman
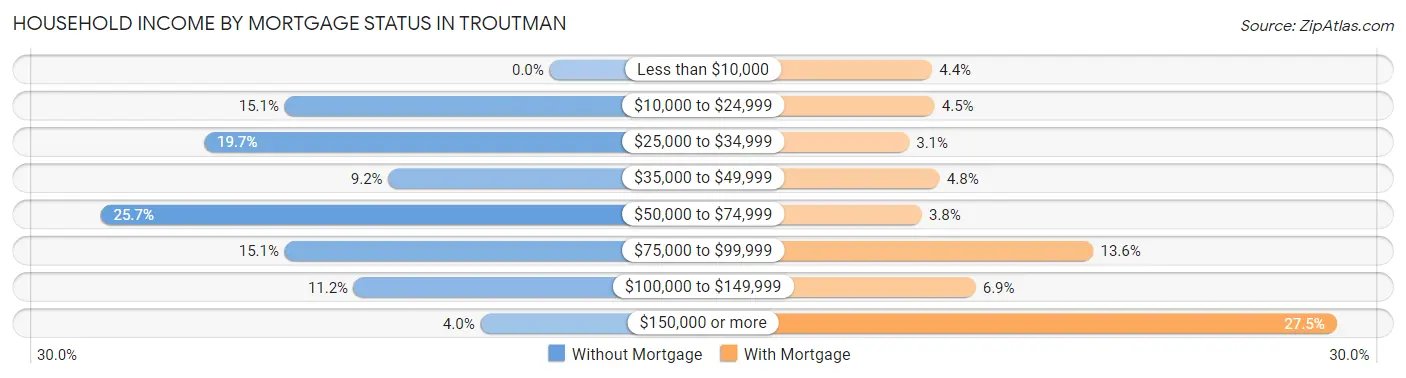
| Household Income | Without Mortgage | With Mortgage |
| Less than $10,000 | 0 (0.0%) | 30 (4.4%) |
| $10,000 to $24,999 | 46 (15.1%) | 31 (4.5%) |
| $25,000 to $34,999 | 60 (19.7%) | 21 (3.1%) |
| $35,000 to $49,999 | 28 (9.2%) | 33 (4.8%) |
| $50,000 to $74,999 | 78 (25.7%) | 26 (3.8%) |
| $75,000 to $99,999 | 46 (15.1%) | 93 (13.6%) |
| $100,000 to $149,999 | 34 (11.2%) | 47 (6.9%) |
| $150,000 or more | 12 (4.0%) | 188 (27.5%) |
| Total | 304 (100.0%) | 684 (100.0%) |
Property Value to Household Income Ratio in Troutman
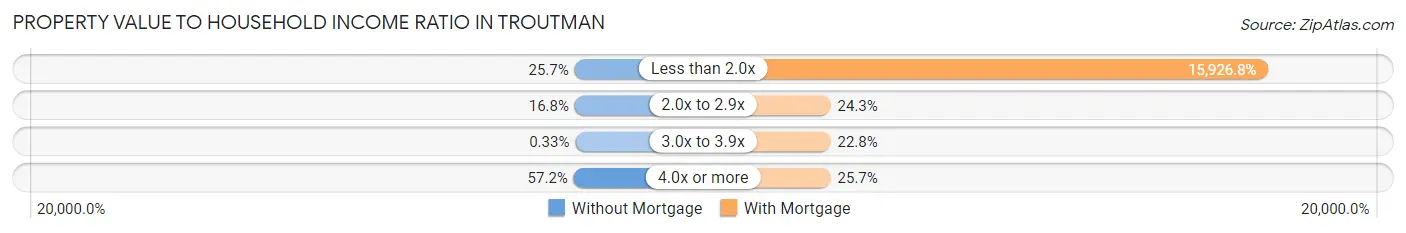
| Value-to-Income Ratio | Without Mortgage | With Mortgage |
| Less than 2.0x | 78 (25.7%) | 108,939 (15,926.8%) |
| 2.0x to 2.9x | 51 (16.8%) | 166 (24.3%) |
| 3.0x to 3.9x | 1 (0.3%) | 156 (22.8%) |
| 4.0x or more | 174 (57.2%) | 176 (25.7%) |
| Total | 304 (100.0%) | 684 (100.0%) |
Real Estate Taxes by Mortgage Status in Troutman
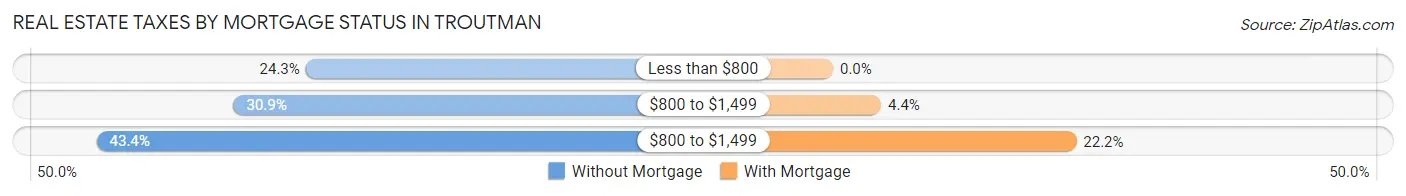
| Property Taxes | Without Mortgage | With Mortgage |
| Less than $800 | 74 (24.3%) | 0 (0.0%) |
| $800 to $1,499 | 94 (30.9%) | 30 (4.4%) |
| $800 to $1,499 | 132 (43.4%) | 152 (22.2%) |
| Total | 304 (100.0%) | 684 (100.0%) |
Health & Disability in Troutman
Health Insurance Coverage by Age in Troutman
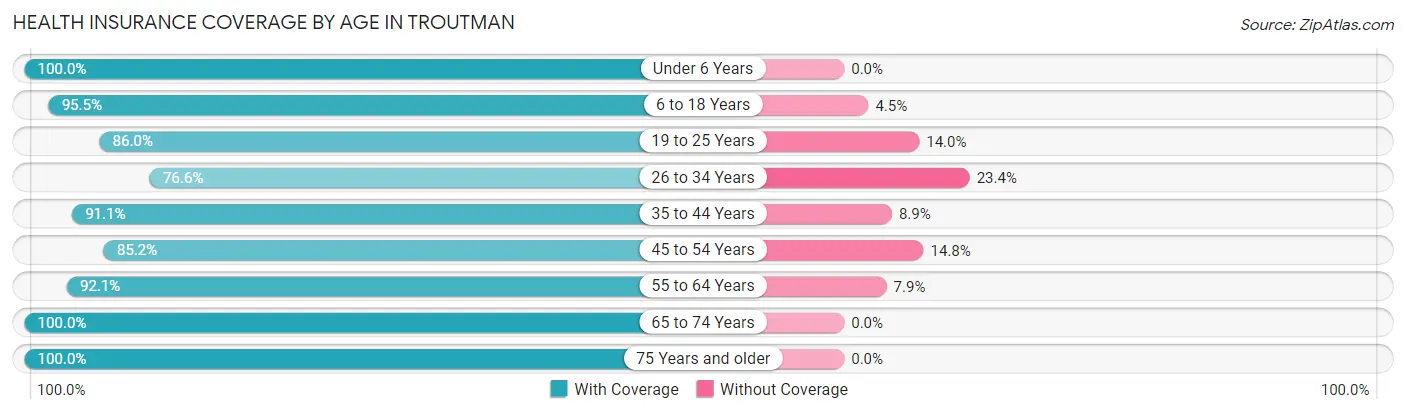
| Age Bracket | With Coverage | Without Coverage |
| Under 6 Years | 448 (100.0%) | 0 (0.0%) |
| 6 to 18 Years | 635 (95.5%) | 30 (4.5%) |
| 19 to 25 Years | 166 (86.0%) | 27 (14.0%) |
| 26 to 34 Years | 393 (76.6%) | 120 (23.4%) |
| 35 to 44 Years | 533 (91.1%) | 52 (8.9%) |
| 45 to 54 Years | 386 (85.2%) | 67 (14.8%) |
| 55 to 64 Years | 408 (92.1%) | 35 (7.9%) |
| 65 to 74 Years | 175 (100.0%) | 0 (0.0%) |
| 75 Years and older | 207 (100.0%) | 0 (0.0%) |
| Total | 3,351 (91.0%) | 331 (9.0%) |
Health Insurance Coverage by Citizenship Status in Troutman
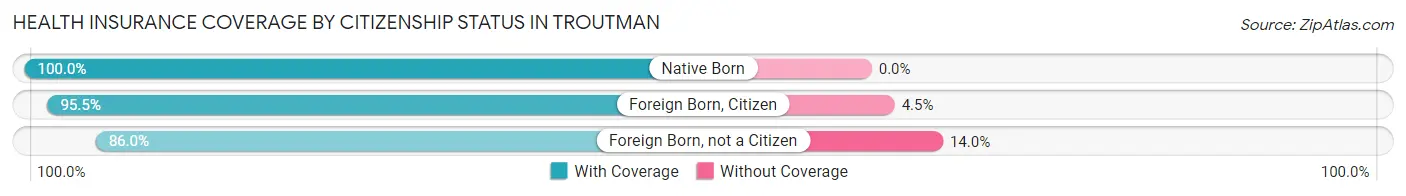
| Citizenship Status | With Coverage | Without Coverage |
| Native Born | 448 (100.0%) | 0 (0.0%) |
| Foreign Born, Citizen | 635 (95.5%) | 30 (4.5%) |
| Foreign Born, not a Citizen | 166 (86.0%) | 27 (14.0%) |
Health Insurance Coverage by Household Income in Troutman
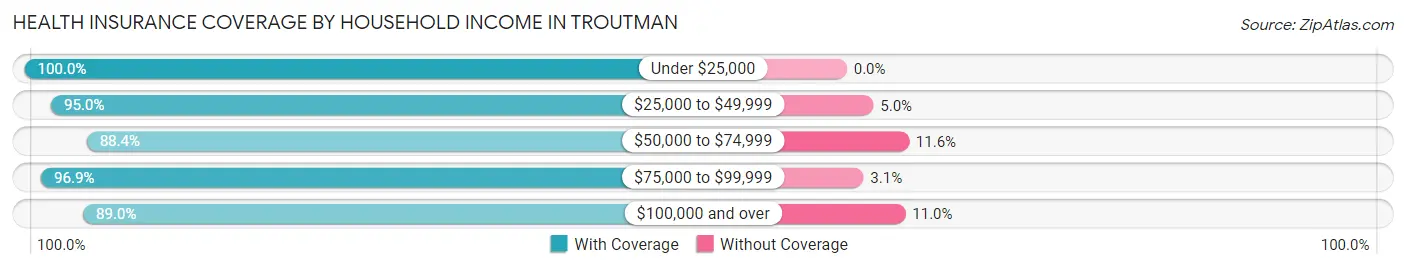
| Household Income | With Coverage | Without Coverage |
| Under $25,000 | 224 (100.0%) | 0 (0.0%) |
| $25,000 to $49,999 | 421 (95.0%) | 22 (5.0%) |
| $50,000 to $74,999 | 706 (88.4%) | 93 (11.6%) |
| $75,000 to $99,999 | 312 (96.9%) | 10 (3.1%) |
| $100,000 and over | 1,671 (89.0%) | 206 (11.0%) |
Public vs Private Health Insurance Coverage by Age in Troutman
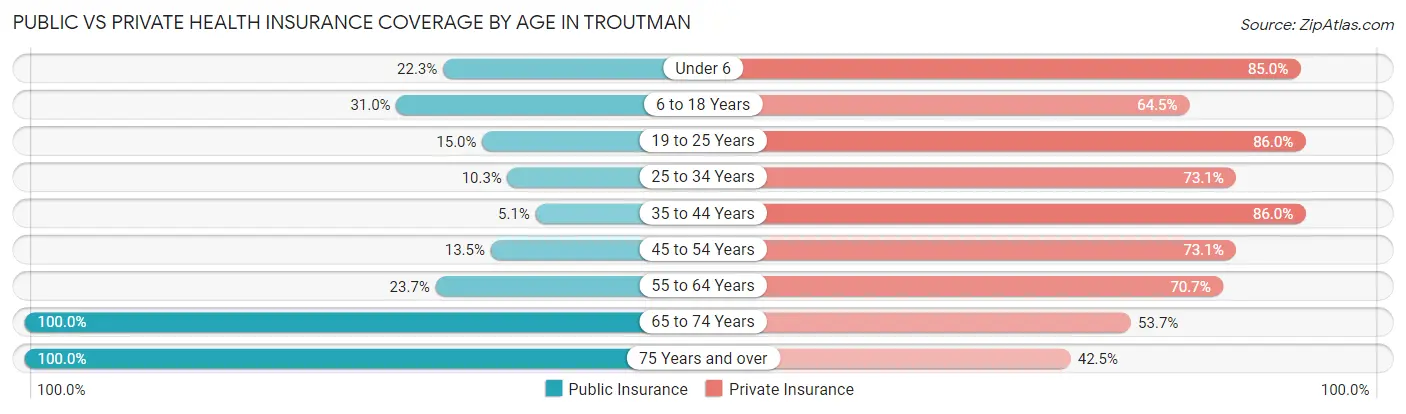
| Age Bracket | Public Insurance | Private Insurance |
| Under 6 | 100 (22.3%) | 381 (85.0%) |
| 6 to 18 Years | 206 (31.0%) | 429 (64.5%) |
| 19 to 25 Years | 29 (15.0%) | 166 (86.0%) |
| 25 to 34 Years | 53 (10.3%) | 375 (73.1%) |
| 35 to 44 Years | 30 (5.1%) | 503 (86.0%) |
| 45 to 54 Years | 61 (13.5%) | 331 (73.1%) |
| 55 to 64 Years | 105 (23.7%) | 313 (70.7%) |
| 65 to 74 Years | 175 (100.0%) | 94 (53.7%) |
| 75 Years and over | 207 (100.0%) | 88 (42.5%) |
| Total | 966 (26.2%) | 2,680 (72.8%) |
Disability Status by Sex by Age in Troutman
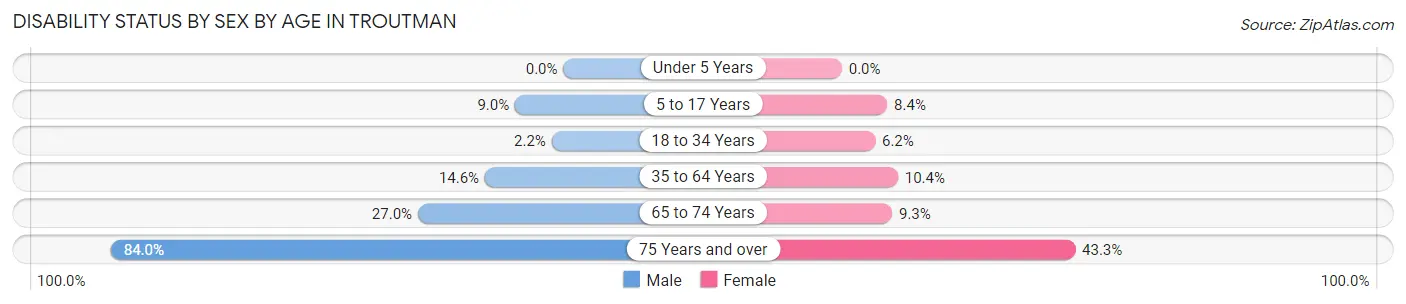
| Age Bracket | Male | Female |
| Under 5 Years | 0 (0.0%) | 0 (0.0%) |
| 5 to 17 Years | 35 (9.0%) | 25 (8.4%) |
| 18 to 34 Years | 7 (2.2%) | 25 (6.2%) |
| 35 to 64 Years | 95 (14.5%) | 86 (10.4%) |
| 65 to 74 Years | 27 (27.0%) | 7 (9.3%) |
| 75 Years and over | 42 (84.0%) | 68 (43.3%) |
Disability Class by Sex by Age in Troutman
Disability Class: Hearing Difficulty
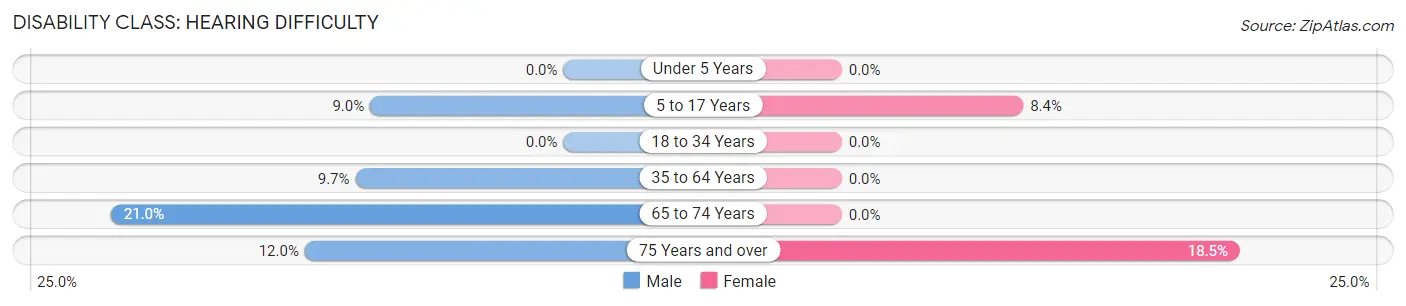
| Age Bracket | Male | Female |
| Under 5 Years | 0 (0.0%) | 0 (0.0%) |
| 5 to 17 Years | 35 (9.0%) | 25 (8.4%) |
| 18 to 34 Years | 0 (0.0%) | 0 (0.0%) |
| 35 to 64 Years | 63 (9.7%) | 0 (0.0%) |
| 65 to 74 Years | 21 (21.0%) | 0 (0.0%) |
| 75 Years and over | 6 (12.0%) | 29 (18.5%) |
Disability Class: Vision Difficulty
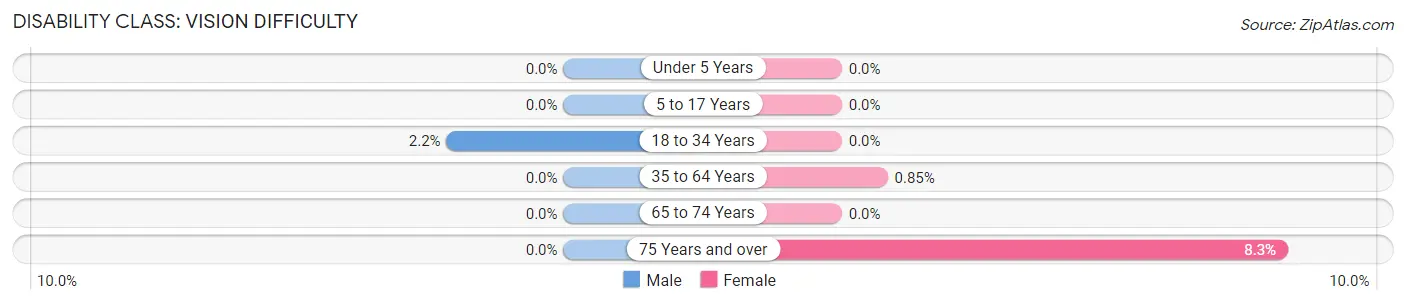
| Age Bracket | Male | Female |
| Under 5 Years | 0 (0.0%) | 0 (0.0%) |
| 5 to 17 Years | 0 (0.0%) | 0 (0.0%) |
| 18 to 34 Years | 7 (2.2%) | 0 (0.0%) |
| 35 to 64 Years | 0 (0.0%) | 7 (0.9%) |
| 65 to 74 Years | 0 (0.0%) | 0 (0.0%) |
| 75 Years and over | 0 (0.0%) | 13 (8.3%) |
Disability Class: Cognitive Difficulty
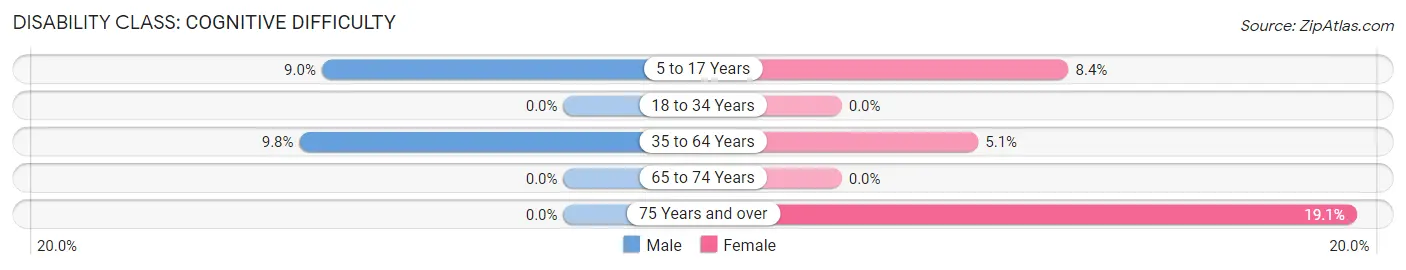
| Age Bracket | Male | Female |
| 5 to 17 Years | 35 (9.0%) | 25 (8.4%) |
| 18 to 34 Years | 0 (0.0%) | 0 (0.0%) |
| 35 to 64 Years | 64 (9.8%) | 42 (5.1%) |
| 65 to 74 Years | 0 (0.0%) | 0 (0.0%) |
| 75 Years and over | 0 (0.0%) | 30 (19.1%) |
Disability Class: Ambulatory Difficulty
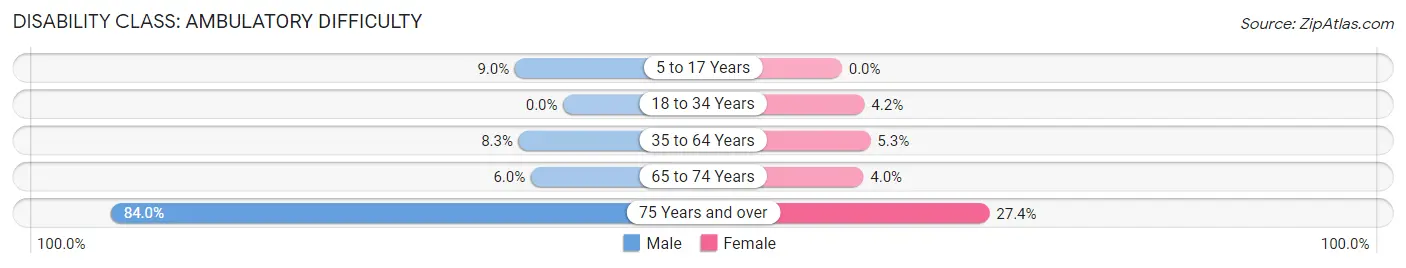
| Age Bracket | Male | Female |
| 5 to 17 Years | 35 (9.0%) | 0 (0.0%) |
| 18 to 34 Years | 0 (0.0%) | 17 (4.2%) |
| 35 to 64 Years | 54 (8.3%) | 44 (5.3%) |
| 65 to 74 Years | 6 (6.0%) | 3 (4.0%) |
| 75 Years and over | 42 (84.0%) | 43 (27.4%) |
Disability Class: Self-Care Difficulty
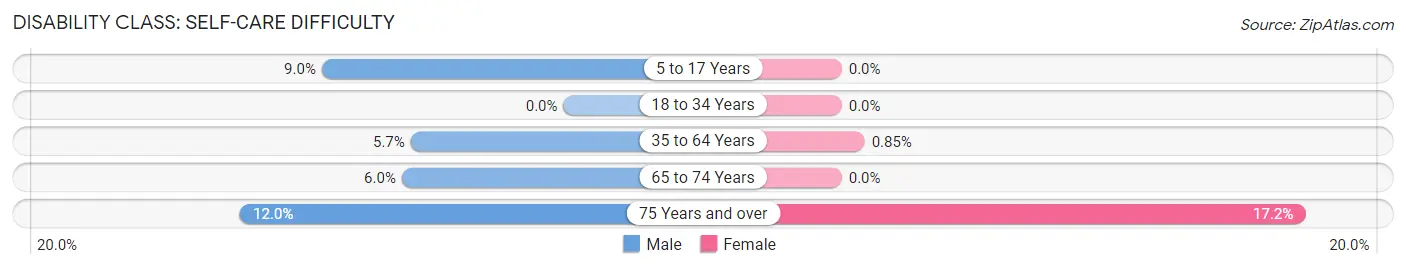
| Age Bracket | Male | Female |
| 5 to 17 Years | 35 (9.0%) | 0 (0.0%) |
| 18 to 34 Years | 0 (0.0%) | 0 (0.0%) |
| 35 to 64 Years | 37 (5.7%) | 7 (0.9%) |
| 65 to 74 Years | 6 (6.0%) | 0 (0.0%) |
| 75 Years and over | 6 (12.0%) | 27 (17.2%) |
Technology Access in Troutman
Computing Device Access in Troutman
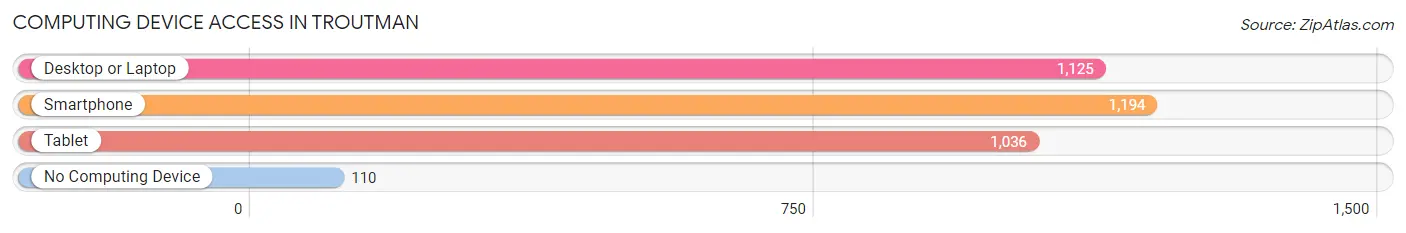
| Device Type | # Households | % Households |
| Desktop or Laptop | 1,125 | 81.8% |
| Smartphone | 1,194 | 86.8% |
| Tablet | 1,036 | 75.3% |
| No Computing Device | 110 | 8.0% |
| Total | 1,376 | 100.0% |
Internet Access in Troutman
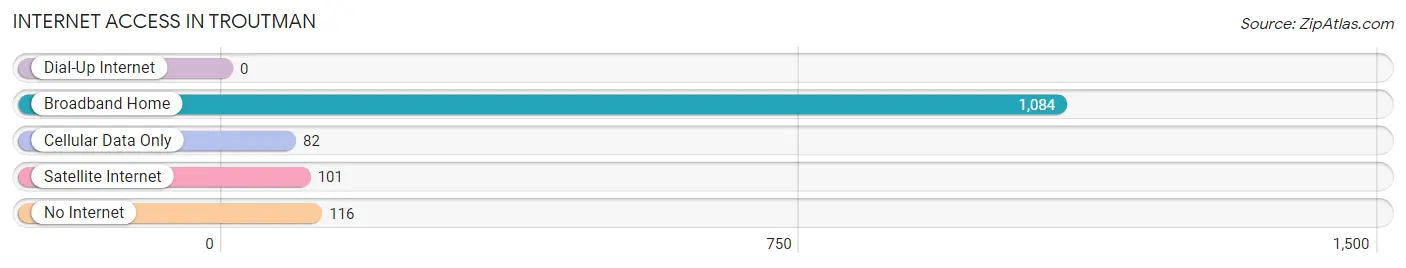
| Internet Type | # Households | % Households |
| Dial-Up Internet | 0 | 0.0% |
| Broadband Home | 1,084 | 78.8% |
| Cellular Data Only | 82 | 6.0% |
| Satellite Internet | 101 | 7.3% |
| No Internet | 116 | 8.4% |
| Total | 1,376 | 100.0% |
Troutman Summary
Troutman, North Carolina is a small town located in Iredell County, in the Piedmont region of the state. The town was founded in 1851 and is named after the Troutman family, who were among the first settlers in the area. The town has a population of approximately 2,500 people and is located about 25 miles north of Charlotte.
Troutman is located in the foothills of the Blue Ridge Mountains, and is surrounded by rolling hills and lush forests. The town is situated on the banks of the South Yadkin River, which provides a scenic backdrop for the town. The town is also home to several parks and recreational areas, including Lake Norman State Park, which offers camping, fishing, and other outdoor activities.
The economy of Troutman is largely based on agriculture and manufacturing. The town is home to several large farms, which produce a variety of crops, including corn, soybeans, and tobacco. Troutman is also home to several manufacturing companies, including a furniture factory and a textile mill. The town is also home to several small businesses, including restaurants, shops, and other services.
Troutman has a diverse population, with a mix of races and ethnicities. The town is home to a large Hispanic population, as well as African Americans, Native Americans, and other minority groups. The town also has a large number of retirees, as well as a growing number of young professionals.
Troutman is served by the Iredell-Statesville School District, which provides public education to the town's students. The town is also home to several private schools, including a Catholic school and a Christian school. The town is also home to a community college, which offers a variety of courses and programs.
Troutman is a small town with a rich history and a vibrant economy. The town is home to a diverse population, and offers a variety of recreational activities and educational opportunities. The town is also home to several businesses, which provide employment opportunities for the town's residents. Troutman is a great place to live, work, and raise a family.
Common Questions
What is Per Capita Income in Troutman?
Per Capita income in Troutman is $37,562.
What is the Median Family Income in Troutman?
Median Family Income in Troutman is $101,481.
What is the Median Household income in Troutman?
Median Household Income in Troutman is $74,219.
What is Income or Wage Gap in Troutman?
Income or Wage Gap in Troutman is 43.7%.
Women in Troutman earn 56.3 cents for every dollar earned by a man.
What is Inequality or Gini Index in Troutman?
Inequality or Gini Index in Troutman is 0.41.
What is the Total Population of Troutman?
Total Population of Troutman is 3,689.
What is the Total Male Population of Troutman?
Total Male Population of Troutman is 1,778.
What is the Total Female Population of Troutman?
Total Female Population of Troutman is 1,911.
What is the Ratio of Males per 100 Females in Troutman?
There are 93.04 Males per 100 Females in Troutman.
What is the Ratio of Females per 100 Males in Troutman?
There are 107.48 Females per 100 Males in Troutman.
What is the Median Population Age in Troutman?
Median Population Age in Troutman is 35.3 Years.
What is the Average Family Size in Troutman
Average Family Size in Troutman is 3.4 People.
What is the Average Household Size in Troutman
Average Household Size in Troutman is 2.7 People.
How Large is the Labor Force in Troutman?
There are 1,932 People in the Labor Forcein in Troutman.
What is the Percentage of People in the Labor Force in Troutman?
72.3% of People are in the Labor Force in Troutman.
What is the Unemployment Rate in Troutman?
Unemployment Rate in Troutman is 8.9%.