Cities with the Most Immigrants from Dominican Republic in Ohio
RELATED REPORTS & OPTIONS
Dominican Republic
Ohio
Compare Cities
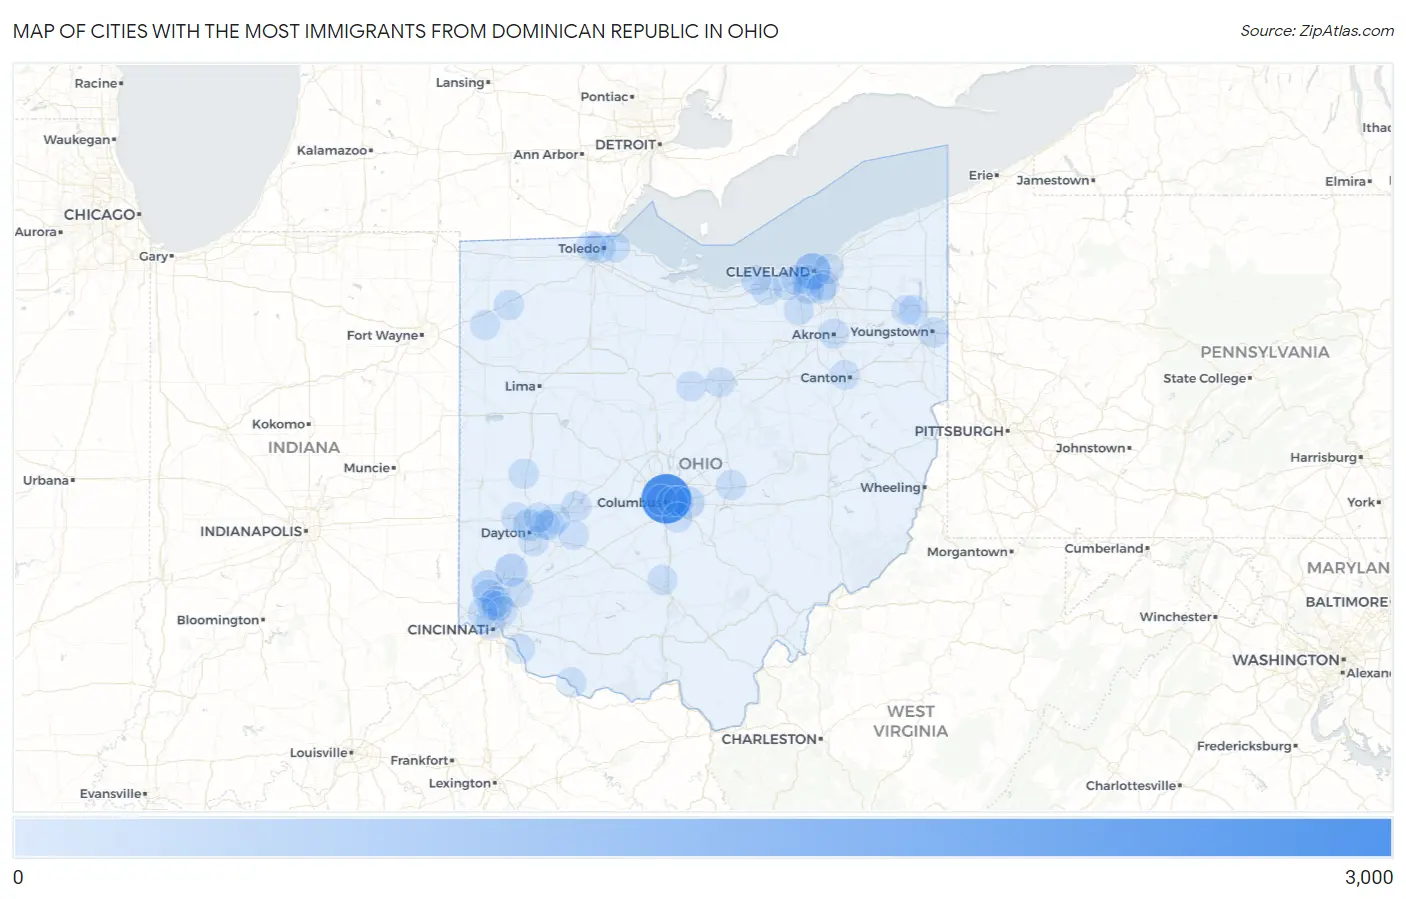
Map of Cities with the Most Immigrants from Dominican Republic in Ohio
0
3,000
Cities with the Most Immigrants from Dominican Republic in Ohio
| City | Dominican Republic | vs State | vs National | |
| 1. | Columbus | 2,584 | 6,549(39.46%)#1 | 1,223,316(0.21%)#41 |
| 2. | Cleveland | 794 | 6,549(12.12%)#2 | 1,223,316(0.06%)#136 |
| 3. | Middletown | 328 | 6,549(5.01%)#3 | 1,223,316(0.03%)#299 |
| 4. | Hamilton | 253 | 6,549(3.86%)#4 | 1,223,316(0.02%)#376 |
| 5. | Reynoldsburg | 218 | 6,549(3.33%)#5 | 1,223,316(0.02%)#423 |
| 6. | Dayton | 207 | 6,549(3.16%)#6 | 1,223,316(0.02%)#439 |
| 7. | Fairfield | 180 | 6,549(2.75%)#7 | 1,223,316(0.01%)#492 |
| 8. | Toledo | 150 | 6,549(2.29%)#8 | 1,223,316(0.01%)#568 |
| 9. | Brooklyn | 101 | 6,549(1.54%)#9 | 1,223,316(0.01%)#732 |
| 10. | Grandview Heights | 91 | 6,549(1.39%)#10 | 1,223,316(0.01%)#793 |
| 11. | Parma | 88 | 6,549(1.34%)#11 | 1,223,316(0.01%)#808 |
| 12. | Springdale | 68 | 6,549(1.04%)#12 | 1,223,316(0.01%)#981 |
| 13. | Newark | 61 | 6,549(0.93%)#13 | 1,223,316(0.00%)#1,039 |
| 14. | Youngstown | 53 | 6,549(0.81%)#14 | 1,223,316(0.00%)#1,111 |
| 15. | Cincinnati | 50 | 6,549(0.76%)#15 | 1,223,316(0.00%)#1,145 |
| 16. | Springfield | 48 | 6,549(0.73%)#16 | 1,223,316(0.00%)#1,172 |
| 17. | Akron | 41 | 6,549(0.63%)#17 | 1,223,316(0.00%)#1,263 |
| 18. | Woodlawn | 36 | 6,549(0.55%)#18 | 1,223,316(0.00%)#1,368 |
| 19. | Garfield Heights | 35 | 6,549(0.53%)#19 | 1,223,316(0.00%)#1,381 |
| 20. | Defiance | 32 | 6,549(0.49%)#20 | 1,223,316(0.00%)#1,455 |
| 21. | Piqua | 29 | 6,549(0.44%)#21 | 1,223,316(0.00%)#1,516 |
| 22. | Elyria | 28 | 6,549(0.43%)#22 | 1,223,316(0.00%)#1,538 |
| 23. | Lorain | 27 | 6,549(0.41%)#23 | 1,223,316(0.00%)#1,564 |
| 24. | Brunswick | 27 | 6,549(0.41%)#24 | 1,223,316(0.00%)#1,569 |
| 25. | North Olmsted | 23 | 6,549(0.35%)#25 | 1,223,316(0.00%)#1,680 |
| 26. | Ottawa Hills | 22 | 6,549(0.34%)#26 | 1,223,316(0.00%)#1,726 |
| 27. | Kettering | 21 | 6,549(0.32%)#27 | 1,223,316(0.00%)#1,745 |
| 28. | Mason | 21 | 6,549(0.32%)#28 | 1,223,316(0.00%)#1,748 |
| 29. | Englewood | 19 | 6,549(0.29%)#29 | 1,223,316(0.00%)#1,828 |
| 30. | Galion | 19 | 6,549(0.29%)#30 | 1,223,316(0.00%)#1,832 |
| 31. | Greenhills | 16 | 6,549(0.24%)#31 | 1,223,316(0.00%)#1,968 |
| 32. | Fairview Park | 13 | 6,549(0.20%)#32 | 1,223,316(0.00%)#2,075 |
| 33. | Oregon | 11 | 6,549(0.17%)#33 | 1,223,316(0.00%)#2,168 |
| 34. | Reading | 11 | 6,549(0.17%)#34 | 1,223,316(0.00%)#2,178 |
| 35. | Paulding | 9 | 6,549(0.14%)#35 | 1,223,316(0.00%)#2,296 |
| 36. | Holiday Valley | 9 | 6,549(0.14%)#36 | 1,223,316(0.00%)#2,309 |
| 37. | Leavittsburg | 9 | 6,549(0.14%)#37 | 1,223,316(0.00%)#2,314 |
| 38. | Cleveland Heights | 8 | 6,549(0.12%)#38 | 1,223,316(0.00%)#2,330 |
| 39. | Bexley | 8 | 6,549(0.12%)#39 | 1,223,316(0.00%)#2,338 |
| 40. | Warren | 7 | 6,549(0.11%)#40 | 1,223,316(0.00%)#2,373 |
| 41. | Fairborn | 7 | 6,549(0.11%)#41 | 1,223,316(0.00%)#2,375 |
| 42. | Whitehall | 7 | 6,549(0.11%)#42 | 1,223,316(0.00%)#2,381 |
| 43. | Wright Patterson Afb | 6 | 6,549(0.09%)#43 | 1,223,316(0.00%)#2,482 |
| 44. | Huber Heights | 5 | 6,549(0.08%)#44 | 1,223,316(0.00%)#2,502 |
| 45. | Groveport | 5 | 6,549(0.08%)#45 | 1,223,316(0.00%)#2,526 |
| 46. | Andersonville | 5 | 6,549(0.08%)#46 | 1,223,316(0.00%)#2,559 |
| 47. | Mansfield | 4 | 6,549(0.06%)#47 | 1,223,316(0.00%)#2,568 |
| 48. | Cedarville | 3 | 6,549(0.05%)#48 | 1,223,316(0.00%)#2,625 |
| 49. | Ripley | 3 | 6,549(0.05%)#49 | 1,223,316(0.00%)#2,641 |
| 50. | White Oak | 2 | 6,549(0.03%)#50 | 1,223,316(0.00%)#2,668 |
| 51. | Independence | 2 | 6,549(0.03%)#51 | 1,223,316(0.00%)#2,675 |
| 52. | New Richmond | 2 | 6,549(0.03%)#52 | 1,223,316(0.00%)#2,681 |
| 53. | Meyers Lake | 2 | 6,549(0.03%)#53 | 1,223,316(0.00%)#2,698 |
Common Questions
What are the Top 10 Cities with the Most Immigrants from Dominican Republic in Ohio?
Top 10 Cities with the Most Immigrants from Dominican Republic in Ohio are:
#1
2,584
#2
794
#3
328
#4
253
#5
218
#6
207
#7
180
#8
150
#9
101
#10
91
What city has the Most Immigrants from Dominican Republic in Ohio?
Columbus has the Most Immigrants from Dominican Republic in Ohio with 2,584.
What is the Total Immigrants from Dominican Republic in the State of Ohio?
Total Immigrants from Dominican Republic in Ohio is 6,549.
What is the Total Immigrants from Dominican Republic in the United States?
Total Immigrants from Dominican Republic in the United States is 1,223,316.