Ocean Isle Beach, NC Map & Demographics
Ocean Isle Beach Map
Ocean Isle Beach Overview
$63,760
PER CAPITA INCOME
$105,625
AVG FAMILY INCOME
$91,250
AVG HOUSEHOLD INCOME
59.8%
WAGE / INCOME GAP [ % ]
40.2¢/ $1
WAGE / INCOME GAP [ $ ]
0.46
INEQUALITY / GINI INDEX
809
TOTAL POPULATION
369
MALE POPULATION
440
FEMALE POPULATION
83.86
MALES / 100 FEMALES
119.24
FEMALES / 100 MALES
67.3
MEDIAN AGE
2.1
AVG FAMILY SIZE
1.9
AVG HOUSEHOLD SIZE
256
LABOR FORCE [ PEOPLE ]
32.4%
PERCENT IN LABOR FORCE
3.1%
UNEMPLOYMENT RATE
Ocean Isle Beach Zip Codes
Ocean Isle Beach Area Codes
Income in Ocean Isle Beach
Income Overview in Ocean Isle Beach
Per Capita Income in Ocean Isle Beach is $63,760, while median incomes of families and households are $105,625 and $91,250 respectively.
| Characteristic | Number | Measure |
| Per Capita Income | 809 | $63,760 |
| Median Family Income | 329 | $105,625 |
| Mean Family Income | 329 | $136,056 |
| Median Household Income | 432 | $91,250 |
| Mean Household Income | 432 | $118,059 |
| Income Deficit | 329 | $0 |
| Wage / Income Gap (%) | 809 | 59.79% |
| Wage / Income Gap ($) | 809 | 40.21¢ per $1 |
| Gini / Inequality Index | 809 | 0.46 |
Earnings by Sex in Ocean Isle Beach
Average Earnings in Ocean Isle Beach are $44,688, $78,500 for men and $31,563 for women, a difference of 59.8%.

| Sex | Number | Average Earnings |
| Male | 158 (55.0%) | $78,500 |
| Female | 129 (45.0%) | $31,563 |
| Total | 287 (100.0%) | $44,688 |
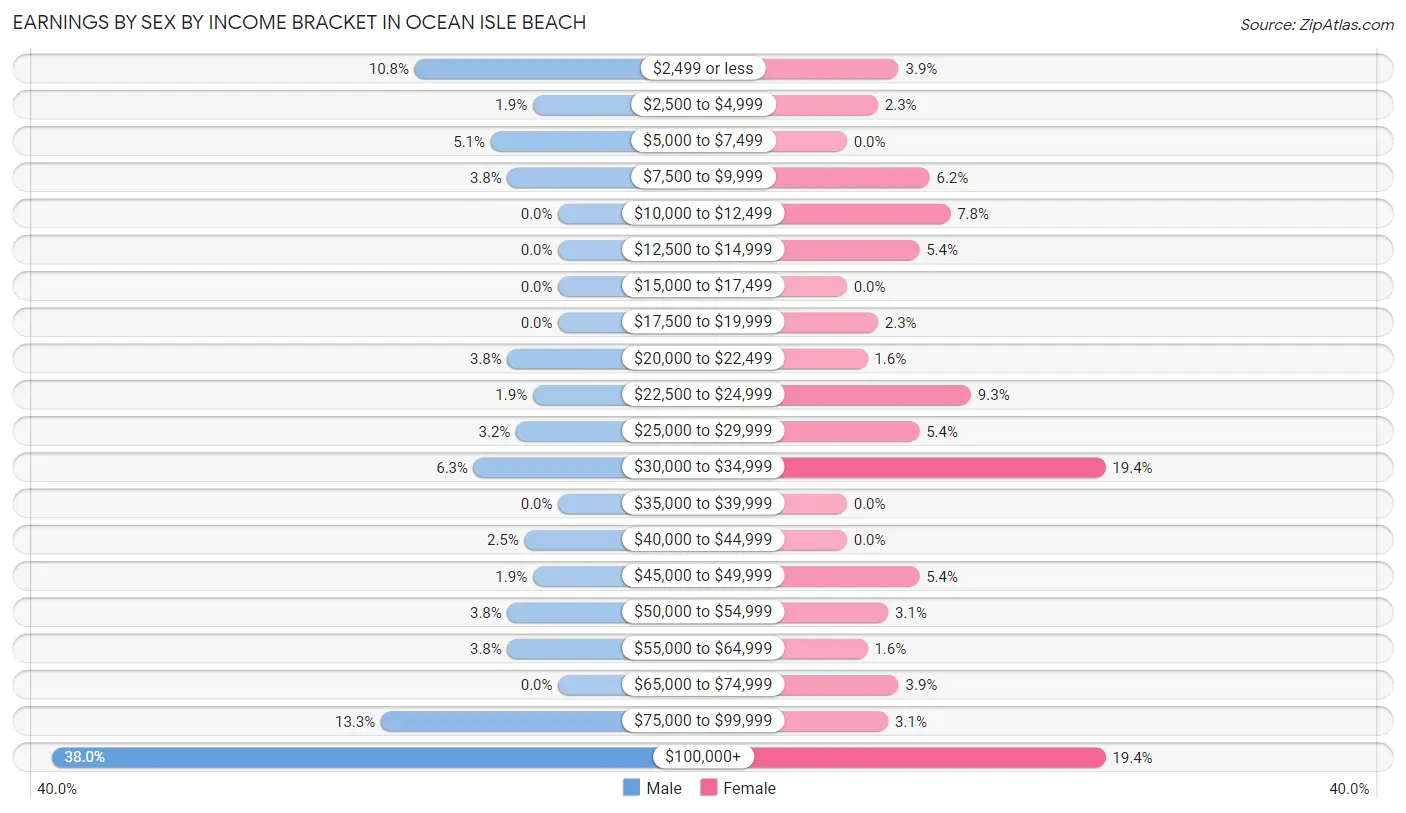
Earnings by Sex by Income Bracket in Ocean Isle Beach
The most common earnings brackets in Ocean Isle Beach are $100,000+ for men (60 | 38.0%) and $30,000 to $34,999 for women (25 | 19.4%).
| Income | Male | Female |
| $2,499 or less | 17 (10.8%) | 5 (3.9%) |
| $2,500 to $4,999 | 3 (1.9%) | 3 (2.3%) |
| $5,000 to $7,499 | 8 (5.1%) | 0 (0.0%) |
| $7,500 to $9,999 | 6 (3.8%) | 8 (6.2%) |
| $10,000 to $12,499 | 0 (0.0%) | 10 (7.7%) |
| $12,500 to $14,999 | 0 (0.0%) | 7 (5.4%) |
| $15,000 to $17,499 | 0 (0.0%) | 0 (0.0%) |
| $17,500 to $19,999 | 0 (0.0%) | 3 (2.3%) |
| $20,000 to $22,499 | 6 (3.8%) | 2 (1.5%) |
| $22,500 to $24,999 | 3 (1.9%) | 12 (9.3%) |
| $25,000 to $29,999 | 5 (3.2%) | 7 (5.4%) |
| $30,000 to $34,999 | 10 (6.3%) | 25 (19.4%) |
| $35,000 to $39,999 | 0 (0.0%) | 0 (0.0%) |
| $40,000 to $44,999 | 4 (2.5%) | 0 (0.0%) |
| $45,000 to $49,999 | 3 (1.9%) | 7 (5.4%) |
| $50,000 to $54,999 | 6 (3.8%) | 4 (3.1%) |
| $55,000 to $64,999 | 6 (3.8%) | 2 (1.5%) |
| $65,000 to $74,999 | 0 (0.0%) | 5 (3.9%) |
| $75,000 to $99,999 | 21 (13.3%) | 4 (3.1%) |
| $100,000+ | 60 (38.0%) | 25 (19.4%) |
| Total | 158 (100.0%) | 129 (100.0%) |
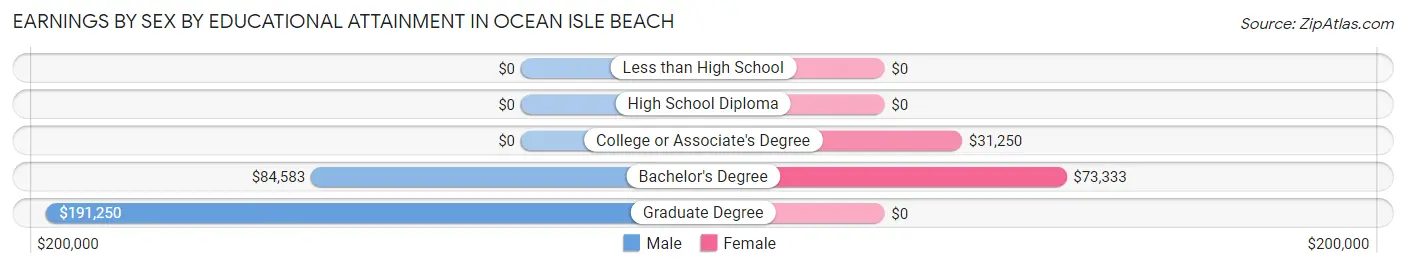
Earnings by Sex by Educational Attainment in Ocean Isle Beach
Average earnings in Ocean Isle Beach are $81,667 for men and $31,979 for women, a difference of 60.8%. Men with an educational attainment of graduate degree enjoy the highest average annual earnings of $191,250, while those with bachelor's degree education earn the least with $84,583. Women with an educational attainment of bachelor's degree earn the most with the average annual earnings of $73,333, while those with college or associate's degree education have the smallest earnings of $31,250.
| Educational Attainment | Male Income | Female Income |
| Less than High School | - | - |
| High School Diploma | - | - |
| College or Associate's Degree | - | - |
| Bachelor's Degree | $84,583 | $73,333 |
| Graduate Degree | $191,250 | $0 |
| Total | $81,667 | $31,979 |
Family Income in Ocean Isle Beach
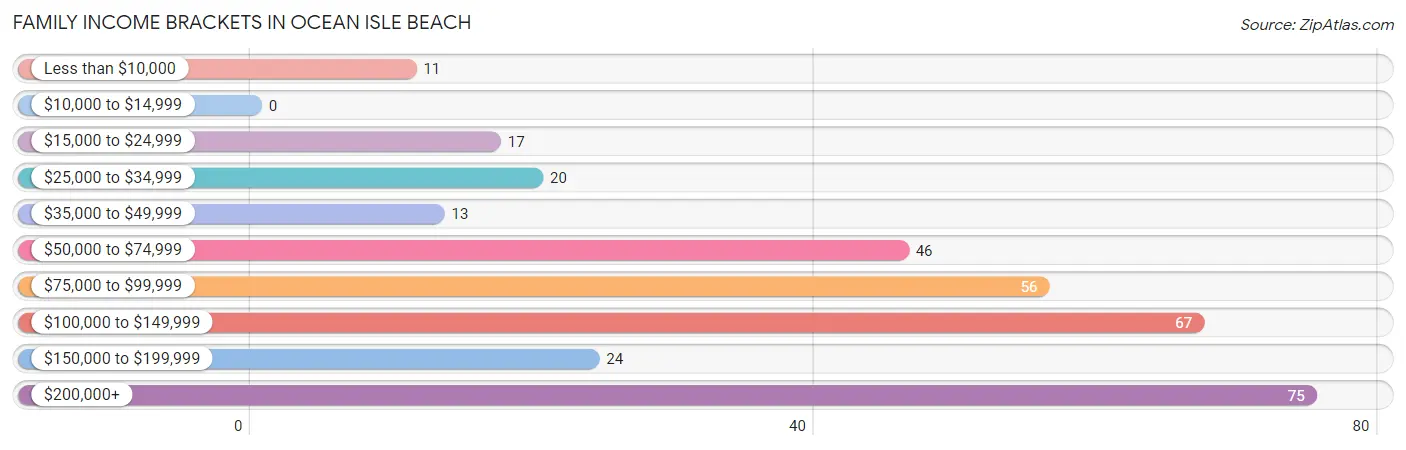
Family Income Brackets in Ocean Isle Beach
According to the Ocean Isle Beach family income data, there are 75 families falling into the $200,000+ income range, which is the most common income bracket and makes up 22.8% of all families.
| Income Bracket | # Families | % Families |
| Less than $10,000 | 11 | 3.3% |
| $10,000 to $14,999 | 0 | 0.0% |
| $15,000 to $24,999 | 17 | 5.2% |
| $25,000 to $34,999 | 20 | 6.1% |
| $35,000 to $49,999 | 13 | 4.0% |
| $50,000 to $74,999 | 46 | 14.0% |
| $75,000 to $99,999 | 56 | 17.0% |
| $100,000 to $149,999 | 67 | 20.4% |
| $150,000 to $199,999 | 24 | 7.3% |
| $200,000+ | 75 | 22.8% |
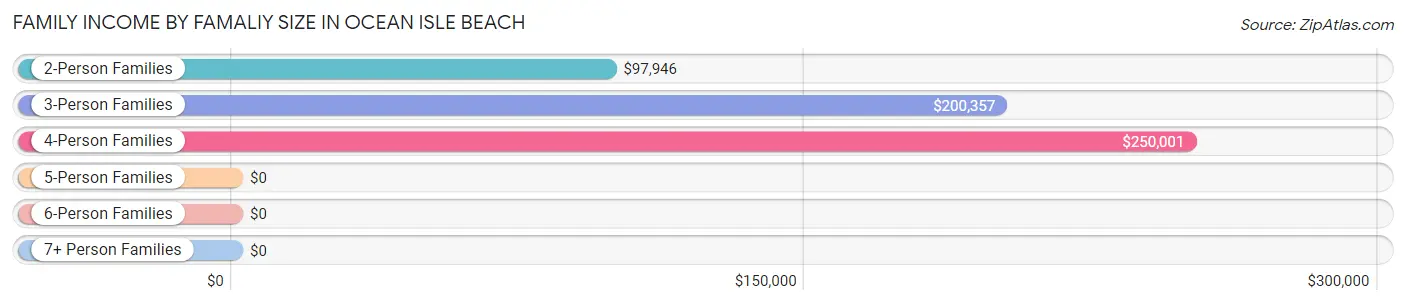
Family Income by Famaliy Size in Ocean Isle Beach
4-person families (8 | 2.4%) account for the highest median family income in Ocean Isle Beach with $250,001 per family, while 3-person families (22 | 6.7%) have the highest median income of $66,786 per family member.
| Income Bracket | # Families | Median Income |
| 2-Person Families | 297 (90.3%) | $97,946 |
| 3-Person Families | 22 (6.7%) | $200,357 |
| 4-Person Families | 8 (2.4%) | $250,001 |
| 5-Person Families | 2 (0.6%) | $0 |
| 6-Person Families | 0 (0.0%) | $0 |
| 7+ Person Families | 0 (0.0%) | $0 |
| Total | 329 (100.0%) | $105,625 |
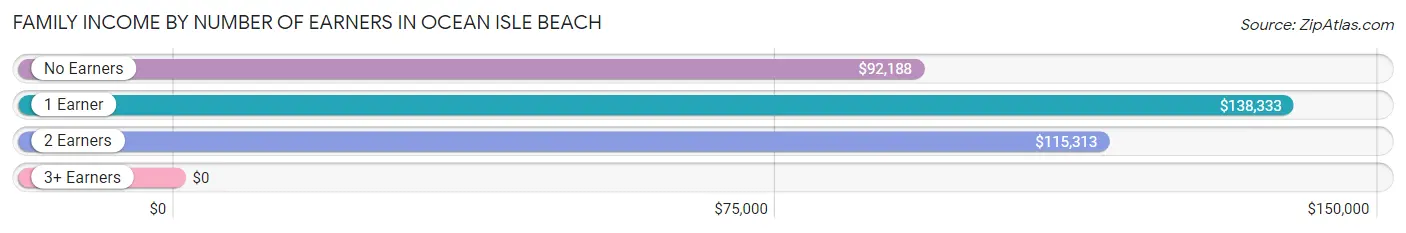
Family Income by Number of Earners in Ocean Isle Beach
| Number of Earners | # Families | Median Income |
| No Earners | 159 (48.3%) | $92,188 |
| 1 Earner | 78 (23.7%) | $138,333 |
| 2 Earners | 87 (26.4%) | $115,313 |
| 3+ Earners | 5 (1.5%) | $0 |
| Total | 329 (100.0%) | $105,625 |
Household Income in Ocean Isle Beach
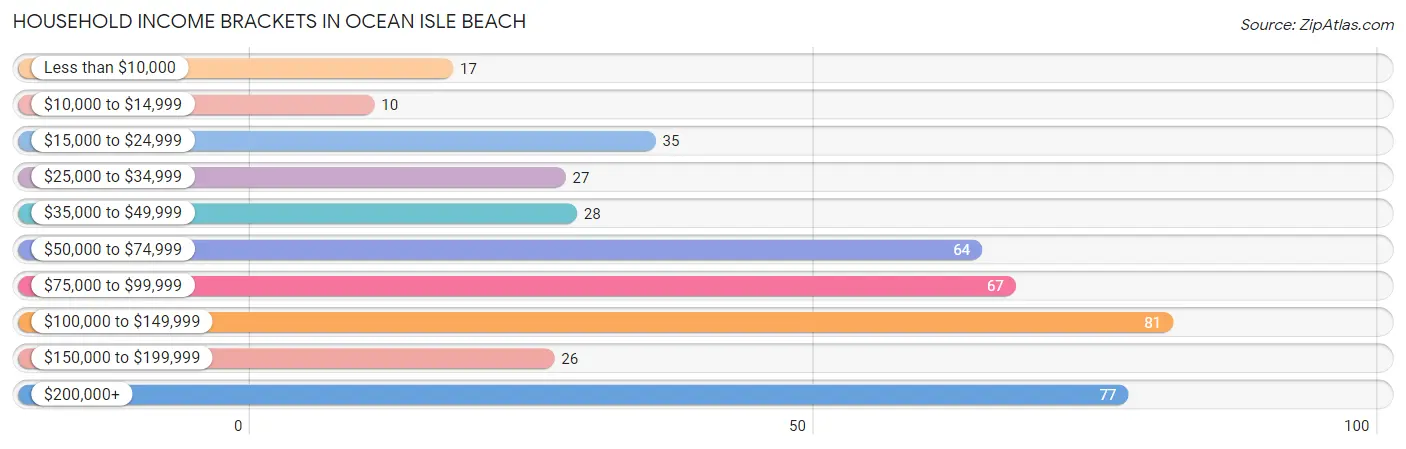
Household Income Brackets in Ocean Isle Beach
With 81 households falling in the category, the $100,000 to $149,999 income range is the most frequent in Ocean Isle Beach, accounting for 18.8% of all households. In contrast, only 10 households (2.3%) fall into the $10,000 to $14,999 income bracket, making it the least populous group.
| Income Bracket | # Households | % Households |
| Less than $10,000 | 17 | 3.9% |
| $10,000 to $14,999 | 10 | 2.3% |
| $15,000 to $24,999 | 35 | 8.1% |
| $25,000 to $34,999 | 27 | 6.3% |
| $35,000 to $49,999 | 28 | 6.5% |
| $50,000 to $74,999 | 64 | 14.8% |
| $75,000 to $99,999 | 67 | 15.5% |
| $100,000 to $149,999 | 81 | 18.8% |
| $150,000 to $199,999 | 26 | 6.0% |
| $200,000+ | 77 | 17.8% |
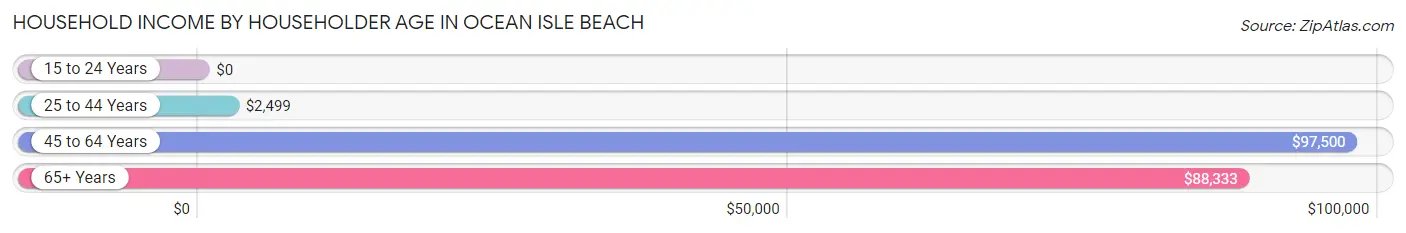
Household Income by Householder Age in Ocean Isle Beach
The median household income in Ocean Isle Beach is $91,250, with the highest median household income of $97,500 found in the 45 to 64 years age bracket for the primary householder. A total of 146 households (33.8%) fall into this category. Meanwhile, the 15 to 24 years age bracket for the primary householder has the lowest median household income of $0, with 1 households (0.2%) in this group.
| Income Bracket | # Households | Median Income |
| 15 to 24 Years | 1 (0.2%) | $0 |
| 25 to 44 Years | 11 (2.5%) | $2,499 |
| 45 to 64 Years | 146 (33.8%) | $97,500 |
| 65+ Years | 274 (63.4%) | $88,333 |
| Total | 432 (100.0%) | $91,250 |
Poverty in Ocean Isle Beach
Income Below Poverty by Sex and Age in Ocean Isle Beach
With 3.5% poverty level for males and 4.1% for females among the residents of Ocean Isle Beach, 35 to 44 year old males and 35 to 44 year old females are the most vulnerable to poverty, with 6 males (75.0%) and 5 females (25.0%) in their respective age groups living below the poverty level.
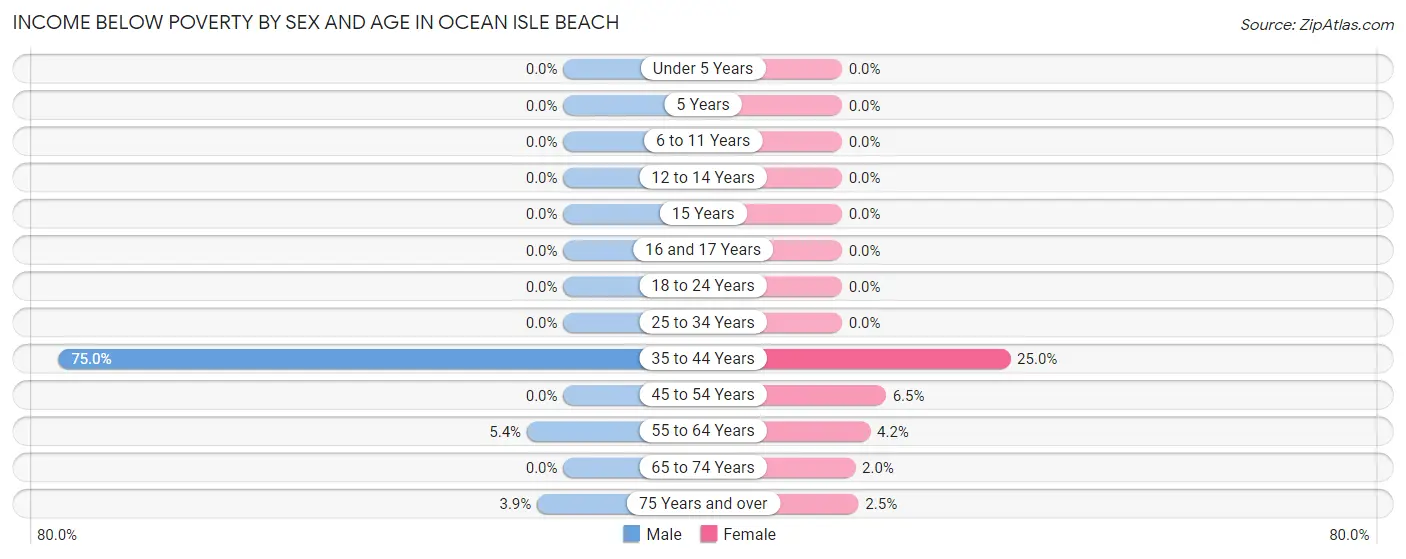
| Age Bracket | Male | Female |
| Under 5 Years | 0 (0.0%) | 0 (0.0%) |
| 5 Years | 0 (0.0%) | 0 (0.0%) |
| 6 to 11 Years | 0 (0.0%) | 0 (0.0%) |
| 12 to 14 Years | 0 (0.0%) | 0 (0.0%) |
| 15 Years | 0 (0.0%) | 0 (0.0%) |
| 16 and 17 Years | 0 (0.0%) | 0 (0.0%) |
| 18 to 24 Years | 0 (0.0%) | 0 (0.0%) |
| 25 to 34 Years | 0 (0.0%) | 0 (0.0%) |
| 35 to 44 Years | 6 (75.0%) | 5 (25.0%) |
| 45 to 54 Years | 0 (0.0%) | 3 (6.5%) |
| 55 to 64 Years | 4 (5.4%) | 5 (4.2%) |
| 65 to 74 Years | 0 (0.0%) | 3 (2.0%) |
| 75 Years and over | 3 (3.9%) | 2 (2.5%) |
| Total | 13 (3.5%) | 18 (4.1%) |
Income Above Poverty by Sex and Age in Ocean Isle Beach
According to the poverty statistics in Ocean Isle Beach, males aged under 5 years and females aged 6 to 11 years are the age groups that are most secure financially, with 100.0% of males and 100.0% of females in these age groups living above the poverty line.
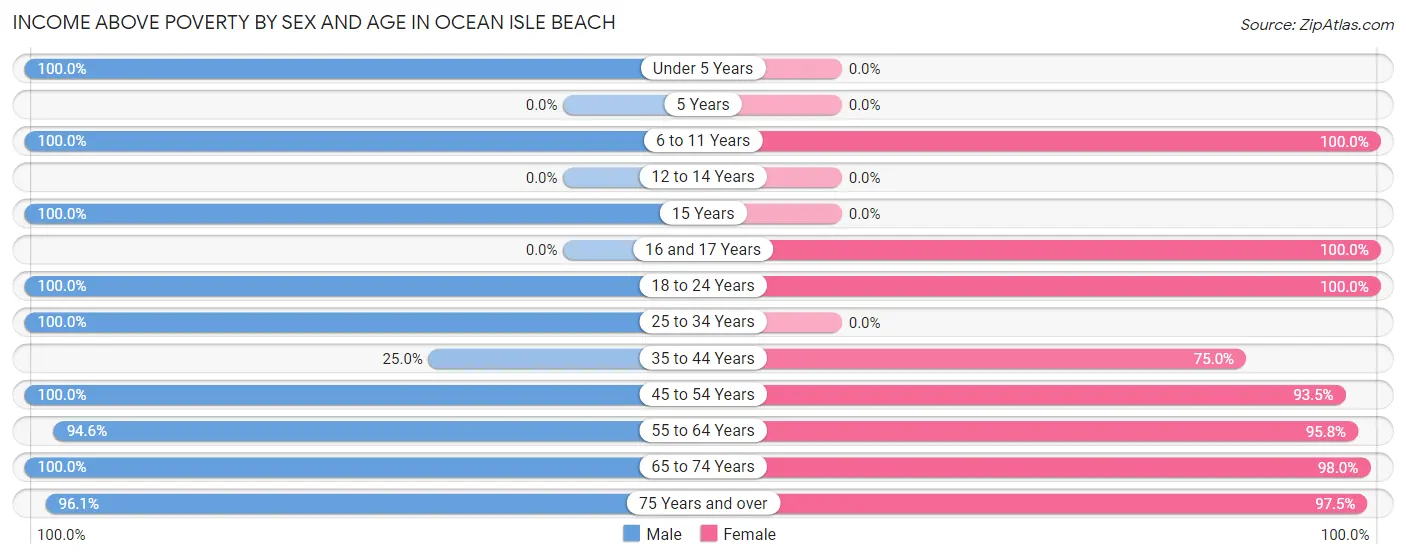
| Age Bracket | Male | Female |
| Under 5 Years | 2 (100.0%) | 0 (0.0%) |
| 5 Years | 0 (0.0%) | 0 (0.0%) |
| 6 to 11 Years | 8 (100.0%) | 8 (100.0%) |
| 12 to 14 Years | 0 (0.0%) | 0 (0.0%) |
| 15 Years | 1 (100.0%) | 0 (0.0%) |
| 16 and 17 Years | 0 (0.0%) | 10 (100.0%) |
| 18 to 24 Years | 10 (100.0%) | 4 (100.0%) |
| 25 to 34 Years | 7 (100.0%) | 0 (0.0%) |
| 35 to 44 Years | 2 (25.0%) | 15 (75.0%) |
| 45 to 54 Years | 32 (100.0%) | 43 (93.5%) |
| 55 to 64 Years | 70 (94.6%) | 114 (95.8%) |
| 65 to 74 Years | 150 (100.0%) | 149 (98.0%) |
| 75 Years and over | 74 (96.1%) | 79 (97.5%) |
| Total | 356 (96.5%) | 422 (95.9%) |
Income Below Poverty Among Married-Couple Families in Ocean Isle Beach
The poverty statistics for married-couple families in Ocean Isle Beach show that 2.6% or 8 of the total 309 families live below the poverty line. Families with no children have the highest poverty rate of 2.7%, comprising of 8 families. On the other hand, families with 1 or 2 children have the lowest poverty rate of 0.0%, which includes 0 families.
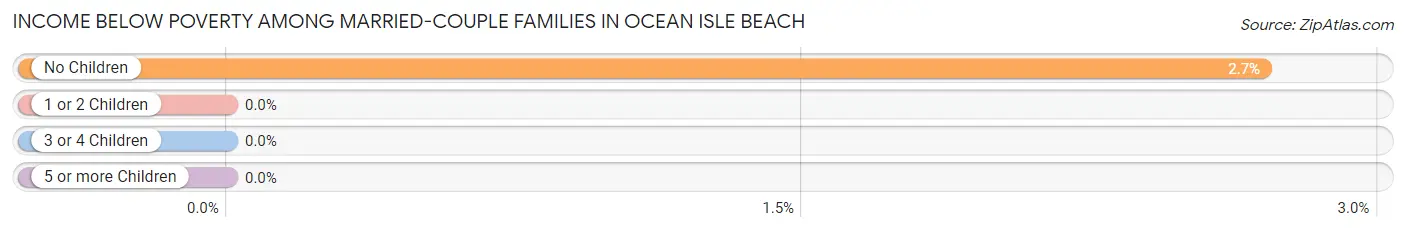
| Children | Above Poverty | Below Poverty |
| No Children | 288 (97.3%) | 8 (2.7%) |
| 1 or 2 Children | 11 (100.0%) | 0 (0.0%) |
| 3 or 4 Children | 2 (100.0%) | 0 (0.0%) |
| 5 or more Children | 0 (0.0%) | 0 (0.0%) |
| Total | 301 (97.4%) | 8 (2.6%) |
Income Below Poverty Among Single-Parent Households in Ocean Isle Beach
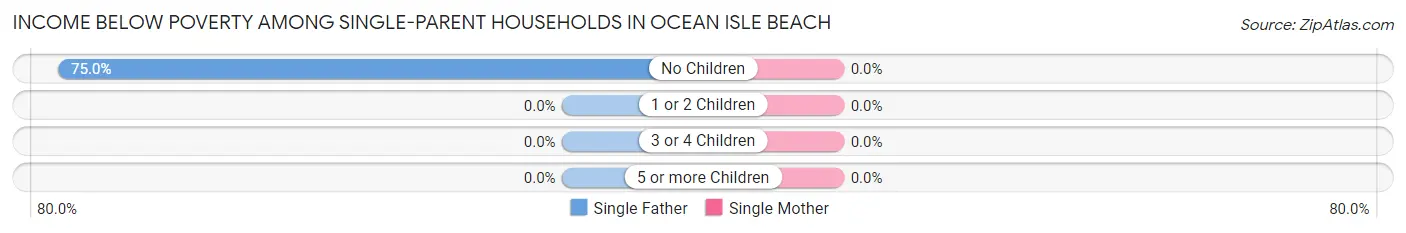
| Children | Single Father | Single Mother |
| No Children | 6 (75.0%) | 0 (0.0%) |
| 1 or 2 Children | 0 (0.0%) | 0 (0.0%) |
| 3 or 4 Children | 0 (0.0%) | 0 (0.0%) |
| 5 or more Children | 0 (0.0%) | 0 (0.0%) |
| Total | 6 (75.0%) | 0 (0.0%) |
Income Below Poverty Among Married-Couple vs Single-Parent Households in Ocean Isle Beach
The poverty data for Ocean Isle Beach shows that 8 of the married-couple family households (2.6%) and 6 of the single-parent households (30.0%) are living below the poverty level. Within the married-couple family households, those with no children have the highest poverty rate, with 8 households (2.7%) falling below the poverty line. Among the single-parent households, those with no children have the highest poverty rate, with 6 household (30.0%) living below poverty.
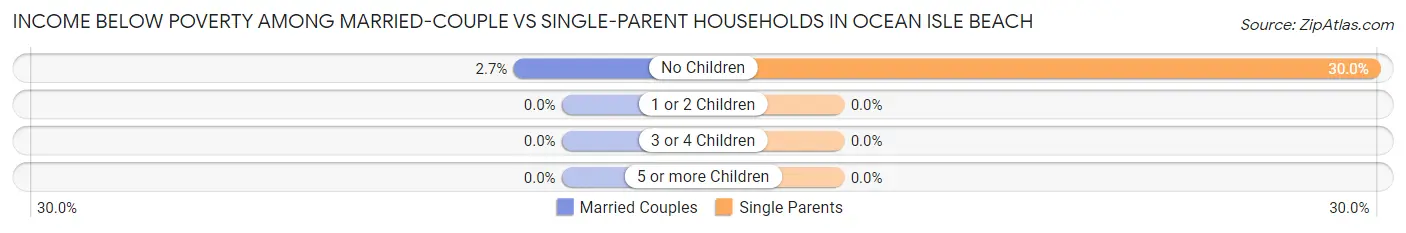
| Children | Married-Couple Families | Single-Parent Households |
| No Children | 8 (2.7%) | 6 (30.0%) |
| 1 or 2 Children | 0 (0.0%) | 0 (0.0%) |
| 3 or 4 Children | 0 (0.0%) | 0 (0.0%) |
| 5 or more Children | 0 (0.0%) | 0 (0.0%) |
| Total | 8 (2.6%) | 6 (30.0%) |
Race in Ocean Isle Beach
The most populous races in Ocean Isle Beach are White / Caucasian (768 | 94.9%), Hispanic or Latino (39 | 4.8%), and Some other Race (35 | 4.3%).
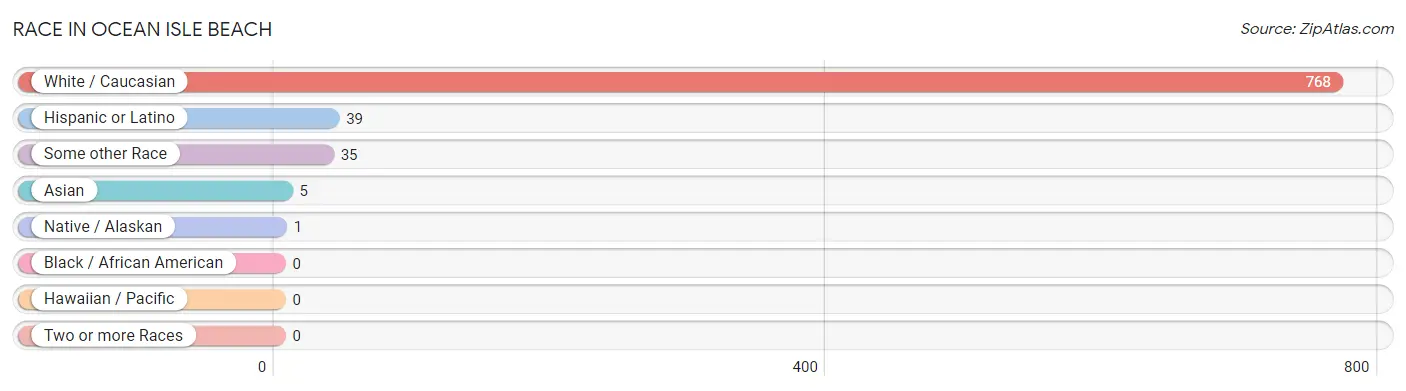
| Race | # Population | % Population |
| Asian | 5 | 0.6% |
| Black / African American | 0 | 0.0% |
| Hawaiian / Pacific | 0 | 0.0% |
| Hispanic or Latino | 39 | 4.8% |
| Native / Alaskan | 1 | 0.1% |
| White / Caucasian | 768 | 94.9% |
| Two or more Races | 0 | 0.0% |
| Some other Race | 35 | 4.3% |
| Total | 809 | 100.0% |
Ancestry in Ocean Isle Beach
The most populous ancestries reported in Ocean Isle Beach are English (216 | 26.7%), German (137 | 16.9%), Irish (125 | 15.4%), American (84 | 10.4%), and Italian (37 | 4.6%), together accounting for 74.0% of all Ocean Isle Beach residents.
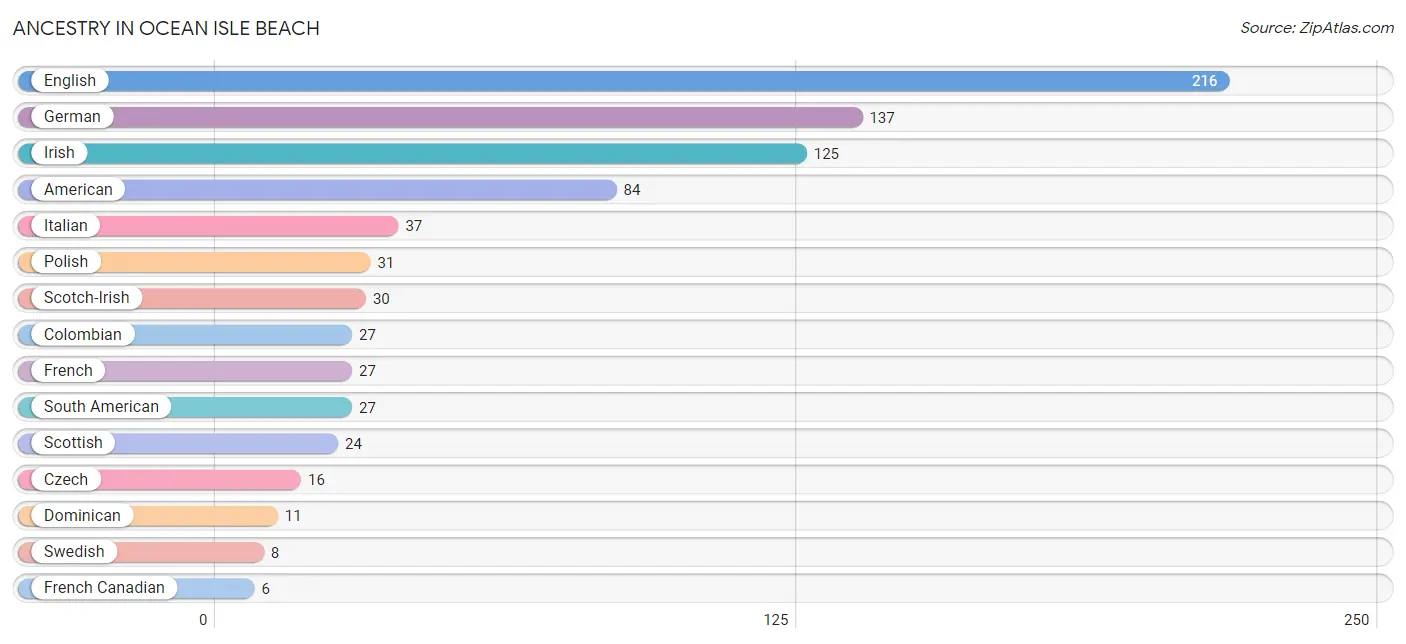
| Ancestry | # Population | % Population |
| American | 84 | 10.4% |
| Austrian | 2 | 0.3% |
| British | 5 | 0.6% |
| Colombian | 27 | 3.3% |
| Czech | 16 | 2.0% |
| Dominican | 11 | 1.4% |
| English | 216 | 26.7% |
| European | 2 | 0.3% |
| French | 27 | 3.3% |
| French Canadian | 6 | 0.7% |
| German | 137 | 16.9% |
| Greek | 2 | 0.3% |
| Indian (Asian) | 2 | 0.3% |
| Irish | 125 | 15.4% |
| Italian | 37 | 4.6% |
| Korean | 3 | 0.4% |
| Lithuanian | 3 | 0.4% |
| Polish | 31 | 3.8% |
| Portuguese | 2 | 0.3% |
| Scotch-Irish | 30 | 3.7% |
| Scottish | 24 | 3.0% |
| Slovak | 3 | 0.4% |
| South American | 27 | 3.3% |
| Swedish | 8 | 1.0% |
| Turkish | 2 | 0.3% |
| Ukrainian | 6 | 0.7% |
| Welsh | 2 | 0.3% | View All 27 Rows |
Immigrants in Ocean Isle Beach
The most numerous immigrant groups reported in Ocean Isle Beach came from Latin America (35 | 4.3%), Colombia (24 | 3.0%), South America (24 | 3.0%), Caribbean (11 | 1.4%), and Dominican Republic (11 | 1.4%), together accounting for 13.0% of all Ocean Isle Beach residents.
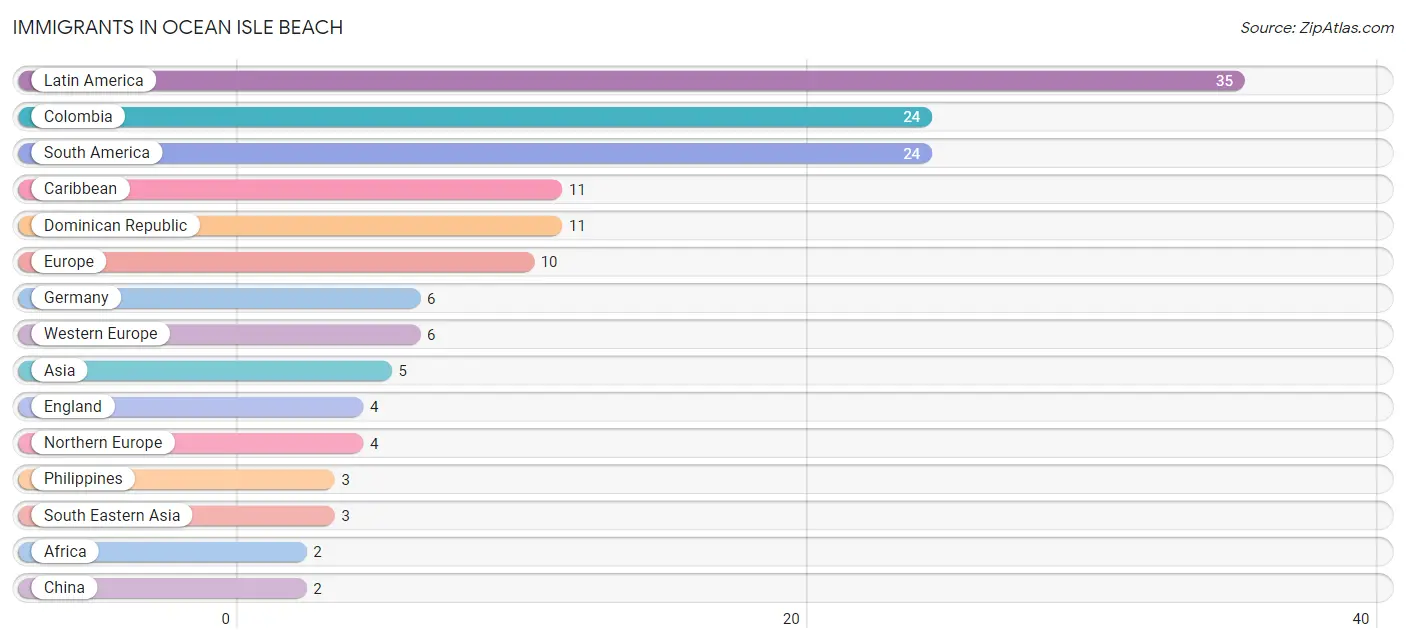
| Immigration Origin | # Population | % Population |
| Africa | 2 | 0.3% |
| Asia | 5 | 0.6% |
| Caribbean | 11 | 1.4% |
| China | 2 | 0.3% |
| Colombia | 24 | 3.0% |
| Dominican Republic | 11 | 1.4% |
| Eastern Asia | 2 | 0.3% |
| Egypt | 2 | 0.3% |
| England | 4 | 0.5% |
| Europe | 10 | 1.2% |
| Germany | 6 | 0.7% |
| Latin America | 35 | 4.3% |
| Northern Africa | 2 | 0.3% |
| Northern Europe | 4 | 0.5% |
| Philippines | 3 | 0.4% |
| South America | 24 | 3.0% |
| South Eastern Asia | 3 | 0.4% |
| Western Europe | 6 | 0.7% | View All 18 Rows |
Sex and Age in Ocean Isle Beach
Sex and Age in Ocean Isle Beach
The most populous age groups in Ocean Isle Beach are 65 to 69 Years (80 | 21.7%) for men and 65 to 69 Years (77 | 17.5%) for women.
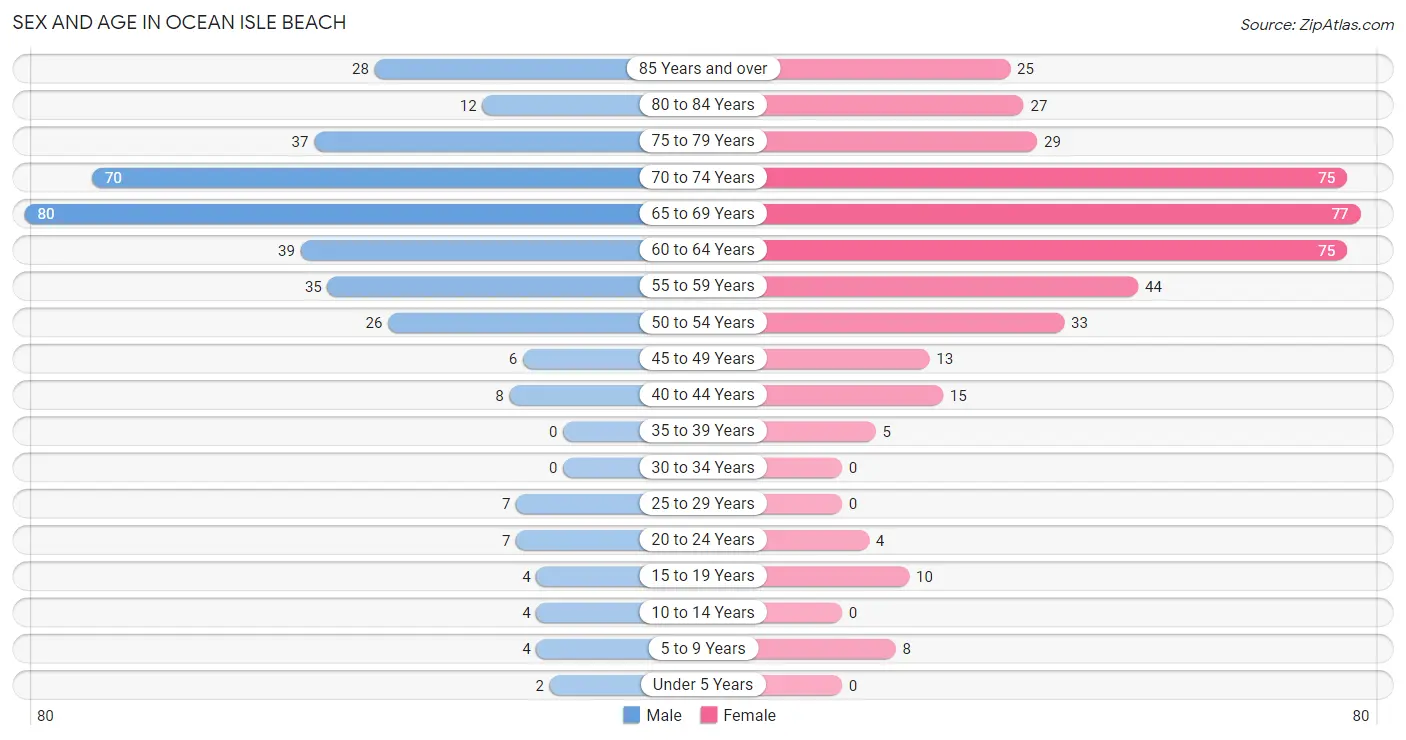
| Age Bracket | Male | Female |
| Under 5 Years | 2 (0.5%) | 0 (0.0%) |
| 5 to 9 Years | 4 (1.1%) | 8 (1.8%) |
| 10 to 14 Years | 4 (1.1%) | 0 (0.0%) |
| 15 to 19 Years | 4 (1.1%) | 10 (2.3%) |
| 20 to 24 Years | 7 (1.9%) | 4 (0.9%) |
| 25 to 29 Years | 7 (1.9%) | 0 (0.0%) |
| 30 to 34 Years | 0 (0.0%) | 0 (0.0%) |
| 35 to 39 Years | 0 (0.0%) | 5 (1.1%) |
| 40 to 44 Years | 8 (2.2%) | 15 (3.4%) |
| 45 to 49 Years | 6 (1.6%) | 13 (2.9%) |
| 50 to 54 Years | 26 (7.0%) | 33 (7.5%) |
| 55 to 59 Years | 35 (9.5%) | 44 (10.0%) |
| 60 to 64 Years | 39 (10.6%) | 75 (17.1%) |
| 65 to 69 Years | 80 (21.7%) | 77 (17.5%) |
| 70 to 74 Years | 70 (19.0%) | 75 (17.1%) |
| 75 to 79 Years | 37 (10.0%) | 29 (6.6%) |
| 80 to 84 Years | 12 (3.3%) | 27 (6.1%) |
| 85 Years and over | 28 (7.6%) | 25 (5.7%) |
| Total | 369 (100.0%) | 440 (100.0%) |
Families and Households in Ocean Isle Beach
Median Family Size in Ocean Isle Beach
The median family size in Ocean Isle Beach is 2.13 persons per family, with single female/mother families (12 | 3.6%) accounting for the largest median family size of 2.42 persons per family. On the other hand, single male/father families (8 | 2.4%) represent the smallest median family size with 1.88 persons per family.
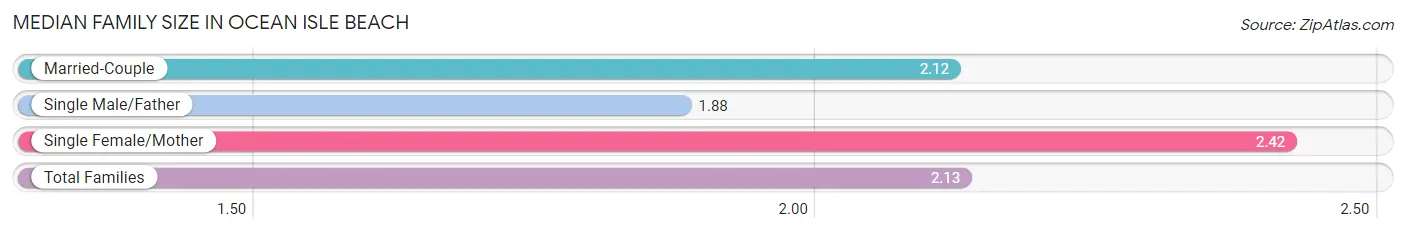
| Family Type | # Families | Family Size |
| Married-Couple | 309 (93.9%) | 2.12 |
| Single Male/Father | 8 (2.4%) | 1.88 |
| Single Female/Mother | 12 (3.6%) | 2.42 |
| Total Families | 329 (100.0%) | 2.13 |
Median Household Size in Ocean Isle Beach
The median household size in Ocean Isle Beach is 1.87 persons per household, with single female/mother households (12 | 2.8%) accounting for the largest median household size of 2.42 persons per household. non-family households (103 | 23.8%) represent the smallest median household size with 1.03 persons per household.
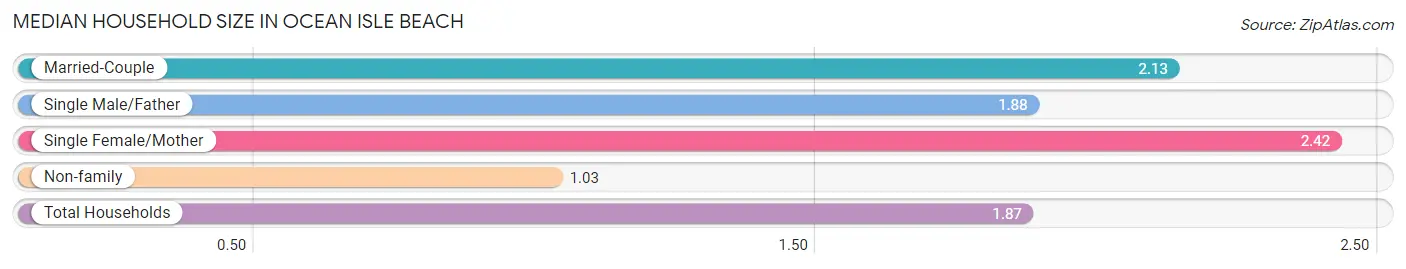
| Household Type | # Households | Household Size |
| Married-Couple | 309 (71.5%) | 2.13 |
| Single Male/Father | 8 (1.8%) | 1.88 |
| Single Female/Mother | 12 (2.8%) | 2.42 |
| Non-family | 103 (23.8%) | 1.03 |
| Total Households | 432 (100.0%) | 1.87 |
Household Size by Marriage Status in Ocean Isle Beach
Out of a total of 432 households in Ocean Isle Beach, 329 (76.2%) are family households, while 103 (23.8%) are nonfamily households. The most numerous type of family households are 2-person households, comprising 297, and the most common type of nonfamily households are 1-person households, comprising 99.
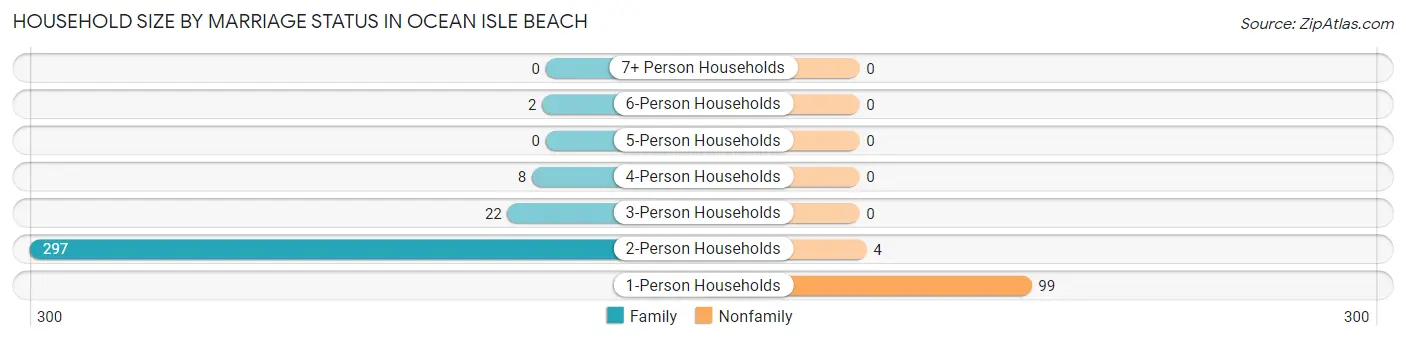
| Household Size | Family Households | Nonfamily Households |
| 1-Person Households | - | 99 (22.9%) |
| 2-Person Households | 297 (68.8%) | 4 (0.9%) |
| 3-Person Households | 22 (5.1%) | 0 (0.0%) |
| 4-Person Households | 8 (1.8%) | 0 (0.0%) |
| 5-Person Households | 0 (0.0%) | 0 (0.0%) |
| 6-Person Households | 2 (0.5%) | 0 (0.0%) |
| 7+ Person Households | 0 (0.0%) | 0 (0.0%) |
| Total | 329 (76.2%) | 103 (23.8%) |
Female Fertility in Ocean Isle Beach
Fertility by Age in Ocean Isle Beach
| Age Bracket | Women with Births | Births / 1,000 Women |
| 15 to 19 years | 0 (0.0%) | 0.0 |
| 20 to 34 years | 0 (0.0%) | 0.0 |
| 35 to 50 years | 0 (0.0%) | 0.0 |
| Total | 0 (0.0%) | 0.0 |
Fertility by Age by Marriage Status in Ocean Isle Beach
| Age Bracket | Married | Unmarried |
| 15 to 19 years | 0 (0.0%) | 0 (0.0%) |
| 20 to 34 years | 0 (0.0%) | 0 (0.0%) |
| 35 to 50 years | 0 (0.0%) | 0 (0.0%) |
| Total | 0 (0.0%) | 0 (0.0%) |
Fertility by Education in Ocean Isle Beach
| Educational Attainment | Women with Births | Births / 1,000 Women |
| Less than High School | 0 (0.0%) | 0.0 |
| High School Diploma | 0 (0.0%) | 0.0 |
| College or Associate's Degree | 0 (0.0%) | 0.0 |
| Bachelor's Degree | 0 (0.0%) | 0.0 |
| Graduate Degree | 0 (0.0%) | 0.0 |
| Total | 0 (0.0%) | 0.0 |
Fertility by Education by Marriage Status in Ocean Isle Beach
| Educational Attainment | Married | Unmarried |
| Less than High School | 0 (0.0%) | 0 (0.0%) |
| High School Diploma | 0 (0.0%) | 0 (0.0%) |
| College or Associate's Degree | 0 (0.0%) | 0 (0.0%) |
| Bachelor's Degree | 0 (0.0%) | 0 (0.0%) |
| Graduate Degree | 0 (0.0%) | 0 (0.0%) |
| Total | 0 (0.0%) | 0 (0.0%) |
Employment Characteristics in Ocean Isle Beach
Employment by Class of Employer in Ocean Isle Beach
Among the 235 employed individuals in Ocean Isle Beach, private company employees (123 | 52.3%), self-employed (incorporated) (41 | 17.4%), and self-employed (not incorporated) (27 | 11.5%) make up the most common classes of employment.
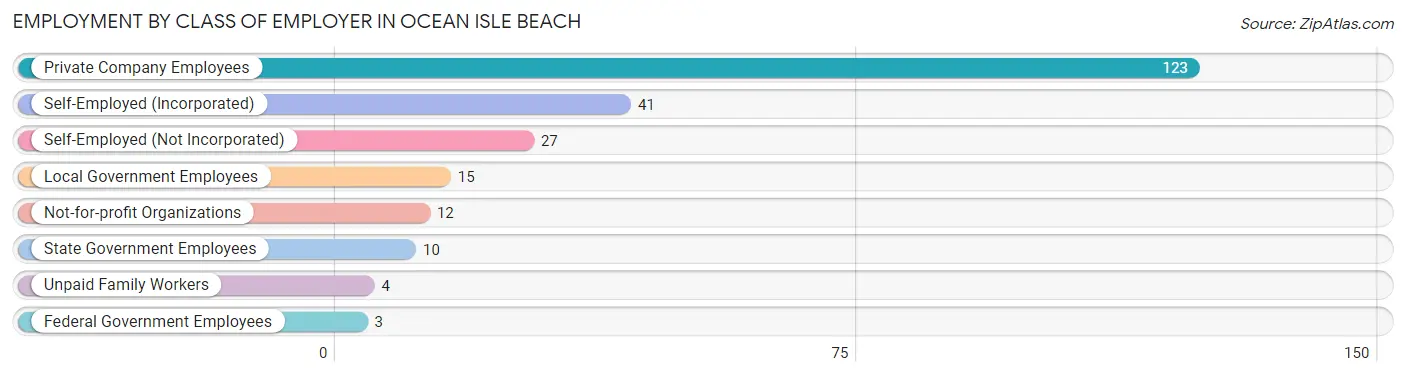
| Employer Class | # Employees | % Employees |
| Private Company Employees | 123 | 52.3% |
| Self-Employed (Incorporated) | 41 | 17.4% |
| Self-Employed (Not Incorporated) | 27 | 11.5% |
| Not-for-profit Organizations | 12 | 5.1% |
| Local Government Employees | 15 | 6.4% |
| State Government Employees | 10 | 4.3% |
| Federal Government Employees | 3 | 1.3% |
| Unpaid Family Workers | 4 | 1.7% |
| Total | 235 | 100.0% |
Employment Status by Age in Ocean Isle Beach
According to the labor force statistics for Ocean Isle Beach, out of the total population over 16 years of age (790), 32.4% or 256 individuals are in the labor force, with 3.1% or 8 of them unemployed. The age group with the highest labor force participation rate is 20 to 24 years, with 100.0% or 11 individuals in the labor force. Within the labor force, the 35 to 44 years age range has the highest percentage of unemployed individuals, with 11.8% or 2 of them being unemployed.
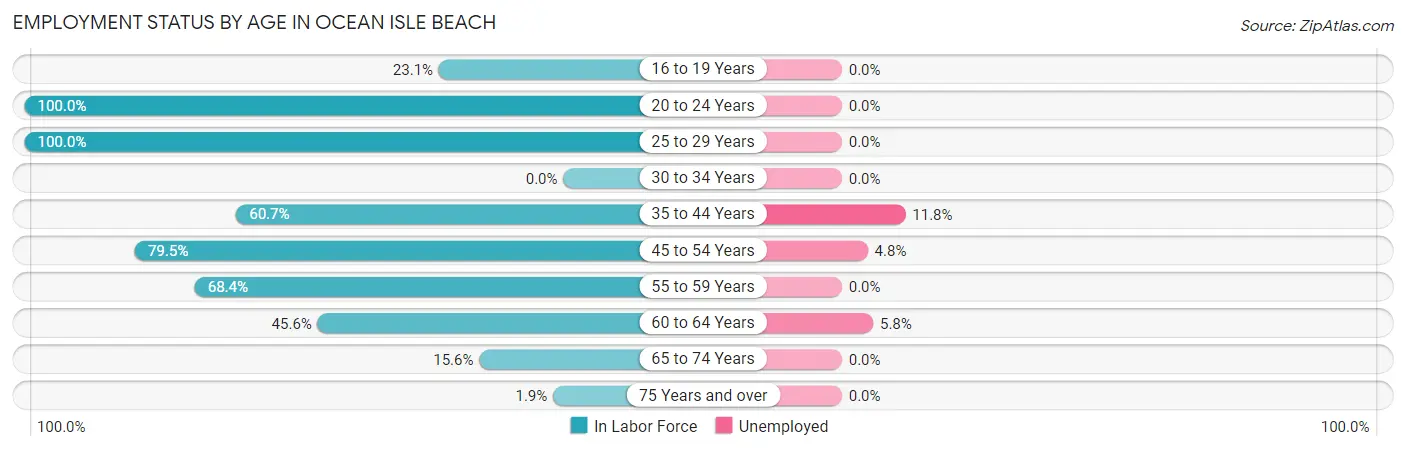
| Age Bracket | In Labor Force | Unemployed |
| 16 to 19 Years | 3 (23.1%) | 0 (0.0%) |
| 20 to 24 Years | 11 (100.0%) | 0 (0.0%) |
| 25 to 29 Years | 7 (100.0%) | 0 (0.0%) |
| 30 to 34 Years | 0 (0.0%) | 0 (0.0%) |
| 35 to 44 Years | 17 (60.7%) | 2 (11.8%) |
| 45 to 54 Years | 62 (79.5%) | 3 (4.8%) |
| 55 to 59 Years | 54 (68.4%) | 0 (0.0%) |
| 60 to 64 Years | 52 (45.6%) | 3 (5.8%) |
| 65 to 74 Years | 47 (15.6%) | 0 (0.0%) |
| 75 Years and over | 3 (1.9%) | 0 (0.0%) |
| Total | 256 (32.4%) | 8 (3.1%) |
Employment Status by Educational Attainment in Ocean Isle Beach
According to labor force statistics for Ocean Isle Beach, 62.7% of individuals (192) out of the total population between 25 and 64 years of age (306) are in the labor force, with 4.2% or 8 of them being unemployed. The group with the highest labor force participation rate are those with the educational attainment of bachelor's degree or higher, with 65.2% or 101 individuals in the labor force. Within the labor force, individuals with high school diploma education have the highest percentage of unemployment, with 60.0% or 3 of them being unemployed.
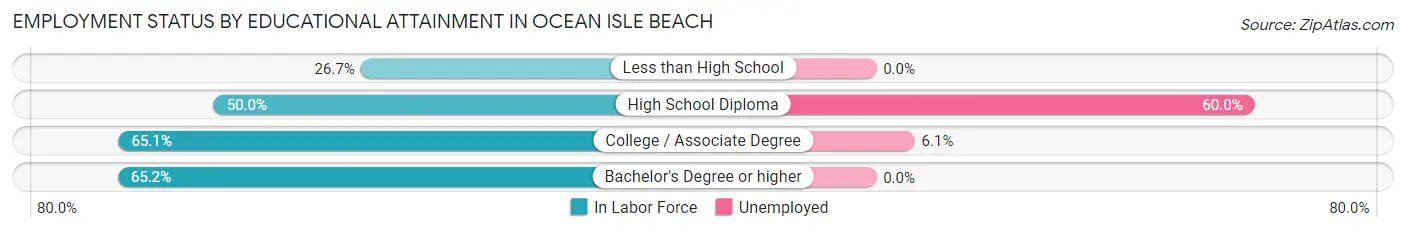
| Educational Attainment | In Labor Force | Unemployed |
| Less than High School | 4 (26.7%) | 0 (0.0%) |
| High School Diploma | 5 (50.0%) | 6 (60.0%) |
| College / Associate Degree | 82 (65.1%) | 8 (6.1%) |
| Bachelor's Degree or higher | 101 (65.2%) | 0 (0.0%) |
| Total | 192 (62.7%) | 13 (4.2%) |
Employment Occupations by Sex in Ocean Isle Beach
Management, Business, Science and Arts Occupations
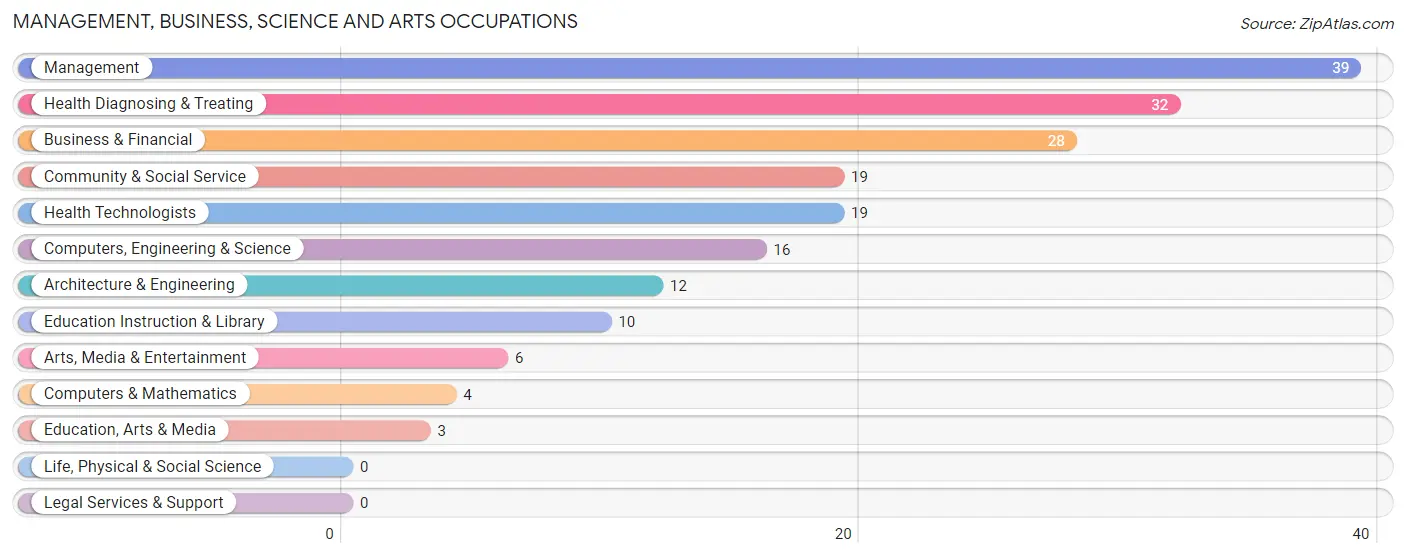
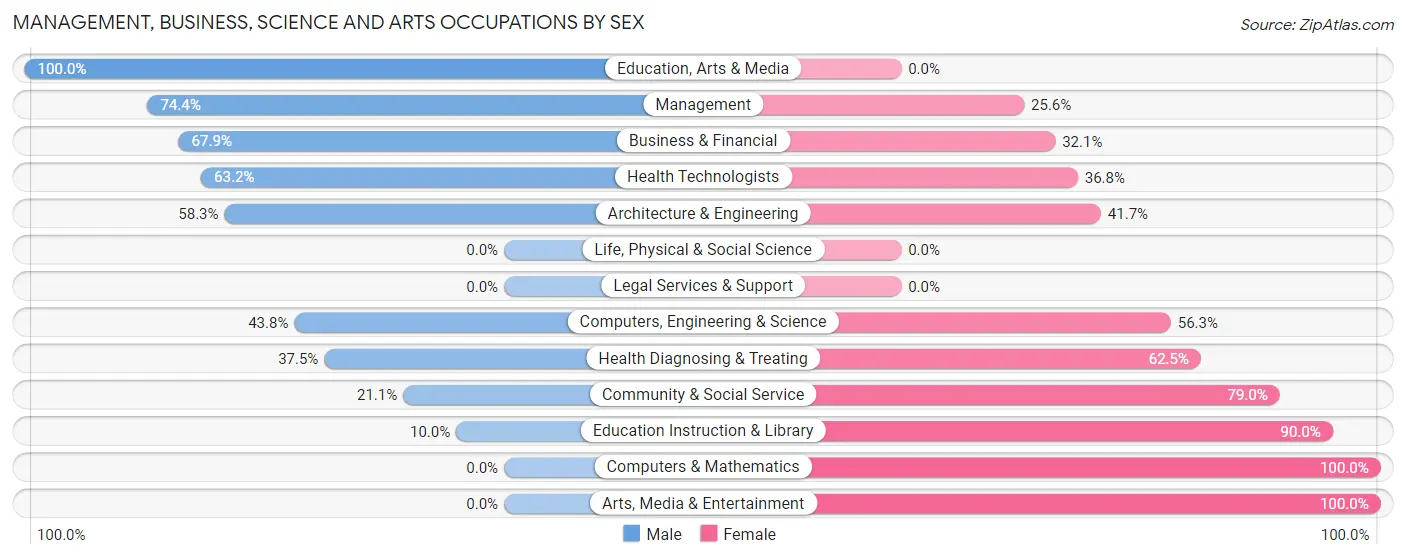
The most common Management, Business, Science and Arts occupations in Ocean Isle Beach are Management (39 | 15.7%), Health Diagnosing & Treating (32 | 12.9%), Business & Financial (28 | 11.3%), Community & Social Service (19 | 7.7%), and Health Technologists (19 | 7.7%).
Management, Business, Science and Arts Occupations by Sex
Within the Management, Business, Science and Arts occupations in Ocean Isle Beach, the most male-oriented occupations are Education, Arts & Media (100.0%), Management (74.4%), and Business & Financial (67.9%), while the most female-oriented occupations are Computers & Mathematics (100.0%), Arts, Media & Entertainment (100.0%), and Education Instruction & Library (90.0%).
| Occupation | Male | Female |
| Management | 29 (74.4%) | 10 (25.6%) |
| Business & Financial | 19 (67.9%) | 9 (32.1%) |
| Computers, Engineering & Science | 7 (43.8%) | 9 (56.2%) |
| Computers & Mathematics | 0 (0.0%) | 4 (100.0%) |
| Architecture & Engineering | 7 (58.3%) | 5 (41.7%) |
| Life, Physical & Social Science | 0 (0.0%) | 0 (0.0%) |
| Community & Social Service | 4 (21.0%) | 15 (78.9%) |
| Education, Arts & Media | 3 (100.0%) | 0 (0.0%) |
| Legal Services & Support | 0 (0.0%) | 0 (0.0%) |
| Education Instruction & Library | 1 (10.0%) | 9 (90.0%) |
| Arts, Media & Entertainment | 0 (0.0%) | 6 (100.0%) |
| Health Diagnosing & Treating | 12 (37.5%) | 20 (62.5%) |
| Health Technologists | 12 (63.2%) | 7 (36.8%) |
| Total (Category) | 71 (53.0%) | 63 (47.0%) |
| Total (Overall) | 134 (54.0%) | 114 (46.0%) |
Services Occupations
The most common Services occupations in Ocean Isle Beach are Food Preparation & Serving (15 | 6.0%), Personal Care & Service (4 | 1.6%), and Healthcare Support (1 | 0.4%).
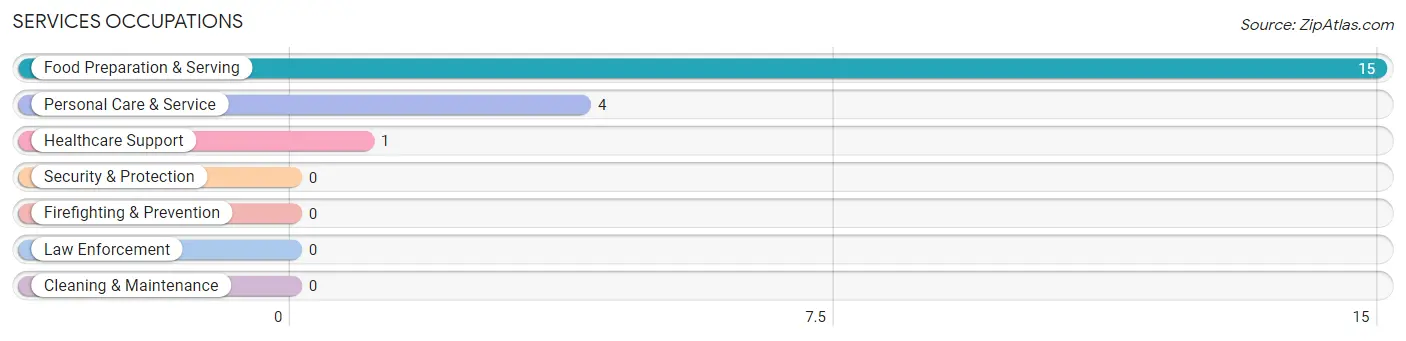
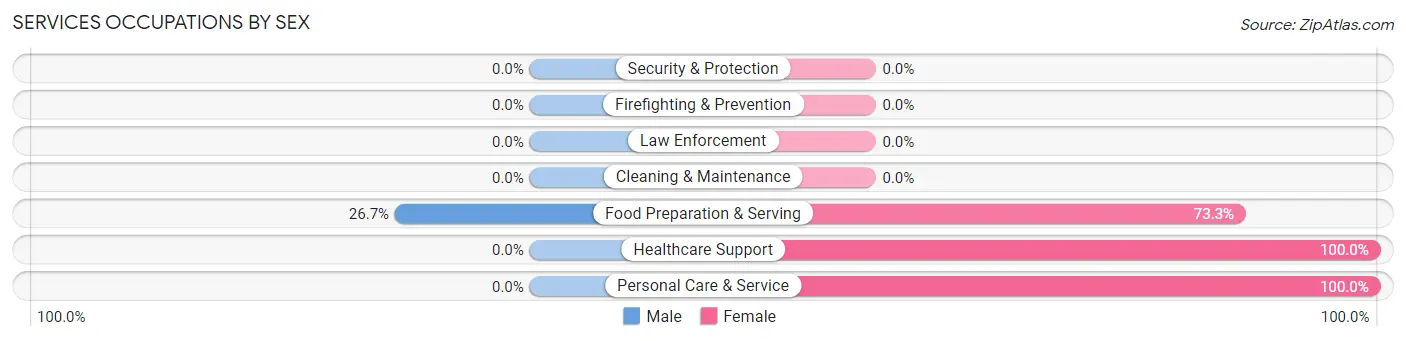
Services Occupations by Sex
| Occupation | Male | Female |
| Healthcare Support | 0 (0.0%) | 1 (100.0%) |
| Security & Protection | 0 (0.0%) | 0 (0.0%) |
| Firefighting & Prevention | 0 (0.0%) | 0 (0.0%) |
| Law Enforcement | 0 (0.0%) | 0 (0.0%) |
| Food Preparation & Serving | 4 (26.7%) | 11 (73.3%) |
| Cleaning & Maintenance | 0 (0.0%) | 0 (0.0%) |
| Personal Care & Service | 0 (0.0%) | 4 (100.0%) |
| Total (Category) | 4 (20.0%) | 16 (80.0%) |
| Total (Overall) | 134 (54.0%) | 114 (46.0%) |
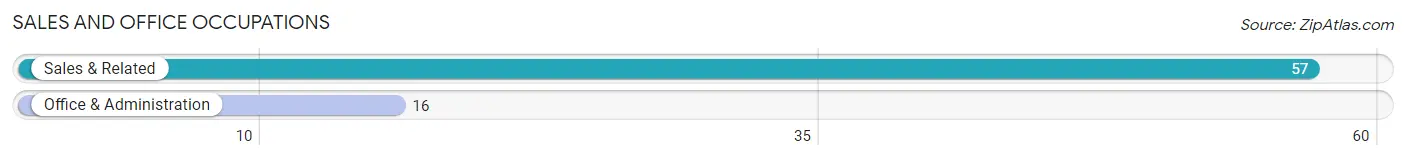
Sales and Office Occupations
The most common Sales and Office occupations in Ocean Isle Beach are Sales & Related (57 | 23.0%), and Office & Administration (16 | 6.5%).
Sales and Office Occupations by Sex
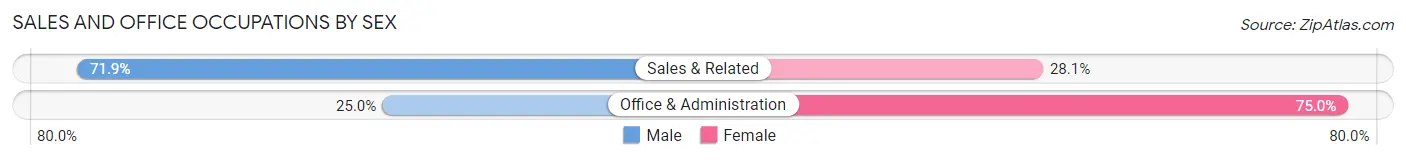
| Occupation | Male | Female |
| Sales & Related | 41 (71.9%) | 16 (28.1%) |
| Office & Administration | 4 (25.0%) | 12 (75.0%) |
| Total (Category) | 45 (61.6%) | 28 (38.4%) |
| Total (Overall) | 134 (54.0%) | 114 (46.0%) |
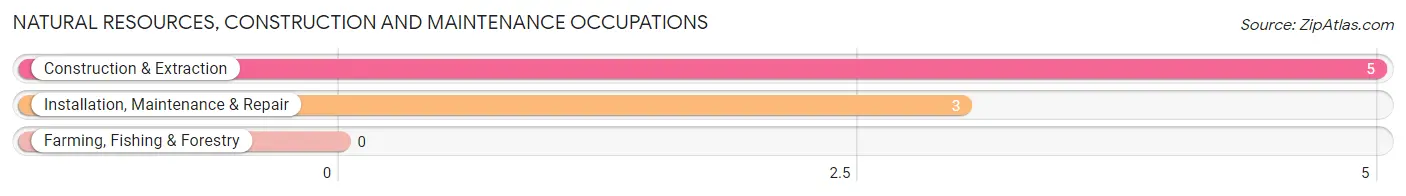
Natural Resources, Construction and Maintenance Occupations
The most common Natural Resources, Construction and Maintenance occupations in Ocean Isle Beach are Construction & Extraction (5 | 2.0%), and Installation, Maintenance & Repair (3 | 1.2%).
Natural Resources, Construction and Maintenance Occupations by Sex
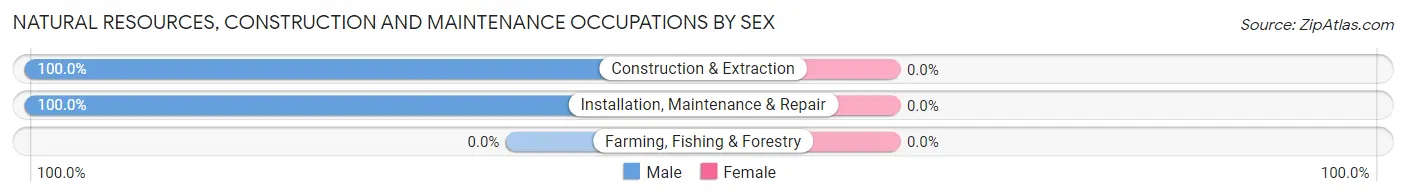
| Occupation | Male | Female |
| Farming, Fishing & Forestry | 0 (0.0%) | 0 (0.0%) |
| Construction & Extraction | 5 (100.0%) | 0 (0.0%) |
| Installation, Maintenance & Repair | 3 (100.0%) | 0 (0.0%) |
| Total (Category) | 8 (100.0%) | 0 (0.0%) |
| Total (Overall) | 134 (54.0%) | 114 (46.0%) |
Production, Transportation and Moving Occupations
The most common Production, Transportation and Moving occupations in Ocean Isle Beach are Production (7 | 2.8%), and Transportation (6 | 2.4%).
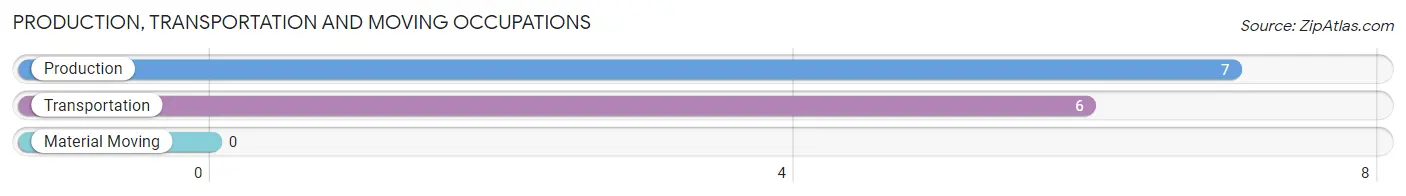
Production, Transportation and Moving Occupations by Sex
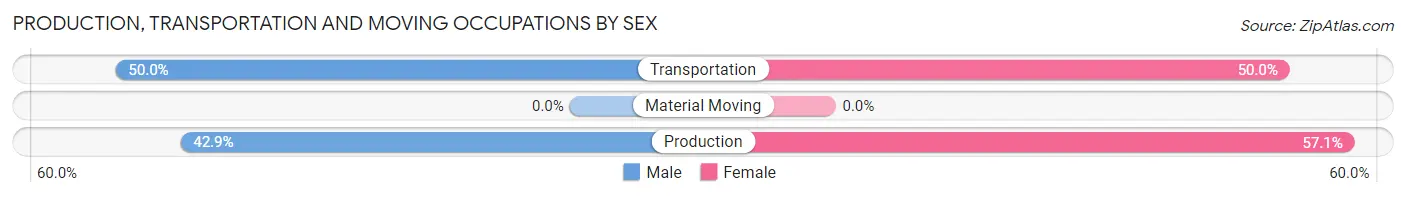
| Occupation | Male | Female |
| Production | 3 (42.9%) | 4 (57.1%) |
| Transportation | 3 (50.0%) | 3 (50.0%) |
| Material Moving | 0 (0.0%) | 0 (0.0%) |
| Total (Category) | 6 (46.2%) | 7 (53.8%) |
| Total (Overall) | 134 (54.0%) | 114 (46.0%) |
Employment Industries by Sex in Ocean Isle Beach
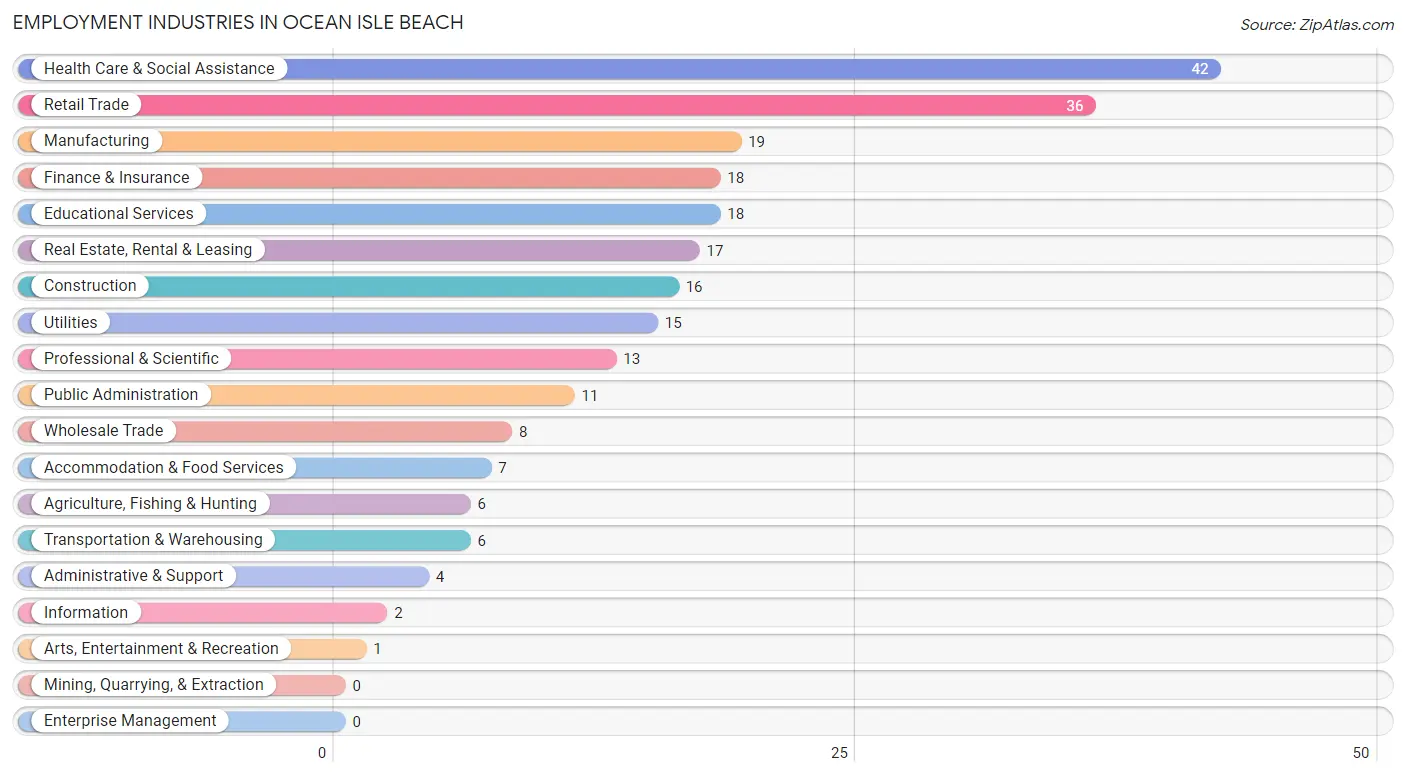
Employment Industries in Ocean Isle Beach
The major employment industries in Ocean Isle Beach include Health Care & Social Assistance (42 | 16.9%), Retail Trade (36 | 14.5%), Manufacturing (19 | 7.7%), Finance & Insurance (18 | 7.3%), and Educational Services (18 | 7.3%).
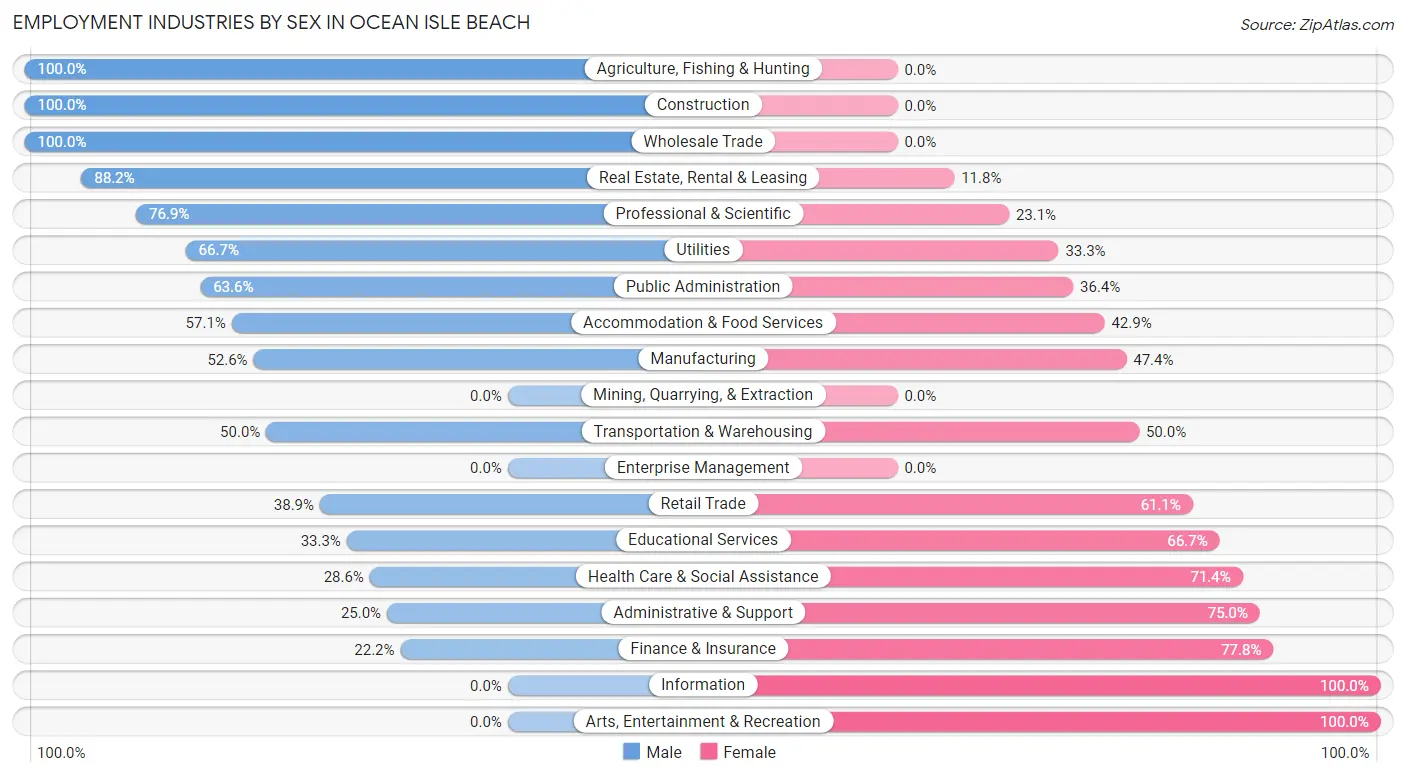
Employment Industries by Sex in Ocean Isle Beach
The Ocean Isle Beach industries that see more men than women are Agriculture, Fishing & Hunting (100.0%), Construction (100.0%), and Wholesale Trade (100.0%), whereas the industries that tend to have a higher number of women are Information (100.0%), Arts, Entertainment & Recreation (100.0%), and Finance & Insurance (77.8%).
| Industry | Male | Female |
| Agriculture, Fishing & Hunting | 6 (100.0%) | 0 (0.0%) |
| Mining, Quarrying, & Extraction | 0 (0.0%) | 0 (0.0%) |
| Construction | 16 (100.0%) | 0 (0.0%) |
| Manufacturing | 10 (52.6%) | 9 (47.4%) |
| Wholesale Trade | 8 (100.0%) | 0 (0.0%) |
| Retail Trade | 14 (38.9%) | 22 (61.1%) |
| Transportation & Warehousing | 3 (50.0%) | 3 (50.0%) |
| Utilities | 10 (66.7%) | 5 (33.3%) |
| Information | 0 (0.0%) | 2 (100.0%) |
| Finance & Insurance | 4 (22.2%) | 14 (77.8%) |
| Real Estate, Rental & Leasing | 15 (88.2%) | 2 (11.8%) |
| Professional & Scientific | 10 (76.9%) | 3 (23.1%) |
| Enterprise Management | 0 (0.0%) | 0 (0.0%) |
| Administrative & Support | 1 (25.0%) | 3 (75.0%) |
| Educational Services | 6 (33.3%) | 12 (66.7%) |
| Health Care & Social Assistance | 12 (28.6%) | 30 (71.4%) |
| Arts, Entertainment & Recreation | 0 (0.0%) | 1 (100.0%) |
| Accommodation & Food Services | 4 (57.1%) | 3 (42.9%) |
| Public Administration | 7 (63.6%) | 4 (36.4%) |
| Total | 134 (54.0%) | 114 (46.0%) |
Education in Ocean Isle Beach
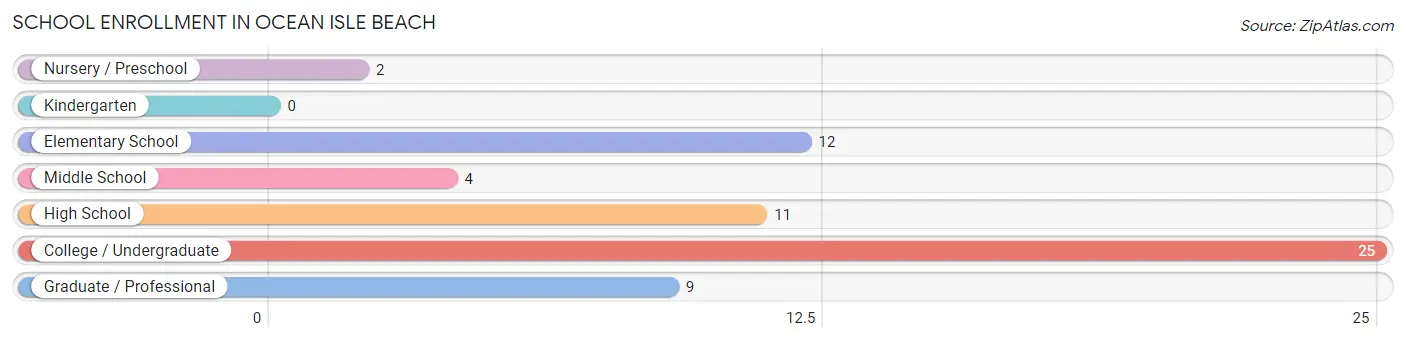
School Enrollment in Ocean Isle Beach
The most common levels of schooling among the 63 students in Ocean Isle Beach are college / undergraduate (25 | 39.7%), elementary school (12 | 19.1%), and high school (11 | 17.5%).
| School Level | # Students | % Students |
| Nursery / Preschool | 2 | 3.2% |
| Kindergarten | 0 | 0.0% |
| Elementary School | 12 | 19.1% |
| Middle School | 4 | 6.4% |
| High School | 11 | 17.5% |
| College / Undergraduate | 25 | 39.7% |
| Graduate / Professional | 9 | 14.3% |
| Total | 63 | 100.0% |
School Enrollment by Age by Funding Source in Ocean Isle Beach
Out of a total of 63 students who are enrolled in schools in Ocean Isle Beach, 13 (20.6%) attend a private institution, while the remaining 50 (79.4%) are enrolled in public schools. The age group of 3 to 4 year olds has the highest likelihood of being enrolled in private schools, with 2 (100.0% in the age bracket) enrolled. Conversely, the age group of 15 to 17 year olds has the lowest likelihood of being enrolled in a private school, with 11 (100.0% in the age bracket) attending a public institution.
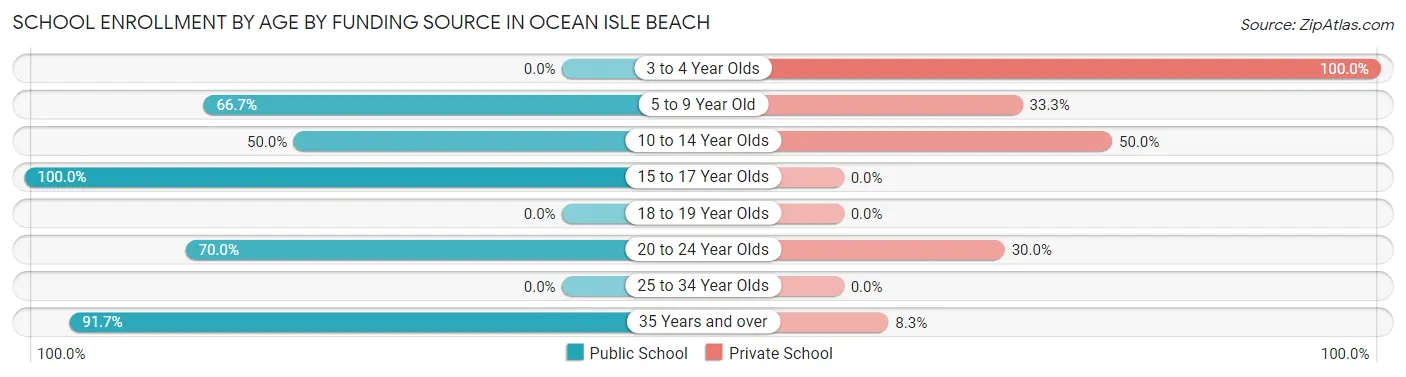
| Age Bracket | Public School | Private School |
| 3 to 4 Year Olds | 0 (0.0%) | 2 (100.0%) |
| 5 to 9 Year Old | 8 (66.7%) | 4 (33.3%) |
| 10 to 14 Year Olds | 2 (50.0%) | 2 (50.0%) |
| 15 to 17 Year Olds | 11 (100.0%) | 0 (0.0%) |
| 18 to 19 Year Olds | 0 (0.0%) | 0 (0.0%) |
| 20 to 24 Year Olds | 7 (70.0%) | 3 (30.0%) |
| 25 to 34 Year Olds | 0 (0.0%) | 0 (0.0%) |
| 35 Years and over | 22 (91.7%) | 2 (8.3%) |
| Total | 50 (79.4%) | 13 (20.6%) |
Educational Attainment by Field of Study in Ocean Isle Beach
Education (105 | 23.5%), business (83 | 18.6%), science & technology (68 | 15.2%), social sciences (42 | 9.4%), and engineering (32 | 7.2%) are the most common fields of study among 447 individuals in Ocean Isle Beach who have obtained a bachelor's degree or higher.
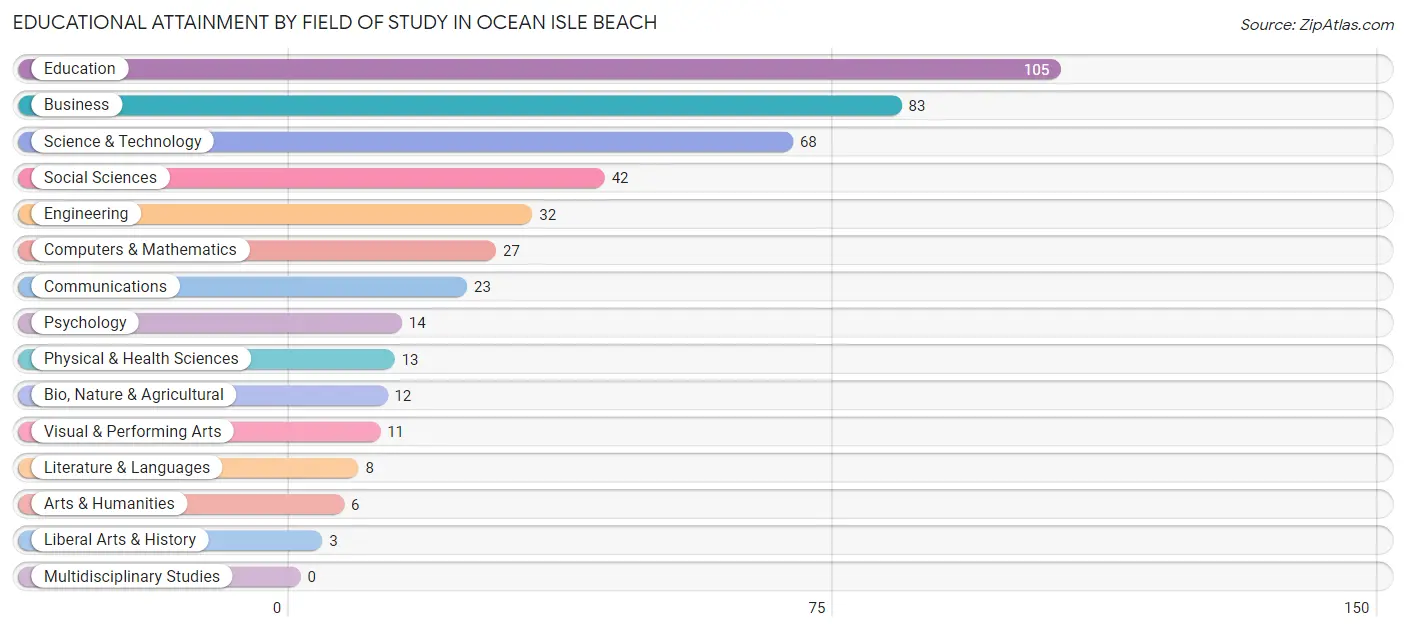
| Field of Study | # Graduates | % Graduates |
| Computers & Mathematics | 27 | 6.0% |
| Bio, Nature & Agricultural | 12 | 2.7% |
| Physical & Health Sciences | 13 | 2.9% |
| Psychology | 14 | 3.1% |
| Social Sciences | 42 | 9.4% |
| Engineering | 32 | 7.2% |
| Multidisciplinary Studies | 0 | 0.0% |
| Science & Technology | 68 | 15.2% |
| Business | 83 | 18.6% |
| Education | 105 | 23.5% |
| Literature & Languages | 8 | 1.8% |
| Liberal Arts & History | 3 | 0.7% |
| Visual & Performing Arts | 11 | 2.5% |
| Communications | 23 | 5.1% |
| Arts & Humanities | 6 | 1.3% |
| Total | 447 | 100.0% |
Transportation & Commute in Ocean Isle Beach
Vehicle Availability by Sex in Ocean Isle Beach
The most prevalent vehicle ownership categories in Ocean Isle Beach are males with 2 vehicles (75, accounting for 56.0%) and females with 2 vehicles (64, making up 74.3%).
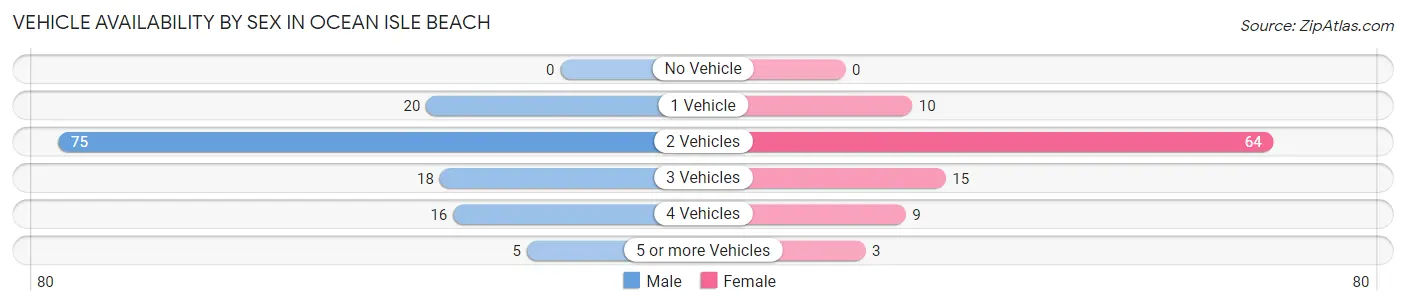
| Vehicles Available | Male | Female |
| No Vehicle | 0 (0.0%) | 0 (0.0%) |
| 1 Vehicle | 20 (14.9%) | 10 (9.9%) |
| 2 Vehicles | 75 (56.0%) | 64 (63.4%) |
| 3 Vehicles | 18 (13.4%) | 15 (14.8%) |
| 4 Vehicles | 16 (11.9%) | 9 (8.9%) |
| 5 or more Vehicles | 5 (3.7%) | 3 (3.0%) |
| Total | 134 (100.0%) | 101 (100.0%) |
Commute Time in Ocean Isle Beach
The most frequently occuring commute durations in Ocean Isle Beach are 10 to 14 minutes (51 commuters, 29.8%), 15 to 19 minutes (27 commuters, 15.8%), and 5 to 9 minutes (19 commuters, 11.1%).
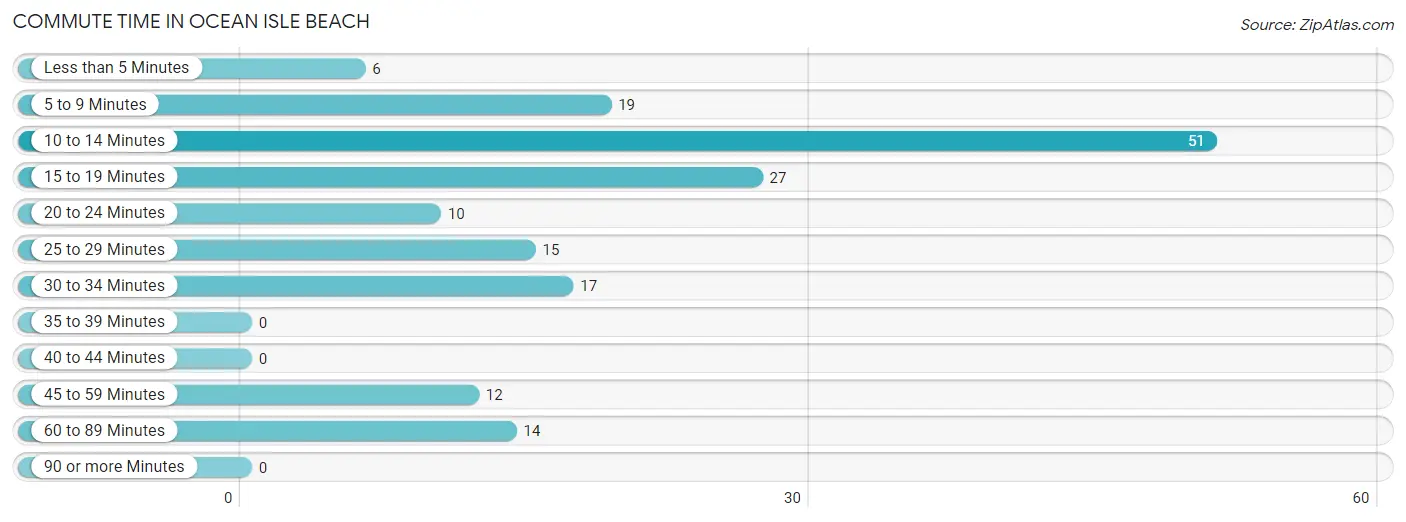
| Commute Time | # Commuters | % Commuters |
| Less than 5 Minutes | 6 | 3.5% |
| 5 to 9 Minutes | 19 | 11.1% |
| 10 to 14 Minutes | 51 | 29.8% |
| 15 to 19 Minutes | 27 | 15.8% |
| 20 to 24 Minutes | 10 | 5.9% |
| 25 to 29 Minutes | 15 | 8.8% |
| 30 to 34 Minutes | 17 | 9.9% |
| 35 to 39 Minutes | 0 | 0.0% |
| 40 to 44 Minutes | 0 | 0.0% |
| 45 to 59 Minutes | 12 | 7.0% |
| 60 to 89 Minutes | 14 | 8.2% |
| 90 or more Minutes | 0 | 0.0% |
Commute Time by Sex in Ocean Isle Beach
The most common commute times in Ocean Isle Beach are 10 to 14 minutes (20 commuters, 22.0%) for males and 10 to 14 minutes (31 commuters, 38.8%) for females.
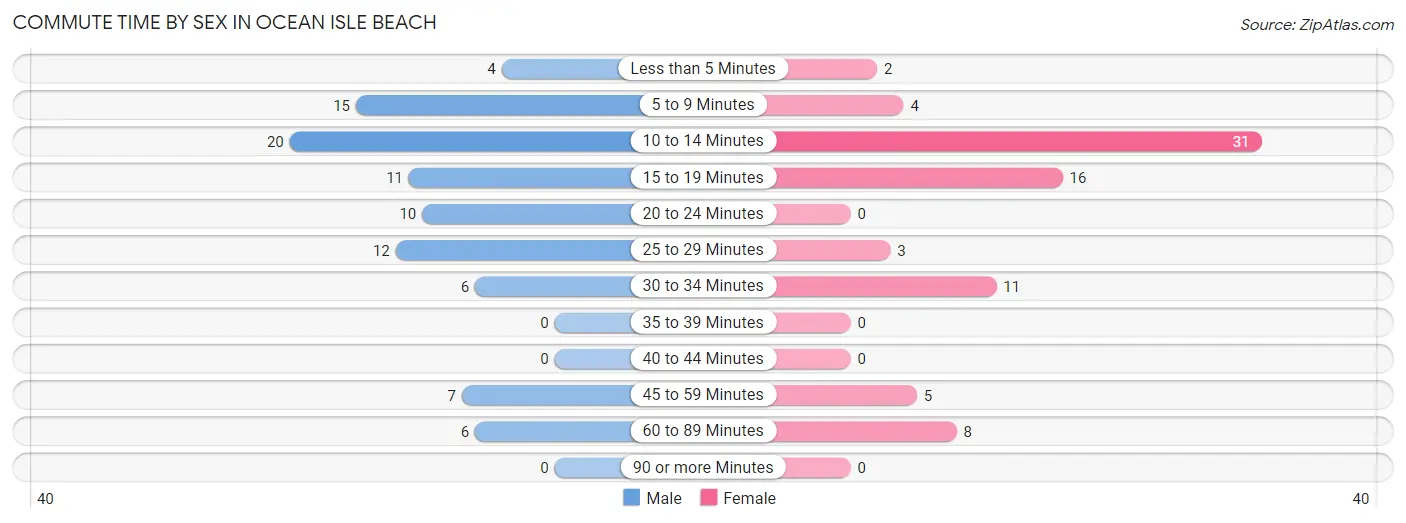
| Commute Time | Male | Female |
| Less than 5 Minutes | 4 (4.4%) | 2 (2.5%) |
| 5 to 9 Minutes | 15 (16.5%) | 4 (5.0%) |
| 10 to 14 Minutes | 20 (22.0%) | 31 (38.8%) |
| 15 to 19 Minutes | 11 (12.1%) | 16 (20.0%) |
| 20 to 24 Minutes | 10 (11.0%) | 0 (0.0%) |
| 25 to 29 Minutes | 12 (13.2%) | 3 (3.7%) |
| 30 to 34 Minutes | 6 (6.6%) | 11 (13.8%) |
| 35 to 39 Minutes | 0 (0.0%) | 0 (0.0%) |
| 40 to 44 Minutes | 0 (0.0%) | 0 (0.0%) |
| 45 to 59 Minutes | 7 (7.7%) | 5 (6.2%) |
| 60 to 89 Minutes | 6 (6.6%) | 8 (10.0%) |
| 90 or more Minutes | 0 (0.0%) | 0 (0.0%) |
Time of Departure to Work by Sex in Ocean Isle Beach
The most frequent times of departure to work in Ocean Isle Beach are 6:00 AM to 6:29 AM (16, 17.6%) for males and 9:00 AM to 9:59 AM (17, 21.2%) for females.
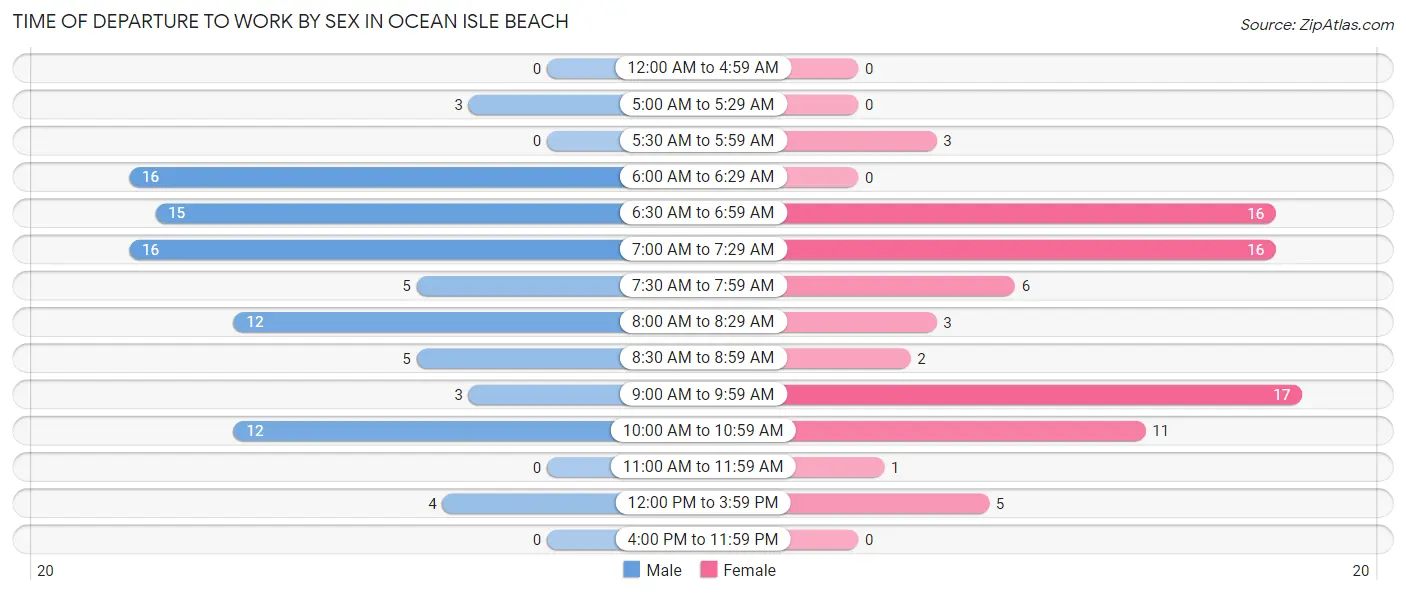
| Time of Departure | Male | Female |
| 12:00 AM to 4:59 AM | 0 (0.0%) | 0 (0.0%) |
| 5:00 AM to 5:29 AM | 3 (3.3%) | 0 (0.0%) |
| 5:30 AM to 5:59 AM | 0 (0.0%) | 3 (3.7%) |
| 6:00 AM to 6:29 AM | 16 (17.6%) | 0 (0.0%) |
| 6:30 AM to 6:59 AM | 15 (16.5%) | 16 (20.0%) |
| 7:00 AM to 7:29 AM | 16 (17.6%) | 16 (20.0%) |
| 7:30 AM to 7:59 AM | 5 (5.5%) | 6 (7.5%) |
| 8:00 AM to 8:29 AM | 12 (13.2%) | 3 (3.7%) |
| 8:30 AM to 8:59 AM | 5 (5.5%) | 2 (2.5%) |
| 9:00 AM to 9:59 AM | 3 (3.3%) | 17 (21.2%) |
| 10:00 AM to 10:59 AM | 12 (13.2%) | 11 (13.8%) |
| 11:00 AM to 11:59 AM | 0 (0.0%) | 1 (1.3%) |
| 12:00 PM to 3:59 PM | 4 (4.4%) | 5 (6.2%) |
| 4:00 PM to 11:59 PM | 0 (0.0%) | 0 (0.0%) |
| Total | 91 (100.0%) | 80 (100.0%) |
Housing Occupancy in Ocean Isle Beach
Occupancy by Ownership in Ocean Isle Beach
Of the total 432 dwellings in Ocean Isle Beach, owner-occupied units account for 418 (96.8%), while renter-occupied units make up 14 (3.2%).
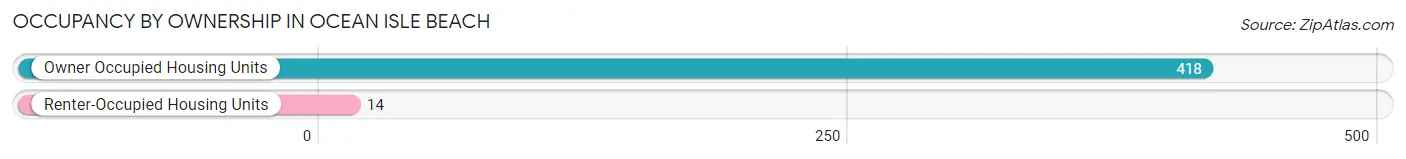
| Occupancy | # Housing Units | % Housing Units |
| Owner Occupied Housing Units | 418 | 96.8% |
| Renter-Occupied Housing Units | 14 | 3.2% |
| Total Occupied Housing Units | 432 | 100.0% |
Occupancy by Household Size in Ocean Isle Beach
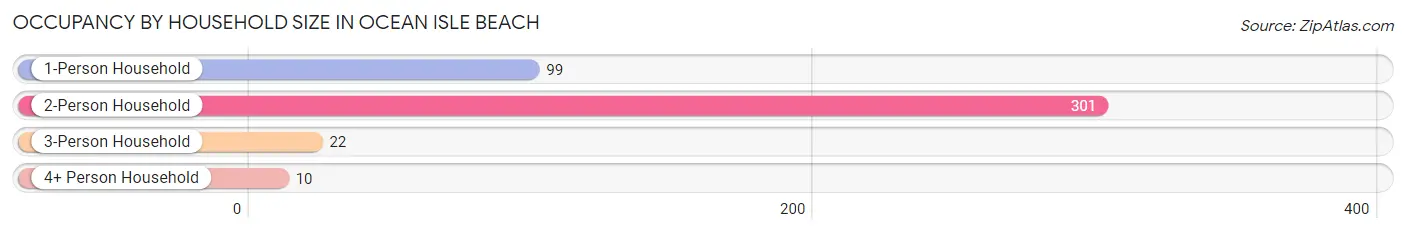
| Household Size | # Housing Units | % Housing Units |
| 1-Person Household | 99 | 22.9% |
| 2-Person Household | 301 | 69.7% |
| 3-Person Household | 22 | 5.1% |
| 4+ Person Household | 10 | 2.3% |
| Total Housing Units | 432 | 100.0% |
Occupancy by Ownership by Household Size in Ocean Isle Beach
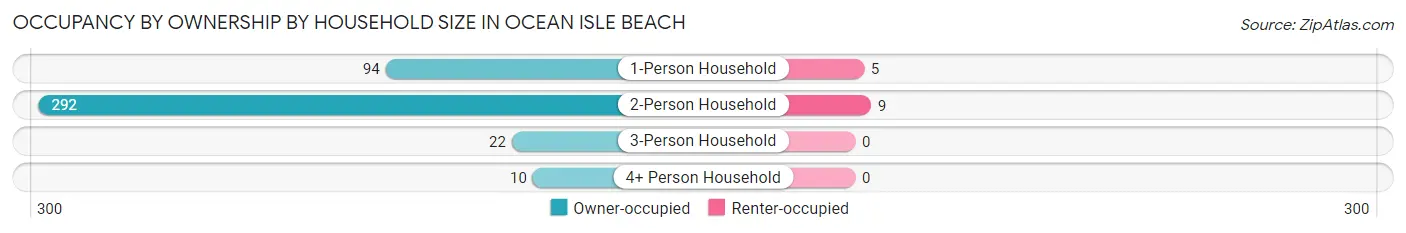
| Household Size | Owner-occupied | Renter-occupied |
| 1-Person Household | 94 (95.0%) | 5 (5.1%) |
| 2-Person Household | 292 (97.0%) | 9 (3.0%) |
| 3-Person Household | 22 (100.0%) | 0 (0.0%) |
| 4+ Person Household | 10 (100.0%) | 0 (0.0%) |
| Total Housing Units | 418 (96.8%) | 14 (3.2%) |
Occupancy by Educational Attainment in Ocean Isle Beach
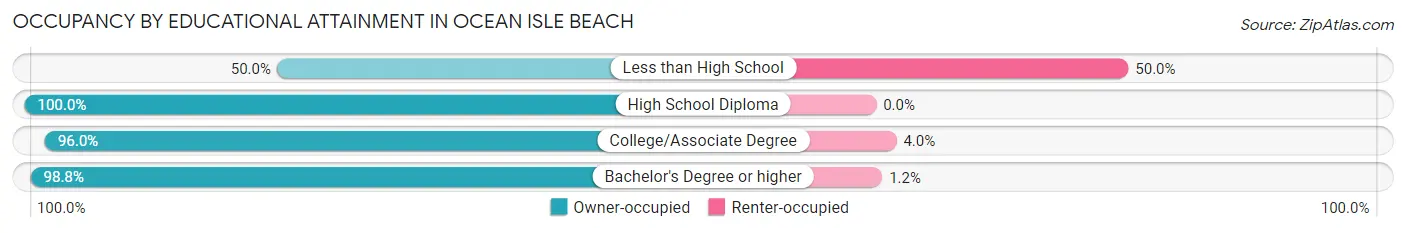
| Household Size | Owner-occupied | Renter-occupied |
| Less than High School | 6 (50.0%) | 6 (50.0%) |
| High School Diploma | 47 (100.0%) | 0 (0.0%) |
| College/Associate Degree | 119 (96.0%) | 5 (4.0%) |
| Bachelor's Degree or higher | 246 (98.8%) | 3 (1.2%) |
Occupancy by Age of Householder in Ocean Isle Beach
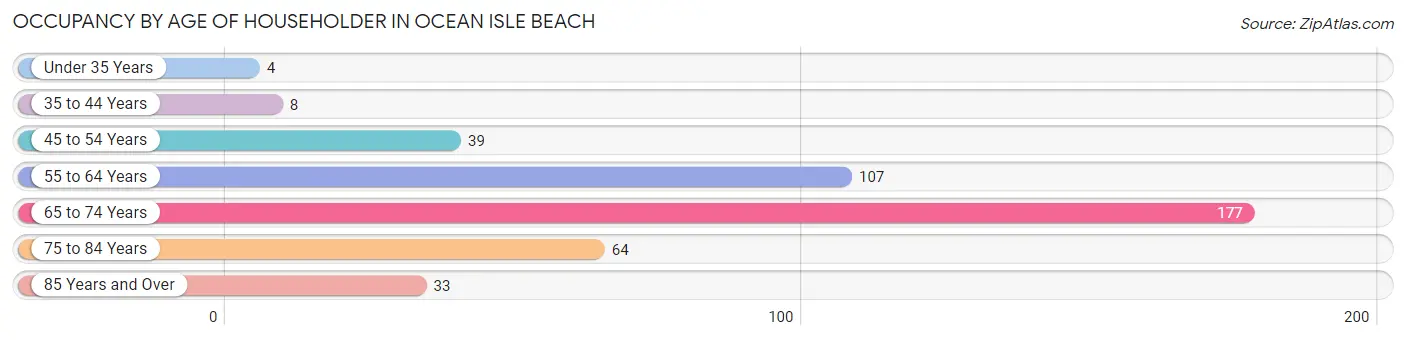
| Age Bracket | # Households | % Households |
| Under 35 Years | 4 | 0.9% |
| 35 to 44 Years | 8 | 1.8% |
| 45 to 54 Years | 39 | 9.0% |
| 55 to 64 Years | 107 | 24.8% |
| 65 to 74 Years | 177 | 41.0% |
| 75 to 84 Years | 64 | 14.8% |
| 85 Years and Over | 33 | 7.6% |
| Total | 432 | 100.0% |
Housing Finances in Ocean Isle Beach
Median Income by Occupancy in Ocean Isle Beach
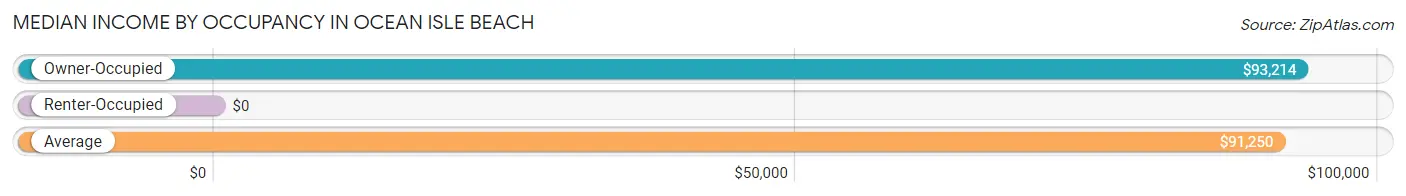
| Occupancy Type | # Households | Median Income |
| Owner-Occupied | 418 (96.8%) | $93,214 |
| Renter-Occupied | 14 (3.2%) | $0 |
| Average | 432 (100.0%) | $91,250 |
Occupancy by Householder Income Bracket in Ocean Isle Beach
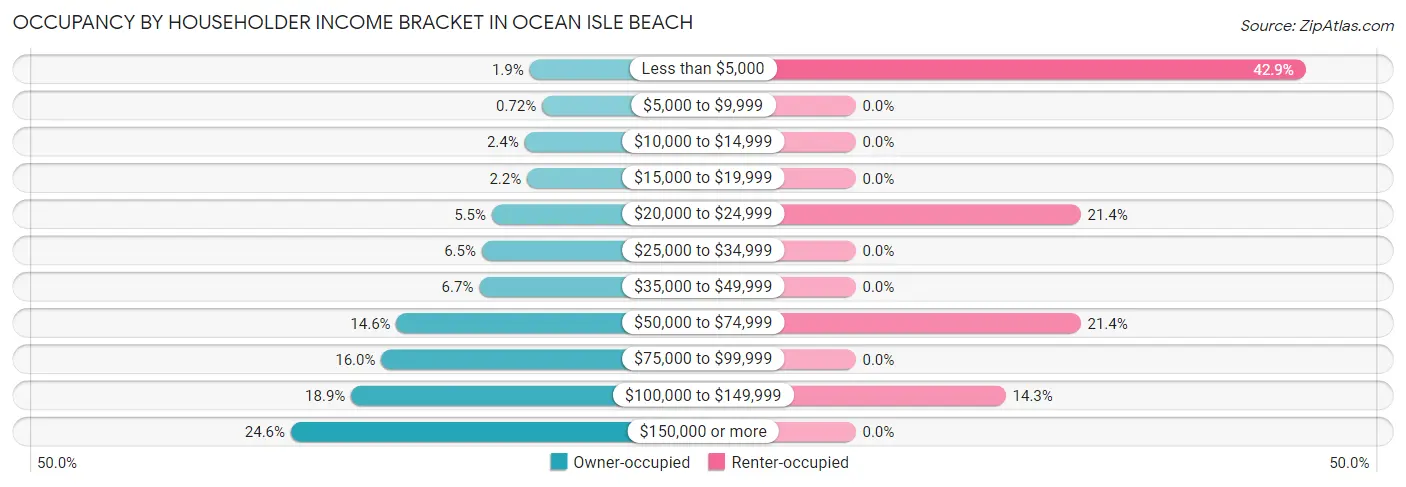
| Income Bracket | Owner-occupied | Renter-occupied |
| Less than $5,000 | 8 (1.9%) | 6 (42.9%) |
| $5,000 to $9,999 | 3 (0.7%) | 0 (0.0%) |
| $10,000 to $14,999 | 10 (2.4%) | 0 (0.0%) |
| $15,000 to $19,999 | 9 (2.1%) | 0 (0.0%) |
| $20,000 to $24,999 | 23 (5.5%) | 3 (21.4%) |
| $25,000 to $34,999 | 27 (6.5%) | 0 (0.0%) |
| $35,000 to $49,999 | 28 (6.7%) | 0 (0.0%) |
| $50,000 to $74,999 | 61 (14.6%) | 3 (21.4%) |
| $75,000 to $99,999 | 67 (16.0%) | 0 (0.0%) |
| $100,000 to $149,999 | 79 (18.9%) | 2 (14.3%) |
| $150,000 or more | 103 (24.6%) | 0 (0.0%) |
| Total | 418 (100.0%) | 14 (100.0%) |
Monthly Housing Cost Tiers in Ocean Isle Beach
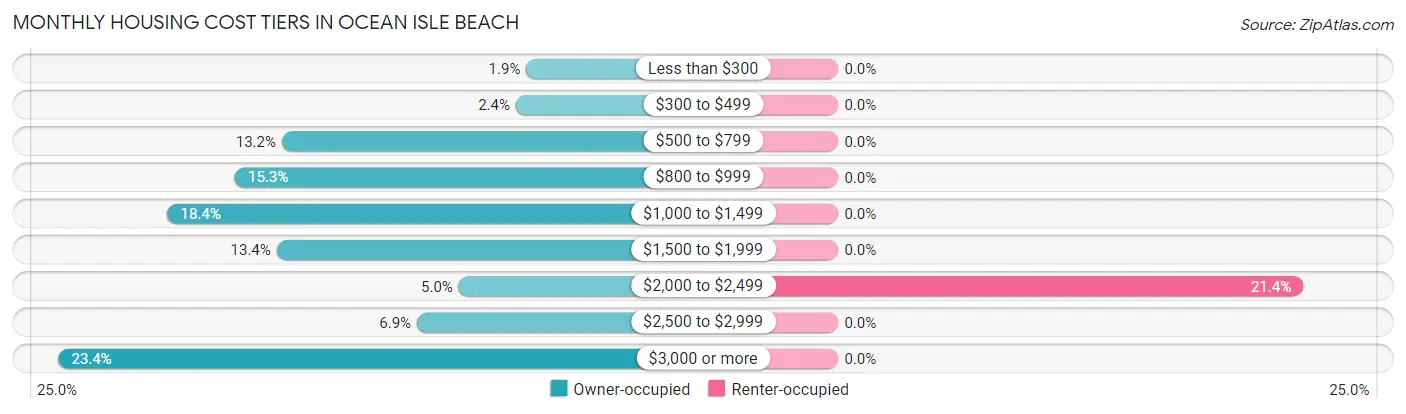
| Monthly Cost | Owner-occupied | Renter-occupied |
| Less than $300 | 8 (1.9%) | 0 (0.0%) |
| $300 to $499 | 10 (2.4%) | 0 (0.0%) |
| $500 to $799 | 55 (13.2%) | 0 (0.0%) |
| $800 to $999 | 64 (15.3%) | 0 (0.0%) |
| $1,000 to $1,499 | 77 (18.4%) | 0 (0.0%) |
| $1,500 to $1,999 | 56 (13.4%) | 0 (0.0%) |
| $2,000 to $2,499 | 21 (5.0%) | 3 (21.4%) |
| $2,500 to $2,999 | 29 (6.9%) | 0 (0.0%) |
| $3,000 or more | 98 (23.4%) | 0 (0.0%) |
| Total | 418 (100.0%) | 14 (100.0%) |
Physical Housing Characteristics in Ocean Isle Beach
Housing Structures in Ocean Isle Beach
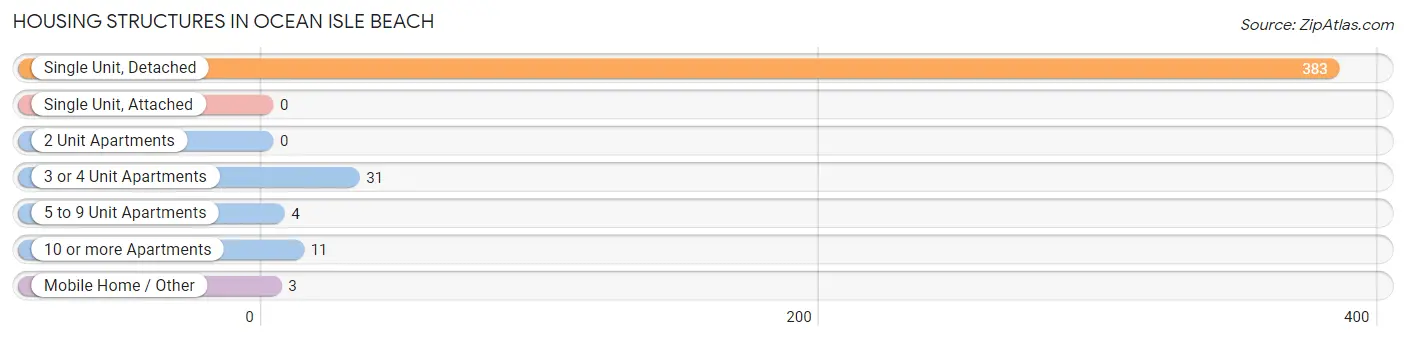
| Structure Type | # Housing Units | % Housing Units |
| Single Unit, Detached | 383 | 88.7% |
| Single Unit, Attached | 0 | 0.0% |
| 2 Unit Apartments | 0 | 0.0% |
| 3 or 4 Unit Apartments | 31 | 7.2% |
| 5 to 9 Unit Apartments | 4 | 0.9% |
| 10 or more Apartments | 11 | 2.5% |
| Mobile Home / Other | 3 | 0.7% |
| Total | 432 | 100.0% |
Housing Structures by Occupancy in Ocean Isle Beach
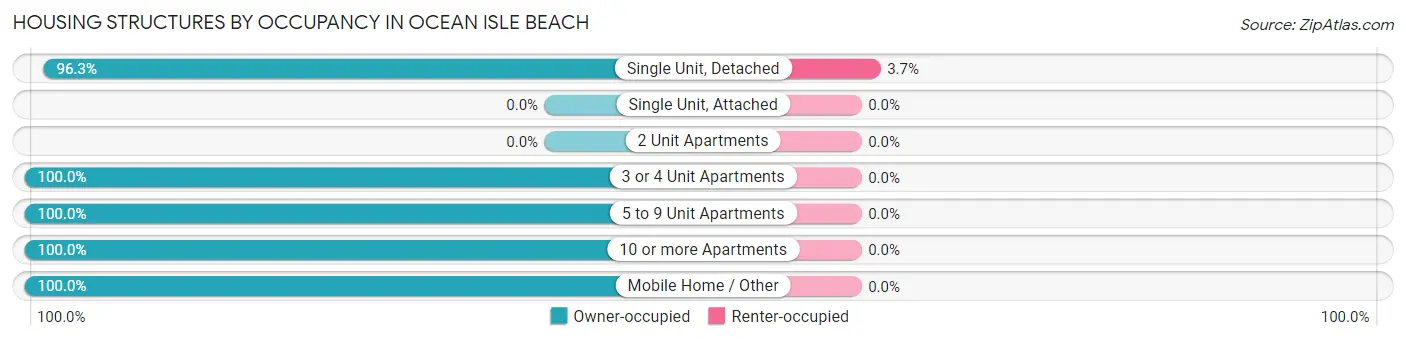
| Structure Type | Owner-occupied | Renter-occupied |
| Single Unit, Detached | 369 (96.3%) | 14 (3.7%) |
| Single Unit, Attached | 0 (0.0%) | 0 (0.0%) |
| 2 Unit Apartments | 0 (0.0%) | 0 (0.0%) |
| 3 or 4 Unit Apartments | 31 (100.0%) | 0 (0.0%) |
| 5 to 9 Unit Apartments | 4 (100.0%) | 0 (0.0%) |
| 10 or more Apartments | 11 (100.0%) | 0 (0.0%) |
| Mobile Home / Other | 3 (100.0%) | 0 (0.0%) |
| Total | 418 (96.8%) | 14 (3.2%) |
Housing Structures by Number of Rooms in Ocean Isle Beach
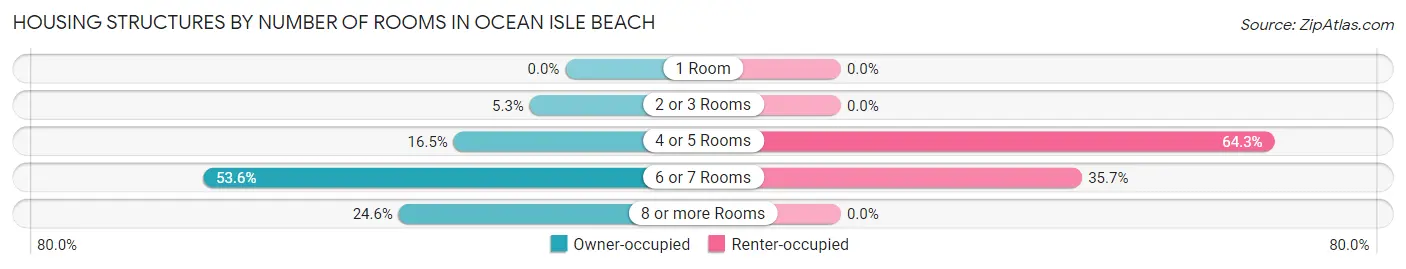
| Number of Rooms | Owner-occupied | Renter-occupied |
| 1 Room | 0 (0.0%) | 0 (0.0%) |
| 2 or 3 Rooms | 22 (5.3%) | 0 (0.0%) |
| 4 or 5 Rooms | 69 (16.5%) | 9 (64.3%) |
| 6 or 7 Rooms | 224 (53.6%) | 5 (35.7%) |
| 8 or more Rooms | 103 (24.6%) | 0 (0.0%) |
| Total | 418 (100.0%) | 14 (100.0%) |
Housing Structure by Heating Type in Ocean Isle Beach
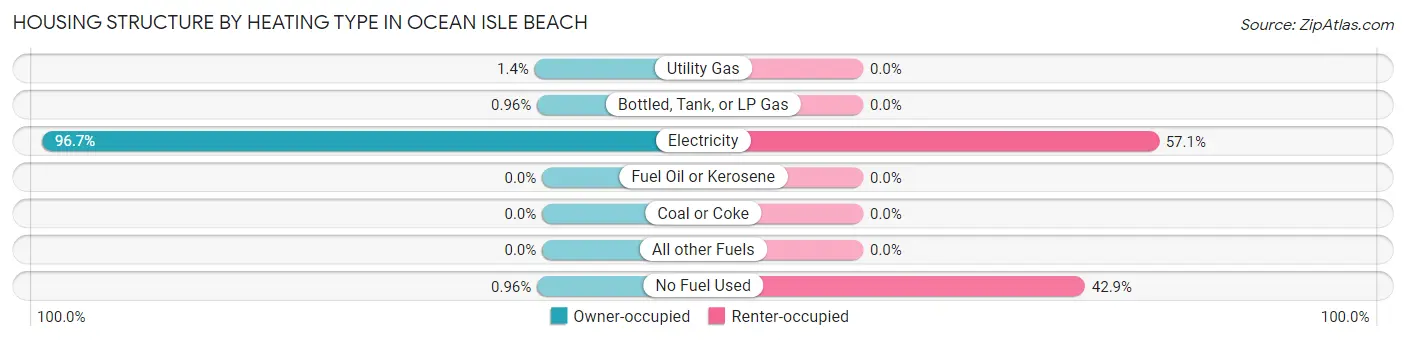
| Heating Type | Owner-occupied | Renter-occupied |
| Utility Gas | 6 (1.4%) | 0 (0.0%) |
| Bottled, Tank, or LP Gas | 4 (1.0%) | 0 (0.0%) |
| Electricity | 404 (96.7%) | 8 (57.1%) |
| Fuel Oil or Kerosene | 0 (0.0%) | 0 (0.0%) |
| Coal or Coke | 0 (0.0%) | 0 (0.0%) |
| All other Fuels | 0 (0.0%) | 0 (0.0%) |
| No Fuel Used | 4 (1.0%) | 6 (42.9%) |
| Total | 418 (100.0%) | 14 (100.0%) |
Household Vehicle Usage in Ocean Isle Beach
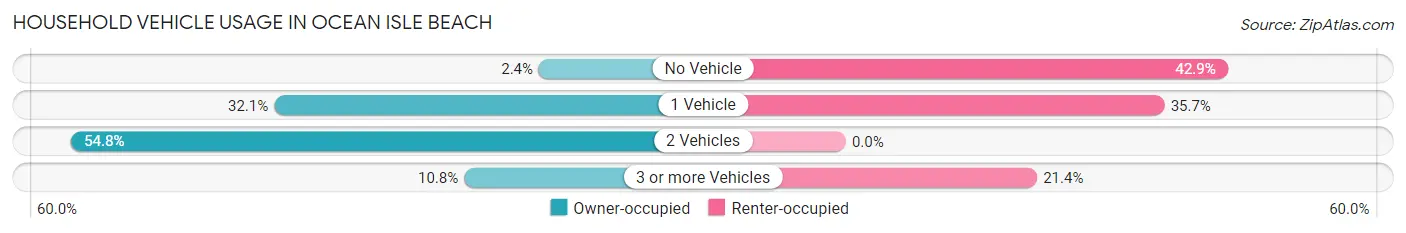
| Vehicles per Household | Owner-occupied | Renter-occupied |
| No Vehicle | 10 (2.4%) | 6 (42.9%) |
| 1 Vehicle | 134 (32.1%) | 5 (35.7%) |
| 2 Vehicles | 229 (54.8%) | 0 (0.0%) |
| 3 or more Vehicles | 45 (10.8%) | 3 (21.4%) |
| Total | 418 (100.0%) | 14 (100.0%) |
Real Estate & Mortgages in Ocean Isle Beach
Real Estate and Mortgage Overview in Ocean Isle Beach
| Characteristic | Without Mortgage | With Mortgage |
| Housing Units | 212 | 206 |
| Median Property Value | $661,300 | $663,500 |
| Median Household Income | $90,000 | $68 |
| Monthly Housing Costs | $882 | $98 |
| Real Estate Taxes | $3,545 | $0 |
Property Value by Mortgage Status in Ocean Isle Beach
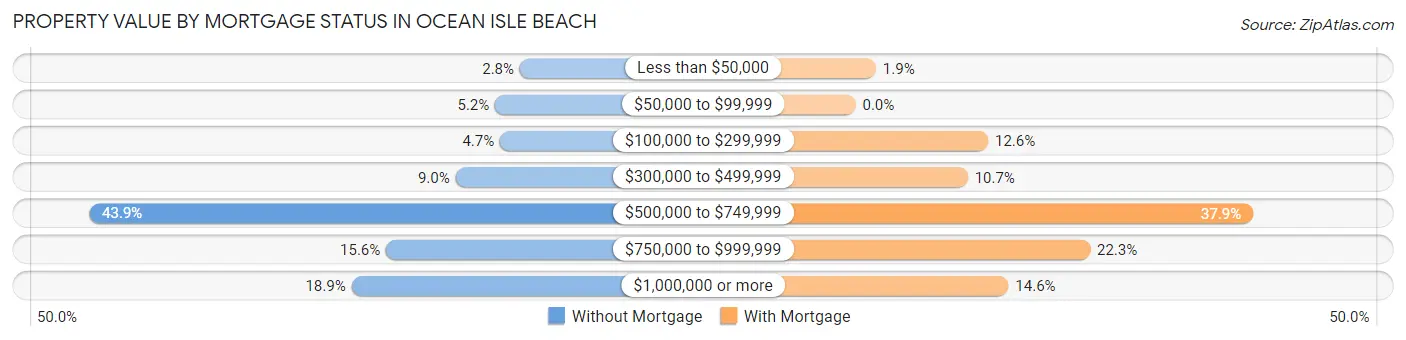
| Property Value | Without Mortgage | With Mortgage |
| Less than $50,000 | 6 (2.8%) | 4 (1.9%) |
| $50,000 to $99,999 | 11 (5.2%) | 0 (0.0%) |
| $100,000 to $299,999 | 10 (4.7%) | 26 (12.6%) |
| $300,000 to $499,999 | 19 (9.0%) | 22 (10.7%) |
| $500,000 to $749,999 | 93 (43.9%) | 78 (37.9%) |
| $750,000 to $999,999 | 33 (15.6%) | 46 (22.3%) |
| $1,000,000 or more | 40 (18.9%) | 30 (14.6%) |
| Total | 212 (100.0%) | 206 (100.0%) |
Household Income by Mortgage Status in Ocean Isle Beach
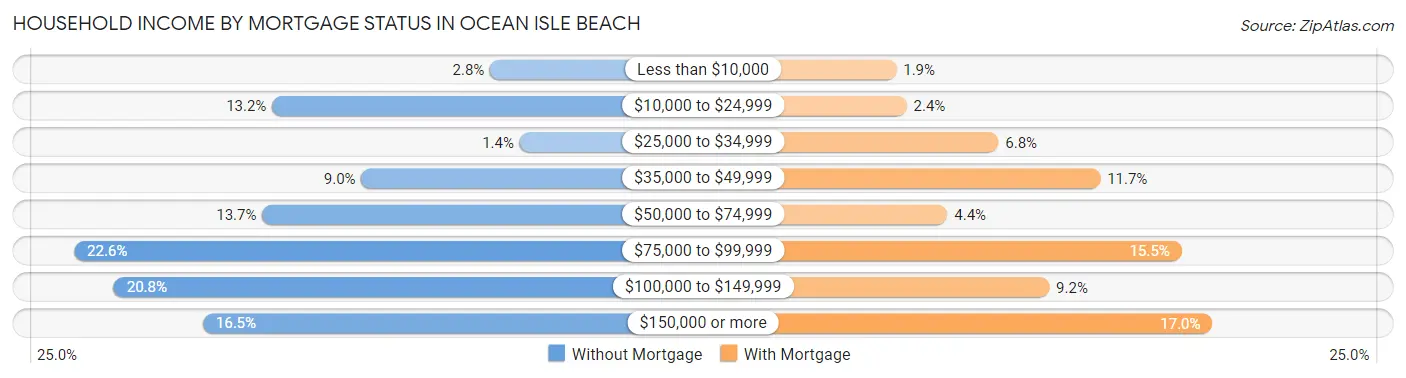
| Household Income | Without Mortgage | With Mortgage |
| Less than $10,000 | 6 (2.8%) | 4 (1.9%) |
| $10,000 to $24,999 | 28 (13.2%) | 5 (2.4%) |
| $25,000 to $34,999 | 3 (1.4%) | 14 (6.8%) |
| $35,000 to $49,999 | 19 (9.0%) | 24 (11.7%) |
| $50,000 to $74,999 | 29 (13.7%) | 9 (4.4%) |
| $75,000 to $99,999 | 48 (22.6%) | 32 (15.5%) |
| $100,000 to $149,999 | 44 (20.7%) | 19 (9.2%) |
| $150,000 or more | 35 (16.5%) | 35 (17.0%) |
| Total | 212 (100.0%) | 206 (100.0%) |
Property Value to Household Income Ratio in Ocean Isle Beach
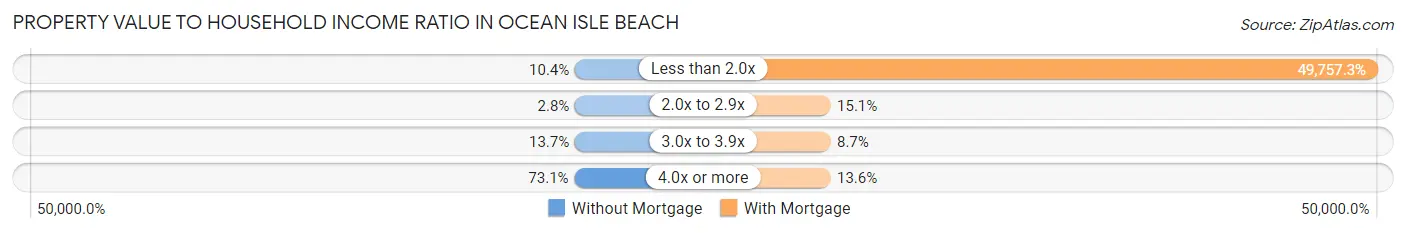
| Value-to-Income Ratio | Without Mortgage | With Mortgage |
| Less than 2.0x | 22 (10.4%) | 102,500 (49,757.3%) |
| 2.0x to 2.9x | 6 (2.8%) | 31 (15.0%) |
| 3.0x to 3.9x | 29 (13.7%) | 18 (8.7%) |
| 4.0x or more | 155 (73.1%) | 28 (13.6%) |
| Total | 212 (100.0%) | 206 (100.0%) |
Real Estate Taxes by Mortgage Status in Ocean Isle Beach
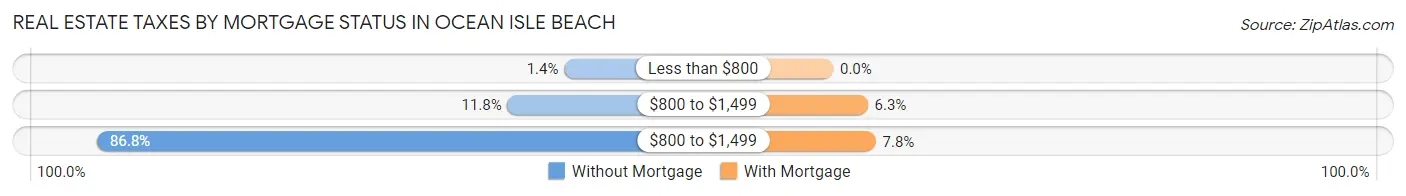
| Property Taxes | Without Mortgage | With Mortgage |
| Less than $800 | 3 (1.4%) | 0 (0.0%) |
| $800 to $1,499 | 25 (11.8%) | 13 (6.3%) |
| $800 to $1,499 | 184 (86.8%) | 16 (7.8%) |
| Total | 212 (100.0%) | 206 (100.0%) |
Health & Disability in Ocean Isle Beach
Health Insurance Coverage by Age in Ocean Isle Beach
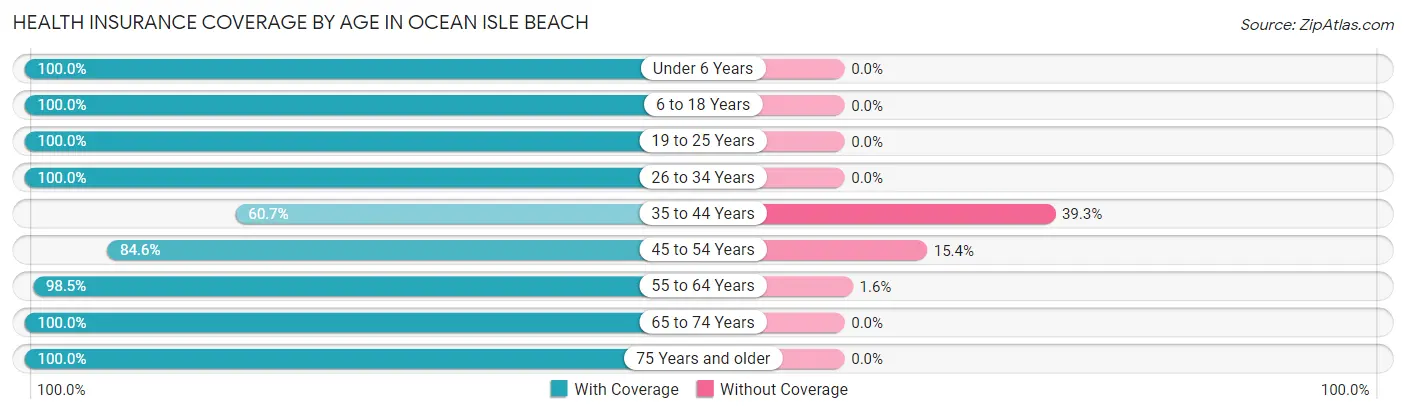
| Age Bracket | With Coverage | Without Coverage |
| Under 6 Years | 2 (100.0%) | 0 (0.0%) |
| 6 to 18 Years | 30 (100.0%) | 0 (0.0%) |
| 19 to 25 Years | 11 (100.0%) | 0 (0.0%) |
| 26 to 34 Years | 7 (100.0%) | 0 (0.0%) |
| 35 to 44 Years | 17 (60.7%) | 11 (39.3%) |
| 45 to 54 Years | 66 (84.6%) | 12 (15.4%) |
| 55 to 64 Years | 190 (98.5%) | 3 (1.5%) |
| 65 to 74 Years | 302 (100.0%) | 0 (0.0%) |
| 75 Years and older | 158 (100.0%) | 0 (0.0%) |
| Total | 783 (96.8%) | 26 (3.2%) |
Health Insurance Coverage by Citizenship Status in Ocean Isle Beach
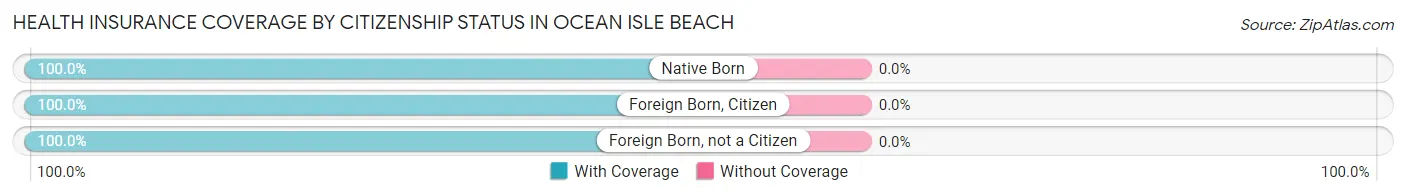
| Citizenship Status | With Coverage | Without Coverage |
| Native Born | 2 (100.0%) | 0 (0.0%) |
| Foreign Born, Citizen | 30 (100.0%) | 0 (0.0%) |
| Foreign Born, not a Citizen | 11 (100.0%) | 0 (0.0%) |
Health Insurance Coverage by Household Income in Ocean Isle Beach
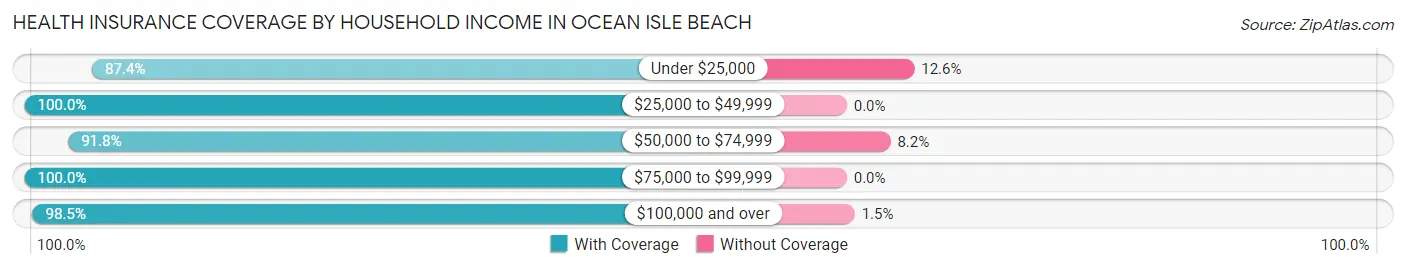
| Household Income | With Coverage | Without Coverage |
| Under $25,000 | 76 (87.4%) | 11 (12.6%) |
| $25,000 to $49,999 | 82 (100.0%) | 0 (0.0%) |
| $50,000 to $74,999 | 101 (91.8%) | 9 (8.2%) |
| $75,000 to $99,999 | 126 (100.0%) | 0 (0.0%) |
| $100,000 and over | 398 (98.5%) | 6 (1.5%) |
Public vs Private Health Insurance Coverage by Age in Ocean Isle Beach
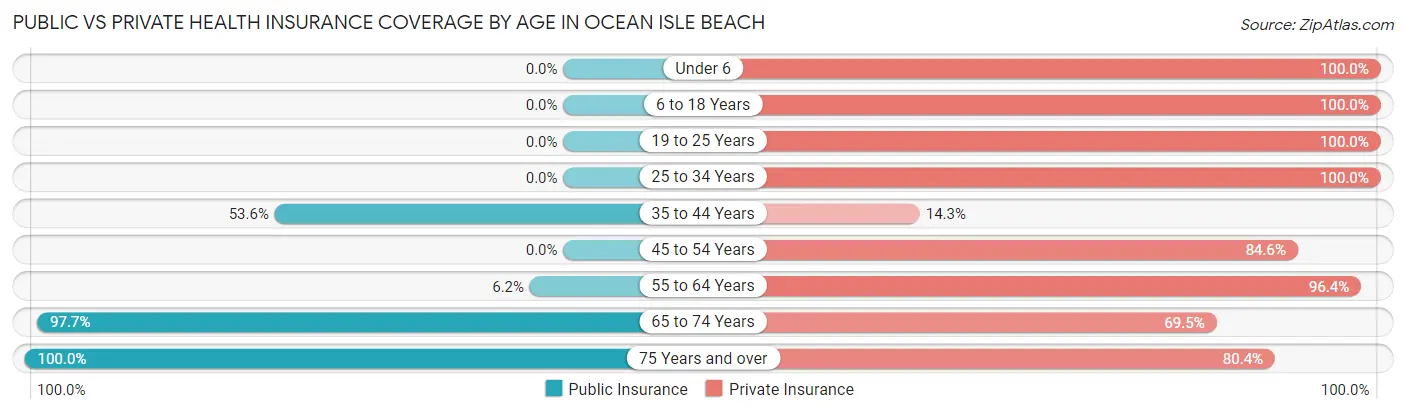
| Age Bracket | Public Insurance | Private Insurance |
| Under 6 | 0 (0.0%) | 2 (100.0%) |
| 6 to 18 Years | 0 (0.0%) | 30 (100.0%) |
| 19 to 25 Years | 0 (0.0%) | 11 (100.0%) |
| 25 to 34 Years | 0 (0.0%) | 7 (100.0%) |
| 35 to 44 Years | 15 (53.6%) | 4 (14.3%) |
| 45 to 54 Years | 0 (0.0%) | 66 (84.6%) |
| 55 to 64 Years | 12 (6.2%) | 186 (96.4%) |
| 65 to 74 Years | 295 (97.7%) | 210 (69.5%) |
| 75 Years and over | 158 (100.0%) | 127 (80.4%) |
| Total | 480 (59.3%) | 643 (79.5%) |
Disability Status by Sex by Age in Ocean Isle Beach
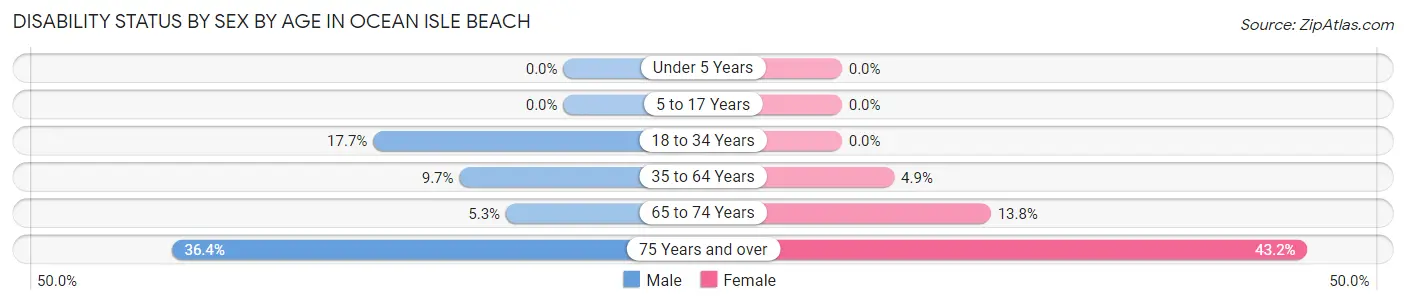
| Age Bracket | Male | Female |
| Under 5 Years | 0 (0.0%) | 0 (0.0%) |
| 5 to 17 Years | 0 (0.0%) | 0 (0.0%) |
| 18 to 34 Years | 3 (17.6%) | 0 (0.0%) |
| 35 to 64 Years | 11 (9.7%) | 9 (4.9%) |
| 65 to 74 Years | 8 (5.3%) | 21 (13.8%) |
| 75 Years and over | 28 (36.4%) | 35 (43.2%) |
Disability Class by Sex by Age in Ocean Isle Beach
Disability Class: Hearing Difficulty
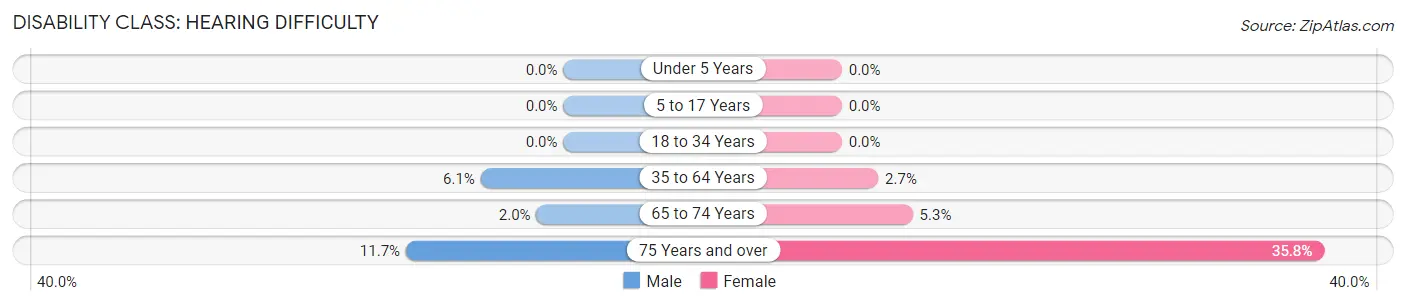
| Age Bracket | Male | Female |
| Under 5 Years | 0 (0.0%) | 0 (0.0%) |
| 5 to 17 Years | 0 (0.0%) | 0 (0.0%) |
| 18 to 34 Years | 0 (0.0%) | 0 (0.0%) |
| 35 to 64 Years | 7 (6.1%) | 5 (2.7%) |
| 65 to 74 Years | 3 (2.0%) | 8 (5.3%) |
| 75 Years and over | 9 (11.7%) | 29 (35.8%) |
Disability Class: Vision Difficulty
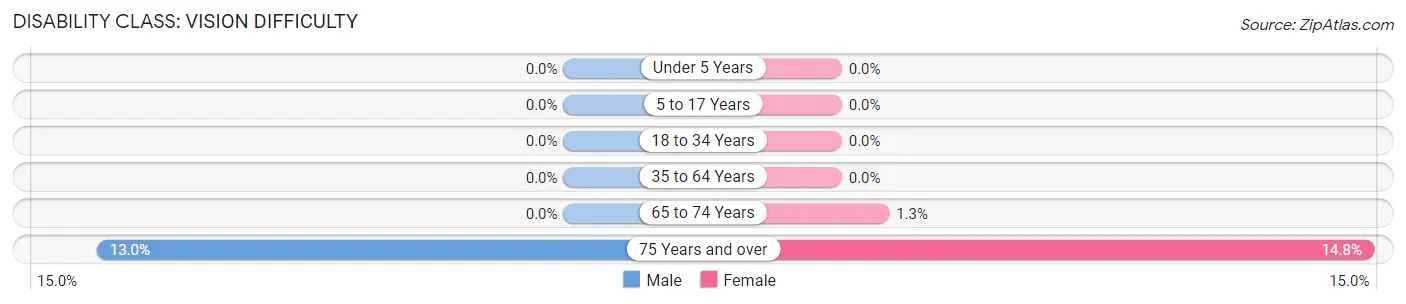
| Age Bracket | Male | Female |
| Under 5 Years | 0 (0.0%) | 0 (0.0%) |
| 5 to 17 Years | 0 (0.0%) | 0 (0.0%) |
| 18 to 34 Years | 0 (0.0%) | 0 (0.0%) |
| 35 to 64 Years | 0 (0.0%) | 0 (0.0%) |
| 65 to 74 Years | 0 (0.0%) | 2 (1.3%) |
| 75 Years and over | 10 (13.0%) | 12 (14.8%) |
Disability Class: Cognitive Difficulty
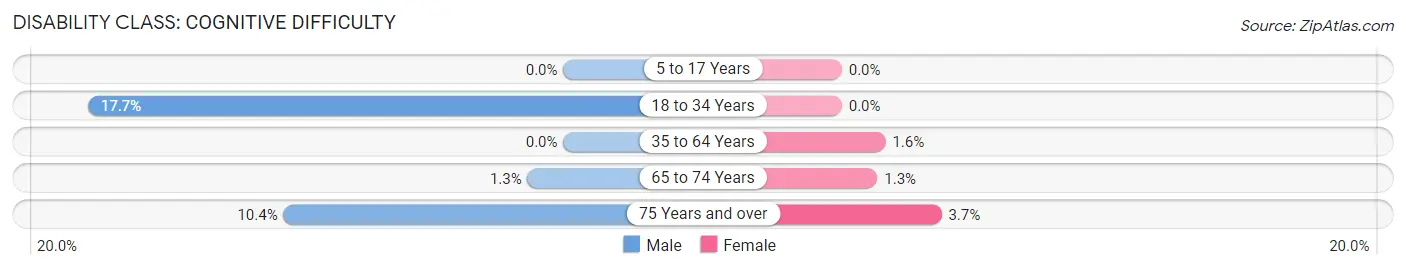
| Age Bracket | Male | Female |
| 5 to 17 Years | 0 (0.0%) | 0 (0.0%) |
| 18 to 34 Years | 3 (17.6%) | 0 (0.0%) |
| 35 to 64 Years | 0 (0.0%) | 3 (1.6%) |
| 65 to 74 Years | 2 (1.3%) | 2 (1.3%) |
| 75 Years and over | 8 (10.4%) | 3 (3.7%) |
Disability Class: Ambulatory Difficulty
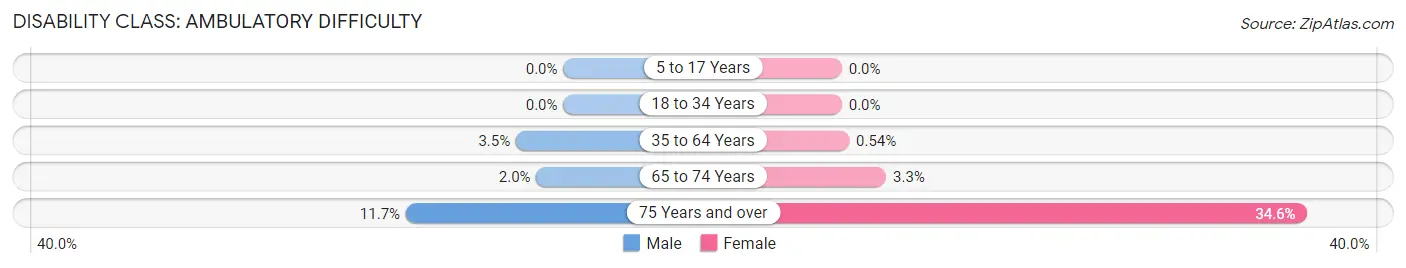
| Age Bracket | Male | Female |
| 5 to 17 Years | 0 (0.0%) | 0 (0.0%) |
| 18 to 34 Years | 0 (0.0%) | 0 (0.0%) |
| 35 to 64 Years | 4 (3.5%) | 1 (0.5%) |
| 65 to 74 Years | 3 (2.0%) | 5 (3.3%) |
| 75 Years and over | 9 (11.7%) | 28 (34.6%) |
Disability Class: Self-Care Difficulty
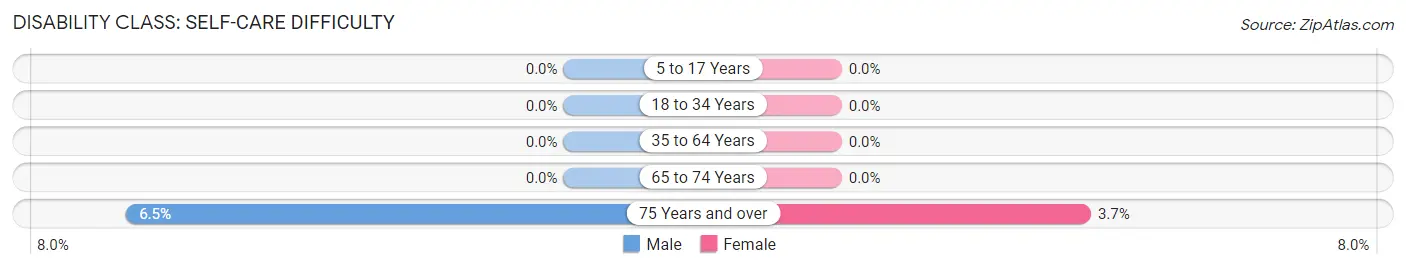
| Age Bracket | Male | Female |
| 5 to 17 Years | 0 (0.0%) | 0 (0.0%) |
| 18 to 34 Years | 0 (0.0%) | 0 (0.0%) |
| 35 to 64 Years | 0 (0.0%) | 0 (0.0%) |
| 65 to 74 Years | 0 (0.0%) | 0 (0.0%) |
| 75 Years and over | 5 (6.5%) | 3 (3.7%) |
Technology Access in Ocean Isle Beach
Computing Device Access in Ocean Isle Beach
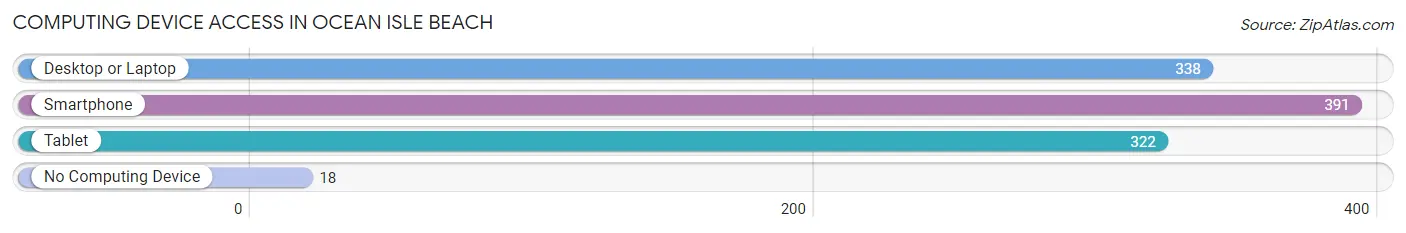
| Device Type | # Households | % Households |
| Desktop or Laptop | 338 | 78.2% |
| Smartphone | 391 | 90.5% |
| Tablet | 322 | 74.5% |
| No Computing Device | 18 | 4.2% |
| Total | 432 | 100.0% |
Internet Access in Ocean Isle Beach
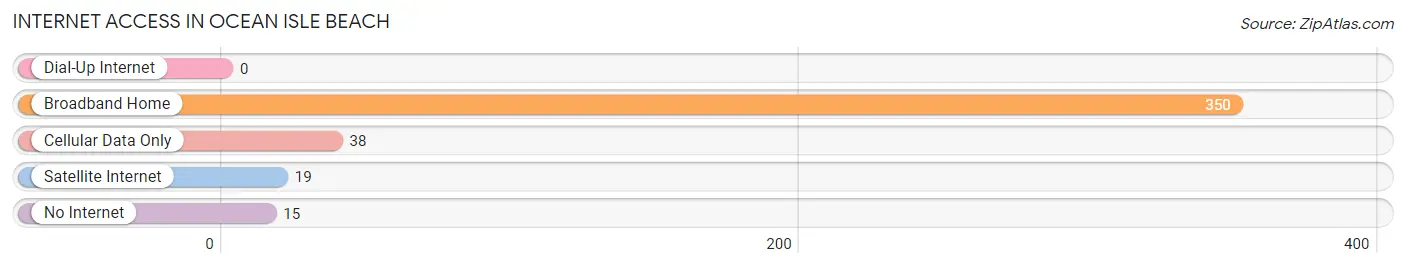
| Internet Type | # Households | % Households |
| Dial-Up Internet | 0 | 0.0% |
| Broadband Home | 350 | 81.0% |
| Cellular Data Only | 38 | 8.8% |
| Satellite Internet | 19 | 4.4% |
| No Internet | 15 | 3.5% |
| Total | 432 | 100.0% |
Ocean Isle Beach Summary
History
The history of Ocean Isle Beach, North Carolina dates back to the early 1700s when the area was inhabited by the Waccamaw Indians. The Waccamaw Indians were a part of the larger Siouan-speaking tribe, and they lived in the area for centuries before the arrival of European settlers. The first Europeans to settle in the area were the English, who established a trading post in 1725. The trading post was located near what is now known as the Shallotte River.
In the late 1700s, the area was settled by a group of Scottish immigrants who named the area Ocean Isle Beach. The name was derived from the fact that the area was surrounded by the Atlantic Ocean on one side and the Shallotte River on the other. The settlers built a small fishing village and began to farm the land.
In the early 1900s, the area began to attract tourists who were drawn to the area's natural beauty and its proximity to the ocean. The first hotel was built in 1912, and the area quickly became a popular destination for vacationers.
In the 1950s, the area began to experience rapid growth as more and more people moved to the area. The population of Ocean Isle Beach increased from just over 500 in 1950 to over 5,000 in 2000.
Geography
Ocean Isle Beach is located in Brunswick County, North Carolina, on the Atlantic Coast. It is situated on a barrier island between the Atlantic Ocean and the Shallotte River. The town is approximately 8 miles long and 1 mile wide, and it is bordered by the towns of Sunset Beach, Holden Beach, and Ocean View.
The town is divided into two distinct sections: the beachfront and the mainland. The beachfront is home to the majority of the town's businesses, restaurants, and hotels, while the mainland is primarily residential.
The town is known for its beautiful beaches, which are made up of white sand and crystal clear waters. The beaches are popular for swimming, sunbathing, and fishing. The town also has a number of parks and nature preserves, including the Ocean Isle Beach Nature Preserve and the Ocean Isle Beach State Park.
Economy
The economy of Ocean Isle Beach is largely driven by tourism. The town is a popular destination for vacationers, and it is home to a number of hotels, restaurants, and other businesses that cater to tourists. The town also has a number of marinas, which provide services to boaters and fishermen.
In addition to tourism, the town is also home to a number of businesses that provide goods and services to the local population. These businesses include retail stores, grocery stores, and other services.
Demographics
As of the 2010 census, the population of Ocean Isle Beach was 5,583. The population is primarily white (93.3%), with a small percentage of African Americans (3.2%) and Hispanics (2.2%). The median household income is $50,945, and the median age is 44.
Conclusion
Ocean Isle Beach, North Carolina is a small town located on the Atlantic Coast. It is known for its beautiful beaches and its proximity to the ocean. The town has a long history, dating back to the early 1700s when it was inhabited by the Waccamaw Indians. Today, the town is a popular destination for tourists, and it is home to a number of businesses that cater to the local population. The town has a population of 5,583, and the median household income is $50,945.
Common Questions
What is Per Capita Income in Ocean Isle Beach?
Per Capita income in Ocean Isle Beach is $63,760.
What is the Median Family Income in Ocean Isle Beach?
Median Family Income in Ocean Isle Beach is $105,625.
What is the Median Household income in Ocean Isle Beach?
Median Household Income in Ocean Isle Beach is $91,250.
What is Income or Wage Gap in Ocean Isle Beach?
Income or Wage Gap in Ocean Isle Beach is 59.8%.
Women in Ocean Isle Beach earn 40.2 cents for every dollar earned by a man.
What is Inequality or Gini Index in Ocean Isle Beach?
Inequality or Gini Index in Ocean Isle Beach is 0.46.
What is the Total Population of Ocean Isle Beach?
Total Population of Ocean Isle Beach is 809.
What is the Total Male Population of Ocean Isle Beach?
Total Male Population of Ocean Isle Beach is 369.
What is the Total Female Population of Ocean Isle Beach?
Total Female Population of Ocean Isle Beach is 440.
What is the Ratio of Males per 100 Females in Ocean Isle Beach?
There are 83.86 Males per 100 Females in Ocean Isle Beach.
What is the Ratio of Females per 100 Males in Ocean Isle Beach?
There are 119.24 Females per 100 Males in Ocean Isle Beach.
What is the Median Population Age in Ocean Isle Beach?
Median Population Age in Ocean Isle Beach is 67.3 Years.
What is the Average Family Size in Ocean Isle Beach
Average Family Size in Ocean Isle Beach is 2.1 People.
What is the Average Household Size in Ocean Isle Beach
Average Household Size in Ocean Isle Beach is 1.9 People.
How Large is the Labor Force in Ocean Isle Beach?
There are 256 People in the Labor Forcein in Ocean Isle Beach.
What is the Percentage of People in the Labor Force in Ocean Isle Beach?
32.4% of People are in the Labor Force in Ocean Isle Beach.
What is the Unemployment Rate in Ocean Isle Beach?
Unemployment Rate in Ocean Isle Beach is 3.1%.