Granite Falls, NC Map & Demographics
Granite Falls Map
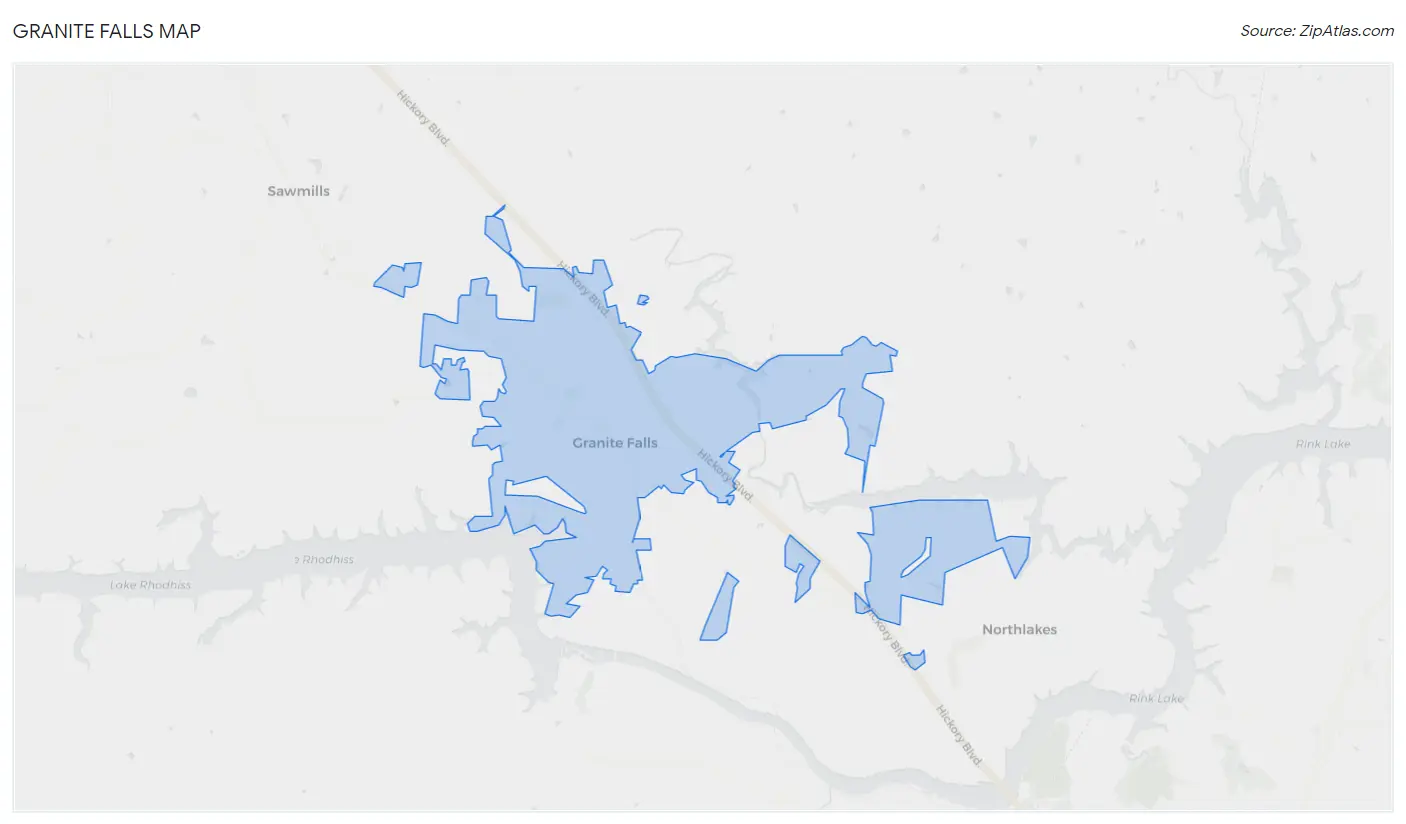
Granite Falls Overview
$32,835
PER CAPITA INCOME
$84,800
AVG FAMILY INCOME
$76,680
AVG HOUSEHOLD INCOME
17.2%
WAGE / INCOME GAP [ % ]
82.8¢/ $1
WAGE / INCOME GAP [ $ ]
0.43
INEQUALITY / GINI INDEX
4,934
TOTAL POPULATION
2,364
MALE POPULATION
2,570
FEMALE POPULATION
91.98
MALES / 100 FEMALES
108.71
FEMALES / 100 MALES
42.3
MEDIAN AGE
3.2
AVG FAMILY SIZE
2.9
AVG HOUSEHOLD SIZE
2,286
LABOR FORCE [ PEOPLE ]
59.4%
PERCENT IN LABOR FORCE
3.0%
UNEMPLOYMENT RATE
Granite Falls Zip Codes
Granite Falls Area Codes
Income in Granite Falls
Income Overview in Granite Falls
Per Capita Income in Granite Falls is $32,835, while median incomes of families and households are $84,800 and $76,680 respectively.
| Characteristic | Number | Measure |
| Per Capita Income | 4,934 | $32,835 |
| Median Family Income | 1,332 | $84,800 |
| Mean Family Income | 1,332 | $97,992 |
| Median Household Income | 1,686 | $76,680 |
| Mean Household Income | 1,686 | $94,293 |
| Income Deficit | 1,332 | $0 |
| Wage / Income Gap (%) | 4,934 | 17.22% |
| Wage / Income Gap ($) | 4,934 | 82.78¢ per $1 |
| Gini / Inequality Index | 4,934 | 0.43 |
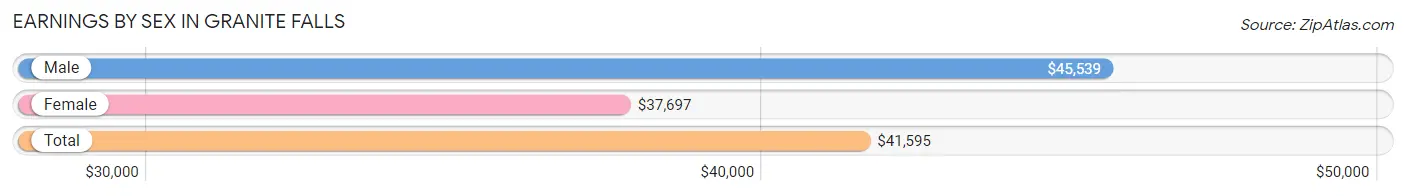
Earnings by Sex in Granite Falls
Average Earnings in Granite Falls are $41,595, $45,539 for men and $37,697 for women, a difference of 17.2%.
| Sex | Number | Average Earnings |
| Male | 1,084 (47.6%) | $45,539 |
| Female | 1,194 (52.4%) | $37,697 |
| Total | 2,278 (100.0%) | $41,595 |
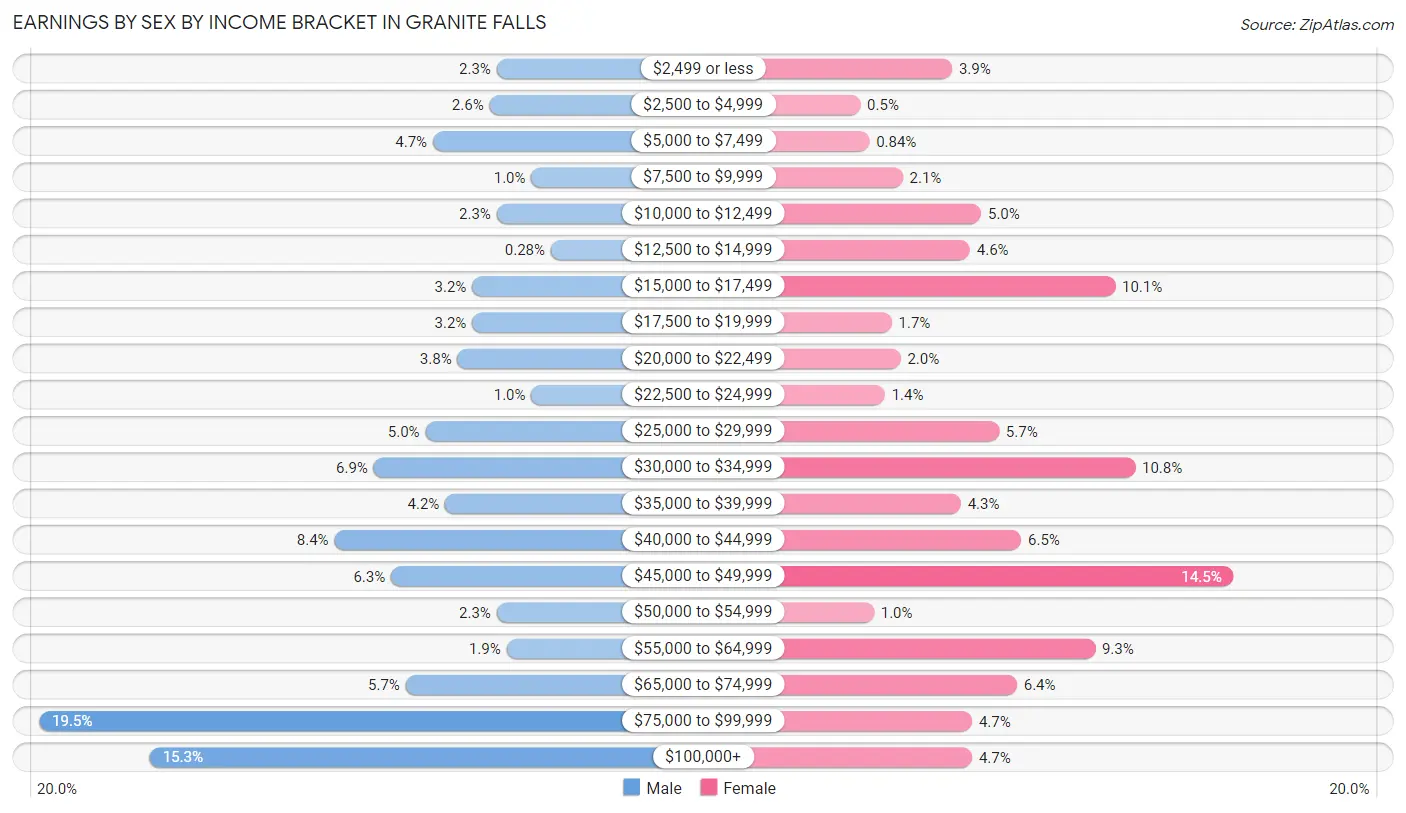
Earnings by Sex by Income Bracket in Granite Falls
The most common earnings brackets in Granite Falls are $75,000 to $99,999 for men (211 | 19.5%) and $45,000 to $49,999 for women (173 | 14.5%).
| Income | Male | Female |
| $2,499 or less | 25 (2.3%) | 47 (3.9%) |
| $2,500 to $4,999 | 28 (2.6%) | 6 (0.5%) |
| $5,000 to $7,499 | 51 (4.7%) | 10 (0.8%) |
| $7,500 to $9,999 | 11 (1.0%) | 25 (2.1%) |
| $10,000 to $12,499 | 25 (2.3%) | 60 (5.0%) |
| $12,500 to $14,999 | 3 (0.3%) | 55 (4.6%) |
| $15,000 to $17,499 | 35 (3.2%) | 120 (10.1%) |
| $17,500 to $19,999 | 35 (3.2%) | 20 (1.7%) |
| $20,000 to $22,499 | 41 (3.8%) | 24 (2.0%) |
| $22,500 to $24,999 | 11 (1.0%) | 17 (1.4%) |
| $25,000 to $29,999 | 54 (5.0%) | 68 (5.7%) |
| $30,000 to $34,999 | 75 (6.9%) | 129 (10.8%) |
| $35,000 to $39,999 | 46 (4.2%) | 51 (4.3%) |
| $40,000 to $44,999 | 91 (8.4%) | 78 (6.5%) |
| $45,000 to $49,999 | 68 (6.3%) | 173 (14.5%) |
| $50,000 to $54,999 | 25 (2.3%) | 12 (1.0%) |
| $55,000 to $64,999 | 21 (1.9%) | 111 (9.3%) |
| $65,000 to $74,999 | 62 (5.7%) | 76 (6.4%) |
| $75,000 to $99,999 | 211 (19.5%) | 56 (4.7%) |
| $100,000+ | 166 (15.3%) | 56 (4.7%) |
| Total | 1,084 (100.0%) | 1,194 (100.0%) |
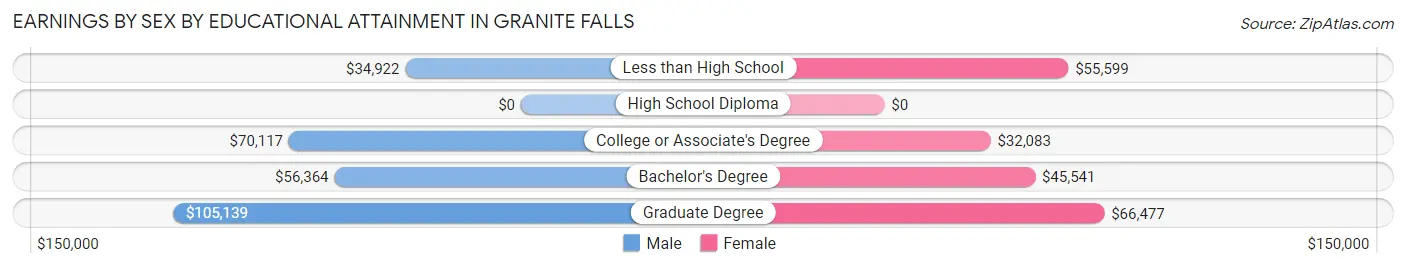
Earnings by Sex by Educational Attainment in Granite Falls
Average earnings in Granite Falls are $52,273 for men and $34,942 for women, a difference of 33.2%. Men with an educational attainment of graduate degree enjoy the highest average annual earnings of $105,139, while those with less than high school education earn the least with $34,922. Women with an educational attainment of graduate degree earn the most with the average annual earnings of $66,477, while those with college or associate's degree education have the smallest earnings of $32,083.
| Educational Attainment | Male Income | Female Income |
| Less than High School | $34,922 | $55,599 |
| High School Diploma | - | - |
| College or Associate's Degree | $70,117 | $32,083 |
| Bachelor's Degree | $56,364 | $45,541 |
| Graduate Degree | $105,139 | $66,477 |
| Total | $52,273 | $34,942 |
Family Income in Granite Falls
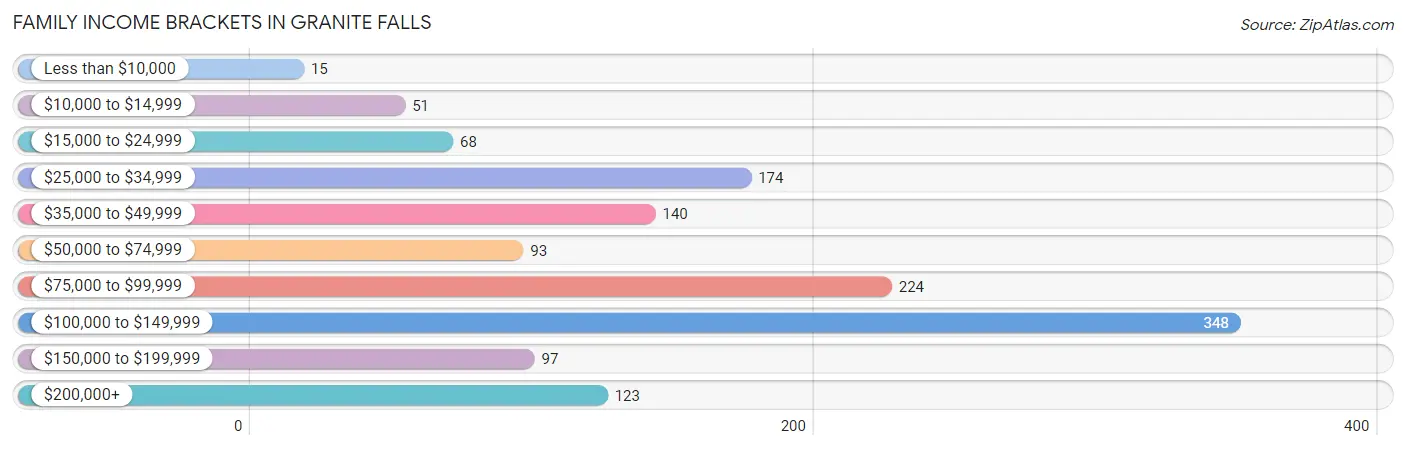
Family Income Brackets in Granite Falls
According to the Granite Falls family income data, there are 348 families falling into the $100,000 to $149,999 income range, which is the most common income bracket and makes up 26.1% of all families. Conversely, the less than $10,000 income bracket is the least frequent group with only 15 families (1.1%) belonging to this category.
| Income Bracket | # Families | % Families |
| Less than $10,000 | 15 | 1.1% |
| $10,000 to $14,999 | 51 | 3.8% |
| $15,000 to $24,999 | 68 | 5.1% |
| $25,000 to $34,999 | 174 | 13.1% |
| $35,000 to $49,999 | 140 | 10.5% |
| $50,000 to $74,999 | 93 | 7.0% |
| $75,000 to $99,999 | 224 | 16.8% |
| $100,000 to $149,999 | 348 | 26.1% |
| $150,000 to $199,999 | 97 | 7.3% |
| $200,000+ | 123 | 9.2% |
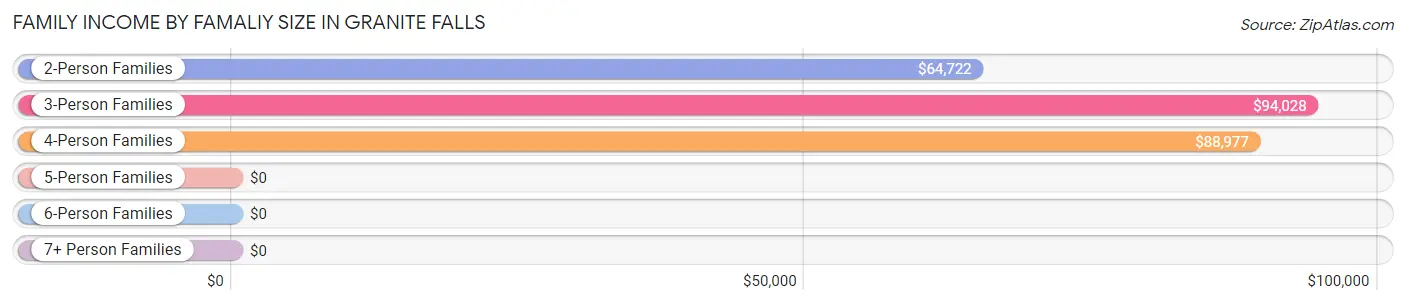
Family Income by Famaliy Size in Granite Falls
3-person families (289 | 21.7%) account for the highest median family income in Granite Falls with $94,028 per family, while 2-person families (660 | 49.5%) have the highest median income of $32,361 per family member.
| Income Bracket | # Families | Median Income |
| 2-Person Families | 660 (49.5%) | $64,722 |
| 3-Person Families | 289 (21.7%) | $94,028 |
| 4-Person Families | 223 (16.7%) | $88,977 |
| 5-Person Families | 105 (7.9%) | $0 |
| 6-Person Families | 39 (2.9%) | $0 |
| 7+ Person Families | 16 (1.2%) | $0 |
| Total | 1,332 (100.0%) | $84,800 |
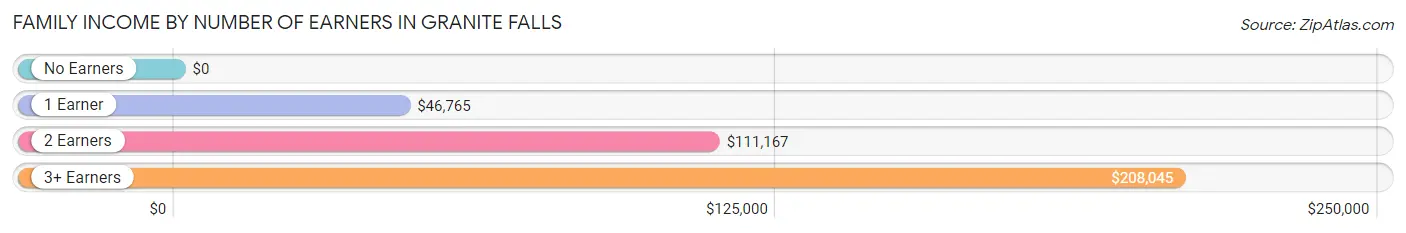
Family Income by Number of Earners in Granite Falls
| Number of Earners | # Families | Median Income |
| No Earners | 237 (17.8%) | $0 |
| 1 Earner | 486 (36.5%) | $46,765 |
| 2 Earners | 526 (39.5%) | $111,167 |
| 3+ Earners | 83 (6.2%) | $208,045 |
| Total | 1,332 (100.0%) | $84,800 |
Household Income in Granite Falls
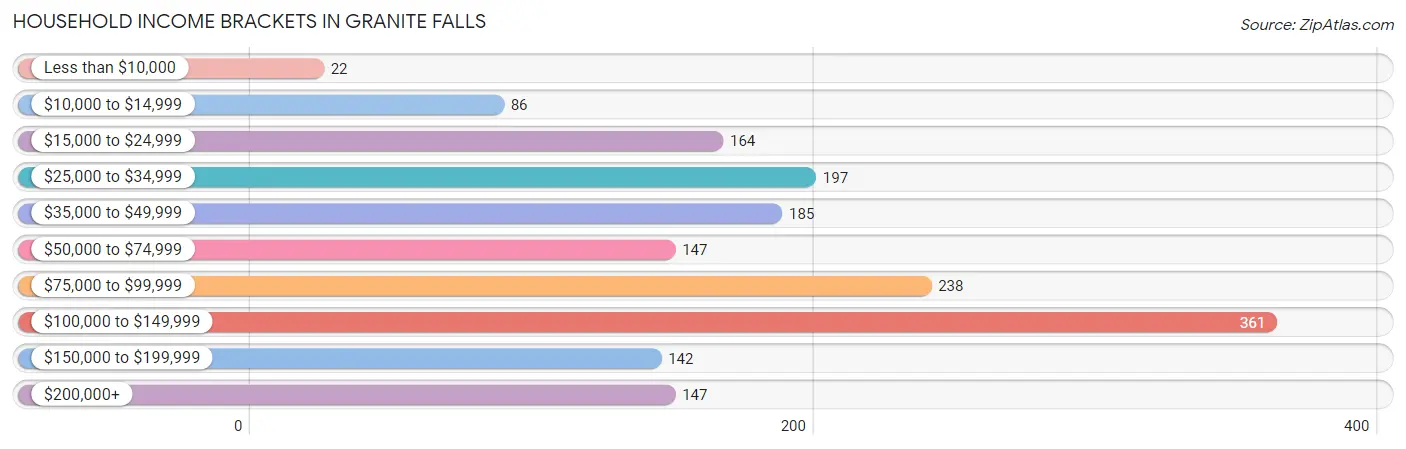
Household Income Brackets in Granite Falls
With 361 households falling in the category, the $100,000 to $149,999 income range is the most frequent in Granite Falls, accounting for 21.4% of all households. In contrast, only 22 households (1.3%) fall into the less than $10,000 income bracket, making it the least populous group.
| Income Bracket | # Households | % Households |
| Less than $10,000 | 22 | 1.3% |
| $10,000 to $14,999 | 86 | 5.1% |
| $15,000 to $24,999 | 164 | 9.7% |
| $25,000 to $34,999 | 197 | 11.7% |
| $35,000 to $49,999 | 185 | 11.0% |
| $50,000 to $74,999 | 147 | 8.7% |
| $75,000 to $99,999 | 238 | 14.1% |
| $100,000 to $149,999 | 361 | 21.4% |
| $150,000 to $199,999 | 142 | 8.4% |
| $200,000+ | 147 | 8.7% |
Household Income by Householder Age in Granite Falls
The median household income in Granite Falls is $76,680, with the highest median household income of $112,083 found in the 45 to 64 years age bracket for the primary householder. A total of 678 households (40.2%) fall into this category. Meanwhile, the 15 to 24 years age bracket for the primary householder has the lowest median household income of $0, with 75 households (4.4%) in this group.
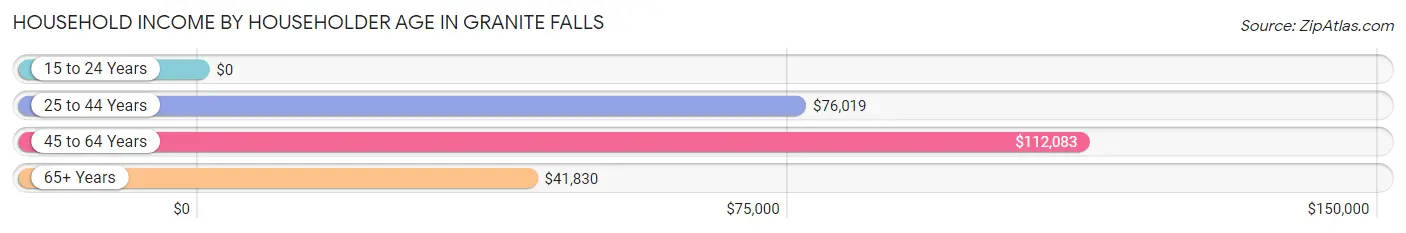
| Income Bracket | # Households | Median Income |
| 15 to 24 Years | 75 (4.4%) | $0 |
| 25 to 44 Years | 462 (27.4%) | $76,019 |
| 45 to 64 Years | 678 (40.2%) | $112,083 |
| 65+ Years | 471 (27.9%) | $41,830 |
| Total | 1,686 (100.0%) | $76,680 |
Poverty in Granite Falls
Income Below Poverty by Sex and Age in Granite Falls
With 11.5% poverty level for males and 13.4% for females among the residents of Granite Falls, 15 year old males and 18 to 24 year old females are the most vulnerable to poverty, with 24 males (55.8%) and 66 females (34.2%) in their respective age groups living below the poverty level.
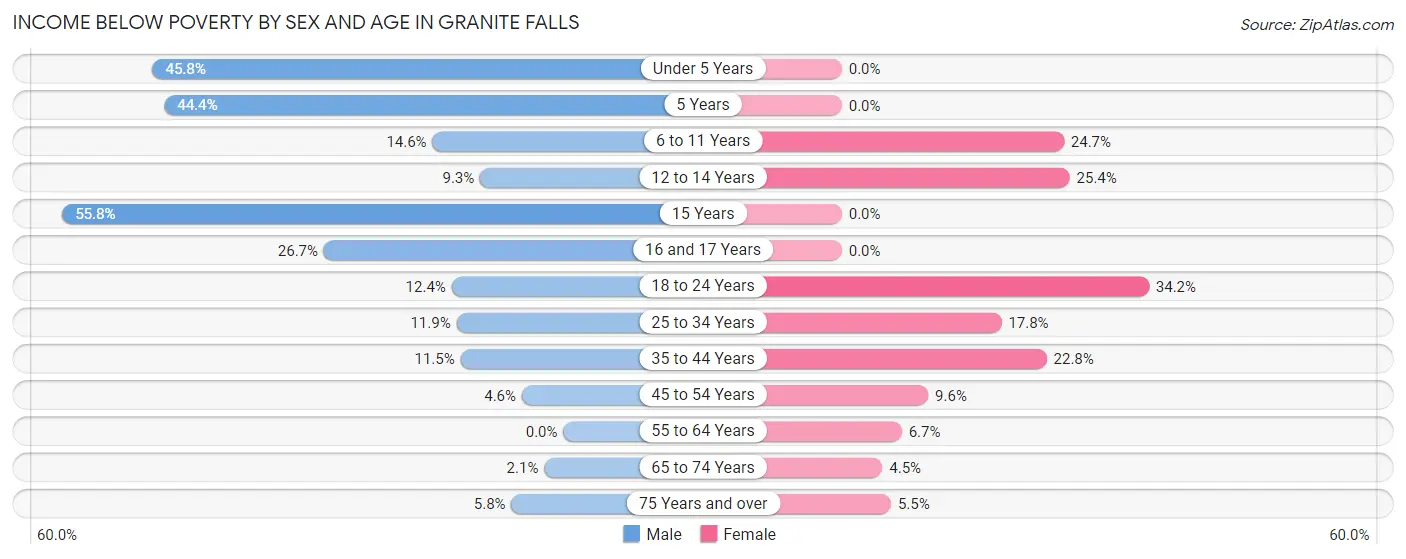
| Age Bracket | Male | Female |
| Under 5 Years | 70 (45.8%) | 0 (0.0%) |
| 5 Years | 8 (44.4%) | 0 (0.0%) |
| 6 to 11 Years | 28 (14.6%) | 45 (24.7%) |
| 12 to 14 Years | 19 (9.3%) | 17 (25.4%) |
| 15 Years | 24 (55.8%) | 0 (0.0%) |
| 16 and 17 Years | 12 (26.7%) | 0 (0.0%) |
| 18 to 24 Years | 25 (12.4%) | 66 (34.2%) |
| 25 to 34 Years | 20 (11.9%) | 56 (17.8%) |
| 35 to 44 Years | 26 (11.5%) | 65 (22.8%) |
| 45 to 54 Years | 16 (4.6%) | 40 (9.6%) |
| 55 to 64 Years | 0 (0.0%) | 22 (6.7%) |
| 65 to 74 Years | 7 (2.1%) | 9 (4.5%) |
| 75 Years and over | 10 (5.8%) | 12 (5.5%) |
| Total | 265 (11.5%) | 332 (13.4%) |
Income Above Poverty by Sex and Age in Granite Falls
According to the poverty statistics in Granite Falls, males aged 55 to 64 years and females aged under 5 years are the age groups that are most secure financially, with 100.0% of males and 100.0% of females in these age groups living above the poverty line.
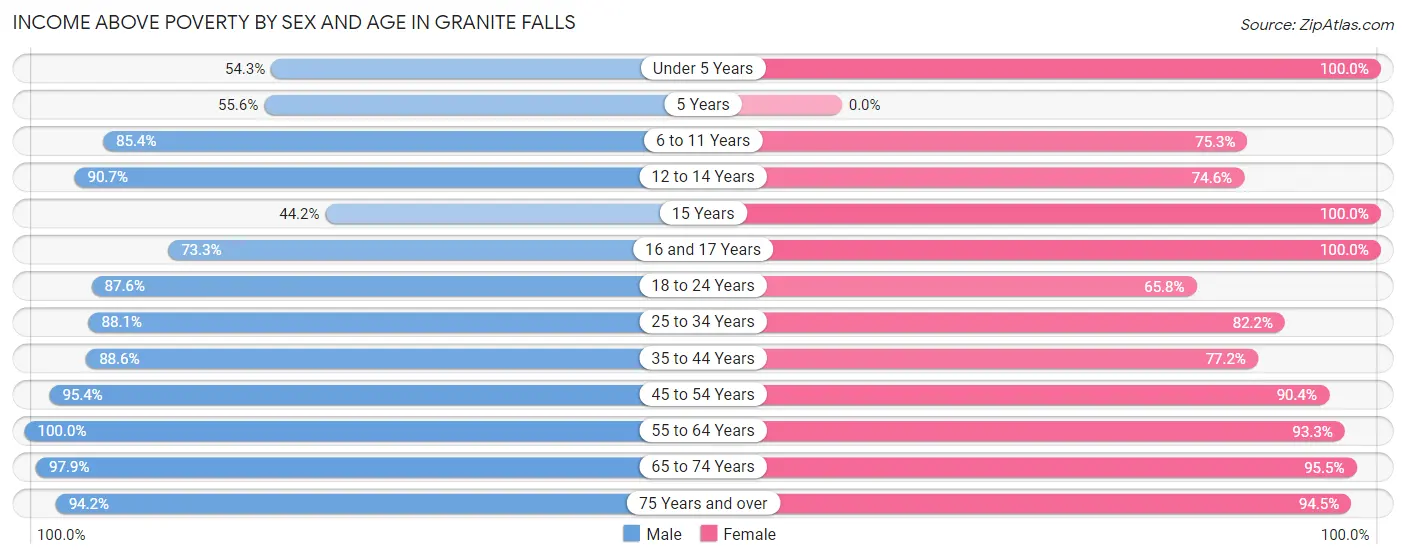
| Age Bracket | Male | Female |
| Under 5 Years | 83 (54.2%) | 178 (100.0%) |
| 5 Years | 10 (55.6%) | 0 (0.0%) |
| 6 to 11 Years | 164 (85.4%) | 137 (75.3%) |
| 12 to 14 Years | 186 (90.7%) | 50 (74.6%) |
| 15 Years | 19 (44.2%) | 17 (100.0%) |
| 16 and 17 Years | 33 (73.3%) | 84 (100.0%) |
| 18 to 24 Years | 176 (87.6%) | 127 (65.8%) |
| 25 to 34 Years | 148 (88.1%) | 259 (82.2%) |
| 35 to 44 Years | 201 (88.5%) | 220 (77.2%) |
| 45 to 54 Years | 330 (95.4%) | 376 (90.4%) |
| 55 to 64 Years | 203 (100.0%) | 308 (93.3%) |
| 65 to 74 Years | 322 (97.9%) | 190 (95.5%) |
| 75 Years and over | 163 (94.2%) | 207 (94.5%) |
| Total | 2,038 (88.5%) | 2,153 (86.6%) |
Income Below Poverty Among Married-Couple Families in Granite Falls
The poverty statistics for married-couple families in Granite Falls show that 3.3% or 35 of the total 1,055 families live below the poverty line. Families with 3 or 4 children have the highest poverty rate of 55.6%, comprising of 25 families. On the other hand, families with no children have the lowest poverty rate of 0.0%, which includes 0 families.
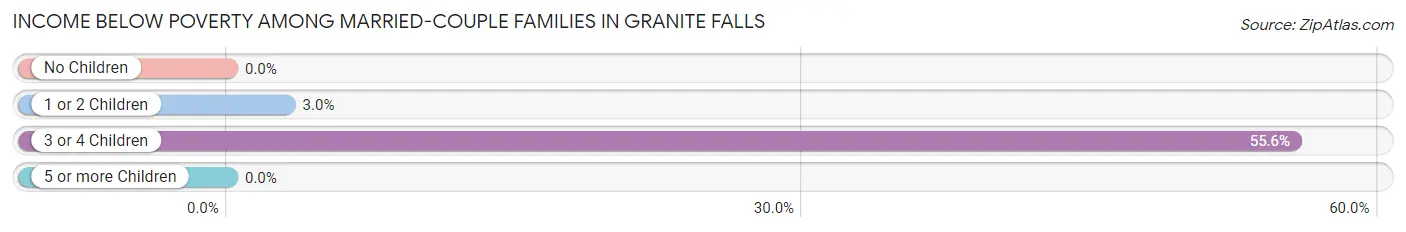
| Children | Above Poverty | Below Poverty |
| No Children | 662 (100.0%) | 0 (0.0%) |
| 1 or 2 Children | 322 (97.0%) | 10 (3.0%) |
| 3 or 4 Children | 20 (44.4%) | 25 (55.6%) |
| 5 or more Children | 16 (100.0%) | 0 (0.0%) |
| Total | 1,020 (96.7%) | 35 (3.3%) |
Income Below Poverty Among Single-Parent Households in Granite Falls
According to the poverty data in Granite Falls, 22.9% or 8 single-father households and 33.1% or 80 single-mother households are living below the poverty line. Among single-father households, those with 1 or 2 children have the highest poverty rate, with 8 households (53.3%) experiencing poverty. Likewise, among single-mother households, those with 3 or 4 children have the highest poverty rate, with 20 households (100.0%) falling below the poverty line.
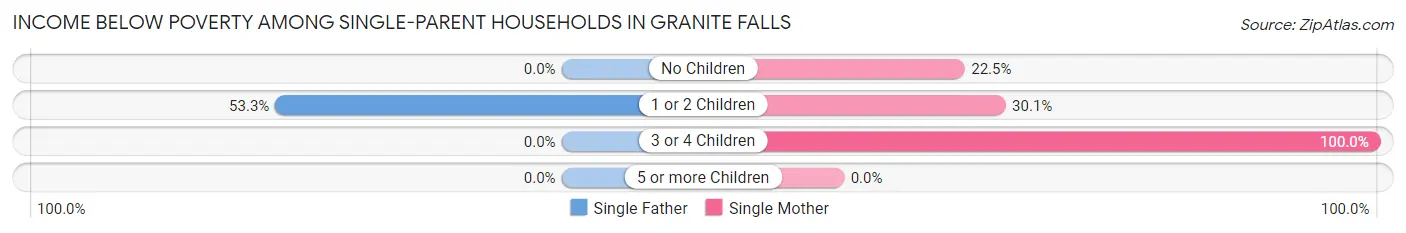
| Children | Single Father | Single Mother |
| No Children | 0 (0.0%) | 20 (22.5%) |
| 1 or 2 Children | 8 (53.3%) | 40 (30.1%) |
| 3 or 4 Children | 0 (0.0%) | 20 (100.0%) |
| 5 or more Children | 0 (0.0%) | 0 (0.0%) |
| Total | 8 (22.9%) | 80 (33.1%) |
Income Below Poverty Among Married-Couple vs Single-Parent Households in Granite Falls
The poverty data for Granite Falls shows that 35 of the married-couple family households (3.3%) and 88 of the single-parent households (31.8%) are living below the poverty level. Within the married-couple family households, those with 3 or 4 children have the highest poverty rate, with 25 households (55.6%) falling below the poverty line. Among the single-parent households, those with 3 or 4 children have the highest poverty rate, with 20 household (64.5%) living below poverty.
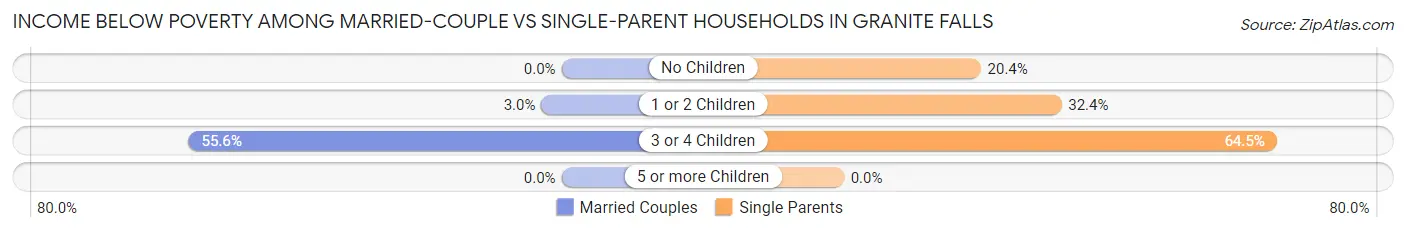
| Children | Married-Couple Families | Single-Parent Households |
| No Children | 0 (0.0%) | 20 (20.4%) |
| 1 or 2 Children | 10 (3.0%) | 48 (32.4%) |
| 3 or 4 Children | 25 (55.6%) | 20 (64.5%) |
| 5 or more Children | 0 (0.0%) | 0 (0.0%) |
| Total | 35 (3.3%) | 88 (31.8%) |
Race in Granite Falls
The most populous races in Granite Falls are White / Caucasian (3,868 | 78.4%), Hispanic or Latino (621 | 12.6%), and Some other Race (406 | 8.2%).
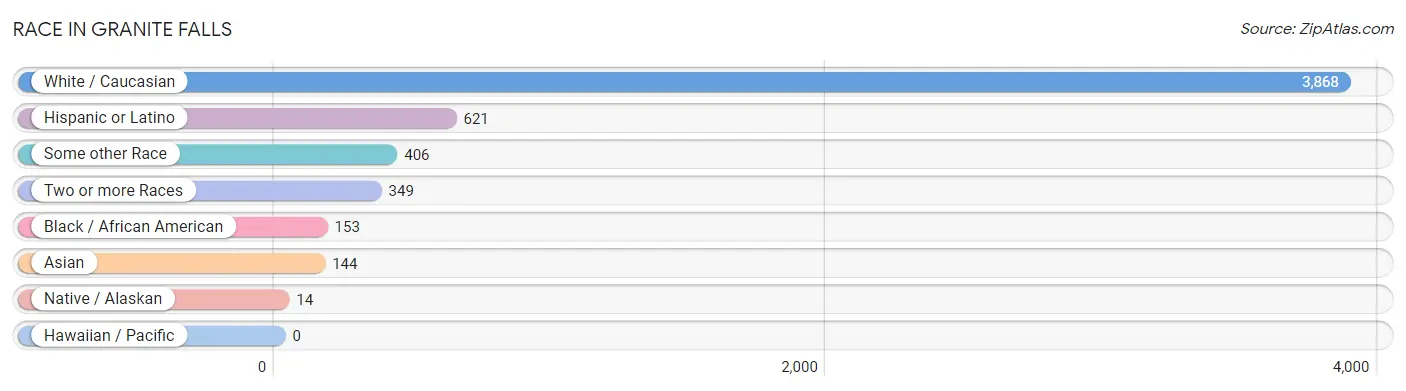
| Race | # Population | % Population |
| Asian | 144 | 2.9% |
| Black / African American | 153 | 3.1% |
| Hawaiian / Pacific | 0 | 0.0% |
| Hispanic or Latino | 621 | 12.6% |
| Native / Alaskan | 14 | 0.3% |
| White / Caucasian | 3,868 | 78.4% |
| Two or more Races | 349 | 7.1% |
| Some other Race | 406 | 8.2% |
| Total | 4,934 | 100.0% |
Ancestry in Granite Falls
The most populous ancestries reported in Granite Falls are American (1,002 | 20.3%), German (855 | 17.3%), Irish (470 | 9.5%), English (398 | 8.1%), and Puerto Rican (329 | 6.7%), together accounting for 61.9% of all Granite Falls residents.
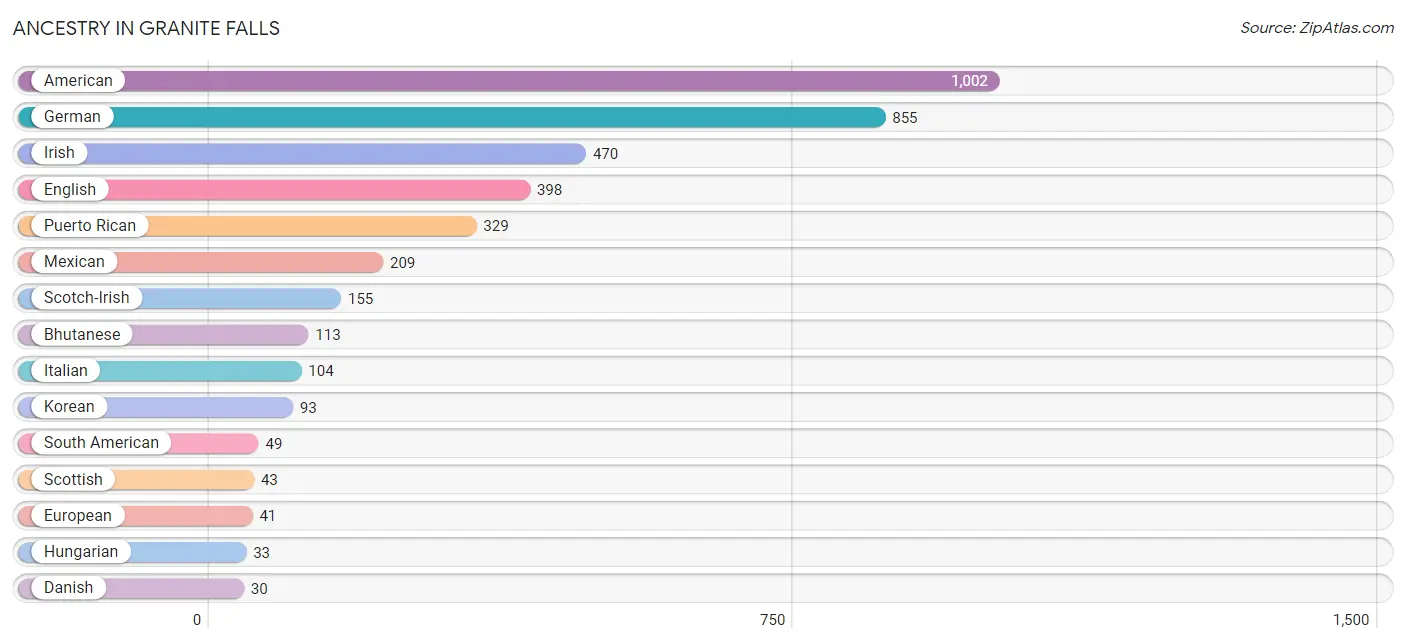
| Ancestry | # Population | % Population |
| American | 1,002 | 20.3% |
| Argentinean | 20 | 0.4% |
| Bhutanese | 113 | 2.3% |
| British | 29 | 0.6% |
| Burmese | 25 | 0.5% |
| Central American | 23 | 0.5% |
| Cherokee | 25 | 0.5% |
| Danish | 30 | 0.6% |
| Dominican | 11 | 0.2% |
| Dutch | 5 | 0.1% |
| Ecuadorian | 29 | 0.6% |
| English | 398 | 8.1% |
| European | 41 | 0.8% |
| Finnish | 6 | 0.1% |
| German | 855 | 17.3% |
| Greek | 9 | 0.2% |
| Guatemalan | 4 | 0.1% |
| Hungarian | 33 | 0.7% |
| Irish | 470 | 9.5% |
| Italian | 104 | 2.1% |
| Korean | 93 | 1.9% |
| Lithuanian | 20 | 0.4% |
| Mexican | 209 | 4.2% |
| Polish | 29 | 0.6% |
| Puerto Rican | 329 | 6.7% |
| Salvadoran | 19 | 0.4% |
| Scandinavian | 13 | 0.3% |
| Scotch-Irish | 155 | 3.1% |
| Scottish | 43 | 0.9% |
| South American | 49 | 1.0% |
| Welsh | 19 | 0.4% | View All 31 Rows |
Immigrants in Granite Falls
The most numerous immigrant groups reported in Granite Falls came from Asia (167 | 3.4%), Philippines (93 | 1.9%), South Eastern Asia (93 | 1.9%), Latin America (87 | 1.8%), and Eastern Asia (74 | 1.5%), together accounting for 10.4% of all Granite Falls residents.
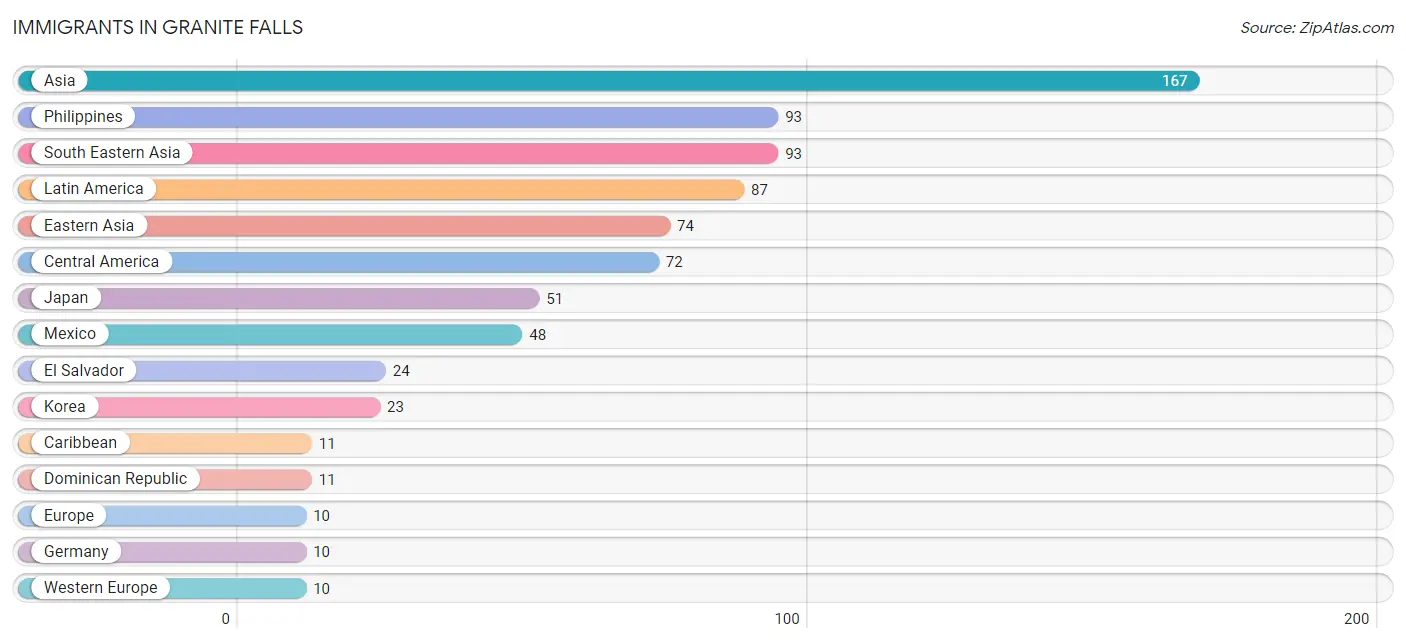
| Immigration Origin | # Population | % Population |
| Argentina | 4 | 0.1% |
| Asia | 167 | 3.4% |
| Caribbean | 11 | 0.2% |
| Central America | 72 | 1.5% |
| Dominican Republic | 11 | 0.2% |
| Eastern Asia | 74 | 1.5% |
| El Salvador | 24 | 0.5% |
| Europe | 10 | 0.2% |
| Germany | 10 | 0.2% |
| Japan | 51 | 1.0% |
| Korea | 23 | 0.5% |
| Latin America | 87 | 1.8% |
| Mexico | 48 | 1.0% |
| Philippines | 93 | 1.9% |
| South America | 4 | 0.1% |
| South Eastern Asia | 93 | 1.9% |
| Western Europe | 10 | 0.2% | View All 17 Rows |
Sex and Age in Granite Falls
Sex and Age in Granite Falls
The most populous age groups in Granite Falls are 10 to 14 Years (254 | 10.7%) for men and 50 to 54 Years (245 | 9.5%) for women.
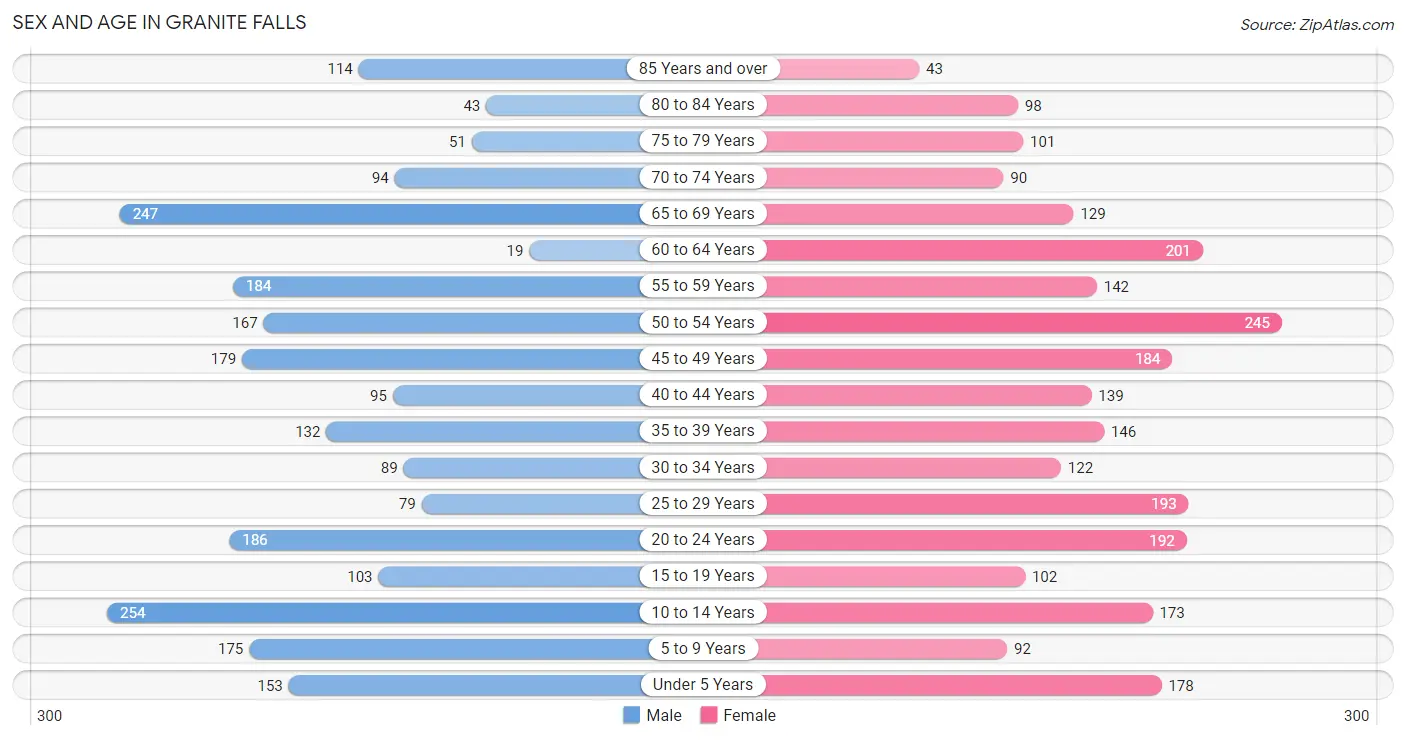
| Age Bracket | Male | Female |
| Under 5 Years | 153 (6.5%) | 178 (6.9%) |
| 5 to 9 Years | 175 (7.4%) | 92 (3.6%) |
| 10 to 14 Years | 254 (10.7%) | 173 (6.7%) |
| 15 to 19 Years | 103 (4.4%) | 102 (4.0%) |
| 20 to 24 Years | 186 (7.9%) | 192 (7.5%) |
| 25 to 29 Years | 79 (3.3%) | 193 (7.5%) |
| 30 to 34 Years | 89 (3.8%) | 122 (4.8%) |
| 35 to 39 Years | 132 (5.6%) | 146 (5.7%) |
| 40 to 44 Years | 95 (4.0%) | 139 (5.4%) |
| 45 to 49 Years | 179 (7.6%) | 184 (7.2%) |
| 50 to 54 Years | 167 (7.1%) | 245 (9.5%) |
| 55 to 59 Years | 184 (7.8%) | 142 (5.5%) |
| 60 to 64 Years | 19 (0.8%) | 201 (7.8%) |
| 65 to 69 Years | 247 (10.4%) | 129 (5.0%) |
| 70 to 74 Years | 94 (4.0%) | 90 (3.5%) |
| 75 to 79 Years | 51 (2.2%) | 101 (3.9%) |
| 80 to 84 Years | 43 (1.8%) | 98 (3.8%) |
| 85 Years and over | 114 (4.8%) | 43 (1.7%) |
| Total | 2,364 (100.0%) | 2,570 (100.0%) |
Families and Households in Granite Falls
Median Family Size in Granite Falls
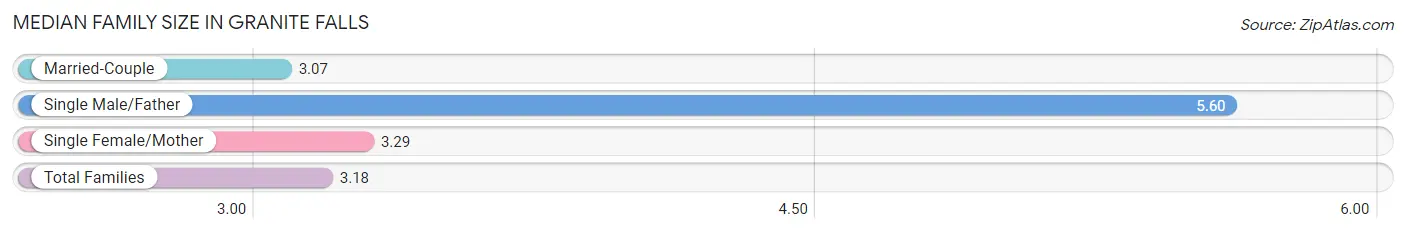
The median family size in Granite Falls is 3.18 persons per family, with single male/father families (35 | 2.6%) accounting for the largest median family size of 5.6 persons per family. On the other hand, married-couple families (1,055 | 79.2%) represent the smallest median family size with 3.07 persons per family.
| Family Type | # Families | Family Size |
| Married-Couple | 1,055 (79.2%) | 3.07 |
| Single Male/Father | 35 (2.6%) | 5.60 |
| Single Female/Mother | 242 (18.2%) | 3.29 |
| Total Families | 1,332 (100.0%) | 3.18 |
Median Household Size in Granite Falls
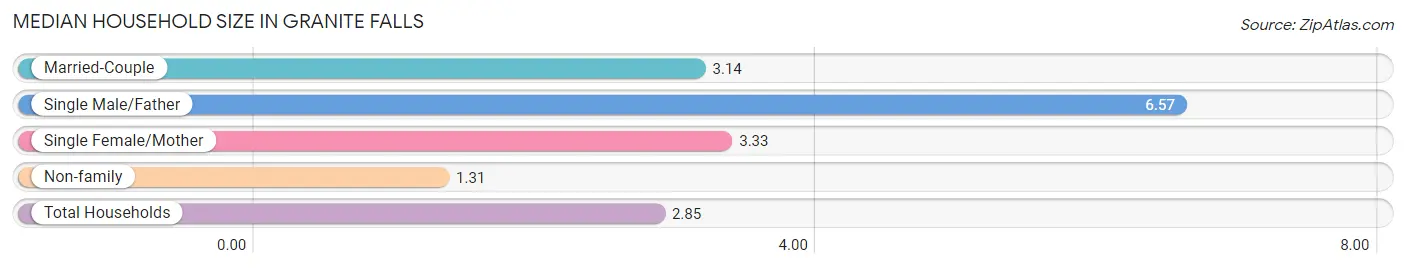
The median household size in Granite Falls is 2.85 persons per household, with single male/father households (35 | 2.1%) accounting for the largest median household size of 6.57 persons per household. non-family households (354 | 21.0%) represent the smallest median household size with 1.31 persons per household.
| Household Type | # Households | Household Size |
| Married-Couple | 1,055 (62.6%) | 3.14 |
| Single Male/Father | 35 (2.1%) | 6.57 |
| Single Female/Mother | 242 (14.3%) | 3.33 |
| Non-family | 354 (21.0%) | 1.31 |
| Total Households | 1,686 (100.0%) | 2.85 |
Household Size by Marriage Status in Granite Falls
Out of a total of 1,686 households in Granite Falls, 1,332 (79.0%) are family households, while 354 (21.0%) are nonfamily households. The most numerous type of family households are 2-person households, comprising 646, and the most common type of nonfamily households are 1-person households, comprising 289.
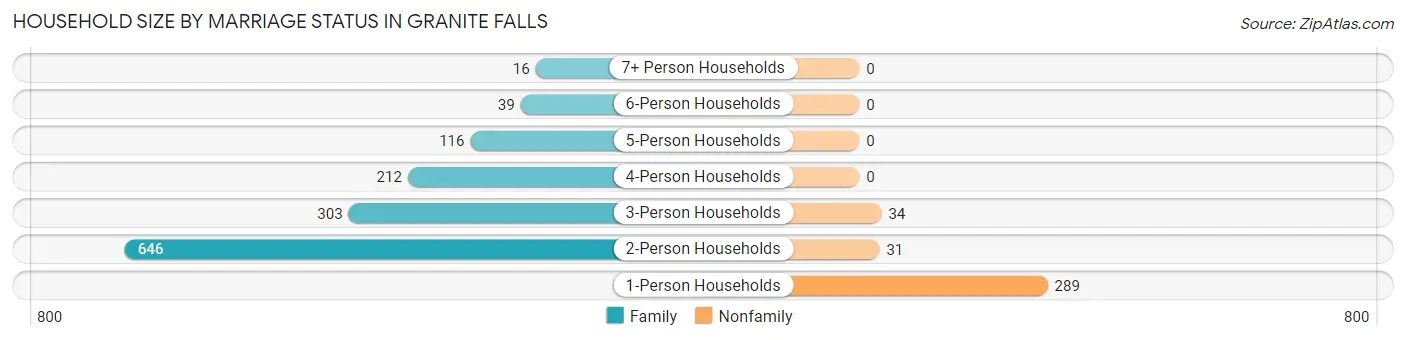
| Household Size | Family Households | Nonfamily Households |
| 1-Person Households | - | 289 (17.1%) |
| 2-Person Households | 646 (38.3%) | 31 (1.8%) |
| 3-Person Households | 303 (18.0%) | 34 (2.0%) |
| 4-Person Households | 212 (12.6%) | 0 (0.0%) |
| 5-Person Households | 116 (6.9%) | 0 (0.0%) |
| 6-Person Households | 39 (2.3%) | 0 (0.0%) |
| 7+ Person Households | 16 (0.9%) | 0 (0.0%) |
| Total | 1,332 (79.0%) | 354 (21.0%) |
Female Fertility in Granite Falls
Fertility by Age in Granite Falls
Average fertility rate in Granite Falls is 47.0 births per 1,000 women. Women in the age bracket of 20 to 34 years have the highest fertility rate with 89.0 births per 1,000 women. Women in the age bracket of 20 to 34 years acount for 83.3% of all women with births.
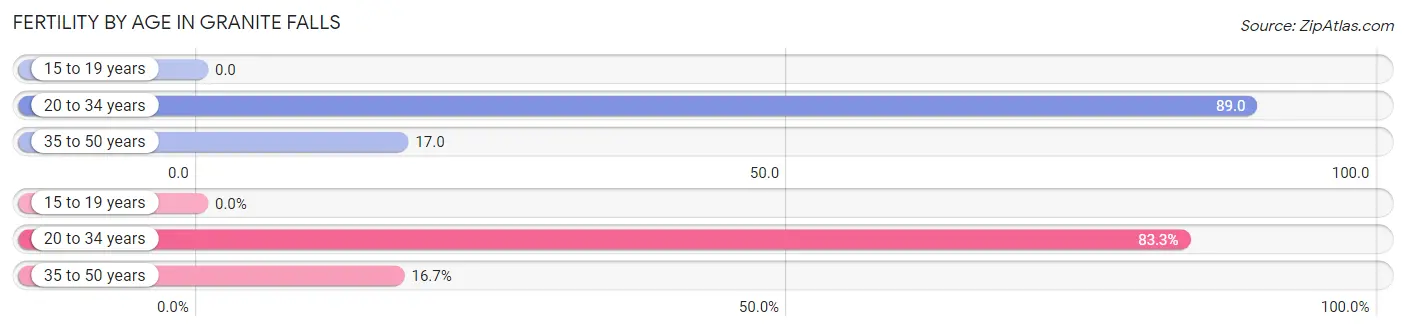
| Age Bracket | Women with Births | Births / 1,000 Women |
| 15 to 19 years | 0 (0.0%) | 0.0 |
| 20 to 34 years | 45 (83.3%) | 89.0 |
| 35 to 50 years | 9 (16.7%) | 17.0 |
| Total | 54 (100.0%) | 47.0 |
Fertility by Age by Marriage Status in Granite Falls
25.9% of women with births (54) in Granite Falls are married. The highest percentage of unmarried women with births falls into 20 to 34 years age bracket with 88.9% of them unmarried at the time of birth, while the lowest percentage of unmarried women with births belong to 35 to 50 years age bracket with 0.0% of them unmarried.
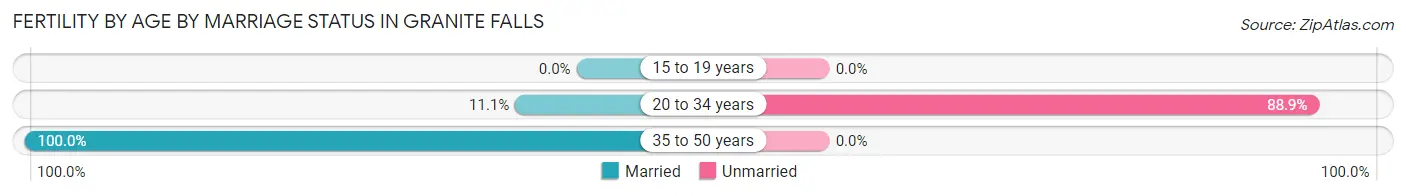
| Age Bracket | Married | Unmarried |
| 15 to 19 years | 0 (0.0%) | 0 (0.0%) |
| 20 to 34 years | 5 (11.1%) | 40 (88.9%) |
| 35 to 50 years | 9 (100.0%) | 0 (0.0%) |
| Total | 14 (25.9%) | 40 (74.1%) |
Fertility by Education in Granite Falls
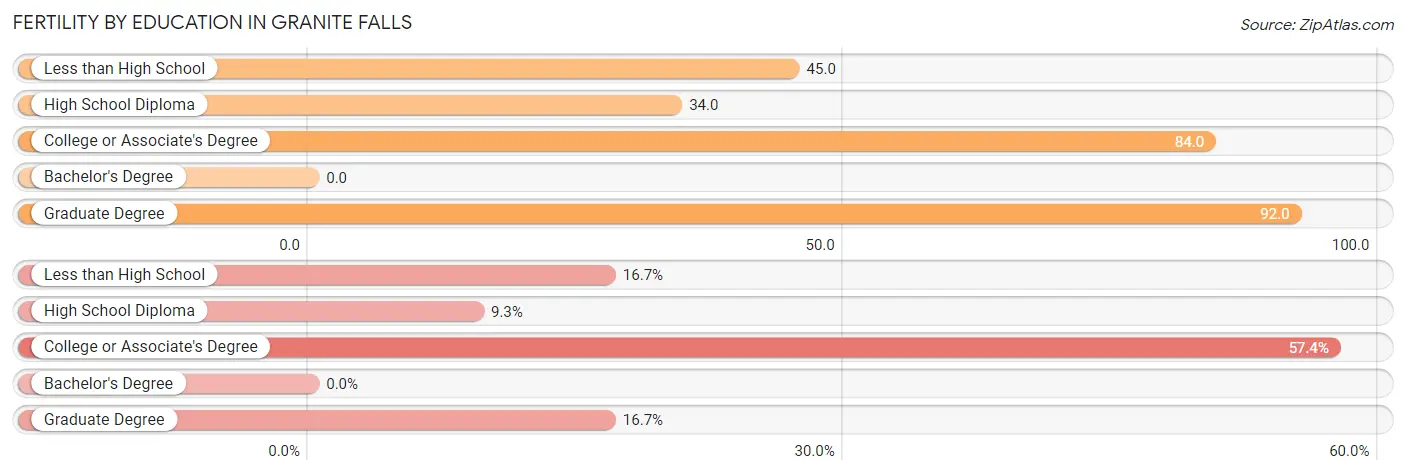
| Educational Attainment | Women with Births | Births / 1,000 Women |
| Less than High School | 9 (16.7%) | 45.0 |
| High School Diploma | 5 (9.3%) | 34.0 |
| College or Associate's Degree | 31 (57.4%) | 84.0 |
| Bachelor's Degree | 0 (0.0%) | 0.0 |
| Graduate Degree | 9 (16.7%) | 92.0 |
| Total | 54 (100.0%) | 47.0 |
Fertility by Education by Marriage Status in Granite Falls
74.1% of women with births in Granite Falls are unmarried. Women with the educational attainment of high school diploma are most likely to be married with 100.0% of them married at childbirth, while women with the educational attainment of less than high school are least likely to be married with 100.0% of them unmarried at childbirth.
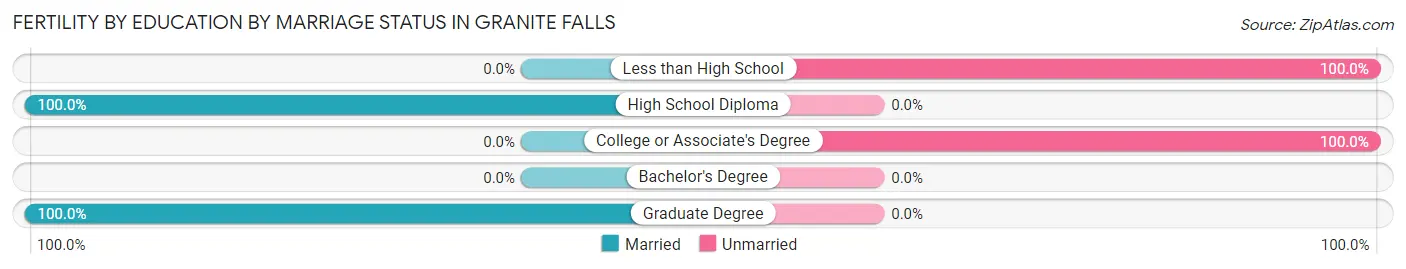
| Educational Attainment | Married | Unmarried |
| Less than High School | 0 (0.0%) | 9 (100.0%) |
| High School Diploma | 5 (100.0%) | 0 (0.0%) |
| College or Associate's Degree | 0 (0.0%) | 31 (100.0%) |
| Bachelor's Degree | 0 (0.0%) | 0 (0.0%) |
| Graduate Degree | 9 (100.0%) | 0 (0.0%) |
| Total | 14 (25.9%) | 40 (74.1%) |
Employment Characteristics in Granite Falls
Employment by Class of Employer in Granite Falls
Among the 2,185 employed individuals in Granite Falls, private company employees (1,457 | 66.7%), self-employed (incorporated) (212 | 9.7%), and local government employees (183 | 8.4%) make up the most common classes of employment.
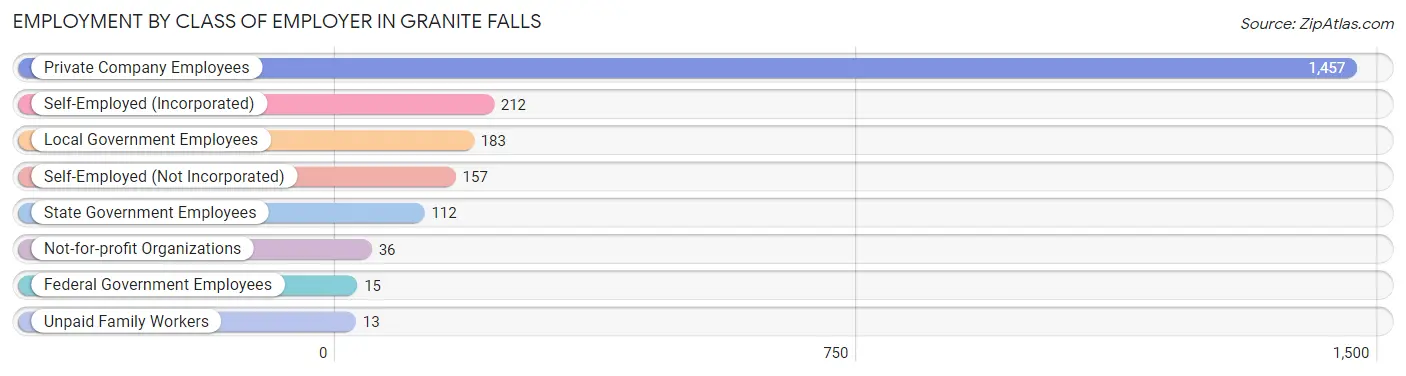
| Employer Class | # Employees | % Employees |
| Private Company Employees | 1,457 | 66.7% |
| Self-Employed (Incorporated) | 212 | 9.7% |
| Self-Employed (Not Incorporated) | 157 | 7.2% |
| Not-for-profit Organizations | 36 | 1.7% |
| Local Government Employees | 183 | 8.4% |
| State Government Employees | 112 | 5.1% |
| Federal Government Employees | 15 | 0.7% |
| Unpaid Family Workers | 13 | 0.6% |
| Total | 2,185 | 100.0% |
Employment Status by Age in Granite Falls
According to the labor force statistics for Granite Falls, out of the total population over 16 years of age (3,849), 59.4% or 2,286 individuals are in the labor force, with 3.0% or 69 of them unemployed. The age group with the highest labor force participation rate is 45 to 54 years, with 94.1% or 729 individuals in the labor force. Within the labor force, the 60 to 64 years age range has the highest percentage of unemployed individuals, with 13.0% or 7 of them being unemployed.
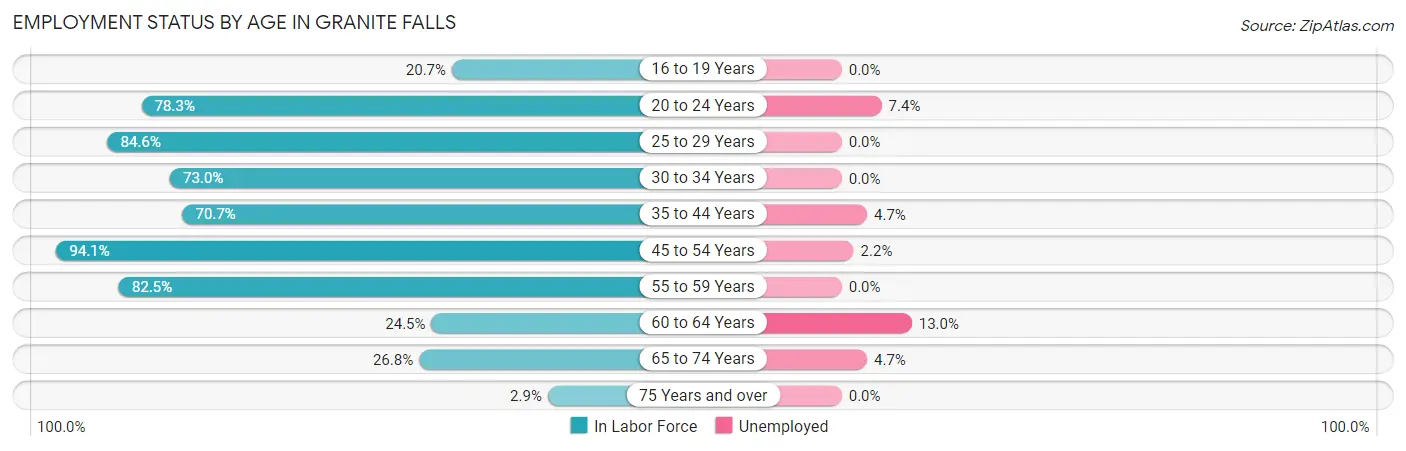
| Age Bracket | In Labor Force | Unemployed |
| 16 to 19 Years | 30 (20.7%) | 0 (0.0%) |
| 20 to 24 Years | 296 (78.3%) | 22 (7.4%) |
| 25 to 29 Years | 230 (84.6%) | 0 (0.0%) |
| 30 to 34 Years | 154 (73.0%) | 0 (0.0%) |
| 35 to 44 Years | 362 (70.7%) | 17 (4.7%) |
| 45 to 54 Years | 729 (94.1%) | 16 (2.2%) |
| 55 to 59 Years | 269 (82.5%) | 0 (0.0%) |
| 60 to 64 Years | 54 (24.5%) | 7 (13.0%) |
| 65 to 74 Years | 150 (26.8%) | 7 (4.7%) |
| 75 Years and over | 13 (2.9%) | 0 (0.0%) |
| Total | 2,286 (59.4%) | 69 (3.0%) |
Employment Status by Educational Attainment in Granite Falls
According to labor force statistics for Granite Falls, 77.6% of individuals (1,797) out of the total population between 25 and 64 years of age (2,316) are in the labor force, with 2.2% or 40 of them being unemployed. The group with the highest labor force participation rate are those with the educational attainment of bachelor's degree or higher, with 88.2% or 614 individuals in the labor force. Within the labor force, individuals with less than high school education have the highest percentage of unemployment, with 14.0% or 33 of them being unemployed.
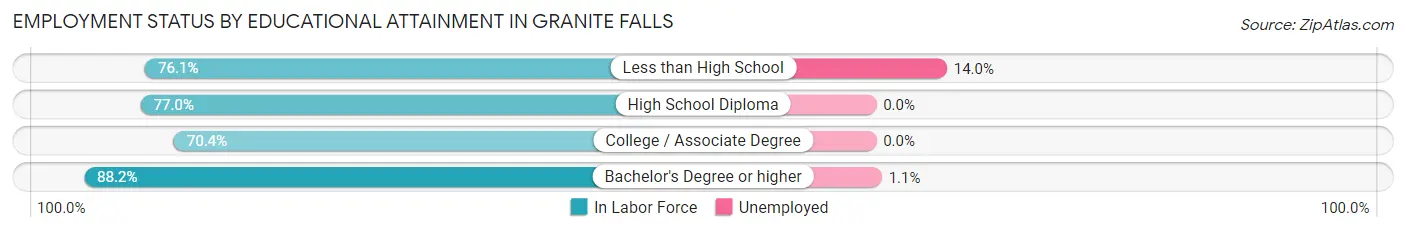
| Educational Attainment | In Labor Force | Unemployed |
| Less than High School | 236 (76.1%) | 43 (14.0%) |
| High School Diploma | 302 (77.0%) | 0 (0.0%) |
| College / Associate Degree | 646 (70.4%) | 0 (0.0%) |
| Bachelor's Degree or higher | 614 (88.2%) | 8 (1.1%) |
| Total | 1,797 (77.6%) | 51 (2.2%) |
Employment Occupations by Sex in Granite Falls
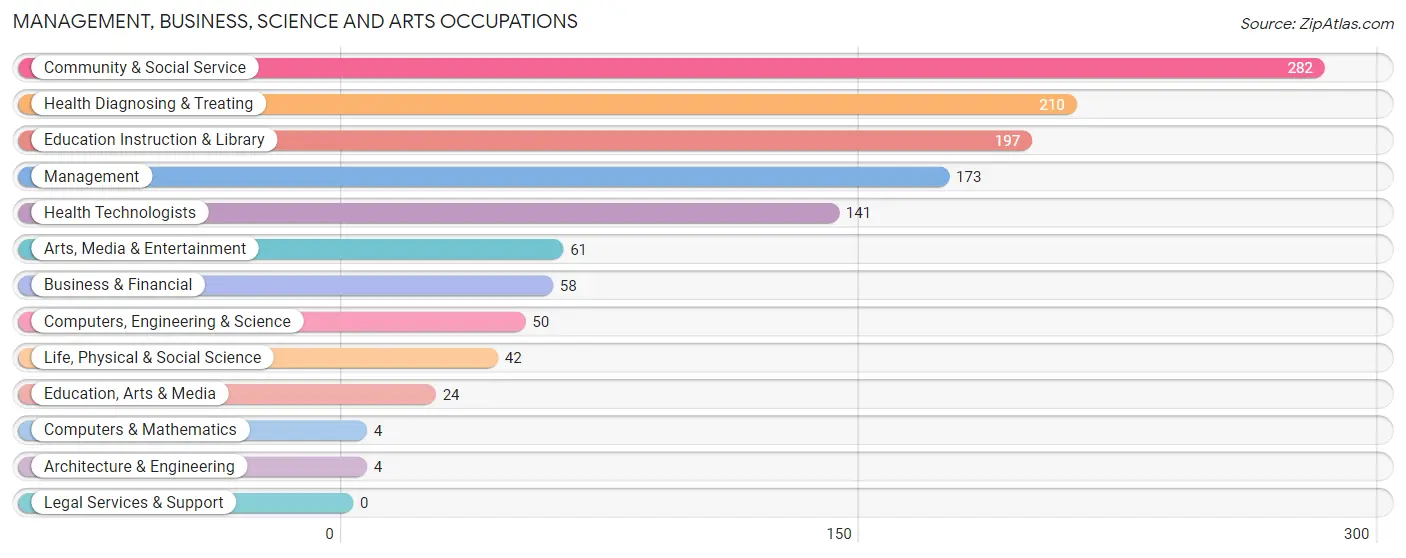
Management, Business, Science and Arts Occupations
The most common Management, Business, Science and Arts occupations in Granite Falls are Community & Social Service (282 | 12.7%), Health Diagnosing & Treating (210 | 9.5%), Education Instruction & Library (197 | 8.9%), Management (173 | 7.8%), and Health Technologists (141 | 6.4%).
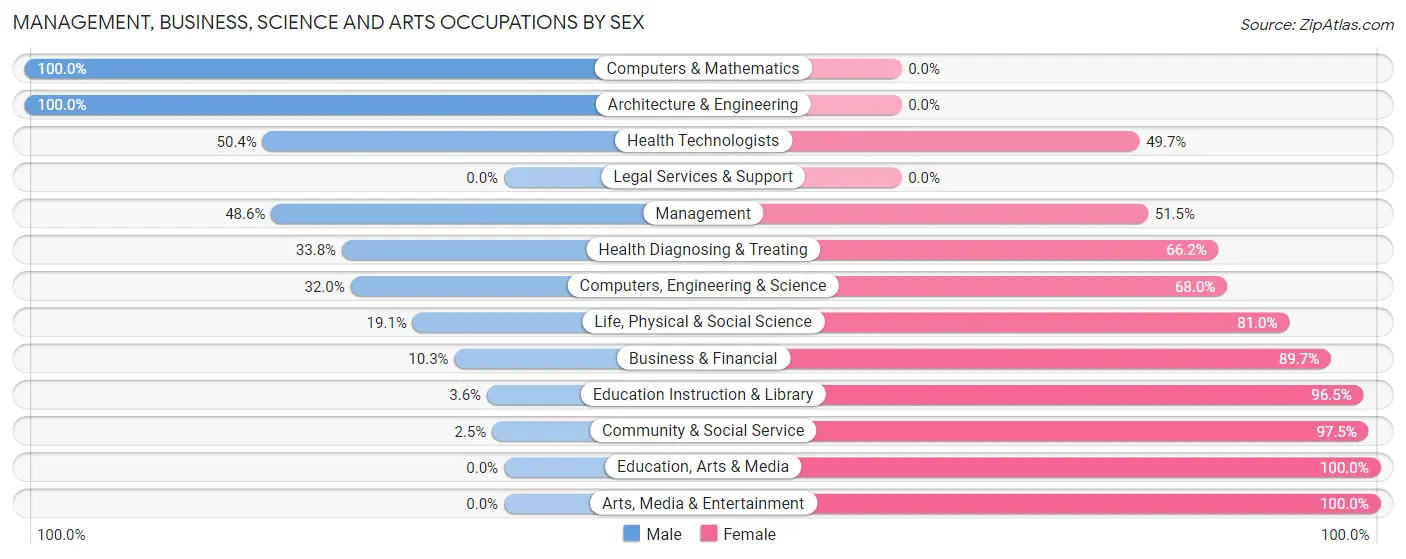
Management, Business, Science and Arts Occupations by Sex
Within the Management, Business, Science and Arts occupations in Granite Falls, the most male-oriented occupations are Computers & Mathematics (100.0%), Architecture & Engineering (100.0%), and Health Technologists (50.3%), while the most female-oriented occupations are Education, Arts & Media (100.0%), Arts, Media & Entertainment (100.0%), and Community & Social Service (97.5%).
| Occupation | Male | Female |
| Management | 84 (48.5%) | 89 (51.4%) |
| Business & Financial | 6 (10.3%) | 52 (89.7%) |
| Computers, Engineering & Science | 16 (32.0%) | 34 (68.0%) |
| Computers & Mathematics | 4 (100.0%) | 0 (0.0%) |
| Architecture & Engineering | 4 (100.0%) | 0 (0.0%) |
| Life, Physical & Social Science | 8 (19.1%) | 34 (80.9%) |
| Community & Social Service | 7 (2.5%) | 275 (97.5%) |
| Education, Arts & Media | 0 (0.0%) | 24 (100.0%) |
| Legal Services & Support | 0 (0.0%) | 0 (0.0%) |
| Education Instruction & Library | 7 (3.5%) | 190 (96.5%) |
| Arts, Media & Entertainment | 0 (0.0%) | 61 (100.0%) |
| Health Diagnosing & Treating | 71 (33.8%) | 139 (66.2%) |
| Health Technologists | 71 (50.3%) | 70 (49.6%) |
| Total (Category) | 184 (23.8%) | 589 (76.2%) |
| Total (Overall) | 1,065 (48.0%) | 1,153 (52.0%) |
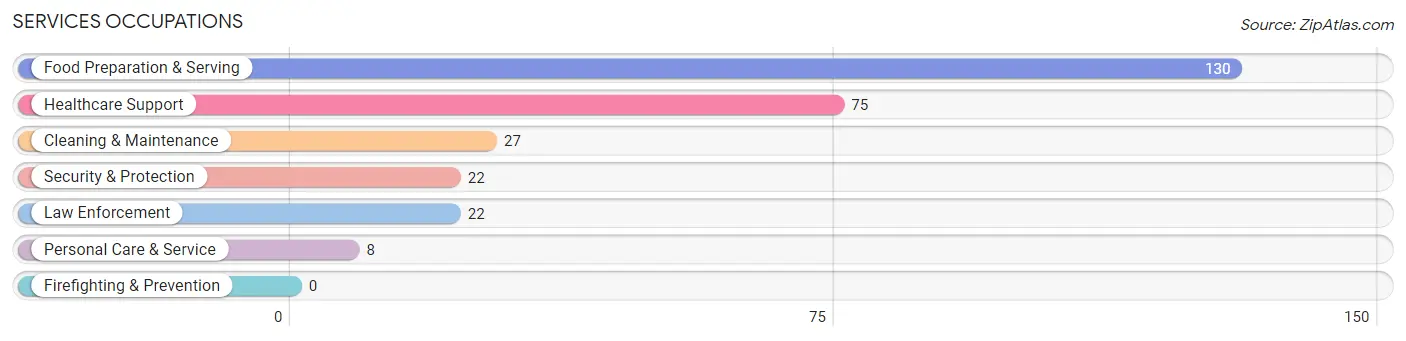
Services Occupations
The most common Services occupations in Granite Falls are Food Preparation & Serving (130 | 5.9%), Healthcare Support (75 | 3.4%), Cleaning & Maintenance (27 | 1.2%), Security & Protection (22 | 1.0%), and Law Enforcement (22 | 1.0%).
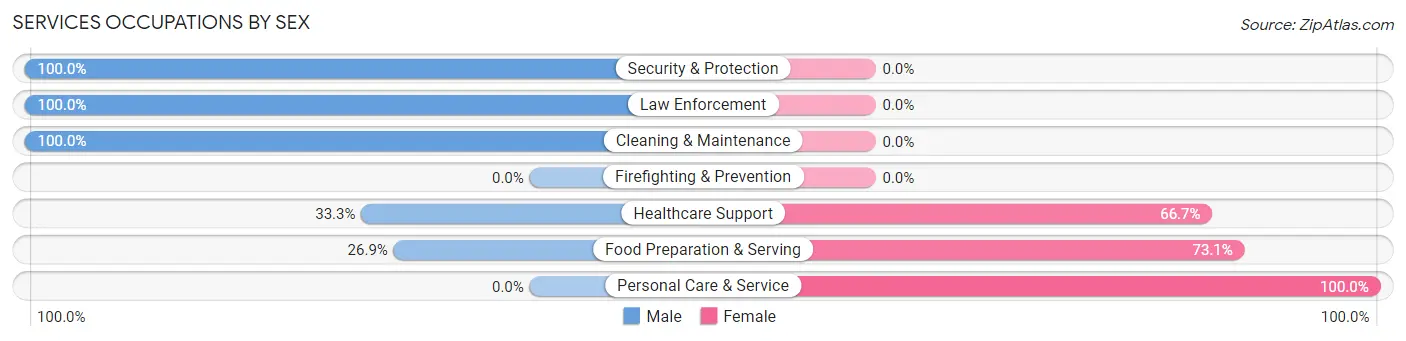
Services Occupations by Sex
Within the Services occupations in Granite Falls, the most male-oriented occupations are Security & Protection (100.0%), Law Enforcement (100.0%), and Cleaning & Maintenance (100.0%), while the most female-oriented occupations are Personal Care & Service (100.0%), Food Preparation & Serving (73.1%), and Healthcare Support (66.7%).
| Occupation | Male | Female |
| Healthcare Support | 25 (33.3%) | 50 (66.7%) |
| Security & Protection | 22 (100.0%) | 0 (0.0%) |
| Firefighting & Prevention | 0 (0.0%) | 0 (0.0%) |
| Law Enforcement | 22 (100.0%) | 0 (0.0%) |
| Food Preparation & Serving | 35 (26.9%) | 95 (73.1%) |
| Cleaning & Maintenance | 27 (100.0%) | 0 (0.0%) |
| Personal Care & Service | 0 (0.0%) | 8 (100.0%) |
| Total (Category) | 109 (41.6%) | 153 (58.4%) |
| Total (Overall) | 1,065 (48.0%) | 1,153 (52.0%) |
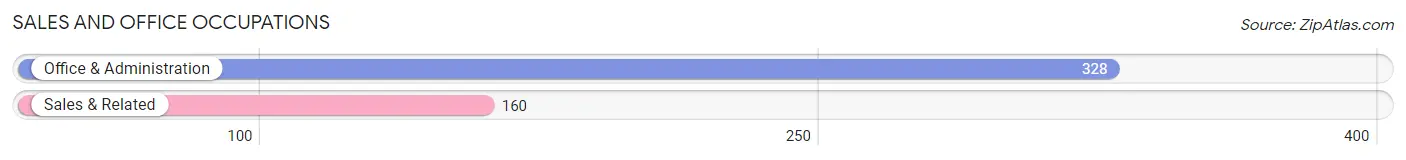
Sales and Office Occupations
The most common Sales and Office occupations in Granite Falls are Office & Administration (328 | 14.8%), and Sales & Related (160 | 7.2%).
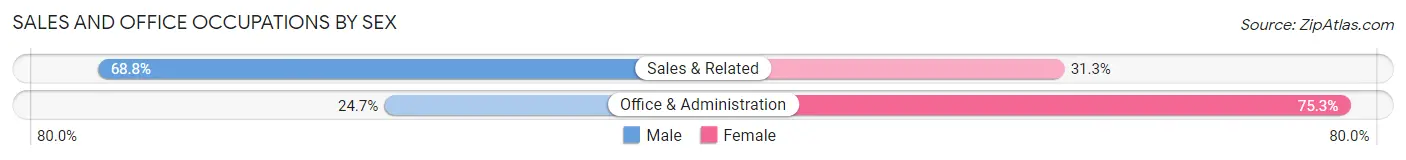
Sales and Office Occupations by Sex
| Occupation | Male | Female |
| Sales & Related | 110 (68.8%) | 50 (31.2%) |
| Office & Administration | 81 (24.7%) | 247 (75.3%) |
| Total (Category) | 191 (39.1%) | 297 (60.9%) |
| Total (Overall) | 1,065 (48.0%) | 1,153 (52.0%) |
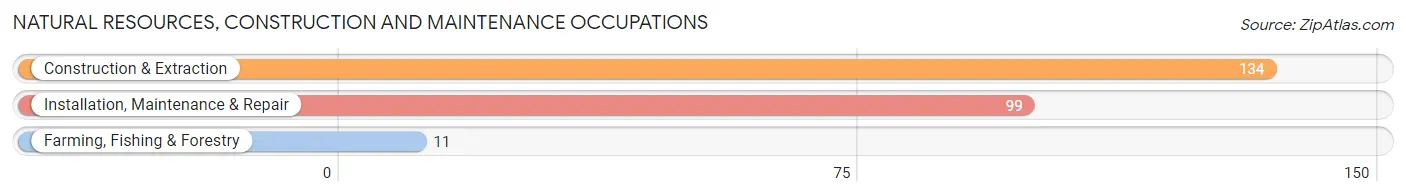
Natural Resources, Construction and Maintenance Occupations
The most common Natural Resources, Construction and Maintenance occupations in Granite Falls are Construction & Extraction (134 | 6.0%), Installation, Maintenance & Repair (99 | 4.5%), and Farming, Fishing & Forestry (11 | 0.5%).
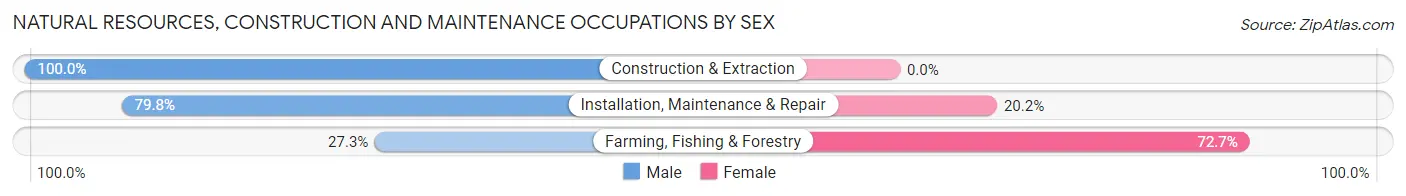
Natural Resources, Construction and Maintenance Occupations by Sex
| Occupation | Male | Female |
| Farming, Fishing & Forestry | 3 (27.3%) | 8 (72.7%) |
| Construction & Extraction | 134 (100.0%) | 0 (0.0%) |
| Installation, Maintenance & Repair | 79 (79.8%) | 20 (20.2%) |
| Total (Category) | 216 (88.5%) | 28 (11.5%) |
| Total (Overall) | 1,065 (48.0%) | 1,153 (52.0%) |
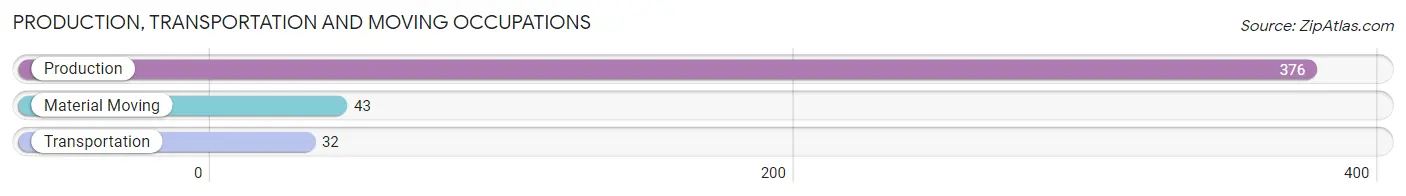
Production, Transportation and Moving Occupations
The most common Production, Transportation and Moving occupations in Granite Falls are Production (376 | 17.0%), Material Moving (43 | 1.9%), and Transportation (32 | 1.4%).
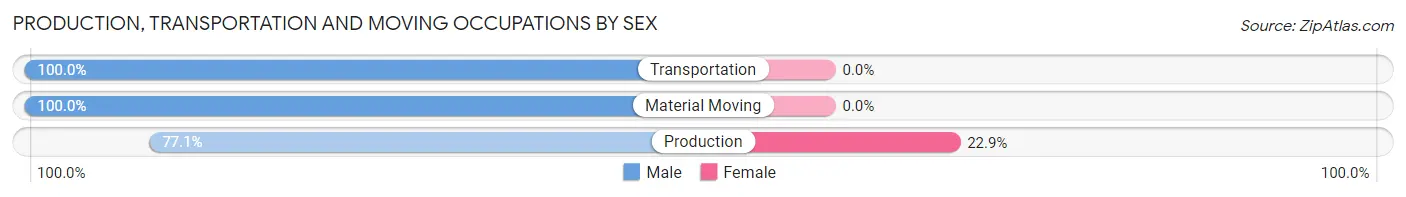
Production, Transportation and Moving Occupations by Sex
| Occupation | Male | Female |
| Production | 290 (77.1%) | 86 (22.9%) |
| Transportation | 32 (100.0%) | 0 (0.0%) |
| Material Moving | 43 (100.0%) | 0 (0.0%) |
| Total (Category) | 365 (80.9%) | 86 (19.1%) |
| Total (Overall) | 1,065 (48.0%) | 1,153 (52.0%) |
Employment Industries by Sex in Granite Falls
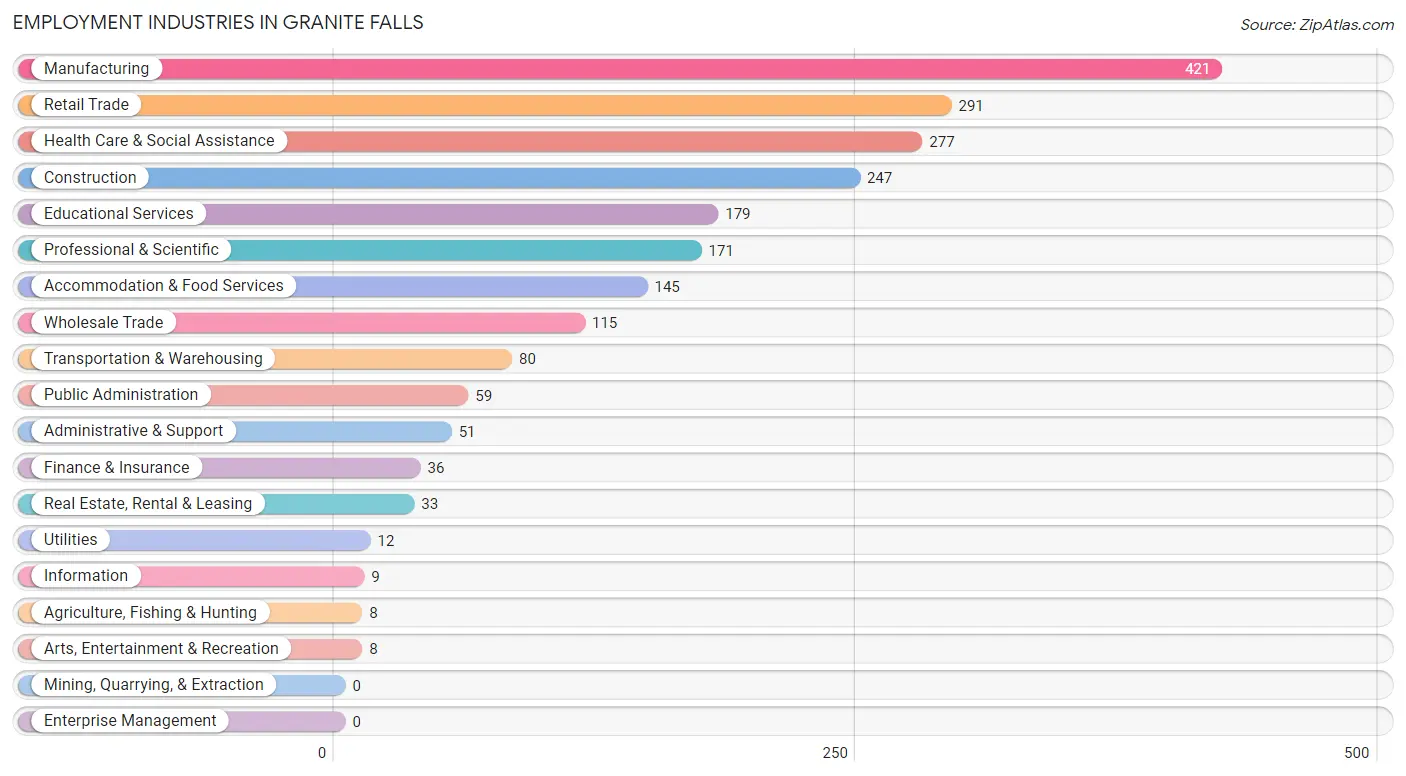
Employment Industries in Granite Falls
The major employment industries in Granite Falls include Manufacturing (421 | 19.0%), Retail Trade (291 | 13.1%), Health Care & Social Assistance (277 | 12.5%), Construction (247 | 11.1%), and Educational Services (179 | 8.1%).
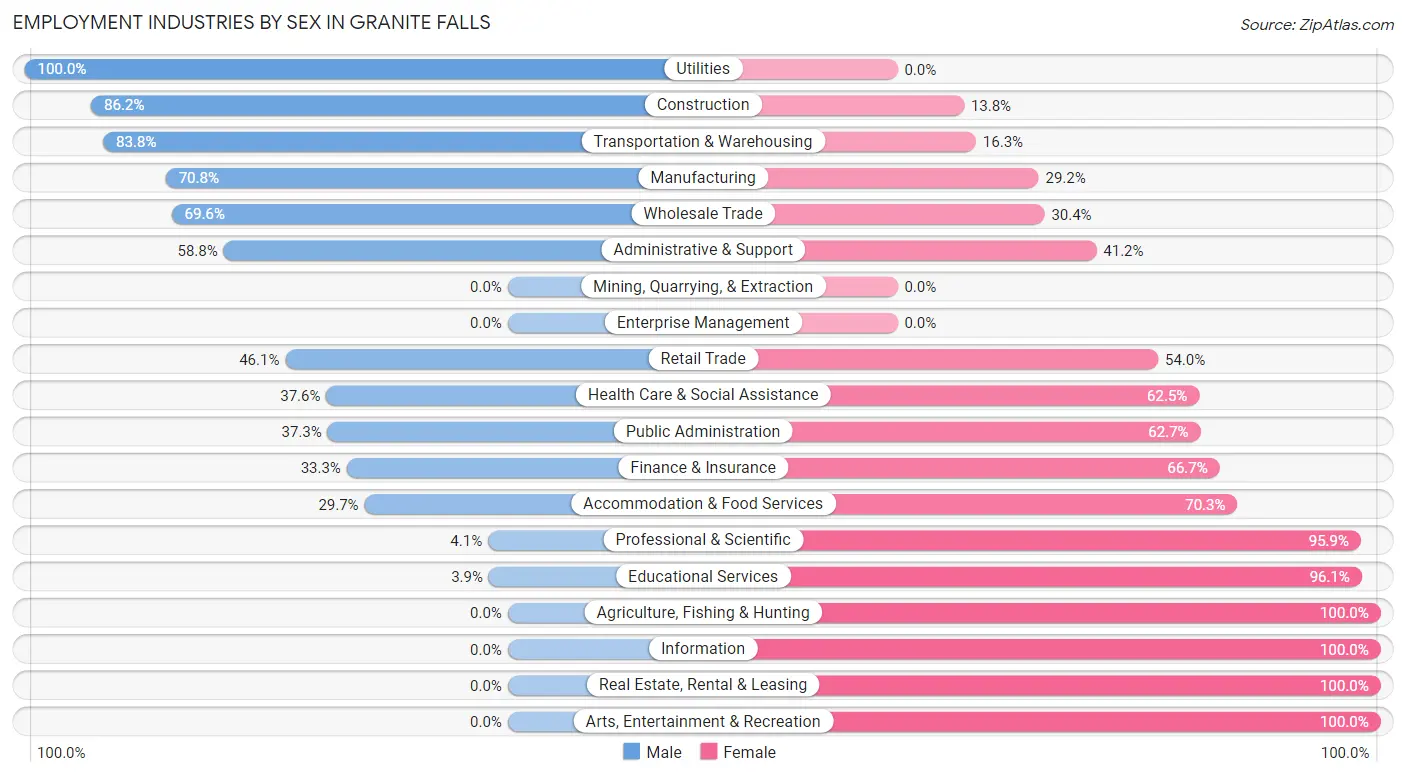
Employment Industries by Sex in Granite Falls
The Granite Falls industries that see more men than women are Utilities (100.0%), Construction (86.2%), and Transportation & Warehousing (83.8%), whereas the industries that tend to have a higher number of women are Agriculture, Fishing & Hunting (100.0%), Information (100.0%), and Real Estate, Rental & Leasing (100.0%).
| Industry | Male | Female |
| Agriculture, Fishing & Hunting | 0 (0.0%) | 8 (100.0%) |
| Mining, Quarrying, & Extraction | 0 (0.0%) | 0 (0.0%) |
| Construction | 213 (86.2%) | 34 (13.8%) |
| Manufacturing | 298 (70.8%) | 123 (29.2%) |
| Wholesale Trade | 80 (69.6%) | 35 (30.4%) |
| Retail Trade | 134 (46.1%) | 157 (53.9%) |
| Transportation & Warehousing | 67 (83.8%) | 13 (16.3%) |
| Utilities | 12 (100.0%) | 0 (0.0%) |
| Information | 0 (0.0%) | 9 (100.0%) |
| Finance & Insurance | 12 (33.3%) | 24 (66.7%) |
| Real Estate, Rental & Leasing | 0 (0.0%) | 33 (100.0%) |
| Professional & Scientific | 7 (4.1%) | 164 (95.9%) |
| Enterprise Management | 0 (0.0%) | 0 (0.0%) |
| Administrative & Support | 30 (58.8%) | 21 (41.2%) |
| Educational Services | 7 (3.9%) | 172 (96.1%) |
| Health Care & Social Assistance | 104 (37.6%) | 173 (62.5%) |
| Arts, Entertainment & Recreation | 0 (0.0%) | 8 (100.0%) |
| Accommodation & Food Services | 43 (29.7%) | 102 (70.3%) |
| Public Administration | 22 (37.3%) | 37 (62.7%) |
| Total | 1,065 (48.0%) | 1,153 (52.0%) |
Education in Granite Falls
School Enrollment in Granite Falls
The most common levels of schooling among the 1,073 students in Granite Falls are middle school (326 | 30.4%), elementary school (259 | 24.1%), and high school (256 | 23.9%).
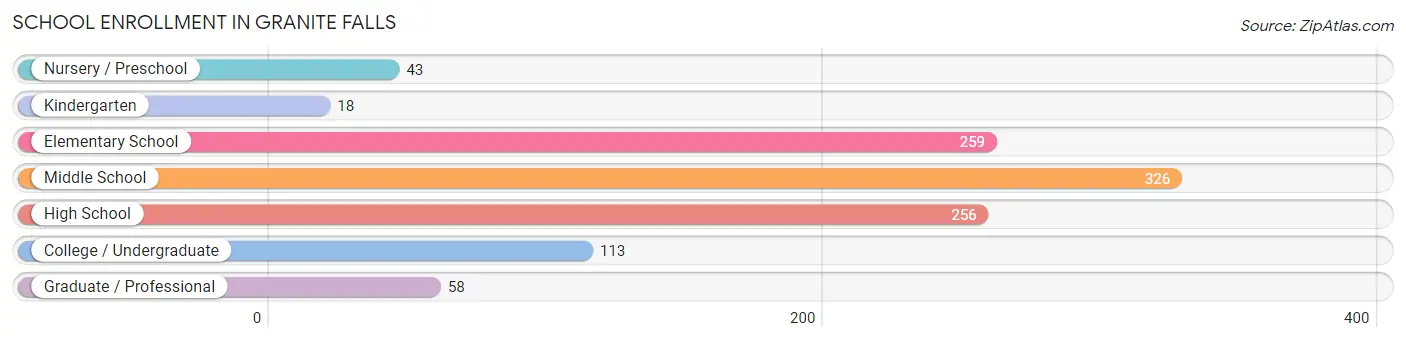
| School Level | # Students | % Students |
| Nursery / Preschool | 43 | 4.0% |
| Kindergarten | 18 | 1.7% |
| Elementary School | 259 | 24.1% |
| Middle School | 326 | 30.4% |
| High School | 256 | 23.9% |
| College / Undergraduate | 113 | 10.5% |
| Graduate / Professional | 58 | 5.4% |
| Total | 1,073 | 100.0% |
School Enrollment by Age by Funding Source in Granite Falls
Out of a total of 1,073 students who are enrolled in schools in Granite Falls, 204 (19.0%) attend a private institution, while the remaining 869 (81.0%) are enrolled in public schools. The age group of 3 to 4 year olds has the highest likelihood of being enrolled in private schools, with 43 (100.0% in the age bracket) enrolled. Conversely, the age group of 20 to 24 year olds has the lowest likelihood of being enrolled in a private school, with 81 (100.0% in the age bracket) attending a public institution.
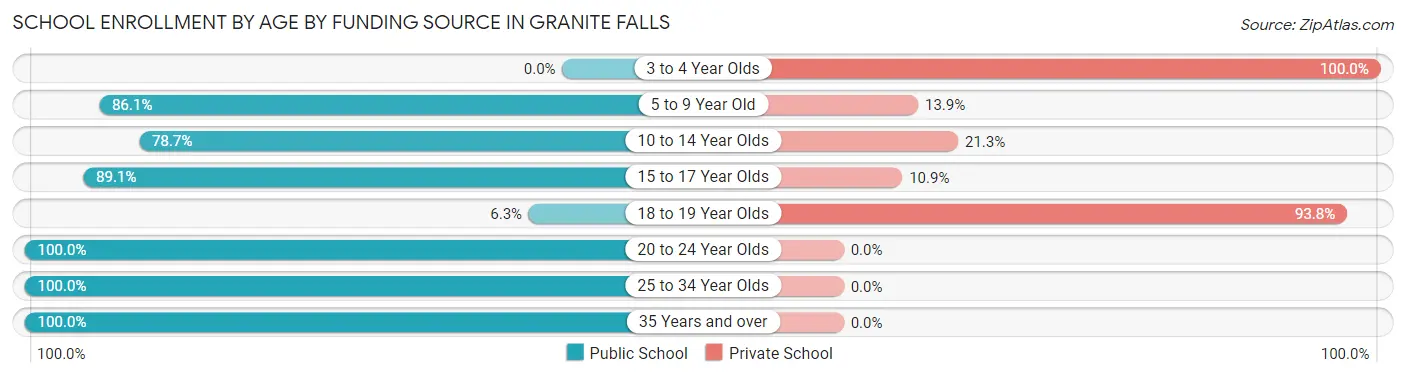
| Age Bracket | Public School | Private School |
| 3 to 4 Year Olds | 0 (0.0%) | 43 (100.0%) |
| 5 to 9 Year Old | 230 (86.1%) | 37 (13.9%) |
| 10 to 14 Year Olds | 336 (78.7%) | 91 (21.3%) |
| 15 to 17 Year Olds | 147 (89.1%) | 18 (10.9%) |
| 18 to 19 Year Olds | 1 (6.2%) | 15 (93.8%) |
| 20 to 24 Year Olds | 81 (100.0%) | 0 (0.0%) |
| 25 to 34 Year Olds | 45 (100.0%) | 0 (0.0%) |
| 35 Years and over | 29 (100.0%) | 0 (0.0%) |
| Total | 869 (81.0%) | 204 (19.0%) |
Educational Attainment by Field of Study in Granite Falls
Education (245 | 26.8%), science & technology (148 | 16.2%), psychology (110 | 12.0%), business (105 | 11.5%), and bio, nature & agricultural (85 | 9.3%) are the most common fields of study among 914 individuals in Granite Falls who have obtained a bachelor's degree or higher.
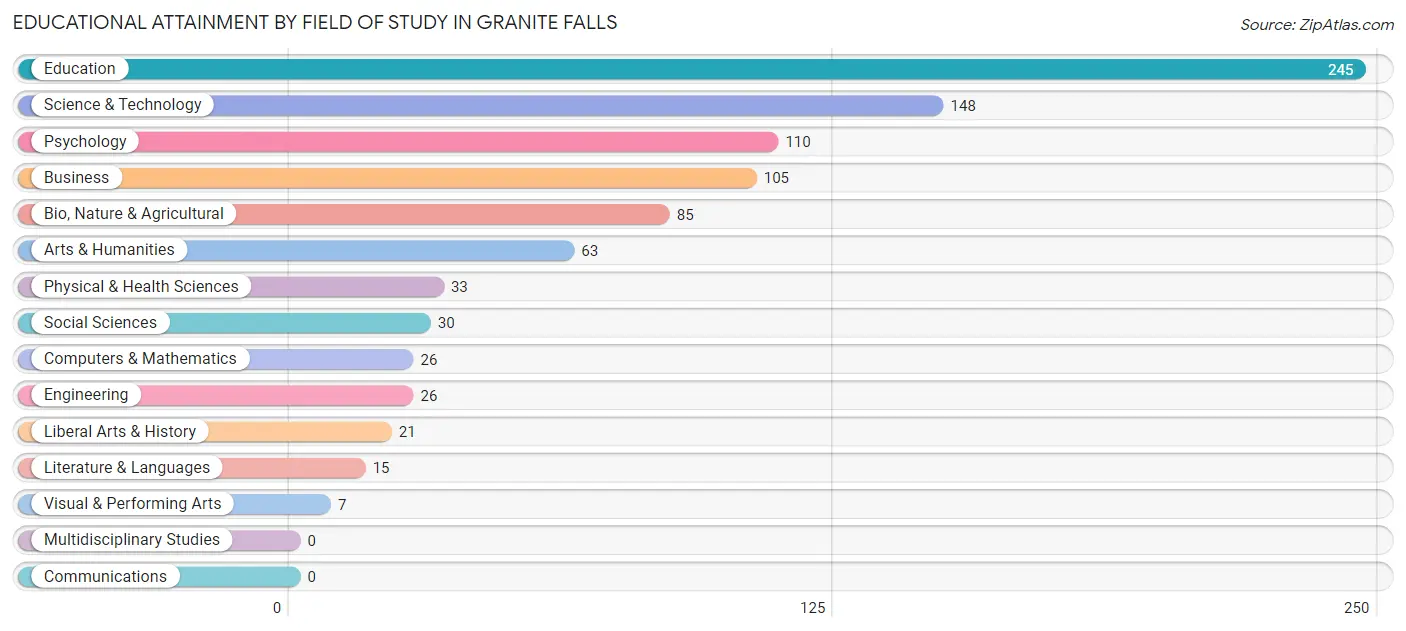
| Field of Study | # Graduates | % Graduates |
| Computers & Mathematics | 26 | 2.8% |
| Bio, Nature & Agricultural | 85 | 9.3% |
| Physical & Health Sciences | 33 | 3.6% |
| Psychology | 110 | 12.0% |
| Social Sciences | 30 | 3.3% |
| Engineering | 26 | 2.8% |
| Multidisciplinary Studies | 0 | 0.0% |
| Science & Technology | 148 | 16.2% |
| Business | 105 | 11.5% |
| Education | 245 | 26.8% |
| Literature & Languages | 15 | 1.6% |
| Liberal Arts & History | 21 | 2.3% |
| Visual & Performing Arts | 7 | 0.8% |
| Communications | 0 | 0.0% |
| Arts & Humanities | 63 | 6.9% |
| Total | 914 | 100.0% |
Transportation & Commute in Granite Falls
Vehicle Availability by Sex in Granite Falls
The most prevalent vehicle ownership categories in Granite Falls are males with 2 vehicles (381, accounting for 35.8%) and females with 2 vehicles (431, making up 34.0%).
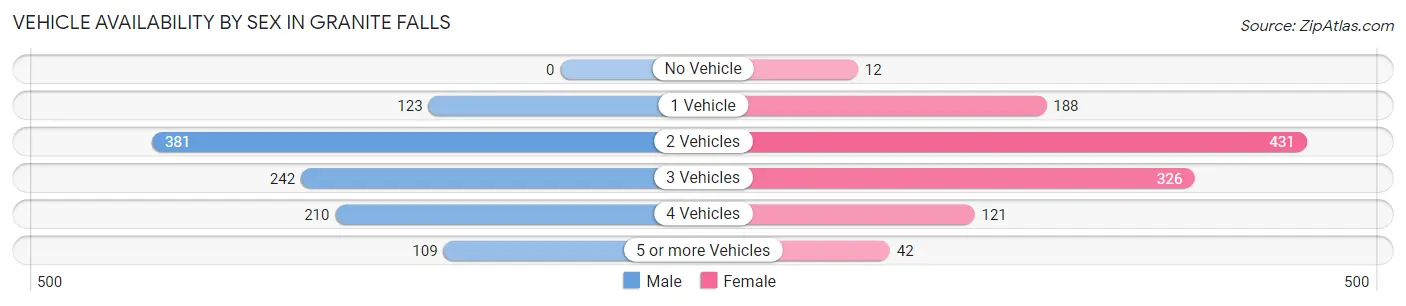
| Vehicles Available | Male | Female |
| No Vehicle | 0 (0.0%) | 12 (1.1%) |
| 1 Vehicle | 123 (11.6%) | 188 (16.8%) |
| 2 Vehicles | 381 (35.8%) | 431 (38.5%) |
| 3 Vehicles | 242 (22.7%) | 326 (29.1%) |
| 4 Vehicles | 210 (19.7%) | 121 (10.8%) |
| 5 or more Vehicles | 109 (10.2%) | 42 (3.7%) |
| Total | 1,065 (100.0%) | 1,120 (100.0%) |
Commute Time in Granite Falls
The most frequently occuring commute durations in Granite Falls are 20 to 24 minutes (501 commuters, 25.3%), 10 to 14 minutes (289 commuters, 14.6%), and 5 to 9 minutes (253 commuters, 12.8%).
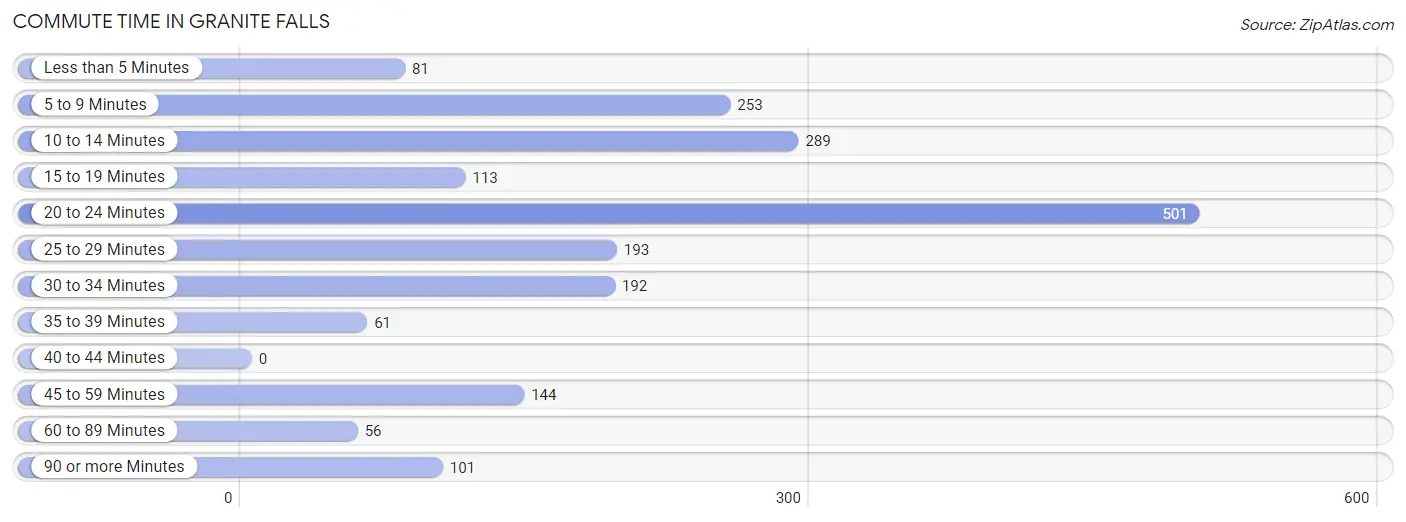
| Commute Time | # Commuters | % Commuters |
| Less than 5 Minutes | 81 | 4.1% |
| 5 to 9 Minutes | 253 | 12.8% |
| 10 to 14 Minutes | 289 | 14.6% |
| 15 to 19 Minutes | 113 | 5.7% |
| 20 to 24 Minutes | 501 | 25.3% |
| 25 to 29 Minutes | 193 | 9.7% |
| 30 to 34 Minutes | 192 | 9.7% |
| 35 to 39 Minutes | 61 | 3.1% |
| 40 to 44 Minutes | 0 | 0.0% |
| 45 to 59 Minutes | 144 | 7.3% |
| 60 to 89 Minutes | 56 | 2.8% |
| 90 or more Minutes | 101 | 5.1% |
Commute Time by Sex in Granite Falls
The most common commute times in Granite Falls are 20 to 24 minutes (288 commuters, 27.9%) for males and 10 to 14 minutes (214 commuters, 22.5%) for females.
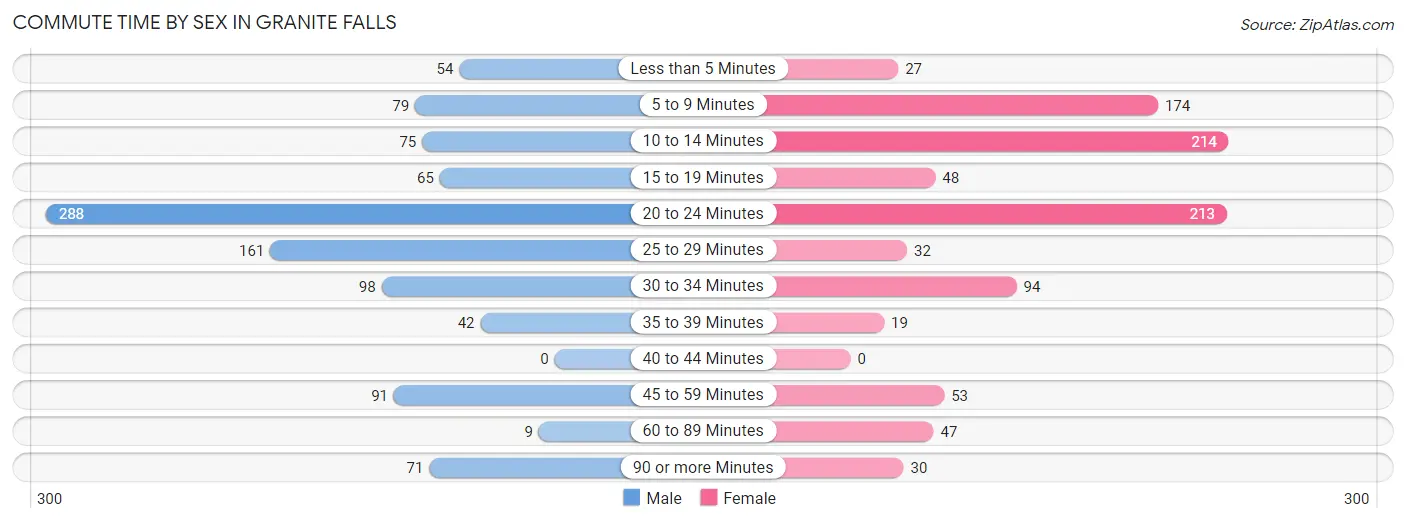
| Commute Time | Male | Female |
| Less than 5 Minutes | 54 (5.2%) | 27 (2.8%) |
| 5 to 9 Minutes | 79 (7.6%) | 174 (18.3%) |
| 10 to 14 Minutes | 75 (7.3%) | 214 (22.5%) |
| 15 to 19 Minutes | 65 (6.3%) | 48 (5.1%) |
| 20 to 24 Minutes | 288 (27.9%) | 213 (22.4%) |
| 25 to 29 Minutes | 161 (15.6%) | 32 (3.4%) |
| 30 to 34 Minutes | 98 (9.5%) | 94 (9.9%) |
| 35 to 39 Minutes | 42 (4.1%) | 19 (2.0%) |
| 40 to 44 Minutes | 0 (0.0%) | 0 (0.0%) |
| 45 to 59 Minutes | 91 (8.8%) | 53 (5.6%) |
| 60 to 89 Minutes | 9 (0.9%) | 47 (4.9%) |
| 90 or more Minutes | 71 (6.9%) | 30 (3.2%) |
Time of Departure to Work by Sex in Granite Falls
The most frequent times of departure to work in Granite Falls are 7:30 AM to 7:59 AM (208, 20.1%) for males and 7:00 AM to 7:29 AM (167, 17.6%) for females.
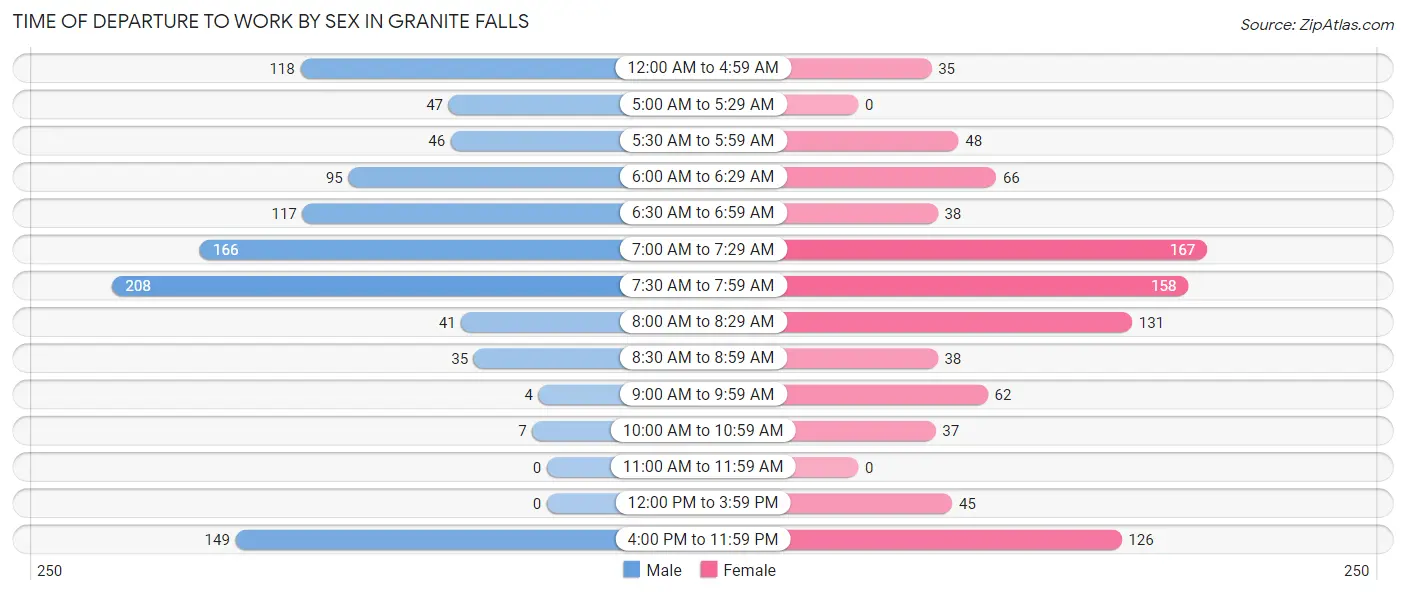
| Time of Departure | Male | Female |
| 12:00 AM to 4:59 AM | 118 (11.4%) | 35 (3.7%) |
| 5:00 AM to 5:29 AM | 47 (4.5%) | 0 (0.0%) |
| 5:30 AM to 5:59 AM | 46 (4.4%) | 48 (5.1%) |
| 6:00 AM to 6:29 AM | 95 (9.2%) | 66 (6.9%) |
| 6:30 AM to 6:59 AM | 117 (11.3%) | 38 (4.0%) |
| 7:00 AM to 7:29 AM | 166 (16.1%) | 167 (17.6%) |
| 7:30 AM to 7:59 AM | 208 (20.1%) | 158 (16.6%) |
| 8:00 AM to 8:29 AM | 41 (4.0%) | 131 (13.8%) |
| 8:30 AM to 8:59 AM | 35 (3.4%) | 38 (4.0%) |
| 9:00 AM to 9:59 AM | 4 (0.4%) | 62 (6.5%) |
| 10:00 AM to 10:59 AM | 7 (0.7%) | 37 (3.9%) |
| 11:00 AM to 11:59 AM | 0 (0.0%) | 0 (0.0%) |
| 12:00 PM to 3:59 PM | 0 (0.0%) | 45 (4.7%) |
| 4:00 PM to 11:59 PM | 149 (14.4%) | 126 (13.3%) |
| Total | 1,033 (100.0%) | 951 (100.0%) |
Housing Occupancy in Granite Falls
Occupancy by Ownership in Granite Falls
Of the total 1,686 dwellings in Granite Falls, owner-occupied units account for 1,188 (70.5%), while renter-occupied units make up 498 (29.5%).
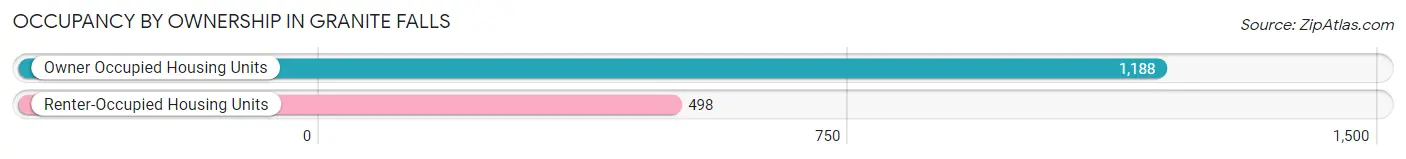
| Occupancy | # Housing Units | % Housing Units |
| Owner Occupied Housing Units | 1,188 | 70.5% |
| Renter-Occupied Housing Units | 498 | 29.5% |
| Total Occupied Housing Units | 1,686 | 100.0% |
Occupancy by Household Size in Granite Falls
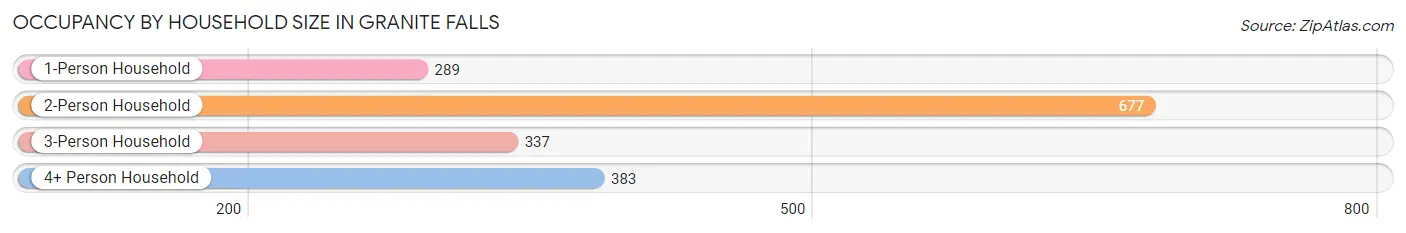
| Household Size | # Housing Units | % Housing Units |
| 1-Person Household | 289 | 17.1% |
| 2-Person Household | 677 | 40.2% |
| 3-Person Household | 337 | 20.0% |
| 4+ Person Household | 383 | 22.7% |
| Total Housing Units | 1,686 | 100.0% |
Occupancy by Ownership by Household Size in Granite Falls
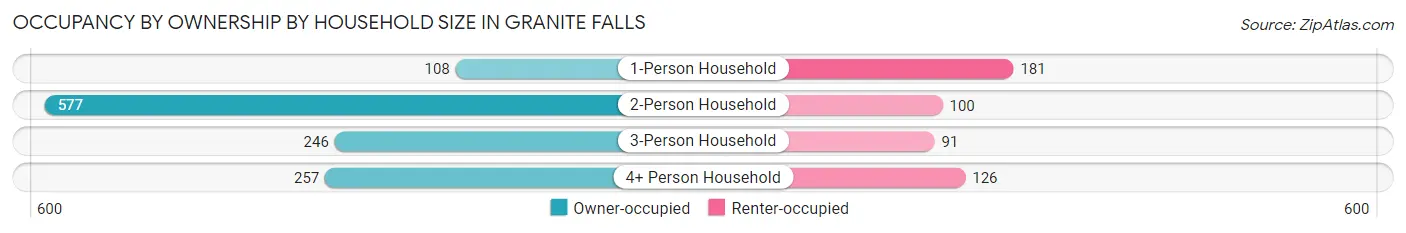
| Household Size | Owner-occupied | Renter-occupied |
| 1-Person Household | 108 (37.4%) | 181 (62.6%) |
| 2-Person Household | 577 (85.2%) | 100 (14.8%) |
| 3-Person Household | 246 (73.0%) | 91 (27.0%) |
| 4+ Person Household | 257 (67.1%) | 126 (32.9%) |
| Total Housing Units | 1,188 (70.5%) | 498 (29.5%) |
Occupancy by Educational Attainment in Granite Falls
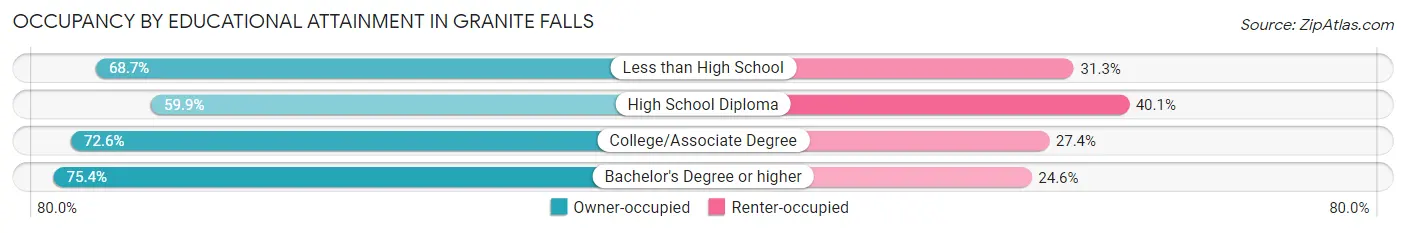
| Household Size | Owner-occupied | Renter-occupied |
| Less than High School | 125 (68.7%) | 57 (31.3%) |
| High School Diploma | 214 (59.9%) | 143 (40.1%) |
| College/Associate Degree | 411 (72.6%) | 155 (27.4%) |
| Bachelor's Degree or higher | 438 (75.4%) | 143 (24.6%) |
Occupancy by Age of Householder in Granite Falls
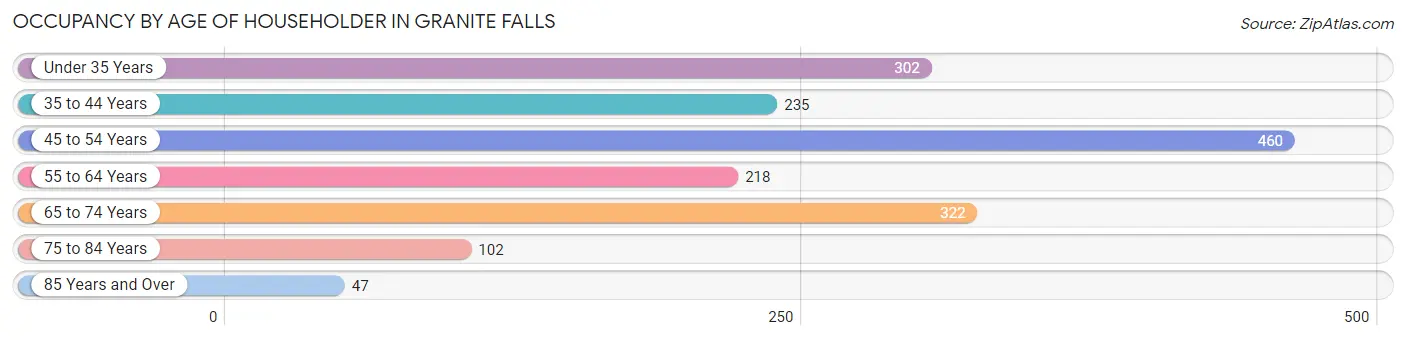
| Age Bracket | # Households | % Households |
| Under 35 Years | 302 | 17.9% |
| 35 to 44 Years | 235 | 13.9% |
| 45 to 54 Years | 460 | 27.3% |
| 55 to 64 Years | 218 | 12.9% |
| 65 to 74 Years | 322 | 19.1% |
| 75 to 84 Years | 102 | 6.0% |
| 85 Years and Over | 47 | 2.8% |
| Total | 1,686 | 100.0% |
Housing Finances in Granite Falls
Median Income by Occupancy in Granite Falls
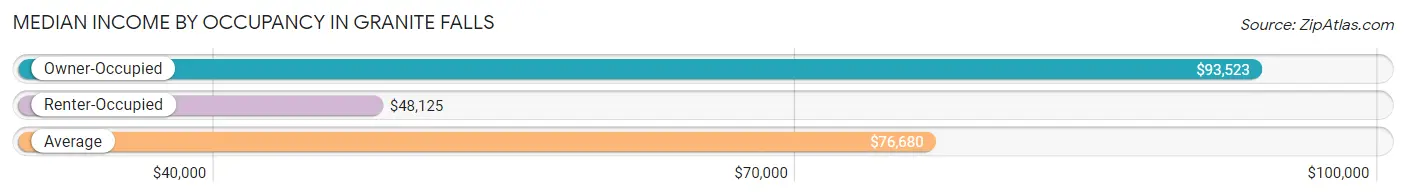
| Occupancy Type | # Households | Median Income |
| Owner-Occupied | 1,188 (70.5%) | $93,523 |
| Renter-Occupied | 498 (29.5%) | $48,125 |
| Average | 1,686 (100.0%) | $76,680 |
Occupancy by Householder Income Bracket in Granite Falls
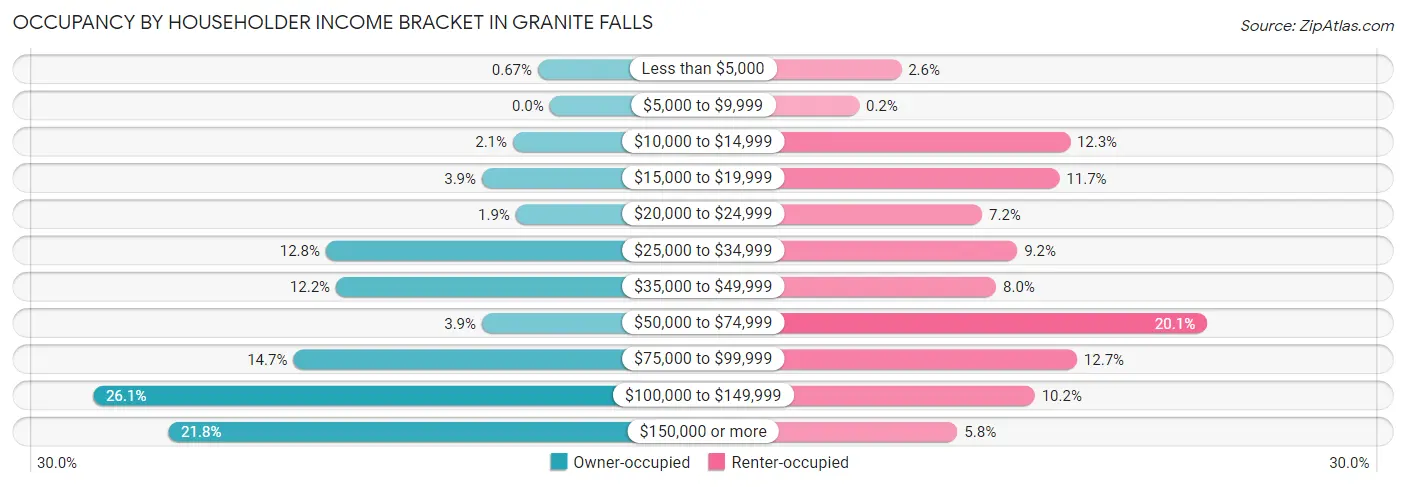
| Income Bracket | Owner-occupied | Renter-occupied |
| Less than $5,000 | 8 (0.7%) | 13 (2.6%) |
| $5,000 to $9,999 | 0 (0.0%) | 1 (0.2%) |
| $10,000 to $14,999 | 25 (2.1%) | 61 (12.2%) |
| $15,000 to $19,999 | 46 (3.9%) | 58 (11.7%) |
| $20,000 to $24,999 | 23 (1.9%) | 36 (7.2%) |
| $25,000 to $34,999 | 152 (12.8%) | 46 (9.2%) |
| $35,000 to $49,999 | 145 (12.2%) | 40 (8.0%) |
| $50,000 to $74,999 | 46 (3.9%) | 100 (20.1%) |
| $75,000 to $99,999 | 174 (14.6%) | 63 (12.7%) |
| $100,000 to $149,999 | 310 (26.1%) | 51 (10.2%) |
| $150,000 or more | 259 (21.8%) | 29 (5.8%) |
| Total | 1,188 (100.0%) | 498 (100.0%) |
Monthly Housing Cost Tiers in Granite Falls
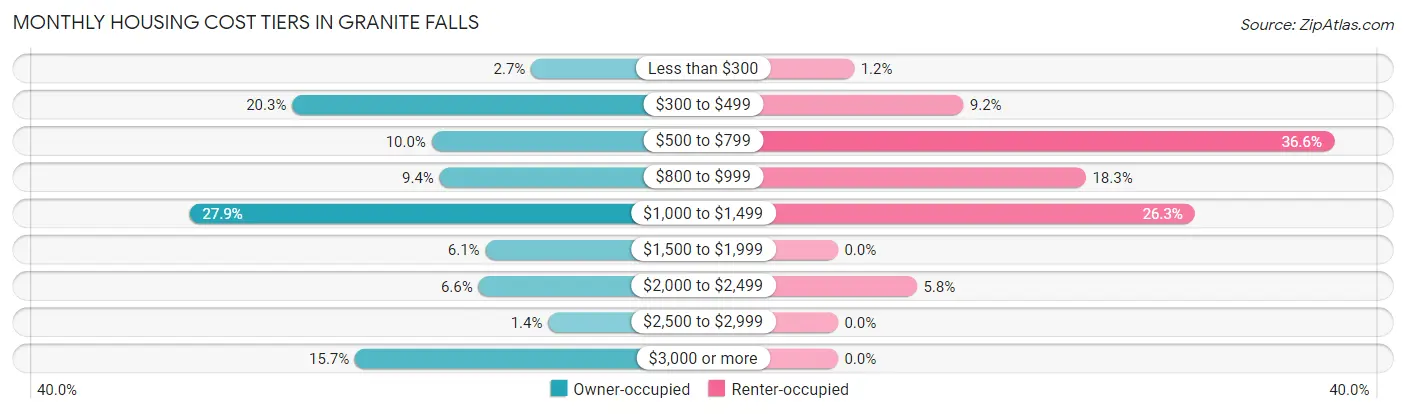
| Monthly Cost | Owner-occupied | Renter-occupied |
| Less than $300 | 32 (2.7%) | 6 (1.2%) |
| $300 to $499 | 241 (20.3%) | 46 (9.2%) |
| $500 to $799 | 119 (10.0%) | 182 (36.5%) |
| $800 to $999 | 112 (9.4%) | 91 (18.3%) |
| $1,000 to $1,499 | 331 (27.9%) | 131 (26.3%) |
| $1,500 to $1,999 | 72 (6.1%) | 0 (0.0%) |
| $2,000 to $2,499 | 78 (6.6%) | 29 (5.8%) |
| $2,500 to $2,999 | 17 (1.4%) | 0 (0.0%) |
| $3,000 or more | 186 (15.7%) | 0 (0.0%) |
| Total | 1,188 (100.0%) | 498 (100.0%) |
Physical Housing Characteristics in Granite Falls
Housing Structures in Granite Falls
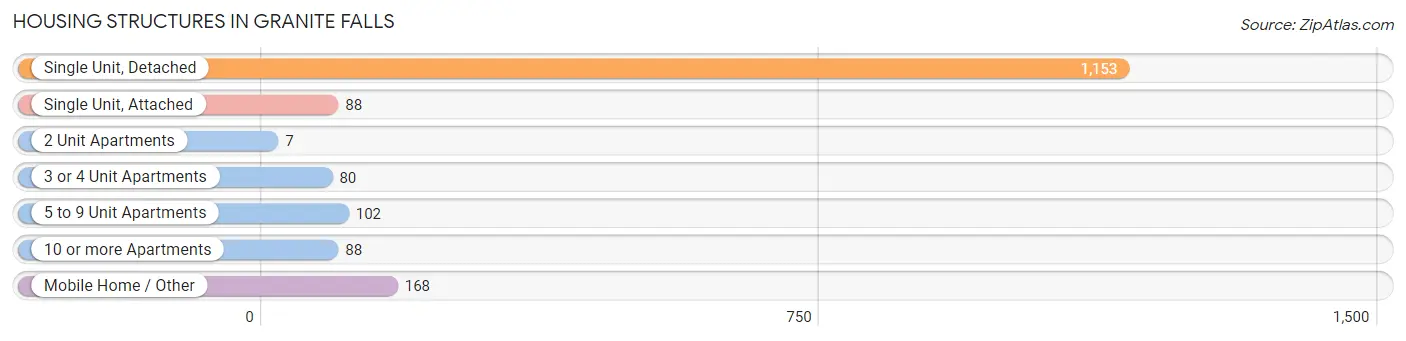
| Structure Type | # Housing Units | % Housing Units |
| Single Unit, Detached | 1,153 | 68.4% |
| Single Unit, Attached | 88 | 5.2% |
| 2 Unit Apartments | 7 | 0.4% |
| 3 or 4 Unit Apartments | 80 | 4.7% |
| 5 to 9 Unit Apartments | 102 | 6.0% |
| 10 or more Apartments | 88 | 5.2% |
| Mobile Home / Other | 168 | 10.0% |
| Total | 1,686 | 100.0% |
Housing Structures by Occupancy in Granite Falls
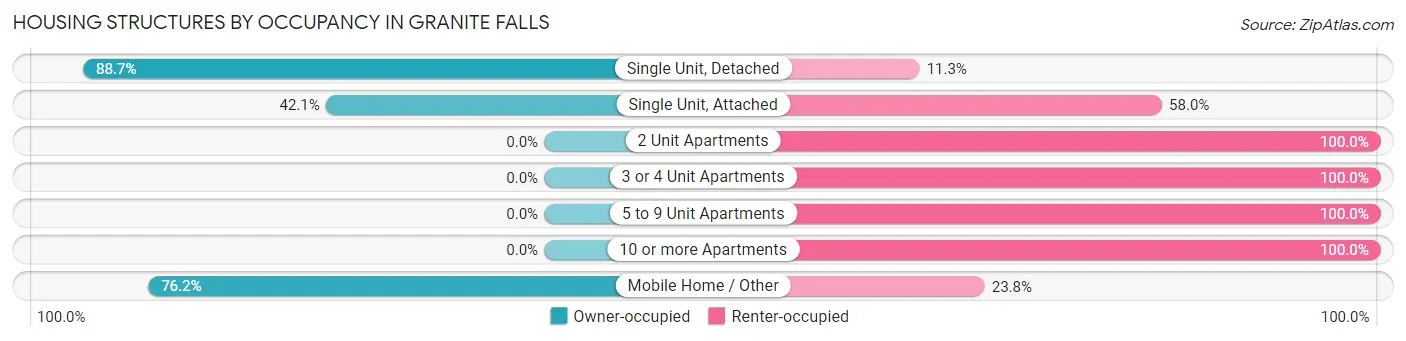
| Structure Type | Owner-occupied | Renter-occupied |
| Single Unit, Detached | 1,023 (88.7%) | 130 (11.3%) |
| Single Unit, Attached | 37 (42.0%) | 51 (58.0%) |
| 2 Unit Apartments | 0 (0.0%) | 7 (100.0%) |
| 3 or 4 Unit Apartments | 0 (0.0%) | 80 (100.0%) |
| 5 to 9 Unit Apartments | 0 (0.0%) | 102 (100.0%) |
| 10 or more Apartments | 0 (0.0%) | 88 (100.0%) |
| Mobile Home / Other | 128 (76.2%) | 40 (23.8%) |
| Total | 1,188 (70.5%) | 498 (29.5%) |
Housing Structures by Number of Rooms in Granite Falls
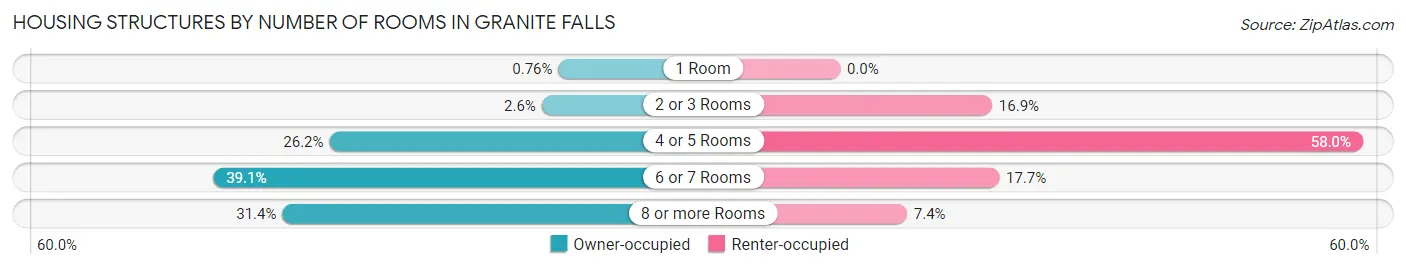
| Number of Rooms | Owner-occupied | Renter-occupied |
| 1 Room | 9 (0.8%) | 0 (0.0%) |
| 2 or 3 Rooms | 31 (2.6%) | 84 (16.9%) |
| 4 or 5 Rooms | 311 (26.2%) | 289 (58.0%) |
| 6 or 7 Rooms | 464 (39.1%) | 88 (17.7%) |
| 8 or more Rooms | 373 (31.4%) | 37 (7.4%) |
| Total | 1,188 (100.0%) | 498 (100.0%) |
Housing Structure by Heating Type in Granite Falls
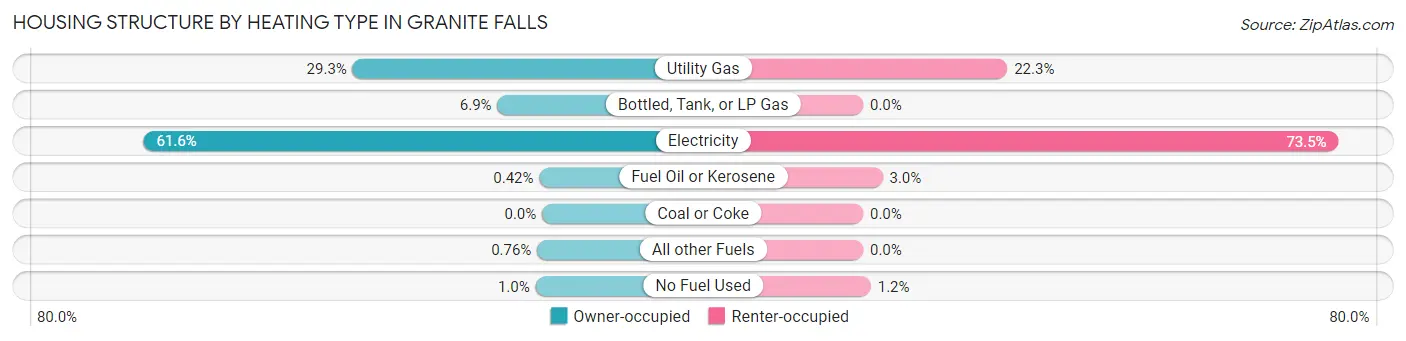
| Heating Type | Owner-occupied | Renter-occupied |
| Utility Gas | 348 (29.3%) | 111 (22.3%) |
| Bottled, Tank, or LP Gas | 82 (6.9%) | 0 (0.0%) |
| Electricity | 732 (61.6%) | 366 (73.5%) |
| Fuel Oil or Kerosene | 5 (0.4%) | 15 (3.0%) |
| Coal or Coke | 0 (0.0%) | 0 (0.0%) |
| All other Fuels | 9 (0.8%) | 0 (0.0%) |
| No Fuel Used | 12 (1.0%) | 6 (1.2%) |
| Total | 1,188 (100.0%) | 498 (100.0%) |
Household Vehicle Usage in Granite Falls
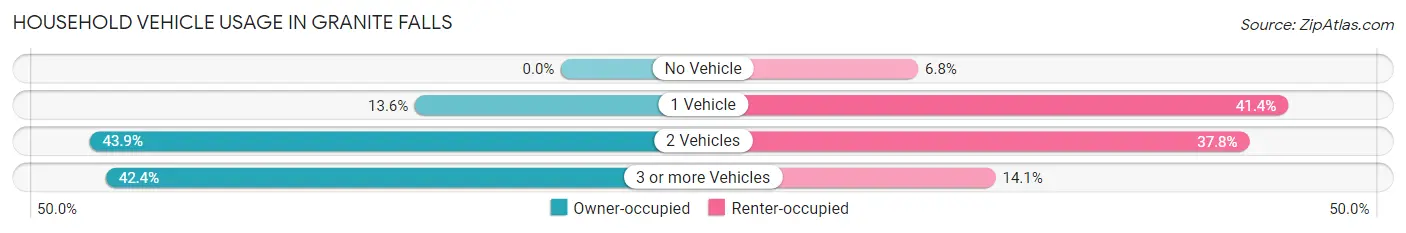
| Vehicles per Household | Owner-occupied | Renter-occupied |
| No Vehicle | 0 (0.0%) | 34 (6.8%) |
| 1 Vehicle | 162 (13.6%) | 206 (41.4%) |
| 2 Vehicles | 522 (43.9%) | 188 (37.8%) |
| 3 or more Vehicles | 504 (42.4%) | 70 (14.1%) |
| Total | 1,188 (100.0%) | 498 (100.0%) |
Real Estate & Mortgages in Granite Falls
Real Estate and Mortgage Overview in Granite Falls
| Characteristic | Without Mortgage | With Mortgage |
| Housing Units | 423 | 765 |
| Median Property Value | $163,600 | $228,900 |
| Median Household Income | $37,969 | $218 |
| Monthly Housing Costs | $428 | $176 |
| Real Estate Taxes | $990 | $16 |
Property Value by Mortgage Status in Granite Falls
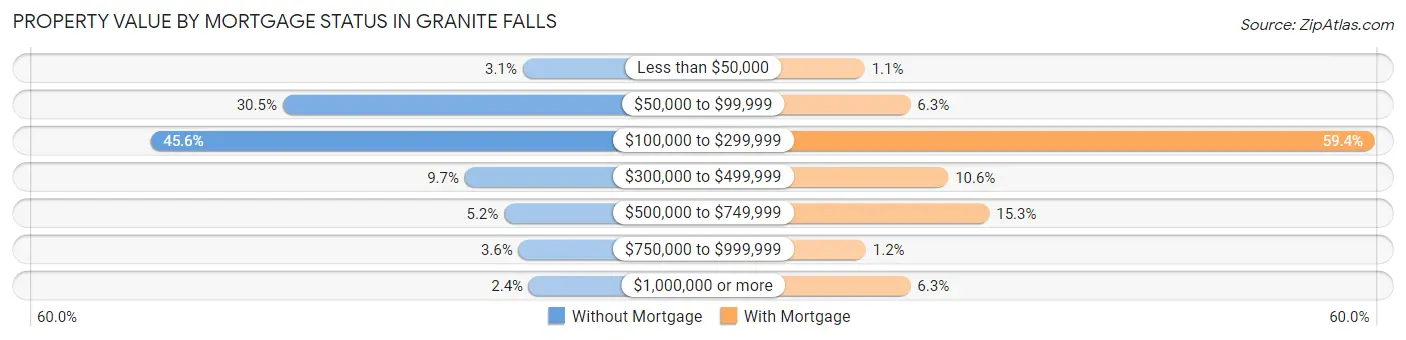
| Property Value | Without Mortgage | With Mortgage |
| Less than $50,000 | 13 (3.1%) | 8 (1.1%) |
| $50,000 to $99,999 | 129 (30.5%) | 48 (6.3%) |
| $100,000 to $299,999 | 193 (45.6%) | 454 (59.4%) |
| $300,000 to $499,999 | 41 (9.7%) | 81 (10.6%) |
| $500,000 to $749,999 | 22 (5.2%) | 117 (15.3%) |
| $750,000 to $999,999 | 15 (3.5%) | 9 (1.2%) |
| $1,000,000 or more | 10 (2.4%) | 48 (6.3%) |
| Total | 423 (100.0%) | 765 (100.0%) |
Household Income by Mortgage Status in Granite Falls
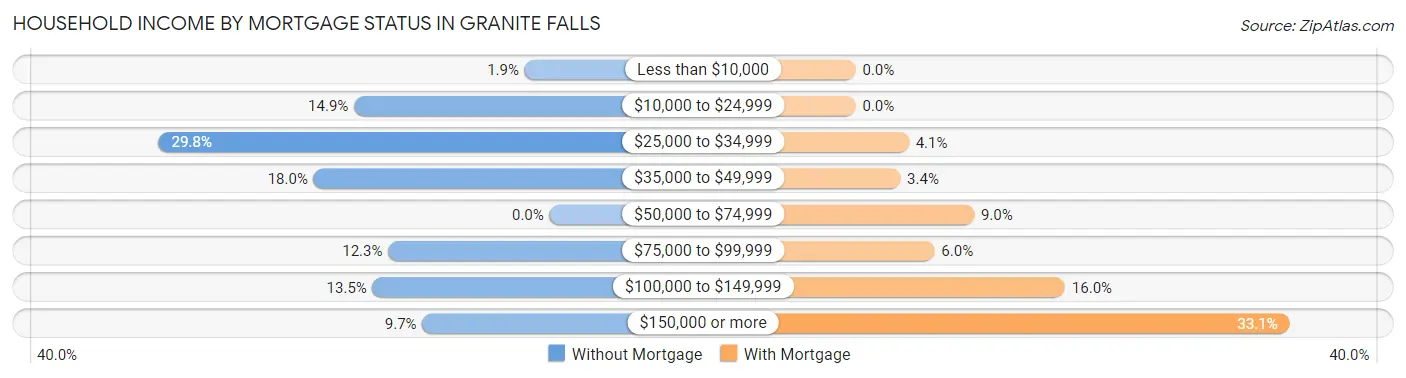
| Household Income | Without Mortgage | With Mortgage |
| Less than $10,000 | 8 (1.9%) | 0 (0.0%) |
| $10,000 to $24,999 | 63 (14.9%) | 0 (0.0%) |
| $25,000 to $34,999 | 126 (29.8%) | 31 (4.1%) |
| $35,000 to $49,999 | 76 (18.0%) | 26 (3.4%) |
| $50,000 to $74,999 | 0 (0.0%) | 69 (9.0%) |
| $75,000 to $99,999 | 52 (12.3%) | 46 (6.0%) |
| $100,000 to $149,999 | 57 (13.5%) | 122 (16.0%) |
| $150,000 or more | 41 (9.7%) | 253 (33.1%) |
| Total | 423 (100.0%) | 765 (100.0%) |
Property Value to Household Income Ratio in Granite Falls
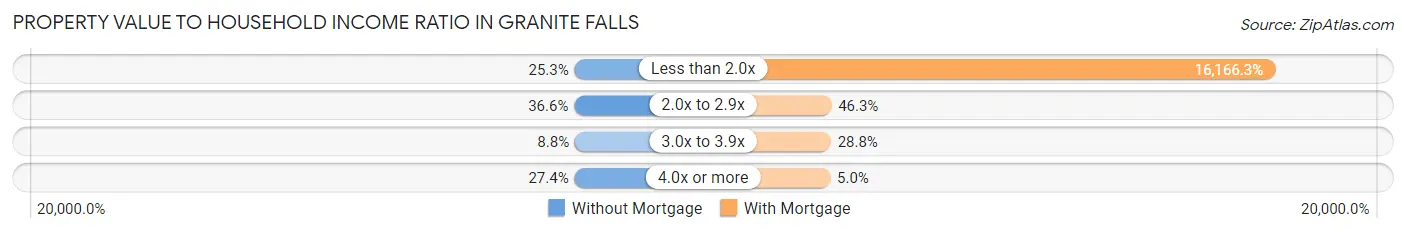
| Value-to-Income Ratio | Without Mortgage | With Mortgage |
| Less than 2.0x | 107 (25.3%) | 123,672 (16,166.3%) |
| 2.0x to 2.9x | 155 (36.6%) | 354 (46.3%) |
| 3.0x to 3.9x | 37 (8.7%) | 220 (28.8%) |
| 4.0x or more | 116 (27.4%) | 38 (5.0%) |
| Total | 423 (100.0%) | 765 (100.0%) |
Real Estate Taxes by Mortgage Status in Granite Falls
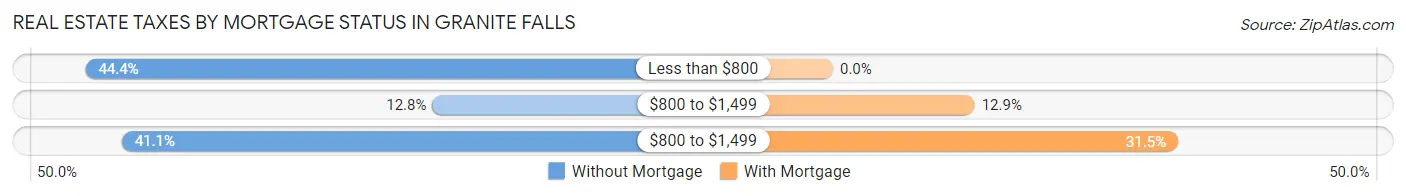
| Property Taxes | Without Mortgage | With Mortgage |
| Less than $800 | 188 (44.4%) | 0 (0.0%) |
| $800 to $1,499 | 54 (12.8%) | 99 (12.9%) |
| $800 to $1,499 | 174 (41.1%) | 241 (31.5%) |
| Total | 423 (100.0%) | 765 (100.0%) |
Health & Disability in Granite Falls
Health Insurance Coverage by Age in Granite Falls
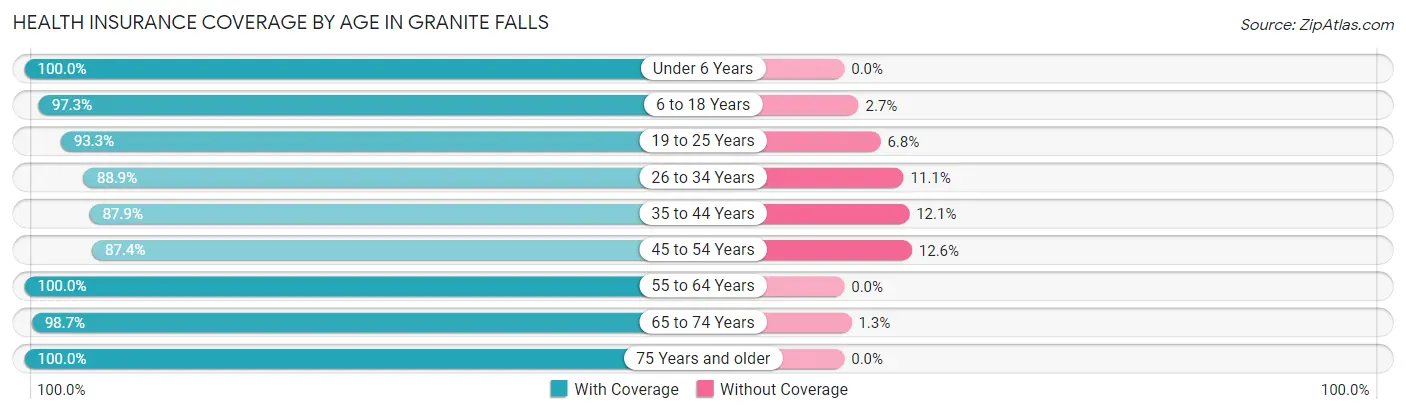
| Age Bracket | With Coverage | Without Coverage |
| Under 6 Years | 349 (100.0%) | 0 (0.0%) |
| 6 to 18 Years | 843 (97.3%) | 23 (2.7%) |
| 19 to 25 Years | 387 (93.2%) | 28 (6.8%) |
| 26 to 34 Years | 410 (88.9%) | 51 (11.1%) |
| 35 to 44 Years | 450 (87.9%) | 62 (12.1%) |
| 45 to 54 Years | 666 (87.4%) | 96 (12.6%) |
| 55 to 64 Years | 533 (100.0%) | 0 (0.0%) |
| 65 to 74 Years | 521 (98.7%) | 7 (1.3%) |
| 75 Years and older | 392 (100.0%) | 0 (0.0%) |
| Total | 4,551 (94.5%) | 267 (5.5%) |
Health Insurance Coverage by Citizenship Status in Granite Falls
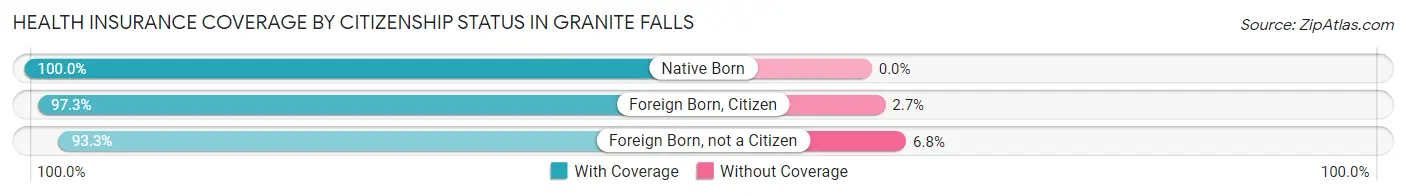
| Citizenship Status | With Coverage | Without Coverage |
| Native Born | 349 (100.0%) | 0 (0.0%) |
| Foreign Born, Citizen | 843 (97.3%) | 23 (2.7%) |
| Foreign Born, not a Citizen | 387 (93.2%) | 28 (6.8%) |
Health Insurance Coverage by Household Income in Granite Falls
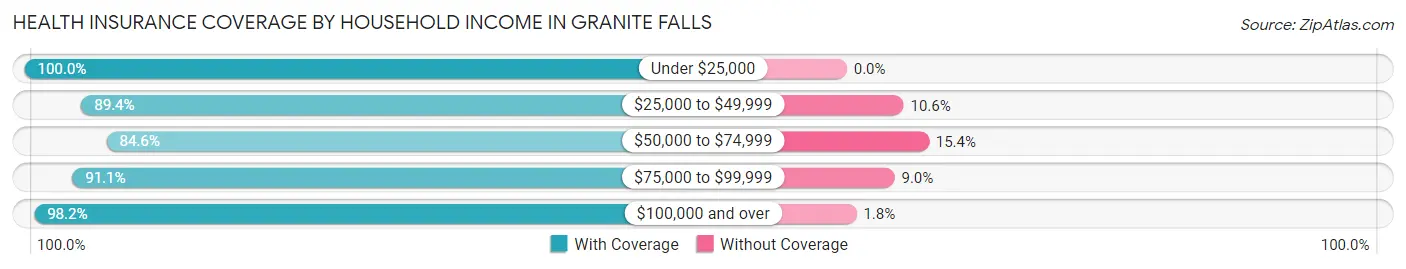
| Household Income | With Coverage | Without Coverage |
| Under $25,000 | 616 (100.0%) | 0 (0.0%) |
| $25,000 to $49,999 | 840 (89.4%) | 100 (10.6%) |
| $50,000 to $74,999 | 259 (84.6%) | 47 (15.4%) |
| $75,000 to $99,999 | 824 (91.0%) | 81 (8.9%) |
| $100,000 and over | 2,006 (98.2%) | 37 (1.8%) |
Public vs Private Health Insurance Coverage by Age in Granite Falls
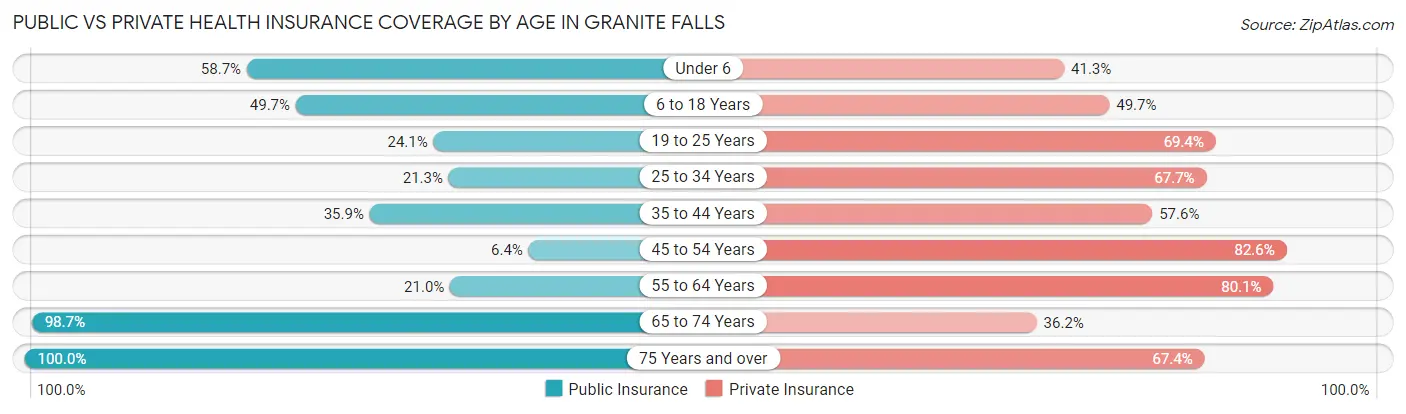
| Age Bracket | Public Insurance | Private Insurance |
| Under 6 | 205 (58.7%) | 144 (41.3%) |
| 6 to 18 Years | 430 (49.6%) | 430 (49.6%) |
| 19 to 25 Years | 100 (24.1%) | 288 (69.4%) |
| 25 to 34 Years | 98 (21.3%) | 312 (67.7%) |
| 35 to 44 Years | 184 (35.9%) | 295 (57.6%) |
| 45 to 54 Years | 49 (6.4%) | 629 (82.6%) |
| 55 to 64 Years | 112 (21.0%) | 427 (80.1%) |
| 65 to 74 Years | 521 (98.7%) | 191 (36.2%) |
| 75 Years and over | 392 (100.0%) | 264 (67.3%) |
| Total | 2,091 (43.4%) | 2,980 (61.9%) |
Disability Status by Sex by Age in Granite Falls
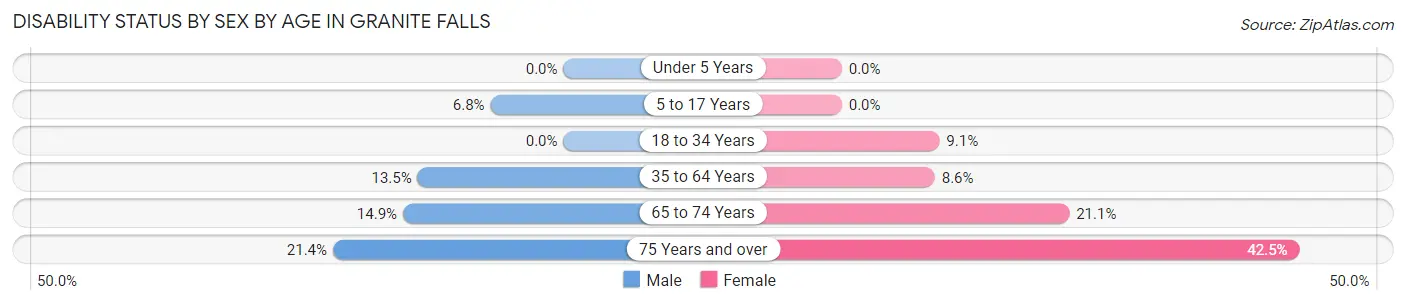
| Age Bracket | Male | Female |
| Under 5 Years | 0 (0.0%) | 0 (0.0%) |
| 5 to 17 Years | 35 (6.8%) | 0 (0.0%) |
| 18 to 34 Years | 0 (0.0%) | 46 (9.1%) |
| 35 to 64 Years | 105 (13.5%) | 89 (8.6%) |
| 65 to 74 Years | 49 (14.9%) | 42 (21.1%) |
| 75 Years and over | 37 (21.4%) | 93 (42.5%) |
Disability Class by Sex by Age in Granite Falls
Disability Class: Hearing Difficulty
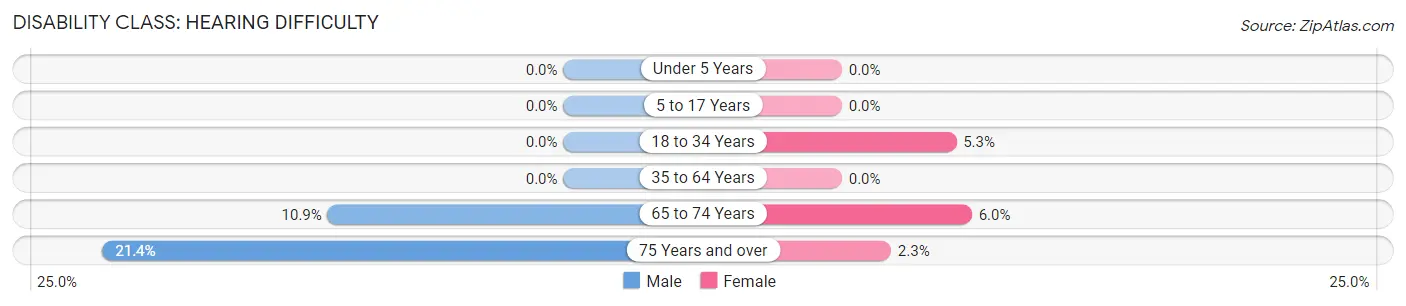
| Age Bracket | Male | Female |
| Under 5 Years | 0 (0.0%) | 0 (0.0%) |
| 5 to 17 Years | 0 (0.0%) | 0 (0.0%) |
| 18 to 34 Years | 0 (0.0%) | 27 (5.3%) |
| 35 to 64 Years | 0 (0.0%) | 0 (0.0%) |
| 65 to 74 Years | 36 (10.9%) | 12 (6.0%) |
| 75 Years and over | 37 (21.4%) | 5 (2.3%) |
Disability Class: Vision Difficulty
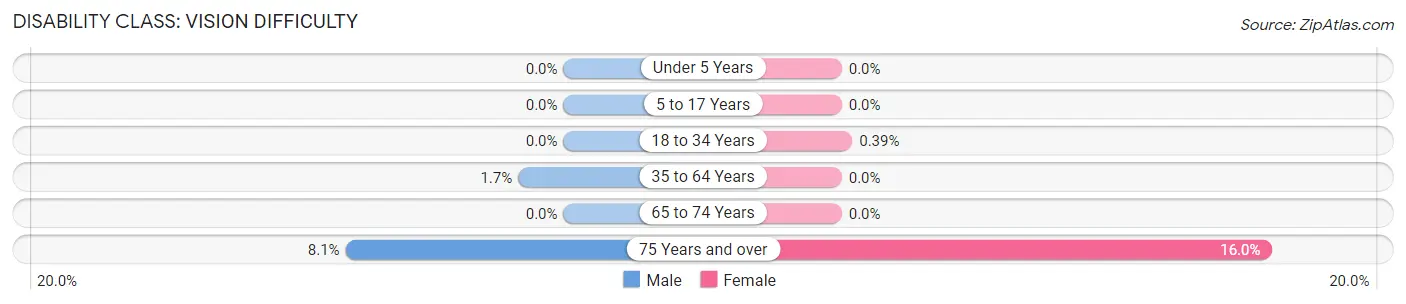
| Age Bracket | Male | Female |
| Under 5 Years | 0 (0.0%) | 0 (0.0%) |
| 5 to 17 Years | 0 (0.0%) | 0 (0.0%) |
| 18 to 34 Years | 0 (0.0%) | 2 (0.4%) |
| 35 to 64 Years | 13 (1.7%) | 0 (0.0%) |
| 65 to 74 Years | 0 (0.0%) | 0 (0.0%) |
| 75 Years and over | 14 (8.1%) | 35 (16.0%) |
Disability Class: Cognitive Difficulty
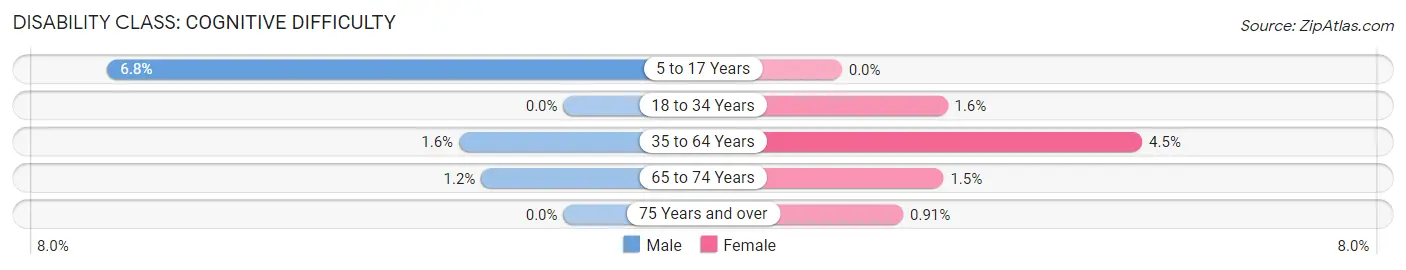
| Age Bracket | Male | Female |
| 5 to 17 Years | 35 (6.8%) | 0 (0.0%) |
| 18 to 34 Years | 0 (0.0%) | 8 (1.6%) |
| 35 to 64 Years | 12 (1.5%) | 46 (4.5%) |
| 65 to 74 Years | 4 (1.2%) | 3 (1.5%) |
| 75 Years and over | 0 (0.0%) | 2 (0.9%) |
Disability Class: Ambulatory Difficulty
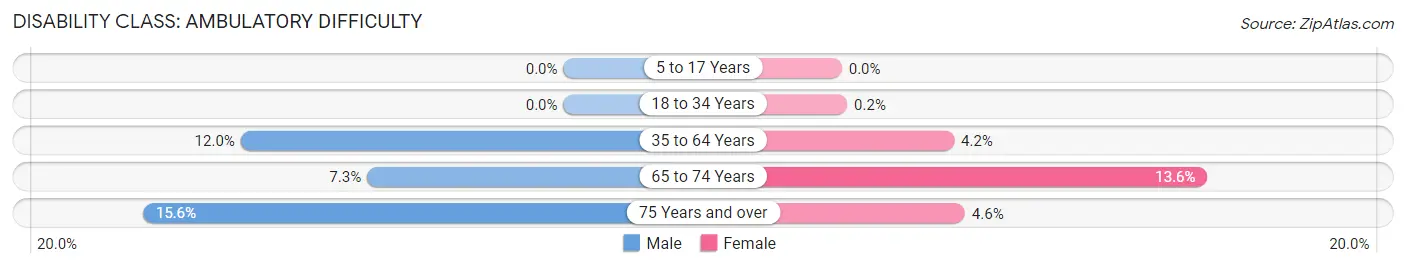
| Age Bracket | Male | Female |
| 5 to 17 Years | 0 (0.0%) | 0 (0.0%) |
| 18 to 34 Years | 0 (0.0%) | 1 (0.2%) |
| 35 to 64 Years | 93 (12.0%) | 43 (4.2%) |
| 65 to 74 Years | 24 (7.3%) | 27 (13.6%) |
| 75 Years and over | 27 (15.6%) | 10 (4.6%) |
Disability Class: Self-Care Difficulty
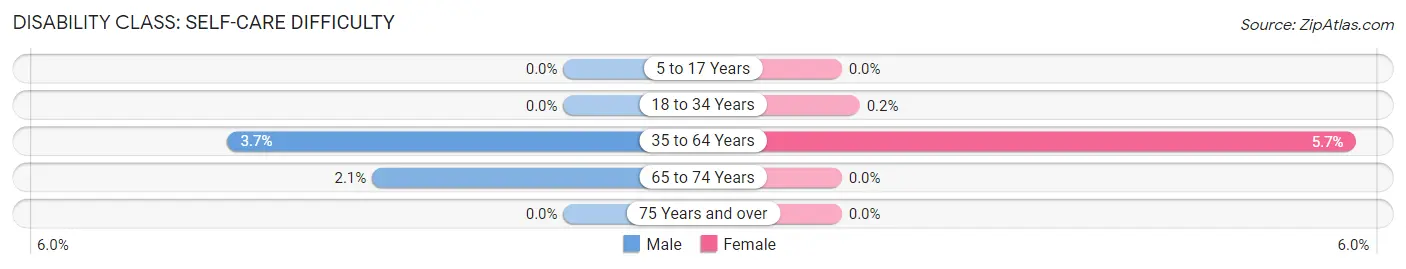
| Age Bracket | Male | Female |
| 5 to 17 Years | 0 (0.0%) | 0 (0.0%) |
| 18 to 34 Years | 0 (0.0%) | 1 (0.2%) |
| 35 to 64 Years | 29 (3.7%) | 59 (5.7%) |
| 65 to 74 Years | 7 (2.1%) | 0 (0.0%) |
| 75 Years and over | 0 (0.0%) | 0 (0.0%) |
Technology Access in Granite Falls
Computing Device Access in Granite Falls
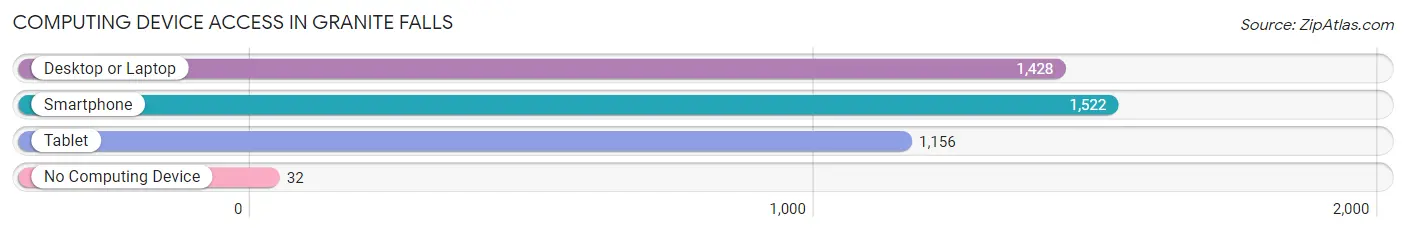
| Device Type | # Households | % Households |
| Desktop or Laptop | 1,428 | 84.7% |
| Smartphone | 1,522 | 90.3% |
| Tablet | 1,156 | 68.6% |
| No Computing Device | 32 | 1.9% |
| Total | 1,686 | 100.0% |
Internet Access in Granite Falls
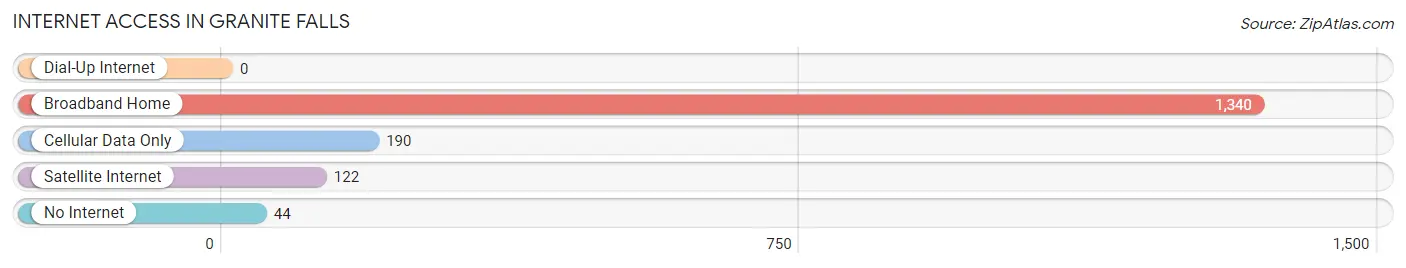
| Internet Type | # Households | % Households |
| Dial-Up Internet | 0 | 0.0% |
| Broadband Home | 1,340 | 79.5% |
| Cellular Data Only | 190 | 11.3% |
| Satellite Internet | 122 | 7.2% |
| No Internet | 44 | 2.6% |
| Total | 1,686 | 100.0% |
Granite Falls Summary
Granite Falls is a small town located in Caldwell County, North Carolina. It is situated in the foothills of the Blue Ridge Mountains, approximately 40 miles northeast of Charlotte. The town was founded in 1883 and has a population of approximately 4,000 people.
Geography
Granite Falls is located in the foothills of the Blue Ridge Mountains, approximately 40 miles northeast of Charlotte. The town is situated on the Catawba River, which is a major tributary of the Yadkin River. The town is surrounded by rolling hills and is home to several small lakes and streams. The town is located at an elevation of 890 feet above sea level.
History
Granite Falls was founded in 1883 by a group of settlers from the nearby town of Lenoir. The town was named after the nearby granite quarry, which provided the stone for many of the buildings in the area. The town quickly grew and by the early 1900s, it had become a thriving community. The town was home to several mills, including a cotton mill, a sawmill, and a gristmill.
In the early 1900s, the town was also home to a thriving tourist industry. The town was home to several resorts, including the Granite Falls Hotel and the Granite Falls Inn. The town was also home to several amusement parks, including the Granite Falls Amusement Park and the Granite Falls Water Park.
Economy
Granite Falls is home to several small businesses, including restaurants, retail stores, and service providers. The town is also home to several manufacturing companies, including a furniture manufacturer, a textile manufacturer, and a plastics manufacturer. The town is also home to several agricultural businesses, including a dairy farm and a poultry farm.
Demographics
As of the 2010 census, Granite Falls had a population of 4,000 people. The racial makeup of the town was 94.2% White, 2.2% African American, 0.7% Native American, 0.4% Asian, 0.1% Pacific Islander, and 2.4% from other races. The median household income was $35,000 and the median family income was $41,000.
Conclusion
Granite Falls is a small town located in the foothills of the Blue Ridge Mountains in North Carolina. The town was founded in 1883 and has a population of approximately 4,000 people. The town is home to several small businesses, including restaurants, retail stores, and service providers. The town is also home to several manufacturing companies, including a furniture manufacturer, a textile manufacturer, and a plastics manufacturer. The town is also home to several agricultural businesses, including a dairy farm and a poultry farm. The racial makeup of the town is 94.2% White, 2.2% African American, 0.7% Native American, 0.4% Asian, 0.1% Pacific Islander, and 2.4% from other races. The median household income was $35,000 and the median family income was $41,000.
Common Questions
What is Per Capita Income in Granite Falls?
Per Capita income in Granite Falls is $32,835.
What is the Median Family Income in Granite Falls?
Median Family Income in Granite Falls is $84,800.
What is the Median Household income in Granite Falls?
Median Household Income in Granite Falls is $76,680.
What is Income or Wage Gap in Granite Falls?
Income or Wage Gap in Granite Falls is 17.2%.
Women in Granite Falls earn 82.8 cents for every dollar earned by a man.
What is Inequality or Gini Index in Granite Falls?
Inequality or Gini Index in Granite Falls is 0.43.
What is the Total Population of Granite Falls?
Total Population of Granite Falls is 4,934.
What is the Total Male Population of Granite Falls?
Total Male Population of Granite Falls is 2,364.
What is the Total Female Population of Granite Falls?
Total Female Population of Granite Falls is 2,570.
What is the Ratio of Males per 100 Females in Granite Falls?
There are 91.98 Males per 100 Females in Granite Falls.
What is the Ratio of Females per 100 Males in Granite Falls?
There are 108.71 Females per 100 Males in Granite Falls.
What is the Median Population Age in Granite Falls?
Median Population Age in Granite Falls is 42.3 Years.
What is the Average Family Size in Granite Falls
Average Family Size in Granite Falls is 3.2 People.
What is the Average Household Size in Granite Falls
Average Household Size in Granite Falls is 2.9 People.
How Large is the Labor Force in Granite Falls?
There are 2,286 People in the Labor Forcein in Granite Falls.
What is the Percentage of People in the Labor Force in Granite Falls?
59.4% of People are in the Labor Force in Granite Falls.
What is the Unemployment Rate in Granite Falls?
Unemployment Rate in Granite Falls is 3.0%.