Maggie Valley, NC Map & Demographics
Maggie Valley Map
Maggie Valley Overview
$33,957
PER CAPITA INCOME
$72,361
AVG FAMILY INCOME
$62,083
AVG HOUSEHOLD INCOME
2.0%
WAGE / INCOME GAP [ % ]
98.0¢/ $1
WAGE / INCOME GAP [ $ ]
0.40
INEQUALITY / GINI INDEX
2,195
TOTAL POPULATION
1,027
MALE POPULATION
1,168
FEMALE POPULATION
87.93
MALES / 100 FEMALES
113.73
FEMALES / 100 MALES
49.0
MEDIAN AGE
3.3
AVG FAMILY SIZE
2.6
AVG HOUSEHOLD SIZE
998
LABOR FORCE [ PEOPLE ]
54.7%
PERCENT IN LABOR FORCE
2.3%
UNEMPLOYMENT RATE
Maggie Valley Zip Codes
Maggie Valley Area Codes
Income in Maggie Valley
Income Overview in Maggie Valley
Per Capita Income in Maggie Valley is $33,957, while median incomes of families and households are $72,361 and $62,083 respectively.
| Characteristic | Number | Measure |
| Per Capita Income | 2,195 | $33,957 |
| Median Family Income | 517 | $72,361 |
| Mean Family Income | 517 | $100,158 |
| Median Household Income | 832 | $62,083 |
| Mean Household Income | 832 | $85,856 |
| Income Deficit | 517 | $0 |
| Wage / Income Gap (%) | 2,195 | 1.97% |
| Wage / Income Gap ($) | 2,195 | 98.03¢ per $1 |
| Gini / Inequality Index | 2,195 | 0.40 |
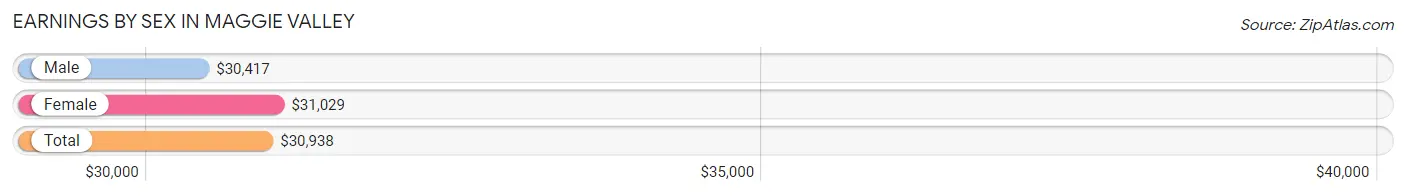
Earnings by Sex in Maggie Valley
Average Earnings in Maggie Valley are $30,938, $30,417 for men and $31,029 for women, a difference of 2.0%.
| Sex | Number | Average Earnings |
| Male | 557 (53.4%) | $30,417 |
| Female | 486 (46.6%) | $31,029 |
| Total | 1,043 (100.0%) | $30,938 |
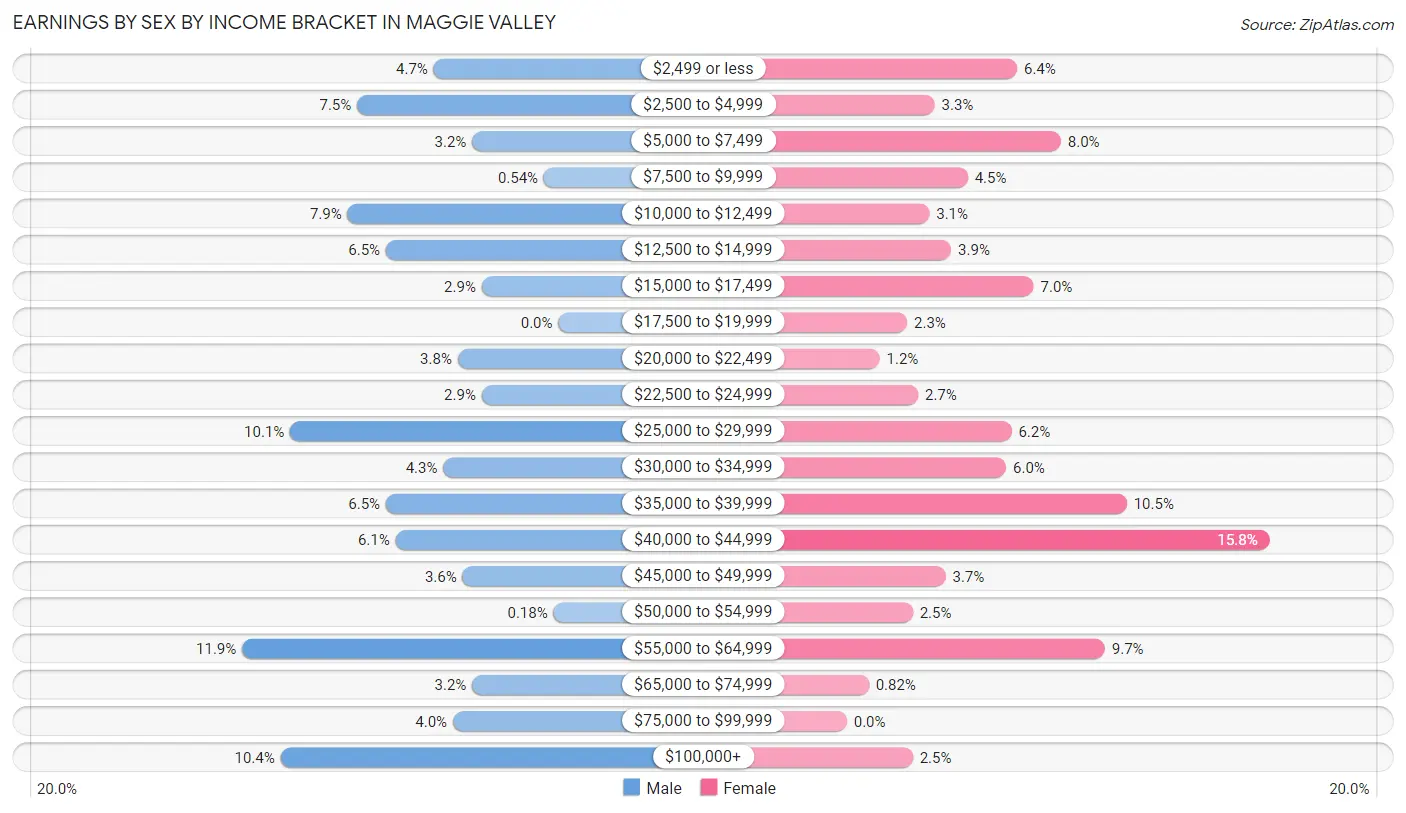
Earnings by Sex by Income Bracket in Maggie Valley
The most common earnings brackets in Maggie Valley are $55,000 to $64,999 for men (66 | 11.8%) and $40,000 to $44,999 for women (77 | 15.8%).
| Income | Male | Female |
| $2,499 or less | 26 (4.7%) | 31 (6.4%) |
| $2,500 to $4,999 | 42 (7.5%) | 16 (3.3%) |
| $5,000 to $7,499 | 18 (3.2%) | 39 (8.0%) |
| $7,500 to $9,999 | 3 (0.5%) | 22 (4.5%) |
| $10,000 to $12,499 | 44 (7.9%) | 15 (3.1%) |
| $12,500 to $14,999 | 36 (6.5%) | 19 (3.9%) |
| $15,000 to $17,499 | 16 (2.9%) | 34 (7.0%) |
| $17,500 to $19,999 | 0 (0.0%) | 11 (2.3%) |
| $20,000 to $22,499 | 21 (3.8%) | 6 (1.2%) |
| $22,500 to $24,999 | 16 (2.9%) | 13 (2.7%) |
| $25,000 to $29,999 | 56 (10.1%) | 30 (6.2%) |
| $30,000 to $34,999 | 24 (4.3%) | 29 (6.0%) |
| $35,000 to $39,999 | 36 (6.5%) | 51 (10.5%) |
| $40,000 to $44,999 | 34 (6.1%) | 77 (15.8%) |
| $45,000 to $49,999 | 20 (3.6%) | 18 (3.7%) |
| $50,000 to $54,999 | 1 (0.2%) | 12 (2.5%) |
| $55,000 to $64,999 | 66 (11.8%) | 47 (9.7%) |
| $65,000 to $74,999 | 18 (3.2%) | 4 (0.8%) |
| $75,000 to $99,999 | 22 (4.0%) | 0 (0.0%) |
| $100,000+ | 58 (10.4%) | 12 (2.5%) |
| Total | 557 (100.0%) | 486 (100.0%) |
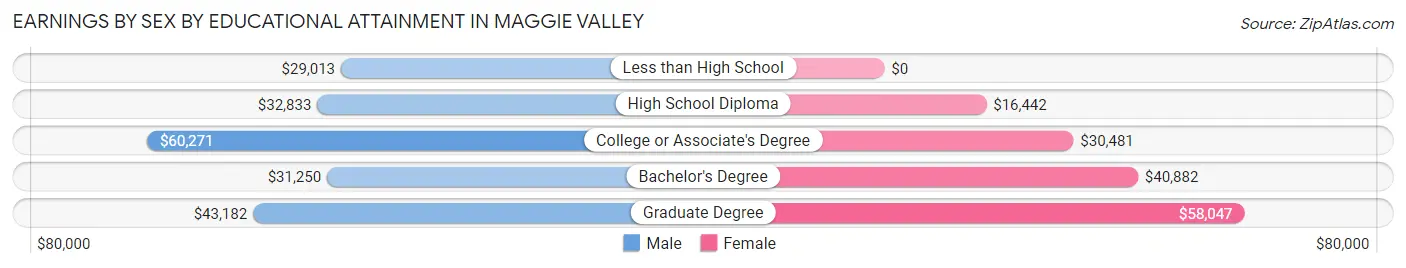
Earnings by Sex by Educational Attainment in Maggie Valley
Average earnings in Maggie Valley are $36,023 for men and $31,029 for women, a difference of 13.9%. Men with an educational attainment of college or associate's degree enjoy the highest average annual earnings of $60,271, while those with less than high school education earn the least with $29,013. Women with an educational attainment of graduate degree earn the most with the average annual earnings of $58,047, while those with high school diploma education have the smallest earnings of $16,442.
| Educational Attainment | Male Income | Female Income |
| Less than High School | $29,013 | $0 |
| High School Diploma | $32,833 | $16,442 |
| College or Associate's Degree | $60,271 | $30,481 |
| Bachelor's Degree | $31,250 | $40,882 |
| Graduate Degree | $43,182 | $58,047 |
| Total | $36,023 | $31,029 |
Family Income in Maggie Valley
Family Income Brackets in Maggie Valley
According to the Maggie Valley family income data, there are 106 families falling into the $35,000 to $49,999 income range, which is the most common income bracket and makes up 20.5% of all families. Conversely, the $10,000 to $14,999 income bracket is the least frequent group with only 6 families (1.2%) belonging to this category.
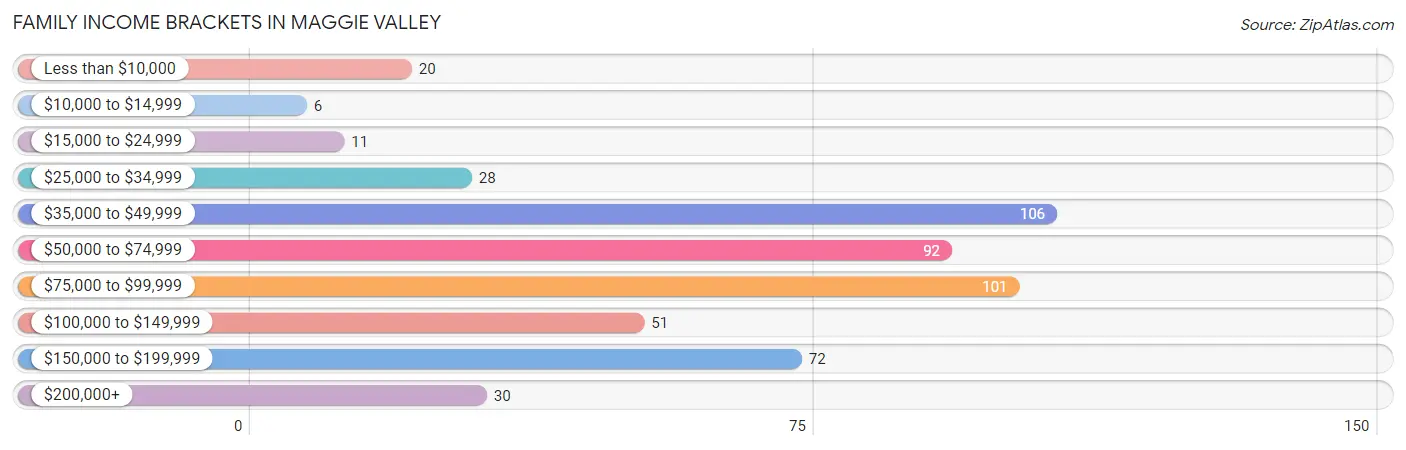
| Income Bracket | # Families | % Families |
| Less than $10,000 | 20 | 3.9% |
| $10,000 to $14,999 | 6 | 1.2% |
| $15,000 to $24,999 | 11 | 2.1% |
| $25,000 to $34,999 | 28 | 5.4% |
| $35,000 to $49,999 | 106 | 20.5% |
| $50,000 to $74,999 | 92 | 17.8% |
| $75,000 to $99,999 | 101 | 19.5% |
| $100,000 to $149,999 | 51 | 9.9% |
| $150,000 to $199,999 | 72 | 13.9% |
| $200,000+ | 30 | 5.8% |
Family Income by Famaliy Size in Maggie Valley
3-person families (112 | 21.7%) account for the highest median family income in Maggie Valley with $93,654 per family, while 2-person families (263 | 50.9%) have the highest median income of $32,410 per family member.
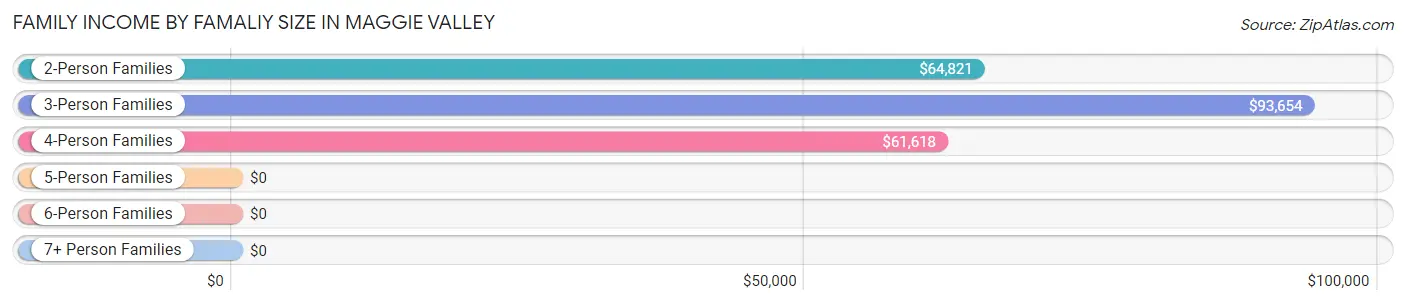
| Income Bracket | # Families | Median Income |
| 2-Person Families | 263 (50.9%) | $64,821 |
| 3-Person Families | 112 (21.7%) | $93,654 |
| 4-Person Families | 118 (22.8%) | $61,618 |
| 5-Person Families | 14 (2.7%) | $0 |
| 6-Person Families | 10 (1.9%) | $0 |
| 7+ Person Families | 0 (0.0%) | $0 |
| Total | 517 (100.0%) | $72,361 |
Family Income by Number of Earners in Maggie Valley
The median family income in Maggie Valley is $72,361, with families comprising 3+ earners (37) having the highest median family income of $93,438, while families with 1 earner (168) have the lowest median family income of $50,962, accounting for 7.2% and 32.5% of families, respectively.
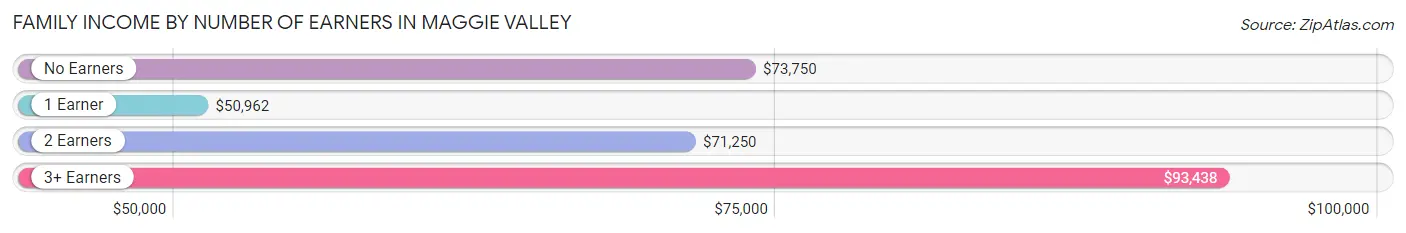
| Number of Earners | # Families | Median Income |
| No Earners | 122 (23.6%) | $73,750 |
| 1 Earner | 168 (32.5%) | $50,962 |
| 2 Earners | 190 (36.7%) | $71,250 |
| 3+ Earners | 37 (7.2%) | $93,438 |
| Total | 517 (100.0%) | $72,361 |
Household Income in Maggie Valley
Household Income Brackets in Maggie Valley
With 203 households falling in the category, the $50,000 to $74,999 income range is the most frequent in Maggie Valley, accounting for 24.4% of all households. In contrast, only 14 households (1.7%) fall into the less than $10,000 income bracket, making it the least populous group.
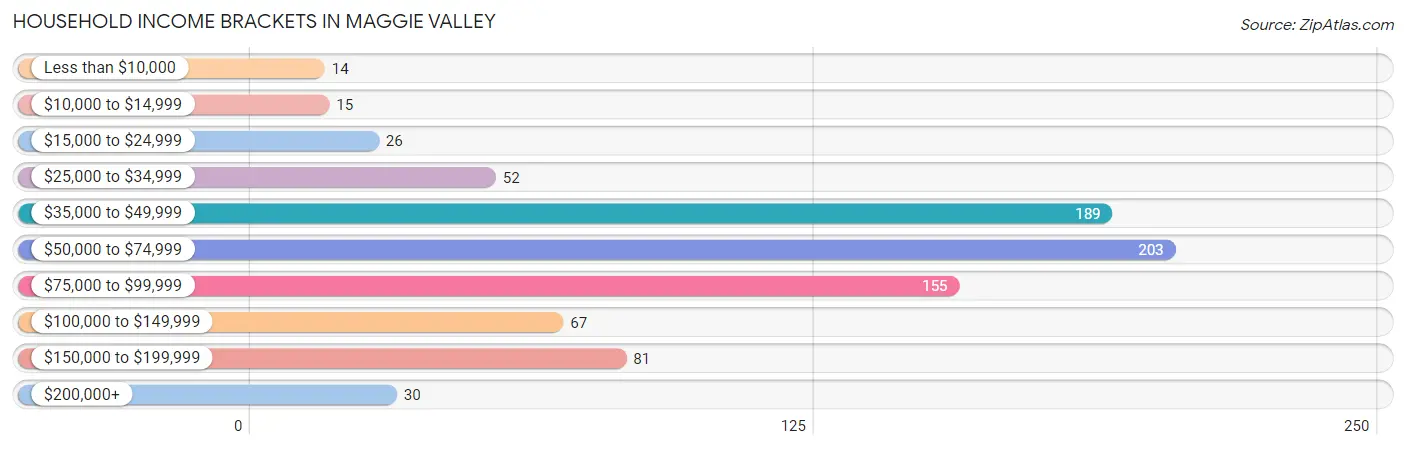
| Income Bracket | # Households | % Households |
| Less than $10,000 | 14 | 1.7% |
| $10,000 to $14,999 | 15 | 1.8% |
| $15,000 to $24,999 | 26 | 3.1% |
| $25,000 to $34,999 | 52 | 6.3% |
| $35,000 to $49,999 | 189 | 22.7% |
| $50,000 to $74,999 | 203 | 24.4% |
| $75,000 to $99,999 | 155 | 18.6% |
| $100,000 to $149,999 | 67 | 8.1% |
| $150,000 to $199,999 | 81 | 9.7% |
| $200,000+ | 30 | 3.6% |
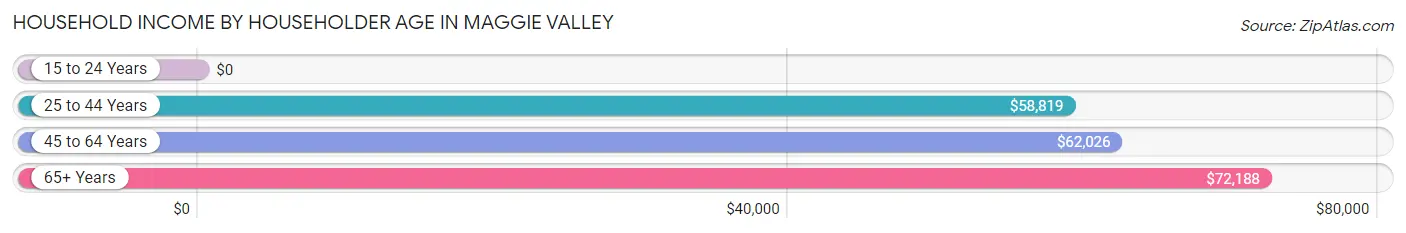
Household Income by Householder Age in Maggie Valley
The median household income in Maggie Valley is $62,083, with the highest median household income of $72,188 found in the 65+ years age bracket for the primary householder. A total of 325 households (39.1%) fall into this category. Meanwhile, the 15 to 24 years age bracket for the primary householder has the lowest median household income of $0, with 20 households (2.4%) in this group.
| Income Bracket | # Households | Median Income |
| 15 to 24 Years | 20 (2.4%) | $0 |
| 25 to 44 Years | 167 (20.1%) | $58,819 |
| 45 to 64 Years | 320 (38.5%) | $62,026 |
| 65+ Years | 325 (39.1%) | $72,188 |
| Total | 832 (100.0%) | $62,083 |
Poverty in Maggie Valley
Income Below Poverty by Sex and Age in Maggie Valley
With 8.2% poverty level for males and 12.8% for females among the residents of Maggie Valley, 18 to 24 year old males and 6 to 11 year old females are the most vulnerable to poverty, with 30 males (44.1%) and 74 females (40.0%) in their respective age groups living below the poverty level.
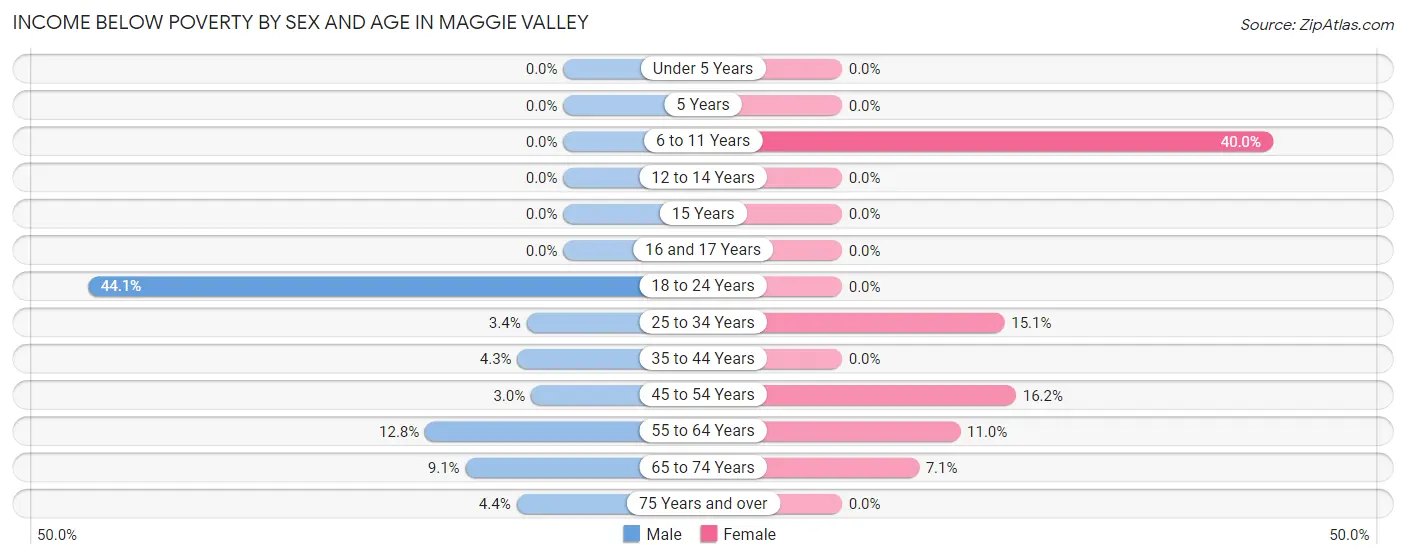
| Age Bracket | Male | Female |
| Under 5 Years | 0 (0.0%) | 0 (0.0%) |
| 5 Years | 0 (0.0%) | 0 (0.0%) |
| 6 to 11 Years | 0 (0.0%) | 74 (40.0%) |
| 12 to 14 Years | 0 (0.0%) | 0 (0.0%) |
| 15 Years | 0 (0.0%) | 0 (0.0%) |
| 16 and 17 Years | 0 (0.0%) | 0 (0.0%) |
| 18 to 24 Years | 30 (44.1%) | 0 (0.0%) |
| 25 to 34 Years | 4 (3.4%) | 19 (15.1%) |
| 35 to 44 Years | 4 (4.3%) | 0 (0.0%) |
| 45 to 54 Years | 3 (3.0%) | 21 (16.2%) |
| 55 to 64 Years | 24 (12.8%) | 19 (11.0%) |
| 65 to 74 Years | 13 (9.1%) | 14 (7.1%) |
| 75 Years and over | 6 (4.3%) | 0 (0.0%) |
| Total | 84 (8.2%) | 147 (12.8%) |
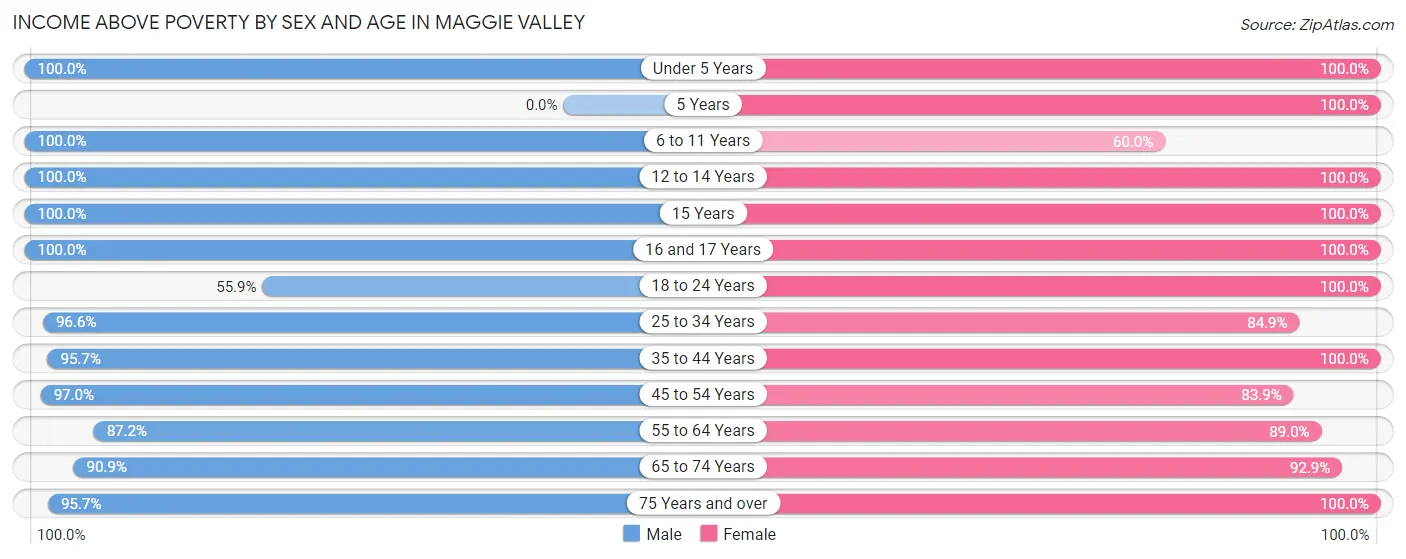
Income Above Poverty by Sex and Age in Maggie Valley
According to the poverty statistics in Maggie Valley, males aged under 5 years and females aged under 5 years are the age groups that are most secure financially, with 100.0% of males and 100.0% of females in these age groups living above the poverty line.
| Age Bracket | Male | Female |
| Under 5 Years | 2 (100.0%) | 15 (100.0%) |
| 5 Years | 0 (0.0%) | 2 (100.0%) |
| 6 to 11 Years | 14 (100.0%) | 111 (60.0%) |
| 12 to 14 Years | 59 (100.0%) | 2 (100.0%) |
| 15 Years | 76 (100.0%) | 16 (100.0%) |
| 16 and 17 Years | 29 (100.0%) | 3 (100.0%) |
| 18 to 24 Years | 38 (55.9%) | 133 (100.0%) |
| 25 to 34 Years | 113 (96.6%) | 107 (84.9%) |
| 35 to 44 Years | 90 (95.7%) | 63 (100.0%) |
| 45 to 54 Years | 97 (97.0%) | 109 (83.9%) |
| 55 to 64 Years | 163 (87.2%) | 154 (89.0%) |
| 65 to 74 Years | 130 (90.9%) | 182 (92.9%) |
| 75 Years and over | 132 (95.7%) | 108 (100.0%) |
| Total | 943 (91.8%) | 1,005 (87.2%) |
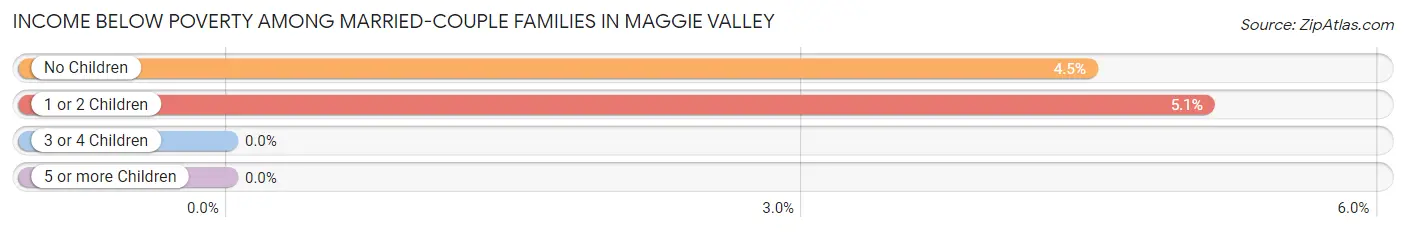
Income Below Poverty Among Married-Couple Families in Maggie Valley
The poverty statistics for married-couple families in Maggie Valley show that 4.6% or 19 of the total 410 families live below the poverty line. Families with 1 or 2 children have the highest poverty rate of 5.1%, comprising of 5 families. On the other hand, families with no children have the lowest poverty rate of 4.5%, which includes 14 families.
| Children | Above Poverty | Below Poverty |
| No Children | 298 (95.5%) | 14 (4.5%) |
| 1 or 2 Children | 93 (94.9%) | 5 (5.1%) |
| 3 or 4 Children | 0 (0.0%) | 0 (0.0%) |
| 5 or more Children | 0 (0.0%) | 0 (0.0%) |
| Total | 391 (95.4%) | 19 (4.6%) |
Income Below Poverty Among Single-Parent Households in Maggie Valley
According to the poverty data in Maggie Valley, 20.0% or 3 single-father households and 15.2% or 14 single-mother households are living below the poverty line. Among single-father households, those with no children have the highest poverty rate, with 3 households (100.0%) experiencing poverty. Likewise, among single-mother households, those with 1 or 2 children have the highest poverty rate, with 14 households (66.7%) falling below the poverty line.
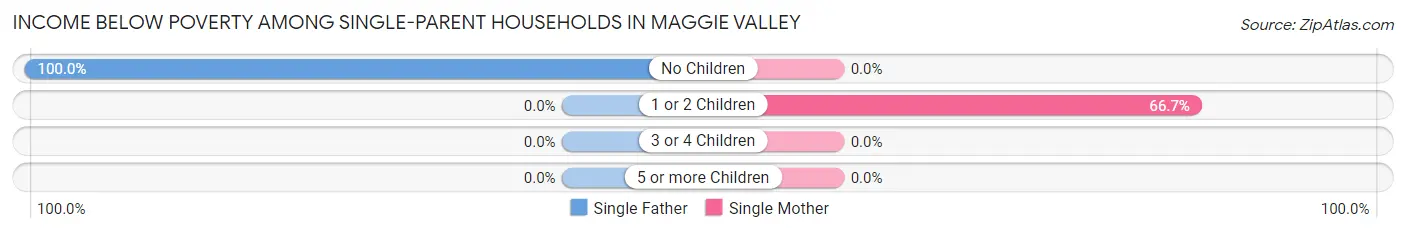
| Children | Single Father | Single Mother |
| No Children | 3 (100.0%) | 0 (0.0%) |
| 1 or 2 Children | 0 (0.0%) | 14 (66.7%) |
| 3 or 4 Children | 0 (0.0%) | 0 (0.0%) |
| 5 or more Children | 0 (0.0%) | 0 (0.0%) |
| Total | 3 (20.0%) | 14 (15.2%) |
Income Below Poverty Among Married-Couple vs Single-Parent Households in Maggie Valley
The poverty data for Maggie Valley shows that 19 of the married-couple family households (4.6%) and 17 of the single-parent households (15.9%) are living below the poverty level. Within the married-couple family households, those with 1 or 2 children have the highest poverty rate, with 5 households (5.1%) falling below the poverty line. Among the single-parent households, those with 1 or 2 children have the highest poverty rate, with 14 household (42.4%) living below poverty.
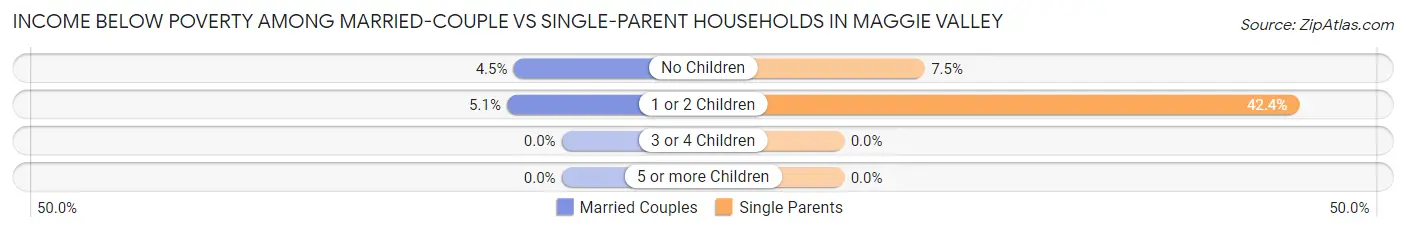
| Children | Married-Couple Families | Single-Parent Households |
| No Children | 14 (4.5%) | 3 (7.5%) |
| 1 or 2 Children | 5 (5.1%) | 14 (42.4%) |
| 3 or 4 Children | 0 (0.0%) | 0 (0.0%) |
| 5 or more Children | 0 (0.0%) | 0 (0.0%) |
| Total | 19 (4.6%) | 17 (15.9%) |
Race in Maggie Valley
The most populous races in Maggie Valley are White / Caucasian (1,887 | 86.0%), Hispanic or Latino (203 | 9.2%), and Some other Race (170 | 7.7%).
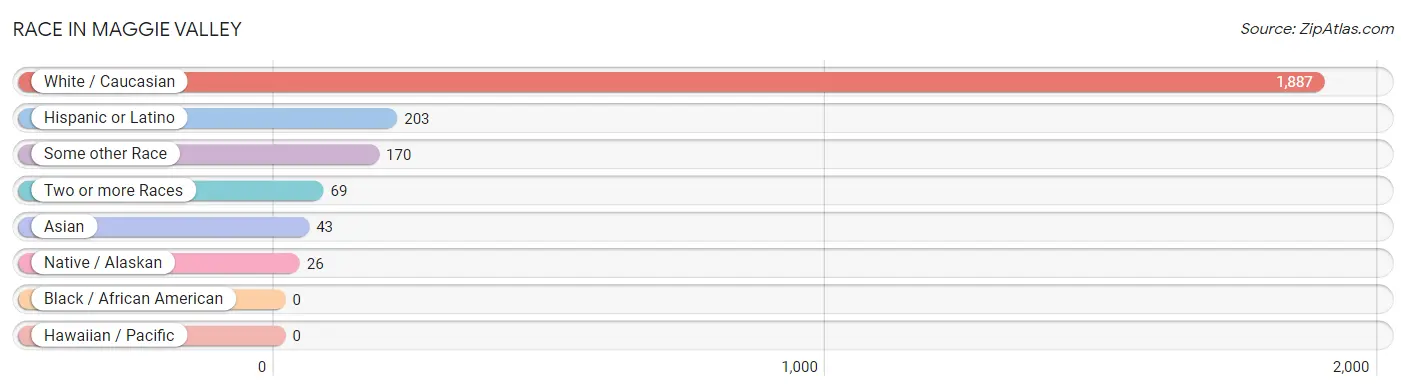
| Race | # Population | % Population |
| Asian | 43 | 2.0% |
| Black / African American | 0 | 0.0% |
| Hawaiian / Pacific | 0 | 0.0% |
| Hispanic or Latino | 203 | 9.2% |
| Native / Alaskan | 26 | 1.2% |
| White / Caucasian | 1,887 | 86.0% |
| Two or more Races | 69 | 3.1% |
| Some other Race | 170 | 7.7% |
| Total | 2,195 | 100.0% |
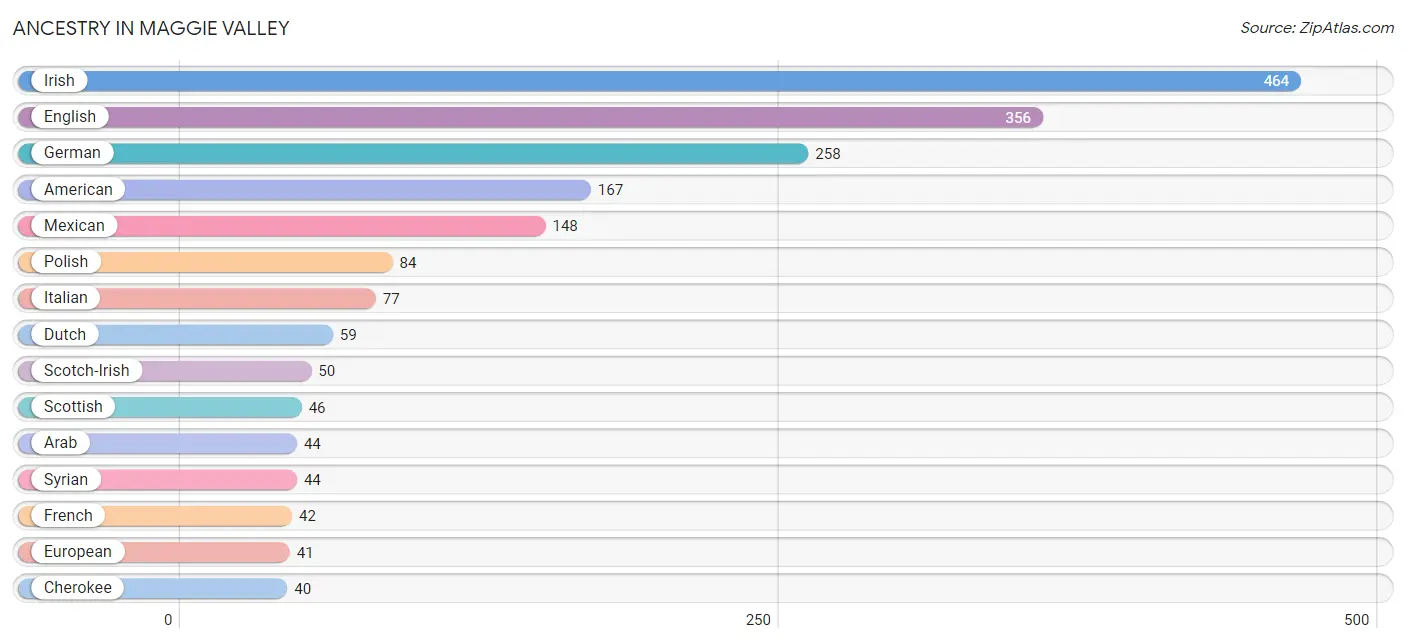
Ancestry in Maggie Valley
The most populous ancestries reported in Maggie Valley are Irish (464 | 21.1%), English (356 | 16.2%), German (258 | 11.7%), American (167 | 7.6%), and Mexican (148 | 6.7%), together accounting for 63.5% of all Maggie Valley residents.
| Ancestry | # Population | % Population |
| American | 167 | 7.6% |
| Arab | 44 | 2.0% |
| Austrian | 3 | 0.1% |
| Blackfeet | 4 | 0.2% |
| British | 9 | 0.4% |
| Central American | 3 | 0.1% |
| Cherokee | 40 | 1.8% |
| Chippewa | 3 | 0.1% |
| Cuban | 11 | 0.5% |
| Czech | 3 | 0.1% |
| Czechoslovakian | 9 | 0.4% |
| Danish | 6 | 0.3% |
| Dominican | 2 | 0.1% |
| Dutch | 59 | 2.7% |
| Ecuadorian | 28 | 1.3% |
| English | 356 | 16.2% |
| European | 41 | 1.9% |
| French | 42 | 1.9% |
| French Canadian | 7 | 0.3% |
| German | 258 | 11.7% |
| Greek | 2 | 0.1% |
| Haitian | 3 | 0.1% |
| Irish | 464 | 21.1% |
| Italian | 77 | 3.5% |
| Lumbee | 2 | 0.1% |
| Mexican | 148 | 6.7% |
| Nicaraguan | 3 | 0.1% |
| Northern European | 12 | 0.5% |
| Norwegian | 6 | 0.3% |
| Polish | 84 | 3.8% |
| Portuguese | 3 | 0.1% |
| Puerto Rican | 8 | 0.4% |
| Russian | 9 | 0.4% |
| Scotch-Irish | 50 | 2.3% |
| Scottish | 46 | 2.1% |
| South American | 28 | 1.3% |
| Spaniard | 3 | 0.1% |
| Sri Lankan | 5 | 0.2% |
| Swedish | 23 | 1.1% |
| Swiss | 16 | 0.7% |
| Syrian | 44 | 2.0% |
| Thai | 38 | 1.7% |
| Ukrainian | 6 | 0.3% |
| Welsh | 6 | 0.3% | View All 44 Rows |
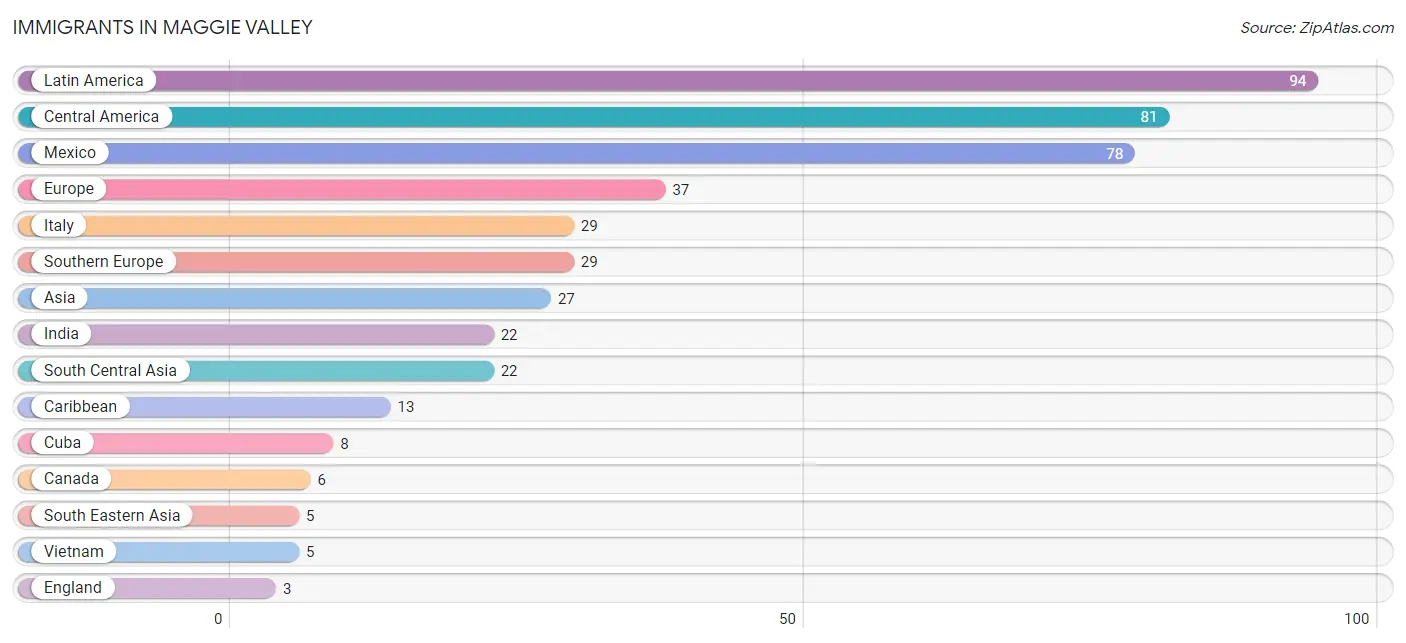
Immigrants in Maggie Valley
The most numerous immigrant groups reported in Maggie Valley came from Latin America (94 | 4.3%), Central America (81 | 3.7%), Mexico (78 | 3.5%), Europe (37 | 1.7%), and Italy (29 | 1.3%), together accounting for 14.5% of all Maggie Valley residents.
| Immigration Origin | # Population | % Population |
| Asia | 27 | 1.2% |
| Belarus | 2 | 0.1% |
| Canada | 6 | 0.3% |
| Caribbean | 13 | 0.6% |
| Central America | 81 | 3.7% |
| Cuba | 8 | 0.4% |
| Dominican Republic | 2 | 0.1% |
| Eastern Europe | 2 | 0.1% |
| England | 3 | 0.1% |
| Europe | 37 | 1.7% |
| Germany | 3 | 0.1% |
| Haiti | 3 | 0.1% |
| India | 22 | 1.0% |
| Italy | 29 | 1.3% |
| Latin America | 94 | 4.3% |
| Mexico | 78 | 3.5% |
| Nicaragua | 3 | 0.1% |
| Northern Europe | 3 | 0.1% |
| South Central Asia | 22 | 1.0% |
| South Eastern Asia | 5 | 0.2% |
| Southern Europe | 29 | 1.3% |
| Vietnam | 5 | 0.2% |
| Western Europe | 3 | 0.1% | View All 23 Rows |
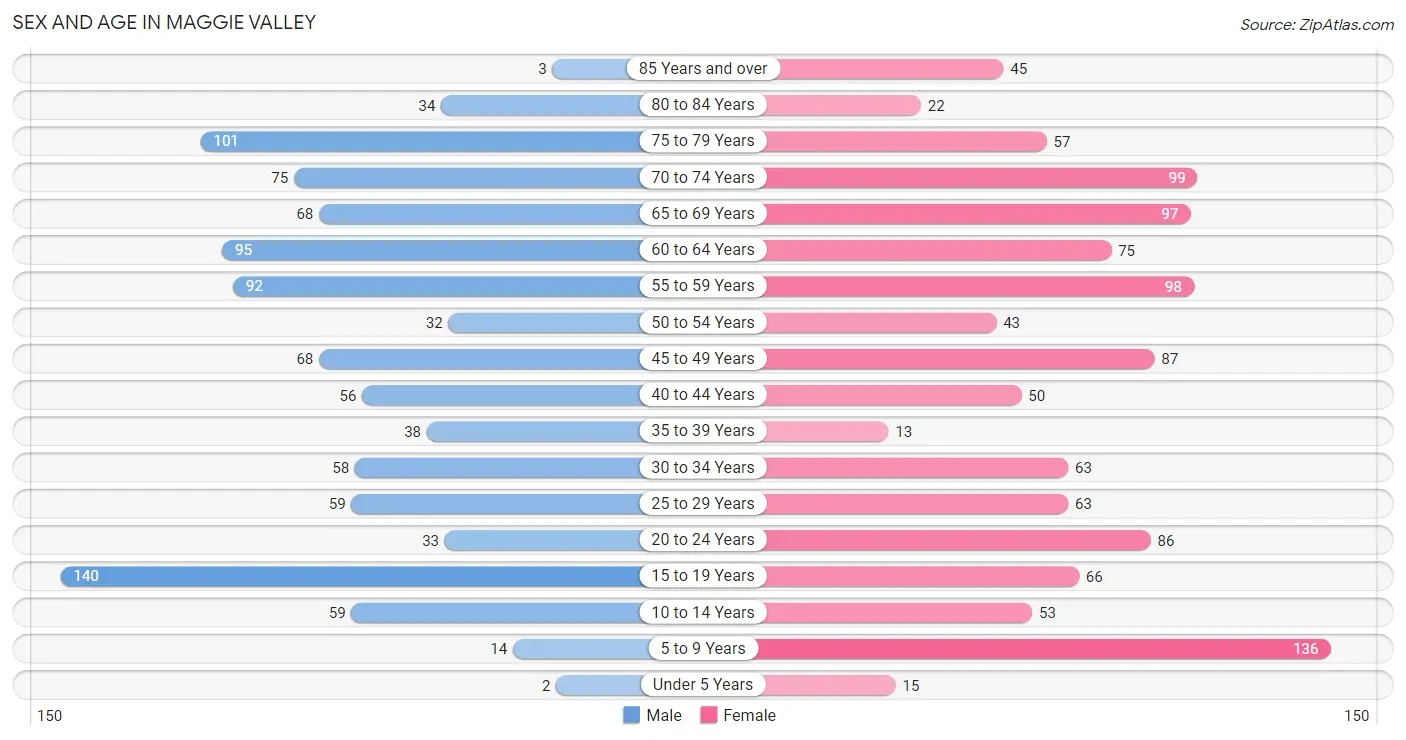
Sex and Age in Maggie Valley
Sex and Age in Maggie Valley
The most populous age groups in Maggie Valley are 15 to 19 Years (140 | 13.6%) for men and 5 to 9 Years (136 | 11.6%) for women.
| Age Bracket | Male | Female |
| Under 5 Years | 2 (0.2%) | 15 (1.3%) |
| 5 to 9 Years | 14 (1.4%) | 136 (11.6%) |
| 10 to 14 Years | 59 (5.7%) | 53 (4.5%) |
| 15 to 19 Years | 140 (13.6%) | 66 (5.7%) |
| 20 to 24 Years | 33 (3.2%) | 86 (7.4%) |
| 25 to 29 Years | 59 (5.7%) | 63 (5.4%) |
| 30 to 34 Years | 58 (5.7%) | 63 (5.4%) |
| 35 to 39 Years | 38 (3.7%) | 13 (1.1%) |
| 40 to 44 Years | 56 (5.4%) | 50 (4.3%) |
| 45 to 49 Years | 68 (6.6%) | 87 (7.4%) |
| 50 to 54 Years | 32 (3.1%) | 43 (3.7%) |
| 55 to 59 Years | 92 (9.0%) | 98 (8.4%) |
| 60 to 64 Years | 95 (9.2%) | 75 (6.4%) |
| 65 to 69 Years | 68 (6.6%) | 97 (8.3%) |
| 70 to 74 Years | 75 (7.3%) | 99 (8.5%) |
| 75 to 79 Years | 101 (9.8%) | 57 (4.9%) |
| 80 to 84 Years | 34 (3.3%) | 22 (1.9%) |
| 85 Years and over | 3 (0.3%) | 45 (3.8%) |
| Total | 1,027 (100.0%) | 1,168 (100.0%) |
Families and Households in Maggie Valley
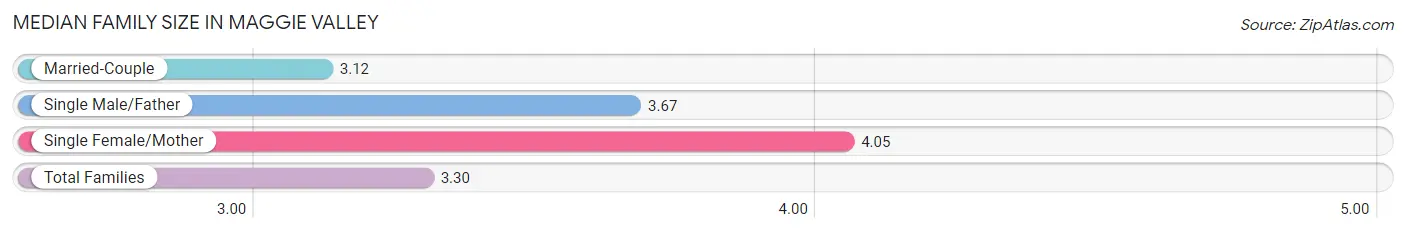
Median Family Size in Maggie Valley
The median family size in Maggie Valley is 3.30 persons per family, with single female/mother families (92 | 17.8%) accounting for the largest median family size of 4.05 persons per family. On the other hand, married-couple families (410 | 79.3%) represent the smallest median family size with 3.12 persons per family.
| Family Type | # Families | Family Size |
| Married-Couple | 410 (79.3%) | 3.12 |
| Single Male/Father | 15 (2.9%) | 3.67 |
| Single Female/Mother | 92 (17.8%) | 4.05 |
| Total Families | 517 (100.0%) | 3.30 |
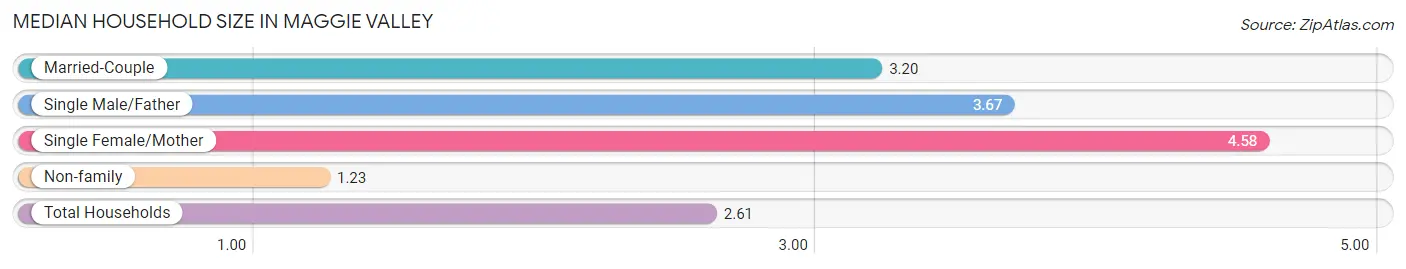
Median Household Size in Maggie Valley
The median household size in Maggie Valley is 2.61 persons per household, with single female/mother households (92 | 11.1%) accounting for the largest median household size of 4.58 persons per household. non-family households (315 | 37.9%) represent the smallest median household size with 1.23 persons per household.
| Household Type | # Households | Household Size |
| Married-Couple | 410 (49.3%) | 3.20 |
| Single Male/Father | 15 (1.8%) | 3.67 |
| Single Female/Mother | 92 (11.1%) | 4.58 |
| Non-family | 315 (37.9%) | 1.23 |
| Total Households | 832 (100.0%) | 2.61 |
Household Size by Marriage Status in Maggie Valley
Out of a total of 832 households in Maggie Valley, 517 (62.1%) are family households, while 315 (37.9%) are nonfamily households. The most numerous type of family households are 2-person households, comprising 258, and the most common type of nonfamily households are 1-person households, comprising 244.
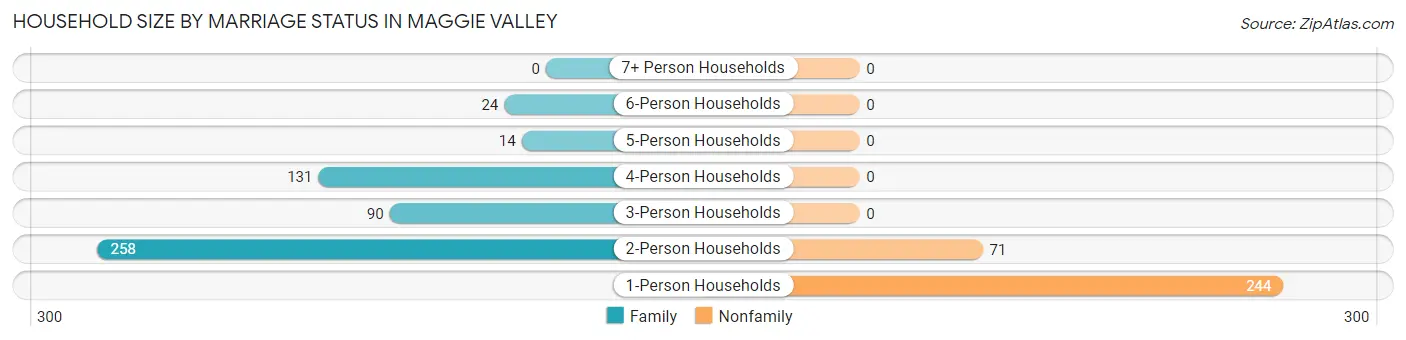
| Household Size | Family Households | Nonfamily Households |
| 1-Person Households | - | 244 (29.3%) |
| 2-Person Households | 258 (31.0%) | 71 (8.5%) |
| 3-Person Households | 90 (10.8%) | 0 (0.0%) |
| 4-Person Households | 131 (15.8%) | 0 (0.0%) |
| 5-Person Households | 14 (1.7%) | 0 (0.0%) |
| 6-Person Households | 24 (2.9%) | 0 (0.0%) |
| 7+ Person Households | 0 (0.0%) | 0 (0.0%) |
| Total | 517 (62.1%) | 315 (37.9%) |
Female Fertility in Maggie Valley
Fertility by Age in Maggie Valley
| Age Bracket | Women with Births | Births / 1,000 Women |
| 15 to 19 years | 0 (0.0%) | 0.0 |
| 20 to 34 years | 0 (0.0%) | 0.0 |
| 35 to 50 years | 0 (0.0%) | 0.0 |
| Total | 0 (0.0%) | 0.0 |
Fertility by Age by Marriage Status in Maggie Valley
| Age Bracket | Married | Unmarried |
| 15 to 19 years | 0 (0.0%) | 0 (0.0%) |
| 20 to 34 years | 0 (0.0%) | 0 (0.0%) |
| 35 to 50 years | 0 (0.0%) | 0 (0.0%) |
| Total | 0 (0.0%) | 0 (0.0%) |
Fertility by Education in Maggie Valley
| Educational Attainment | Women with Births | Births / 1,000 Women |
| Less than High School | 0 (0.0%) | 0.0 |
| High School Diploma | 0 (0.0%) | 0.0 |
| College or Associate's Degree | 0 (0.0%) | 0.0 |
| Bachelor's Degree | 0 (0.0%) | 0.0 |
| Graduate Degree | 0 (0.0%) | 0.0 |
| Total | 0 (0.0%) | 0.0 |
Fertility by Education by Marriage Status in Maggie Valley
| Educational Attainment | Married | Unmarried |
| Less than High School | 0 (0.0%) | 0 (0.0%) |
| High School Diploma | 0 (0.0%) | 0 (0.0%) |
| College or Associate's Degree | 0 (0.0%) | 0 (0.0%) |
| Bachelor's Degree | 0 (0.0%) | 0 (0.0%) |
| Graduate Degree | 0 (0.0%) | 0 (0.0%) |
| Total | 0 (0.0%) | 0 (0.0%) |
Employment Characteristics in Maggie Valley
Employment by Class of Employer in Maggie Valley
Among the 941 employed individuals in Maggie Valley, private company employees (704 | 74.8%), self-employed (not incorporated) (96 | 10.2%), and self-employed (incorporated) (46 | 4.9%) make up the most common classes of employment.

| Employer Class | # Employees | % Employees |
| Private Company Employees | 704 | 74.8% |
| Self-Employed (Incorporated) | 46 | 4.9% |
| Self-Employed (Not Incorporated) | 96 | 10.2% |
| Not-for-profit Organizations | 29 | 3.1% |
| Local Government Employees | 20 | 2.1% |
| State Government Employees | 34 | 3.6% |
| Federal Government Employees | 12 | 1.3% |
| Unpaid Family Workers | 0 | 0.0% |
| Total | 941 | 100.0% |
Employment Status by Age in Maggie Valley
According to the labor force statistics for Maggie Valley, out of the total population over 16 years of age (1,824), 54.7% or 998 individuals are in the labor force, with 2.3% or 23 of them unemployed. The age group with the highest labor force participation rate is 25 to 29 years, with 100.0% or 122 individuals in the labor force. Within the labor force, the 30 to 34 years age range has the highest percentage of unemployed individuals, with 8.6% or 10 of them being unemployed.
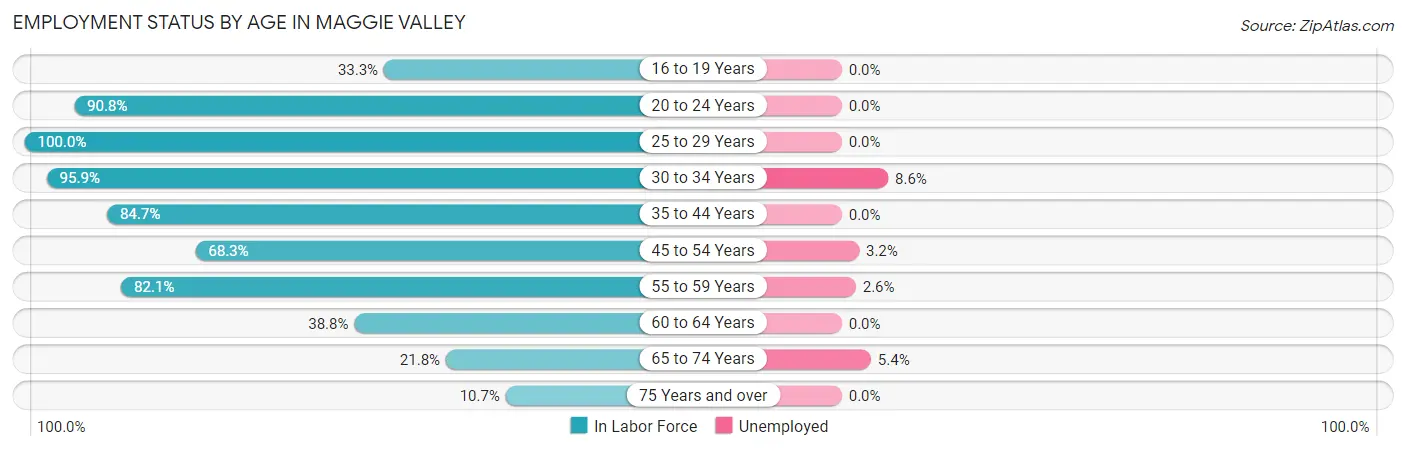
| Age Bracket | In Labor Force | Unemployed |
| 16 to 19 Years | 38 (33.3%) | 0 (0.0%) |
| 20 to 24 Years | 108 (90.8%) | 0 (0.0%) |
| 25 to 29 Years | 122 (100.0%) | 0 (0.0%) |
| 30 to 34 Years | 116 (95.9%) | 10 (8.6%) |
| 35 to 44 Years | 133 (84.7%) | 0 (0.0%) |
| 45 to 54 Years | 157 (68.3%) | 5 (3.2%) |
| 55 to 59 Years | 156 (82.1%) | 4 (2.6%) |
| 60 to 64 Years | 66 (38.8%) | 0 (0.0%) |
| 65 to 74 Years | 74 (21.8%) | 4 (5.4%) |
| 75 Years and over | 28 (10.7%) | 0 (0.0%) |
| Total | 998 (54.7%) | 23 (2.3%) |
Employment Status by Educational Attainment in Maggie Valley
According to labor force statistics for Maggie Valley, 75.8% of individuals (750) out of the total population between 25 and 64 years of age (990) are in the labor force, with 2.5% or 19 of them being unemployed. The group with the highest labor force participation rate are those with the educational attainment of less than high school, with 89.6% or 103 individuals in the labor force. Within the labor force, individuals with bachelor's degree or higher education have the highest percentage of unemployment, with 6.3% or 15 of them being unemployed.
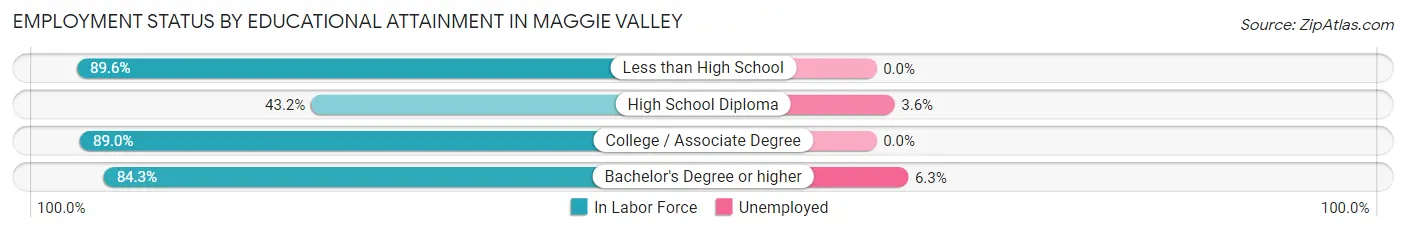
| Educational Attainment | In Labor Force | Unemployed |
| Less than High School | 103 (89.6%) | 0 (0.0%) |
| High School Diploma | 112 (43.2%) | 9 (3.6%) |
| College / Associate Degree | 298 (89.0%) | 0 (0.0%) |
| Bachelor's Degree or higher | 237 (84.3%) | 18 (6.3%) |
| Total | 750 (75.8%) | 25 (2.5%) |
Employment Occupations by Sex in Maggie Valley
Management, Business, Science and Arts Occupations
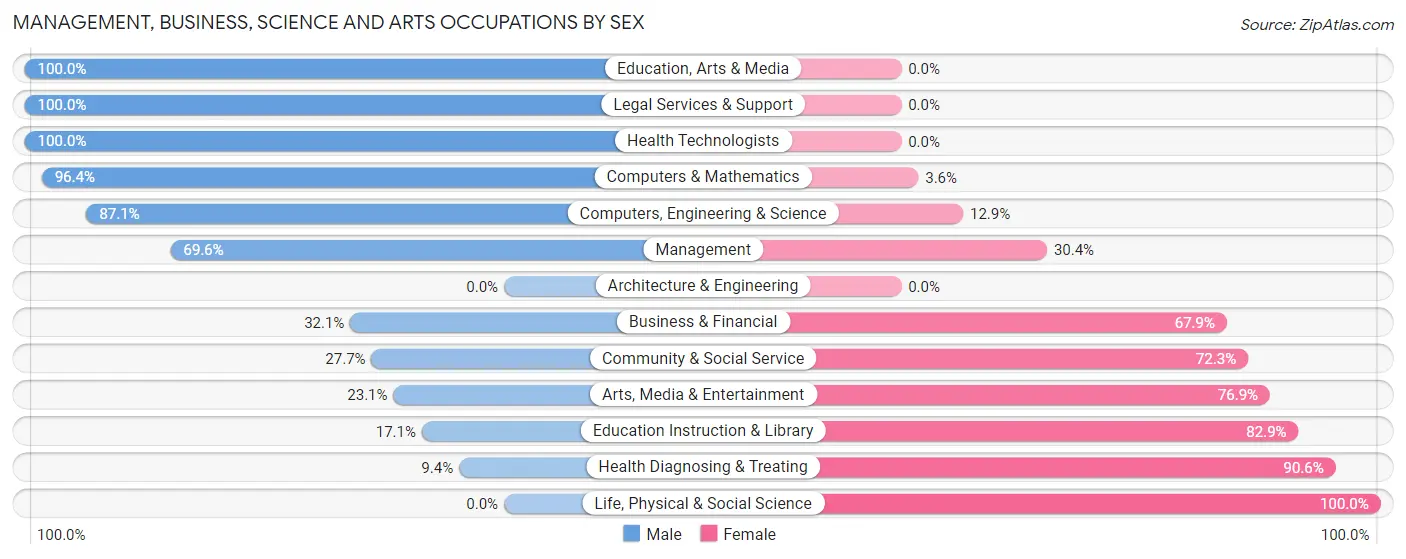
The most common Management, Business, Science and Arts occupations in Maggie Valley are Management (171 | 17.5%), Community & Social Service (94 | 9.6%), Education Instruction & Library (70 | 7.2%), Business & Financial (53 | 5.4%), and Health Diagnosing & Treating (32 | 3.3%).
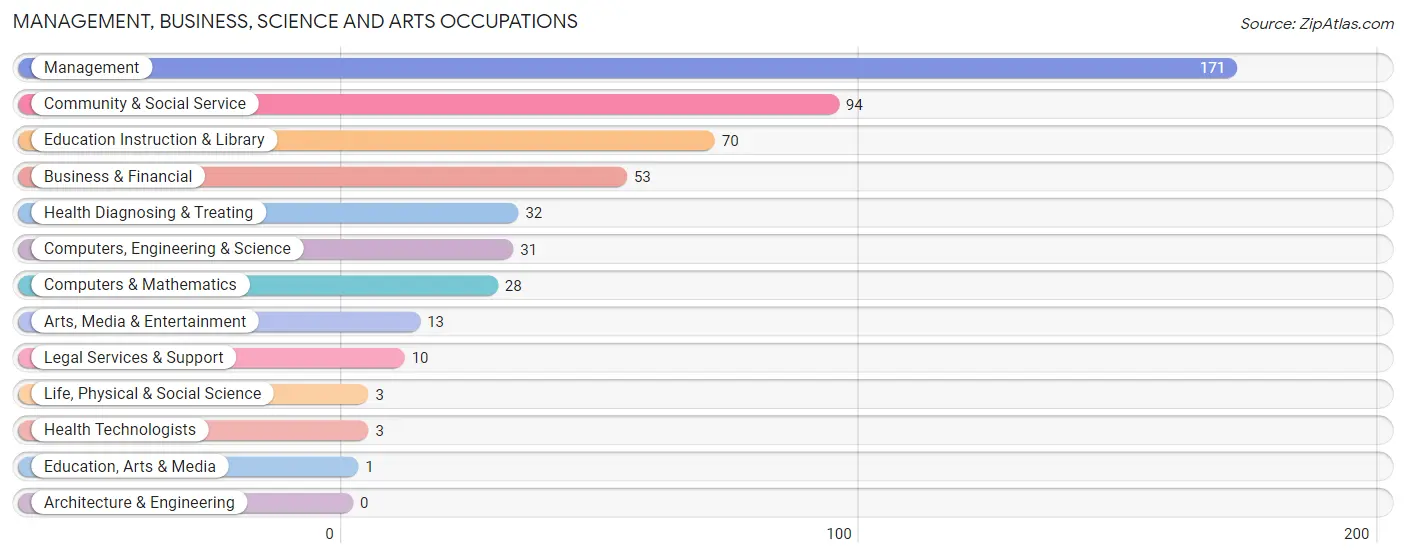
Management, Business, Science and Arts Occupations by Sex
Within the Management, Business, Science and Arts occupations in Maggie Valley, the most male-oriented occupations are Education, Arts & Media (100.0%), Legal Services & Support (100.0%), and Health Technologists (100.0%), while the most female-oriented occupations are Life, Physical & Social Science (100.0%), Health Diagnosing & Treating (90.6%), and Education Instruction & Library (82.9%).
| Occupation | Male | Female |
| Management | 119 (69.6%) | 52 (30.4%) |
| Business & Financial | 17 (32.1%) | 36 (67.9%) |
| Computers, Engineering & Science | 27 (87.1%) | 4 (12.9%) |
| Computers & Mathematics | 27 (96.4%) | 1 (3.6%) |
| Architecture & Engineering | 0 (0.0%) | 0 (0.0%) |
| Life, Physical & Social Science | 0 (0.0%) | 3 (100.0%) |
| Community & Social Service | 26 (27.7%) | 68 (72.3%) |
| Education, Arts & Media | 1 (100.0%) | 0 (0.0%) |
| Legal Services & Support | 10 (100.0%) | 0 (0.0%) |
| Education Instruction & Library | 12 (17.1%) | 58 (82.9%) |
| Arts, Media & Entertainment | 3 (23.1%) | 10 (76.9%) |
| Health Diagnosing & Treating | 3 (9.4%) | 29 (90.6%) |
| Health Technologists | 3 (100.0%) | 0 (0.0%) |
| Total (Category) | 192 (50.4%) | 189 (49.6%) |
| Total (Overall) | 517 (53.0%) | 458 (47.0%) |
Services Occupations
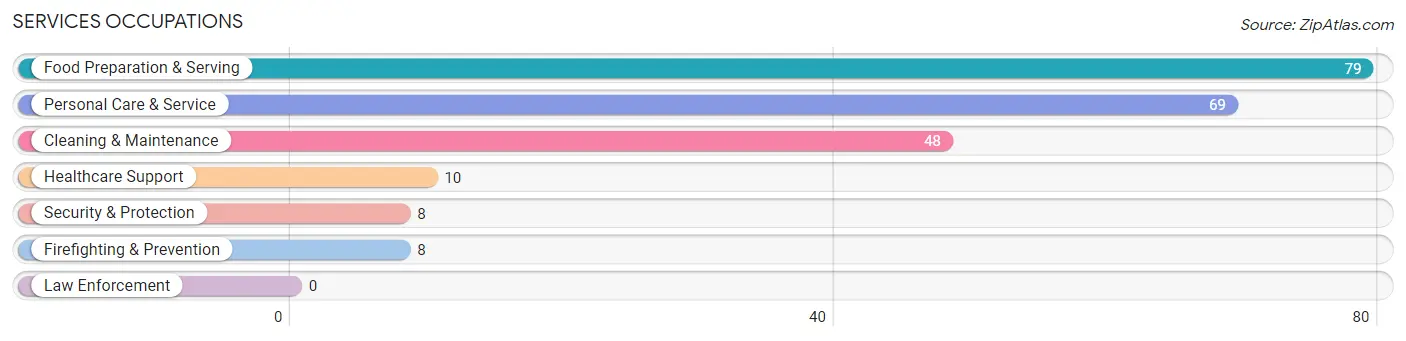
The most common Services occupations in Maggie Valley are Food Preparation & Serving (79 | 8.1%), Personal Care & Service (69 | 7.1%), Cleaning & Maintenance (48 | 4.9%), Healthcare Support (10 | 1.0%), and Security & Protection (8 | 0.8%).
Services Occupations by Sex
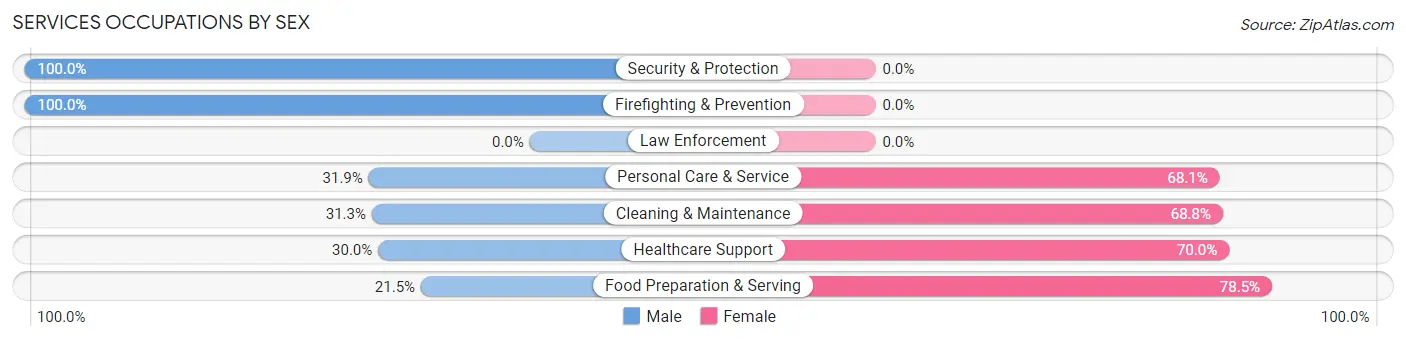
Within the Services occupations in Maggie Valley, the most male-oriented occupations are Security & Protection (100.0%), Firefighting & Prevention (100.0%), and Personal Care & Service (31.9%), while the most female-oriented occupations are Food Preparation & Serving (78.5%), Healthcare Support (70.0%), and Cleaning & Maintenance (68.8%).
| Occupation | Male | Female |
| Healthcare Support | 3 (30.0%) | 7 (70.0%) |
| Security & Protection | 8 (100.0%) | 0 (0.0%) |
| Firefighting & Prevention | 8 (100.0%) | 0 (0.0%) |
| Law Enforcement | 0 (0.0%) | 0 (0.0%) |
| Food Preparation & Serving | 17 (21.5%) | 62 (78.5%) |
| Cleaning & Maintenance | 15 (31.2%) | 33 (68.8%) |
| Personal Care & Service | 22 (31.9%) | 47 (68.1%) |
| Total (Category) | 65 (30.4%) | 149 (69.6%) |
| Total (Overall) | 517 (53.0%) | 458 (47.0%) |
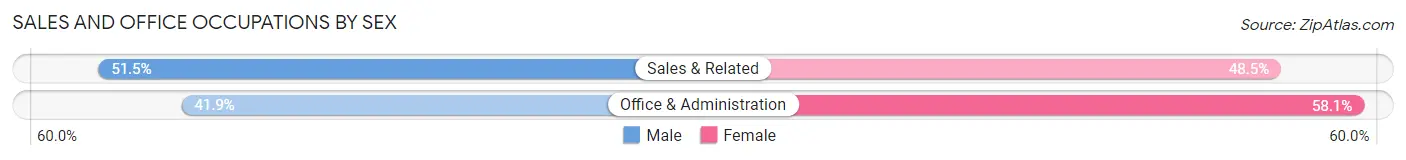
Sales and Office Occupations
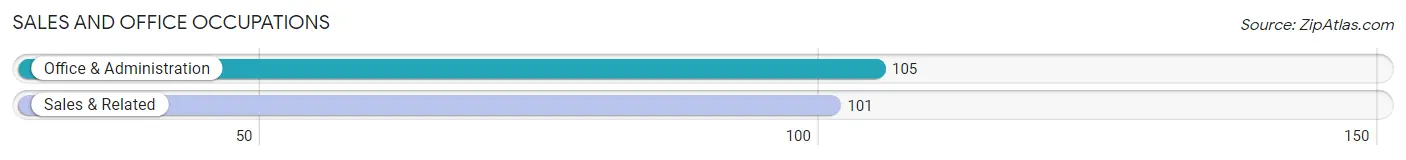
The most common Sales and Office occupations in Maggie Valley are Office & Administration (105 | 10.8%), and Sales & Related (101 | 10.4%).
Sales and Office Occupations by Sex
| Occupation | Male | Female |
| Sales & Related | 52 (51.5%) | 49 (48.5%) |
| Office & Administration | 44 (41.9%) | 61 (58.1%) |
| Total (Category) | 96 (46.6%) | 110 (53.4%) |
| Total (Overall) | 517 (53.0%) | 458 (47.0%) |
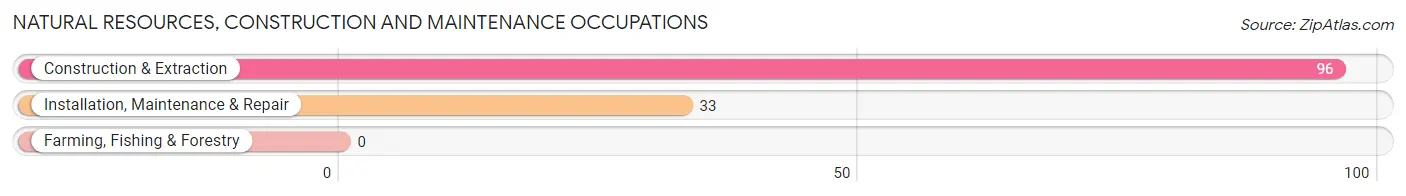
Natural Resources, Construction and Maintenance Occupations
The most common Natural Resources, Construction and Maintenance occupations in Maggie Valley are Construction & Extraction (96 | 9.9%), and Installation, Maintenance & Repair (33 | 3.4%).
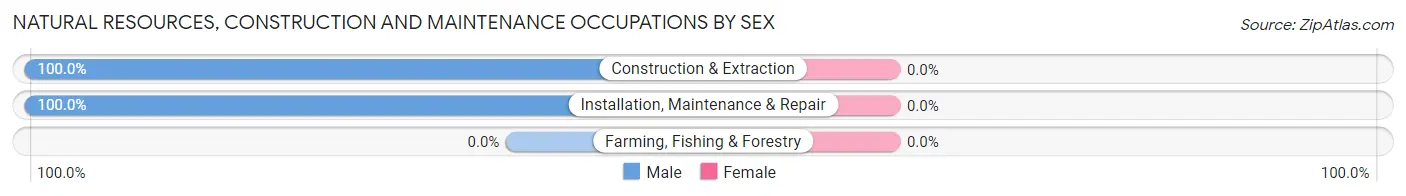
Natural Resources, Construction and Maintenance Occupations by Sex
| Occupation | Male | Female |
| Farming, Fishing & Forestry | 0 (0.0%) | 0 (0.0%) |
| Construction & Extraction | 96 (100.0%) | 0 (0.0%) |
| Installation, Maintenance & Repair | 33 (100.0%) | 0 (0.0%) |
| Total (Category) | 129 (100.0%) | 0 (0.0%) |
| Total (Overall) | 517 (53.0%) | 458 (47.0%) |
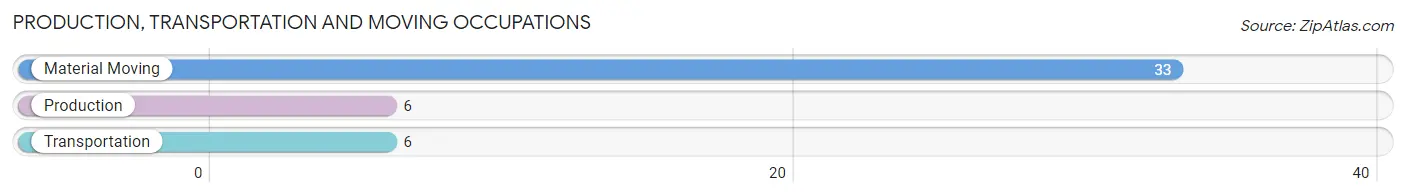
Production, Transportation and Moving Occupations
The most common Production, Transportation and Moving occupations in Maggie Valley are Material Moving (33 | 3.4%), Production (6 | 0.6%), and Transportation (6 | 0.6%).
Production, Transportation and Moving Occupations by Sex
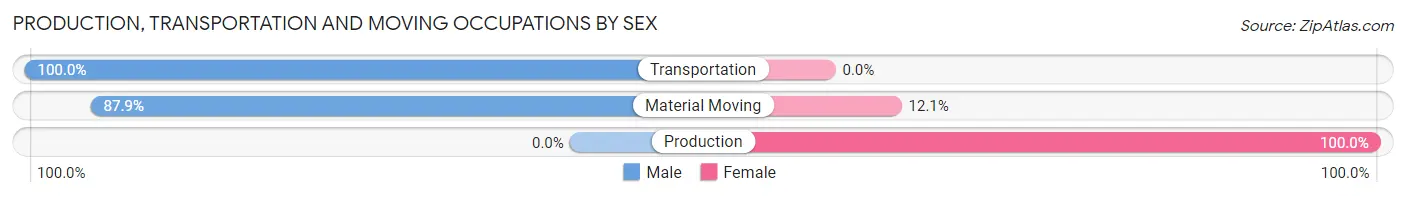
| Occupation | Male | Female |
| Production | 0 (0.0%) | 6 (100.0%) |
| Transportation | 6 (100.0%) | 0 (0.0%) |
| Material Moving | 29 (87.9%) | 4 (12.1%) |
| Total (Category) | 35 (77.8%) | 10 (22.2%) |
| Total (Overall) | 517 (53.0%) | 458 (47.0%) |
Employment Industries by Sex in Maggie Valley
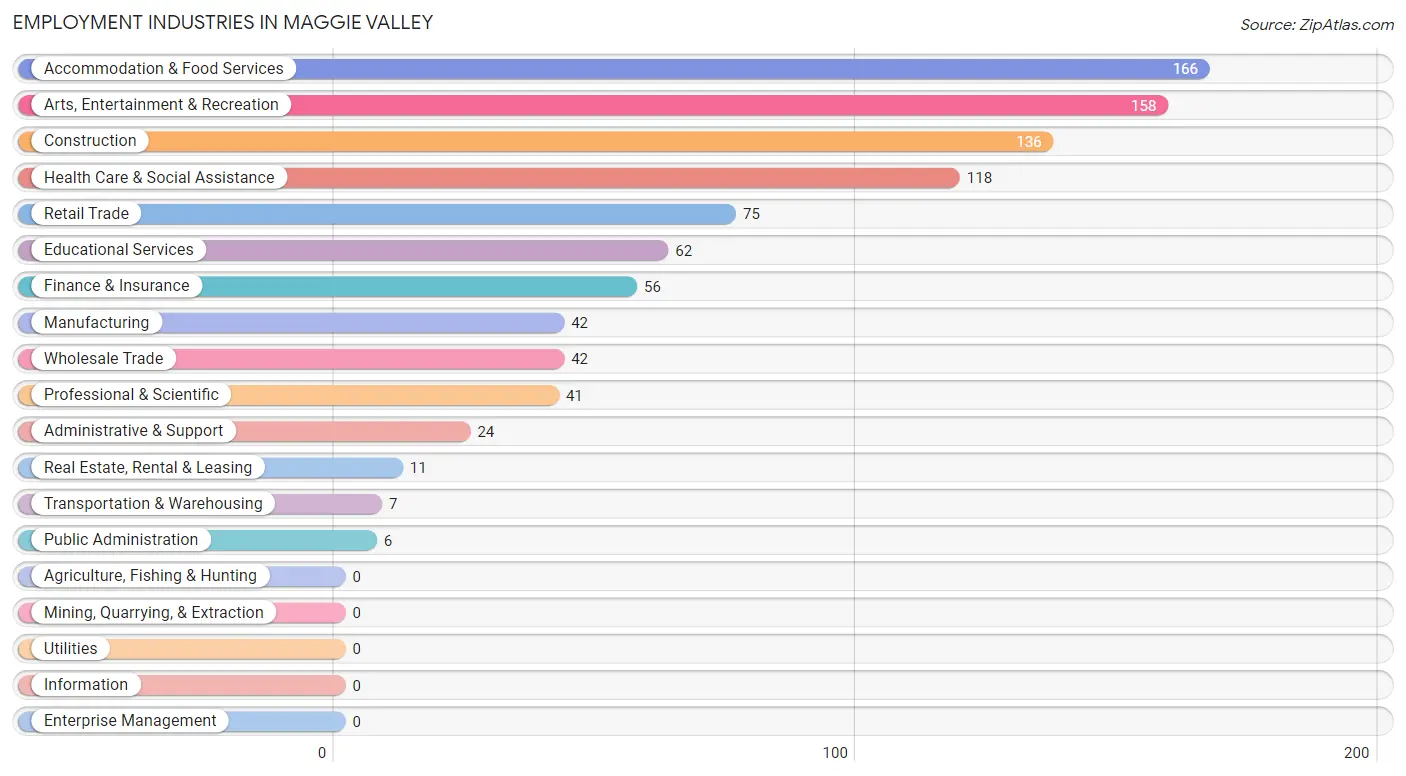
Employment Industries in Maggie Valley
The major employment industries in Maggie Valley include Accommodation & Food Services (166 | 17.0%), Arts, Entertainment & Recreation (158 | 16.2%), Construction (136 | 14.0%), Health Care & Social Assistance (118 | 12.1%), and Retail Trade (75 | 7.7%).
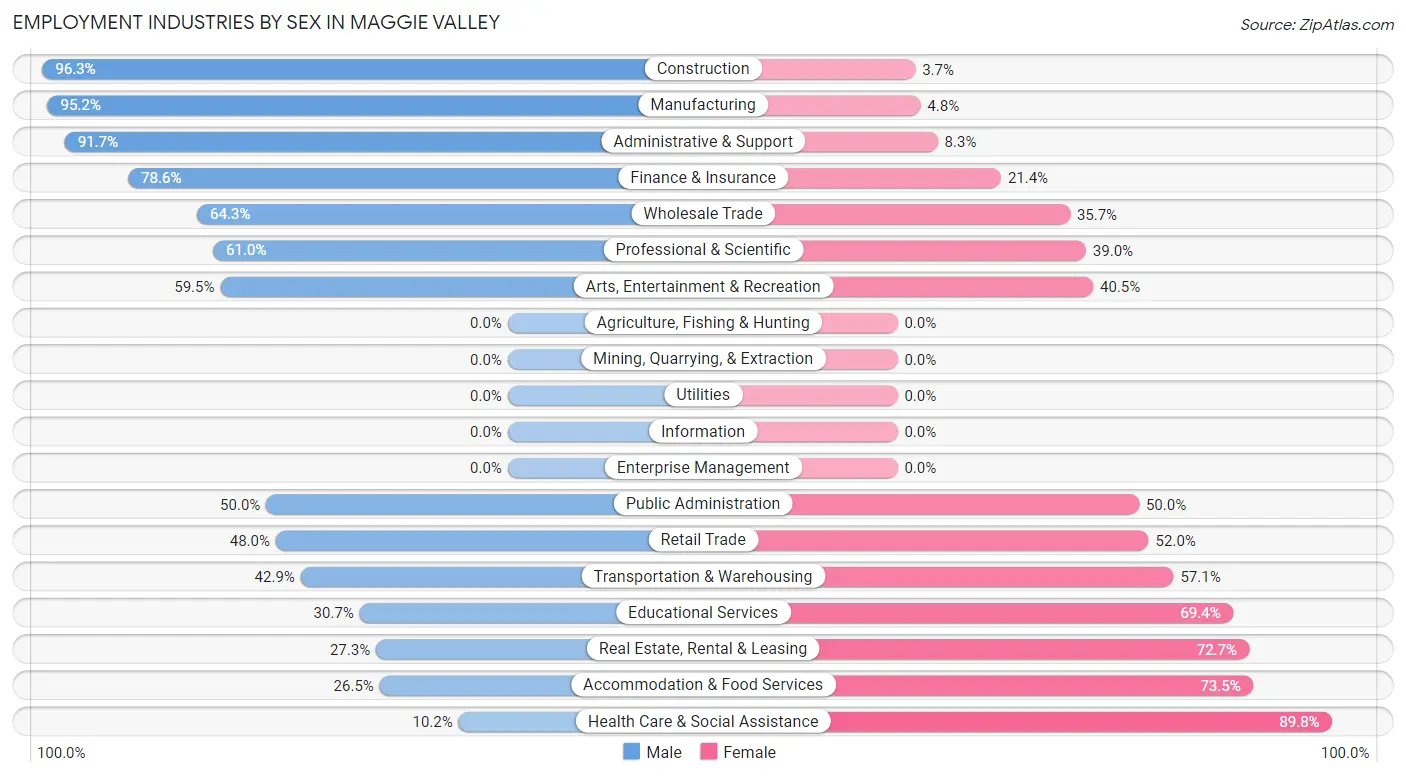
Employment Industries by Sex in Maggie Valley
The Maggie Valley industries that see more men than women are Construction (96.3%), Manufacturing (95.2%), and Administrative & Support (91.7%), whereas the industries that tend to have a higher number of women are Health Care & Social Assistance (89.8%), Accommodation & Food Services (73.5%), and Real Estate, Rental & Leasing (72.7%).
| Industry | Male | Female |
| Agriculture, Fishing & Hunting | 0 (0.0%) | 0 (0.0%) |
| Mining, Quarrying, & Extraction | 0 (0.0%) | 0 (0.0%) |
| Construction | 131 (96.3%) | 5 (3.7%) |
| Manufacturing | 40 (95.2%) | 2 (4.8%) |
| Wholesale Trade | 27 (64.3%) | 15 (35.7%) |
| Retail Trade | 36 (48.0%) | 39 (52.0%) |
| Transportation & Warehousing | 3 (42.9%) | 4 (57.1%) |
| Utilities | 0 (0.0%) | 0 (0.0%) |
| Information | 0 (0.0%) | 0 (0.0%) |
| Finance & Insurance | 44 (78.6%) | 12 (21.4%) |
| Real Estate, Rental & Leasing | 3 (27.3%) | 8 (72.7%) |
| Professional & Scientific | 25 (61.0%) | 16 (39.0%) |
| Enterprise Management | 0 (0.0%) | 0 (0.0%) |
| Administrative & Support | 22 (91.7%) | 2 (8.3%) |
| Educational Services | 19 (30.6%) | 43 (69.4%) |
| Health Care & Social Assistance | 12 (10.2%) | 106 (89.8%) |
| Arts, Entertainment & Recreation | 94 (59.5%) | 64 (40.5%) |
| Accommodation & Food Services | 44 (26.5%) | 122 (73.5%) |
| Public Administration | 3 (50.0%) | 3 (50.0%) |
| Total | 517 (53.0%) | 458 (47.0%) |
Education in Maggie Valley
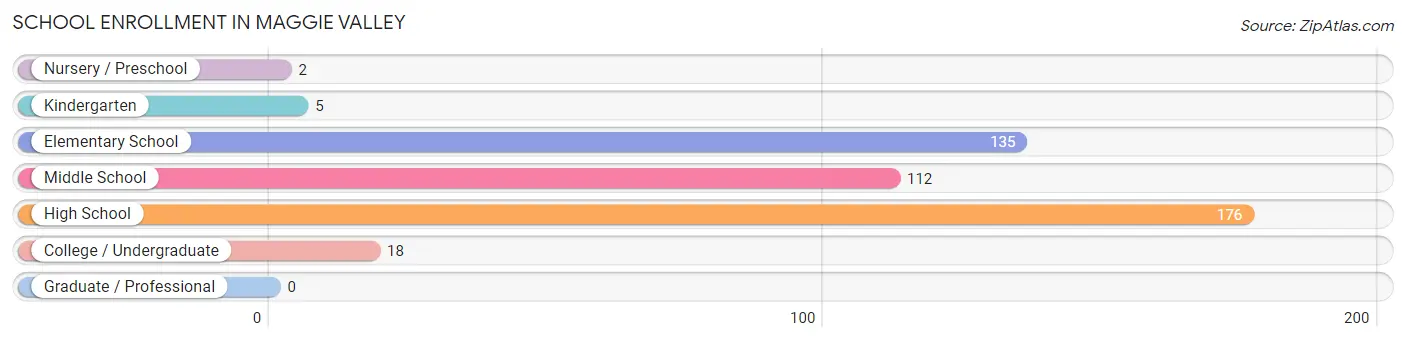
School Enrollment in Maggie Valley
The most common levels of schooling among the 448 students in Maggie Valley are high school (176 | 39.3%), elementary school (135 | 30.1%), and middle school (112 | 25.0%).
| School Level | # Students | % Students |
| Nursery / Preschool | 2 | 0.4% |
| Kindergarten | 5 | 1.1% |
| Elementary School | 135 | 30.1% |
| Middle School | 112 | 25.0% |
| High School | 176 | 39.3% |
| College / Undergraduate | 18 | 4.0% |
| Graduate / Professional | 0 | 0.0% |
| Total | 448 | 100.0% |
School Enrollment by Age by Funding Source in Maggie Valley
Out of a total of 448 students who are enrolled in schools in Maggie Valley, 26 (5.8%) attend a private institution, while the remaining 422 (94.2%) are enrolled in public schools. The age group of 15 to 17 year olds has the highest likelihood of being enrolled in private schools, with 26 (21.0% in the age bracket) enrolled. Conversely, the age group of 3 to 4 year olds has the lowest likelihood of being enrolled in a private school, with 2 (100.0% in the age bracket) attending a public institution.
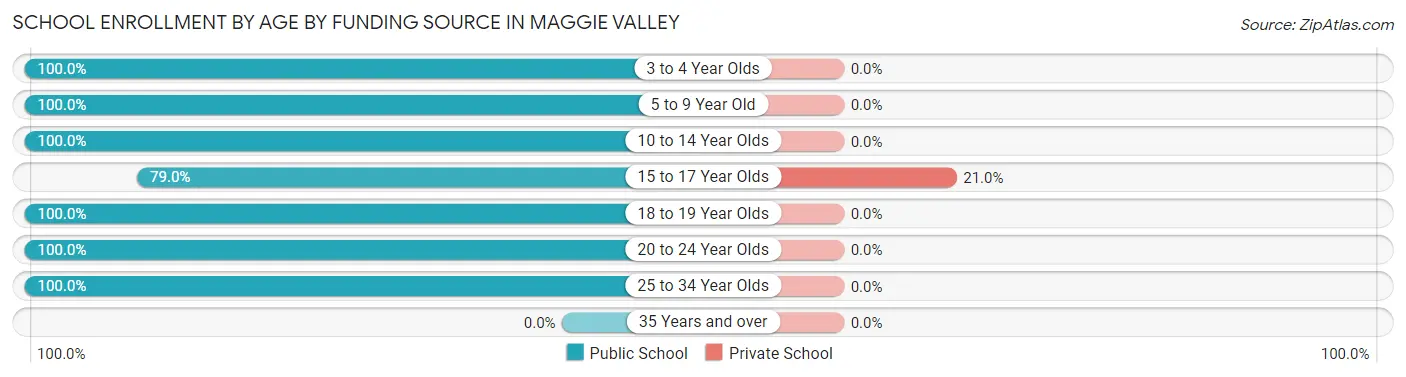
| Age Bracket | Public School | Private School |
| 3 to 4 Year Olds | 2 (100.0%) | 0 (0.0%) |
| 5 to 9 Year Old | 140 (100.0%) | 0 (0.0%) |
| 10 to 14 Year Olds | 112 (100.0%) | 0 (0.0%) |
| 15 to 17 Year Olds | 98 (79.0%) | 26 (21.0%) |
| 18 to 19 Year Olds | 52 (100.0%) | 0 (0.0%) |
| 20 to 24 Year Olds | 6 (100.0%) | 0 (0.0%) |
| 25 to 34 Year Olds | 12 (100.0%) | 0 (0.0%) |
| 35 Years and over | 0 (0.0%) | 0 (0.0%) |
| Total | 422 (94.2%) | 26 (5.8%) |
Educational Attainment by Field of Study in Maggie Valley
Business (130 | 23.1%), education (85 | 15.1%), psychology (68 | 12.1%), liberal arts & history (54 | 9.6%), and arts & humanities (44 | 7.8%) are the most common fields of study among 562 individuals in Maggie Valley who have obtained a bachelor's degree or higher.
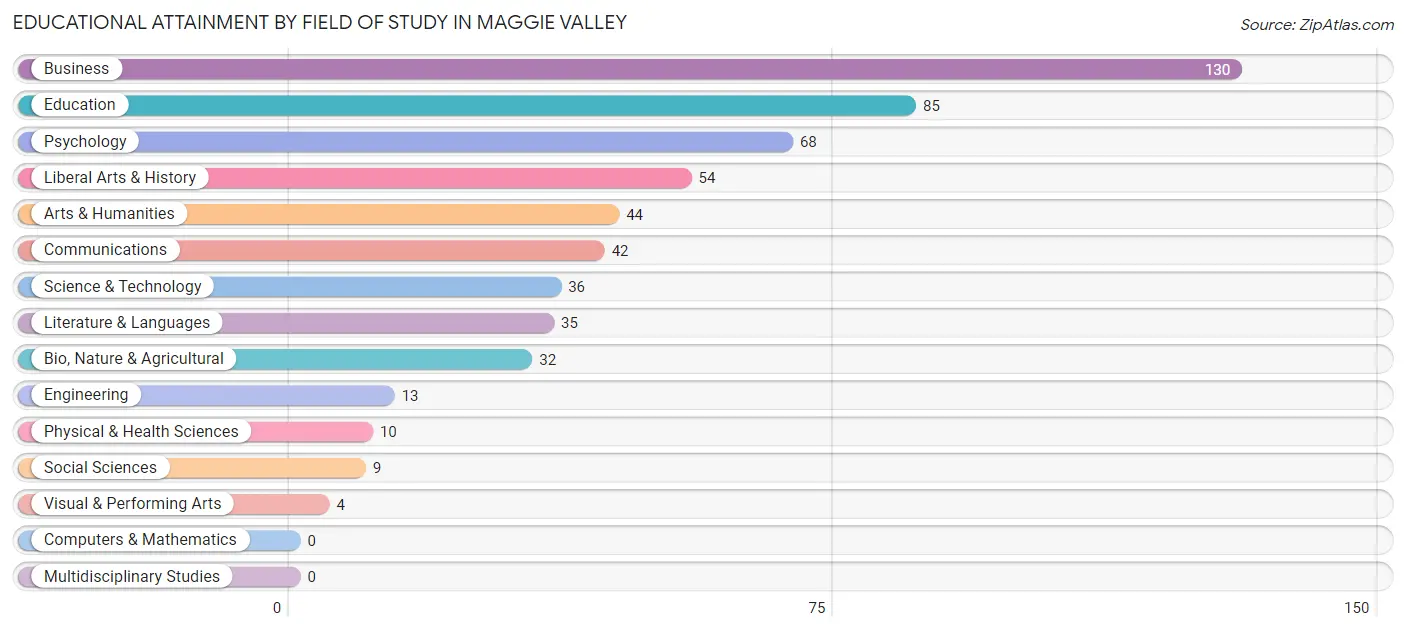
| Field of Study | # Graduates | % Graduates |
| Computers & Mathematics | 0 | 0.0% |
| Bio, Nature & Agricultural | 32 | 5.7% |
| Physical & Health Sciences | 10 | 1.8% |
| Psychology | 68 | 12.1% |
| Social Sciences | 9 | 1.6% |
| Engineering | 13 | 2.3% |
| Multidisciplinary Studies | 0 | 0.0% |
| Science & Technology | 36 | 6.4% |
| Business | 130 | 23.1% |
| Education | 85 | 15.1% |
| Literature & Languages | 35 | 6.2% |
| Liberal Arts & History | 54 | 9.6% |
| Visual & Performing Arts | 4 | 0.7% |
| Communications | 42 | 7.5% |
| Arts & Humanities | 44 | 7.8% |
| Total | 562 | 100.0% |
Transportation & Commute in Maggie Valley
Vehicle Availability by Sex in Maggie Valley
The most prevalent vehicle ownership categories in Maggie Valley are males with 2 vehicles (178, accounting for 37.1%) and females with 2 vehicles (193, making up 38.9%).
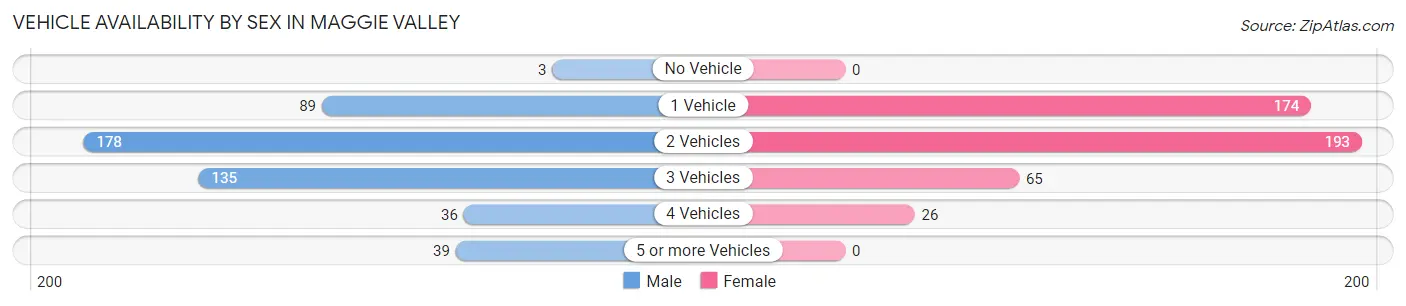
| Vehicles Available | Male | Female |
| No Vehicle | 3 (0.6%) | 0 (0.0%) |
| 1 Vehicle | 89 (18.5%) | 174 (38.0%) |
| 2 Vehicles | 178 (37.1%) | 193 (42.1%) |
| 3 Vehicles | 135 (28.1%) | 65 (14.2%) |
| 4 Vehicles | 36 (7.5%) | 26 (5.7%) |
| 5 or more Vehicles | 39 (8.1%) | 0 (0.0%) |
| Total | 480 (100.0%) | 458 (100.0%) |
Commute Time in Maggie Valley
The most frequently occuring commute durations in Maggie Valley are 15 to 19 minutes (156 commuters, 19.1%), 20 to 24 minutes (120 commuters, 14.6%), and 40 to 44 minutes (98 commuters, 12.0%).
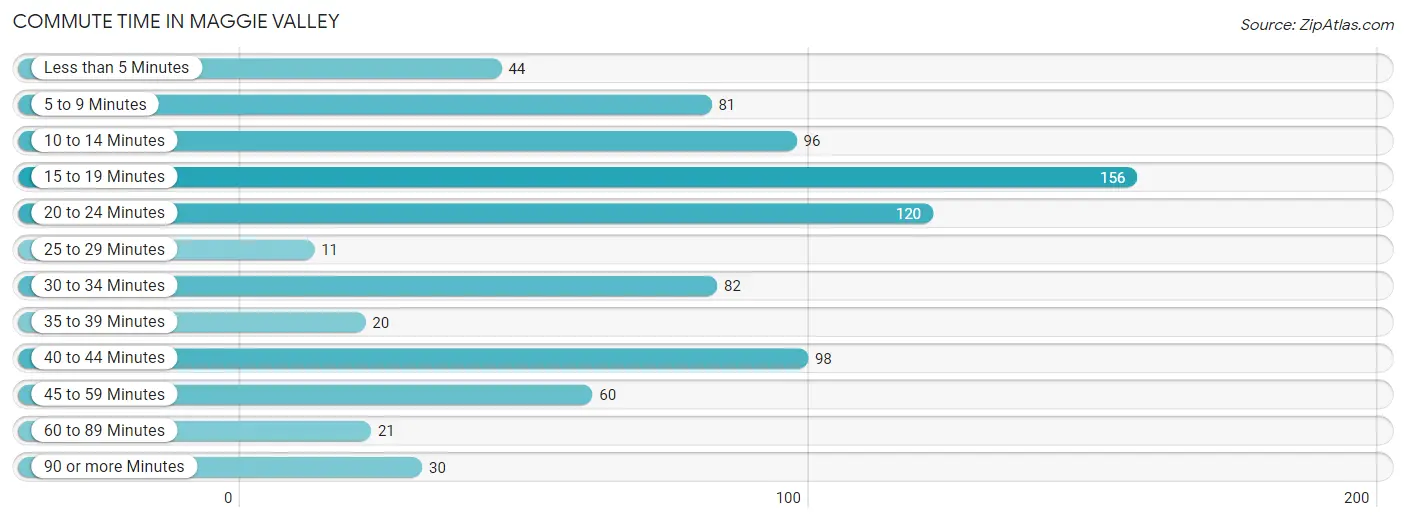
| Commute Time | # Commuters | % Commuters |
| Less than 5 Minutes | 44 | 5.4% |
| 5 to 9 Minutes | 81 | 9.9% |
| 10 to 14 Minutes | 96 | 11.7% |
| 15 to 19 Minutes | 156 | 19.1% |
| 20 to 24 Minutes | 120 | 14.6% |
| 25 to 29 Minutes | 11 | 1.3% |
| 30 to 34 Minutes | 82 | 10.0% |
| 35 to 39 Minutes | 20 | 2.4% |
| 40 to 44 Minutes | 98 | 12.0% |
| 45 to 59 Minutes | 60 | 7.3% |
| 60 to 89 Minutes | 21 | 2.6% |
| 90 or more Minutes | 30 | 3.7% |
Commute Time by Sex in Maggie Valley
The most common commute times in Maggie Valley are 15 to 19 minutes (85 commuters, 20.9%) for males and 10 to 14 minutes (86 commuters, 20.9%) for females.
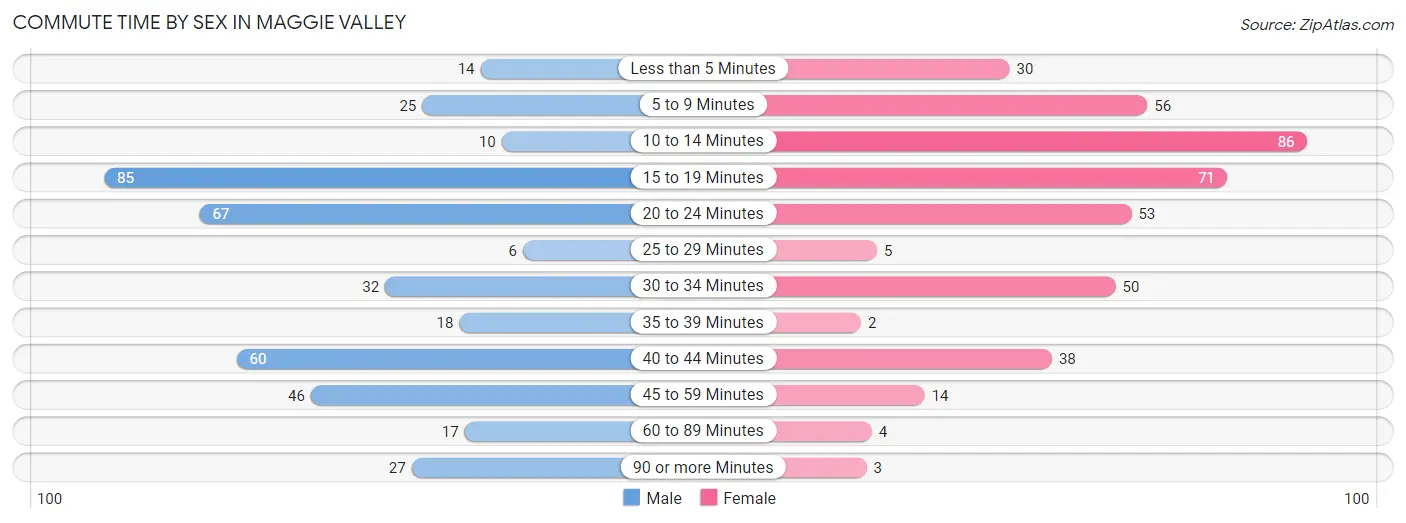
| Commute Time | Male | Female |
| Less than 5 Minutes | 14 (3.4%) | 30 (7.3%) |
| 5 to 9 Minutes | 25 (6.1%) | 56 (13.6%) |
| 10 to 14 Minutes | 10 (2.5%) | 86 (20.9%) |
| 15 to 19 Minutes | 85 (20.9%) | 71 (17.2%) |
| 20 to 24 Minutes | 67 (16.5%) | 53 (12.9%) |
| 25 to 29 Minutes | 6 (1.5%) | 5 (1.2%) |
| 30 to 34 Minutes | 32 (7.9%) | 50 (12.1%) |
| 35 to 39 Minutes | 18 (4.4%) | 2 (0.5%) |
| 40 to 44 Minutes | 60 (14.7%) | 38 (9.2%) |
| 45 to 59 Minutes | 46 (11.3%) | 14 (3.4%) |
| 60 to 89 Minutes | 17 (4.2%) | 4 (1.0%) |
| 90 or more Minutes | 27 (6.6%) | 3 (0.7%) |
Time of Departure to Work by Sex in Maggie Valley
The most frequent times of departure to work in Maggie Valley are 6:30 AM to 6:59 AM (76, 18.7%) for males and 7:30 AM to 7:59 AM (91, 22.1%) for females.
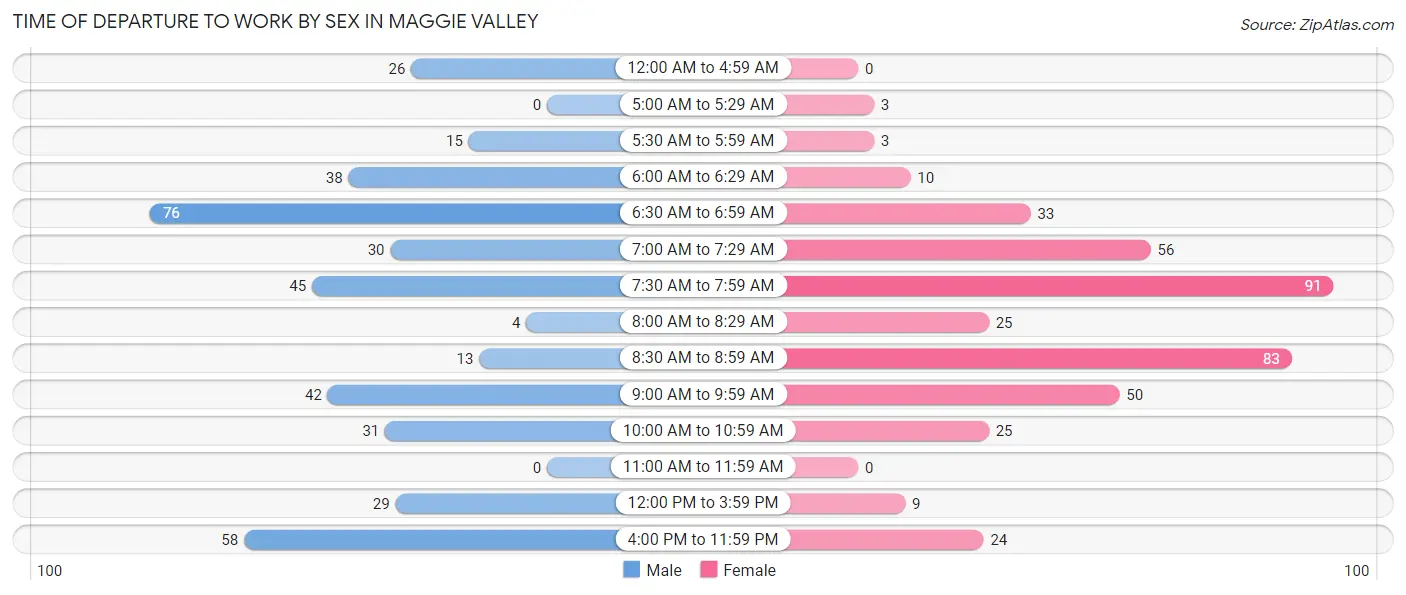
| Time of Departure | Male | Female |
| 12:00 AM to 4:59 AM | 26 (6.4%) | 0 (0.0%) |
| 5:00 AM to 5:29 AM | 0 (0.0%) | 3 (0.7%) |
| 5:30 AM to 5:59 AM | 15 (3.7%) | 3 (0.7%) |
| 6:00 AM to 6:29 AM | 38 (9.3%) | 10 (2.4%) |
| 6:30 AM to 6:59 AM | 76 (18.7%) | 33 (8.0%) |
| 7:00 AM to 7:29 AM | 30 (7.4%) | 56 (13.6%) |
| 7:30 AM to 7:59 AM | 45 (11.1%) | 91 (22.1%) |
| 8:00 AM to 8:29 AM | 4 (1.0%) | 25 (6.1%) |
| 8:30 AM to 8:59 AM | 13 (3.2%) | 83 (20.2%) |
| 9:00 AM to 9:59 AM | 42 (10.3%) | 50 (12.1%) |
| 10:00 AM to 10:59 AM | 31 (7.6%) | 25 (6.1%) |
| 11:00 AM to 11:59 AM | 0 (0.0%) | 0 (0.0%) |
| 12:00 PM to 3:59 PM | 29 (7.1%) | 9 (2.2%) |
| 4:00 PM to 11:59 PM | 58 (14.2%) | 24 (5.8%) |
| Total | 407 (100.0%) | 412 (100.0%) |
Housing Occupancy in Maggie Valley
Occupancy by Ownership in Maggie Valley
Of the total 832 dwellings in Maggie Valley, owner-occupied units account for 659 (79.2%), while renter-occupied units make up 173 (20.8%).
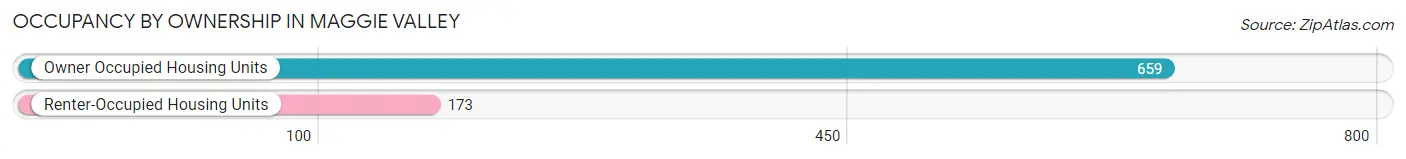
| Occupancy | # Housing Units | % Housing Units |
| Owner Occupied Housing Units | 659 | 79.2% |
| Renter-Occupied Housing Units | 173 | 20.8% |
| Total Occupied Housing Units | 832 | 100.0% |
Occupancy by Household Size in Maggie Valley
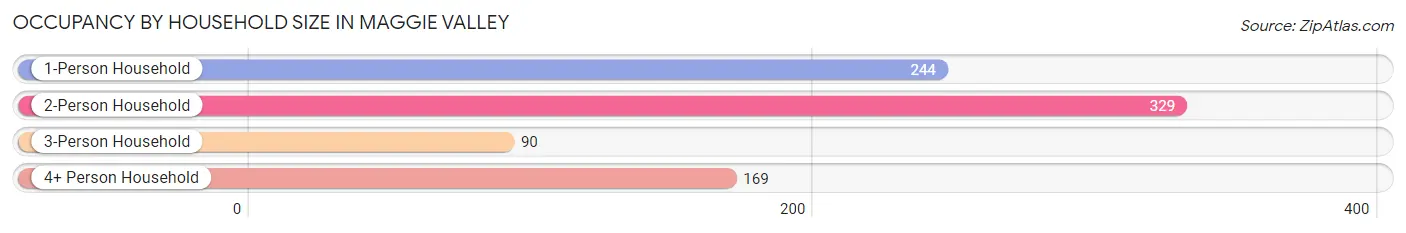
| Household Size | # Housing Units | % Housing Units |
| 1-Person Household | 244 | 29.3% |
| 2-Person Household | 329 | 39.5% |
| 3-Person Household | 90 | 10.8% |
| 4+ Person Household | 169 | 20.3% |
| Total Housing Units | 832 | 100.0% |
Occupancy by Ownership by Household Size in Maggie Valley
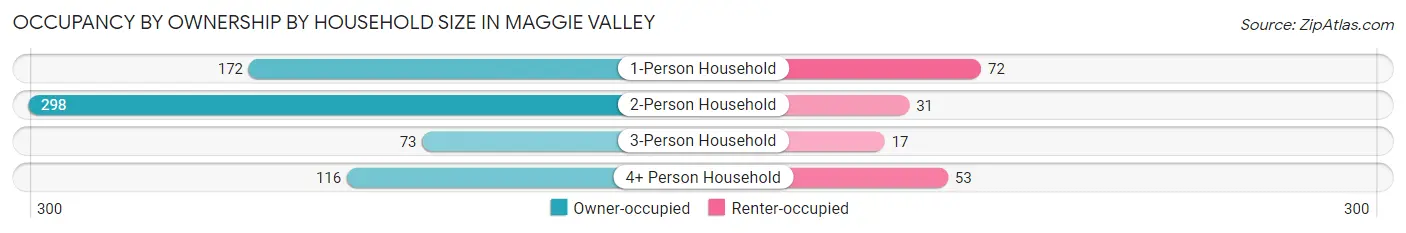
| Household Size | Owner-occupied | Renter-occupied |
| 1-Person Household | 172 (70.5%) | 72 (29.5%) |
| 2-Person Household | 298 (90.6%) | 31 (9.4%) |
| 3-Person Household | 73 (81.1%) | 17 (18.9%) |
| 4+ Person Household | 116 (68.6%) | 53 (31.4%) |
| Total Housing Units | 659 (79.2%) | 173 (20.8%) |
Occupancy by Educational Attainment in Maggie Valley
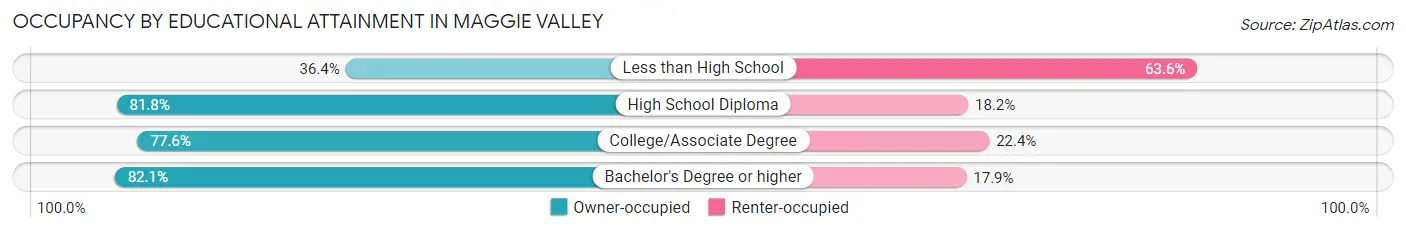
| Household Size | Owner-occupied | Renter-occupied |
| Less than High School | 8 (36.4%) | 14 (63.6%) |
| High School Diploma | 148 (81.8%) | 33 (18.2%) |
| College/Associate Degree | 232 (77.6%) | 67 (22.4%) |
| Bachelor's Degree or higher | 271 (82.1%) | 59 (17.9%) |
Occupancy by Age of Householder in Maggie Valley
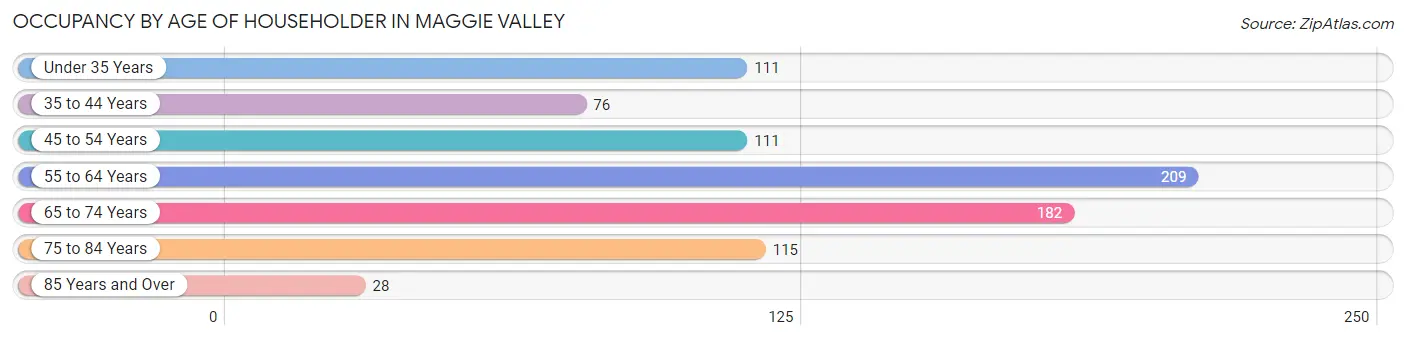
| Age Bracket | # Households | % Households |
| Under 35 Years | 111 | 13.3% |
| 35 to 44 Years | 76 | 9.1% |
| 45 to 54 Years | 111 | 13.3% |
| 55 to 64 Years | 209 | 25.1% |
| 65 to 74 Years | 182 | 21.9% |
| 75 to 84 Years | 115 | 13.8% |
| 85 Years and Over | 28 | 3.4% |
| Total | 832 | 100.0% |
Housing Finances in Maggie Valley
Median Income by Occupancy in Maggie Valley
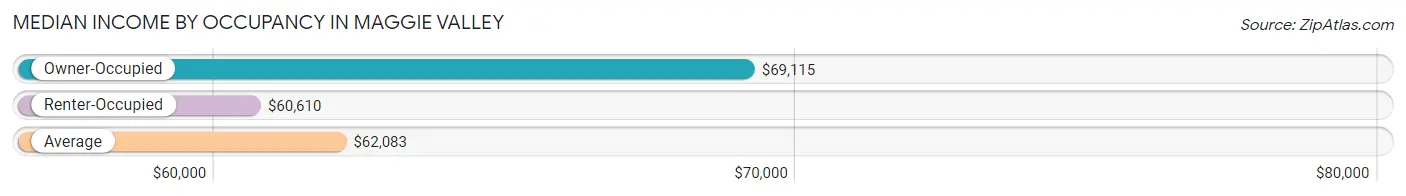
| Occupancy Type | # Households | Median Income |
| Owner-Occupied | 659 (79.2%) | $69,115 |
| Renter-Occupied | 173 (20.8%) | $60,610 |
| Average | 832 (100.0%) | $62,083 |
Occupancy by Householder Income Bracket in Maggie Valley
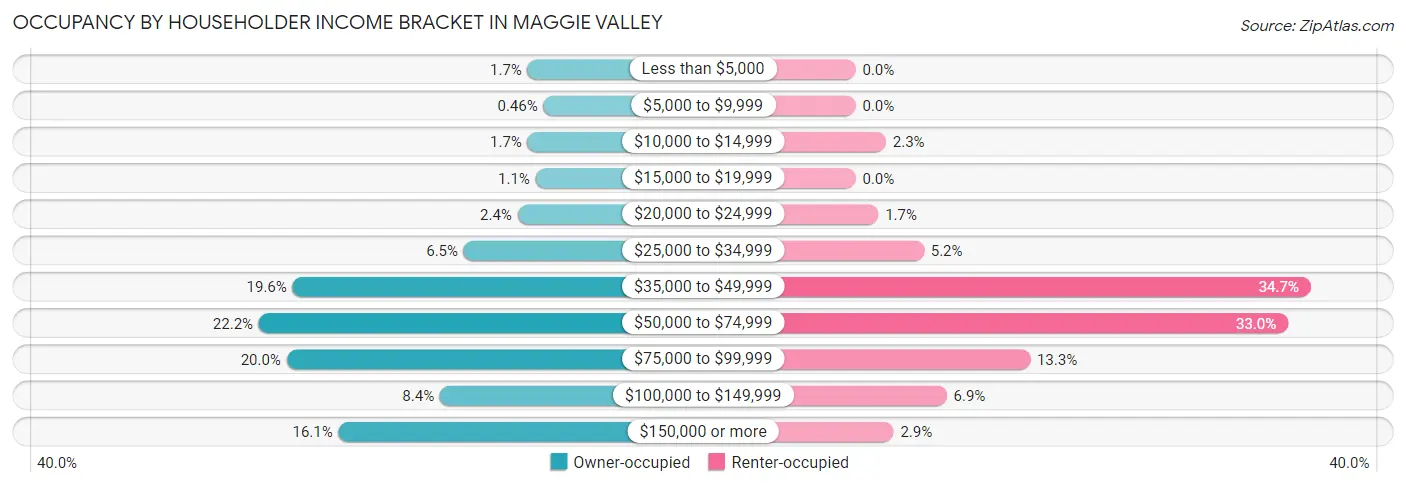
| Income Bracket | Owner-occupied | Renter-occupied |
| Less than $5,000 | 11 (1.7%) | 0 (0.0%) |
| $5,000 to $9,999 | 3 (0.5%) | 0 (0.0%) |
| $10,000 to $14,999 | 11 (1.7%) | 4 (2.3%) |
| $15,000 to $19,999 | 7 (1.1%) | 0 (0.0%) |
| $20,000 to $24,999 | 16 (2.4%) | 3 (1.7%) |
| $25,000 to $34,999 | 43 (6.5%) | 9 (5.2%) |
| $35,000 to $49,999 | 129 (19.6%) | 60 (34.7%) |
| $50,000 to $74,999 | 146 (22.2%) | 57 (33.0%) |
| $75,000 to $99,999 | 132 (20.0%) | 23 (13.3%) |
| $100,000 to $149,999 | 55 (8.4%) | 12 (6.9%) |
| $150,000 or more | 106 (16.1%) | 5 (2.9%) |
| Total | 659 (100.0%) | 173 (100.0%) |
Monthly Housing Cost Tiers in Maggie Valley
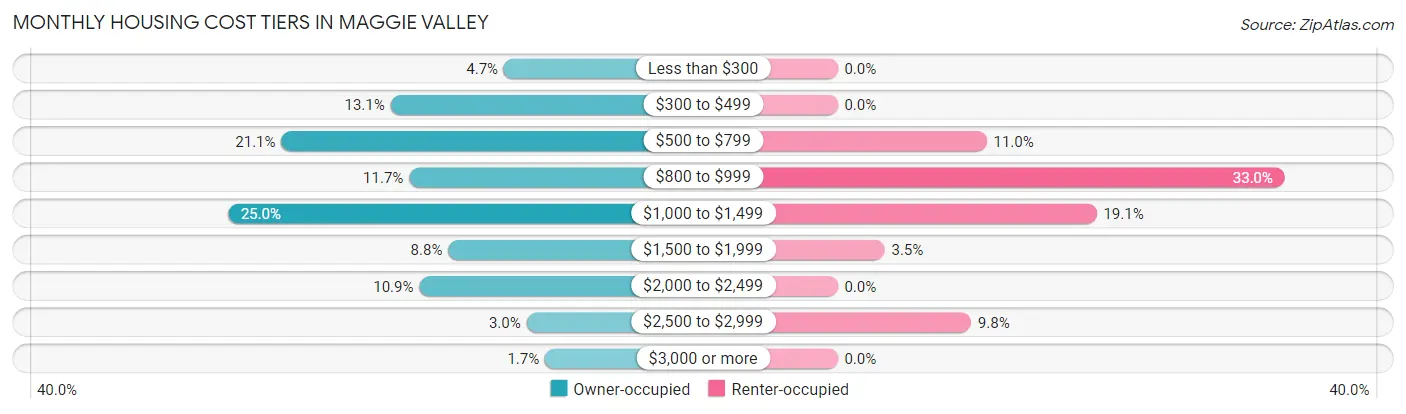
| Monthly Cost | Owner-occupied | Renter-occupied |
| Less than $300 | 31 (4.7%) | 0 (0.0%) |
| $300 to $499 | 86 (13.1%) | 0 (0.0%) |
| $500 to $799 | 139 (21.1%) | 19 (11.0%) |
| $800 to $999 | 77 (11.7%) | 57 (33.0%) |
| $1,000 to $1,499 | 165 (25.0%) | 33 (19.1%) |
| $1,500 to $1,999 | 58 (8.8%) | 6 (3.5%) |
| $2,000 to $2,499 | 72 (10.9%) | 0 (0.0%) |
| $2,500 to $2,999 | 20 (3.0%) | 17 (9.8%) |
| $3,000 or more | 11 (1.7%) | 0 (0.0%) |
| Total | 659 (100.0%) | 173 (100.0%) |
Physical Housing Characteristics in Maggie Valley
Housing Structures in Maggie Valley
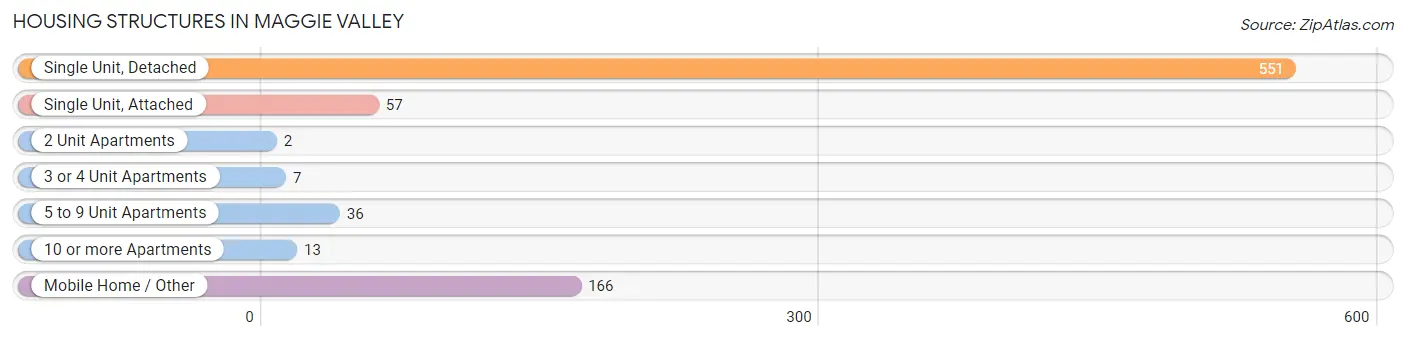
| Structure Type | # Housing Units | % Housing Units |
| Single Unit, Detached | 551 | 66.2% |
| Single Unit, Attached | 57 | 6.9% |
| 2 Unit Apartments | 2 | 0.2% |
| 3 or 4 Unit Apartments | 7 | 0.8% |
| 5 to 9 Unit Apartments | 36 | 4.3% |
| 10 or more Apartments | 13 | 1.6% |
| Mobile Home / Other | 166 | 20.0% |
| Total | 832 | 100.0% |
Housing Structures by Occupancy in Maggie Valley
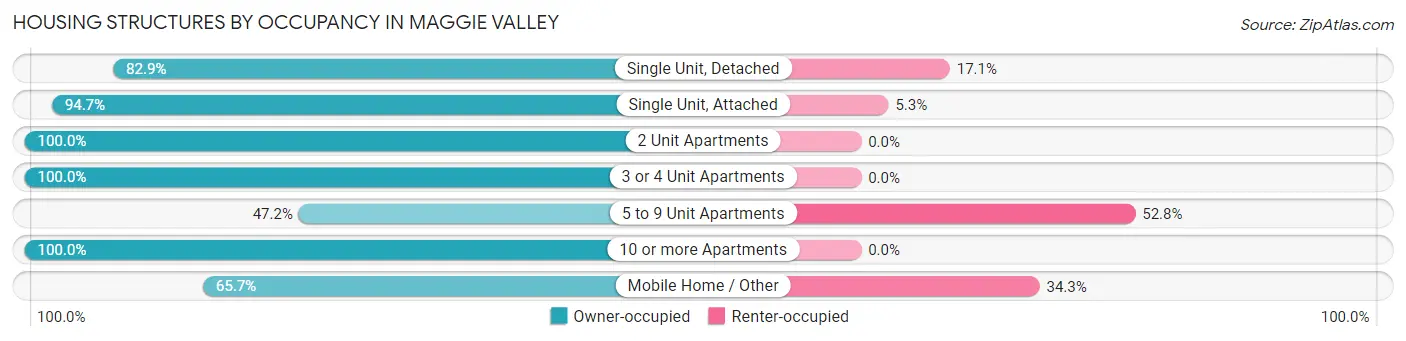
| Structure Type | Owner-occupied | Renter-occupied |
| Single Unit, Detached | 457 (82.9%) | 94 (17.1%) |
| Single Unit, Attached | 54 (94.7%) | 3 (5.3%) |
| 2 Unit Apartments | 2 (100.0%) | 0 (0.0%) |
| 3 or 4 Unit Apartments | 7 (100.0%) | 0 (0.0%) |
| 5 to 9 Unit Apartments | 17 (47.2%) | 19 (52.8%) |
| 10 or more Apartments | 13 (100.0%) | 0 (0.0%) |
| Mobile Home / Other | 109 (65.7%) | 57 (34.3%) |
| Total | 659 (79.2%) | 173 (20.8%) |
Housing Structures by Number of Rooms in Maggie Valley
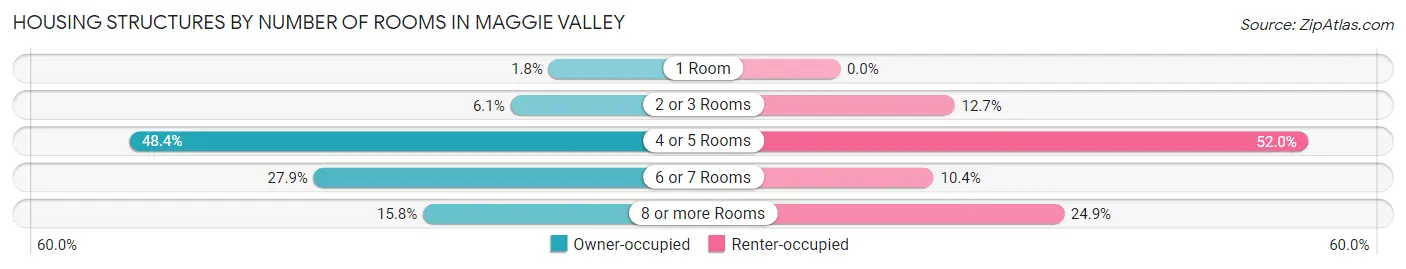
| Number of Rooms | Owner-occupied | Renter-occupied |
| 1 Room | 12 (1.8%) | 0 (0.0%) |
| 2 or 3 Rooms | 40 (6.1%) | 22 (12.7%) |
| 4 or 5 Rooms | 319 (48.4%) | 90 (52.0%) |
| 6 or 7 Rooms | 184 (27.9%) | 18 (10.4%) |
| 8 or more Rooms | 104 (15.8%) | 43 (24.9%) |
| Total | 659 (100.0%) | 173 (100.0%) |
Housing Structure by Heating Type in Maggie Valley
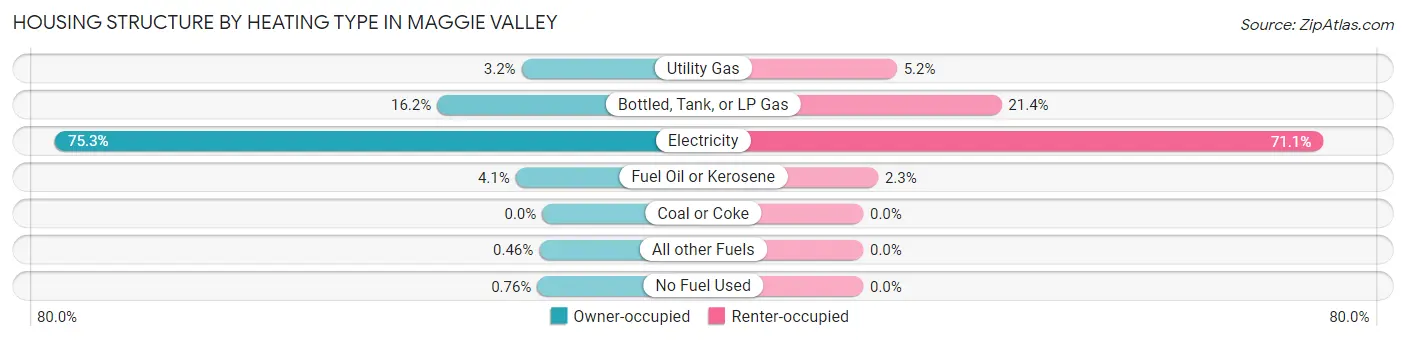
| Heating Type | Owner-occupied | Renter-occupied |
| Utility Gas | 21 (3.2%) | 9 (5.2%) |
| Bottled, Tank, or LP Gas | 107 (16.2%) | 37 (21.4%) |
| Electricity | 496 (75.3%) | 123 (71.1%) |
| Fuel Oil or Kerosene | 27 (4.1%) | 4 (2.3%) |
| Coal or Coke | 0 (0.0%) | 0 (0.0%) |
| All other Fuels | 3 (0.5%) | 0 (0.0%) |
| No Fuel Used | 5 (0.8%) | 0 (0.0%) |
| Total | 659 (100.0%) | 173 (100.0%) |
Household Vehicle Usage in Maggie Valley
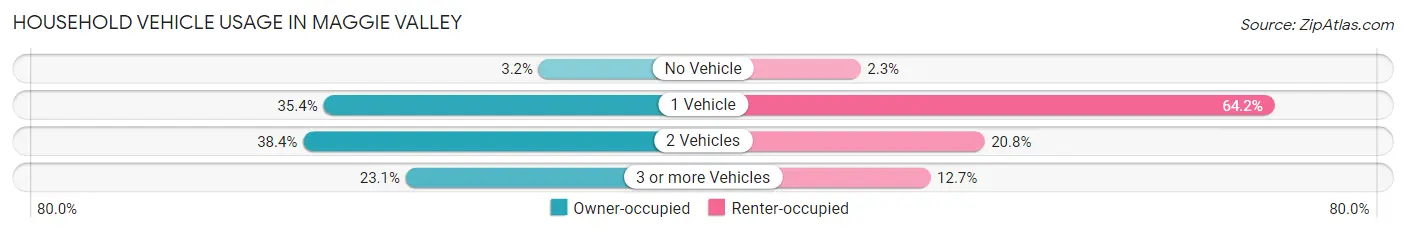
| Vehicles per Household | Owner-occupied | Renter-occupied |
| No Vehicle | 21 (3.2%) | 4 (2.3%) |
| 1 Vehicle | 233 (35.4%) | 111 (64.2%) |
| 2 Vehicles | 253 (38.4%) | 36 (20.8%) |
| 3 or more Vehicles | 152 (23.1%) | 22 (12.7%) |
| Total | 659 (100.0%) | 173 (100.0%) |
Real Estate & Mortgages in Maggie Valley
Real Estate and Mortgage Overview in Maggie Valley
| Characteristic | Without Mortgage | With Mortgage |
| Housing Units | 291 | 368 |
| Median Property Value | $300,900 | $235,000 |
| Median Household Income | $70,139 | $57 |
| Monthly Housing Costs | $563 | $11 |
| Real Estate Taxes | $2,369 | $4 |
Property Value by Mortgage Status in Maggie Valley
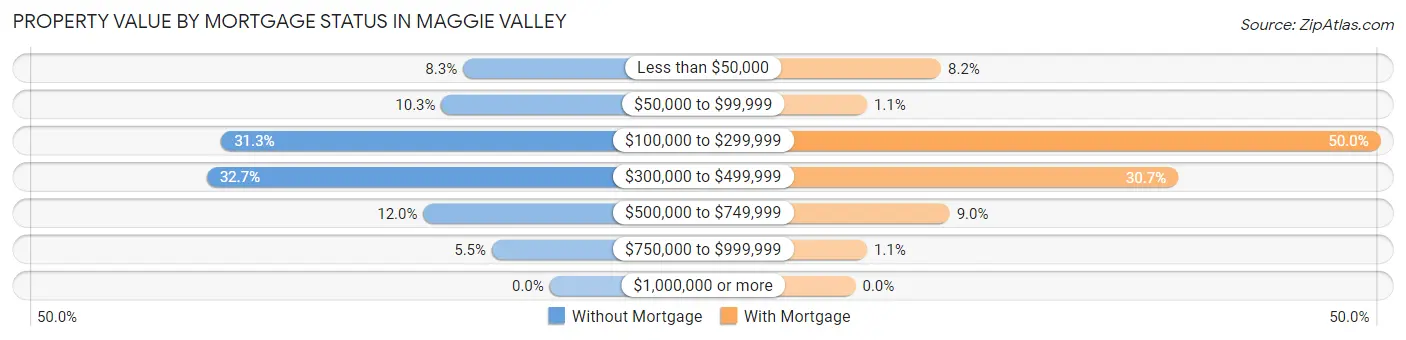
| Property Value | Without Mortgage | With Mortgage |
| Less than $50,000 | 24 (8.3%) | 30 (8.2%) |
| $50,000 to $99,999 | 30 (10.3%) | 4 (1.1%) |
| $100,000 to $299,999 | 91 (31.3%) | 184 (50.0%) |
| $300,000 to $499,999 | 95 (32.7%) | 113 (30.7%) |
| $500,000 to $749,999 | 35 (12.0%) | 33 (9.0%) |
| $750,000 to $999,999 | 16 (5.5%) | 4 (1.1%) |
| $1,000,000 or more | 0 (0.0%) | 0 (0.0%) |
| Total | 291 (100.0%) | 368 (100.0%) |
Household Income by Mortgage Status in Maggie Valley
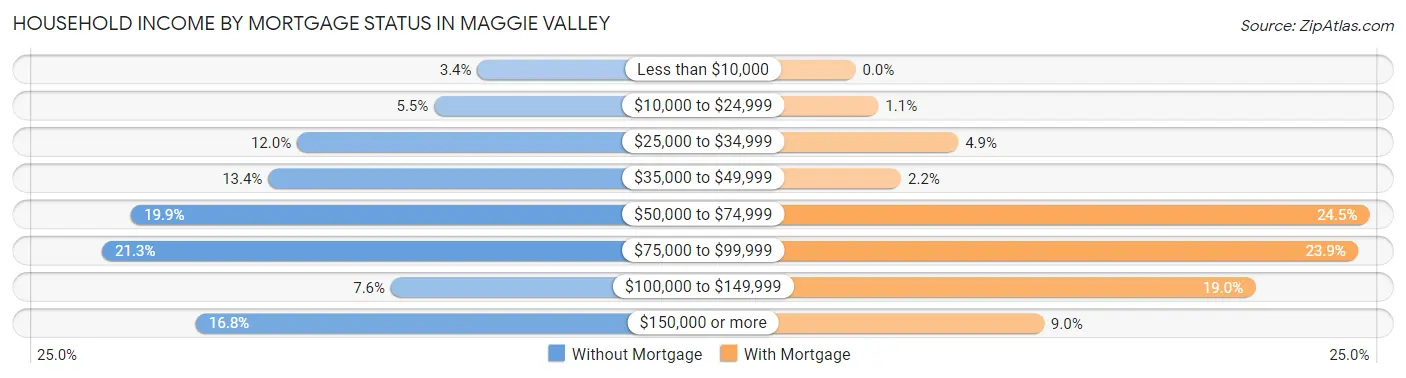
| Household Income | Without Mortgage | With Mortgage |
| Less than $10,000 | 10 (3.4%) | 0 (0.0%) |
| $10,000 to $24,999 | 16 (5.5%) | 4 (1.1%) |
| $25,000 to $34,999 | 35 (12.0%) | 18 (4.9%) |
| $35,000 to $49,999 | 39 (13.4%) | 8 (2.2%) |
| $50,000 to $74,999 | 58 (19.9%) | 90 (24.5%) |
| $75,000 to $99,999 | 62 (21.3%) | 88 (23.9%) |
| $100,000 to $149,999 | 22 (7.6%) | 70 (19.0%) |
| $150,000 or more | 49 (16.8%) | 33 (9.0%) |
| Total | 291 (100.0%) | 368 (100.0%) |
Property Value to Household Income Ratio in Maggie Valley
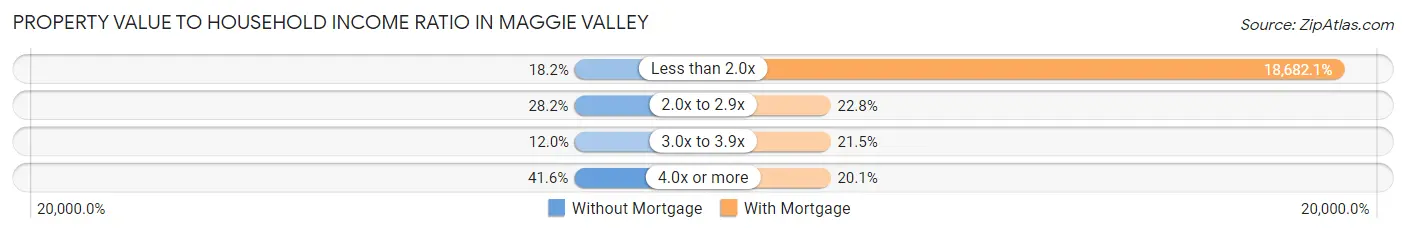
| Value-to-Income Ratio | Without Mortgage | With Mortgage |
| Less than 2.0x | 53 (18.2%) | 68,750 (18,682.1%) |
| 2.0x to 2.9x | 82 (28.2%) | 84 (22.8%) |
| 3.0x to 3.9x | 35 (12.0%) | 79 (21.5%) |
| 4.0x or more | 121 (41.6%) | 74 (20.1%) |
| Total | 291 (100.0%) | 368 (100.0%) |
Real Estate Taxes by Mortgage Status in Maggie Valley
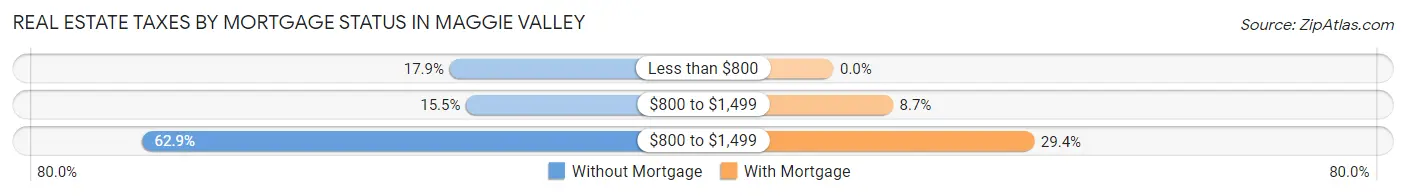
| Property Taxes | Without Mortgage | With Mortgage |
| Less than $800 | 52 (17.9%) | 0 (0.0%) |
| $800 to $1,499 | 45 (15.5%) | 32 (8.7%) |
| $800 to $1,499 | 183 (62.9%) | 108 (29.3%) |
| Total | 291 (100.0%) | 368 (100.0%) |
Health & Disability in Maggie Valley
Health Insurance Coverage by Age in Maggie Valley
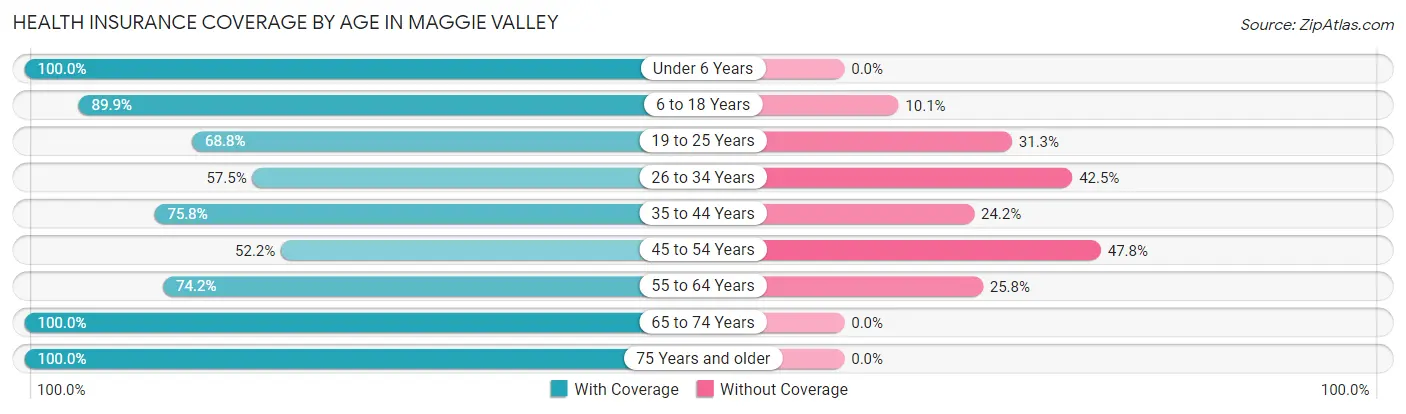
| Age Bracket | With Coverage | Without Coverage |
| Under 6 Years | 19 (100.0%) | 0 (0.0%) |
| 6 to 18 Years | 392 (89.9%) | 44 (10.1%) |
| 19 to 25 Years | 132 (68.8%) | 60 (31.2%) |
| 26 to 34 Years | 115 (57.5%) | 85 (42.5%) |
| 35 to 44 Years | 119 (75.8%) | 38 (24.2%) |
| 45 to 54 Years | 120 (52.2%) | 110 (47.8%) |
| 55 to 64 Years | 267 (74.2%) | 93 (25.8%) |
| 65 to 74 Years | 339 (100.0%) | 0 (0.0%) |
| 75 Years and older | 246 (100.0%) | 0 (0.0%) |
| Total | 1,749 (80.3%) | 430 (19.7%) |
Health Insurance Coverage by Citizenship Status in Maggie Valley
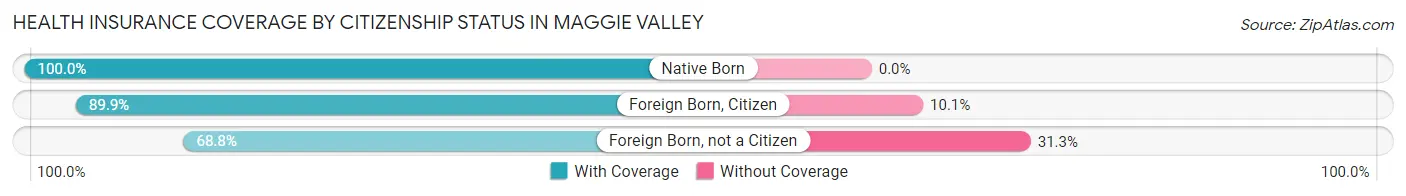
| Citizenship Status | With Coverage | Without Coverage |
| Native Born | 19 (100.0%) | 0 (0.0%) |
| Foreign Born, Citizen | 392 (89.9%) | 44 (10.1%) |
| Foreign Born, not a Citizen | 132 (68.8%) | 60 (31.2%) |
Health Insurance Coverage by Household Income in Maggie Valley
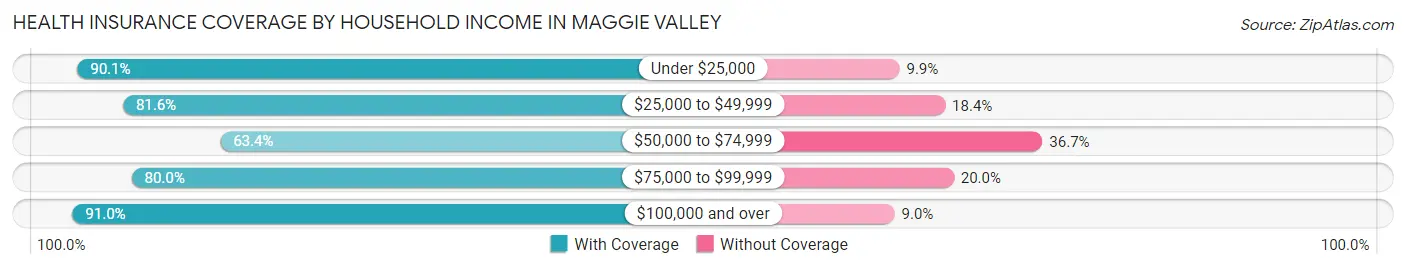
| Household Income | With Coverage | Without Coverage |
| Under $25,000 | 73 (90.1%) | 8 (9.9%) |
| $25,000 to $49,999 | 456 (81.6%) | 103 (18.4%) |
| $50,000 to $74,999 | 299 (63.3%) | 173 (36.6%) |
| $75,000 to $99,999 | 367 (80.0%) | 92 (20.0%) |
| $100,000 and over | 549 (91.0%) | 54 (9.0%) |
Public vs Private Health Insurance Coverage by Age in Maggie Valley
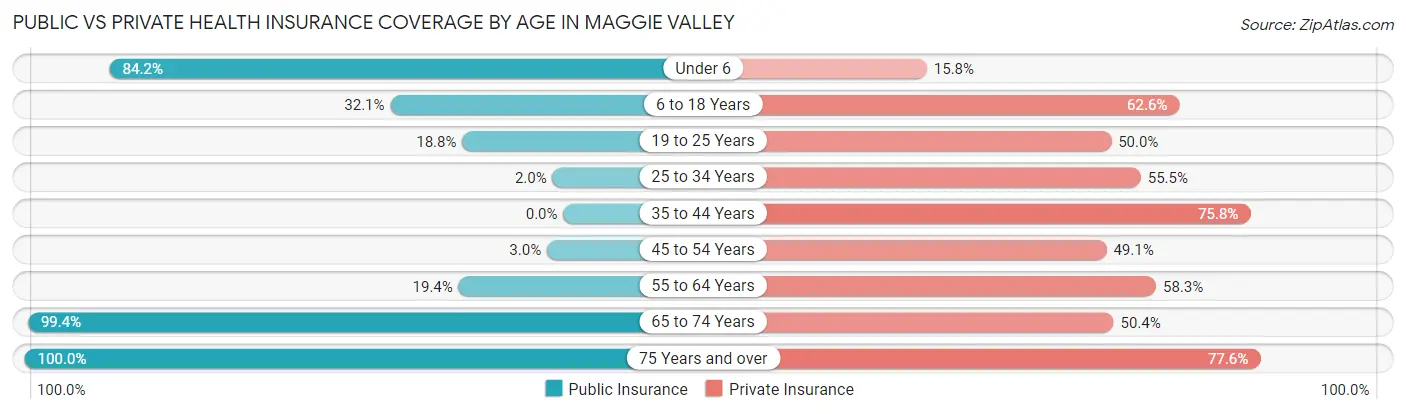
| Age Bracket | Public Insurance | Private Insurance |
| Under 6 | 16 (84.2%) | 3 (15.8%) |
| 6 to 18 Years | 140 (32.1%) | 273 (62.6%) |
| 19 to 25 Years | 36 (18.8%) | 96 (50.0%) |
| 25 to 34 Years | 4 (2.0%) | 111 (55.5%) |
| 35 to 44 Years | 0 (0.0%) | 119 (75.8%) |
| 45 to 54 Years | 7 (3.0%) | 113 (49.1%) |
| 55 to 64 Years | 70 (19.4%) | 210 (58.3%) |
| 65 to 74 Years | 337 (99.4%) | 171 (50.4%) |
| 75 Years and over | 246 (100.0%) | 191 (77.6%) |
| Total | 856 (39.3%) | 1,287 (59.1%) |
Disability Status by Sex by Age in Maggie Valley
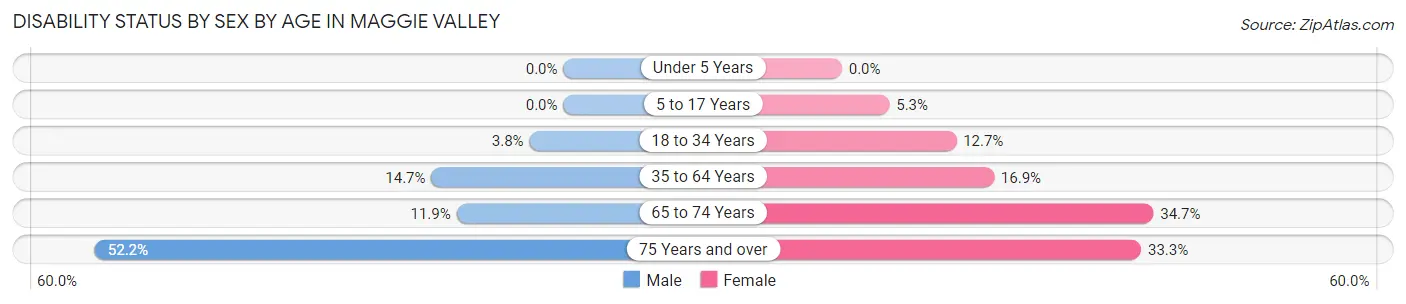
| Age Bracket | Male | Female |
| Under 5 Years | 0 (0.0%) | 0 (0.0%) |
| 5 to 17 Years | 0 (0.0%) | 11 (5.3%) |
| 18 to 34 Years | 7 (3.8%) | 33 (12.7%) |
| 35 to 64 Years | 56 (14.7%) | 62 (16.9%) |
| 65 to 74 Years | 17 (11.9%) | 68 (34.7%) |
| 75 Years and over | 72 (52.2%) | 36 (33.3%) |
Disability Class by Sex by Age in Maggie Valley
Disability Class: Hearing Difficulty
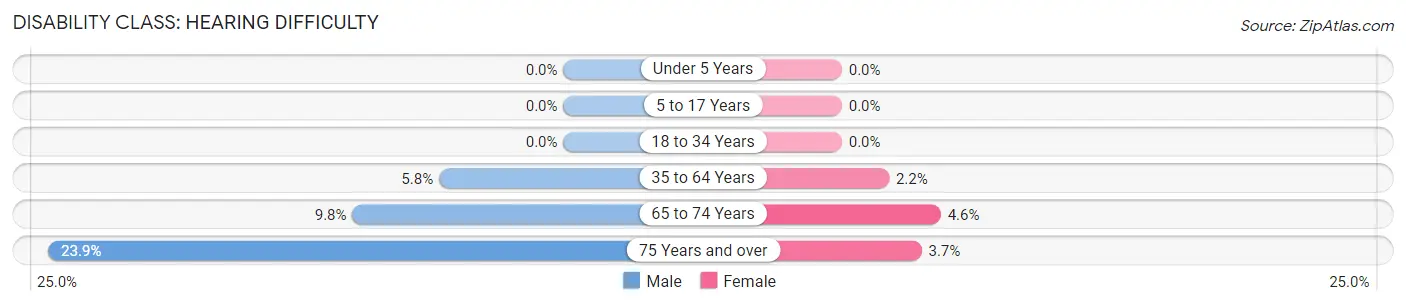
| Age Bracket | Male | Female |
| Under 5 Years | 0 (0.0%) | 0 (0.0%) |
| 5 to 17 Years | 0 (0.0%) | 0 (0.0%) |
| 18 to 34 Years | 0 (0.0%) | 0 (0.0%) |
| 35 to 64 Years | 22 (5.8%) | 8 (2.2%) |
| 65 to 74 Years | 14 (9.8%) | 9 (4.6%) |
| 75 Years and over | 33 (23.9%) | 4 (3.7%) |
Disability Class: Vision Difficulty
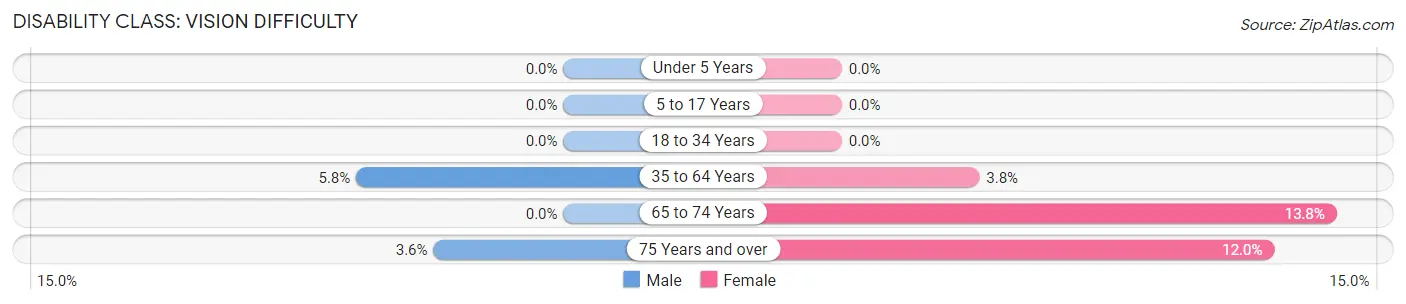
| Age Bracket | Male | Female |
| Under 5 Years | 0 (0.0%) | 0 (0.0%) |
| 5 to 17 Years | 0 (0.0%) | 0 (0.0%) |
| 18 to 34 Years | 0 (0.0%) | 0 (0.0%) |
| 35 to 64 Years | 22 (5.8%) | 14 (3.8%) |
| 65 to 74 Years | 0 (0.0%) | 27 (13.8%) |
| 75 Years and over | 5 (3.6%) | 13 (12.0%) |
Disability Class: Cognitive Difficulty
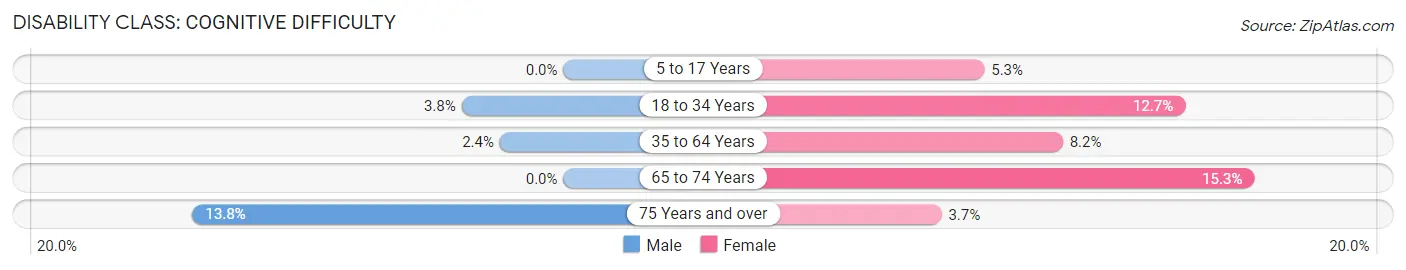
| Age Bracket | Male | Female |
| 5 to 17 Years | 0 (0.0%) | 11 (5.3%) |
| 18 to 34 Years | 7 (3.8%) | 33 (12.7%) |
| 35 to 64 Years | 9 (2.4%) | 30 (8.2%) |
| 65 to 74 Years | 0 (0.0%) | 30 (15.3%) |
| 75 Years and over | 19 (13.8%) | 4 (3.7%) |
Disability Class: Ambulatory Difficulty
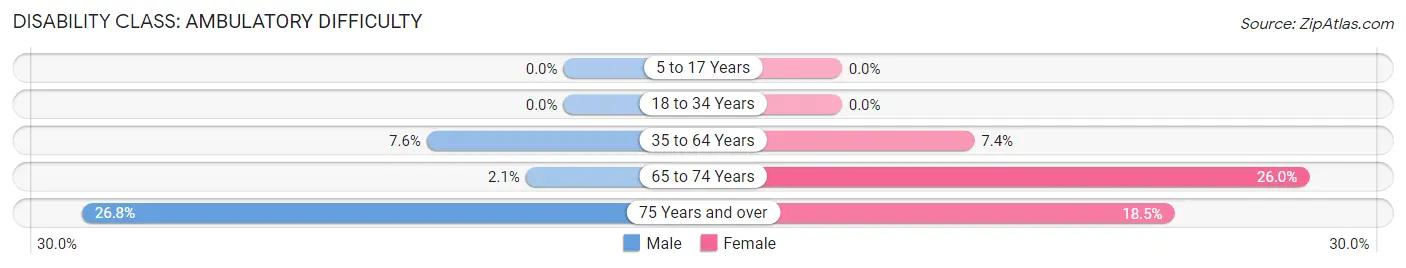
| Age Bracket | Male | Female |
| 5 to 17 Years | 0 (0.0%) | 0 (0.0%) |
| 18 to 34 Years | 0 (0.0%) | 0 (0.0%) |
| 35 to 64 Years | 29 (7.6%) | 27 (7.4%) |
| 65 to 74 Years | 3 (2.1%) | 51 (26.0%) |
| 75 Years and over | 37 (26.8%) | 20 (18.5%) |
Disability Class: Self-Care Difficulty
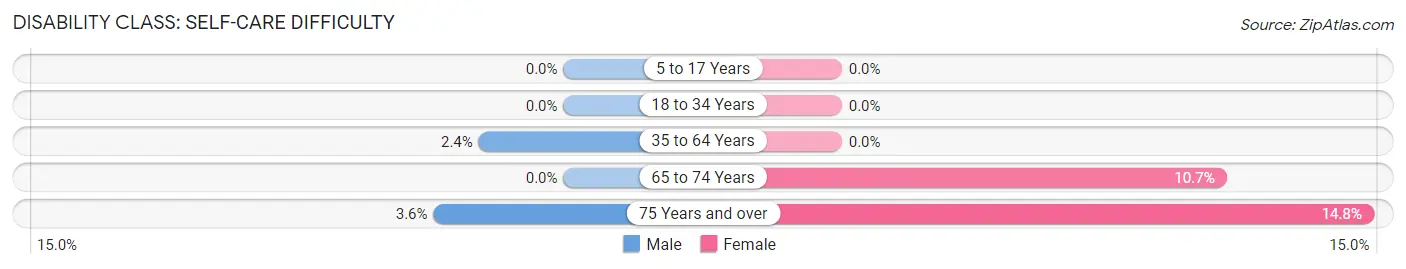
| Age Bracket | Male | Female |
| 5 to 17 Years | 0 (0.0%) | 0 (0.0%) |
| 18 to 34 Years | 0 (0.0%) | 0 (0.0%) |
| 35 to 64 Years | 9 (2.4%) | 0 (0.0%) |
| 65 to 74 Years | 0 (0.0%) | 21 (10.7%) |
| 75 Years and over | 5 (3.6%) | 16 (14.8%) |
Technology Access in Maggie Valley
Computing Device Access in Maggie Valley
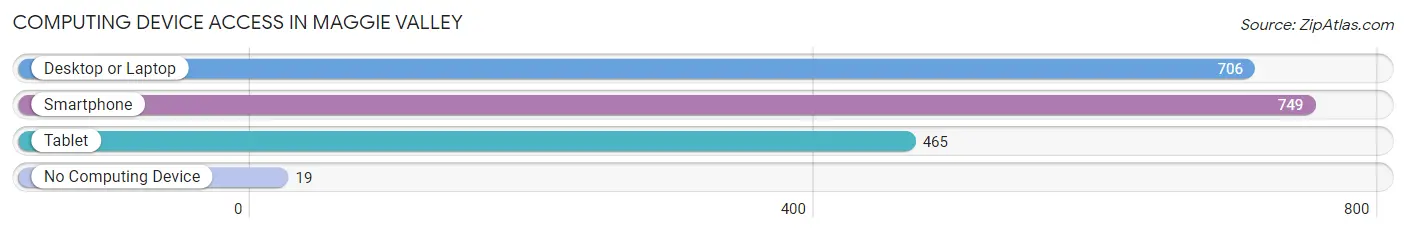
| Device Type | # Households | % Households |
| Desktop or Laptop | 706 | 84.9% |
| Smartphone | 749 | 90.0% |
| Tablet | 465 | 55.9% |
| No Computing Device | 19 | 2.3% |
| Total | 832 | 100.0% |
Internet Access in Maggie Valley
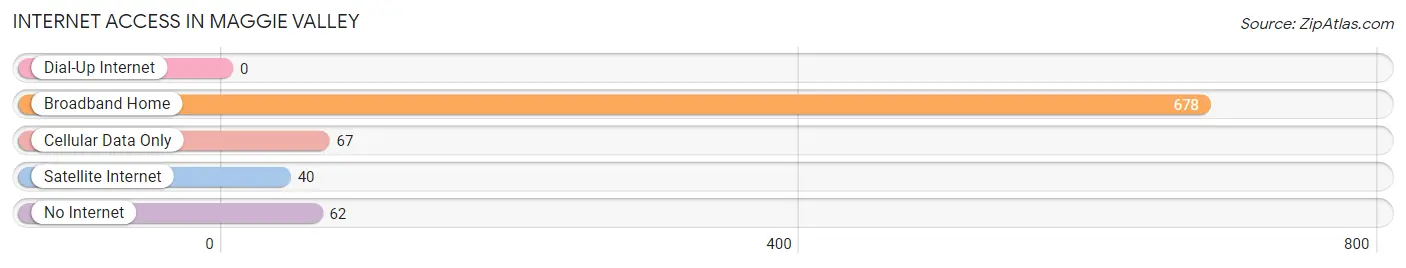
| Internet Type | # Households | % Households |
| Dial-Up Internet | 0 | 0.0% |
| Broadband Home | 678 | 81.5% |
| Cellular Data Only | 67 | 8.1% |
| Satellite Internet | 40 | 4.8% |
| No Internet | 62 | 7.4% |
| Total | 832 | 100.0% |
Maggie Valley Summary
Maggie Valley is a small town located in the western part of North Carolina, in the Blue Ridge Mountains. It is situated in Haywood County, and is part of the Asheville Metropolitan Statistical Area. The town is known for its scenic beauty, and is a popular tourist destination.
History
Maggie Valley was founded in the late 19th century by a group of settlers from the nearby town of Waynesville. The town was named after Maggie Mae Setzer, the daughter of one of the settlers. The town was originally a logging and farming community, and the first post office was established in 1891.
In the early 20th century, Maggie Valley became a popular tourist destination, due to its proximity to the Great Smoky Mountains National Park. The town was also known for its moonshine production, and was home to several stills. In the 1950s, the town began to attract more visitors, and the first ski resort was built in the area.
Geography
Maggie Valley is located in the Blue Ridge Mountains of western North Carolina. The town is situated in Haywood County, and is part of the Asheville Metropolitan Statistical Area. The town is located at an elevation of 2,400 feet, and is surrounded by the Great Smoky Mountains National Park. The town is located near the Cataloochee Ski Area, and is close to the Blue Ridge Parkway.
The town is located in a temperate climate, with mild winters and warm summers. The average annual temperature is around 60 degrees Fahrenheit, and the average annual precipitation is around 50 inches.
Economy
Maggie Valley is a popular tourist destination, and the town’s economy is largely based on tourism. The town is home to several resorts, hotels, and restaurants, and is also home to the Cataloochee Ski Area. The town is also home to several shops and galleries, and is a popular destination for outdoor activities such as hiking, fishing, and camping.
Demographics
As of the 2010 census, the population of Maggie Valley was 1,150. The racial makeup of the town was 95.3% White, 0.9% African American, 0.7% Native American, 0.7% Asian, 0.2% Pacific Islander, and 1.2% from other races. The median household income was $35,000, and the median family income was $41,000. The per capita income was $19,000.
Maggie Valley is a small town with a rich history and a vibrant economy. The town is known for its scenic beauty, and is a popular tourist destination. The town is home to several resorts, hotels, and restaurants, and is a popular destination for outdoor activities. The town has a diverse population, and is a great place to live and visit.
Common Questions
What is Per Capita Income in Maggie Valley?
Per Capita income in Maggie Valley is $33,957.
What is the Median Family Income in Maggie Valley?
Median Family Income in Maggie Valley is $72,361.
What is the Median Household income in Maggie Valley?
Median Household Income in Maggie Valley is $62,083.
What is Income or Wage Gap in Maggie Valley?
Income or Wage Gap in Maggie Valley is 2.0%.
Women in Maggie Valley earn 98.0 cents for every dollar earned by a man.
What is Inequality or Gini Index in Maggie Valley?
Inequality or Gini Index in Maggie Valley is 0.40.
What is the Total Population of Maggie Valley?
Total Population of Maggie Valley is 2,195.
What is the Total Male Population of Maggie Valley?
Total Male Population of Maggie Valley is 1,027.
What is the Total Female Population of Maggie Valley?
Total Female Population of Maggie Valley is 1,168.
What is the Ratio of Males per 100 Females in Maggie Valley?
There are 87.93 Males per 100 Females in Maggie Valley.
What is the Ratio of Females per 100 Males in Maggie Valley?
There are 113.73 Females per 100 Males in Maggie Valley.
What is the Median Population Age in Maggie Valley?
Median Population Age in Maggie Valley is 49.0 Years.
What is the Average Family Size in Maggie Valley
Average Family Size in Maggie Valley is 3.3 People.
What is the Average Household Size in Maggie Valley
Average Household Size in Maggie Valley is 2.6 People.
How Large is the Labor Force in Maggie Valley?
There are 998 People in the Labor Forcein in Maggie Valley.
What is the Percentage of People in the Labor Force in Maggie Valley?
54.7% of People are in the Labor Force in Maggie Valley.
What is the Unemployment Rate in Maggie Valley?
Unemployment Rate in Maggie Valley is 2.3%.