Montreat, NC Map & Demographics
Montreat Map
Montreat Overview
$10,937
PER CAPITA INCOME
442
TOTAL POPULATION
322
MALE POPULATION
120
FEMALE POPULATION
268.33
MALES / 100 FEMALES
37.27
FEMALES / 100 MALES
20.5
MEDIAN AGE
5.7
AVG FAMILY SIZE
5.7
AVG HOUSEHOLD SIZE
315
LABOR FORCE [ PEOPLE ]
71.3%
PERCENT IN LABOR FORCE
13.0%
UNEMPLOYMENT RATE
Montreat Zip Codes
Montreat Area Codes
Income in Montreat
Income Overview in Montreat
| Characteristic | Number | Measure |
| Per Capita Income | 442 | $10,937 |
| Median Family Income | 18 | $0 |
| Mean Family Income | 18 | $0 |
| Median Household Income | 18 | $0 |
| Mean Household Income | 18 | $0 |
| Income Deficit | 18 | $0 |
| Wage / Income Gap (%) | 442 | 0.00% |
| Wage / Income Gap ($) | 442 | 100.00¢ per $1 |
| Gini / Inequality Index | 442 | 0.00 |
Earnings by Sex in Montreat
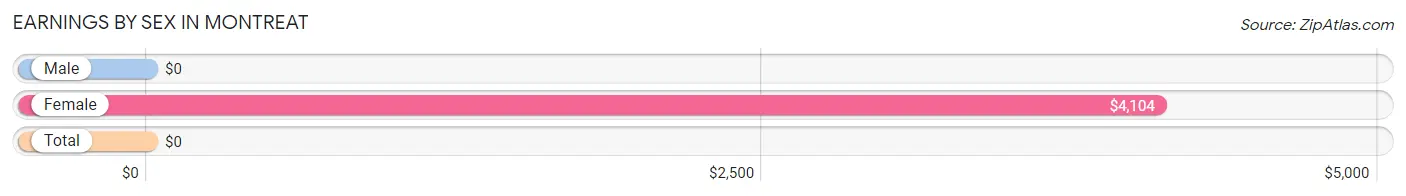
| Sex | Number | Average Earnings |
| Male | 242 (72.9%) | $0 |
| Female | 90 (27.1%) | $4,104 |
| Total | 332 (100.0%) | $0 |
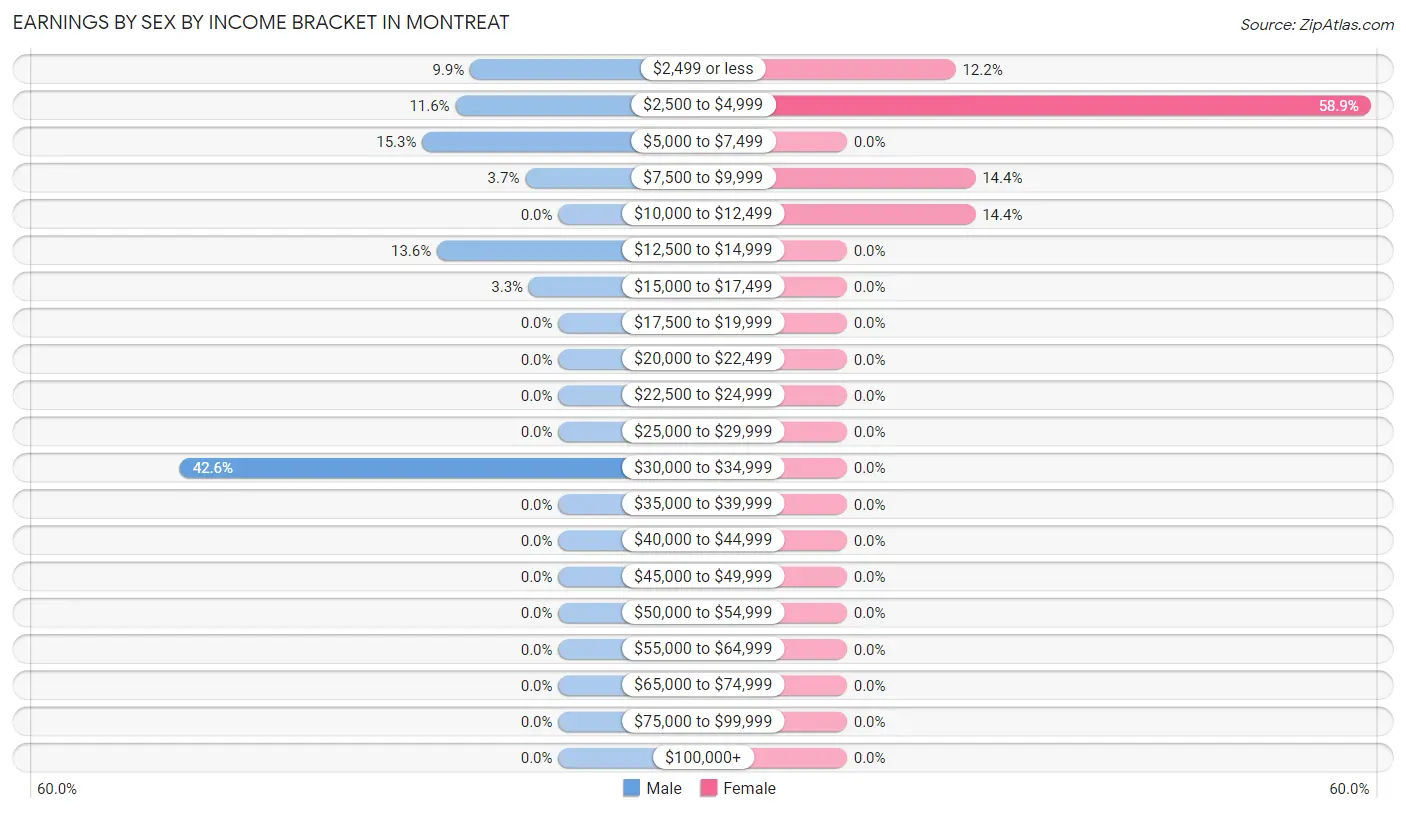
Earnings by Sex by Income Bracket in Montreat
The most common earnings brackets in Montreat are $30,000 to $34,999 for men (103 | 42.6%) and $2,500 to $4,999 for women (53 | 58.9%).
| Income | Male | Female |
| $2,499 or less | 24 (9.9%) | 11 (12.2%) |
| $2,500 to $4,999 | 28 (11.6%) | 53 (58.9%) |
| $5,000 to $7,499 | 37 (15.3%) | 0 (0.0%) |
| $7,500 to $9,999 | 9 (3.7%) | 13 (14.4%) |
| $10,000 to $12,499 | 0 (0.0%) | 13 (14.4%) |
| $12,500 to $14,999 | 33 (13.6%) | 0 (0.0%) |
| $15,000 to $17,499 | 8 (3.3%) | 0 (0.0%) |
| $17,500 to $19,999 | 0 (0.0%) | 0 (0.0%) |
| $20,000 to $22,499 | 0 (0.0%) | 0 (0.0%) |
| $22,500 to $24,999 | 0 (0.0%) | 0 (0.0%) |
| $25,000 to $29,999 | 0 (0.0%) | 0 (0.0%) |
| $30,000 to $34,999 | 103 (42.6%) | 0 (0.0%) |
| $35,000 to $39,999 | 0 (0.0%) | 0 (0.0%) |
| $40,000 to $44,999 | 0 (0.0%) | 0 (0.0%) |
| $45,000 to $49,999 | 0 (0.0%) | 0 (0.0%) |
| $50,000 to $54,999 | 0 (0.0%) | 0 (0.0%) |
| $55,000 to $64,999 | 0 (0.0%) | 0 (0.0%) |
| $65,000 to $74,999 | 0 (0.0%) | 0 (0.0%) |
| $75,000 to $99,999 | 0 (0.0%) | 0 (0.0%) |
| $100,000+ | 0 (0.0%) | 0 (0.0%) |
| Total | 242 (100.0%) | 90 (100.0%) |
Earnings by Sex by Educational Attainment in Montreat
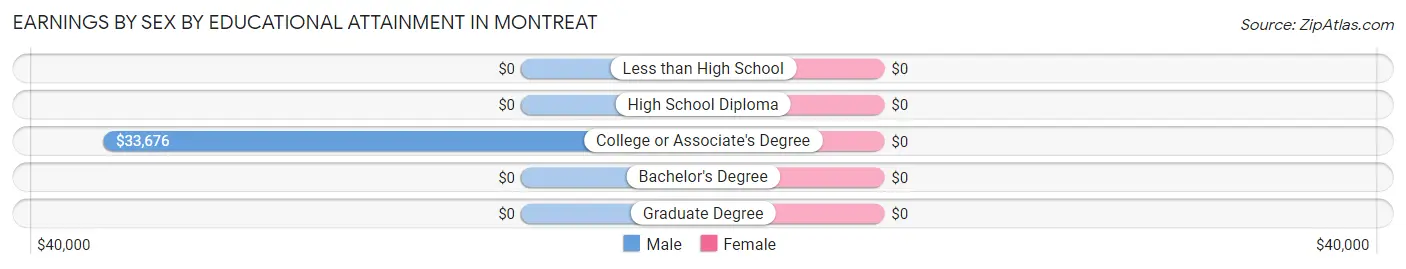
| Educational Attainment | Male Income | Female Income |
| Less than High School | - | - |
| High School Diploma | - | - |
| College or Associate's Degree | $33,676 | $0 |
| Bachelor's Degree | - | - |
| Graduate Degree | - | - |
| Total | $33,676 | $0 |
Family Income in Montreat
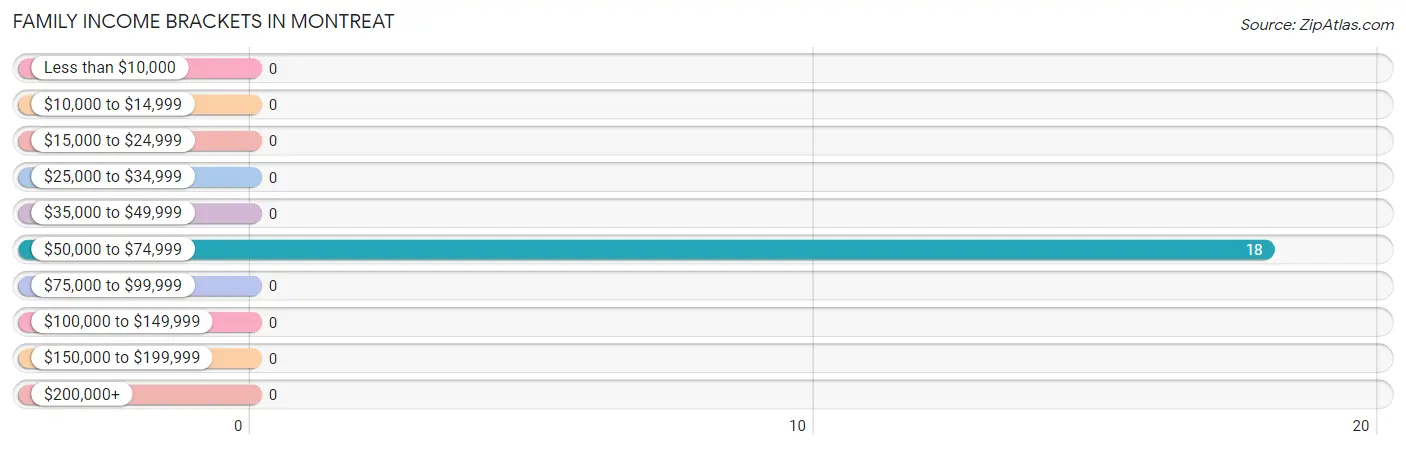
Family Income Brackets in Montreat
According to the Montreat family income data, there are 18 families falling into the $50,000 to $74,999 income range, which is the most common income bracket and makes up 100.0% of all families.
| Income Bracket | # Families | % Families |
| Less than $10,000 | 0 | 0.0% |
| $10,000 to $14,999 | 0 | 0.0% |
| $15,000 to $24,999 | 0 | 0.0% |
| $25,000 to $34,999 | 0 | 0.0% |
| $35,000 to $49,999 | 0 | 0.0% |
| $50,000 to $74,999 | 18 | 100.0% |
| $75,000 to $99,999 | 0 | 0.0% |
| $100,000 to $149,999 | 0 | 0.0% |
| $150,000 to $199,999 | 0 | 0.0% |
| $200,000+ | 0 | 0.0% |
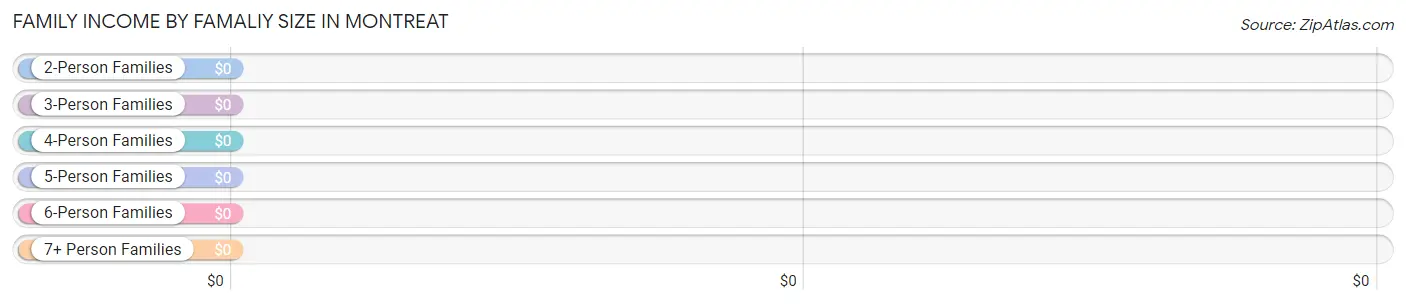
Family Income by Famaliy Size in Montreat
| Income Bracket | # Families | Median Income |
| 2-Person Families | 18 (100.0%) | $0 |
| 3-Person Families | 0 (0.0%) | $0 |
| 4-Person Families | 0 (0.0%) | $0 |
| 5-Person Families | 0 (0.0%) | $0 |
| 6-Person Families | 0 (0.0%) | $0 |
| 7+ Person Families | 0 (0.0%) | $0 |
| Total | 18 (100.0%) | $0 |
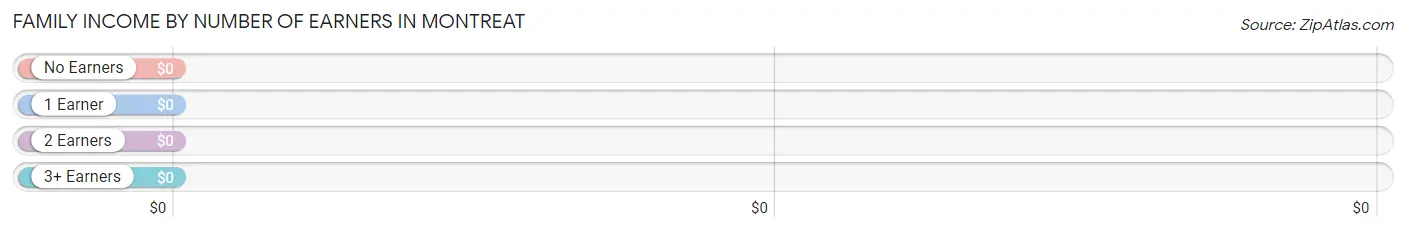
Family Income by Number of Earners in Montreat
| Number of Earners | # Families | Median Income |
| No Earners | 0 (0.0%) | $0 |
| 1 Earner | 0 (0.0%) | $0 |
| 2 Earners | 18 (100.0%) | $0 |
| 3+ Earners | 0 (0.0%) | $0 |
| Total | 18 (100.0%) | $0 |
Household Income in Montreat
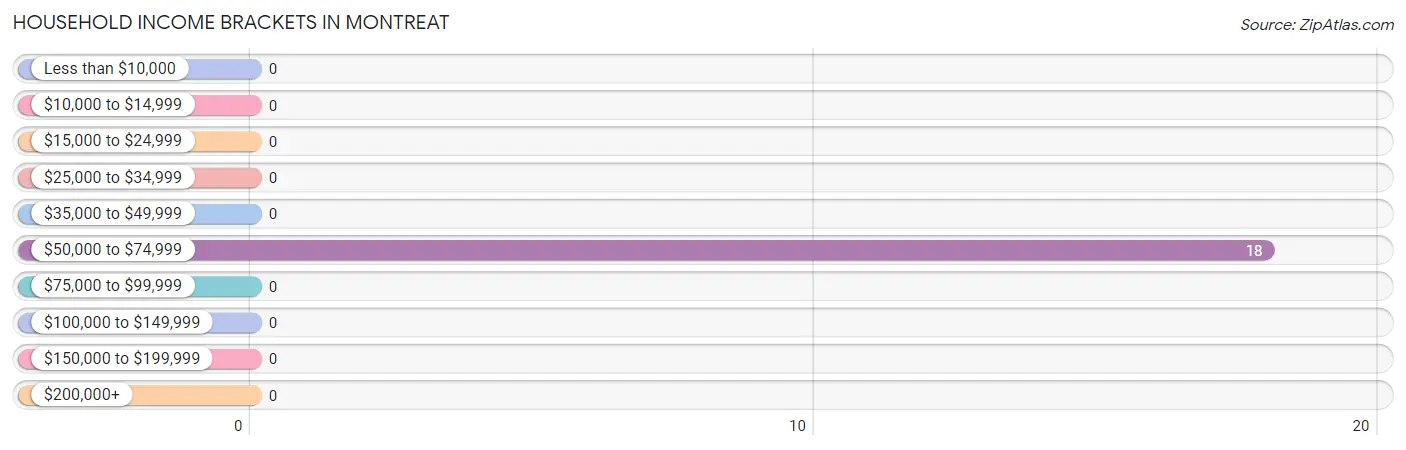
Household Income Brackets in Montreat
With 18 households falling in the category, the $50,000 to $74,999 income range is the most frequent in Montreat, accounting for 100.0% of all households.
| Income Bracket | # Households | % Households |
| Less than $10,000 | 0 | 0.0% |
| $10,000 to $14,999 | 0 | 0.0% |
| $15,000 to $24,999 | 0 | 0.0% |
| $25,000 to $34,999 | 0 | 0.0% |
| $35,000 to $49,999 | 0 | 0.0% |
| $50,000 to $74,999 | 18 | 100.0% |
| $75,000 to $99,999 | 0 | 0.0% |
| $100,000 to $149,999 | 0 | 0.0% |
| $150,000 to $199,999 | 0 | 0.0% |
| $200,000+ | 0 | 0.0% |
Household Income by Householder Age in Montreat
| Income Bracket | # Households | Median Income |
| 15 to 24 Years | 18 (100.0%) | $0 |
| 25 to 44 Years | 0 (0.0%) | $0 |
| 45 to 64 Years | 0 (0.0%) | $0 |
| 65+ Years | 0 (0.0%) | $0 |
| Total | 18 (100.0%) | $0 |
Poverty in Montreat
Income Below Poverty by Sex and Age in Montreat
| Age Bracket | Male | Female |
| Under 5 Years | 0 (0.0%) | 0 (0.0%) |
| 5 Years | 0 (0.0%) | 0 (0.0%) |
| 6 to 11 Years | 0 (0.0%) | 0 (0.0%) |
| 12 to 14 Years | 0 (0.0%) | 0 (0.0%) |
| 15 Years | 0 (0.0%) | 0 (0.0%) |
| 16 and 17 Years | 0 (0.0%) | 0 (0.0%) |
| 18 to 24 Years | 0 (0.0%) | 0 (0.0%) |
| 25 to 34 Years | 0 (0.0%) | 0 (0.0%) |
| 35 to 44 Years | 0 (0.0%) | 0 (0.0%) |
| 45 to 54 Years | 0 (0.0%) | 0 (0.0%) |
| 55 to 64 Years | 0 (0.0%) | 0 (0.0%) |
| 65 to 74 Years | 0 (0.0%) | 0 (0.0%) |
| 75 Years and over | 0 (0.0%) | 0 (0.0%) |
| Total | 0 (0.0%) | 0 (0.0%) |
Income Above Poverty by Sex and Age in Montreat
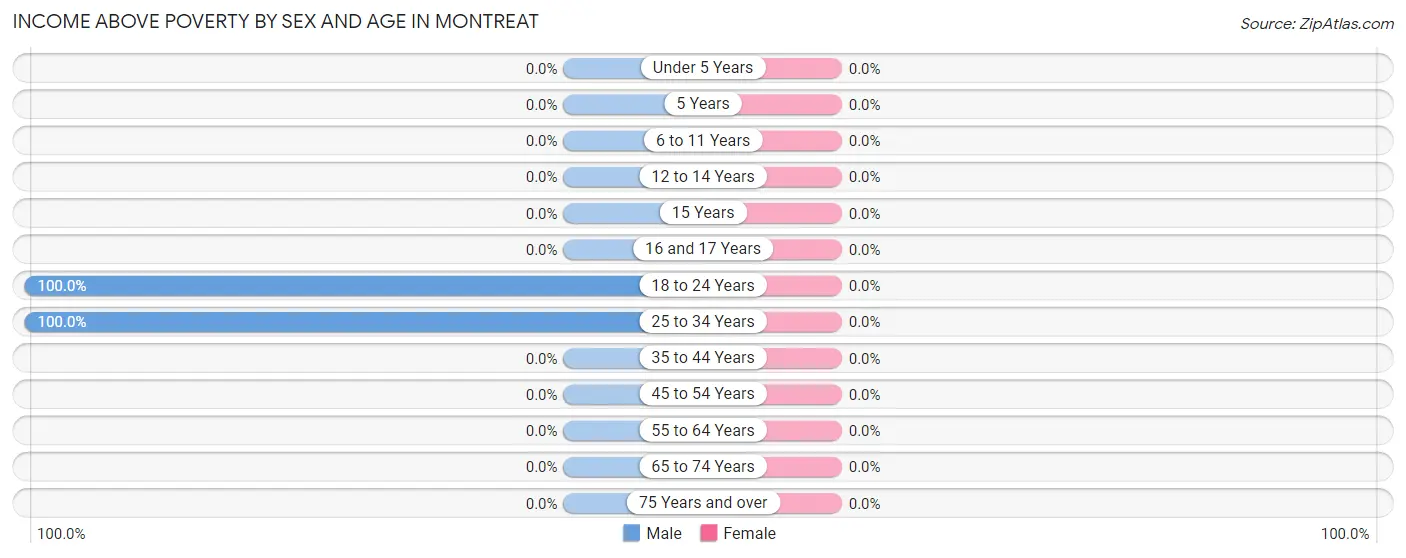
| Age Bracket | Male | Female |
| Under 5 Years | 0 (0.0%) | 0 (0.0%) |
| 5 Years | 0 (0.0%) | 0 (0.0%) |
| 6 to 11 Years | 0 (0.0%) | 0 (0.0%) |
| 12 to 14 Years | 0 (0.0%) | 0 (0.0%) |
| 15 Years | 0 (0.0%) | 0 (0.0%) |
| 16 and 17 Years | 0 (0.0%) | 0 (0.0%) |
| 18 to 24 Years | 18 (100.0%) | 0 (0.0%) |
| 25 to 34 Years | 85 (100.0%) | 0 (0.0%) |
| 35 to 44 Years | 0 (0.0%) | 0 (0.0%) |
| 45 to 54 Years | 0 (0.0%) | 0 (0.0%) |
| 55 to 64 Years | 0 (0.0%) | 0 (0.0%) |
| 65 to 74 Years | 0 (0.0%) | 0 (0.0%) |
| 75 Years and over | 0 (0.0%) | 0 (0.0%) |
| Total | 103 (100.0%) | 0 (0.0%) |
Income Below Poverty Among Married-Couple Families in Montreat
| Children | Above Poverty | Below Poverty |
| No Children | 0 (0.0%) | 0 (0.0%) |
| 1 or 2 Children | 0 (0.0%) | 0 (0.0%) |
| 3 or 4 Children | 0 (0.0%) | 0 (0.0%) |
| 5 or more Children | 0 (0.0%) | 0 (0.0%) |
| Total | 0 (0.0%) | 0 (0.0%) |
Income Below Poverty Among Single-Parent Households in Montreat
| Children | Single Father | Single Mother |
| No Children | 0 (0.0%) | 0 (0.0%) |
| 1 or 2 Children | 0 (0.0%) | 0 (0.0%) |
| 3 or 4 Children | 0 (0.0%) | 0 (0.0%) |
| 5 or more Children | 0 (0.0%) | 0 (0.0%) |
| Total | 0 (0.0%) | 0 (0.0%) |
Income Below Poverty Among Married-Couple vs Single-Parent Households in Montreat
| Children | Married-Couple Families | Single-Parent Households |
| No Children | 0 (0.0%) | 0 (0.0%) |
| 1 or 2 Children | 0 (0.0%) | 0 (0.0%) |
| 3 or 4 Children | 0 (0.0%) | 0 (0.0%) |
| 5 or more Children | 0 (0.0%) | 0 (0.0%) |
| Total | 0 (0.0%) | 0 (0.0%) |
Race in Montreat
The most populous races in Montreat are White / Caucasian (321 | 72.6%), Black / African American (81 | 18.3%), and Hispanic or Latino (66 | 14.9%).
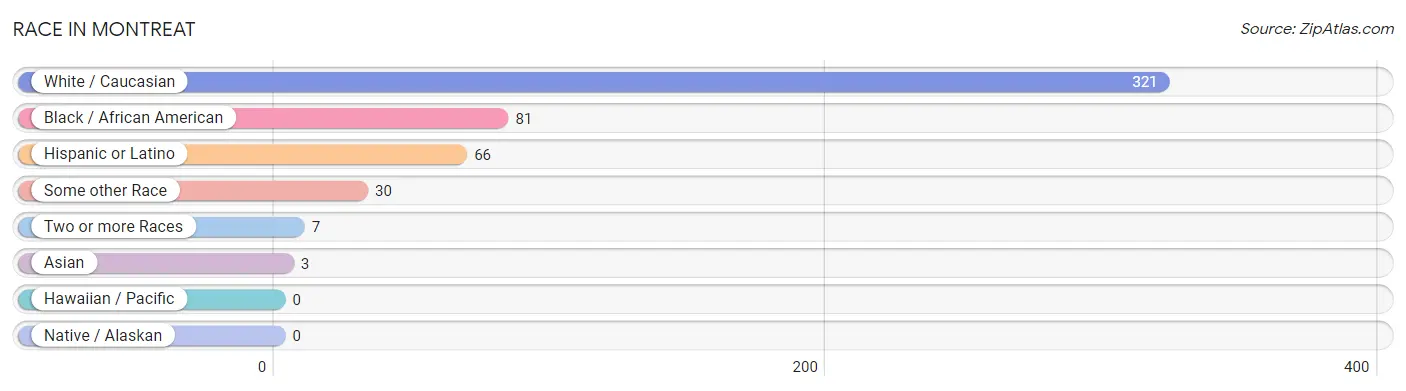
| Race | # Population | % Population |
| Asian | 3 | 0.7% |
| Black / African American | 81 | 18.3% |
| Hawaiian / Pacific | 0 | 0.0% |
| Hispanic or Latino | 66 | 14.9% |
| Native / Alaskan | 0 | 0.0% |
| White / Caucasian | 321 | 72.6% |
| Two or more Races | 7 | 1.6% |
| Some other Race | 30 | 6.8% |
| Total | 442 | 100.0% |
Ancestry in Montreat
The most populous ancestries reported in Montreat are American (113 | 25.6%), Jamaican (28 | 6.3%), Mexican (23 | 5.2%), Italian (16 | 3.6%), and English (15 | 3.4%), together accounting for 44.1% of all Montreat residents.
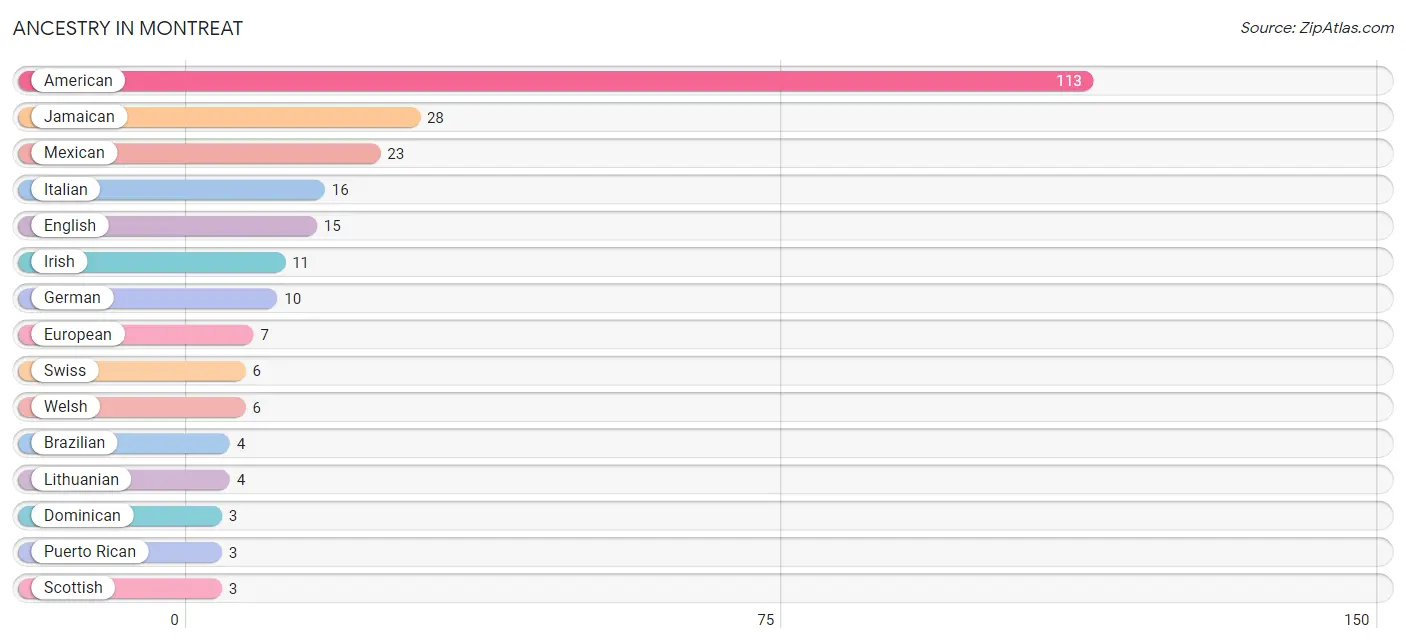
| Ancestry | # Population | % Population |
| American | 113 | 25.6% |
| Arab | 2 | 0.4% |
| Brazilian | 4 | 0.9% |
| Dominican | 3 | 0.7% |
| English | 15 | 3.4% |
| European | 7 | 1.6% |
| German | 10 | 2.3% |
| Irish | 11 | 2.5% |
| Israeli | 2 | 0.4% |
| Italian | 16 | 3.6% |
| Jamaican | 28 | 6.3% |
| Lithuanian | 4 | 0.9% |
| Mexican | 23 | 5.2% |
| Puerto Rican | 3 | 0.7% |
| Scottish | 3 | 0.7% |
| Spaniard | 3 | 0.7% |
| Swiss | 6 | 1.4% |
| Syrian | 2 | 0.4% |
| Thai | 3 | 0.7% |
| Welsh | 6 | 1.4% | View All 20 Rows |
Immigrants in Montreat
The most numerous immigrant groups reported in Montreat came from Latin America (11 | 2.5%), South America (8 | 1.8%), Argentina (4 | 0.9%), Brazil (4 | 0.9%), and Caribbean (3 | 0.7%), together accounting for 6.8% of all Montreat residents.
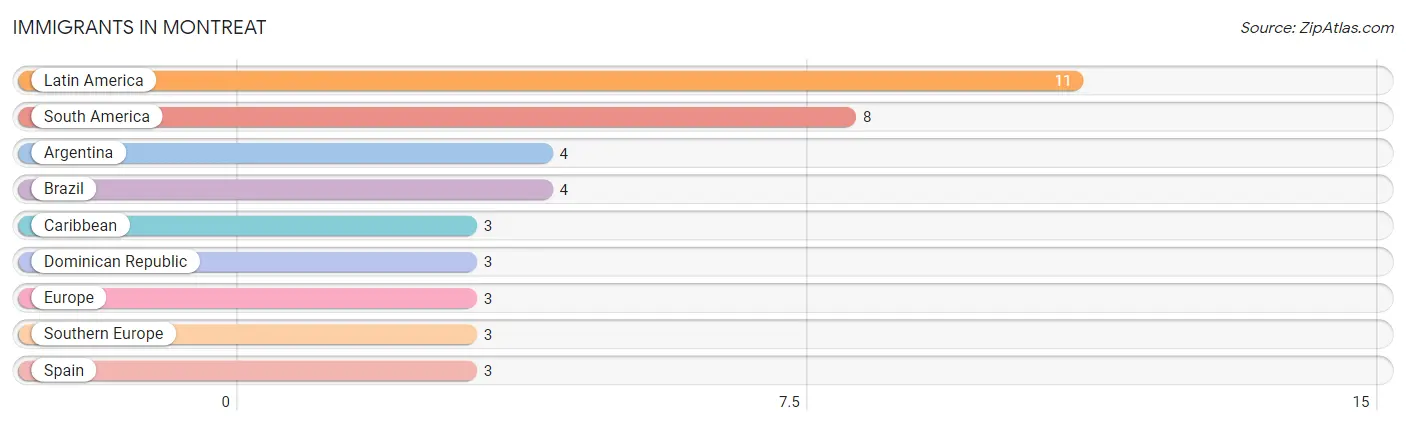
| Immigration Origin | # Population | % Population |
| Argentina | 4 | 0.9% |
| Brazil | 4 | 0.9% |
| Caribbean | 3 | 0.7% |
| Dominican Republic | 3 | 0.7% |
| Europe | 3 | 0.7% |
| Latin America | 11 | 2.5% |
| South America | 8 | 1.8% |
| Southern Europe | 3 | 0.7% |
| Spain | 3 | 0.7% | View All 9 Rows |
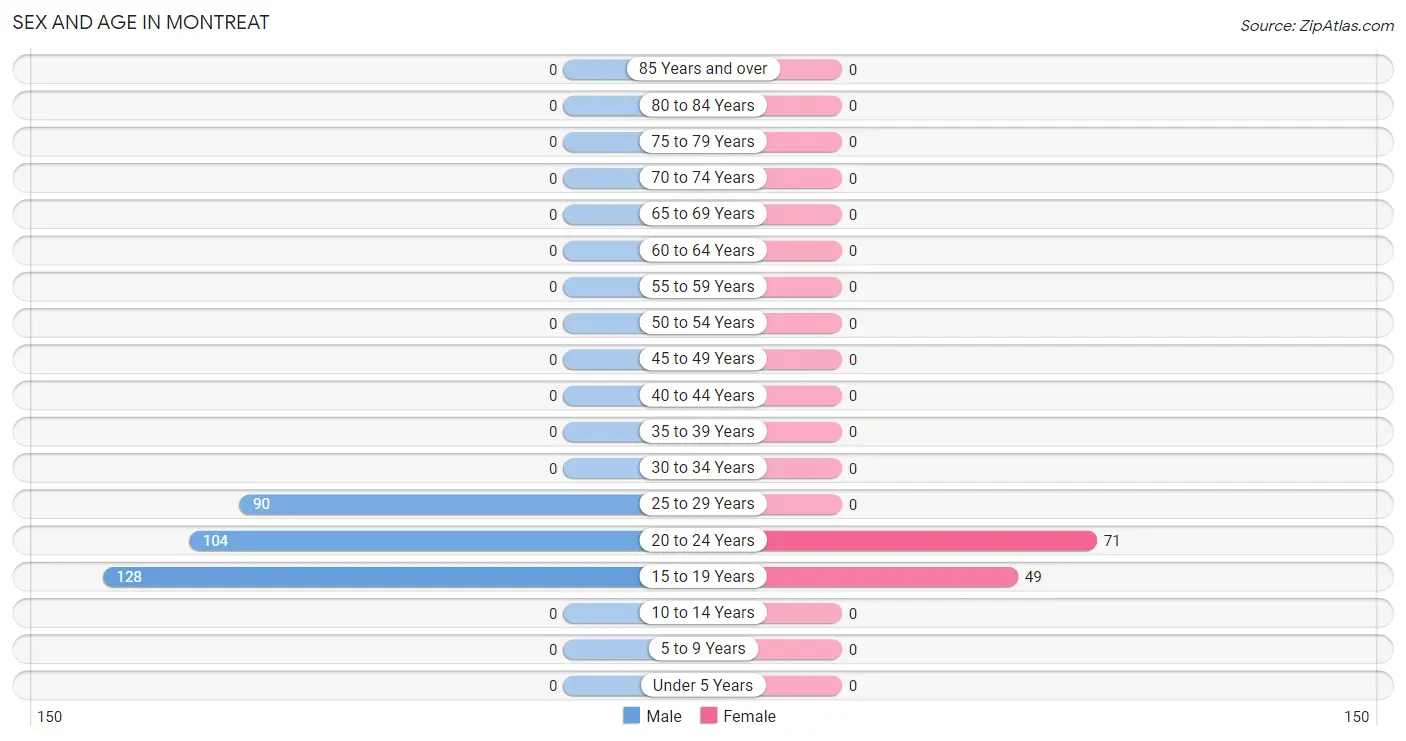
Sex and Age in Montreat
Sex and Age in Montreat
The most populous age groups in Montreat are 15 to 19 Years (128 | 39.8%) for men and 20 to 24 Years (71 | 59.2%) for women.
| Age Bracket | Male | Female |
| Under 5 Years | 0 (0.0%) | 0 (0.0%) |
| 5 to 9 Years | 0 (0.0%) | 0 (0.0%) |
| 10 to 14 Years | 0 (0.0%) | 0 (0.0%) |
| 15 to 19 Years | 128 (39.8%) | 49 (40.8%) |
| 20 to 24 Years | 104 (32.3%) | 71 (59.2%) |
| 25 to 29 Years | 90 (28.0%) | 0 (0.0%) |
| 30 to 34 Years | 0 (0.0%) | 0 (0.0%) |
| 35 to 39 Years | 0 (0.0%) | 0 (0.0%) |
| 40 to 44 Years | 0 (0.0%) | 0 (0.0%) |
| 45 to 49 Years | 0 (0.0%) | 0 (0.0%) |
| 50 to 54 Years | 0 (0.0%) | 0 (0.0%) |
| 55 to 59 Years | 0 (0.0%) | 0 (0.0%) |
| 60 to 64 Years | 0 (0.0%) | 0 (0.0%) |
| 65 to 69 Years | 0 (0.0%) | 0 (0.0%) |
| 70 to 74 Years | 0 (0.0%) | 0 (0.0%) |
| 75 to 79 Years | 0 (0.0%) | 0 (0.0%) |
| 80 to 84 Years | 0 (0.0%) | 0 (0.0%) |
| 85 Years and over | 0 (0.0%) | 0 (0.0%) |
| Total | 322 (100.0%) | 120 (100.0%) |
Families and Households in Montreat
Median Family Size in Montreat
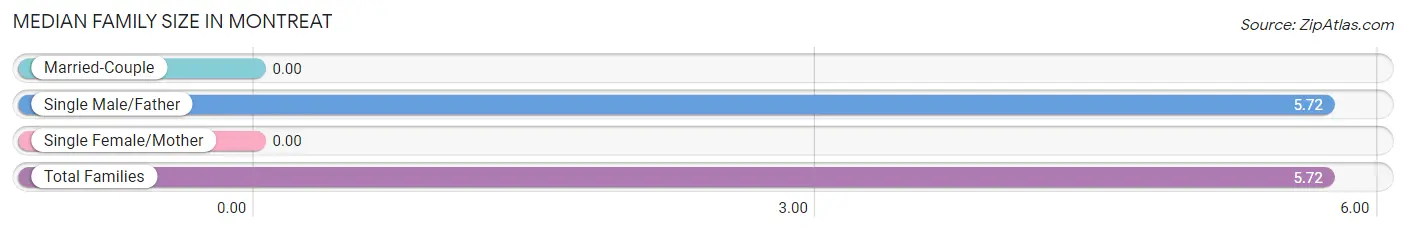
| Family Type | # Families | Family Size |
| Married-Couple | 0 (0.0%) | - |
| Single Male/Father | 18 (100.0%) | 5.72 |
| Single Female/Mother | 0 (0.0%) | - |
| Total Families | 18 (100.0%) | 5.72 |
Median Household Size in Montreat
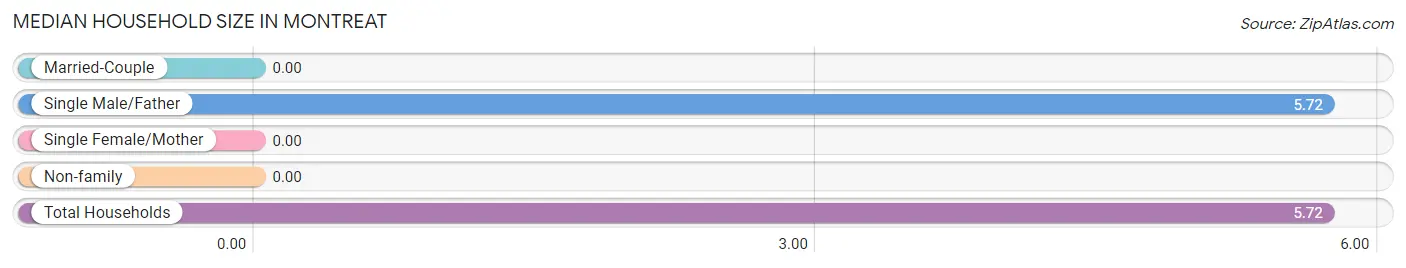
| Household Type | # Households | Household Size |
| Married-Couple | 0 (0.0%) | - |
| Single Male/Father | 18 (100.0%) | 5.72 |
| Single Female/Mother | 0 (0.0%) | - |
| Non-family | 0 (0.0%) | - |
| Total Households | 18 (100.0%) | 5.72 |
Household Size by Marriage Status in Montreat
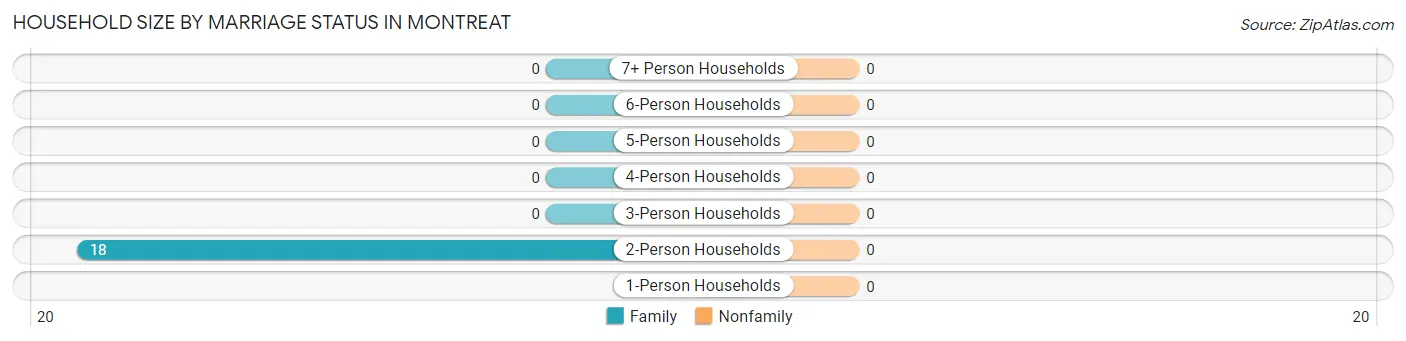
| Household Size | Family Households | Nonfamily Households |
| 1-Person Households | - | 0 (0.0%) |
| 2-Person Households | 18 (100.0%) | 0 (0.0%) |
| 3-Person Households | 0 (0.0%) | 0 (0.0%) |
| 4-Person Households | 0 (0.0%) | 0 (0.0%) |
| 5-Person Households | 0 (0.0%) | 0 (0.0%) |
| 6-Person Households | 0 (0.0%) | 0 (0.0%) |
| 7+ Person Households | 0 (0.0%) | 0 (0.0%) |
| Total | 18 (100.0%) | 0 (0.0%) |
Female Fertility in Montreat
Fertility by Age in Montreat
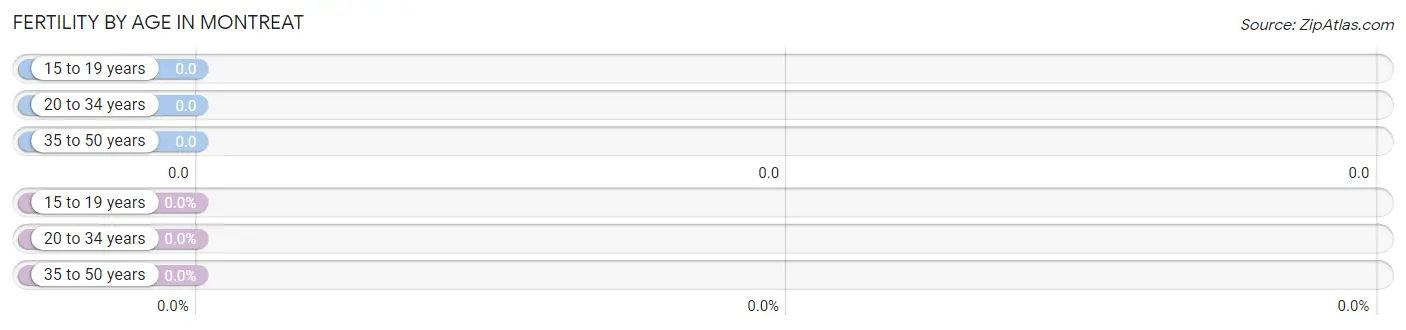
| Age Bracket | Women with Births | Births / 1,000 Women |
| 15 to 19 years | 0 (0.0%) | 0.0 |
| 20 to 34 years | 0 (0.0%) | 0.0 |
| 35 to 50 years | 0 (0.0%) | 0.0 |
| Total | 0 (0.0%) | 0.0 |
Fertility by Age by Marriage Status in Montreat
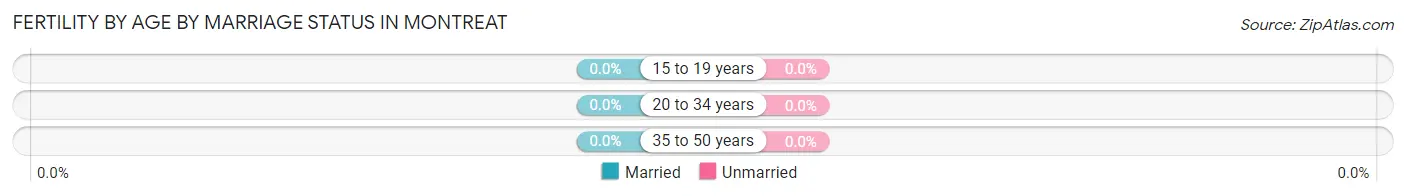
| Age Bracket | Married | Unmarried |
| 15 to 19 years | 0 (0.0%) | 0 (0.0%) |
| 20 to 34 years | 0 (0.0%) | 0 (0.0%) |
| 35 to 50 years | 0 (0.0%) | 0 (0.0%) |
| Total | 0 (0.0%) | 0 (0.0%) |
Fertility by Education in Montreat
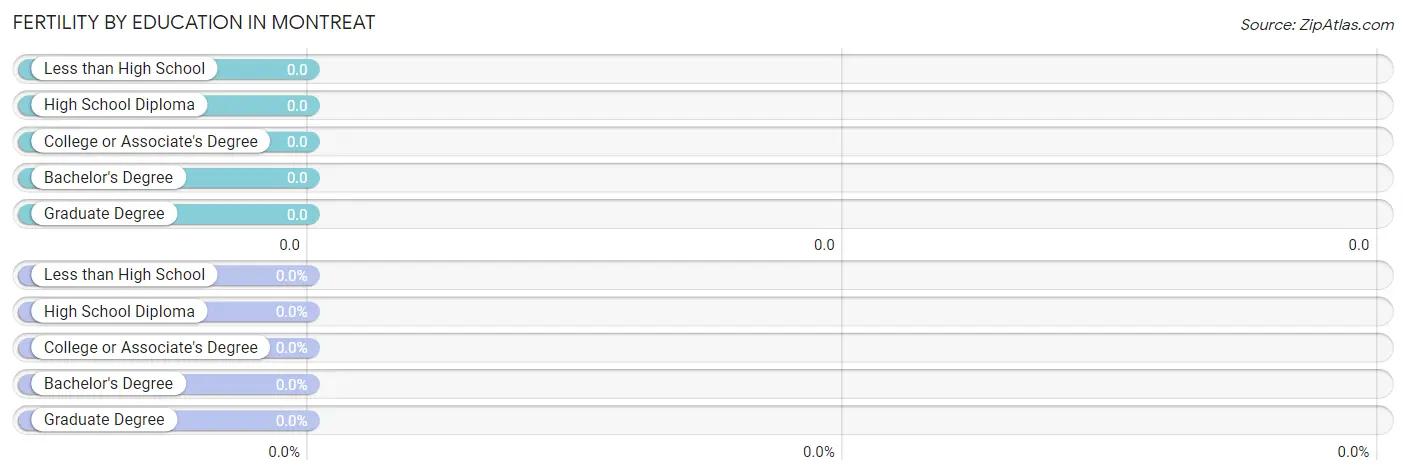
| Educational Attainment | Women with Births | Births / 1,000 Women |
| Less than High School | 0 (0.0%) | 0.0 |
| High School Diploma | 0 (0.0%) | 0.0 |
| College or Associate's Degree | 0 (0.0%) | 0.0 |
| Bachelor's Degree | 0 (0.0%) | 0.0 |
| Graduate Degree | 0 (0.0%) | 0.0 |
| Total | 0 (0.0%) | 0.0 |
Fertility by Education by Marriage Status in Montreat
| Educational Attainment | Married | Unmarried |
| Less than High School | 0 (0.0%) | 0 (0.0%) |
| High School Diploma | 0 (0.0%) | 0 (0.0%) |
| College or Associate's Degree | 0 (0.0%) | 0 (0.0%) |
| Bachelor's Degree | 0 (0.0%) | 0 (0.0%) |
| Graduate Degree | 0 (0.0%) | 0 (0.0%) |
| Total | 0 (0.0%) | 0 (0.0%) |
Employment Characteristics in Montreat
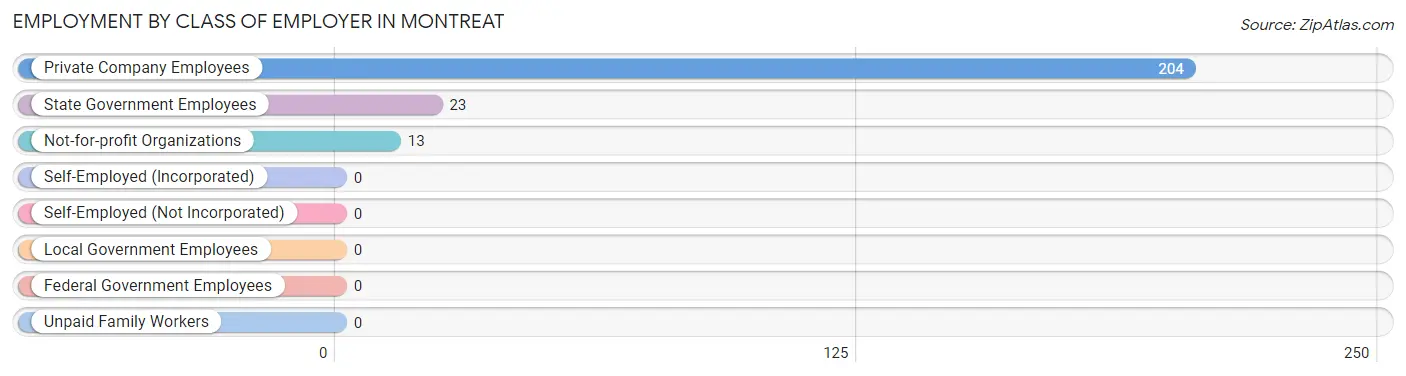
Employment by Class of Employer in Montreat
Among the 240 employed individuals in Montreat, private company employees (204 | 85.0%), state government employees (23 | 9.6%), and not-for-profit organizations (13 | 5.4%) make up the most common classes of employment.
| Employer Class | # Employees | % Employees |
| Private Company Employees | 204 | 85.0% |
| Self-Employed (Incorporated) | 0 | 0.0% |
| Self-Employed (Not Incorporated) | 0 | 0.0% |
| Not-for-profit Organizations | 13 | 5.4% |
| Local Government Employees | 0 | 0.0% |
| State Government Employees | 23 | 9.6% |
| Federal Government Employees | 0 | 0.0% |
| Unpaid Family Workers | 0 | 0.0% |
| Total | 240 | 100.0% |
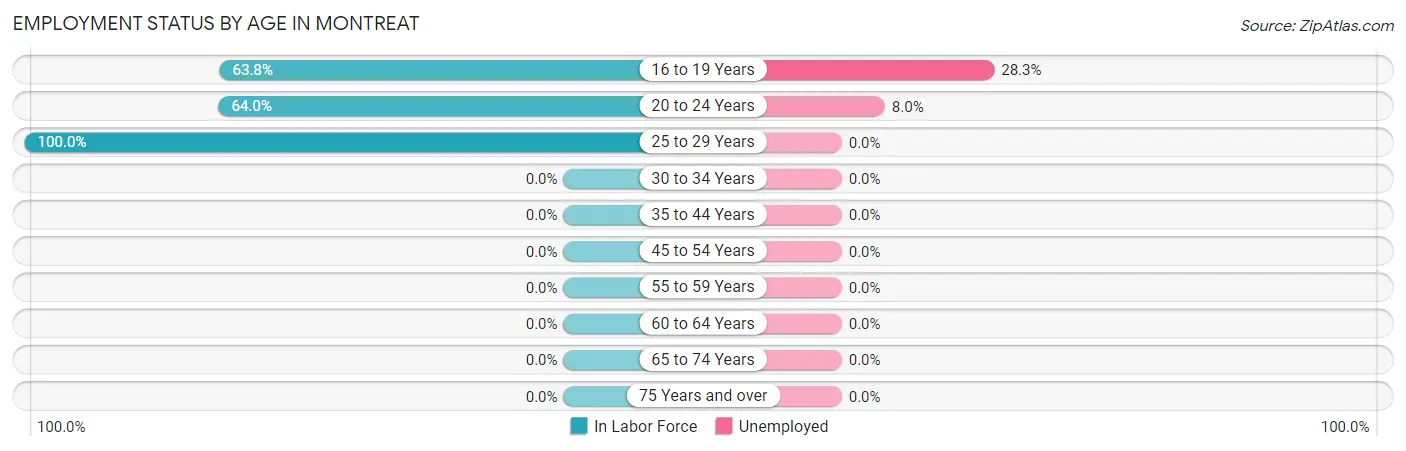
Employment Status by Age in Montreat
According to the labor force statistics for Montreat, out of the total population over 16 years of age (442), 71.3% or 315 individuals are in the labor force, with 13.0% or 41 of them unemployed. The age group with the highest labor force participation rate is 25 to 29 years, with 100.0% or 90 individuals in the labor force. Within the labor force, the 16 to 19 years age range has the highest percentage of unemployed individuals, with 28.3% or 32 of them being unemployed.
| Age Bracket | In Labor Force | Unemployed |
| 16 to 19 Years | 113 (63.8%) | 32 (28.3%) |
| 20 to 24 Years | 112 (64.0%) | 9 (8.0%) |
| 25 to 29 Years | 90 (100.0%) | 0 (0.0%) |
| 30 to 34 Years | 0 (0.0%) | 0 (0.0%) |
| 35 to 44 Years | 0 (0.0%) | 0 (0.0%) |
| 45 to 54 Years | 0 (0.0%) | 0 (0.0%) |
| 55 to 59 Years | 0 (0.0%) | 0 (0.0%) |
| 60 to 64 Years | 0 (0.0%) | 0 (0.0%) |
| 65 to 74 Years | 0 (0.0%) | 0 (0.0%) |
| 75 Years and over | 0 (0.0%) | 0 (0.0%) |
| Total | 315 (71.3%) | 41 (13.0%) |
Employment Status by Educational Attainment in Montreat
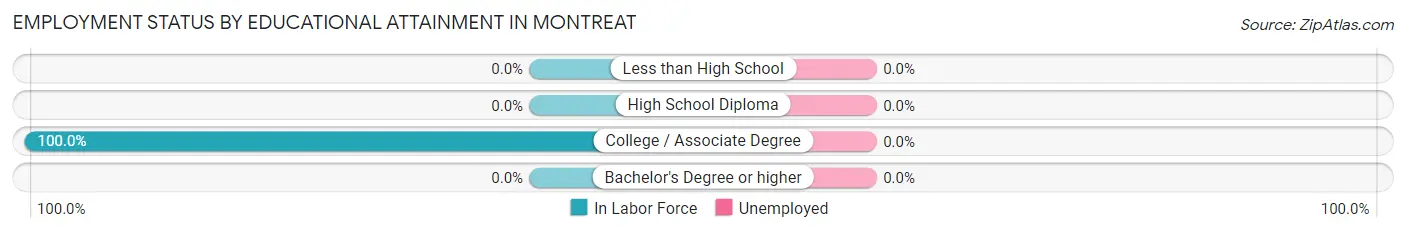
| Educational Attainment | In Labor Force | Unemployed |
| Less than High School | 0 (0.0%) | 0 (0.0%) |
| High School Diploma | 0 (0.0%) | 0 (0.0%) |
| College / Associate Degree | 90 (100.0%) | 0 (0.0%) |
| Bachelor's Degree or higher | 0 (0.0%) | 0 (0.0%) |
| Total | 90 (100.0%) | 0 (0.0%) |
Employment Occupations by Sex in Montreat
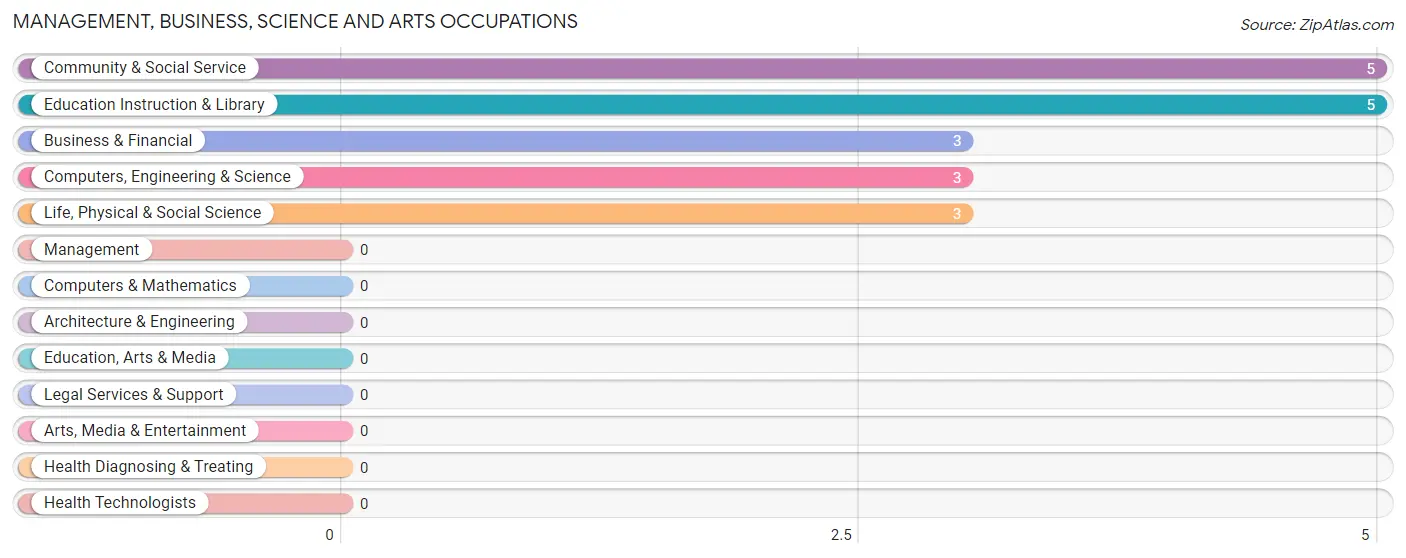
Management, Business, Science and Arts Occupations
The most common Management, Business, Science and Arts occupations in Montreat are Community & Social Service (5 | 1.8%), Education Instruction & Library (5 | 1.8%), Business & Financial (3 | 1.1%), Computers, Engineering & Science (3 | 1.1%), and Life, Physical & Social Science (3 | 1.1%).
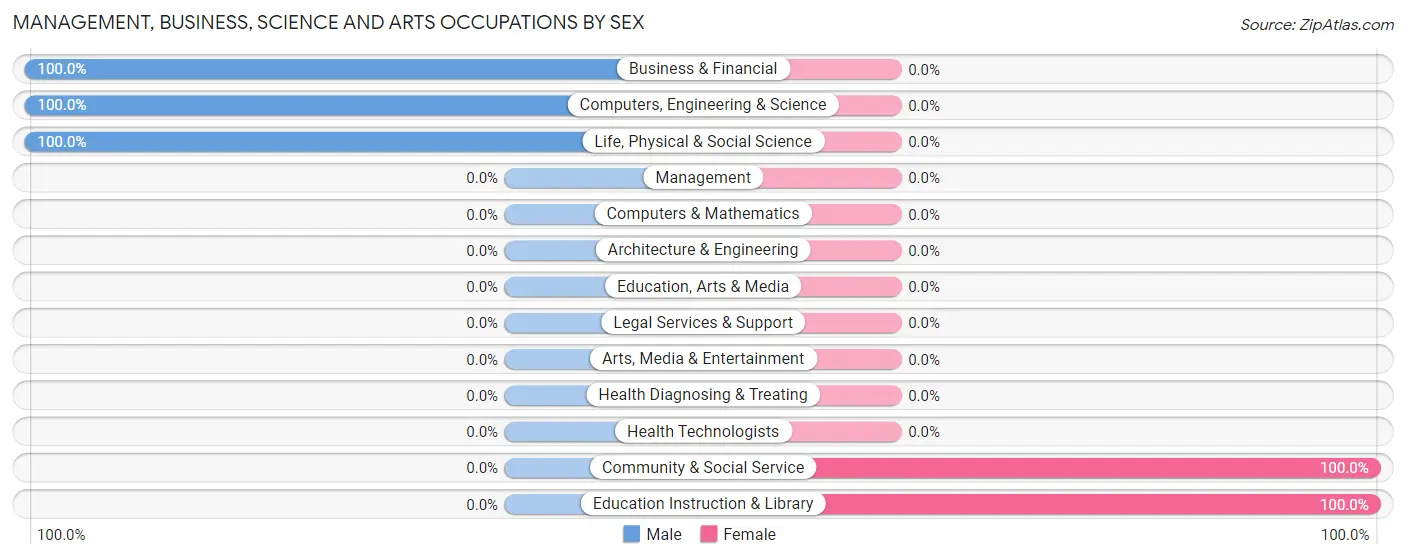
Management, Business, Science and Arts Occupations by Sex
Within the Management, Business, Science and Arts occupations in Montreat, the most male-oriented occupations are Business & Financial (100.0%), Computers, Engineering & Science (100.0%), and Life, Physical & Social Science (100.0%), while the most female-oriented occupations are Community & Social Service (100.0%), and Education Instruction & Library (100.0%).
| Occupation | Male | Female |
| Management | 0 (0.0%) | 0 (0.0%) |
| Business & Financial | 3 (100.0%) | 0 (0.0%) |
| Computers, Engineering & Science | 3 (100.0%) | 0 (0.0%) |
| Computers & Mathematics | 0 (0.0%) | 0 (0.0%) |
| Architecture & Engineering | 0 (0.0%) | 0 (0.0%) |
| Life, Physical & Social Science | 3 (100.0%) | 0 (0.0%) |
| Community & Social Service | 0 (0.0%) | 5 (100.0%) |
| Education, Arts & Media | 0 (0.0%) | 0 (0.0%) |
| Legal Services & Support | 0 (0.0%) | 0 (0.0%) |
| Education Instruction & Library | 0 (0.0%) | 5 (100.0%) |
| Arts, Media & Entertainment | 0 (0.0%) | 0 (0.0%) |
| Health Diagnosing & Treating | 0 (0.0%) | 0 (0.0%) |
| Health Technologists | 0 (0.0%) | 0 (0.0%) |
| Total (Category) | 6 (54.5%) | 5 (45.5%) |
| Total (Overall) | 190 (69.3%) | 84 (30.7%) |
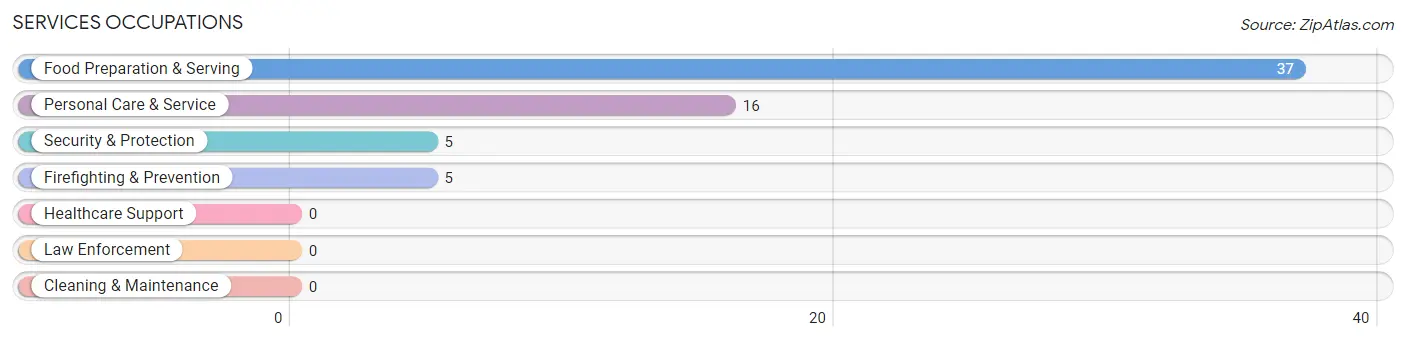
Services Occupations
The most common Services occupations in Montreat are Food Preparation & Serving (37 | 13.5%), Personal Care & Service (16 | 5.8%), Security & Protection (5 | 1.8%), and Firefighting & Prevention (5 | 1.8%).
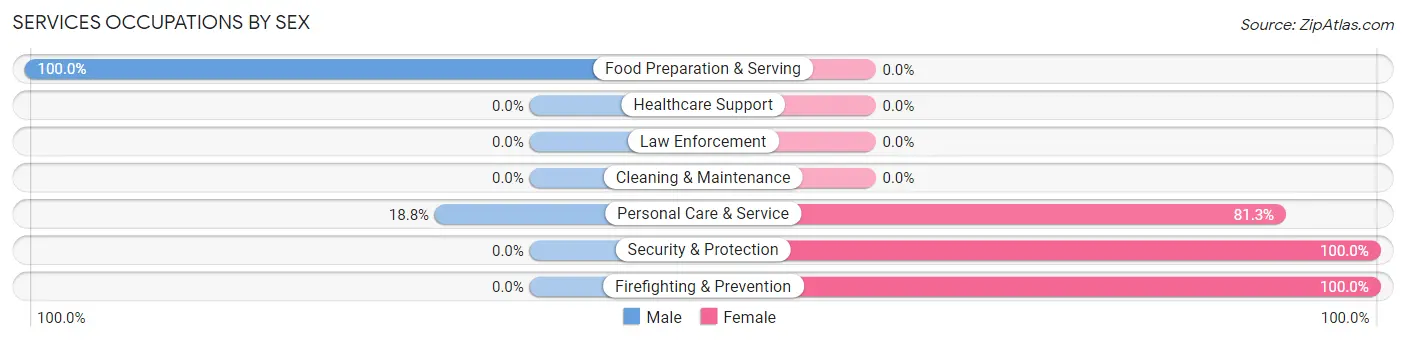
Services Occupations by Sex
Within the Services occupations in Montreat, the most male-oriented occupations are Food Preparation & Serving (100.0%), and Personal Care & Service (18.8%), while the most female-oriented occupations are Security & Protection (100.0%), Firefighting & Prevention (100.0%), and Personal Care & Service (81.2%).
| Occupation | Male | Female |
| Healthcare Support | 0 (0.0%) | 0 (0.0%) |
| Security & Protection | 0 (0.0%) | 5 (100.0%) |
| Firefighting & Prevention | 0 (0.0%) | 5 (100.0%) |
| Law Enforcement | 0 (0.0%) | 0 (0.0%) |
| Food Preparation & Serving | 37 (100.0%) | 0 (0.0%) |
| Cleaning & Maintenance | 0 (0.0%) | 0 (0.0%) |
| Personal Care & Service | 3 (18.8%) | 13 (81.2%) |
| Total (Category) | 40 (69.0%) | 18 (31.0%) |
| Total (Overall) | 190 (69.3%) | 84 (30.7%) |
Sales and Office Occupations
The most common Sales and Office occupations in Montreat are Sales & Related (53 | 19.3%), and Office & Administration (18 | 6.6%).
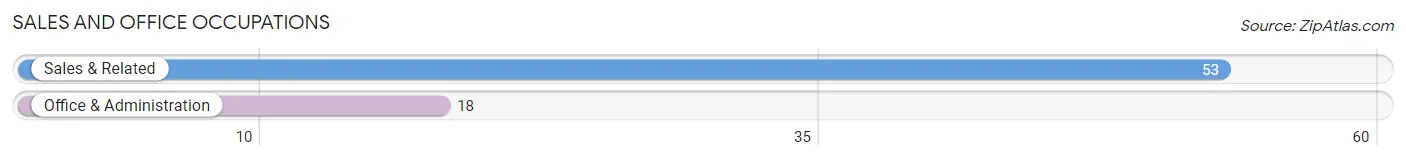
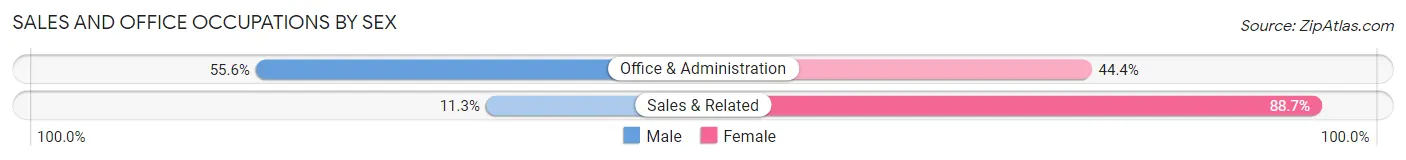
Sales and Office Occupations by Sex
| Occupation | Male | Female |
| Sales & Related | 6 (11.3%) | 47 (88.7%) |
| Office & Administration | 10 (55.6%) | 8 (44.4%) |
| Total (Category) | 16 (22.5%) | 55 (77.5%) |
| Total (Overall) | 190 (69.3%) | 84 (30.7%) |
Natural Resources, Construction and Maintenance Occupations
The most common Natural Resources, Construction and Maintenance occupations in Montreat are Farming, Fishing & Forestry (10 | 3.6%), and Installation, Maintenance & Repair (6 | 2.2%).
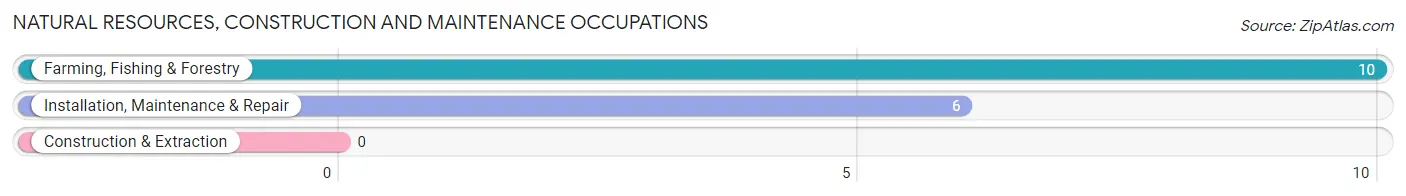
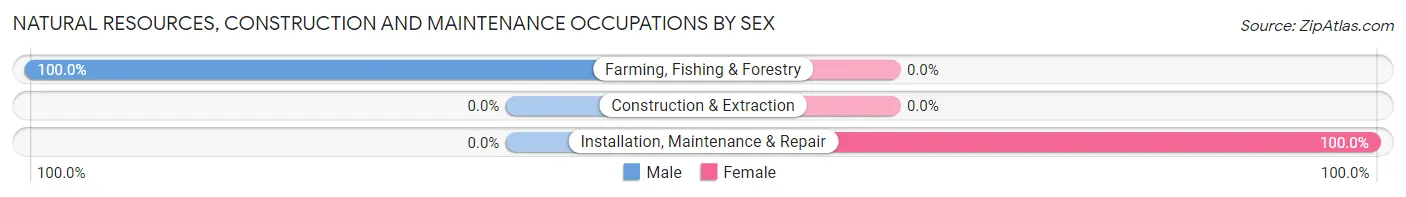
Natural Resources, Construction and Maintenance Occupations by Sex
| Occupation | Male | Female |
| Farming, Fishing & Forestry | 10 (100.0%) | 0 (0.0%) |
| Construction & Extraction | 0 (0.0%) | 0 (0.0%) |
| Installation, Maintenance & Repair | 0 (0.0%) | 6 (100.0%) |
| Total (Category) | 10 (62.5%) | 6 (37.5%) |
| Total (Overall) | 190 (69.3%) | 84 (30.7%) |
Production, Transportation and Moving Occupations
The most common Production, Transportation and Moving occupations in Montreat are , and Material Moving (118 | 43.1%).
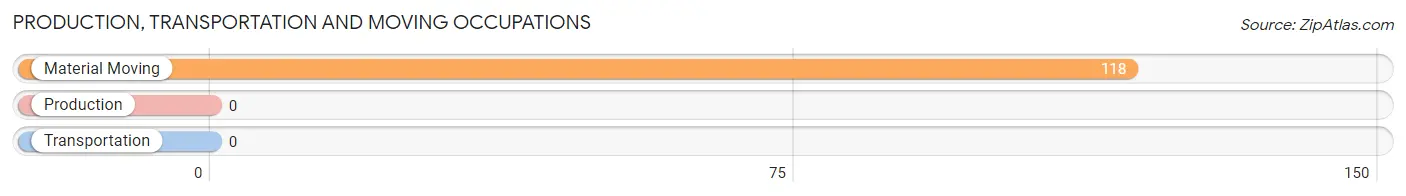
Production, Transportation and Moving Occupations by Sex
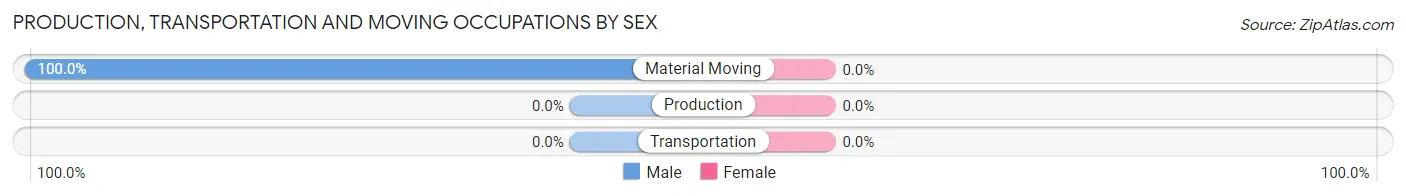
| Occupation | Male | Female |
| Production | 0 (0.0%) | 0 (0.0%) |
| Transportation | 0 (0.0%) | 0 (0.0%) |
| Material Moving | 118 (100.0%) | 0 (0.0%) |
| Total (Category) | 118 (100.0%) | 0 (0.0%) |
| Total (Overall) | 190 (69.3%) | 84 (30.7%) |
Employment Industries by Sex in Montreat
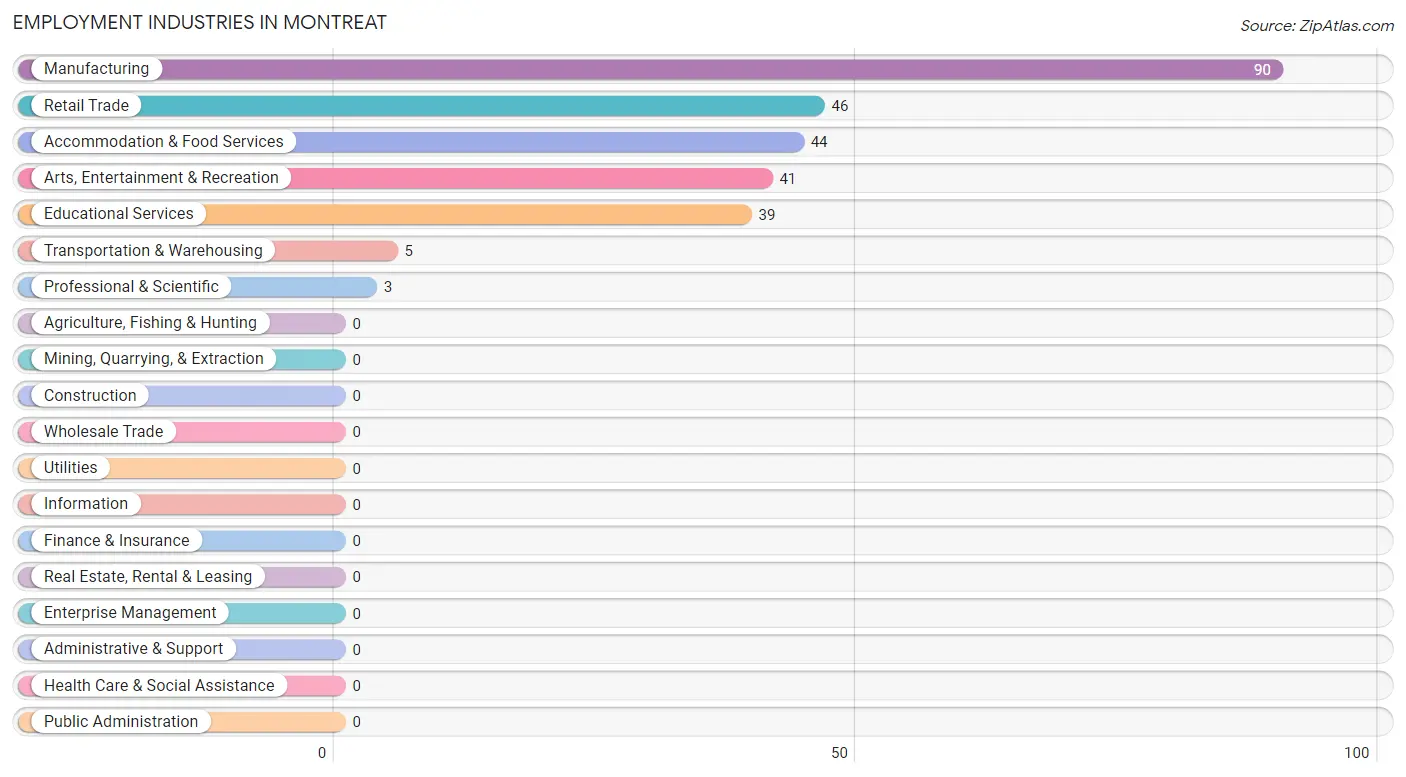
Employment Industries in Montreat
The major employment industries in Montreat include Manufacturing (90 | 32.9%), Retail Trade (46 | 16.8%), Accommodation & Food Services (44 | 16.1%), Arts, Entertainment & Recreation (41 | 15.0%), and Educational Services (39 | 14.2%).
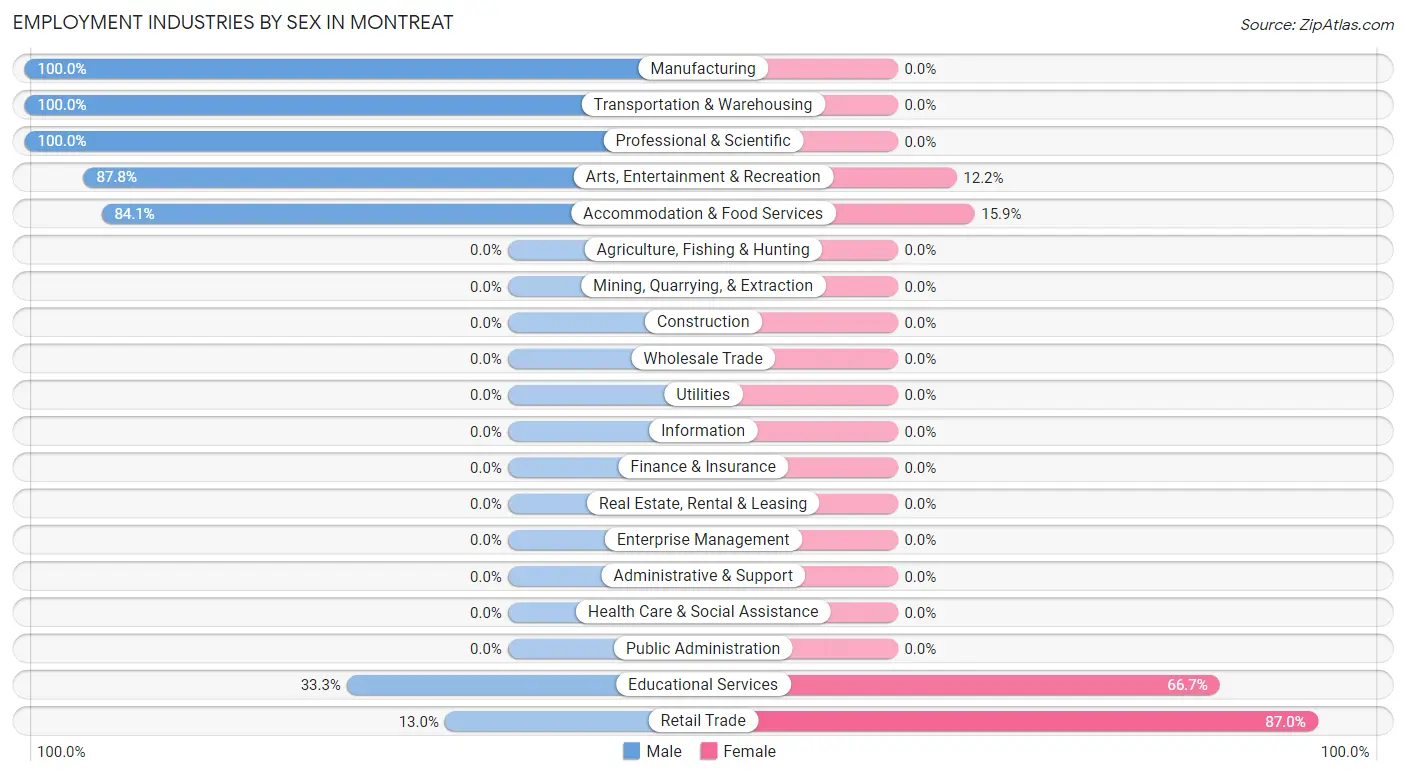
Employment Industries by Sex in Montreat
The Montreat industries that see more men than women are Manufacturing (100.0%), Transportation & Warehousing (100.0%), and Professional & Scientific (100.0%), whereas the industries that tend to have a higher number of women are Retail Trade (87.0%), Educational Services (66.7%), and Accommodation & Food Services (15.9%).
| Industry | Male | Female |
| Agriculture, Fishing & Hunting | 0 (0.0%) | 0 (0.0%) |
| Mining, Quarrying, & Extraction | 0 (0.0%) | 0 (0.0%) |
| Construction | 0 (0.0%) | 0 (0.0%) |
| Manufacturing | 90 (100.0%) | 0 (0.0%) |
| Wholesale Trade | 0 (0.0%) | 0 (0.0%) |
| Retail Trade | 6 (13.0%) | 40 (87.0%) |
| Transportation & Warehousing | 5 (100.0%) | 0 (0.0%) |
| Utilities | 0 (0.0%) | 0 (0.0%) |
| Information | 0 (0.0%) | 0 (0.0%) |
| Finance & Insurance | 0 (0.0%) | 0 (0.0%) |
| Real Estate, Rental & Leasing | 0 (0.0%) | 0 (0.0%) |
| Professional & Scientific | 3 (100.0%) | 0 (0.0%) |
| Enterprise Management | 0 (0.0%) | 0 (0.0%) |
| Administrative & Support | 0 (0.0%) | 0 (0.0%) |
| Educational Services | 13 (33.3%) | 26 (66.7%) |
| Health Care & Social Assistance | 0 (0.0%) | 0 (0.0%) |
| Arts, Entertainment & Recreation | 36 (87.8%) | 5 (12.2%) |
| Accommodation & Food Services | 37 (84.1%) | 7 (15.9%) |
| Public Administration | 0 (0.0%) | 0 (0.0%) |
| Total | 190 (69.3%) | 84 (30.7%) |
Education in Montreat
School Enrollment in Montreat
The most common levels of schooling among the 339 students in Montreat are college / undergraduate (335 | 98.8%), and graduate / professional (4 | 1.2%).
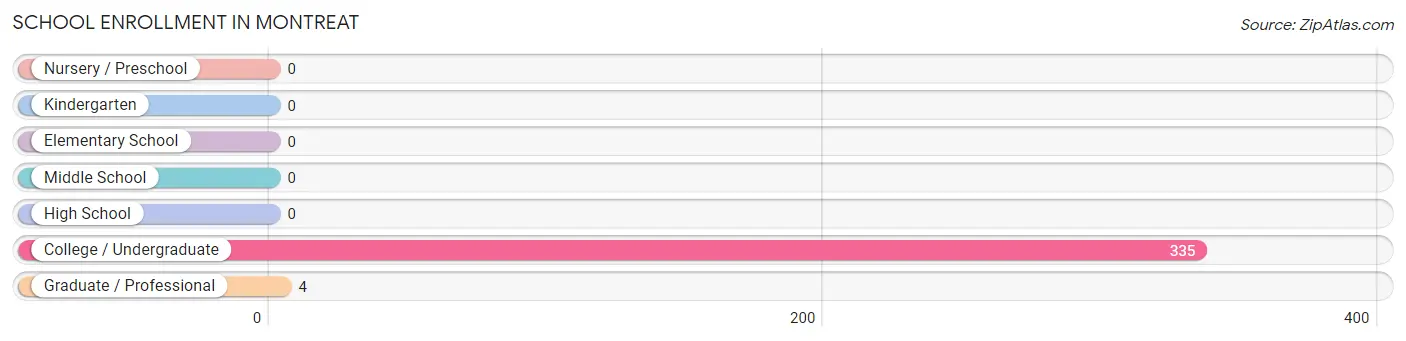
| School Level | # Students | % Students |
| Nursery / Preschool | 0 | 0.0% |
| Kindergarten | 0 | 0.0% |
| Elementary School | 0 | 0.0% |
| Middle School | 0 | 0.0% |
| High School | 0 | 0.0% |
| College / Undergraduate | 335 | 98.8% |
| Graduate / Professional | 4 | 1.2% |
| Total | 339 | 100.0% |
School Enrollment by Age by Funding Source in Montreat
Out of a total of 339 students who are enrolled in schools in Montreat, 210 (61.9%) attend a private institution, while the remaining 129 (38.1%) are enrolled in public schools. The age group of 15 to 17 year olds has the highest likelihood of being enrolled in private schools, with 3 (100.0% in the age bracket) enrolled. Conversely, the age group of 20 to 24 year olds has the lowest likelihood of being enrolled in a private school, with 72 (41.1% in the age bracket) attending a public institution.
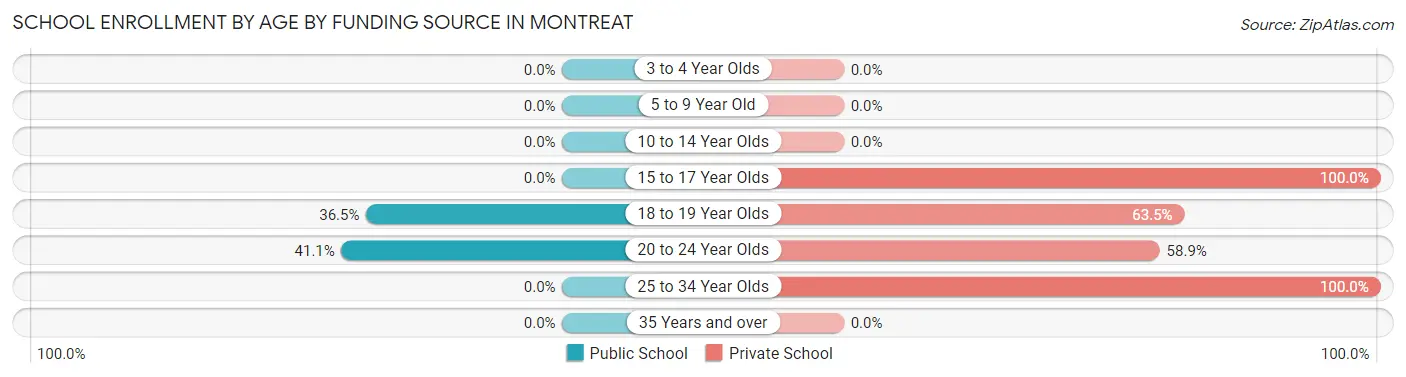
| Age Bracket | Public School | Private School |
| 3 to 4 Year Olds | 0 (0.0%) | 0 (0.0%) |
| 5 to 9 Year Old | 0 (0.0%) | 0 (0.0%) |
| 10 to 14 Year Olds | 0 (0.0%) | 0 (0.0%) |
| 15 to 17 Year Olds | 0 (0.0%) | 3 (100.0%) |
| 18 to 19 Year Olds | 57 (36.5%) | 99 (63.5%) |
| 20 to 24 Year Olds | 72 (41.1%) | 103 (58.9%) |
| 25 to 34 Year Olds | 0 (0.0%) | 5 (100.0%) |
| 35 Years and over | 0 (0.0%) | 0 (0.0%) |
| Total | 129 (38.1%) | 210 (61.9%) |
Educational Attainment by Field of Study in Montreat
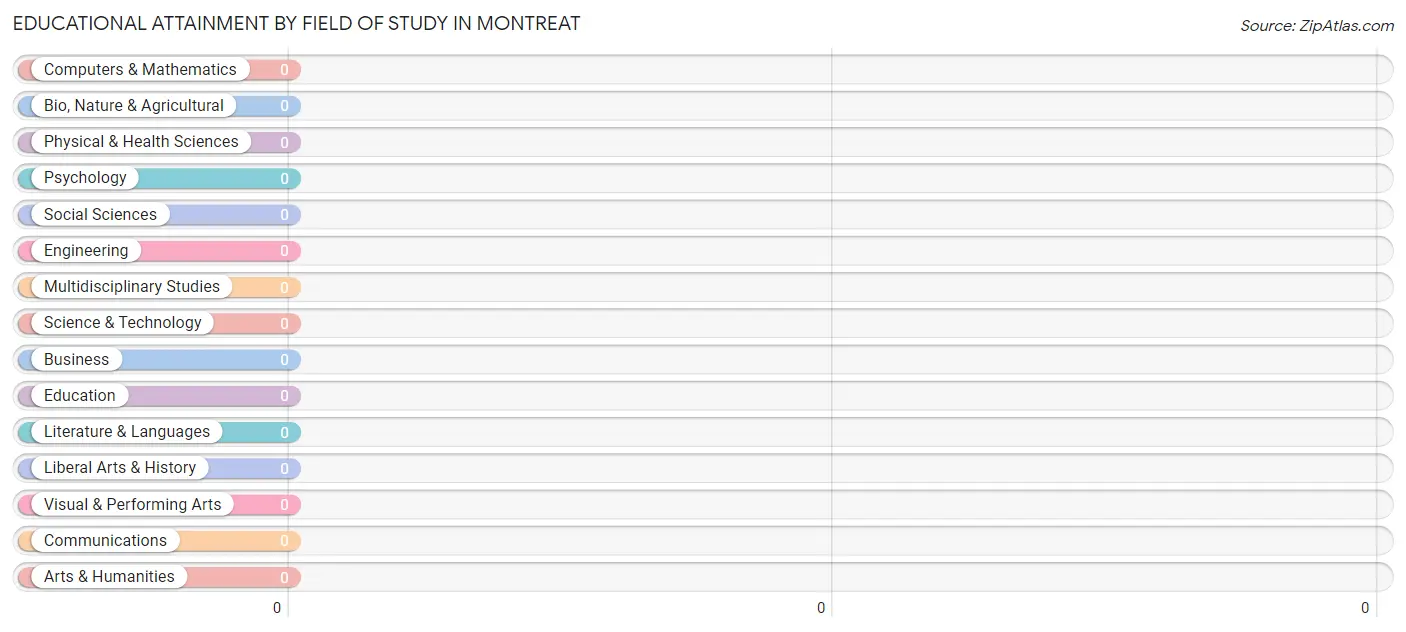
| Field of Study | # Graduates | % Graduates |
| Computers & Mathematics | 0 | 0.0% |
| Bio, Nature & Agricultural | 0 | 0.0% |
| Physical & Health Sciences | 0 | 0.0% |
| Psychology | 0 | 0.0% |
| Social Sciences | 0 | 0.0% |
| Engineering | 0 | 0.0% |
| Multidisciplinary Studies | 0 | 0.0% |
| Science & Technology | 0 | 0.0% |
| Business | 0 | 0.0% |
| Education | 0 | 0.0% |
| Literature & Languages | 0 | 0.0% |
| Liberal Arts & History | 0 | 0.0% |
| Visual & Performing Arts | 0 | 0.0% |
| Communications | 0 | 0.0% |
| Arts & Humanities | 0 | 0.0% |
| Total | 0 | 0.0% |
Transportation & Commute in Montreat
Vehicle Availability by Sex in Montreat

| Vehicles Available | Male | Female |
| No Vehicle | 0 (0.0%) | 0 (0.0%) |
| 1 Vehicle | 0 (0.0%) | 0 (0.0%) |
| 2 Vehicles | 85 (100.0%) | 0 (0.0%) |
| 3 Vehicles | 0 (0.0%) | 0 (0.0%) |
| 4 Vehicles | 0 (0.0%) | 0 (0.0%) |
| 5 or more Vehicles | 0 (0.0%) | 0 (0.0%) |
| Total | 85 (100.0%) | 0 (0.0%) |
Commute Time in Montreat
The most frequently occuring commute durations in Montreat are 5 to 9 minutes (119 commuters, 58.6%), 20 to 24 minutes (36 commuters, 17.7%), and 10 to 14 minutes (32 commuters, 15.8%).
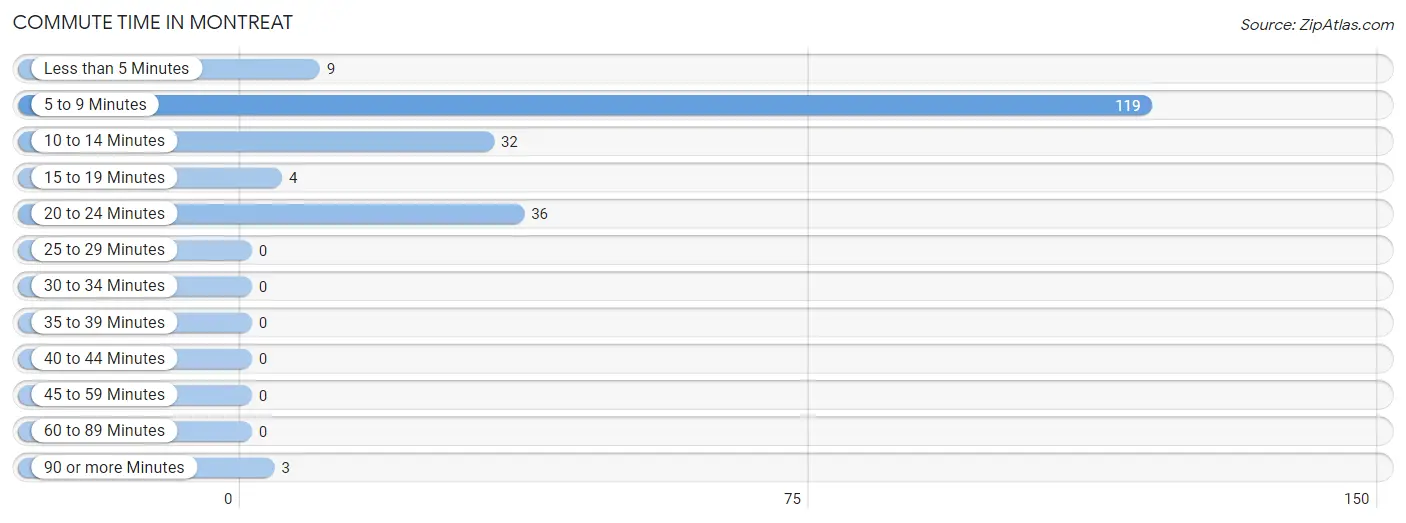
| Commute Time | # Commuters | % Commuters |
| Less than 5 Minutes | 9 | 4.4% |
| 5 to 9 Minutes | 119 | 58.6% |
| 10 to 14 Minutes | 32 | 15.8% |
| 15 to 19 Minutes | 4 | 2.0% |
| 20 to 24 Minutes | 36 | 17.7% |
| 25 to 29 Minutes | 0 | 0.0% |
| 30 to 34 Minutes | 0 | 0.0% |
| 35 to 39 Minutes | 0 | 0.0% |
| 40 to 44 Minutes | 0 | 0.0% |
| 45 to 59 Minutes | 0 | 0.0% |
| 60 to 89 Minutes | 0 | 0.0% |
| 90 or more Minutes | 3 | 1.5% |
Commute Time by Sex in Montreat
The most common commute times in Montreat are 5 to 9 minutes (96 commuters, 60.4%) for males and 5 to 9 minutes (23 commuters, 52.3%) for females.
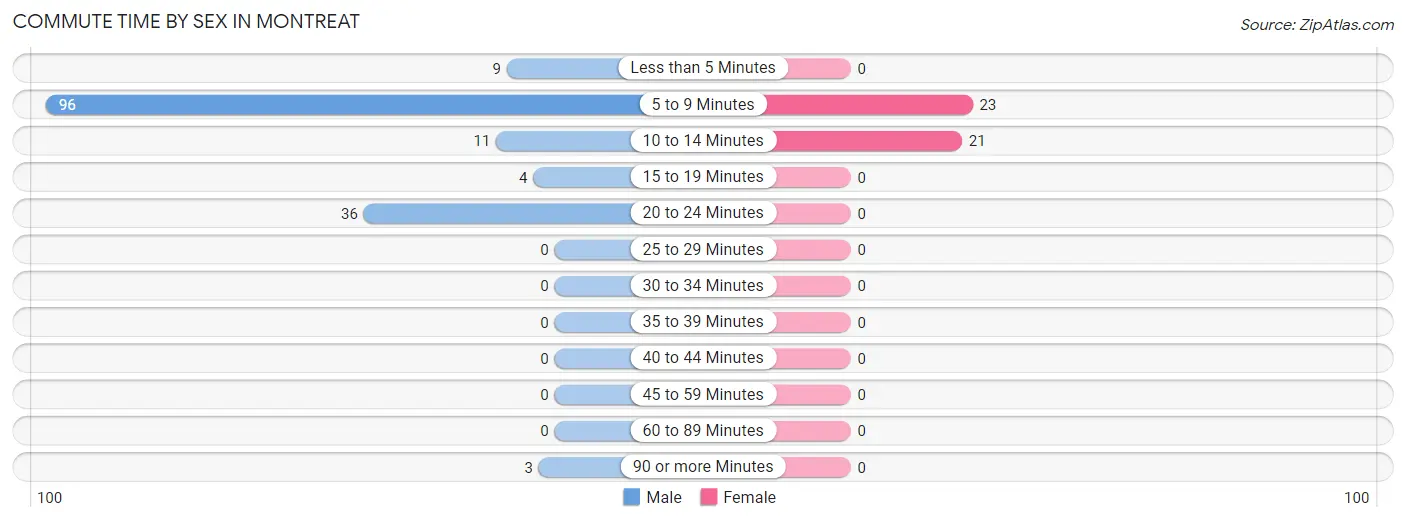
| Commute Time | Male | Female |
| Less than 5 Minutes | 9 (5.7%) | 0 (0.0%) |
| 5 to 9 Minutes | 96 (60.4%) | 23 (52.3%) |
| 10 to 14 Minutes | 11 (6.9%) | 21 (47.7%) |
| 15 to 19 Minutes | 4 (2.5%) | 0 (0.0%) |
| 20 to 24 Minutes | 36 (22.6%) | 0 (0.0%) |
| 25 to 29 Minutes | 0 (0.0%) | 0 (0.0%) |
| 30 to 34 Minutes | 0 (0.0%) | 0 (0.0%) |
| 35 to 39 Minutes | 0 (0.0%) | 0 (0.0%) |
| 40 to 44 Minutes | 0 (0.0%) | 0 (0.0%) |
| 45 to 59 Minutes | 0 (0.0%) | 0 (0.0%) |
| 60 to 89 Minutes | 0 (0.0%) | 0 (0.0%) |
| 90 or more Minutes | 3 (1.9%) | 0 (0.0%) |
Time of Departure to Work by Sex in Montreat
The most frequent times of departure to work in Montreat are 4:00 PM to 11:59 PM (97, 61.0%) for males and 8:30 AM to 8:59 AM (21, 47.7%) for females.
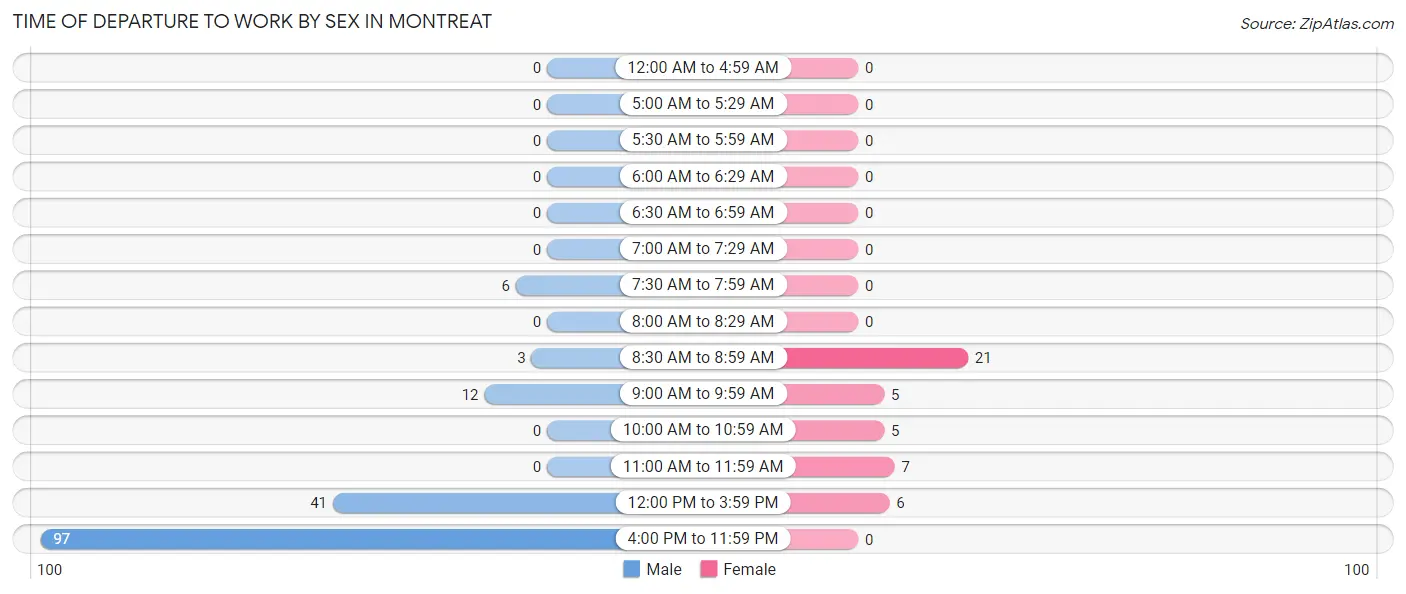
| Time of Departure | Male | Female |
| 12:00 AM to 4:59 AM | 0 (0.0%) | 0 (0.0%) |
| 5:00 AM to 5:29 AM | 0 (0.0%) | 0 (0.0%) |
| 5:30 AM to 5:59 AM | 0 (0.0%) | 0 (0.0%) |
| 6:00 AM to 6:29 AM | 0 (0.0%) | 0 (0.0%) |
| 6:30 AM to 6:59 AM | 0 (0.0%) | 0 (0.0%) |
| 7:00 AM to 7:29 AM | 0 (0.0%) | 0 (0.0%) |
| 7:30 AM to 7:59 AM | 6 (3.8%) | 0 (0.0%) |
| 8:00 AM to 8:29 AM | 0 (0.0%) | 0 (0.0%) |
| 8:30 AM to 8:59 AM | 3 (1.9%) | 21 (47.7%) |
| 9:00 AM to 9:59 AM | 12 (7.5%) | 5 (11.4%) |
| 10:00 AM to 10:59 AM | 0 (0.0%) | 5 (11.4%) |
| 11:00 AM to 11:59 AM | 0 (0.0%) | 7 (15.9%) |
| 12:00 PM to 3:59 PM | 41 (25.8%) | 6 (13.6%) |
| 4:00 PM to 11:59 PM | 97 (61.0%) | 0 (0.0%) |
| Total | 159 (100.0%) | 44 (100.0%) |
Housing Occupancy in Montreat
Occupancy by Ownership in Montreat
Of the total 18 dwellings in Montreat, owner-occupied units account for 0 (0.0%), while renter-occupied units make up 18 (100.0%).
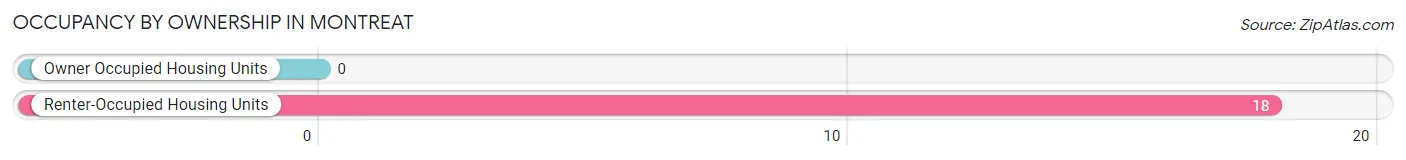
| Occupancy | # Housing Units | % Housing Units |
| Owner Occupied Housing Units | 0 | 0.0% |
| Renter-Occupied Housing Units | 18 | 100.0% |
| Total Occupied Housing Units | 18 | 100.0% |
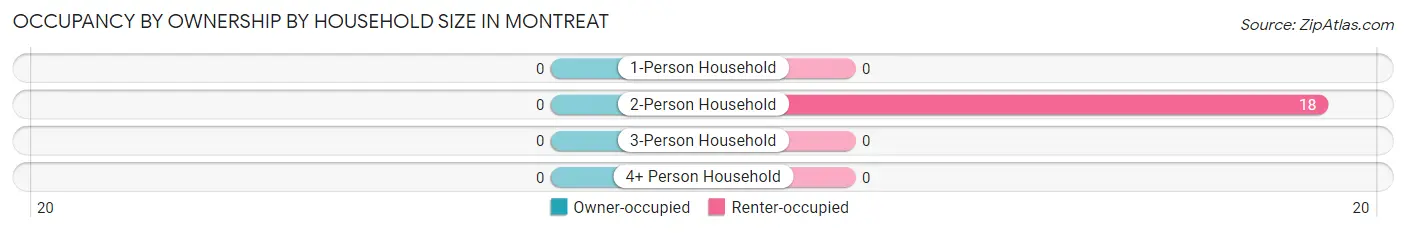
Occupancy by Household Size in Montreat
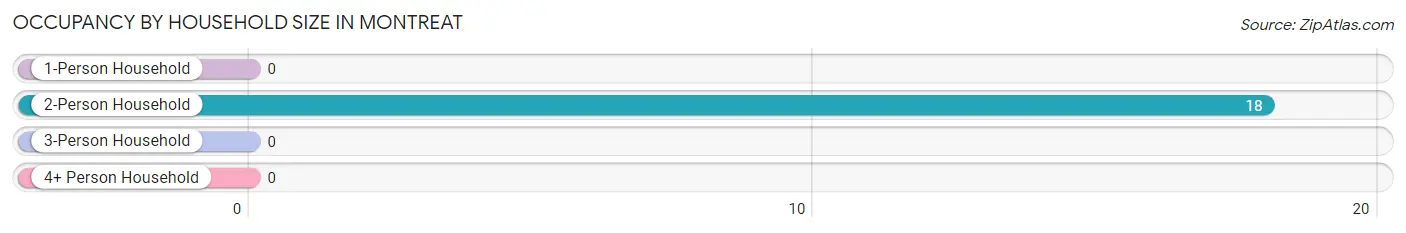
| Household Size | # Housing Units | % Housing Units |
| 1-Person Household | 0 | 0.0% |
| 2-Person Household | 18 | 100.0% |
| 3-Person Household | 0 | 0.0% |
| 4+ Person Household | 0 | 0.0% |
| Total Housing Units | 18 | 100.0% |
Occupancy by Ownership by Household Size in Montreat
| Household Size | Owner-occupied | Renter-occupied |
| 1-Person Household | 0 (0.0%) | 0 (0.0%) |
| 2-Person Household | 0 (0.0%) | 18 (100.0%) |
| 3-Person Household | 0 (0.0%) | 0 (0.0%) |
| 4+ Person Household | 0 (0.0%) | 0 (0.0%) |
| Total Housing Units | 0 (0.0%) | 18 (100.0%) |
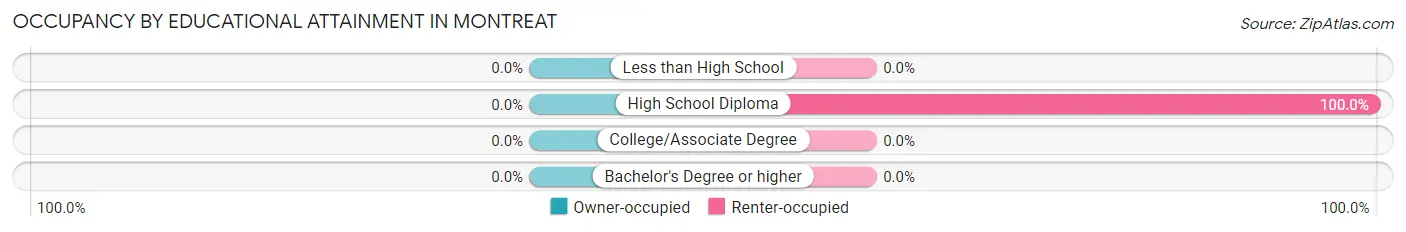
Occupancy by Educational Attainment in Montreat
| Household Size | Owner-occupied | Renter-occupied |
| Less than High School | 0 (0.0%) | 0 (0.0%) |
| High School Diploma | 0 (0.0%) | 18 (100.0%) |
| College/Associate Degree | 0 (0.0%) | 0 (0.0%) |
| Bachelor's Degree or higher | 0 (0.0%) | 0 (0.0%) |
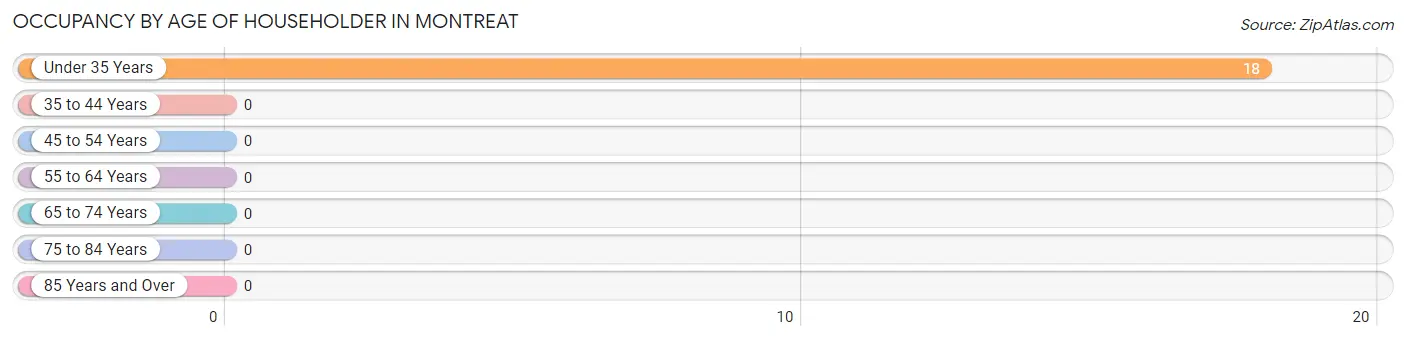
Occupancy by Age of Householder in Montreat
| Age Bracket | # Households | % Households |
| Under 35 Years | 18 | 100.0% |
| 35 to 44 Years | 0 | 0.0% |
| 45 to 54 Years | 0 | 0.0% |
| 55 to 64 Years | 0 | 0.0% |
| 65 to 74 Years | 0 | 0.0% |
| 75 to 84 Years | 0 | 0.0% |
| 85 Years and Over | 0 | 0.0% |
| Total | 18 | 100.0% |
Housing Finances in Montreat
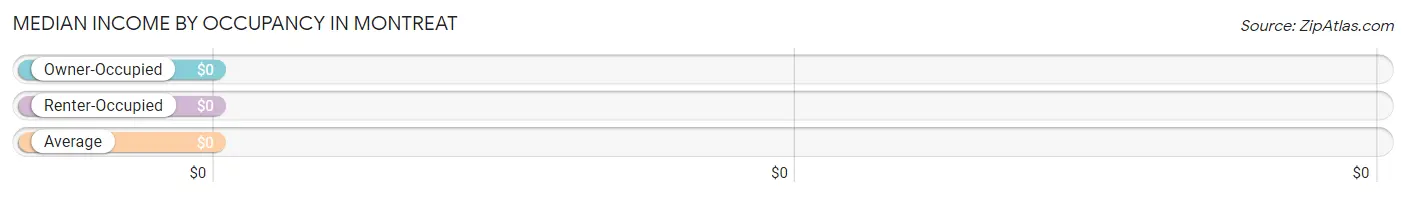
Median Income by Occupancy in Montreat
| Occupancy Type | # Households | Median Income |
| Owner-Occupied | 0 (0.0%) | $0 |
| Renter-Occupied | 18 (100.0%) | $0 |
| Average | 18 (100.0%) | $0 |
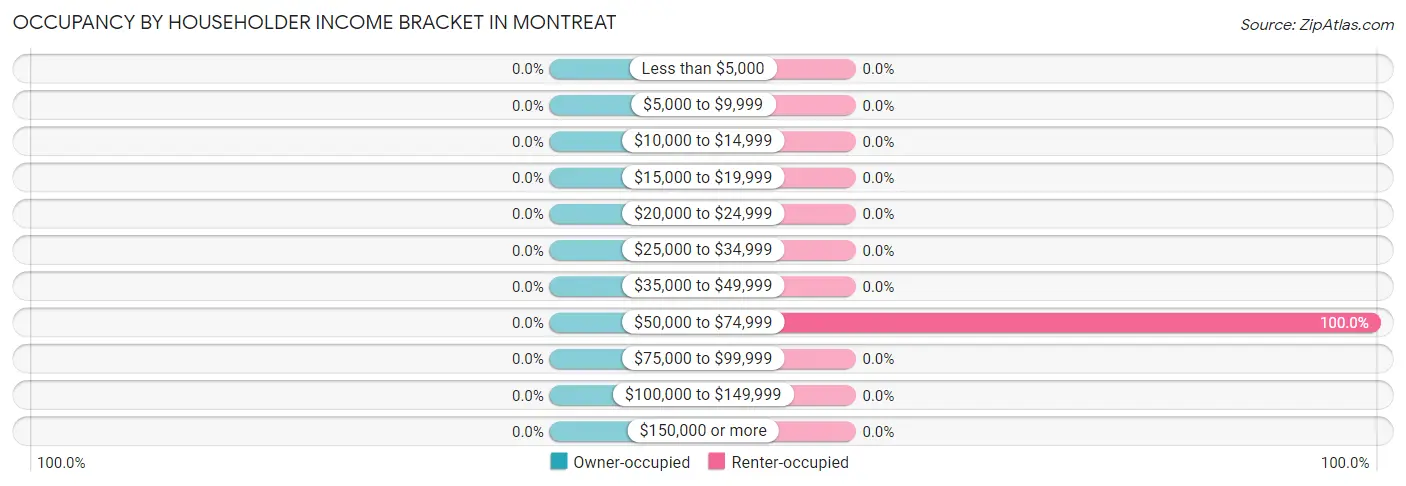
Occupancy by Householder Income Bracket in Montreat
| Income Bracket | Owner-occupied | Renter-occupied |
| Less than $5,000 | 0 (0.0%) | 0 (0.0%) |
| $5,000 to $9,999 | 0 (0.0%) | 0 (0.0%) |
| $10,000 to $14,999 | 0 (0.0%) | 0 (0.0%) |
| $15,000 to $19,999 | 0 (0.0%) | 0 (0.0%) |
| $20,000 to $24,999 | 0 (0.0%) | 0 (0.0%) |
| $25,000 to $34,999 | 0 (0.0%) | 0 (0.0%) |
| $35,000 to $49,999 | 0 (0.0%) | 0 (0.0%) |
| $50,000 to $74,999 | 0 (0.0%) | 18 (100.0%) |
| $75,000 to $99,999 | 0 (0.0%) | 0 (0.0%) |
| $100,000 to $149,999 | 0 (0.0%) | 0 (0.0%) |
| $150,000 or more | 0 (0.0%) | 0 (0.0%) |
| Total | 0 (0.0%) | 18 (100.0%) |
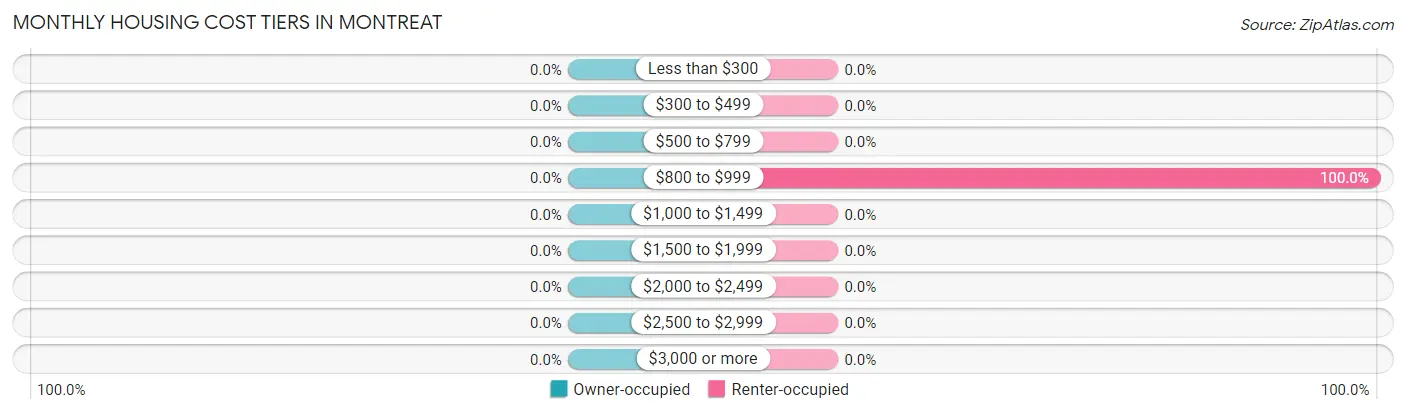
Monthly Housing Cost Tiers in Montreat
| Monthly Cost | Owner-occupied | Renter-occupied |
| Less than $300 | 0 (0.0%) | 0 (0.0%) |
| $300 to $499 | 0 (0.0%) | 0 (0.0%) |
| $500 to $799 | 0 (0.0%) | 0 (0.0%) |
| $800 to $999 | 0 (0.0%) | 18 (100.0%) |
| $1,000 to $1,499 | 0 (0.0%) | 0 (0.0%) |
| $1,500 to $1,999 | 0 (0.0%) | 0 (0.0%) |
| $2,000 to $2,499 | 0 (0.0%) | 0 (0.0%) |
| $2,500 to $2,999 | 0 (0.0%) | 0 (0.0%) |
| $3,000 or more | 0 (0.0%) | 0 (0.0%) |
| Total | 0 (0.0%) | 18 (100.0%) |
Physical Housing Characteristics in Montreat
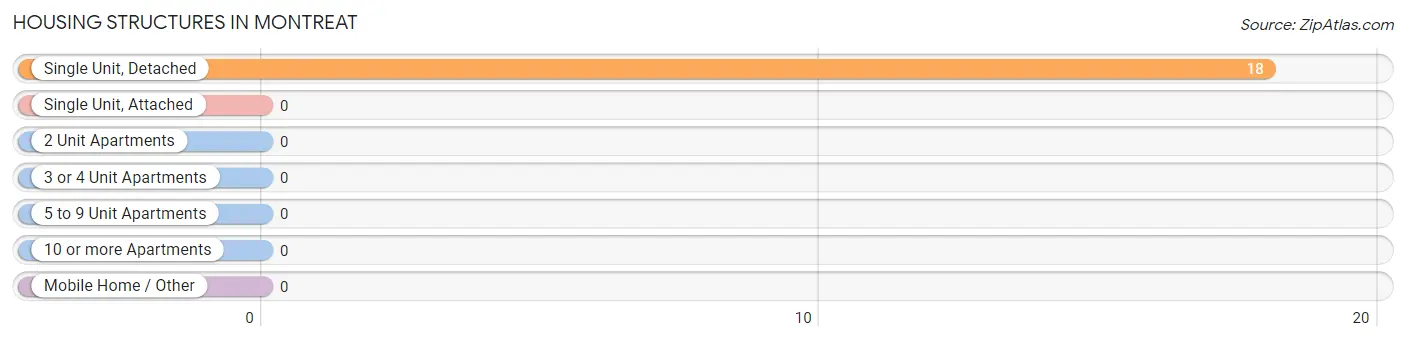
Housing Structures in Montreat
| Structure Type | # Housing Units | % Housing Units |
| Single Unit, Detached | 18 | 100.0% |
| Single Unit, Attached | 0 | 0.0% |
| 2 Unit Apartments | 0 | 0.0% |
| 3 or 4 Unit Apartments | 0 | 0.0% |
| 5 to 9 Unit Apartments | 0 | 0.0% |
| 10 or more Apartments | 0 | 0.0% |
| Mobile Home / Other | 0 | 0.0% |
| Total | 18 | 100.0% |
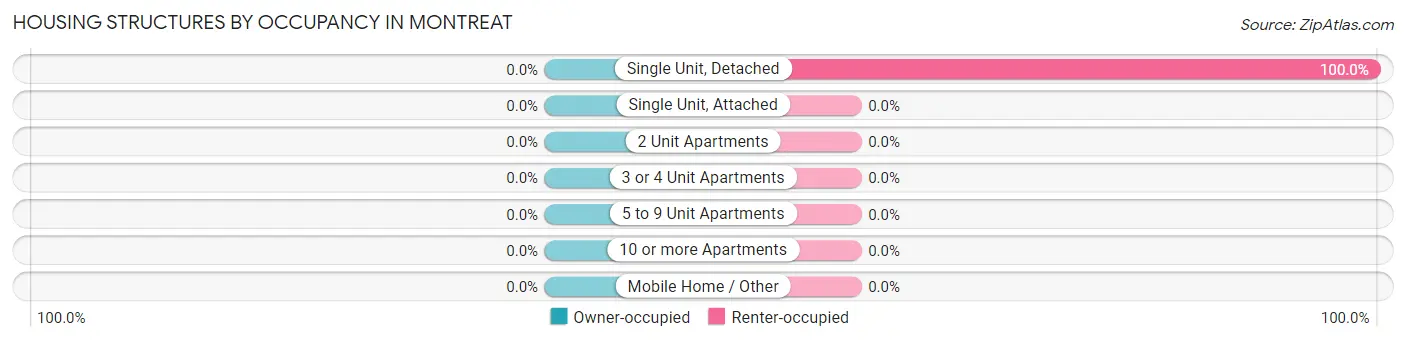
Housing Structures by Occupancy in Montreat
| Structure Type | Owner-occupied | Renter-occupied |
| Single Unit, Detached | 0 (0.0%) | 18 (100.0%) |
| Single Unit, Attached | 0 (0.0%) | 0 (0.0%) |
| 2 Unit Apartments | 0 (0.0%) | 0 (0.0%) |
| 3 or 4 Unit Apartments | 0 (0.0%) | 0 (0.0%) |
| 5 to 9 Unit Apartments | 0 (0.0%) | 0 (0.0%) |
| 10 or more Apartments | 0 (0.0%) | 0 (0.0%) |
| Mobile Home / Other | 0 (0.0%) | 0 (0.0%) |
| Total | 0 (0.0%) | 18 (100.0%) |
Housing Structures by Number of Rooms in Montreat
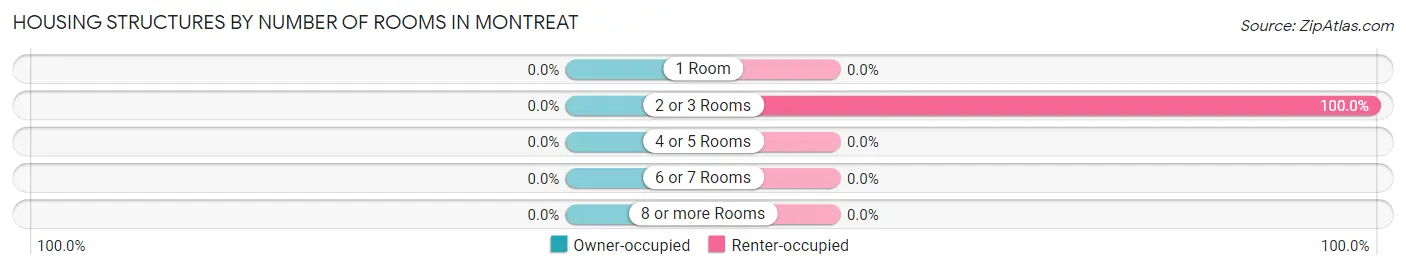
| Number of Rooms | Owner-occupied | Renter-occupied |
| 1 Room | 0 (0.0%) | 0 (0.0%) |
| 2 or 3 Rooms | 0 (0.0%) | 18 (100.0%) |
| 4 or 5 Rooms | 0 (0.0%) | 0 (0.0%) |
| 6 or 7 Rooms | 0 (0.0%) | 0 (0.0%) |
| 8 or more Rooms | 0 (0.0%) | 0 (0.0%) |
| Total | 0 (0.0%) | 18 (100.0%) |
Housing Structure by Heating Type in Montreat
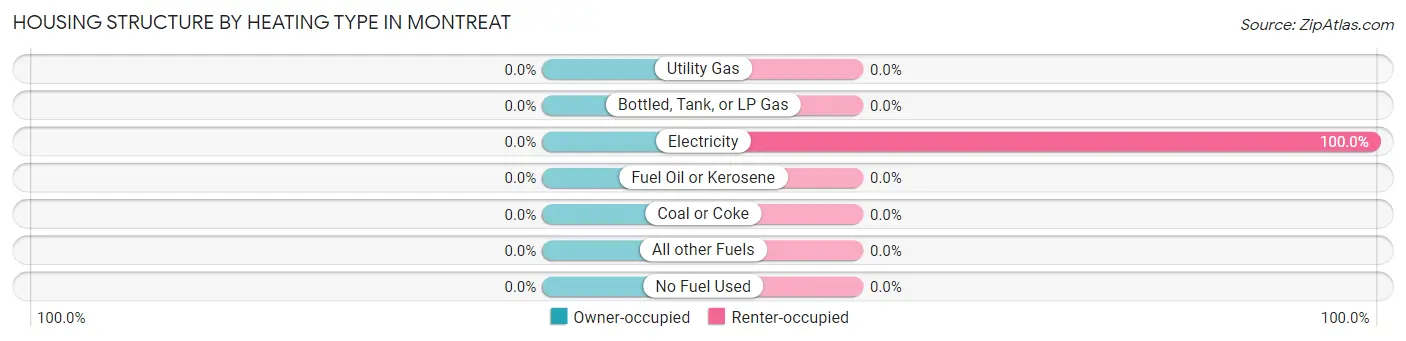
| Heating Type | Owner-occupied | Renter-occupied |
| Utility Gas | 0 (0.0%) | 0 (0.0%) |
| Bottled, Tank, or LP Gas | 0 (0.0%) | 0 (0.0%) |
| Electricity | 0 (0.0%) | 18 (100.0%) |
| Fuel Oil or Kerosene | 0 (0.0%) | 0 (0.0%) |
| Coal or Coke | 0 (0.0%) | 0 (0.0%) |
| All other Fuels | 0 (0.0%) | 0 (0.0%) |
| No Fuel Used | 0 (0.0%) | 0 (0.0%) |
| Total | 0 (0.0%) | 18 (100.0%) |
Household Vehicle Usage in Montreat
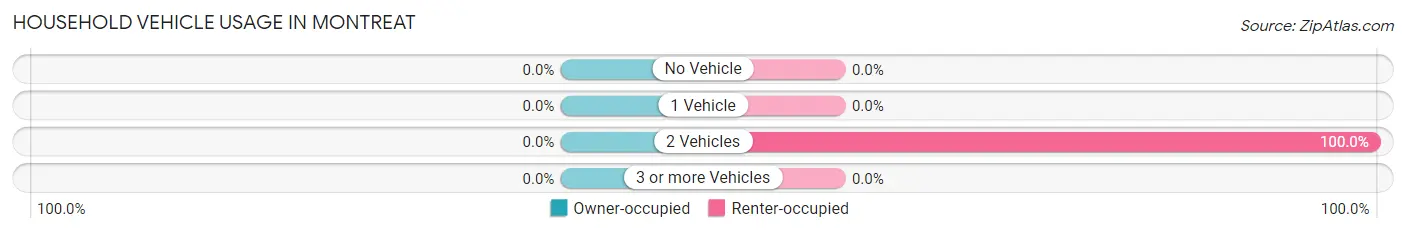
| Vehicles per Household | Owner-occupied | Renter-occupied |
| No Vehicle | 0 (0.0%) | 0 (0.0%) |
| 1 Vehicle | 0 (0.0%) | 0 (0.0%) |
| 2 Vehicles | 0 (0.0%) | 18 (100.0%) |
| 3 or more Vehicles | 0 (0.0%) | 0 (0.0%) |
| Total | 0 (0.0%) | 18 (100.0%) |
Real Estate & Mortgages in Montreat
Real Estate and Mortgage Overview in Montreat
| Characteristic | Without Mortgage | With Mortgage |
| Housing Units | 0 | 0 |
| Median Property Value | - | - |
| Median Household Income | - | - |
| Monthly Housing Costs | - | - |
| Real Estate Taxes | - | - |
Property Value by Mortgage Status in Montreat
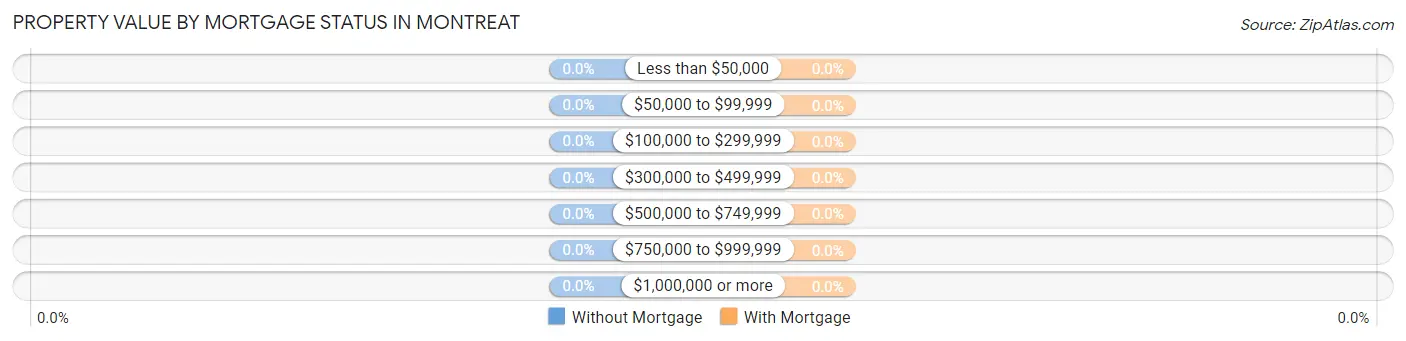
| Property Value | Without Mortgage | With Mortgage |
| Less than $50,000 | 0 (0.0%) | 0 (0.0%) |
| $50,000 to $99,999 | 0 (0.0%) | 0 (0.0%) |
| $100,000 to $299,999 | 0 (0.0%) | 0 (0.0%) |
| $300,000 to $499,999 | 0 (0.0%) | 0 (0.0%) |
| $500,000 to $749,999 | 0 (0.0%) | 0 (0.0%) |
| $750,000 to $999,999 | 0 (0.0%) | 0 (0.0%) |
| $1,000,000 or more | 0 (0.0%) | 0 (0.0%) |
| Total | 0 (0.0%) | 0 (0.0%) |
Household Income by Mortgage Status in Montreat
| Household Income | Without Mortgage | With Mortgage |
| Less than $10,000 | 0 (0.0%) | 0 (0.0%) |
| $10,000 to $24,999 | 0 (0.0%) | 0 (0.0%) |
| $25,000 to $34,999 | 0 (0.0%) | 0 (0.0%) |
| $35,000 to $49,999 | 0 (0.0%) | 0 (0.0%) |
| $50,000 to $74,999 | 0 (0.0%) | 0 (0.0%) |
| $75,000 to $99,999 | 0 (0.0%) | 0 (0.0%) |
| $100,000 to $149,999 | 0 (0.0%) | 0 (0.0%) |
| $150,000 or more | 0 (0.0%) | 0 (0.0%) |
| Total | 0 (0.0%) | 0 (0.0%) |
Property Value to Household Income Ratio in Montreat
| Value-to-Income Ratio | Without Mortgage | With Mortgage |
| Less than 2.0x | 0 (0.0%) | 0 (0.0%) |
| 2.0x to 2.9x | 0 (0.0%) | 0 (0.0%) |
| 3.0x to 3.9x | 0 (0.0%) | 0 (0.0%) |
| 4.0x or more | 0 (0.0%) | 0 (0.0%) |
| Total | 0 (0.0%) | 0 (0.0%) |
Real Estate Taxes by Mortgage Status in Montreat
| Property Taxes | Without Mortgage | With Mortgage |
| Less than $800 | 0 (0.0%) | 0 (0.0%) |
| $800 to $1,499 | 0 (0.0%) | 0 (0.0%) |
| $800 to $1,499 | 0 (0.0%) | 0 (0.0%) |
| Total | 0 (0.0%) | 0 (0.0%) |
Health & Disability in Montreat
Health Insurance Coverage by Age in Montreat
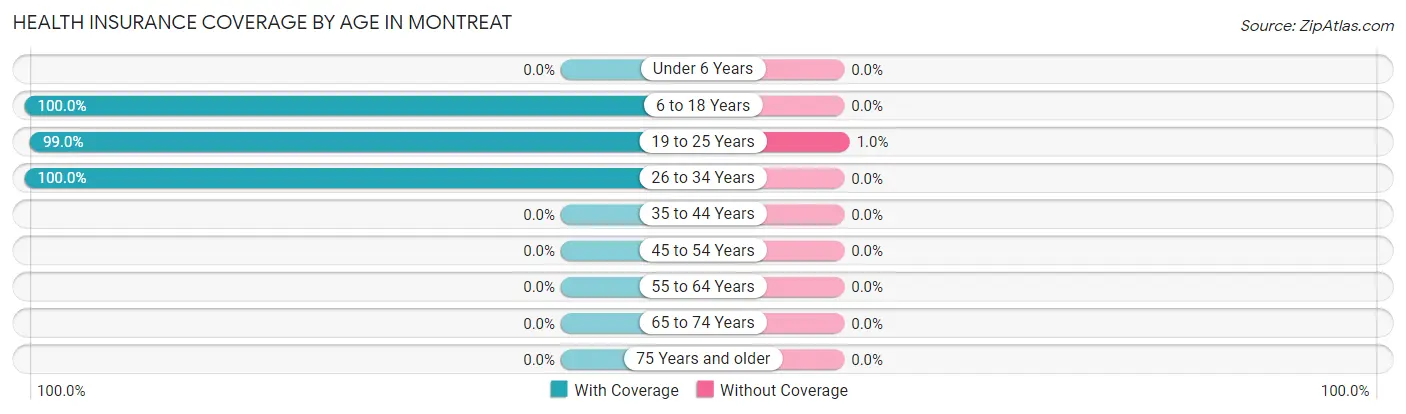
| Age Bracket | With Coverage | Without Coverage |
| Under 6 Years | 0 (0.0%) | 0 (0.0%) |
| 6 to 18 Years | 56 (100.0%) | 0 (0.0%) |
| 19 to 25 Years | 293 (99.0%) | 3 (1.0%) |
| 26 to 34 Years | 90 (100.0%) | 0 (0.0%) |
| 35 to 44 Years | 0 (0.0%) | 0 (0.0%) |
| 45 to 54 Years | 0 (0.0%) | 0 (0.0%) |
| 55 to 64 Years | 0 (0.0%) | 0 (0.0%) |
| 65 to 74 Years | 0 (0.0%) | 0 (0.0%) |
| 75 Years and older | 0 (0.0%) | 0 (0.0%) |
| Total | 439 (99.3%) | 3 (0.7%) |
Health Insurance Coverage by Citizenship Status in Montreat
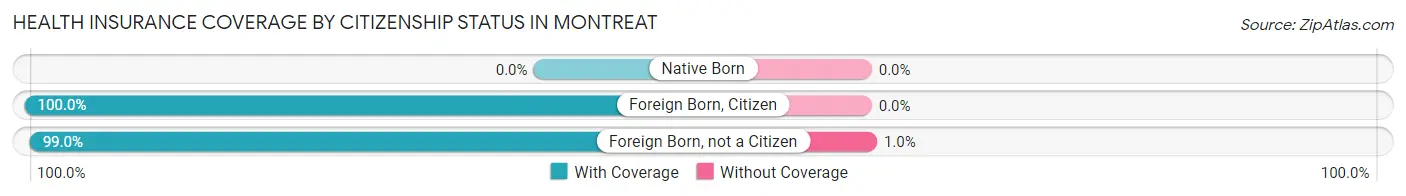
| Citizenship Status | With Coverage | Without Coverage |
| Native Born | 0 (0.0%) | 0 (0.0%) |
| Foreign Born, Citizen | 56 (100.0%) | 0 (0.0%) |
| Foreign Born, not a Citizen | 293 (99.0%) | 3 (1.0%) |
Health Insurance Coverage by Household Income in Montreat
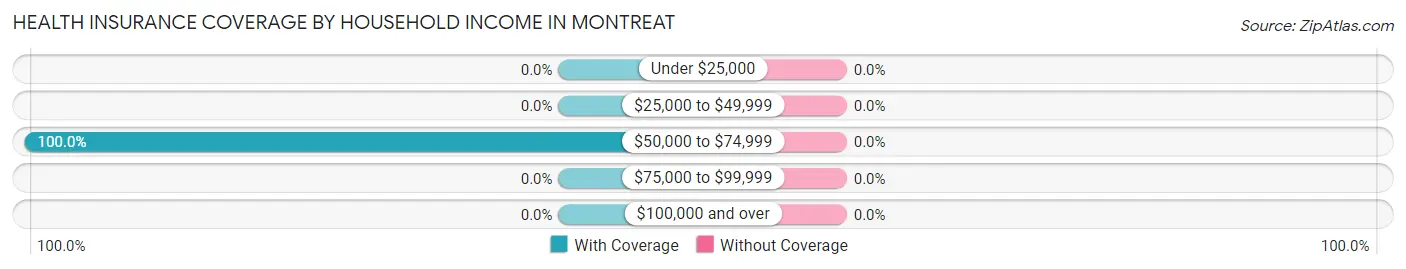
| Household Income | With Coverage | Without Coverage |
| Under $25,000 | 0 (0.0%) | 0 (0.0%) |
| $25,000 to $49,999 | 0 (0.0%) | 0 (0.0%) |
| $50,000 to $74,999 | 103 (100.0%) | 0 (0.0%) |
| $75,000 to $99,999 | 0 (0.0%) | 0 (0.0%) |
| $100,000 and over | 0 (0.0%) | 0 (0.0%) |
Public vs Private Health Insurance Coverage by Age in Montreat
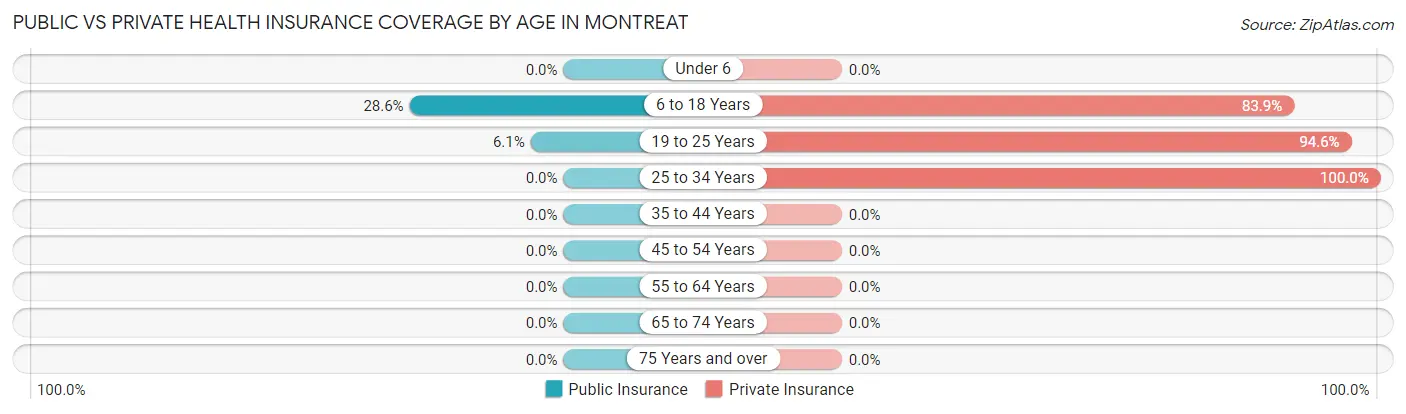
| Age Bracket | Public Insurance | Private Insurance |
| Under 6 | 0 (0.0%) | 0 (0.0%) |
| 6 to 18 Years | 16 (28.6%) | 47 (83.9%) |
| 19 to 25 Years | 18 (6.1%) | 280 (94.6%) |
| 25 to 34 Years | 0 (0.0%) | 90 (100.0%) |
| 35 to 44 Years | 0 (0.0%) | 0 (0.0%) |
| 45 to 54 Years | 0 (0.0%) | 0 (0.0%) |
| 55 to 64 Years | 0 (0.0%) | 0 (0.0%) |
| 65 to 74 Years | 0 (0.0%) | 0 (0.0%) |
| 75 Years and over | 0 (0.0%) | 0 (0.0%) |
| Total | 34 (7.7%) | 417 (94.3%) |
Disability Status by Sex by Age in Montreat
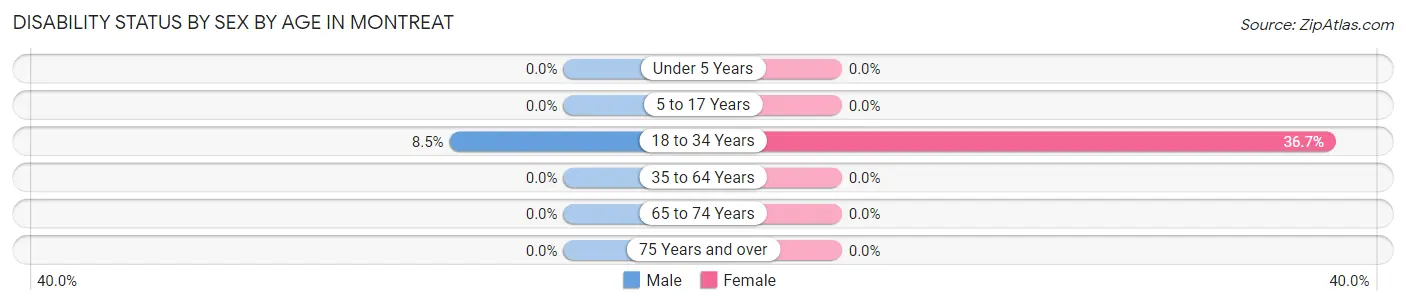
| Age Bracket | Male | Female |
| Under 5 Years | 0 (0.0%) | 0 (0.0%) |
| 5 to 17 Years | 0 (0.0%) | 0 (0.0%) |
| 18 to 34 Years | 27 (8.5%) | 44 (36.7%) |
| 35 to 64 Years | 0 (0.0%) | 0 (0.0%) |
| 65 to 74 Years | 0 (0.0%) | 0 (0.0%) |
| 75 Years and over | 0 (0.0%) | 0 (0.0%) |
Disability Class by Sex by Age in Montreat
Disability Class: Hearing Difficulty
| Age Bracket | Male | Female |
| Under 5 Years | 0 (0.0%) | 0 (0.0%) |
| 5 to 17 Years | 0 (0.0%) | 0 (0.0%) |
| 18 to 34 Years | 0 (0.0%) | 0 (0.0%) |
| 35 to 64 Years | 0 (0.0%) | 0 (0.0%) |
| 65 to 74 Years | 0 (0.0%) | 0 (0.0%) |
| 75 Years and over | 0 (0.0%) | 0 (0.0%) |
Disability Class: Vision Difficulty
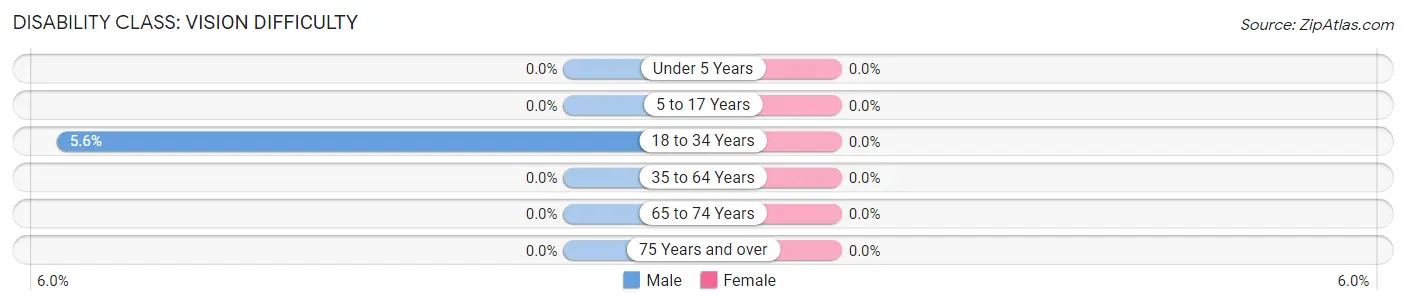
| Age Bracket | Male | Female |
| Under 5 Years | 0 (0.0%) | 0 (0.0%) |
| 5 to 17 Years | 0 (0.0%) | 0 (0.0%) |
| 18 to 34 Years | 18 (5.6%) | 0 (0.0%) |
| 35 to 64 Years | 0 (0.0%) | 0 (0.0%) |
| 65 to 74 Years | 0 (0.0%) | 0 (0.0%) |
| 75 Years and over | 0 (0.0%) | 0 (0.0%) |
Disability Class: Cognitive Difficulty
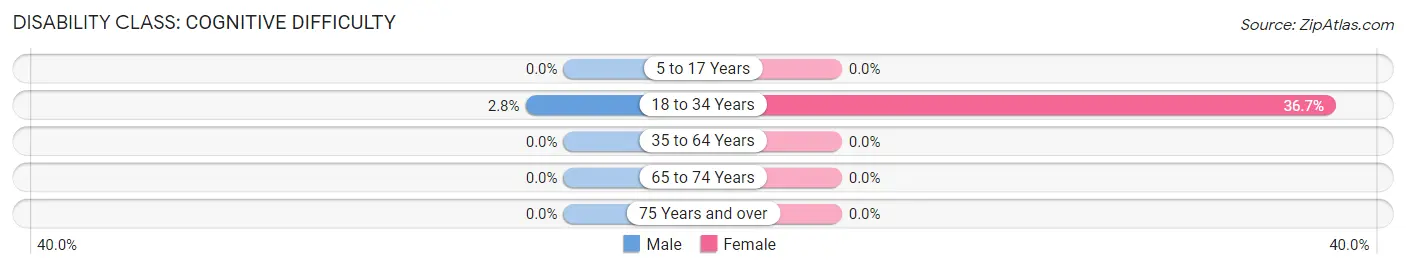
| Age Bracket | Male | Female |
| 5 to 17 Years | 0 (0.0%) | 0 (0.0%) |
| 18 to 34 Years | 9 (2.8%) | 44 (36.7%) |
| 35 to 64 Years | 0 (0.0%) | 0 (0.0%) |
| 65 to 74 Years | 0 (0.0%) | 0 (0.0%) |
| 75 Years and over | 0 (0.0%) | 0 (0.0%) |
Disability Class: Ambulatory Difficulty
| Age Bracket | Male | Female |
| 5 to 17 Years | 0 (0.0%) | 0 (0.0%) |
| 18 to 34 Years | 0 (0.0%) | 0 (0.0%) |
| 35 to 64 Years | 0 (0.0%) | 0 (0.0%) |
| 65 to 74 Years | 0 (0.0%) | 0 (0.0%) |
| 75 Years and over | 0 (0.0%) | 0 (0.0%) |
Disability Class: Self-Care Difficulty
| Age Bracket | Male | Female |
| 5 to 17 Years | 0 (0.0%) | 0 (0.0%) |
| 18 to 34 Years | 0 (0.0%) | 0 (0.0%) |
| 35 to 64 Years | 0 (0.0%) | 0 (0.0%) |
| 65 to 74 Years | 0 (0.0%) | 0 (0.0%) |
| 75 Years and over | 0 (0.0%) | 0 (0.0%) |
Technology Access in Montreat
Computing Device Access in Montreat
| Device Type | # Households | % Households |
| Desktop or Laptop | 18 | 100.0% |
| Smartphone | 18 | 100.0% |
| Tablet | 0 | 0.0% |
| No Computing Device | 0 | 0.0% |
| Total | 18 | 100.0% |
Internet Access in Montreat
| Internet Type | # Households | % Households |
| Dial-Up Internet | 0 | 0.0% |
| Broadband Home | 18 | 100.0% |
| Cellular Data Only | 0 | 0.0% |
| Satellite Internet | 0 | 0.0% |
| No Internet | 0 | 0.0% |
| Total | 18 | 100.0% |
Montreat Summary
Montreat, NC is a small town located in the Blue Ridge Mountains of western North Carolina. It is situated in the Swannanoa Valley, just east of Asheville. The town was founded in 1897 by the Rev. John Collins, a Presbyterian minister, and is named after the French word for “mountain retreat.” The town has a population of approximately 1,000 people and is known for its picturesque mountain views, outdoor recreation, and small-town charm.
History
Montreat was founded in 1897 by the Rev. John Collins, a Presbyterian minister. He purchased the land from the local Cherokee Indians and named the town after the French word for “mountain retreat.” The town was originally a summer retreat for Presbyterians, and the first church was built in 1898. The town grew slowly over the years, and by the 1950s, it had become a popular tourist destination.
In the 1960s, Montreat College was founded, and the town began to attract more people. The college has since grown to become a four-year liberal arts college. In the 1970s, the town was incorporated, and the population began to grow. Today, Montreat is a popular tourist destination, and the town is known for its picturesque mountain views, outdoor recreation, and small-town charm.
Geography
Montreat is located in the Blue Ridge Mountains of western North Carolina. It is situated in the Swannanoa Valley, just east of Asheville. The town is surrounded by the Pisgah National Forest and is close to the Great Smoky Mountains National Park. The town is located at an elevation of 2,400 feet and has a humid subtropical climate.
Economy
Montreat’s economy is largely based on tourism. The town is a popular destination for outdoor recreation, and it is home to several resorts and hotels. The town is also home to Montreat College, which provides jobs for many of the town’s residents. In addition, the town is home to several small businesses, including restaurants, shops, and galleries.
Demographics
As of the 2010 census, the population of Montreat was 1,092. The racial makeup of the town was 95.3% White, 1.2% African American, 0.7% Native American, 0.7% Asian, 0.2% Pacific Islander, and 1.9% from other races. The median household income was $41,250, and the median family income was $50,000. The per capita income was $20,945.
Conclusion
Montreat, NC is a small town located in the Blue Ridge Mountains of western North Carolina. It is known for its picturesque mountain views, outdoor recreation, and small-town charm. The town has a population of approximately 1,000 people and is largely supported by tourism. The town is home to Montreat College and several small businesses. The town has a diverse population, with a median household income of $41,250 and a median family income of $50,000.
Common Questions
What is Per Capita Income in Montreat?
Per Capita income in Montreat is $10,937.
What is the Total Population of Montreat?
Total Population of Montreat is 442.
What is the Total Male Population of Montreat?
Total Male Population of Montreat is 322.
What is the Total Female Population of Montreat?
Total Female Population of Montreat is 120.
What is the Ratio of Males per 100 Females in Montreat?
There are 268.33 Males per 100 Females in Montreat.
What is the Ratio of Females per 100 Males in Montreat?
There are 37.27 Females per 100 Males in Montreat.
What is the Median Population Age in Montreat?
Median Population Age in Montreat is 20.5 Years.
What is the Average Family Size in Montreat
Average Family Size in Montreat is 5.7 People.
What is the Average Household Size in Montreat
Average Household Size in Montreat is 5.7 People.
How Large is the Labor Force in Montreat?
There are 315 People in the Labor Forcein in Montreat.
What is the Percentage of People in the Labor Force in Montreat?
71.3% of People are in the Labor Force in Montreat.
What is the Unemployment Rate in Montreat?
Unemployment Rate in Montreat is 13.0%.