Stedman, NC Map & Demographics
Stedman Map
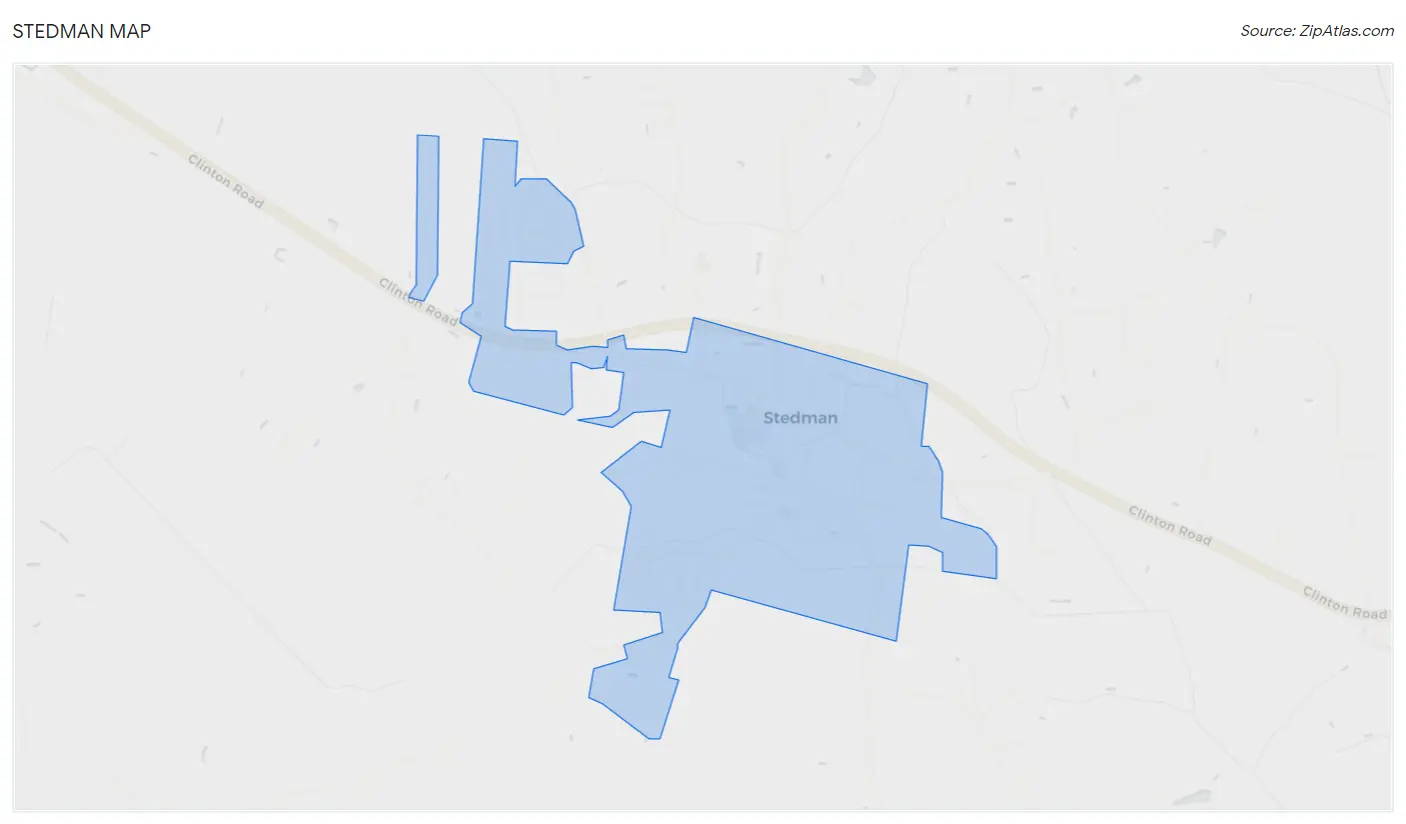
Stedman Overview
$37,229
PER CAPITA INCOME
$100,076
AVG FAMILY INCOME
$98,615
AVG HOUSEHOLD INCOME
26.8%
WAGE / INCOME GAP [ % ]
73.2¢/ $1
WAGE / INCOME GAP [ $ ]
0.31
INEQUALITY / GINI INDEX
1,479
TOTAL POPULATION
801
MALE POPULATION
678
FEMALE POPULATION
118.14
MALES / 100 FEMALES
84.64
FEMALES / 100 MALES
35.4
MEDIAN AGE
3.3
AVG FAMILY SIZE
2.8
AVG HOUSEHOLD SIZE
792
LABOR FORCE [ PEOPLE ]
67.4%
PERCENT IN LABOR FORCE
1.9%
UNEMPLOYMENT RATE
Stedman Zip Codes
Stedman Area Codes
Income in Stedman
Income Overview in Stedman
Per Capita Income in Stedman is $37,229, while median incomes of families and households are $100,076 and $98,615 respectively.
| Characteristic | Number | Measure |
| Per Capita Income | 1,479 | $37,229 |
| Median Family Income | 392 | $100,076 |
| Mean Family Income | 392 | $111,805 |
| Median Household Income | 537 | $98,615 |
| Mean Household Income | 537 | $101,650 |
| Income Deficit | 392 | $0 |
| Wage / Income Gap (%) | 1,479 | 26.75% |
| Wage / Income Gap ($) | 1,479 | 73.25¢ per $1 |
| Gini / Inequality Index | 1,479 | 0.31 |
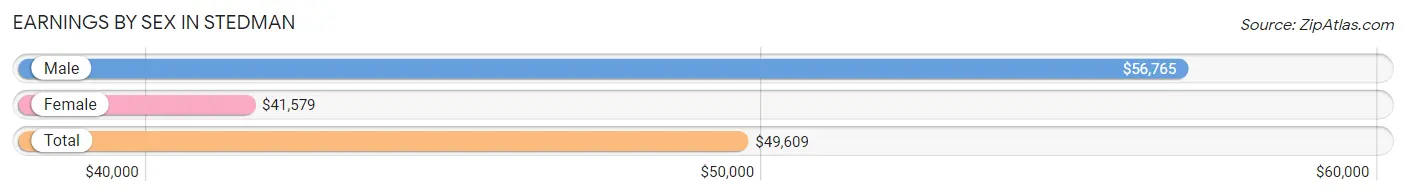
Earnings by Sex in Stedman
Average Earnings in Stedman are $49,609, $56,765 for men and $41,579 for women, a difference of 26.8%.
| Sex | Number | Average Earnings |
| Male | 442 (54.6%) | $56,765 |
| Female | 368 (45.4%) | $41,579 |
| Total | 810 (100.0%) | $49,609 |
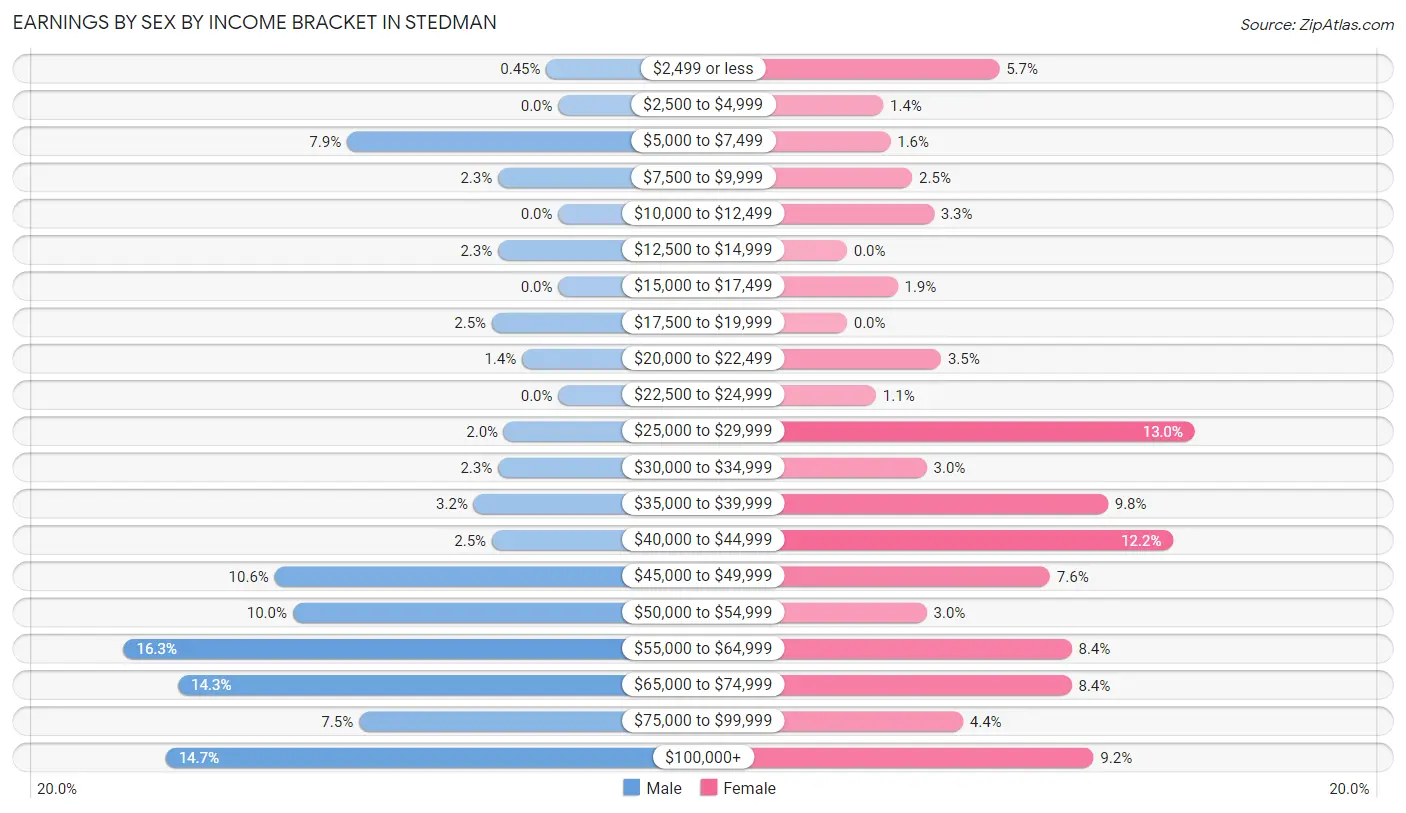
Earnings by Sex by Income Bracket in Stedman
The most common earnings brackets in Stedman are $55,000 to $64,999 for men (72 | 16.3%) and $25,000 to $29,999 for women (48 | 13.0%).
| Income | Male | Female |
| $2,499 or less | 2 (0.4%) | 21 (5.7%) |
| $2,500 to $4,999 | 0 (0.0%) | 5 (1.4%) |
| $5,000 to $7,499 | 35 (7.9%) | 6 (1.6%) |
| $7,500 to $9,999 | 10 (2.3%) | 9 (2.5%) |
| $10,000 to $12,499 | 0 (0.0%) | 12 (3.3%) |
| $12,500 to $14,999 | 10 (2.3%) | 0 (0.0%) |
| $15,000 to $17,499 | 0 (0.0%) | 7 (1.9%) |
| $17,500 to $19,999 | 11 (2.5%) | 0 (0.0%) |
| $20,000 to $22,499 | 6 (1.4%) | 13 (3.5%) |
| $22,500 to $24,999 | 0 (0.0%) | 4 (1.1%) |
| $25,000 to $29,999 | 9 (2.0%) | 48 (13.0%) |
| $30,000 to $34,999 | 10 (2.3%) | 11 (3.0%) |
| $35,000 to $39,999 | 14 (3.2%) | 36 (9.8%) |
| $40,000 to $44,999 | 11 (2.5%) | 45 (12.2%) |
| $45,000 to $49,999 | 47 (10.6%) | 28 (7.6%) |
| $50,000 to $54,999 | 44 (10.0%) | 11 (3.0%) |
| $55,000 to $64,999 | 72 (16.3%) | 31 (8.4%) |
| $65,000 to $74,999 | 63 (14.2%) | 31 (8.4%) |
| $75,000 to $99,999 | 33 (7.5%) | 16 (4.3%) |
| $100,000+ | 65 (14.7%) | 34 (9.2%) |
| Total | 442 (100.0%) | 368 (100.0%) |
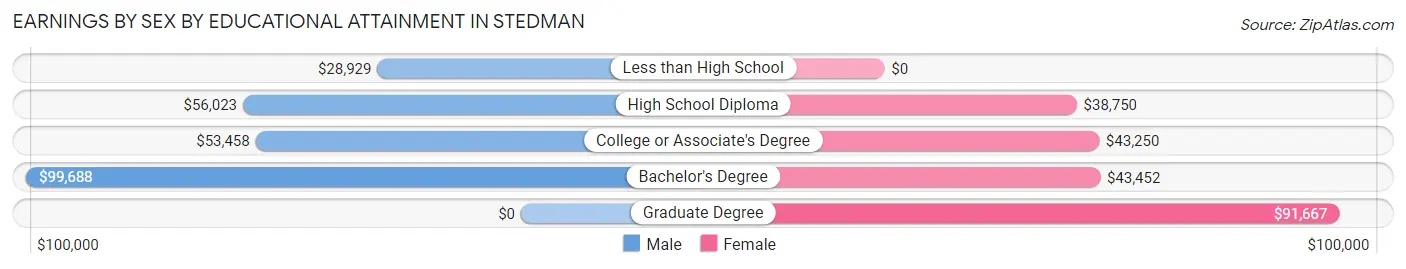
Earnings by Sex by Educational Attainment in Stedman
Average earnings in Stedman are $60,223 for men and $45,563 for women, a difference of 24.3%. Men with an educational attainment of bachelor's degree enjoy the highest average annual earnings of $99,688, while those with less than high school education earn the least with $28,929. Women with an educational attainment of graduate degree earn the most with the average annual earnings of $91,667, while those with high school diploma education have the smallest earnings of $38,750.
| Educational Attainment | Male Income | Female Income |
| Less than High School | $28,929 | $0 |
| High School Diploma | $56,023 | $38,750 |
| College or Associate's Degree | $53,458 | $43,250 |
| Bachelor's Degree | $99,688 | $43,452 |
| Graduate Degree | - | - |
| Total | $60,223 | $45,563 |
Family Income in Stedman
Family Income Brackets in Stedman
According to the Stedman family income data, there are 121 families falling into the $100,000 to $149,999 income range, which is the most common income bracket and makes up 30.9% of all families.
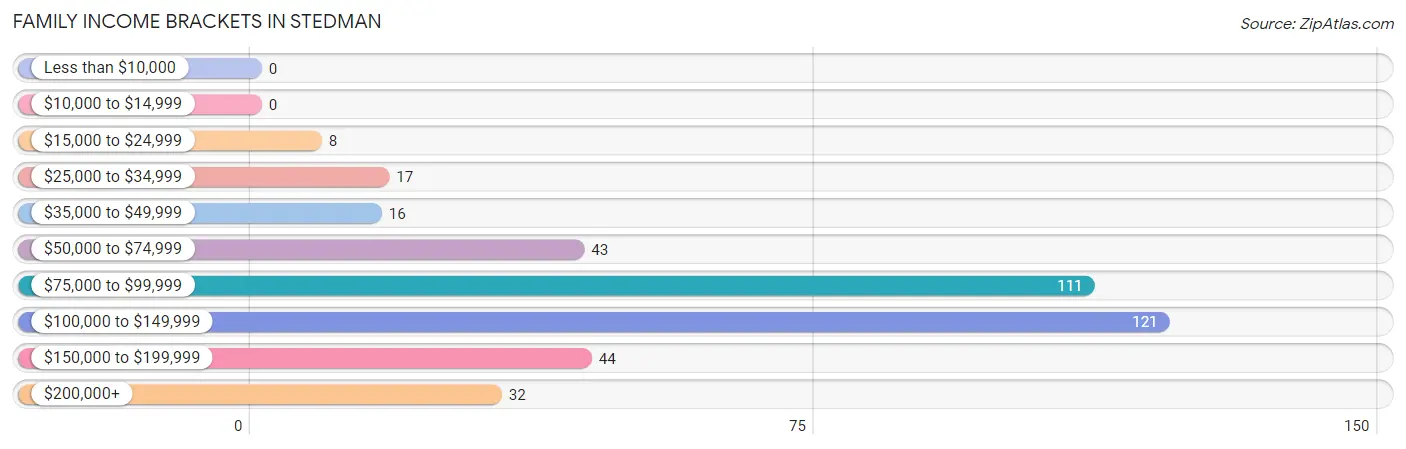
| Income Bracket | # Families | % Families |
| Less than $10,000 | 0 | 0.0% |
| $10,000 to $14,999 | 0 | 0.0% |
| $15,000 to $24,999 | 8 | 2.0% |
| $25,000 to $34,999 | 17 | 4.3% |
| $35,000 to $49,999 | 16 | 4.1% |
| $50,000 to $74,999 | 43 | 11.0% |
| $75,000 to $99,999 | 111 | 28.3% |
| $100,000 to $149,999 | 121 | 30.9% |
| $150,000 to $199,999 | 44 | 11.2% |
| $200,000+ | 32 | 8.2% |
Family Income by Famaliy Size in Stedman
5-person families (45 | 11.5%) account for the highest median family income in Stedman with $175,156 per family, while 2-person families (175 | 44.6%) have the highest median income of $49,425 per family member.
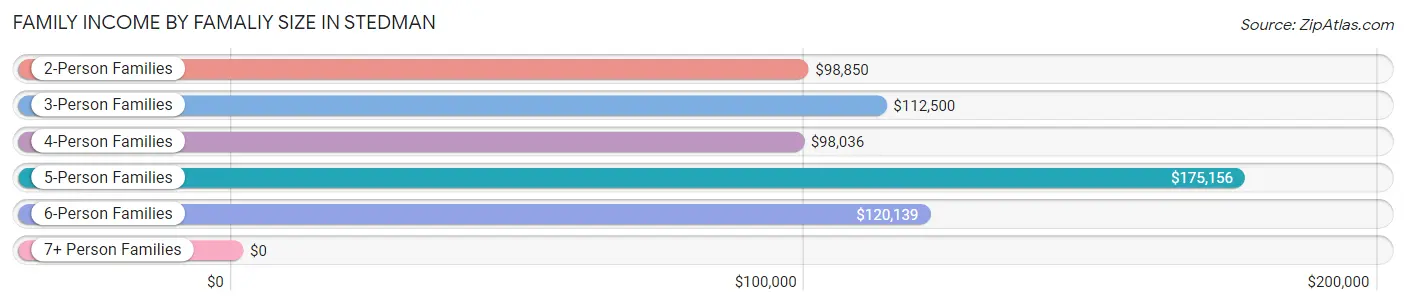
| Income Bracket | # Families | Median Income |
| 2-Person Families | 175 (44.6%) | $98,850 |
| 3-Person Families | 92 (23.5%) | $112,500 |
| 4-Person Families | 63 (16.1%) | $98,036 |
| 5-Person Families | 45 (11.5%) | $175,156 |
| 6-Person Families | 17 (4.3%) | $120,139 |
| 7+ Person Families | 0 (0.0%) | $0 |
| Total | 392 (100.0%) | $100,076 |
Family Income by Number of Earners in Stedman
The median family income in Stedman is $100,076, with families comprising 3+ earners (63) having the highest median family income of $127,679, while families with no earners (29) have the lowest median family income of $40,417, accounting for 16.1% and 7.4% of families, respectively.
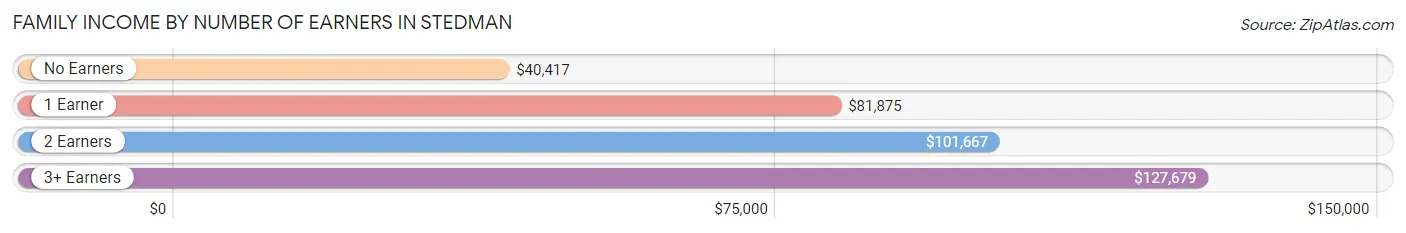
| Number of Earners | # Families | Median Income |
| No Earners | 29 (7.4%) | $40,417 |
| 1 Earner | 124 (31.6%) | $81,875 |
| 2 Earners | 176 (44.9%) | $101,667 |
| 3+ Earners | 63 (16.1%) | $127,679 |
| Total | 392 (100.0%) | $100,076 |
Household Income in Stedman
Household Income Brackets in Stedman
With 165 households falling in the category, the $100,000 to $149,999 income range is the most frequent in Stedman, accounting for 30.7% of all households. In contrast, only 11 households (2.1%) fall into the less than $10,000 income bracket, making it the least populous group.
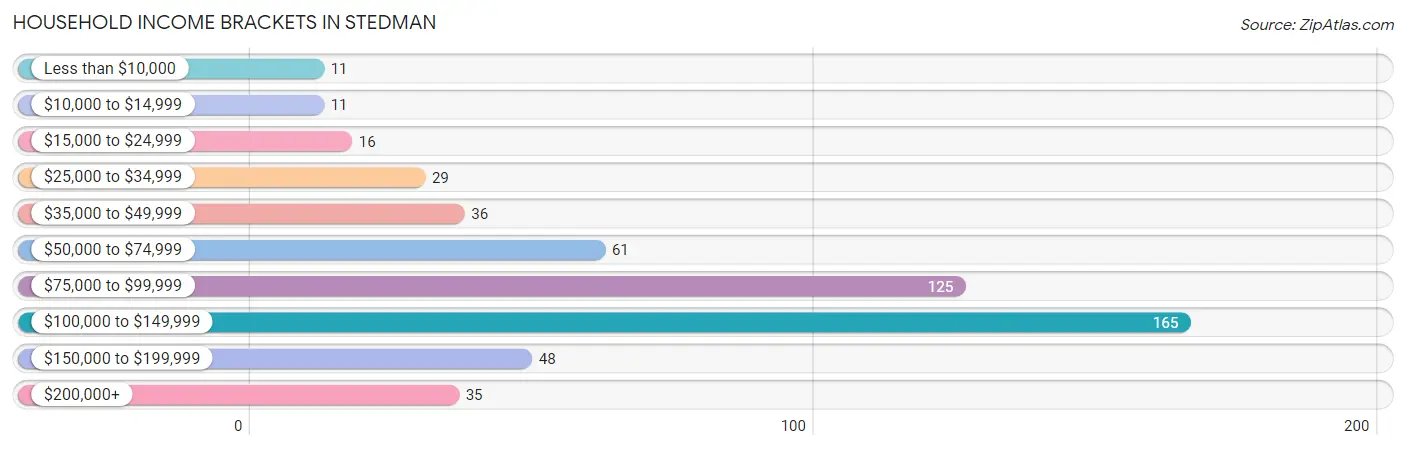
| Income Bracket | # Households | % Households |
| Less than $10,000 | 11 | 2.0% |
| $10,000 to $14,999 | 11 | 2.0% |
| $15,000 to $24,999 | 16 | 3.0% |
| $25,000 to $34,999 | 29 | 5.4% |
| $35,000 to $49,999 | 36 | 6.7% |
| $50,000 to $74,999 | 61 | 11.4% |
| $75,000 to $99,999 | 125 | 23.3% |
| $100,000 to $149,999 | 165 | 30.7% |
| $150,000 to $199,999 | 48 | 8.9% |
| $200,000+ | 35 | 6.5% |
Household Income by Householder Age in Stedman
The median household income in Stedman is $98,615, with the highest median household income of $127,560 found in the 45 to 64 years age bracket for the primary householder. A total of 167 households (31.1%) fall into this category. Meanwhile, the 15 to 24 years age bracket for the primary householder has the lowest median household income of $0, with 6 households (1.1%) in this group.
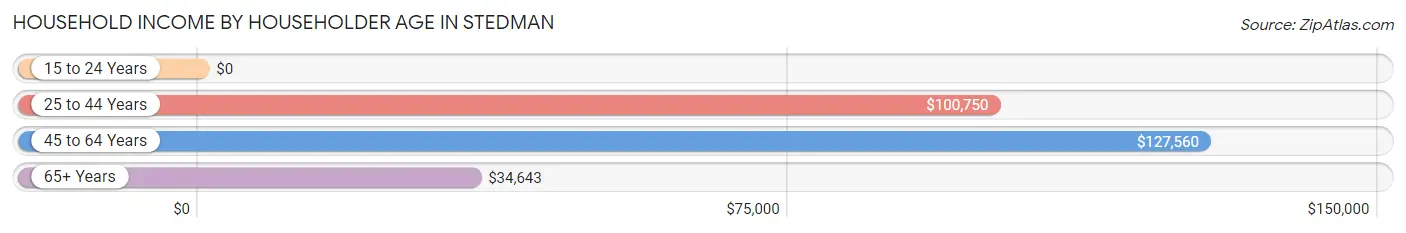
| Income Bracket | # Households | Median Income |
| 15 to 24 Years | 6 (1.1%) | $0 |
| 25 to 44 Years | 272 (50.6%) | $100,750 |
| 45 to 64 Years | 167 (31.1%) | $127,560 |
| 65+ Years | 92 (17.1%) | $34,643 |
| Total | 537 (100.0%) | $98,615 |
Poverty in Stedman
Income Below Poverty by Sex and Age in Stedman
With 3.7% poverty level for males and 4.0% for females among the residents of Stedman, 75 year old and over males and 75 year old and over females are the most vulnerable to poverty, with 4 males (20.0%) and 11 females (21.1%) in their respective age groups living below the poverty level.
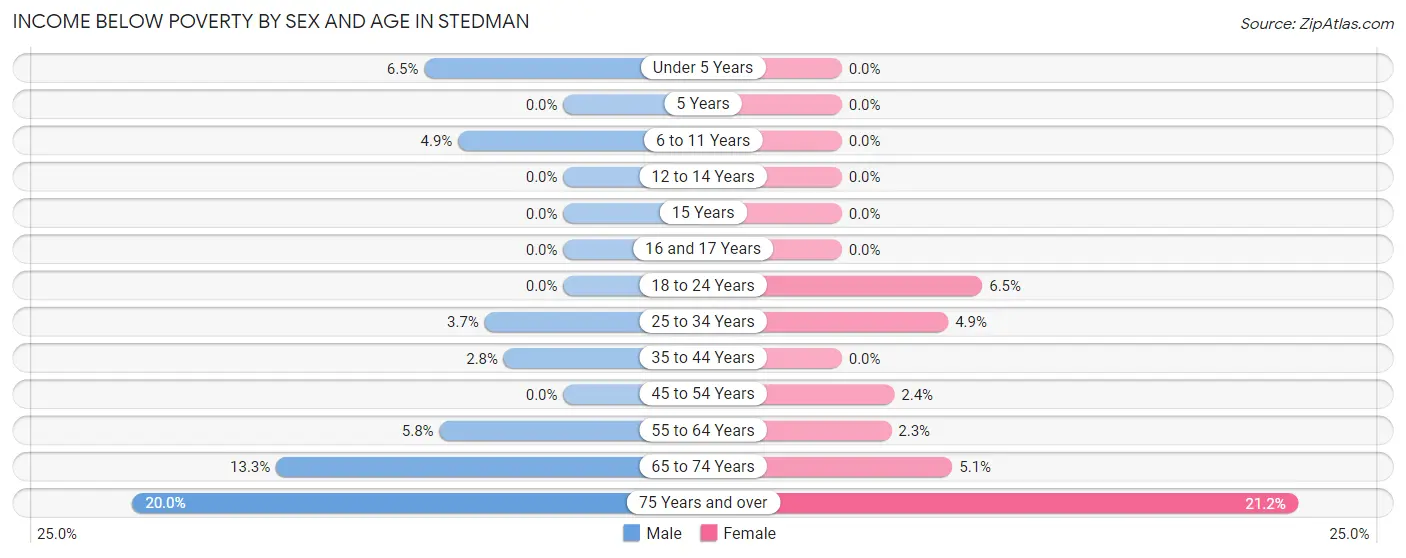
| Age Bracket | Male | Female |
| Under 5 Years | 4 (6.5%) | 0 (0.0%) |
| 5 Years | 0 (0.0%) | 0 (0.0%) |
| 6 to 11 Years | 4 (4.9%) | 0 (0.0%) |
| 12 to 14 Years | 0 (0.0%) | 0 (0.0%) |
| 15 Years | 0 (0.0%) | 0 (0.0%) |
| 16 and 17 Years | 0 (0.0%) | 0 (0.0%) |
| 18 to 24 Years | 0 (0.0%) | 6 (6.5%) |
| 25 to 34 Years | 5 (3.6%) | 4 (4.9%) |
| 35 to 44 Years | 4 (2.8%) | 0 (0.0%) |
| 45 to 54 Years | 0 (0.0%) | 2 (2.4%) |
| 55 to 64 Years | 5 (5.8%) | 2 (2.3%) |
| 65 to 74 Years | 4 (13.3%) | 2 (5.1%) |
| 75 Years and over | 4 (20.0%) | 11 (21.1%) |
| Total | 30 (3.7%) | 27 (4.0%) |
Income Above Poverty by Sex and Age in Stedman
According to the poverty statistics in Stedman, males aged 12 to 14 years and females aged under 5 years are the age groups that are most secure financially, with 100.0% of males and 100.0% of females in these age groups living above the poverty line.
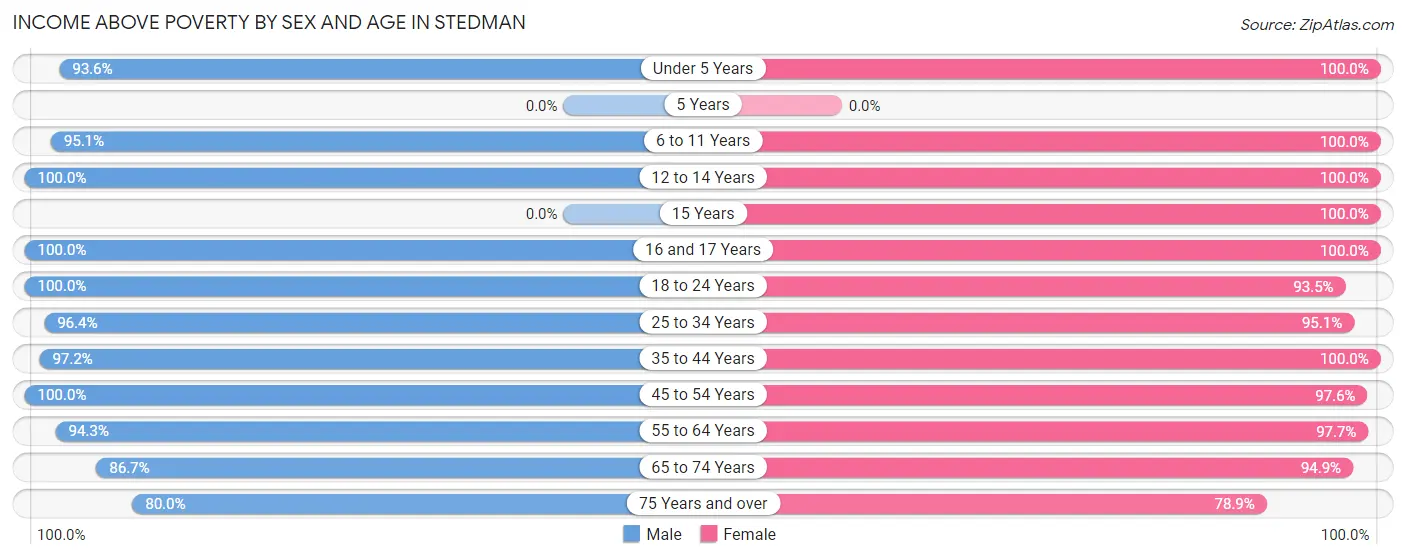
| Age Bracket | Male | Female |
| Under 5 Years | 58 (93.5%) | 19 (100.0%) |
| 5 Years | 0 (0.0%) | 0 (0.0%) |
| 6 to 11 Years | 78 (95.1%) | 54 (100.0%) |
| 12 to 14 Years | 55 (100.0%) | 26 (100.0%) |
| 15 Years | 0 (0.0%) | 6 (100.0%) |
| 16 and 17 Years | 37 (100.0%) | 16 (100.0%) |
| 18 to 24 Years | 63 (100.0%) | 86 (93.5%) |
| 25 to 34 Years | 132 (96.4%) | 77 (95.1%) |
| 35 to 44 Years | 141 (97.2%) | 124 (100.0%) |
| 45 to 54 Years | 83 (100.0%) | 80 (97.6%) |
| 55 to 64 Years | 82 (94.3%) | 85 (97.7%) |
| 65 to 74 Years | 26 (86.7%) | 37 (94.9%) |
| 75 Years and over | 16 (80.0%) | 41 (78.8%) |
| Total | 771 (96.3%) | 651 (96.0%) |
Income Below Poverty Among Married-Couple Families in Stedman
The poverty statistics for married-couple families in Stedman show that 2.3% or 8 of the total 348 families live below the poverty line. Families with 1 or 2 children have the highest poverty rate of 4.0%, comprising of 4 families. On the other hand, families with 3 or 4 children have the lowest poverty rate of 0.0%, which includes 0 families.
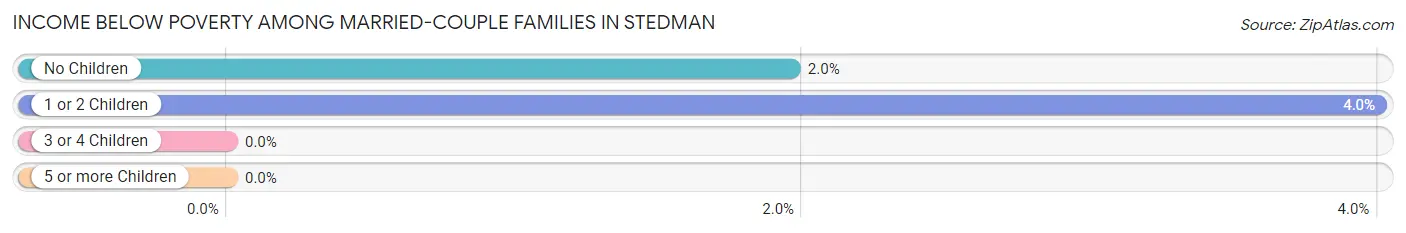
| Children | Above Poverty | Below Poverty |
| No Children | 200 (98.0%) | 4 (2.0%) |
| 1 or 2 Children | 96 (96.0%) | 4 (4.0%) |
| 3 or 4 Children | 44 (100.0%) | 0 (0.0%) |
| 5 or more Children | 0 (0.0%) | 0 (0.0%) |
| Total | 340 (97.7%) | 8 (2.3%) |
Income Below Poverty Among Single-Parent Households in Stedman
| Children | Single Father | Single Mother |
| No Children | 0 (0.0%) | 0 (0.0%) |
| 1 or 2 Children | 0 (0.0%) | 0 (0.0%) |
| 3 or 4 Children | 0 (0.0%) | 0 (0.0%) |
| 5 or more Children | 0 (0.0%) | 0 (0.0%) |
| Total | 0 (0.0%) | 0 (0.0%) |
Income Below Poverty Among Married-Couple vs Single-Parent Households in Stedman
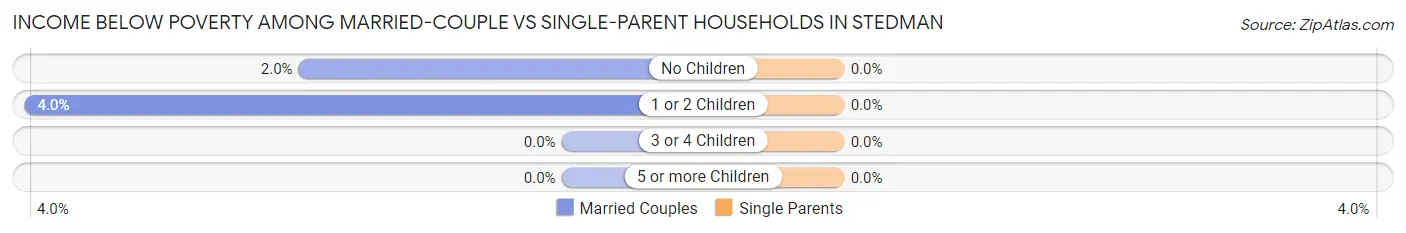
| Children | Married-Couple Families | Single-Parent Households |
| No Children | 4 (2.0%) | 0 (0.0%) |
| 1 or 2 Children | 4 (4.0%) | 0 (0.0%) |
| 3 or 4 Children | 0 (0.0%) | 0 (0.0%) |
| 5 or more Children | 0 (0.0%) | 0 (0.0%) |
| Total | 8 (2.3%) | 0 (0.0%) |
Race in Stedman
The most populous races in Stedman are White / Caucasian (1,085 | 73.4%), Black / African American (276 | 18.7%), and Two or more Races (109 | 7.4%).
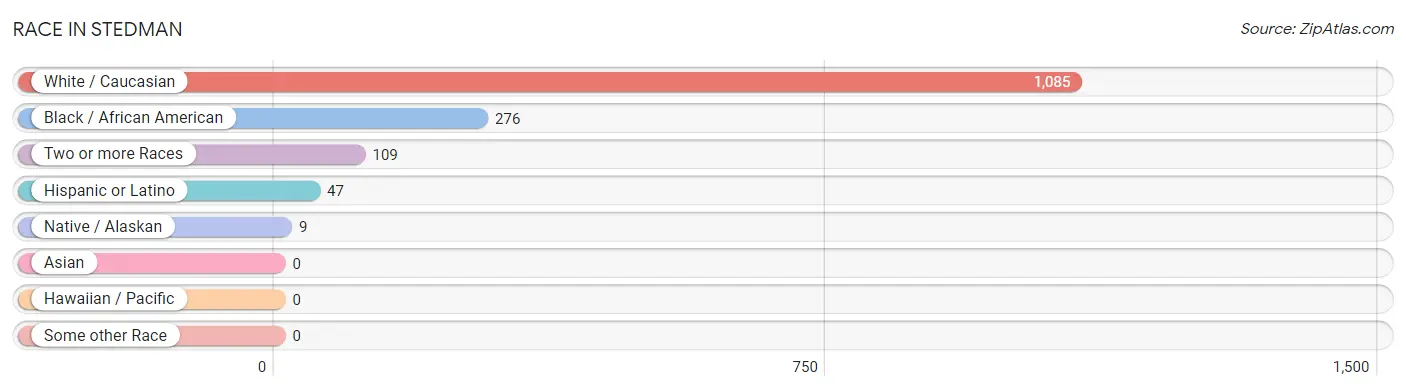
| Race | # Population | % Population |
| Asian | 0 | 0.0% |
| Black / African American | 276 | 18.7% |
| Hawaiian / Pacific | 0 | 0.0% |
| Hispanic or Latino | 47 | 3.2% |
| Native / Alaskan | 9 | 0.6% |
| White / Caucasian | 1,085 | 73.4% |
| Two or more Races | 109 | 7.4% |
| Some other Race | 0 | 0.0% |
| Total | 1,479 | 100.0% |
Ancestry in Stedman
The most populous ancestries reported in Stedman are English (228 | 15.4%), Irish (161 | 10.9%), Scottish (148 | 10.0%), American (141 | 9.5%), and German (114 | 7.7%), together accounting for 53.6% of all Stedman residents.
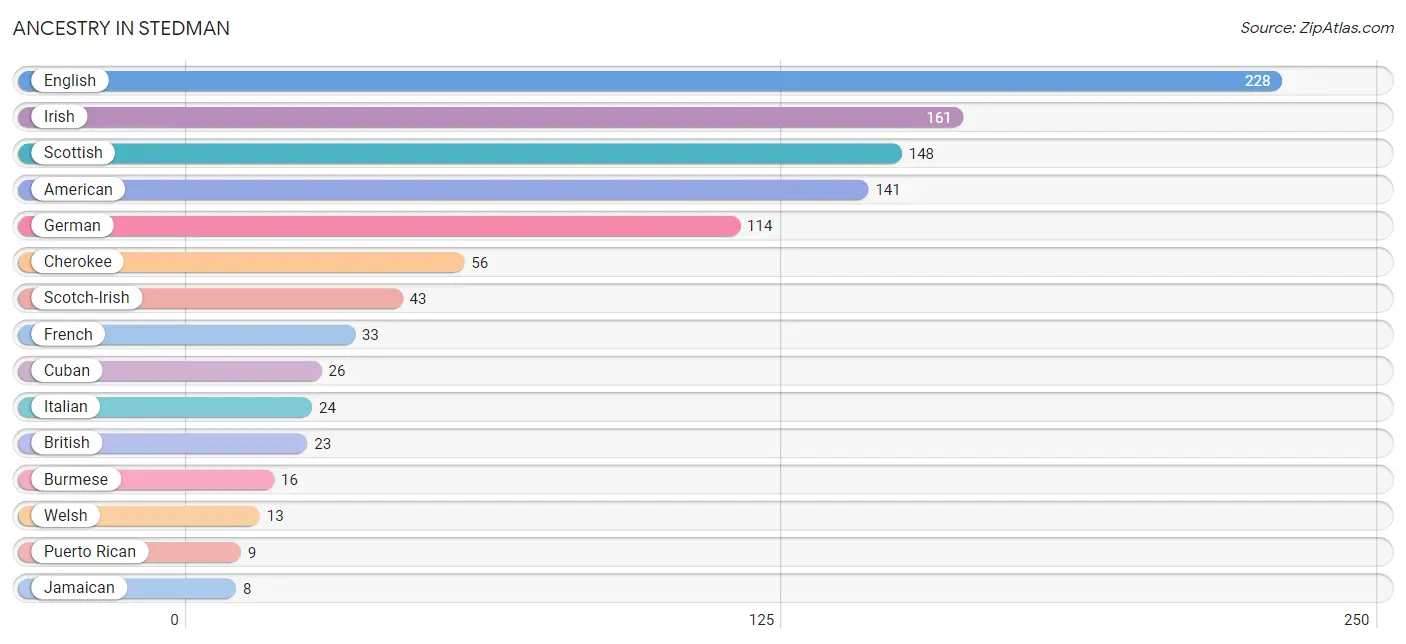
| Ancestry | # Population | % Population |
| Aleut | 2 | 0.1% |
| American | 141 | 9.5% |
| British | 23 | 1.6% |
| Burmese | 16 | 1.1% |
| Canadian | 1 | 0.1% |
| Central American | 4 | 0.3% |
| Cherokee | 56 | 3.8% |
| Cuban | 26 | 1.8% |
| Dominican | 5 | 0.3% |
| Eastern European | 7 | 0.5% |
| English | 228 | 15.4% |
| European | 6 | 0.4% |
| French | 33 | 2.2% |
| French Canadian | 3 | 0.2% |
| German | 114 | 7.7% |
| Honduran | 4 | 0.3% |
| Irish | 161 | 10.9% |
| Italian | 24 | 1.6% |
| Jamaican | 8 | 0.5% |
| Korean | 4 | 0.3% |
| Mexican | 3 | 0.2% |
| Polish | 6 | 0.4% |
| Puerto Rican | 9 | 0.6% |
| Romanian | 3 | 0.2% |
| Scotch-Irish | 43 | 2.9% |
| Scottish | 148 | 10.0% |
| Welsh | 13 | 0.9% | View All 27 Rows |
Immigrants in Stedman
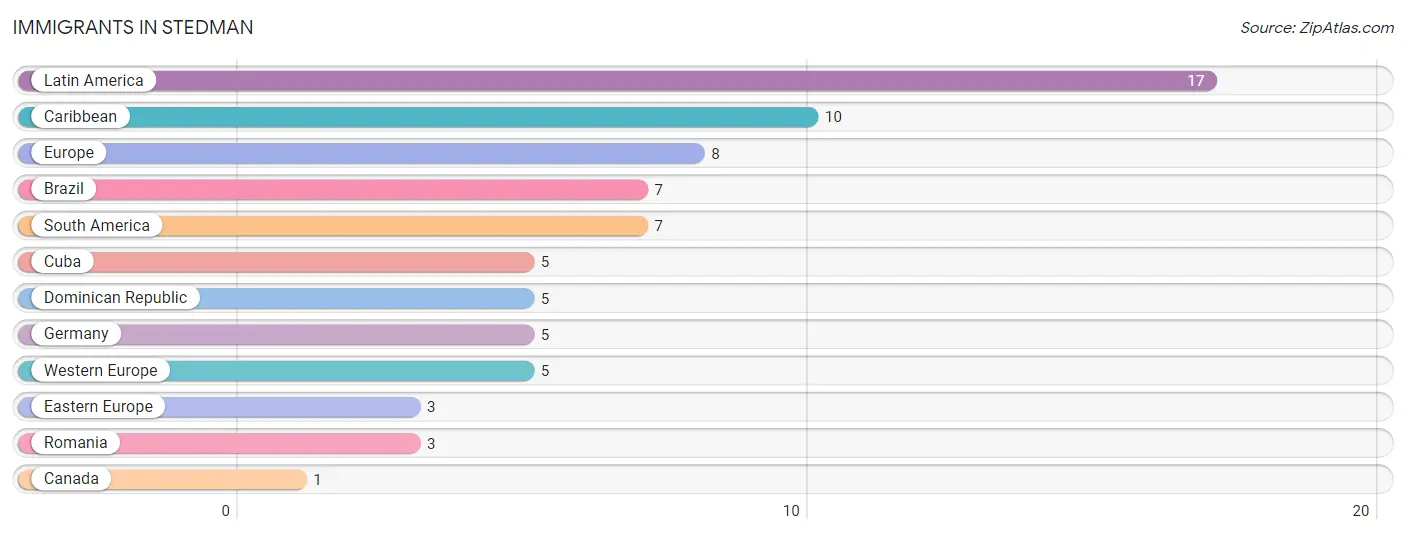
The most numerous immigrant groups reported in Stedman came from Latin America (17 | 1.1%), Caribbean (10 | 0.7%), Europe (8 | 0.5%), Brazil (7 | 0.5%), and South America (7 | 0.5%), together accounting for 3.3% of all Stedman residents.
| Immigration Origin | # Population | % Population |
| Brazil | 7 | 0.5% |
| Canada | 1 | 0.1% |
| Caribbean | 10 | 0.7% |
| Cuba | 5 | 0.3% |
| Dominican Republic | 5 | 0.3% |
| Eastern Europe | 3 | 0.2% |
| Europe | 8 | 0.5% |
| Germany | 5 | 0.3% |
| Latin America | 17 | 1.1% |
| Romania | 3 | 0.2% |
| South America | 7 | 0.5% |
| Western Europe | 5 | 0.3% | View All 12 Rows |
Sex and Age in Stedman
Sex and Age in Stedman
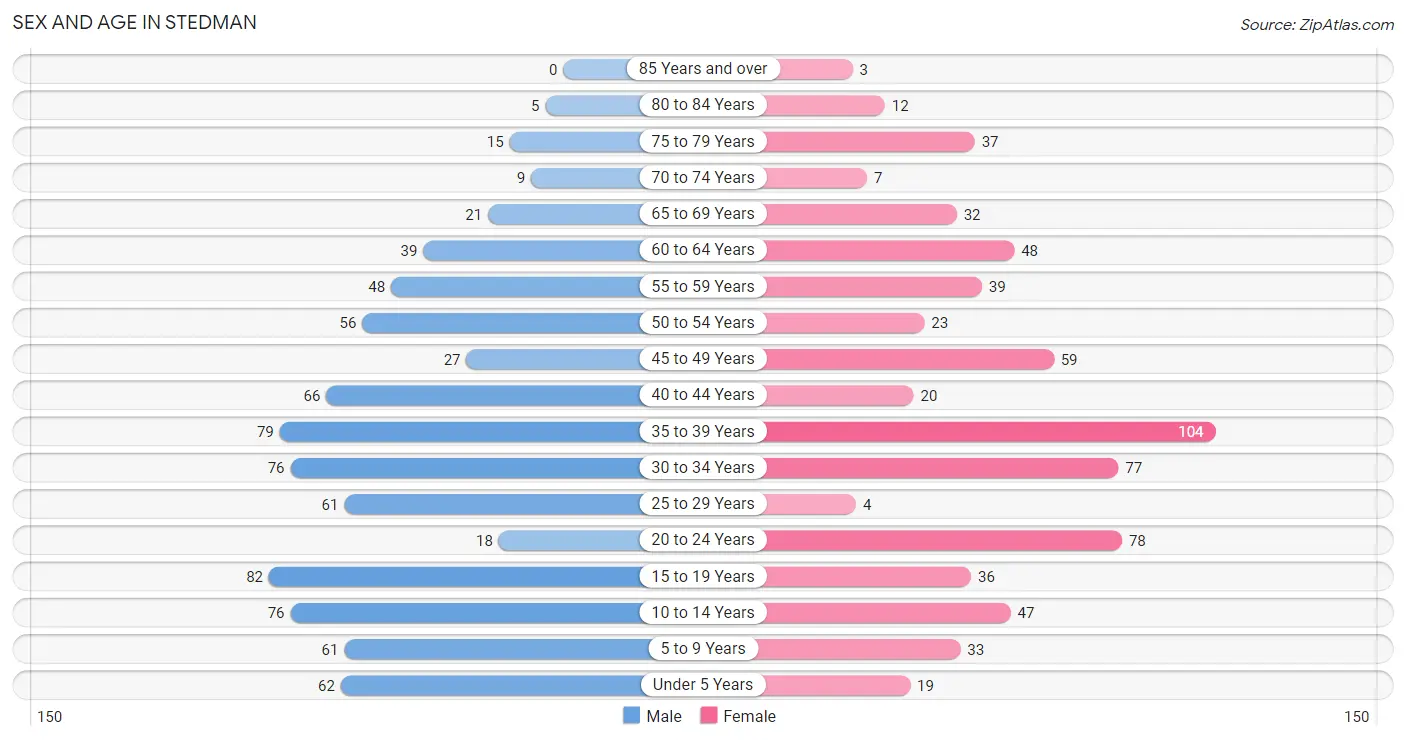
The most populous age groups in Stedman are 15 to 19 Years (82 | 10.2%) for men and 35 to 39 Years (104 | 15.3%) for women.
| Age Bracket | Male | Female |
| Under 5 Years | 62 (7.7%) | 19 (2.8%) |
| 5 to 9 Years | 61 (7.6%) | 33 (4.9%) |
| 10 to 14 Years | 76 (9.5%) | 47 (6.9%) |
| 15 to 19 Years | 82 (10.2%) | 36 (5.3%) |
| 20 to 24 Years | 18 (2.2%) | 78 (11.5%) |
| 25 to 29 Years | 61 (7.6%) | 4 (0.6%) |
| 30 to 34 Years | 76 (9.5%) | 77 (11.4%) |
| 35 to 39 Years | 79 (9.9%) | 104 (15.3%) |
| 40 to 44 Years | 66 (8.2%) | 20 (2.9%) |
| 45 to 49 Years | 27 (3.4%) | 59 (8.7%) |
| 50 to 54 Years | 56 (7.0%) | 23 (3.4%) |
| 55 to 59 Years | 48 (6.0%) | 39 (5.8%) |
| 60 to 64 Years | 39 (4.9%) | 48 (7.1%) |
| 65 to 69 Years | 21 (2.6%) | 32 (4.7%) |
| 70 to 74 Years | 9 (1.1%) | 7 (1.0%) |
| 75 to 79 Years | 15 (1.9%) | 37 (5.5%) |
| 80 to 84 Years | 5 (0.6%) | 12 (1.8%) |
| 85 Years and over | 0 (0.0%) | 3 (0.4%) |
| Total | 801 (100.0%) | 678 (100.0%) |
Families and Households in Stedman
Median Family Size in Stedman
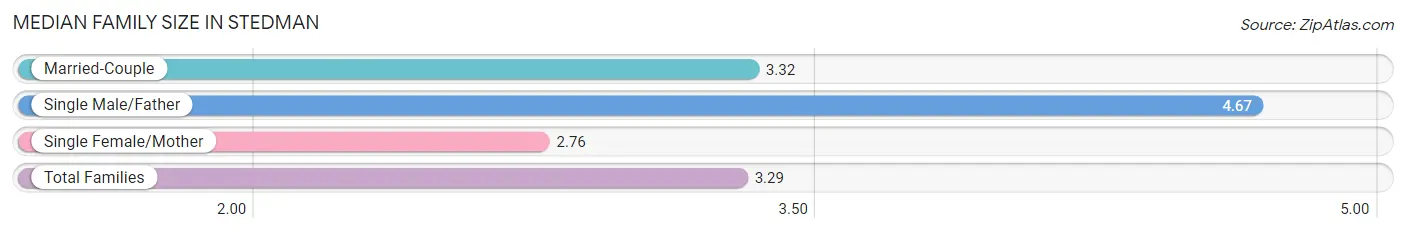
The median family size in Stedman is 3.29 persons per family, with single male/father families (6 | 1.5%) accounting for the largest median family size of 4.67 persons per family. On the other hand, single female/mother families (38 | 9.7%) represent the smallest median family size with 2.76 persons per family.
| Family Type | # Families | Family Size |
| Married-Couple | 348 (88.8%) | 3.32 |
| Single Male/Father | 6 (1.5%) | 4.67 |
| Single Female/Mother | 38 (9.7%) | 2.76 |
| Total Families | 392 (100.0%) | 3.29 |
Median Household Size in Stedman
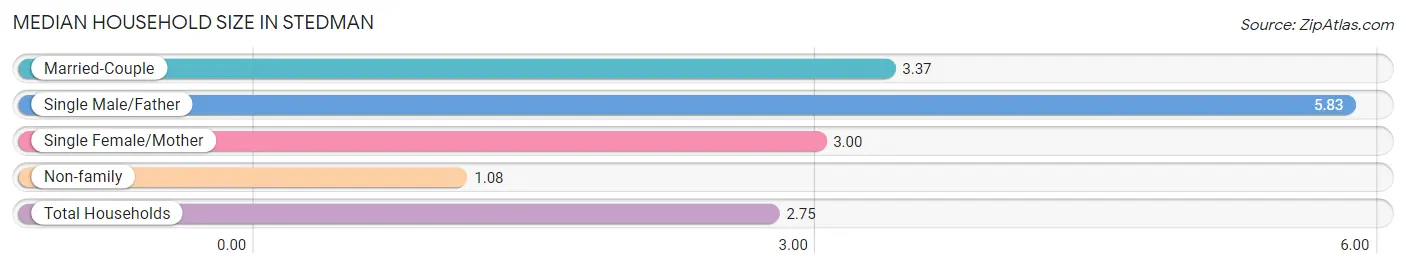
The median household size in Stedman is 2.75 persons per household, with single male/father households (6 | 1.1%) accounting for the largest median household size of 5.83 persons per household. non-family households (145 | 27.0%) represent the smallest median household size with 1.08 persons per household.
| Household Type | # Households | Household Size |
| Married-Couple | 348 (64.8%) | 3.37 |
| Single Male/Father | 6 (1.1%) | 5.83 |
| Single Female/Mother | 38 (7.1%) | 3.00 |
| Non-family | 145 (27.0%) | 1.08 |
| Total Households | 537 (100.0%) | 2.75 |
Household Size by Marriage Status in Stedman
Out of a total of 537 households in Stedman, 392 (73.0%) are family households, while 145 (27.0%) are nonfamily households. The most numerous type of family households are 2-person households, comprising 162, and the most common type of nonfamily households are 1-person households, comprising 137.
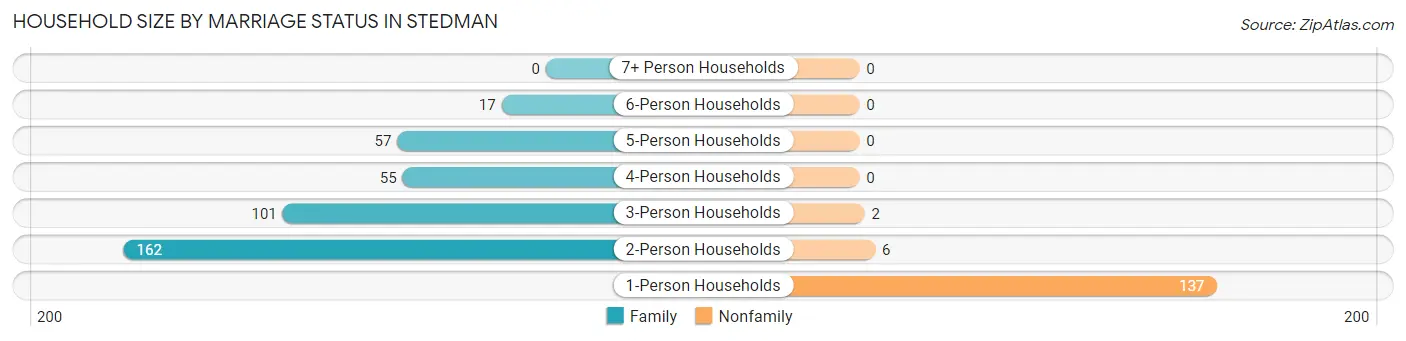
| Household Size | Family Households | Nonfamily Households |
| 1-Person Households | - | 137 (25.5%) |
| 2-Person Households | 162 (30.2%) | 6 (1.1%) |
| 3-Person Households | 101 (18.8%) | 2 (0.4%) |
| 4-Person Households | 55 (10.2%) | 0 (0.0%) |
| 5-Person Households | 57 (10.6%) | 0 (0.0%) |
| 6-Person Households | 17 (3.2%) | 0 (0.0%) |
| 7+ Person Households | 0 (0.0%) | 0 (0.0%) |
| Total | 392 (73.0%) | 145 (27.0%) |
Female Fertility in Stedman
Fertility by Age in Stedman
Average fertility rate in Stedman is 10.0 births per 1,000 women. Women in the age bracket of 20 to 34 years have the highest fertility rate with 25.0 births per 1,000 women. Women in the age bracket of 20 to 34 years acount for 100.0% of all women with births.
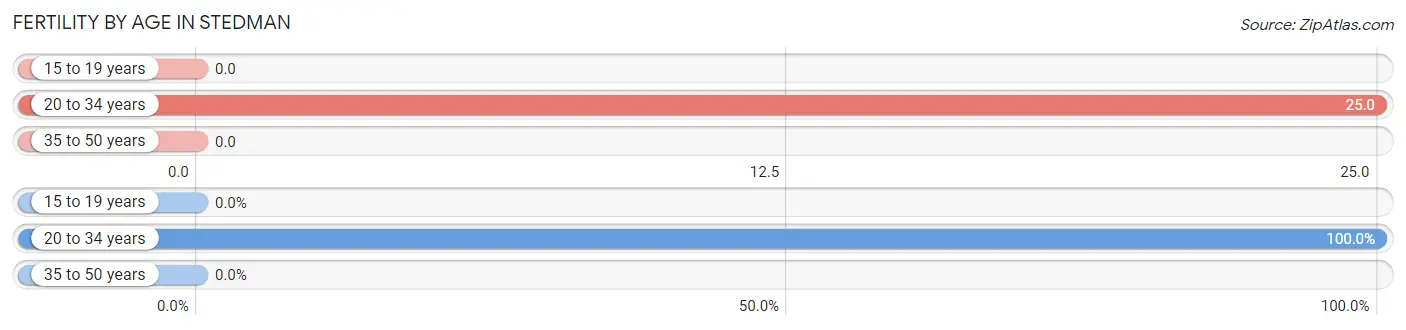
| Age Bracket | Women with Births | Births / 1,000 Women |
| 15 to 19 years | 0 (0.0%) | 0.0 |
| 20 to 34 years | 4 (100.0%) | 25.0 |
| 35 to 50 years | 0 (0.0%) | 0.0 |
| Total | 4 (100.0%) | 10.0 |
Fertility by Age by Marriage Status in Stedman
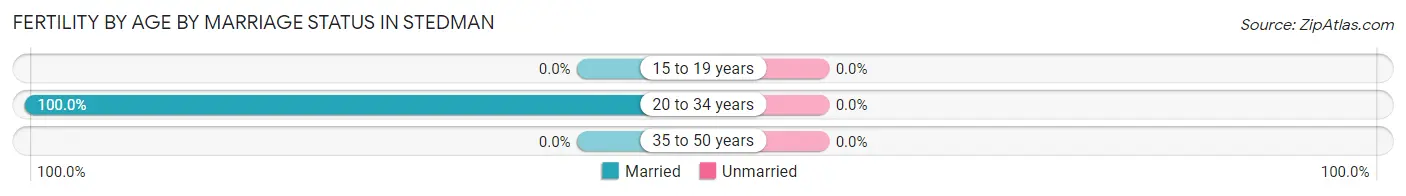
| Age Bracket | Married | Unmarried |
| 15 to 19 years | 0 (0.0%) | 0 (0.0%) |
| 20 to 34 years | 4 (100.0%) | 0 (0.0%) |
| 35 to 50 years | 0 (0.0%) | 0 (0.0%) |
| Total | 4 (100.0%) | 0 (0.0%) |
Fertility by Education in Stedman
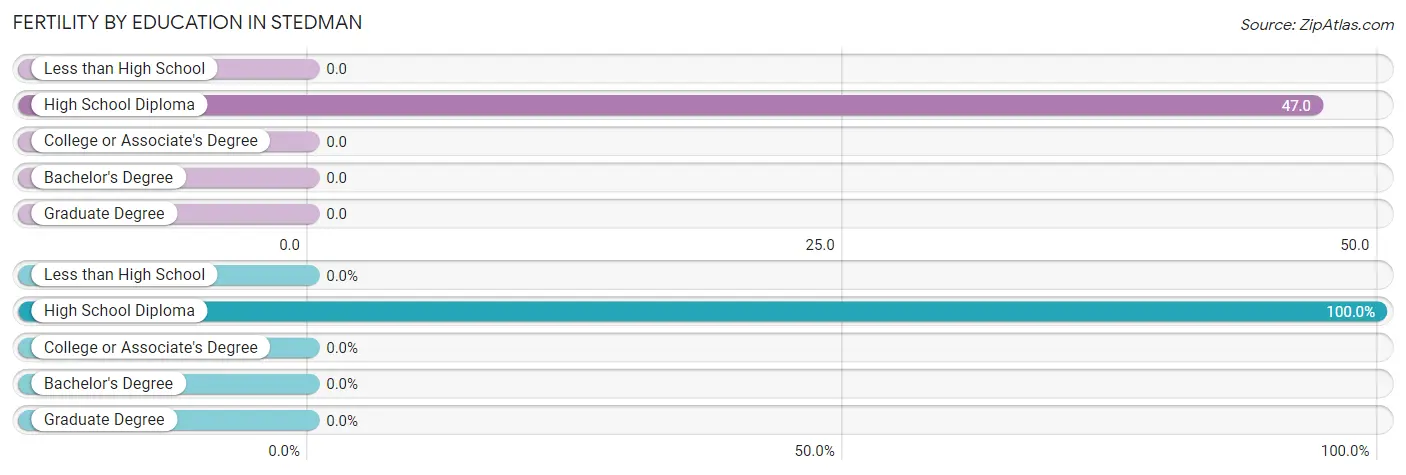
| Educational Attainment | Women with Births | Births / 1,000 Women |
| Less than High School | 0 (0.0%) | 0.0 |
| High School Diploma | 4 (100.0%) | 47.0 |
| College or Associate's Degree | 0 (0.0%) | 0.0 |
| Bachelor's Degree | 0 (0.0%) | 0.0 |
| Graduate Degree | 0 (0.0%) | 0.0 |
| Total | 4 (100.0%) | 10.0 |
Fertility by Education by Marriage Status in Stedman
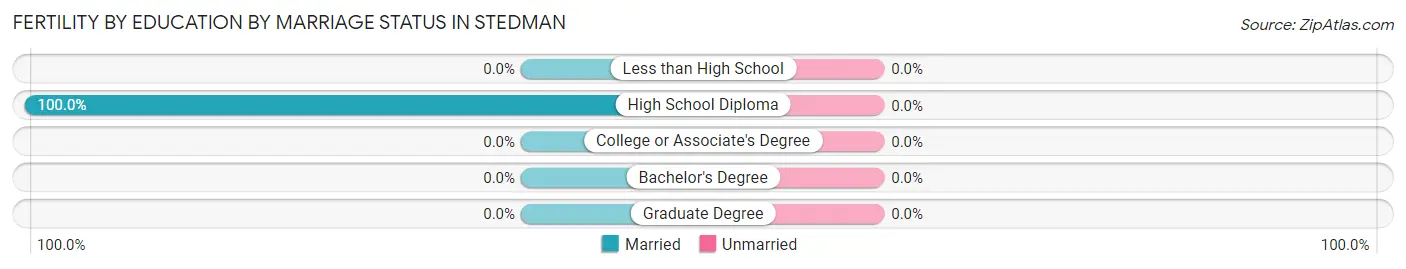
| Educational Attainment | Married | Unmarried |
| Less than High School | 0 (0.0%) | 0 (0.0%) |
| High School Diploma | 4 (100.0%) | 0 (0.0%) |
| College or Associate's Degree | 0 (0.0%) | 0 (0.0%) |
| Bachelor's Degree | 0 (0.0%) | 0 (0.0%) |
| Graduate Degree | 0 (0.0%) | 0 (0.0%) |
| Total | 4 (100.0%) | 0 (0.0%) |
Employment Characteristics in Stedman
Employment by Class of Employer in Stedman
Among the 778 employed individuals in Stedman, private company employees (467 | 60.0%), federal government employees (114 | 14.6%), and local government employees (107 | 13.8%) make up the most common classes of employment.
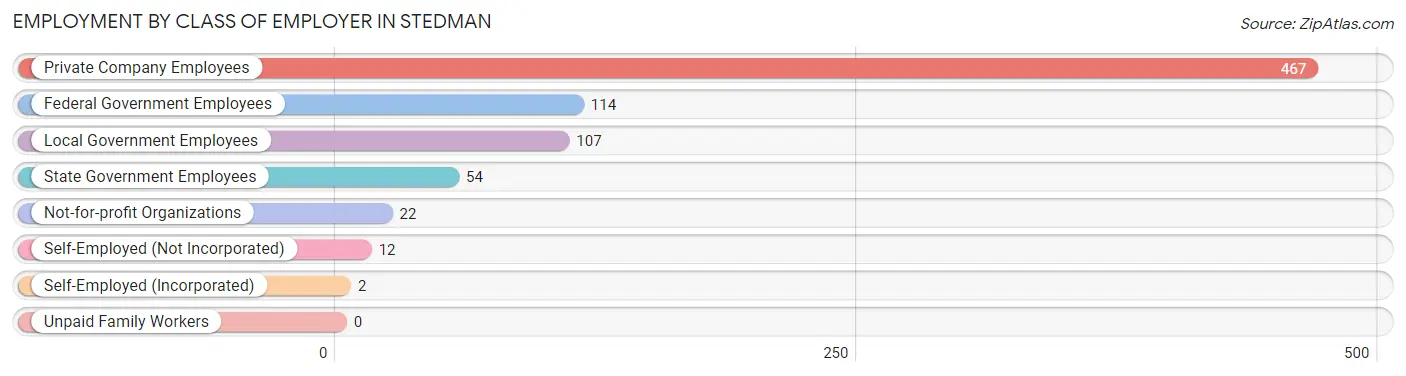
| Employer Class | # Employees | % Employees |
| Private Company Employees | 467 | 60.0% |
| Self-Employed (Incorporated) | 2 | 0.3% |
| Self-Employed (Not Incorporated) | 12 | 1.5% |
| Not-for-profit Organizations | 22 | 2.8% |
| Local Government Employees | 107 | 13.8% |
| State Government Employees | 54 | 6.9% |
| Federal Government Employees | 114 | 14.6% |
| Unpaid Family Workers | 0 | 0.0% |
| Total | 778 | 100.0% |
Employment Status by Age in Stedman
According to the labor force statistics for Stedman, out of the total population over 16 years of age (1,175), 67.4% or 792 individuals are in the labor force, with 1.9% or 15 of them unemployed. The age group with the highest labor force participation rate is 35 to 44 years, with 88.5% or 238 individuals in the labor force. Within the labor force, the 30 to 34 years age range has the highest percentage of unemployed individuals, with 6.1% or 8 of them being unemployed.
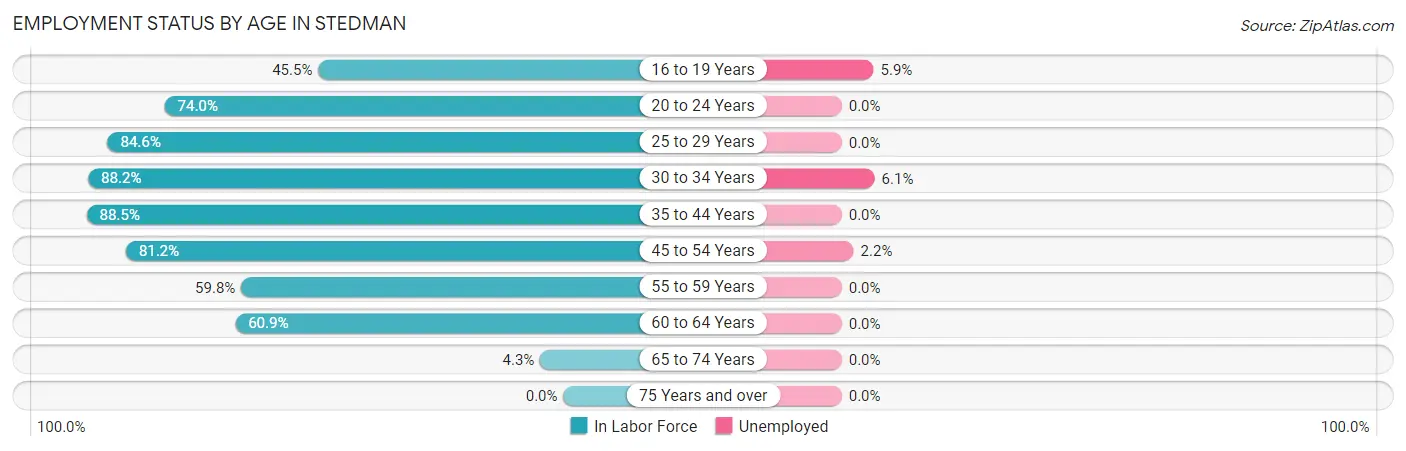
| Age Bracket | In Labor Force | Unemployed |
| 16 to 19 Years | 51 (45.5%) | 3 (5.9%) |
| 20 to 24 Years | 71 (74.0%) | 0 (0.0%) |
| 25 to 29 Years | 55 (84.6%) | 0 (0.0%) |
| 30 to 34 Years | 135 (88.2%) | 8 (6.1%) |
| 35 to 44 Years | 238 (88.5%) | 0 (0.0%) |
| 45 to 54 Years | 134 (81.2%) | 3 (2.2%) |
| 55 to 59 Years | 52 (59.8%) | 0 (0.0%) |
| 60 to 64 Years | 53 (60.9%) | 0 (0.0%) |
| 65 to 74 Years | 3 (4.3%) | 0 (0.0%) |
| 75 Years and over | 0 (0.0%) | 0 (0.0%) |
| Total | 792 (67.4%) | 15 (1.9%) |
Employment Status by Educational Attainment in Stedman
According to labor force statistics for Stedman, 80.8% of individuals (667) out of the total population between 25 and 64 years of age (826) are in the labor force, with 1.7% or 11 of them being unemployed. The group with the highest labor force participation rate are those with the educational attainment of college / associate degree, with 84.7% or 221 individuals in the labor force. Within the labor force, individuals with less than high school education have the highest percentage of unemployment, with 10.0% or 2 of them being unemployed.
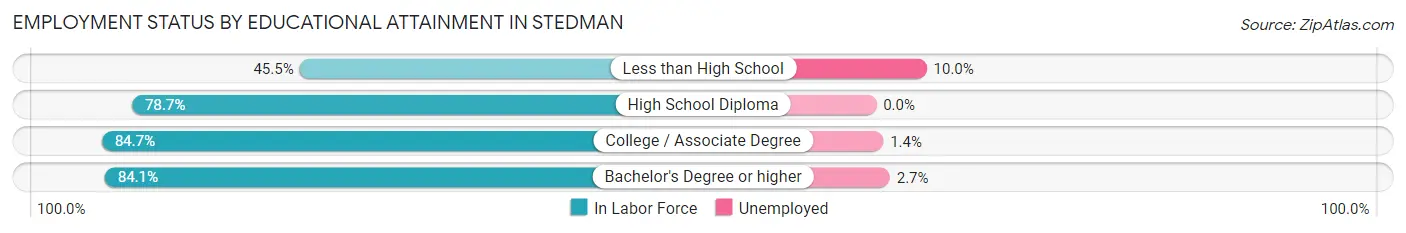
| Educational Attainment | In Labor Force | Unemployed |
| Less than High School | 20 (45.5%) | 4 (10.0%) |
| High School Diploma | 177 (78.7%) | 0 (0.0%) |
| College / Associate Degree | 221 (84.7%) | 4 (1.4%) |
| Bachelor's Degree or higher | 249 (84.1%) | 8 (2.7%) |
| Total | 667 (80.8%) | 14 (1.7%) |
Employment Occupations by Sex in Stedman
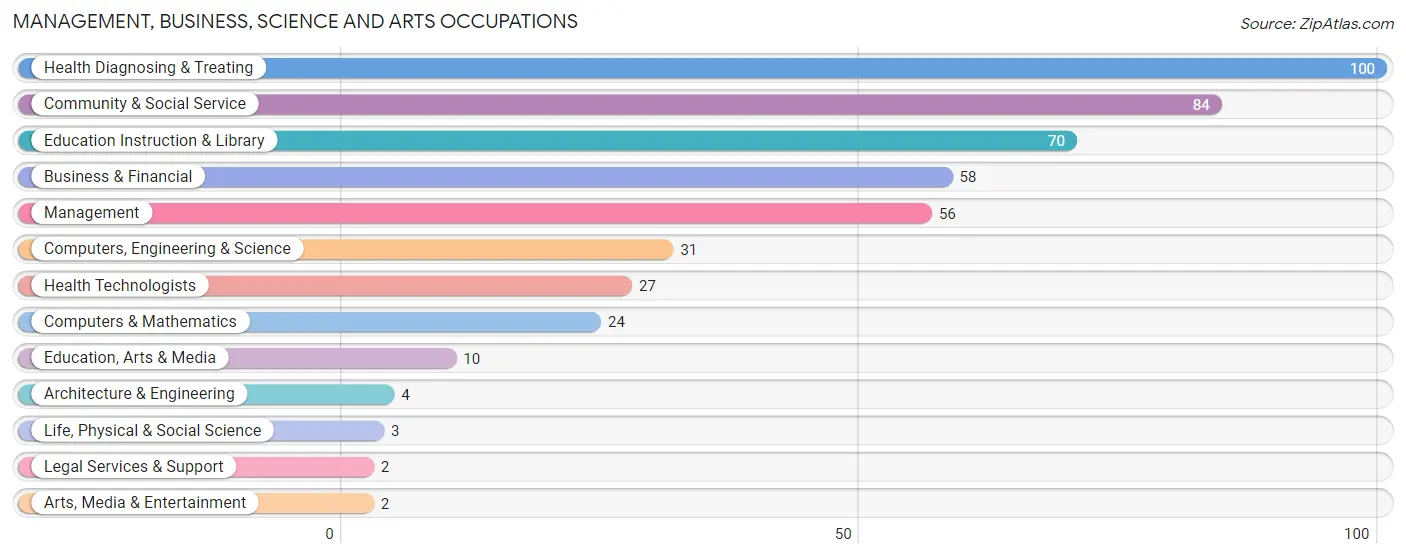
Management, Business, Science and Arts Occupations
The most common Management, Business, Science and Arts occupations in Stedman are Health Diagnosing & Treating (100 | 13.5%), Community & Social Service (84 | 11.3%), Education Instruction & Library (70 | 9.4%), Business & Financial (58 | 7.8%), and Management (56 | 7.5%).
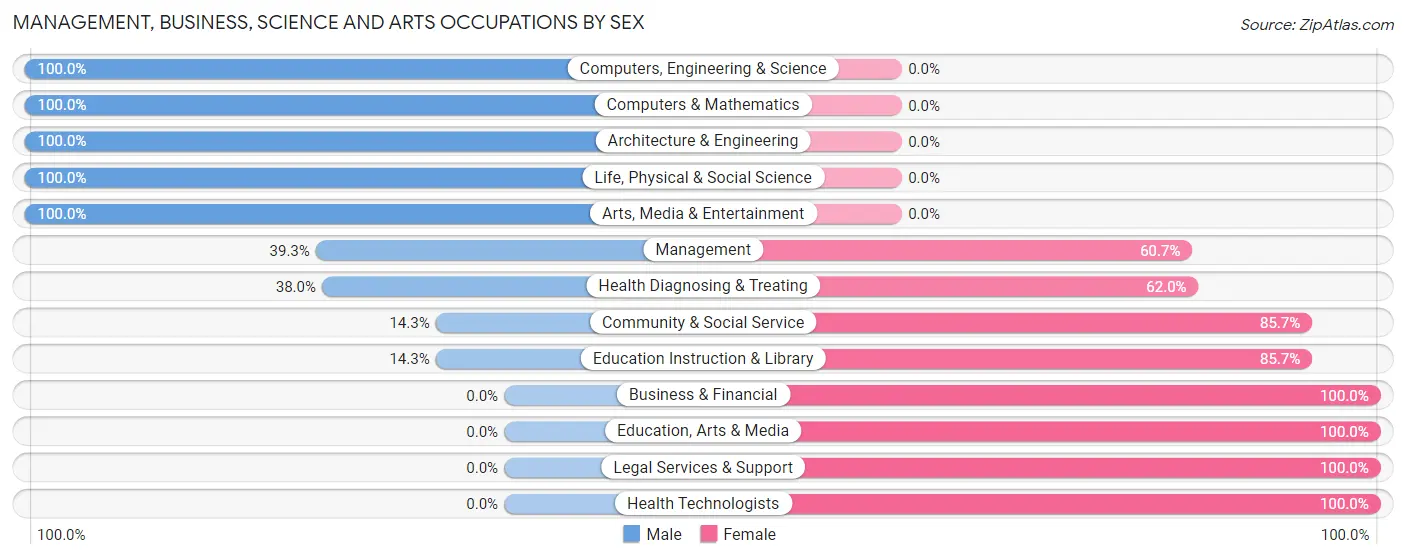
Management, Business, Science and Arts Occupations by Sex
Within the Management, Business, Science and Arts occupations in Stedman, the most male-oriented occupations are Computers, Engineering & Science (100.0%), Computers & Mathematics (100.0%), and Architecture & Engineering (100.0%), while the most female-oriented occupations are Business & Financial (100.0%), Education, Arts & Media (100.0%), and Legal Services & Support (100.0%).
| Occupation | Male | Female |
| Management | 22 (39.3%) | 34 (60.7%) |
| Business & Financial | 0 (0.0%) | 58 (100.0%) |
| Computers, Engineering & Science | 31 (100.0%) | 0 (0.0%) |
| Computers & Mathematics | 24 (100.0%) | 0 (0.0%) |
| Architecture & Engineering | 4 (100.0%) | 0 (0.0%) |
| Life, Physical & Social Science | 3 (100.0%) | 0 (0.0%) |
| Community & Social Service | 12 (14.3%) | 72 (85.7%) |
| Education, Arts & Media | 0 (0.0%) | 10 (100.0%) |
| Legal Services & Support | 0 (0.0%) | 2 (100.0%) |
| Education Instruction & Library | 10 (14.3%) | 60 (85.7%) |
| Arts, Media & Entertainment | 2 (100.0%) | 0 (0.0%) |
| Health Diagnosing & Treating | 38 (38.0%) | 62 (62.0%) |
| Health Technologists | 0 (0.0%) | 27 (100.0%) |
| Total (Category) | 103 (31.3%) | 226 (68.7%) |
| Total (Overall) | 393 (53.0%) | 349 (47.0%) |
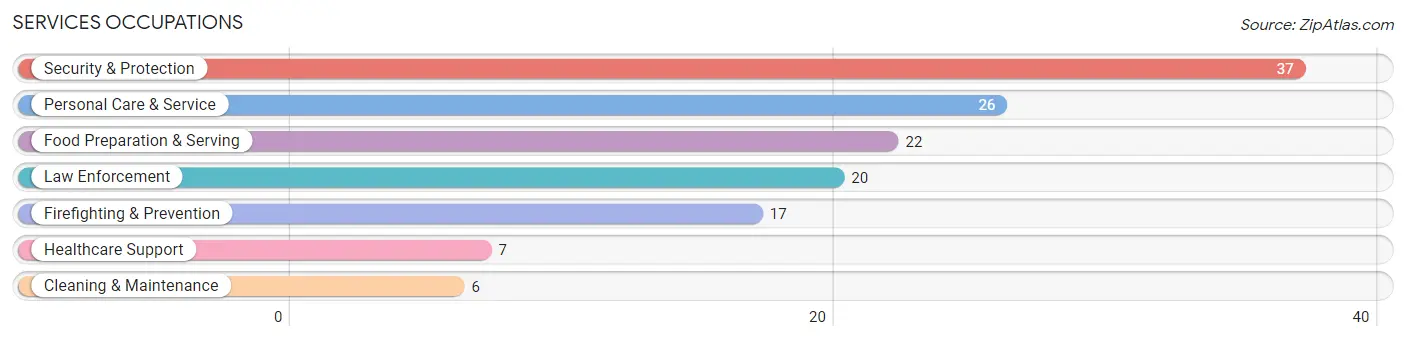
Services Occupations
The most common Services occupations in Stedman are Security & Protection (37 | 5.0%), Personal Care & Service (26 | 3.5%), Food Preparation & Serving (22 | 3.0%), Law Enforcement (20 | 2.7%), and Firefighting & Prevention (17 | 2.3%).
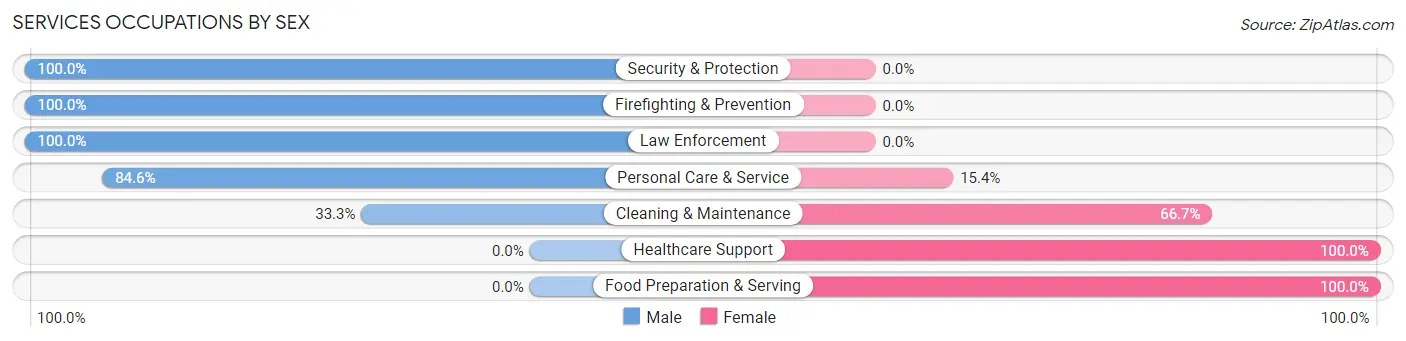
Services Occupations by Sex
Within the Services occupations in Stedman, the most male-oriented occupations are Security & Protection (100.0%), Firefighting & Prevention (100.0%), and Law Enforcement (100.0%), while the most female-oriented occupations are Healthcare Support (100.0%), Food Preparation & Serving (100.0%), and Cleaning & Maintenance (66.7%).
| Occupation | Male | Female |
| Healthcare Support | 0 (0.0%) | 7 (100.0%) |
| Security & Protection | 37 (100.0%) | 0 (0.0%) |
| Firefighting & Prevention | 17 (100.0%) | 0 (0.0%) |
| Law Enforcement | 20 (100.0%) | 0 (0.0%) |
| Food Preparation & Serving | 0 (0.0%) | 22 (100.0%) |
| Cleaning & Maintenance | 2 (33.3%) | 4 (66.7%) |
| Personal Care & Service | 22 (84.6%) | 4 (15.4%) |
| Total (Category) | 61 (62.2%) | 37 (37.8%) |
| Total (Overall) | 393 (53.0%) | 349 (47.0%) |
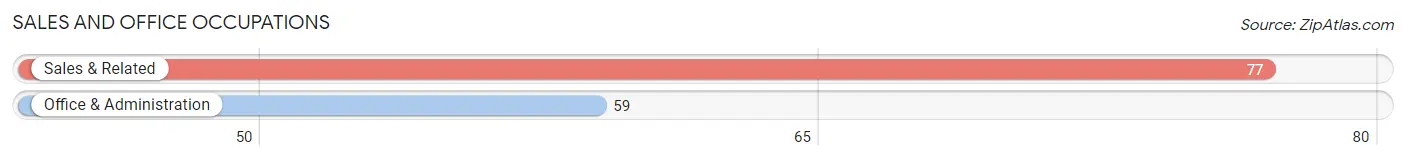
Sales and Office Occupations
The most common Sales and Office occupations in Stedman are Sales & Related (77 | 10.4%), and Office & Administration (59 | 8.0%).
Sales and Office Occupations by Sex
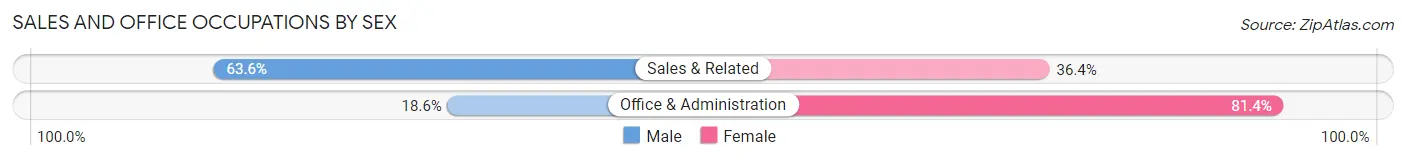
| Occupation | Male | Female |
| Sales & Related | 49 (63.6%) | 28 (36.4%) |
| Office & Administration | 11 (18.6%) | 48 (81.4%) |
| Total (Category) | 60 (44.1%) | 76 (55.9%) |
| Total (Overall) | 393 (53.0%) | 349 (47.0%) |
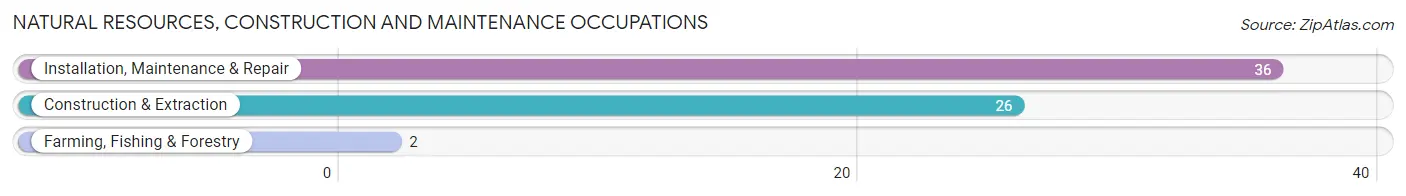
Natural Resources, Construction and Maintenance Occupations
The most common Natural Resources, Construction and Maintenance occupations in Stedman are Installation, Maintenance & Repair (36 | 4.9%), Construction & Extraction (26 | 3.5%), and Farming, Fishing & Forestry (2 | 0.3%).
Natural Resources, Construction and Maintenance Occupations by Sex
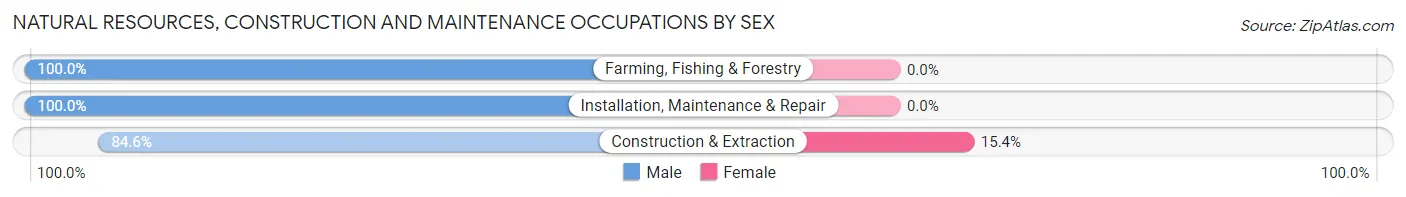
| Occupation | Male | Female |
| Farming, Fishing & Forestry | 2 (100.0%) | 0 (0.0%) |
| Construction & Extraction | 22 (84.6%) | 4 (15.4%) |
| Installation, Maintenance & Repair | 36 (100.0%) | 0 (0.0%) |
| Total (Category) | 60 (93.8%) | 4 (6.2%) |
| Total (Overall) | 393 (53.0%) | 349 (47.0%) |
Production, Transportation and Moving Occupations
The most common Production, Transportation and Moving occupations in Stedman are Production (51 | 6.9%), Material Moving (39 | 5.3%), and Transportation (25 | 3.4%).

Production, Transportation and Moving Occupations by Sex
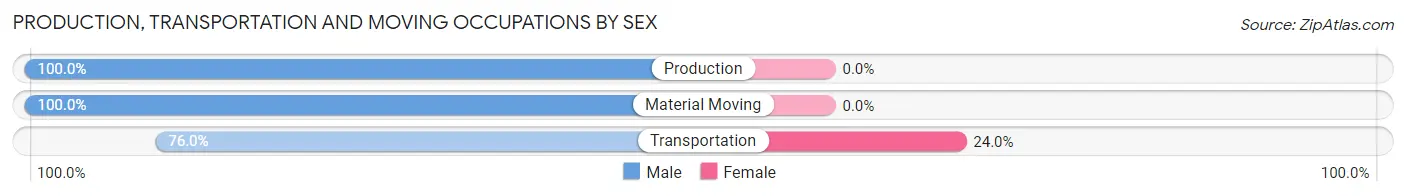
| Occupation | Male | Female |
| Production | 51 (100.0%) | 0 (0.0%) |
| Transportation | 19 (76.0%) | 6 (24.0%) |
| Material Moving | 39 (100.0%) | 0 (0.0%) |
| Total (Category) | 109 (94.8%) | 6 (5.2%) |
| Total (Overall) | 393 (53.0%) | 349 (47.0%) |
Employment Industries by Sex in Stedman
Employment Industries in Stedman
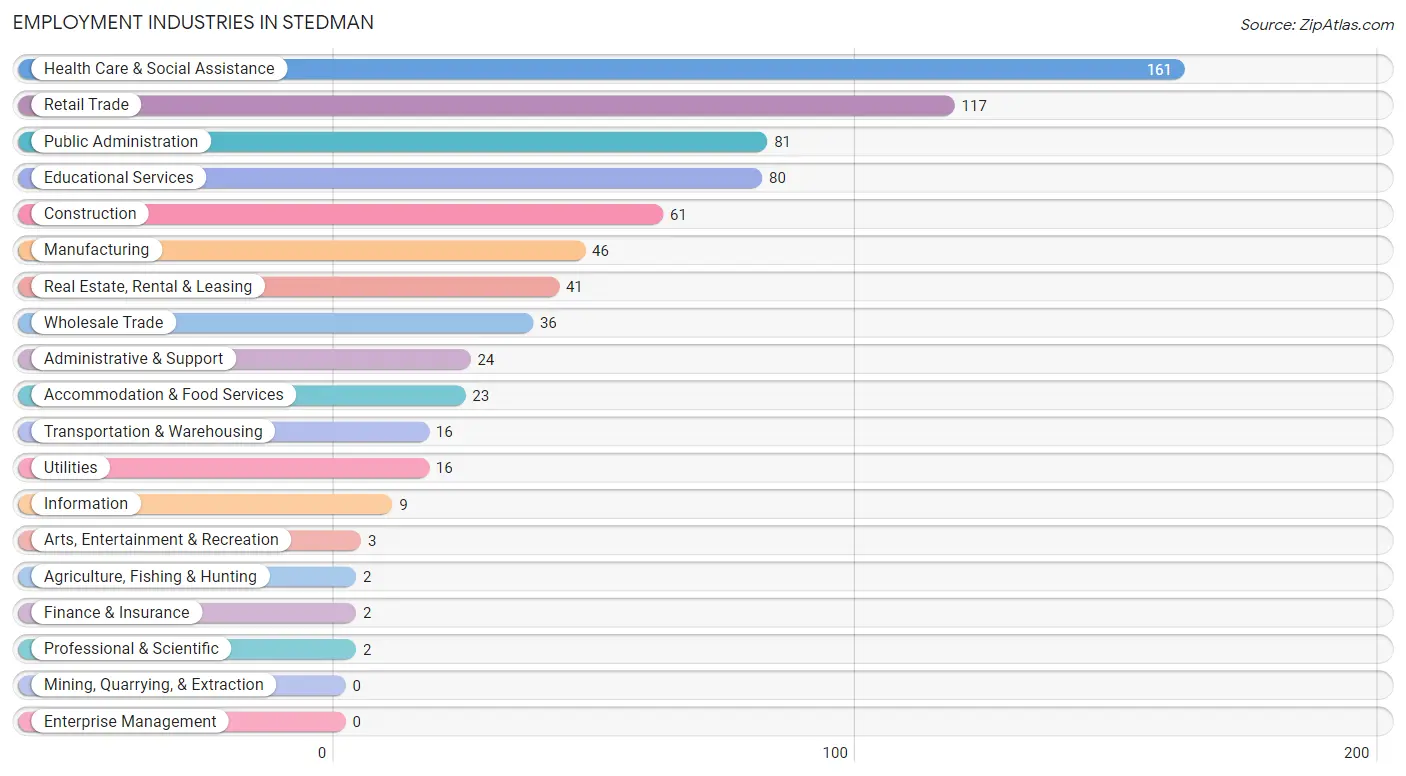
The major employment industries in Stedman include Health Care & Social Assistance (161 | 21.7%), Retail Trade (117 | 15.8%), Public Administration (81 | 10.9%), Educational Services (80 | 10.8%), and Construction (61 | 8.2%).
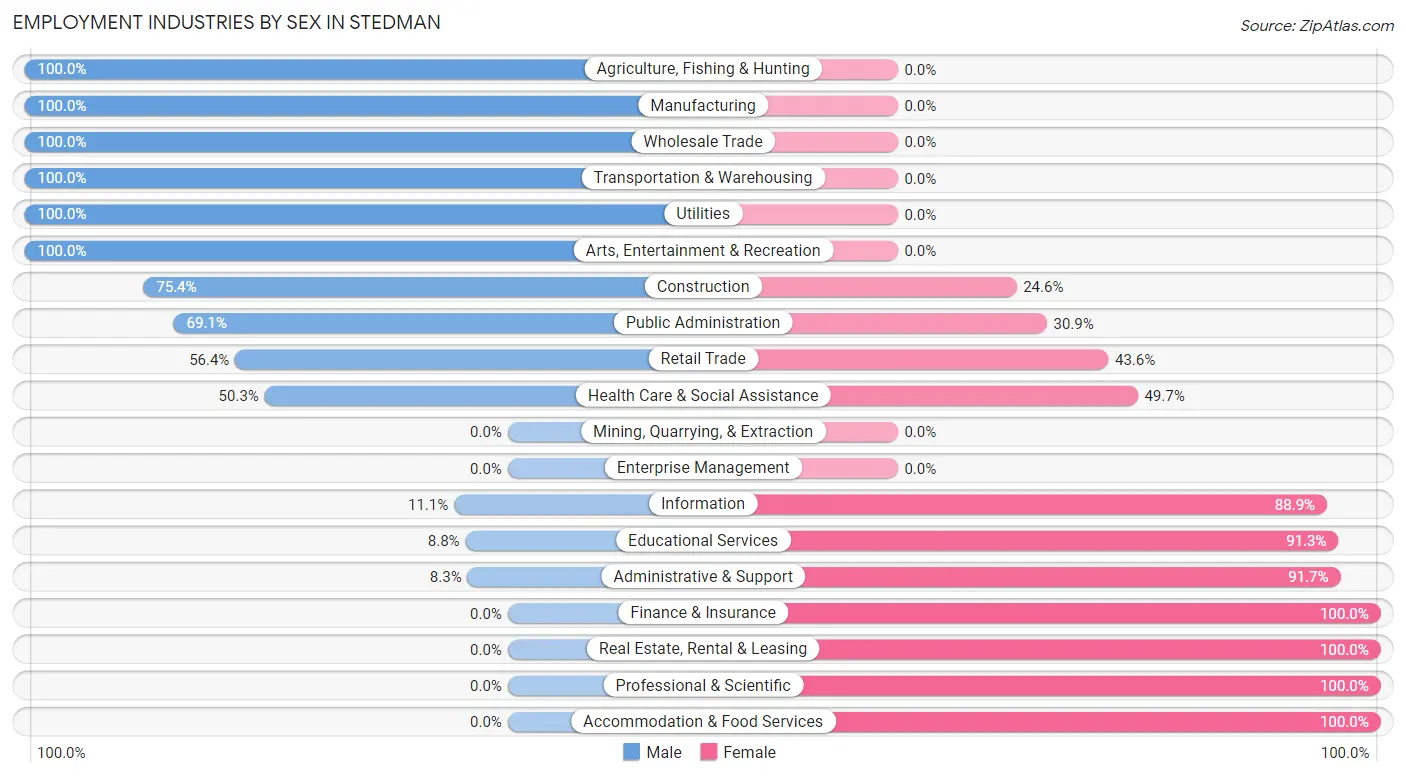
Employment Industries by Sex in Stedman
The Stedman industries that see more men than women are Agriculture, Fishing & Hunting (100.0%), Manufacturing (100.0%), and Wholesale Trade (100.0%), whereas the industries that tend to have a higher number of women are Finance & Insurance (100.0%), Real Estate, Rental & Leasing (100.0%), and Professional & Scientific (100.0%).
| Industry | Male | Female |
| Agriculture, Fishing & Hunting | 2 (100.0%) | 0 (0.0%) |
| Mining, Quarrying, & Extraction | 0 (0.0%) | 0 (0.0%) |
| Construction | 46 (75.4%) | 15 (24.6%) |
| Manufacturing | 46 (100.0%) | 0 (0.0%) |
| Wholesale Trade | 36 (100.0%) | 0 (0.0%) |
| Retail Trade | 66 (56.4%) | 51 (43.6%) |
| Transportation & Warehousing | 16 (100.0%) | 0 (0.0%) |
| Utilities | 16 (100.0%) | 0 (0.0%) |
| Information | 1 (11.1%) | 8 (88.9%) |
| Finance & Insurance | 0 (0.0%) | 2 (100.0%) |
| Real Estate, Rental & Leasing | 0 (0.0%) | 41 (100.0%) |
| Professional & Scientific | 0 (0.0%) | 2 (100.0%) |
| Enterprise Management | 0 (0.0%) | 0 (0.0%) |
| Administrative & Support | 2 (8.3%) | 22 (91.7%) |
| Educational Services | 7 (8.7%) | 73 (91.2%) |
| Health Care & Social Assistance | 81 (50.3%) | 80 (49.7%) |
| Arts, Entertainment & Recreation | 3 (100.0%) | 0 (0.0%) |
| Accommodation & Food Services | 0 (0.0%) | 23 (100.0%) |
| Public Administration | 56 (69.1%) | 25 (30.9%) |
| Total | 393 (53.0%) | 349 (47.0%) |
Education in Stedman
School Enrollment in Stedman
The most common levels of schooling among the 427 students in Stedman are high school (129 | 30.2%), middle school (102 | 23.9%), and college / undergraduate (85 | 19.9%).
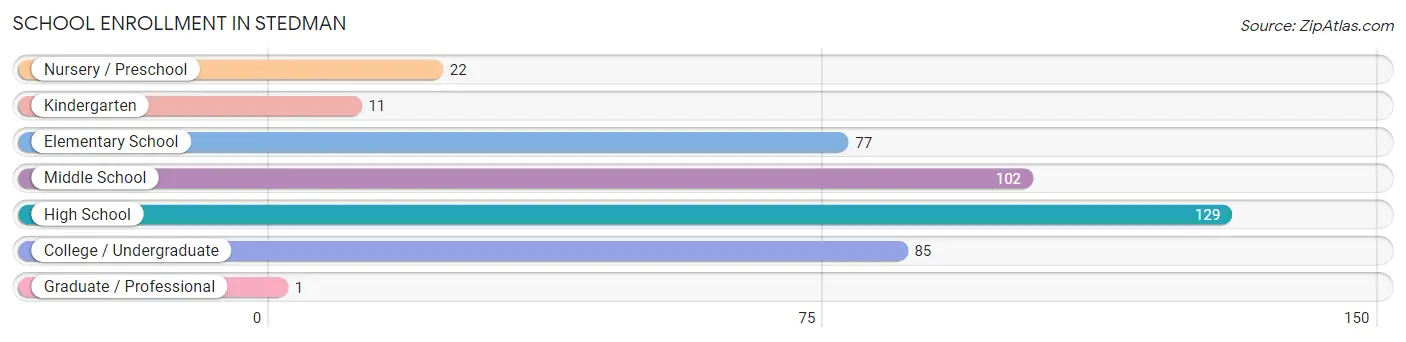
| School Level | # Students | % Students |
| Nursery / Preschool | 22 | 5.1% |
| Kindergarten | 11 | 2.6% |
| Elementary School | 77 | 18.0% |
| Middle School | 102 | 23.9% |
| High School | 129 | 30.2% |
| College / Undergraduate | 85 | 19.9% |
| Graduate / Professional | 1 | 0.2% |
| Total | 427 | 100.0% |
School Enrollment by Age by Funding Source in Stedman
Out of a total of 427 students who are enrolled in schools in Stedman, 57 (13.3%) attend a private institution, while the remaining 370 (86.7%) are enrolled in public schools. The age group of 3 to 4 year olds has the highest likelihood of being enrolled in private schools, with 15 (100.0% in the age bracket) enrolled. Conversely, the age group of 18 to 19 year olds has the lowest likelihood of being enrolled in a private school, with 27 (100.0% in the age bracket) attending a public institution.
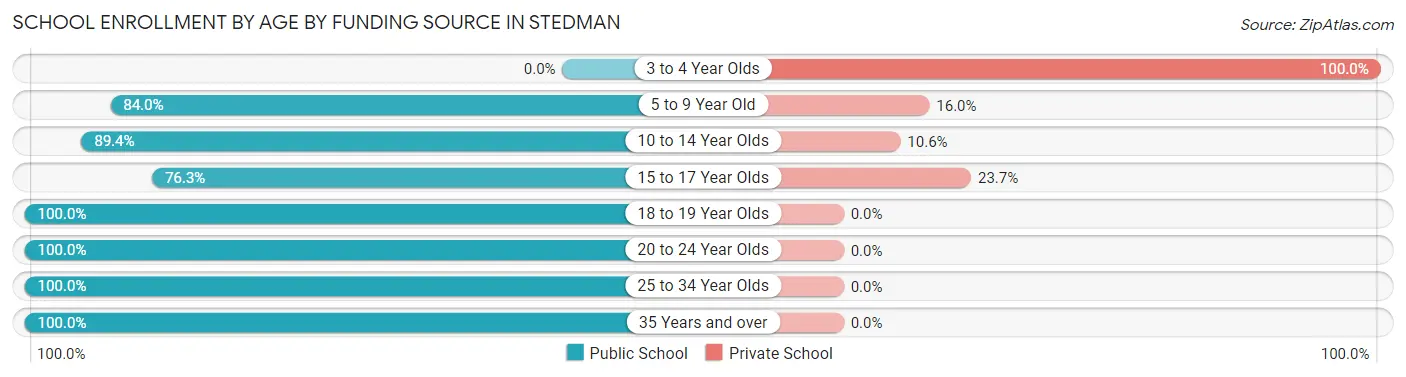
| Age Bracket | Public School | Private School |
| 3 to 4 Year Olds | 0 (0.0%) | 15 (100.0%) |
| 5 to 9 Year Old | 79 (84.0%) | 15 (16.0%) |
| 10 to 14 Year Olds | 110 (89.4%) | 13 (10.6%) |
| 15 to 17 Year Olds | 45 (76.3%) | 14 (23.7%) |
| 18 to 19 Year Olds | 27 (100.0%) | 0 (0.0%) |
| 20 to 24 Year Olds | 53 (100.0%) | 0 (0.0%) |
| 25 to 34 Year Olds | 15 (100.0%) | 0 (0.0%) |
| 35 Years and over | 41 (100.0%) | 0 (0.0%) |
| Total | 370 (86.7%) | 57 (13.3%) |
Educational Attainment by Field of Study in Stedman
Business (69 | 20.6%), physical & health sciences (63 | 18.8%), education (56 | 16.7%), science & technology (50 | 14.9%), and arts & humanities (21 | 6.3%) are the most common fields of study among 335 individuals in Stedman who have obtained a bachelor's degree or higher.
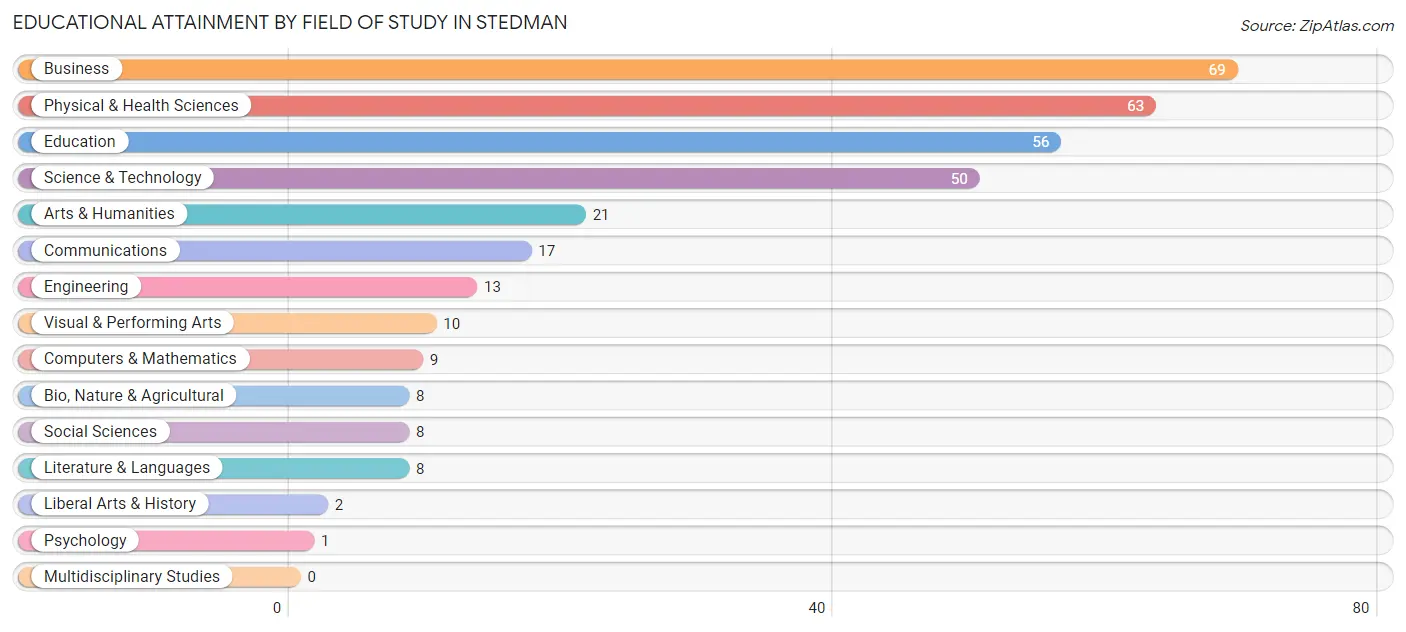
| Field of Study | # Graduates | % Graduates |
| Computers & Mathematics | 9 | 2.7% |
| Bio, Nature & Agricultural | 8 | 2.4% |
| Physical & Health Sciences | 63 | 18.8% |
| Psychology | 1 | 0.3% |
| Social Sciences | 8 | 2.4% |
| Engineering | 13 | 3.9% |
| Multidisciplinary Studies | 0 | 0.0% |
| Science & Technology | 50 | 14.9% |
| Business | 69 | 20.6% |
| Education | 56 | 16.7% |
| Literature & Languages | 8 | 2.4% |
| Liberal Arts & History | 2 | 0.6% |
| Visual & Performing Arts | 10 | 3.0% |
| Communications | 17 | 5.1% |
| Arts & Humanities | 21 | 6.3% |
| Total | 335 | 100.0% |
Transportation & Commute in Stedman
Vehicle Availability by Sex in Stedman
The most prevalent vehicle ownership categories in Stedman are males with 3 vehicles (180, accounting for 42.0%) and females with 3 vehicles (125, making up 51.6%).
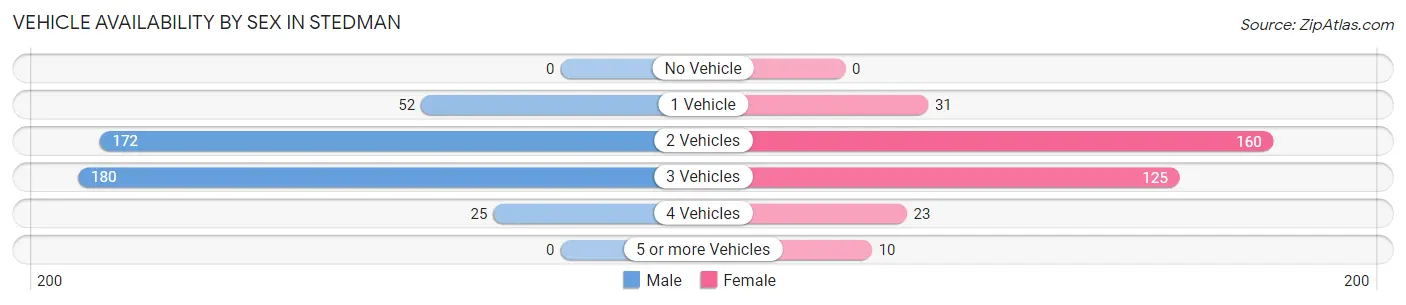
| Vehicles Available | Male | Female |
| No Vehicle | 0 (0.0%) | 0 (0.0%) |
| 1 Vehicle | 52 (12.1%) | 31 (8.9%) |
| 2 Vehicles | 172 (40.1%) | 160 (45.9%) |
| 3 Vehicles | 180 (42.0%) | 125 (35.8%) |
| 4 Vehicles | 25 (5.8%) | 23 (6.6%) |
| 5 or more Vehicles | 0 (0.0%) | 10 (2.9%) |
| Total | 429 (100.0%) | 349 (100.0%) |
Commute Time in Stedman
The most frequently occuring commute durations in Stedman are 30 to 34 minutes (222 commuters, 29.0%), 25 to 29 minutes (136 commuters, 17.8%), and 20 to 24 minutes (87 commuters, 11.4%).
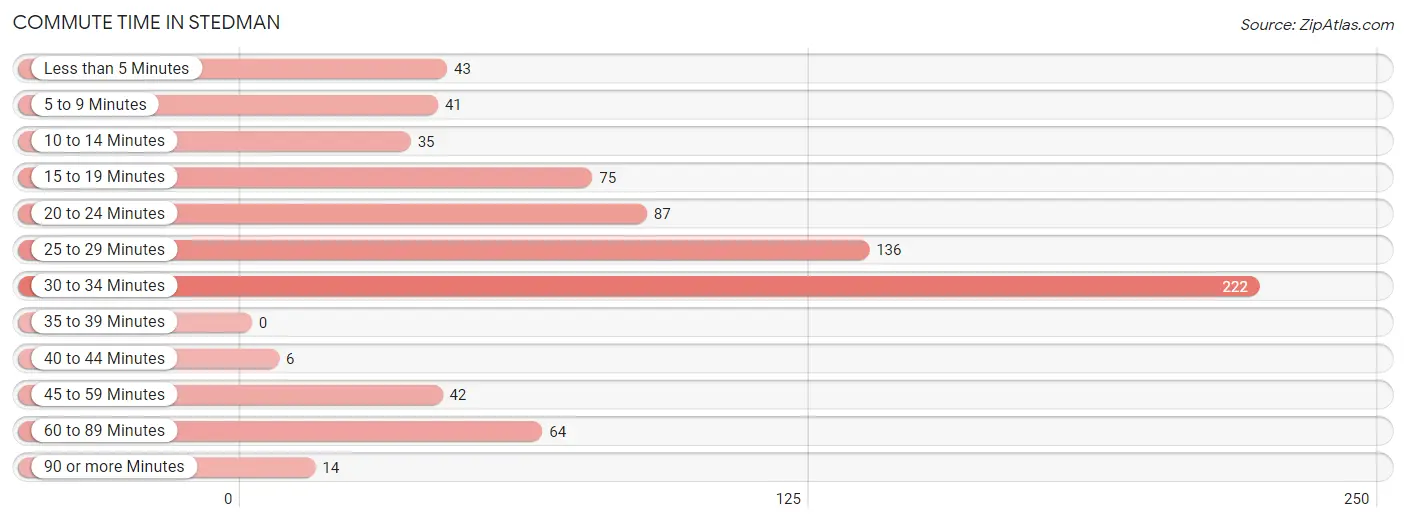
| Commute Time | # Commuters | % Commuters |
| Less than 5 Minutes | 43 | 5.6% |
| 5 to 9 Minutes | 41 | 5.4% |
| 10 to 14 Minutes | 35 | 4.6% |
| 15 to 19 Minutes | 75 | 9.8% |
| 20 to 24 Minutes | 87 | 11.4% |
| 25 to 29 Minutes | 136 | 17.8% |
| 30 to 34 Minutes | 222 | 29.0% |
| 35 to 39 Minutes | 0 | 0.0% |
| 40 to 44 Minutes | 6 | 0.8% |
| 45 to 59 Minutes | 42 | 5.5% |
| 60 to 89 Minutes | 64 | 8.4% |
| 90 or more Minutes | 14 | 1.8% |
Commute Time by Sex in Stedman
The most common commute times in Stedman are 30 to 34 minutes (129 commuters, 30.3%) for males and 30 to 34 minutes (93 commuters, 27.4%) for females.
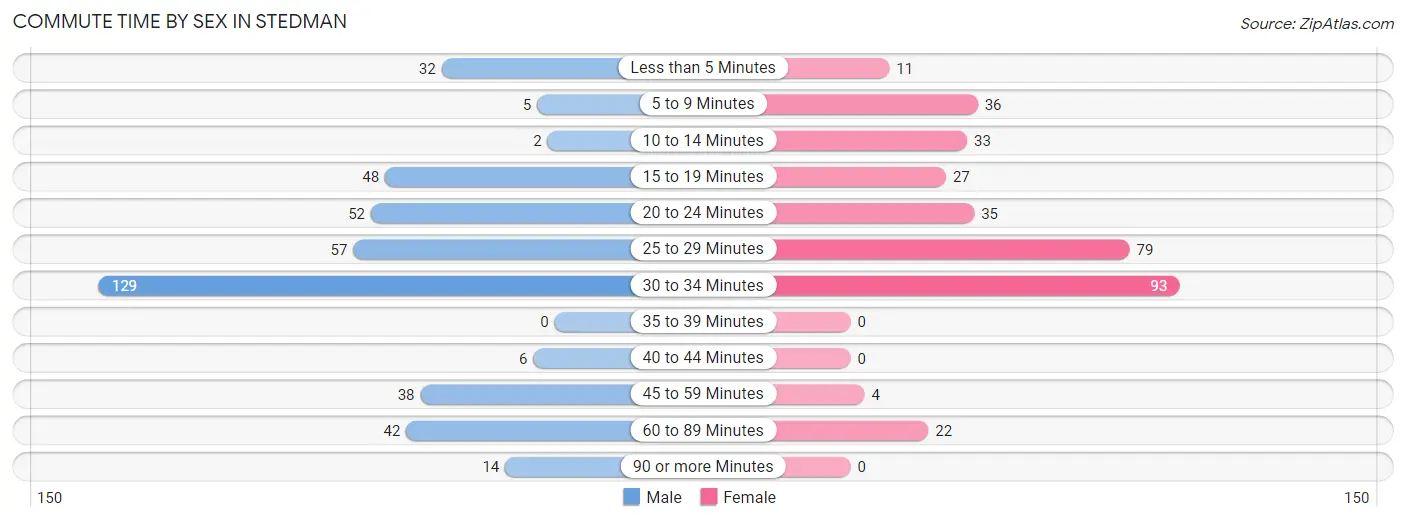
| Commute Time | Male | Female |
| Less than 5 Minutes | 32 (7.5%) | 11 (3.2%) |
| 5 to 9 Minutes | 5 (1.2%) | 36 (10.6%) |
| 10 to 14 Minutes | 2 (0.5%) | 33 (9.7%) |
| 15 to 19 Minutes | 48 (11.3%) | 27 (7.9%) |
| 20 to 24 Minutes | 52 (12.2%) | 35 (10.3%) |
| 25 to 29 Minutes | 57 (13.4%) | 79 (23.2%) |
| 30 to 34 Minutes | 129 (30.3%) | 93 (27.4%) |
| 35 to 39 Minutes | 0 (0.0%) | 0 (0.0%) |
| 40 to 44 Minutes | 6 (1.4%) | 0 (0.0%) |
| 45 to 59 Minutes | 38 (8.9%) | 4 (1.2%) |
| 60 to 89 Minutes | 42 (9.9%) | 22 (6.5%) |
| 90 or more Minutes | 14 (3.3%) | 0 (0.0%) |
Time of Departure to Work by Sex in Stedman
The most frequent times of departure to work in Stedman are 7:00 AM to 7:29 AM (112, 26.4%) for males and 6:30 AM to 6:59 AM (83, 24.4%) for females.
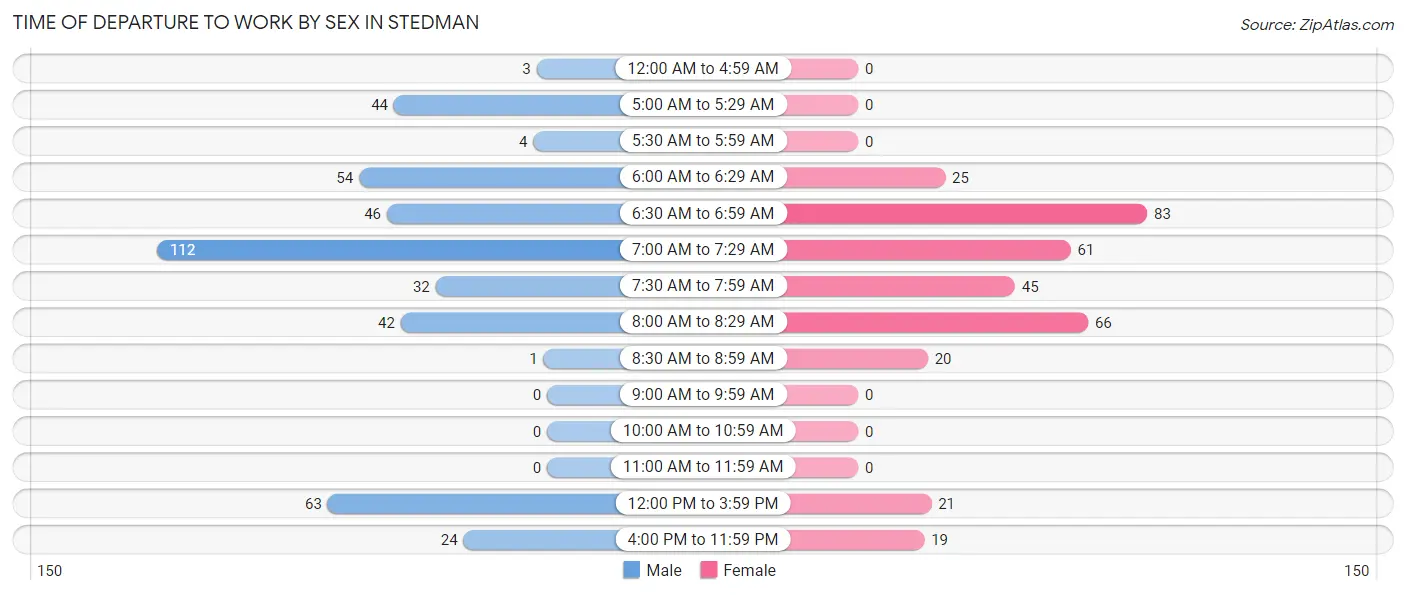
| Time of Departure | Male | Female |
| 12:00 AM to 4:59 AM | 3 (0.7%) | 0 (0.0%) |
| 5:00 AM to 5:29 AM | 44 (10.3%) | 0 (0.0%) |
| 5:30 AM to 5:59 AM | 4 (0.9%) | 0 (0.0%) |
| 6:00 AM to 6:29 AM | 54 (12.7%) | 25 (7.3%) |
| 6:30 AM to 6:59 AM | 46 (10.8%) | 83 (24.4%) |
| 7:00 AM to 7:29 AM | 112 (26.4%) | 61 (17.9%) |
| 7:30 AM to 7:59 AM | 32 (7.5%) | 45 (13.2%) |
| 8:00 AM to 8:29 AM | 42 (9.9%) | 66 (19.4%) |
| 8:30 AM to 8:59 AM | 1 (0.2%) | 20 (5.9%) |
| 9:00 AM to 9:59 AM | 0 (0.0%) | 0 (0.0%) |
| 10:00 AM to 10:59 AM | 0 (0.0%) | 0 (0.0%) |
| 11:00 AM to 11:59 AM | 0 (0.0%) | 0 (0.0%) |
| 12:00 PM to 3:59 PM | 63 (14.8%) | 21 (6.2%) |
| 4:00 PM to 11:59 PM | 24 (5.7%) | 19 (5.6%) |
| Total | 425 (100.0%) | 340 (100.0%) |
Housing Occupancy in Stedman
Occupancy by Ownership in Stedman
Of the total 537 dwellings in Stedman, owner-occupied units account for 483 (89.9%), while renter-occupied units make up 54 (10.1%).
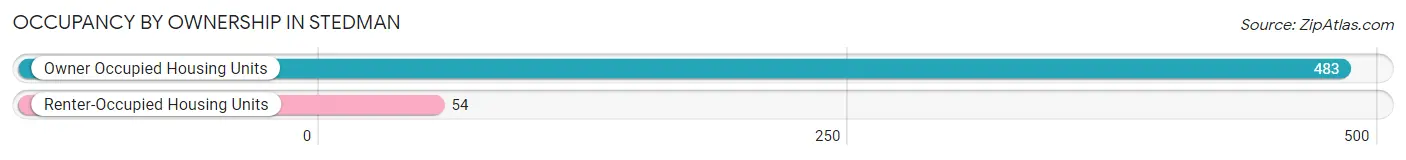
| Occupancy | # Housing Units | % Housing Units |
| Owner Occupied Housing Units | 483 | 89.9% |
| Renter-Occupied Housing Units | 54 | 10.1% |
| Total Occupied Housing Units | 537 | 100.0% |
Occupancy by Household Size in Stedman
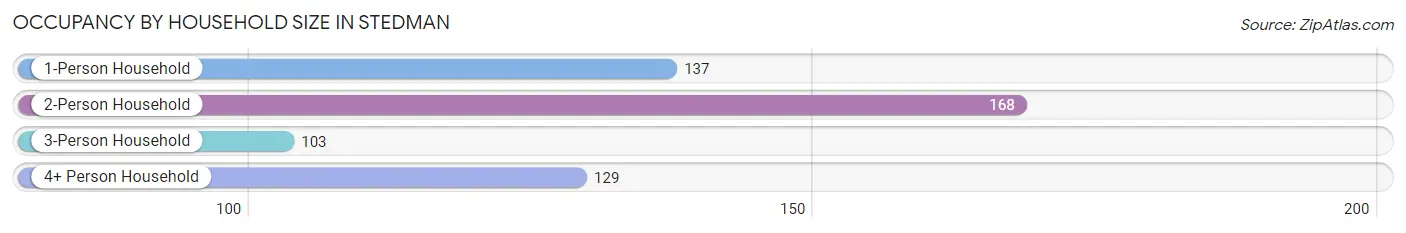
| Household Size | # Housing Units | % Housing Units |
| 1-Person Household | 137 | 25.5% |
| 2-Person Household | 168 | 31.3% |
| 3-Person Household | 103 | 19.2% |
| 4+ Person Household | 129 | 24.0% |
| Total Housing Units | 537 | 100.0% |
Occupancy by Ownership by Household Size in Stedman
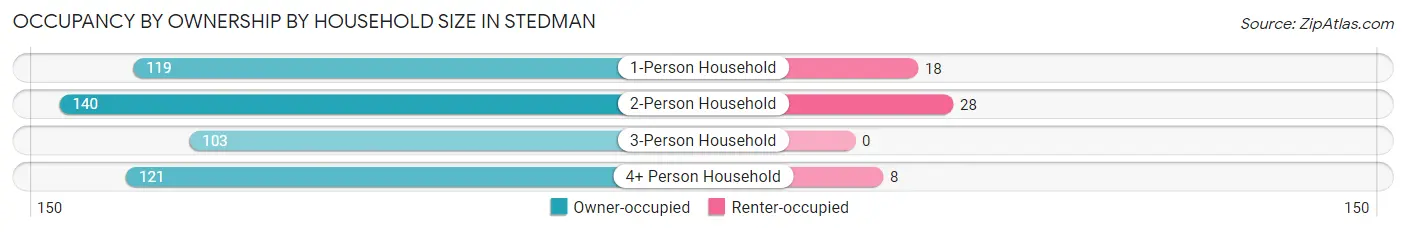
| Household Size | Owner-occupied | Renter-occupied |
| 1-Person Household | 119 (86.9%) | 18 (13.1%) |
| 2-Person Household | 140 (83.3%) | 28 (16.7%) |
| 3-Person Household | 103 (100.0%) | 0 (0.0%) |
| 4+ Person Household | 121 (93.8%) | 8 (6.2%) |
| Total Housing Units | 483 (89.9%) | 54 (10.1%) |
Occupancy by Educational Attainment in Stedman
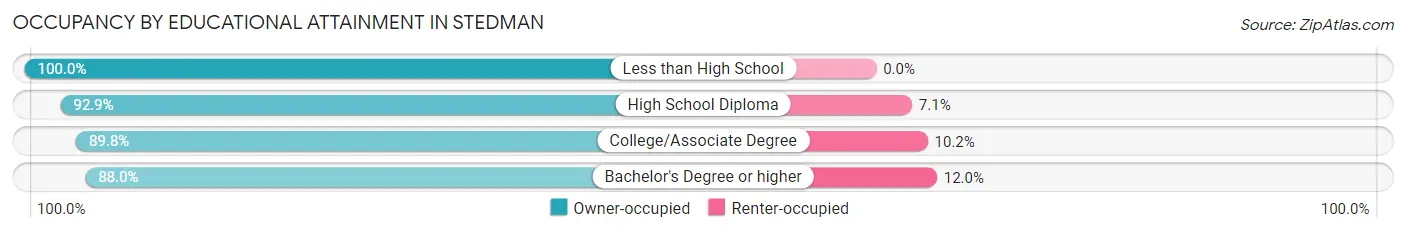
| Household Size | Owner-occupied | Renter-occupied |
| Less than High School | 6 (100.0%) | 0 (0.0%) |
| High School Diploma | 131 (92.9%) | 10 (7.1%) |
| College/Associate Degree | 141 (89.8%) | 16 (10.2%) |
| Bachelor's Degree or higher | 205 (88.0%) | 28 (12.0%) |
Occupancy by Age of Householder in Stedman
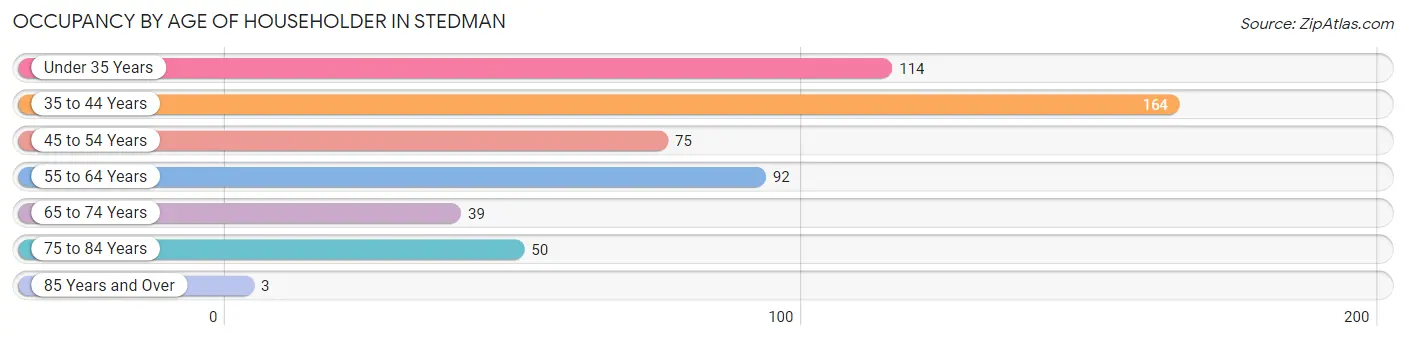
| Age Bracket | # Households | % Households |
| Under 35 Years | 114 | 21.2% |
| 35 to 44 Years | 164 | 30.5% |
| 45 to 54 Years | 75 | 14.0% |
| 55 to 64 Years | 92 | 17.1% |
| 65 to 74 Years | 39 | 7.3% |
| 75 to 84 Years | 50 | 9.3% |
| 85 Years and Over | 3 | 0.6% |
| Total | 537 | 100.0% |
Housing Finances in Stedman
Median Income by Occupancy in Stedman
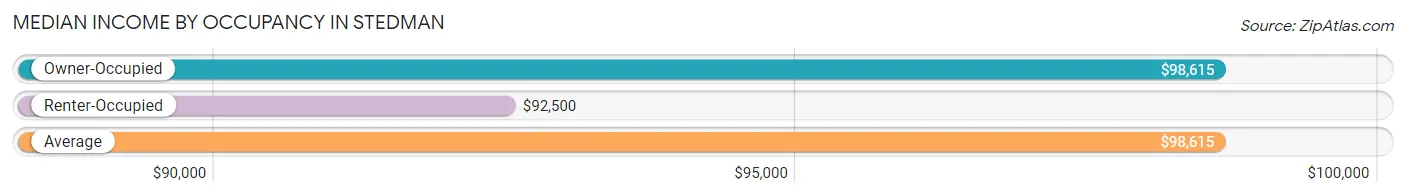
| Occupancy Type | # Households | Median Income |
| Owner-Occupied | 483 (89.9%) | $98,615 |
| Renter-Occupied | 54 (10.1%) | $92,500 |
| Average | 537 (100.0%) | $98,615 |
Occupancy by Householder Income Bracket in Stedman
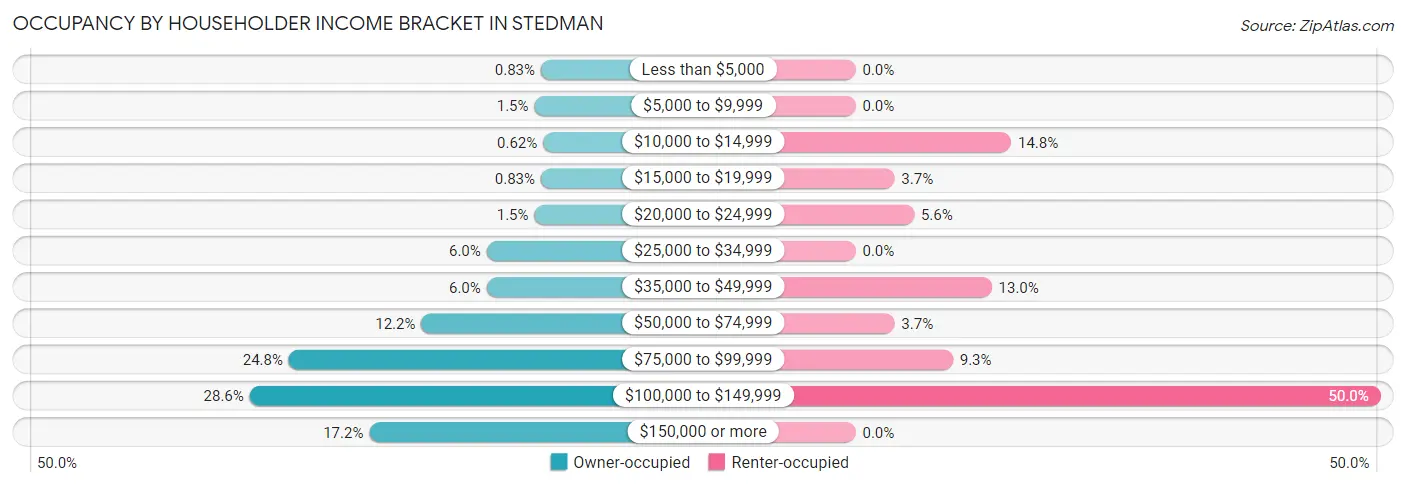
| Income Bracket | Owner-occupied | Renter-occupied |
| Less than $5,000 | 4 (0.8%) | 0 (0.0%) |
| $5,000 to $9,999 | 7 (1.5%) | 0 (0.0%) |
| $10,000 to $14,999 | 3 (0.6%) | 8 (14.8%) |
| $15,000 to $19,999 | 4 (0.8%) | 2 (3.7%) |
| $20,000 to $24,999 | 7 (1.5%) | 3 (5.6%) |
| $25,000 to $34,999 | 29 (6.0%) | 0 (0.0%) |
| $35,000 to $49,999 | 29 (6.0%) | 7 (13.0%) |
| $50,000 to $74,999 | 59 (12.2%) | 2 (3.7%) |
| $75,000 to $99,999 | 120 (24.8%) | 5 (9.3%) |
| $100,000 to $149,999 | 138 (28.6%) | 27 (50.0%) |
| $150,000 or more | 83 (17.2%) | 0 (0.0%) |
| Total | 483 (100.0%) | 54 (100.0%) |
Monthly Housing Cost Tiers in Stedman
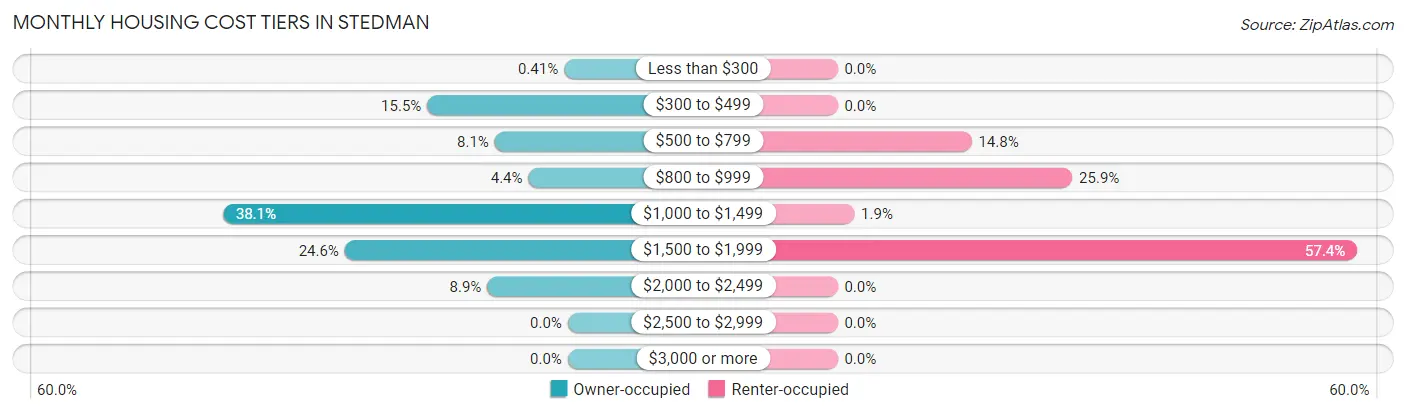
| Monthly Cost | Owner-occupied | Renter-occupied |
| Less than $300 | 2 (0.4%) | 0 (0.0%) |
| $300 to $499 | 75 (15.5%) | 0 (0.0%) |
| $500 to $799 | 39 (8.1%) | 8 (14.8%) |
| $800 to $999 | 21 (4.3%) | 14 (25.9%) |
| $1,000 to $1,499 | 184 (38.1%) | 1 (1.8%) |
| $1,500 to $1,999 | 119 (24.6%) | 31 (57.4%) |
| $2,000 to $2,499 | 43 (8.9%) | 0 (0.0%) |
| $2,500 to $2,999 | 0 (0.0%) | 0 (0.0%) |
| $3,000 or more | 0 (0.0%) | 0 (0.0%) |
| Total | 483 (100.0%) | 54 (100.0%) |
Physical Housing Characteristics in Stedman
Housing Structures in Stedman
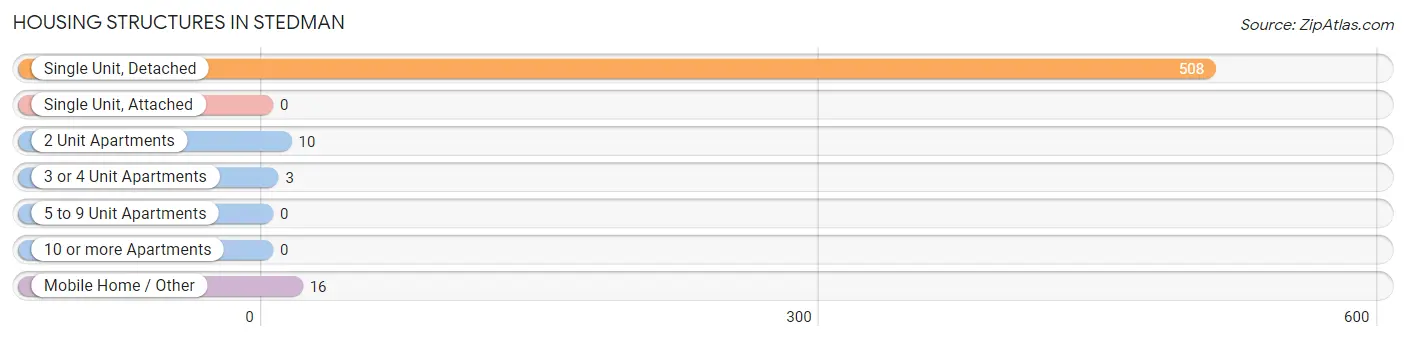
| Structure Type | # Housing Units | % Housing Units |
| Single Unit, Detached | 508 | 94.6% |
| Single Unit, Attached | 0 | 0.0% |
| 2 Unit Apartments | 10 | 1.9% |
| 3 or 4 Unit Apartments | 3 | 0.6% |
| 5 to 9 Unit Apartments | 0 | 0.0% |
| 10 or more Apartments | 0 | 0.0% |
| Mobile Home / Other | 16 | 3.0% |
| Total | 537 | 100.0% |
Housing Structures by Occupancy in Stedman
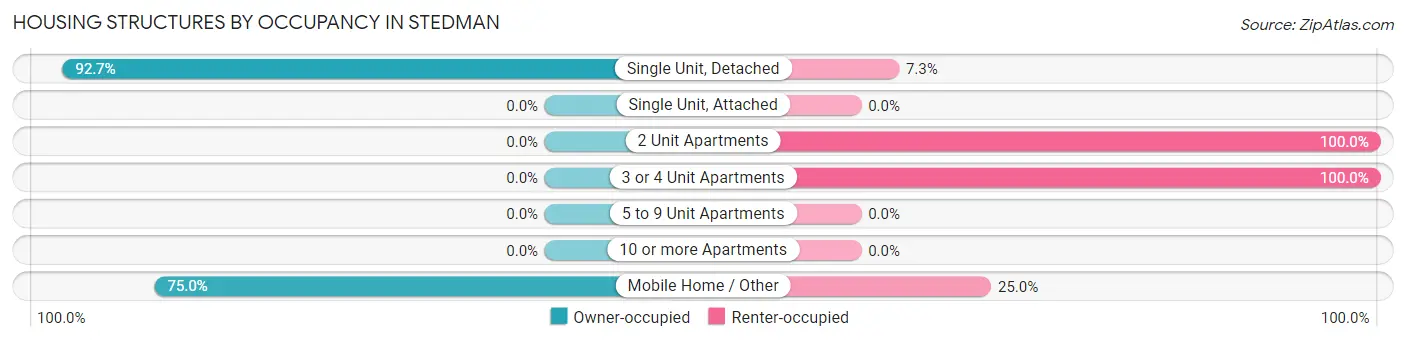
| Structure Type | Owner-occupied | Renter-occupied |
| Single Unit, Detached | 471 (92.7%) | 37 (7.3%) |
| Single Unit, Attached | 0 (0.0%) | 0 (0.0%) |
| 2 Unit Apartments | 0 (0.0%) | 10 (100.0%) |
| 3 or 4 Unit Apartments | 0 (0.0%) | 3 (100.0%) |
| 5 to 9 Unit Apartments | 0 (0.0%) | 0 (0.0%) |
| 10 or more Apartments | 0 (0.0%) | 0 (0.0%) |
| Mobile Home / Other | 12 (75.0%) | 4 (25.0%) |
| Total | 483 (89.9%) | 54 (10.1%) |
Housing Structures by Number of Rooms in Stedman
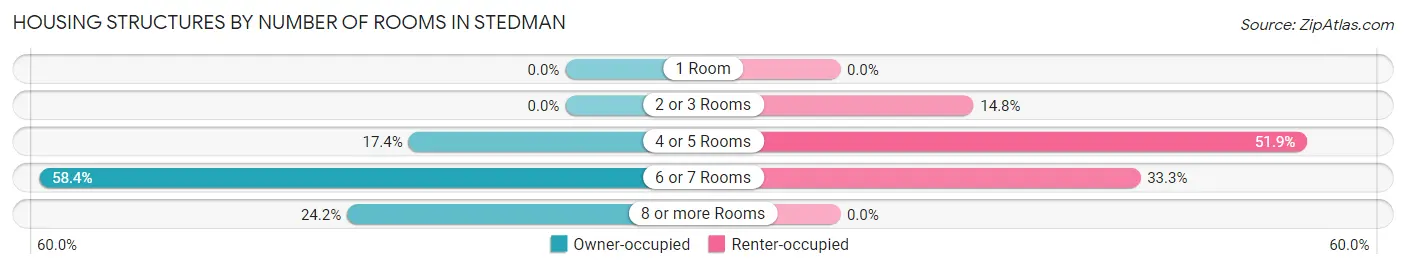
| Number of Rooms | Owner-occupied | Renter-occupied |
| 1 Room | 0 (0.0%) | 0 (0.0%) |
| 2 or 3 Rooms | 0 (0.0%) | 8 (14.8%) |
| 4 or 5 Rooms | 84 (17.4%) | 28 (51.8%) |
| 6 or 7 Rooms | 282 (58.4%) | 18 (33.3%) |
| 8 or more Rooms | 117 (24.2%) | 0 (0.0%) |
| Total | 483 (100.0%) | 54 (100.0%) |
Housing Structure by Heating Type in Stedman
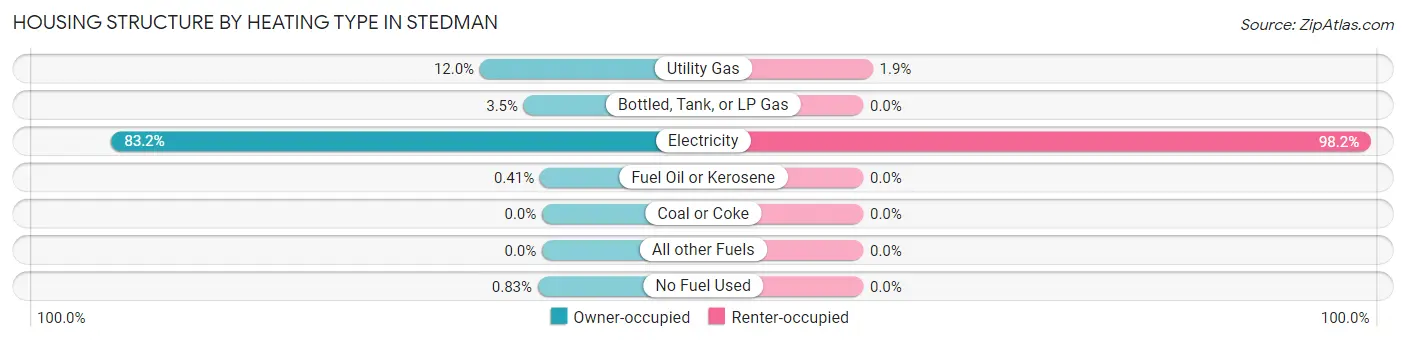
| Heating Type | Owner-occupied | Renter-occupied |
| Utility Gas | 58 (12.0%) | 1 (1.8%) |
| Bottled, Tank, or LP Gas | 17 (3.5%) | 0 (0.0%) |
| Electricity | 402 (83.2%) | 53 (98.2%) |
| Fuel Oil or Kerosene | 2 (0.4%) | 0 (0.0%) |
| Coal or Coke | 0 (0.0%) | 0 (0.0%) |
| All other Fuels | 0 (0.0%) | 0 (0.0%) |
| No Fuel Used | 4 (0.8%) | 0 (0.0%) |
| Total | 483 (100.0%) | 54 (100.0%) |
Household Vehicle Usage in Stedman
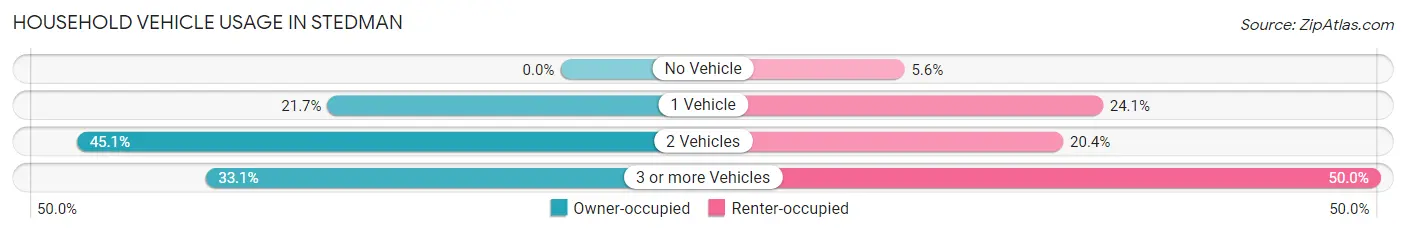
| Vehicles per Household | Owner-occupied | Renter-occupied |
| No Vehicle | 0 (0.0%) | 3 (5.6%) |
| 1 Vehicle | 105 (21.7%) | 13 (24.1%) |
| 2 Vehicles | 218 (45.1%) | 11 (20.4%) |
| 3 or more Vehicles | 160 (33.1%) | 27 (50.0%) |
| Total | 483 (100.0%) | 54 (100.0%) |
Real Estate & Mortgages in Stedman
Real Estate and Mortgage Overview in Stedman
| Characteristic | Without Mortgage | With Mortgage |
| Housing Units | 91 | 392 |
| Median Property Value | $169,100 | $186,800 |
| Median Household Income | $58,194 | $73 |
| Monthly Housing Costs | $467 | $0 |
| Real Estate Taxes | $1,734 | $8 |
Property Value by Mortgage Status in Stedman
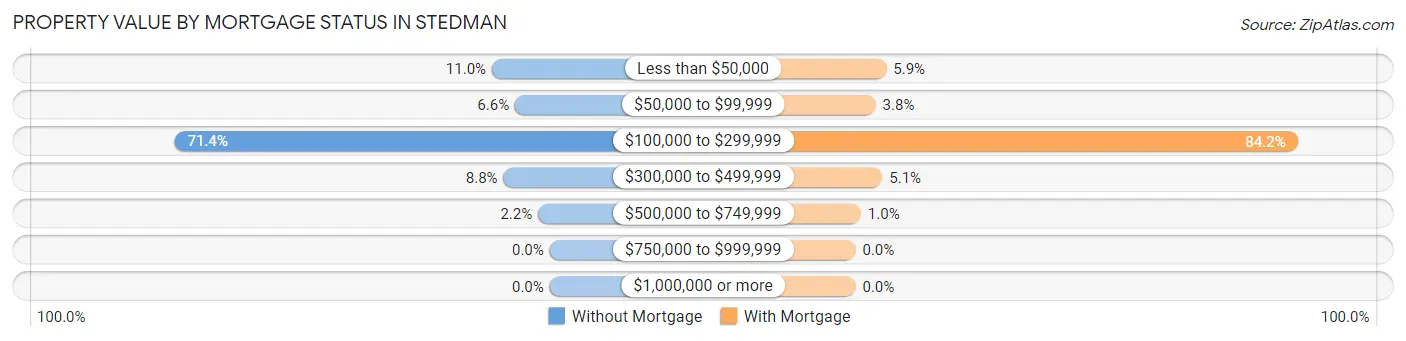
| Property Value | Without Mortgage | With Mortgage |
| Less than $50,000 | 10 (11.0%) | 23 (5.9%) |
| $50,000 to $99,999 | 6 (6.6%) | 15 (3.8%) |
| $100,000 to $299,999 | 65 (71.4%) | 330 (84.2%) |
| $300,000 to $499,999 | 8 (8.8%) | 20 (5.1%) |
| $500,000 to $749,999 | 2 (2.2%) | 4 (1.0%) |
| $750,000 to $999,999 | 0 (0.0%) | 0 (0.0%) |
| $1,000,000 or more | 0 (0.0%) | 0 (0.0%) |
| Total | 91 (100.0%) | 392 (100.0%) |
Household Income by Mortgage Status in Stedman
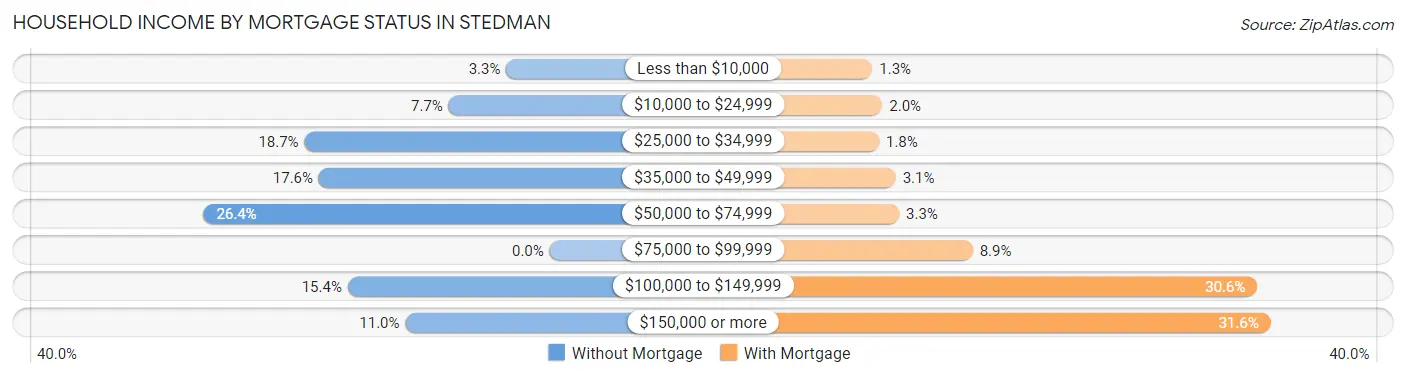
| Household Income | Without Mortgage | With Mortgage |
| Less than $10,000 | 3 (3.3%) | 5 (1.3%) |
| $10,000 to $24,999 | 7 (7.7%) | 8 (2.0%) |
| $25,000 to $34,999 | 17 (18.7%) | 7 (1.8%) |
| $35,000 to $49,999 | 16 (17.6%) | 12 (3.1%) |
| $50,000 to $74,999 | 24 (26.4%) | 13 (3.3%) |
| $75,000 to $99,999 | 0 (0.0%) | 35 (8.9%) |
| $100,000 to $149,999 | 14 (15.4%) | 120 (30.6%) |
| $150,000 or more | 10 (11.0%) | 124 (31.6%) |
| Total | 91 (100.0%) | 392 (100.0%) |
Property Value to Household Income Ratio in Stedman
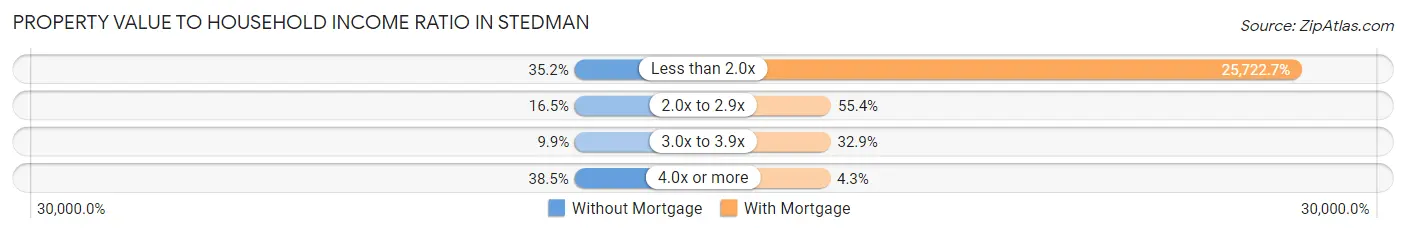
| Value-to-Income Ratio | Without Mortgage | With Mortgage |
| Less than 2.0x | 32 (35.2%) | 100,833 (25,722.7%) |
| 2.0x to 2.9x | 15 (16.5%) | 217 (55.4%) |
| 3.0x to 3.9x | 9 (9.9%) | 129 (32.9%) |
| 4.0x or more | 35 (38.5%) | 17 (4.3%) |
| Total | 91 (100.0%) | 392 (100.0%) |
Real Estate Taxes by Mortgage Status in Stedman
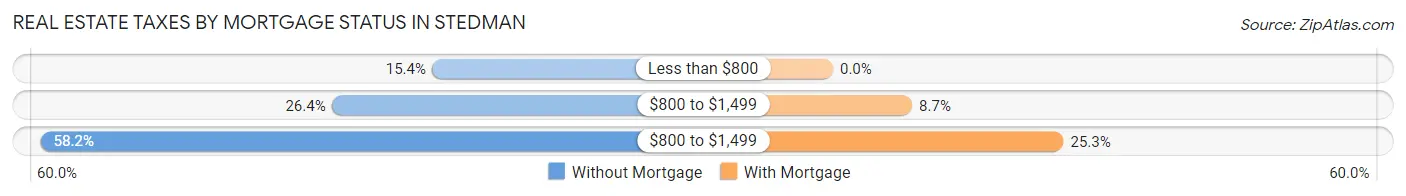
| Property Taxes | Without Mortgage | With Mortgage |
| Less than $800 | 14 (15.4%) | 0 (0.0%) |
| $800 to $1,499 | 24 (26.4%) | 34 (8.7%) |
| $800 to $1,499 | 53 (58.2%) | 99 (25.3%) |
| Total | 91 (100.0%) | 392 (100.0%) |
Health & Disability in Stedman
Health Insurance Coverage by Age in Stedman
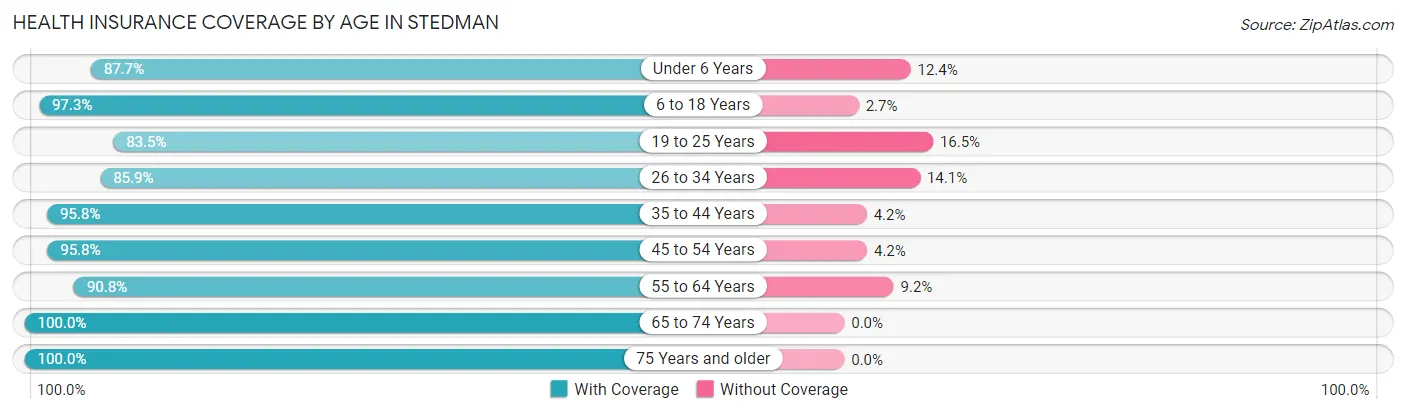
| Age Bracket | With Coverage | Without Coverage |
| Under 6 Years | 71 (87.6%) | 10 (12.3%) |
| 6 to 18 Years | 326 (97.3%) | 9 (2.7%) |
| 19 to 25 Years | 101 (83.5%) | 20 (16.5%) |
| 26 to 34 Years | 140 (85.9%) | 23 (14.1%) |
| 35 to 44 Years | 252 (95.8%) | 11 (4.2%) |
| 45 to 54 Years | 158 (95.8%) | 7 (4.2%) |
| 55 to 64 Years | 158 (90.8%) | 16 (9.2%) |
| 65 to 74 Years | 69 (100.0%) | 0 (0.0%) |
| 75 Years and older | 72 (100.0%) | 0 (0.0%) |
| Total | 1,347 (93.3%) | 96 (6.7%) |
Health Insurance Coverage by Citizenship Status in Stedman
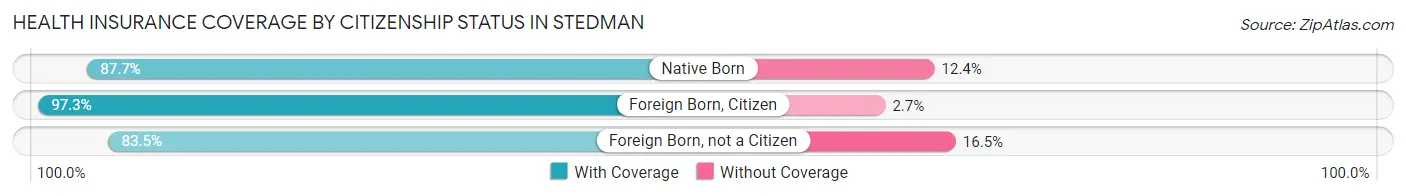
| Citizenship Status | With Coverage | Without Coverage |
| Native Born | 71 (87.6%) | 10 (12.3%) |
| Foreign Born, Citizen | 326 (97.3%) | 9 (2.7%) |
| Foreign Born, not a Citizen | 101 (83.5%) | 20 (16.5%) |
Health Insurance Coverage by Household Income in Stedman
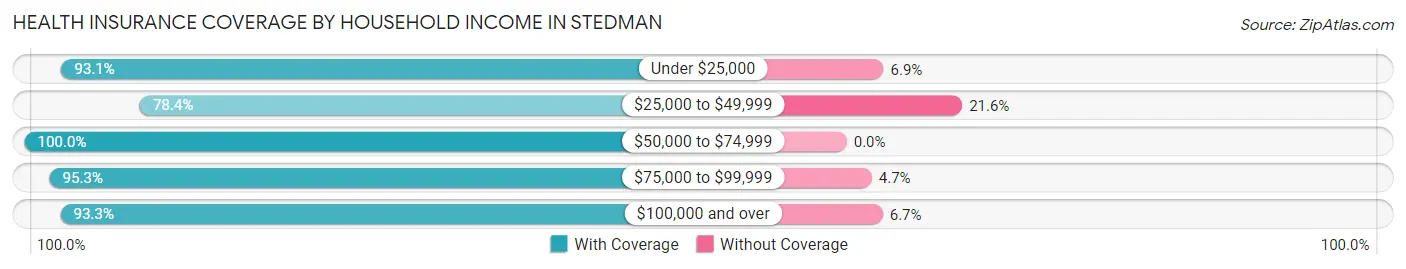
| Household Income | With Coverage | Without Coverage |
| Under $25,000 | 54 (93.1%) | 4 (6.9%) |
| $25,000 to $49,999 | 87 (78.4%) | 24 (21.6%) |
| $50,000 to $74,999 | 161 (100.0%) | 0 (0.0%) |
| $75,000 to $99,999 | 325 (95.3%) | 16 (4.7%) |
| $100,000 and over | 720 (93.3%) | 52 (6.7%) |
Public vs Private Health Insurance Coverage by Age in Stedman
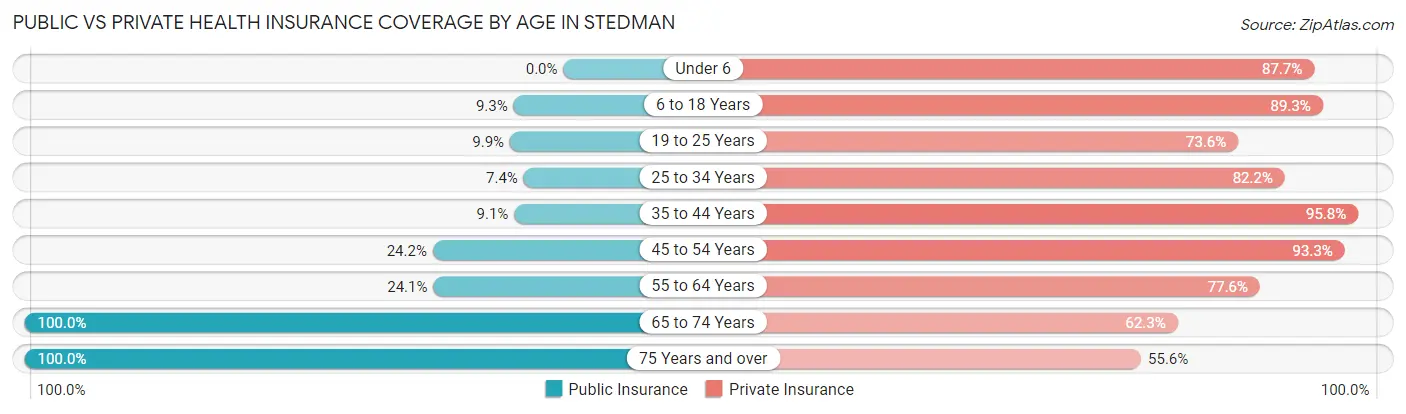
| Age Bracket | Public Insurance | Private Insurance |
| Under 6 | 0 (0.0%) | 71 (87.6%) |
| 6 to 18 Years | 31 (9.2%) | 299 (89.2%) |
| 19 to 25 Years | 12 (9.9%) | 89 (73.6%) |
| 25 to 34 Years | 12 (7.4%) | 134 (82.2%) |
| 35 to 44 Years | 24 (9.1%) | 252 (95.8%) |
| 45 to 54 Years | 40 (24.2%) | 154 (93.3%) |
| 55 to 64 Years | 42 (24.1%) | 135 (77.6%) |
| 65 to 74 Years | 69 (100.0%) | 43 (62.3%) |
| 75 Years and over | 72 (100.0%) | 40 (55.6%) |
| Total | 302 (20.9%) | 1,217 (84.3%) |
Disability Status by Sex by Age in Stedman
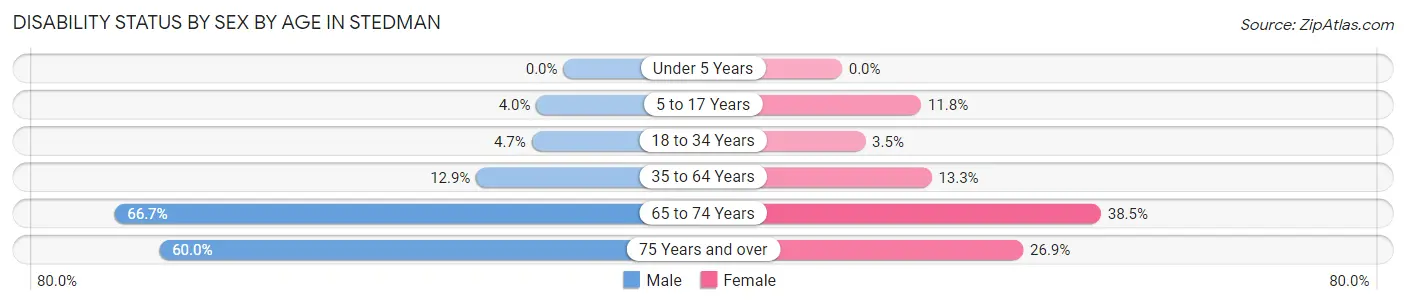
| Age Bracket | Male | Female |
| Under 5 Years | 0 (0.0%) | 0 (0.0%) |
| 5 to 17 Years | 7 (4.0%) | 12 (11.8%) |
| 18 to 34 Years | 8 (4.7%) | 6 (3.5%) |
| 35 to 64 Years | 40 (12.9%) | 39 (13.3%) |
| 65 to 74 Years | 20 (66.7%) | 15 (38.5%) |
| 75 Years and over | 12 (60.0%) | 14 (26.9%) |
Disability Class by Sex by Age in Stedman
Disability Class: Hearing Difficulty
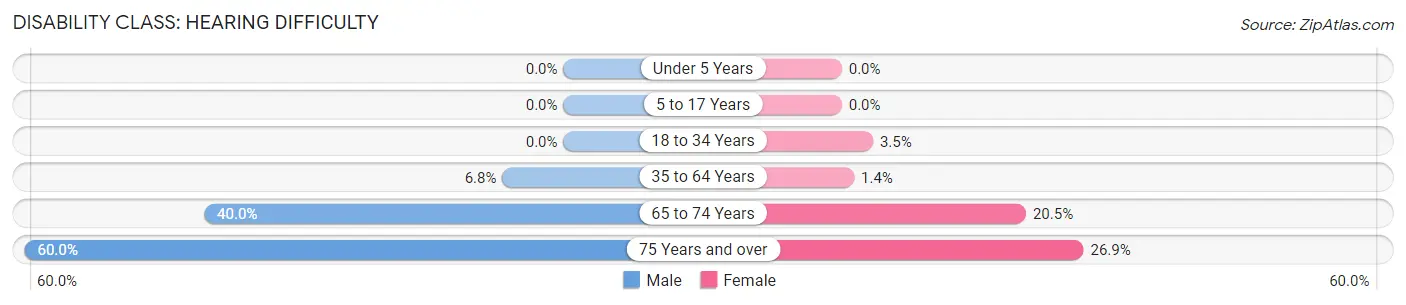
| Age Bracket | Male | Female |
| Under 5 Years | 0 (0.0%) | 0 (0.0%) |
| 5 to 17 Years | 0 (0.0%) | 0 (0.0%) |
| 18 to 34 Years | 0 (0.0%) | 6 (3.5%) |
| 35 to 64 Years | 21 (6.8%) | 4 (1.4%) |
| 65 to 74 Years | 12 (40.0%) | 8 (20.5%) |
| 75 Years and over | 12 (60.0%) | 14 (26.9%) |
Disability Class: Vision Difficulty
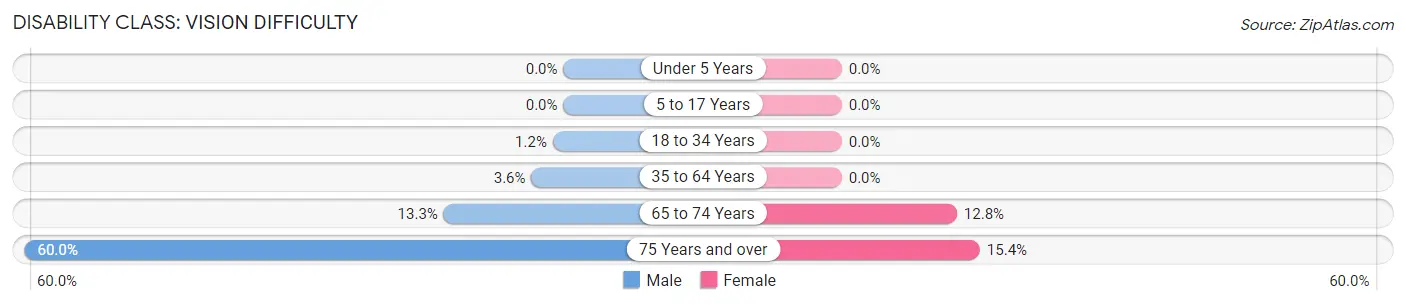
| Age Bracket | Male | Female |
| Under 5 Years | 0 (0.0%) | 0 (0.0%) |
| 5 to 17 Years | 0 (0.0%) | 0 (0.0%) |
| 18 to 34 Years | 2 (1.2%) | 0 (0.0%) |
| 35 to 64 Years | 11 (3.6%) | 0 (0.0%) |
| 65 to 74 Years | 4 (13.3%) | 5 (12.8%) |
| 75 Years and over | 12 (60.0%) | 8 (15.4%) |
Disability Class: Cognitive Difficulty
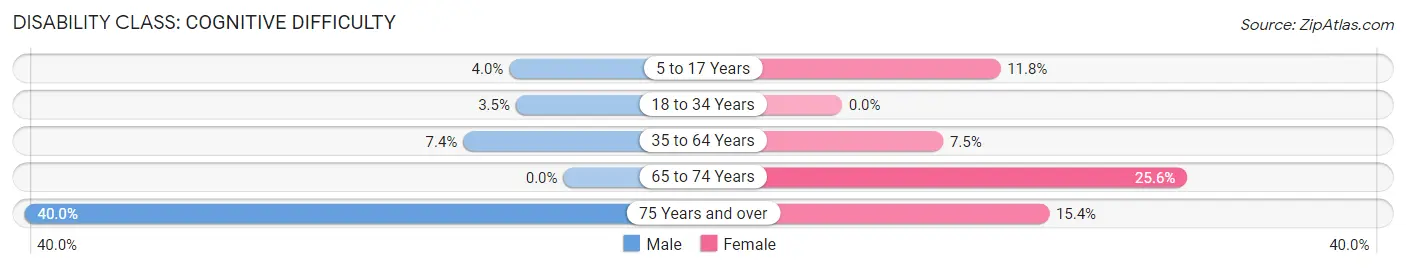
| Age Bracket | Male | Female |
| 5 to 17 Years | 7 (4.0%) | 12 (11.8%) |
| 18 to 34 Years | 6 (3.5%) | 0 (0.0%) |
| 35 to 64 Years | 23 (7.4%) | 22 (7.5%) |
| 65 to 74 Years | 0 (0.0%) | 10 (25.6%) |
| 75 Years and over | 8 (40.0%) | 8 (15.4%) |
Disability Class: Ambulatory Difficulty
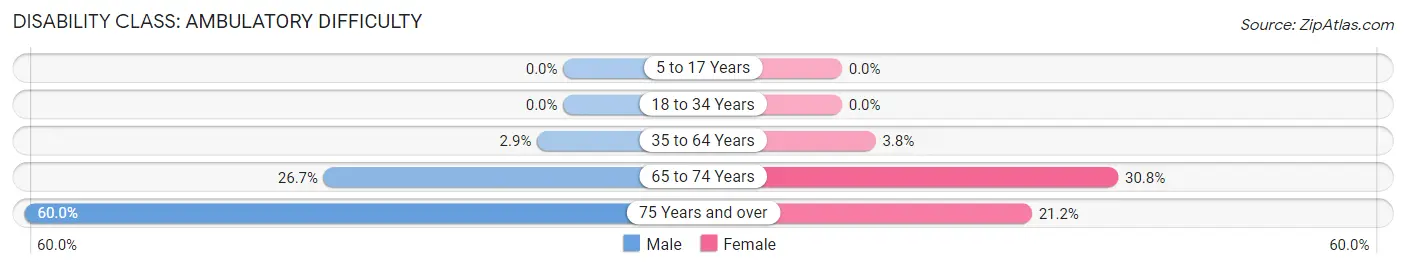
| Age Bracket | Male | Female |
| 5 to 17 Years | 0 (0.0%) | 0 (0.0%) |
| 18 to 34 Years | 0 (0.0%) | 0 (0.0%) |
| 35 to 64 Years | 9 (2.9%) | 11 (3.7%) |
| 65 to 74 Years | 8 (26.7%) | 12 (30.8%) |
| 75 Years and over | 12 (60.0%) | 11 (21.1%) |
Disability Class: Self-Care Difficulty
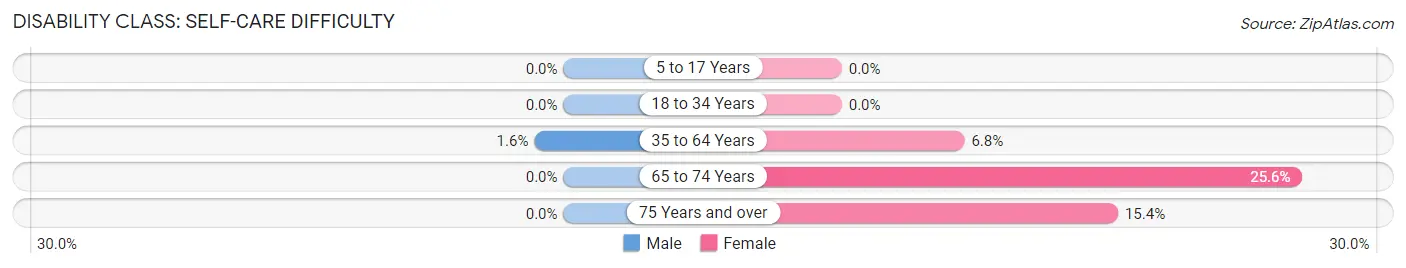
| Age Bracket | Male | Female |
| 5 to 17 Years | 0 (0.0%) | 0 (0.0%) |
| 18 to 34 Years | 0 (0.0%) | 0 (0.0%) |
| 35 to 64 Years | 5 (1.6%) | 20 (6.8%) |
| 65 to 74 Years | 0 (0.0%) | 10 (25.6%) |
| 75 Years and over | 0 (0.0%) | 8 (15.4%) |
Technology Access in Stedman
Computing Device Access in Stedman
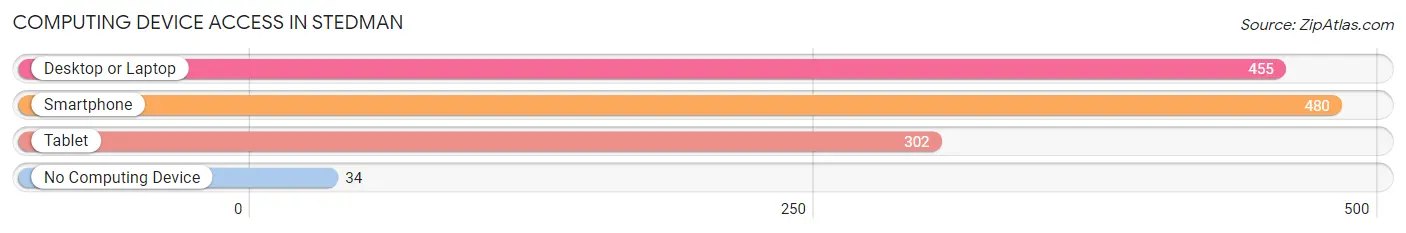
| Device Type | # Households | % Households |
| Desktop or Laptop | 455 | 84.7% |
| Smartphone | 480 | 89.4% |
| Tablet | 302 | 56.2% |
| No Computing Device | 34 | 6.3% |
| Total | 537 | 100.0% |
Internet Access in Stedman
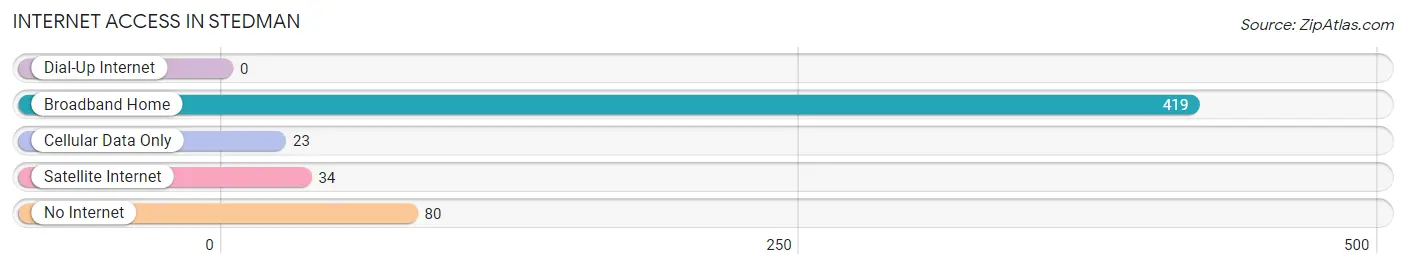
| Internet Type | # Households | % Households |
| Dial-Up Internet | 0 | 0.0% |
| Broadband Home | 419 | 78.0% |
| Cellular Data Only | 23 | 4.3% |
| Satellite Internet | 34 | 6.3% |
| No Internet | 80 | 14.9% |
| Total | 537 | 100.0% |
Stedman Summary
Stedman, North Carolina is a small town located in Cumberland County, North Carolina. It is situated about 20 miles south of Fayetteville and is part of the Fayetteville Metropolitan Statistical Area. The town was founded in 1887 and has a population of approximately 2,000 people.
History
Stedman was founded in 1887 by a group of settlers from Scotland. The town was named after a Scottish minister, Rev. John Stedman, who had served in the area. The town was originally a farming community, but it soon developed into a small industrial center. The first industry in Stedman was a cotton mill, which was established in 1891. The mill was owned by the Stedman Manufacturing Company and employed many of the town’s residents.
In the early 1900s, Stedman experienced a period of growth and prosperity. The town was home to several businesses, including a bank, a hotel, a movie theater, and a variety of stores. The town also had a railroad station, which connected it to other towns in the area.
In the 1950s, Stedman began to decline. The cotton mill closed in 1957, and many of the businesses in town closed as well. The town’s population decreased, and by the 1970s, Stedman was a small, quiet town.
In the 1980s, Stedman began to experience a resurgence. The town was designated as a historic district in 1984, and many of the old buildings were restored. The town also began to attract new businesses, and the population began to increase.
Geography
Stedman is located in the Sandhills region of North Carolina. The town is situated on the banks of the Cape Fear River, and the terrain is mostly flat. The town is surrounded by forests and farmland, and there are several small lakes in the area.
The climate in Stedman is mild and humid. The average temperature in the summer is around 80 degrees Fahrenheit, and the average temperature in the winter is around 40 degrees Fahrenheit. The town receives an average of 48 inches of rain per year.
Economy
The economy of Stedman is largely based on agriculture and tourism. The town is home to several farms, and the surrounding area is known for its production of tobacco, cotton, and soybeans. The town also has several small businesses, including restaurants, shops, and a movie theater.
Tourism is an important part of the economy in Stedman. The town is home to several historic sites, including the Stedman Cotton Mill, which is listed on the National Register of Historic Places. The town also has several parks and recreational areas, including the Stedman Recreation Area, which offers camping, fishing, and hiking.
Demographics
As of the 2010 census, the population of Stedman was 2,039. The racial makeup of the town was 79.3% White, 16.2% African American, 0.7% Native American, 0.3% Asian, 0.1% Pacific Islander, and 3.4% from other races. The median household income in Stedman was $35,938, and the median age was 38.
Stedman is a small, close-knit community. The town is home to several churches, and there are several organizations and clubs that are active in the community. The town also has a strong sense of pride, and many of the residents are involved in local events and activities.
Common Questions
What is Per Capita Income in Stedman?
Per Capita income in Stedman is $37,229.
What is the Median Family Income in Stedman?
Median Family Income in Stedman is $100,076.
What is the Median Household income in Stedman?
Median Household Income in Stedman is $98,615.
What is Income or Wage Gap in Stedman?
Income or Wage Gap in Stedman is 26.8%.
Women in Stedman earn 73.2 cents for every dollar earned by a man.
What is Inequality or Gini Index in Stedman?
Inequality or Gini Index in Stedman is 0.31.
What is the Total Population of Stedman?
Total Population of Stedman is 1,479.
What is the Total Male Population of Stedman?
Total Male Population of Stedman is 801.
What is the Total Female Population of Stedman?
Total Female Population of Stedman is 678.
What is the Ratio of Males per 100 Females in Stedman?
There are 118.14 Males per 100 Females in Stedman.
What is the Ratio of Females per 100 Males in Stedman?
There are 84.64 Females per 100 Males in Stedman.
What is the Median Population Age in Stedman?
Median Population Age in Stedman is 35.4 Years.
What is the Average Family Size in Stedman
Average Family Size in Stedman is 3.3 People.
What is the Average Household Size in Stedman
Average Household Size in Stedman is 2.8 People.
How Large is the Labor Force in Stedman?
There are 792 People in the Labor Forcein in Stedman.
What is the Percentage of People in the Labor Force in Stedman?
67.4% of People are in the Labor Force in Stedman.
What is the Unemployment Rate in Stedman?
Unemployment Rate in Stedman is 1.9%.