Henderson, NC Map & Demographics
Henderson Map
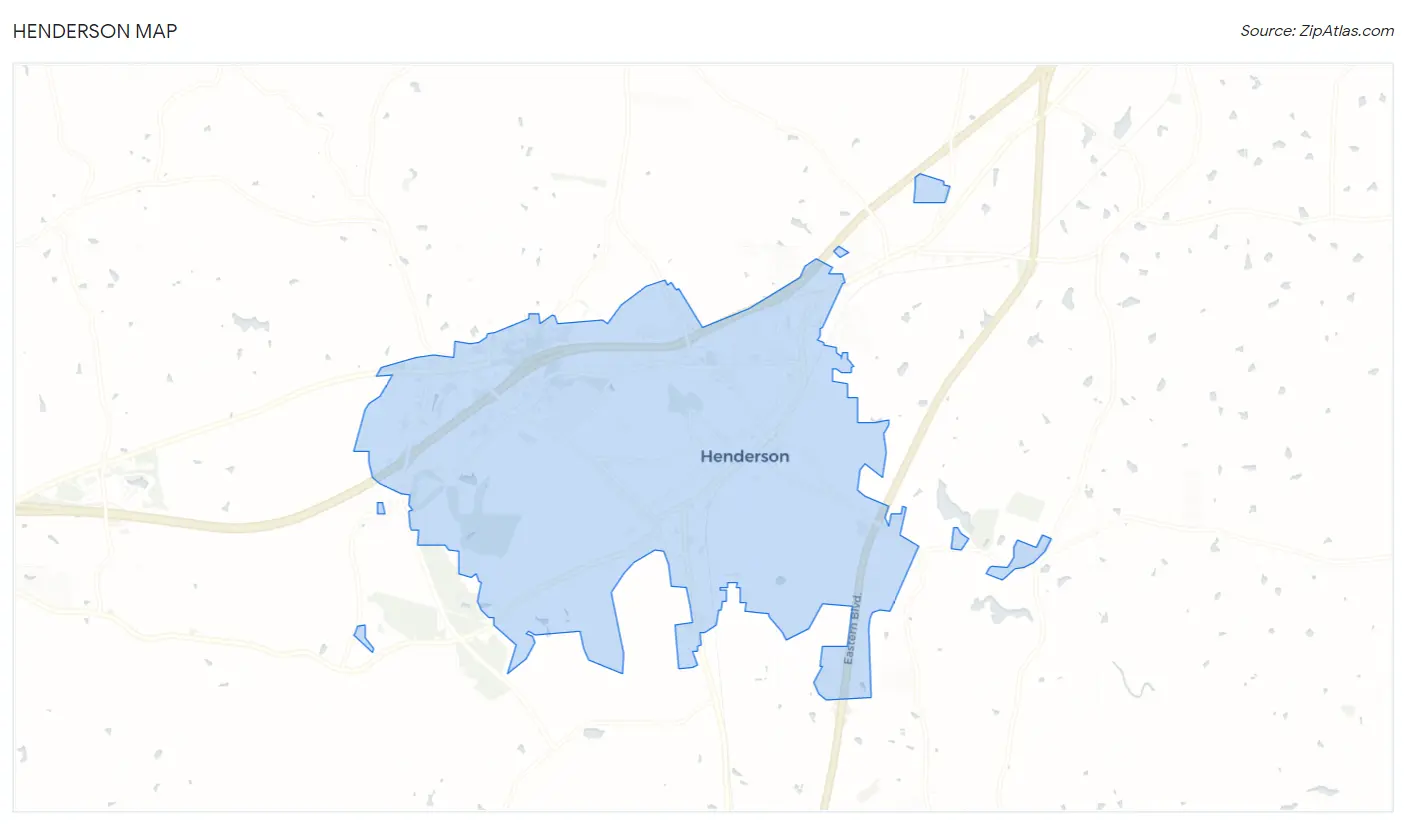
Henderson Overview
$22,916
PER CAPITA INCOME
$53,258
AVG FAMILY INCOME
$37,670
AVG HOUSEHOLD INCOME
20.8%
WAGE / INCOME GAP [ % ]
79.2¢/ $1
WAGE / INCOME GAP [ $ ]
$11,864
FAMILY INCOME DEFICIT
0.50
INEQUALITY / GINI INDEX
14,997
TOTAL POPULATION
6,454
MALE POPULATION
8,543
FEMALE POPULATION
75.55
MALES / 100 FEMALES
132.37
FEMALES / 100 MALES
35.8
MEDIAN AGE
3.3
AVG FAMILY SIZE
2.5
AVG HOUSEHOLD SIZE
6,734
LABOR FORCE [ PEOPLE ]
57.5%
PERCENT IN LABOR FORCE
6.7%
UNEMPLOYMENT RATE
Henderson Area Codes
Income in Henderson
Income Overview in Henderson
Per Capita Income in Henderson is $22,916, while median incomes of families and households are $53,258 and $37,670 respectively.
| Characteristic | Number | Measure |
| Per Capita Income | 14,997 | $22,916 |
| Median Family Income | 3,495 | $53,258 |
| Mean Family Income | 3,495 | $65,157 |
| Median Household Income | 5,832 | $37,670 |
| Mean Household Income | 5,832 | $53,730 |
| Income Deficit | 3,495 | $11,864 |
| Wage / Income Gap (%) | 14,997 | 20.83% |
| Wage / Income Gap ($) | 14,997 | 79.17¢ per $1 |
| Gini / Inequality Index | 14,997 | 0.50 |
Earnings by Sex in Henderson
Average Earnings in Henderson are $28,273, $31,718 for men and $25,112 for women, a difference of 20.8%.
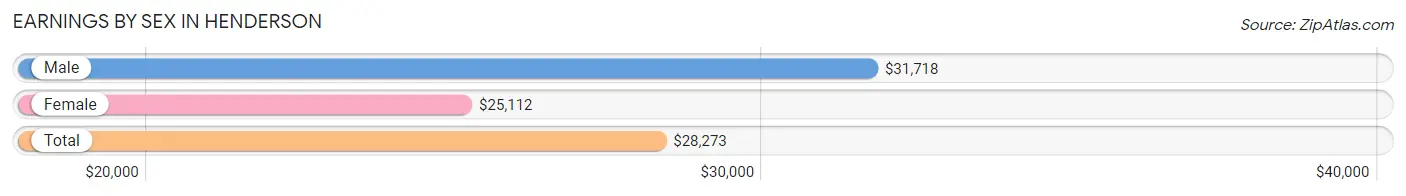
| Sex | Number | Average Earnings |
| Male | 3,089 (42.9%) | $31,718 |
| Female | 4,103 (57.1%) | $25,112 |
| Total | 7,192 (100.0%) | $28,273 |
Earnings by Sex by Income Bracket in Henderson
The most common earnings brackets in Henderson are $30,000 to $34,999 for men (412 | 13.3%) and $10,000 to $12,499 for women (400 | 9.8%).
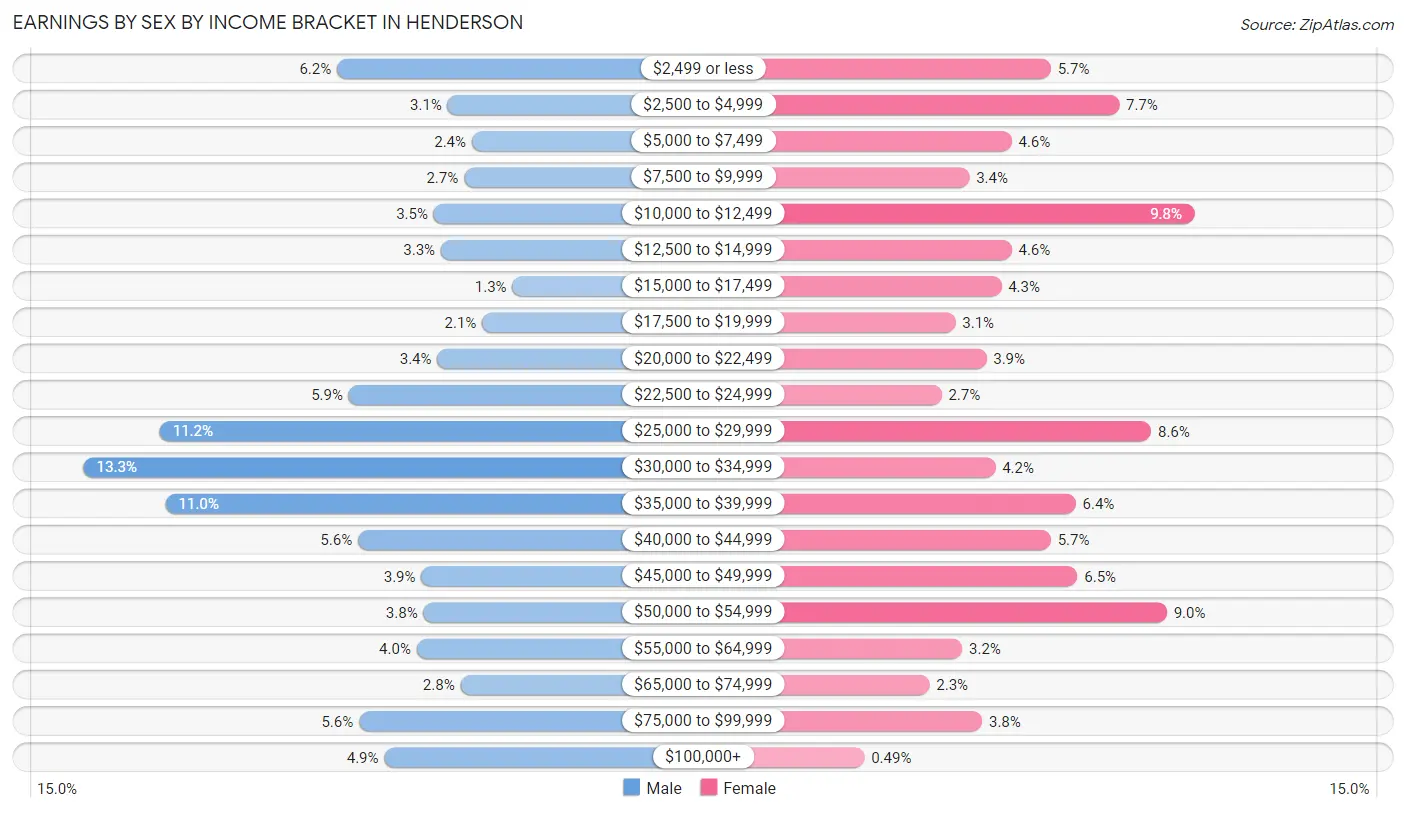
| Income | Male | Female |
| $2,499 or less | 192 (6.2%) | 235 (5.7%) |
| $2,500 to $4,999 | 96 (3.1%) | 314 (7.6%) |
| $5,000 to $7,499 | 75 (2.4%) | 190 (4.6%) |
| $7,500 to $9,999 | 82 (2.6%) | 141 (3.4%) |
| $10,000 to $12,499 | 108 (3.5%) | 400 (9.8%) |
| $12,500 to $14,999 | 102 (3.3%) | 190 (4.6%) |
| $15,000 to $17,499 | 40 (1.3%) | 178 (4.3%) |
| $17,500 to $19,999 | 66 (2.1%) | 125 (3.0%) |
| $20,000 to $22,499 | 105 (3.4%) | 161 (3.9%) |
| $22,500 to $24,999 | 182 (5.9%) | 109 (2.7%) |
| $25,000 to $29,999 | 346 (11.2%) | 351 (8.6%) |
| $30,000 to $34,999 | 412 (13.3%) | 171 (4.2%) |
| $35,000 to $39,999 | 341 (11.0%) | 264 (6.4%) |
| $40,000 to $44,999 | 174 (5.6%) | 235 (5.7%) |
| $45,000 to $49,999 | 119 (3.8%) | 266 (6.5%) |
| $50,000 to $54,999 | 117 (3.8%) | 369 (9.0%) |
| $55,000 to $64,999 | 123 (4.0%) | 133 (3.2%) |
| $65,000 to $74,999 | 85 (2.8%) | 95 (2.3%) |
| $75,000 to $99,999 | 173 (5.6%) | 156 (3.8%) |
| $100,000+ | 151 (4.9%) | 20 (0.5%) |
| Total | 3,089 (100.0%) | 4,103 (100.0%) |
Earnings by Sex by Educational Attainment in Henderson
Average earnings in Henderson are $32,645 for men and $30,207 for women, a difference of 7.5%. Men with an educational attainment of graduate degree enjoy the highest average annual earnings of $48,162, while those with less than high school education earn the least with $24,847. Women with an educational attainment of bachelor's degree earn the most with the average annual earnings of $46,115, while those with less than high school education have the smallest earnings of $26,250.
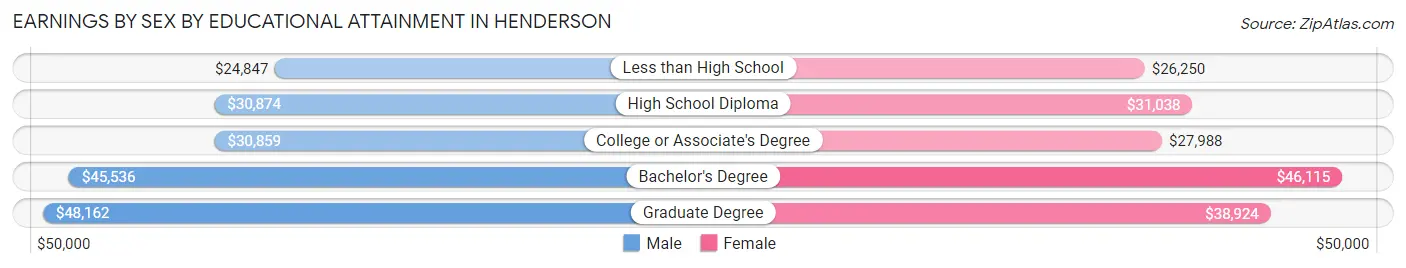
| Educational Attainment | Male Income | Female Income |
| Less than High School | $24,847 | $26,250 |
| High School Diploma | $30,874 | $31,038 |
| College or Associate's Degree | $30,859 | $27,988 |
| Bachelor's Degree | $45,536 | $46,115 |
| Graduate Degree | $48,162 | $38,924 |
| Total | $32,645 | $30,207 |
Family Income in Henderson
Family Income Brackets in Henderson
According to the Henderson family income data, there are 958 families falling into the $50,000 to $74,999 income range, which is the most common income bracket and makes up 27.4% of all families. Conversely, the $200,000+ income bracket is the least frequent group with only 80 families (2.3%) belonging to this category.
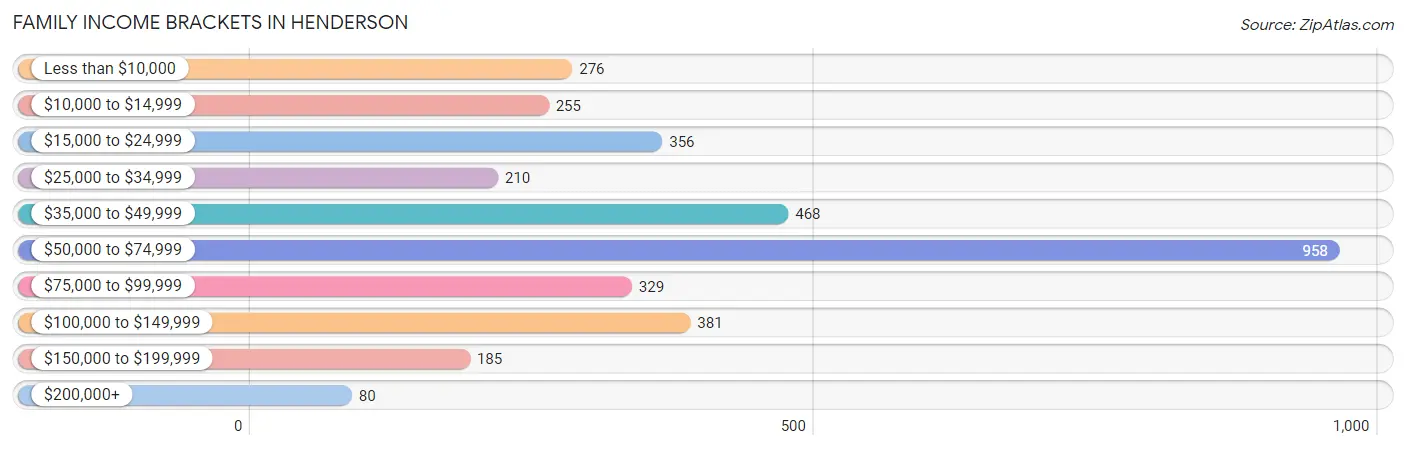
| Income Bracket | # Families | % Families |
| Less than $10,000 | 276 | 7.9% |
| $10,000 to $14,999 | 255 | 7.3% |
| $15,000 to $24,999 | 356 | 10.2% |
| $25,000 to $34,999 | 210 | 6.0% |
| $35,000 to $49,999 | 468 | 13.4% |
| $50,000 to $74,999 | 958 | 27.4% |
| $75,000 to $99,999 | 329 | 9.4% |
| $100,000 to $149,999 | 381 | 10.9% |
| $150,000 to $199,999 | 185 | 5.3% |
| $200,000+ | 80 | 2.3% |
Family Income by Famaliy Size in Henderson
5-person families (186 | 5.3%) account for the highest median family income in Henderson with $63,714 per family, while 2-person families (1,746 | 50.0%) have the highest median income of $26,554 per family member.
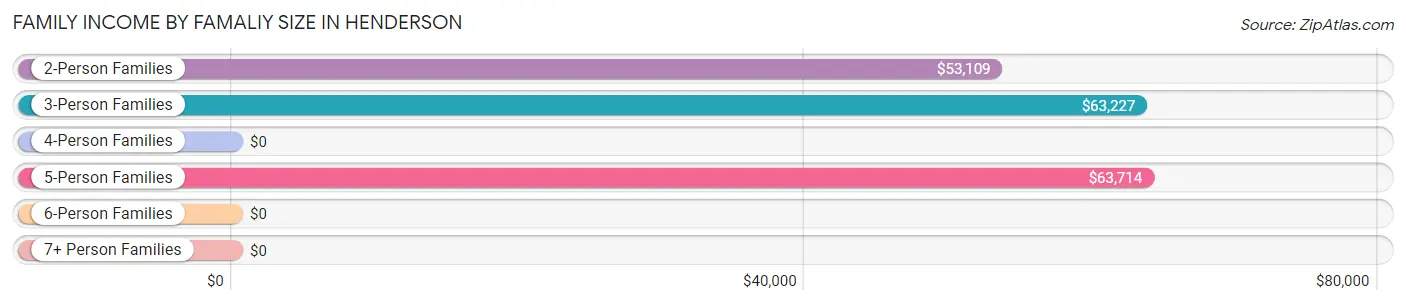
| Income Bracket | # Families | Median Income |
| 2-Person Families | 1,746 (50.0%) | $53,109 |
| 3-Person Families | 827 (23.7%) | $63,227 |
| 4-Person Families | 667 (19.1%) | $0 |
| 5-Person Families | 186 (5.3%) | $63,714 |
| 6-Person Families | 39 (1.1%) | $0 |
| 7+ Person Families | 30 (0.9%) | $0 |
| Total | 3,495 (100.0%) | $53,258 |
Family Income by Number of Earners in Henderson
The median family income in Henderson is $53,258, with families comprising 3+ earners (165) having the highest median family income of $129,375, while families with no earners (488) have the lowest median family income of $25,197, accounting for 4.7% and 14.0% of families, respectively.
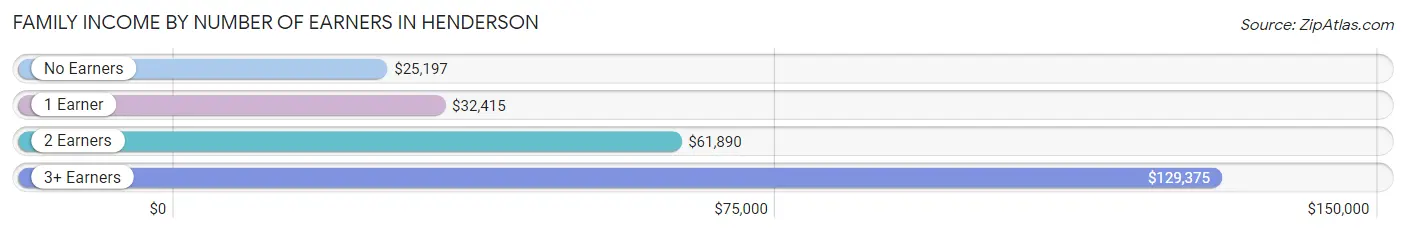
| Number of Earners | # Families | Median Income |
| No Earners | 488 (14.0%) | $25,197 |
| 1 Earner | 1,425 (40.8%) | $32,415 |
| 2 Earners | 1,417 (40.5%) | $61,890 |
| 3+ Earners | 165 (4.7%) | $129,375 |
| Total | 3,495 (100.0%) | $53,258 |
Household Income in Henderson
Household Income Brackets in Henderson
With 1,260 households falling in the category, the $50,000 to $74,999 income range is the most frequent in Henderson, accounting for 21.6% of all households. In contrast, only 93 households (1.6%) fall into the $200,000+ income bracket, making it the least populous group.
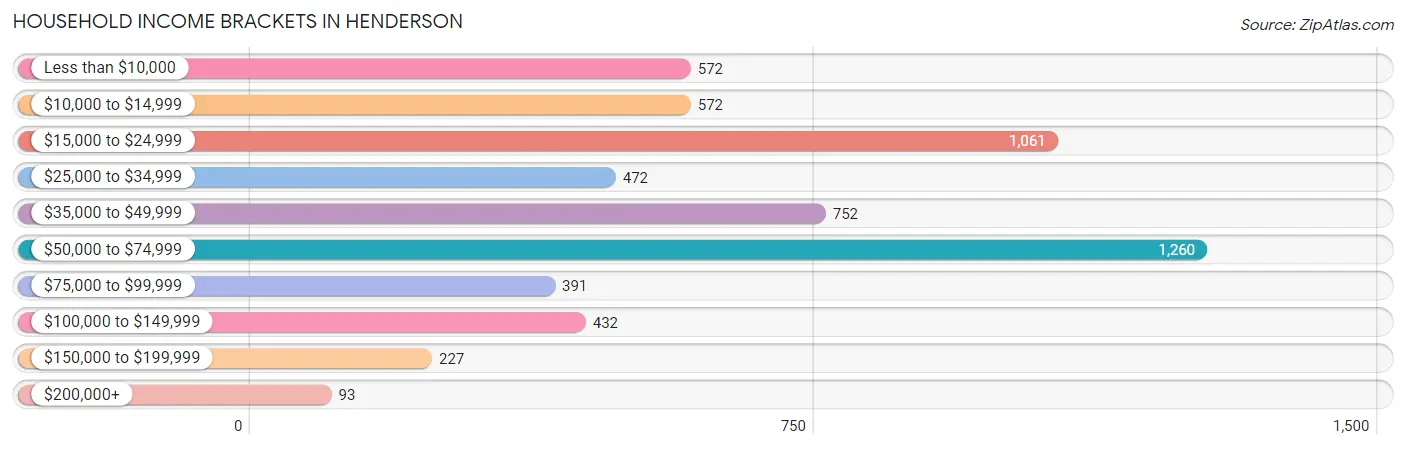
| Income Bracket | # Households | % Households |
| Less than $10,000 | 572 | 9.8% |
| $10,000 to $14,999 | 572 | 9.8% |
| $15,000 to $24,999 | 1,061 | 18.2% |
| $25,000 to $34,999 | 472 | 8.1% |
| $35,000 to $49,999 | 752 | 12.9% |
| $50,000 to $74,999 | 1,260 | 21.6% |
| $75,000 to $99,999 | 391 | 6.7% |
| $100,000 to $149,999 | 432 | 7.4% |
| $150,000 to $199,999 | 227 | 3.9% |
| $200,000+ | 93 | 1.6% |
Household Income by Householder Age in Henderson
The median household income in Henderson is $37,670, with the highest median household income of $44,018 found in the 45 to 64 years age bracket for the primary householder. A total of 2,158 households (37.0%) fall into this category. Meanwhile, the 15 to 24 years age bracket for the primary householder has the lowest median household income of $0, with 258 households (4.4%) in this group.
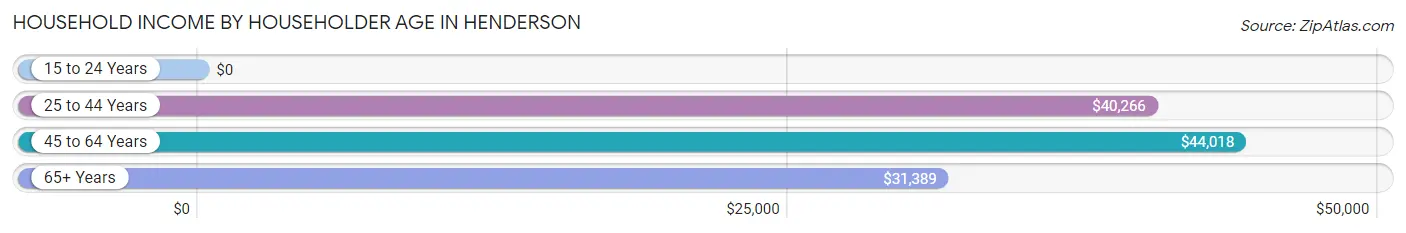
| Income Bracket | # Households | Median Income |
| 15 to 24 Years | 258 (4.4%) | $0 |
| 25 to 44 Years | 1,946 (33.4%) | $40,266 |
| 45 to 64 Years | 2,158 (37.0%) | $44,018 |
| 65+ Years | 1,470 (25.2%) | $31,389 |
| Total | 5,832 (100.0%) | $37,670 |
Poverty in Henderson
Income Below Poverty by Sex and Age in Henderson
With 22.0% poverty level for males and 29.9% for females among the residents of Henderson, 5 year old males and 15 year old females are the most vulnerable to poverty, with 10 males (100.0%) and 23 females (56.1%) in their respective age groups living below the poverty level.
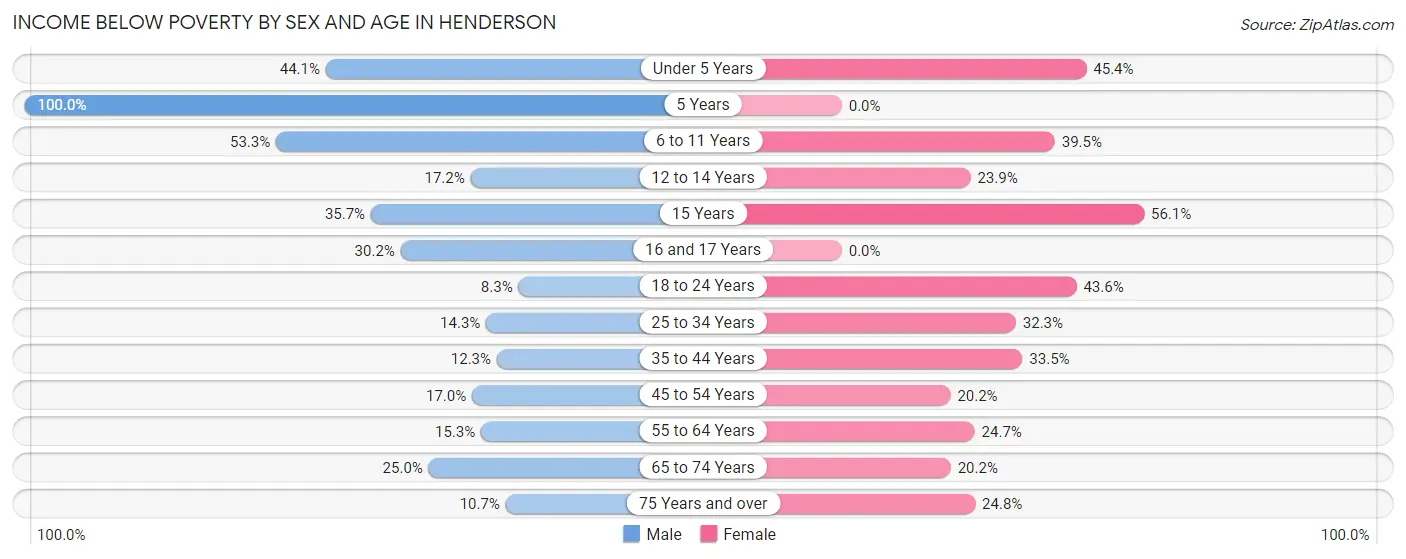
| Age Bracket | Male | Female |
| Under 5 Years | 273 (44.1%) | 271 (45.4%) |
| 5 Years | 10 (100.0%) | 0 (0.0%) |
| 6 to 11 Years | 296 (53.3%) | 291 (39.5%) |
| 12 to 14 Years | 41 (17.2%) | 97 (23.9%) |
| 15 Years | 10 (35.7%) | 23 (56.1%) |
| 16 and 17 Years | 74 (30.2%) | 0 (0.0%) |
| 18 to 24 Years | 59 (8.3%) | 406 (43.6%) |
| 25 to 34 Years | 130 (14.3%) | 317 (32.3%) |
| 35 to 44 Years | 68 (12.3%) | 366 (33.5%) |
| 45 to 54 Years | 149 (17.0%) | 167 (20.2%) |
| 55 to 64 Years | 117 (15.3%) | 274 (24.7%) |
| 65 to 74 Years | 121 (25.0%) | 150 (20.2%) |
| 75 Years and over | 26 (10.7%) | 146 (24.7%) |
| Total | 1,374 (22.0%) | 2,508 (29.9%) |
Income Above Poverty by Sex and Age in Henderson
According to the poverty statistics in Henderson, males aged 18 to 24 years and females aged 5 years are the age groups that are most secure financially, with 91.7% of males and 100.0% of females in these age groups living above the poverty line.
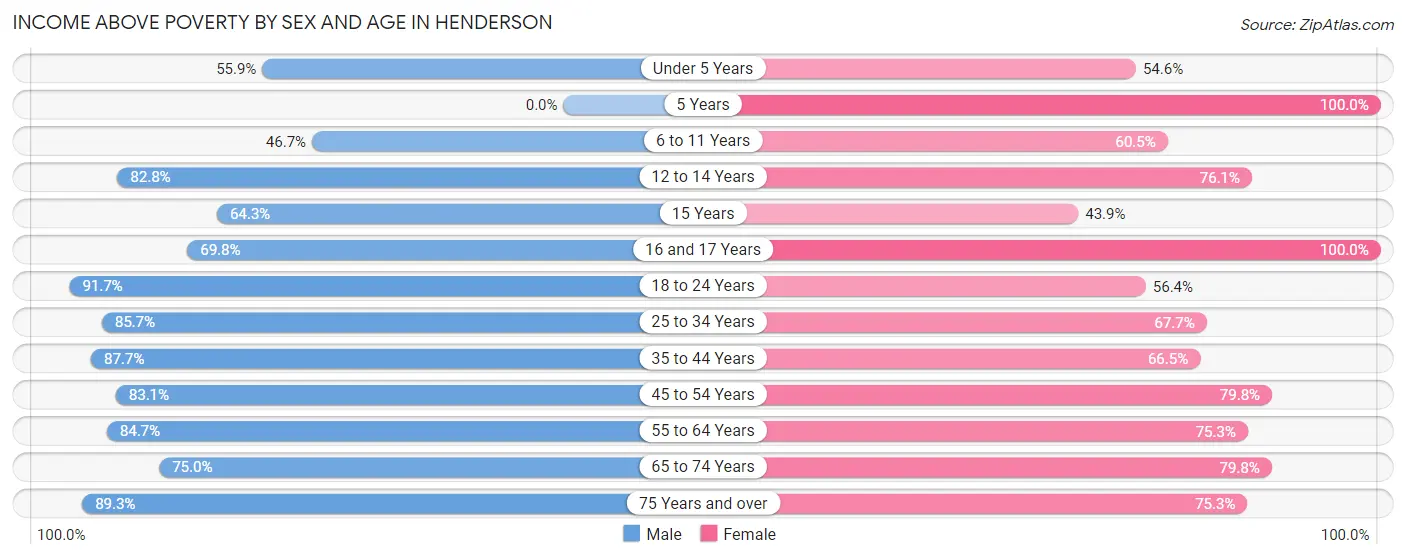
| Age Bracket | Male | Female |
| Under 5 Years | 346 (55.9%) | 326 (54.6%) |
| 5 Years | 0 (0.0%) | 55 (100.0%) |
| 6 to 11 Years | 259 (46.7%) | 445 (60.5%) |
| 12 to 14 Years | 197 (82.8%) | 309 (76.1%) |
| 15 Years | 18 (64.3%) | 18 (43.9%) |
| 16 and 17 Years | 171 (69.8%) | 271 (100.0%) |
| 18 to 24 Years | 649 (91.7%) | 526 (56.4%) |
| 25 to 34 Years | 777 (85.7%) | 664 (67.7%) |
| 35 to 44 Years | 483 (87.7%) | 726 (66.5%) |
| 45 to 54 Years | 730 (83.1%) | 661 (79.8%) |
| 55 to 64 Years | 649 (84.7%) | 837 (75.3%) |
| 65 to 74 Years | 363 (75.0%) | 592 (79.8%) |
| 75 Years and over | 217 (89.3%) | 444 (75.2%) |
| Total | 4,859 (78.0%) | 5,874 (70.1%) |
Income Below Poverty Among Married-Couple Families in Henderson
The poverty statistics for married-couple families in Henderson show that 3.6% or 47 of the total 1,322 families live below the poverty line. Families with 1 or 2 children have the highest poverty rate of 5.1%, comprising of 29 families. On the other hand, families with 3 or 4 children have the lowest poverty rate of 0.0%, which includes 0 families.
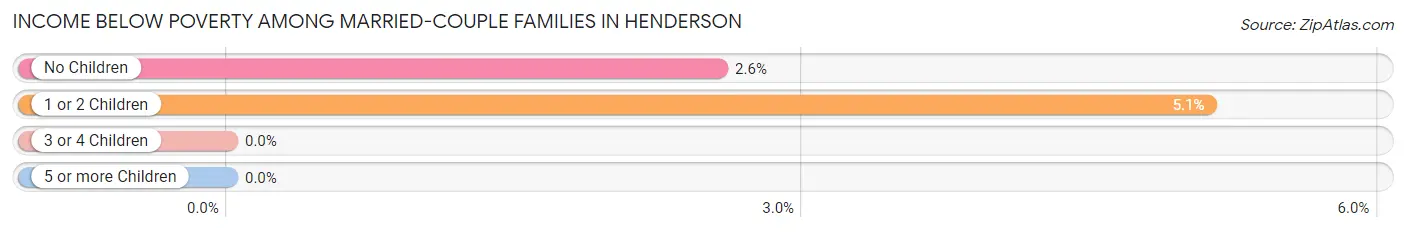
| Children | Above Poverty | Below Poverty |
| No Children | 685 (97.4%) | 18 (2.6%) |
| 1 or 2 Children | 539 (94.9%) | 29 (5.1%) |
| 3 or 4 Children | 30 (100.0%) | 0 (0.0%) |
| 5 or more Children | 21 (100.0%) | 0 (0.0%) |
| Total | 1,275 (96.4%) | 47 (3.6%) |
Income Below Poverty Among Single-Parent Households in Henderson
According to the poverty data in Henderson, 10.8% or 37 single-father households and 40.0% or 731 single-mother households are living below the poverty line. Among single-father households, those with 1 or 2 children have the highest poverty rate, with 37 households (17.3%) experiencing poverty. Likewise, among single-mother households, those with 3 or 4 children have the highest poverty rate, with 231 households (96.3%) falling below the poverty line.
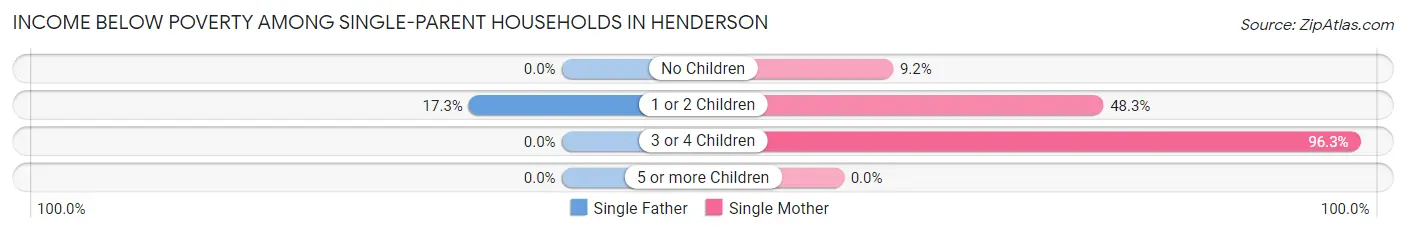
| Children | Single Father | Single Mother |
| No Children | 0 (0.0%) | 63 (9.2%) |
| 1 or 2 Children | 37 (17.3%) | 437 (48.3%) |
| 3 or 4 Children | 0 (0.0%) | 231 (96.3%) |
| 5 or more Children | 0 (0.0%) | 0 (0.0%) |
| Total | 37 (10.8%) | 731 (40.0%) |
Income Below Poverty Among Married-Couple vs Single-Parent Households in Henderson
The poverty data for Henderson shows that 47 of the married-couple family households (3.6%) and 768 of the single-parent households (35.3%) are living below the poverty level. Within the married-couple family households, those with 1 or 2 children have the highest poverty rate, with 29 households (5.1%) falling below the poverty line. Among the single-parent households, those with 3 or 4 children have the highest poverty rate, with 231 household (84.6%) living below poverty.
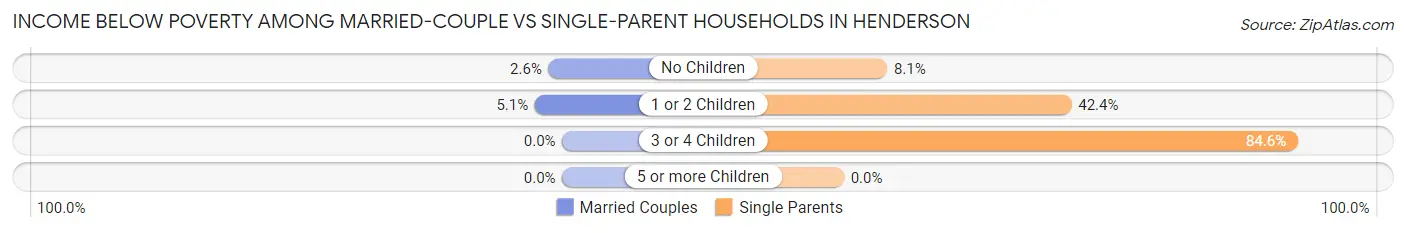
| Children | Married-Couple Families | Single-Parent Households |
| No Children | 18 (2.6%) | 63 (8.1%) |
| 1 or 2 Children | 29 (5.1%) | 474 (42.4%) |
| 3 or 4 Children | 0 (0.0%) | 231 (84.6%) |
| 5 or more Children | 0 (0.0%) | 0 (0.0%) |
| Total | 47 (3.6%) | 768 (35.3%) |
Race in Henderson
The most populous races in Henderson are Black / African American (9,471 | 63.1%), White / Caucasian (4,063 | 27.1%), and Hispanic or Latino (1,480 | 9.9%).
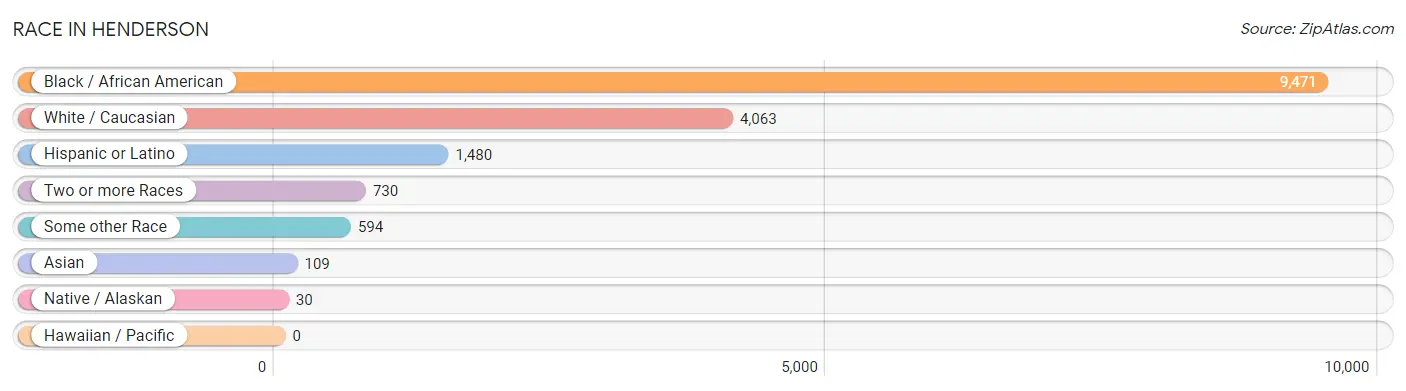
| Race | # Population | % Population |
| Asian | 109 | 0.7% |
| Black / African American | 9,471 | 63.1% |
| Hawaiian / Pacific | 0 | 0.0% |
| Hispanic or Latino | 1,480 | 9.9% |
| Native / Alaskan | 30 | 0.2% |
| White / Caucasian | 4,063 | 27.1% |
| Two or more Races | 730 | 4.9% |
| Some other Race | 594 | 4.0% |
| Total | 14,997 | 100.0% |
Ancestry in Henderson
The most populous ancestries reported in Henderson are American (1,318 | 8.8%), Mexican (1,169 | 7.8%), English (808 | 5.4%), Irish (623 | 4.2%), and Jamaican (383 | 2.5%), together accounting for 28.7% of all Henderson residents.
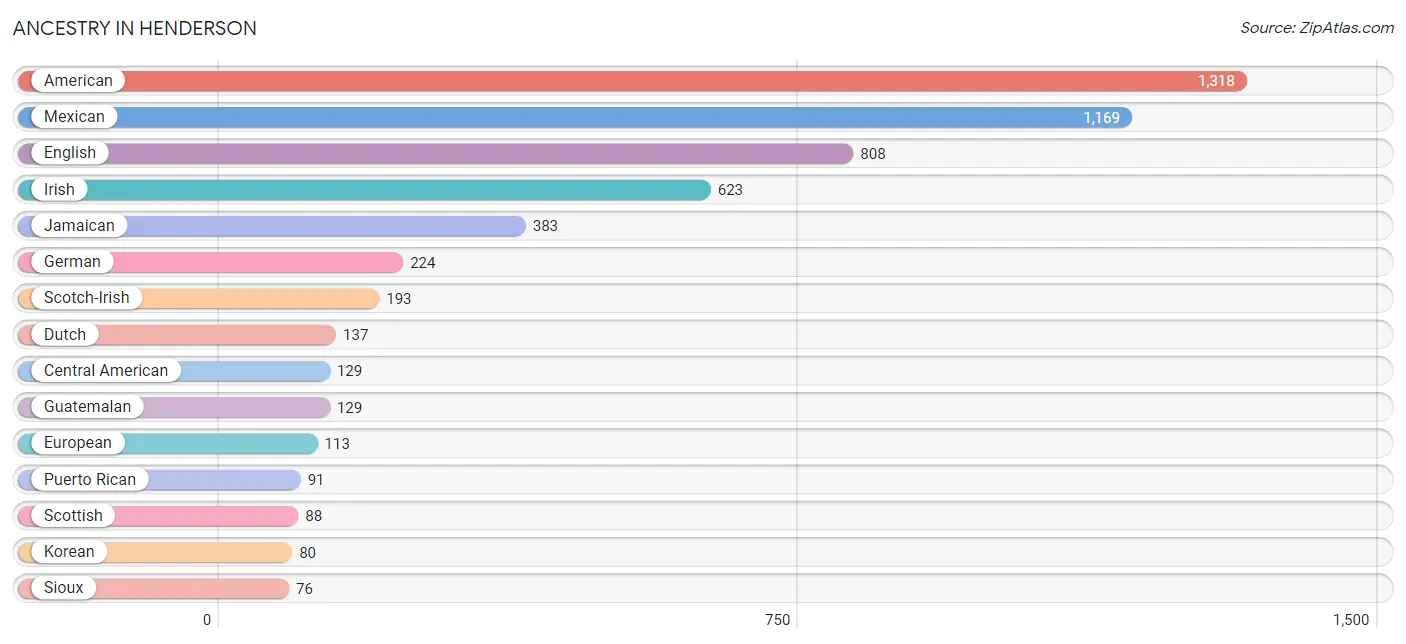
| Ancestry | # Population | % Population |
| African | 57 | 0.4% |
| American | 1,318 | 8.8% |
| Arab | 41 | 0.3% |
| British | 4 | 0.0% |
| Burmese | 18 | 0.1% |
| Central American | 129 | 0.9% |
| Central American Indian | 18 | 0.1% |
| Cherokee | 17 | 0.1% |
| Chilean | 18 | 0.1% |
| Colombian | 15 | 0.1% |
| Cuban | 54 | 0.4% |
| Dominican | 4 | 0.0% |
| Dutch | 137 | 0.9% |
| Dutch West Indian | 33 | 0.2% |
| Eastern European | 7 | 0.1% |
| Egyptian | 35 | 0.2% |
| English | 808 | 5.4% |
| European | 113 | 0.7% |
| French | 30 | 0.2% |
| German | 224 | 1.5% |
| Greek | 7 | 0.1% |
| Guatemalan | 129 | 0.9% |
| Haitian | 42 | 0.3% |
| Irish | 623 | 4.2% |
| Italian | 44 | 0.3% |
| Jamaican | 383 | 2.5% |
| Korean | 80 | 0.5% |
| Lumbee | 16 | 0.1% |
| Mexican | 1,169 | 7.8% |
| Northern European | 9 | 0.1% |
| Norwegian | 20 | 0.1% |
| Portuguese | 13 | 0.1% |
| Puerto Rican | 91 | 0.6% |
| Scotch-Irish | 193 | 1.3% |
| Scottish | 88 | 0.6% |
| Sioux | 76 | 0.5% |
| South American | 33 | 0.2% |
| Subsaharan African | 57 | 0.4% |
| Swedish | 11 | 0.1% |
| Swiss | 9 | 0.1% |
| Thai | 29 | 0.2% |
| Turkish | 67 | 0.4% |
| Welsh | 11 | 0.1% | View All 43 Rows |
Immigrants in Henderson
The most numerous immigrant groups reported in Henderson came from Latin America (585 | 3.9%), Central America (324 | 2.2%), Caribbean (213 | 1.4%), Jamaica (209 | 1.4%), and Asia (200 | 1.3%), together accounting for 10.2% of all Henderson residents.
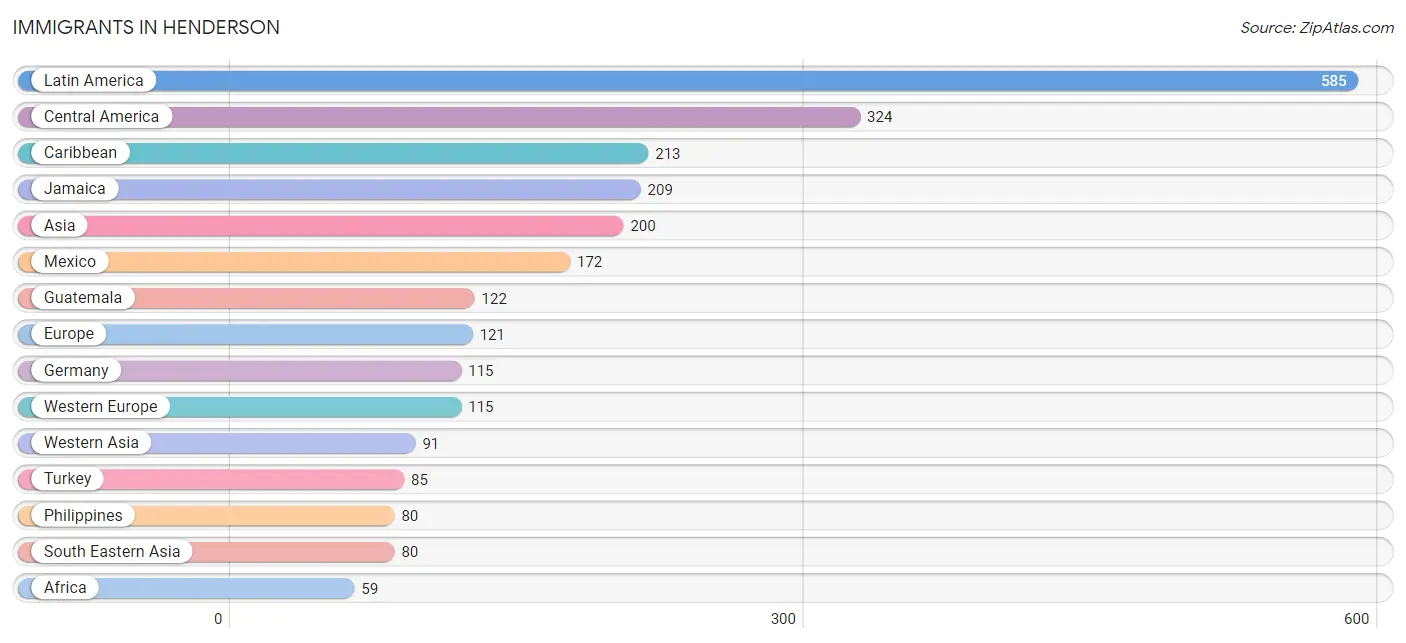
| Immigration Origin | # Population | % Population |
| Africa | 59 | 0.4% |
| Argentina | 15 | 0.1% |
| Asia | 200 | 1.3% |
| Caribbean | 213 | 1.4% |
| Central America | 324 | 2.2% |
| Chile | 18 | 0.1% |
| Colombia | 15 | 0.1% |
| Dominican Republic | 4 | 0.0% |
| Eastern Europe | 6 | 0.0% |
| Egypt | 59 | 0.4% |
| El Salvador | 30 | 0.2% |
| Europe | 121 | 0.8% |
| Germany | 115 | 0.8% |
| Guatemala | 122 | 0.8% |
| India | 29 | 0.2% |
| Jamaica | 209 | 1.4% |
| Latin America | 585 | 3.9% |
| Mexico | 172 | 1.1% |
| Northern Africa | 59 | 0.4% |
| Philippines | 80 | 0.5% |
| Poland | 6 | 0.0% |
| South America | 48 | 0.3% |
| South Central Asia | 29 | 0.2% |
| South Eastern Asia | 80 | 0.5% |
| Turkey | 85 | 0.6% |
| Western Asia | 91 | 0.6% |
| Western Europe | 115 | 0.8% |
| Yemen | 6 | 0.0% | View All 28 Rows |
Sex and Age in Henderson
Sex and Age in Henderson
The most populous age groups in Henderson are Under 5 Years (619 | 9.6%) for men and 10 to 14 Years (765 | 8.9%) for women.
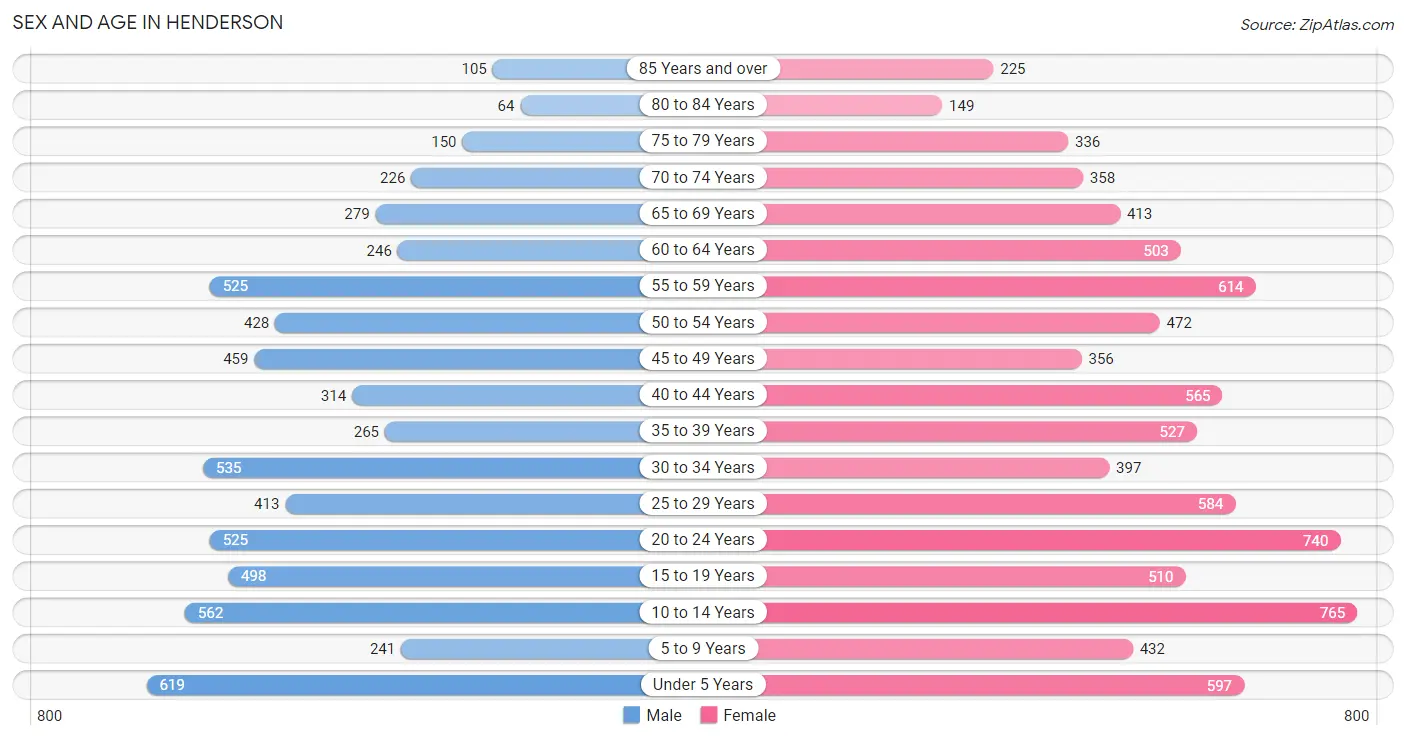
| Age Bracket | Male | Female |
| Under 5 Years | 619 (9.6%) | 597 (7.0%) |
| 5 to 9 Years | 241 (3.7%) | 432 (5.1%) |
| 10 to 14 Years | 562 (8.7%) | 765 (8.9%) |
| 15 to 19 Years | 498 (7.7%) | 510 (6.0%) |
| 20 to 24 Years | 525 (8.1%) | 740 (8.7%) |
| 25 to 29 Years | 413 (6.4%) | 584 (6.8%) |
| 30 to 34 Years | 535 (8.3%) | 397 (4.6%) |
| 35 to 39 Years | 265 (4.1%) | 527 (6.2%) |
| 40 to 44 Years | 314 (4.9%) | 565 (6.6%) |
| 45 to 49 Years | 459 (7.1%) | 356 (4.2%) |
| 50 to 54 Years | 428 (6.6%) | 472 (5.5%) |
| 55 to 59 Years | 525 (8.1%) | 614 (7.2%) |
| 60 to 64 Years | 246 (3.8%) | 503 (5.9%) |
| 65 to 69 Years | 279 (4.3%) | 413 (4.8%) |
| 70 to 74 Years | 226 (3.5%) | 358 (4.2%) |
| 75 to 79 Years | 150 (2.3%) | 336 (3.9%) |
| 80 to 84 Years | 64 (1.0%) | 149 (1.7%) |
| 85 Years and over | 105 (1.6%) | 225 (2.6%) |
| Total | 6,454 (100.0%) | 8,543 (100.0%) |
Families and Households in Henderson
Median Family Size in Henderson
The median family size in Henderson is 3.28 persons per family, with single male/father families (343 | 9.8%) accounting for the largest median family size of 3.66 persons per family. On the other hand, single female/mother families (1,830 | 52.4%) represent the smallest median family size with 3.21 persons per family.
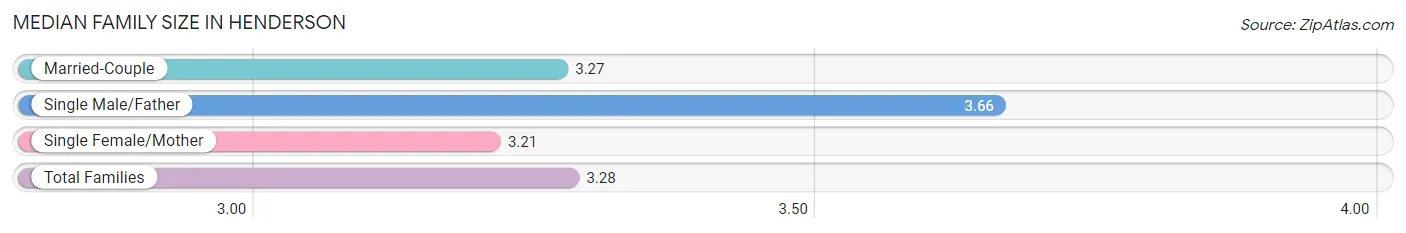
| Family Type | # Families | Family Size |
| Married-Couple | 1,322 (37.8%) | 3.27 |
| Single Male/Father | 343 (9.8%) | 3.66 |
| Single Female/Mother | 1,830 (52.4%) | 3.21 |
| Total Families | 3,495 (100.0%) | 3.28 |
Median Household Size in Henderson
The median household size in Henderson is 2.49 persons per household, with single male/father households (343 | 5.9%) accounting for the largest median household size of 4.21 persons per household. non-family households (2,337 | 40.1%) represent the smallest median household size with 1.17 persons per household.
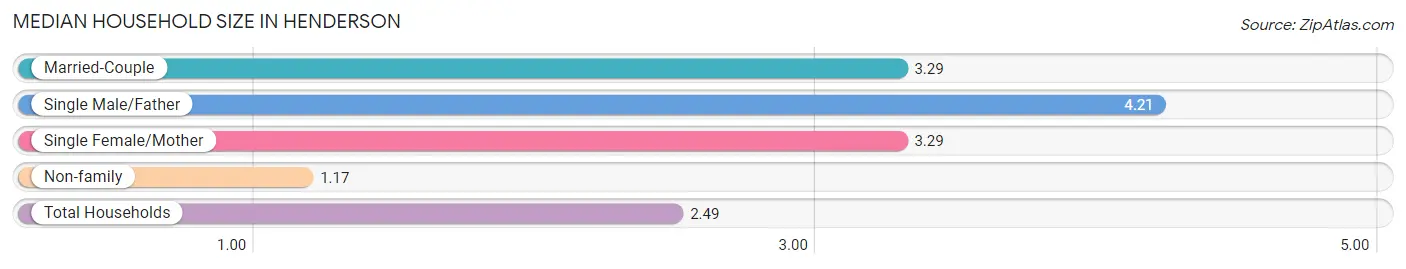
| Household Type | # Households | Household Size |
| Married-Couple | 1,322 (22.7%) | 3.29 |
| Single Male/Father | 343 (5.9%) | 4.21 |
| Single Female/Mother | 1,830 (31.4%) | 3.29 |
| Non-family | 2,337 (40.1%) | 1.17 |
| Total Households | 5,832 (100.0%) | 2.49 |
Household Size by Marriage Status in Henderson
Out of a total of 5,832 households in Henderson, 3,495 (59.9%) are family households, while 2,337 (40.1%) are nonfamily households. The most numerous type of family households are 2-person households, comprising 1,685, and the most common type of nonfamily households are 1-person households, comprising 2,009.
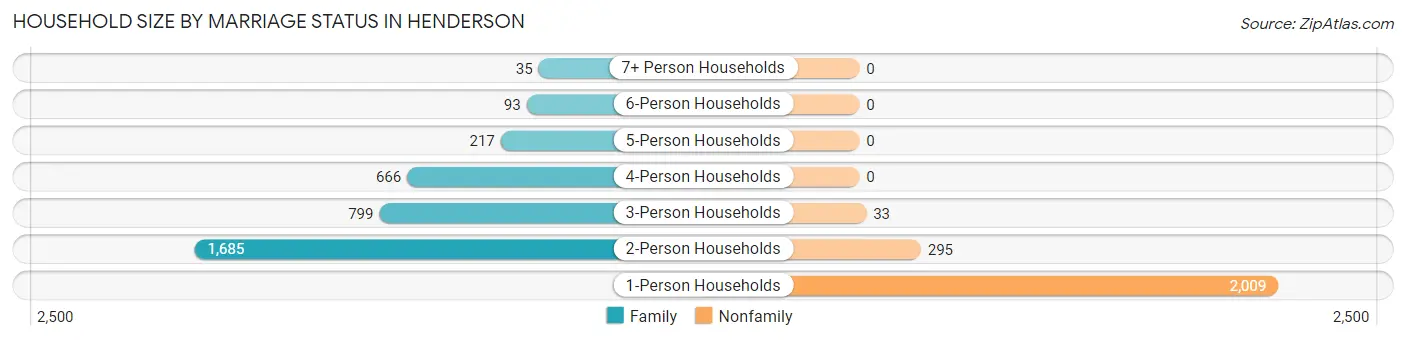
| Household Size | Family Households | Nonfamily Households |
| 1-Person Households | - | 2,009 (34.4%) |
| 2-Person Households | 1,685 (28.9%) | 295 (5.1%) |
| 3-Person Households | 799 (13.7%) | 33 (0.6%) |
| 4-Person Households | 666 (11.4%) | 0 (0.0%) |
| 5-Person Households | 217 (3.7%) | 0 (0.0%) |
| 6-Person Households | 93 (1.6%) | 0 (0.0%) |
| 7+ Person Households | 35 (0.6%) | 0 (0.0%) |
| Total | 3,495 (59.9%) | 2,337 (40.1%) |
Female Fertility in Henderson
Fertility by Age in Henderson
Average fertility rate in Henderson is 48.0 births per 1,000 women. Women in the age bracket of 20 to 34 years have the highest fertility rate with 84.0 births per 1,000 women. Women in the age bracket of 20 to 34 years acount for 80.0% of all women with births.
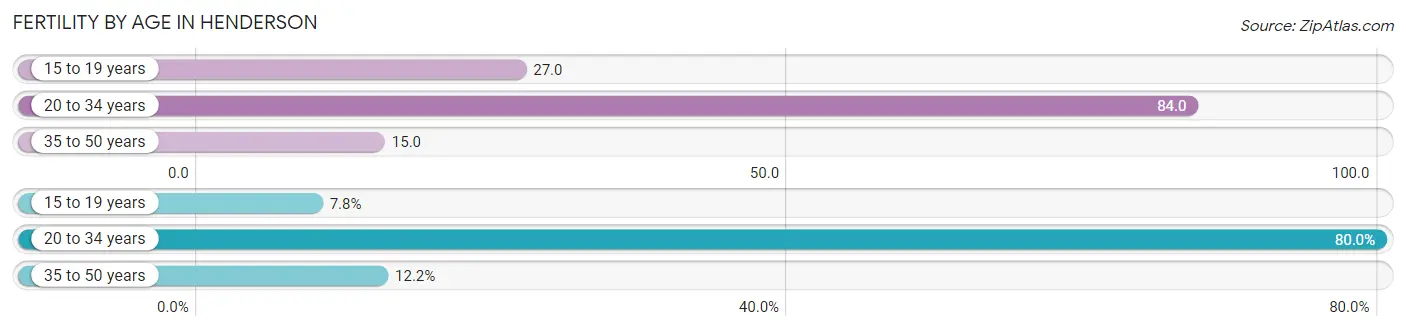
| Age Bracket | Women with Births | Births / 1,000 Women |
| 15 to 19 years | 14 (7.8%) | 27.0 |
| 20 to 34 years | 144 (80.0%) | 84.0 |
| 35 to 50 years | 22 (12.2%) | 15.0 |
| Total | 180 (100.0%) | 48.0 |
Fertility by Age by Marriage Status in Henderson
35.6% of women with births (180) in Henderson are married. The highest percentage of unmarried women with births falls into 15 to 19 years age bracket with 100.0% of them unmarried at the time of birth, while the lowest percentage of unmarried women with births belong to 35 to 50 years age bracket with 0.0% of them unmarried.
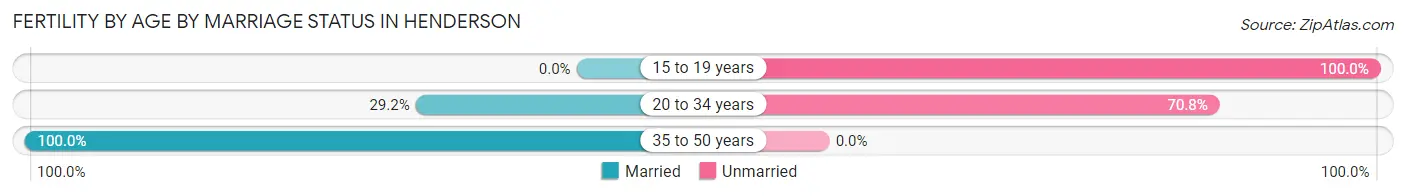
| Age Bracket | Married | Unmarried |
| 15 to 19 years | 0 (0.0%) | 14 (100.0%) |
| 20 to 34 years | 42 (29.2%) | 102 (70.8%) |
| 35 to 50 years | 22 (100.0%) | 0 (0.0%) |
| Total | 64 (35.6%) | 116 (64.4%) |
Fertility by Education in Henderson
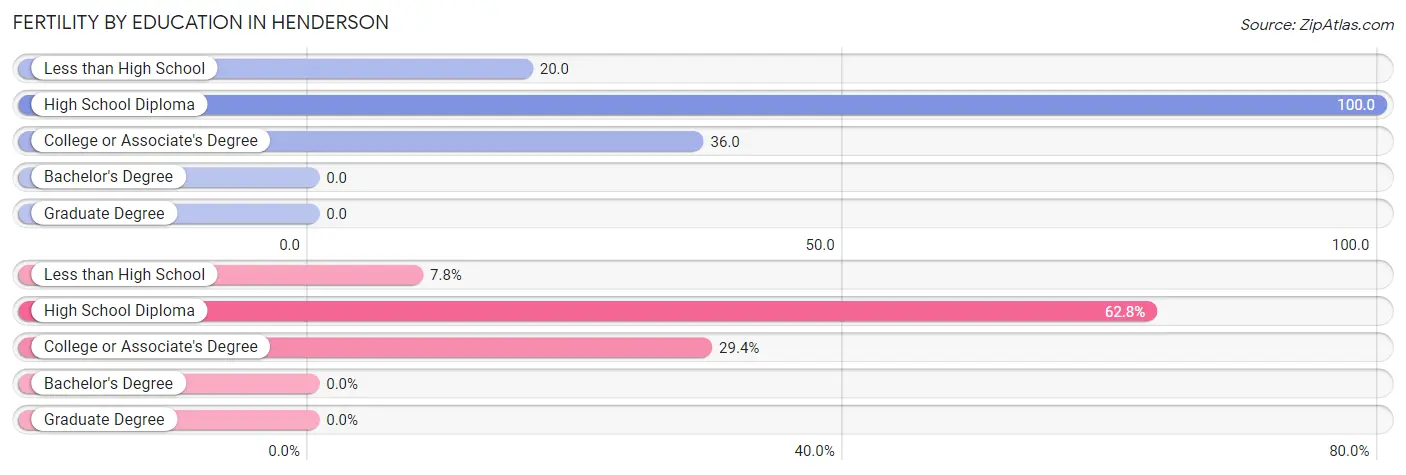
| Educational Attainment | Women with Births | Births / 1,000 Women |
| Less than High School | 14 (7.8%) | 20.0 |
| High School Diploma | 113 (62.8%) | 100.0 |
| College or Associate's Degree | 53 (29.4%) | 36.0 |
| Bachelor's Degree | 0 (0.0%) | 0.0 |
| Graduate Degree | 0 (0.0%) | 0.0 |
| Total | 180 (100.0%) | 48.0 |
Fertility by Education by Marriage Status in Henderson
64.4% of women with births in Henderson are unmarried. Women with the educational attainment of college or associate's degree are most likely to be married with 41.5% of them married at childbirth, while women with the educational attainment of less than high school are least likely to be married with 100.0% of them unmarried at childbirth.
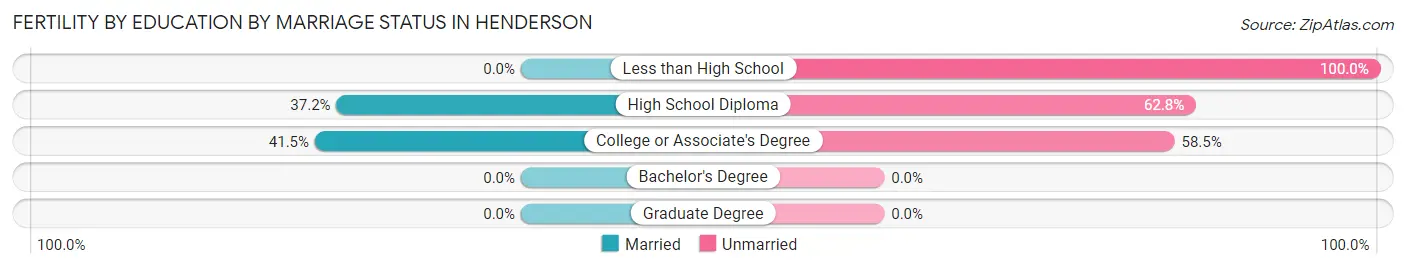
| Educational Attainment | Married | Unmarried |
| Less than High School | 0 (0.0%) | 14 (100.0%) |
| High School Diploma | 42 (37.2%) | 71 (62.8%) |
| College or Associate's Degree | 22 (41.5%) | 31 (58.5%) |
| Bachelor's Degree | 0 (0.0%) | 0 (0.0%) |
| Graduate Degree | 0 (0.0%) | 0 (0.0%) |
| Total | 64 (35.6%) | 116 (64.4%) |
Employment Characteristics in Henderson
Employment by Class of Employer in Henderson
Among the 6,154 employed individuals in Henderson, private company employees (4,319 | 70.2%), state government employees (509 | 8.3%), and not-for-profit organizations (389 | 6.3%) make up the most common classes of employment.
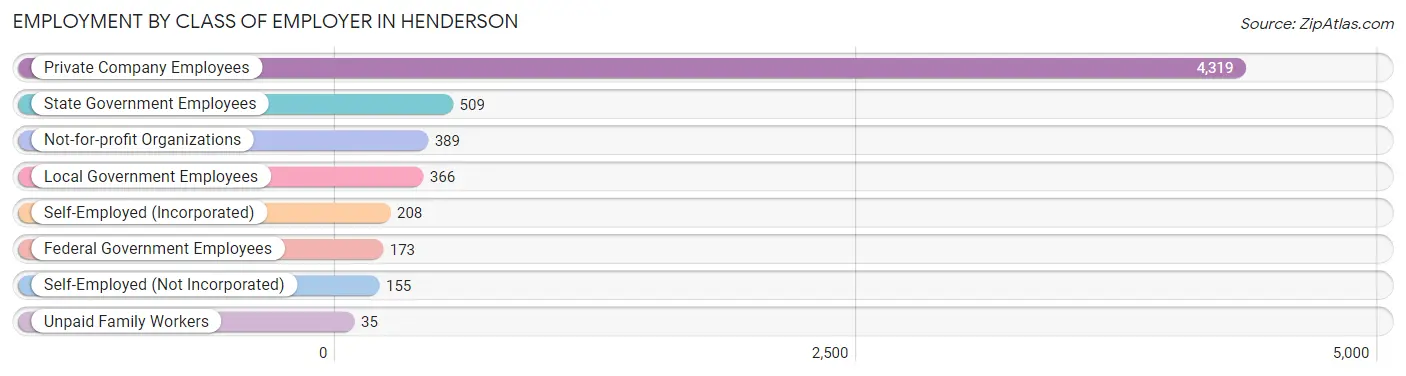
| Employer Class | # Employees | % Employees |
| Private Company Employees | 4,319 | 70.2% |
| Self-Employed (Incorporated) | 208 | 3.4% |
| Self-Employed (Not Incorporated) | 155 | 2.5% |
| Not-for-profit Organizations | 389 | 6.3% |
| Local Government Employees | 366 | 5.9% |
| State Government Employees | 509 | 8.3% |
| Federal Government Employees | 173 | 2.8% |
| Unpaid Family Workers | 35 | 0.6% |
| Total | 6,154 | 100.0% |
Employment Status by Age in Henderson
According to the labor force statistics for Henderson, out of the total population over 16 years of age (11,712), 57.5% or 6,734 individuals are in the labor force, with 6.7% or 451 of them unemployed. The age group with the highest labor force participation rate is 35 to 44 years, with 85.8% or 1,434 individuals in the labor force. Within the labor force, the 16 to 19 years age range has the highest percentage of unemployed individuals, with 26.9% or 68 of them being unemployed.
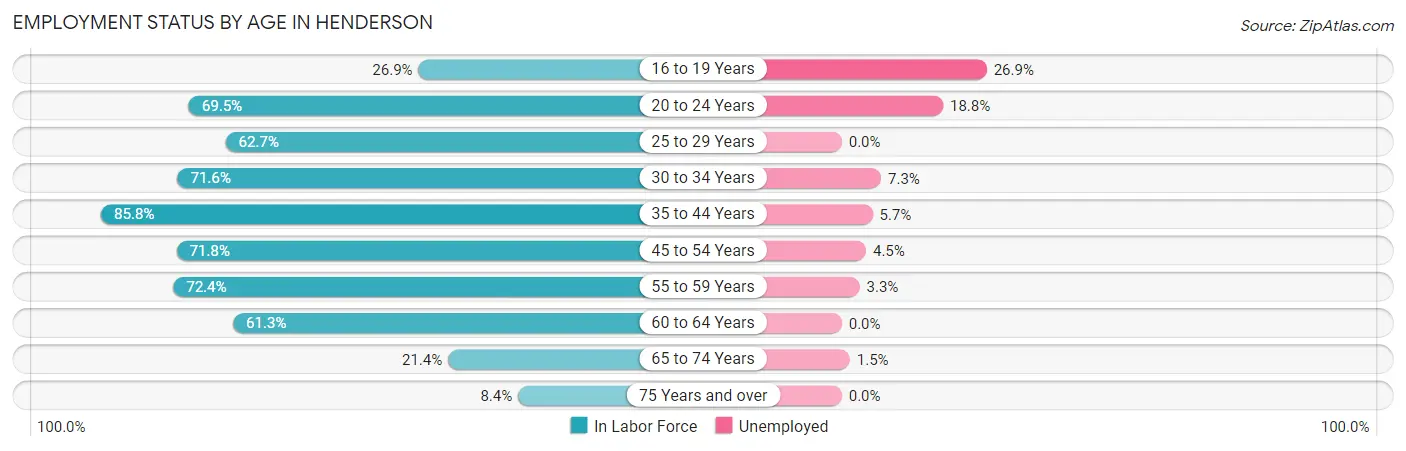
| Age Bracket | In Labor Force | Unemployed |
| 16 to 19 Years | 253 (26.9%) | 68 (26.9%) |
| 20 to 24 Years | 879 (69.5%) | 165 (18.8%) |
| 25 to 29 Years | 625 (62.7%) | 0 (0.0%) |
| 30 to 34 Years | 667 (71.6%) | 49 (7.3%) |
| 35 to 44 Years | 1,434 (85.8%) | 82 (5.7%) |
| 45 to 54 Years | 1,231 (71.8%) | 55 (4.5%) |
| 55 to 59 Years | 825 (72.4%) | 27 (3.3%) |
| 60 to 64 Years | 459 (61.3%) | 0 (0.0%) |
| 65 to 74 Years | 273 (21.4%) | 4 (1.5%) |
| 75 Years and over | 86 (8.4%) | 0 (0.0%) |
| Total | 6,734 (57.5%) | 451 (6.7%) |
Employment Status by Educational Attainment in Henderson
According to labor force statistics for Henderson, 72.7% of individuals (5,237) out of the total population between 25 and 64 years of age (7,203) are in the labor force, with 4.1% or 215 of them being unemployed. The group with the highest labor force participation rate are those with the educational attainment of bachelor's degree or higher, with 86.0% or 1,001 individuals in the labor force. Within the labor force, individuals with less than high school education have the highest percentage of unemployment, with 20.6% or 72 of them being unemployed.
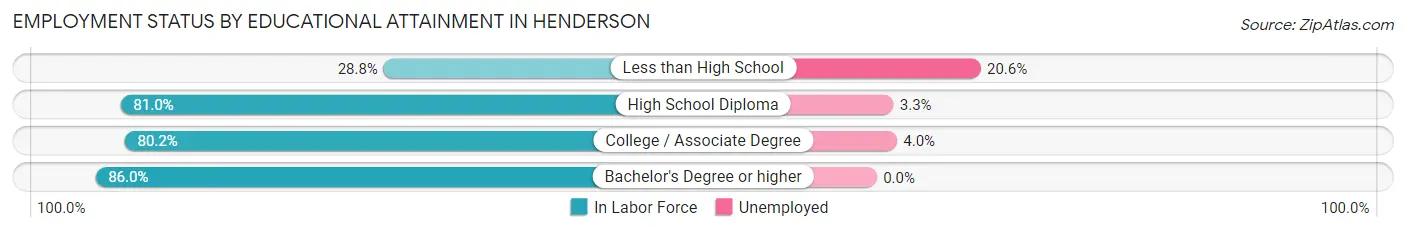
| Educational Attainment | In Labor Force | Unemployed |
| Less than High School | 349 (28.8%) | 250 (20.6%) |
| High School Diploma | 1,835 (81.0%) | 75 (3.3%) |
| College / Associate Degree | 2,054 (80.2%) | 102 (4.0%) |
| Bachelor's Degree or higher | 1,001 (86.0%) | 0 (0.0%) |
| Total | 5,237 (72.7%) | 295 (4.1%) |
Employment Occupations by Sex in Henderson
Management, Business, Science and Arts Occupations
The most common Management, Business, Science and Arts occupations in Henderson are Community & Social Service (884 | 14.1%), Education Instruction & Library (459 | 7.3%), Business & Financial (351 | 5.6%), Health Diagnosing & Treating (334 | 5.3%), and Education, Arts & Media (330 | 5.2%).
Management, Business, Science and Arts Occupations by Sex
Within the Management, Business, Science and Arts occupations in Henderson, the most male-oriented occupations are Computers & Mathematics (100.0%), Life, Physical & Social Science (100.0%), and Management (81.5%), while the most female-oriented occupations are Health Diagnosing & Treating (94.6%), Business & Financial (93.4%), and Architecture & Engineering (87.6%).
| Occupation | Male | Female |
| Management | 216 (81.5%) | 49 (18.5%) |
| Business & Financial | 23 (6.6%) | 328 (93.4%) |
| Computers, Engineering & Science | 42 (37.2%) | 71 (62.8%) |
| Computers & Mathematics | 7 (100.0%) | 0 (0.0%) |
| Architecture & Engineering | 10 (12.3%) | 71 (87.6%) |
| Life, Physical & Social Science | 25 (100.0%) | 0 (0.0%) |
| Community & Social Service | 249 (28.2%) | 635 (71.8%) |
| Education, Arts & Media | 138 (41.8%) | 192 (58.2%) |
| Legal Services & Support | 10 (32.3%) | 21 (67.7%) |
| Education Instruction & Library | 80 (17.4%) | 379 (82.6%) |
| Arts, Media & Entertainment | 21 (32.8%) | 43 (67.2%) |
| Health Diagnosing & Treating | 18 (5.4%) | 316 (94.6%) |
| Health Technologists | 18 (16.7%) | 90 (83.3%) |
| Total (Category) | 548 (28.1%) | 1,399 (71.9%) |
| Total (Overall) | 2,598 (41.4%) | 3,682 (58.6%) |
Services Occupations
The most common Services occupations in Henderson are Food Preparation & Serving (409 | 6.5%), Healthcare Support (272 | 4.3%), Cleaning & Maintenance (207 | 3.3%), Personal Care & Service (180 | 2.9%), and Security & Protection (146 | 2.3%).
Services Occupations by Sex
Within the Services occupations in Henderson, the most male-oriented occupations are Firefighting & Prevention (83.5%), Security & Protection (73.3%), and Cleaning & Maintenance (56.0%), while the most female-oriented occupations are Personal Care & Service (100.0%), Healthcare Support (92.6%), and Law Enforcement (51.2%).
| Occupation | Male | Female |
| Healthcare Support | 20 (7.3%) | 252 (92.6%) |
| Security & Protection | 107 (73.3%) | 39 (26.7%) |
| Firefighting & Prevention | 86 (83.5%) | 17 (16.5%) |
| Law Enforcement | 21 (48.8%) | 22 (51.2%) |
| Food Preparation & Serving | 208 (50.9%) | 201 (49.1%) |
| Cleaning & Maintenance | 116 (56.0%) | 91 (44.0%) |
| Personal Care & Service | 0 (0.0%) | 180 (100.0%) |
| Total (Category) | 451 (37.1%) | 763 (62.8%) |
| Total (Overall) | 2,598 (41.4%) | 3,682 (58.6%) |
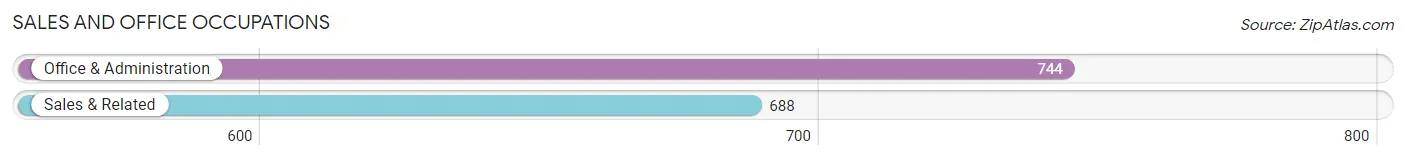
Sales and Office Occupations
The most common Sales and Office occupations in Henderson are Office & Administration (744 | 11.8%), and Sales & Related (688 | 11.0%).
Sales and Office Occupations by Sex
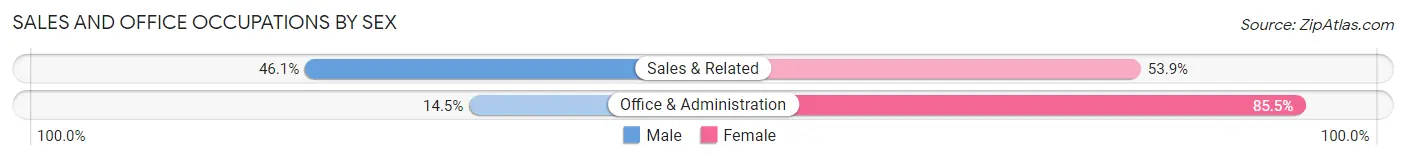
| Occupation | Male | Female |
| Sales & Related | 317 (46.1%) | 371 (53.9%) |
| Office & Administration | 108 (14.5%) | 636 (85.5%) |
| Total (Category) | 425 (29.7%) | 1,007 (70.3%) |
| Total (Overall) | 2,598 (41.4%) | 3,682 (58.6%) |
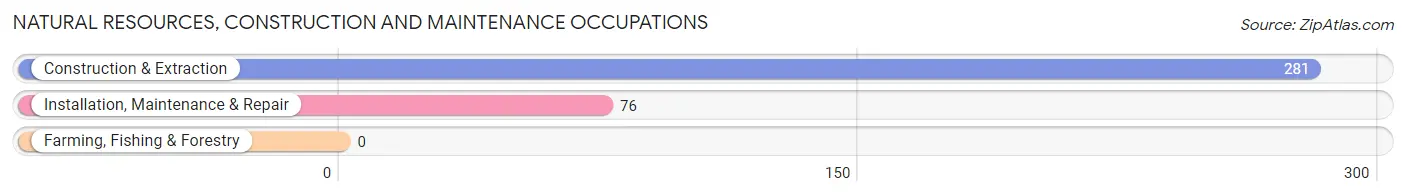
Natural Resources, Construction and Maintenance Occupations
The most common Natural Resources, Construction and Maintenance occupations in Henderson are Construction & Extraction (281 | 4.5%), and Installation, Maintenance & Repair (76 | 1.2%).
Natural Resources, Construction and Maintenance Occupations by Sex
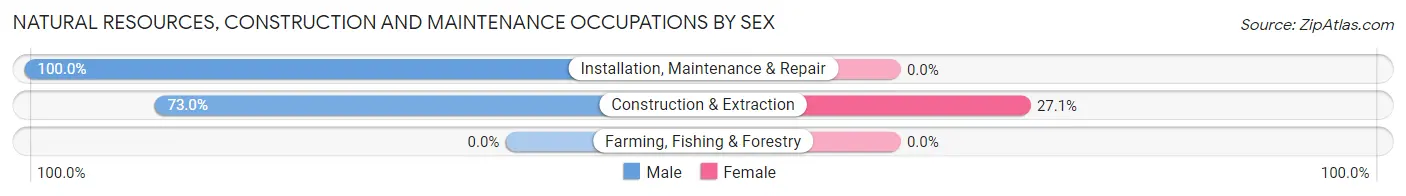
| Occupation | Male | Female |
| Farming, Fishing & Forestry | 0 (0.0%) | 0 (0.0%) |
| Construction & Extraction | 205 (73.0%) | 76 (27.1%) |
| Installation, Maintenance & Repair | 76 (100.0%) | 0 (0.0%) |
| Total (Category) | 281 (78.7%) | 76 (21.3%) |
| Total (Overall) | 2,598 (41.4%) | 3,682 (58.6%) |
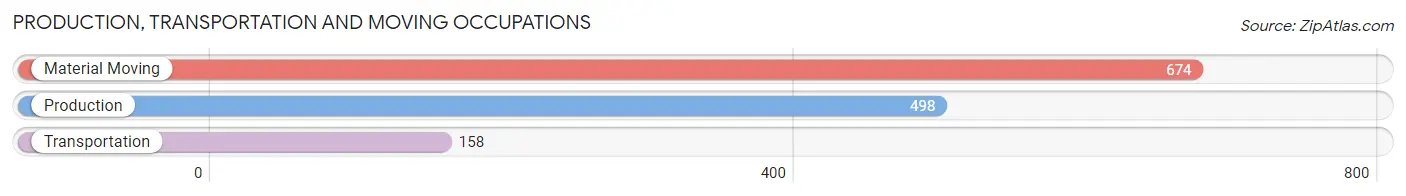
Production, Transportation and Moving Occupations
The most common Production, Transportation and Moving occupations in Henderson are Material Moving (674 | 10.7%), Production (498 | 7.9%), and Transportation (158 | 2.5%).
Production, Transportation and Moving Occupations by Sex
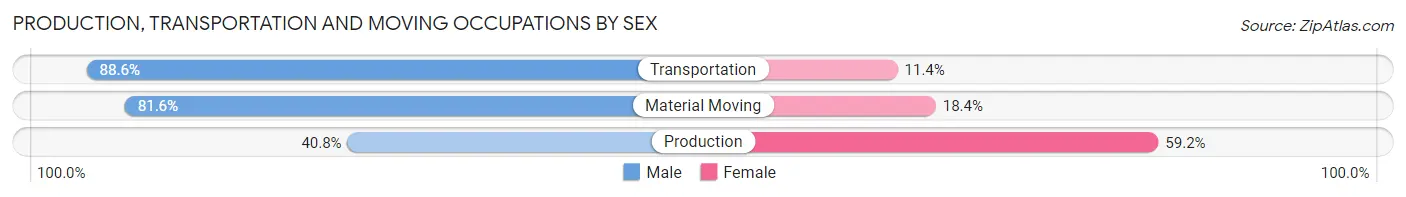
| Occupation | Male | Female |
| Production | 203 (40.8%) | 295 (59.2%) |
| Transportation | 140 (88.6%) | 18 (11.4%) |
| Material Moving | 550 (81.6%) | 124 (18.4%) |
| Total (Category) | 893 (67.1%) | 437 (32.9%) |
| Total (Overall) | 2,598 (41.4%) | 3,682 (58.6%) |
Employment Industries by Sex in Henderson
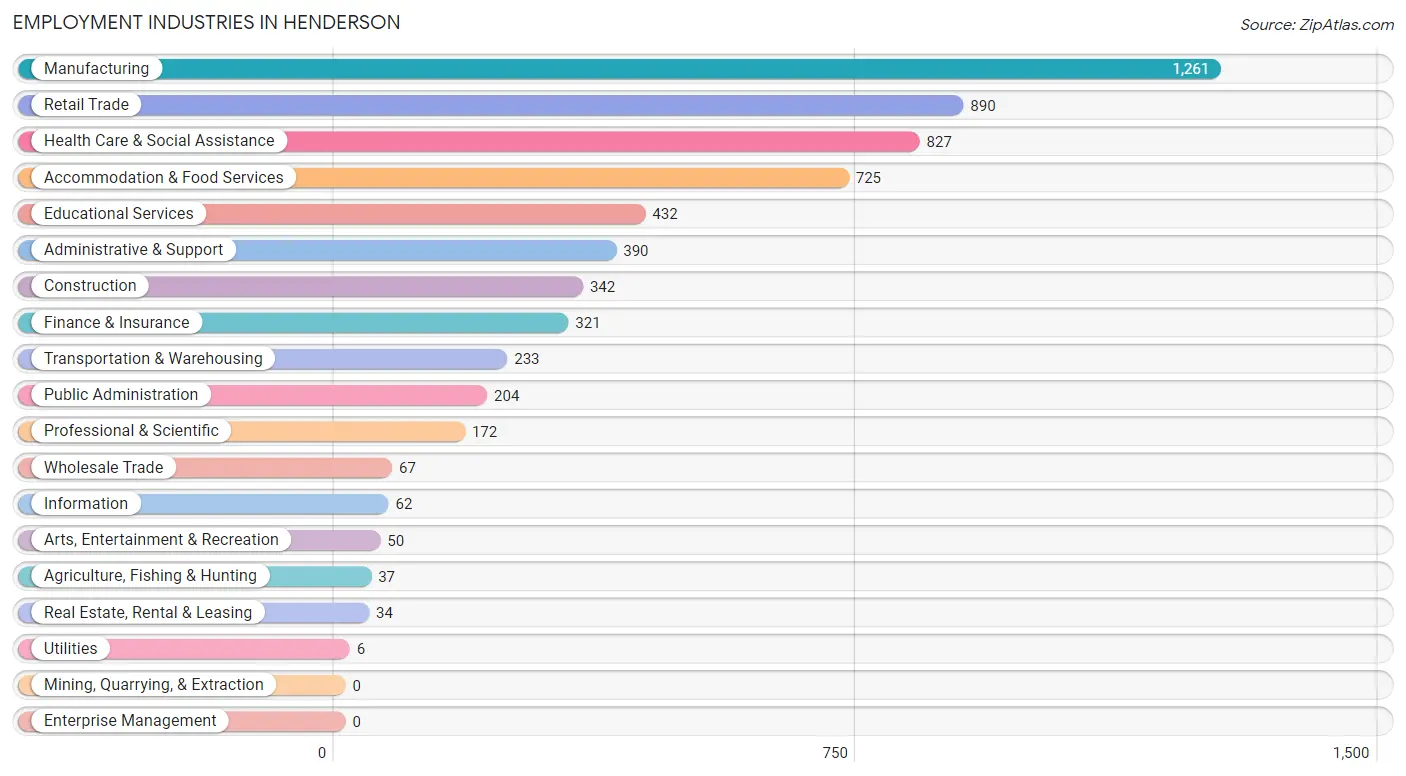
Employment Industries in Henderson
The major employment industries in Henderson include Manufacturing (1,261 | 20.1%), Retail Trade (890 | 14.2%), Health Care & Social Assistance (827 | 13.2%), Accommodation & Food Services (725 | 11.5%), and Educational Services (432 | 6.9%).
Employment Industries by Sex in Henderson
The Henderson industries that see more men than women are Utilities (100.0%), Construction (76.6%), and Wholesale Trade (73.1%), whereas the industries that tend to have a higher number of women are Agriculture, Fishing & Hunting (100.0%), Arts, Entertainment & Recreation (100.0%), and Health Care & Social Assistance (92.6%).
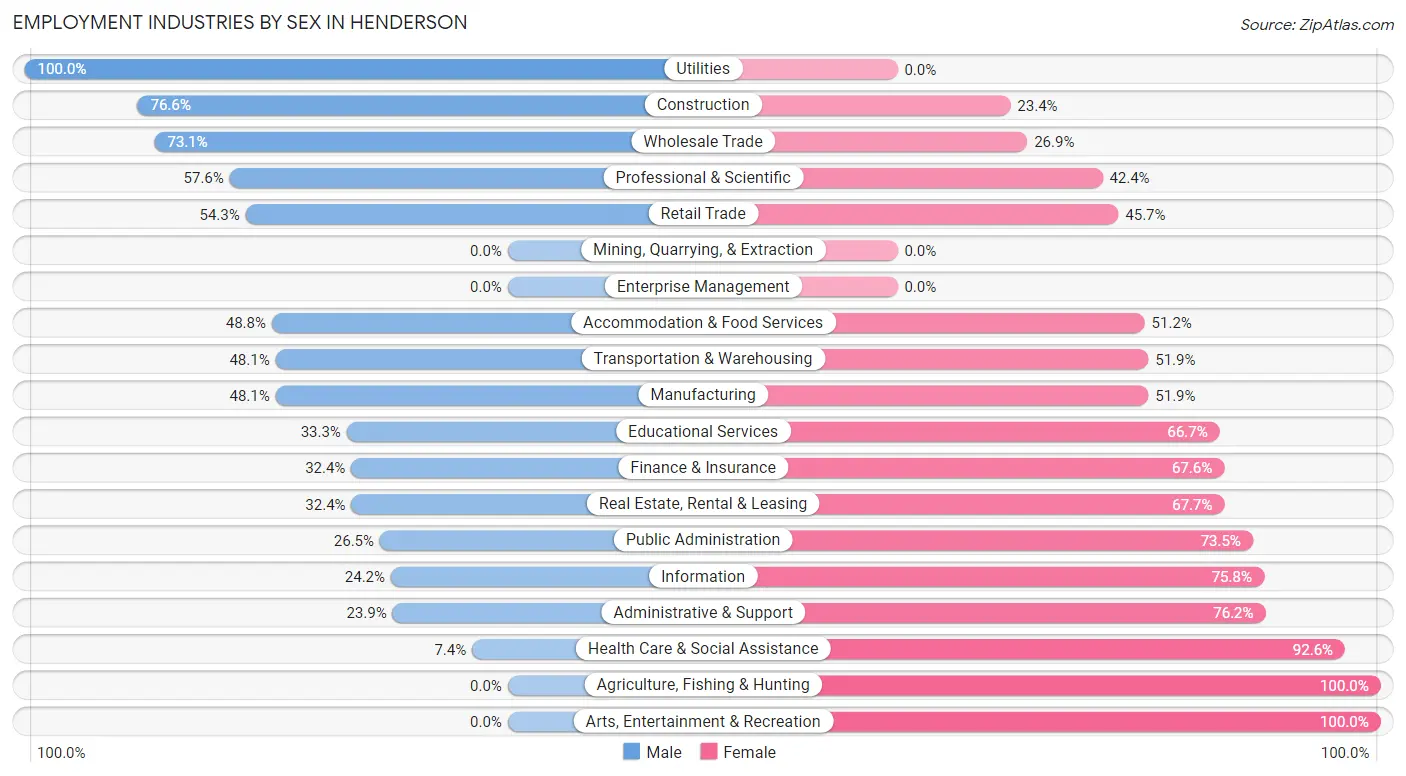
| Industry | Male | Female |
| Agriculture, Fishing & Hunting | 0 (0.0%) | 37 (100.0%) |
| Mining, Quarrying, & Extraction | 0 (0.0%) | 0 (0.0%) |
| Construction | 262 (76.6%) | 80 (23.4%) |
| Manufacturing | 606 (48.1%) | 655 (51.9%) |
| Wholesale Trade | 49 (73.1%) | 18 (26.9%) |
| Retail Trade | 483 (54.3%) | 407 (45.7%) |
| Transportation & Warehousing | 112 (48.1%) | 121 (51.9%) |
| Utilities | 6 (100.0%) | 0 (0.0%) |
| Information | 15 (24.2%) | 47 (75.8%) |
| Finance & Insurance | 104 (32.4%) | 217 (67.6%) |
| Real Estate, Rental & Leasing | 11 (32.4%) | 23 (67.6%) |
| Professional & Scientific | 99 (57.6%) | 73 (42.4%) |
| Enterprise Management | 0 (0.0%) | 0 (0.0%) |
| Administrative & Support | 93 (23.8%) | 297 (76.1%) |
| Educational Services | 144 (33.3%) | 288 (66.7%) |
| Health Care & Social Assistance | 61 (7.4%) | 766 (92.6%) |
| Arts, Entertainment & Recreation | 0 (0.0%) | 50 (100.0%) |
| Accommodation & Food Services | 354 (48.8%) | 371 (51.2%) |
| Public Administration | 54 (26.5%) | 150 (73.5%) |
| Total | 2,598 (41.4%) | 3,682 (58.6%) |
Education in Henderson
School Enrollment in Henderson
The most common levels of schooling among the 3,819 students in Henderson are middle school (1,198 | 31.4%), college / undergraduate (771 | 20.2%), and high school (731 | 19.1%).
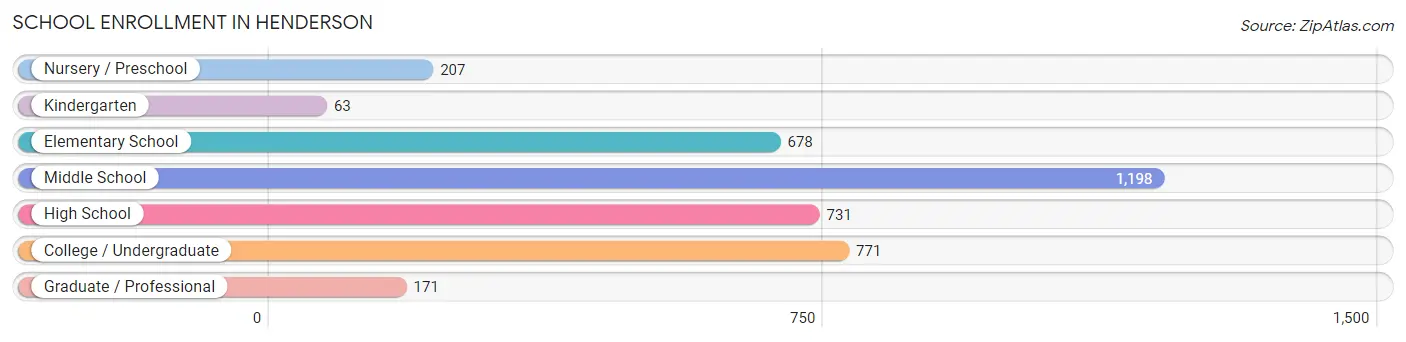
| School Level | # Students | % Students |
| Nursery / Preschool | 207 | 5.4% |
| Kindergarten | 63 | 1.7% |
| Elementary School | 678 | 17.7% |
| Middle School | 1,198 | 31.4% |
| High School | 731 | 19.1% |
| College / Undergraduate | 771 | 20.2% |
| Graduate / Professional | 171 | 4.5% |
| Total | 3,819 | 100.0% |
School Enrollment by Age by Funding Source in Henderson
Out of a total of 3,819 students who are enrolled in schools in Henderson, 764 (20.0%) attend a private institution, while the remaining 3,055 (80.0%) are enrolled in public schools. The age group of 25 to 34 year olds has the highest likelihood of being enrolled in private schools, with 99 (92.5% in the age bracket) enrolled. Conversely, the age group of 18 to 19 year olds has the lowest likelihood of being enrolled in a private school, with 324 (100.0% in the age bracket) attending a public institution.
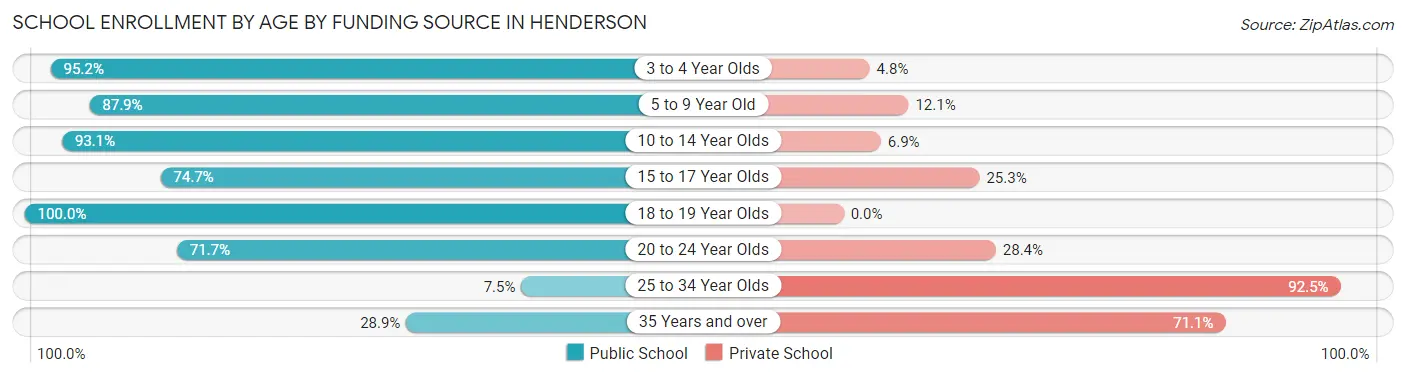
| Age Bracket | Public School | Private School |
| 3 to 4 Year Olds | 177 (95.2%) | 9 (4.8%) |
| 5 to 9 Year Old | 590 (87.9%) | 81 (12.1%) |
| 10 to 14 Year Olds | 1,235 (93.1%) | 92 (6.9%) |
| 15 to 17 Year Olds | 378 (74.7%) | 128 (25.3%) |
| 18 to 19 Year Olds | 324 (100.0%) | 0 (0.0%) |
| 20 to 24 Year Olds | 235 (71.7%) | 93 (28.3%) |
| 25 to 34 Year Olds | 8 (7.5%) | 99 (92.5%) |
| 35 Years and over | 107 (28.9%) | 263 (71.1%) |
| Total | 3,055 (80.0%) | 764 (20.0%) |
Educational Attainment by Field of Study in Henderson
Business (446 | 27.2%), education (281 | 17.2%), arts & humanities (199 | 12.1%), liberal arts & history (146 | 8.9%), and bio, nature & agricultural (131 | 8.0%) are the most common fields of study among 1,638 individuals in Henderson who have obtained a bachelor's degree or higher.
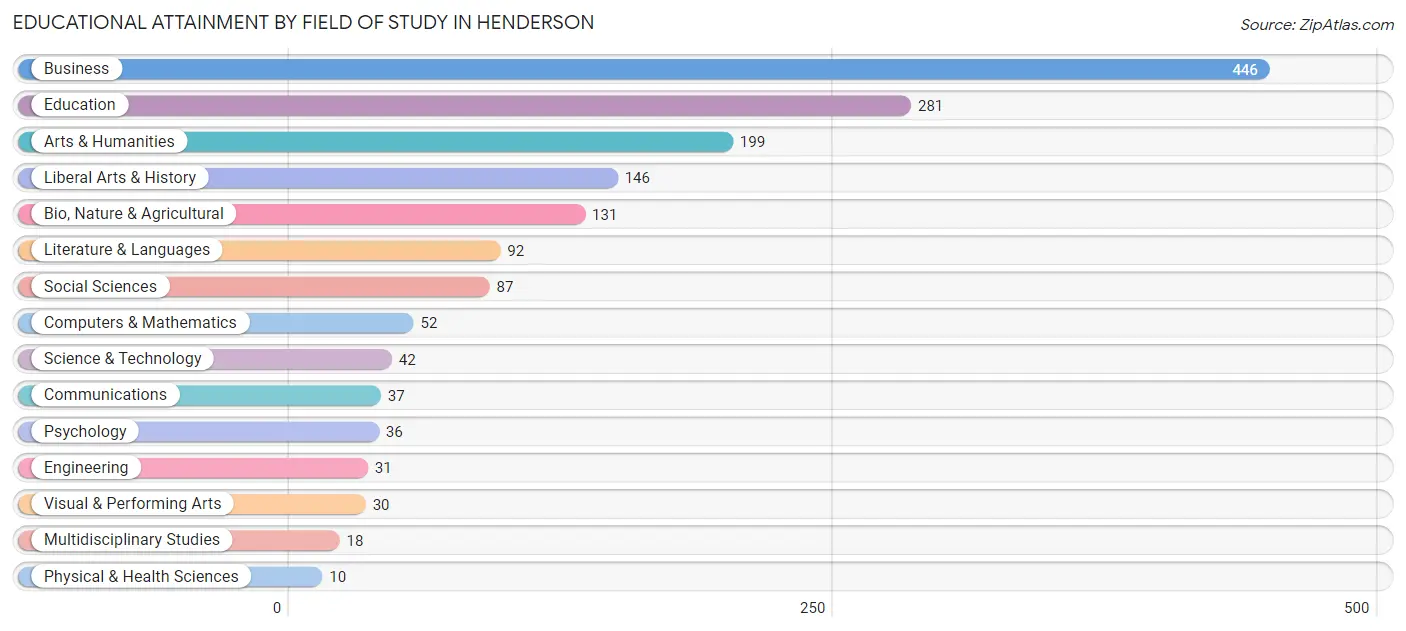
| Field of Study | # Graduates | % Graduates |
| Computers & Mathematics | 52 | 3.2% |
| Bio, Nature & Agricultural | 131 | 8.0% |
| Physical & Health Sciences | 10 | 0.6% |
| Psychology | 36 | 2.2% |
| Social Sciences | 87 | 5.3% |
| Engineering | 31 | 1.9% |
| Multidisciplinary Studies | 18 | 1.1% |
| Science & Technology | 42 | 2.6% |
| Business | 446 | 27.2% |
| Education | 281 | 17.2% |
| Literature & Languages | 92 | 5.6% |
| Liberal Arts & History | 146 | 8.9% |
| Visual & Performing Arts | 30 | 1.8% |
| Communications | 37 | 2.3% |
| Arts & Humanities | 199 | 12.1% |
| Total | 1,638 | 100.0% |
Transportation & Commute in Henderson
Vehicle Availability by Sex in Henderson
The most prevalent vehicle ownership categories in Henderson are males with 2 vehicles (834, accounting for 33.3%) and females with 2 vehicles (1,218, making up 23.0%).
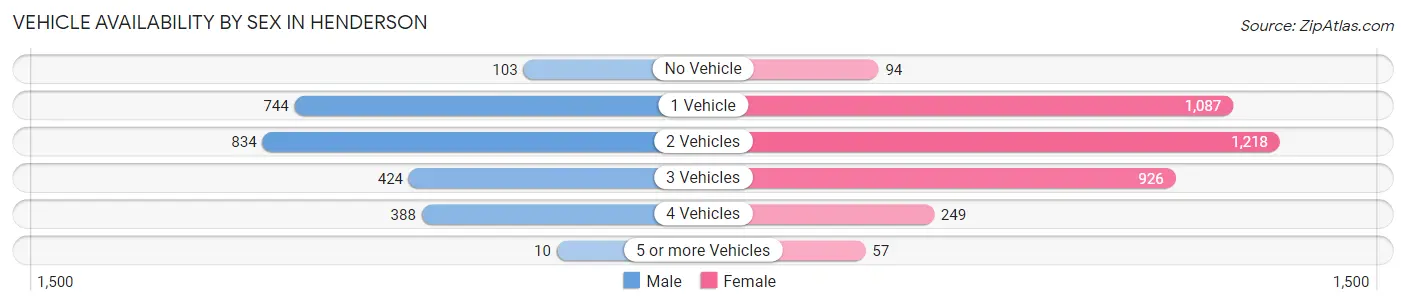
| Vehicles Available | Male | Female |
| No Vehicle | 103 (4.1%) | 94 (2.6%) |
| 1 Vehicle | 744 (29.7%) | 1,087 (29.9%) |
| 2 Vehicles | 834 (33.3%) | 1,218 (33.5%) |
| 3 Vehicles | 424 (16.9%) | 926 (25.5%) |
| 4 Vehicles | 388 (15.5%) | 249 (6.9%) |
| 5 or more Vehicles | 10 (0.4%) | 57 (1.6%) |
| Total | 2,503 (100.0%) | 3,631 (100.0%) |
Commute Time in Henderson
The most frequently occuring commute durations in Henderson are 10 to 14 minutes (1,148 commuters, 20.3%), 5 to 9 minutes (1,038 commuters, 18.3%), and 15 to 19 minutes (648 commuters, 11.4%).
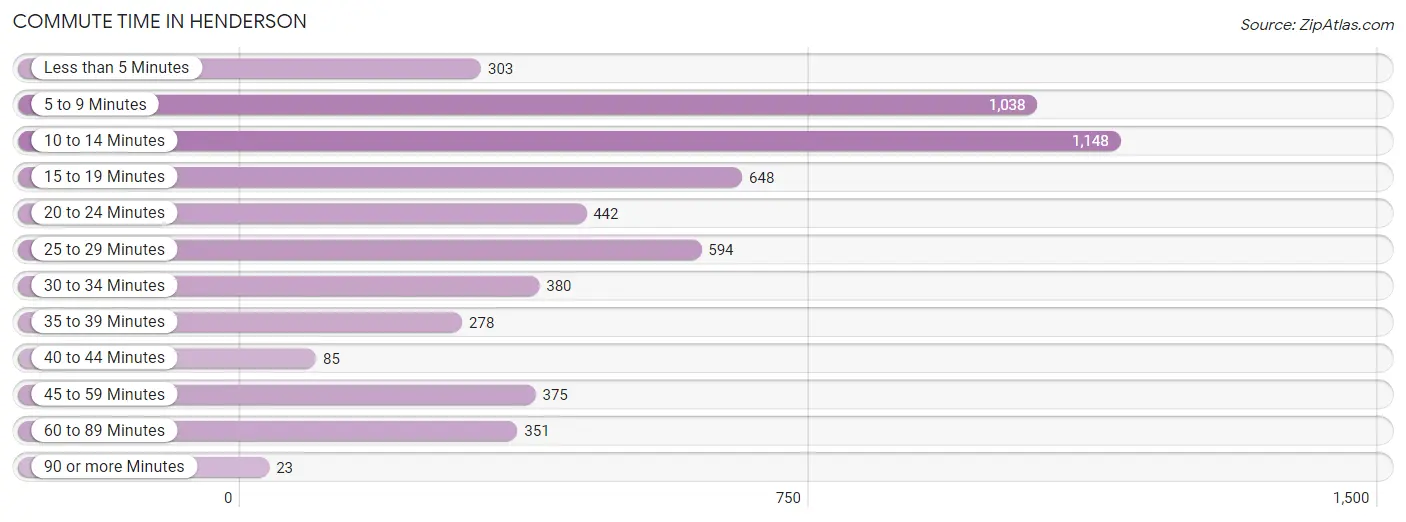
| Commute Time | # Commuters | % Commuters |
| Less than 5 Minutes | 303 | 5.3% |
| 5 to 9 Minutes | 1,038 | 18.3% |
| 10 to 14 Minutes | 1,148 | 20.3% |
| 15 to 19 Minutes | 648 | 11.4% |
| 20 to 24 Minutes | 442 | 7.8% |
| 25 to 29 Minutes | 594 | 10.5% |
| 30 to 34 Minutes | 380 | 6.7% |
| 35 to 39 Minutes | 278 | 4.9% |
| 40 to 44 Minutes | 85 | 1.5% |
| 45 to 59 Minutes | 375 | 6.6% |
| 60 to 89 Minutes | 351 | 6.2% |
| 90 or more Minutes | 23 | 0.4% |
Commute Time by Sex in Henderson
The most common commute times in Henderson are 15 to 19 minutes (398 commuters, 16.8%) for males and 10 to 14 minutes (892 commuters, 27.0%) for females.
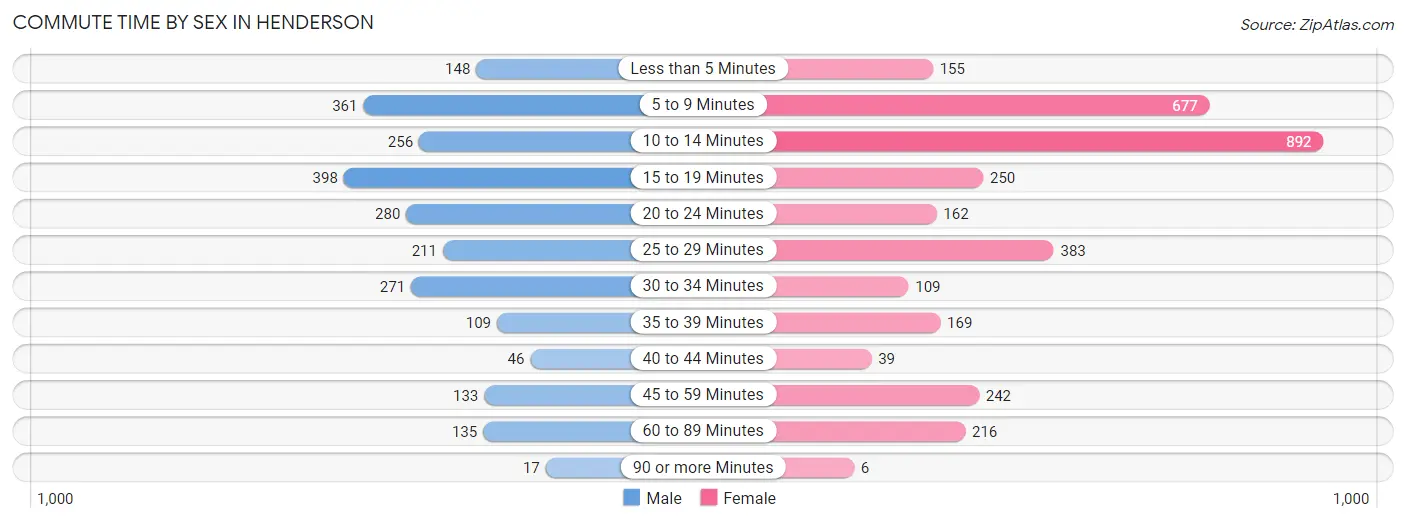
| Commute Time | Male | Female |
| Less than 5 Minutes | 148 (6.3%) | 155 (4.7%) |
| 5 to 9 Minutes | 361 (15.3%) | 677 (20.5%) |
| 10 to 14 Minutes | 256 (10.8%) | 892 (27.0%) |
| 15 to 19 Minutes | 398 (16.8%) | 250 (7.6%) |
| 20 to 24 Minutes | 280 (11.8%) | 162 (4.9%) |
| 25 to 29 Minutes | 211 (8.9%) | 383 (11.6%) |
| 30 to 34 Minutes | 271 (11.5%) | 109 (3.3%) |
| 35 to 39 Minutes | 109 (4.6%) | 169 (5.1%) |
| 40 to 44 Minutes | 46 (1.9%) | 39 (1.2%) |
| 45 to 59 Minutes | 133 (5.6%) | 242 (7.3%) |
| 60 to 89 Minutes | 135 (5.7%) | 216 (6.6%) |
| 90 or more Minutes | 17 (0.7%) | 6 (0.2%) |
Time of Departure to Work by Sex in Henderson
The most frequent times of departure to work in Henderson are 12:00 PM to 3:59 PM (396, 16.7%) for males and 7:00 AM to 7:29 AM (711, 21.5%) for females.
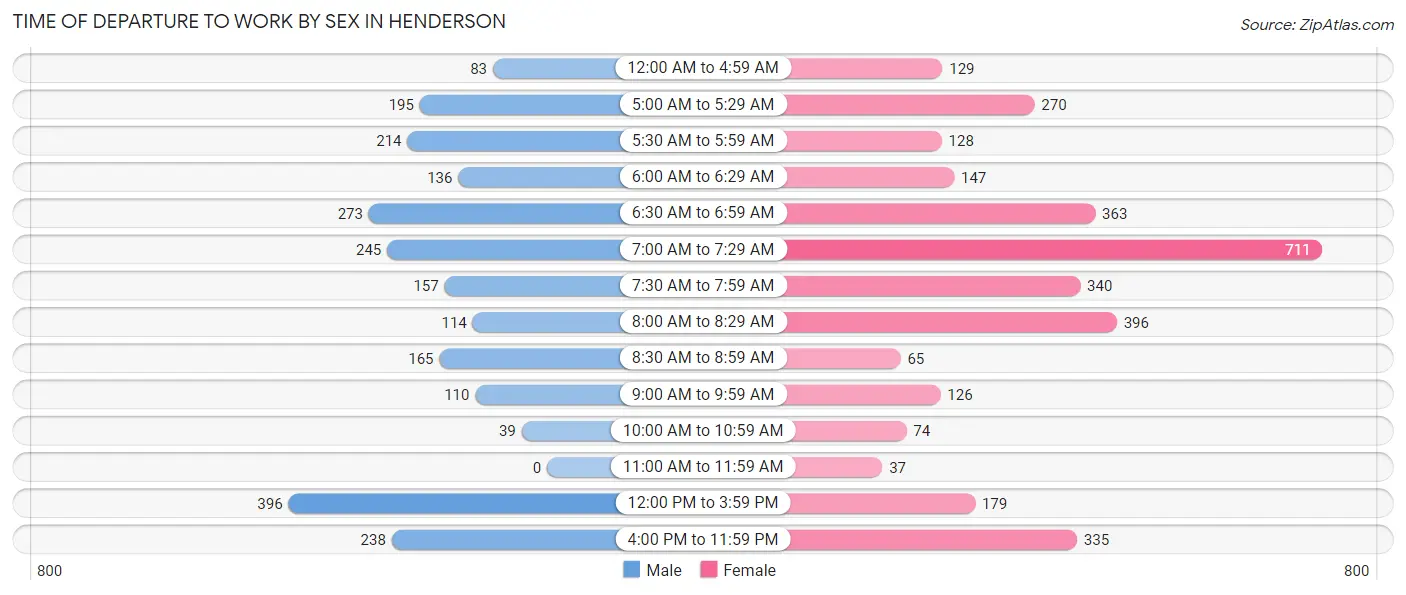
| Time of Departure | Male | Female |
| 12:00 AM to 4:59 AM | 83 (3.5%) | 129 (3.9%) |
| 5:00 AM to 5:29 AM | 195 (8.3%) | 270 (8.2%) |
| 5:30 AM to 5:59 AM | 214 (9.0%) | 128 (3.9%) |
| 6:00 AM to 6:29 AM | 136 (5.8%) | 147 (4.4%) |
| 6:30 AM to 6:59 AM | 273 (11.5%) | 363 (11.0%) |
| 7:00 AM to 7:29 AM | 245 (10.4%) | 711 (21.5%) |
| 7:30 AM to 7:59 AM | 157 (6.6%) | 340 (10.3%) |
| 8:00 AM to 8:29 AM | 114 (4.8%) | 396 (12.0%) |
| 8:30 AM to 8:59 AM | 165 (7.0%) | 65 (2.0%) |
| 9:00 AM to 9:59 AM | 110 (4.6%) | 126 (3.8%) |
| 10:00 AM to 10:59 AM | 39 (1.7%) | 74 (2.2%) |
| 11:00 AM to 11:59 AM | 0 (0.0%) | 37 (1.1%) |
| 12:00 PM to 3:59 PM | 396 (16.7%) | 179 (5.4%) |
| 4:00 PM to 11:59 PM | 238 (10.1%) | 335 (10.2%) |
| Total | 2,365 (100.0%) | 3,300 (100.0%) |
Housing Occupancy in Henderson
Occupancy by Ownership in Henderson
Of the total 5,832 dwellings in Henderson, owner-occupied units account for 2,157 (37.0%), while renter-occupied units make up 3,675 (63.0%).
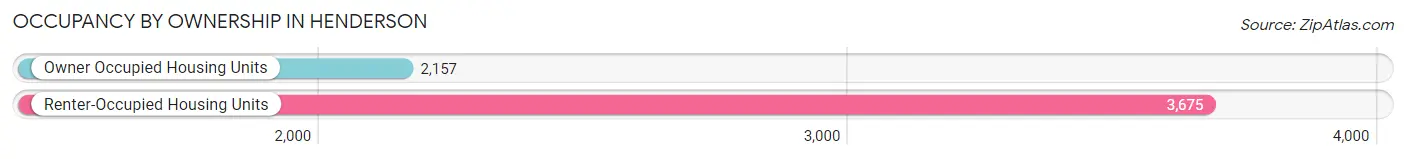
| Occupancy | # Housing Units | % Housing Units |
| Owner Occupied Housing Units | 2,157 | 37.0% |
| Renter-Occupied Housing Units | 3,675 | 63.0% |
| Total Occupied Housing Units | 5,832 | 100.0% |
Occupancy by Household Size in Henderson
| Household Size | # Housing Units | % Housing Units |
| 1-Person Household | 2,009 | 34.4% |
| 2-Person Household | 1,980 | 34.0% |
| 3-Person Household | 832 | 14.3% |
| 4+ Person Household | 1,011 | 17.3% |
| Total Housing Units | 5,832 | 100.0% |
Occupancy by Ownership by Household Size in Henderson
| Household Size | Owner-occupied | Renter-occupied |
| 1-Person Household | 491 (24.4%) | 1,518 (75.6%) |
| 2-Person Household | 993 (50.1%) | 987 (49.8%) |
| 3-Person Household | 256 (30.8%) | 576 (69.2%) |
| 4+ Person Household | 417 (41.2%) | 594 (58.8%) |
| Total Housing Units | 2,157 (37.0%) | 3,675 (63.0%) |
Occupancy by Educational Attainment in Henderson
| Household Size | Owner-occupied | Renter-occupied |
| Less than High School | 98 (15.2%) | 545 (84.8%) |
| High School Diploma | 631 (30.9%) | 1,414 (69.1%) |
| College/Associate Degree | 932 (44.5%) | 1,162 (55.5%) |
| Bachelor's Degree or higher | 496 (47.2%) | 554 (52.8%) |
Occupancy by Age of Householder in Henderson
| Age Bracket | # Households | % Households |
| Under 35 Years | 1,154 | 19.8% |
| 35 to 44 Years | 1,050 | 18.0% |
| 45 to 54 Years | 839 | 14.4% |
| 55 to 64 Years | 1,319 | 22.6% |
| 65 to 74 Years | 813 | 13.9% |
| 75 to 84 Years | 466 | 8.0% |
| 85 Years and Over | 191 | 3.3% |
| Total | 5,832 | 100.0% |
Housing Finances in Henderson
Median Income by Occupancy in Henderson
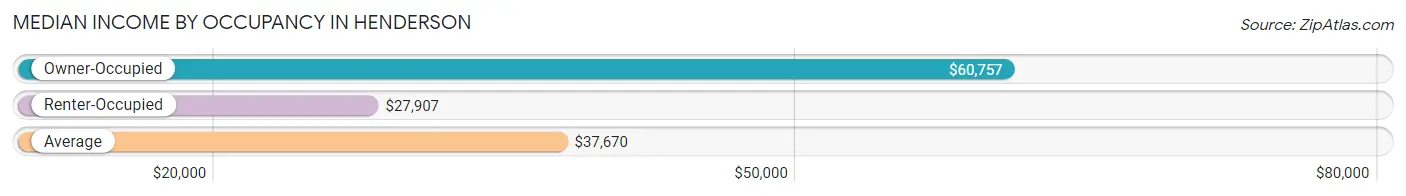
| Occupancy Type | # Households | Median Income |
| Owner-Occupied | 2,157 (37.0%) | $60,757 |
| Renter-Occupied | 3,675 (63.0%) | $27,907 |
| Average | 5,832 (100.0%) | $37,670 |
Occupancy by Householder Income Bracket in Henderson
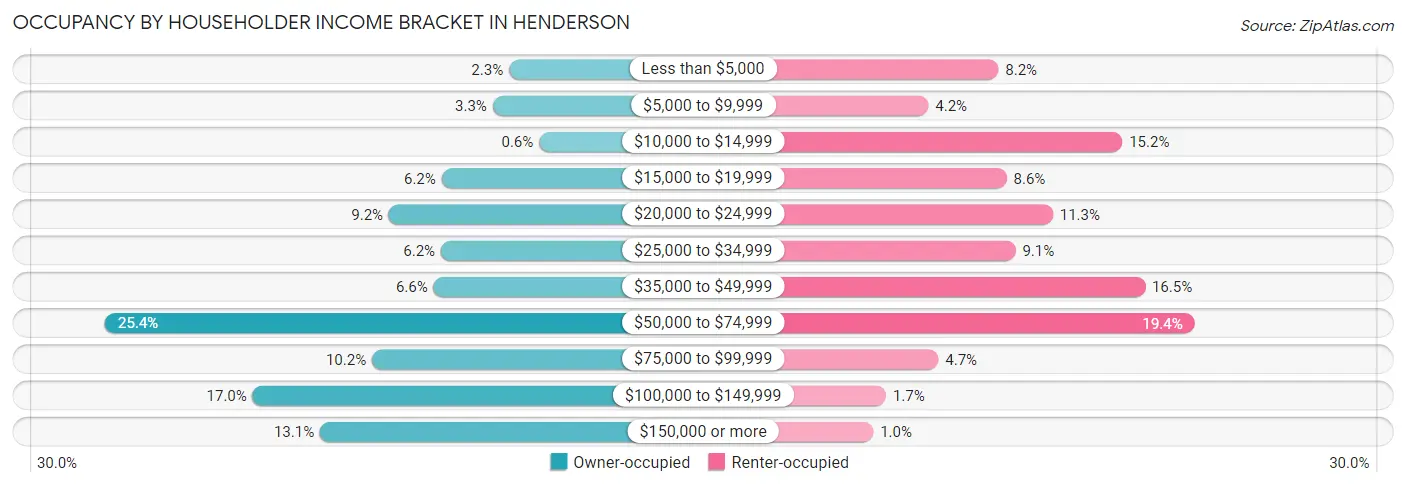
| Income Bracket | Owner-occupied | Renter-occupied |
| Less than $5,000 | 50 (2.3%) | 300 (8.2%) |
| $5,000 to $9,999 | 70 (3.3%) | 153 (4.2%) |
| $10,000 to $14,999 | 13 (0.6%) | 560 (15.2%) |
| $15,000 to $19,999 | 133 (6.2%) | 317 (8.6%) |
| $20,000 to $24,999 | 198 (9.2%) | 414 (11.3%) |
| $25,000 to $34,999 | 134 (6.2%) | 336 (9.1%) |
| $35,000 to $49,999 | 143 (6.6%) | 608 (16.5%) |
| $50,000 to $74,999 | 548 (25.4%) | 712 (19.4%) |
| $75,000 to $99,999 | 219 (10.2%) | 174 (4.7%) |
| $100,000 to $149,999 | 366 (17.0%) | 64 (1.7%) |
| $150,000 or more | 283 (13.1%) | 37 (1.0%) |
| Total | 2,157 (100.0%) | 3,675 (100.0%) |
Monthly Housing Cost Tiers in Henderson
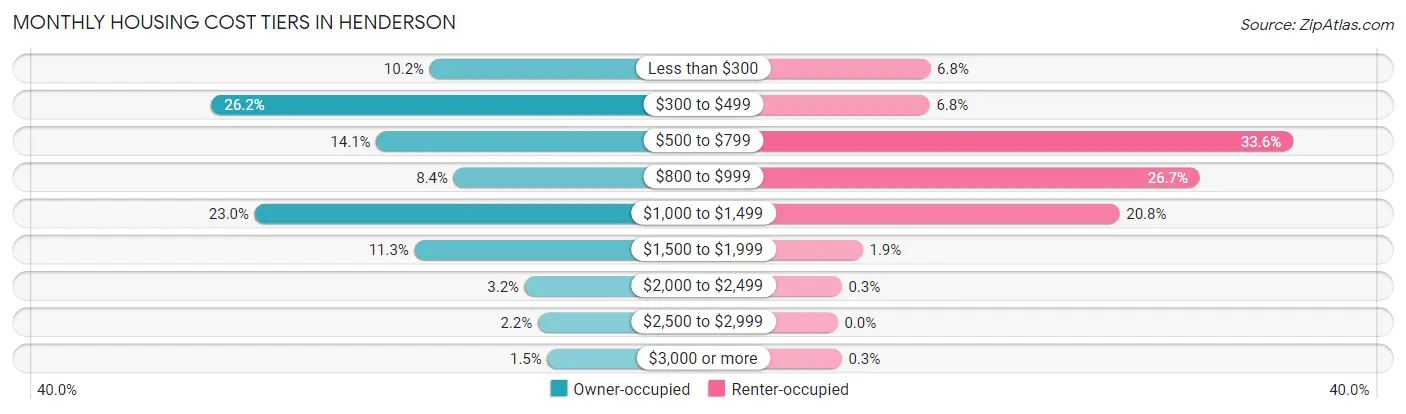
| Monthly Cost | Owner-occupied | Renter-occupied |
| Less than $300 | 219 (10.2%) | 251 (6.8%) |
| $300 to $499 | 566 (26.2%) | 249 (6.8%) |
| $500 to $799 | 304 (14.1%) | 1,233 (33.6%) |
| $800 to $999 | 181 (8.4%) | 981 (26.7%) |
| $1,000 to $1,499 | 497 (23.0%) | 763 (20.8%) |
| $1,500 to $1,999 | 243 (11.3%) | 68 (1.8%) |
| $2,000 to $2,499 | 68 (3.2%) | 11 (0.3%) |
| $2,500 to $2,999 | 47 (2.2%) | 0 (0.0%) |
| $3,000 or more | 32 (1.5%) | 11 (0.3%) |
| Total | 2,157 (100.0%) | 3,675 (100.0%) |
Physical Housing Characteristics in Henderson
Housing Structures in Henderson
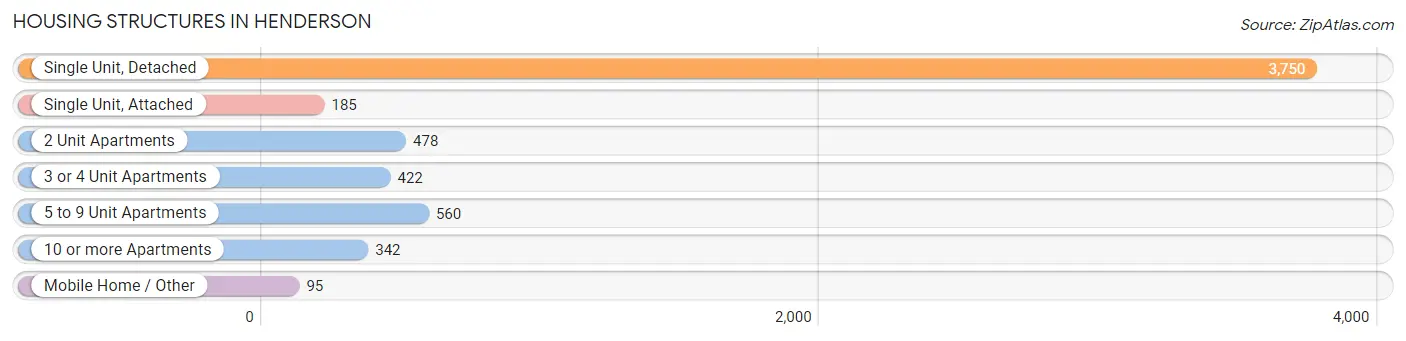
| Structure Type | # Housing Units | % Housing Units |
| Single Unit, Detached | 3,750 | 64.3% |
| Single Unit, Attached | 185 | 3.2% |
| 2 Unit Apartments | 478 | 8.2% |
| 3 or 4 Unit Apartments | 422 | 7.2% |
| 5 to 9 Unit Apartments | 560 | 9.6% |
| 10 or more Apartments | 342 | 5.9% |
| Mobile Home / Other | 95 | 1.6% |
| Total | 5,832 | 100.0% |
Housing Structures by Occupancy in Henderson
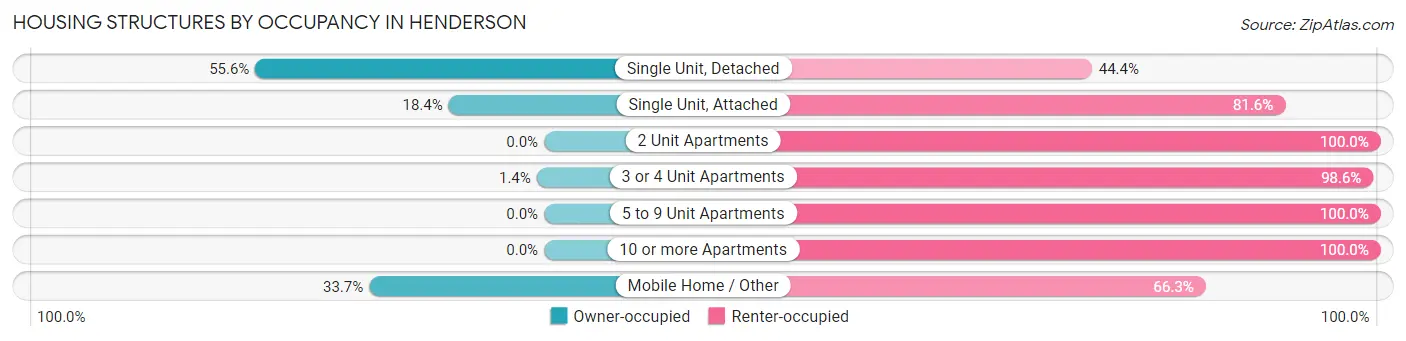
| Structure Type | Owner-occupied | Renter-occupied |
| Single Unit, Detached | 2,085 (55.6%) | 1,665 (44.4%) |
| Single Unit, Attached | 34 (18.4%) | 151 (81.6%) |
| 2 Unit Apartments | 0 (0.0%) | 478 (100.0%) |
| 3 or 4 Unit Apartments | 6 (1.4%) | 416 (98.6%) |
| 5 to 9 Unit Apartments | 0 (0.0%) | 560 (100.0%) |
| 10 or more Apartments | 0 (0.0%) | 342 (100.0%) |
| Mobile Home / Other | 32 (33.7%) | 63 (66.3%) |
| Total | 2,157 (37.0%) | 3,675 (63.0%) |
Housing Structures by Number of Rooms in Henderson
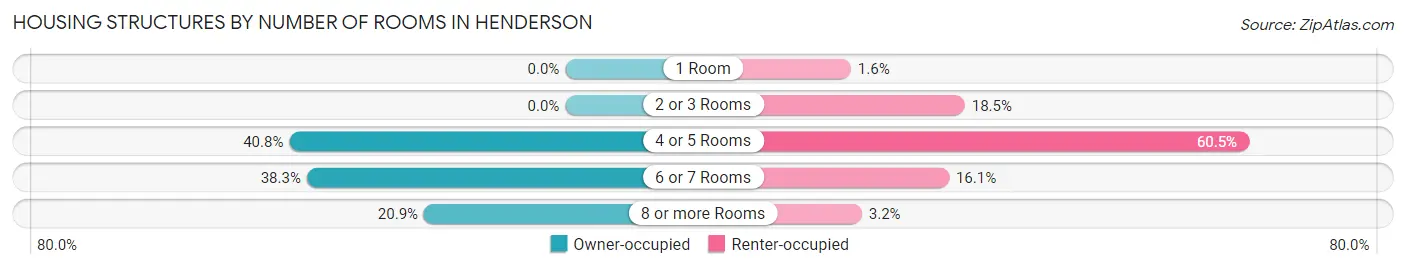
| Number of Rooms | Owner-occupied | Renter-occupied |
| 1 Room | 0 (0.0%) | 60 (1.6%) |
| 2 or 3 Rooms | 0 (0.0%) | 679 (18.5%) |
| 4 or 5 Rooms | 881 (40.8%) | 2,224 (60.5%) |
| 6 or 7 Rooms | 825 (38.3%) | 593 (16.1%) |
| 8 or more Rooms | 451 (20.9%) | 119 (3.2%) |
| Total | 2,157 (100.0%) | 3,675 (100.0%) |
Housing Structure by Heating Type in Henderson
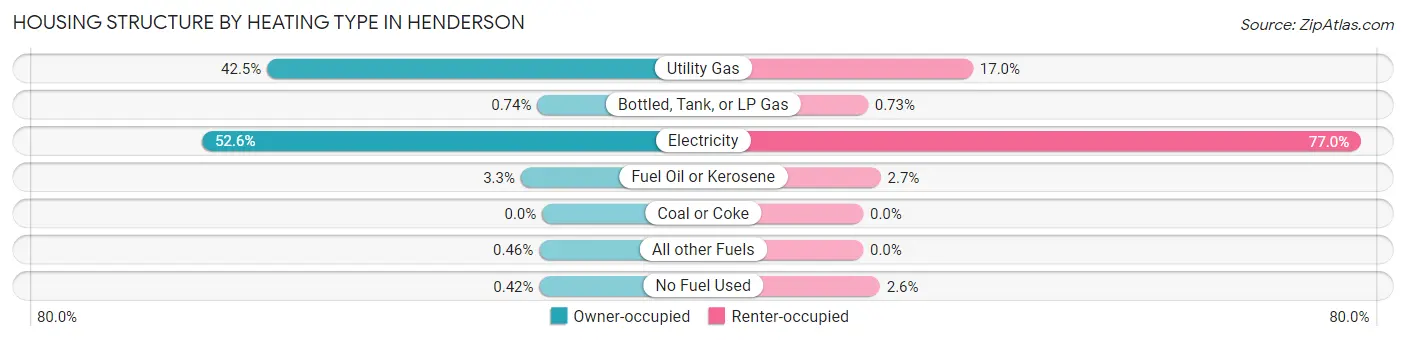
| Heating Type | Owner-occupied | Renter-occupied |
| Utility Gas | 917 (42.5%) | 624 (17.0%) |
| Bottled, Tank, or LP Gas | 16 (0.7%) | 27 (0.7%) |
| Electricity | 1,134 (52.6%) | 2,829 (77.0%) |
| Fuel Oil or Kerosene | 71 (3.3%) | 100 (2.7%) |
| Coal or Coke | 0 (0.0%) | 0 (0.0%) |
| All other Fuels | 10 (0.5%) | 0 (0.0%) |
| No Fuel Used | 9 (0.4%) | 95 (2.6%) |
| Total | 2,157 (100.0%) | 3,675 (100.0%) |
Household Vehicle Usage in Henderson
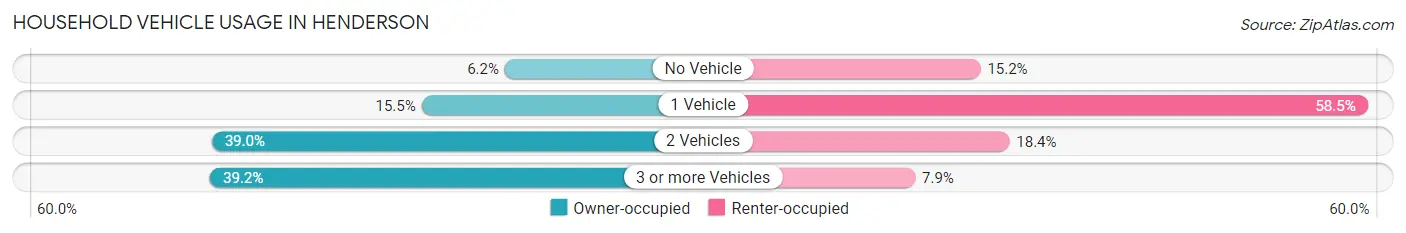
| Vehicles per Household | Owner-occupied | Renter-occupied |
| No Vehicle | 134 (6.2%) | 558 (15.2%) |
| 1 Vehicle | 335 (15.5%) | 2,151 (58.5%) |
| 2 Vehicles | 842 (39.0%) | 677 (18.4%) |
| 3 or more Vehicles | 846 (39.2%) | 289 (7.9%) |
| Total | 2,157 (100.0%) | 3,675 (100.0%) |
Real Estate & Mortgages in Henderson
Real Estate and Mortgage Overview in Henderson
| Characteristic | Without Mortgage | With Mortgage |
| Housing Units | 1,115 | 1,042 |
| Median Property Value | $97,400 | $127,000 |
| Median Household Income | $53,694 | $167 |
| Monthly Housing Costs | $447 | $21 |
| Real Estate Taxes | $1,182 | $0 |
Property Value by Mortgage Status in Henderson
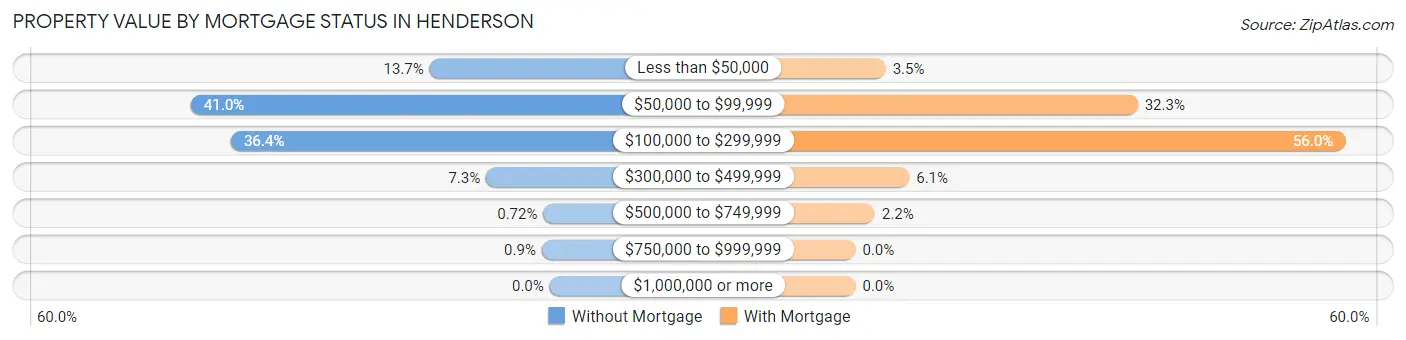
| Property Value | Without Mortgage | With Mortgage |
| Less than $50,000 | 153 (13.7%) | 36 (3.5%) |
| $50,000 to $99,999 | 457 (41.0%) | 336 (32.3%) |
| $100,000 to $299,999 | 406 (36.4%) | 583 (55.9%) |
| $300,000 to $499,999 | 81 (7.3%) | 64 (6.1%) |
| $500,000 to $749,999 | 8 (0.7%) | 23 (2.2%) |
| $750,000 to $999,999 | 10 (0.9%) | 0 (0.0%) |
| $1,000,000 or more | 0 (0.0%) | 0 (0.0%) |
| Total | 1,115 (100.0%) | 1,042 (100.0%) |
Household Income by Mortgage Status in Henderson
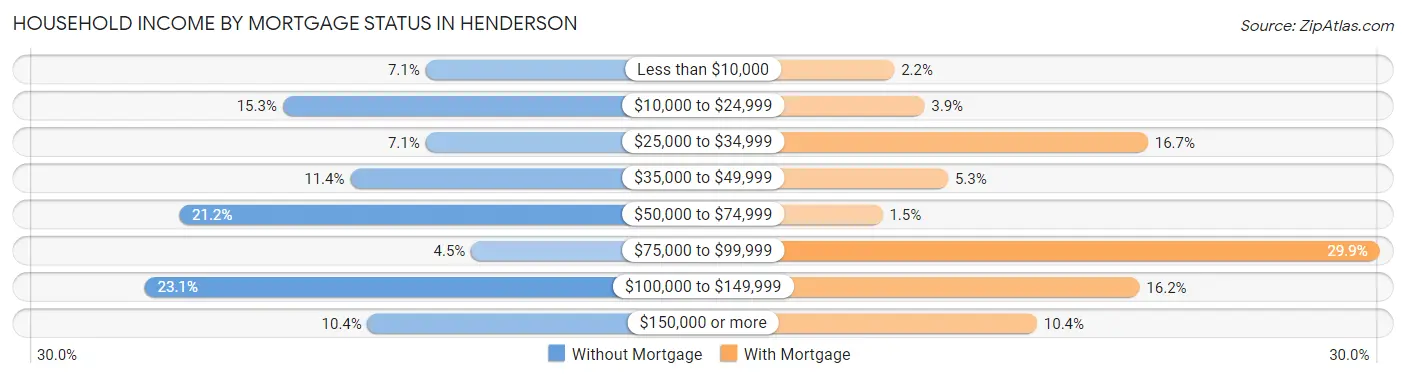
| Household Income | Without Mortgage | With Mortgage |
| Less than $10,000 | 79 (7.1%) | 23 (2.2%) |
| $10,000 to $24,999 | 170 (15.2%) | 41 (3.9%) |
| $25,000 to $34,999 | 79 (7.1%) | 174 (16.7%) |
| $35,000 to $49,999 | 127 (11.4%) | 55 (5.3%) |
| $50,000 to $74,999 | 236 (21.2%) | 16 (1.5%) |
| $75,000 to $99,999 | 50 (4.5%) | 312 (29.9%) |
| $100,000 to $149,999 | 258 (23.1%) | 169 (16.2%) |
| $150,000 or more | 116 (10.4%) | 108 (10.4%) |
| Total | 1,115 (100.0%) | 1,042 (100.0%) |
Property Value to Household Income Ratio in Henderson
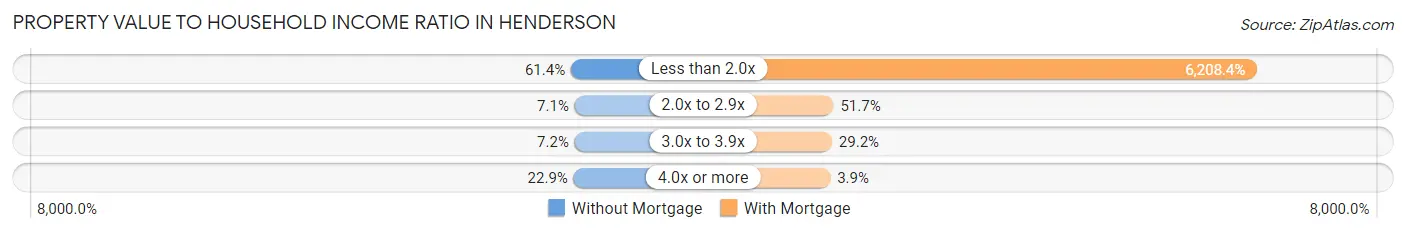
| Value-to-Income Ratio | Without Mortgage | With Mortgage |
| Less than 2.0x | 684 (61.4%) | 64,691 (6,208.4%) |
| 2.0x to 2.9x | 79 (7.1%) | 539 (51.7%) |
| 3.0x to 3.9x | 80 (7.2%) | 304 (29.2%) |
| 4.0x or more | 255 (22.9%) | 41 (3.9%) |
| Total | 1,115 (100.0%) | 1,042 (100.0%) |
Real Estate Taxes by Mortgage Status in Henderson
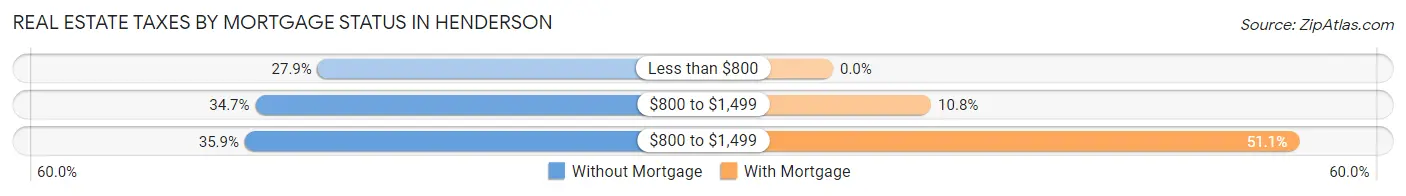
| Property Taxes | Without Mortgage | With Mortgage |
| Less than $800 | 311 (27.9%) | 0 (0.0%) |
| $800 to $1,499 | 387 (34.7%) | 112 (10.7%) |
| $800 to $1,499 | 400 (35.9%) | 532 (51.1%) |
| Total | 1,115 (100.0%) | 1,042 (100.0%) |
Health & Disability in Henderson
Health Insurance Coverage by Age in Henderson
| Age Bracket | With Coverage | Without Coverage |
| Under 6 Years | 1,273 (99.4%) | 8 (0.6%) |
| 6 to 18 Years | 2,385 (90.6%) | 248 (9.4%) |
| 19 to 25 Years | 1,368 (83.1%) | 279 (16.9%) |
| 26 to 34 Years | 1,357 (76.7%) | 411 (23.3%) |
| 35 to 44 Years | 1,300 (79.1%) | 343 (20.9%) |
| 45 to 54 Years | 1,277 (74.8%) | 430 (25.2%) |
| 55 to 64 Years | 1,701 (90.6%) | 176 (9.4%) |
| 65 to 74 Years | 1,226 (100.0%) | 0 (0.0%) |
| 75 Years and older | 823 (98.8%) | 10 (1.2%) |
| Total | 12,710 (87.0%) | 1,905 (13.0%) |
Health Insurance Coverage by Citizenship Status in Henderson
| Citizenship Status | With Coverage | Without Coverage |
| Native Born | 1,273 (99.4%) | 8 (0.6%) |
| Foreign Born, Citizen | 2,385 (90.6%) | 248 (9.4%) |
| Foreign Born, not a Citizen | 1,368 (83.1%) | 279 (16.9%) |
Health Insurance Coverage by Household Income in Henderson
| Household Income | With Coverage | Without Coverage |
| Under $25,000 | 3,718 (90.2%) | 402 (9.8%) |
| $25,000 to $49,999 | 2,392 (83.0%) | 491 (17.0%) |
| $50,000 to $74,999 | 3,287 (90.5%) | 343 (9.5%) |
| $75,000 to $99,999 | 1,002 (78.3%) | 278 (21.7%) |
| $100,000 and over | 2,227 (85.1%) | 391 (14.9%) |
Public vs Private Health Insurance Coverage by Age in Henderson
| Age Bracket | Public Insurance | Private Insurance |
| Under 6 | 1,133 (88.4%) | 196 (15.3%) |
| 6 to 18 Years | 1,776 (67.4%) | 783 (29.7%) |
| 19 to 25 Years | 608 (36.9%) | 803 (48.8%) |
| 25 to 34 Years | 756 (42.8%) | 791 (44.7%) |
| 35 to 44 Years | 423 (25.8%) | 901 (54.8%) |
| 45 to 54 Years | 416 (24.4%) | 1,045 (61.2%) |
| 55 to 64 Years | 539 (28.7%) | 1,327 (70.7%) |
| 65 to 74 Years | 1,130 (92.2%) | 567 (46.3%) |
| 75 Years and over | 823 (98.8%) | 602 (72.3%) |
| Total | 7,604 (52.0%) | 7,015 (48.0%) |
Disability Status by Sex by Age in Henderson
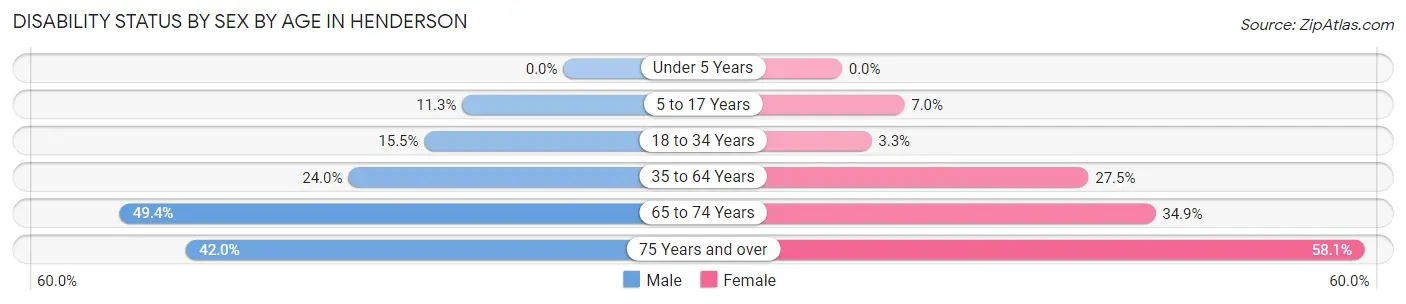
| Age Bracket | Male | Female |
| Under 5 Years | 0 (0.0%) | 0 (0.0%) |
| 5 to 17 Years | 121 (11.3%) | 105 (7.0%) |
| 18 to 34 Years | 250 (15.5%) | 63 (3.3%) |
| 35 to 64 Years | 526 (23.9%) | 832 (27.5%) |
| 65 to 74 Years | 239 (49.4%) | 259 (34.9%) |
| 75 Years and over | 102 (42.0%) | 343 (58.1%) |
Disability Class by Sex by Age in Henderson
Disability Class: Hearing Difficulty
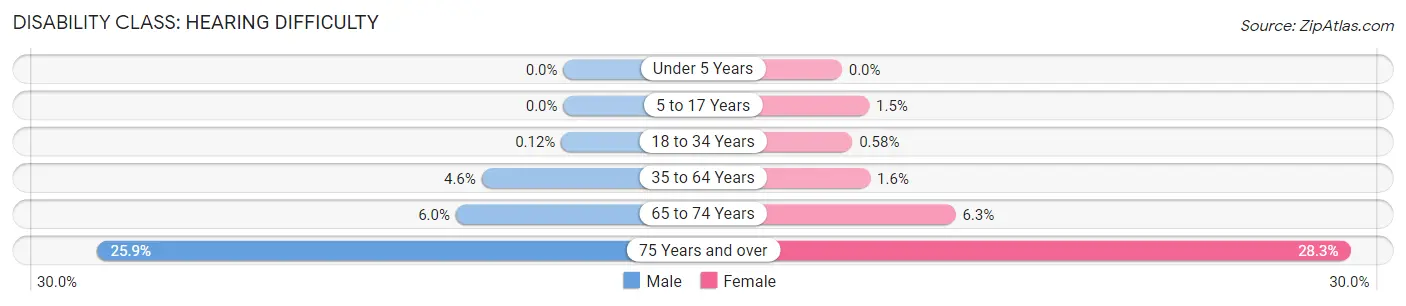
| Age Bracket | Male | Female |
| Under 5 Years | 0 (0.0%) | 0 (0.0%) |
| 5 to 17 Years | 0 (0.0%) | 23 (1.5%) |
| 18 to 34 Years | 2 (0.1%) | 11 (0.6%) |
| 35 to 64 Years | 100 (4.5%) | 48 (1.6%) |
| 65 to 74 Years | 29 (6.0%) | 47 (6.3%) |
| 75 Years and over | 63 (25.9%) | 167 (28.3%) |
Disability Class: Vision Difficulty
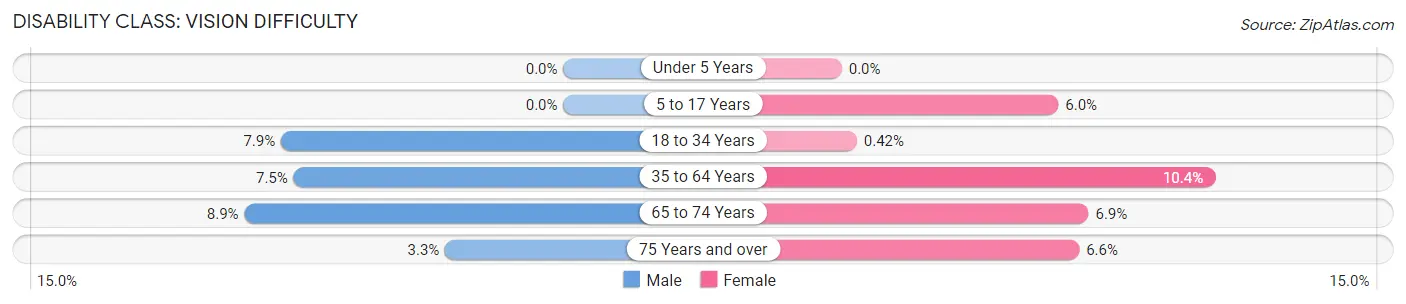
| Age Bracket | Male | Female |
| Under 5 Years | 0 (0.0%) | 0 (0.0%) |
| 5 to 17 Years | 0 (0.0%) | 91 (6.0%) |
| 18 to 34 Years | 127 (7.9%) | 8 (0.4%) |
| 35 to 64 Years | 165 (7.5%) | 315 (10.4%) |
| 65 to 74 Years | 43 (8.9%) | 51 (6.9%) |
| 75 Years and over | 8 (3.3%) | 39 (6.6%) |
Disability Class: Cognitive Difficulty
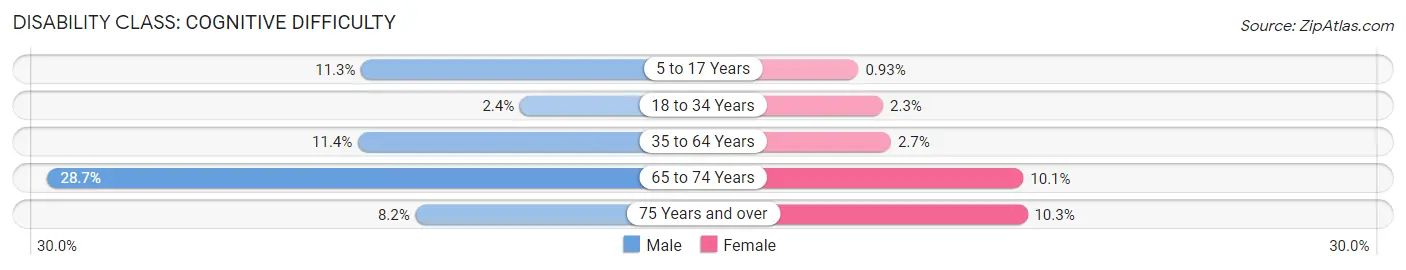
| Age Bracket | Male | Female |
| 5 to 17 Years | 121 (11.3%) | 14 (0.9%) |
| 18 to 34 Years | 39 (2.4%) | 44 (2.3%) |
| 35 to 64 Years | 251 (11.4%) | 83 (2.7%) |
| 65 to 74 Years | 139 (28.7%) | 75 (10.1%) |
| 75 Years and over | 20 (8.2%) | 61 (10.3%) |
Disability Class: Ambulatory Difficulty
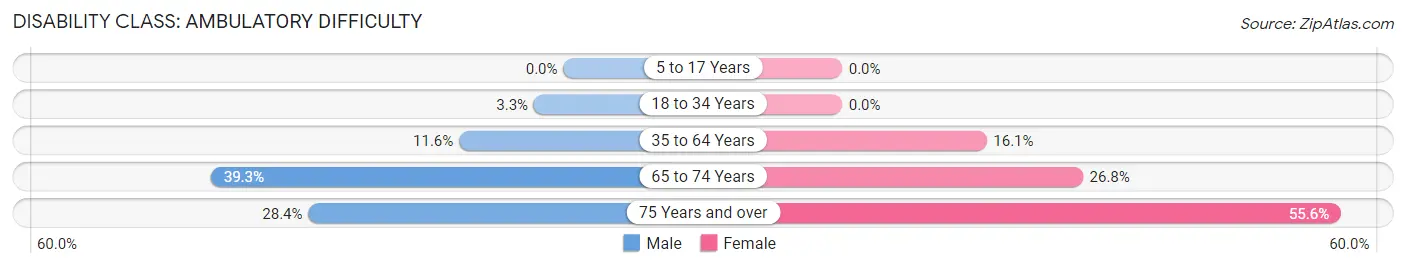
| Age Bracket | Male | Female |
| 5 to 17 Years | 0 (0.0%) | 0 (0.0%) |
| 18 to 34 Years | 53 (3.3%) | 0 (0.0%) |
| 35 to 64 Years | 255 (11.6%) | 488 (16.1%) |
| 65 to 74 Years | 190 (39.3%) | 199 (26.8%) |
| 75 Years and over | 69 (28.4%) | 328 (55.6%) |
Disability Class: Self-Care Difficulty
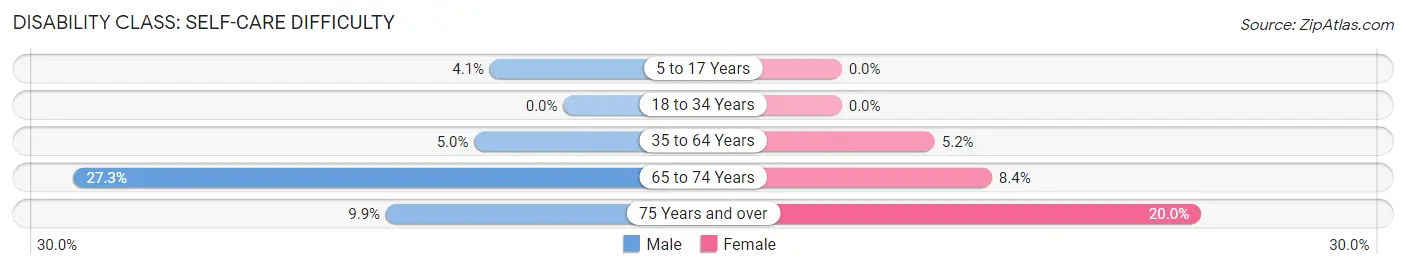
| Age Bracket | Male | Female |
| 5 to 17 Years | 44 (4.1%) | 0 (0.0%) |
| 18 to 34 Years | 0 (0.0%) | 0 (0.0%) |
| 35 to 64 Years | 109 (5.0%) | 157 (5.2%) |
| 65 to 74 Years | 132 (27.3%) | 62 (8.4%) |
| 75 Years and over | 24 (9.9%) | 118 (20.0%) |
Technology Access in Henderson
Computing Device Access in Henderson
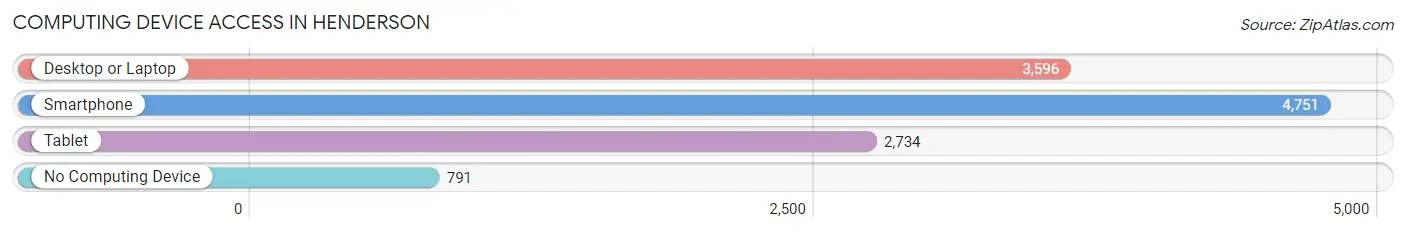
| Device Type | # Households | % Households |
| Desktop or Laptop | 3,596 | 61.7% |
| Smartphone | 4,751 | 81.5% |
| Tablet | 2,734 | 46.9% |
| No Computing Device | 791 | 13.6% |
| Total | 5,832 | 100.0% |
Internet Access in Henderson
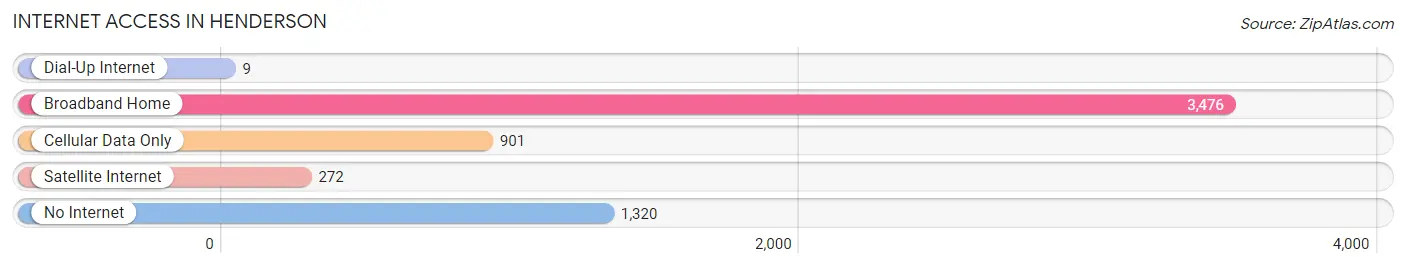
| Internet Type | # Households | % Households |
| Dial-Up Internet | 9 | 0.2% |
| Broadband Home | 3,476 | 59.6% |
| Cellular Data Only | 901 | 15.4% |
| Satellite Internet | 272 | 4.7% |
| No Internet | 1,320 | 22.6% |
| Total | 5,832 | 100.0% |
Henderson Summary
Henderson, North Carolina is a small city located in Vance County, in the northeastern part of the state. It is situated on the banks of the Tar River, and is the county seat of Vance County. The city has a population of 15,368, according to the 2010 census, and is part of the Raleigh-Durham-Chapel Hill metropolitan area.
History
Henderson was founded in 1841 and named after Leonard Henderson, a prominent North Carolina lawyer and politician. The city was originally a small farming community, but it grew rapidly after the arrival of the railroad in 1887. The railroad connected Henderson to other cities in the region, and it quickly became a major hub for the production of tobacco, cotton, and other agricultural products.
In the early 20th century, Henderson experienced a period of industrial growth, with the establishment of several factories and mills. The city was also home to several prominent educational institutions, including Henderson Institute, a historically black college that was founded in 1891.
Geography
Henderson is located in the northeastern part of North Carolina, in Vance County. It is situated on the banks of the Tar River, and is approximately 30 miles northeast of Raleigh. The city has a total area of 8.3 square miles, and is located at an elevation of approximately 300 feet.
The climate in Henderson is humid subtropical, with hot, humid summers and mild winters. The average annual temperature is around 61 degrees Fahrenheit, and the average annual precipitation is around 45 inches.
Economy
Henderson’s economy is largely based on agriculture and manufacturing. The city is home to several large agricultural operations, including tobacco, cotton, and soybean farms. The city is also home to several manufacturing companies, including a furniture factory, a paper mill, and a plastics plant.
The city is also home to several educational institutions, including Vance-Granville Community College and Henderson Institute. The city is also home to several healthcare facilities, including Maria Parham Medical Center and Maria Parham Health.
Demographics
According to the 2010 census, Henderson has a population of 15,368. The racial makeup of the city is 57.3% White, 37.2% African American, 0.5% Native American, 0.7% Asian, 0.1% Pacific Islander, and 4.2% from other races. The median household income is $31,945, and the median age is 37.
Henderson is a small city with a rich history and a diverse economy. It is home to several educational institutions, healthcare facilities, and manufacturing companies, and is a major hub for the production of agricultural products. The city has a population of 15,368, and is part of the Raleigh-Durham-Chapel Hill metropolitan area.
Common Questions
What is Per Capita Income in Henderson?
Per Capita income in Henderson is $22,916.
What is the Median Family Income in Henderson?
Median Family Income in Henderson is $53,258.
What is the Median Household income in Henderson?
Median Household Income in Henderson is $37,670.
What is Income or Wage Gap in Henderson?
Income or Wage Gap in Henderson is 20.8%.
Women in Henderson earn 79.2 cents for every dollar earned by a man.
What is Family Income Deficit in Henderson?
Family Income Deficit in Henderson is $11,864.
Families that are below poverty line in Henderson earn $11,864 less on average than the poverty threshold level.
What is Inequality or Gini Index in Henderson?
Inequality or Gini Index in Henderson is 0.50.
What is the Total Population of Henderson?
Total Population of Henderson is 14,997.
What is the Total Male Population of Henderson?
Total Male Population of Henderson is 6,454.
What is the Total Female Population of Henderson?
Total Female Population of Henderson is 8,543.
What is the Ratio of Males per 100 Females in Henderson?
There are 75.55 Males per 100 Females in Henderson.
What is the Ratio of Females per 100 Males in Henderson?
There are 132.37 Females per 100 Males in Henderson.
What is the Median Population Age in Henderson?
Median Population Age in Henderson is 35.8 Years.
What is the Average Family Size in Henderson
Average Family Size in Henderson is 3.3 People.
What is the Average Household Size in Henderson
Average Household Size in Henderson is 2.5 People.
How Large is the Labor Force in Henderson?
There are 6,734 People in the Labor Forcein in Henderson.
What is the Percentage of People in the Labor Force in Henderson?
57.5% of People are in the Labor Force in Henderson.
What is the Unemployment Rate in Henderson?
Unemployment Rate in Henderson is 6.7%.