Claremont, NC Map & Demographics
Claremont Map
Claremont Overview
$34,389
PER CAPITA INCOME
$76,705
AVG FAMILY INCOME
$60,735
AVG HOUSEHOLD INCOME
23.8%
WAGE / INCOME GAP [ % ]
76.2¢/ $1
WAGE / INCOME GAP [ $ ]
0.44
INEQUALITY / GINI INDEX
1,902
TOTAL POPULATION
956
MALE POPULATION
946
FEMALE POPULATION
101.06
MALES / 100 FEMALES
98.95
FEMALES / 100 MALES
44.5
MEDIAN AGE
2.7
AVG FAMILY SIZE
2.3
AVG HOUSEHOLD SIZE
1,080
LABOR FORCE [ PEOPLE ]
66.8%
PERCENT IN LABOR FORCE
2.0%
UNEMPLOYMENT RATE
Claremont Zip Codes
Claremont Area Codes
Income in Claremont
Income Overview in Claremont
Per Capita Income in Claremont is $34,389, while median incomes of families and households are $76,705 and $60,735 respectively.
| Characteristic | Number | Measure |
| Per Capita Income | 1,902 | $34,389 |
| Median Family Income | 549 | $76,705 |
| Mean Family Income | 549 | $92,256 |
| Median Household Income | 814 | $60,735 |
| Mean Household Income | 814 | $79,324 |
| Income Deficit | 549 | $0 |
| Wage / Income Gap (%) | 1,902 | 23.81% |
| Wage / Income Gap ($) | 1,902 | 76.19¢ per $1 |
| Gini / Inequality Index | 1,902 | 0.44 |
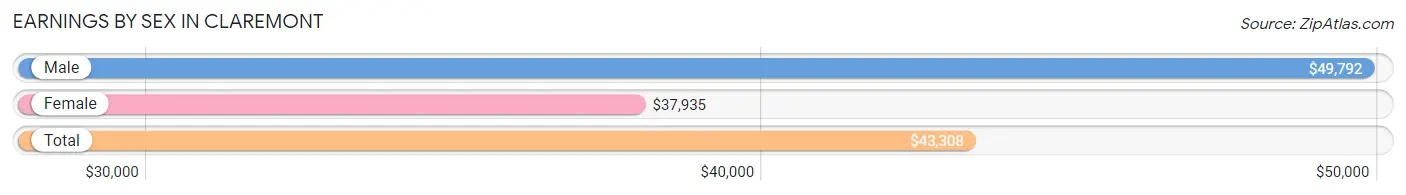
Earnings by Sex in Claremont
Average Earnings in Claremont are $43,308, $49,792 for men and $37,935 for women, a difference of 23.8%.
| Sex | Number | Average Earnings |
| Male | 580 (53.7%) | $49,792 |
| Female | 500 (46.3%) | $37,935 |
| Total | 1,080 (100.0%) | $43,308 |
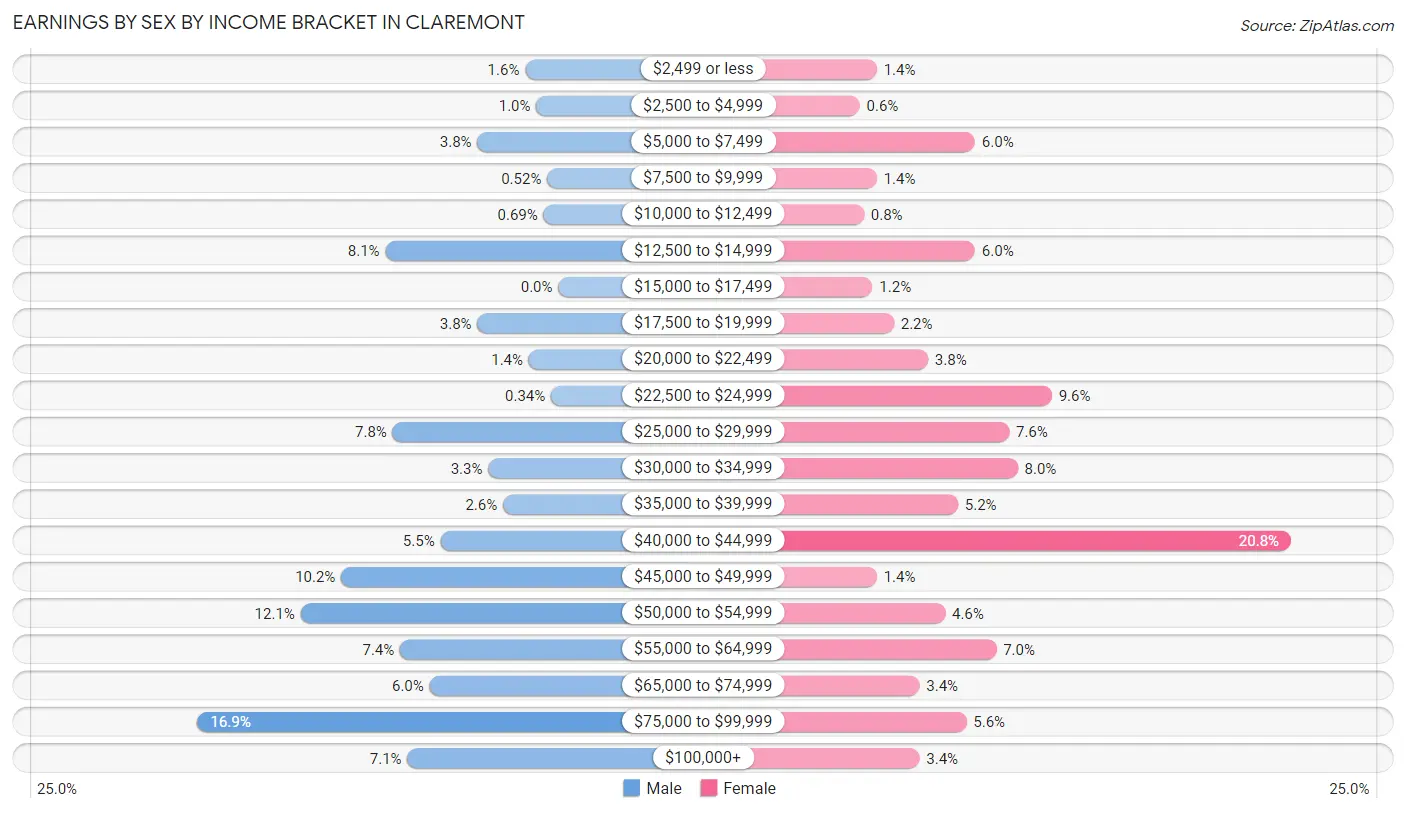
Earnings by Sex by Income Bracket in Claremont
The most common earnings brackets in Claremont are $75,000 to $99,999 for men (98 | 16.9%) and $40,000 to $44,999 for women (104 | 20.8%).
| Income | Male | Female |
| $2,499 or less | 9 (1.5%) | 7 (1.4%) |
| $2,500 to $4,999 | 6 (1.0%) | 3 (0.6%) |
| $5,000 to $7,499 | 22 (3.8%) | 30 (6.0%) |
| $7,500 to $9,999 | 3 (0.5%) | 7 (1.4%) |
| $10,000 to $12,499 | 4 (0.7%) | 4 (0.8%) |
| $12,500 to $14,999 | 47 (8.1%) | 30 (6.0%) |
| $15,000 to $17,499 | 0 (0.0%) | 6 (1.2%) |
| $17,500 to $19,999 | 22 (3.8%) | 11 (2.2%) |
| $20,000 to $22,499 | 8 (1.4%) | 19 (3.8%) |
| $22,500 to $24,999 | 2 (0.3%) | 48 (9.6%) |
| $25,000 to $29,999 | 45 (7.8%) | 38 (7.6%) |
| $30,000 to $34,999 | 19 (3.3%) | 40 (8.0%) |
| $35,000 to $39,999 | 15 (2.6%) | 26 (5.2%) |
| $40,000 to $44,999 | 32 (5.5%) | 104 (20.8%) |
| $45,000 to $49,999 | 59 (10.2%) | 7 (1.4%) |
| $50,000 to $54,999 | 70 (12.1%) | 23 (4.6%) |
| $55,000 to $64,999 | 43 (7.4%) | 35 (7.0%) |
| $65,000 to $74,999 | 35 (6.0%) | 17 (3.4%) |
| $75,000 to $99,999 | 98 (16.9%) | 28 (5.6%) |
| $100,000+ | 41 (7.1%) | 17 (3.4%) |
| Total | 580 (100.0%) | 500 (100.0%) |
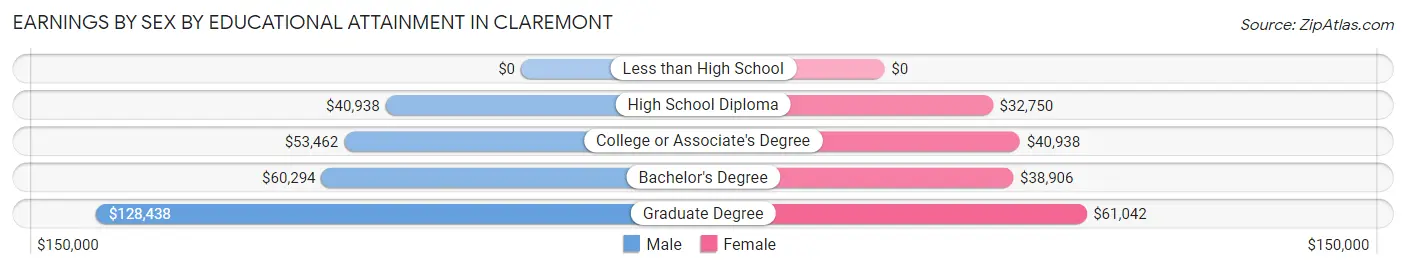
Earnings by Sex by Educational Attainment in Claremont
Average earnings in Claremont are $52,644 for men and $39,891 for women, a difference of 24.2%. Men with an educational attainment of graduate degree enjoy the highest average annual earnings of $128,438, while those with high school diploma education earn the least with $40,938. Women with an educational attainment of graduate degree earn the most with the average annual earnings of $61,042, while those with high school diploma education have the smallest earnings of $32,750.
| Educational Attainment | Male Income | Female Income |
| Less than High School | - | - |
| High School Diploma | $40,938 | $32,750 |
| College or Associate's Degree | $53,462 | $40,938 |
| Bachelor's Degree | $60,294 | $38,906 |
| Graduate Degree | $128,438 | $61,042 |
| Total | $52,644 | $39,891 |
Family Income in Claremont
Family Income Brackets in Claremont
According to the Claremont family income data, there are 117 families falling into the $35,000 to $49,999 income range, which is the most common income bracket and makes up 21.3% of all families.
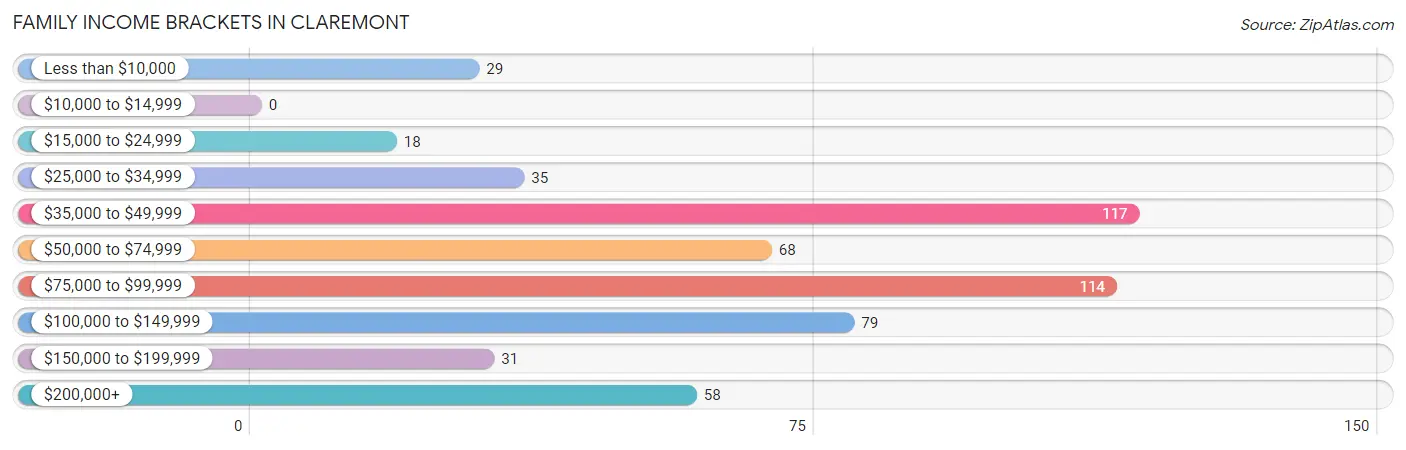
| Income Bracket | # Families | % Families |
| Less than $10,000 | 29 | 5.3% |
| $10,000 to $14,999 | 0 | 0.0% |
| $15,000 to $24,999 | 18 | 3.3% |
| $25,000 to $34,999 | 35 | 6.4% |
| $35,000 to $49,999 | 117 | 21.3% |
| $50,000 to $74,999 | 68 | 12.4% |
| $75,000 to $99,999 | 114 | 20.8% |
| $100,000 to $149,999 | 79 | 14.4% |
| $150,000 to $199,999 | 31 | 5.6% |
| $200,000+ | 58 | 10.6% |
Family Income by Famaliy Size in Claremont
4-person families (65 | 11.8%) account for the highest median family income in Claremont with $134,688 per family, while 4-person families (65 | 11.8%) have the highest median income of $33,672 per family member.
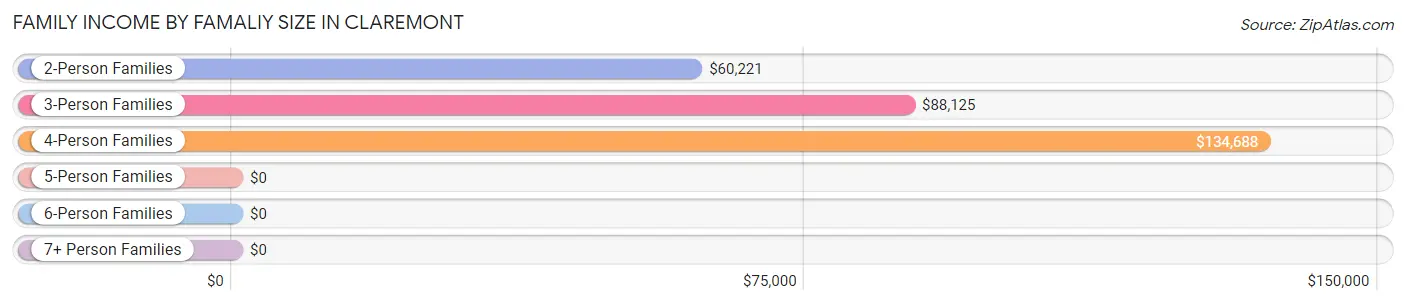
| Income Bracket | # Families | Median Income |
| 2-Person Families | 327 (59.6%) | $60,221 |
| 3-Person Families | 117 (21.3%) | $88,125 |
| 4-Person Families | 65 (11.8%) | $134,688 |
| 5-Person Families | 40 (7.3%) | $0 |
| 6-Person Families | 0 (0.0%) | $0 |
| 7+ Person Families | 0 (0.0%) | $0 |
| Total | 549 (100.0%) | $76,705 |
Family Income by Number of Earners in Claremont
The median family income in Claremont is $76,705, with families comprising 3+ earners (33) having the highest median family income of $202,938, while families with no earners (73) have the lowest median family income of $31,563, accounting for 6.0% and 13.3% of families, respectively.
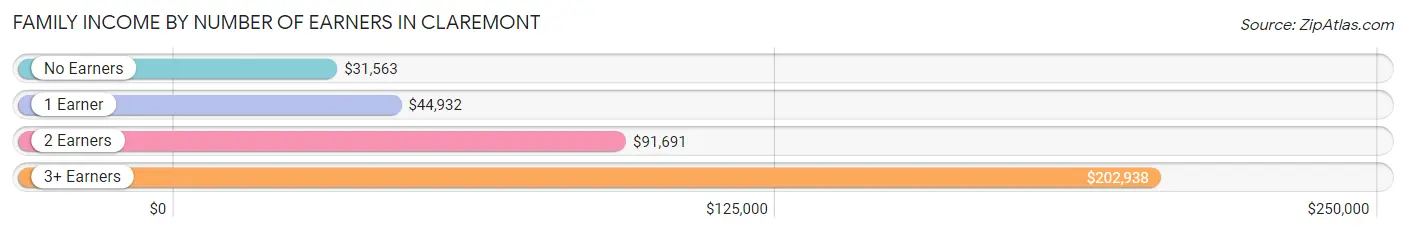
| Number of Earners | # Families | Median Income |
| No Earners | 73 (13.3%) | $31,563 |
| 1 Earner | 206 (37.5%) | $44,932 |
| 2 Earners | 237 (43.2%) | $91,691 |
| 3+ Earners | 33 (6.0%) | $202,938 |
| Total | 549 (100.0%) | $76,705 |
Household Income in Claremont
Household Income Brackets in Claremont
With 155 households falling in the category, the $75,000 to $99,999 income range is the most frequent in Claremont, accounting for 19.0% of all households. In contrast, only 33 households (4.1%) fall into the $10,000 to $14,999 income bracket, making it the least populous group.
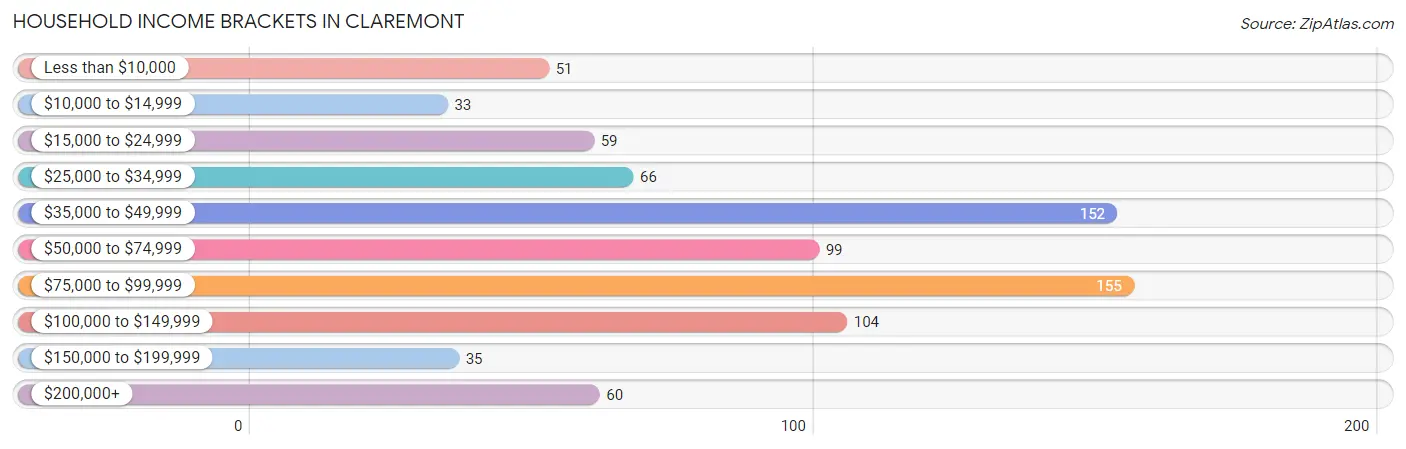
| Income Bracket | # Households | % Households |
| Less than $10,000 | 51 | 6.3% |
| $10,000 to $14,999 | 33 | 4.1% |
| $15,000 to $24,999 | 59 | 7.2% |
| $25,000 to $34,999 | 66 | 8.1% |
| $35,000 to $49,999 | 152 | 18.7% |
| $50,000 to $74,999 | 99 | 12.2% |
| $75,000 to $99,999 | 155 | 19.0% |
| $100,000 to $149,999 | 104 | 12.8% |
| $150,000 to $199,999 | 35 | 4.3% |
| $200,000+ | 60 | 7.4% |
Household Income by Householder Age in Claremont
The median household income in Claremont is $60,735, with the highest median household income of $83,000 found in the 45 to 64 years age bracket for the primary householder. A total of 350 households (43.0%) fall into this category. Meanwhile, the 65+ years age bracket for the primary householder has the lowest median household income of $45,536, with 249 households (30.6%) in this group.
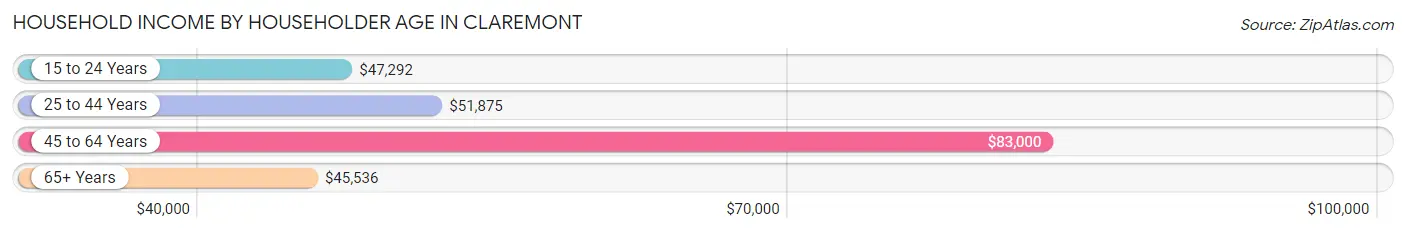
| Income Bracket | # Households | Median Income |
| 15 to 24 Years | 35 (4.3%) | $47,292 |
| 25 to 44 Years | 180 (22.1%) | $51,875 |
| 45 to 64 Years | 350 (43.0%) | $83,000 |
| 65+ Years | 249 (30.6%) | $45,536 |
| Total | 814 (100.0%) | $60,735 |
Poverty in Claremont
Income Below Poverty by Sex and Age in Claremont
With 9.4% poverty level for males and 12.6% for females among the residents of Claremont, 15 year old males and 12 to 14 year old females are the most vulnerable to poverty, with 6 males (100.0%) and 7 females (36.8%) in their respective age groups living below the poverty level.
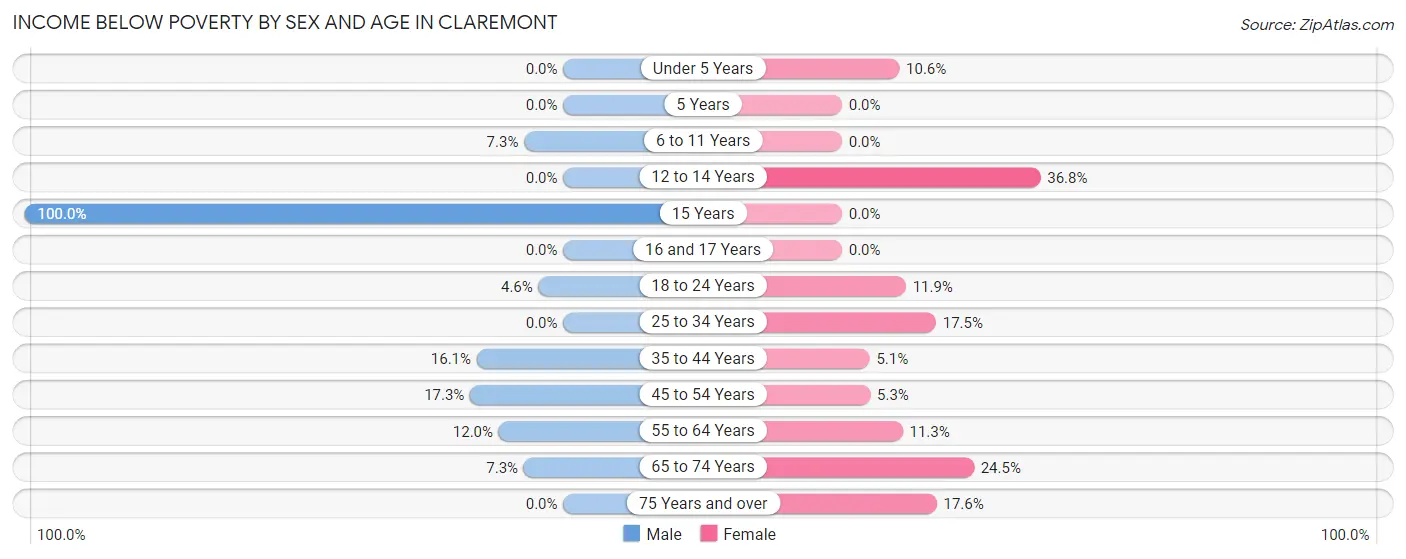
| Age Bracket | Male | Female |
| Under 5 Years | 0 (0.0%) | 5 (10.6%) |
| 5 Years | 0 (0.0%) | 0 (0.0%) |
| 6 to 11 Years | 9 (7.3%) | 0 (0.0%) |
| 12 to 14 Years | 0 (0.0%) | 7 (36.8%) |
| 15 Years | 6 (100.0%) | 0 (0.0%) |
| 16 and 17 Years | 0 (0.0%) | 0 (0.0%) |
| 18 to 24 Years | 5 (4.6%) | 7 (11.9%) |
| 25 to 34 Years | 0 (0.0%) | 26 (17.4%) |
| 35 to 44 Years | 13 (16.1%) | 4 (5.1%) |
| 45 to 54 Years | 37 (17.3%) | 10 (5.3%) |
| 55 to 64 Years | 14 (12.0%) | 8 (11.3%) |
| 65 to 74 Years | 6 (7.3%) | 36 (24.5%) |
| 75 Years and over | 0 (0.0%) | 16 (17.6%) |
| Total | 90 (9.4%) | 119 (12.6%) |
Income Above Poverty by Sex and Age in Claremont
According to the poverty statistics in Claremont, males aged under 5 years and females aged 5 years are the age groups that are most secure financially, with 100.0% of males and 100.0% of females in these age groups living above the poverty line.
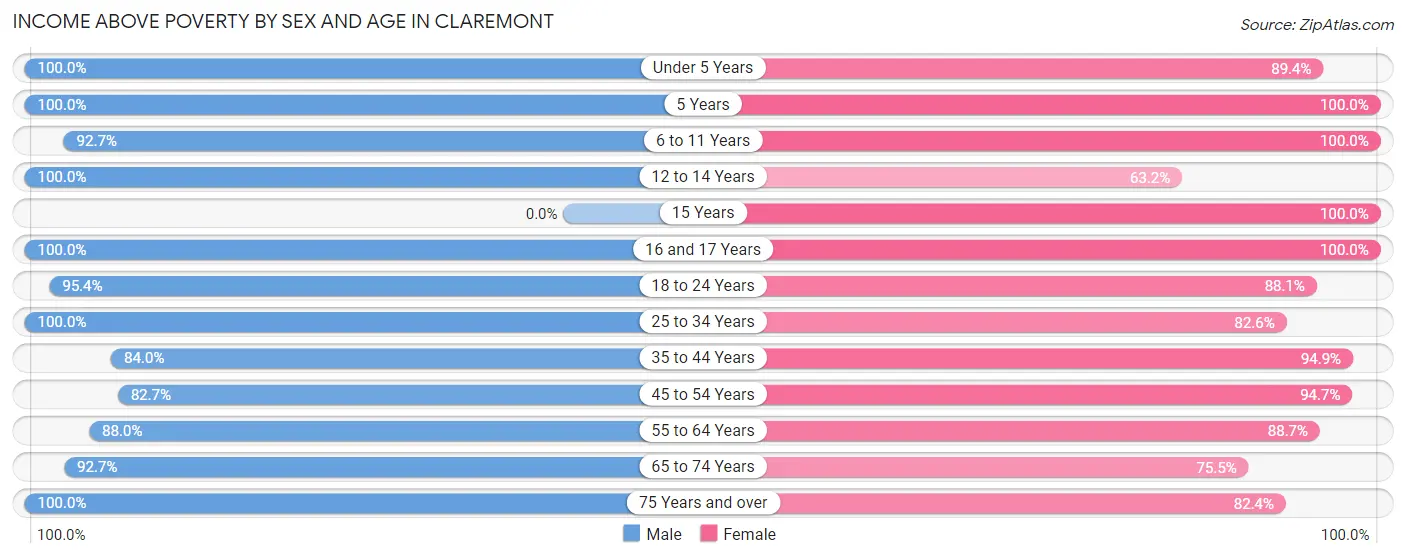
| Age Bracket | Male | Female |
| Under 5 Years | 30 (100.0%) | 42 (89.4%) |
| 5 Years | 21 (100.0%) | 4 (100.0%) |
| 6 to 11 Years | 115 (92.7%) | 12 (100.0%) |
| 12 to 14 Years | 10 (100.0%) | 12 (63.2%) |
| 15 Years | 0 (0.0%) | 8 (100.0%) |
| 16 and 17 Years | 37 (100.0%) | 67 (100.0%) |
| 18 to 24 Years | 104 (95.4%) | 52 (88.1%) |
| 25 to 34 Years | 88 (100.0%) | 123 (82.6%) |
| 35 to 44 Years | 68 (84.0%) | 74 (94.9%) |
| 45 to 54 Years | 177 (82.7%) | 180 (94.7%) |
| 55 to 64 Years | 103 (88.0%) | 63 (88.7%) |
| 65 to 74 Years | 76 (92.7%) | 111 (75.5%) |
| 75 Years and over | 37 (100.0%) | 75 (82.4%) |
| Total | 866 (90.6%) | 823 (87.4%) |
Income Below Poverty Among Married-Couple Families in Claremont
The poverty statistics for married-couple families in Claremont show that 3.7% or 13 of the total 352 families live below the poverty line. Families with no children have the highest poverty rate of 5.6%, comprising of 13 families. On the other hand, families with 1 or 2 children have the lowest poverty rate of 0.0%, which includes 0 families.
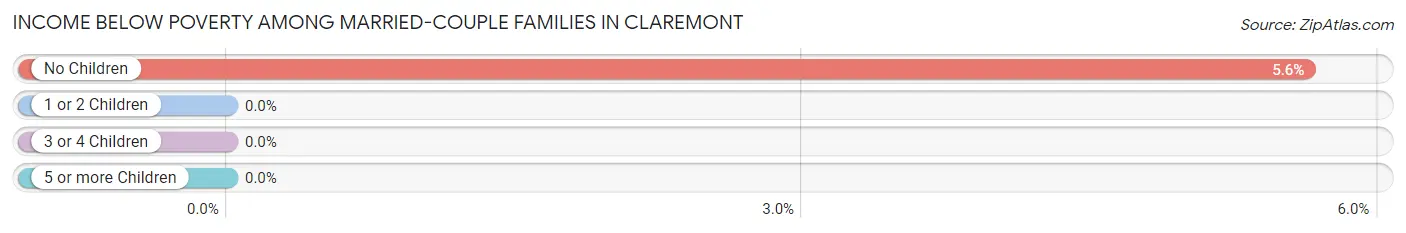
| Children | Above Poverty | Below Poverty |
| No Children | 218 (94.4%) | 13 (5.6%) |
| 1 or 2 Children | 108 (100.0%) | 0 (0.0%) |
| 3 or 4 Children | 13 (100.0%) | 0 (0.0%) |
| 5 or more Children | 0 (0.0%) | 0 (0.0%) |
| Total | 339 (96.3%) | 13 (3.7%) |
Income Below Poverty Among Single-Parent Households in Claremont
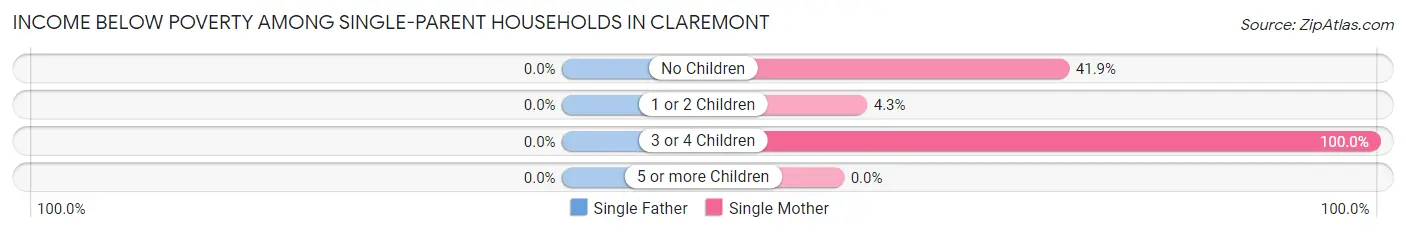
| Children | Single Father | Single Mother |
| No Children | 0 (0.0%) | 13 (41.9%) |
| 1 or 2 Children | 0 (0.0%) | 5 (4.3%) |
| 3 or 4 Children | 0 (0.0%) | 4 (100.0%) |
| 5 or more Children | 0 (0.0%) | 0 (0.0%) |
| Total | 0 (0.0%) | 22 (14.6%) |
Income Below Poverty Among Married-Couple vs Single-Parent Households in Claremont
The poverty data for Claremont shows that 13 of the married-couple family households (3.7%) and 22 of the single-parent households (11.2%) are living below the poverty level. Within the married-couple family households, those with no children have the highest poverty rate, with 13 households (5.6%) falling below the poverty line. Among the single-parent households, those with 3 or 4 children have the highest poverty rate, with 4 household (100.0%) living below poverty.
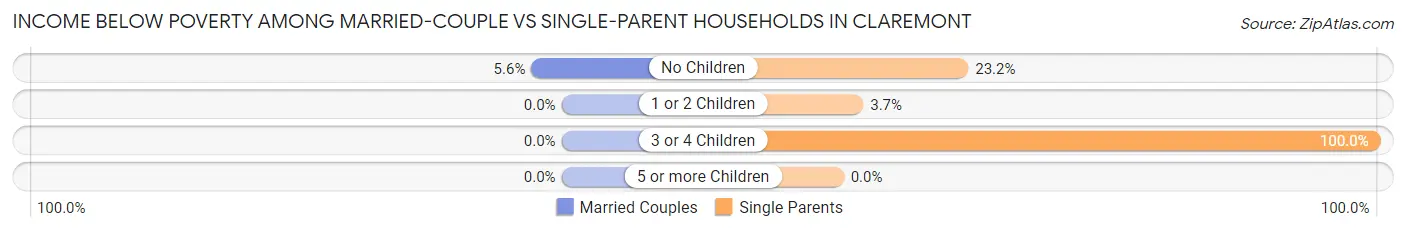
| Children | Married-Couple Families | Single-Parent Households |
| No Children | 13 (5.6%) | 13 (23.2%) |
| 1 or 2 Children | 0 (0.0%) | 5 (3.6%) |
| 3 or 4 Children | 0 (0.0%) | 4 (100.0%) |
| 5 or more Children | 0 (0.0%) | 0 (0.0%) |
| Total | 13 (3.7%) | 22 (11.2%) |
Race in Claremont
The most populous races in Claremont are White / Caucasian (1,616 | 85.0%), Two or more Races (187 | 9.8%), and Hispanic or Latino (177 | 9.3%).
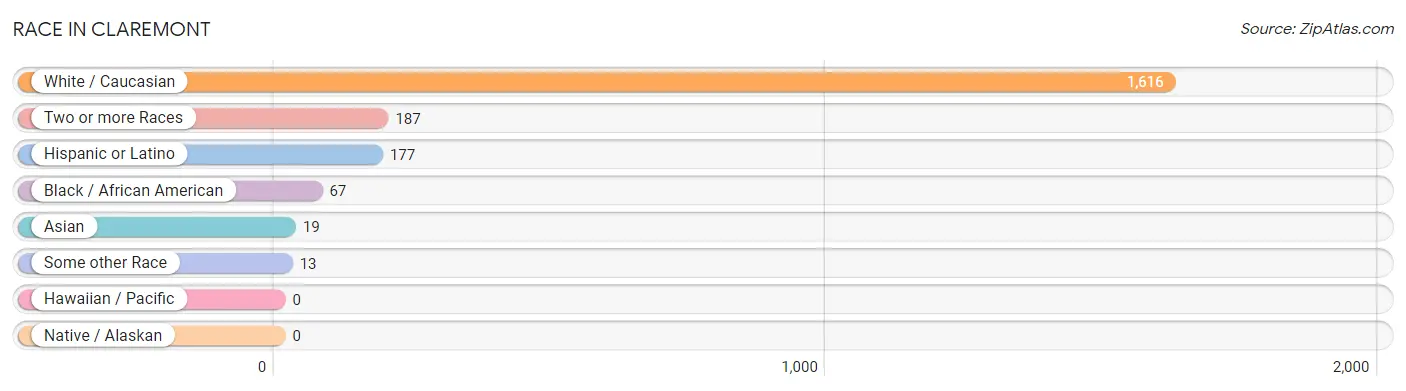
| Race | # Population | % Population |
| Asian | 19 | 1.0% |
| Black / African American | 67 | 3.5% |
| Hawaiian / Pacific | 0 | 0.0% |
| Hispanic or Latino | 177 | 9.3% |
| Native / Alaskan | 0 | 0.0% |
| White / Caucasian | 1,616 | 85.0% |
| Two or more Races | 187 | 9.8% |
| Some other Race | 13 | 0.7% |
| Total | 1,902 | 100.0% |
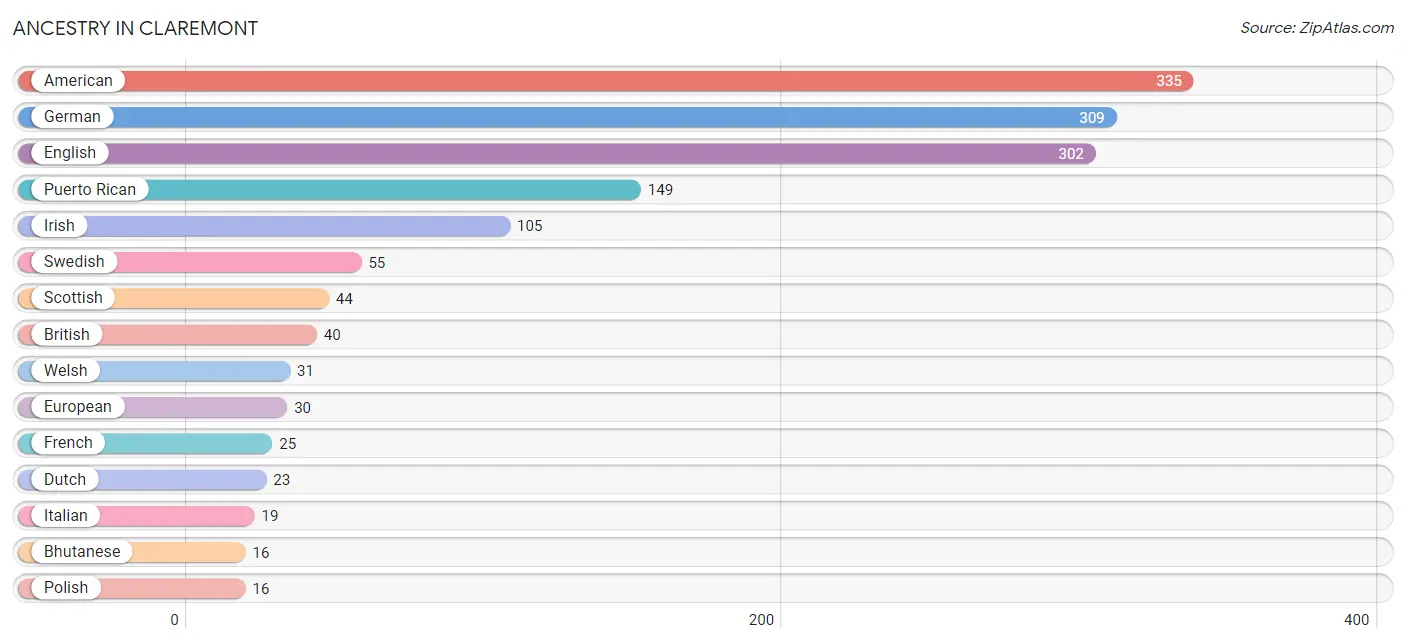
Ancestry in Claremont
The most populous ancestries reported in Claremont are American (335 | 17.6%), German (309 | 16.3%), English (302 | 15.9%), Puerto Rican (149 | 7.8%), and Irish (105 | 5.5%), together accounting for 63.1% of all Claremont residents.
| Ancestry | # Population | % Population |
| African | 9 | 0.5% |
| American | 335 | 17.6% |
| Bangladeshi | 12 | 0.6% |
| Bhutanese | 16 | 0.8% |
| Blackfeet | 9 | 0.5% |
| British | 40 | 2.1% |
| Burmese | 3 | 0.2% |
| Cherokee | 4 | 0.2% |
| Colombian | 4 | 0.2% |
| Dominican | 13 | 0.7% |
| Dutch | 23 | 1.2% |
| Eastern European | 3 | 0.2% |
| English | 302 | 15.9% |
| European | 30 | 1.6% |
| Finnish | 4 | 0.2% |
| French | 25 | 1.3% |
| German | 309 | 16.3% |
| Hungarian | 3 | 0.2% |
| Irish | 105 | 5.5% |
| Italian | 19 | 1.0% |
| Mexican | 7 | 0.4% |
| Pennsylvania German | 4 | 0.2% |
| Polish | 16 | 0.8% |
| Puerto Rican | 149 | 7.8% |
| Scandinavian | 5 | 0.3% |
| Scotch-Irish | 5 | 0.3% |
| Scottish | 44 | 2.3% |
| South American | 8 | 0.4% |
| Subsaharan African | 9 | 0.5% |
| Swedish | 55 | 2.9% |
| Swiss | 9 | 0.5% |
| Thai | 4 | 0.2% |
| Welsh | 31 | 1.6% | View All 33 Rows |
Immigrants in Claremont
The most numerous immigrant groups reported in Claremont came from Caribbean (13 | 0.7%), Dominican Republic (13 | 0.7%), Latin America (13 | 0.7%), Asia (11 | 0.6%), and India (4 | 0.2%), together accounting for 2.8% of all Claremont residents.
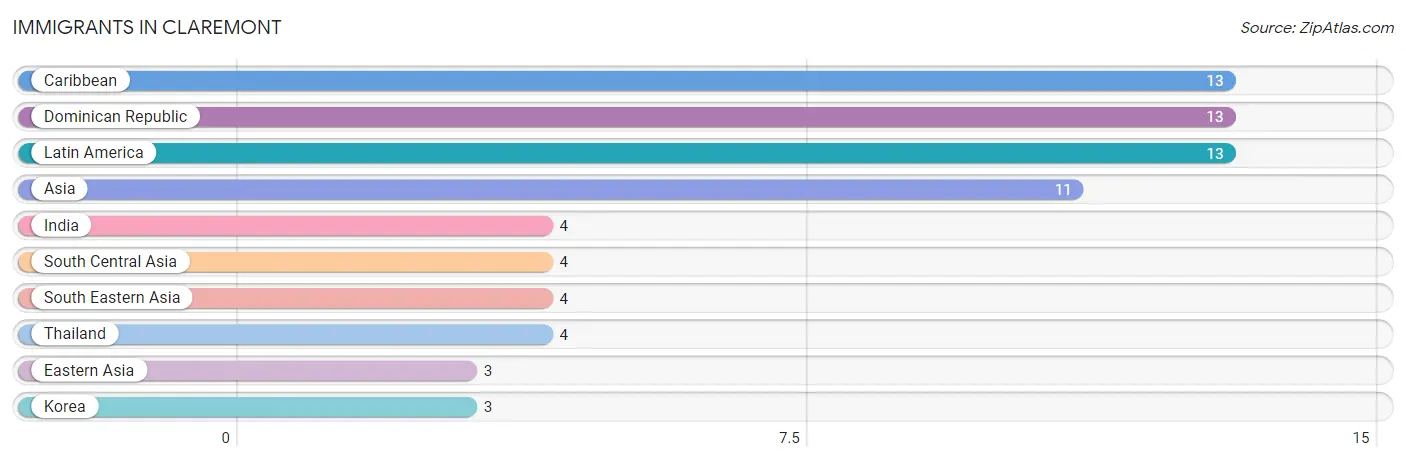
| Immigration Origin | # Population | % Population |
| Asia | 11 | 0.6% |
| Caribbean | 13 | 0.7% |
| Dominican Republic | 13 | 0.7% |
| Eastern Asia | 3 | 0.2% |
| India | 4 | 0.2% |
| Korea | 3 | 0.2% |
| Latin America | 13 | 0.7% |
| South Central Asia | 4 | 0.2% |
| South Eastern Asia | 4 | 0.2% |
| Thailand | 4 | 0.2% | View All 10 Rows |
Sex and Age in Claremont
Sex and Age in Claremont
The most populous age groups in Claremont are 45 to 49 Years (169 | 17.7%) for men and 50 to 54 Years (149 | 15.8%) for women.
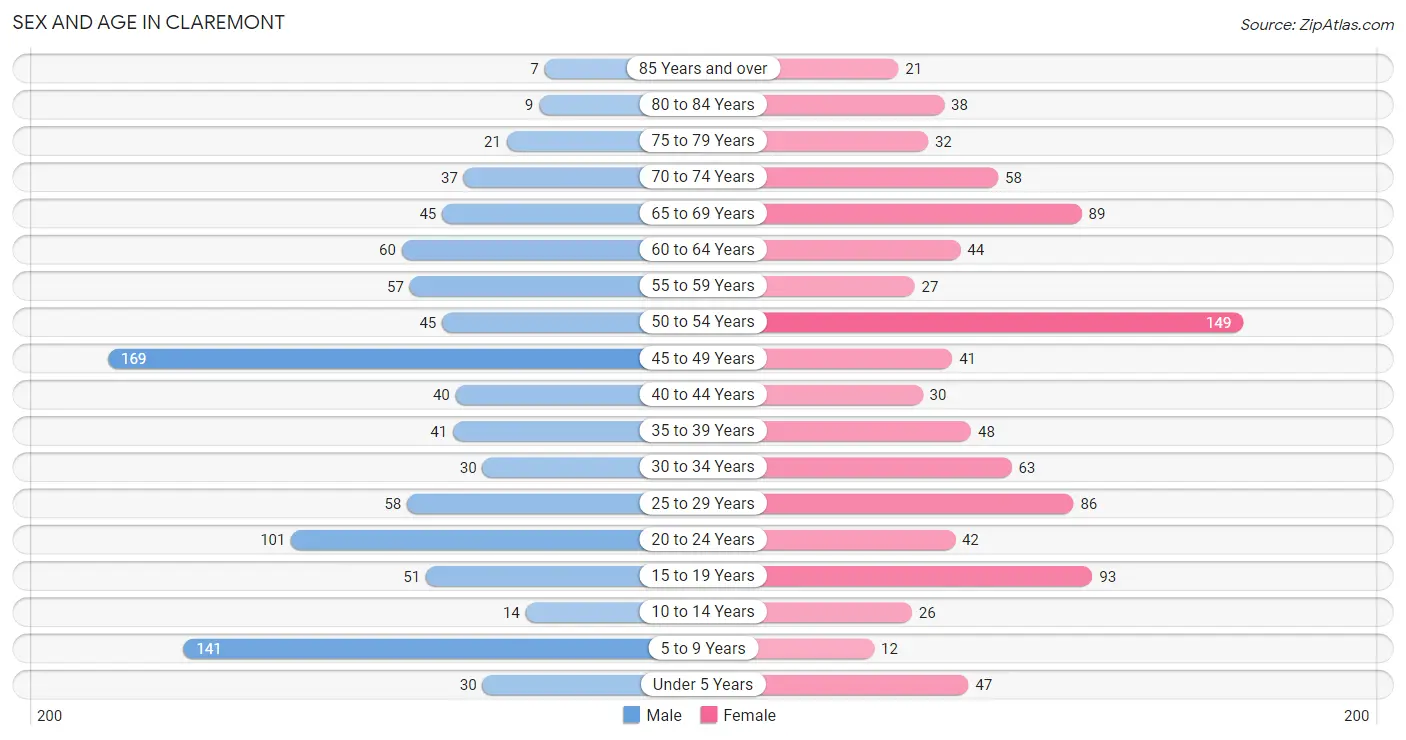
| Age Bracket | Male | Female |
| Under 5 Years | 30 (3.1%) | 47 (5.0%) |
| 5 to 9 Years | 141 (14.7%) | 12 (1.3%) |
| 10 to 14 Years | 14 (1.5%) | 26 (2.8%) |
| 15 to 19 Years | 51 (5.3%) | 93 (9.8%) |
| 20 to 24 Years | 101 (10.6%) | 42 (4.4%) |
| 25 to 29 Years | 58 (6.1%) | 86 (9.1%) |
| 30 to 34 Years | 30 (3.1%) | 63 (6.7%) |
| 35 to 39 Years | 41 (4.3%) | 48 (5.1%) |
| 40 to 44 Years | 40 (4.2%) | 30 (3.2%) |
| 45 to 49 Years | 169 (17.7%) | 41 (4.3%) |
| 50 to 54 Years | 45 (4.7%) | 149 (15.8%) |
| 55 to 59 Years | 57 (6.0%) | 27 (2.9%) |
| 60 to 64 Years | 60 (6.3%) | 44 (4.6%) |
| 65 to 69 Years | 45 (4.7%) | 89 (9.4%) |
| 70 to 74 Years | 37 (3.9%) | 58 (6.1%) |
| 75 to 79 Years | 21 (2.2%) | 32 (3.4%) |
| 80 to 84 Years | 9 (0.9%) | 38 (4.0%) |
| 85 Years and over | 7 (0.7%) | 21 (2.2%) |
| Total | 956 (100.0%) | 946 (100.0%) |
Families and Households in Claremont
Median Family Size in Claremont
The median family size in Claremont is 2.73 persons per family, with single male/father families (46 | 8.4%) accounting for the largest median family size of 3.15 persons per family. On the other hand, single female/mother families (151 | 27.5%) represent the smallest median family size with 2.08 persons per family.
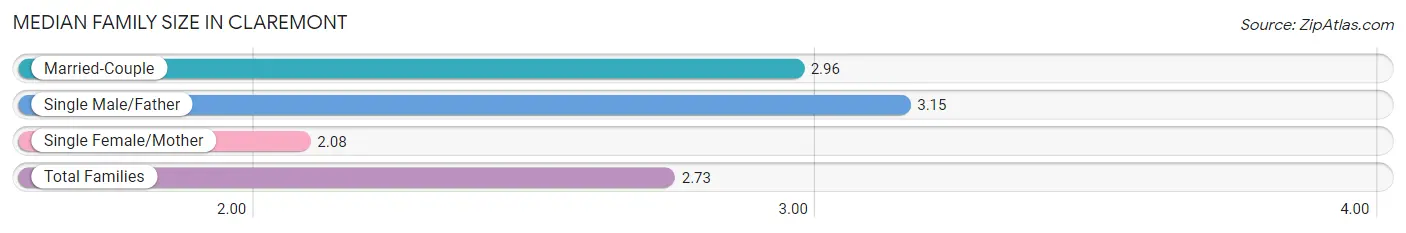
| Family Type | # Families | Family Size |
| Married-Couple | 352 (64.1%) | 2.96 |
| Single Male/Father | 46 (8.4%) | 3.15 |
| Single Female/Mother | 151 (27.5%) | 2.08 |
| Total Families | 549 (100.0%) | 2.73 |
Median Household Size in Claremont
The median household size in Claremont is 2.34 persons per household, with single male/father households (46 | 5.7%) accounting for the largest median household size of 3.54 persons per household. non-family households (265 | 32.6%) represent the smallest median household size with 1.29 persons per household.
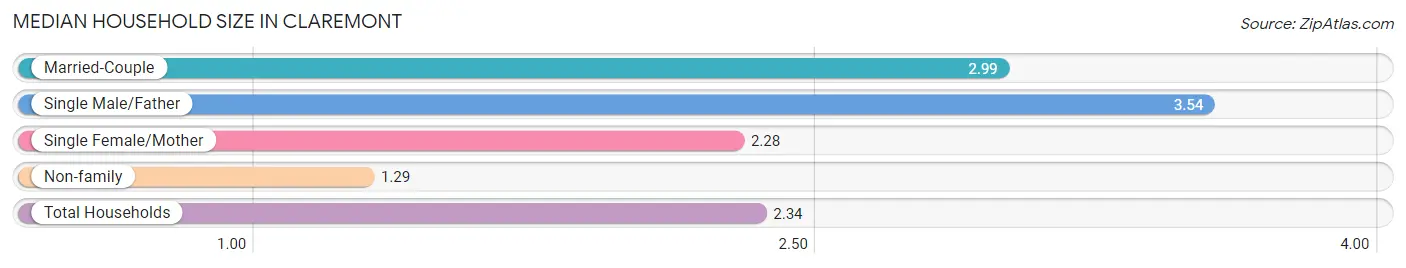
| Household Type | # Households | Household Size |
| Married-Couple | 352 (43.2%) | 2.99 |
| Single Male/Father | 46 (5.7%) | 3.54 |
| Single Female/Mother | 151 (18.5%) | 2.28 |
| Non-family | 265 (32.6%) | 1.29 |
| Total Households | 814 (100.0%) | 2.34 |
Household Size by Marriage Status in Claremont
Out of a total of 814 households in Claremont, 549 (67.4%) are family households, while 265 (32.6%) are nonfamily households. The most numerous type of family households are 2-person households, comprising 308, and the most common type of nonfamily households are 1-person households, comprising 200.
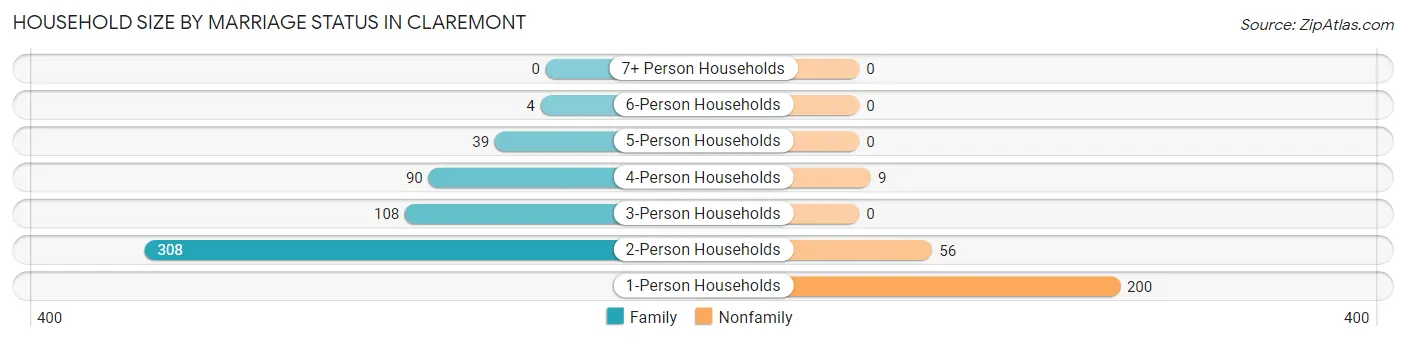
| Household Size | Family Households | Nonfamily Households |
| 1-Person Households | - | 200 (24.6%) |
| 2-Person Households | 308 (37.8%) | 56 (6.9%) |
| 3-Person Households | 108 (13.3%) | 0 (0.0%) |
| 4-Person Households | 90 (11.1%) | 9 (1.1%) |
| 5-Person Households | 39 (4.8%) | 0 (0.0%) |
| 6-Person Households | 4 (0.5%) | 0 (0.0%) |
| 7+ Person Households | 0 (0.0%) | 0 (0.0%) |
| Total | 549 (67.4%) | 265 (32.6%) |
Female Fertility in Claremont
Fertility by Age in Claremont
Average fertility rate in Claremont is 82.0 births per 1,000 women. Women in the age bracket of 20 to 34 years have the highest fertility rate with 120.0 births per 1,000 women. Women in the age bracket of 20 to 34 years acount for 65.7% of all women with births.
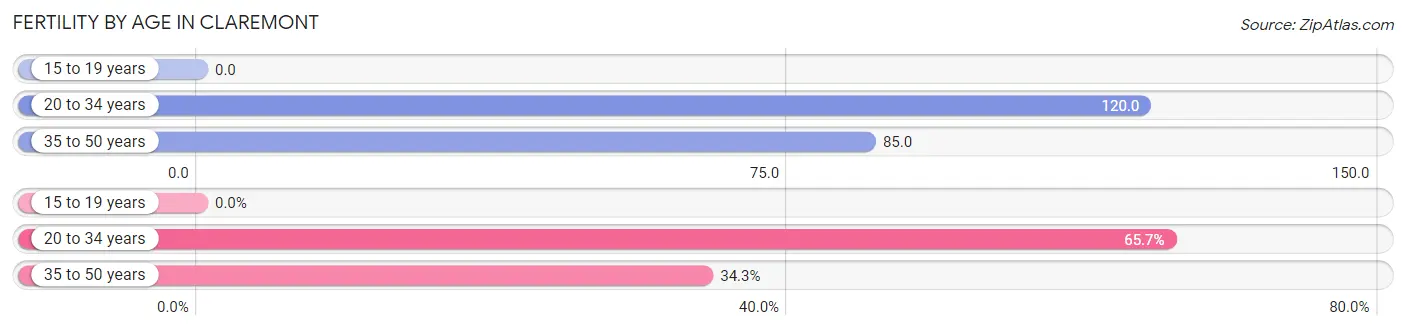
| Age Bracket | Women with Births | Births / 1,000 Women |
| 15 to 19 years | 0 (0.0%) | 0.0 |
| 20 to 34 years | 23 (65.7%) | 120.0 |
| 35 to 50 years | 12 (34.3%) | 85.0 |
| Total | 35 (100.0%) | 82.0 |
Fertility by Age by Marriage Status in Claremont
48.6% of women with births (35) in Claremont are married. The highest percentage of unmarried women with births falls into 35 to 50 years age bracket with 100.0% of them unmarried at the time of birth, while the lowest percentage of unmarried women with births belong to 20 to 34 years age bracket with 26.1% of them unmarried.
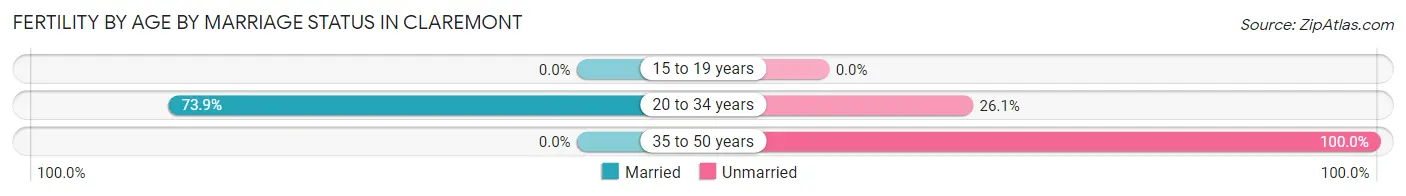
| Age Bracket | Married | Unmarried |
| 15 to 19 years | 0 (0.0%) | 0 (0.0%) |
| 20 to 34 years | 17 (73.9%) | 6 (26.1%) |
| 35 to 50 years | 0 (0.0%) | 12 (100.0%) |
| Total | 17 (48.6%) | 18 (51.4%) |
Fertility by Education in Claremont
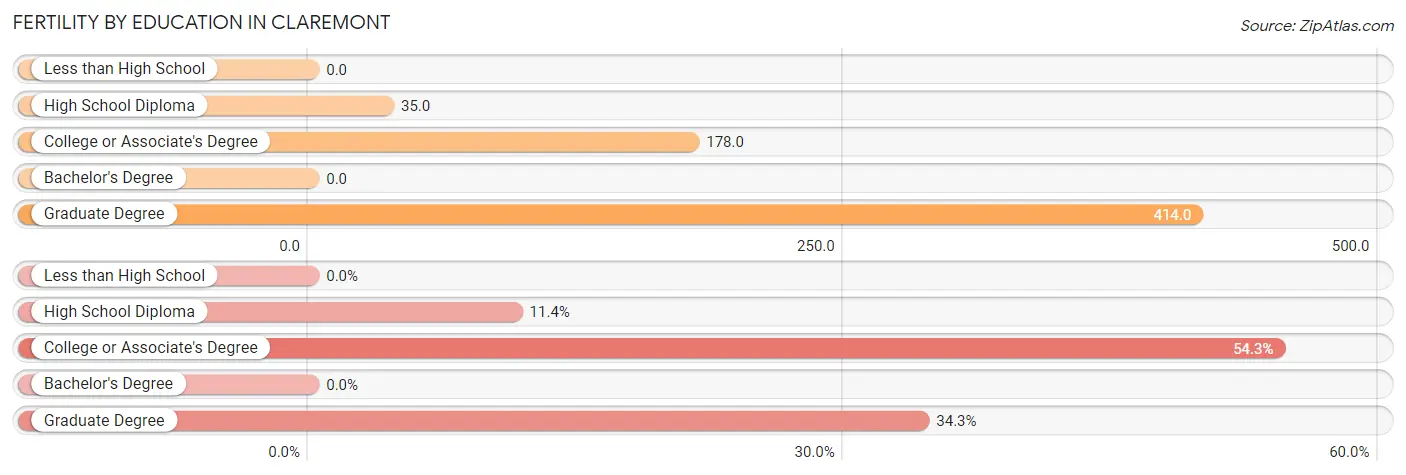
| Educational Attainment | Women with Births | Births / 1,000 Women |
| Less than High School | 0 (0.0%) | 0.0 |
| High School Diploma | 4 (11.4%) | 35.0 |
| College or Associate's Degree | 19 (54.3%) | 178.0 |
| Bachelor's Degree | 0 (0.0%) | 0.0 |
| Graduate Degree | 12 (34.3%) | 414.0 |
| Total | 35 (100.0%) | 82.0 |
Fertility by Education by Marriage Status in Claremont
51.4% of women with births in Claremont are unmarried. Women with the educational attainment of college or associate's degree are most likely to be married with 89.5% of them married at childbirth, while women with the educational attainment of high school diploma are least likely to be married with 100.0% of them unmarried at childbirth.
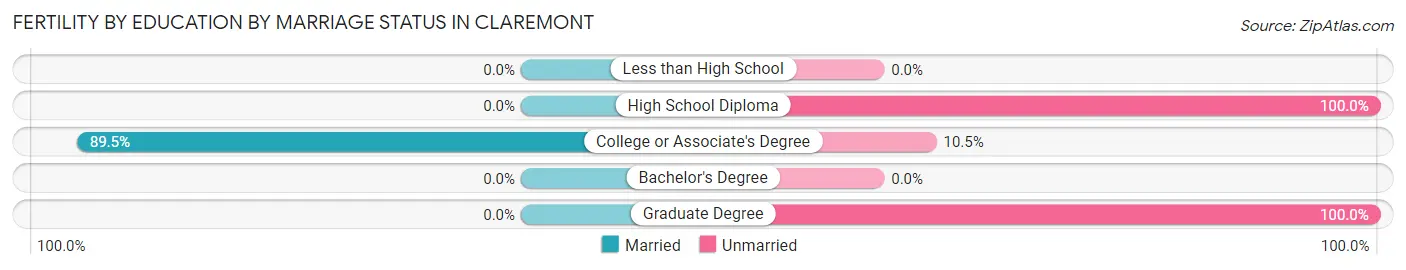
| Educational Attainment | Married | Unmarried |
| Less than High School | 0 (0.0%) | 0 (0.0%) |
| High School Diploma | 0 (0.0%) | 4 (100.0%) |
| College or Associate's Degree | 17 (89.5%) | 2 (10.5%) |
| Bachelor's Degree | 0 (0.0%) | 0 (0.0%) |
| Graduate Degree | 0 (0.0%) | 12 (100.0%) |
| Total | 17 (48.6%) | 18 (51.4%) |
Employment Characteristics in Claremont
Employment by Class of Employer in Claremont
Among the 1,046 employed individuals in Claremont, private company employees (773 | 73.9%), local government employees (100 | 9.6%), and not-for-profit organizations (65 | 6.2%) make up the most common classes of employment.
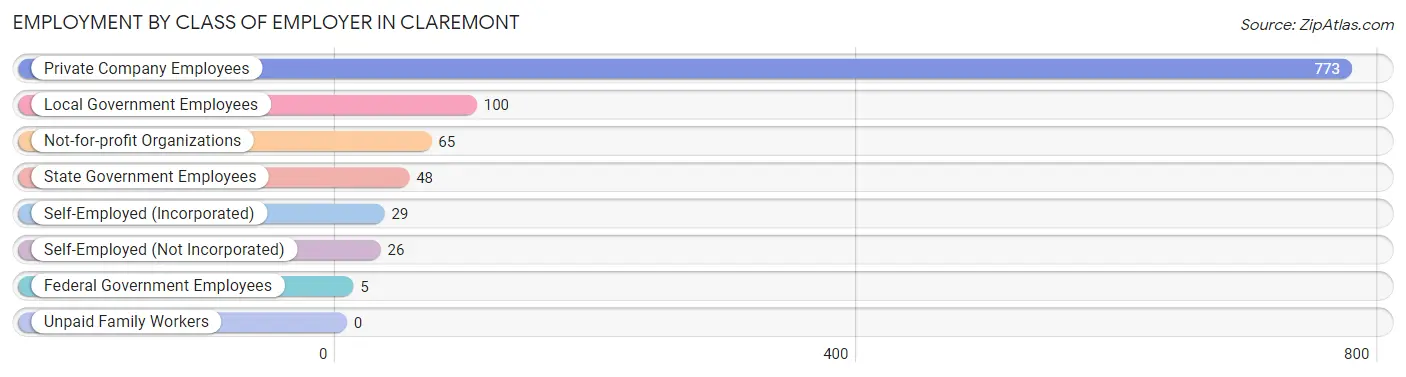
| Employer Class | # Employees | % Employees |
| Private Company Employees | 773 | 73.9% |
| Self-Employed (Incorporated) | 29 | 2.8% |
| Self-Employed (Not Incorporated) | 26 | 2.5% |
| Not-for-profit Organizations | 65 | 6.2% |
| Local Government Employees | 100 | 9.6% |
| State Government Employees | 48 | 4.6% |
| Federal Government Employees | 5 | 0.5% |
| Unpaid Family Workers | 0 | 0.0% |
| Total | 1,046 | 100.0% |
Employment Status by Age in Claremont
According to the labor force statistics for Claremont, out of the total population over 16 years of age (1,617), 66.8% or 1,080 individuals are in the labor force, with 2.0% or 22 of them unemployed. The age group with the highest labor force participation rate is 25 to 29 years, with 94.4% or 136 individuals in the labor force. Within the labor force, the 16 to 19 years age range has the highest percentage of unemployed individuals, with 13.8% or 4 of them being unemployed.
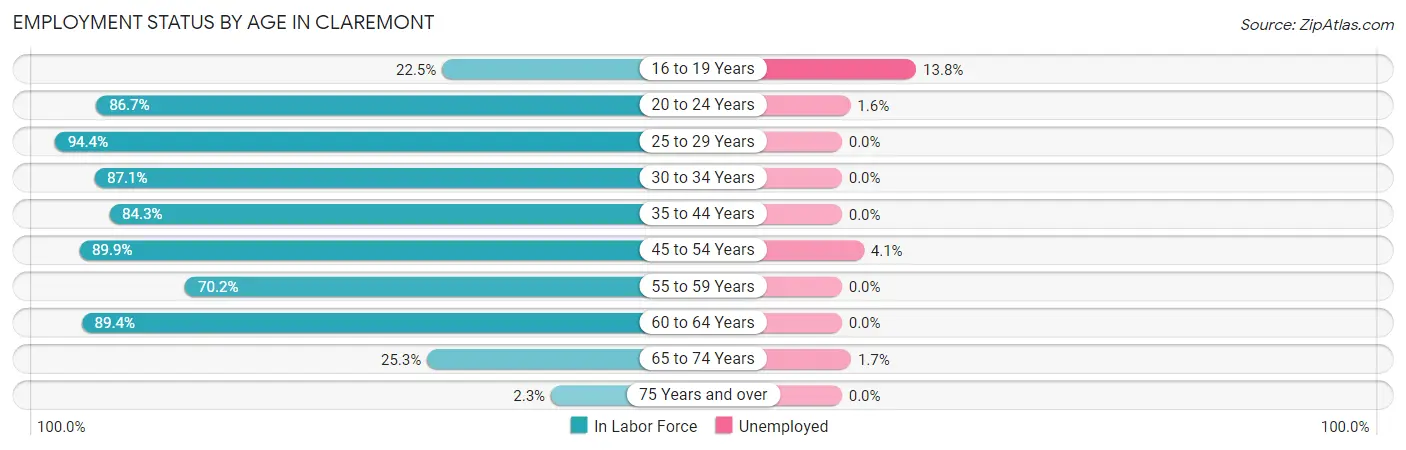
| Age Bracket | In Labor Force | Unemployed |
| 16 to 19 Years | 29 (22.5%) | 4 (13.8%) |
| 20 to 24 Years | 124 (86.7%) | 2 (1.6%) |
| 25 to 29 Years | 136 (94.4%) | 0 (0.0%) |
| 30 to 34 Years | 81 (87.1%) | 0 (0.0%) |
| 35 to 44 Years | 134 (84.3%) | 0 (0.0%) |
| 45 to 54 Years | 363 (89.9%) | 15 (4.1%) |
| 55 to 59 Years | 59 (70.2%) | 0 (0.0%) |
| 60 to 64 Years | 93 (89.4%) | 0 (0.0%) |
| 65 to 74 Years | 58 (25.3%) | 1 (1.7%) |
| 75 Years and over | 3 (2.3%) | 0 (0.0%) |
| Total | 1,080 (66.8%) | 22 (2.0%) |
Employment Status by Educational Attainment in Claremont
According to labor force statistics for Claremont, 87.7% of individuals (866) out of the total population between 25 and 64 years of age (988) are in the labor force, with 1.7% or 15 of them being unemployed. The group with the highest labor force participation rate are those with the educational attainment of bachelor's degree or higher, with 100.0% or 197 individuals in the labor force. Within the labor force, individuals with bachelor's degree or higher education have the highest percentage of unemployment, with 7.6% or 15 of them being unemployed.
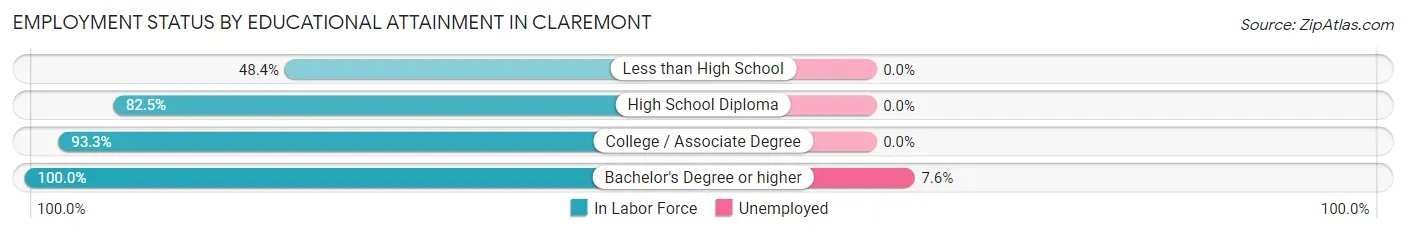
| Educational Attainment | In Labor Force | Unemployed |
| Less than High School | 31 (48.4%) | 0 (0.0%) |
| High School Diploma | 306 (82.5%) | 0 (0.0%) |
| College / Associate Degree | 332 (93.3%) | 0 (0.0%) |
| Bachelor's Degree or higher | 197 (100.0%) | 15 (7.6%) |
| Total | 866 (87.7%) | 17 (1.7%) |
Employment Occupations by Sex in Claremont
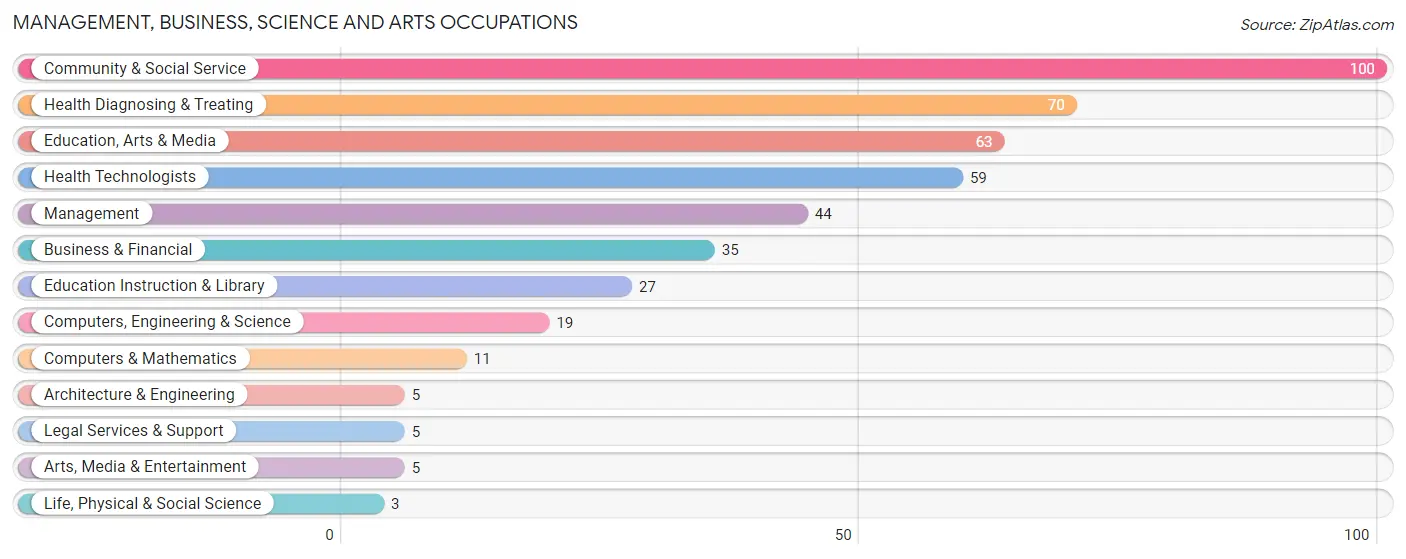
Management, Business, Science and Arts Occupations
The most common Management, Business, Science and Arts occupations in Claremont are Community & Social Service (100 | 9.5%), Health Diagnosing & Treating (70 | 6.6%), Education, Arts & Media (63 | 5.9%), Health Technologists (59 | 5.6%), and Management (44 | 4.2%).
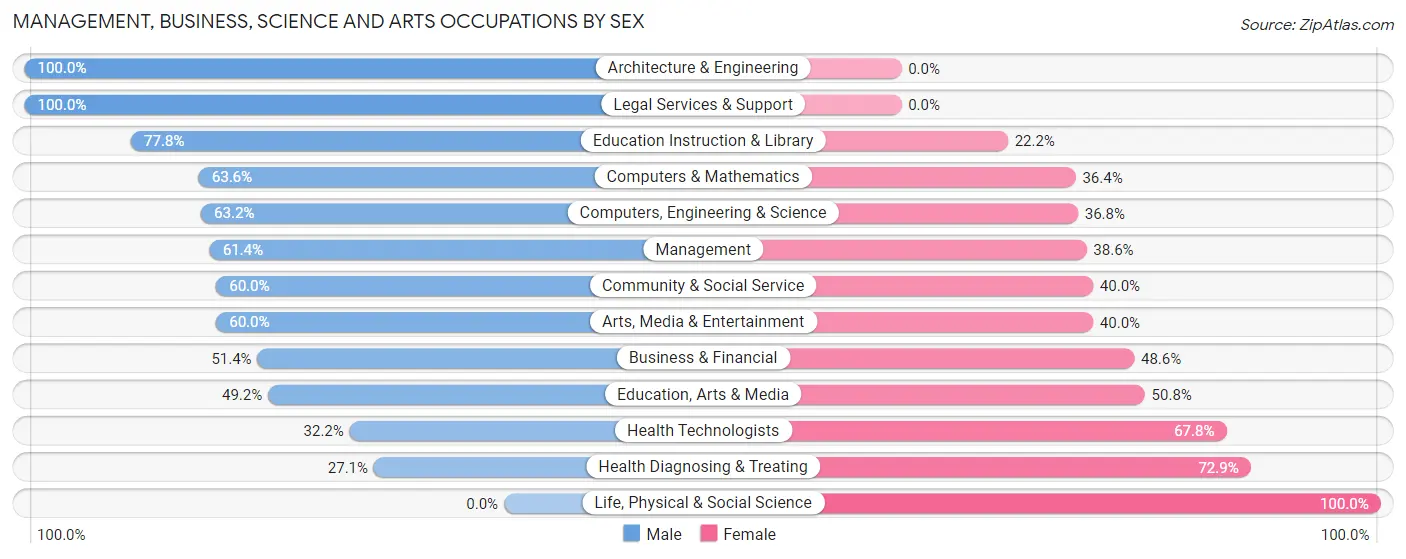
Management, Business, Science and Arts Occupations by Sex
Within the Management, Business, Science and Arts occupations in Claremont, the most male-oriented occupations are Architecture & Engineering (100.0%), Legal Services & Support (100.0%), and Education Instruction & Library (77.8%), while the most female-oriented occupations are Life, Physical & Social Science (100.0%), Health Diagnosing & Treating (72.9%), and Health Technologists (67.8%).
| Occupation | Male | Female |
| Management | 27 (61.4%) | 17 (38.6%) |
| Business & Financial | 18 (51.4%) | 17 (48.6%) |
| Computers, Engineering & Science | 12 (63.2%) | 7 (36.8%) |
| Computers & Mathematics | 7 (63.6%) | 4 (36.4%) |
| Architecture & Engineering | 5 (100.0%) | 0 (0.0%) |
| Life, Physical & Social Science | 0 (0.0%) | 3 (100.0%) |
| Community & Social Service | 60 (60.0%) | 40 (40.0%) |
| Education, Arts & Media | 31 (49.2%) | 32 (50.8%) |
| Legal Services & Support | 5 (100.0%) | 0 (0.0%) |
| Education Instruction & Library | 21 (77.8%) | 6 (22.2%) |
| Arts, Media & Entertainment | 3 (60.0%) | 2 (40.0%) |
| Health Diagnosing & Treating | 19 (27.1%) | 51 (72.9%) |
| Health Technologists | 19 (32.2%) | 40 (67.8%) |
| Total (Category) | 136 (50.7%) | 132 (49.2%) |
| Total (Overall) | 570 (53.9%) | 488 (46.1%) |
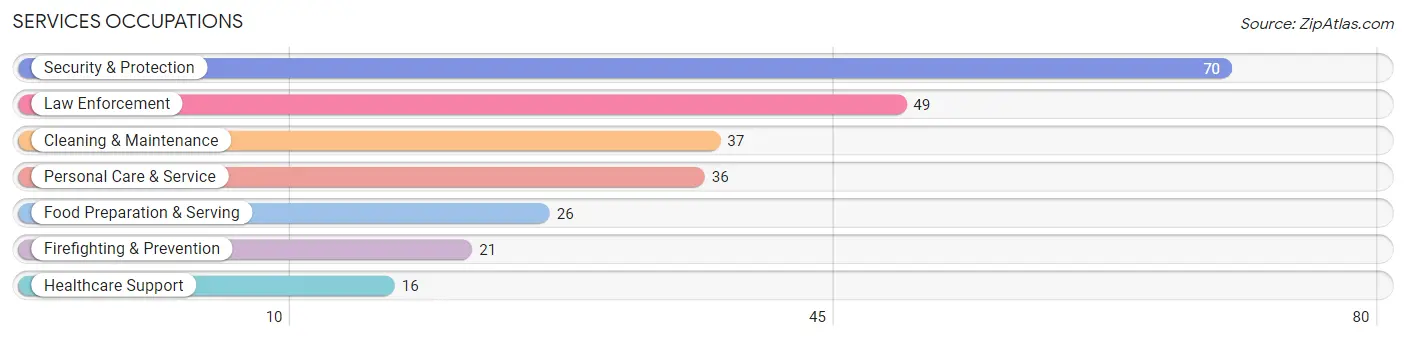
Services Occupations
The most common Services occupations in Claremont are Security & Protection (70 | 6.6%), Law Enforcement (49 | 4.6%), Cleaning & Maintenance (37 | 3.5%), Personal Care & Service (36 | 3.4%), and Food Preparation & Serving (26 | 2.5%).
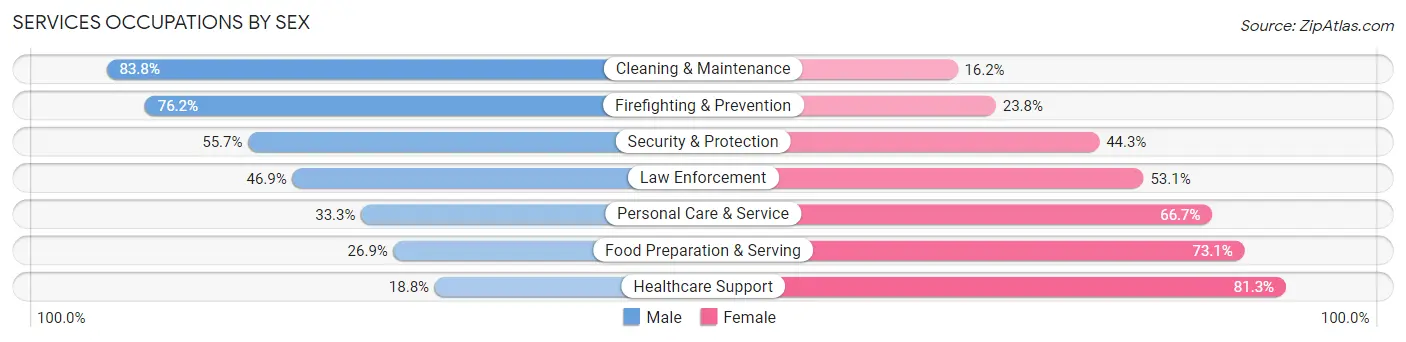
Services Occupations by Sex
Within the Services occupations in Claremont, the most male-oriented occupations are Cleaning & Maintenance (83.8%), Firefighting & Prevention (76.2%), and Security & Protection (55.7%), while the most female-oriented occupations are Healthcare Support (81.2%), Food Preparation & Serving (73.1%), and Personal Care & Service (66.7%).
| Occupation | Male | Female |
| Healthcare Support | 3 (18.8%) | 13 (81.2%) |
| Security & Protection | 39 (55.7%) | 31 (44.3%) |
| Firefighting & Prevention | 16 (76.2%) | 5 (23.8%) |
| Law Enforcement | 23 (46.9%) | 26 (53.1%) |
| Food Preparation & Serving | 7 (26.9%) | 19 (73.1%) |
| Cleaning & Maintenance | 31 (83.8%) | 6 (16.2%) |
| Personal Care & Service | 12 (33.3%) | 24 (66.7%) |
| Total (Category) | 92 (49.7%) | 93 (50.3%) |
| Total (Overall) | 570 (53.9%) | 488 (46.1%) |
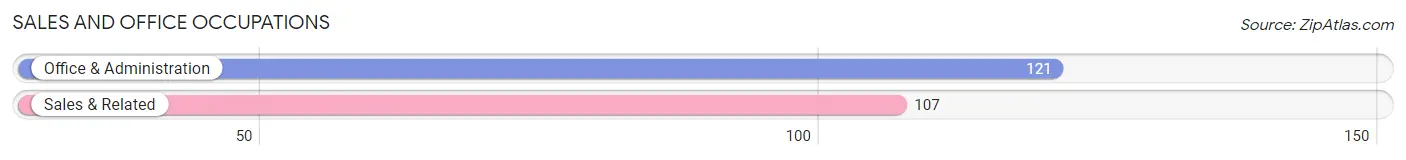
Sales and Office Occupations
The most common Sales and Office occupations in Claremont are Office & Administration (121 | 11.4%), and Sales & Related (107 | 10.1%).
Sales and Office Occupations by Sex
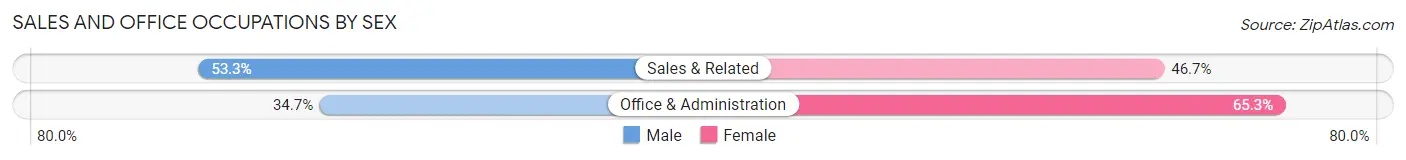
| Occupation | Male | Female |
| Sales & Related | 57 (53.3%) | 50 (46.7%) |
| Office & Administration | 42 (34.7%) | 79 (65.3%) |
| Total (Category) | 99 (43.4%) | 129 (56.6%) |
| Total (Overall) | 570 (53.9%) | 488 (46.1%) |
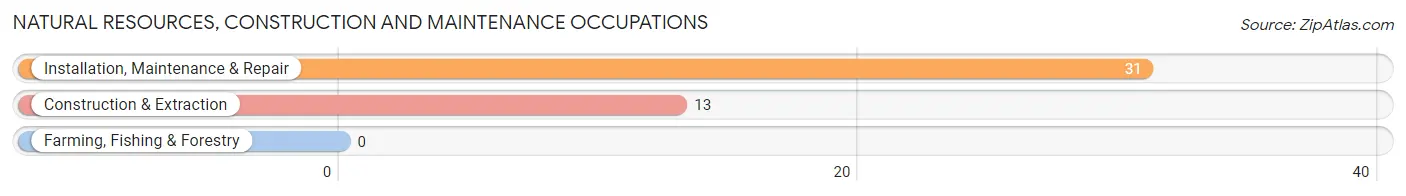
Natural Resources, Construction and Maintenance Occupations
The most common Natural Resources, Construction and Maintenance occupations in Claremont are Installation, Maintenance & Repair (31 | 2.9%), and Construction & Extraction (13 | 1.2%).
Natural Resources, Construction and Maintenance Occupations by Sex
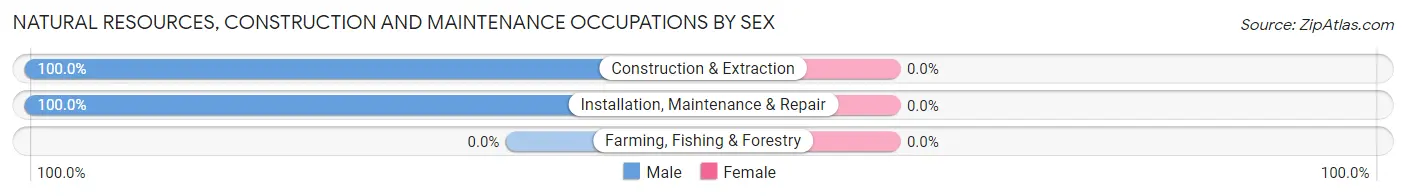
| Occupation | Male | Female |
| Farming, Fishing & Forestry | 0 (0.0%) | 0 (0.0%) |
| Construction & Extraction | 13 (100.0%) | 0 (0.0%) |
| Installation, Maintenance & Repair | 31 (100.0%) | 0 (0.0%) |
| Total (Category) | 44 (100.0%) | 0 (0.0%) |
| Total (Overall) | 570 (53.9%) | 488 (46.1%) |
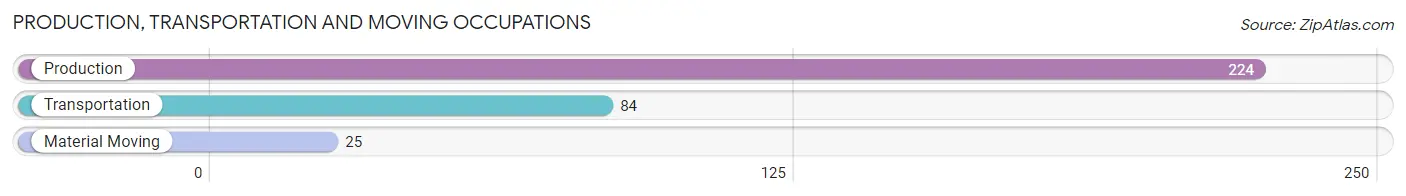
Production, Transportation and Moving Occupations
The most common Production, Transportation and Moving occupations in Claremont are Production (224 | 21.2%), Transportation (84 | 7.9%), and Material Moving (25 | 2.4%).
Production, Transportation and Moving Occupations by Sex
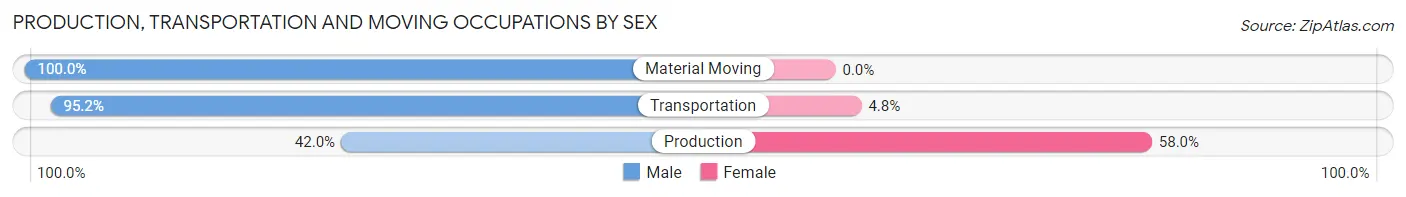
| Occupation | Male | Female |
| Production | 94 (42.0%) | 130 (58.0%) |
| Transportation | 80 (95.2%) | 4 (4.8%) |
| Material Moving | 25 (100.0%) | 0 (0.0%) |
| Total (Category) | 199 (59.8%) | 134 (40.2%) |
| Total (Overall) | 570 (53.9%) | 488 (46.1%) |
Employment Industries by Sex in Claremont
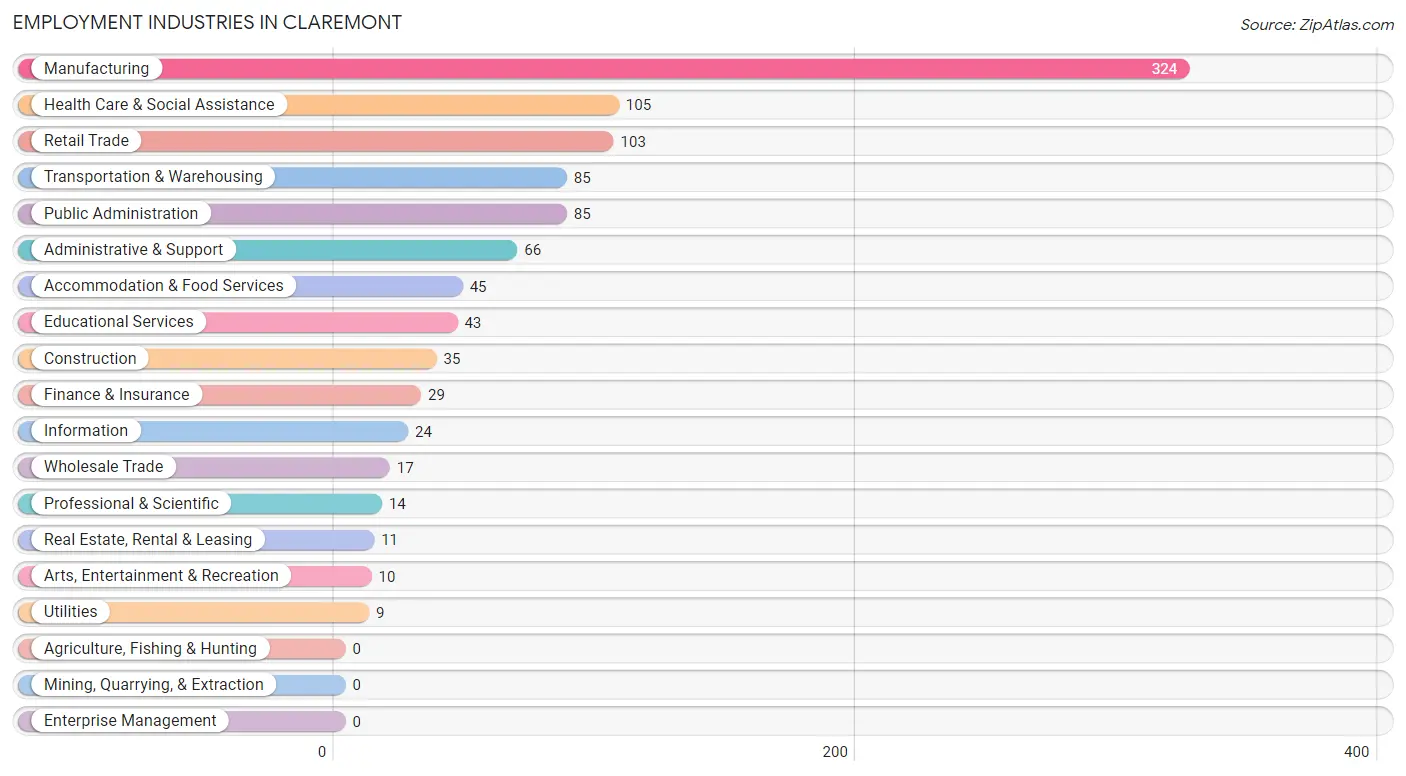
Employment Industries in Claremont
The major employment industries in Claremont include Manufacturing (324 | 30.6%), Health Care & Social Assistance (105 | 9.9%), Retail Trade (103 | 9.7%), Transportation & Warehousing (85 | 8.0%), and Public Administration (85 | 8.0%).
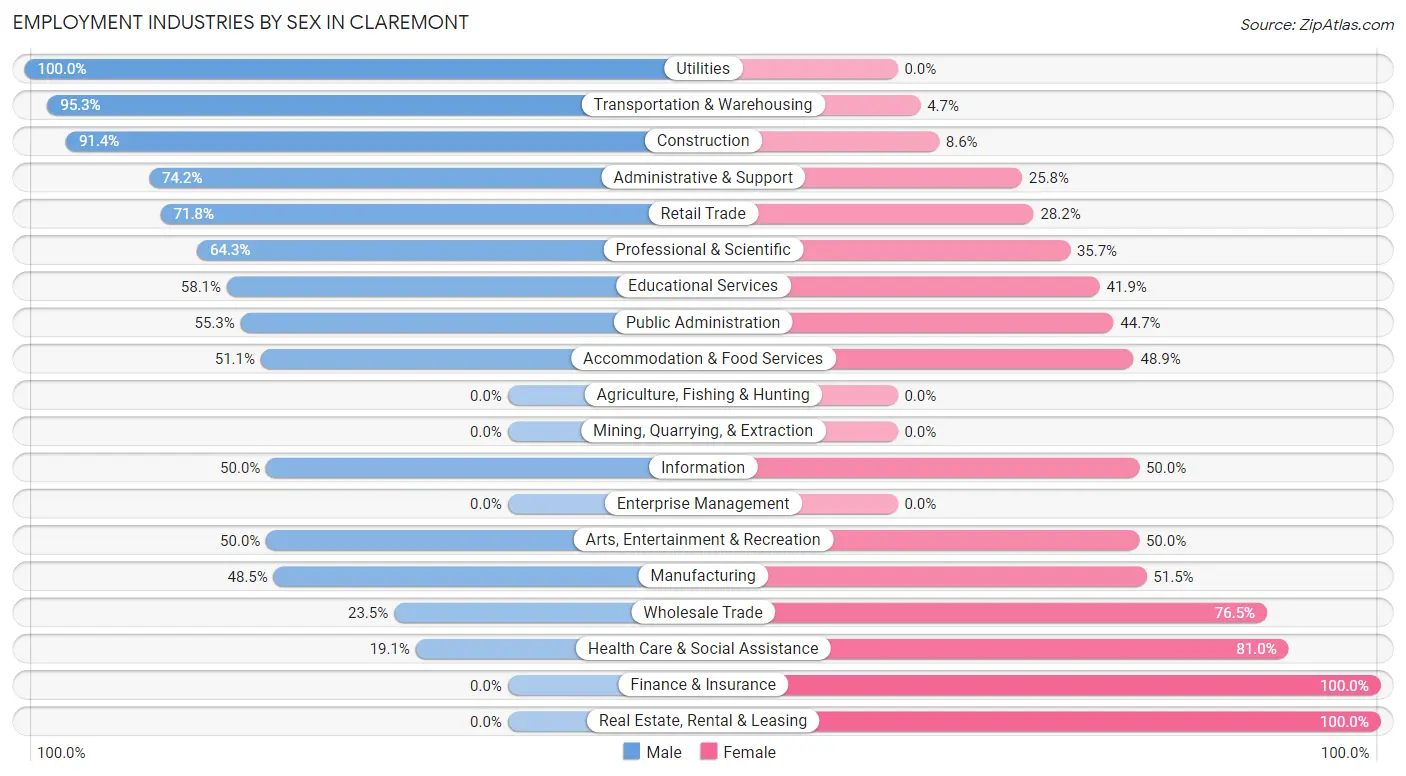
Employment Industries by Sex in Claremont
The Claremont industries that see more men than women are Utilities (100.0%), Transportation & Warehousing (95.3%), and Construction (91.4%), whereas the industries that tend to have a higher number of women are Finance & Insurance (100.0%), Real Estate, Rental & Leasing (100.0%), and Health Care & Social Assistance (80.9%).
| Industry | Male | Female |
| Agriculture, Fishing & Hunting | 0 (0.0%) | 0 (0.0%) |
| Mining, Quarrying, & Extraction | 0 (0.0%) | 0 (0.0%) |
| Construction | 32 (91.4%) | 3 (8.6%) |
| Manufacturing | 157 (48.5%) | 167 (51.5%) |
| Wholesale Trade | 4 (23.5%) | 13 (76.5%) |
| Retail Trade | 74 (71.8%) | 29 (28.2%) |
| Transportation & Warehousing | 81 (95.3%) | 4 (4.7%) |
| Utilities | 9 (100.0%) | 0 (0.0%) |
| Information | 12 (50.0%) | 12 (50.0%) |
| Finance & Insurance | 0 (0.0%) | 29 (100.0%) |
| Real Estate, Rental & Leasing | 0 (0.0%) | 11 (100.0%) |
| Professional & Scientific | 9 (64.3%) | 5 (35.7%) |
| Enterprise Management | 0 (0.0%) | 0 (0.0%) |
| Administrative & Support | 49 (74.2%) | 17 (25.8%) |
| Educational Services | 25 (58.1%) | 18 (41.9%) |
| Health Care & Social Assistance | 20 (19.1%) | 85 (80.9%) |
| Arts, Entertainment & Recreation | 5 (50.0%) | 5 (50.0%) |
| Accommodation & Food Services | 23 (51.1%) | 22 (48.9%) |
| Public Administration | 47 (55.3%) | 38 (44.7%) |
| Total | 570 (53.9%) | 488 (46.1%) |
Education in Claremont
School Enrollment in Claremont
The most common levels of schooling among the 374 students in Claremont are high school (140 | 37.4%), kindergarten (84 | 22.5%), and elementary school (59 | 15.8%).
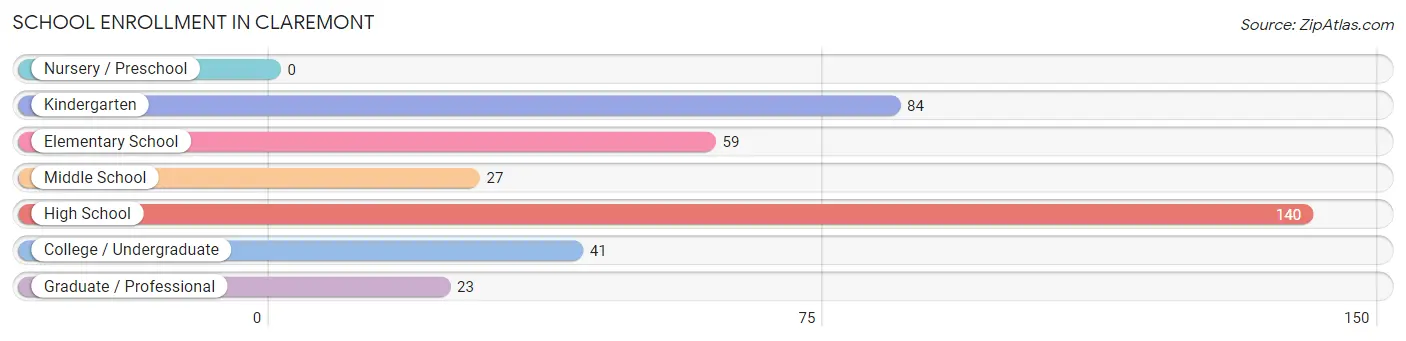
| School Level | # Students | % Students |
| Nursery / Preschool | 0 | 0.0% |
| Kindergarten | 84 | 22.5% |
| Elementary School | 59 | 15.8% |
| Middle School | 27 | 7.2% |
| High School | 140 | 37.4% |
| College / Undergraduate | 41 | 11.0% |
| Graduate / Professional | 23 | 6.1% |
| Total | 374 | 100.0% |
School Enrollment by Age by Funding Source in Claremont
Out of a total of 374 students who are enrolled in schools in Claremont, 130 (34.8%) attend a private institution, while the remaining 244 (65.2%) are enrolled in public schools. The age group of 35 years and over has the highest likelihood of being enrolled in private schools, with 18 (62.1% in the age bracket) enrolled. Conversely, the age group of 25 to 34 year olds has the lowest likelihood of being enrolled in a private school, with 17 (100.0% in the age bracket) attending a public institution.
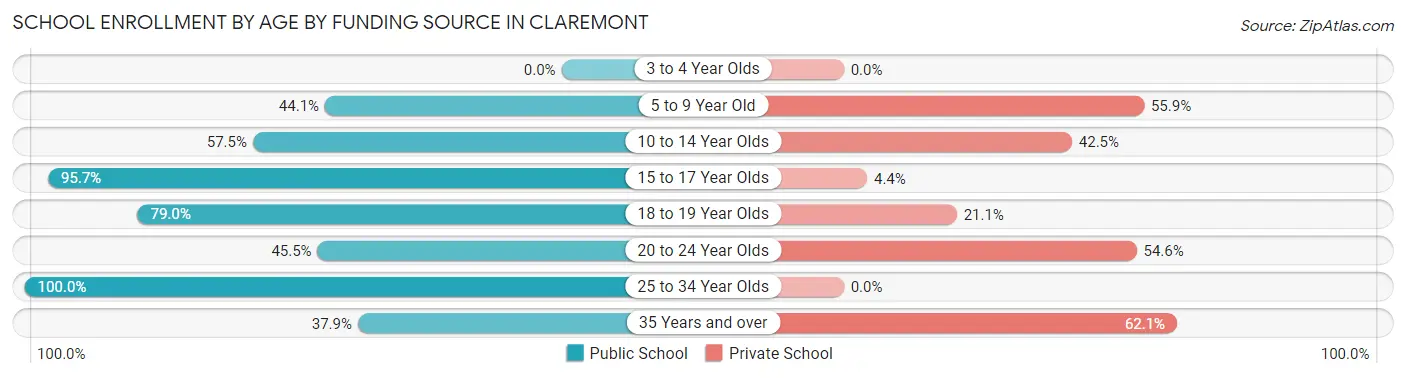
| Age Bracket | Public School | Private School |
| 3 to 4 Year Olds | 0 (0.0%) | 0 (0.0%) |
| 5 to 9 Year Old | 63 (44.1%) | 80 (55.9%) |
| 10 to 14 Year Olds | 23 (57.5%) | 17 (42.5%) |
| 15 to 17 Year Olds | 110 (95.7%) | 5 (4.3%) |
| 18 to 19 Year Olds | 15 (78.9%) | 4 (21.0%) |
| 20 to 24 Year Olds | 5 (45.5%) | 6 (54.5%) |
| 25 to 34 Year Olds | 17 (100.0%) | 0 (0.0%) |
| 35 Years and over | 11 (37.9%) | 18 (62.1%) |
| Total | 244 (65.2%) | 130 (34.8%) |
Educational Attainment by Field of Study in Claremont
Arts & humanities (70 | 23.5%), education (62 | 20.8%), business (49 | 16.4%), science & technology (37 | 12.4%), and social sciences (16 | 5.4%) are the most common fields of study among 298 individuals in Claremont who have obtained a bachelor's degree or higher.
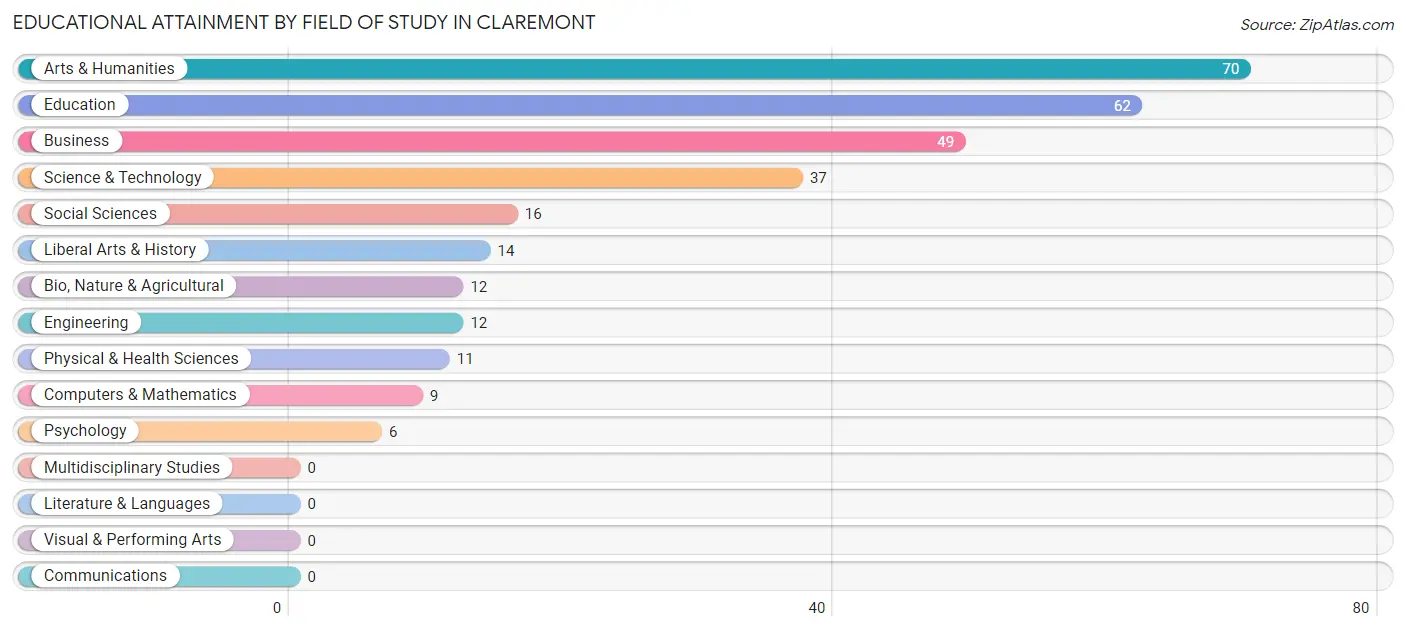
| Field of Study | # Graduates | % Graduates |
| Computers & Mathematics | 9 | 3.0% |
| Bio, Nature & Agricultural | 12 | 4.0% |
| Physical & Health Sciences | 11 | 3.7% |
| Psychology | 6 | 2.0% |
| Social Sciences | 16 | 5.4% |
| Engineering | 12 | 4.0% |
| Multidisciplinary Studies | 0 | 0.0% |
| Science & Technology | 37 | 12.4% |
| Business | 49 | 16.4% |
| Education | 62 | 20.8% |
| Literature & Languages | 0 | 0.0% |
| Liberal Arts & History | 14 | 4.7% |
| Visual & Performing Arts | 0 | 0.0% |
| Communications | 0 | 0.0% |
| Arts & Humanities | 70 | 23.5% |
| Total | 298 | 100.0% |
Transportation & Commute in Claremont
Vehicle Availability by Sex in Claremont
The most prevalent vehicle ownership categories in Claremont are males with 2 vehicles (203, accounting for 36.0%) and females with 2 vehicles (143, making up 42.1%).
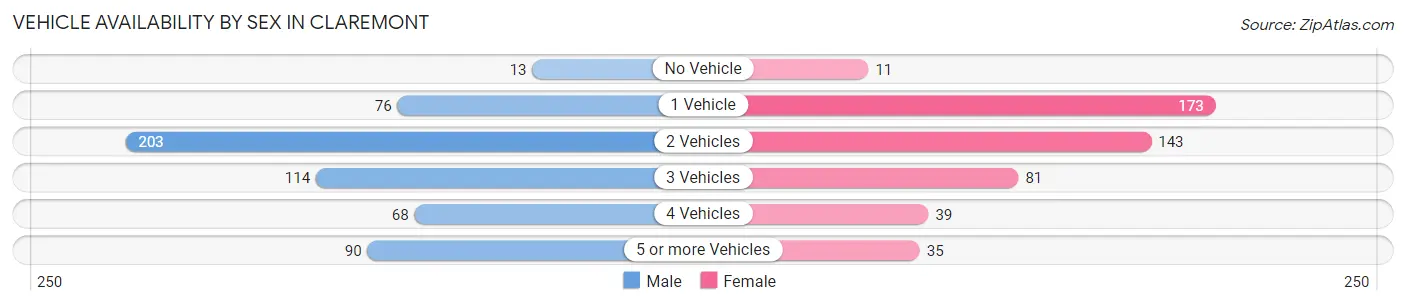
| Vehicles Available | Male | Female |
| No Vehicle | 13 (2.3%) | 11 (2.3%) |
| 1 Vehicle | 76 (13.5%) | 173 (35.9%) |
| 2 Vehicles | 203 (36.0%) | 143 (29.7%) |
| 3 Vehicles | 114 (20.2%) | 81 (16.8%) |
| 4 Vehicles | 68 (12.1%) | 39 (8.1%) |
| 5 or more Vehicles | 90 (16.0%) | 35 (7.3%) |
| Total | 564 (100.0%) | 482 (100.0%) |
Commute Time in Claremont
The most frequently occuring commute durations in Claremont are 10 to 14 minutes (236 commuters, 23.5%), 15 to 19 minutes (182 commuters, 18.2%), and 20 to 24 minutes (176 commuters, 17.6%).
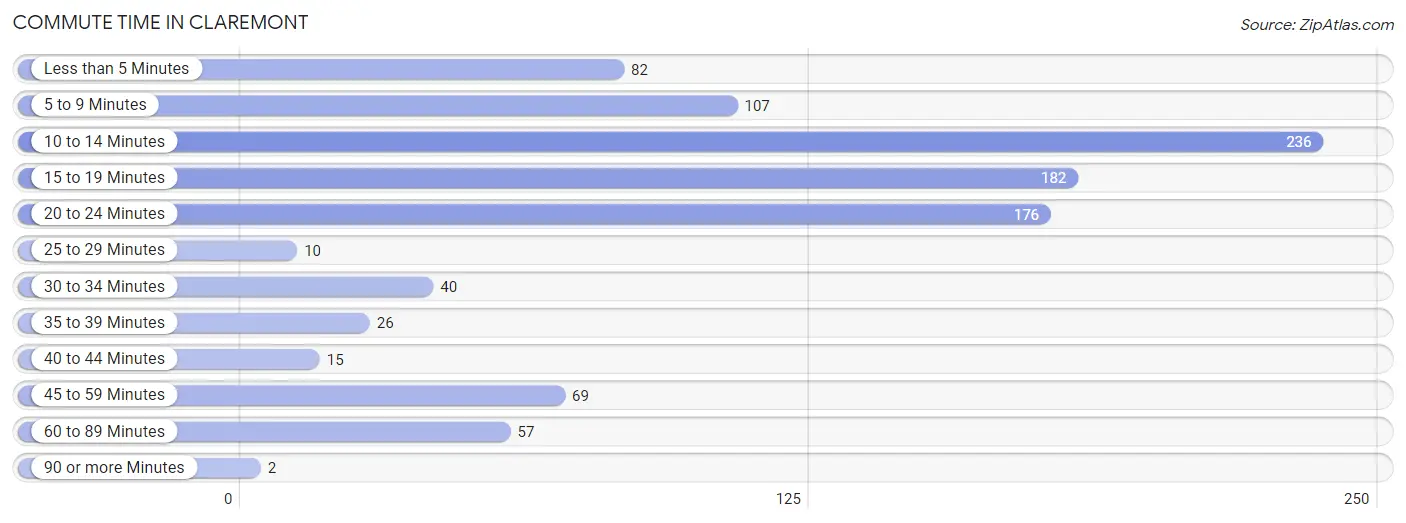
| Commute Time | # Commuters | % Commuters |
| Less than 5 Minutes | 82 | 8.2% |
| 5 to 9 Minutes | 107 | 10.7% |
| 10 to 14 Minutes | 236 | 23.5% |
| 15 to 19 Minutes | 182 | 18.2% |
| 20 to 24 Minutes | 176 | 17.6% |
| 25 to 29 Minutes | 10 | 1.0% |
| 30 to 34 Minutes | 40 | 4.0% |
| 35 to 39 Minutes | 26 | 2.6% |
| 40 to 44 Minutes | 15 | 1.5% |
| 45 to 59 Minutes | 69 | 6.9% |
| 60 to 89 Minutes | 57 | 5.7% |
| 90 or more Minutes | 2 | 0.2% |
Commute Time by Sex in Claremont
The most common commute times in Claremont are 20 to 24 minutes (128 commuters, 23.5%) for males and 10 to 14 minutes (139 commuters, 30.3%) for females.
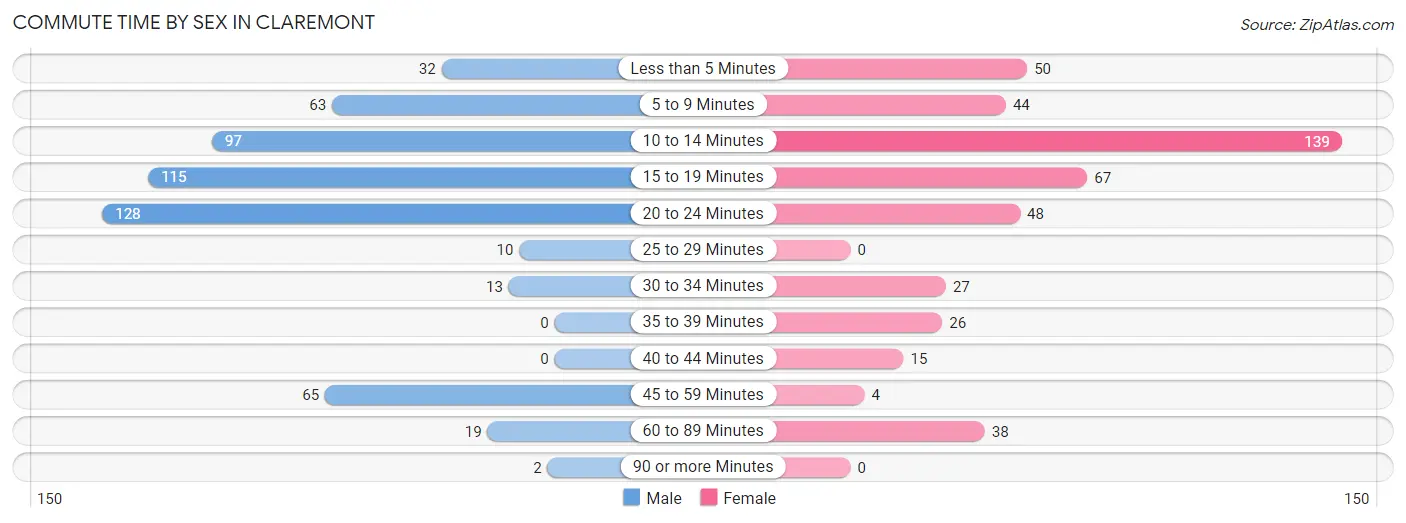
| Commute Time | Male | Female |
| Less than 5 Minutes | 32 (5.9%) | 50 (10.9%) |
| 5 to 9 Minutes | 63 (11.6%) | 44 (9.6%) |
| 10 to 14 Minutes | 97 (17.8%) | 139 (30.3%) |
| 15 to 19 Minutes | 115 (21.1%) | 67 (14.6%) |
| 20 to 24 Minutes | 128 (23.5%) | 48 (10.5%) |
| 25 to 29 Minutes | 10 (1.8%) | 0 (0.0%) |
| 30 to 34 Minutes | 13 (2.4%) | 27 (5.9%) |
| 35 to 39 Minutes | 0 (0.0%) | 26 (5.7%) |
| 40 to 44 Minutes | 0 (0.0%) | 15 (3.3%) |
| 45 to 59 Minutes | 65 (11.9%) | 4 (0.9%) |
| 60 to 89 Minutes | 19 (3.5%) | 38 (8.3%) |
| 90 or more Minutes | 2 (0.4%) | 0 (0.0%) |
Time of Departure to Work by Sex in Claremont
The most frequent times of departure to work in Claremont are 6:00 AM to 6:29 AM (161, 29.6%) for males and 6:30 AM to 6:59 AM (148, 32.3%) for females.
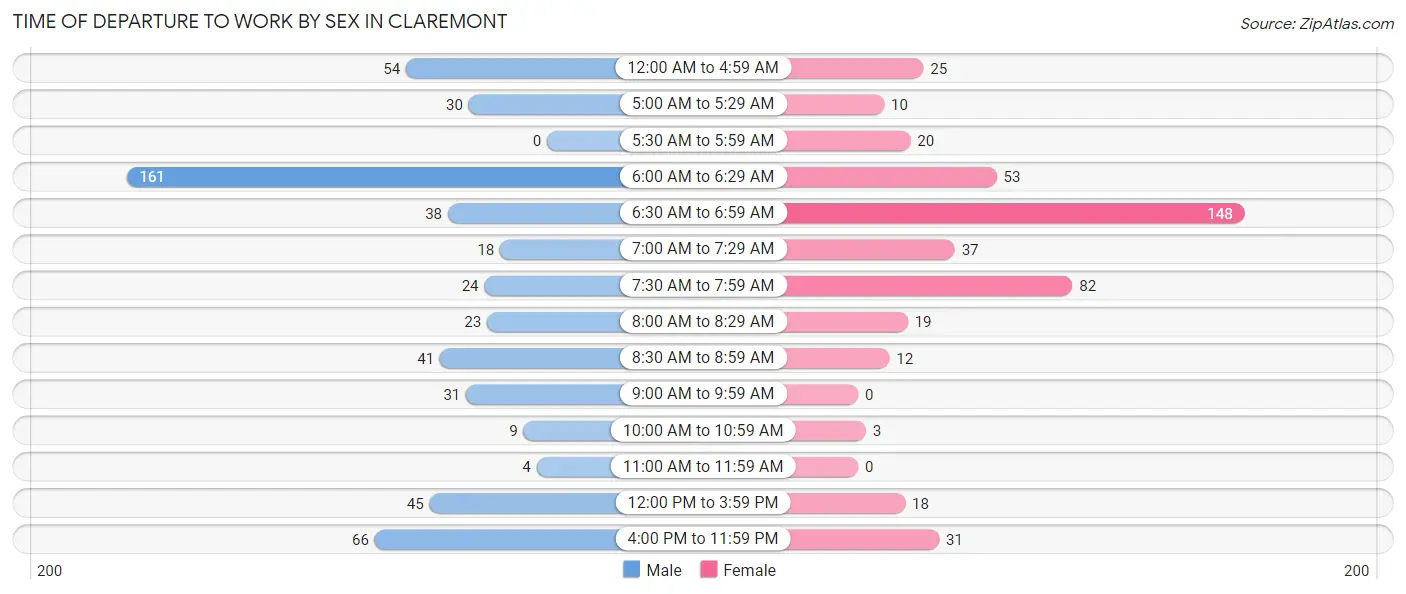
| Time of Departure | Male | Female |
| 12:00 AM to 4:59 AM | 54 (9.9%) | 25 (5.5%) |
| 5:00 AM to 5:29 AM | 30 (5.5%) | 10 (2.2%) |
| 5:30 AM to 5:59 AM | 0 (0.0%) | 20 (4.4%) |
| 6:00 AM to 6:29 AM | 161 (29.6%) | 53 (11.6%) |
| 6:30 AM to 6:59 AM | 38 (7.0%) | 148 (32.3%) |
| 7:00 AM to 7:29 AM | 18 (3.3%) | 37 (8.1%) |
| 7:30 AM to 7:59 AM | 24 (4.4%) | 82 (17.9%) |
| 8:00 AM to 8:29 AM | 23 (4.2%) | 19 (4.2%) |
| 8:30 AM to 8:59 AM | 41 (7.5%) | 12 (2.6%) |
| 9:00 AM to 9:59 AM | 31 (5.7%) | 0 (0.0%) |
| 10:00 AM to 10:59 AM | 9 (1.7%) | 3 (0.7%) |
| 11:00 AM to 11:59 AM | 4 (0.7%) | 0 (0.0%) |
| 12:00 PM to 3:59 PM | 45 (8.3%) | 18 (3.9%) |
| 4:00 PM to 11:59 PM | 66 (12.1%) | 31 (6.8%) |
| Total | 544 (100.0%) | 458 (100.0%) |
Housing Occupancy in Claremont
Occupancy by Ownership in Claremont
Of the total 814 dwellings in Claremont, owner-occupied units account for 496 (60.9%), while renter-occupied units make up 318 (39.1%).
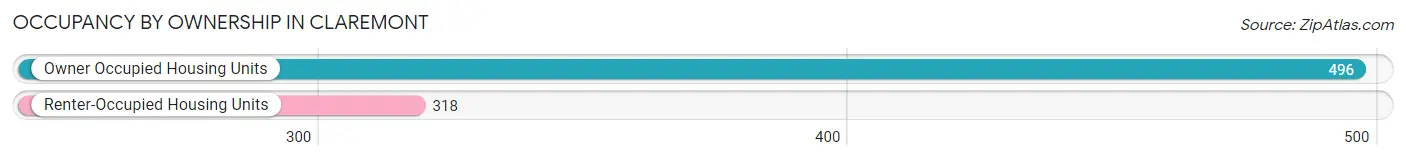
| Occupancy | # Housing Units | % Housing Units |
| Owner Occupied Housing Units | 496 | 60.9% |
| Renter-Occupied Housing Units | 318 | 39.1% |
| Total Occupied Housing Units | 814 | 100.0% |
Occupancy by Household Size in Claremont
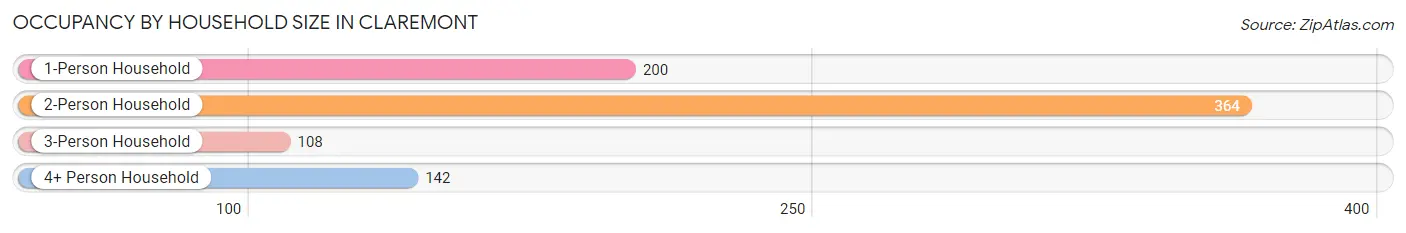
| Household Size | # Housing Units | % Housing Units |
| 1-Person Household | 200 | 24.6% |
| 2-Person Household | 364 | 44.7% |
| 3-Person Household | 108 | 13.3% |
| 4+ Person Household | 142 | 17.4% |
| Total Housing Units | 814 | 100.0% |
Occupancy by Ownership by Household Size in Claremont
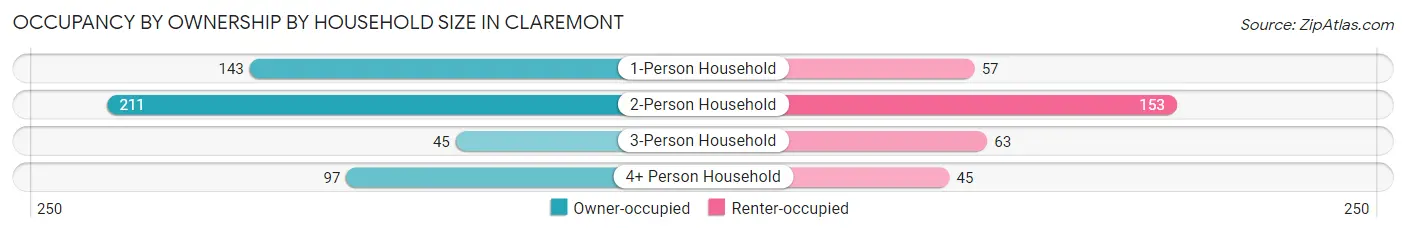
| Household Size | Owner-occupied | Renter-occupied |
| 1-Person Household | 143 (71.5%) | 57 (28.5%) |
| 2-Person Household | 211 (58.0%) | 153 (42.0%) |
| 3-Person Household | 45 (41.7%) | 63 (58.3%) |
| 4+ Person Household | 97 (68.3%) | 45 (31.7%) |
| Total Housing Units | 496 (60.9%) | 318 (39.1%) |
Occupancy by Educational Attainment in Claremont
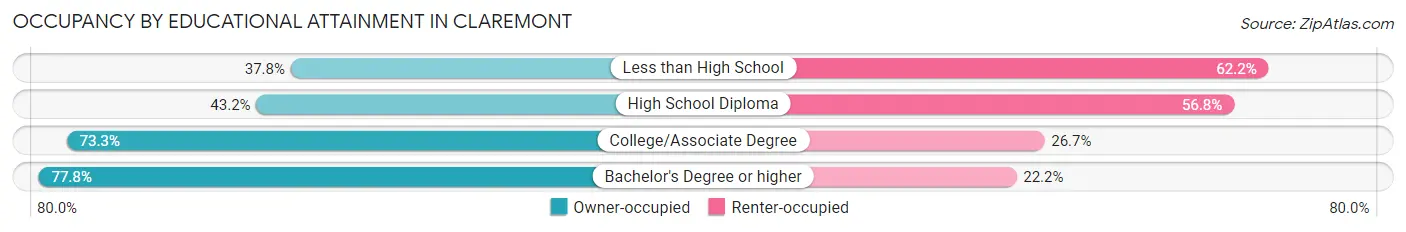
| Household Size | Owner-occupied | Renter-occupied |
| Less than High School | 17 (37.8%) | 28 (62.2%) |
| High School Diploma | 134 (43.2%) | 176 (56.8%) |
| College/Associate Degree | 198 (73.3%) | 72 (26.7%) |
| Bachelor's Degree or higher | 147 (77.8%) | 42 (22.2%) |
Occupancy by Age of Householder in Claremont
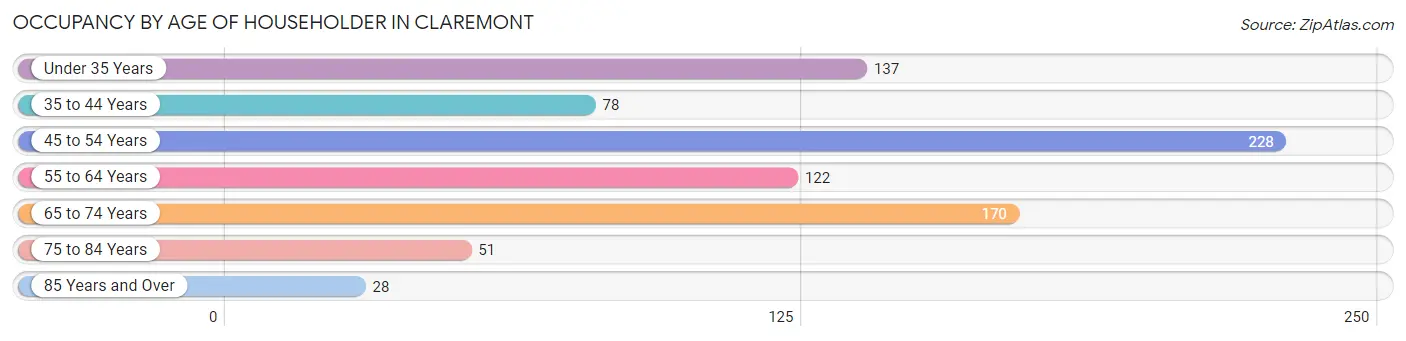
| Age Bracket | # Households | % Households |
| Under 35 Years | 137 | 16.8% |
| 35 to 44 Years | 78 | 9.6% |
| 45 to 54 Years | 228 | 28.0% |
| 55 to 64 Years | 122 | 15.0% |
| 65 to 74 Years | 170 | 20.9% |
| 75 to 84 Years | 51 | 6.3% |
| 85 Years and Over | 28 | 3.4% |
| Total | 814 | 100.0% |
Housing Finances in Claremont
Median Income by Occupancy in Claremont
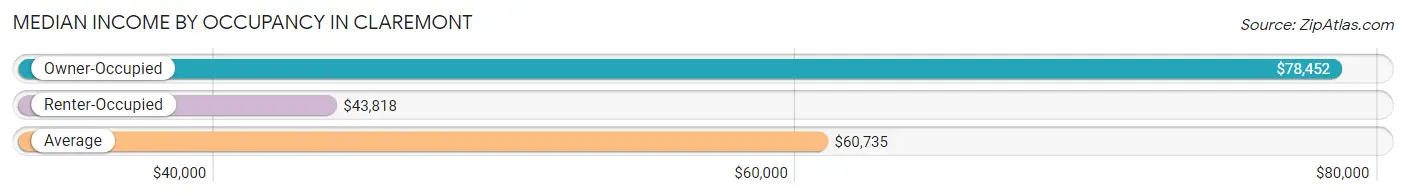
| Occupancy Type | # Households | Median Income |
| Owner-Occupied | 496 (60.9%) | $78,452 |
| Renter-Occupied | 318 (39.1%) | $43,818 |
| Average | 814 (100.0%) | $60,735 |
Occupancy by Householder Income Bracket in Claremont
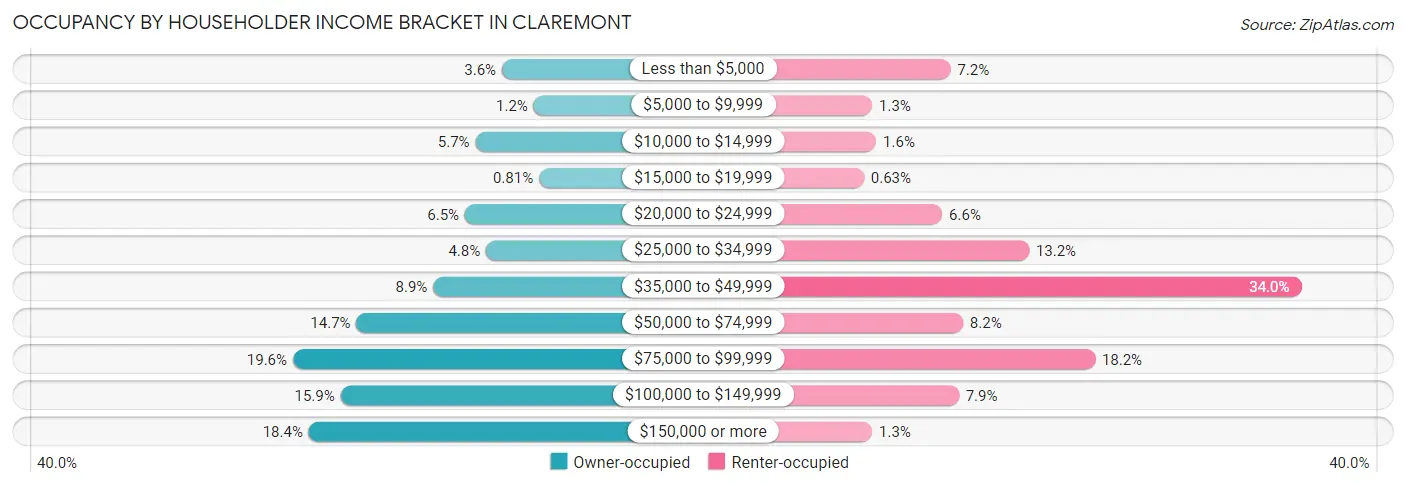
| Income Bracket | Owner-occupied | Renter-occupied |
| Less than $5,000 | 18 (3.6%) | 23 (7.2%) |
| $5,000 to $9,999 | 6 (1.2%) | 4 (1.3%) |
| $10,000 to $14,999 | 28 (5.7%) | 5 (1.6%) |
| $15,000 to $19,999 | 4 (0.8%) | 2 (0.6%) |
| $20,000 to $24,999 | 32 (6.5%) | 21 (6.6%) |
| $25,000 to $34,999 | 24 (4.8%) | 42 (13.2%) |
| $35,000 to $49,999 | 44 (8.9%) | 108 (34.0%) |
| $50,000 to $74,999 | 73 (14.7%) | 26 (8.2%) |
| $75,000 to $99,999 | 97 (19.6%) | 58 (18.2%) |
| $100,000 to $149,999 | 79 (15.9%) | 25 (7.9%) |
| $150,000 or more | 91 (18.3%) | 4 (1.3%) |
| Total | 496 (100.0%) | 318 (100.0%) |
Monthly Housing Cost Tiers in Claremont
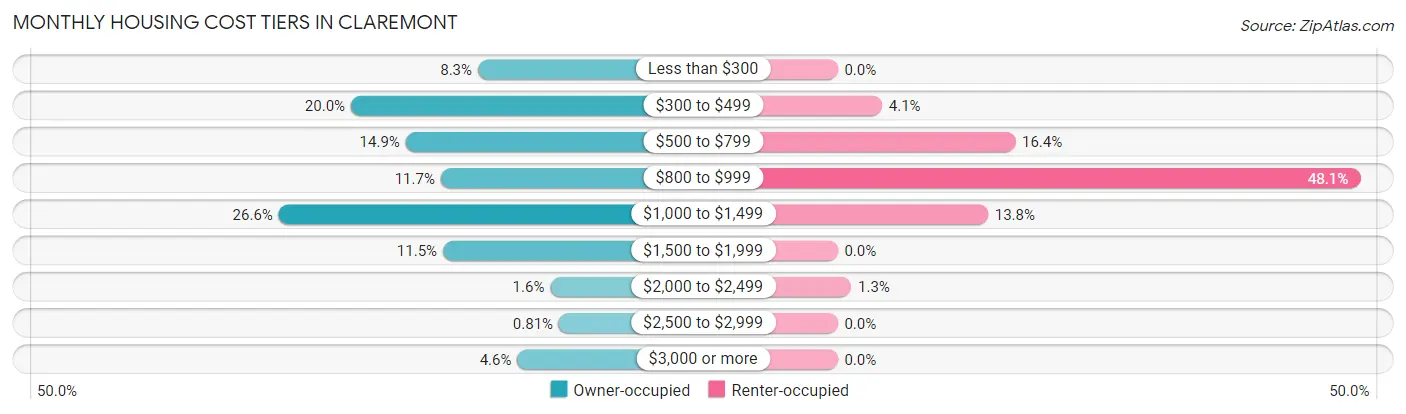
| Monthly Cost | Owner-occupied | Renter-occupied |
| Less than $300 | 41 (8.3%) | 0 (0.0%) |
| $300 to $499 | 99 (20.0%) | 13 (4.1%) |
| $500 to $799 | 74 (14.9%) | 52 (16.4%) |
| $800 to $999 | 58 (11.7%) | 153 (48.1%) |
| $1,000 to $1,499 | 132 (26.6%) | 44 (13.8%) |
| $1,500 to $1,999 | 57 (11.5%) | 0 (0.0%) |
| $2,000 to $2,499 | 8 (1.6%) | 4 (1.3%) |
| $2,500 to $2,999 | 4 (0.8%) | 0 (0.0%) |
| $3,000 or more | 23 (4.6%) | 0 (0.0%) |
| Total | 496 (100.0%) | 318 (100.0%) |
Physical Housing Characteristics in Claremont
Housing Structures in Claremont
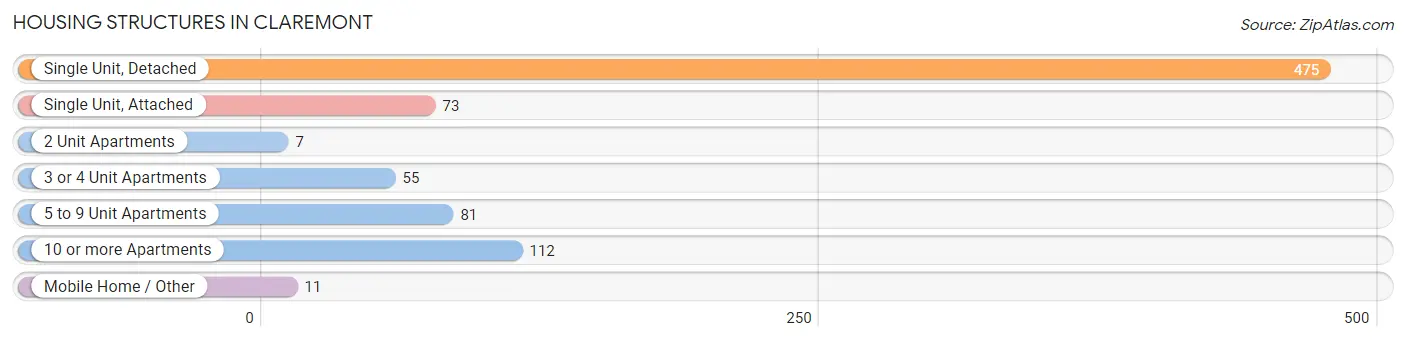
| Structure Type | # Housing Units | % Housing Units |
| Single Unit, Detached | 475 | 58.4% |
| Single Unit, Attached | 73 | 9.0% |
| 2 Unit Apartments | 7 | 0.9% |
| 3 or 4 Unit Apartments | 55 | 6.8% |
| 5 to 9 Unit Apartments | 81 | 10.0% |
| 10 or more Apartments | 112 | 13.8% |
| Mobile Home / Other | 11 | 1.3% |
| Total | 814 | 100.0% |
Housing Structures by Occupancy in Claremont
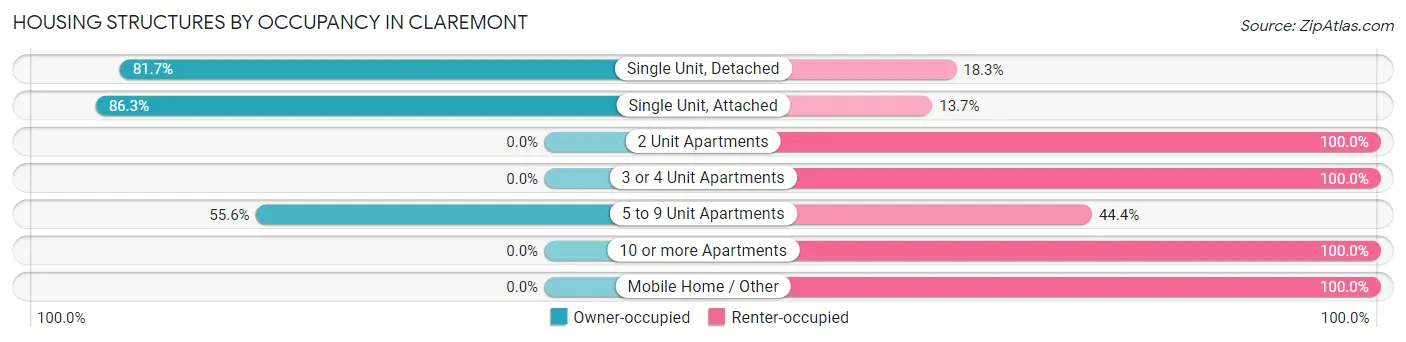
| Structure Type | Owner-occupied | Renter-occupied |
| Single Unit, Detached | 388 (81.7%) | 87 (18.3%) |
| Single Unit, Attached | 63 (86.3%) | 10 (13.7%) |
| 2 Unit Apartments | 0 (0.0%) | 7 (100.0%) |
| 3 or 4 Unit Apartments | 0 (0.0%) | 55 (100.0%) |
| 5 to 9 Unit Apartments | 45 (55.6%) | 36 (44.4%) |
| 10 or more Apartments | 0 (0.0%) | 112 (100.0%) |
| Mobile Home / Other | 0 (0.0%) | 11 (100.0%) |
| Total | 496 (60.9%) | 318 (39.1%) |
Housing Structures by Number of Rooms in Claremont
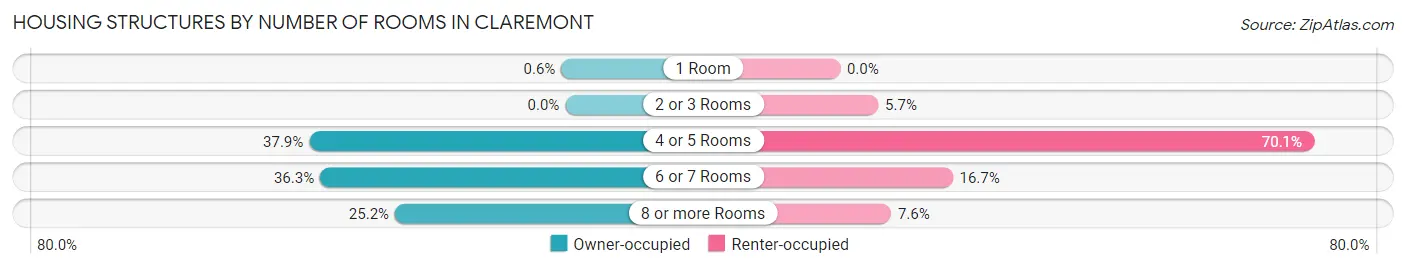
| Number of Rooms | Owner-occupied | Renter-occupied |
| 1 Room | 3 (0.6%) | 0 (0.0%) |
| 2 or 3 Rooms | 0 (0.0%) | 18 (5.7%) |
| 4 or 5 Rooms | 188 (37.9%) | 223 (70.1%) |
| 6 or 7 Rooms | 180 (36.3%) | 53 (16.7%) |
| 8 or more Rooms | 125 (25.2%) | 24 (7.5%) |
| Total | 496 (100.0%) | 318 (100.0%) |
Housing Structure by Heating Type in Claremont
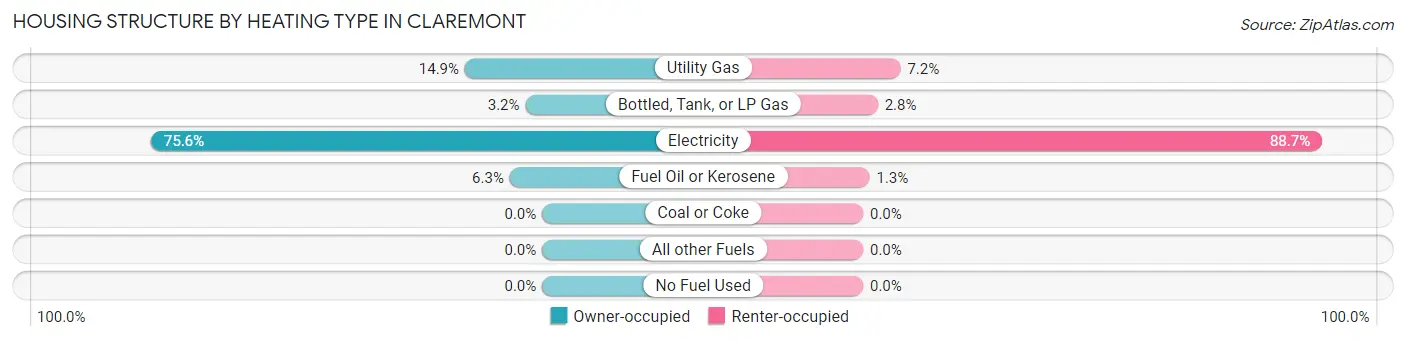
| Heating Type | Owner-occupied | Renter-occupied |
| Utility Gas | 74 (14.9%) | 23 (7.2%) |
| Bottled, Tank, or LP Gas | 16 (3.2%) | 9 (2.8%) |
| Electricity | 375 (75.6%) | 282 (88.7%) |
| Fuel Oil or Kerosene | 31 (6.2%) | 4 (1.3%) |
| Coal or Coke | 0 (0.0%) | 0 (0.0%) |
| All other Fuels | 0 (0.0%) | 0 (0.0%) |
| No Fuel Used | 0 (0.0%) | 0 (0.0%) |
| Total | 496 (100.0%) | 318 (100.0%) |
Household Vehicle Usage in Claremont
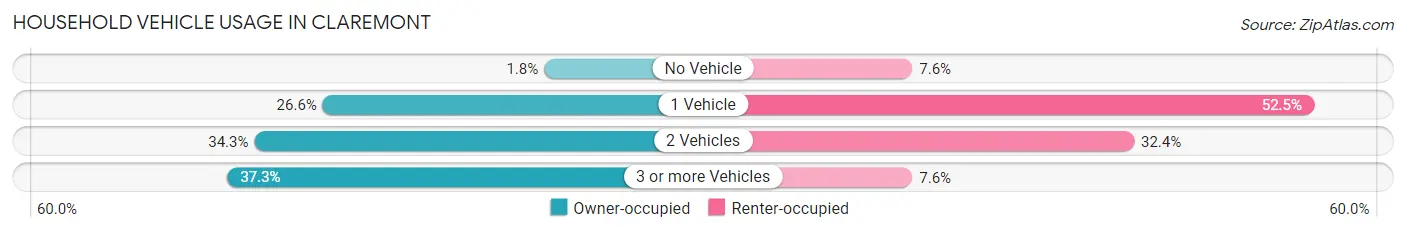
| Vehicles per Household | Owner-occupied | Renter-occupied |
| No Vehicle | 9 (1.8%) | 24 (7.5%) |
| 1 Vehicle | 132 (26.6%) | 167 (52.5%) |
| 2 Vehicles | 170 (34.3%) | 103 (32.4%) |
| 3 or more Vehicles | 185 (37.3%) | 24 (7.5%) |
| Total | 496 (100.0%) | 318 (100.0%) |
Real Estate & Mortgages in Claremont
Real Estate and Mortgage Overview in Claremont
| Characteristic | Without Mortgage | With Mortgage |
| Housing Units | 159 | 337 |
| Median Property Value | $202,400 | $189,200 |
| Median Household Income | $70,536 | $68 |
| Monthly Housing Costs | $417 | $23 |
| Real Estate Taxes | $1,618 | $5 |
Property Value by Mortgage Status in Claremont
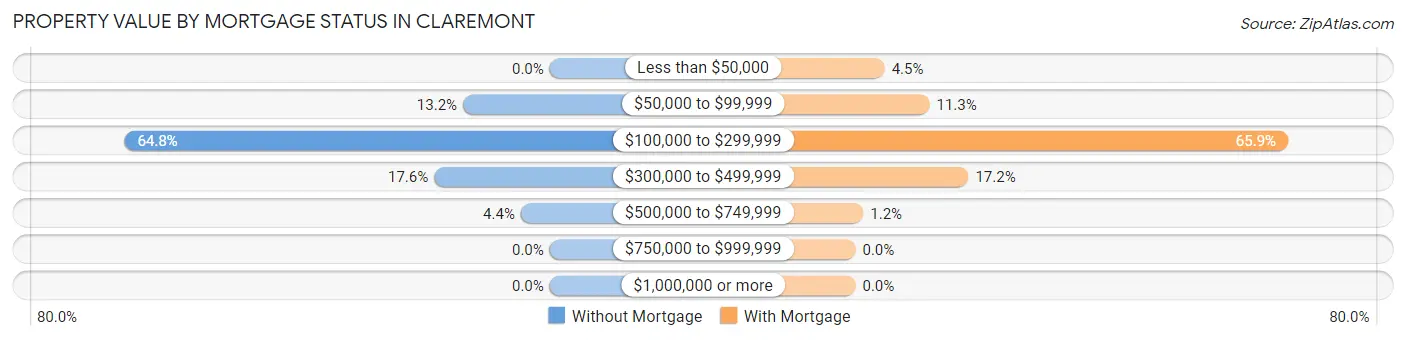
| Property Value | Without Mortgage | With Mortgage |
| Less than $50,000 | 0 (0.0%) | 15 (4.4%) |
| $50,000 to $99,999 | 21 (13.2%) | 38 (11.3%) |
| $100,000 to $299,999 | 103 (64.8%) | 222 (65.9%) |
| $300,000 to $499,999 | 28 (17.6%) | 58 (17.2%) |
| $500,000 to $749,999 | 7 (4.4%) | 4 (1.2%) |
| $750,000 to $999,999 | 0 (0.0%) | 0 (0.0%) |
| $1,000,000 or more | 0 (0.0%) | 0 (0.0%) |
| Total | 159 (100.0%) | 337 (100.0%) |
Household Income by Mortgage Status in Claremont
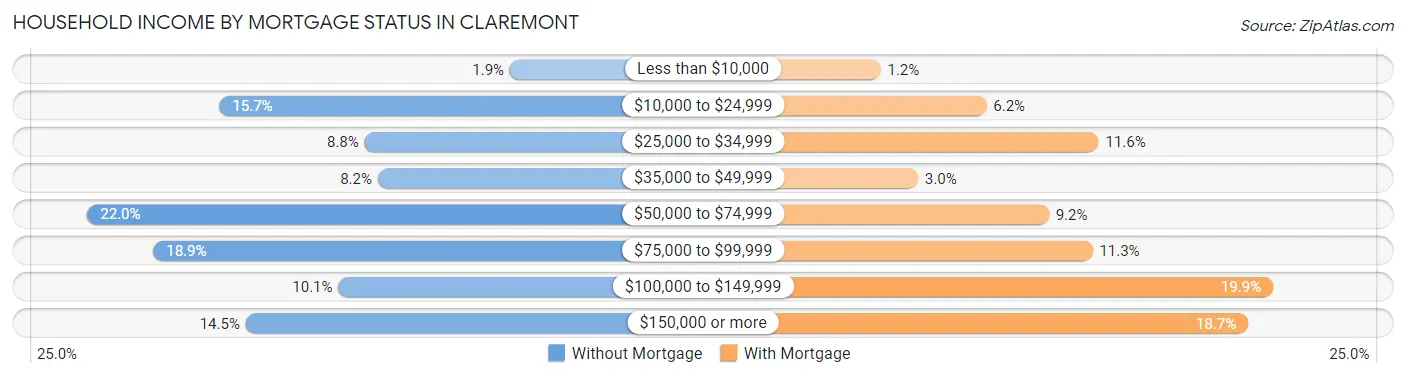
| Household Income | Without Mortgage | With Mortgage |
| Less than $10,000 | 3 (1.9%) | 4 (1.2%) |
| $10,000 to $24,999 | 25 (15.7%) | 21 (6.2%) |
| $25,000 to $34,999 | 14 (8.8%) | 39 (11.6%) |
| $35,000 to $49,999 | 13 (8.2%) | 10 (3.0%) |
| $50,000 to $74,999 | 35 (22.0%) | 31 (9.2%) |
| $75,000 to $99,999 | 30 (18.9%) | 38 (11.3%) |
| $100,000 to $149,999 | 16 (10.1%) | 67 (19.9%) |
| $150,000 or more | 23 (14.5%) | 63 (18.7%) |
| Total | 159 (100.0%) | 337 (100.0%) |
Property Value to Household Income Ratio in Claremont
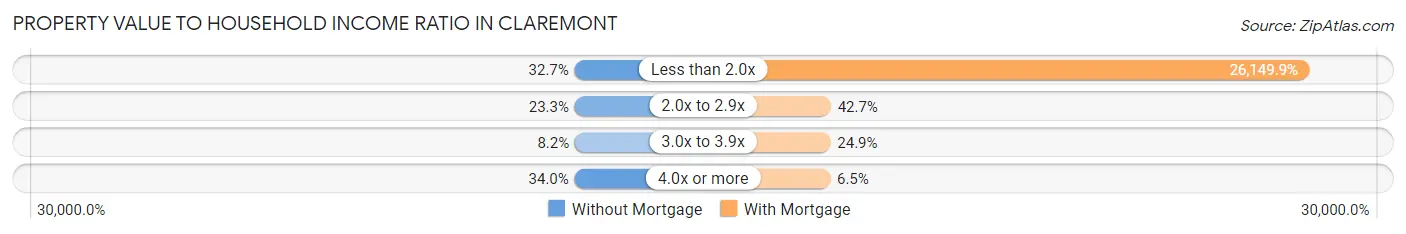
| Value-to-Income Ratio | Without Mortgage | With Mortgage |
| Less than 2.0x | 52 (32.7%) | 88,125 (26,149.8%) |
| 2.0x to 2.9x | 37 (23.3%) | 144 (42.7%) |
| 3.0x to 3.9x | 13 (8.2%) | 84 (24.9%) |
| 4.0x or more | 54 (34.0%) | 22 (6.5%) |
| Total | 159 (100.0%) | 337 (100.0%) |
Real Estate Taxes by Mortgage Status in Claremont
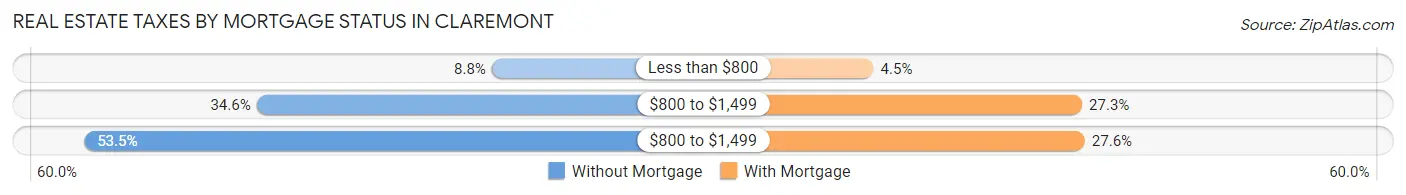
| Property Taxes | Without Mortgage | With Mortgage |
| Less than $800 | 14 (8.8%) | 15 (4.4%) |
| $800 to $1,499 | 55 (34.6%) | 92 (27.3%) |
| $800 to $1,499 | 85 (53.5%) | 93 (27.6%) |
| Total | 159 (100.0%) | 337 (100.0%) |
Health & Disability in Claremont
Health Insurance Coverage by Age in Claremont
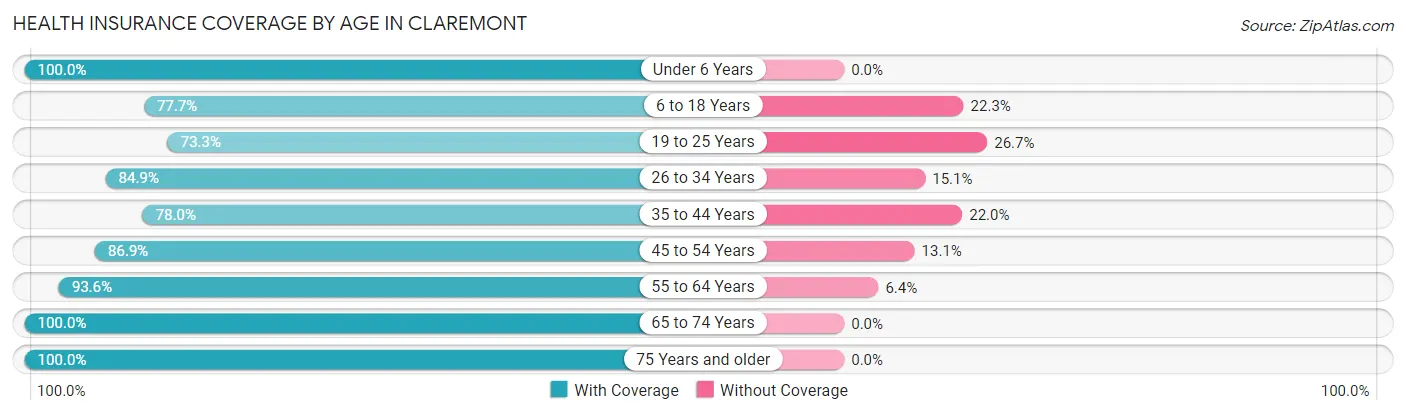
| Age Bracket | With Coverage | Without Coverage |
| Under 6 Years | 102 (100.0%) | 0 (0.0%) |
| 6 to 18 Years | 234 (77.7%) | 67 (22.3%) |
| 19 to 25 Years | 121 (73.3%) | 44 (26.7%) |
| 26 to 34 Years | 191 (84.9%) | 34 (15.1%) |
| 35 to 44 Years | 124 (78.0%) | 35 (22.0%) |
| 45 to 54 Years | 351 (86.9%) | 53 (13.1%) |
| 55 to 64 Years | 176 (93.6%) | 12 (6.4%) |
| 65 to 74 Years | 229 (100.0%) | 0 (0.0%) |
| 75 Years and older | 128 (100.0%) | 0 (0.0%) |
| Total | 1,656 (87.1%) | 245 (12.9%) |
Health Insurance Coverage by Citizenship Status in Claremont
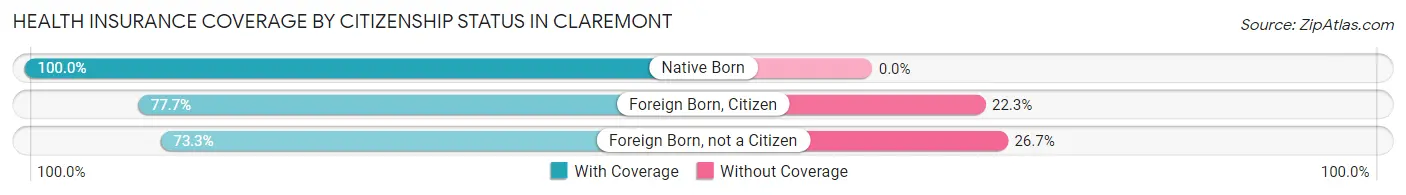
| Citizenship Status | With Coverage | Without Coverage |
| Native Born | 102 (100.0%) | 0 (0.0%) |
| Foreign Born, Citizen | 234 (77.7%) | 67 (22.3%) |
| Foreign Born, not a Citizen | 121 (73.3%) | 44 (26.7%) |
Health Insurance Coverage by Household Income in Claremont
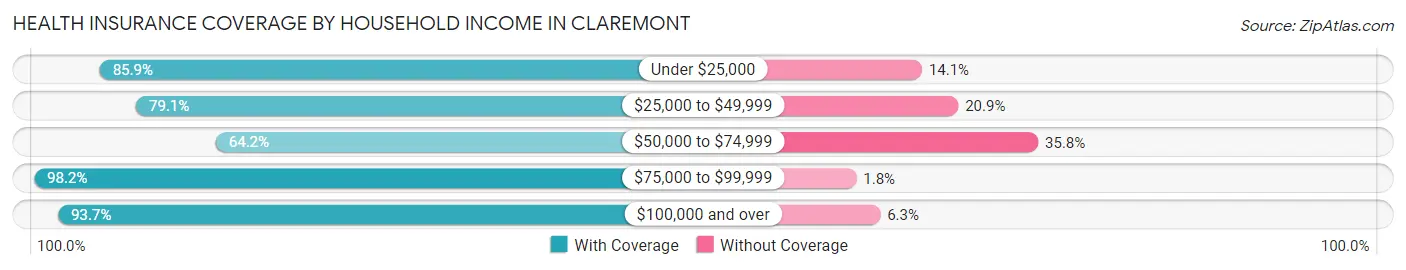
| Household Income | With Coverage | Without Coverage |
| Under $25,000 | 177 (85.9%) | 29 (14.1%) |
| $25,000 to $49,999 | 341 (79.1%) | 90 (20.9%) |
| $50,000 to $74,999 | 145 (64.2%) | 81 (35.8%) |
| $75,000 to $99,999 | 439 (98.2%) | 8 (1.8%) |
| $100,000 and over | 554 (93.7%) | 37 (6.3%) |
Public vs Private Health Insurance Coverage by Age in Claremont
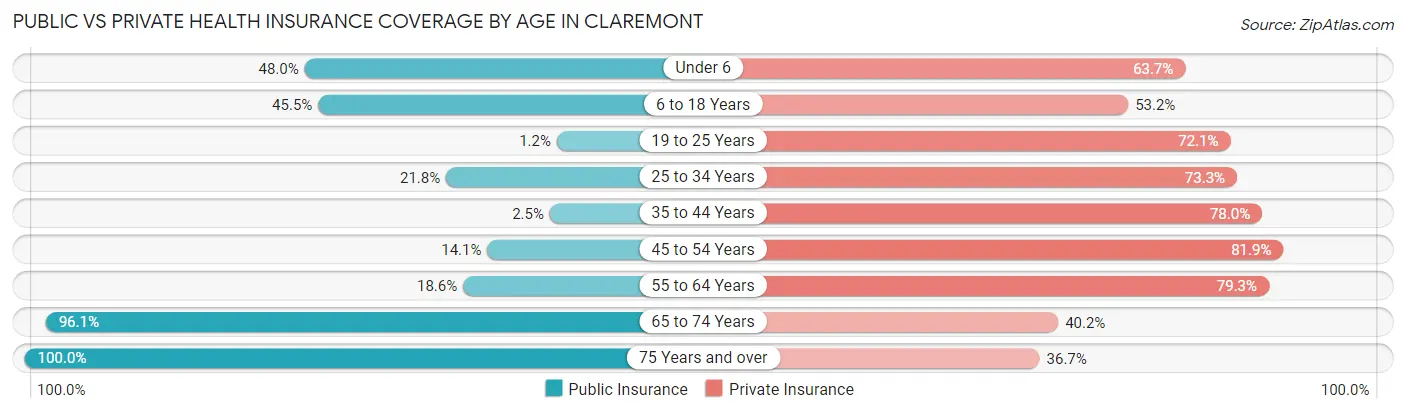
| Age Bracket | Public Insurance | Private Insurance |
| Under 6 | 49 (48.0%) | 65 (63.7%) |
| 6 to 18 Years | 137 (45.5%) | 160 (53.2%) |
| 19 to 25 Years | 2 (1.2%) | 119 (72.1%) |
| 25 to 34 Years | 49 (21.8%) | 165 (73.3%) |
| 35 to 44 Years | 4 (2.5%) | 124 (78.0%) |
| 45 to 54 Years | 57 (14.1%) | 331 (81.9%) |
| 55 to 64 Years | 35 (18.6%) | 149 (79.3%) |
| 65 to 74 Years | 220 (96.1%) | 92 (40.2%) |
| 75 Years and over | 128 (100.0%) | 47 (36.7%) |
| Total | 681 (35.8%) | 1,252 (65.9%) |
Disability Status by Sex by Age in Claremont
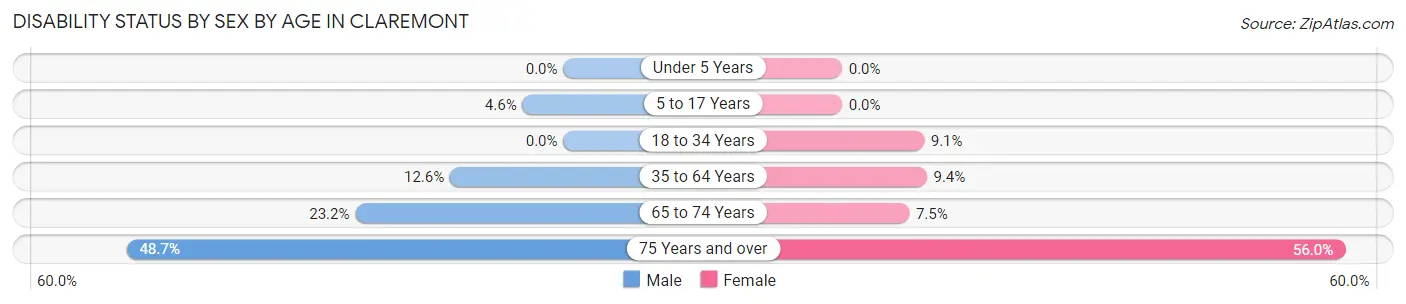
| Age Bracket | Male | Female |
| Under 5 Years | 0 (0.0%) | 0 (0.0%) |
| 5 to 17 Years | 9 (4.5%) | 0 (0.0%) |
| 18 to 34 Years | 0 (0.0%) | 19 (9.1%) |
| 35 to 64 Years | 52 (12.6%) | 32 (9.4%) |
| 65 to 74 Years | 19 (23.2%) | 11 (7.5%) |
| 75 Years and over | 18 (48.6%) | 51 (56.0%) |
Disability Class by Sex by Age in Claremont
Disability Class: Hearing Difficulty
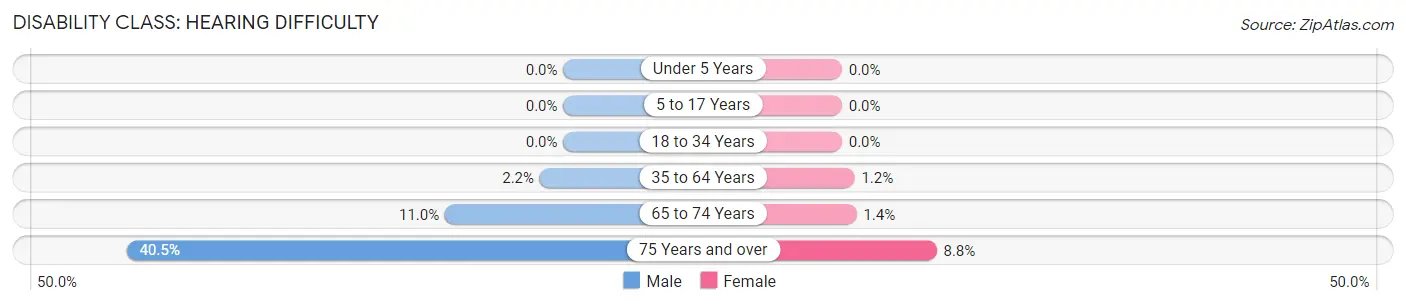
| Age Bracket | Male | Female |
| Under 5 Years | 0 (0.0%) | 0 (0.0%) |
| 5 to 17 Years | 0 (0.0%) | 0 (0.0%) |
| 18 to 34 Years | 0 (0.0%) | 0 (0.0%) |
| 35 to 64 Years | 9 (2.2%) | 4 (1.2%) |
| 65 to 74 Years | 9 (11.0%) | 2 (1.4%) |
| 75 Years and over | 15 (40.5%) | 8 (8.8%) |
Disability Class: Vision Difficulty
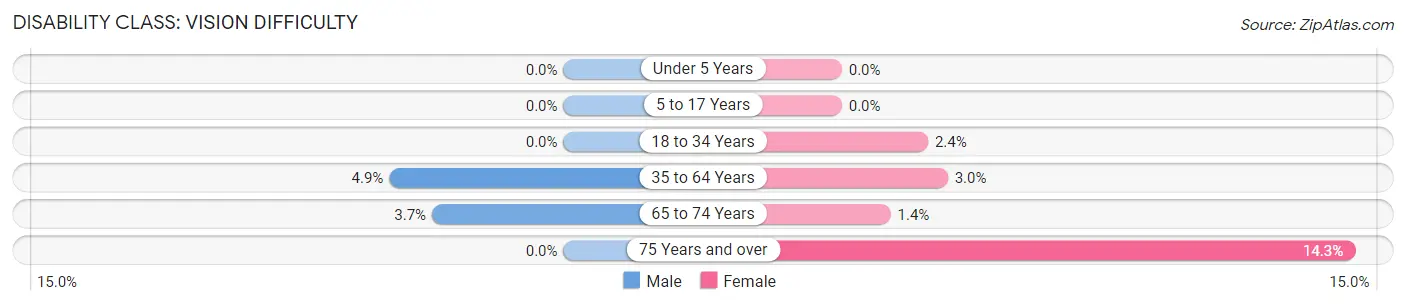
| Age Bracket | Male | Female |
| Under 5 Years | 0 (0.0%) | 0 (0.0%) |
| 5 to 17 Years | 0 (0.0%) | 0 (0.0%) |
| 18 to 34 Years | 0 (0.0%) | 5 (2.4%) |
| 35 to 64 Years | 20 (4.9%) | 10 (2.9%) |
| 65 to 74 Years | 3 (3.7%) | 2 (1.4%) |
| 75 Years and over | 0 (0.0%) | 13 (14.3%) |
Disability Class: Cognitive Difficulty
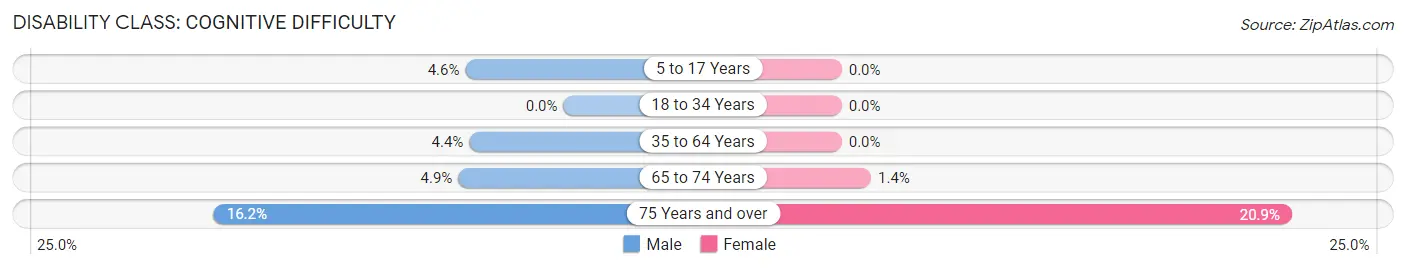
| Age Bracket | Male | Female |
| 5 to 17 Years | 9 (4.5%) | 0 (0.0%) |
| 18 to 34 Years | 0 (0.0%) | 0 (0.0%) |
| 35 to 64 Years | 18 (4.4%) | 0 (0.0%) |
| 65 to 74 Years | 4 (4.9%) | 2 (1.4%) |
| 75 Years and over | 6 (16.2%) | 19 (20.9%) |
Disability Class: Ambulatory Difficulty
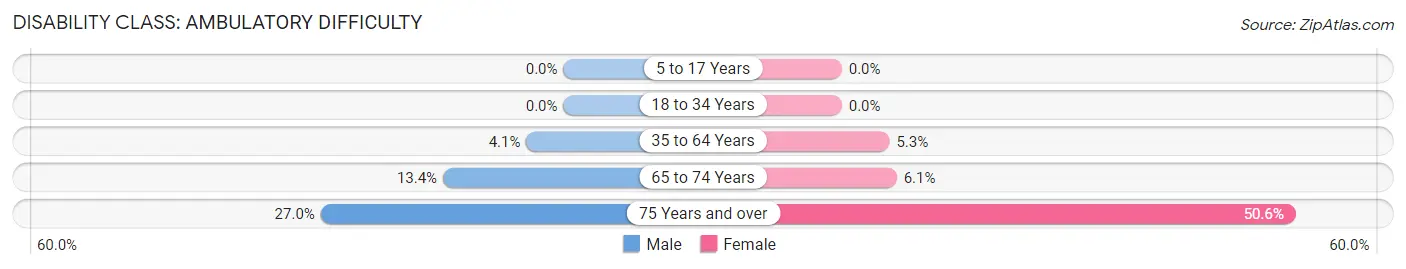
| Age Bracket | Male | Female |
| 5 to 17 Years | 0 (0.0%) | 0 (0.0%) |
| 18 to 34 Years | 0 (0.0%) | 0 (0.0%) |
| 35 to 64 Years | 17 (4.1%) | 18 (5.3%) |
| 65 to 74 Years | 11 (13.4%) | 9 (6.1%) |
| 75 Years and over | 10 (27.0%) | 46 (50.5%) |
Disability Class: Self-Care Difficulty
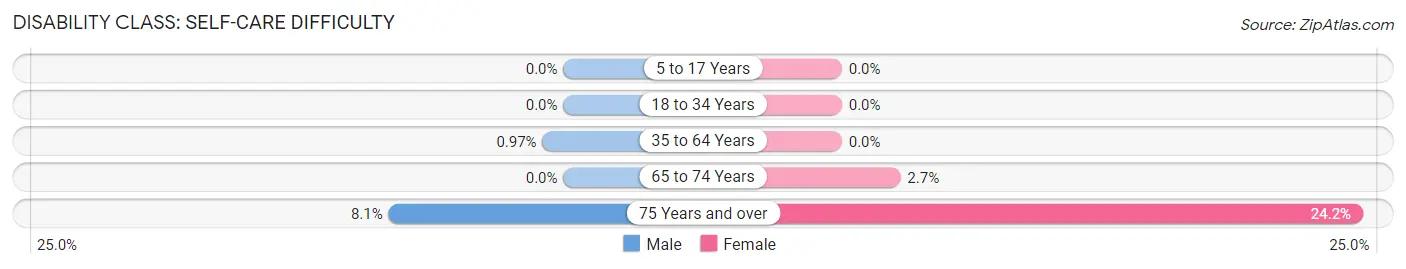
| Age Bracket | Male | Female |
| 5 to 17 Years | 0 (0.0%) | 0 (0.0%) |
| 18 to 34 Years | 0 (0.0%) | 0 (0.0%) |
| 35 to 64 Years | 4 (1.0%) | 0 (0.0%) |
| 65 to 74 Years | 0 (0.0%) | 4 (2.7%) |
| 75 Years and over | 3 (8.1%) | 22 (24.2%) |
Technology Access in Claremont
Computing Device Access in Claremont
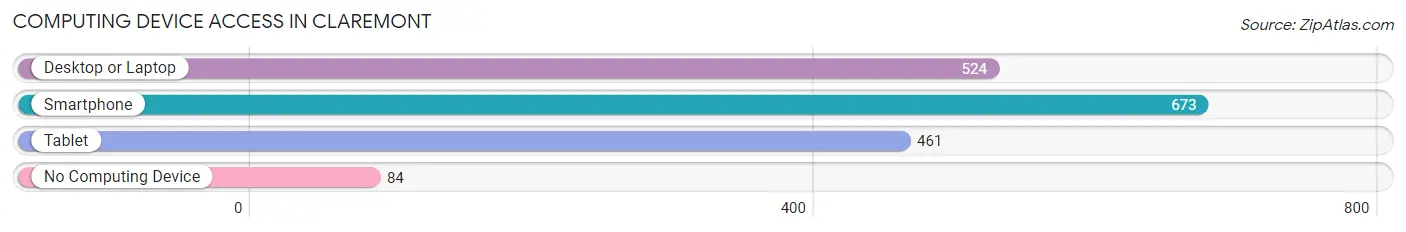
| Device Type | # Households | % Households |
| Desktop or Laptop | 524 | 64.4% |
| Smartphone | 673 | 82.7% |
| Tablet | 461 | 56.6% |
| No Computing Device | 84 | 10.3% |
| Total | 814 | 100.0% |
Internet Access in Claremont
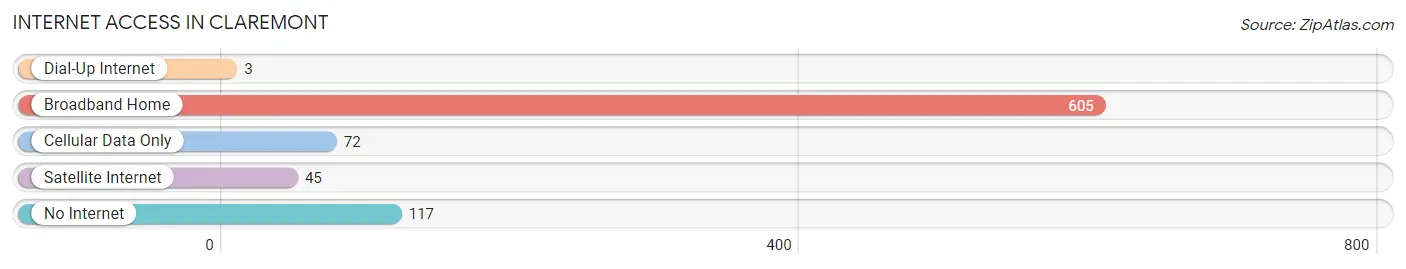
| Internet Type | # Households | % Households |
| Dial-Up Internet | 3 | 0.4% |
| Broadband Home | 605 | 74.3% |
| Cellular Data Only | 72 | 8.8% |
| Satellite Internet | 45 | 5.5% |
| No Internet | 117 | 14.4% |
| Total | 814 | 100.0% |
Claremont Summary
Claremont is a small town located in Catawba County, North Carolina. It is situated in the foothills of the Blue Ridge Mountains, about 25 miles northwest of Charlotte. The town has a population of approximately 1,500 people and is part of the Hickory-Lenoir-Morganton Metropolitan Statistical Area.
Geography
Claremont is located in the foothills of the Blue Ridge Mountains, about 25 miles northwest of Charlotte. The town is situated in the Catawba River Valley, which is surrounded by the Catawba River to the east and the South Fork Catawba River to the west. The town is located at an elevation of 890 feet above sea level. The climate in Claremont is humid subtropical, with hot, humid summers and mild winters.
History
Claremont was founded in 1891 by the Catawba Valley Land Company. The town was named after the Claremont Hotel, which was located in the area. The hotel was built in 1887 and was a popular destination for wealthy visitors from the North. The town was incorporated in 1895 and was home to a variety of businesses, including a cotton mill, a furniture factory, and a brickyard.
In the early 20th century, Claremont experienced a period of growth and prosperity. The town was home to several churches, a bank, a post office, and a variety of stores and businesses. The town also had a movie theater, a library, and a hospital.
Economy
The economy of Claremont is largely based on manufacturing and agriculture. The town is home to several manufacturing companies, including a furniture factory, a brickyard, and a cotton mill. The town is also home to several farms, which produce a variety of crops, including corn, soybeans, and tobacco.
Demographics
As of the 2010 census, the population of Claremont was 1,521. The racial makeup of the town was 94.3% White, 2.7% African American, 0.3% Native American, 0.3% Asian, 0.1% Pacific Islander, 1.2% from other races, and 1.3% from two or more races. Hispanic or Latino of any race were 2.7% of the population.
The median household income in Claremont was $37,917, and the median family income was $45,938. The per capita income was $19,945. About 11.3% of families and 14.2% of the population were below the poverty line, including 19.2% of those under age 18 and 8.2% of those age 65 or over.
Conclusion
Claremont is a small town located in Catawba County, North Carolina. It is situated in the foothills of the Blue Ridge Mountains, about 25 miles northwest of Charlotte. The town has a population of approximately 1,500 people and is part of the Hickory-Lenoir-Morganton Metropolitan Statistical Area. The economy of Claremont is largely based on manufacturing and agriculture, and the town is home to several churches, a bank, a post office, and a variety of stores and businesses. The racial makeup of the town is 94.3% White, 2.7% African American, 0.3% Native American, 0.3% Asian, 0.1% Pacific Islander, 1.2% from other races, and 1.3% from two or more races. The median household income in Claremont was $37,917, and the median family income was $45,938.
Common Questions
What is Per Capita Income in Claremont?
Per Capita income in Claremont is $34,389.
What is the Median Family Income in Claremont?
Median Family Income in Claremont is $76,705.
What is the Median Household income in Claremont?
Median Household Income in Claremont is $60,735.
What is Income or Wage Gap in Claremont?
Income or Wage Gap in Claremont is 23.8%.
Women in Claremont earn 76.2 cents for every dollar earned by a man.
What is Inequality or Gini Index in Claremont?
Inequality or Gini Index in Claremont is 0.44.
What is the Total Population of Claremont?
Total Population of Claremont is 1,902.
What is the Total Male Population of Claremont?
Total Male Population of Claremont is 956.
What is the Total Female Population of Claremont?
Total Female Population of Claremont is 946.
What is the Ratio of Males per 100 Females in Claremont?
There are 101.06 Males per 100 Females in Claremont.
What is the Ratio of Females per 100 Males in Claremont?
There are 98.95 Females per 100 Males in Claremont.
What is the Median Population Age in Claremont?
Median Population Age in Claremont is 44.5 Years.
What is the Average Family Size in Claremont
Average Family Size in Claremont is 2.7 People.
What is the Average Household Size in Claremont
Average Household Size in Claremont is 2.3 People.
How Large is the Labor Force in Claremont?
There are 1,080 People in the Labor Forcein in Claremont.
What is the Percentage of People in the Labor Force in Claremont?
66.8% of People are in the Labor Force in Claremont.
What is the Unemployment Rate in Claremont?
Unemployment Rate in Claremont is 2.0%.