Lowell, NC Map & Demographics
Lowell Map
Lowell Overview
$33,305
PER CAPITA INCOME
$82,523
AVG FAMILY INCOME
$55,481
AVG HOUSEHOLD INCOME
0.6%
WAGE / INCOME GAP [ % ]
99.4¢/ $1
WAGE / INCOME GAP [ $ ]
0.49
INEQUALITY / GINI INDEX
3,692
TOTAL POPULATION
2,054
MALE POPULATION
1,638
FEMALE POPULATION
125.40
MALES / 100 FEMALES
79.75
FEMALES / 100 MALES
38.7
MEDIAN AGE
2.9
AVG FAMILY SIZE
2.5
AVG HOUSEHOLD SIZE
1,943
LABOR FORCE [ PEOPLE ]
65.7%
PERCENT IN LABOR FORCE
4.5%
UNEMPLOYMENT RATE
Lowell Zip Codes
Income in Lowell
Income Overview in Lowell
Per Capita Income in Lowell is $33,305, while median incomes of families and households are $82,523 and $55,481 respectively.
| Characteristic | Number | Measure |
| Per Capita Income | 3,692 | $33,305 |
| Median Family Income | 895 | $82,523 |
| Mean Family Income | 895 | $85,407 |
| Median Household Income | 1,487 | $55,481 |
| Mean Household Income | 1,487 | $79,703 |
| Income Deficit | 895 | $0 |
| Wage / Income Gap (%) | 3,692 | 0.57% |
| Wage / Income Gap ($) | 3,692 | 99.43¢ per $1 |
| Gini / Inequality Index | 3,692 | 0.49 |
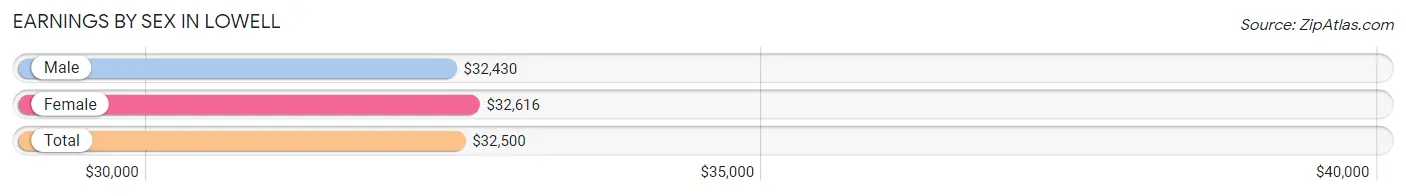
Earnings by Sex in Lowell
Average Earnings in Lowell are $32,500, $32,430 for men and $32,616 for women, a difference of 0.6%.
| Sex | Number | Average Earnings |
| Male | 1,039 (52.7%) | $32,430 |
| Female | 933 (47.3%) | $32,616 |
| Total | 1,972 (100.0%) | $32,500 |
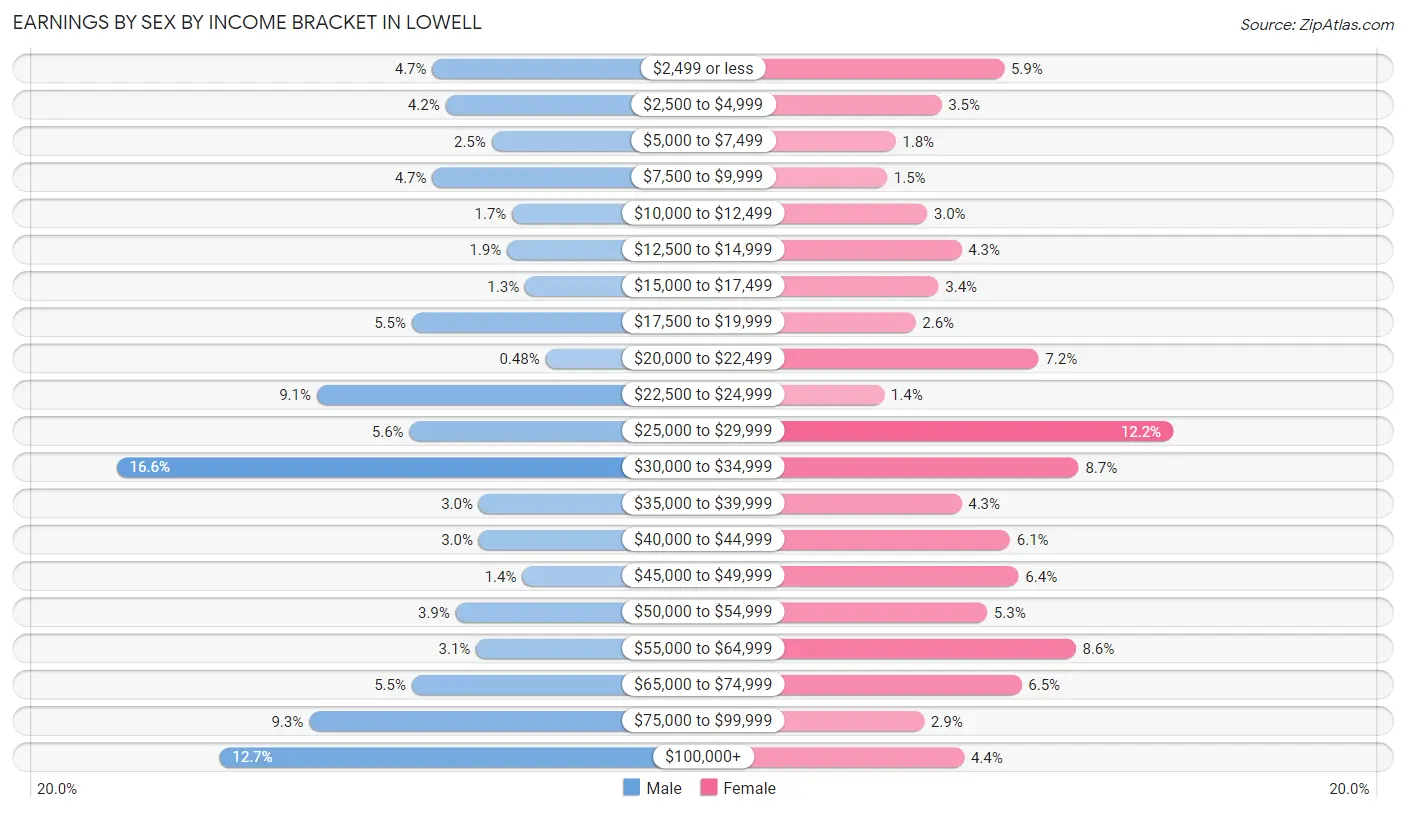
Earnings by Sex by Income Bracket in Lowell
The most common earnings brackets in Lowell are $30,000 to $34,999 for men (172 | 16.6%) and $25,000 to $29,999 for women (114 | 12.2%).
| Income | Male | Female |
| $2,499 or less | 49 (4.7%) | 55 (5.9%) |
| $2,500 to $4,999 | 44 (4.2%) | 33 (3.5%) |
| $5,000 to $7,499 | 26 (2.5%) | 17 (1.8%) |
| $7,500 to $9,999 | 49 (4.7%) | 14 (1.5%) |
| $10,000 to $12,499 | 18 (1.7%) | 28 (3.0%) |
| $12,500 to $14,999 | 20 (1.9%) | 40 (4.3%) |
| $15,000 to $17,499 | 13 (1.3%) | 32 (3.4%) |
| $17,500 to $19,999 | 57 (5.5%) | 24 (2.6%) |
| $20,000 to $22,499 | 5 (0.5%) | 67 (7.2%) |
| $22,500 to $24,999 | 94 (9.0%) | 13 (1.4%) |
| $25,000 to $29,999 | 58 (5.6%) | 114 (12.2%) |
| $30,000 to $34,999 | 172 (16.6%) | 81 (8.7%) |
| $35,000 to $39,999 | 31 (3.0%) | 40 (4.3%) |
| $40,000 to $44,999 | 31 (3.0%) | 57 (6.1%) |
| $45,000 to $49,999 | 14 (1.3%) | 60 (6.4%) |
| $50,000 to $54,999 | 40 (3.8%) | 49 (5.2%) |
| $55,000 to $64,999 | 32 (3.1%) | 80 (8.6%) |
| $65,000 to $74,999 | 57 (5.5%) | 61 (6.5%) |
| $75,000 to $99,999 | 97 (9.3%) | 27 (2.9%) |
| $100,000+ | 132 (12.7%) | 41 (4.4%) |
| Total | 1,039 (100.0%) | 933 (100.0%) |
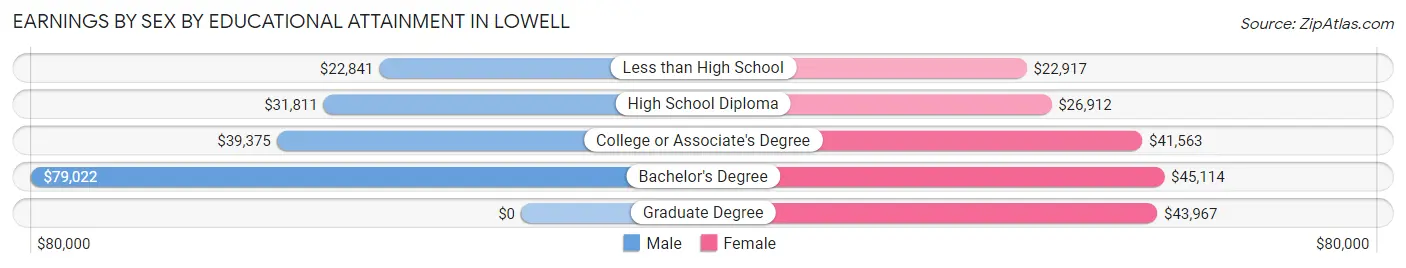
Earnings by Sex by Educational Attainment in Lowell
Average earnings in Lowell are $34,186 for men and $35,250 for women, a difference of 3.0%. Men with an educational attainment of bachelor's degree enjoy the highest average annual earnings of $79,022, while those with less than high school education earn the least with $22,841. Women with an educational attainment of bachelor's degree earn the most with the average annual earnings of $45,114, while those with less than high school education have the smallest earnings of $22,917.
| Educational Attainment | Male Income | Female Income |
| Less than High School | $22,841 | $22,917 |
| High School Diploma | $31,811 | $26,912 |
| College or Associate's Degree | $39,375 | $41,563 |
| Bachelor's Degree | $79,022 | $45,114 |
| Graduate Degree | - | - |
| Total | $34,186 | $35,250 |
Family Income in Lowell
Family Income Brackets in Lowell
According to the Lowell family income data, there are 204 families falling into the $75,000 to $99,999 income range, which is the most common income bracket and makes up 22.8% of all families. Conversely, the less than $10,000 income bracket is the least frequent group with only 12 families (1.3%) belonging to this category.
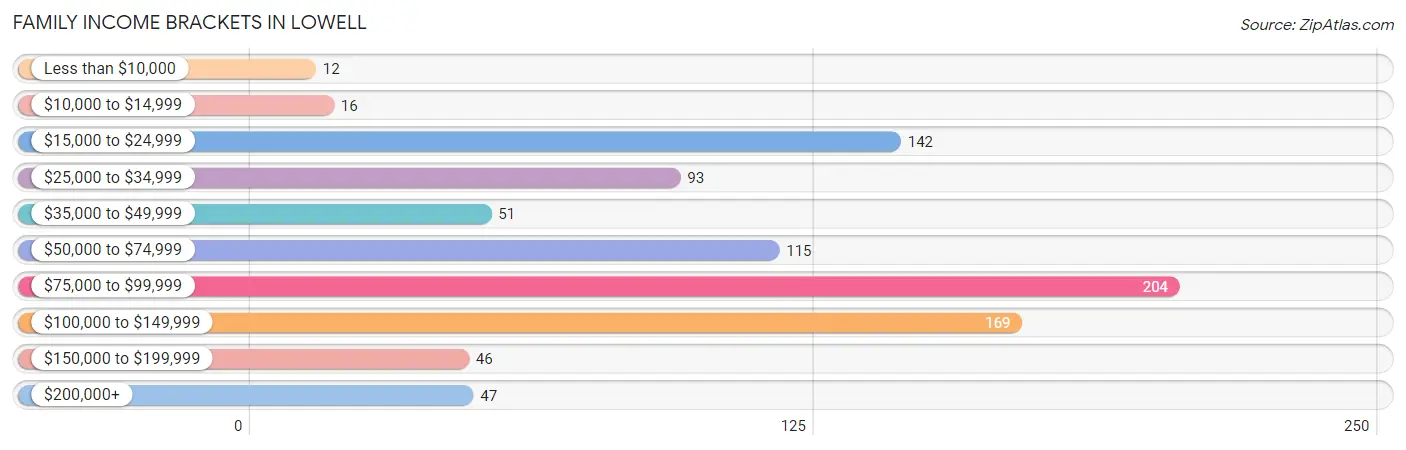
| Income Bracket | # Families | % Families |
| Less than $10,000 | 12 | 1.3% |
| $10,000 to $14,999 | 16 | 1.8% |
| $15,000 to $24,999 | 142 | 15.9% |
| $25,000 to $34,999 | 93 | 10.4% |
| $35,000 to $49,999 | 51 | 5.7% |
| $50,000 to $74,999 | 115 | 12.8% |
| $75,000 to $99,999 | 204 | 22.8% |
| $100,000 to $149,999 | 169 | 18.9% |
| $150,000 to $199,999 | 46 | 5.1% |
| $200,000+ | 47 | 5.3% |
Family Income by Famaliy Size in Lowell
4-person families (189 | 21.1%) account for the highest median family income in Lowell with $98,051 per family, while 2-person families (470 | 52.5%) have the highest median income of $36,818 per family member.
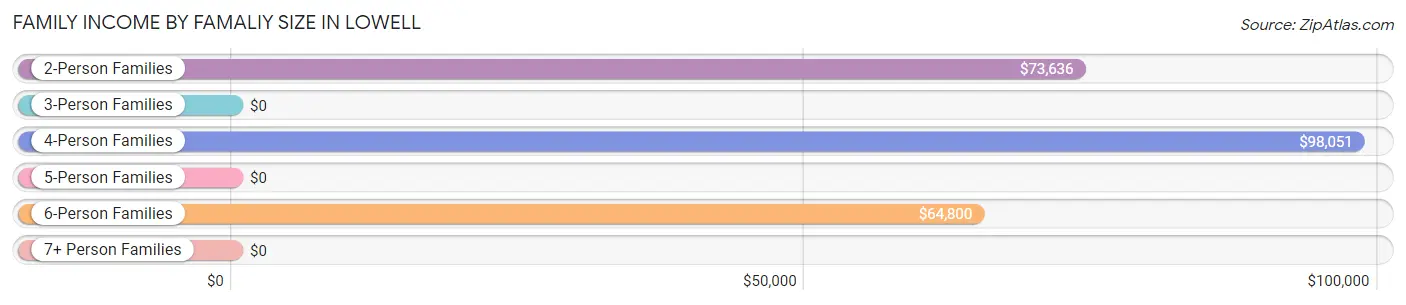
| Income Bracket | # Families | Median Income |
| 2-Person Families | 470 (52.5%) | $73,636 |
| 3-Person Families | 150 (16.8%) | $0 |
| 4-Person Families | 189 (21.1%) | $98,051 |
| 5-Person Families | 40 (4.5%) | $0 |
| 6-Person Families | 46 (5.1%) | $64,800 |
| 7+ Person Families | 0 (0.0%) | $0 |
| Total | 895 (100.0%) | $82,523 |
Family Income by Number of Earners in Lowell
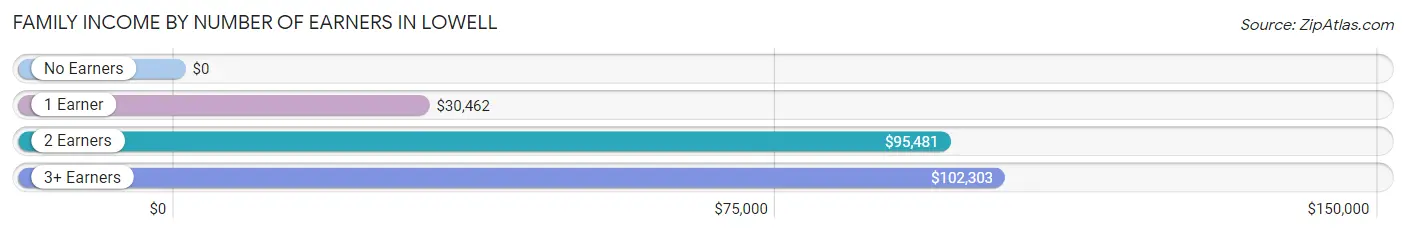
| Number of Earners | # Families | Median Income |
| No Earners | 82 (9.2%) | $0 |
| 1 Earner | 323 (36.1%) | $30,462 |
| 2 Earners | 411 (45.9%) | $95,481 |
| 3+ Earners | 79 (8.8%) | $102,303 |
| Total | 895 (100.0%) | $82,523 |
Household Income in Lowell
Household Income Brackets in Lowell
With 294 households falling in the category, the $25,000 to $34,999 income range is the most frequent in Lowell, accounting for 19.8% of all households. In contrast, only 46 households (3.1%) fall into the less than $10,000 income bracket, making it the least populous group.
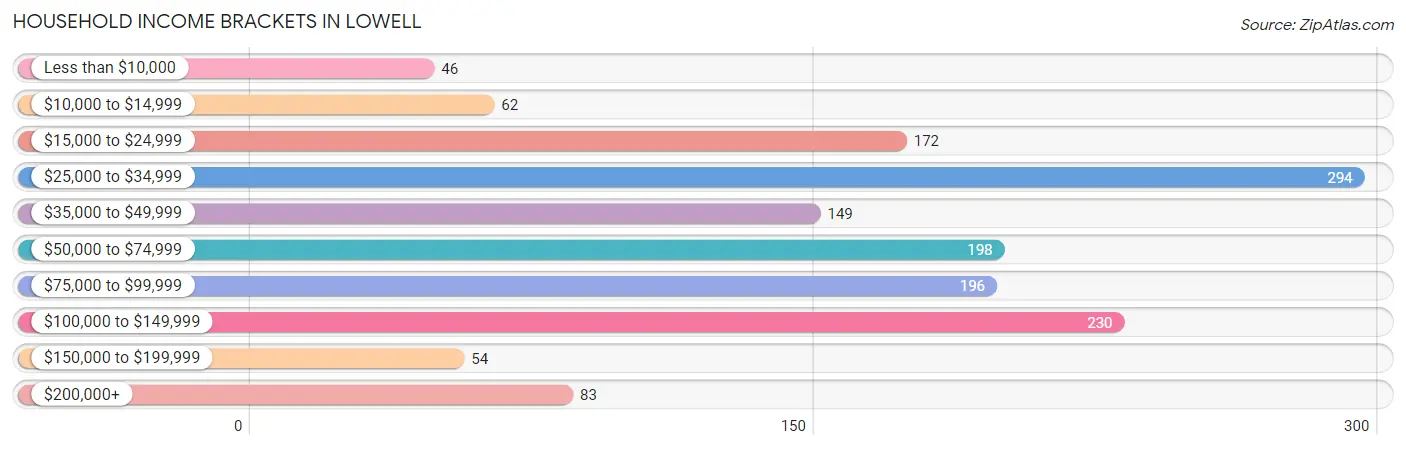
| Income Bracket | # Households | % Households |
| Less than $10,000 | 46 | 3.1% |
| $10,000 to $14,999 | 62 | 4.2% |
| $15,000 to $24,999 | 172 | 11.6% |
| $25,000 to $34,999 | 294 | 19.8% |
| $35,000 to $49,999 | 149 | 10.0% |
| $50,000 to $74,999 | 198 | 13.3% |
| $75,000 to $99,999 | 196 | 13.2% |
| $100,000 to $149,999 | 230 | 15.5% |
| $150,000 to $199,999 | 54 | 3.6% |
| $200,000+ | 83 | 5.6% |
Household Income by Householder Age in Lowell
The median household income in Lowell is $55,481, with the highest median household income of $63,698 found in the 25 to 44 years age bracket for the primary householder. A total of 487 households (32.8%) fall into this category. Meanwhile, the 15 to 24 years age bracket for the primary householder has the lowest median household income of $0, with 3 households (0.2%) in this group.
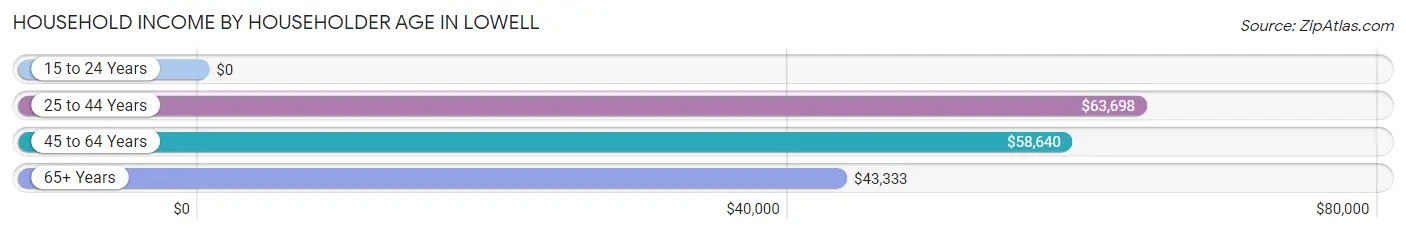
| Income Bracket | # Households | Median Income |
| 15 to 24 Years | 3 (0.2%) | $0 |
| 25 to 44 Years | 487 (32.8%) | $63,698 |
| 45 to 64 Years | 703 (47.3%) | $58,640 |
| 65+ Years | 294 (19.8%) | $43,333 |
| Total | 1,487 (100.0%) | $55,481 |
Poverty in Lowell
Income Below Poverty by Sex and Age in Lowell
With 19.8% poverty level for males and 25.3% for females among the residents of Lowell, 5 year old males and 12 to 14 year old females are the most vulnerable to poverty, with 5 males (100.0%) and 62 females (70.5%) in their respective age groups living below the poverty level.
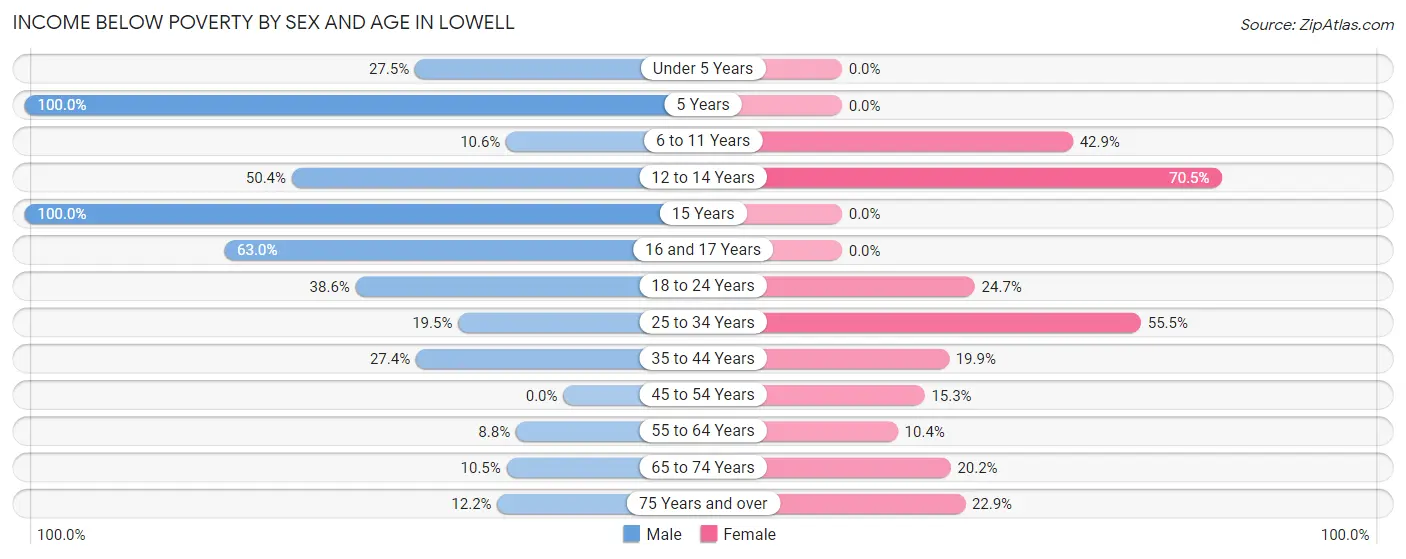
| Age Bracket | Male | Female |
| Under 5 Years | 30 (27.5%) | 0 (0.0%) |
| 5 Years | 5 (100.0%) | 0 (0.0%) |
| 6 to 11 Years | 26 (10.6%) | 15 (42.9%) |
| 12 to 14 Years | 64 (50.4%) | 62 (70.5%) |
| 15 Years | 17 (100.0%) | 0 (0.0%) |
| 16 and 17 Years | 17 (63.0%) | 0 (0.0%) |
| 18 to 24 Years | 64 (38.6%) | 36 (24.7%) |
| 25 to 34 Years | 56 (19.5%) | 116 (55.5%) |
| 35 to 44 Years | 67 (27.4%) | 53 (19.9%) |
| 45 to 54 Years | 0 (0.0%) | 29 (15.3%) |
| 55 to 64 Years | 32 (8.8%) | 25 (10.4%) |
| 65 to 74 Years | 16 (10.5%) | 47 (20.2%) |
| 75 Years and over | 6 (12.2%) | 16 (22.9%) |
| Total | 400 (19.8%) | 399 (25.3%) |
Income Above Poverty by Sex and Age in Lowell
According to the poverty statistics in Lowell, males aged 45 to 54 years and females aged under 5 years are the age groups that are most secure financially, with 100.0% of males and 100.0% of females in these age groups living above the poverty line.
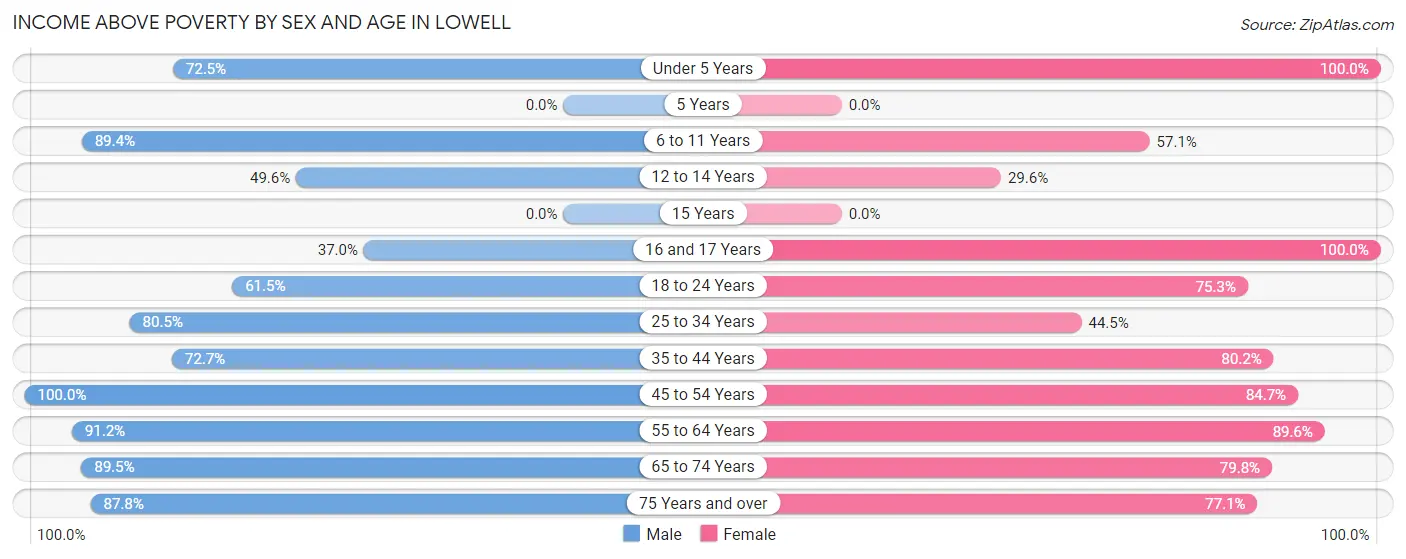
| Age Bracket | Male | Female |
| Under 5 Years | 79 (72.5%) | 61 (100.0%) |
| 5 Years | 0 (0.0%) | 0 (0.0%) |
| 6 to 11 Years | 219 (89.4%) | 20 (57.1%) |
| 12 to 14 Years | 63 (49.6%) | 26 (29.5%) |
| 15 Years | 0 (0.0%) | 0 (0.0%) |
| 16 and 17 Years | 10 (37.0%) | 39 (100.0%) |
| 18 to 24 Years | 102 (61.5%) | 110 (75.3%) |
| 25 to 34 Years | 231 (80.5%) | 93 (44.5%) |
| 35 to 44 Years | 178 (72.7%) | 214 (80.1%) |
| 45 to 54 Years | 232 (100.0%) | 160 (84.7%) |
| 55 to 64 Years | 332 (91.2%) | 216 (89.6%) |
| 65 to 74 Years | 136 (89.5%) | 186 (79.8%) |
| 75 Years and over | 43 (87.8%) | 54 (77.1%) |
| Total | 1,625 (80.2%) | 1,179 (74.7%) |
Income Below Poverty Among Married-Couple Families in Lowell
The poverty statistics for married-couple families in Lowell show that 6.2% or 31 of the total 499 families live below the poverty line. Families with 3 or 4 children have the highest poverty rate of 32.0%, comprising of 16 families. On the other hand, families with no children have the lowest poverty rate of 2.3%, which includes 7 families.
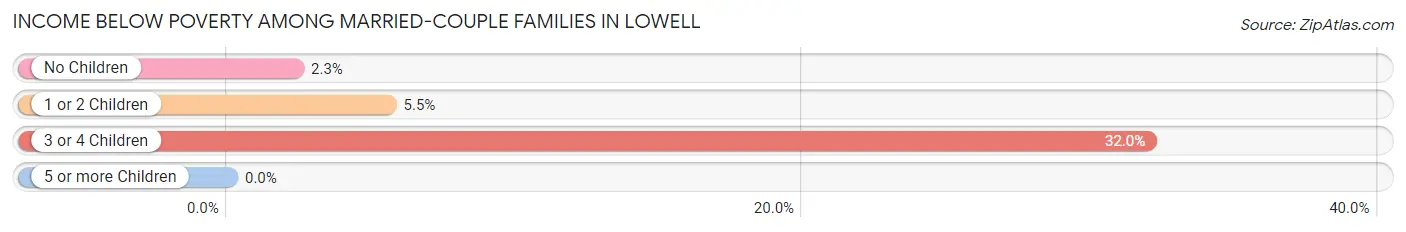
| Children | Above Poverty | Below Poverty |
| No Children | 297 (97.7%) | 7 (2.3%) |
| 1 or 2 Children | 137 (94.5%) | 8 (5.5%) |
| 3 or 4 Children | 34 (68.0%) | 16 (32.0%) |
| 5 or more Children | 0 (0.0%) | 0 (0.0%) |
| Total | 468 (93.8%) | 31 (6.2%) |
Income Below Poverty Among Single-Parent Households in Lowell
According to the poverty data in Lowell, 20.5% or 33 single-father households and 31.9% or 75 single-mother households are living below the poverty line. Among single-father households, those with 3 or 4 children have the highest poverty rate, with 33 households (100.0%) experiencing poverty. Likewise, among single-mother households, those with 1 or 2 children have the highest poverty rate, with 48 households (36.1%) falling below the poverty line.
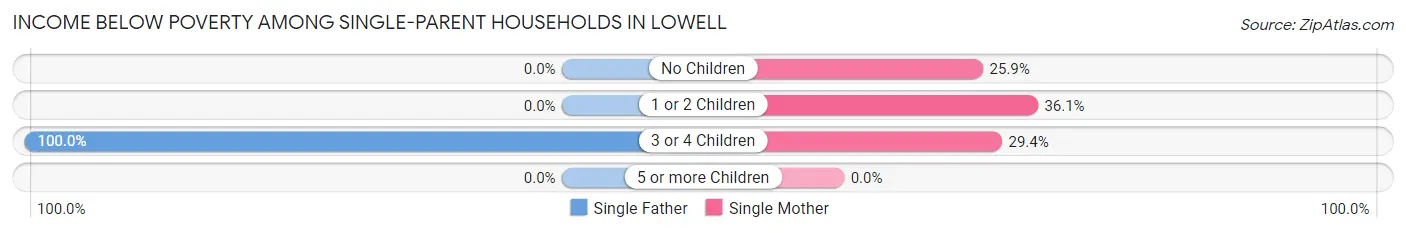
| Children | Single Father | Single Mother |
| No Children | 0 (0.0%) | 22 (25.9%) |
| 1 or 2 Children | 0 (0.0%) | 48 (36.1%) |
| 3 or 4 Children | 33 (100.0%) | 5 (29.4%) |
| 5 or more Children | 0 (0.0%) | 0 (0.0%) |
| Total | 33 (20.5%) | 75 (31.9%) |
Income Below Poverty Among Married-Couple vs Single-Parent Households in Lowell
The poverty data for Lowell shows that 31 of the married-couple family households (6.2%) and 108 of the single-parent households (27.3%) are living below the poverty level. Within the married-couple family households, those with 3 or 4 children have the highest poverty rate, with 16 households (32.0%) falling below the poverty line. Among the single-parent households, those with 3 or 4 children have the highest poverty rate, with 38 household (76.0%) living below poverty.
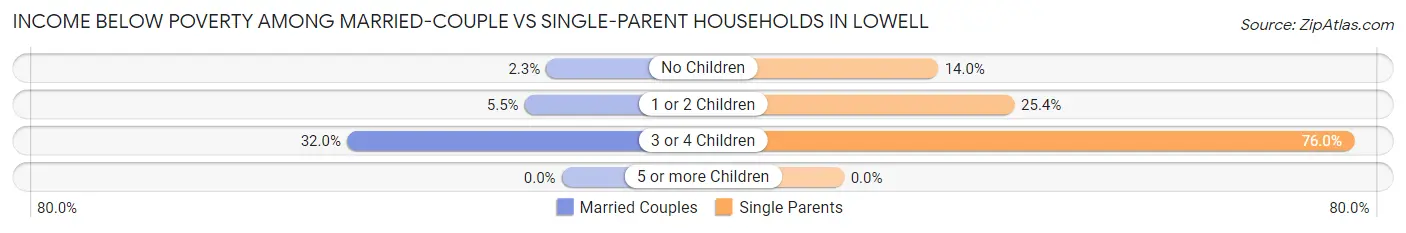
| Children | Married-Couple Families | Single-Parent Households |
| No Children | 7 (2.3%) | 22 (14.0%) |
| 1 or 2 Children | 8 (5.5%) | 48 (25.4%) |
| 3 or 4 Children | 16 (32.0%) | 38 (76.0%) |
| 5 or more Children | 0 (0.0%) | 0 (0.0%) |
| Total | 31 (6.2%) | 108 (27.3%) |
Race in Lowell
The most populous races in Lowell are White / Caucasian (2,695 | 73.0%), Black / African American (613 | 16.6%), and Hispanic or Latino (522 | 14.1%).
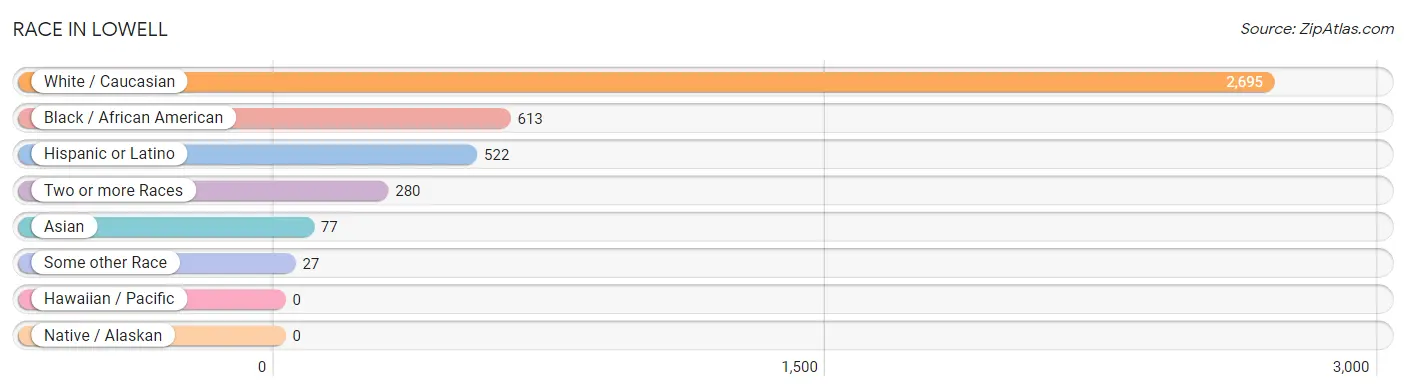
| Race | # Population | % Population |
| Asian | 77 | 2.1% |
| Black / African American | 613 | 16.6% |
| Hawaiian / Pacific | 0 | 0.0% |
| Hispanic or Latino | 522 | 14.1% |
| Native / Alaskan | 0 | 0.0% |
| White / Caucasian | 2,695 | 73.0% |
| Two or more Races | 280 | 7.6% |
| Some other Race | 27 | 0.7% |
| Total | 3,692 | 100.0% |
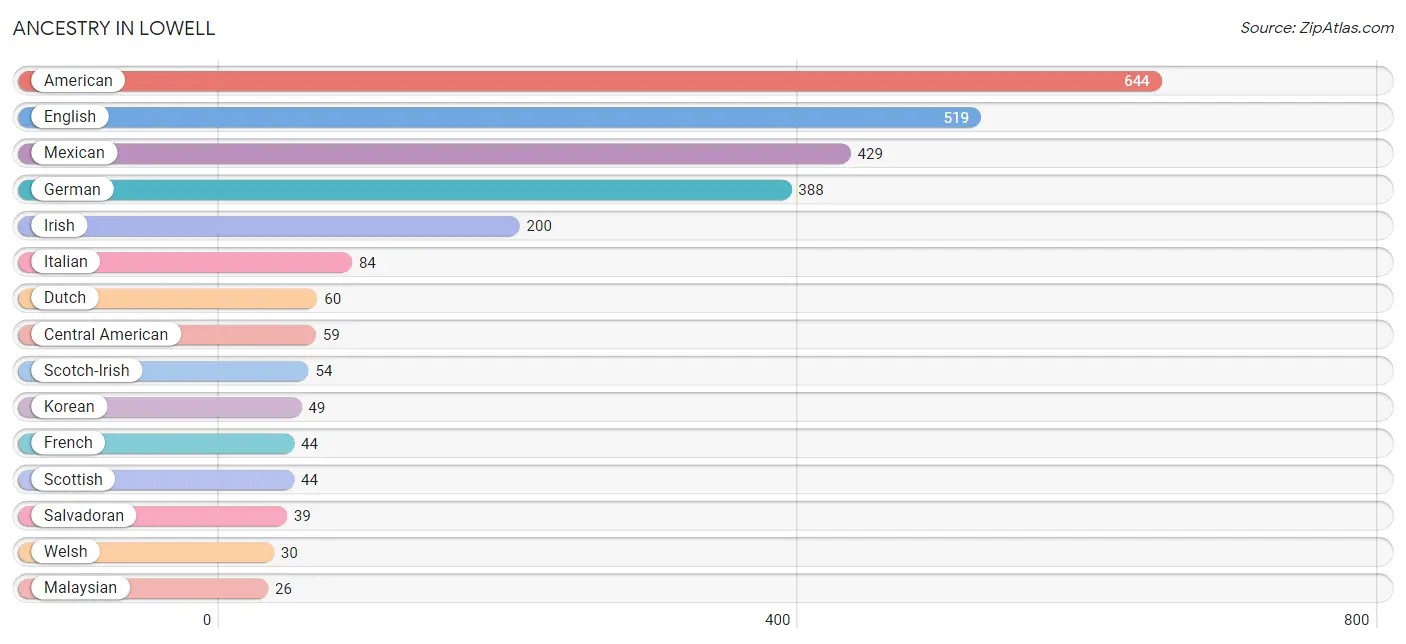
Ancestry in Lowell
The most populous ancestries reported in Lowell are American (644 | 17.4%), English (519 | 14.1%), Mexican (429 | 11.6%), German (388 | 10.5%), and Irish (200 | 5.4%), together accounting for 59.1% of all Lowell residents.
| Ancestry | # Population | % Population |
| African | 20 | 0.5% |
| American | 644 | 17.4% |
| Arab | 11 | 0.3% |
| Blackfeet | 12 | 0.3% |
| British | 22 | 0.6% |
| Central American | 59 | 1.6% |
| Cherokee | 19 | 0.5% |
| Dominican | 10 | 0.3% |
| Dutch | 60 | 1.6% |
| English | 519 | 14.1% |
| European | 11 | 0.3% |
| Finnish | 10 | 0.3% |
| French | 44 | 1.2% |
| French Canadian | 5 | 0.1% |
| German | 388 | 10.5% |
| German Russian | 17 | 0.5% |
| Guatemalan | 9 | 0.2% |
| Guyanese | 6 | 0.2% |
| Indian (Asian) | 14 | 0.4% |
| Irish | 200 | 5.4% |
| Italian | 84 | 2.3% |
| Korean | 49 | 1.3% |
| Lebanese | 2 | 0.1% |
| Malaysian | 26 | 0.7% |
| Mexican | 429 | 11.6% |
| Northern European | 8 | 0.2% |
| Norwegian | 19 | 0.5% |
| Palestinian | 9 | 0.2% |
| Panamanian | 11 | 0.3% |
| Polish | 23 | 0.6% |
| Puerto Rican | 24 | 0.6% |
| Russian | 8 | 0.2% |
| Salvadoran | 39 | 1.1% |
| Scotch-Irish | 54 | 1.5% |
| Scottish | 44 | 1.2% |
| Sri Lankan | 11 | 0.3% |
| Subsaharan African | 20 | 0.5% |
| Swedish | 7 | 0.2% |
| Thai | 10 | 0.3% |
| Welsh | 30 | 0.8% | View All 40 Rows |
Immigrants in Lowell
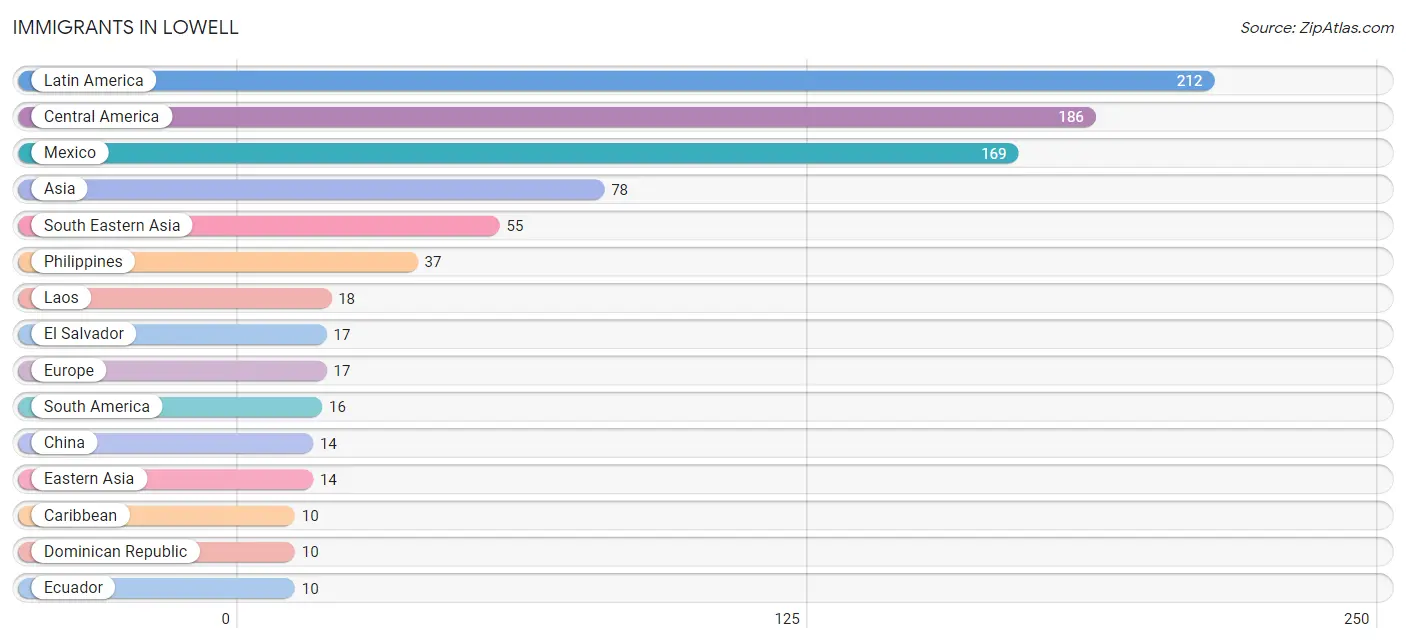
The most numerous immigrant groups reported in Lowell came from Latin America (212 | 5.7%), Central America (186 | 5.0%), Mexico (169 | 4.6%), Asia (78 | 2.1%), and South Eastern Asia (55 | 1.5%), together accounting for 19.0% of all Lowell residents.
| Immigration Origin | # Population | % Population |
| Asia | 78 | 2.1% |
| Caribbean | 10 | 0.3% |
| Central America | 186 | 5.0% |
| China | 14 | 0.4% |
| Dominican Republic | 10 | 0.3% |
| Eastern Asia | 14 | 0.4% |
| Eastern Europe | 8 | 0.2% |
| Ecuador | 10 | 0.3% |
| El Salvador | 17 | 0.5% |
| England | 5 | 0.1% |
| Europe | 17 | 0.5% |
| Guyana | 3 | 0.1% |
| Laos | 18 | 0.5% |
| Latin America | 212 | 5.7% |
| Mexico | 169 | 4.6% |
| Northern Europe | 9 | 0.2% |
| Philippines | 37 | 1.0% |
| Russia | 8 | 0.2% |
| South America | 16 | 0.4% |
| South Eastern Asia | 55 | 1.5% | View All 20 Rows |
Sex and Age in Lowell
Sex and Age in Lowell
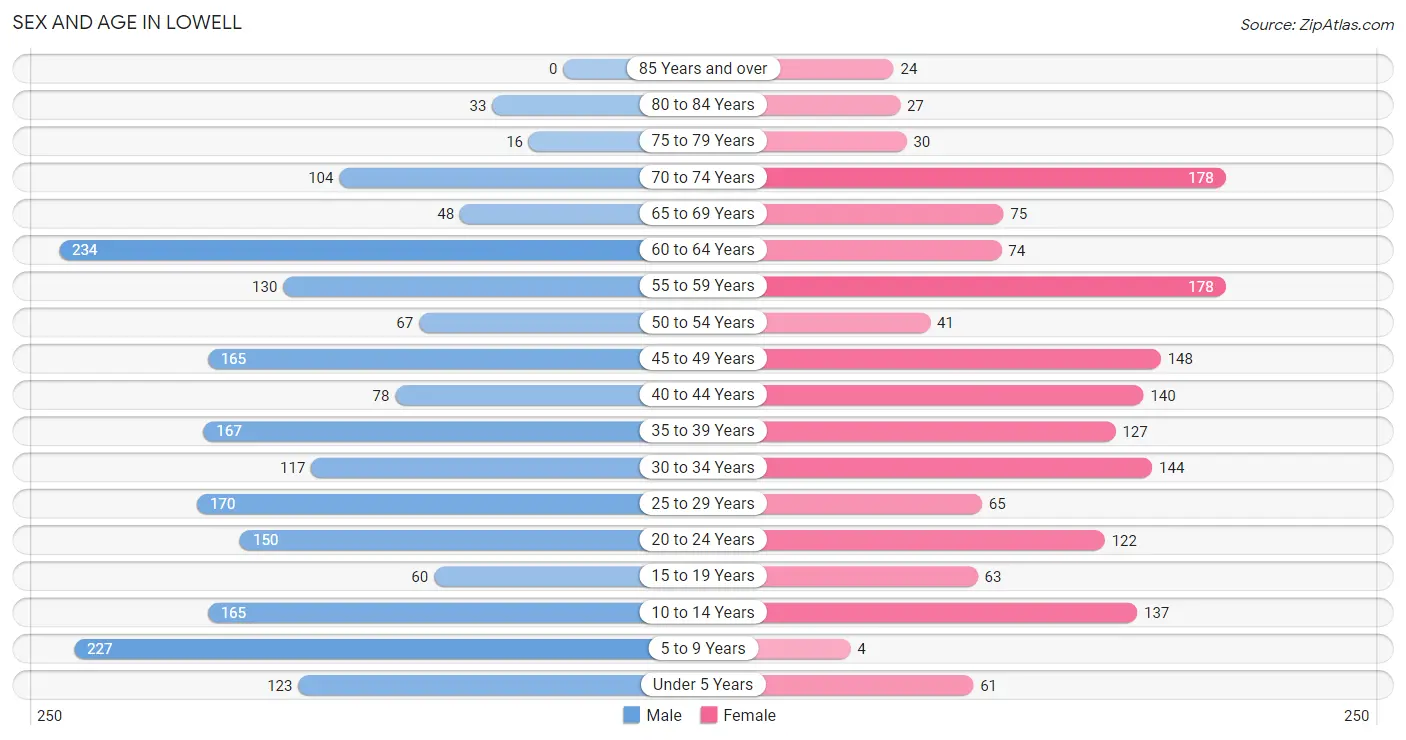
The most populous age groups in Lowell are 60 to 64 Years (234 | 11.4%) for men and 55 to 59 Years (178 | 10.9%) for women.
| Age Bracket | Male | Female |
| Under 5 Years | 123 (6.0%) | 61 (3.7%) |
| 5 to 9 Years | 227 (11.1%) | 4 (0.2%) |
| 10 to 14 Years | 165 (8.0%) | 137 (8.4%) |
| 15 to 19 Years | 60 (2.9%) | 63 (3.8%) |
| 20 to 24 Years | 150 (7.3%) | 122 (7.4%) |
| 25 to 29 Years | 170 (8.3%) | 65 (4.0%) |
| 30 to 34 Years | 117 (5.7%) | 144 (8.8%) |
| 35 to 39 Years | 167 (8.1%) | 127 (7.7%) |
| 40 to 44 Years | 78 (3.8%) | 140 (8.6%) |
| 45 to 49 Years | 165 (8.0%) | 148 (9.0%) |
| 50 to 54 Years | 67 (3.3%) | 41 (2.5%) |
| 55 to 59 Years | 130 (6.3%) | 178 (10.9%) |
| 60 to 64 Years | 234 (11.4%) | 74 (4.5%) |
| 65 to 69 Years | 48 (2.3%) | 75 (4.6%) |
| 70 to 74 Years | 104 (5.1%) | 178 (10.9%) |
| 75 to 79 Years | 16 (0.8%) | 30 (1.8%) |
| 80 to 84 Years | 33 (1.6%) | 27 (1.7%) |
| 85 Years and over | 0 (0.0%) | 24 (1.5%) |
| Total | 2,054 (100.0%) | 1,638 (100.0%) |
Families and Households in Lowell
Median Family Size in Lowell
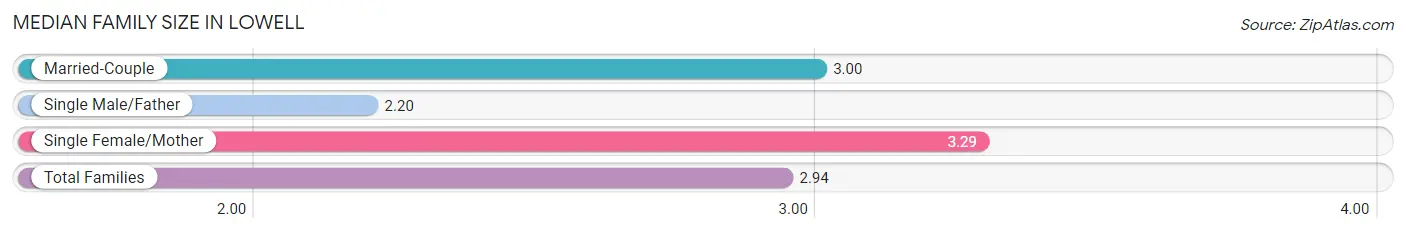
The median family size in Lowell is 2.94 persons per family, with single female/mother families (235 | 26.3%) accounting for the largest median family size of 3.29 persons per family. On the other hand, single male/father families (161 | 18.0%) represent the smallest median family size with 2.20 persons per family.
| Family Type | # Families | Family Size |
| Married-Couple | 499 (55.7%) | 3.00 |
| Single Male/Father | 161 (18.0%) | 2.20 |
| Single Female/Mother | 235 (26.3%) | 3.29 |
| Total Families | 895 (100.0%) | 2.94 |
Median Household Size in Lowell
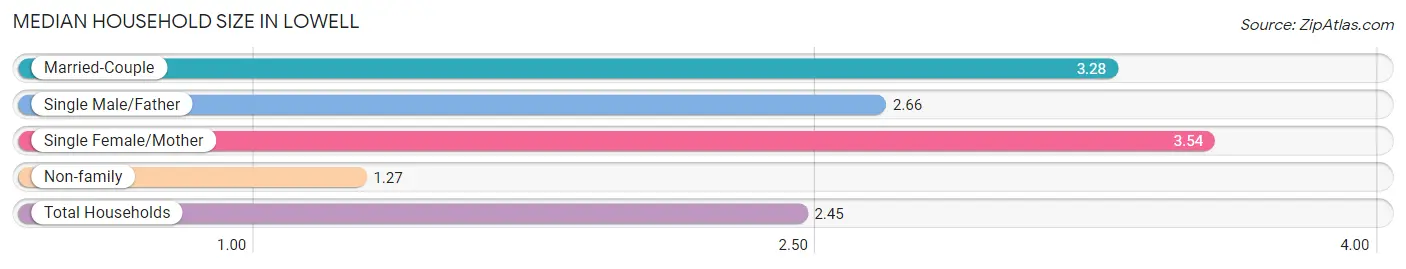
The median household size in Lowell is 2.45 persons per household, with single female/mother households (235 | 15.8%) accounting for the largest median household size of 3.54 persons per household. non-family households (592 | 39.8%) represent the smallest median household size with 1.27 persons per household.
| Household Type | # Households | Household Size |
| Married-Couple | 499 (33.6%) | 3.28 |
| Single Male/Father | 161 (10.8%) | 2.66 |
| Single Female/Mother | 235 (15.8%) | 3.54 |
| Non-family | 592 (39.8%) | 1.27 |
| Total Households | 1,487 (100.0%) | 2.45 |
Household Size by Marriage Status in Lowell
Out of a total of 1,487 households in Lowell, 895 (60.2%) are family households, while 592 (39.8%) are nonfamily households. The most numerous type of family households are 2-person households, comprising 416, and the most common type of nonfamily households are 1-person households, comprising 462.
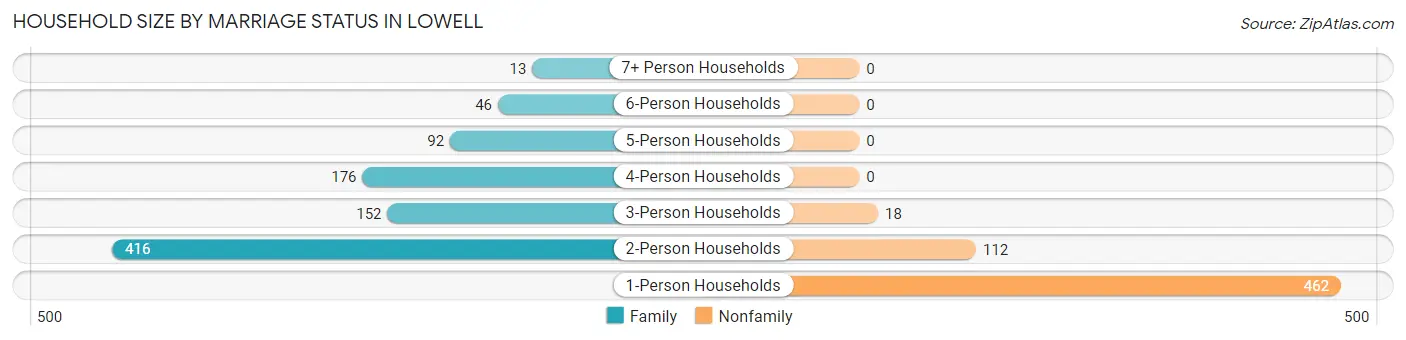
| Household Size | Family Households | Nonfamily Households |
| 1-Person Households | - | 462 (31.1%) |
| 2-Person Households | 416 (28.0%) | 112 (7.5%) |
| 3-Person Households | 152 (10.2%) | 18 (1.2%) |
| 4-Person Households | 176 (11.8%) | 0 (0.0%) |
| 5-Person Households | 92 (6.2%) | 0 (0.0%) |
| 6-Person Households | 46 (3.1%) | 0 (0.0%) |
| 7+ Person Households | 13 (0.9%) | 0 (0.0%) |
| Total | 895 (60.2%) | 592 (39.8%) |
Female Fertility in Lowell
Fertility by Age in Lowell
Average fertility rate in Lowell is 84.0 births per 1,000 women. Women in the age bracket of 20 to 34 years have the highest fertility rate with 91.0 births per 1,000 women. Women in the age bracket of 35 to 50 years acount for 55.9% of all women with births.
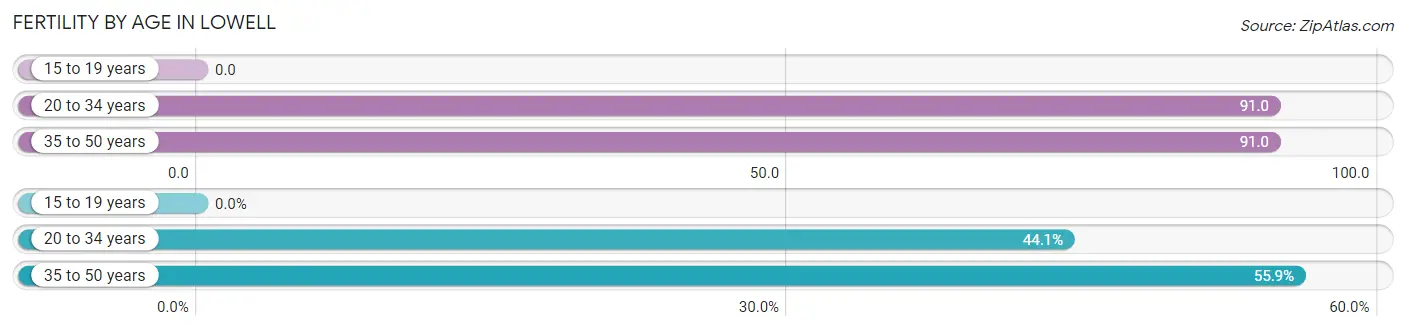
| Age Bracket | Women with Births | Births / 1,000 Women |
| 15 to 19 years | 0 (0.0%) | 0.0 |
| 20 to 34 years | 30 (44.1%) | 91.0 |
| 35 to 50 years | 38 (55.9%) | 91.0 |
| Total | 68 (100.0%) | 84.0 |
Fertility by Age by Marriage Status in Lowell
35.3% of women with births (68) in Lowell are married. The highest percentage of unmarried women with births falls into 20 to 34 years age bracket with 73.3% of them unmarried at the time of birth, while the lowest percentage of unmarried women with births belong to 35 to 50 years age bracket with 57.9% of them unmarried.
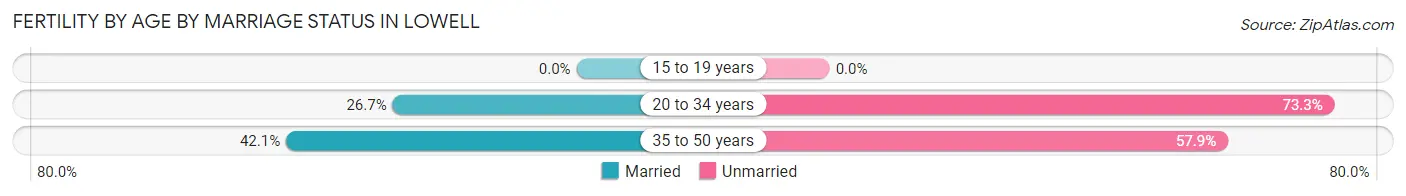
| Age Bracket | Married | Unmarried |
| 15 to 19 years | 0 (0.0%) | 0 (0.0%) |
| 20 to 34 years | 8 (26.7%) | 22 (73.3%) |
| 35 to 50 years | 16 (42.1%) | 22 (57.9%) |
| Total | 24 (35.3%) | 44 (64.7%) |
Fertility by Education in Lowell
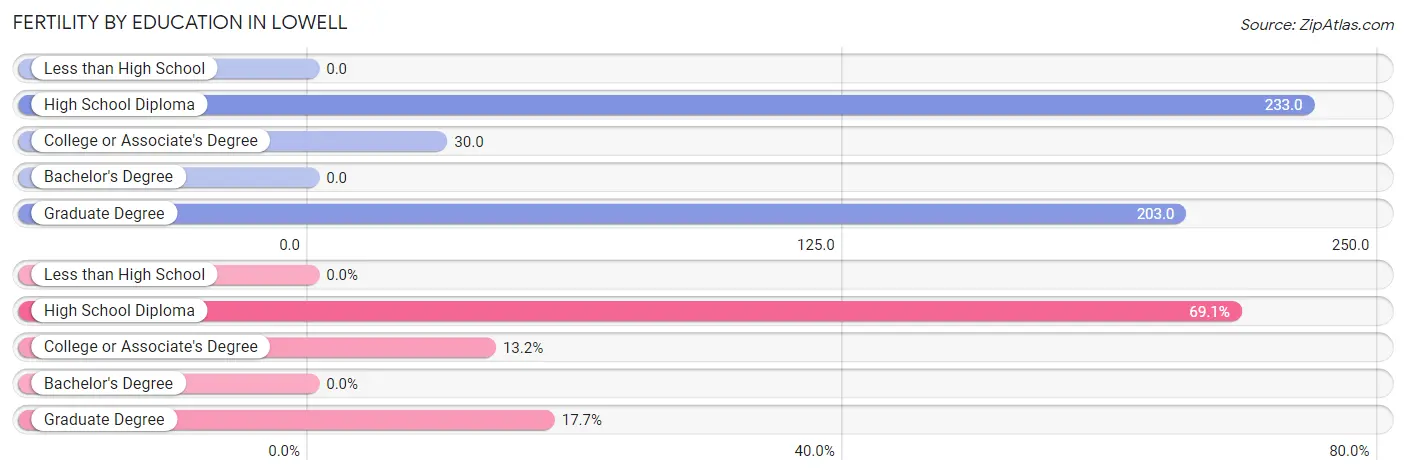
| Educational Attainment | Women with Births | Births / 1,000 Women |
| Less than High School | 0 (0.0%) | 0.0 |
| High School Diploma | 47 (69.1%) | 233.0 |
| College or Associate's Degree | 9 (13.2%) | 30.0 |
| Bachelor's Degree | 0 (0.0%) | 0.0 |
| Graduate Degree | 12 (17.6%) | 203.0 |
| Total | 68 (100.0%) | 84.0 |
Fertility by Education by Marriage Status in Lowell
64.7% of women with births in Lowell are unmarried. Women with the educational attainment of high school diploma are most likely to be married with 51.1% of them married at childbirth, while women with the educational attainment of college or associate's degree are least likely to be married with 100.0% of them unmarried at childbirth.
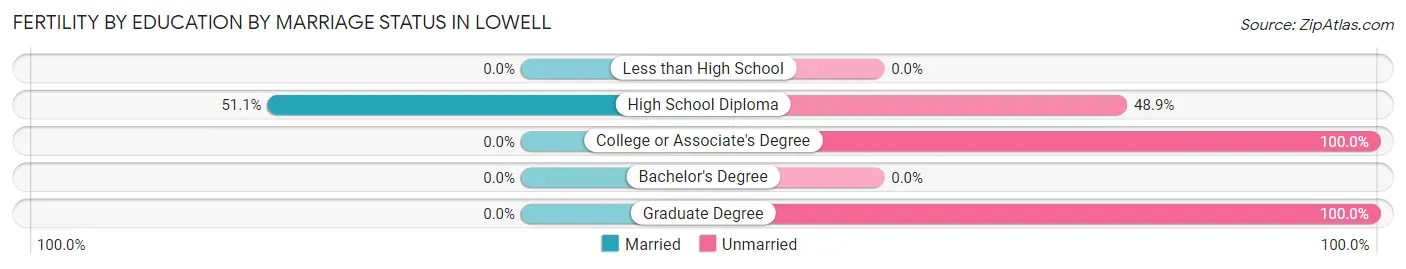
| Educational Attainment | Married | Unmarried |
| Less than High School | 0 (0.0%) | 0 (0.0%) |
| High School Diploma | 24 (51.1%) | 23 (48.9%) |
| College or Associate's Degree | 0 (0.0%) | 9 (100.0%) |
| Bachelor's Degree | 0 (0.0%) | 0 (0.0%) |
| Graduate Degree | 0 (0.0%) | 12 (100.0%) |
| Total | 24 (35.3%) | 44 (64.7%) |
Employment Characteristics in Lowell
Employment by Class of Employer in Lowell
Among the 1,712 employed individuals in Lowell, private company employees (1,241 | 72.5%), not-for-profit organizations (160 | 9.3%), and local government employees (101 | 5.9%) make up the most common classes of employment.
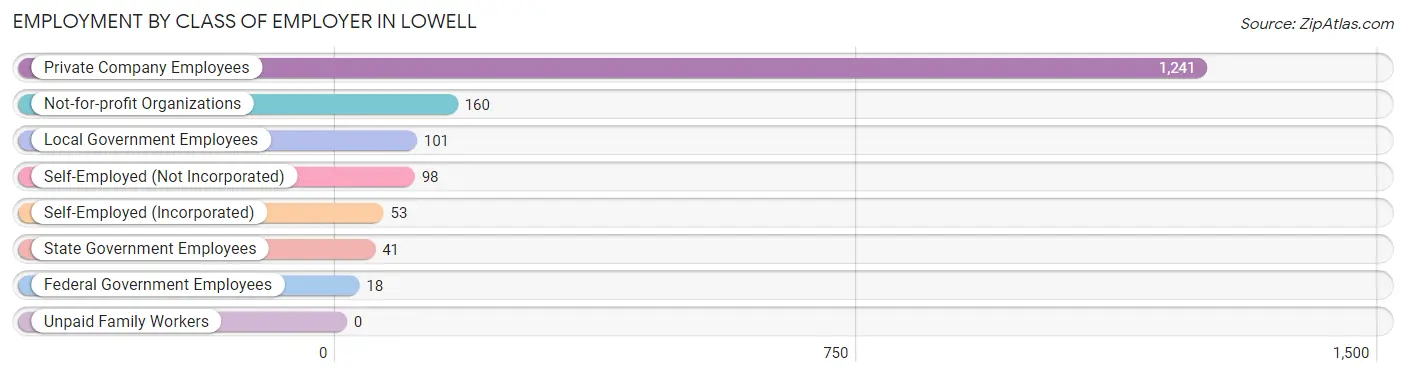
| Employer Class | # Employees | % Employees |
| Private Company Employees | 1,241 | 72.5% |
| Self-Employed (Incorporated) | 53 | 3.1% |
| Self-Employed (Not Incorporated) | 98 | 5.7% |
| Not-for-profit Organizations | 160 | 9.3% |
| Local Government Employees | 101 | 5.9% |
| State Government Employees | 41 | 2.4% |
| Federal Government Employees | 18 | 1.1% |
| Unpaid Family Workers | 0 | 0.0% |
| Total | 1,712 | 100.0% |
Employment Status by Age in Lowell
According to the labor force statistics for Lowell, out of the total population over 16 years of age (2,958), 65.7% or 1,943 individuals are in the labor force, with 4.5% or 87 of them unemployed. The age group with the highest labor force participation rate is 25 to 29 years, with 90.6% or 213 individuals in the labor force. Within the labor force, the 60 to 64 years age range has the highest percentage of unemployed individuals, with 25.4% or 32 of them being unemployed.
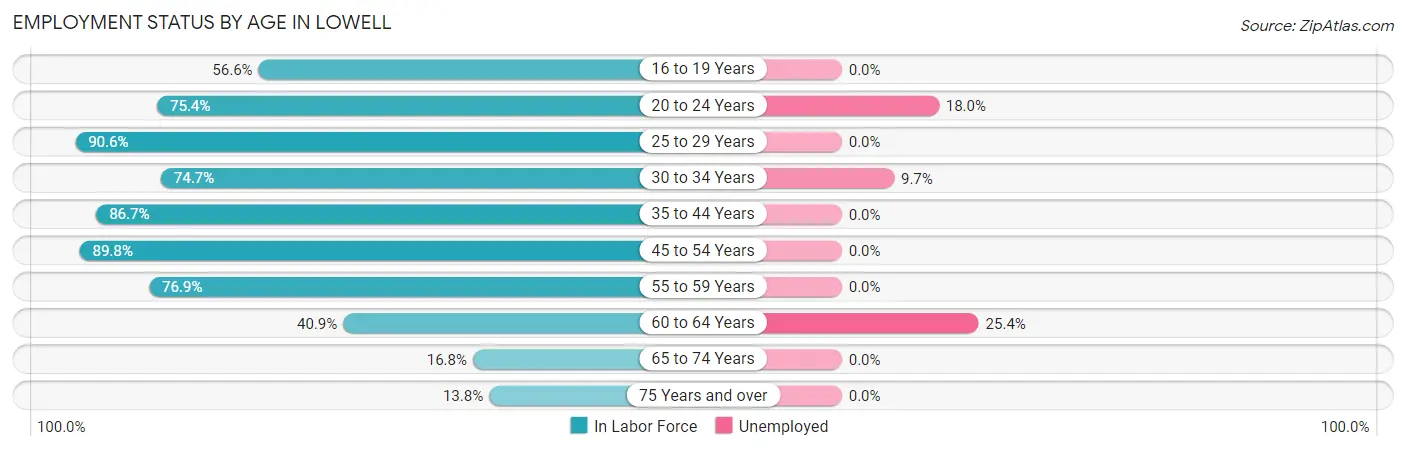
| Age Bracket | In Labor Force | Unemployed |
| 16 to 19 Years | 60 (56.6%) | 0 (0.0%) |
| 20 to 24 Years | 205 (75.4%) | 37 (18.0%) |
| 25 to 29 Years | 213 (90.6%) | 0 (0.0%) |
| 30 to 34 Years | 195 (74.7%) | 19 (9.7%) |
| 35 to 44 Years | 444 (86.7%) | 0 (0.0%) |
| 45 to 54 Years | 378 (89.8%) | 0 (0.0%) |
| 55 to 59 Years | 237 (76.9%) | 0 (0.0%) |
| 60 to 64 Years | 126 (40.9%) | 32 (25.4%) |
| 65 to 74 Years | 68 (16.8%) | 0 (0.0%) |
| 75 Years and over | 18 (13.8%) | 0 (0.0%) |
| Total | 1,943 (65.7%) | 87 (4.5%) |
Employment Status by Educational Attainment in Lowell
According to labor force statistics for Lowell, 77.9% of individuals (1,593) out of the total population between 25 and 64 years of age (2,045) are in the labor force, with 3.2% or 51 of them being unemployed. The group with the highest labor force participation rate are those with the educational attainment of bachelor's degree or higher, with 79.3% or 268 individuals in the labor force. Within the labor force, individuals with bachelor's degree or higher education have the highest percentage of unemployment, with 7.1% or 19 of them being unemployed.
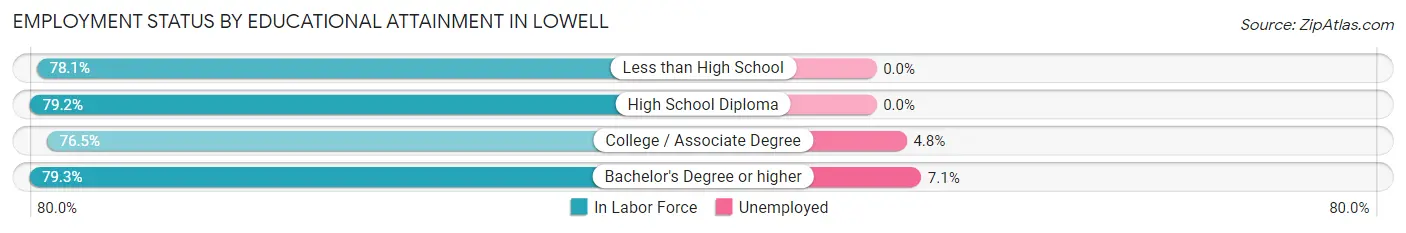
| Educational Attainment | In Labor Force | Unemployed |
| Less than High School | 196 (78.1%) | 0 (0.0%) |
| High School Diploma | 457 (79.2%) | 0 (0.0%) |
| College / Associate Degree | 672 (76.5%) | 42 (4.8%) |
| Bachelor's Degree or higher | 268 (79.3%) | 24 (7.1%) |
| Total | 1,593 (77.9%) | 65 (3.2%) |
Employment Occupations by Sex in Lowell
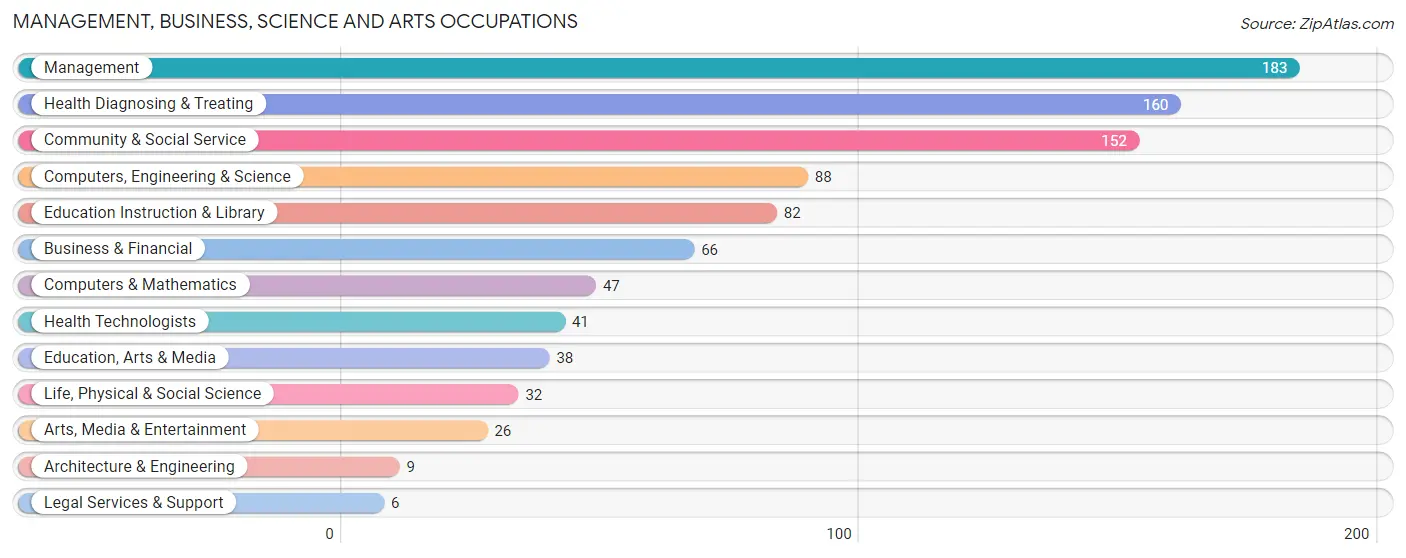
Management, Business, Science and Arts Occupations
The most common Management, Business, Science and Arts occupations in Lowell are Management (183 | 9.9%), Health Diagnosing & Treating (160 | 8.6%), Community & Social Service (152 | 8.2%), Computers, Engineering & Science (88 | 4.7%), and Education Instruction & Library (82 | 4.4%).
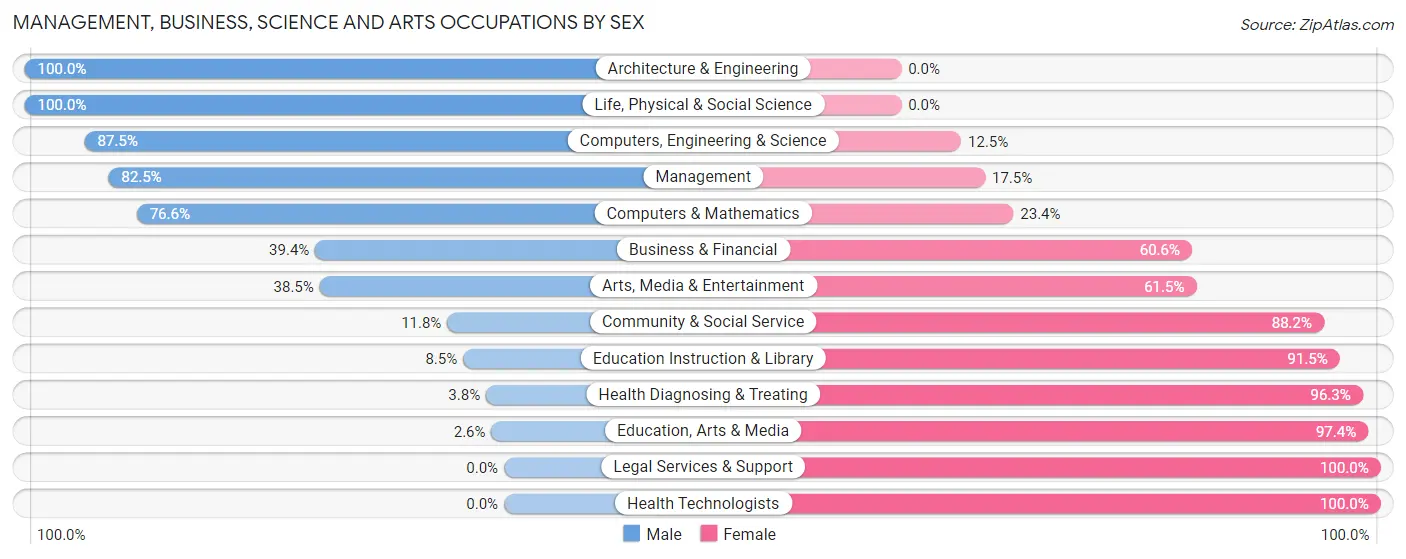
Management, Business, Science and Arts Occupations by Sex
Within the Management, Business, Science and Arts occupations in Lowell, the most male-oriented occupations are Architecture & Engineering (100.0%), Life, Physical & Social Science (100.0%), and Computers, Engineering & Science (87.5%), while the most female-oriented occupations are Legal Services & Support (100.0%), Health Technologists (100.0%), and Education, Arts & Media (97.4%).
| Occupation | Male | Female |
| Management | 151 (82.5%) | 32 (17.5%) |
| Business & Financial | 26 (39.4%) | 40 (60.6%) |
| Computers, Engineering & Science | 77 (87.5%) | 11 (12.5%) |
| Computers & Mathematics | 36 (76.6%) | 11 (23.4%) |
| Architecture & Engineering | 9 (100.0%) | 0 (0.0%) |
| Life, Physical & Social Science | 32 (100.0%) | 0 (0.0%) |
| Community & Social Service | 18 (11.8%) | 134 (88.2%) |
| Education, Arts & Media | 1 (2.6%) | 37 (97.4%) |
| Legal Services & Support | 0 (0.0%) | 6 (100.0%) |
| Education Instruction & Library | 7 (8.5%) | 75 (91.5%) |
| Arts, Media & Entertainment | 10 (38.5%) | 16 (61.5%) |
| Health Diagnosing & Treating | 6 (3.7%) | 154 (96.3%) |
| Health Technologists | 0 (0.0%) | 41 (100.0%) |
| Total (Category) | 278 (42.8%) | 371 (57.2%) |
| Total (Overall) | 968 (52.2%) | 888 (47.8%) |
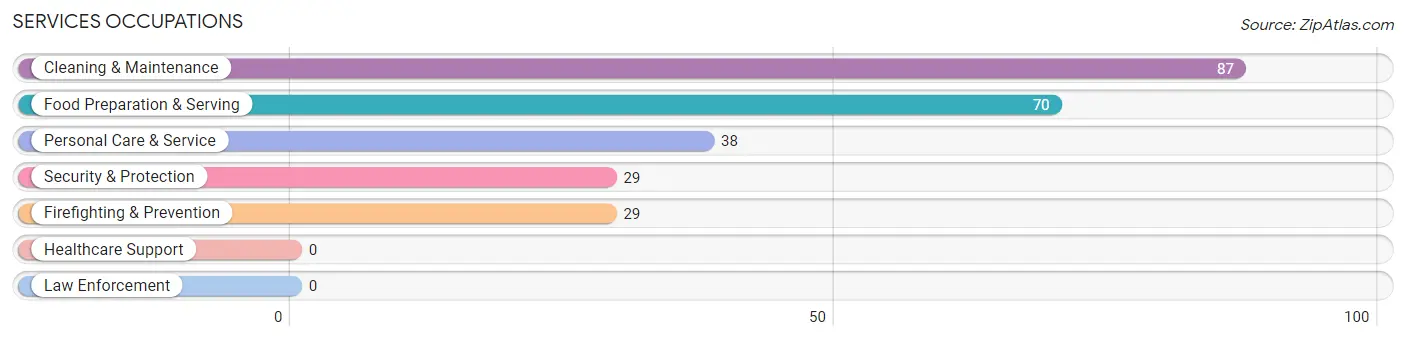
Services Occupations
The most common Services occupations in Lowell are Cleaning & Maintenance (87 | 4.7%), Food Preparation & Serving (70 | 3.8%), Personal Care & Service (38 | 2.1%), Security & Protection (29 | 1.6%), and Firefighting & Prevention (29 | 1.6%).
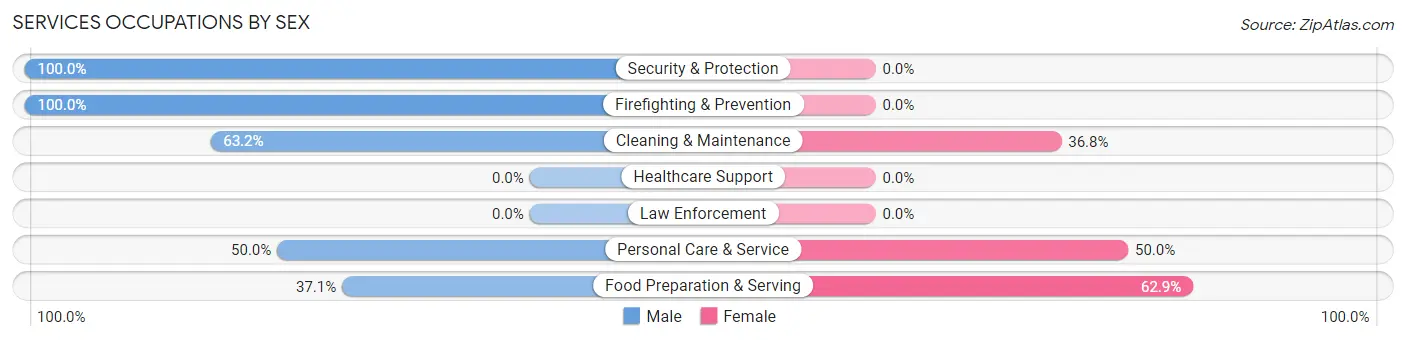
Services Occupations by Sex
Within the Services occupations in Lowell, the most male-oriented occupations are Security & Protection (100.0%), Firefighting & Prevention (100.0%), and Cleaning & Maintenance (63.2%), while the most female-oriented occupations are Food Preparation & Serving (62.9%), Personal Care & Service (50.0%), and Cleaning & Maintenance (36.8%).
| Occupation | Male | Female |
| Healthcare Support | 0 (0.0%) | 0 (0.0%) |
| Security & Protection | 29 (100.0%) | 0 (0.0%) |
| Firefighting & Prevention | 29 (100.0%) | 0 (0.0%) |
| Law Enforcement | 0 (0.0%) | 0 (0.0%) |
| Food Preparation & Serving | 26 (37.1%) | 44 (62.9%) |
| Cleaning & Maintenance | 55 (63.2%) | 32 (36.8%) |
| Personal Care & Service | 19 (50.0%) | 19 (50.0%) |
| Total (Category) | 129 (57.6%) | 95 (42.4%) |
| Total (Overall) | 968 (52.2%) | 888 (47.8%) |
Sales and Office Occupations
The most common Sales and Office occupations in Lowell are Office & Administration (238 | 12.8%), and Sales & Related (214 | 11.5%).

Sales and Office Occupations by Sex
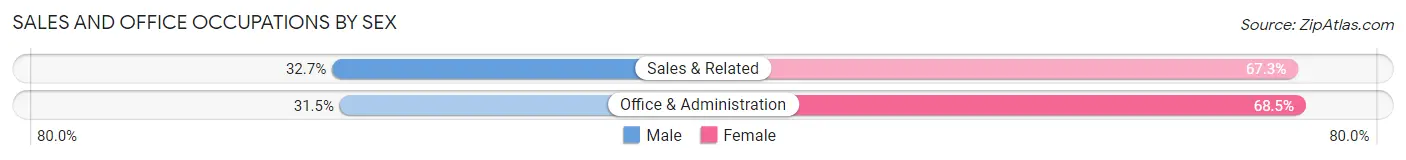
| Occupation | Male | Female |
| Sales & Related | 70 (32.7%) | 144 (67.3%) |
| Office & Administration | 75 (31.5%) | 163 (68.5%) |
| Total (Category) | 145 (32.1%) | 307 (67.9%) |
| Total (Overall) | 968 (52.2%) | 888 (47.8%) |
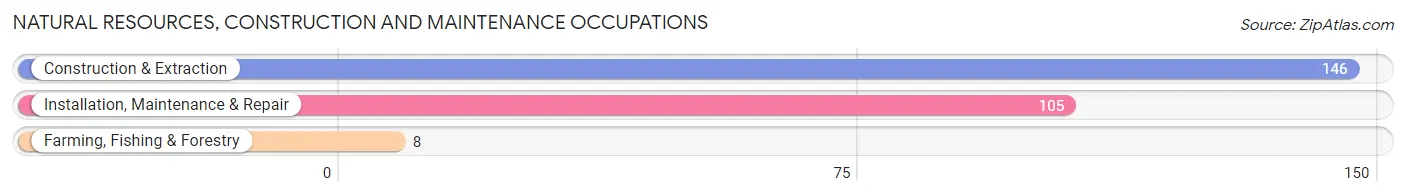
Natural Resources, Construction and Maintenance Occupations
The most common Natural Resources, Construction and Maintenance occupations in Lowell are Construction & Extraction (146 | 7.9%), Installation, Maintenance & Repair (105 | 5.7%), and Farming, Fishing & Forestry (8 | 0.4%).
Natural Resources, Construction and Maintenance Occupations by Sex
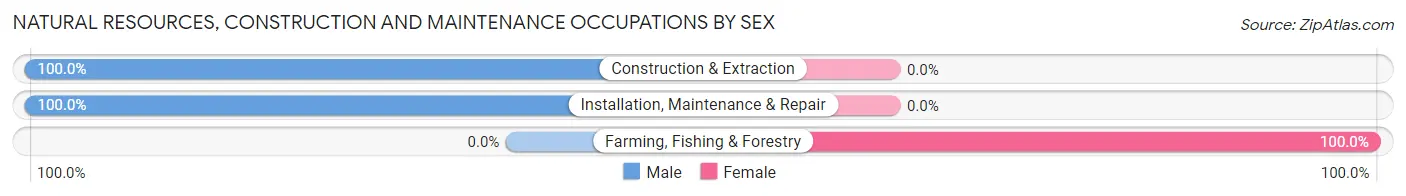
| Occupation | Male | Female |
| Farming, Fishing & Forestry | 0 (0.0%) | 8 (100.0%) |
| Construction & Extraction | 146 (100.0%) | 0 (0.0%) |
| Installation, Maintenance & Repair | 105 (100.0%) | 0 (0.0%) |
| Total (Category) | 251 (96.9%) | 8 (3.1%) |
| Total (Overall) | 968 (52.2%) | 888 (47.8%) |
Production, Transportation and Moving Occupations
The most common Production, Transportation and Moving occupations in Lowell are Production (125 | 6.7%), Material Moving (101 | 5.4%), and Transportation (46 | 2.5%).
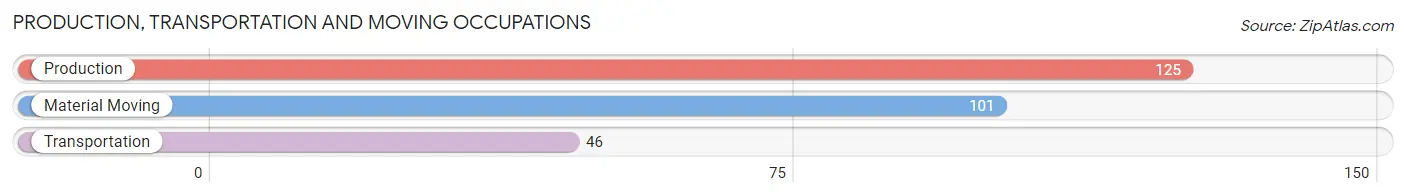
Production, Transportation and Moving Occupations by Sex
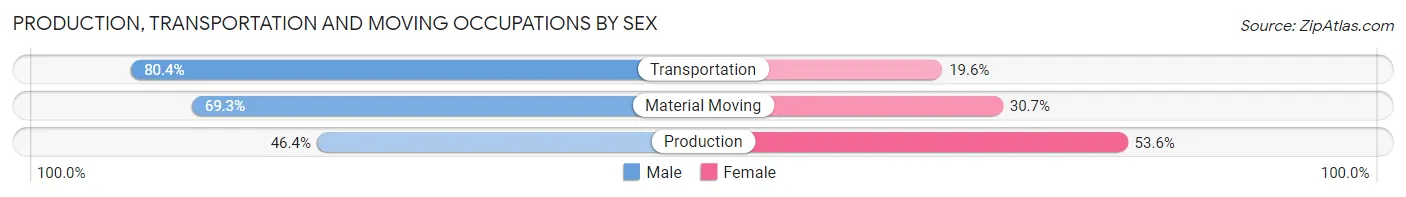
| Occupation | Male | Female |
| Production | 58 (46.4%) | 67 (53.6%) |
| Transportation | 37 (80.4%) | 9 (19.6%) |
| Material Moving | 70 (69.3%) | 31 (30.7%) |
| Total (Category) | 165 (60.7%) | 107 (39.3%) |
| Total (Overall) | 968 (52.2%) | 888 (47.8%) |
Employment Industries by Sex in Lowell
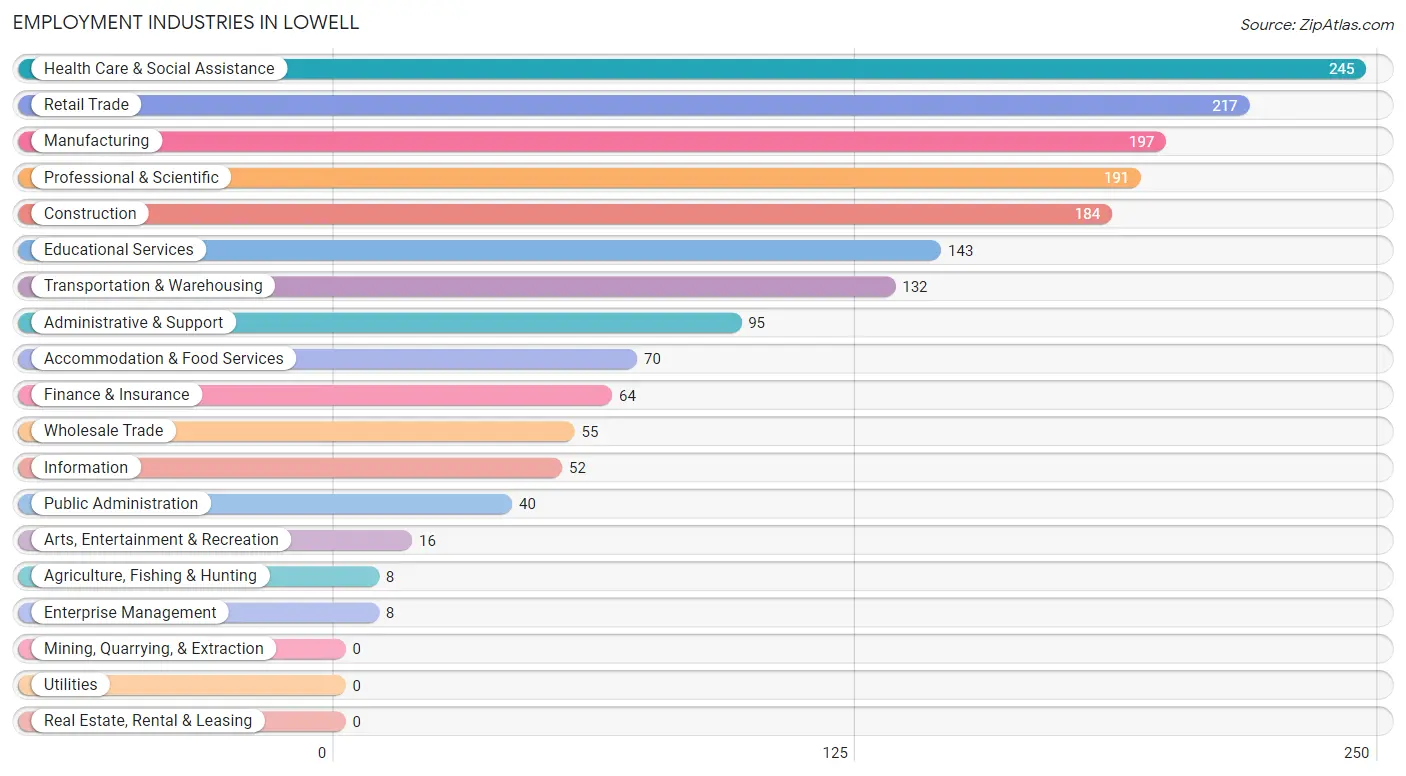
Employment Industries in Lowell
The major employment industries in Lowell include Health Care & Social Assistance (245 | 13.2%), Retail Trade (217 | 11.7%), Manufacturing (197 | 10.6%), Professional & Scientific (191 | 10.3%), and Construction (184 | 9.9%).
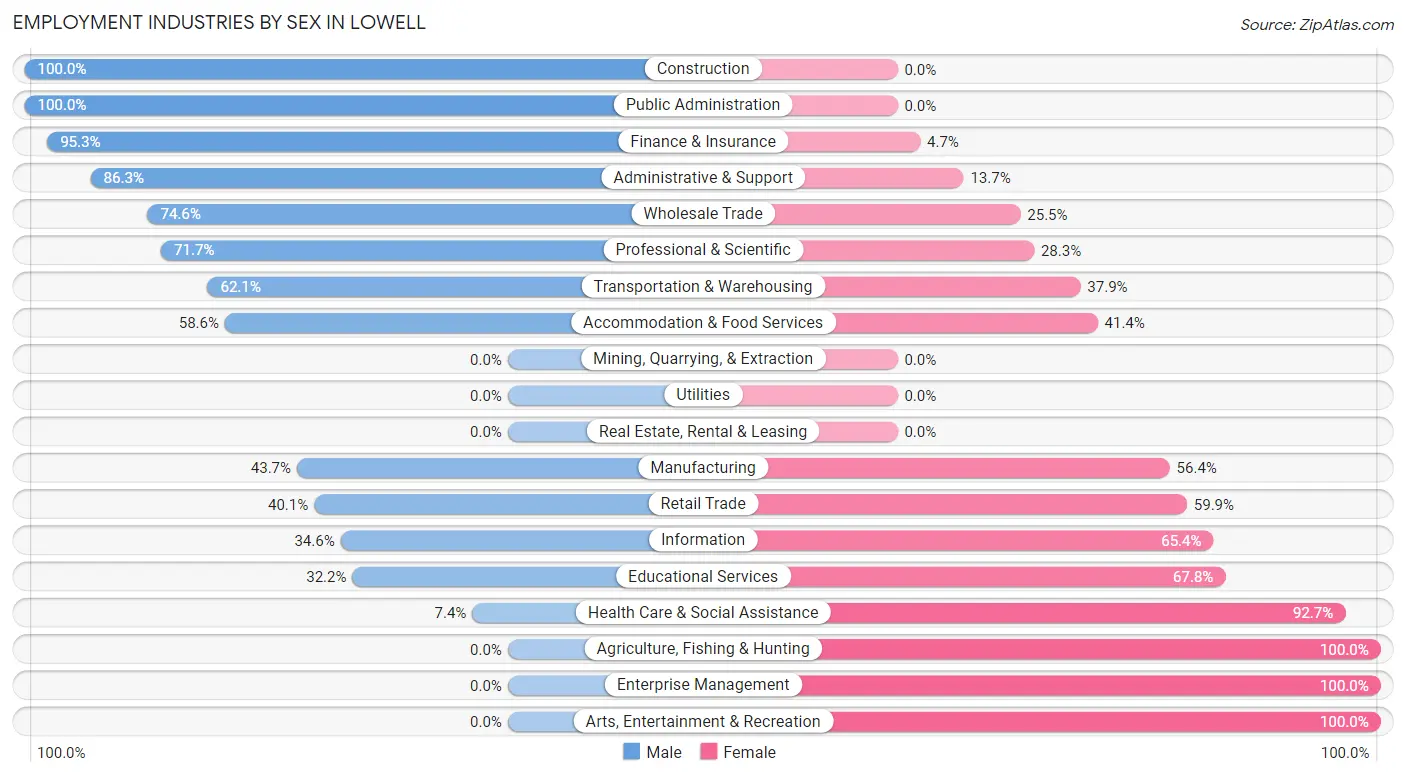
Employment Industries by Sex in Lowell
The Lowell industries that see more men than women are Construction (100.0%), Public Administration (100.0%), and Finance & Insurance (95.3%), whereas the industries that tend to have a higher number of women are Agriculture, Fishing & Hunting (100.0%), Enterprise Management (100.0%), and Arts, Entertainment & Recreation (100.0%).
| Industry | Male | Female |
| Agriculture, Fishing & Hunting | 0 (0.0%) | 8 (100.0%) |
| Mining, Quarrying, & Extraction | 0 (0.0%) | 0 (0.0%) |
| Construction | 184 (100.0%) | 0 (0.0%) |
| Manufacturing | 86 (43.6%) | 111 (56.4%) |
| Wholesale Trade | 41 (74.6%) | 14 (25.5%) |
| Retail Trade | 87 (40.1%) | 130 (59.9%) |
| Transportation & Warehousing | 82 (62.1%) | 50 (37.9%) |
| Utilities | 0 (0.0%) | 0 (0.0%) |
| Information | 18 (34.6%) | 34 (65.4%) |
| Finance & Insurance | 61 (95.3%) | 3 (4.7%) |
| Real Estate, Rental & Leasing | 0 (0.0%) | 0 (0.0%) |
| Professional & Scientific | 137 (71.7%) | 54 (28.3%) |
| Enterprise Management | 0 (0.0%) | 8 (100.0%) |
| Administrative & Support | 82 (86.3%) | 13 (13.7%) |
| Educational Services | 46 (32.2%) | 97 (67.8%) |
| Health Care & Social Assistance | 18 (7.3%) | 227 (92.6%) |
| Arts, Entertainment & Recreation | 0 (0.0%) | 16 (100.0%) |
| Accommodation & Food Services | 41 (58.6%) | 29 (41.4%) |
| Public Administration | 40 (100.0%) | 0 (0.0%) |
| Total | 968 (52.2%) | 888 (47.8%) |
Education in Lowell
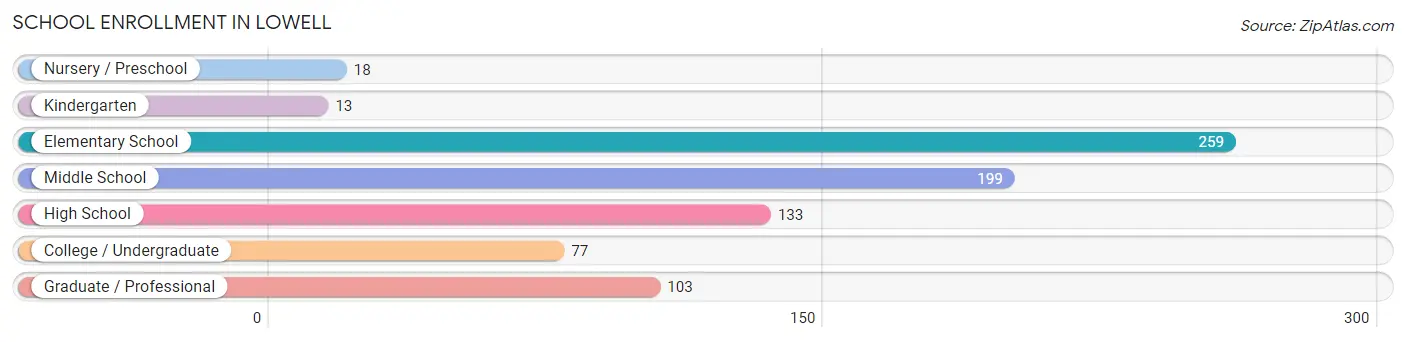
School Enrollment in Lowell
The most common levels of schooling among the 802 students in Lowell are elementary school (259 | 32.3%), middle school (199 | 24.8%), and high school (133 | 16.6%).
| School Level | # Students | % Students |
| Nursery / Preschool | 18 | 2.2% |
| Kindergarten | 13 | 1.6% |
| Elementary School | 259 | 32.3% |
| Middle School | 199 | 24.8% |
| High School | 133 | 16.6% |
| College / Undergraduate | 77 | 9.6% |
| Graduate / Professional | 103 | 12.8% |
| Total | 802 | 100.0% |
School Enrollment by Age by Funding Source in Lowell
Out of a total of 802 students who are enrolled in schools in Lowell, 187 (23.3%) attend a private institution, while the remaining 615 (76.7%) are enrolled in public schools. The age group of 25 to 34 year olds has the highest likelihood of being enrolled in private schools, with 14 (100.0% in the age bracket) enrolled. Conversely, the age group of 20 to 24 year olds has the lowest likelihood of being enrolled in a private school, with 129 (100.0% in the age bracket) attending a public institution.
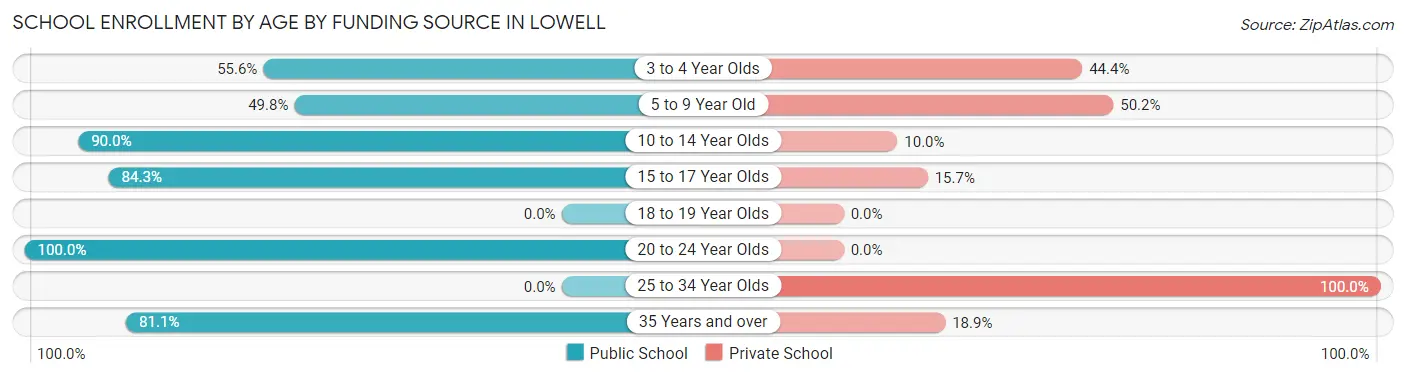
| Age Bracket | Public School | Private School |
| 3 to 4 Year Olds | 10 (55.6%) | 8 (44.4%) |
| 5 to 9 Year Old | 115 (49.8%) | 116 (50.2%) |
| 10 to 14 Year Olds | 261 (90.0%) | 29 (10.0%) |
| 15 to 17 Year Olds | 70 (84.3%) | 13 (15.7%) |
| 18 to 19 Year Olds | 0 (0.0%) | 0 (0.0%) |
| 20 to 24 Year Olds | 129 (100.0%) | 0 (0.0%) |
| 25 to 34 Year Olds | 0 (0.0%) | 14 (100.0%) |
| 35 Years and over | 30 (81.1%) | 7 (18.9%) |
| Total | 615 (76.7%) | 187 (23.3%) |
Educational Attainment by Field of Study in Lowell
Business (89 | 21.2%), science & technology (70 | 16.7%), engineering (44 | 10.5%), arts & humanities (44 | 10.5%), and education (31 | 7.4%) are the most common fields of study among 419 individuals in Lowell who have obtained a bachelor's degree or higher.
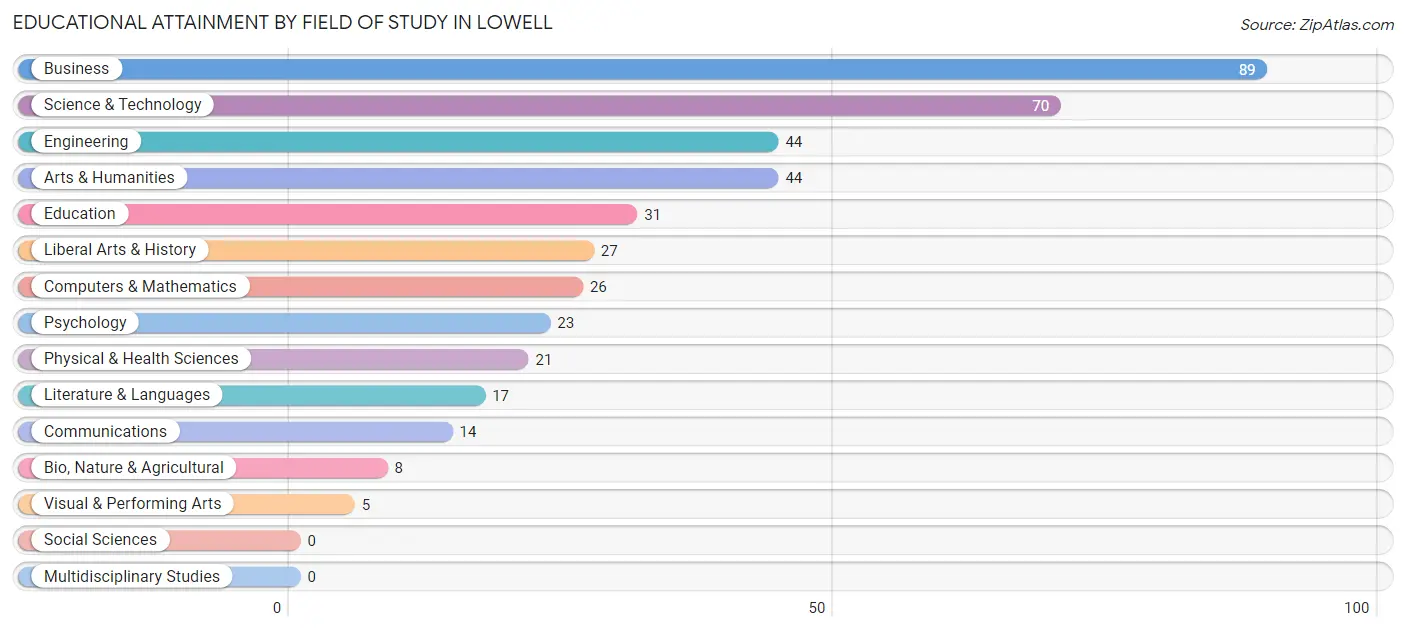
| Field of Study | # Graduates | % Graduates |
| Computers & Mathematics | 26 | 6.2% |
| Bio, Nature & Agricultural | 8 | 1.9% |
| Physical & Health Sciences | 21 | 5.0% |
| Psychology | 23 | 5.5% |
| Social Sciences | 0 | 0.0% |
| Engineering | 44 | 10.5% |
| Multidisciplinary Studies | 0 | 0.0% |
| Science & Technology | 70 | 16.7% |
| Business | 89 | 21.2% |
| Education | 31 | 7.4% |
| Literature & Languages | 17 | 4.1% |
| Liberal Arts & History | 27 | 6.4% |
| Visual & Performing Arts | 5 | 1.2% |
| Communications | 14 | 3.3% |
| Arts & Humanities | 44 | 10.5% |
| Total | 419 | 100.0% |
Transportation & Commute in Lowell
Vehicle Availability by Sex in Lowell
The most prevalent vehicle ownership categories in Lowell are males with 3 vehicles (321, accounting for 36.4%) and females with 3 vehicles (228, making up 38.6%).
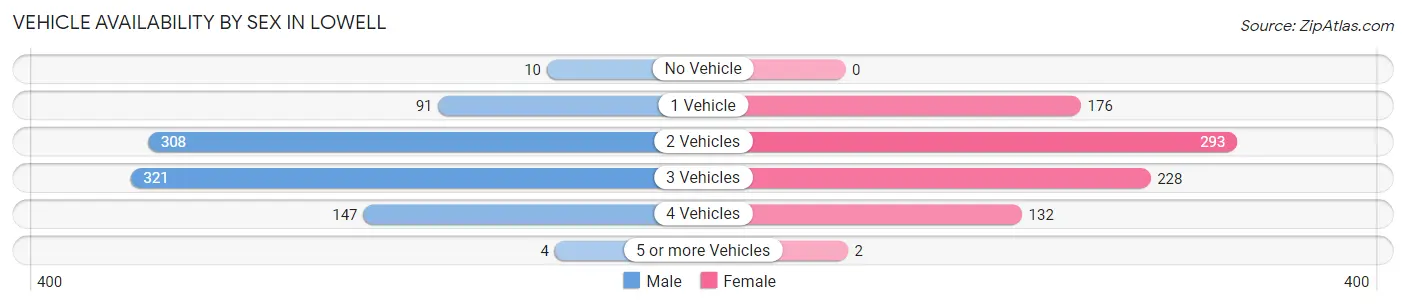
| Vehicles Available | Male | Female |
| No Vehicle | 10 (1.1%) | 0 (0.0%) |
| 1 Vehicle | 91 (10.3%) | 176 (21.2%) |
| 2 Vehicles | 308 (35.0%) | 293 (35.3%) |
| 3 Vehicles | 321 (36.4%) | 228 (27.4%) |
| 4 Vehicles | 147 (16.7%) | 132 (15.9%) |
| 5 or more Vehicles | 4 (0.4%) | 2 (0.2%) |
| Total | 881 (100.0%) | 831 (100.0%) |
Commute Time in Lowell
The most frequently occuring commute durations in Lowell are 10 to 14 minutes (320 commuters, 20.8%), 20 to 24 minutes (315 commuters, 20.5%), and 15 to 19 minutes (220 commuters, 14.3%).
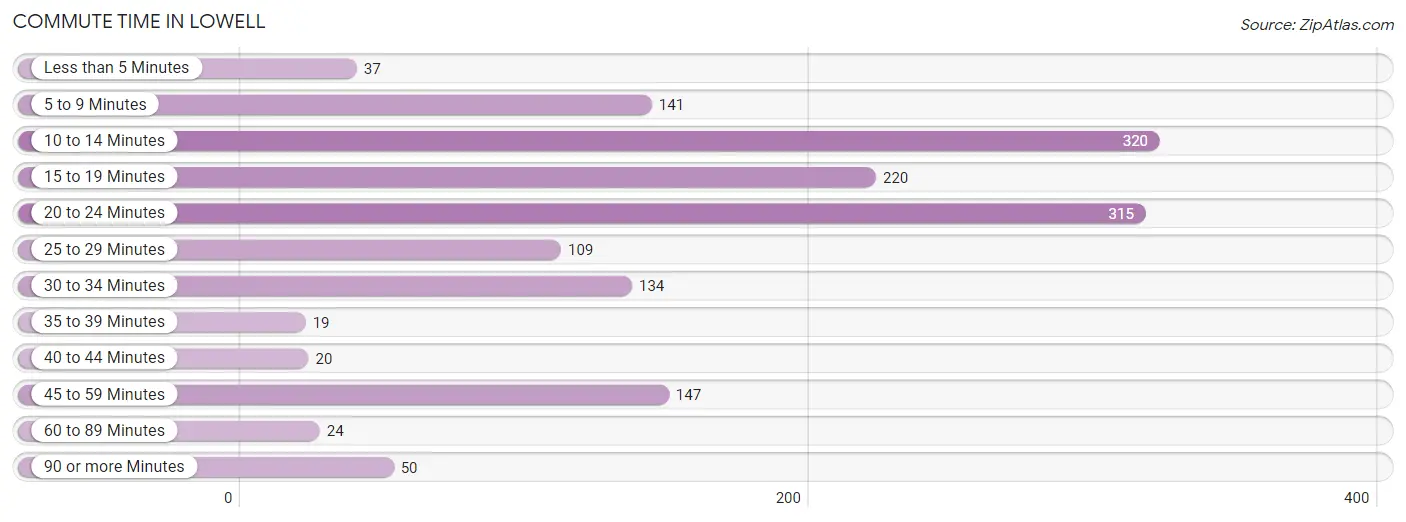
| Commute Time | # Commuters | % Commuters |
| Less than 5 Minutes | 37 | 2.4% |
| 5 to 9 Minutes | 141 | 9.2% |
| 10 to 14 Minutes | 320 | 20.8% |
| 15 to 19 Minutes | 220 | 14.3% |
| 20 to 24 Minutes | 315 | 20.5% |
| 25 to 29 Minutes | 109 | 7.1% |
| 30 to 34 Minutes | 134 | 8.7% |
| 35 to 39 Minutes | 19 | 1.2% |
| 40 to 44 Minutes | 20 | 1.3% |
| 45 to 59 Minutes | 147 | 9.6% |
| 60 to 89 Minutes | 24 | 1.6% |
| 90 or more Minutes | 50 | 3.3% |
Commute Time by Sex in Lowell
The most common commute times in Lowell are 20 to 24 minutes (221 commuters, 26.3%) for males and 10 to 14 minutes (211 commuters, 30.3%) for females.
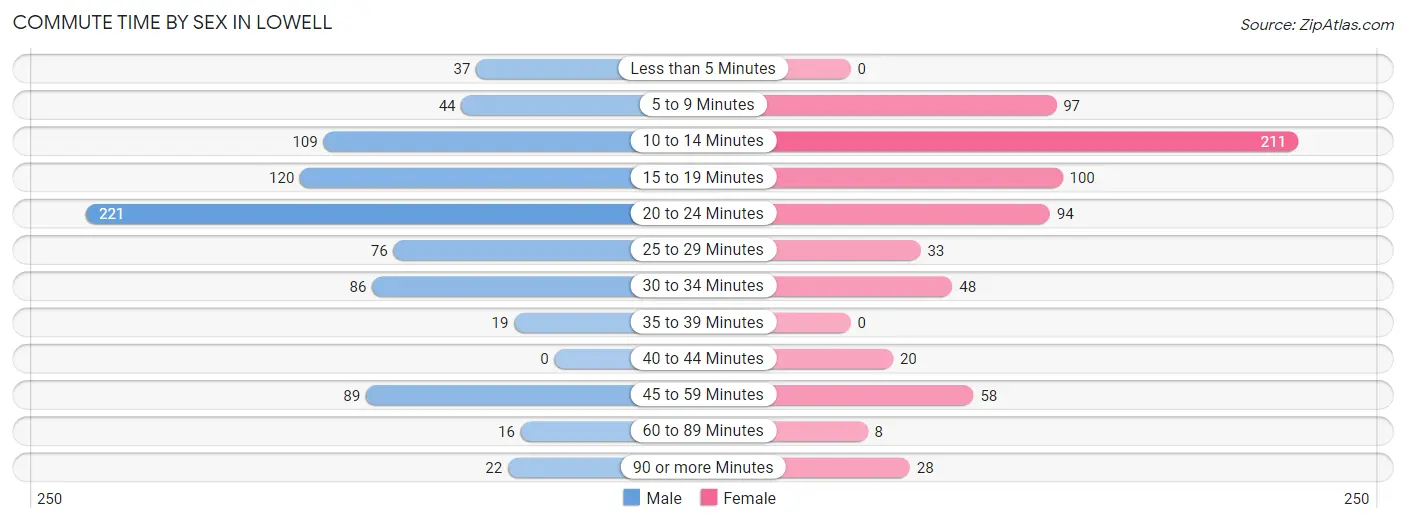
| Commute Time | Male | Female |
| Less than 5 Minutes | 37 (4.4%) | 0 (0.0%) |
| 5 to 9 Minutes | 44 (5.2%) | 97 (13.9%) |
| 10 to 14 Minutes | 109 (13.0%) | 211 (30.3%) |
| 15 to 19 Minutes | 120 (14.3%) | 100 (14.3%) |
| 20 to 24 Minutes | 221 (26.3%) | 94 (13.5%) |
| 25 to 29 Minutes | 76 (9.1%) | 33 (4.7%) |
| 30 to 34 Minutes | 86 (10.2%) | 48 (6.9%) |
| 35 to 39 Minutes | 19 (2.3%) | 0 (0.0%) |
| 40 to 44 Minutes | 0 (0.0%) | 20 (2.9%) |
| 45 to 59 Minutes | 89 (10.6%) | 58 (8.3%) |
| 60 to 89 Minutes | 16 (1.9%) | 8 (1.1%) |
| 90 or more Minutes | 22 (2.6%) | 28 (4.0%) |
Time of Departure to Work by Sex in Lowell
The most frequent times of departure to work in Lowell are 6:00 AM to 6:29 AM (140, 16.7%) for males and 6:30 AM to 6:59 AM (151, 21.7%) for females.
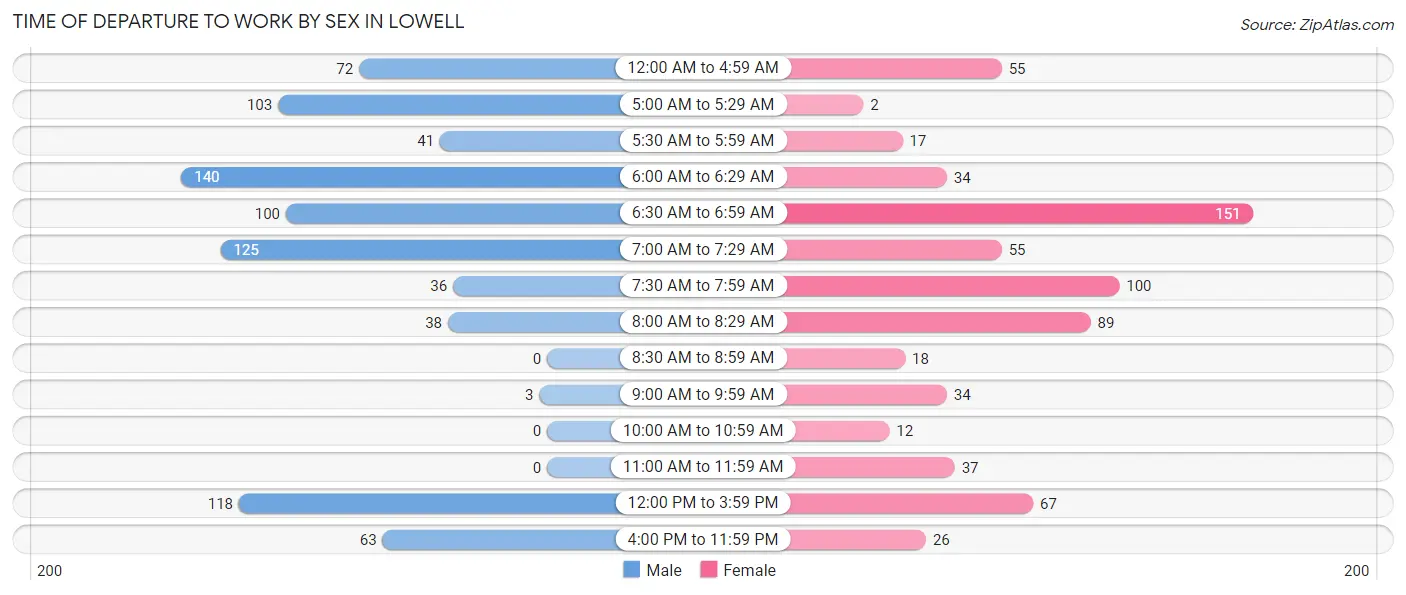
| Time of Departure | Male | Female |
| 12:00 AM to 4:59 AM | 72 (8.6%) | 55 (7.9%) |
| 5:00 AM to 5:29 AM | 103 (12.3%) | 2 (0.3%) |
| 5:30 AM to 5:59 AM | 41 (4.9%) | 17 (2.4%) |
| 6:00 AM to 6:29 AM | 140 (16.7%) | 34 (4.9%) |
| 6:30 AM to 6:59 AM | 100 (11.9%) | 151 (21.7%) |
| 7:00 AM to 7:29 AM | 125 (14.9%) | 55 (7.9%) |
| 7:30 AM to 7:59 AM | 36 (4.3%) | 100 (14.3%) |
| 8:00 AM to 8:29 AM | 38 (4.5%) | 89 (12.8%) |
| 8:30 AM to 8:59 AM | 0 (0.0%) | 18 (2.6%) |
| 9:00 AM to 9:59 AM | 3 (0.4%) | 34 (4.9%) |
| 10:00 AM to 10:59 AM | 0 (0.0%) | 12 (1.7%) |
| 11:00 AM to 11:59 AM | 0 (0.0%) | 37 (5.3%) |
| 12:00 PM to 3:59 PM | 118 (14.1%) | 67 (9.6%) |
| 4:00 PM to 11:59 PM | 63 (7.5%) | 26 (3.7%) |
| Total | 839 (100.0%) | 697 (100.0%) |
Housing Occupancy in Lowell
Occupancy by Ownership in Lowell
Of the total 1,487 dwellings in Lowell, owner-occupied units account for 1,063 (71.5%), while renter-occupied units make up 424 (28.5%).
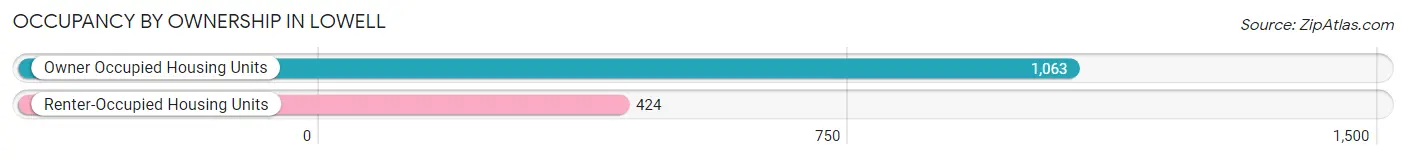
| Occupancy | # Housing Units | % Housing Units |
| Owner Occupied Housing Units | 1,063 | 71.5% |
| Renter-Occupied Housing Units | 424 | 28.5% |
| Total Occupied Housing Units | 1,487 | 100.0% |
Occupancy by Household Size in Lowell
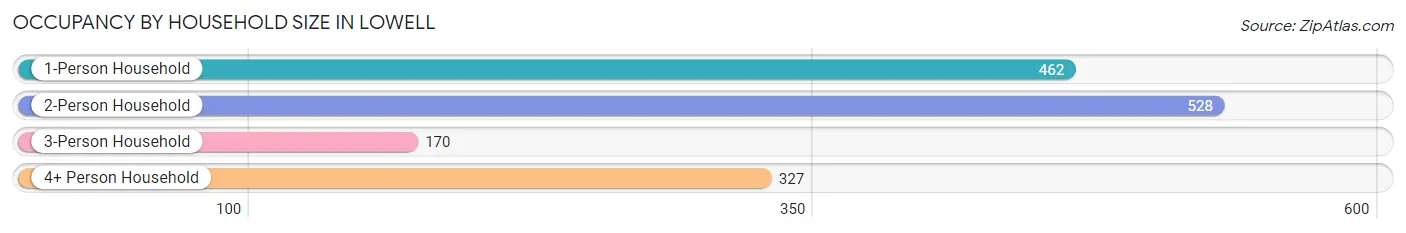
| Household Size | # Housing Units | % Housing Units |
| 1-Person Household | 462 | 31.1% |
| 2-Person Household | 528 | 35.5% |
| 3-Person Household | 170 | 11.4% |
| 4+ Person Household | 327 | 22.0% |
| Total Housing Units | 1,487 | 100.0% |
Occupancy by Ownership by Household Size in Lowell
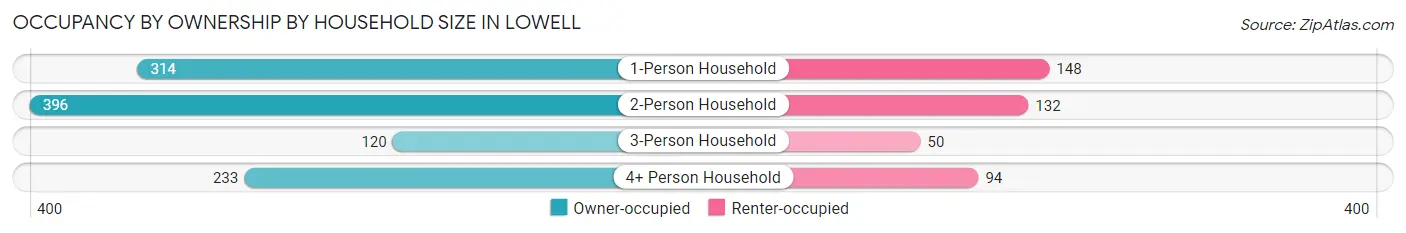
| Household Size | Owner-occupied | Renter-occupied |
| 1-Person Household | 314 (68.0%) | 148 (32.0%) |
| 2-Person Household | 396 (75.0%) | 132 (25.0%) |
| 3-Person Household | 120 (70.6%) | 50 (29.4%) |
| 4+ Person Household | 233 (71.3%) | 94 (28.7%) |
| Total Housing Units | 1,063 (71.5%) | 424 (28.5%) |
Occupancy by Educational Attainment in Lowell
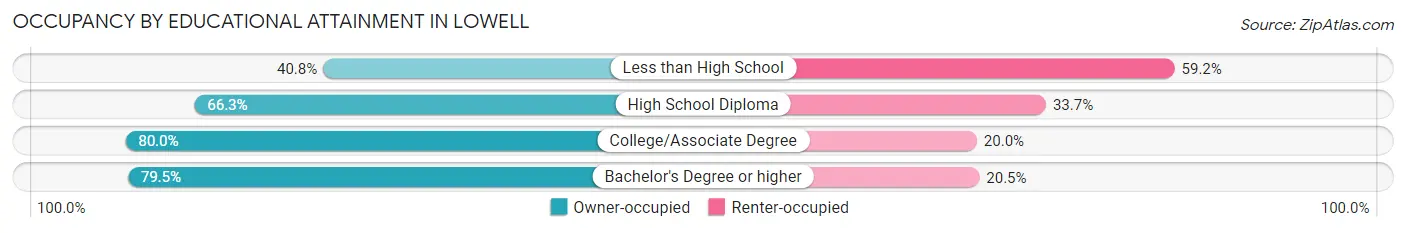
| Household Size | Owner-occupied | Renter-occupied |
| Less than High School | 89 (40.8%) | 129 (59.2%) |
| High School Diploma | 195 (66.3%) | 99 (33.7%) |
| College/Associate Degree | 573 (80.0%) | 143 (20.0%) |
| Bachelor's Degree or higher | 206 (79.5%) | 53 (20.5%) |
Occupancy by Age of Householder in Lowell
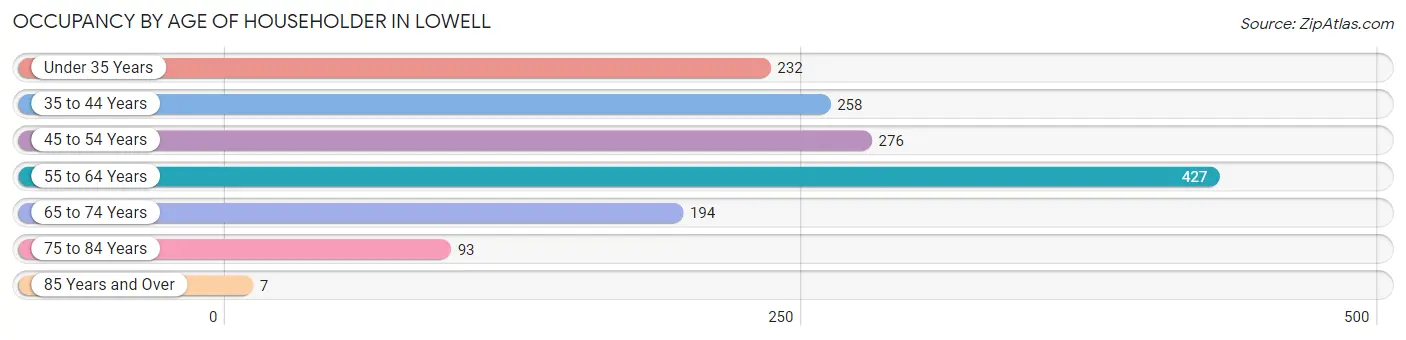
| Age Bracket | # Households | % Households |
| Under 35 Years | 232 | 15.6% |
| 35 to 44 Years | 258 | 17.3% |
| 45 to 54 Years | 276 | 18.6% |
| 55 to 64 Years | 427 | 28.7% |
| 65 to 74 Years | 194 | 13.1% |
| 75 to 84 Years | 93 | 6.2% |
| 85 Years and Over | 7 | 0.5% |
| Total | 1,487 | 100.0% |
Housing Finances in Lowell
Median Income by Occupancy in Lowell
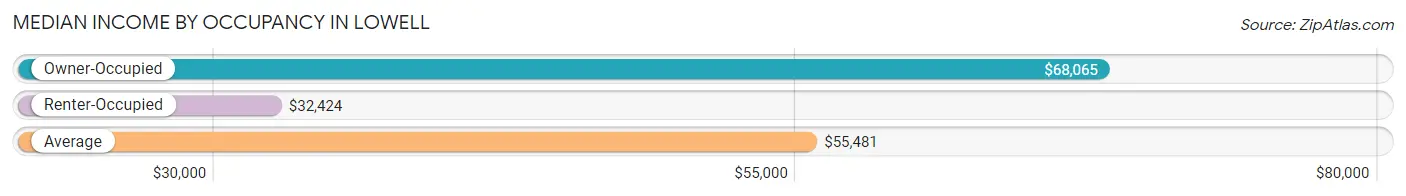
| Occupancy Type | # Households | Median Income |
| Owner-Occupied | 1,063 (71.5%) | $68,065 |
| Renter-Occupied | 424 (28.5%) | $32,424 |
| Average | 1,487 (100.0%) | $55,481 |
Occupancy by Householder Income Bracket in Lowell
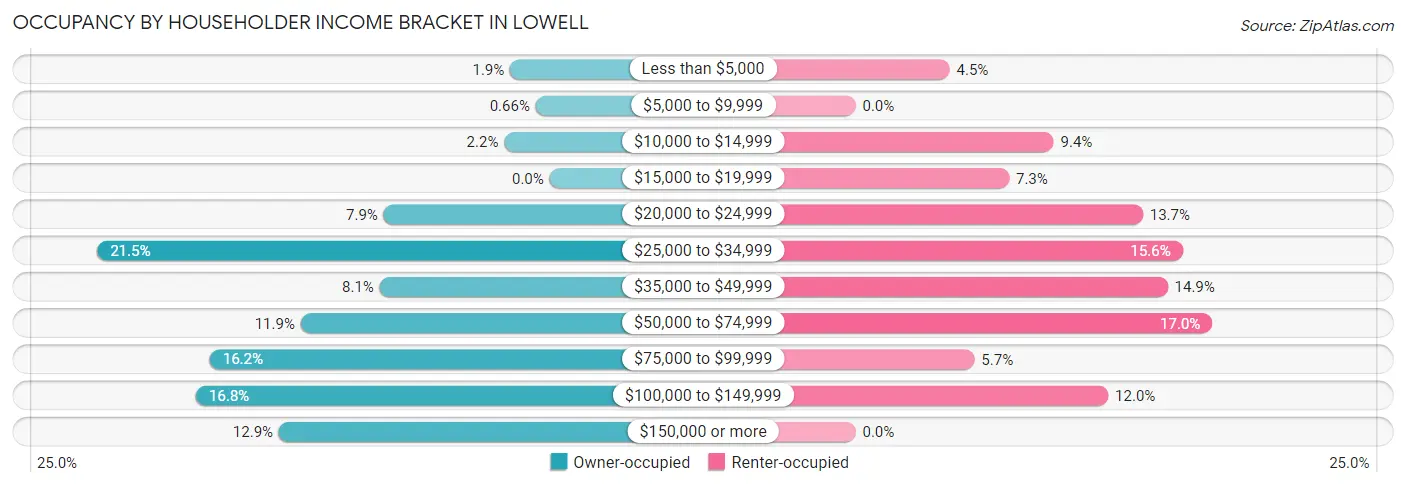
| Income Bracket | Owner-occupied | Renter-occupied |
| Less than $5,000 | 20 (1.9%) | 19 (4.5%) |
| $5,000 to $9,999 | 7 (0.7%) | 0 (0.0%) |
| $10,000 to $14,999 | 23 (2.2%) | 40 (9.4%) |
| $15,000 to $19,999 | 0 (0.0%) | 31 (7.3%) |
| $20,000 to $24,999 | 84 (7.9%) | 58 (13.7%) |
| $25,000 to $34,999 | 229 (21.5%) | 66 (15.6%) |
| $35,000 to $49,999 | 86 (8.1%) | 63 (14.9%) |
| $50,000 to $74,999 | 126 (11.8%) | 72 (17.0%) |
| $75,000 to $99,999 | 172 (16.2%) | 24 (5.7%) |
| $100,000 to $149,999 | 179 (16.8%) | 51 (12.0%) |
| $150,000 or more | 137 (12.9%) | 0 (0.0%) |
| Total | 1,063 (100.0%) | 424 (100.0%) |
Monthly Housing Cost Tiers in Lowell
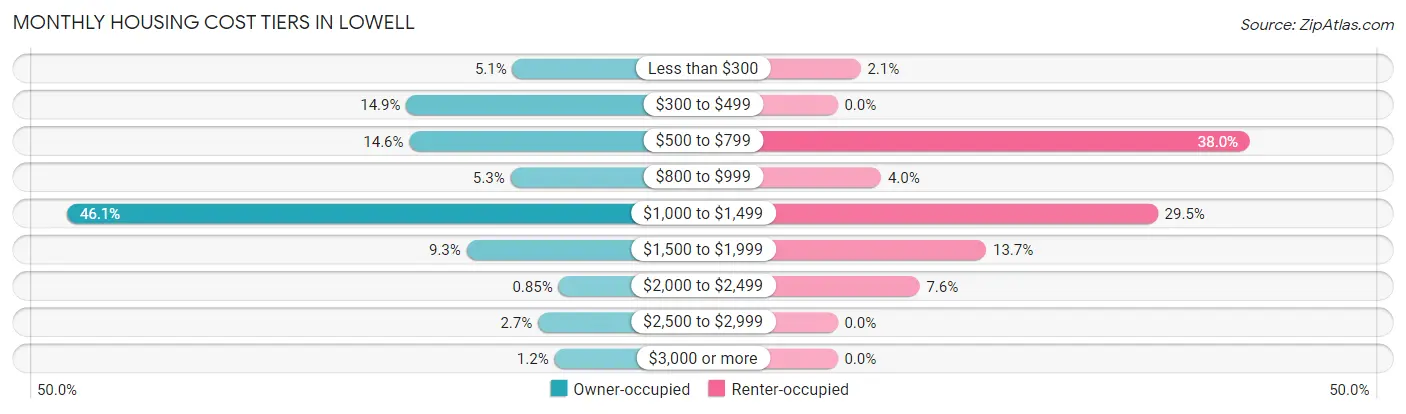
| Monthly Cost | Owner-occupied | Renter-occupied |
| Less than $300 | 54 (5.1%) | 9 (2.1%) |
| $300 to $499 | 158 (14.9%) | 0 (0.0%) |
| $500 to $799 | 155 (14.6%) | 161 (38.0%) |
| $800 to $999 | 56 (5.3%) | 17 (4.0%) |
| $1,000 to $1,499 | 490 (46.1%) | 125 (29.5%) |
| $1,500 to $1,999 | 99 (9.3%) | 58 (13.7%) |
| $2,000 to $2,499 | 9 (0.9%) | 32 (7.5%) |
| $2,500 to $2,999 | 29 (2.7%) | 0 (0.0%) |
| $3,000 or more | 13 (1.2%) | 0 (0.0%) |
| Total | 1,063 (100.0%) | 424 (100.0%) |
Physical Housing Characteristics in Lowell
Housing Structures in Lowell
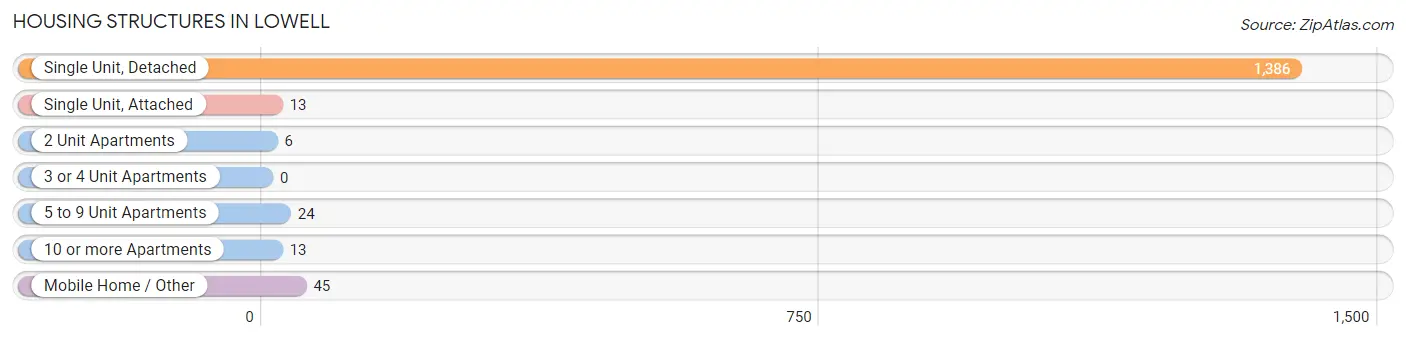
| Structure Type | # Housing Units | % Housing Units |
| Single Unit, Detached | 1,386 | 93.2% |
| Single Unit, Attached | 13 | 0.9% |
| 2 Unit Apartments | 6 | 0.4% |
| 3 or 4 Unit Apartments | 0 | 0.0% |
| 5 to 9 Unit Apartments | 24 | 1.6% |
| 10 or more Apartments | 13 | 0.9% |
| Mobile Home / Other | 45 | 3.0% |
| Total | 1,487 | 100.0% |
Housing Structures by Occupancy in Lowell
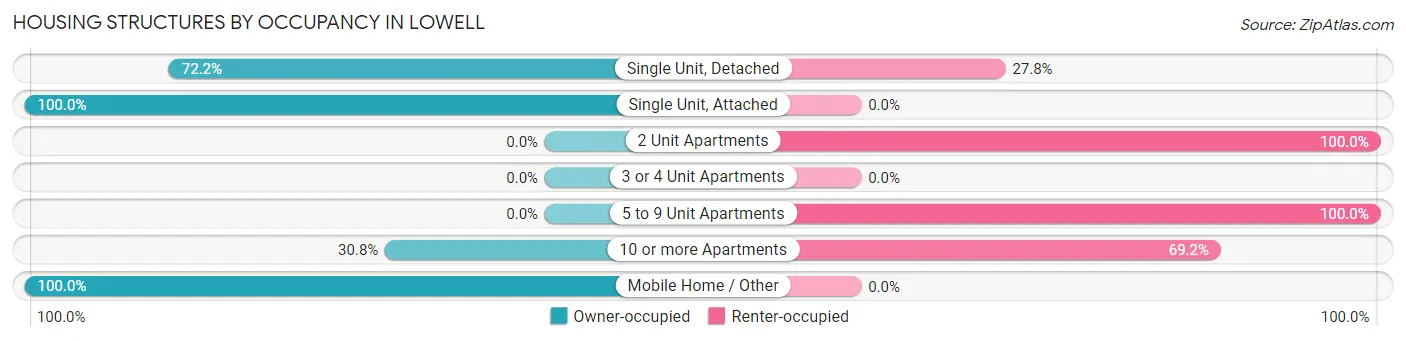
| Structure Type | Owner-occupied | Renter-occupied |
| Single Unit, Detached | 1,001 (72.2%) | 385 (27.8%) |
| Single Unit, Attached | 13 (100.0%) | 0 (0.0%) |
| 2 Unit Apartments | 0 (0.0%) | 6 (100.0%) |
| 3 or 4 Unit Apartments | 0 (0.0%) | 0 (0.0%) |
| 5 to 9 Unit Apartments | 0 (0.0%) | 24 (100.0%) |
| 10 or more Apartments | 4 (30.8%) | 9 (69.2%) |
| Mobile Home / Other | 45 (100.0%) | 0 (0.0%) |
| Total | 1,063 (71.5%) | 424 (28.5%) |
Housing Structures by Number of Rooms in Lowell
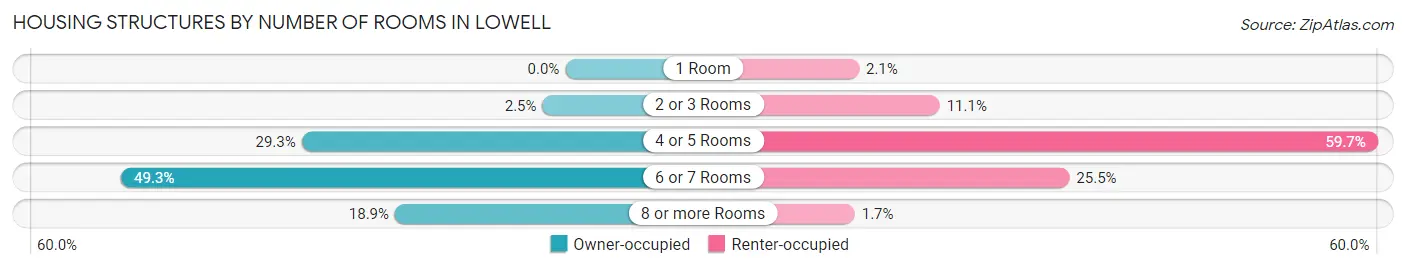
| Number of Rooms | Owner-occupied | Renter-occupied |
| 1 Room | 0 (0.0%) | 9 (2.1%) |
| 2 or 3 Rooms | 27 (2.5%) | 47 (11.1%) |
| 4 or 5 Rooms | 311 (29.3%) | 253 (59.7%) |
| 6 or 7 Rooms | 524 (49.3%) | 108 (25.5%) |
| 8 or more Rooms | 201 (18.9%) | 7 (1.7%) |
| Total | 1,063 (100.0%) | 424 (100.0%) |
Housing Structure by Heating Type in Lowell
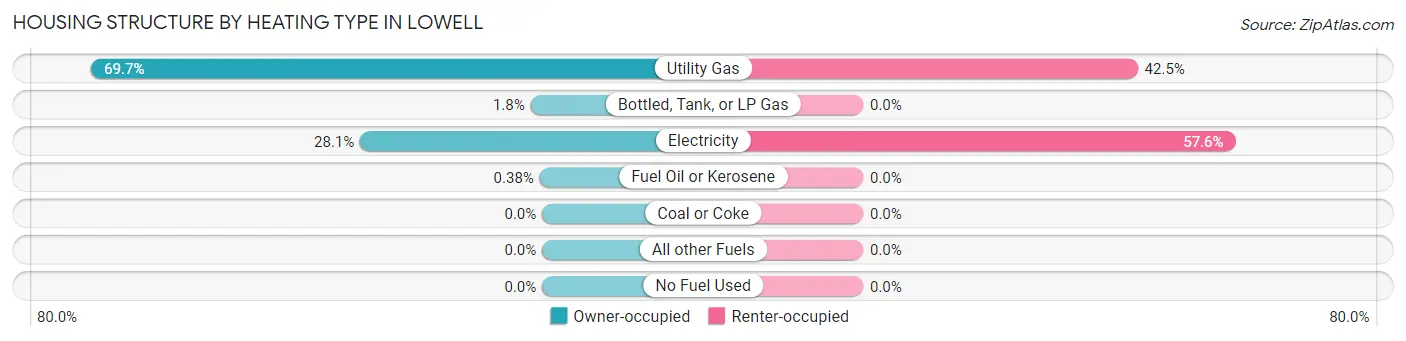
| Heating Type | Owner-occupied | Renter-occupied |
| Utility Gas | 741 (69.7%) | 180 (42.4%) |
| Bottled, Tank, or LP Gas | 19 (1.8%) | 0 (0.0%) |
| Electricity | 299 (28.1%) | 244 (57.6%) |
| Fuel Oil or Kerosene | 4 (0.4%) | 0 (0.0%) |
| Coal or Coke | 0 (0.0%) | 0 (0.0%) |
| All other Fuels | 0 (0.0%) | 0 (0.0%) |
| No Fuel Used | 0 (0.0%) | 0 (0.0%) |
| Total | 1,063 (100.0%) | 424 (100.0%) |
Household Vehicle Usage in Lowell
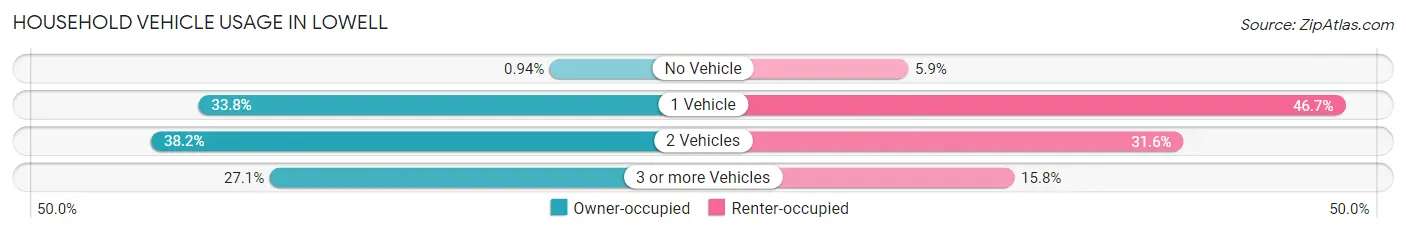
| Vehicles per Household | Owner-occupied | Renter-occupied |
| No Vehicle | 10 (0.9%) | 25 (5.9%) |
| 1 Vehicle | 359 (33.8%) | 198 (46.7%) |
| 2 Vehicles | 406 (38.2%) | 134 (31.6%) |
| 3 or more Vehicles | 288 (27.1%) | 67 (15.8%) |
| Total | 1,063 (100.0%) | 424 (100.0%) |
Real Estate & Mortgages in Lowell
Real Estate and Mortgage Overview in Lowell
| Characteristic | Without Mortgage | With Mortgage |
| Housing Units | 318 | 745 |
| Median Property Value | $143,500 | $161,800 |
| Median Household Income | $48,839 | $129 |
| Monthly Housing Costs | $463 | $13 |
| Real Estate Taxes | $1,540 | $0 |
Property Value by Mortgage Status in Lowell
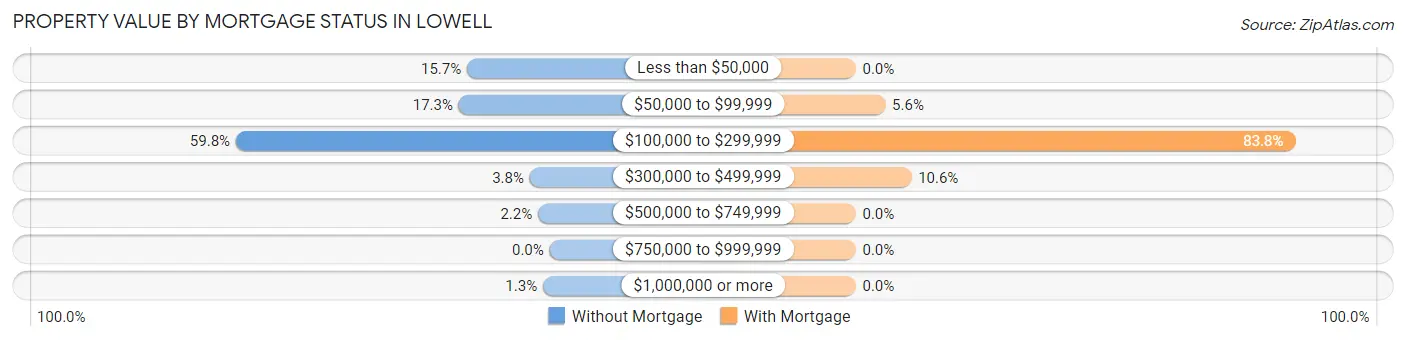
| Property Value | Without Mortgage | With Mortgage |
| Less than $50,000 | 50 (15.7%) | 0 (0.0%) |
| $50,000 to $99,999 | 55 (17.3%) | 42 (5.6%) |
| $100,000 to $299,999 | 190 (59.8%) | 624 (83.8%) |
| $300,000 to $499,999 | 12 (3.8%) | 79 (10.6%) |
| $500,000 to $749,999 | 7 (2.2%) | 0 (0.0%) |
| $750,000 to $999,999 | 0 (0.0%) | 0 (0.0%) |
| $1,000,000 or more | 4 (1.3%) | 0 (0.0%) |
| Total | 318 (100.0%) | 745 (100.0%) |
Household Income by Mortgage Status in Lowell
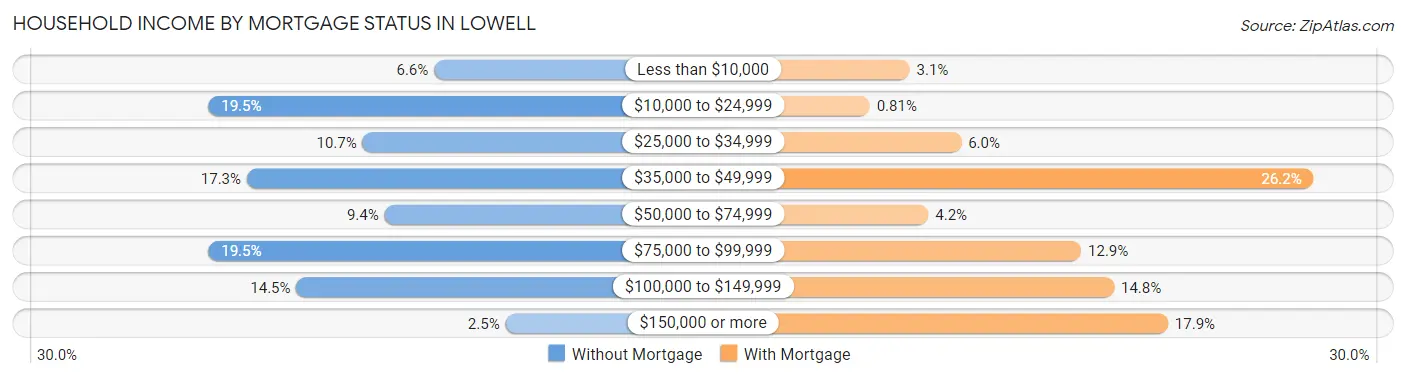
| Household Income | Without Mortgage | With Mortgage |
| Less than $10,000 | 21 (6.6%) | 23 (3.1%) |
| $10,000 to $24,999 | 62 (19.5%) | 6 (0.8%) |
| $25,000 to $34,999 | 34 (10.7%) | 45 (6.0%) |
| $35,000 to $49,999 | 55 (17.3%) | 195 (26.2%) |
| $50,000 to $74,999 | 30 (9.4%) | 31 (4.2%) |
| $75,000 to $99,999 | 62 (19.5%) | 96 (12.9%) |
| $100,000 to $149,999 | 46 (14.5%) | 110 (14.8%) |
| $150,000 or more | 8 (2.5%) | 133 (17.8%) |
| Total | 318 (100.0%) | 745 (100.0%) |
Property Value to Household Income Ratio in Lowell
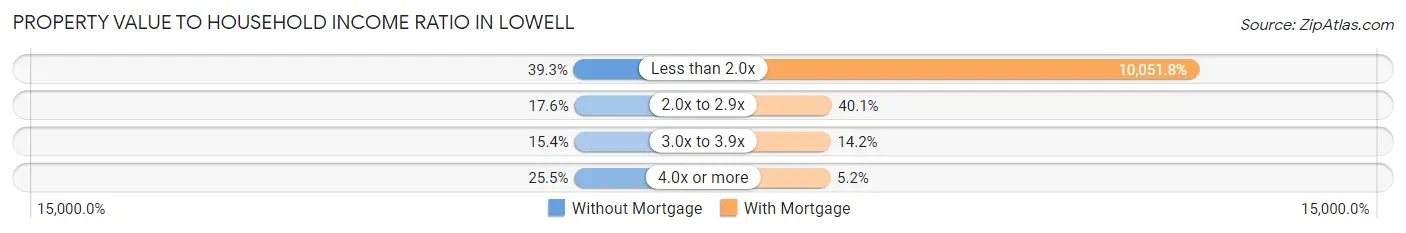
| Value-to-Income Ratio | Without Mortgage | With Mortgage |
| Less than 2.0x | 125 (39.3%) | 74,886 (10,051.8%) |
| 2.0x to 2.9x | 56 (17.6%) | 299 (40.1%) |
| 3.0x to 3.9x | 49 (15.4%) | 106 (14.2%) |
| 4.0x or more | 81 (25.5%) | 39 (5.2%) |
| Total | 318 (100.0%) | 745 (100.0%) |
Real Estate Taxes by Mortgage Status in Lowell
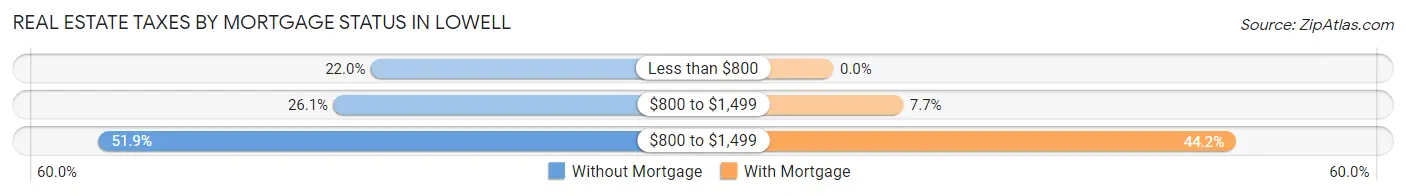
| Property Taxes | Without Mortgage | With Mortgage |
| Less than $800 | 70 (22.0%) | 0 (0.0%) |
| $800 to $1,499 | 83 (26.1%) | 57 (7.6%) |
| $800 to $1,499 | 165 (51.9%) | 329 (44.2%) |
| Total | 318 (100.0%) | 745 (100.0%) |
Health & Disability in Lowell
Health Insurance Coverage by Age in Lowell
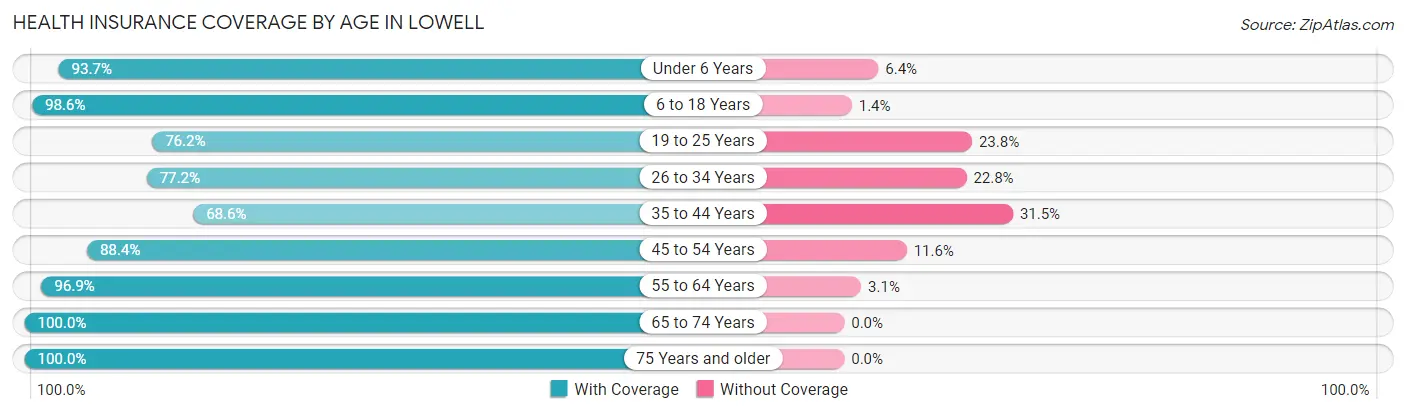
| Age Bracket | With Coverage | Without Coverage |
| Under 6 Years | 177 (93.6%) | 12 (6.4%) |
| 6 to 18 Years | 635 (98.6%) | 9 (1.4%) |
| 19 to 25 Years | 256 (76.2%) | 80 (23.8%) |
| 26 to 34 Years | 339 (77.2%) | 100 (22.8%) |
| 35 to 44 Years | 351 (68.5%) | 161 (31.5%) |
| 45 to 54 Years | 372 (88.4%) | 49 (11.6%) |
| 55 to 64 Years | 586 (96.9%) | 19 (3.1%) |
| 65 to 74 Years | 385 (100.0%) | 0 (0.0%) |
| 75 Years and older | 119 (100.0%) | 0 (0.0%) |
| Total | 3,220 (88.2%) | 430 (11.8%) |
Health Insurance Coverage by Citizenship Status in Lowell
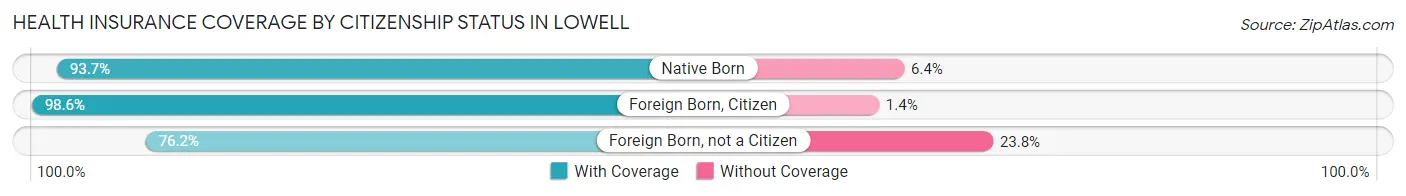
| Citizenship Status | With Coverage | Without Coverage |
| Native Born | 177 (93.6%) | 12 (6.4%) |
| Foreign Born, Citizen | 635 (98.6%) | 9 (1.4%) |
| Foreign Born, not a Citizen | 256 (76.2%) | 80 (23.8%) |
Health Insurance Coverage by Household Income in Lowell
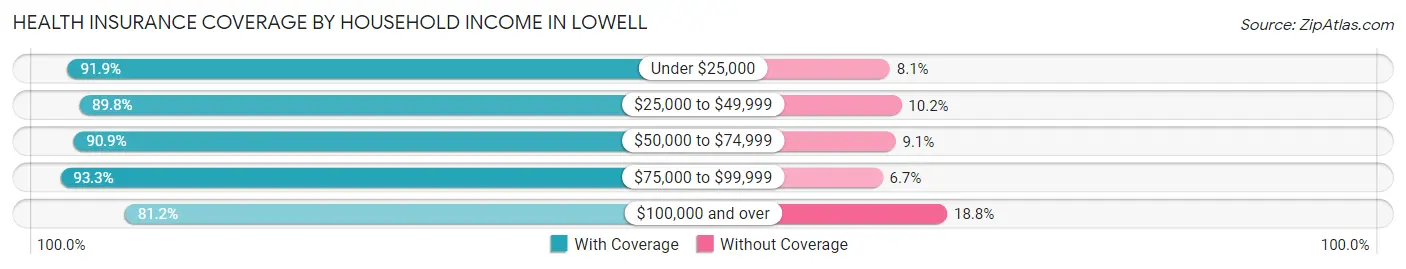
| Household Income | With Coverage | Without Coverage |
| Under $25,000 | 524 (91.9%) | 46 (8.1%) |
| $25,000 to $49,999 | 667 (89.8%) | 76 (10.2%) |
| $50,000 to $74,999 | 468 (90.9%) | 47 (9.1%) |
| $75,000 to $99,999 | 627 (93.3%) | 45 (6.7%) |
| $100,000 and over | 934 (81.2%) | 216 (18.8%) |
Public vs Private Health Insurance Coverage by Age in Lowell
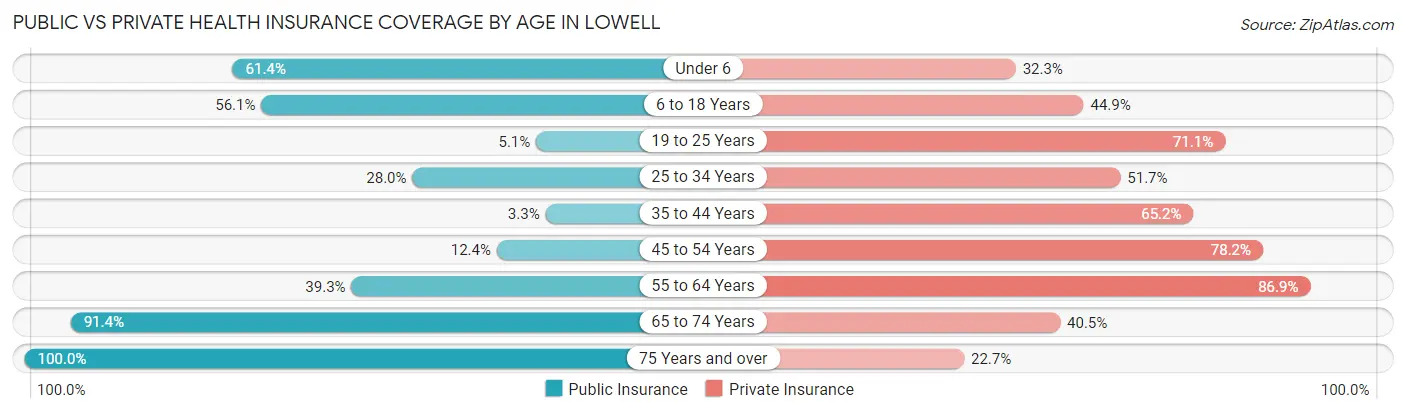
| Age Bracket | Public Insurance | Private Insurance |
| Under 6 | 116 (61.4%) | 61 (32.3%) |
| 6 to 18 Years | 361 (56.1%) | 289 (44.9%) |
| 19 to 25 Years | 17 (5.1%) | 239 (71.1%) |
| 25 to 34 Years | 123 (28.0%) | 227 (51.7%) |
| 35 to 44 Years | 17 (3.3%) | 334 (65.2%) |
| 45 to 54 Years | 52 (12.3%) | 329 (78.1%) |
| 55 to 64 Years | 238 (39.3%) | 526 (86.9%) |
| 65 to 74 Years | 352 (91.4%) | 156 (40.5%) |
| 75 Years and over | 119 (100.0%) | 27 (22.7%) |
| Total | 1,395 (38.2%) | 2,188 (60.0%) |
Disability Status by Sex by Age in Lowell
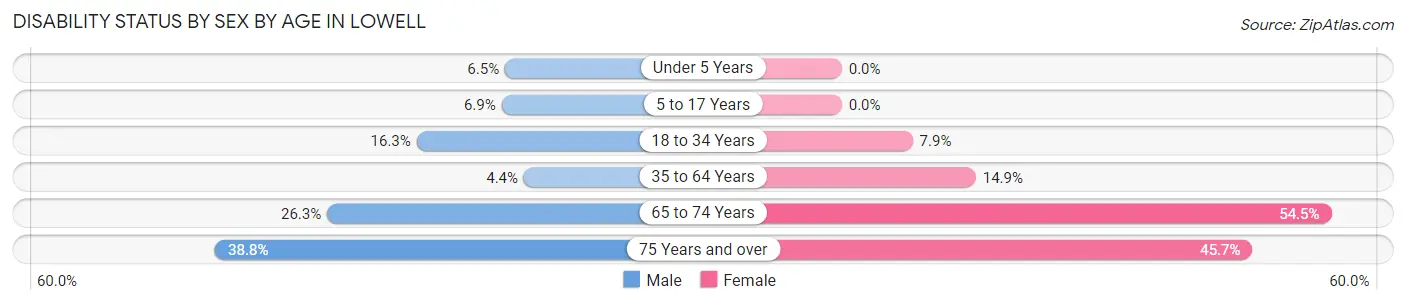
| Age Bracket | Male | Female |
| Under 5 Years | 8 (6.5%) | 0 (0.0%) |
| 5 to 17 Years | 30 (6.9%) | 0 (0.0%) |
| 18 to 34 Years | 74 (16.3%) | 28 (7.9%) |
| 35 to 64 Years | 37 (4.4%) | 104 (14.9%) |
| 65 to 74 Years | 40 (26.3%) | 127 (54.5%) |
| 75 Years and over | 19 (38.8%) | 32 (45.7%) |
Disability Class by Sex by Age in Lowell
Disability Class: Hearing Difficulty
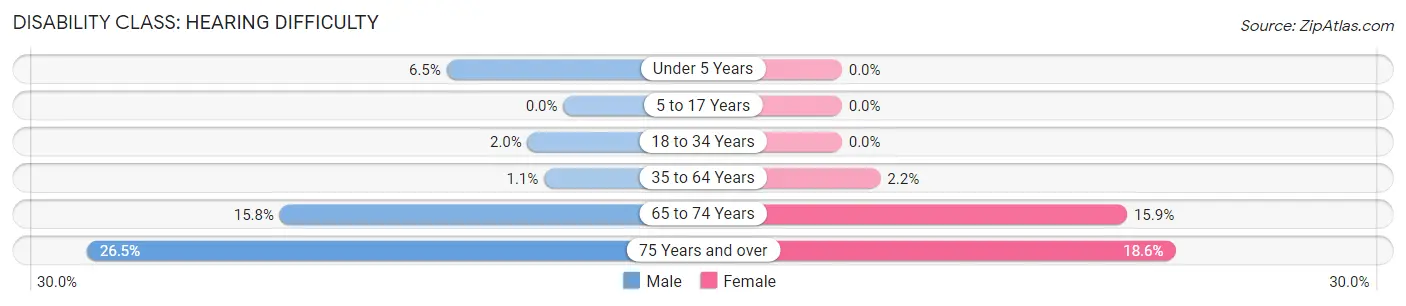
| Age Bracket | Male | Female |
| Under 5 Years | 8 (6.5%) | 0 (0.0%) |
| 5 to 17 Years | 0 (0.0%) | 0 (0.0%) |
| 18 to 34 Years | 9 (2.0%) | 0 (0.0%) |
| 35 to 64 Years | 9 (1.1%) | 15 (2.1%) |
| 65 to 74 Years | 24 (15.8%) | 37 (15.9%) |
| 75 Years and over | 13 (26.5%) | 13 (18.6%) |
Disability Class: Vision Difficulty
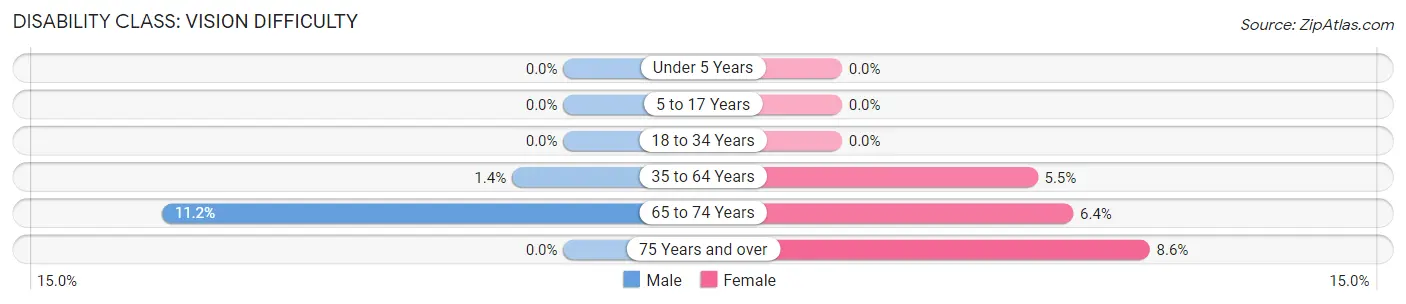
| Age Bracket | Male | Female |
| Under 5 Years | 0 (0.0%) | 0 (0.0%) |
| 5 to 17 Years | 0 (0.0%) | 0 (0.0%) |
| 18 to 34 Years | 0 (0.0%) | 0 (0.0%) |
| 35 to 64 Years | 12 (1.4%) | 38 (5.4%) |
| 65 to 74 Years | 17 (11.2%) | 15 (6.4%) |
| 75 Years and over | 0 (0.0%) | 6 (8.6%) |
Disability Class: Cognitive Difficulty
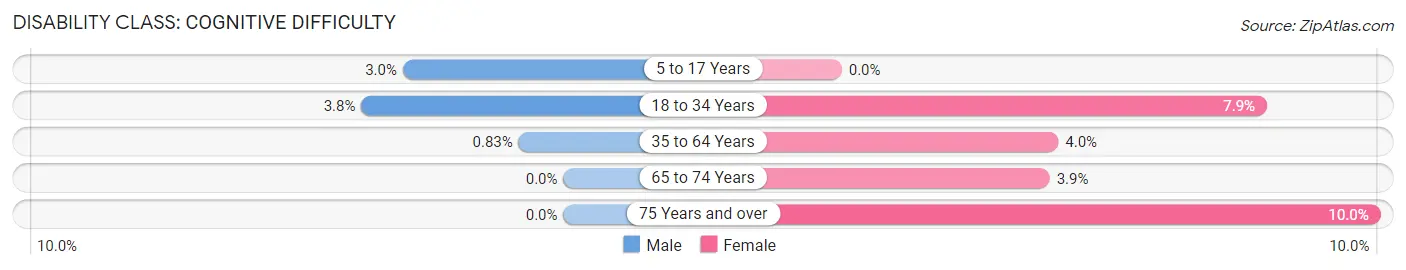
| Age Bracket | Male | Female |
| 5 to 17 Years | 13 (3.0%) | 0 (0.0%) |
| 18 to 34 Years | 17 (3.7%) | 28 (7.9%) |
| 35 to 64 Years | 7 (0.8%) | 28 (4.0%) |
| 65 to 74 Years | 0 (0.0%) | 9 (3.9%) |
| 75 Years and over | 0 (0.0%) | 7 (10.0%) |
Disability Class: Ambulatory Difficulty
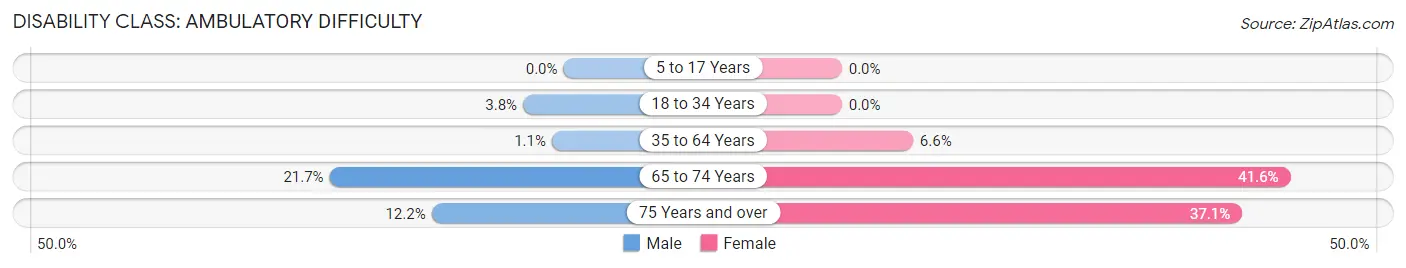
| Age Bracket | Male | Female |
| 5 to 17 Years | 0 (0.0%) | 0 (0.0%) |
| 18 to 34 Years | 17 (3.7%) | 0 (0.0%) |
| 35 to 64 Years | 9 (1.1%) | 46 (6.6%) |
| 65 to 74 Years | 33 (21.7%) | 97 (41.6%) |
| 75 Years and over | 6 (12.2%) | 26 (37.1%) |
Disability Class: Self-Care Difficulty
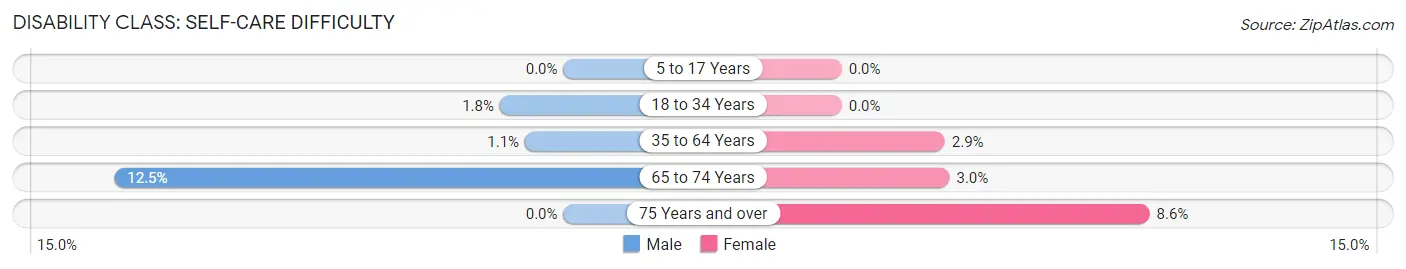
| Age Bracket | Male | Female |
| 5 to 17 Years | 0 (0.0%) | 0 (0.0%) |
| 18 to 34 Years | 8 (1.8%) | 0 (0.0%) |
| 35 to 64 Years | 9 (1.1%) | 20 (2.9%) |
| 65 to 74 Years | 19 (12.5%) | 7 (3.0%) |
| 75 Years and over | 0 (0.0%) | 6 (8.6%) |
Technology Access in Lowell
Computing Device Access in Lowell
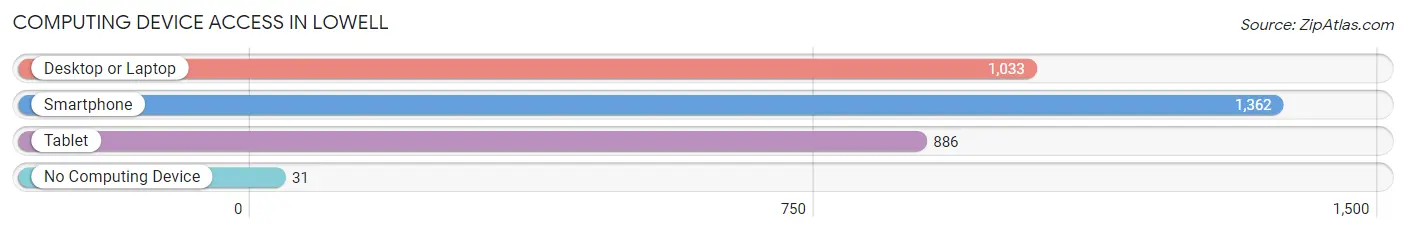
| Device Type | # Households | % Households |
| Desktop or Laptop | 1,033 | 69.5% |
| Smartphone | 1,362 | 91.6% |
| Tablet | 886 | 59.6% |
| No Computing Device | 31 | 2.1% |
| Total | 1,487 | 100.0% |
Internet Access in Lowell
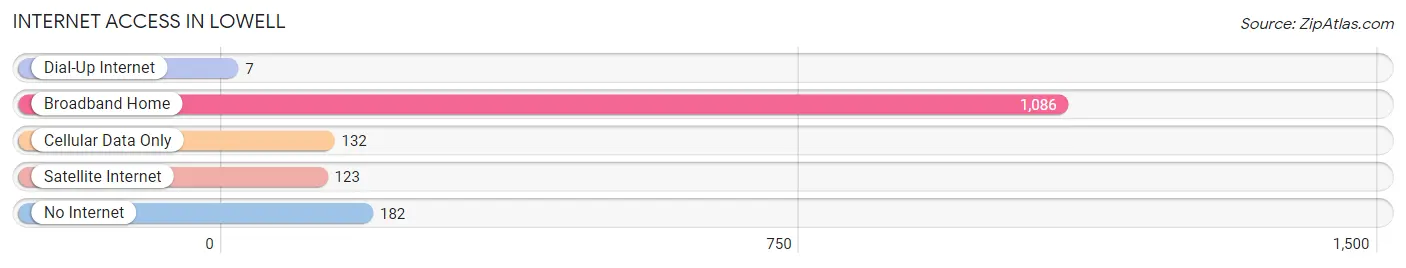
| Internet Type | # Households | % Households |
| Dial-Up Internet | 7 | 0.5% |
| Broadband Home | 1,086 | 73.0% |
| Cellular Data Only | 132 | 8.9% |
| Satellite Internet | 123 | 8.3% |
| No Internet | 182 | 12.2% |
| Total | 1,487 | 100.0% |
Lowell Summary
Lowell is a small town located in Gaston County, North Carolina. It is situated in the foothills of the Blue Ridge Mountains, approximately 25 miles west of Charlotte. The town was founded in 1891 and was named after the Lowell Manufacturing Company, which was established in the area in 1887. The town has a population of approximately 3,000 people and is home to a variety of businesses, including a number of small manufacturing companies.
Geography
Lowell is located in the foothills of the Blue Ridge Mountains, approximately 25 miles west of Charlotte. The town is situated in the Catawba River Valley, which is part of the Piedmont region of North Carolina. The town is bordered by the towns of Dallas, Gastonia, and Cramerton. The Catawba River runs through the town, providing a source of recreation for the residents. The town is also home to a number of parks, including the Lowell City Park, which features a playground, picnic areas, and a walking trail.
Economy
Lowell is home to a variety of businesses, including a number of small manufacturing companies. The town is also home to a number of retail stores, restaurants, and other businesses. The town is also home to a number of medical facilities, including a hospital and a number of medical offices. The town is also home to a number of educational institutions, including a community college and a number of elementary and secondary schools.
Demographics
As of the 2010 census, the population of Lowell was 3,039. The population is predominantly white, with a small percentage of African Americans and Hispanics. The median household income in Lowell is $41,945, and the median home value is $133,400. The town has a low unemployment rate, with only 4.2% of the population unemployed.
Lowell is a small town with a rich history and a vibrant economy. The town is home to a variety of businesses, including a number of small manufacturing companies. The town is also home to a number of educational institutions, medical facilities, and retail stores. The town has a diverse population and a low unemployment rate. Lowell is a great place to live and work, and is a great place to raise a family.
Common Questions
What is Per Capita Income in Lowell?
Per Capita income in Lowell is $33,305.
What is the Median Family Income in Lowell?
Median Family Income in Lowell is $82,523.
What is the Median Household income in Lowell?
Median Household Income in Lowell is $55,481.
What is Income or Wage Gap in Lowell?
Income or Wage Gap in Lowell is 0.6%.
Women in Lowell earn 99.4 cents for every dollar earned by a man.
What is Inequality or Gini Index in Lowell?
Inequality or Gini Index in Lowell is 0.49.
What is the Total Population of Lowell?
Total Population of Lowell is 3,692.
What is the Total Male Population of Lowell?
Total Male Population of Lowell is 2,054.
What is the Total Female Population of Lowell?
Total Female Population of Lowell is 1,638.
What is the Ratio of Males per 100 Females in Lowell?
There are 125.40 Males per 100 Females in Lowell.
What is the Ratio of Females per 100 Males in Lowell?
There are 79.75 Females per 100 Males in Lowell.
What is the Median Population Age in Lowell?
Median Population Age in Lowell is 38.7 Years.
What is the Average Family Size in Lowell
Average Family Size in Lowell is 2.9 People.
What is the Average Household Size in Lowell
Average Household Size in Lowell is 2.5 People.
How Large is the Labor Force in Lowell?
There are 1,943 People in the Labor Forcein in Lowell.
What is the Percentage of People in the Labor Force in Lowell?
65.7% of People are in the Labor Force in Lowell.
What is the Unemployment Rate in Lowell?
Unemployment Rate in Lowell is 4.5%.