Graham, NC Map & Demographics
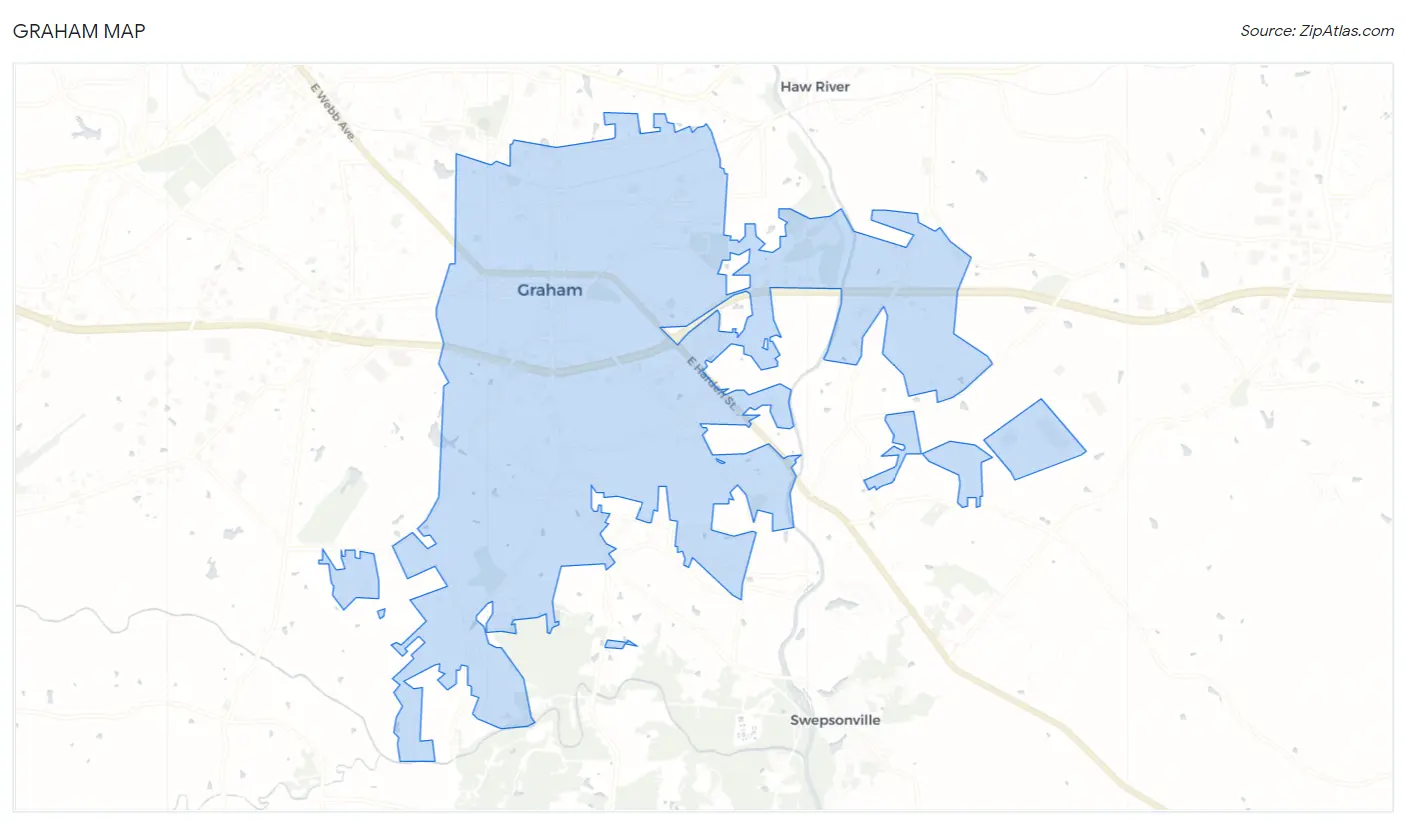
Graham Map
Graham Overview
$28,397
PER CAPITA INCOME
$54,724
AVG FAMILY INCOME
$51,482
AVG HOUSEHOLD INCOME
22.6%
WAGE / INCOME GAP [ % ]
77.4¢/ $1
WAGE / INCOME GAP [ $ ]
$10,628
FAMILY INCOME DEFICIT
0.43
INEQUALITY / GINI INDEX
17,136
TOTAL POPULATION
8,072
MALE POPULATION
9,064
FEMALE POPULATION
89.06
MALES / 100 FEMALES
112.29
FEMALES / 100 MALES
36.8
MEDIAN AGE
2.9
AVG FAMILY SIZE
2.3
AVG HOUSEHOLD SIZE
8,463
LABOR FORCE [ PEOPLE ]
61.0%
PERCENT IN LABOR FORCE
8.1%
UNEMPLOYMENT RATE
Graham Zip Codes
Graham Area Codes
Income in Graham
Income Overview in Graham
Per Capita Income in Graham is $28,397, while median incomes of families and households are $54,724 and $51,482 respectively.
| Characteristic | Number | Measure |
| Per Capita Income | 17,136 | $28,397 |
| Median Family Income | 4,330 | $54,724 |
| Mean Family Income | 4,330 | $74,408 |
| Median Household Income | 7,496 | $51,482 |
| Mean Household Income | 7,496 | $63,232 |
| Income Deficit | 4,330 | $10,628 |
| Wage / Income Gap (%) | 17,136 | 22.57% |
| Wage / Income Gap ($) | 17,136 | 77.43¢ per $1 |
| Gini / Inequality Index | 17,136 | 0.43 |
Earnings by Sex in Graham
Average Earnings in Graham are $34,788, $40,528 for men and $31,379 for women, a difference of 22.6%.
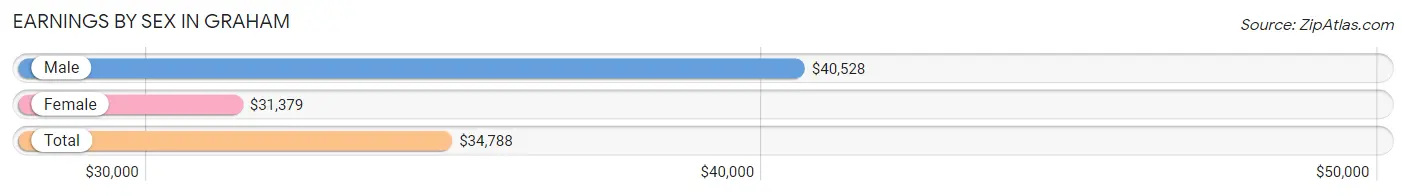
| Sex | Number | Average Earnings |
| Male | 4,383 (49.3%) | $40,528 |
| Female | 4,504 (50.7%) | $31,379 |
| Total | 8,887 (100.0%) | $34,788 |
Earnings by Sex by Income Bracket in Graham
The most common earnings brackets in Graham are $50,000 to $54,999 for men (399 | 9.1%) and $2,499 or less for women (366 | 8.1%).
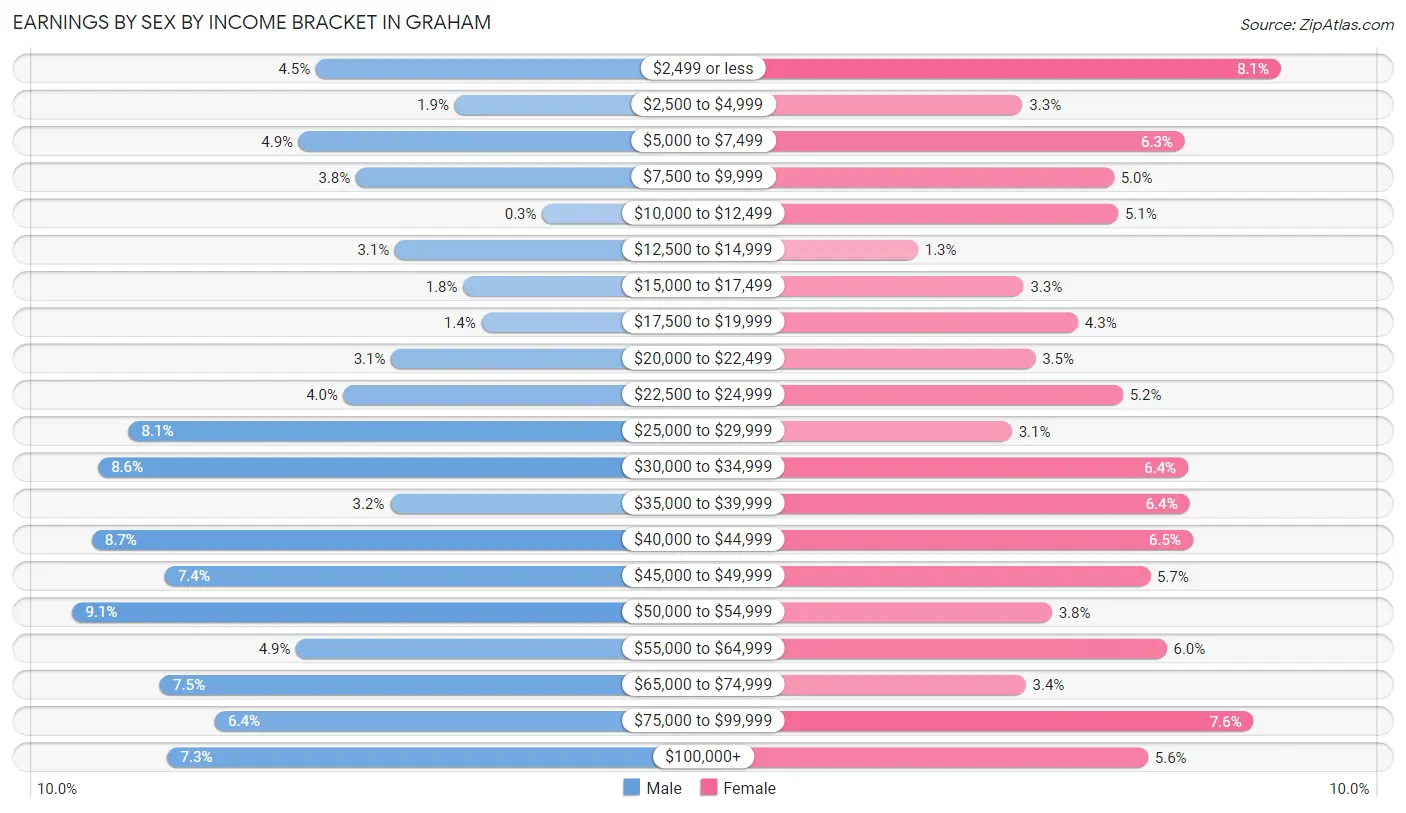
| Income | Male | Female |
| $2,499 or less | 199 (4.5%) | 366 (8.1%) |
| $2,500 to $4,999 | 85 (1.9%) | 148 (3.3%) |
| $5,000 to $7,499 | 213 (4.9%) | 285 (6.3%) |
| $7,500 to $9,999 | 166 (3.8%) | 225 (5.0%) |
| $10,000 to $12,499 | 13 (0.3%) | 229 (5.1%) |
| $12,500 to $14,999 | 134 (3.1%) | 60 (1.3%) |
| $15,000 to $17,499 | 78 (1.8%) | 149 (3.3%) |
| $17,500 to $19,999 | 63 (1.4%) | 195 (4.3%) |
| $20,000 to $22,499 | 137 (3.1%) | 159 (3.5%) |
| $22,500 to $24,999 | 176 (4.0%) | 233 (5.2%) |
| $25,000 to $29,999 | 353 (8.1%) | 139 (3.1%) |
| $30,000 to $34,999 | 378 (8.6%) | 288 (6.4%) |
| $35,000 to $39,999 | 138 (3.2%) | 289 (6.4%) |
| $40,000 to $44,999 | 383 (8.7%) | 292 (6.5%) |
| $45,000 to $49,999 | 323 (7.4%) | 256 (5.7%) |
| $50,000 to $54,999 | 399 (9.1%) | 173 (3.8%) |
| $55,000 to $64,999 | 215 (4.9%) | 270 (6.0%) |
| $65,000 to $74,999 | 327 (7.5%) | 151 (3.4%) |
| $75,000 to $99,999 | 282 (6.4%) | 343 (7.6%) |
| $100,000+ | 321 (7.3%) | 254 (5.6%) |
| Total | 4,383 (100.0%) | 4,504 (100.0%) |
Earnings by Sex by Educational Attainment in Graham
Average earnings in Graham are $42,288 for men and $38,029 for women, a difference of 10.1%. Men with an educational attainment of graduate degree enjoy the highest average annual earnings of $53,750, while those with less than high school education earn the least with $27,333. Women with an educational attainment of graduate degree earn the most with the average annual earnings of $69,659, while those with less than high school education have the smallest earnings of $23,199.
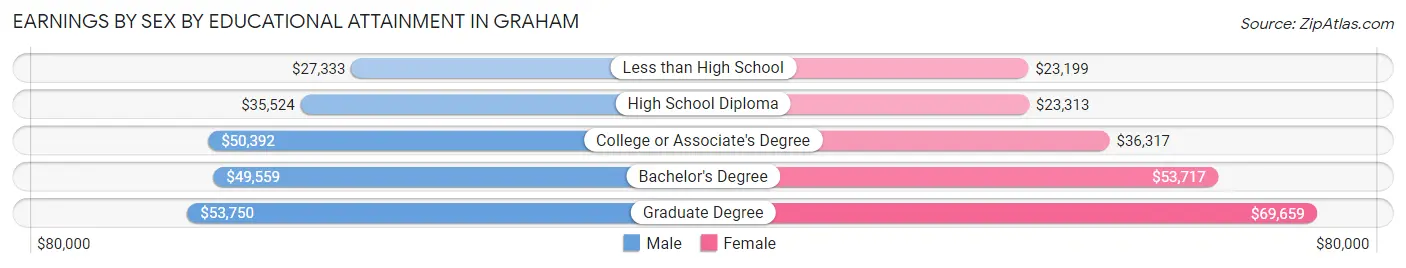
| Educational Attainment | Male Income | Female Income |
| Less than High School | $27,333 | $23,199 |
| High School Diploma | $35,524 | $23,313 |
| College or Associate's Degree | $50,392 | $36,317 |
| Bachelor's Degree | $49,559 | $53,717 |
| Graduate Degree | $53,750 | $69,659 |
| Total | $42,288 | $38,029 |
Family Income in Graham
Family Income Brackets in Graham
According to the Graham family income data, there are 944 families falling into the $50,000 to $74,999 income range, which is the most common income bracket and makes up 21.8% of all families. Conversely, the $10,000 to $14,999 income bracket is the least frequent group with only 147 families (3.4%) belonging to this category.

| Income Bracket | # Families | % Families |
| Less than $10,000 | 320 | 7.4% |
| $10,000 to $14,999 | 147 | 3.4% |
| $15,000 to $24,999 | 368 | 8.5% |
| $25,000 to $34,999 | 221 | 5.1% |
| $35,000 to $49,999 | 732 | 16.9% |
| $50,000 to $74,999 | 944 | 21.8% |
| $75,000 to $99,999 | 576 | 13.3% |
| $100,000 to $149,999 | 563 | 13.0% |
| $150,000 to $199,999 | 238 | 5.5% |
| $200,000+ | 221 | 5.1% |
Family Income by Famaliy Size in Graham
6-person families (121 | 2.8%) account for the highest median family income in Graham with $86,875 per family, while 2-person families (2,391 | 55.2%) have the highest median income of $25,597 per family member.
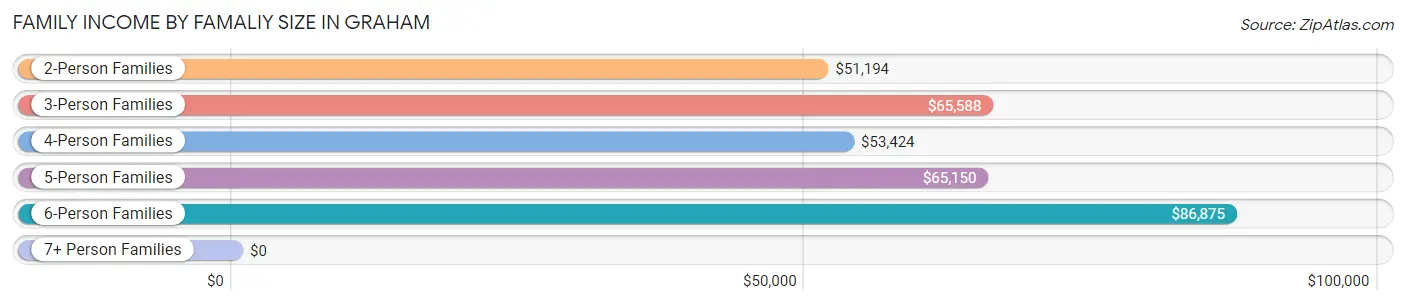
| Income Bracket | # Families | Median Income |
| 2-Person Families | 2,391 (55.2%) | $51,194 |
| 3-Person Families | 706 (16.3%) | $65,588 |
| 4-Person Families | 776 (17.9%) | $53,424 |
| 5-Person Families | 309 (7.1%) | $65,150 |
| 6-Person Families | 121 (2.8%) | $86,875 |
| 7+ Person Families | 27 (0.6%) | $0 |
| Total | 4,330 (100.0%) | $54,724 |
Family Income by Number of Earners in Graham
The median family income in Graham is $54,724, with families comprising 3+ earners (350) having the highest median family income of $152,917, while families with 1 earner (1,539) have the lowest median family income of $40,895, accounting for 8.1% and 35.5% of families, respectively.
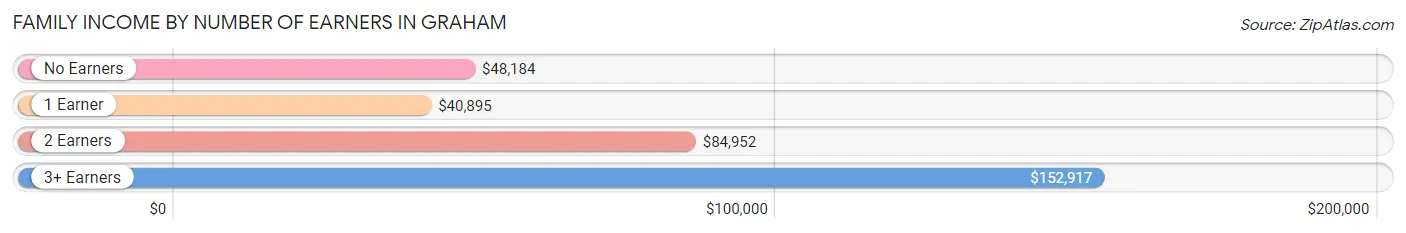
| Number of Earners | # Families | Median Income |
| No Earners | 887 (20.5%) | $48,184 |
| 1 Earner | 1,539 (35.5%) | $40,895 |
| 2 Earners | 1,554 (35.9%) | $84,952 |
| 3+ Earners | 350 (8.1%) | $152,917 |
| Total | 4,330 (100.0%) | $54,724 |
Household Income in Graham
Household Income Brackets in Graham
With 1,604 households falling in the category, the $50,000 to $74,999 income range is the most frequent in Graham, accounting for 21.4% of all households. In contrast, only 232 households (3.1%) fall into the $200,000+ income bracket, making it the least populous group.
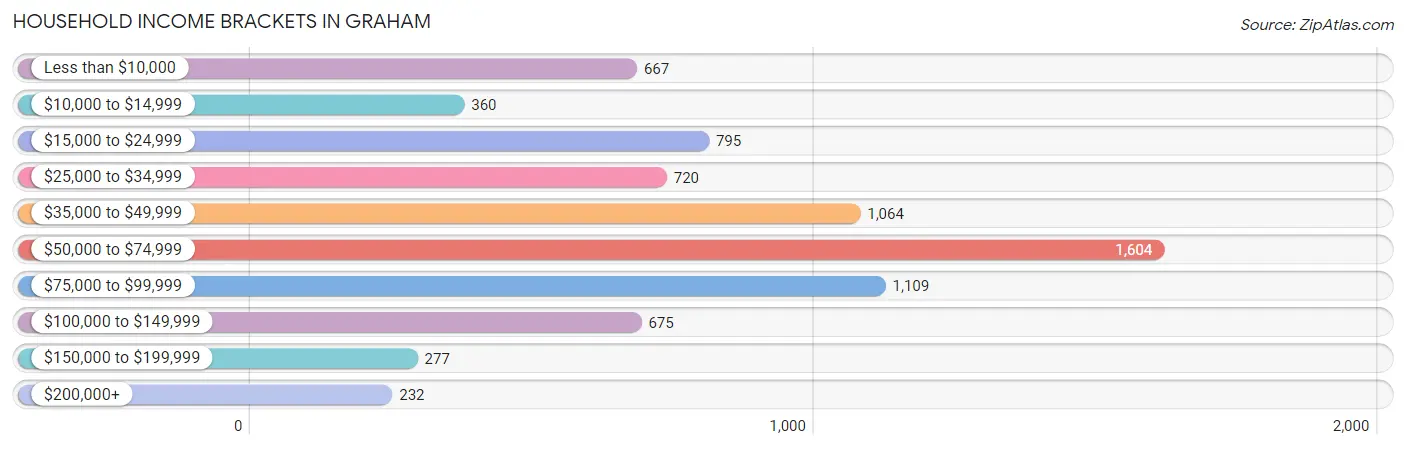
| Income Bracket | # Households | % Households |
| Less than $10,000 | 667 | 8.9% |
| $10,000 to $14,999 | 360 | 4.8% |
| $15,000 to $24,999 | 795 | 10.6% |
| $25,000 to $34,999 | 720 | 9.6% |
| $35,000 to $49,999 | 1,064 | 14.2% |
| $50,000 to $74,999 | 1,604 | 21.4% |
| $75,000 to $99,999 | 1,109 | 14.8% |
| $100,000 to $149,999 | 675 | 9.0% |
| $150,000 to $199,999 | 277 | 3.7% |
| $200,000+ | 232 | 3.1% |
Household Income by Householder Age in Graham
The median household income in Graham is $51,482, with the highest median household income of $57,320 found in the 25 to 44 years age bracket for the primary householder. A total of 2,310 households (30.8%) fall into this category. Meanwhile, the 15 to 24 years age bracket for the primary householder has the lowest median household income of $22,111, with 455 households (6.1%) in this group.
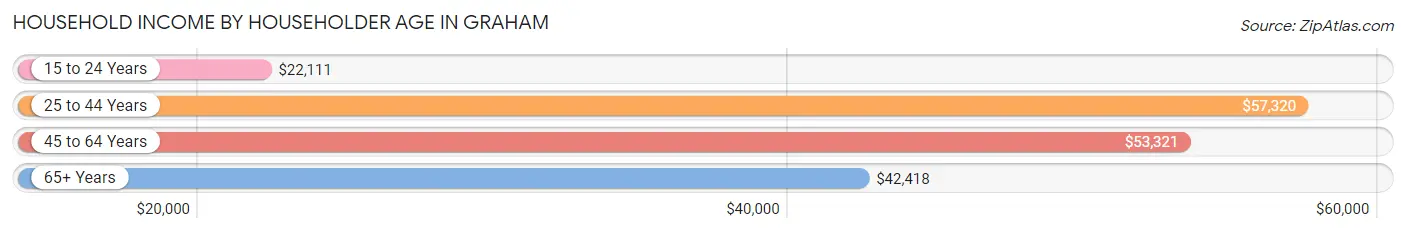
| Income Bracket | # Households | Median Income |
| 15 to 24 Years | 455 (6.1%) | $22,111 |
| 25 to 44 Years | 2,310 (30.8%) | $57,320 |
| 45 to 64 Years | 2,794 (37.3%) | $53,321 |
| 65+ Years | 1,937 (25.8%) | $42,418 |
| Total | 7,496 (100.0%) | $51,482 |
Poverty in Graham
Income Below Poverty by Sex and Age in Graham
With 16.7% poverty level for males and 21.3% for females among the residents of Graham, 5 year old males and 5 year old females are the most vulnerable to poverty, with 51 males (85.0%) and 48 females (38.1%) in their respective age groups living below the poverty level.
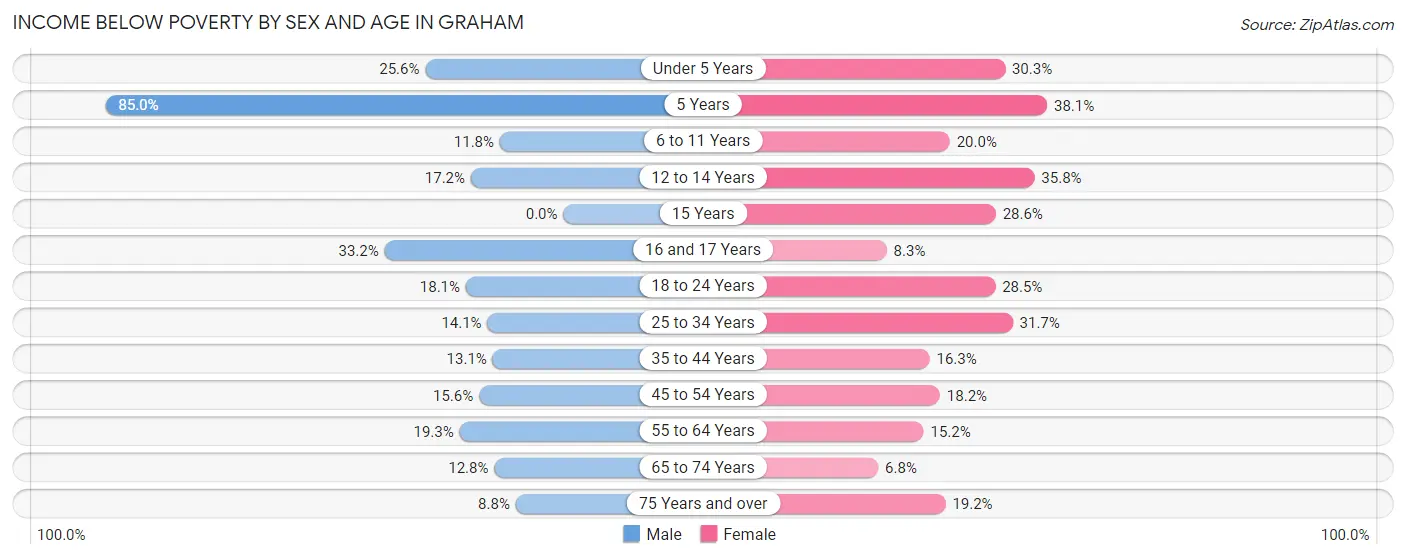
| Age Bracket | Male | Female |
| Under 5 Years | 205 (25.6%) | 126 (30.3%) |
| 5 Years | 51 (85.0%) | 48 (38.1%) |
| 6 to 11 Years | 82 (11.8%) | 90 (20.0%) |
| 12 to 14 Years | 34 (17.2%) | 133 (35.7%) |
| 15 Years | 0 (0.0%) | 14 (28.6%) |
| 16 and 17 Years | 75 (33.2%) | 14 (8.3%) |
| 18 to 24 Years | 82 (18.1%) | 269 (28.5%) |
| 25 to 34 Years | 210 (14.1%) | 457 (31.7%) |
| 35 to 44 Years | 105 (13.1%) | 144 (16.3%) |
| 45 to 54 Years | 130 (15.6%) | 189 (18.2%) |
| 55 to 64 Years | 217 (19.3%) | 208 (15.2%) |
| 65 to 74 Years | 81 (12.8%) | 57 (6.8%) |
| 75 Years and over | 48 (8.8%) | 178 (19.2%) |
| Total | 1,320 (16.7%) | 1,927 (21.3%) |
Income Above Poverty by Sex and Age in Graham
According to the poverty statistics in Graham, males aged 15 years and females aged 65 to 74 years are the age groups that are most secure financially, with 100.0% of males and 93.2% of females in these age groups living above the poverty line.
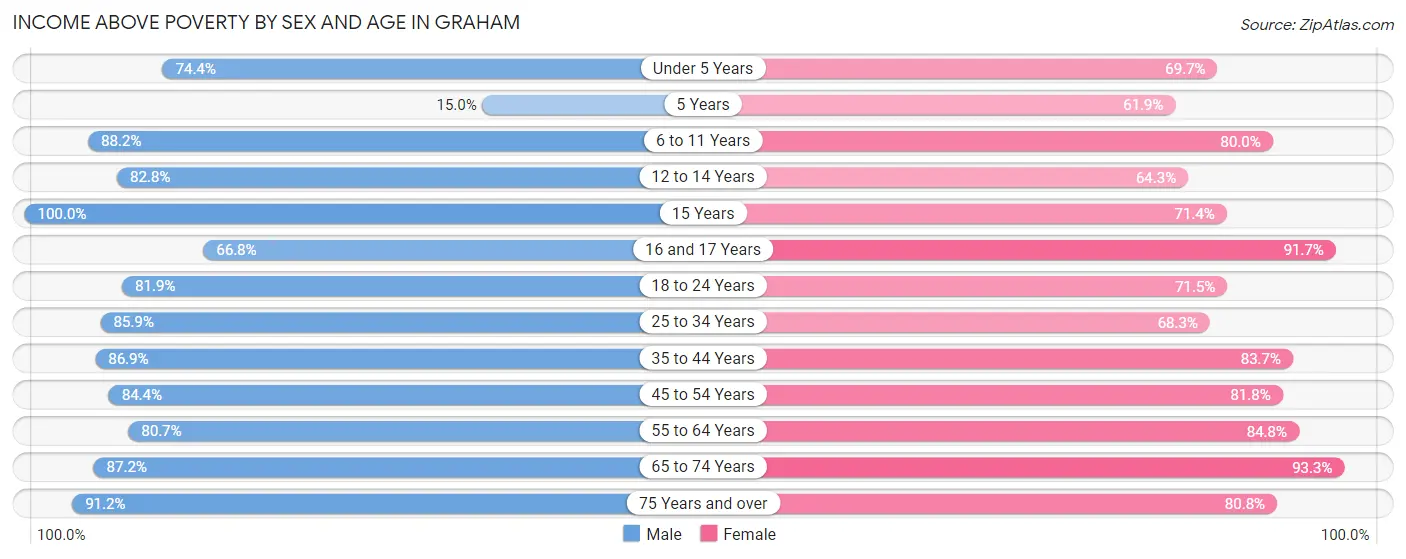
| Age Bracket | Male | Female |
| Under 5 Years | 595 (74.4%) | 290 (69.7%) |
| 5 Years | 9 (15.0%) | 78 (61.9%) |
| 6 to 11 Years | 614 (88.2%) | 359 (80.0%) |
| 12 to 14 Years | 164 (82.8%) | 239 (64.2%) |
| 15 Years | 70 (100.0%) | 35 (71.4%) |
| 16 and 17 Years | 151 (66.8%) | 154 (91.7%) |
| 18 to 24 Years | 371 (81.9%) | 676 (71.5%) |
| 25 to 34 Years | 1,280 (85.9%) | 984 (68.3%) |
| 35 to 44 Years | 695 (86.9%) | 740 (83.7%) |
| 45 to 54 Years | 701 (84.4%) | 849 (81.8%) |
| 55 to 64 Years | 909 (80.7%) | 1,162 (84.8%) |
| 65 to 74 Years | 551 (87.2%) | 787 (93.2%) |
| 75 Years and over | 495 (91.2%) | 747 (80.8%) |
| Total | 6,605 (83.3%) | 7,100 (78.6%) |
Income Below Poverty Among Married-Couple Families in Graham
The poverty statistics for married-couple families in Graham show that 8.6% or 253 of the total 2,938 families live below the poverty line. Families with 1 or 2 children have the highest poverty rate of 11.7%, comprising of 123 families. On the other hand, families with 3 or 4 children have the lowest poverty rate of 0.0%, which includes 0 families.
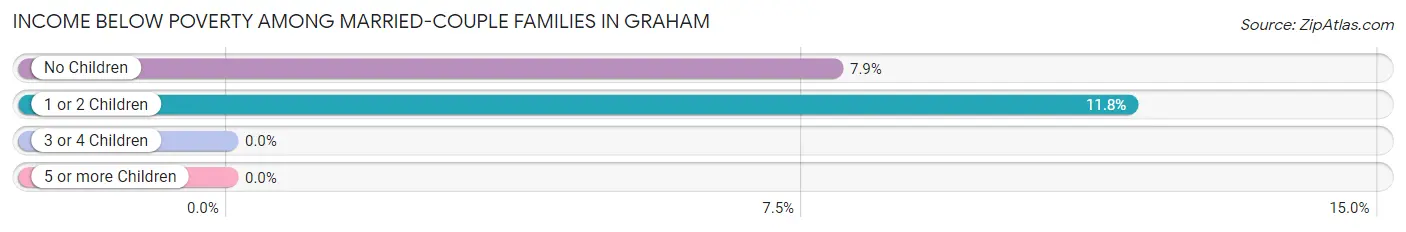
| Children | Above Poverty | Below Poverty |
| No Children | 1,515 (92.1%) | 130 (7.9%) |
| 1 or 2 Children | 924 (88.2%) | 123 (11.7%) |
| 3 or 4 Children | 246 (100.0%) | 0 (0.0%) |
| 5 or more Children | 0 (0.0%) | 0 (0.0%) |
| Total | 2,685 (91.4%) | 253 (8.6%) |
Income Below Poverty Among Single-Parent Households in Graham
According to the poverty data in Graham, 23.2% or 67 single-father households and 37.2% or 410 single-mother households are living below the poverty line. Among single-father households, those with no children have the highest poverty rate, with 67 households (60.4%) experiencing poverty. Likewise, among single-mother households, those with 3 or 4 children have the highest poverty rate, with 125 households (78.1%) falling below the poverty line.
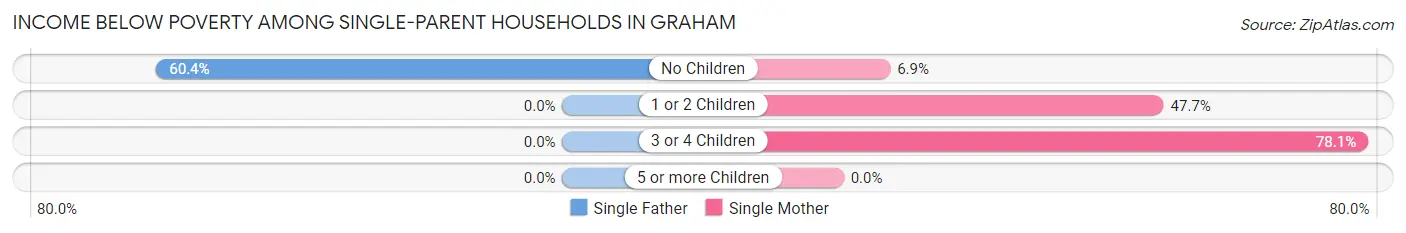
| Children | Single Father | Single Mother |
| No Children | 67 (60.4%) | 28 (6.9%) |
| 1 or 2 Children | 0 (0.0%) | 257 (47.7%) |
| 3 or 4 Children | 0 (0.0%) | 125 (78.1%) |
| 5 or more Children | 0 (0.0%) | 0 (0.0%) |
| Total | 67 (23.2%) | 410 (37.2%) |
Income Below Poverty Among Married-Couple vs Single-Parent Households in Graham
The poverty data for Graham shows that 253 of the married-couple family households (8.6%) and 477 of the single-parent households (34.3%) are living below the poverty level. Within the married-couple family households, those with 1 or 2 children have the highest poverty rate, with 123 households (11.7%) falling below the poverty line. Among the single-parent households, those with 3 or 4 children have the highest poverty rate, with 125 household (78.1%) living below poverty.
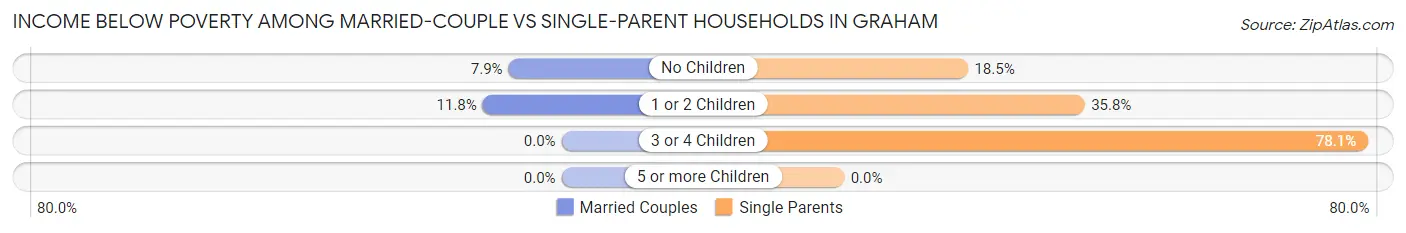
| Children | Married-Couple Families | Single-Parent Households |
| No Children | 130 (7.9%) | 95 (18.4%) |
| 1 or 2 Children | 123 (11.7%) | 257 (35.8%) |
| 3 or 4 Children | 0 (0.0%) | 125 (78.1%) |
| 5 or more Children | 0 (0.0%) | 0 (0.0%) |
| Total | 253 (8.6%) | 477 (34.3%) |
Race in Graham
The most populous races in Graham are White / Caucasian (10,239 | 59.8%), Black / African American (4,059 | 23.7%), and Hispanic or Latino (3,088 | 18.0%).
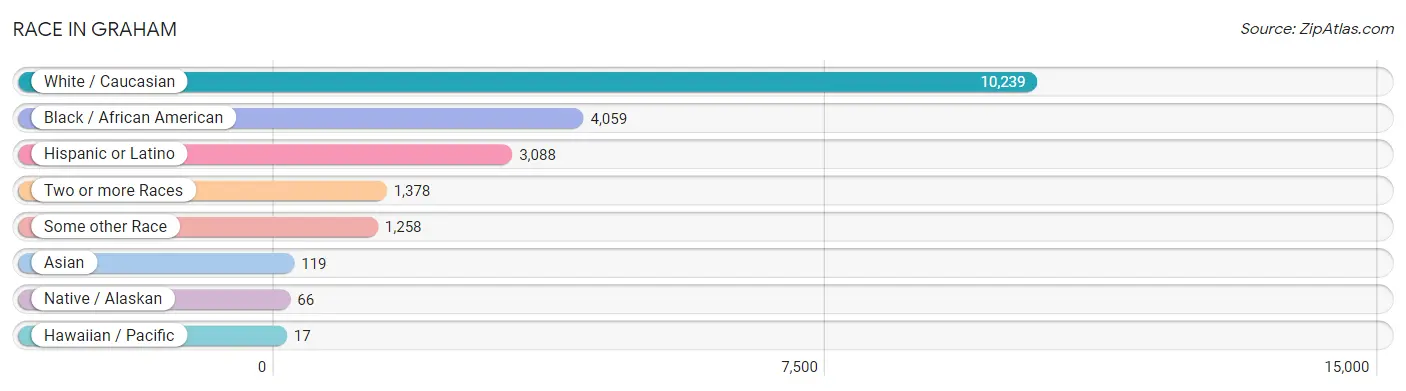
| Race | # Population | % Population |
| Asian | 119 | 0.7% |
| Black / African American | 4,059 | 23.7% |
| Hawaiian / Pacific | 17 | 0.1% |
| Hispanic or Latino | 3,088 | 18.0% |
| Native / Alaskan | 66 | 0.4% |
| White / Caucasian | 10,239 | 59.8% |
| Two or more Races | 1,378 | 8.0% |
| Some other Race | 1,258 | 7.3% |
| Total | 17,136 | 100.0% |
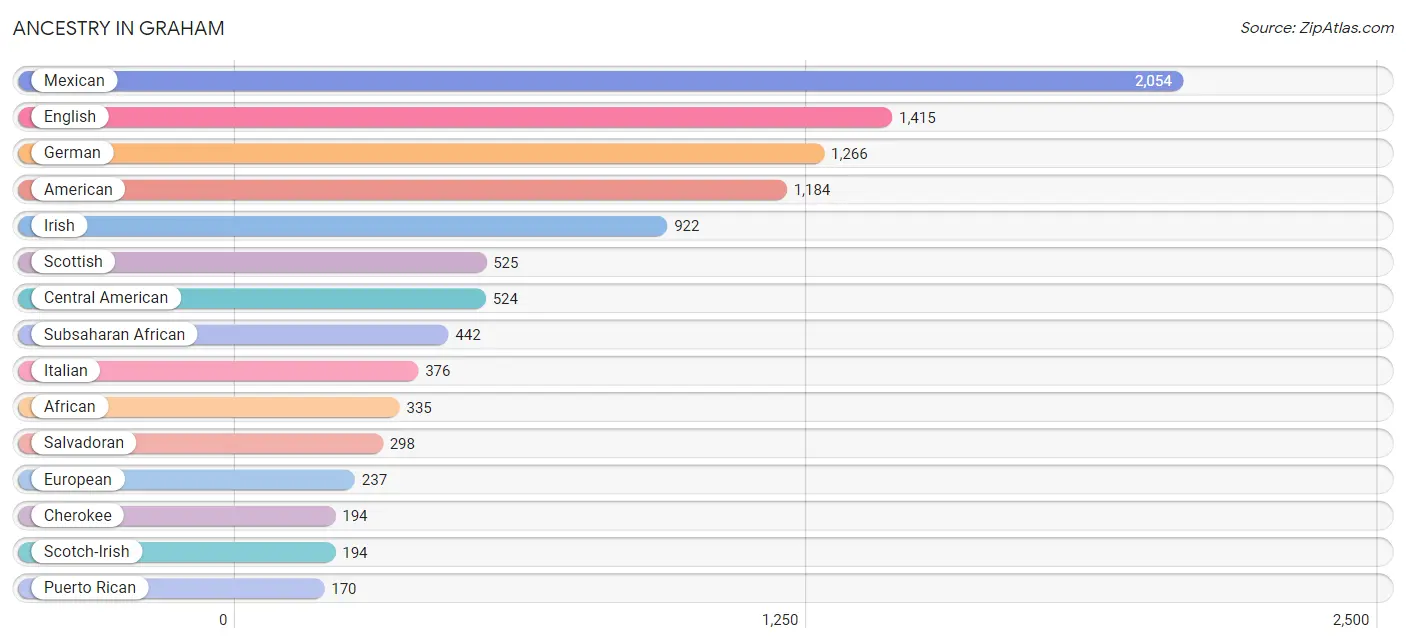
Ancestry in Graham
The most populous ancestries reported in Graham are Mexican (2,054 | 12.0%), English (1,415 | 8.3%), German (1,266 | 7.4%), American (1,184 | 6.9%), and Irish (922 | 5.4%), together accounting for 39.9% of all Graham residents.
| Ancestry | # Population | % Population |
| African | 335 | 1.9% |
| American | 1,184 | 6.9% |
| Arab | 9 | 0.1% |
| Austrian | 11 | 0.1% |
| Bangladeshi | 13 | 0.1% |
| Blackfeet | 69 | 0.4% |
| British | 51 | 0.3% |
| Burmese | 40 | 0.2% |
| Canadian | 14 | 0.1% |
| Central American | 524 | 3.1% |
| Central American Indian | 26 | 0.2% |
| Cherokee | 194 | 1.1% |
| Chilean | 20 | 0.1% |
| Colombian | 36 | 0.2% |
| Costa Rican | 147 | 0.9% |
| Cuban | 88 | 0.5% |
| Czech | 33 | 0.2% |
| Danish | 10 | 0.1% |
| Delaware | 9 | 0.1% |
| Dominican | 88 | 0.5% |
| Dutch | 144 | 0.8% |
| Eastern European | 16 | 0.1% |
| Ecuadorian | 26 | 0.2% |
| English | 1,415 | 8.3% |
| European | 237 | 1.4% |
| Finnish | 28 | 0.2% |
| French | 159 | 0.9% |
| French American Indian | 21 | 0.1% |
| French Canadian | 76 | 0.4% |
| German | 1,266 | 7.4% |
| Greek | 35 | 0.2% |
| Guatemalan | 74 | 0.4% |
| Haitian | 46 | 0.3% |
| Hungarian | 69 | 0.4% |
| Indian (Asian) | 10 | 0.1% |
| Irish | 922 | 5.4% |
| Italian | 376 | 2.2% |
| Jamaican | 5 | 0.0% |
| Latvian | 13 | 0.1% |
| Mexican | 2,054 | 12.0% |
| Mongolian | 23 | 0.1% |
| Native Hawaiian | 17 | 0.1% |
| Nigerian | 12 | 0.1% |
| Norwegian | 66 | 0.4% |
| Pakistani | 47 | 0.3% |
| Panamanian | 5 | 0.0% |
| Pennsylvania German | 35 | 0.2% |
| Polish | 152 | 0.9% |
| Portuguese | 76 | 0.4% |
| Puerto Rican | 170 | 1.0% |
| Russian | 4 | 0.0% |
| Salvadoran | 298 | 1.7% |
| Scotch-Irish | 194 | 1.1% |
| Scottish | 525 | 3.1% |
| Sierra Leonean | 95 | 0.5% |
| Slovak | 7 | 0.0% |
| South American | 82 | 0.5% |
| Spanish | 67 | 0.4% |
| Sri Lankan | 37 | 0.2% |
| Subsaharan African | 442 | 2.6% |
| Swedish | 130 | 0.8% |
| Swiss | 37 | 0.2% |
| Syrian | 9 | 0.1% |
| Welsh | 12 | 0.1% | View All 64 Rows |
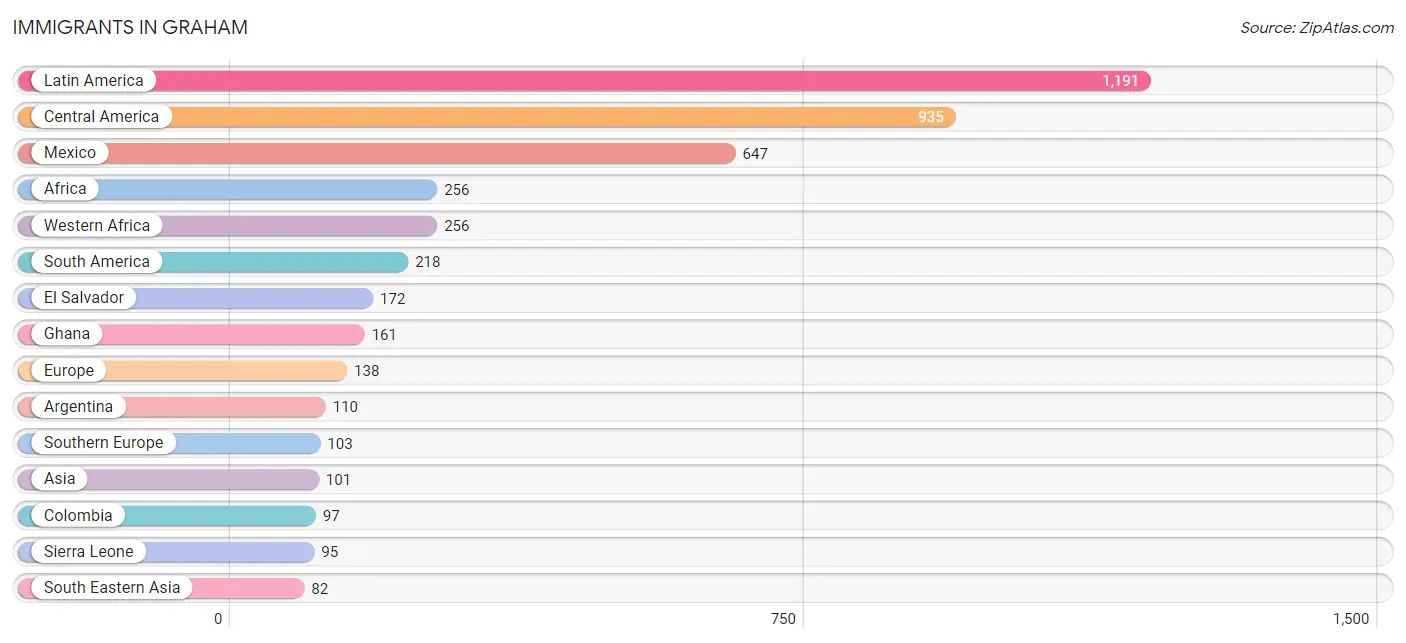
Immigrants in Graham
The most numerous immigrant groups reported in Graham came from Latin America (1,191 | 7.0%), Central America (935 | 5.5%), Mexico (647 | 3.8%), Africa (256 | 1.5%), and Western Africa (256 | 1.5%), together accounting for 19.2% of all Graham residents.
| Immigration Origin | # Population | % Population |
| Africa | 256 | 1.5% |
| Argentina | 110 | 0.6% |
| Asia | 101 | 0.6% |
| Canada | 10 | 0.1% |
| Caribbean | 38 | 0.2% |
| Central America | 935 | 5.5% |
| Chile | 11 | 0.1% |
| China | 10 | 0.1% |
| Colombia | 97 | 0.6% |
| Costa Rica | 27 | 0.2% |
| Cuba | 18 | 0.1% |
| Dominican Republic | 20 | 0.1% |
| Eastern Asia | 10 | 0.1% |
| El Salvador | 172 | 1.0% |
| Europe | 138 | 0.8% |
| Germany | 21 | 0.1% |
| Ghana | 161 | 0.9% |
| Guatemala | 74 | 0.4% |
| Honduras | 10 | 0.1% |
| Italy | 68 | 0.4% |
| Laos | 13 | 0.1% |
| Latin America | 1,191 | 7.0% |
| Mexico | 647 | 3.8% |
| Netherlands | 14 | 0.1% |
| Panama | 5 | 0.0% |
| Portugal | 35 | 0.2% |
| Sierra Leone | 95 | 0.5% |
| South America | 218 | 1.3% |
| South Eastern Asia | 82 | 0.5% |
| Southern Europe | 103 | 0.6% |
| Syria | 9 | 0.1% |
| Thailand | 47 | 0.3% |
| Vietnam | 22 | 0.1% |
| Western Africa | 256 | 1.5% |
| Western Asia | 9 | 0.1% |
| Western Europe | 35 | 0.2% | View All 36 Rows |
Sex and Age in Graham
Sex and Age in Graham
The most populous age groups in Graham are 25 to 29 Years (827 | 10.2%) for men and 30 to 34 Years (804 | 8.9%) for women.
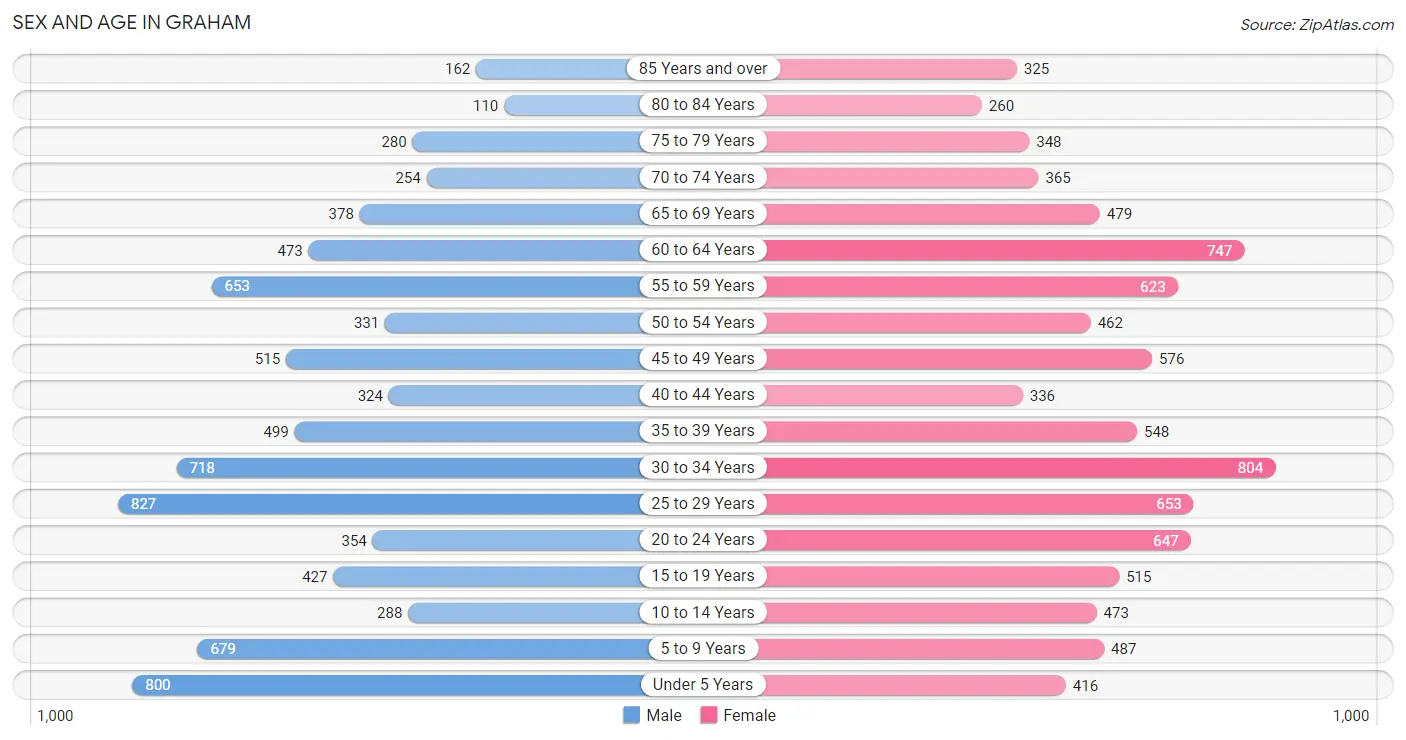
| Age Bracket | Male | Female |
| Under 5 Years | 800 (9.9%) | 416 (4.6%) |
| 5 to 9 Years | 679 (8.4%) | 487 (5.4%) |
| 10 to 14 Years | 288 (3.6%) | 473 (5.2%) |
| 15 to 19 Years | 427 (5.3%) | 515 (5.7%) |
| 20 to 24 Years | 354 (4.4%) | 647 (7.1%) |
| 25 to 29 Years | 827 (10.2%) | 653 (7.2%) |
| 30 to 34 Years | 718 (8.9%) | 804 (8.9%) |
| 35 to 39 Years | 499 (6.2%) | 548 (6.0%) |
| 40 to 44 Years | 324 (4.0%) | 336 (3.7%) |
| 45 to 49 Years | 515 (6.4%) | 576 (6.4%) |
| 50 to 54 Years | 331 (4.1%) | 462 (5.1%) |
| 55 to 59 Years | 653 (8.1%) | 623 (6.9%) |
| 60 to 64 Years | 473 (5.9%) | 747 (8.2%) |
| 65 to 69 Years | 378 (4.7%) | 479 (5.3%) |
| 70 to 74 Years | 254 (3.2%) | 365 (4.0%) |
| 75 to 79 Years | 280 (3.5%) | 348 (3.8%) |
| 80 to 84 Years | 110 (1.4%) | 260 (2.9%) |
| 85 Years and over | 162 (2.0%) | 325 (3.6%) |
| Total | 8,072 (100.0%) | 9,064 (100.0%) |
Families and Households in Graham
Median Family Size in Graham
The median family size in Graham is 2.93 persons per family, with married-couple families (2,938 | 67.8%) accounting for the largest median family size of 3.05 persons per family. On the other hand, single male/father families (289 | 6.7%) represent the smallest median family size with 2.42 persons per family.
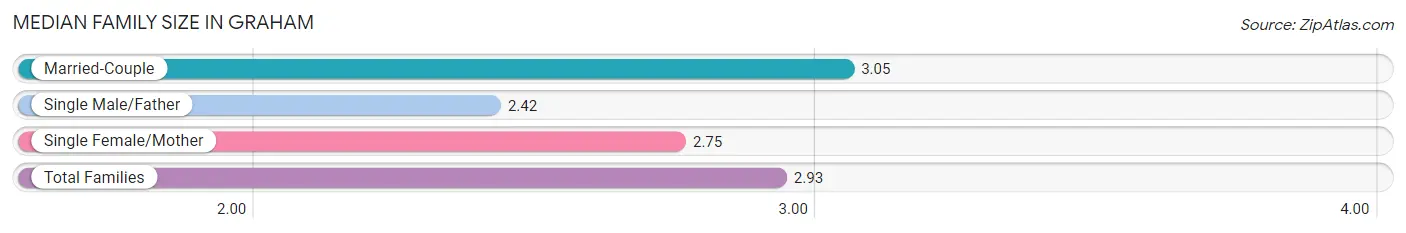
| Family Type | # Families | Family Size |
| Married-Couple | 2,938 (67.8%) | 3.05 |
| Single Male/Father | 289 (6.7%) | 2.42 |
| Single Female/Mother | 1,103 (25.5%) | 2.75 |
| Total Families | 4,330 (100.0%) | 2.93 |
Median Household Size in Graham
The median household size in Graham is 2.26 persons per household, with single female/mother households (1,103 | 14.7%) accounting for the largest median household size of 3.09 persons per household. non-family households (3,166 | 42.2%) represent the smallest median household size with 1.16 persons per household.
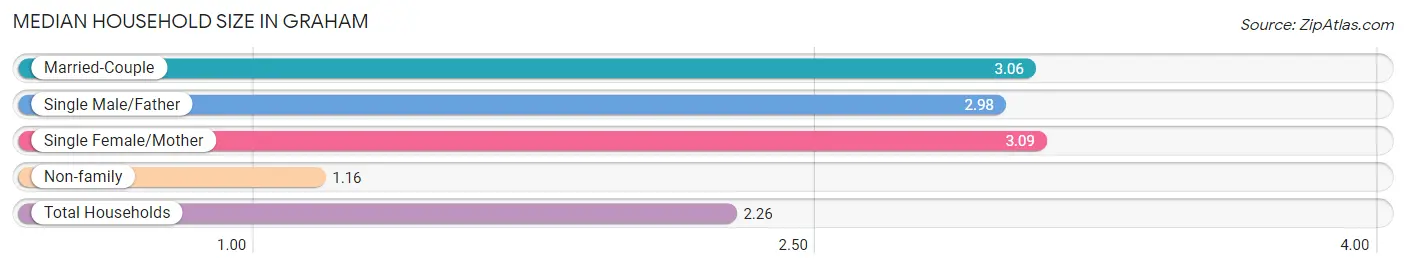
| Household Type | # Households | Household Size |
| Married-Couple | 2,938 (39.2%) | 3.06 |
| Single Male/Father | 289 (3.9%) | 2.98 |
| Single Female/Mother | 1,103 (14.7%) | 3.09 |
| Non-family | 3,166 (42.2%) | 1.16 |
| Total Households | 7,496 (100.0%) | 2.26 |
Household Size by Marriage Status in Graham
Out of a total of 7,496 households in Graham, 4,330 (57.8%) are family households, while 3,166 (42.2%) are nonfamily households. The most numerous type of family households are 2-person households, comprising 2,091, and the most common type of nonfamily households are 1-person households, comprising 2,802.
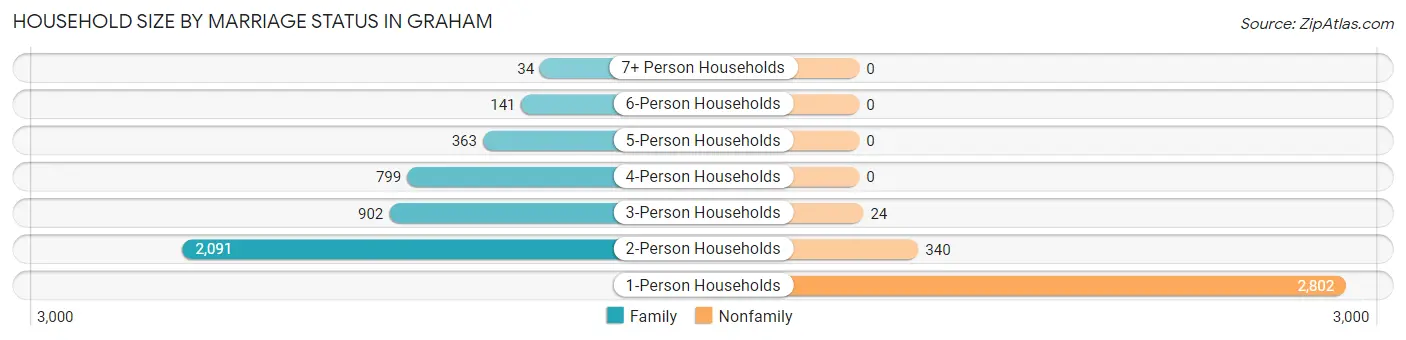
| Household Size | Family Households | Nonfamily Households |
| 1-Person Households | - | 2,802 (37.4%) |
| 2-Person Households | 2,091 (27.9%) | 340 (4.5%) |
| 3-Person Households | 902 (12.0%) | 24 (0.3%) |
| 4-Person Households | 799 (10.7%) | 0 (0.0%) |
| 5-Person Households | 363 (4.8%) | 0 (0.0%) |
| 6-Person Households | 141 (1.9%) | 0 (0.0%) |
| 7+ Person Households | 34 (0.4%) | 0 (0.0%) |
| Total | 4,330 (57.8%) | 3,166 (42.2%) |
Female Fertility in Graham
Fertility by Age in Graham
Average fertility rate in Graham is 64.0 births per 1,000 women. Women in the age bracket of 20 to 34 years have the highest fertility rate with 105.0 births per 1,000 women. Women in the age bracket of 20 to 34 years acount for 84.0% of all women with births.
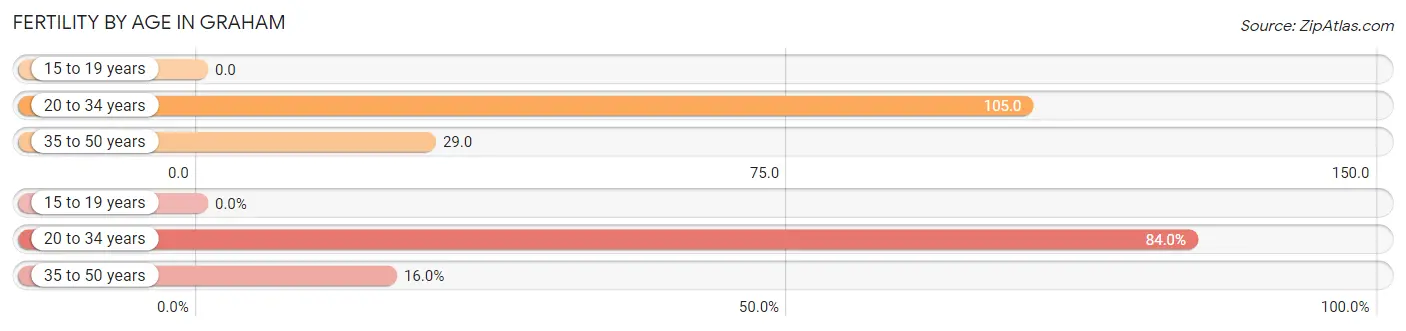
| Age Bracket | Women with Births | Births / 1,000 Women |
| 15 to 19 years | 0 (0.0%) | 0.0 |
| 20 to 34 years | 220 (84.0%) | 105.0 |
| 35 to 50 years | 42 (16.0%) | 29.0 |
| Total | 262 (100.0%) | 64.0 |
Fertility by Age by Marriage Status in Graham
51.1% of women with births (262) in Graham are married. The highest percentage of unmarried women with births falls into 20 to 34 years age bracket with 50.9% of them unmarried at the time of birth, while the lowest percentage of unmarried women with births belong to 35 to 50 years age bracket with 38.1% of them unmarried.
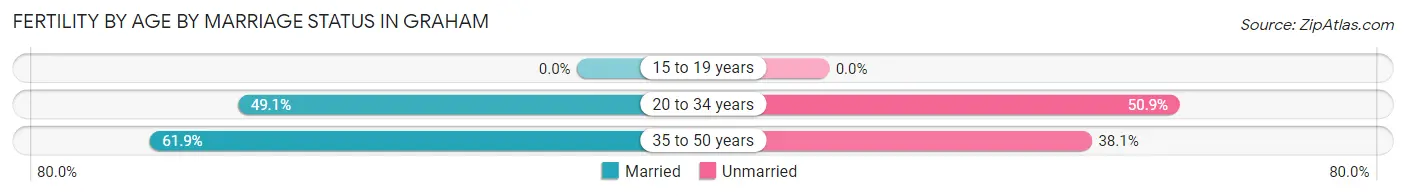
| Age Bracket | Married | Unmarried |
| 15 to 19 years | 0 (0.0%) | 0 (0.0%) |
| 20 to 34 years | 108 (49.1%) | 112 (50.9%) |
| 35 to 50 years | 26 (61.9%) | 16 (38.1%) |
| Total | 134 (51.1%) | 128 (48.8%) |
Fertility by Education in Graham
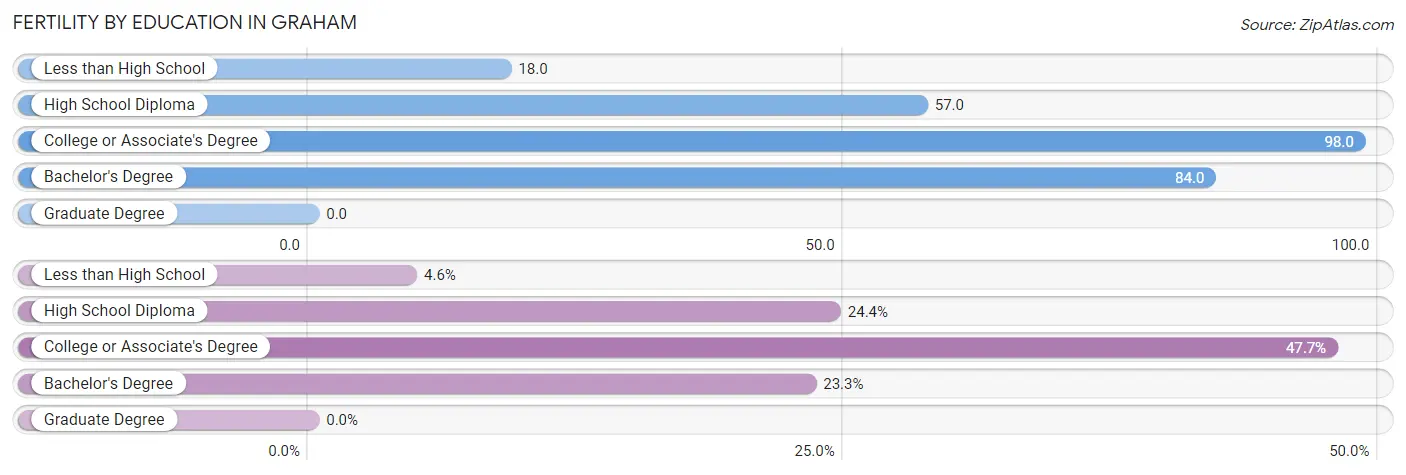
| Educational Attainment | Women with Births | Births / 1,000 Women |
| Less than High School | 12 (4.6%) | 18.0 |
| High School Diploma | 64 (24.4%) | 57.0 |
| College or Associate's Degree | 125 (47.7%) | 98.0 |
| Bachelor's Degree | 61 (23.3%) | 84.0 |
| Graduate Degree | 0 (0.0%) | 0.0 |
| Total | 262 (100.0%) | 64.0 |
Fertility by Education by Marriage Status in Graham
48.8% of women with births in Graham are unmarried. Women with the educational attainment of less than high school are most likely to be married with 100.0% of them married at childbirth, while women with the educational attainment of high school diploma are least likely to be married with 100.0% of them unmarried at childbirth.
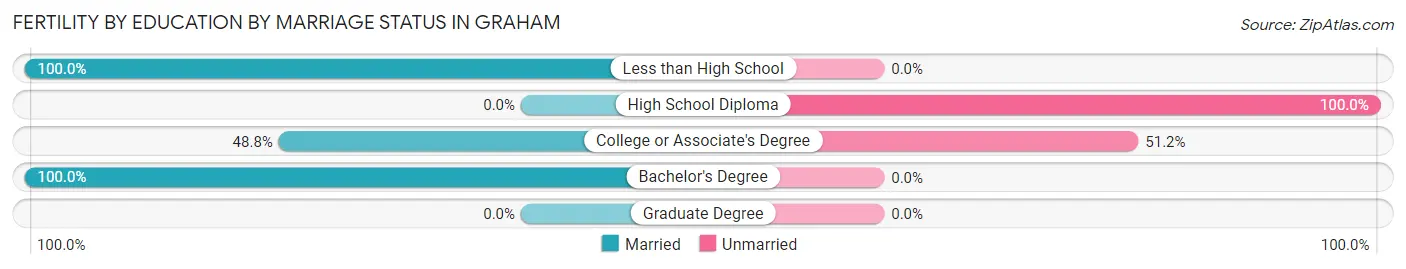
| Educational Attainment | Married | Unmarried |
| Less than High School | 12 (100.0%) | 0 (0.0%) |
| High School Diploma | 0 (0.0%) | 64 (100.0%) |
| College or Associate's Degree | 61 (48.8%) | 64 (51.2%) |
| Bachelor's Degree | 61 (100.0%) | 0 (0.0%) |
| Graduate Degree | 0 (0.0%) | 0 (0.0%) |
| Total | 134 (51.1%) | 128 (48.8%) |
Employment Characteristics in Graham
Employment by Class of Employer in Graham
Among the 7,529 employed individuals in Graham, private company employees (5,236 | 69.5%), not-for-profit organizations (621 | 8.3%), and state government employees (526 | 7.0%) make up the most common classes of employment.
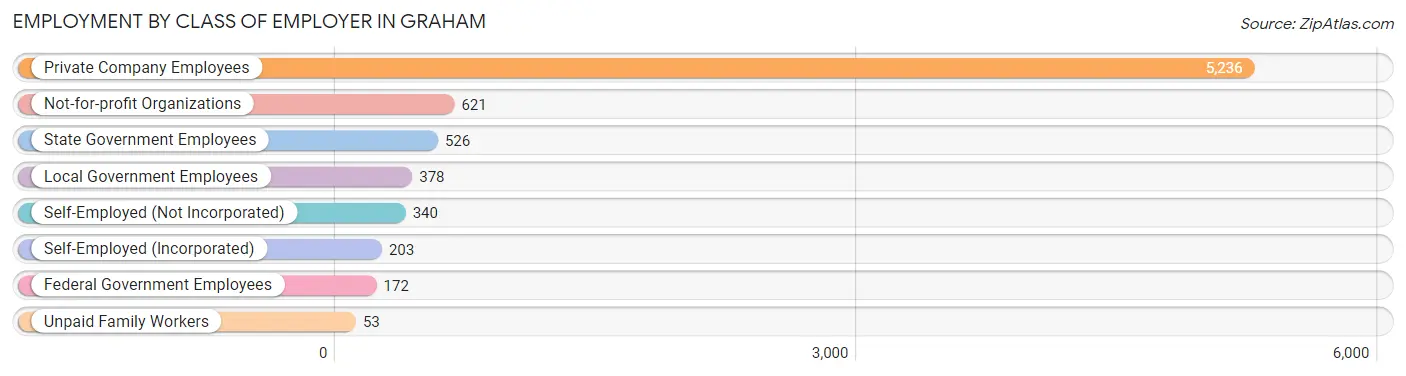
| Employer Class | # Employees | % Employees |
| Private Company Employees | 5,236 | 69.5% |
| Self-Employed (Incorporated) | 203 | 2.7% |
| Self-Employed (Not Incorporated) | 340 | 4.5% |
| Not-for-profit Organizations | 621 | 8.3% |
| Local Government Employees | 378 | 5.0% |
| State Government Employees | 526 | 7.0% |
| Federal Government Employees | 172 | 2.3% |
| Unpaid Family Workers | 53 | 0.7% |
| Total | 7,529 | 100.0% |
Employment Status by Age in Graham
According to the labor force statistics for Graham, out of the total population over 16 years of age (13,874), 61.0% or 8,463 individuals are in the labor force, with 8.1% or 686 of them unemployed. The age group with the highest labor force participation rate is 35 to 44 years, with 82.7% or 1,412 individuals in the labor force. Within the labor force, the 16 to 19 years age range has the highest percentage of unemployed individuals, with 33.6% or 140 of them being unemployed.
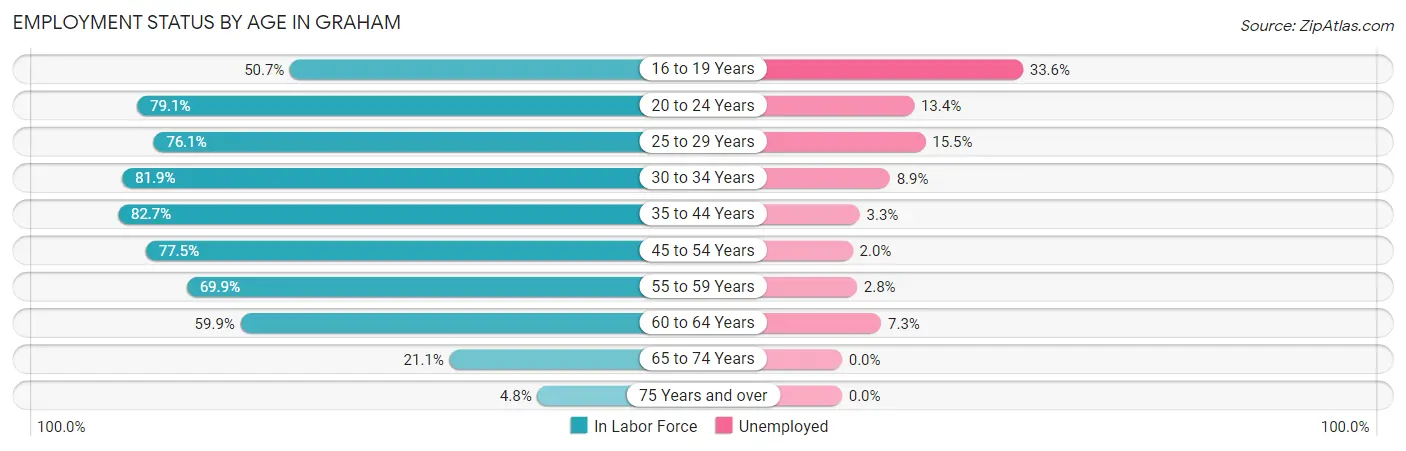
| Age Bracket | In Labor Force | Unemployed |
| 16 to 19 Years | 417 (50.7%) | 140 (33.6%) |
| 20 to 24 Years | 792 (79.1%) | 106 (13.4%) |
| 25 to 29 Years | 1,126 (76.1%) | 175 (15.5%) |
| 30 to 34 Years | 1,247 (81.9%) | 111 (8.9%) |
| 35 to 44 Years | 1,412 (82.7%) | 47 (3.3%) |
| 45 to 54 Years | 1,460 (77.5%) | 29 (2.0%) |
| 55 to 59 Years | 892 (69.9%) | 25 (2.8%) |
| 60 to 64 Years | 731 (59.9%) | 53 (7.3%) |
| 65 to 74 Years | 311 (21.1%) | 0 (0.0%) |
| 75 Years and over | 71 (4.8%) | 0 (0.0%) |
| Total | 8,463 (61.0%) | 686 (8.1%) |
Employment Status by Educational Attainment in Graham
According to labor force statistics for Graham, 75.5% of individuals (6,862) out of the total population between 25 and 64 years of age (9,089) are in the labor force, with 6.4% or 439 of them being unemployed. The group with the highest labor force participation rate are those with the educational attainment of bachelor's degree or higher, with 85.6% or 1,782 individuals in the labor force. Within the labor force, individuals with less than high school education have the highest percentage of unemployment, with 10.1% or 71 of them being unemployed.
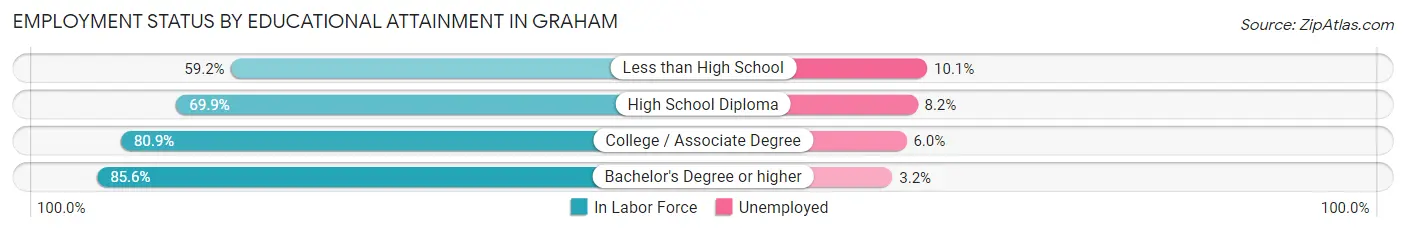
| Educational Attainment | In Labor Force | Unemployed |
| Less than High School | 702 (59.2%) | 120 (10.1%) |
| High School Diploma | 2,087 (69.9%) | 245 (8.2%) |
| College / Associate Degree | 2,295 (80.9%) | 170 (6.0%) |
| Bachelor's Degree or higher | 1,782 (85.6%) | 67 (3.2%) |
| Total | 6,862 (75.5%) | 582 (6.4%) |
Employment Occupations by Sex in Graham
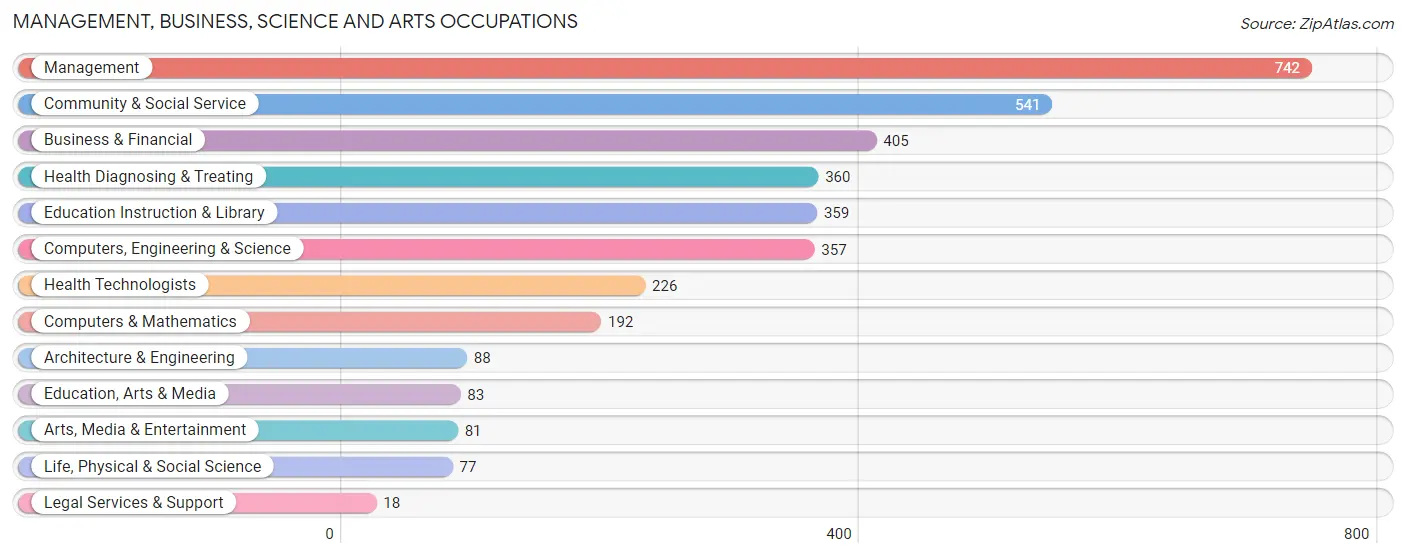
Management, Business, Science and Arts Occupations
The most common Management, Business, Science and Arts occupations in Graham are Management (742 | 9.6%), Community & Social Service (541 | 7.0%), Business & Financial (405 | 5.2%), Health Diagnosing & Treating (360 | 4.7%), and Education Instruction & Library (359 | 4.6%).
Management, Business, Science and Arts Occupations by Sex
Within the Management, Business, Science and Arts occupations in Graham, the most male-oriented occupations are Architecture & Engineering (100.0%), Computers, Engineering & Science (85.2%), and Computers & Mathematics (84.9%), while the most female-oriented occupations are Legal Services & Support (100.0%), Health Diagnosing & Treating (100.0%), and Health Technologists (100.0%).
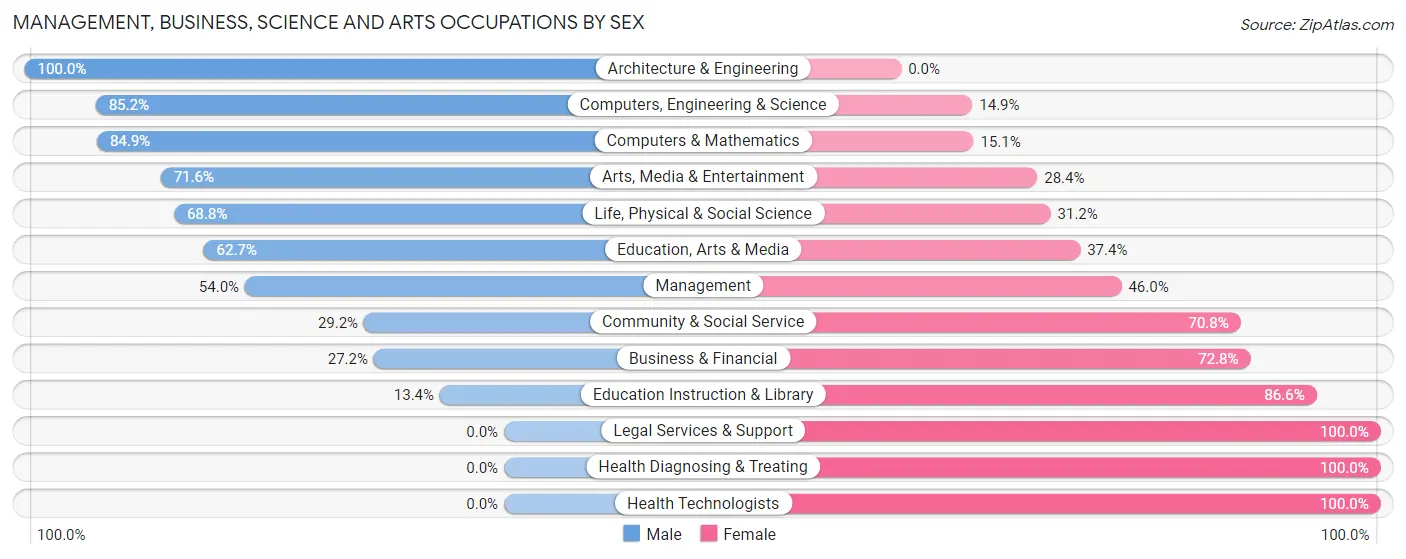
| Occupation | Male | Female |
| Management | 401 (54.0%) | 341 (46.0%) |
| Business & Financial | 110 (27.2%) | 295 (72.8%) |
| Computers, Engineering & Science | 304 (85.2%) | 53 (14.8%) |
| Computers & Mathematics | 163 (84.9%) | 29 (15.1%) |
| Architecture & Engineering | 88 (100.0%) | 0 (0.0%) |
| Life, Physical & Social Science | 53 (68.8%) | 24 (31.2%) |
| Community & Social Service | 158 (29.2%) | 383 (70.8%) |
| Education, Arts & Media | 52 (62.6%) | 31 (37.3%) |
| Legal Services & Support | 0 (0.0%) | 18 (100.0%) |
| Education Instruction & Library | 48 (13.4%) | 311 (86.6%) |
| Arts, Media & Entertainment | 58 (71.6%) | 23 (28.4%) |
| Health Diagnosing & Treating | 0 (0.0%) | 360 (100.0%) |
| Health Technologists | 0 (0.0%) | 226 (100.0%) |
| Total (Category) | 973 (40.5%) | 1,432 (59.5%) |
| Total (Overall) | 3,988 (51.6%) | 3,738 (48.4%) |
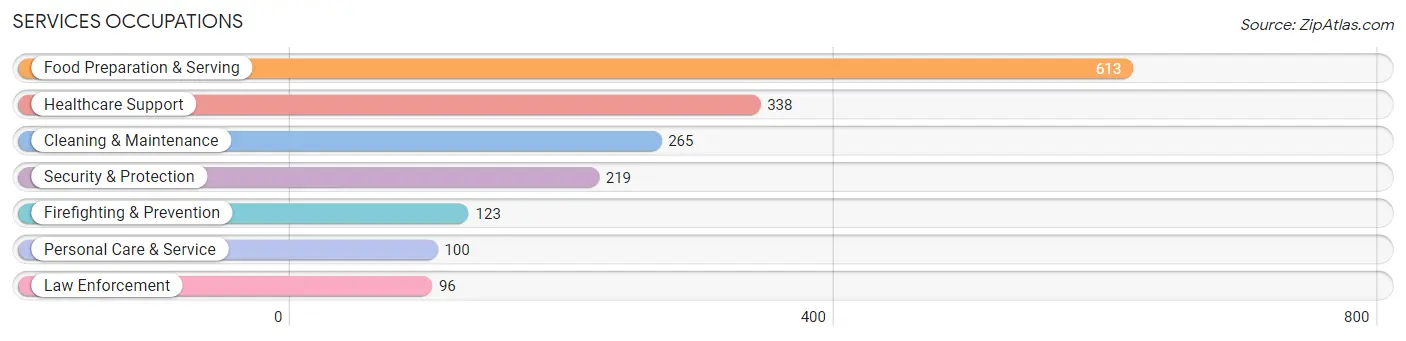
Services Occupations
The most common Services occupations in Graham are Food Preparation & Serving (613 | 7.9%), Healthcare Support (338 | 4.4%), Cleaning & Maintenance (265 | 3.4%), Security & Protection (219 | 2.8%), and Firefighting & Prevention (123 | 1.6%).
Services Occupations by Sex
Within the Services occupations in Graham, the most male-oriented occupations are Cleaning & Maintenance (66.8%), Firefighting & Prevention (54.5%), and Security & Protection (50.2%), while the most female-oriented occupations are Personal Care & Service (93.0%), Healthcare Support (85.5%), and Food Preparation & Serving (60.2%).
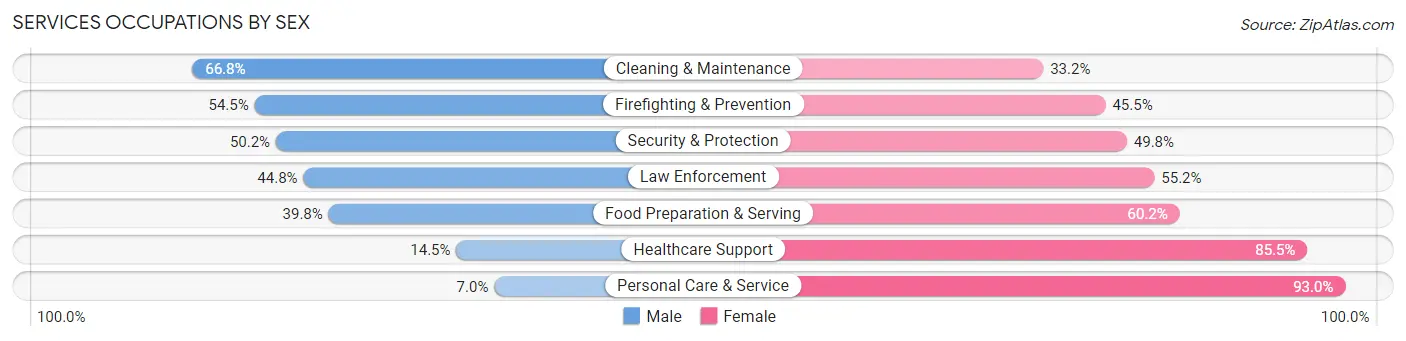
| Occupation | Male | Female |
| Healthcare Support | 49 (14.5%) | 289 (85.5%) |
| Security & Protection | 110 (50.2%) | 109 (49.8%) |
| Firefighting & Prevention | 67 (54.5%) | 56 (45.5%) |
| Law Enforcement | 43 (44.8%) | 53 (55.2%) |
| Food Preparation & Serving | 244 (39.8%) | 369 (60.2%) |
| Cleaning & Maintenance | 177 (66.8%) | 88 (33.2%) |
| Personal Care & Service | 7 (7.0%) | 93 (93.0%) |
| Total (Category) | 587 (38.2%) | 948 (61.8%) |
| Total (Overall) | 3,988 (51.6%) | 3,738 (48.4%) |
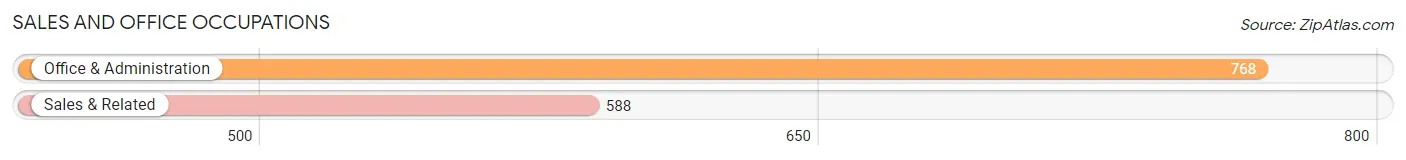
Sales and Office Occupations
The most common Sales and Office occupations in Graham are Office & Administration (768 | 9.9%), and Sales & Related (588 | 7.6%).
Sales and Office Occupations by Sex
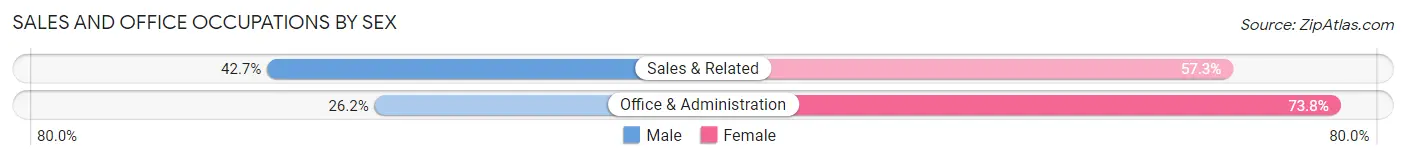
| Occupation | Male | Female |
| Sales & Related | 251 (42.7%) | 337 (57.3%) |
| Office & Administration | 201 (26.2%) | 567 (73.8%) |
| Total (Category) | 452 (33.3%) | 904 (66.7%) |
| Total (Overall) | 3,988 (51.6%) | 3,738 (48.4%) |
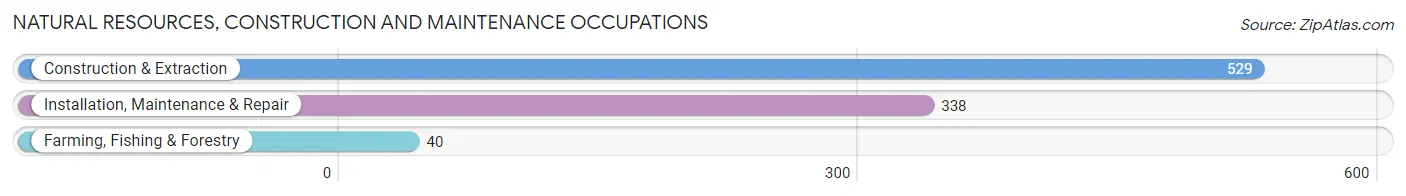
Natural Resources, Construction and Maintenance Occupations
The most common Natural Resources, Construction and Maintenance occupations in Graham are Construction & Extraction (529 | 6.9%), Installation, Maintenance & Repair (338 | 4.4%), and Farming, Fishing & Forestry (40 | 0.5%).
Natural Resources, Construction and Maintenance Occupations by Sex
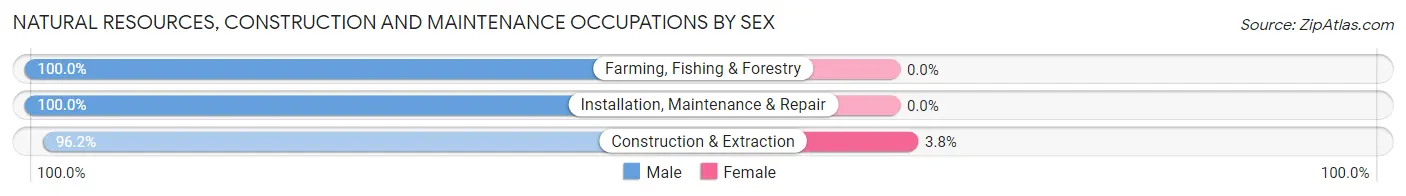
| Occupation | Male | Female |
| Farming, Fishing & Forestry | 40 (100.0%) | 0 (0.0%) |
| Construction & Extraction | 509 (96.2%) | 20 (3.8%) |
| Installation, Maintenance & Repair | 338 (100.0%) | 0 (0.0%) |
| Total (Category) | 887 (97.8%) | 20 (2.2%) |
| Total (Overall) | 3,988 (51.6%) | 3,738 (48.4%) |
Production, Transportation and Moving Occupations
The most common Production, Transportation and Moving occupations in Graham are Production (648 | 8.4%), Material Moving (510 | 6.6%), and Transportation (365 | 4.7%).
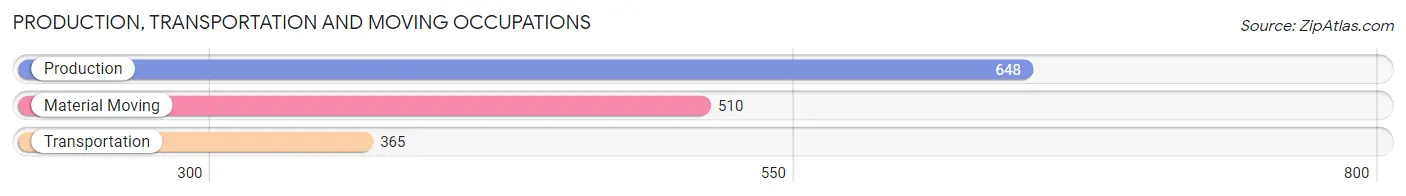
Production, Transportation and Moving Occupations by Sex
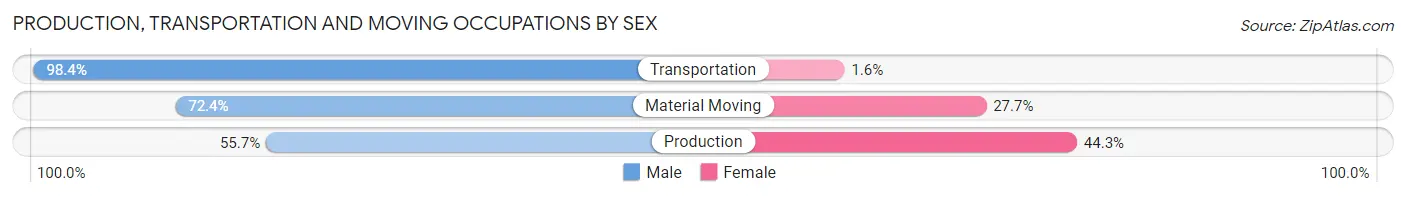
| Occupation | Male | Female |
| Production | 361 (55.7%) | 287 (44.3%) |
| Transportation | 359 (98.4%) | 6 (1.6%) |
| Material Moving | 369 (72.4%) | 141 (27.7%) |
| Total (Category) | 1,089 (71.5%) | 434 (28.5%) |
| Total (Overall) | 3,988 (51.6%) | 3,738 (48.4%) |
Employment Industries by Sex in Graham
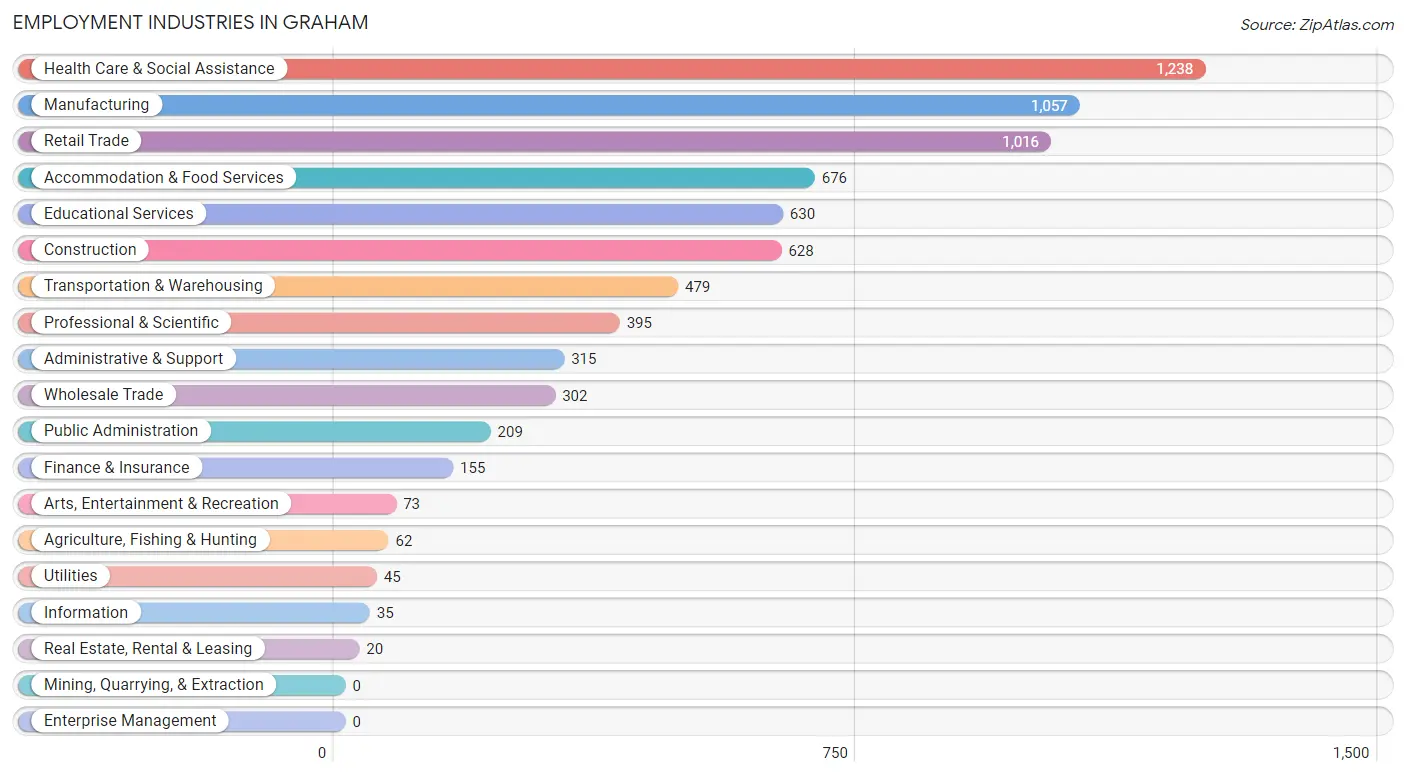
Employment Industries in Graham
The major employment industries in Graham include Health Care & Social Assistance (1,238 | 16.0%), Manufacturing (1,057 | 13.7%), Retail Trade (1,016 | 13.2%), Accommodation & Food Services (676 | 8.7%), and Educational Services (630 | 8.2%).
Employment Industries by Sex in Graham
The Graham industries that see more men than women are Agriculture, Fishing & Hunting (100.0%), Utilities (100.0%), and Arts, Entertainment & Recreation (100.0%), whereas the industries that tend to have a higher number of women are Real Estate, Rental & Leasing (100.0%), Health Care & Social Assistance (86.6%), and Educational Services (80.6%).
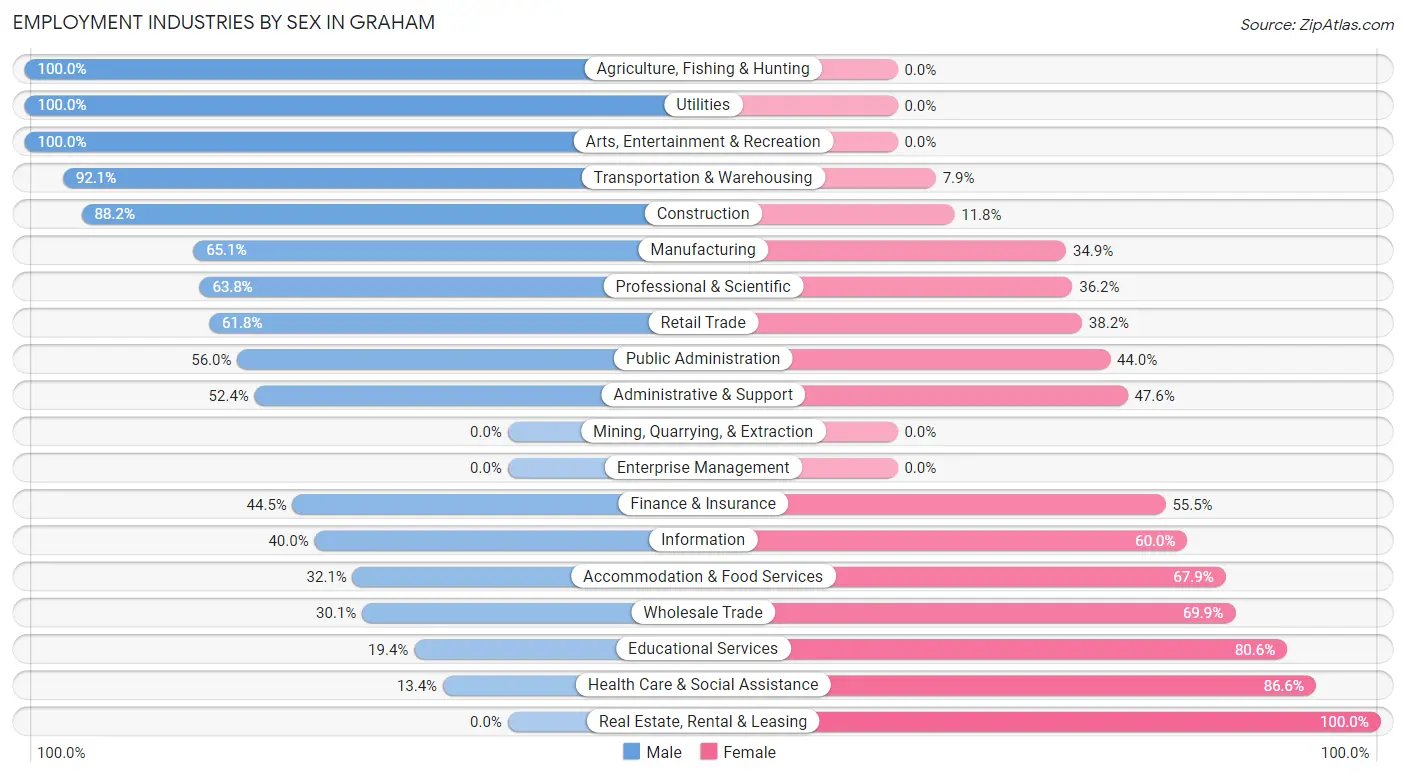
| Industry | Male | Female |
| Agriculture, Fishing & Hunting | 62 (100.0%) | 0 (0.0%) |
| Mining, Quarrying, & Extraction | 0 (0.0%) | 0 (0.0%) |
| Construction | 554 (88.2%) | 74 (11.8%) |
| Manufacturing | 688 (65.1%) | 369 (34.9%) |
| Wholesale Trade | 91 (30.1%) | 211 (69.9%) |
| Retail Trade | 628 (61.8%) | 388 (38.2%) |
| Transportation & Warehousing | 441 (92.1%) | 38 (7.9%) |
| Utilities | 45 (100.0%) | 0 (0.0%) |
| Information | 14 (40.0%) | 21 (60.0%) |
| Finance & Insurance | 69 (44.5%) | 86 (55.5%) |
| Real Estate, Rental & Leasing | 0 (0.0%) | 20 (100.0%) |
| Professional & Scientific | 252 (63.8%) | 143 (36.2%) |
| Enterprise Management | 0 (0.0%) | 0 (0.0%) |
| Administrative & Support | 165 (52.4%) | 150 (47.6%) |
| Educational Services | 122 (19.4%) | 508 (80.6%) |
| Health Care & Social Assistance | 166 (13.4%) | 1,072 (86.6%) |
| Arts, Entertainment & Recreation | 73 (100.0%) | 0 (0.0%) |
| Accommodation & Food Services | 217 (32.1%) | 459 (67.9%) |
| Public Administration | 117 (56.0%) | 92 (44.0%) |
| Total | 3,988 (51.6%) | 3,738 (48.4%) |
Education in Graham
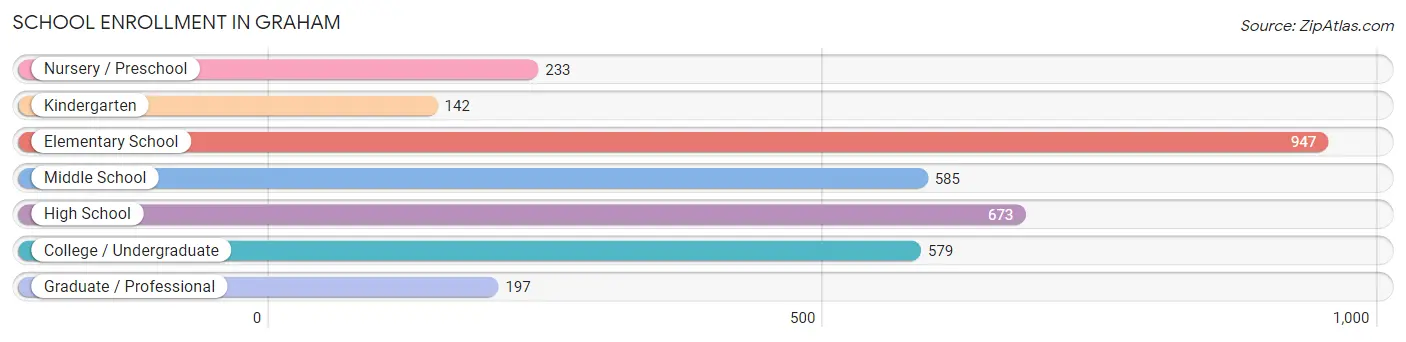
School Enrollment in Graham
The most common levels of schooling among the 3,356 students in Graham are elementary school (947 | 28.2%), high school (673 | 20.1%), and middle school (585 | 17.4%).
| School Level | # Students | % Students |
| Nursery / Preschool | 233 | 6.9% |
| Kindergarten | 142 | 4.2% |
| Elementary School | 947 | 28.2% |
| Middle School | 585 | 17.4% |
| High School | 673 | 20.1% |
| College / Undergraduate | 579 | 17.2% |
| Graduate / Professional | 197 | 5.9% |
| Total | 3,356 | 100.0% |
School Enrollment by Age by Funding Source in Graham
Out of a total of 3,356 students who are enrolled in schools in Graham, 691 (20.6%) attend a private institution, while the remaining 2,665 (79.4%) are enrolled in public schools. The age group of 3 to 4 year olds has the highest likelihood of being enrolled in private schools, with 101 (67.8% in the age bracket) enrolled. Conversely, the age group of 10 to 14 year olds has the lowest likelihood of being enrolled in a private school, with 716 (94.1% in the age bracket) attending a public institution.
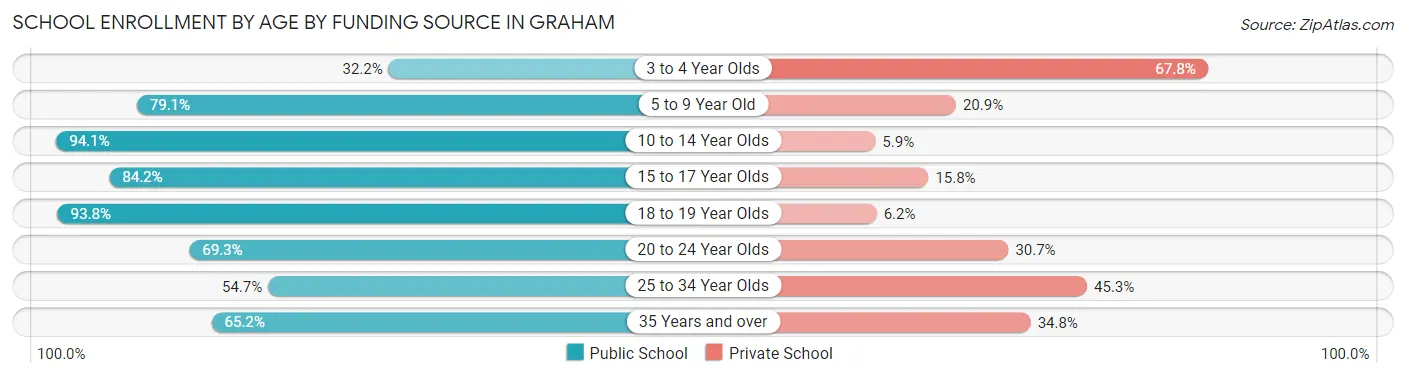
| Age Bracket | Public School | Private School |
| 3 to 4 Year Olds | 48 (32.2%) | 101 (67.8%) |
| 5 to 9 Year Old | 892 (79.1%) | 236 (20.9%) |
| 10 to 14 Year Olds | 716 (94.1%) | 45 (5.9%) |
| 15 to 17 Year Olds | 432 (84.2%) | 81 (15.8%) |
| 18 to 19 Year Olds | 198 (93.8%) | 13 (6.2%) |
| 20 to 24 Year Olds | 131 (69.3%) | 58 (30.7%) |
| 25 to 34 Year Olds | 88 (54.7%) | 73 (45.3%) |
| 35 Years and over | 159 (65.2%) | 85 (34.8%) |
| Total | 2,665 (79.4%) | 691 (20.6%) |
Educational Attainment by Field of Study in Graham
Business (781 | 25.8%), education (477 | 15.7%), science & technology (405 | 13.4%), bio, nature & agricultural (215 | 7.1%), and arts & humanities (206 | 6.8%) are the most common fields of study among 3,030 individuals in Graham who have obtained a bachelor's degree or higher.
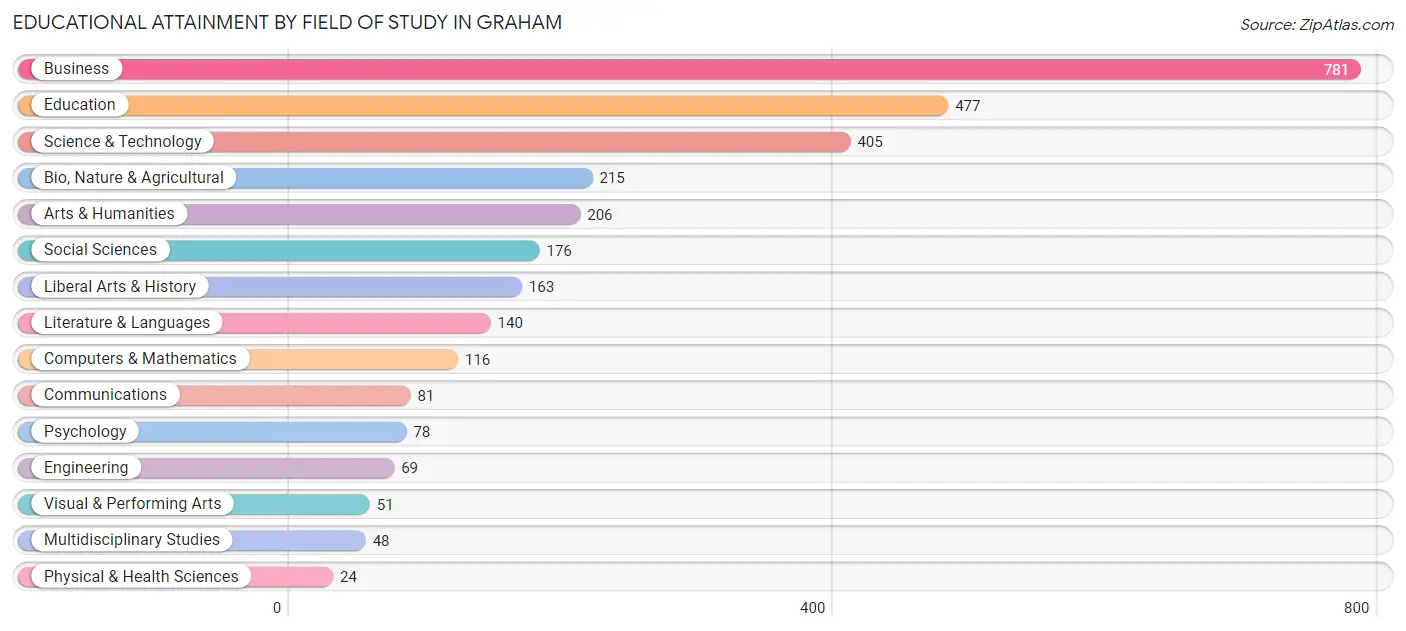
| Field of Study | # Graduates | % Graduates |
| Computers & Mathematics | 116 | 3.8% |
| Bio, Nature & Agricultural | 215 | 7.1% |
| Physical & Health Sciences | 24 | 0.8% |
| Psychology | 78 | 2.6% |
| Social Sciences | 176 | 5.8% |
| Engineering | 69 | 2.3% |
| Multidisciplinary Studies | 48 | 1.6% |
| Science & Technology | 405 | 13.4% |
| Business | 781 | 25.8% |
| Education | 477 | 15.7% |
| Literature & Languages | 140 | 4.6% |
| Liberal Arts & History | 163 | 5.4% |
| Visual & Performing Arts | 51 | 1.7% |
| Communications | 81 | 2.7% |
| Arts & Humanities | 206 | 6.8% |
| Total | 3,030 | 100.0% |
Transportation & Commute in Graham
Vehicle Availability by Sex in Graham
The most prevalent vehicle ownership categories in Graham are males with 2 vehicles (1,595, accounting for 41.1%) and females with 2 vehicles (1,331, making up 43.8%).
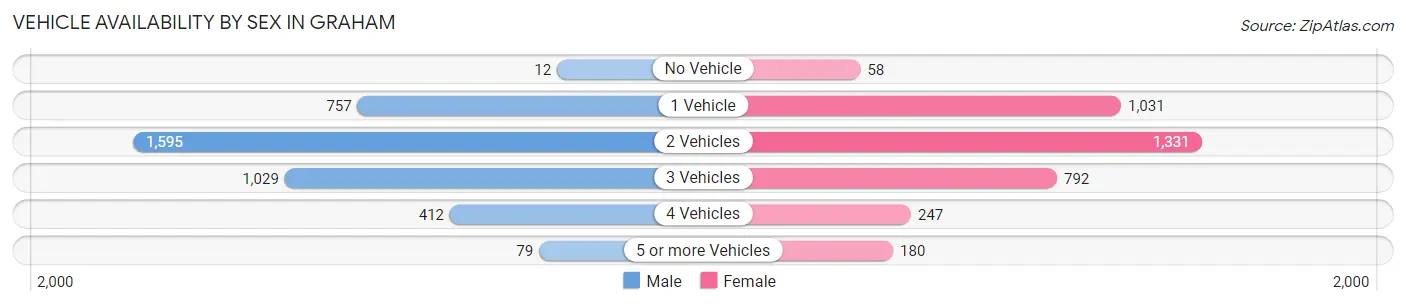
| Vehicles Available | Male | Female |
| No Vehicle | 12 (0.3%) | 58 (1.6%) |
| 1 Vehicle | 757 (19.5%) | 1,031 (28.3%) |
| 2 Vehicles | 1,595 (41.1%) | 1,331 (36.6%) |
| 3 Vehicles | 1,029 (26.5%) | 792 (21.8%) |
| 4 Vehicles | 412 (10.6%) | 247 (6.8%) |
| 5 or more Vehicles | 79 (2.0%) | 180 (5.0%) |
| Total | 3,884 (100.0%) | 3,639 (100.0%) |
Commute Time in Graham
The most frequently occuring commute durations in Graham are 15 to 19 minutes (1,025 commuters, 14.6%), 20 to 24 minutes (867 commuters, 12.3%), and 30 to 34 minutes (806 commuters, 11.5%).
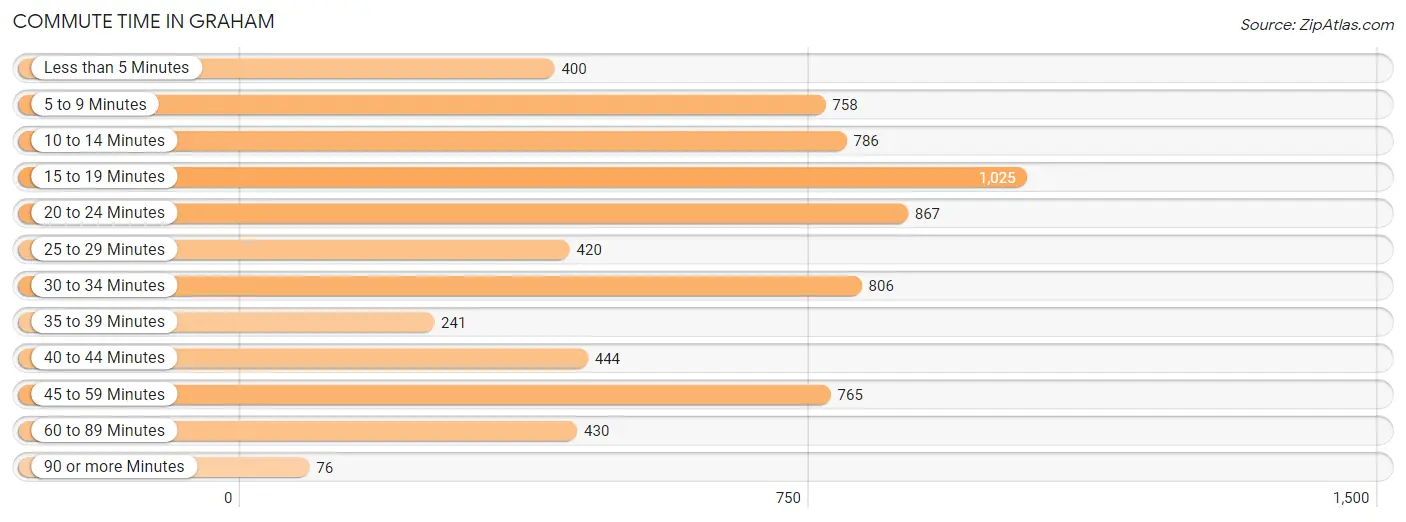
| Commute Time | # Commuters | % Commuters |
| Less than 5 Minutes | 400 | 5.7% |
| 5 to 9 Minutes | 758 | 10.8% |
| 10 to 14 Minutes | 786 | 11.2% |
| 15 to 19 Minutes | 1,025 | 14.6% |
| 20 to 24 Minutes | 867 | 12.3% |
| 25 to 29 Minutes | 420 | 6.0% |
| 30 to 34 Minutes | 806 | 11.5% |
| 35 to 39 Minutes | 241 | 3.4% |
| 40 to 44 Minutes | 444 | 6.3% |
| 45 to 59 Minutes | 765 | 10.9% |
| 60 to 89 Minutes | 430 | 6.1% |
| 90 or more Minutes | 76 | 1.1% |
Commute Time by Sex in Graham
The most common commute times in Graham are 5 to 9 minutes (449 commuters, 12.3%) for males and 15 to 19 minutes (622 commuters, 18.5%) for females.
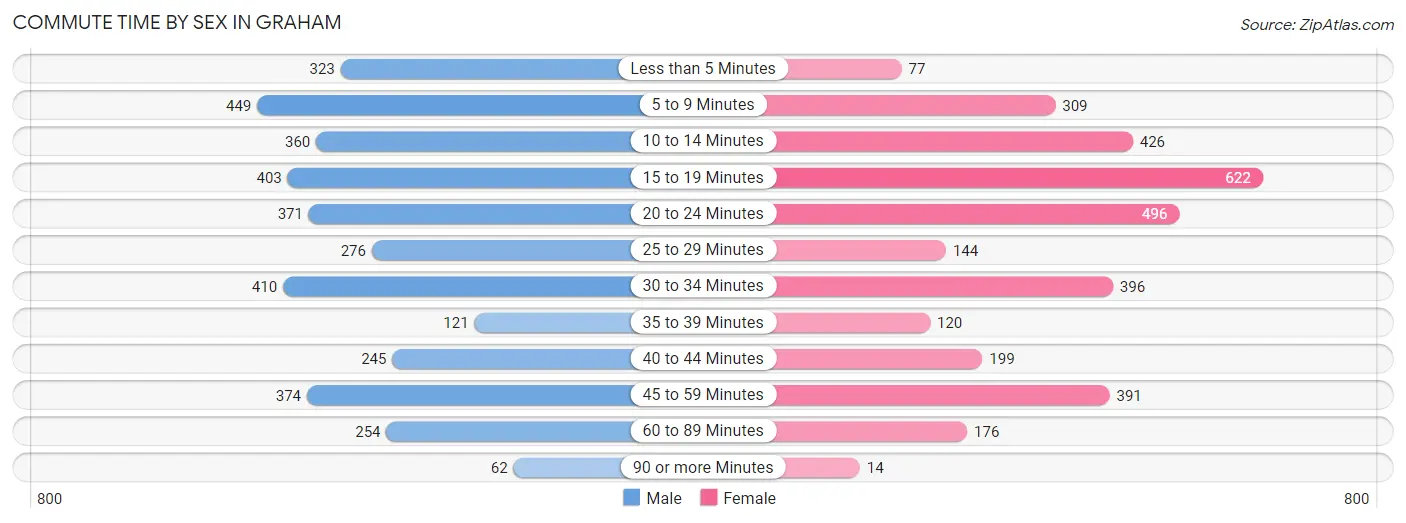
| Commute Time | Male | Female |
| Less than 5 Minutes | 323 (8.8%) | 77 (2.3%) |
| 5 to 9 Minutes | 449 (12.3%) | 309 (9.2%) |
| 10 to 14 Minutes | 360 (9.9%) | 426 (12.6%) |
| 15 to 19 Minutes | 403 (11.1%) | 622 (18.5%) |
| 20 to 24 Minutes | 371 (10.2%) | 496 (14.7%) |
| 25 to 29 Minutes | 276 (7.6%) | 144 (4.3%) |
| 30 to 34 Minutes | 410 (11.2%) | 396 (11.7%) |
| 35 to 39 Minutes | 121 (3.3%) | 120 (3.6%) |
| 40 to 44 Minutes | 245 (6.7%) | 199 (5.9%) |
| 45 to 59 Minutes | 374 (10.2%) | 391 (11.6%) |
| 60 to 89 Minutes | 254 (7.0%) | 176 (5.2%) |
| 90 or more Minutes | 62 (1.7%) | 14 (0.4%) |
Time of Departure to Work by Sex in Graham
The most frequent times of departure to work in Graham are 7:00 AM to 7:29 AM (738, 20.2%) for males and 6:30 AM to 6:59 AM (623, 18.5%) for females.
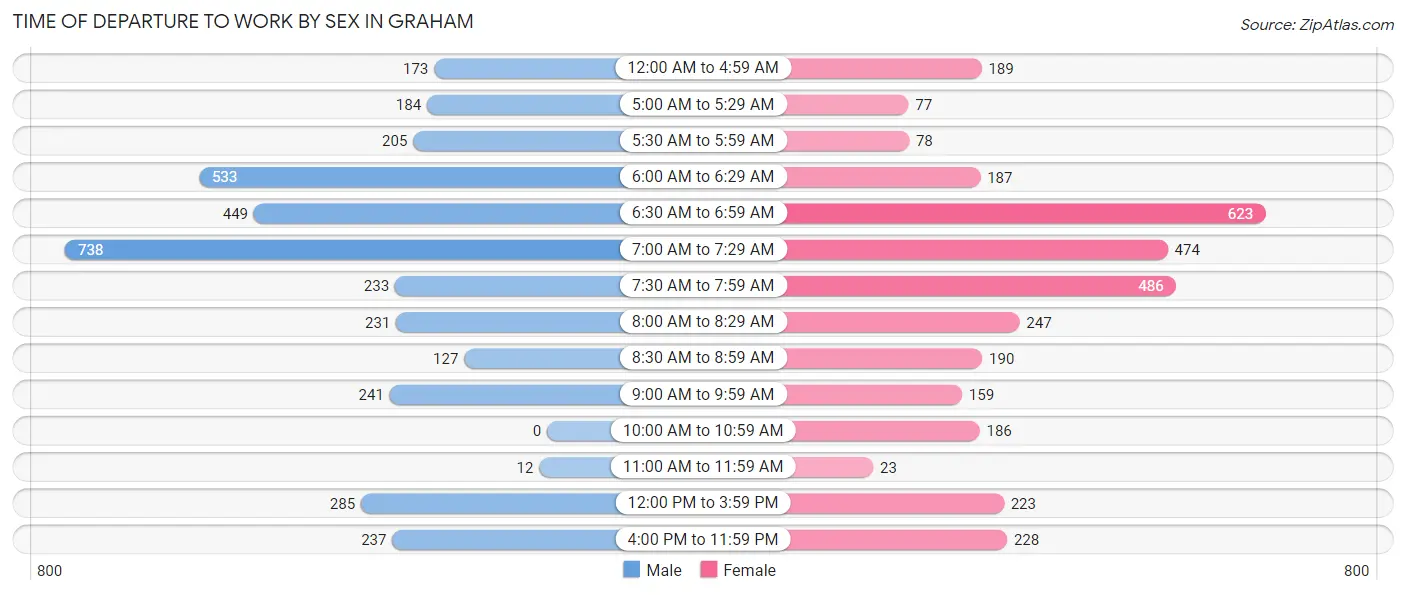
| Time of Departure | Male | Female |
| 12:00 AM to 4:59 AM | 173 (4.7%) | 189 (5.6%) |
| 5:00 AM to 5:29 AM | 184 (5.0%) | 77 (2.3%) |
| 5:30 AM to 5:59 AM | 205 (5.6%) | 78 (2.3%) |
| 6:00 AM to 6:29 AM | 533 (14.6%) | 187 (5.6%) |
| 6:30 AM to 6:59 AM | 449 (12.3%) | 623 (18.5%) |
| 7:00 AM to 7:29 AM | 738 (20.2%) | 474 (14.1%) |
| 7:30 AM to 7:59 AM | 233 (6.4%) | 486 (14.4%) |
| 8:00 AM to 8:29 AM | 231 (6.3%) | 247 (7.3%) |
| 8:30 AM to 8:59 AM | 127 (3.5%) | 190 (5.6%) |
| 9:00 AM to 9:59 AM | 241 (6.6%) | 159 (4.7%) |
| 10:00 AM to 10:59 AM | 0 (0.0%) | 186 (5.5%) |
| 11:00 AM to 11:59 AM | 12 (0.3%) | 23 (0.7%) |
| 12:00 PM to 3:59 PM | 285 (7.8%) | 223 (6.6%) |
| 4:00 PM to 11:59 PM | 237 (6.5%) | 228 (6.8%) |
| Total | 3,648 (100.0%) | 3,370 (100.0%) |
Housing Occupancy in Graham
Occupancy by Ownership in Graham
Of the total 7,496 dwellings in Graham, owner-occupied units account for 4,044 (53.9%), while renter-occupied units make up 3,452 (46.1%).
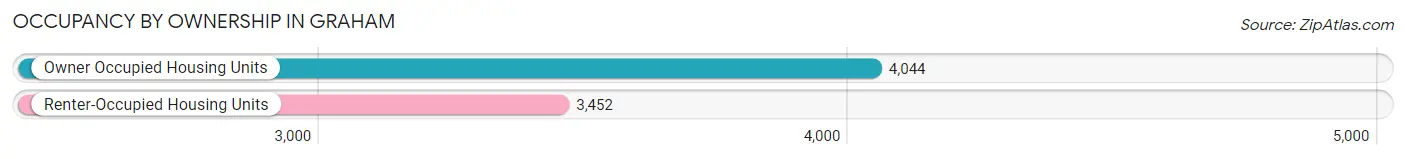
| Occupancy | # Housing Units | % Housing Units |
| Owner Occupied Housing Units | 4,044 | 53.9% |
| Renter-Occupied Housing Units | 3,452 | 46.1% |
| Total Occupied Housing Units | 7,496 | 100.0% |
Occupancy by Household Size in Graham
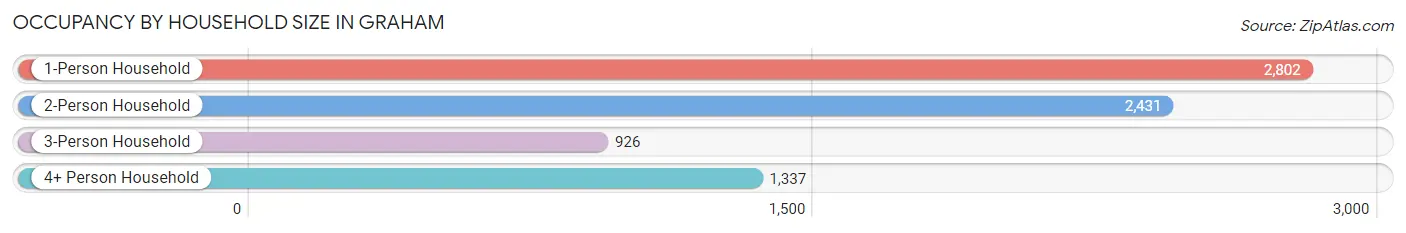
| Household Size | # Housing Units | % Housing Units |
| 1-Person Household | 2,802 | 37.4% |
| 2-Person Household | 2,431 | 32.4% |
| 3-Person Household | 926 | 12.3% |
| 4+ Person Household | 1,337 | 17.8% |
| Total Housing Units | 7,496 | 100.0% |
Occupancy by Ownership by Household Size in Graham
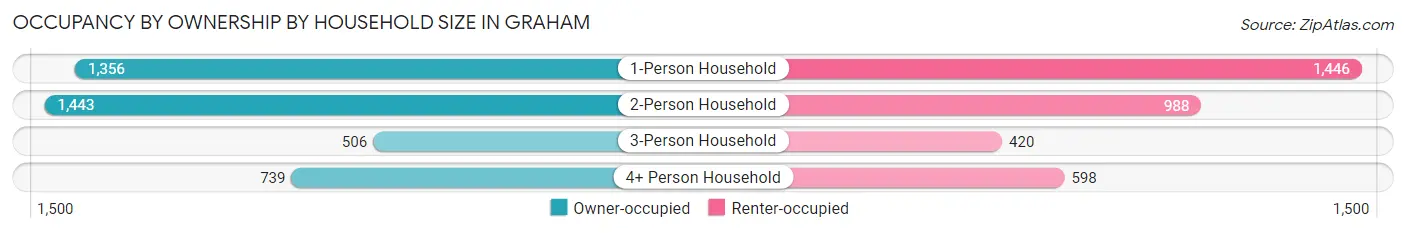
| Household Size | Owner-occupied | Renter-occupied |
| 1-Person Household | 1,356 (48.4%) | 1,446 (51.6%) |
| 2-Person Household | 1,443 (59.4%) | 988 (40.6%) |
| 3-Person Household | 506 (54.6%) | 420 (45.4%) |
| 4+ Person Household | 739 (55.3%) | 598 (44.7%) |
| Total Housing Units | 4,044 (53.9%) | 3,452 (46.1%) |
Occupancy by Educational Attainment in Graham
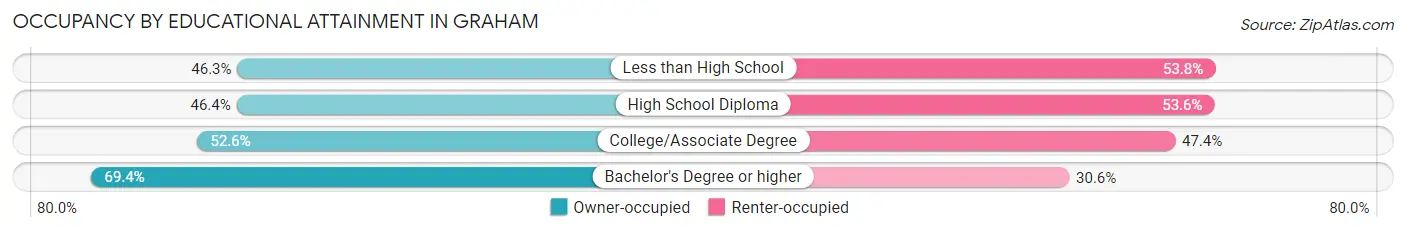
| Household Size | Owner-occupied | Renter-occupied |
| Less than High School | 388 (46.3%) | 451 (53.7%) |
| High School Diploma | 986 (46.4%) | 1,140 (53.6%) |
| College/Associate Degree | 1,484 (52.6%) | 1,338 (47.4%) |
| Bachelor's Degree or higher | 1,186 (69.4%) | 523 (30.6%) |
Occupancy by Age of Householder in Graham
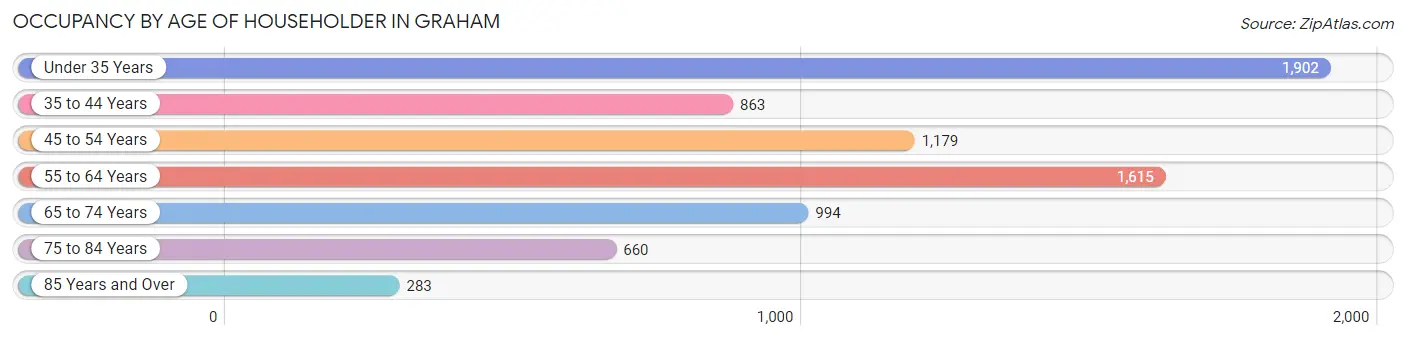
| Age Bracket | # Households | % Households |
| Under 35 Years | 1,902 | 25.4% |
| 35 to 44 Years | 863 | 11.5% |
| 45 to 54 Years | 1,179 | 15.7% |
| 55 to 64 Years | 1,615 | 21.5% |
| 65 to 74 Years | 994 | 13.3% |
| 75 to 84 Years | 660 | 8.8% |
| 85 Years and Over | 283 | 3.8% |
| Total | 7,496 | 100.0% |
Housing Finances in Graham
Median Income by Occupancy in Graham
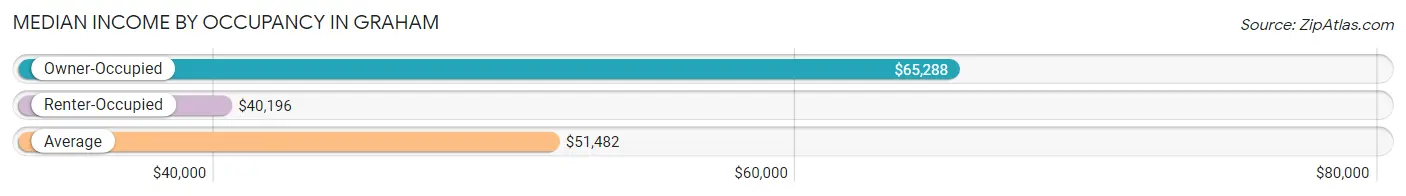
| Occupancy Type | # Households | Median Income |
| Owner-Occupied | 4,044 (53.9%) | $65,288 |
| Renter-Occupied | 3,452 (46.1%) | $40,196 |
| Average | 7,496 (100.0%) | $51,482 |
Occupancy by Householder Income Bracket in Graham
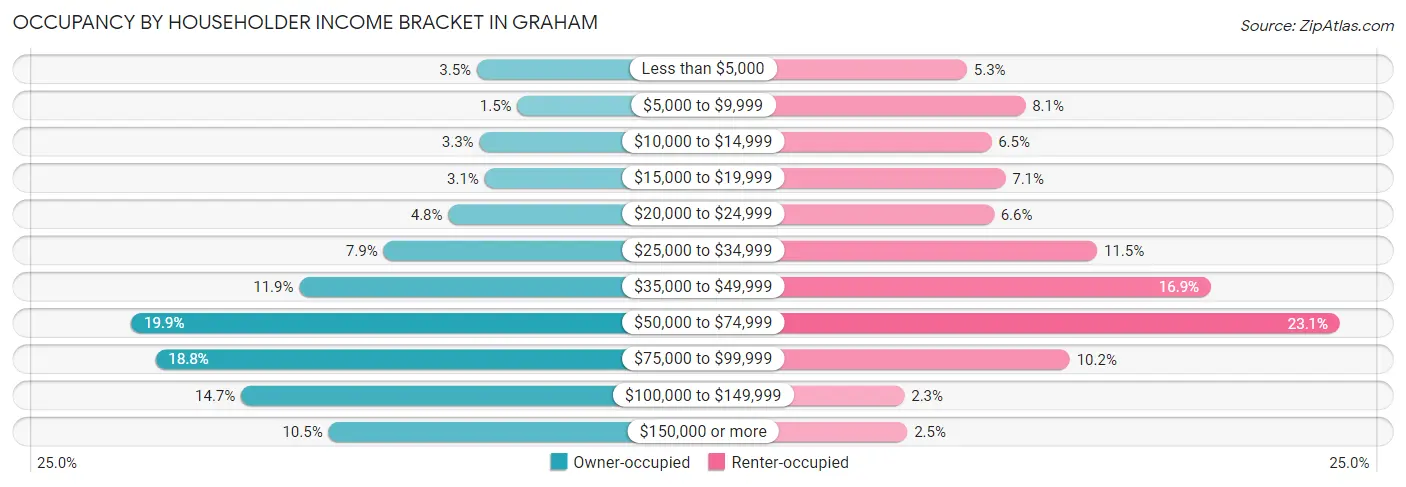
| Income Bracket | Owner-occupied | Renter-occupied |
| Less than $5,000 | 140 (3.5%) | 183 (5.3%) |
| $5,000 to $9,999 | 62 (1.5%) | 279 (8.1%) |
| $10,000 to $14,999 | 135 (3.3%) | 223 (6.5%) |
| $15,000 to $19,999 | 125 (3.1%) | 246 (7.1%) |
| $20,000 to $24,999 | 195 (4.8%) | 227 (6.6%) |
| $25,000 to $34,999 | 320 (7.9%) | 397 (11.5%) |
| $35,000 to $49,999 | 482 (11.9%) | 584 (16.9%) |
| $50,000 to $74,999 | 806 (19.9%) | 796 (23.1%) |
| $75,000 to $99,999 | 759 (18.8%) | 352 (10.2%) |
| $100,000 to $149,999 | 594 (14.7%) | 80 (2.3%) |
| $150,000 or more | 426 (10.5%) | 85 (2.5%) |
| Total | 4,044 (100.0%) | 3,452 (100.0%) |
Monthly Housing Cost Tiers in Graham
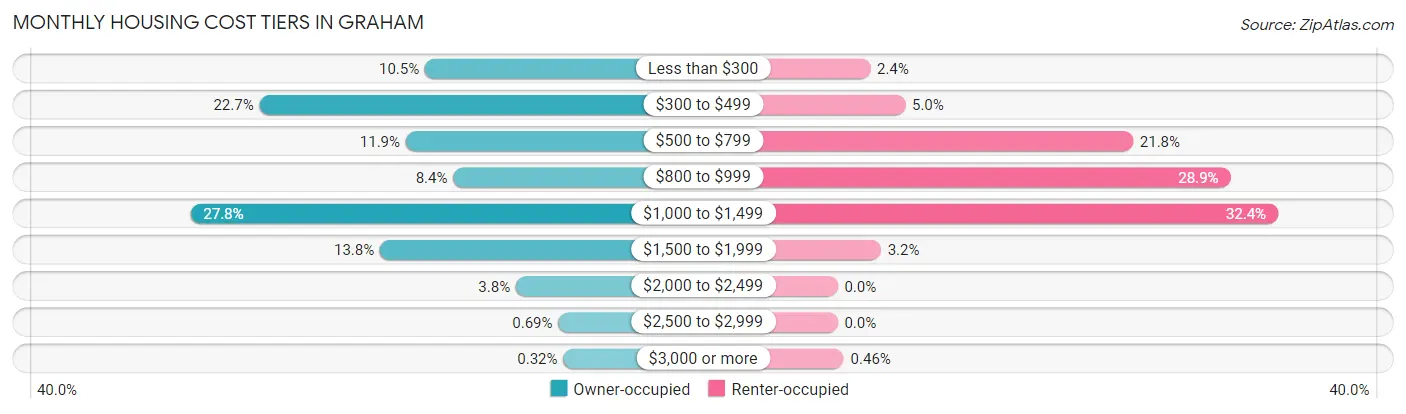
| Monthly Cost | Owner-occupied | Renter-occupied |
| Less than $300 | 425 (10.5%) | 83 (2.4%) |
| $300 to $499 | 918 (22.7%) | 172 (5.0%) |
| $500 to $799 | 482 (11.9%) | 751 (21.8%) |
| $800 to $999 | 341 (8.4%) | 999 (28.9%) |
| $1,000 to $1,499 | 1,124 (27.8%) | 1,120 (32.4%) |
| $1,500 to $1,999 | 559 (13.8%) | 110 (3.2%) |
| $2,000 to $2,499 | 154 (3.8%) | 0 (0.0%) |
| $2,500 to $2,999 | 28 (0.7%) | 0 (0.0%) |
| $3,000 or more | 13 (0.3%) | 16 (0.5%) |
| Total | 4,044 (100.0%) | 3,452 (100.0%) |
Physical Housing Characteristics in Graham
Housing Structures in Graham
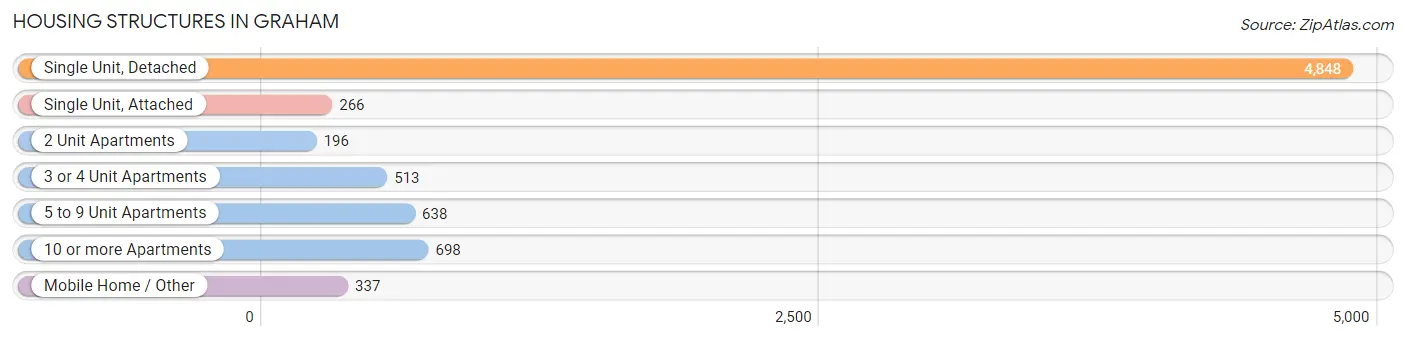
| Structure Type | # Housing Units | % Housing Units |
| Single Unit, Detached | 4,848 | 64.7% |
| Single Unit, Attached | 266 | 3.5% |
| 2 Unit Apartments | 196 | 2.6% |
| 3 or 4 Unit Apartments | 513 | 6.8% |
| 5 to 9 Unit Apartments | 638 | 8.5% |
| 10 or more Apartments | 698 | 9.3% |
| Mobile Home / Other | 337 | 4.5% |
| Total | 7,496 | 100.0% |
Housing Structures by Occupancy in Graham
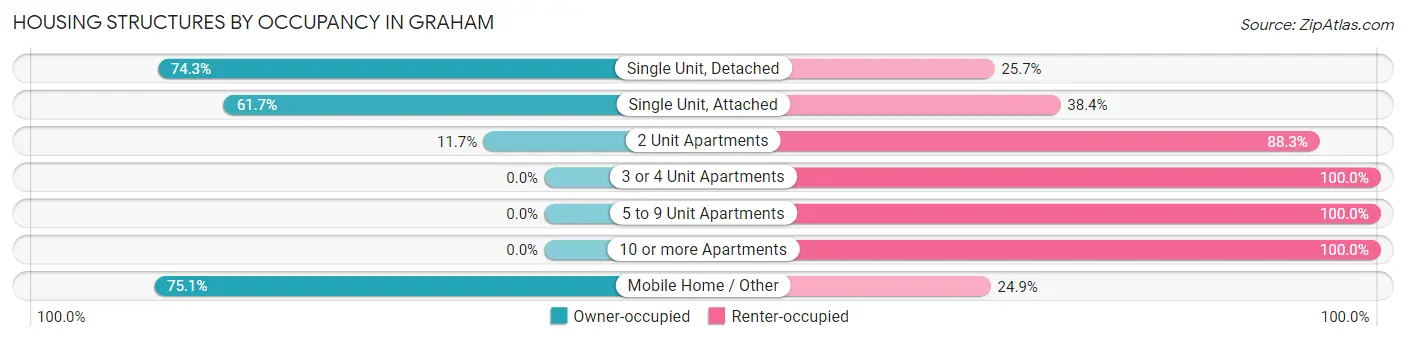
| Structure Type | Owner-occupied | Renter-occupied |
| Single Unit, Detached | 3,604 (74.3%) | 1,244 (25.7%) |
| Single Unit, Attached | 164 (61.7%) | 102 (38.4%) |
| 2 Unit Apartments | 23 (11.7%) | 173 (88.3%) |
| 3 or 4 Unit Apartments | 0 (0.0%) | 513 (100.0%) |
| 5 to 9 Unit Apartments | 0 (0.0%) | 638 (100.0%) |
| 10 or more Apartments | 0 (0.0%) | 698 (100.0%) |
| Mobile Home / Other | 253 (75.1%) | 84 (24.9%) |
| Total | 4,044 (53.9%) | 3,452 (46.1%) |
Housing Structures by Number of Rooms in Graham
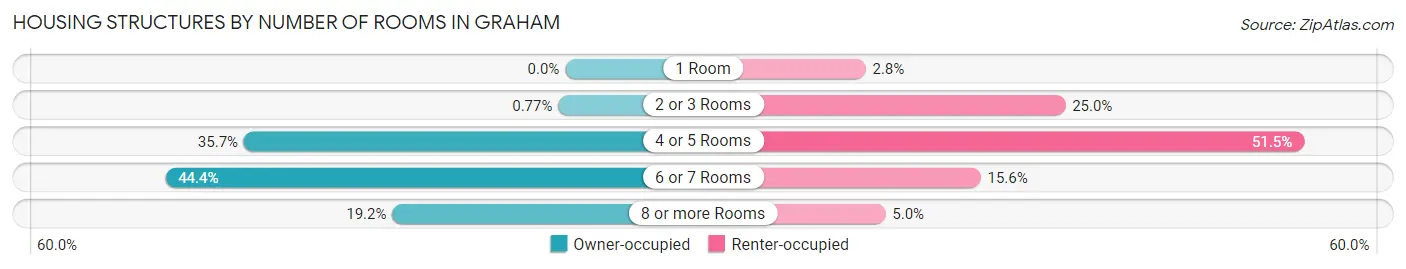
| Number of Rooms | Owner-occupied | Renter-occupied |
| 1 Room | 0 (0.0%) | 98 (2.8%) |
| 2 or 3 Rooms | 31 (0.8%) | 863 (25.0%) |
| 4 or 5 Rooms | 1,442 (35.7%) | 1,778 (51.5%) |
| 6 or 7 Rooms | 1,795 (44.4%) | 539 (15.6%) |
| 8 or more Rooms | 776 (19.2%) | 174 (5.0%) |
| Total | 4,044 (100.0%) | 3,452 (100.0%) |
Housing Structure by Heating Type in Graham
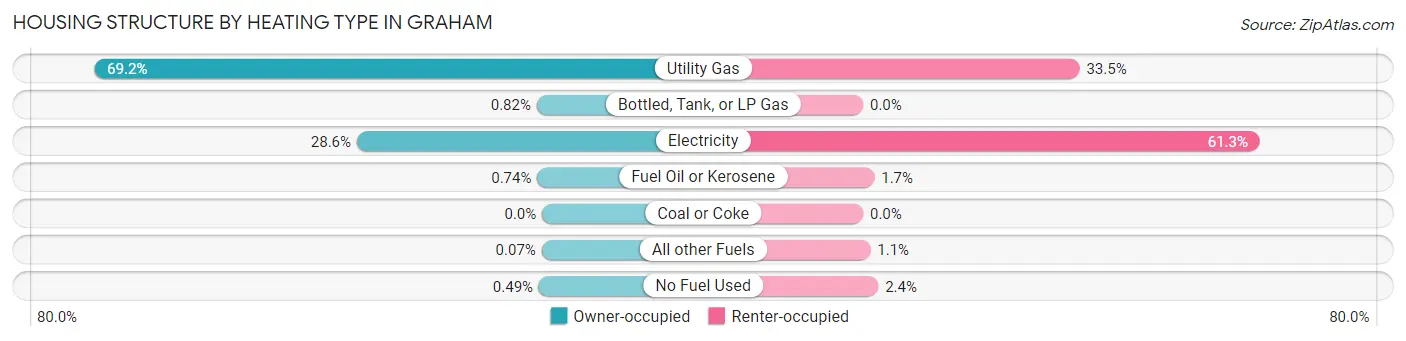
| Heating Type | Owner-occupied | Renter-occupied |
| Utility Gas | 2,800 (69.2%) | 1,155 (33.5%) |
| Bottled, Tank, or LP Gas | 33 (0.8%) | 0 (0.0%) |
| Electricity | 1,158 (28.6%) | 2,117 (61.3%) |
| Fuel Oil or Kerosene | 30 (0.7%) | 60 (1.7%) |
| Coal or Coke | 0 (0.0%) | 0 (0.0%) |
| All other Fuels | 3 (0.1%) | 39 (1.1%) |
| No Fuel Used | 20 (0.5%) | 81 (2.4%) |
| Total | 4,044 (100.0%) | 3,452 (100.0%) |
Household Vehicle Usage in Graham
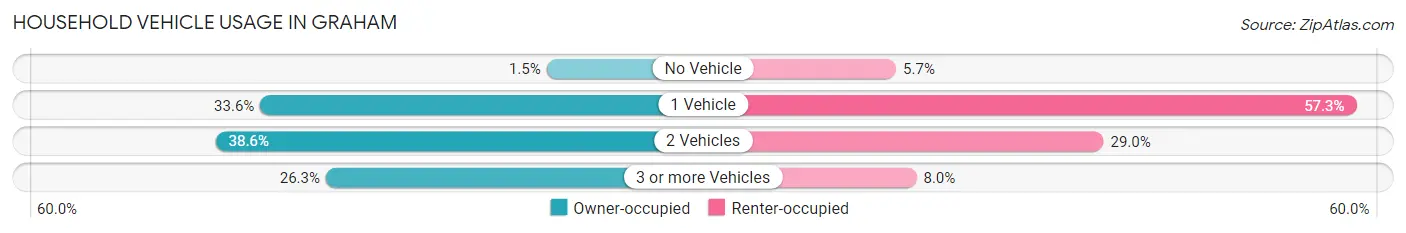
| Vehicles per Household | Owner-occupied | Renter-occupied |
| No Vehicle | 62 (1.5%) | 198 (5.7%) |
| 1 Vehicle | 1,359 (33.6%) | 1,977 (57.3%) |
| 2 Vehicles | 1,561 (38.6%) | 1,000 (29.0%) |
| 3 or more Vehicles | 1,062 (26.3%) | 277 (8.0%) |
| Total | 4,044 (100.0%) | 3,452 (100.0%) |
Real Estate & Mortgages in Graham
Real Estate and Mortgage Overview in Graham
| Characteristic | Without Mortgage | With Mortgage |
| Housing Units | 1,510 | 2,534 |
| Median Property Value | $130,400 | $195,600 |
| Median Household Income | $44,000 | $340 |
| Monthly Housing Costs | $365 | $13 |
| Real Estate Taxes | $1,064 | $15 |
Property Value by Mortgage Status in Graham
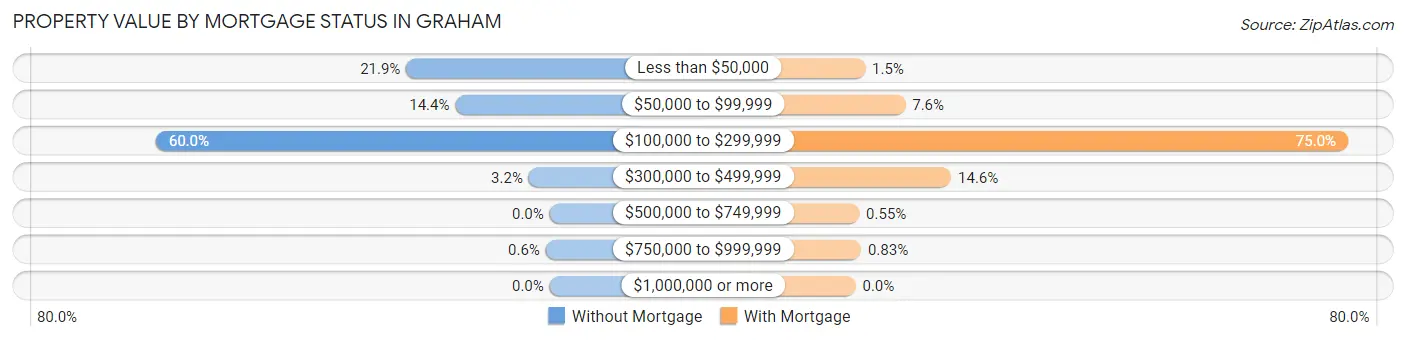
| Property Value | Without Mortgage | With Mortgage |
| Less than $50,000 | 330 (21.8%) | 37 (1.5%) |
| $50,000 to $99,999 | 217 (14.4%) | 192 (7.6%) |
| $100,000 to $299,999 | 906 (60.0%) | 1,901 (75.0%) |
| $300,000 to $499,999 | 48 (3.2%) | 369 (14.6%) |
| $500,000 to $749,999 | 0 (0.0%) | 14 (0.5%) |
| $750,000 to $999,999 | 9 (0.6%) | 21 (0.8%) |
| $1,000,000 or more | 0 (0.0%) | 0 (0.0%) |
| Total | 1,510 (100.0%) | 2,534 (100.0%) |
Household Income by Mortgage Status in Graham
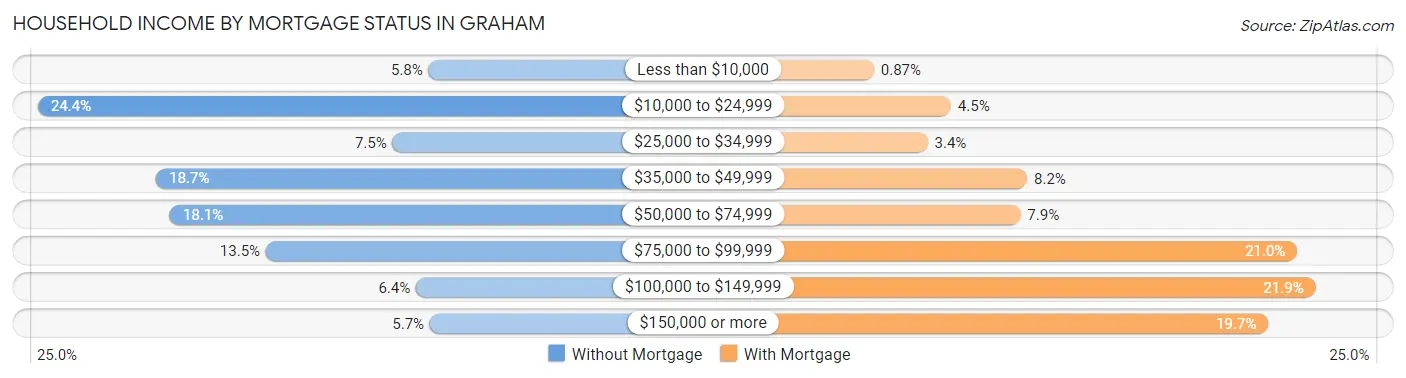
| Household Income | Without Mortgage | With Mortgage |
| Less than $10,000 | 87 (5.8%) | 22 (0.9%) |
| $10,000 to $24,999 | 368 (24.4%) | 115 (4.5%) |
| $25,000 to $34,999 | 113 (7.5%) | 87 (3.4%) |
| $35,000 to $49,999 | 283 (18.7%) | 207 (8.2%) |
| $50,000 to $74,999 | 273 (18.1%) | 199 (7.9%) |
| $75,000 to $99,999 | 204 (13.5%) | 533 (21.0%) |
| $100,000 to $149,999 | 96 (6.4%) | 555 (21.9%) |
| $150,000 or more | 86 (5.7%) | 498 (19.7%) |
| Total | 1,510 (100.0%) | 2,534 (100.0%) |
Property Value to Household Income Ratio in Graham
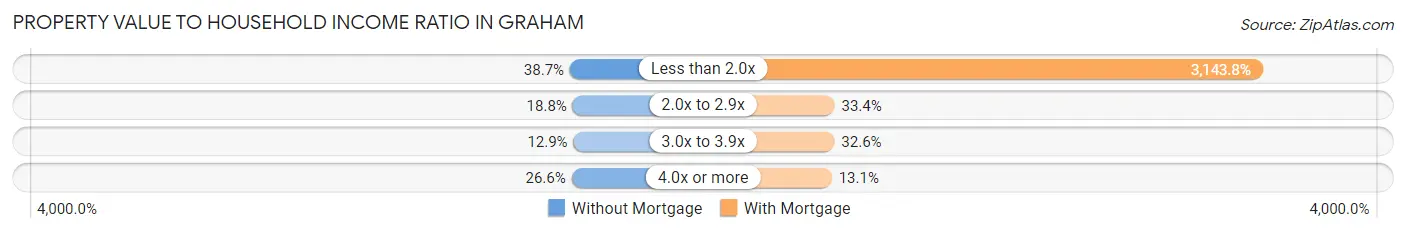
| Value-to-Income Ratio | Without Mortgage | With Mortgage |
| Less than 2.0x | 584 (38.7%) | 79,663 (3,143.8%) |
| 2.0x to 2.9x | 284 (18.8%) | 846 (33.4%) |
| 3.0x to 3.9x | 195 (12.9%) | 825 (32.6%) |
| 4.0x or more | 401 (26.6%) | 331 (13.1%) |
| Total | 1,510 (100.0%) | 2,534 (100.0%) |
Real Estate Taxes by Mortgage Status in Graham
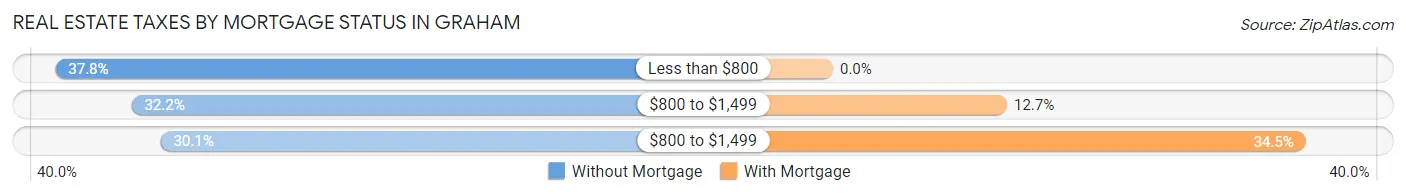
| Property Taxes | Without Mortgage | With Mortgage |
| Less than $800 | 570 (37.8%) | 0 (0.0%) |
| $800 to $1,499 | 486 (32.2%) | 322 (12.7%) |
| $800 to $1,499 | 454 (30.1%) | 875 (34.5%) |
| Total | 1,510 (100.0%) | 2,534 (100.0%) |
Health & Disability in Graham
Health Insurance Coverage by Age in Graham
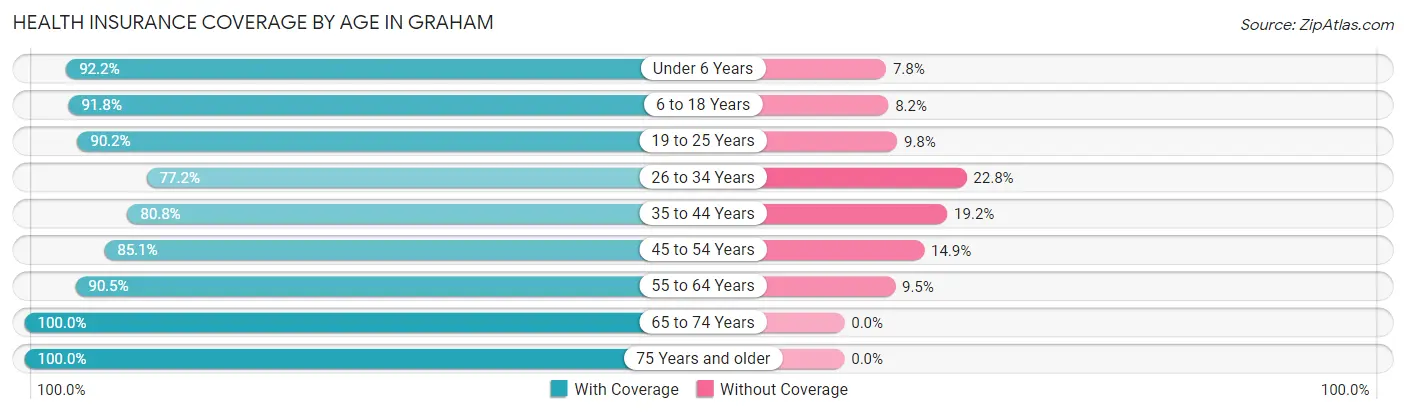
| Age Bracket | With Coverage | Without Coverage |
| Under 6 Years | 1,305 (92.2%) | 110 (7.8%) |
| 6 to 18 Years | 2,219 (91.8%) | 198 (8.2%) |
| 19 to 25 Years | 1,375 (90.2%) | 150 (9.8%) |
| 26 to 34 Years | 1,988 (77.2%) | 586 (22.8%) |
| 35 to 44 Years | 1,361 (80.8%) | 323 (19.2%) |
| 45 to 54 Years | 1,591 (85.1%) | 278 (14.9%) |
| 55 to 64 Years | 2,260 (90.5%) | 236 (9.5%) |
| 65 to 74 Years | 1,476 (100.0%) | 0 (0.0%) |
| 75 Years and older | 1,468 (100.0%) | 0 (0.0%) |
| Total | 15,043 (88.9%) | 1,881 (11.1%) |
Health Insurance Coverage by Citizenship Status in Graham
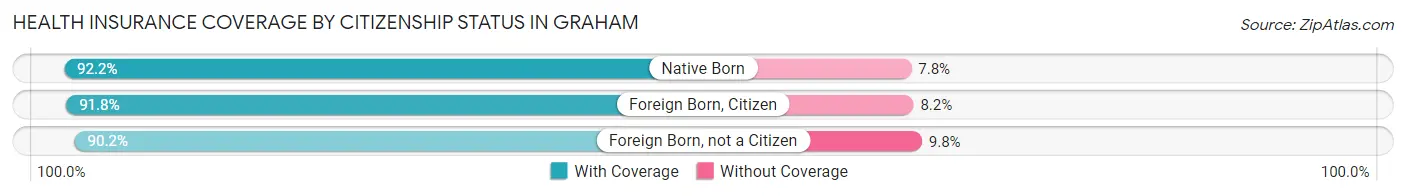
| Citizenship Status | With Coverage | Without Coverage |
| Native Born | 1,305 (92.2%) | 110 (7.8%) |
| Foreign Born, Citizen | 2,219 (91.8%) | 198 (8.2%) |
| Foreign Born, not a Citizen | 1,375 (90.2%) | 150 (9.8%) |
Health Insurance Coverage by Household Income in Graham
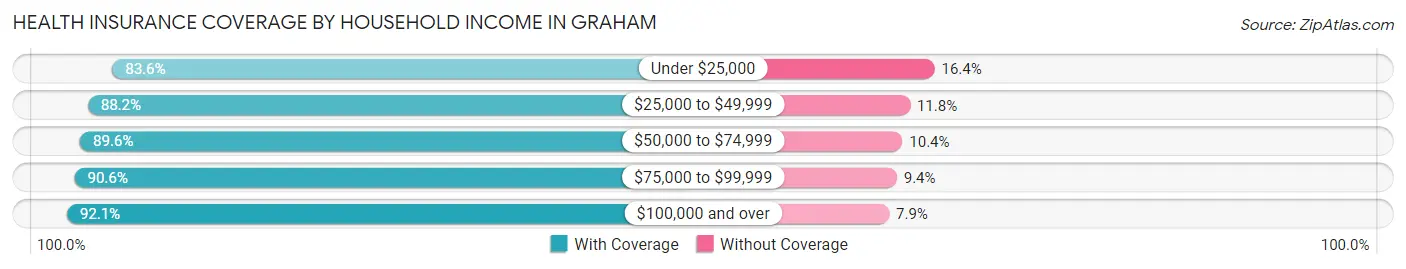
| Household Income | With Coverage | Without Coverage |
| Under $25,000 | 2,765 (83.6%) | 544 (16.4%) |
| $25,000 to $49,999 | 2,925 (88.2%) | 393 (11.8%) |
| $50,000 to $74,999 | 3,279 (89.6%) | 381 (10.4%) |
| $75,000 to $99,999 | 2,582 (90.6%) | 267 (9.4%) |
| $100,000 and over | 3,435 (92.1%) | 296 (7.9%) |
Public vs Private Health Insurance Coverage by Age in Graham
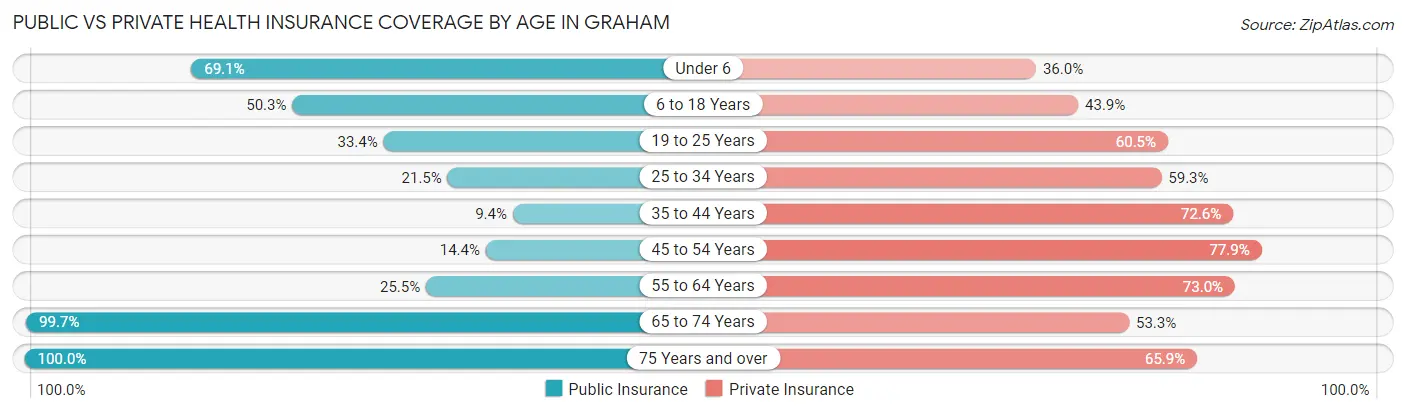
| Age Bracket | Public Insurance | Private Insurance |
| Under 6 | 977 (69.1%) | 510 (36.0%) |
| 6 to 18 Years | 1,216 (50.3%) | 1,060 (43.9%) |
| 19 to 25 Years | 509 (33.4%) | 923 (60.5%) |
| 25 to 34 Years | 553 (21.5%) | 1,527 (59.3%) |
| 35 to 44 Years | 158 (9.4%) | 1,223 (72.6%) |
| 45 to 54 Years | 269 (14.4%) | 1,456 (77.9%) |
| 55 to 64 Years | 636 (25.5%) | 1,821 (73.0%) |
| 65 to 74 Years | 1,472 (99.7%) | 787 (53.3%) |
| 75 Years and over | 1,468 (100.0%) | 968 (65.9%) |
| Total | 7,258 (42.9%) | 10,275 (60.7%) |
Disability Status by Sex by Age in Graham
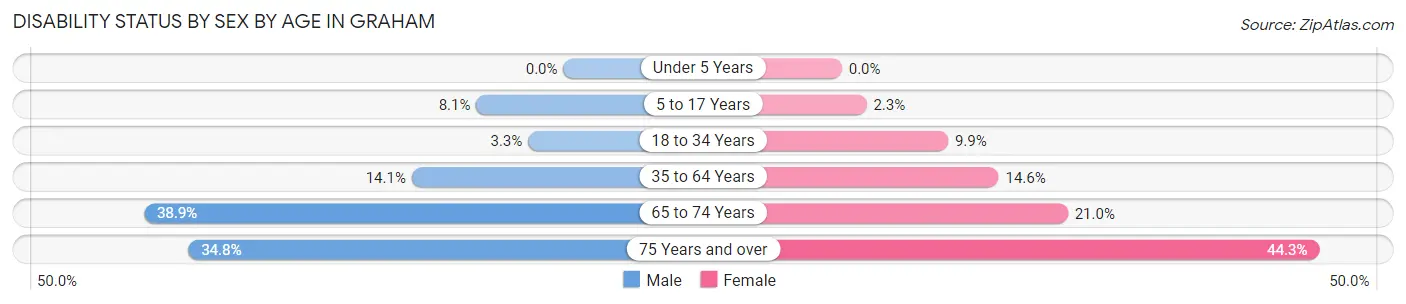
| Age Bracket | Male | Female |
| Under 5 Years | 0 (0.0%) | 0 (0.0%) |
| 5 to 17 Years | 102 (8.1%) | 27 (2.3%) |
| 18 to 34 Years | 63 (3.3%) | 231 (9.9%) |
| 35 to 64 Years | 388 (14.1%) | 479 (14.5%) |
| 65 to 74 Years | 246 (38.9%) | 177 (21.0%) |
| 75 Years and over | 189 (34.8%) | 410 (44.3%) |
Disability Class by Sex by Age in Graham
Disability Class: Hearing Difficulty
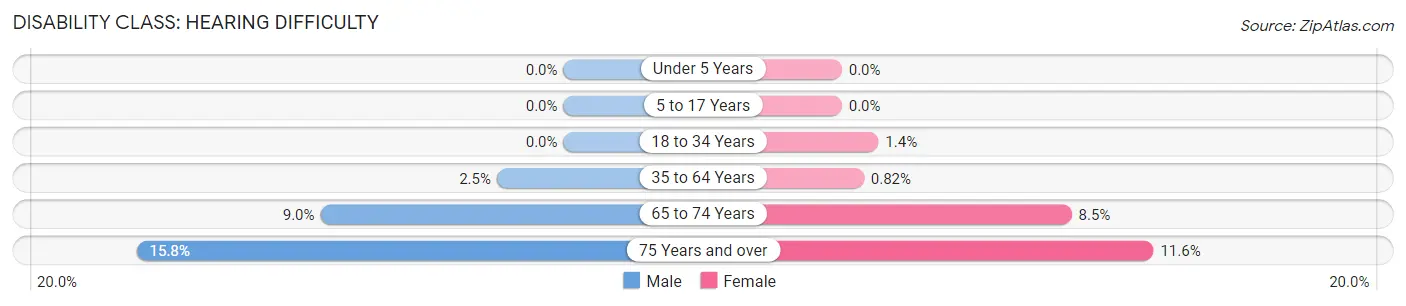
| Age Bracket | Male | Female |
| Under 5 Years | 0 (0.0%) | 0 (0.0%) |
| 5 to 17 Years | 0 (0.0%) | 0 (0.0%) |
| 18 to 34 Years | 0 (0.0%) | 32 (1.4%) |
| 35 to 64 Years | 68 (2.5%) | 27 (0.8%) |
| 65 to 74 Years | 57 (9.0%) | 72 (8.5%) |
| 75 Years and over | 86 (15.8%) | 107 (11.6%) |
Disability Class: Vision Difficulty
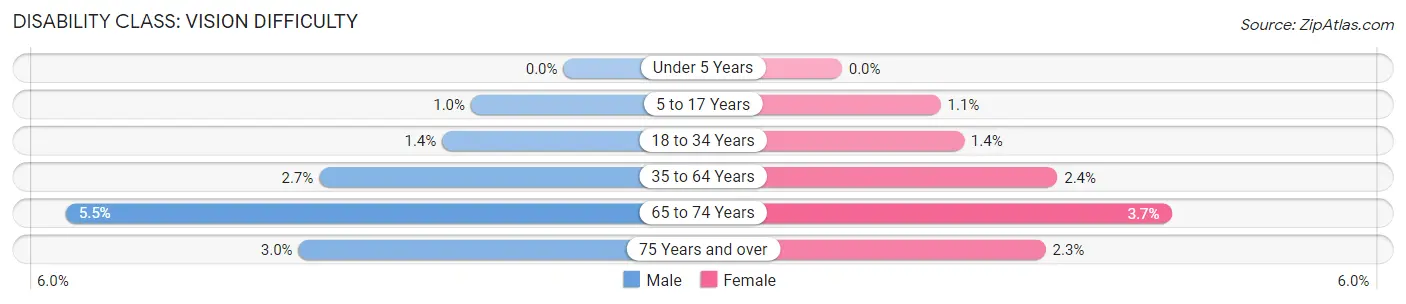
| Age Bracket | Male | Female |
| Under 5 Years | 0 (0.0%) | 0 (0.0%) |
| 5 to 17 Years | 13 (1.0%) | 13 (1.1%) |
| 18 to 34 Years | 26 (1.3%) | 32 (1.4%) |
| 35 to 64 Years | 75 (2.7%) | 79 (2.4%) |
| 65 to 74 Years | 35 (5.5%) | 31 (3.7%) |
| 75 Years and over | 16 (2.9%) | 21 (2.3%) |
Disability Class: Cognitive Difficulty
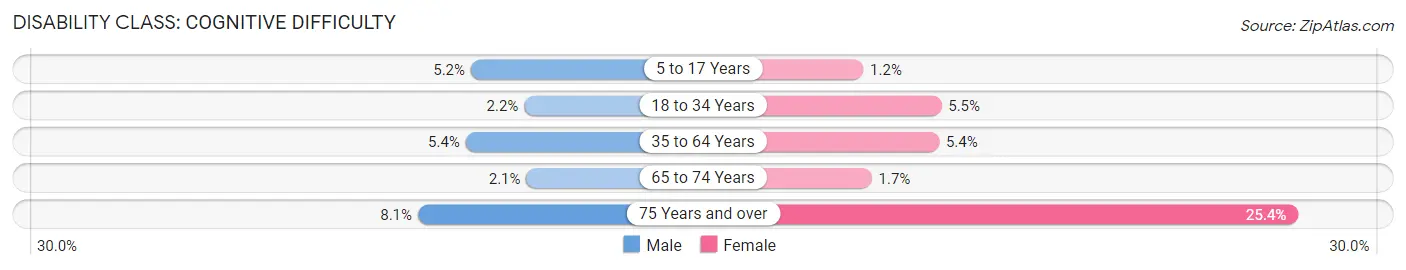
| Age Bracket | Male | Female |
| 5 to 17 Years | 65 (5.1%) | 14 (1.2%) |
| 18 to 34 Years | 42 (2.2%) | 130 (5.5%) |
| 35 to 64 Years | 150 (5.4%) | 178 (5.4%) |
| 65 to 74 Years | 13 (2.1%) | 14 (1.7%) |
| 75 Years and over | 44 (8.1%) | 235 (25.4%) |
Disability Class: Ambulatory Difficulty
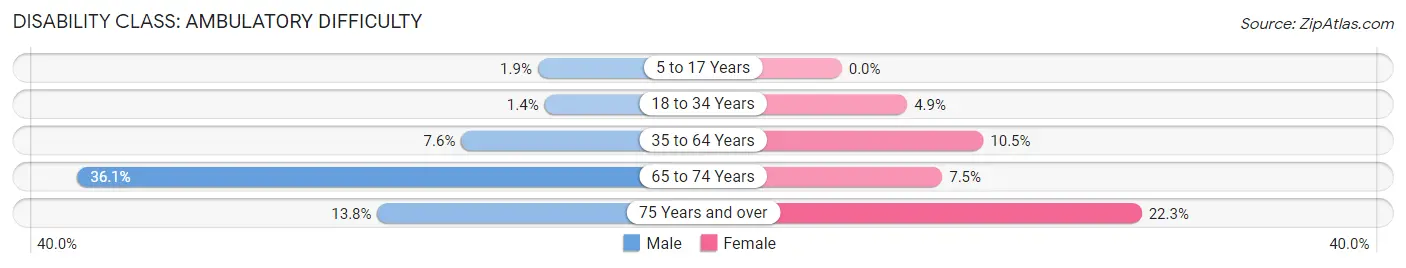
| Age Bracket | Male | Female |
| 5 to 17 Years | 24 (1.9%) | 0 (0.0%) |
| 18 to 34 Years | 27 (1.4%) | 114 (4.9%) |
| 35 to 64 Years | 209 (7.6%) | 346 (10.5%) |
| 65 to 74 Years | 228 (36.1%) | 63 (7.5%) |
| 75 Years and over | 75 (13.8%) | 206 (22.3%) |
Disability Class: Self-Care Difficulty
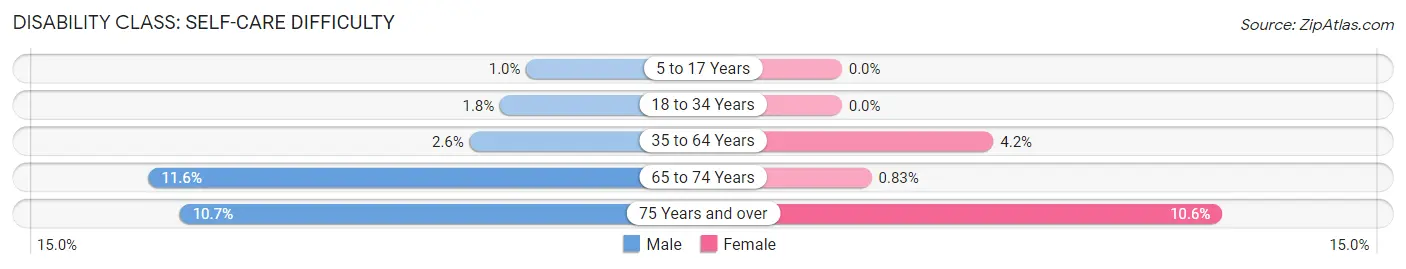
| Age Bracket | Male | Female |
| 5 to 17 Years | 13 (1.0%) | 0 (0.0%) |
| 18 to 34 Years | 34 (1.8%) | 0 (0.0%) |
| 35 to 64 Years | 72 (2.6%) | 139 (4.2%) |
| 65 to 74 Years | 73 (11.6%) | 7 (0.8%) |
| 75 Years and over | 58 (10.7%) | 98 (10.6%) |
Technology Access in Graham
Computing Device Access in Graham
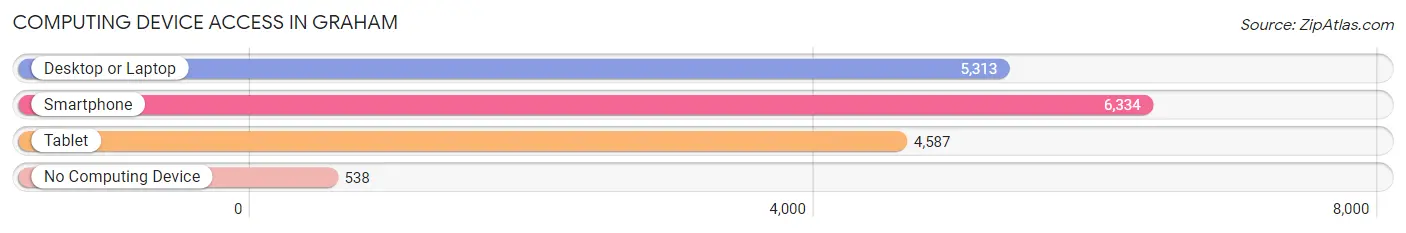
| Device Type | # Households | % Households |
| Desktop or Laptop | 5,313 | 70.9% |
| Smartphone | 6,334 | 84.5% |
| Tablet | 4,587 | 61.2% |
| No Computing Device | 538 | 7.2% |
| Total | 7,496 | 100.0% |
Internet Access in Graham
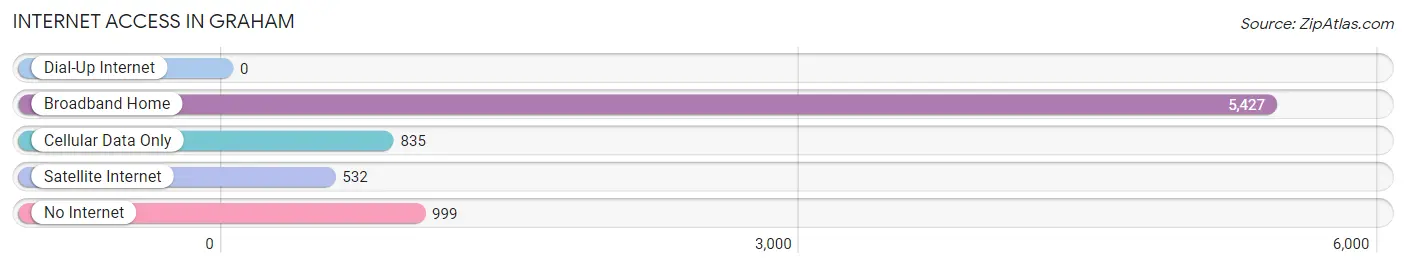
| Internet Type | # Households | % Households |
| Dial-Up Internet | 0 | 0.0% |
| Broadband Home | 5,427 | 72.4% |
| Cellular Data Only | 835 | 11.1% |
| Satellite Internet | 532 | 7.1% |
| No Internet | 999 | 13.3% |
| Total | 7,496 | 100.0% |
Graham Summary
Graham, North Carolina is a small town located in Alamance County in the Piedmont region of North Carolina. It is situated in the foothills of the Appalachian Mountains and is part of the Burlington-Greensboro-Winston-Salem metropolitan area. The town was founded in 1851 and has a population of approximately 14,000 people.
Geography
Graham is located in the Piedmont region of North Carolina, which is characterized by rolling hills and valleys. The town is situated in the foothills of the Appalachian Mountains and is part of the Burlington-Greensboro-Winston-Salem metropolitan area. The town is located at the intersection of US Highway 70 and NC Highway 87. The town is located approximately 30 miles west of Raleigh and 40 miles east of Greensboro.
The town is situated on the banks of the Haw River, which is a tributary of the Cape Fear River. The Haw River is a popular destination for fishing, canoeing, and kayaking. The town is also home to several parks, including Graham City Park, which features a playground, picnic areas, and a walking trail.
History
Graham was founded in 1851 by William Graham, a local landowner. The town was named after him and was originally a small farming community. The town grew slowly over the years and by the early 1900s, it had become a center for textile manufacturing. The town was also home to several tobacco warehouses and was a major hub for the tobacco industry.
In the 1950s, the town began to experience a period of growth and development. Several new businesses opened in the town, including a furniture factory and a clothing factory. The town also saw the construction of several new schools and churches.
Economy
The economy of Graham is largely based on manufacturing and agriculture. The town is home to several manufacturing companies, including a furniture factory, a clothing factory, and a plastics factory. The town is also home to several agricultural businesses, including a dairy farm and a poultry farm.
The town is also home to several retail stores, including a grocery store, a hardware store, and a pharmacy. The town is also home to several restaurants, including a pizza parlor and a Mexican restaurant.
Demographics
As of the 2010 census, the population of Graham was 14,153. The racial makeup of the town was 79.3% White, 15.2% African American, 0.5% Native American, 0.7% Asian, 0.1% Pacific Islander, and 3.2% from other races. The median household income in Graham was $37,945, and the median family income was $45,945.
The town is served by the Alamance-Burlington School System, which includes five elementary schools, two middle schools, and one high school. The town is also home to several churches, including the First Baptist Church of Graham and the Graham United Methodist Church.
Conclusion
Graham, North Carolina is a small town located in Alamance County in the Piedmont region of North Carolina. It is situated in the foothills of the Appalachian Mountains and is part of the Burlington-Greensboro-Winston-Salem metropolitan area. The town was founded in 1851 and has a population of approximately 14,000 people. The economy of Graham is largely based on manufacturing and agriculture, and the town is home to several retail stores, restaurants, and churches. The town is served by the Alamance-Burlington School System and has a population that is 79.3% White, 15.2% African American, 0.5% Native American, 0.7% Asian, 0.1% Pacific Islander, and 3.2% from other races.
Common Questions
What is Per Capita Income in Graham?
Per Capita income in Graham is $28,397.
What is the Median Family Income in Graham?
Median Family Income in Graham is $54,724.
What is the Median Household income in Graham?
Median Household Income in Graham is $51,482.
What is Income or Wage Gap in Graham?
Income or Wage Gap in Graham is 22.6%.
Women in Graham earn 77.4 cents for every dollar earned by a man.
What is Family Income Deficit in Graham?
Family Income Deficit in Graham is $10,628.
Families that are below poverty line in Graham earn $10,628 less on average than the poverty threshold level.
What is Inequality or Gini Index in Graham?
Inequality or Gini Index in Graham is 0.43.
What is the Total Population of Graham?
Total Population of Graham is 17,136.
What is the Total Male Population of Graham?
Total Male Population of Graham is 8,072.
What is the Total Female Population of Graham?
Total Female Population of Graham is 9,064.
What is the Ratio of Males per 100 Females in Graham?
There are 89.06 Males per 100 Females in Graham.
What is the Ratio of Females per 100 Males in Graham?
There are 112.29 Females per 100 Males in Graham.
What is the Median Population Age in Graham?
Median Population Age in Graham is 36.8 Years.
What is the Average Family Size in Graham
Average Family Size in Graham is 2.9 People.
What is the Average Household Size in Graham
Average Household Size in Graham is 2.3 People.
How Large is the Labor Force in Graham?
There are 8,463 People in the Labor Forcein in Graham.
What is the Percentage of People in the Labor Force in Graham?
61.0% of People are in the Labor Force in Graham.
What is the Unemployment Rate in Graham?
Unemployment Rate in Graham is 8.1%.