Manteo, NC Map & Demographics
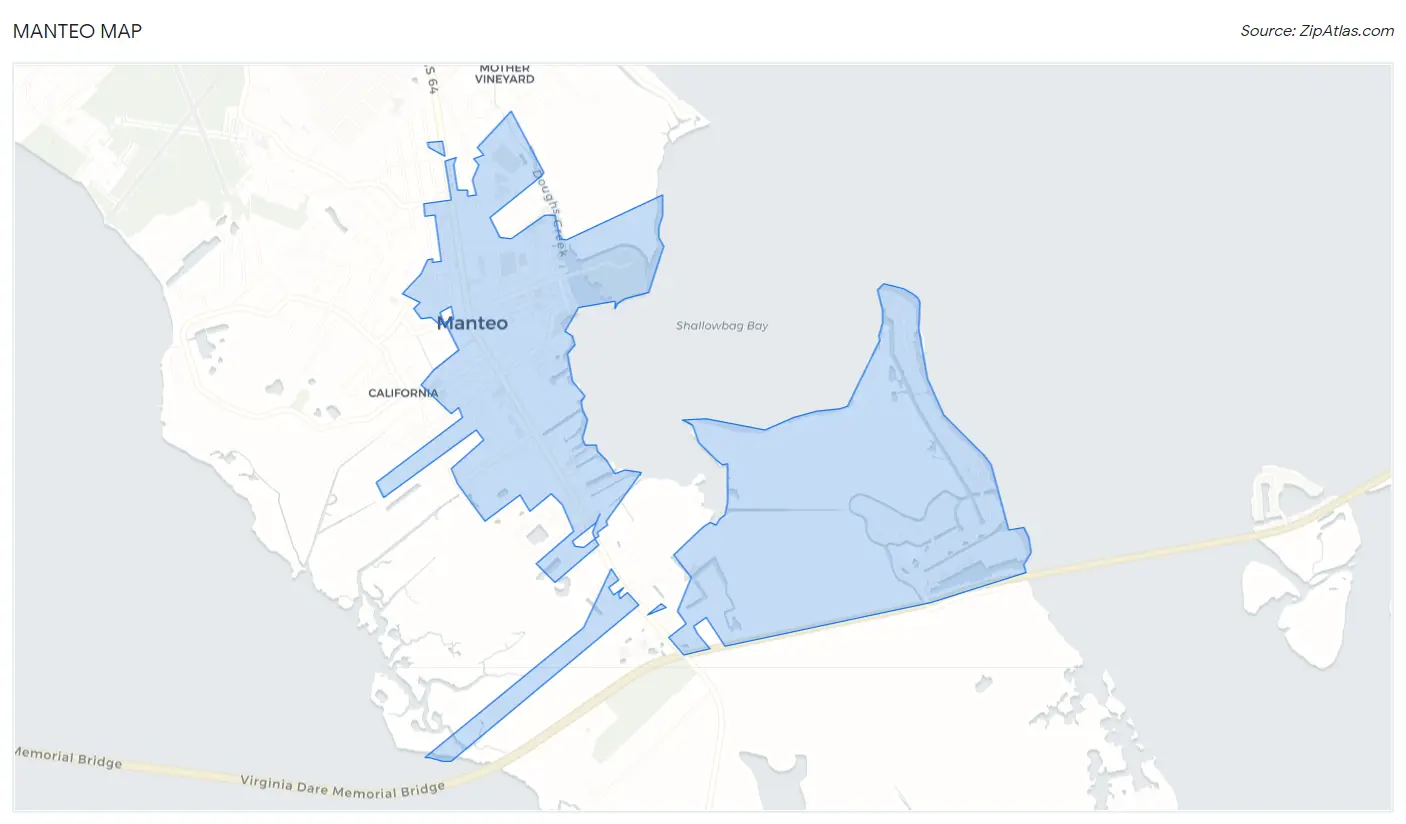
Manteo Map
Manteo Overview
$49,939
PER CAPITA INCOME
$81,080
AVG FAMILY INCOME
$78,074
AVG HOUSEHOLD INCOME
33.6%
WAGE / INCOME GAP [ % ]
66.4¢/ $1
WAGE / INCOME GAP [ $ ]
0.50
INEQUALITY / GINI INDEX
1,808
TOTAL POPULATION
857
MALE POPULATION
951
FEMALE POPULATION
90.12
MALES / 100 FEMALES
110.97
FEMALES / 100 MALES
49.4
MEDIAN AGE
2.8
AVG FAMILY SIZE
2.0
AVG HOUSEHOLD SIZE
860
LABOR FORCE [ PEOPLE ]
57.5%
PERCENT IN LABOR FORCE
2.6%
UNEMPLOYMENT RATE
Manteo Zip Codes
Manteo Area Codes
Income in Manteo
Income Overview in Manteo
Per Capita Income in Manteo is $49,939, while median incomes of families and households are $81,080 and $78,074 respectively.
| Characteristic | Number | Measure |
| Per Capita Income | 1,808 | $49,939 |
| Median Family Income | 447 | $81,080 |
| Mean Family Income | 447 | $112,081 |
| Median Household Income | 889 | $78,074 |
| Mean Household Income | 889 | $100,724 |
| Income Deficit | 447 | $0 |
| Wage / Income Gap (%) | 1,808 | 33.59% |
| Wage / Income Gap ($) | 1,808 | 66.41¢ per $1 |
| Gini / Inequality Index | 1,808 | 0.50 |
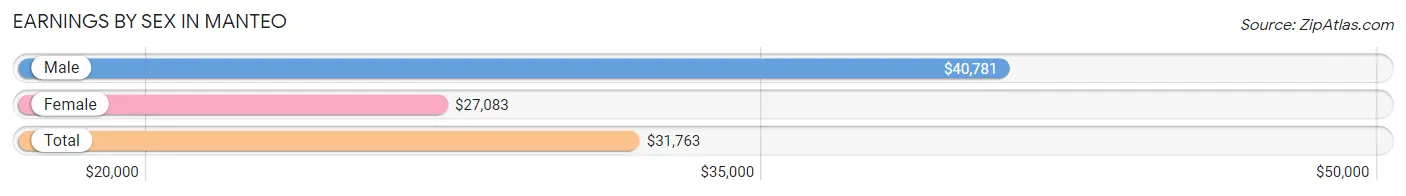
Earnings by Sex in Manteo
Average Earnings in Manteo are $31,763, $40,781 for men and $27,083 for women, a difference of 33.6%.
| Sex | Number | Average Earnings |
| Male | 489 (52.4%) | $40,781 |
| Female | 444 (47.6%) | $27,083 |
| Total | 933 (100.0%) | $31,763 |
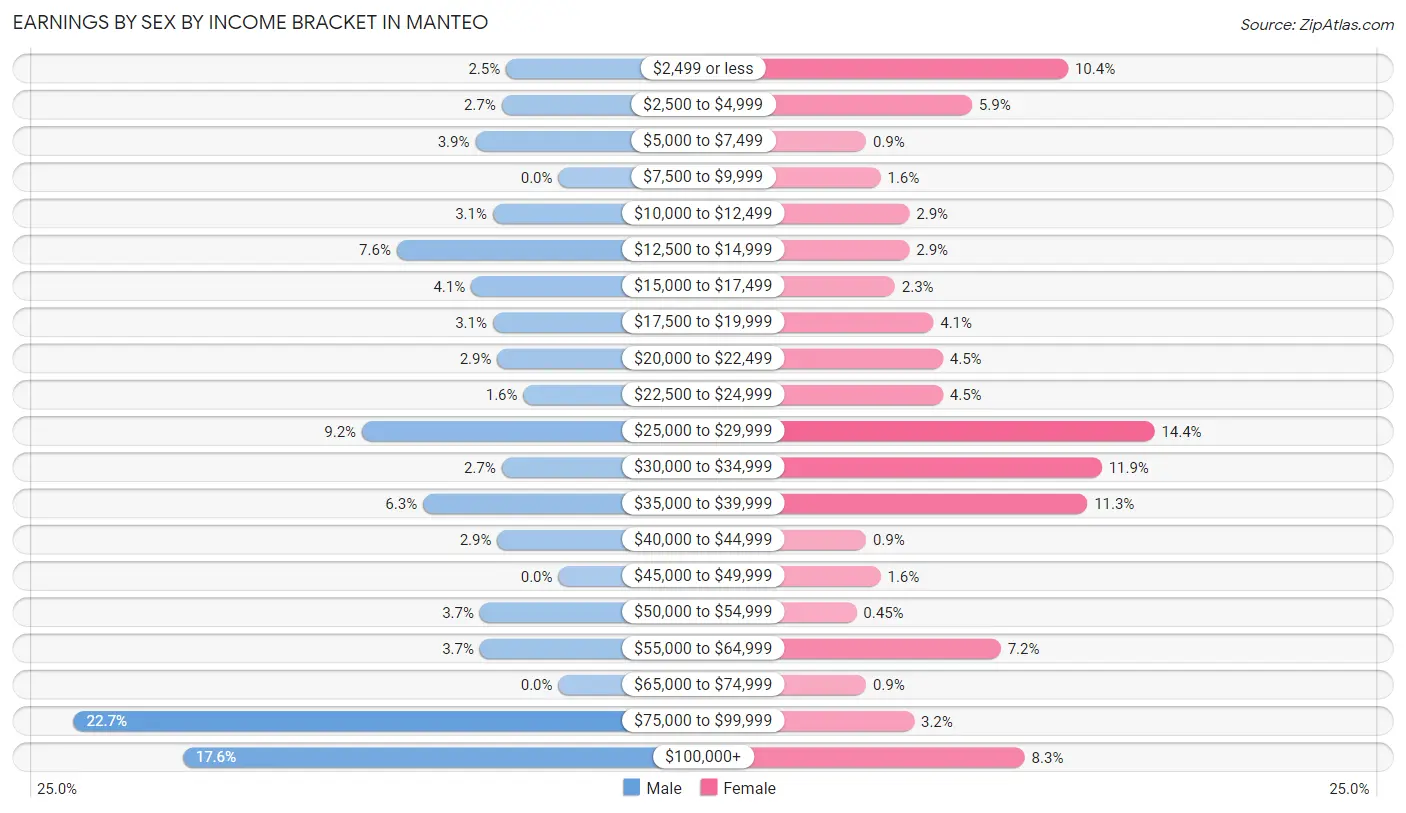
Earnings by Sex by Income Bracket in Manteo
The most common earnings brackets in Manteo are $75,000 to $99,999 for men (111 | 22.7%) and $25,000 to $29,999 for women (64 | 14.4%).
| Income | Male | Female |
| $2,499 or less | 12 (2.5%) | 46 (10.4%) |
| $2,500 to $4,999 | 13 (2.7%) | 26 (5.9%) |
| $5,000 to $7,499 | 19 (3.9%) | 4 (0.9%) |
| $7,500 to $9,999 | 0 (0.0%) | 7 (1.6%) |
| $10,000 to $12,499 | 15 (3.1%) | 13 (2.9%) |
| $12,500 to $14,999 | 37 (7.6%) | 13 (2.9%) |
| $15,000 to $17,499 | 20 (4.1%) | 10 (2.2%) |
| $17,500 to $19,999 | 15 (3.1%) | 18 (4.1%) |
| $20,000 to $22,499 | 14 (2.9%) | 20 (4.5%) |
| $22,500 to $24,999 | 8 (1.6%) | 20 (4.5%) |
| $25,000 to $29,999 | 45 (9.2%) | 64 (14.4%) |
| $30,000 to $34,999 | 13 (2.7%) | 53 (11.9%) |
| $35,000 to $39,999 | 31 (6.3%) | 50 (11.3%) |
| $40,000 to $44,999 | 14 (2.9%) | 4 (0.9%) |
| $45,000 to $49,999 | 0 (0.0%) | 7 (1.6%) |
| $50,000 to $54,999 | 18 (3.7%) | 2 (0.4%) |
| $55,000 to $64,999 | 18 (3.7%) | 32 (7.2%) |
| $65,000 to $74,999 | 0 (0.0%) | 4 (0.9%) |
| $75,000 to $99,999 | 111 (22.7%) | 14 (3.2%) |
| $100,000+ | 86 (17.6%) | 37 (8.3%) |
| Total | 489 (100.0%) | 444 (100.0%) |
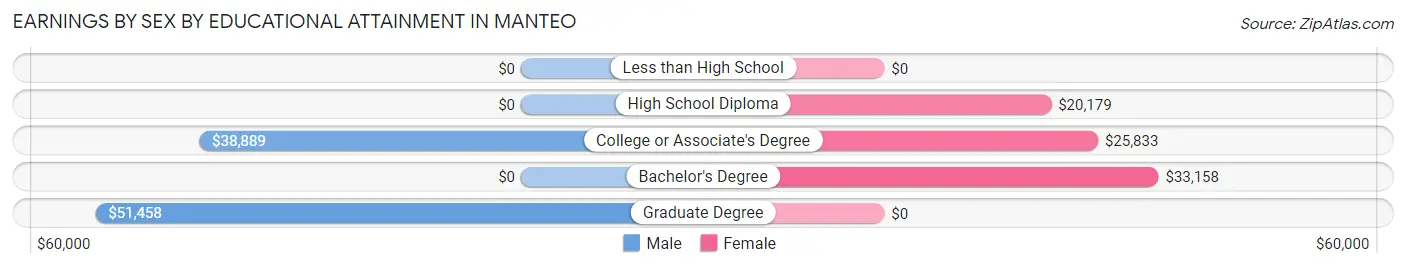
Earnings by Sex by Educational Attainment in Manteo
Average earnings in Manteo are $50,625 for men and $26,968 for women, a difference of 46.7%. Men with an educational attainment of graduate degree enjoy the highest average annual earnings of $51,458, while those with college or associate's degree education earn the least with $38,889. Women with an educational attainment of bachelor's degree earn the most with the average annual earnings of $33,158, while those with high school diploma education have the smallest earnings of $20,179.
| Educational Attainment | Male Income | Female Income |
| Less than High School | - | - |
| High School Diploma | - | - |
| College or Associate's Degree | $38,889 | $25,833 |
| Bachelor's Degree | - | - |
| Graduate Degree | $51,458 | $0 |
| Total | $50,625 | $26,968 |
Family Income in Manteo
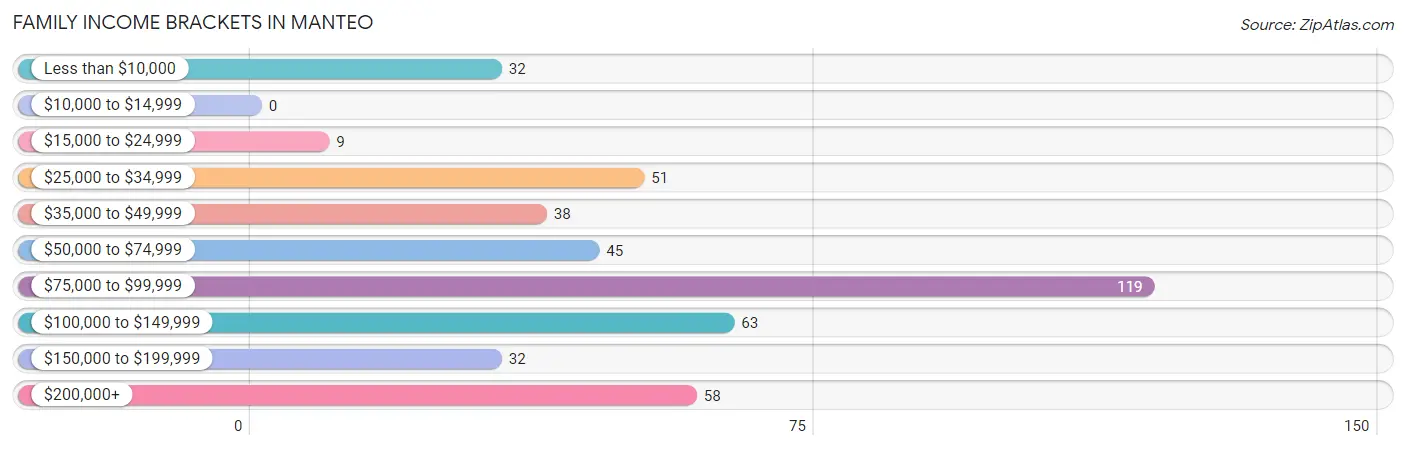
Family Income Brackets in Manteo
According to the Manteo family income data, there are 119 families falling into the $75,000 to $99,999 income range, which is the most common income bracket and makes up 26.6% of all families.
| Income Bracket | # Families | % Families |
| Less than $10,000 | 32 | 7.2% |
| $10,000 to $14,999 | 0 | 0.0% |
| $15,000 to $24,999 | 9 | 2.0% |
| $25,000 to $34,999 | 51 | 11.4% |
| $35,000 to $49,999 | 38 | 8.5% |
| $50,000 to $74,999 | 45 | 10.1% |
| $75,000 to $99,999 | 119 | 26.6% |
| $100,000 to $149,999 | 63 | 14.1% |
| $150,000 to $199,999 | 32 | 7.2% |
| $200,000+ | 58 | 13.0% |
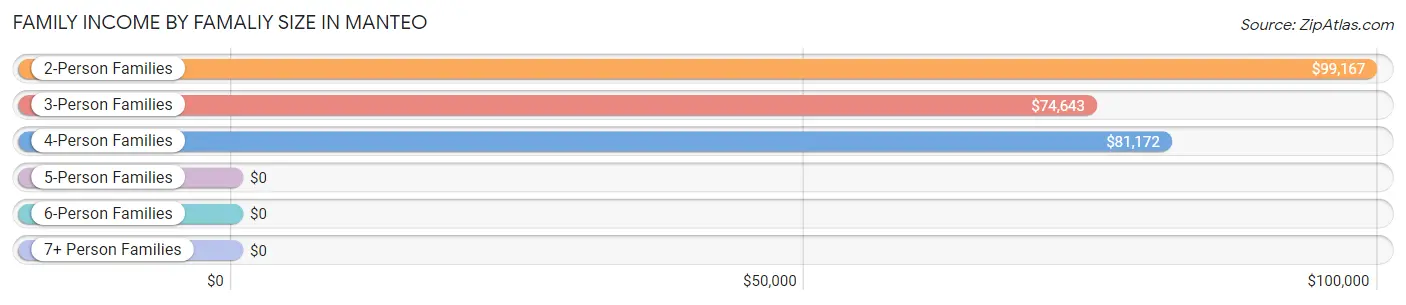
Family Income by Famaliy Size in Manteo
2-person families (238 | 53.2%) account for the highest median family income in Manteo with $99,167 per family, while 2-person families (238 | 53.2%) have the highest median income of $49,584 per family member.
| Income Bracket | # Families | Median Income |
| 2-Person Families | 238 (53.2%) | $99,167 |
| 3-Person Families | 90 (20.1%) | $74,643 |
| 4-Person Families | 81 (18.1%) | $81,172 |
| 5-Person Families | 17 (3.8%) | $0 |
| 6-Person Families | 21 (4.7%) | $0 |
| 7+ Person Families | 0 (0.0%) | $0 |
| Total | 447 (100.0%) | $81,080 |
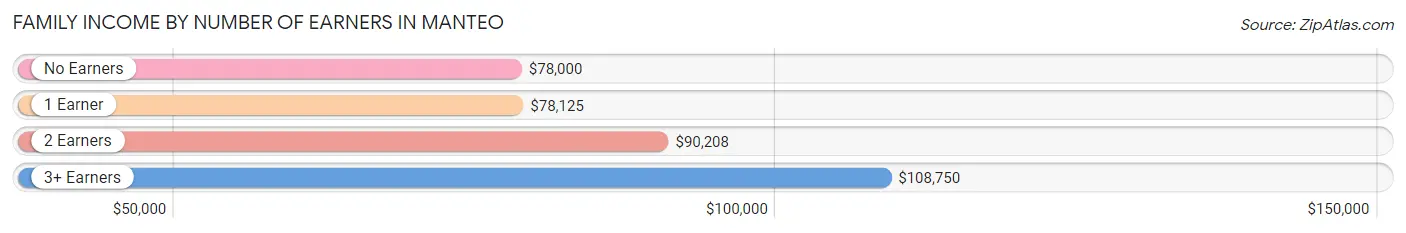
Family Income by Number of Earners in Manteo
The median family income in Manteo is $81,080, with families comprising 3+ earners (26) having the highest median family income of $108,750, while families with no earners (108) have the lowest median family income of $78,000, accounting for 5.8% and 24.2% of families, respectively.
| Number of Earners | # Families | Median Income |
| No Earners | 108 (24.2%) | $78,000 |
| 1 Earner | 170 (38.0%) | $78,125 |
| 2 Earners | 143 (32.0%) | $90,208 |
| 3+ Earners | 26 (5.8%) | $108,750 |
| Total | 447 (100.0%) | $81,080 |
Household Income in Manteo
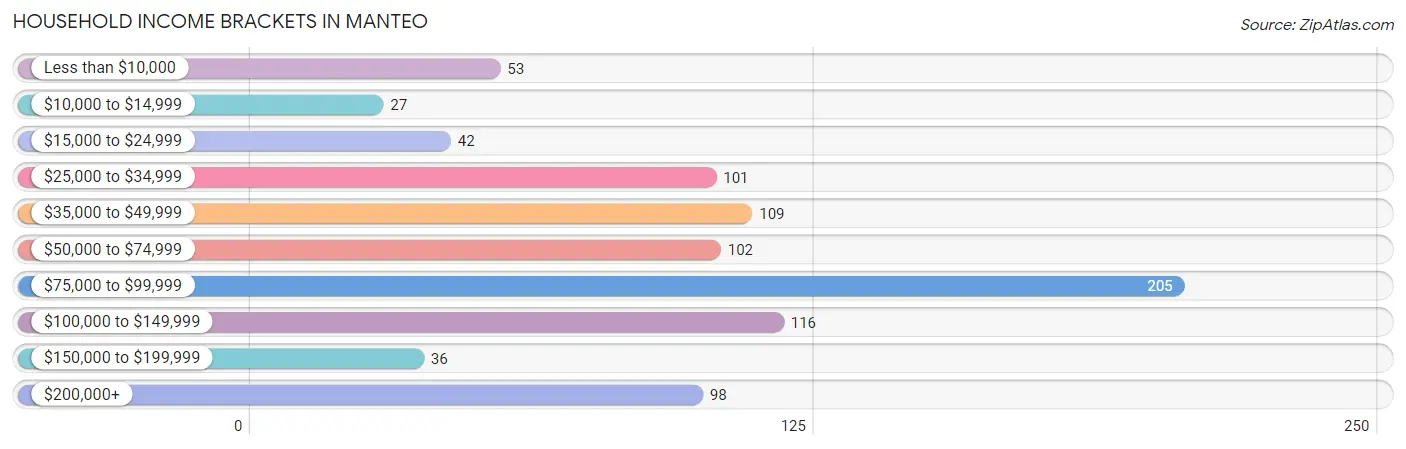
Household Income Brackets in Manteo
With 205 households falling in the category, the $75,000 to $99,999 income range is the most frequent in Manteo, accounting for 23.1% of all households. In contrast, only 27 households (3.0%) fall into the $10,000 to $14,999 income bracket, making it the least populous group.
| Income Bracket | # Households | % Households |
| Less than $10,000 | 53 | 6.0% |
| $10,000 to $14,999 | 27 | 3.0% |
| $15,000 to $24,999 | 42 | 4.7% |
| $25,000 to $34,999 | 101 | 11.4% |
| $35,000 to $49,999 | 109 | 12.3% |
| $50,000 to $74,999 | 102 | 11.5% |
| $75,000 to $99,999 | 205 | 23.1% |
| $100,000 to $149,999 | 116 | 13.0% |
| $150,000 to $199,999 | 36 | 4.0% |
| $200,000+ | 98 | 11.0% |
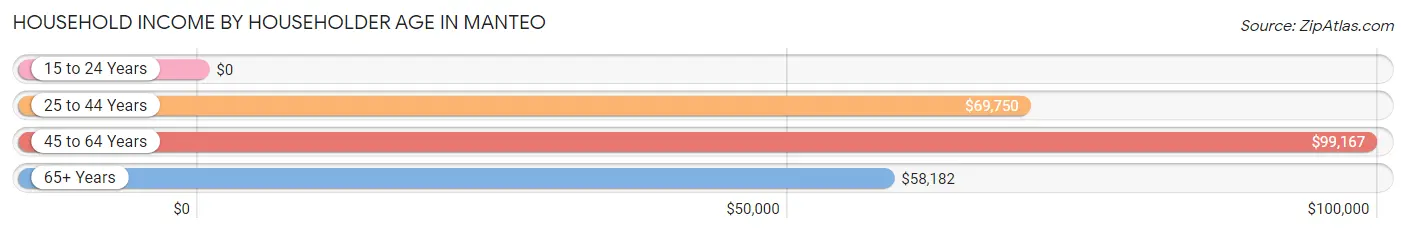
Household Income by Householder Age in Manteo
The median household income in Manteo is $78,074, with the highest median household income of $99,167 found in the 45 to 64 years age bracket for the primary householder. A total of 276 households (31.0%) fall into this category. Meanwhile, the 15 to 24 years age bracket for the primary householder has the lowest median household income of $0, with 6 households (0.7%) in this group.
| Income Bracket | # Households | Median Income |
| 15 to 24 Years | 6 (0.7%) | $0 |
| 25 to 44 Years | 253 (28.5%) | $69,750 |
| 45 to 64 Years | 276 (31.0%) | $99,167 |
| 65+ Years | 354 (39.8%) | $58,182 |
| Total | 889 (100.0%) | $78,074 |
Poverty in Manteo
Income Below Poverty by Sex and Age in Manteo
With 14.2% poverty level for males and 18.1% for females among the residents of Manteo, 12 to 14 year old males and 15 year old females are the most vulnerable to poverty, with 49 males (79.0%) and 21 females (87.5%) in their respective age groups living below the poverty level.
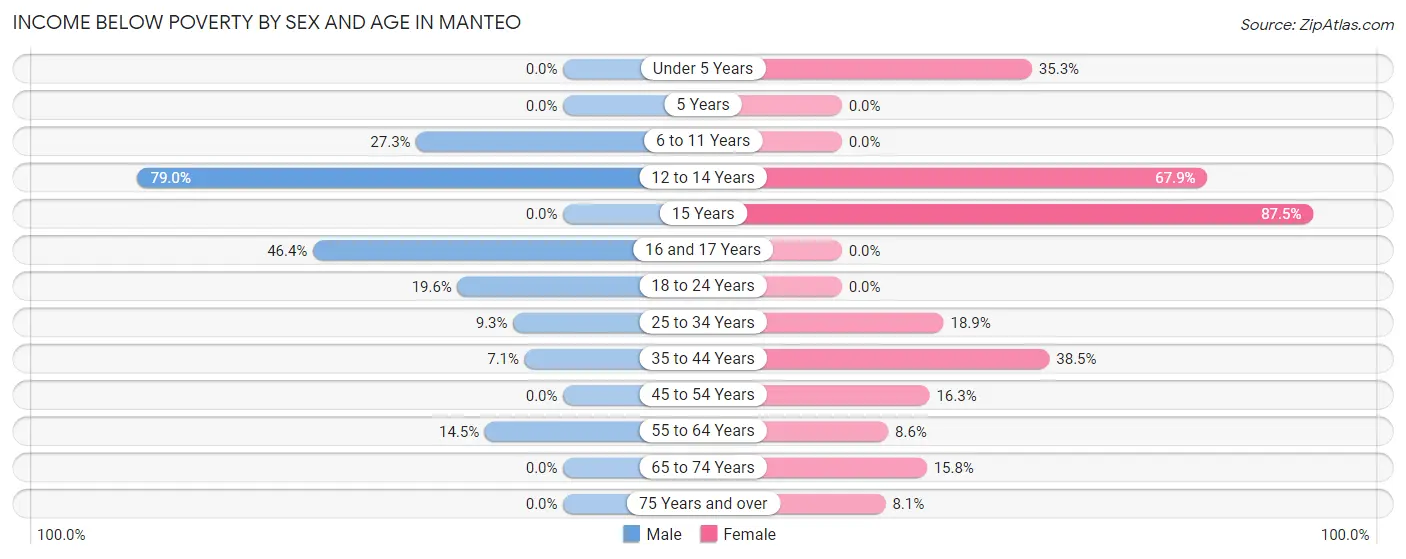
| Age Bracket | Male | Female |
| Under 5 Years | 0 (0.0%) | 6 (35.3%) |
| 5 Years | 0 (0.0%) | 0 (0.0%) |
| 6 to 11 Years | 15 (27.3%) | 0 (0.0%) |
| 12 to 14 Years | 49 (79.0%) | 19 (67.9%) |
| 15 Years | 0 (0.0%) | 21 (87.5%) |
| 16 and 17 Years | 13 (46.4%) | 0 (0.0%) |
| 18 to 24 Years | 10 (19.6%) | 0 (0.0%) |
| 25 to 34 Years | 9 (9.3%) | 17 (18.9%) |
| 35 to 44 Years | 9 (7.1%) | 42 (38.5%) |
| 45 to 54 Years | 0 (0.0%) | 14 (16.3%) |
| 55 to 64 Years | 17 (14.5%) | 14 (8.6%) |
| 65 to 74 Years | 0 (0.0%) | 29 (15.8%) |
| 75 Years and over | 0 (0.0%) | 9 (8.1%) |
| Total | 122 (14.2%) | 171 (18.1%) |
Income Above Poverty by Sex and Age in Manteo
According to the poverty statistics in Manteo, males aged under 5 years and females aged 6 to 11 years are the age groups that are most secure financially, with 100.0% of males and 100.0% of females in these age groups living above the poverty line.
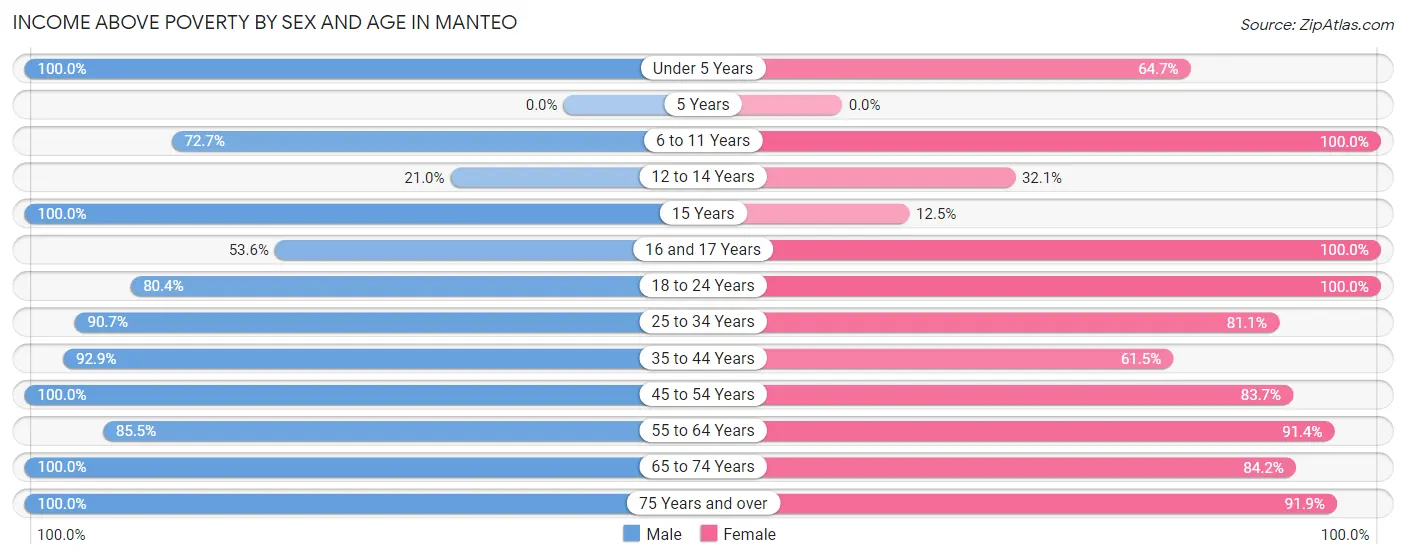
| Age Bracket | Male | Female |
| Under 5 Years | 22 (100.0%) | 11 (64.7%) |
| 5 Years | 0 (0.0%) | 0 (0.0%) |
| 6 to 11 Years | 40 (72.7%) | 82 (100.0%) |
| 12 to 14 Years | 13 (21.0%) | 9 (32.1%) |
| 15 Years | 18 (100.0%) | 3 (12.5%) |
| 16 and 17 Years | 15 (53.6%) | 25 (100.0%) |
| 18 to 24 Years | 41 (80.4%) | 27 (100.0%) |
| 25 to 34 Years | 88 (90.7%) | 73 (81.1%) |
| 35 to 44 Years | 117 (92.9%) | 67 (61.5%) |
| 45 to 54 Years | 81 (100.0%) | 72 (83.7%) |
| 55 to 64 Years | 100 (85.5%) | 149 (91.4%) |
| 65 to 74 Years | 137 (100.0%) | 155 (84.2%) |
| 75 Years and over | 63 (100.0%) | 102 (91.9%) |
| Total | 735 (85.8%) | 775 (81.9%) |
Income Below Poverty Among Married-Couple Families in Manteo
The poverty statistics for married-couple families in Manteo show that 3.1% or 9 of the total 294 families live below the poverty line. Families with 1 or 2 children have the highest poverty rate of 11.5%, comprising of 9 families. On the other hand, families with no children have the lowest poverty rate of 0.0%, which includes 0 families.
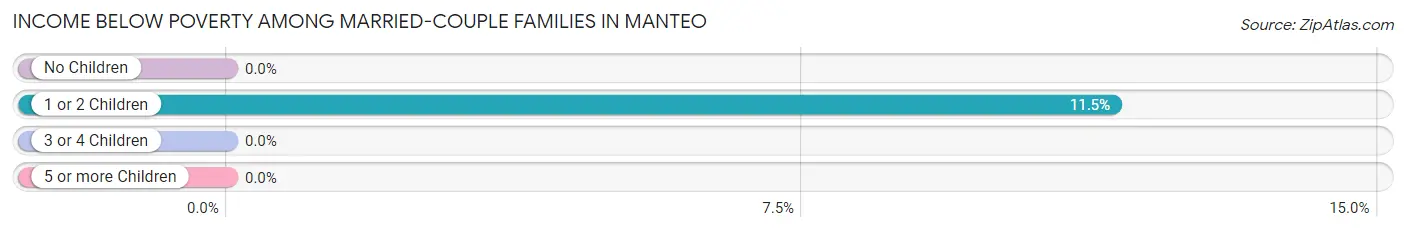
| Children | Above Poverty | Below Poverty |
| No Children | 203 (100.0%) | 0 (0.0%) |
| 1 or 2 Children | 69 (88.5%) | 9 (11.5%) |
| 3 or 4 Children | 13 (100.0%) | 0 (0.0%) |
| 5 or more Children | 0 (0.0%) | 0 (0.0%) |
| Total | 285 (96.9%) | 9 (3.1%) |
Income Below Poverty Among Single-Parent Households in Manteo
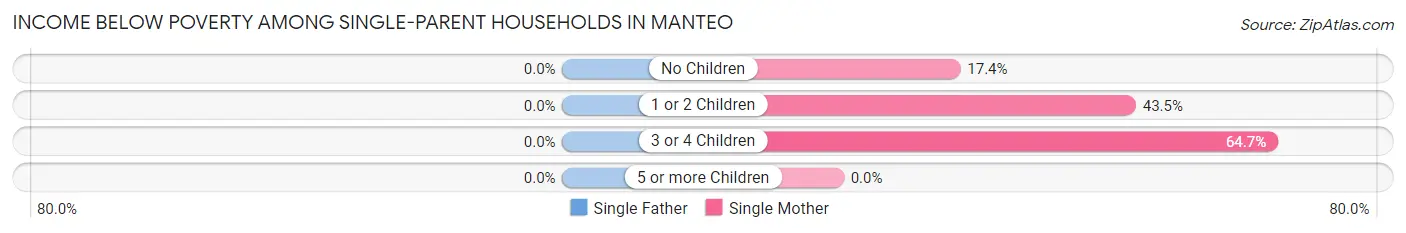
| Children | Single Father | Single Mother |
| No Children | 0 (0.0%) | 4 (17.4%) |
| 1 or 2 Children | 0 (0.0%) | 37 (43.5%) |
| 3 or 4 Children | 0 (0.0%) | 11 (64.7%) |
| 5 or more Children | 0 (0.0%) | 0 (0.0%) |
| Total | 0 (0.0%) | 52 (41.6%) |
Income Below Poverty Among Married-Couple vs Single-Parent Households in Manteo
The poverty data for Manteo shows that 9 of the married-couple family households (3.1%) and 52 of the single-parent households (34.0%) are living below the poverty level. Within the married-couple family households, those with 1 or 2 children have the highest poverty rate, with 9 households (11.5%) falling below the poverty line. Among the single-parent households, those with 3 or 4 children have the highest poverty rate, with 11 household (64.7%) living below poverty.
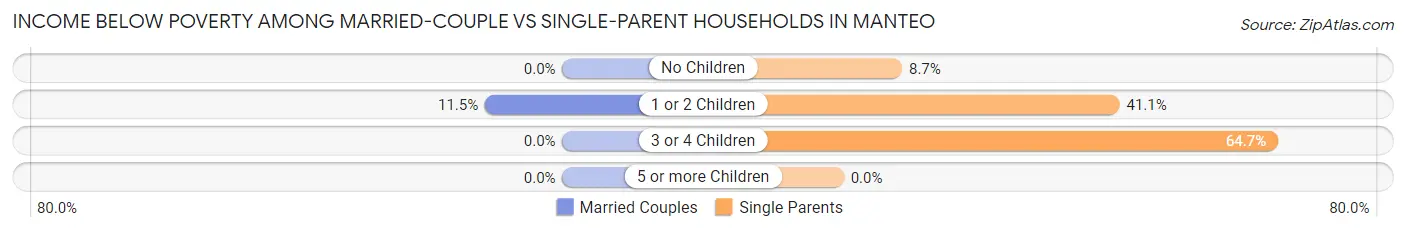
| Children | Married-Couple Families | Single-Parent Households |
| No Children | 0 (0.0%) | 4 (8.7%) |
| 1 or 2 Children | 9 (11.5%) | 37 (41.1%) |
| 3 or 4 Children | 0 (0.0%) | 11 (64.7%) |
| 5 or more Children | 0 (0.0%) | 0 (0.0%) |
| Total | 9 (3.1%) | 52 (34.0%) |
Race in Manteo
The most populous races in Manteo are White / Caucasian (1,435 | 79.4%), Black / African American (220 | 12.2%), and Some other Race (80 | 4.4%).
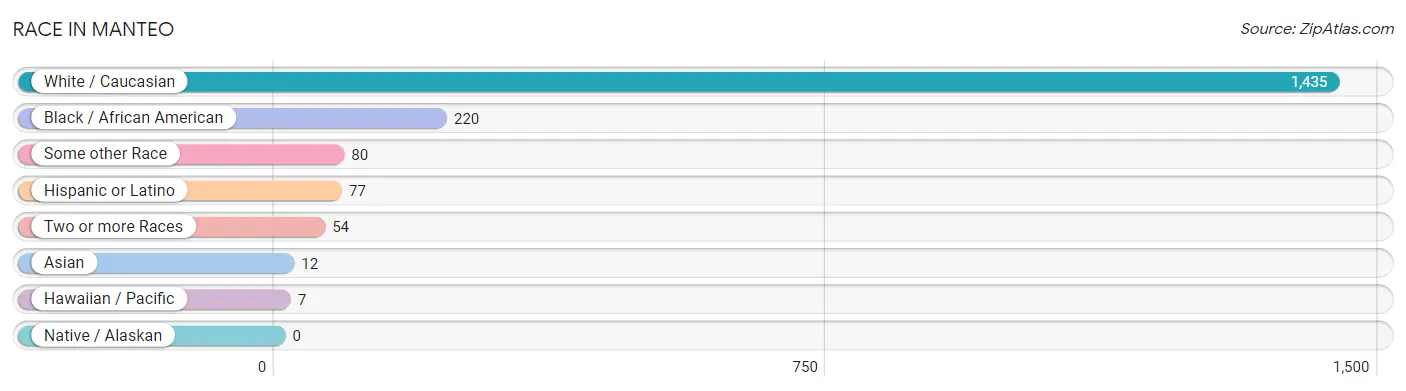
| Race | # Population | % Population |
| Asian | 12 | 0.7% |
| Black / African American | 220 | 12.2% |
| Hawaiian / Pacific | 7 | 0.4% |
| Hispanic or Latino | 77 | 4.3% |
| Native / Alaskan | 0 | 0.0% |
| White / Caucasian | 1,435 | 79.4% |
| Two or more Races | 54 | 3.0% |
| Some other Race | 80 | 4.4% |
| Total | 1,808 | 100.0% |
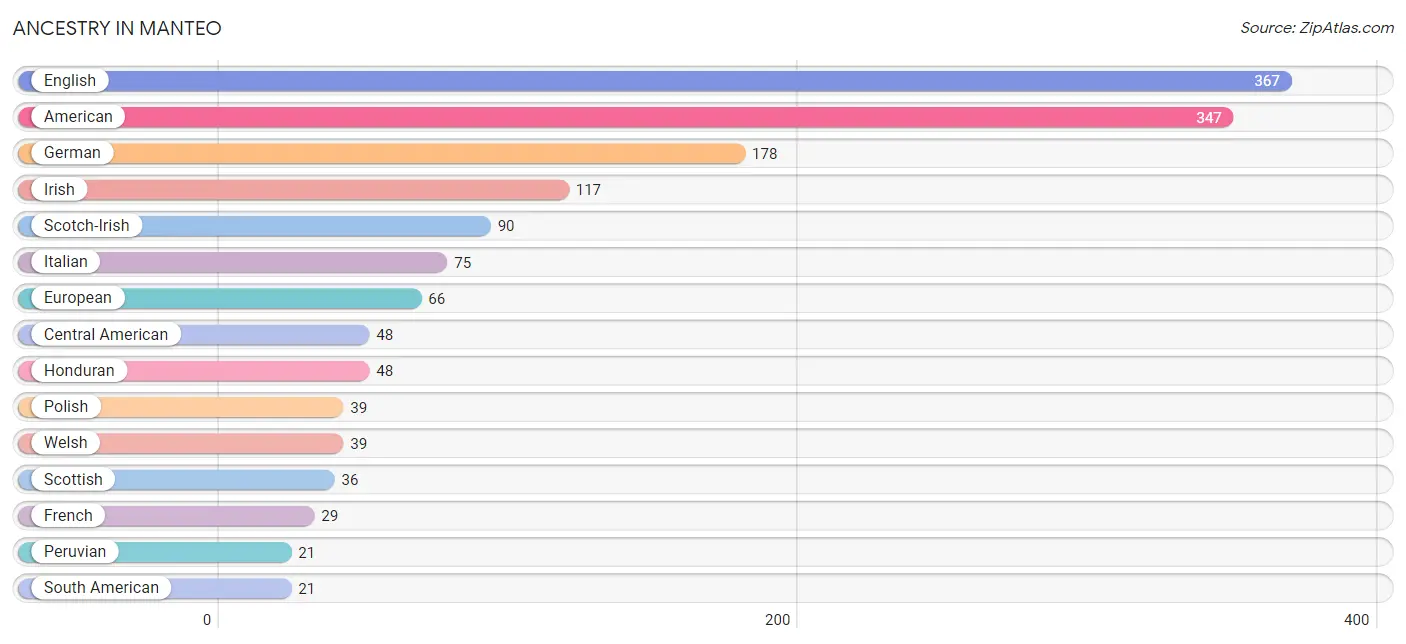
Ancestry in Manteo
The most populous ancestries reported in Manteo are English (367 | 20.3%), American (347 | 19.2%), German (178 | 9.9%), Irish (117 | 6.5%), and Scotch-Irish (90 | 5.0%), together accounting for 60.8% of all Manteo residents.
| Ancestry | # Population | % Population |
| American | 347 | 19.2% |
| Arab | 7 | 0.4% |
| Australian | 7 | 0.4% |
| Bhutanese | 15 | 0.8% |
| British | 9 | 0.5% |
| Central American | 48 | 2.6% |
| Cherokee | 3 | 0.2% |
| Chinese | 2 | 0.1% |
| Dominican | 3 | 0.2% |
| Dutch | 9 | 0.5% |
| Eastern European | 3 | 0.2% |
| English | 367 | 20.3% |
| European | 66 | 3.6% |
| French | 29 | 1.6% |
| French Canadian | 4 | 0.2% |
| German | 178 | 9.9% |
| Greek | 9 | 0.5% |
| Honduran | 48 | 2.6% |
| Hungarian | 7 | 0.4% |
| Irish | 117 | 6.5% |
| Italian | 75 | 4.2% |
| Korean | 5 | 0.3% |
| Lithuanian | 3 | 0.2% |
| Native Hawaiian | 7 | 0.4% |
| Norwegian | 10 | 0.5% |
| Peruvian | 21 | 1.2% |
| Polish | 39 | 2.2% |
| Scandinavian | 4 | 0.2% |
| Scotch-Irish | 90 | 5.0% |
| Scottish | 36 | 2.0% |
| South American | 21 | 1.2% |
| Spanish | 1 | 0.1% |
| Sri Lankan | 7 | 0.4% |
| Swedish | 10 | 0.5% |
| Swiss | 7 | 0.4% |
| Ukrainian | 5 | 0.3% |
| Welsh | 39 | 2.2% | View All 37 Rows |
Immigrants in Manteo
The most numerous immigrant groups reported in Manteo came from Latin America (63 | 3.5%), Central America (48 | 2.6%), Honduras (48 | 2.6%), Europe (14 | 0.8%), and Peru (12 | 0.7%), together accounting for 10.2% of all Manteo residents.
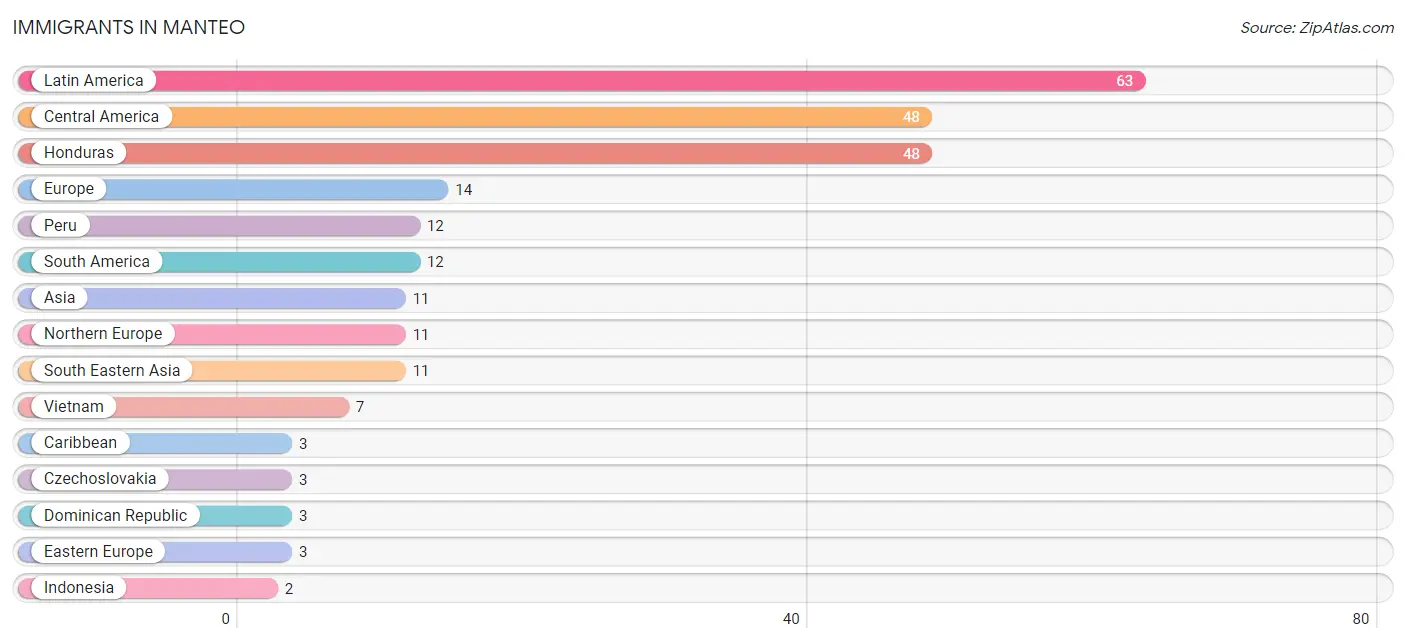
| Immigration Origin | # Population | % Population |
| Asia | 11 | 0.6% |
| Caribbean | 3 | 0.2% |
| Central America | 48 | 2.6% |
| Czechoslovakia | 3 | 0.2% |
| Dominican Republic | 3 | 0.2% |
| Eastern Europe | 3 | 0.2% |
| Europe | 14 | 0.8% |
| Honduras | 48 | 2.6% |
| Indonesia | 2 | 0.1% |
| Latin America | 63 | 3.5% |
| Northern Europe | 11 | 0.6% |
| Peru | 12 | 0.7% |
| Philippines | 2 | 0.1% |
| South America | 12 | 0.7% |
| South Eastern Asia | 11 | 0.6% |
| Vietnam | 7 | 0.4% | View All 16 Rows |
Sex and Age in Manteo
Sex and Age in Manteo
The most populous age groups in Manteo are 10 to 14 Years (90 | 10.5%) for men and 70 to 74 Years (142 | 14.9%) for women.
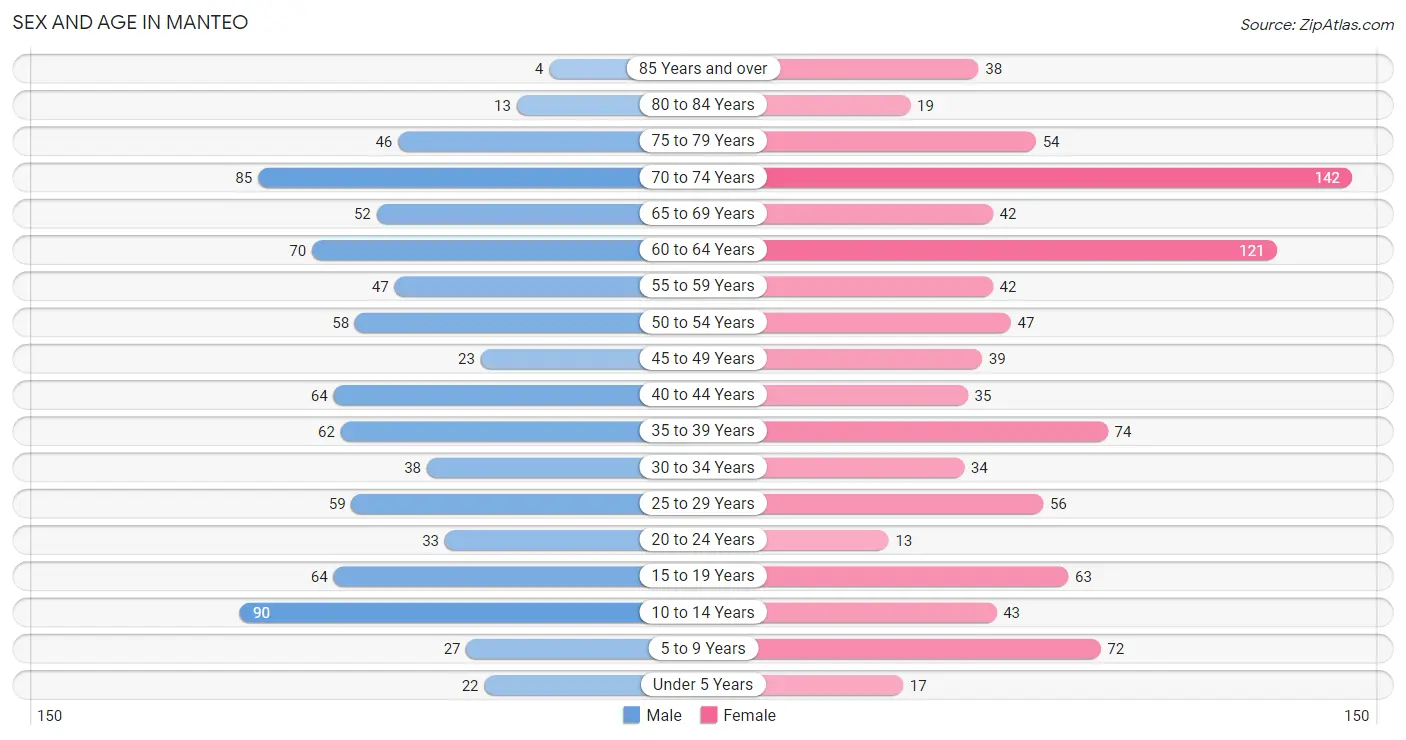
| Age Bracket | Male | Female |
| Under 5 Years | 22 (2.6%) | 17 (1.8%) |
| 5 to 9 Years | 27 (3.2%) | 72 (7.6%) |
| 10 to 14 Years | 90 (10.5%) | 43 (4.5%) |
| 15 to 19 Years | 64 (7.5%) | 63 (6.6%) |
| 20 to 24 Years | 33 (3.8%) | 13 (1.4%) |
| 25 to 29 Years | 59 (6.9%) | 56 (5.9%) |
| 30 to 34 Years | 38 (4.4%) | 34 (3.6%) |
| 35 to 39 Years | 62 (7.2%) | 74 (7.8%) |
| 40 to 44 Years | 64 (7.5%) | 35 (3.7%) |
| 45 to 49 Years | 23 (2.7%) | 39 (4.1%) |
| 50 to 54 Years | 58 (6.8%) | 47 (4.9%) |
| 55 to 59 Years | 47 (5.5%) | 42 (4.4%) |
| 60 to 64 Years | 70 (8.2%) | 121 (12.7%) |
| 65 to 69 Years | 52 (6.1%) | 42 (4.4%) |
| 70 to 74 Years | 85 (9.9%) | 142 (14.9%) |
| 75 to 79 Years | 46 (5.4%) | 54 (5.7%) |
| 80 to 84 Years | 13 (1.5%) | 19 (2.0%) |
| 85 Years and over | 4 (0.5%) | 38 (4.0%) |
| Total | 857 (100.0%) | 951 (100.0%) |
Families and Households in Manteo
Median Family Size in Manteo
The median family size in Manteo is 2.83 persons per family, with single male/father families (28 | 6.3%) accounting for the largest median family size of 3.11 persons per family. On the other hand, single female/mother families (125 | 28.0%) represent the smallest median family size with 2.71 persons per family.
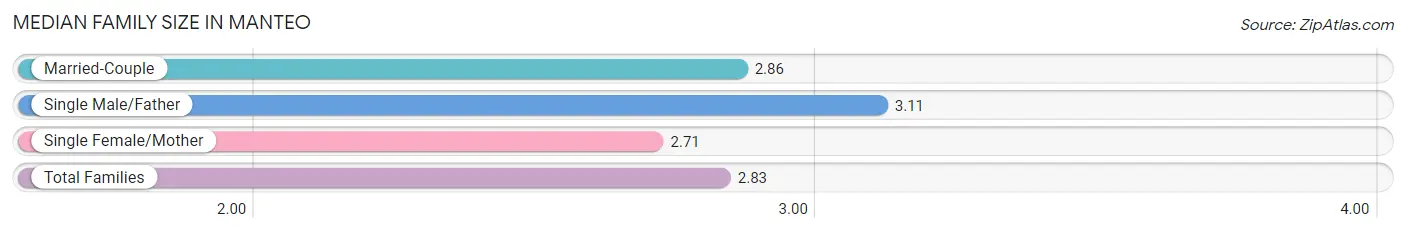
| Family Type | # Families | Family Size |
| Married-Couple | 294 (65.8%) | 2.86 |
| Single Male/Father | 28 (6.3%) | 3.11 |
| Single Female/Mother | 125 (28.0%) | 2.71 |
| Total Families | 447 (100.0%) | 2.83 |
Median Household Size in Manteo
The median household size in Manteo is 2.03 persons per household, with single male/father households (28 | 3.2%) accounting for the largest median household size of 3.36 persons per household. non-family households (442 | 49.7%) represent the smallest median household size with 1.19 persons per household.
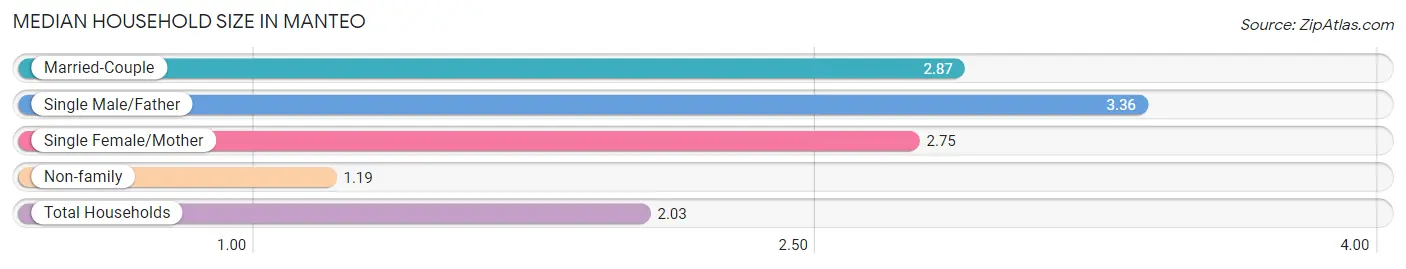
| Household Type | # Households | Household Size |
| Married-Couple | 294 (33.1%) | 2.87 |
| Single Male/Father | 28 (3.2%) | 3.36 |
| Single Female/Mother | 125 (14.1%) | 2.75 |
| Non-family | 442 (49.7%) | 1.19 |
| Total Households | 889 (100.0%) | 2.03 |
Household Size by Marriage Status in Manteo
Out of a total of 889 households in Manteo, 447 (50.3%) are family households, while 442 (49.7%) are nonfamily households. The most numerous type of family households are 2-person households, comprising 232, and the most common type of nonfamily households are 1-person households, comprising 368.
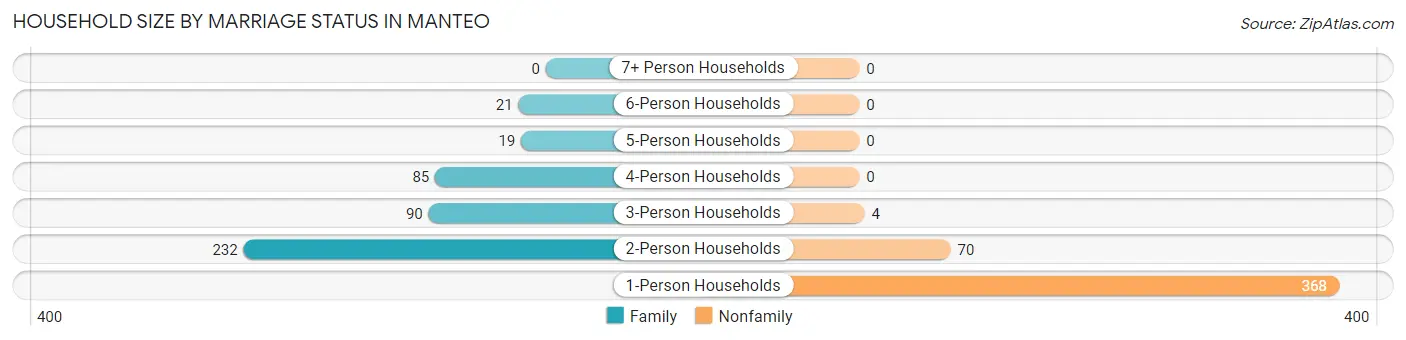
| Household Size | Family Households | Nonfamily Households |
| 1-Person Households | - | 368 (41.4%) |
| 2-Person Households | 232 (26.1%) | 70 (7.9%) |
| 3-Person Households | 90 (10.1%) | 4 (0.4%) |
| 4-Person Households | 85 (9.6%) | 0 (0.0%) |
| 5-Person Households | 19 (2.1%) | 0 (0.0%) |
| 6-Person Households | 21 (2.4%) | 0 (0.0%) |
| 7+ Person Households | 0 (0.0%) | 0 (0.0%) |
| Total | 447 (50.3%) | 442 (49.7%) |
Female Fertility in Manteo
Fertility by Age in Manteo
Average fertility rate in Manteo is 49.0 births per 1,000 women. Women in the age bracket of 20 to 34 years have the highest fertility rate with 155.0 births per 1,000 women. Women in the age bracket of 20 to 34 years acount for 100.0% of all women with births.
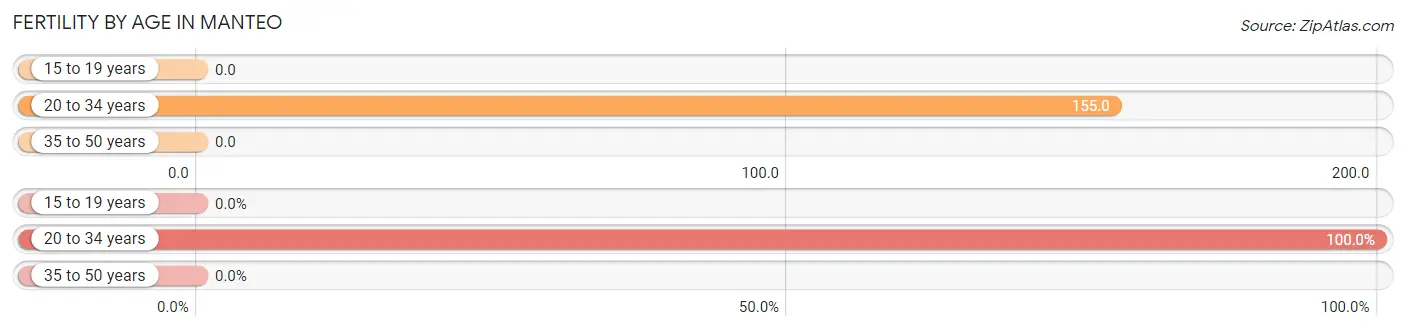
| Age Bracket | Women with Births | Births / 1,000 Women |
| 15 to 19 years | 0 (0.0%) | 0.0 |
| 20 to 34 years | 16 (100.0%) | 155.0 |
| 35 to 50 years | 0 (0.0%) | 0.0 |
| Total | 16 (100.0%) | 49.0 |
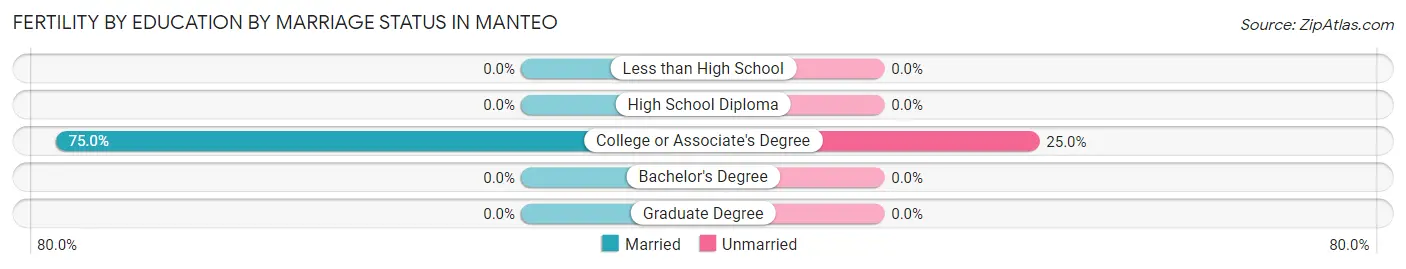
Fertility by Age by Marriage Status in Manteo
75.0% of women with births (16) in Manteo are married. The highest percentage of unmarried women with births falls into 20 to 34 years age bracket with 25.0% of them unmarried at the time of birth, while the lowest percentage of unmarried women with births belong to 20 to 34 years age bracket with 25.0% of them unmarried.
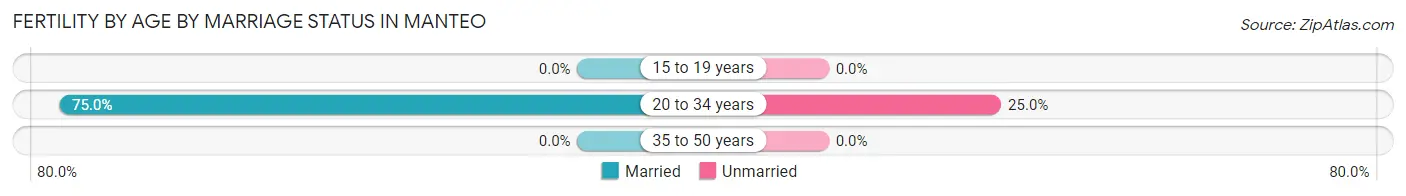
| Age Bracket | Married | Unmarried |
| 15 to 19 years | 0 (0.0%) | 0 (0.0%) |
| 20 to 34 years | 12 (75.0%) | 4 (25.0%) |
| 35 to 50 years | 0 (0.0%) | 0 (0.0%) |
| Total | 12 (75.0%) | 4 (25.0%) |
Fertility by Education in Manteo
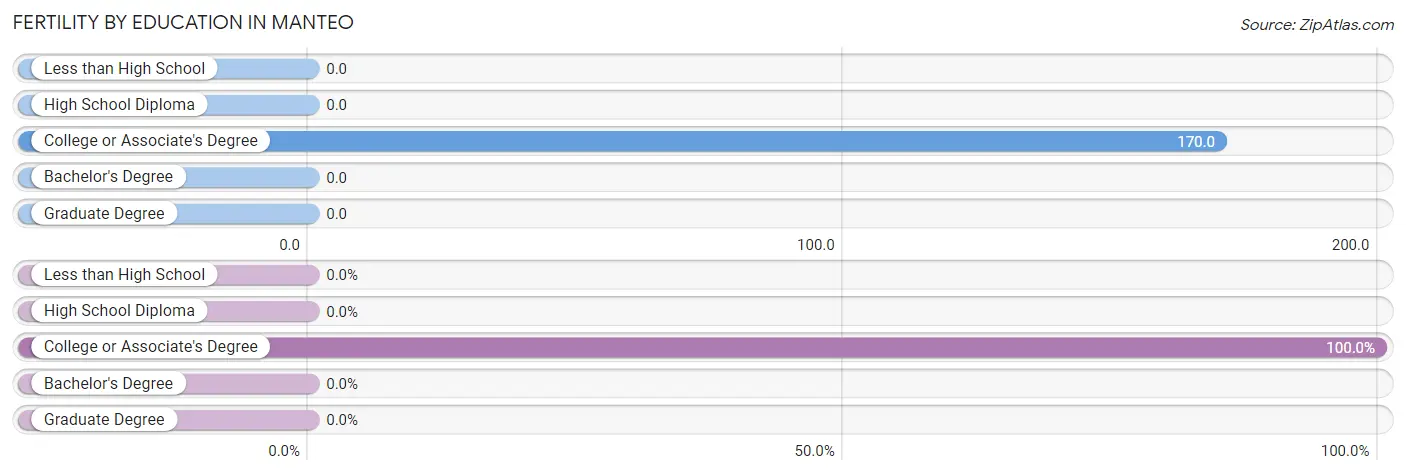
| Educational Attainment | Women with Births | Births / 1,000 Women |
| Less than High School | 0 (0.0%) | 0.0 |
| High School Diploma | 0 (0.0%) | 0.0 |
| College or Associate's Degree | 16 (100.0%) | 170.0 |
| Bachelor's Degree | 0 (0.0%) | 0.0 |
| Graduate Degree | 0 (0.0%) | 0.0 |
| Total | 16 (100.0%) | 49.0 |
Fertility by Education by Marriage Status in Manteo
25.0% of women with births in Manteo are unmarried. Women with the educational attainment of college or associate's degree are most likely to be married with 75.0% of them married at childbirth, while women with the educational attainment of college or associate's degree are least likely to be married with 25.0% of them unmarried at childbirth.
| Educational Attainment | Married | Unmarried |
| Less than High School | 0 (0.0%) | 0 (0.0%) |
| High School Diploma | 0 (0.0%) | 0 (0.0%) |
| College or Associate's Degree | 12 (75.0%) | 4 (25.0%) |
| Bachelor's Degree | 0 (0.0%) | 0 (0.0%) |
| Graduate Degree | 0 (0.0%) | 0 (0.0%) |
| Total | 12 (75.0%) | 4 (25.0%) |
Employment Characteristics in Manteo
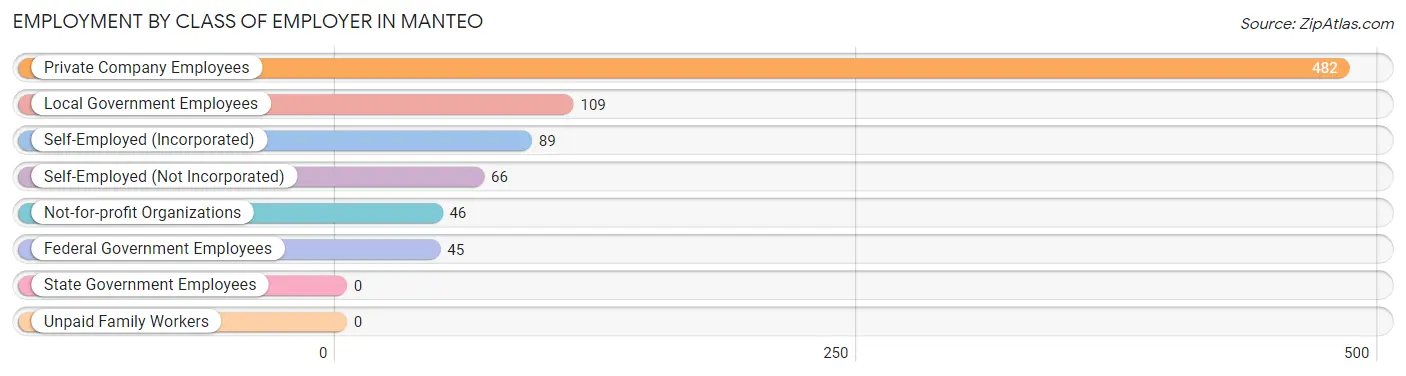
Employment by Class of Employer in Manteo
Among the 837 employed individuals in Manteo, private company employees (482 | 57.6%), local government employees (109 | 13.0%), and self-employed (incorporated) (89 | 10.6%) make up the most common classes of employment.
| Employer Class | # Employees | % Employees |
| Private Company Employees | 482 | 57.6% |
| Self-Employed (Incorporated) | 89 | 10.6% |
| Self-Employed (Not Incorporated) | 66 | 7.9% |
| Not-for-profit Organizations | 46 | 5.5% |
| Local Government Employees | 109 | 13.0% |
| State Government Employees | 0 | 0.0% |
| Federal Government Employees | 45 | 5.4% |
| Unpaid Family Workers | 0 | 0.0% |
| Total | 837 | 100.0% |
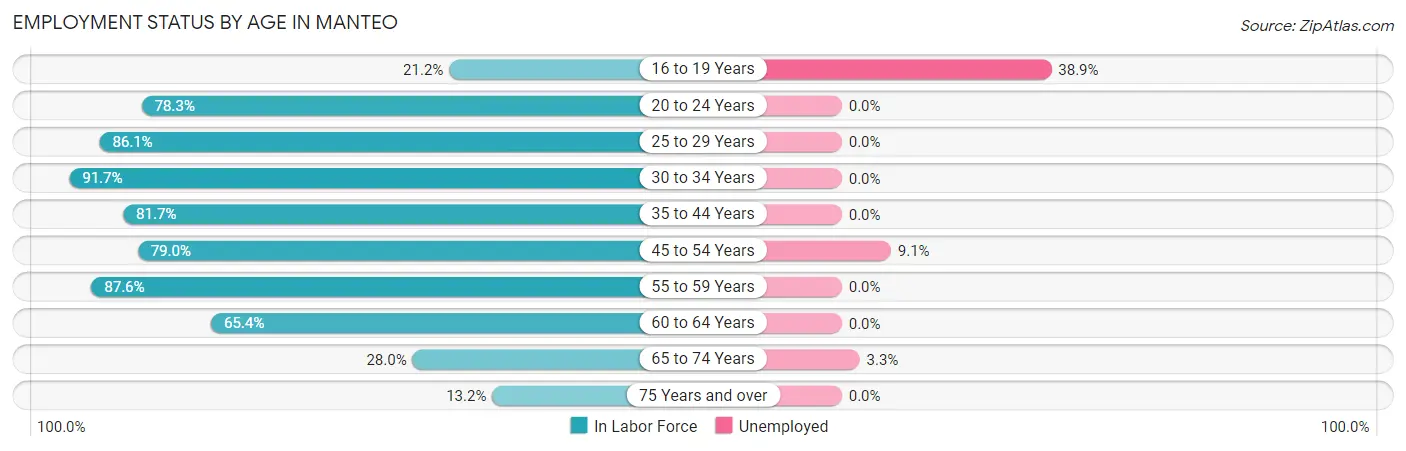
Employment Status by Age in Manteo
According to the labor force statistics for Manteo, out of the total population over 16 years of age (1,495), 57.5% or 860 individuals are in the labor force, with 2.6% or 22 of them unemployed. The age group with the highest labor force participation rate is 30 to 34 years, with 91.7% or 66 individuals in the labor force. Within the labor force, the 16 to 19 years age range has the highest percentage of unemployed individuals, with 38.9% or 7 of them being unemployed.
| Age Bracket | In Labor Force | Unemployed |
| 16 to 19 Years | 18 (21.2%) | 7 (38.9%) |
| 20 to 24 Years | 36 (78.3%) | 0 (0.0%) |
| 25 to 29 Years | 99 (86.1%) | 0 (0.0%) |
| 30 to 34 Years | 66 (91.7%) | 0 (0.0%) |
| 35 to 44 Years | 192 (81.7%) | 0 (0.0%) |
| 45 to 54 Years | 132 (79.0%) | 12 (9.1%) |
| 55 to 59 Years | 78 (87.6%) | 0 (0.0%) |
| 60 to 64 Years | 125 (65.4%) | 0 (0.0%) |
| 65 to 74 Years | 90 (28.0%) | 3 (3.3%) |
| 75 Years and over | 23 (13.2%) | 0 (0.0%) |
| Total | 860 (57.5%) | 22 (2.6%) |
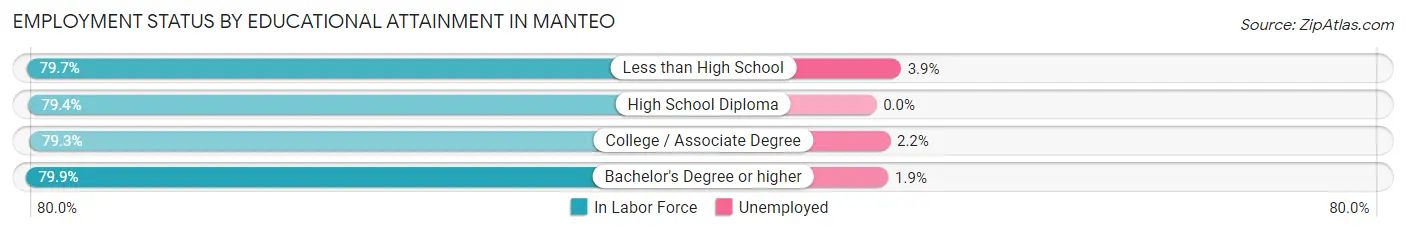
Employment Status by Educational Attainment in Manteo
According to labor force statistics for Manteo, 79.6% of individuals (692) out of the total population between 25 and 64 years of age (869) are in the labor force, with 1.7% or 12 of them being unemployed. The group with the highest labor force participation rate are those with the educational attainment of bachelor's degree or higher, with 79.9% or 314 individuals in the labor force. Within the labor force, individuals with less than high school education have the highest percentage of unemployment, with 3.9% or 2 of them being unemployed.
| Educational Attainment | In Labor Force | Unemployed |
| Less than High School | 51 (79.7%) | 2 (3.9%) |
| High School Diploma | 143 (79.4%) | 0 (0.0%) |
| College / Associate Degree | 184 (79.3%) | 5 (2.2%) |
| Bachelor's Degree or higher | 314 (79.9%) | 7 (1.9%) |
| Total | 692 (79.6%) | 15 (1.7%) |
Employment Occupations by Sex in Manteo
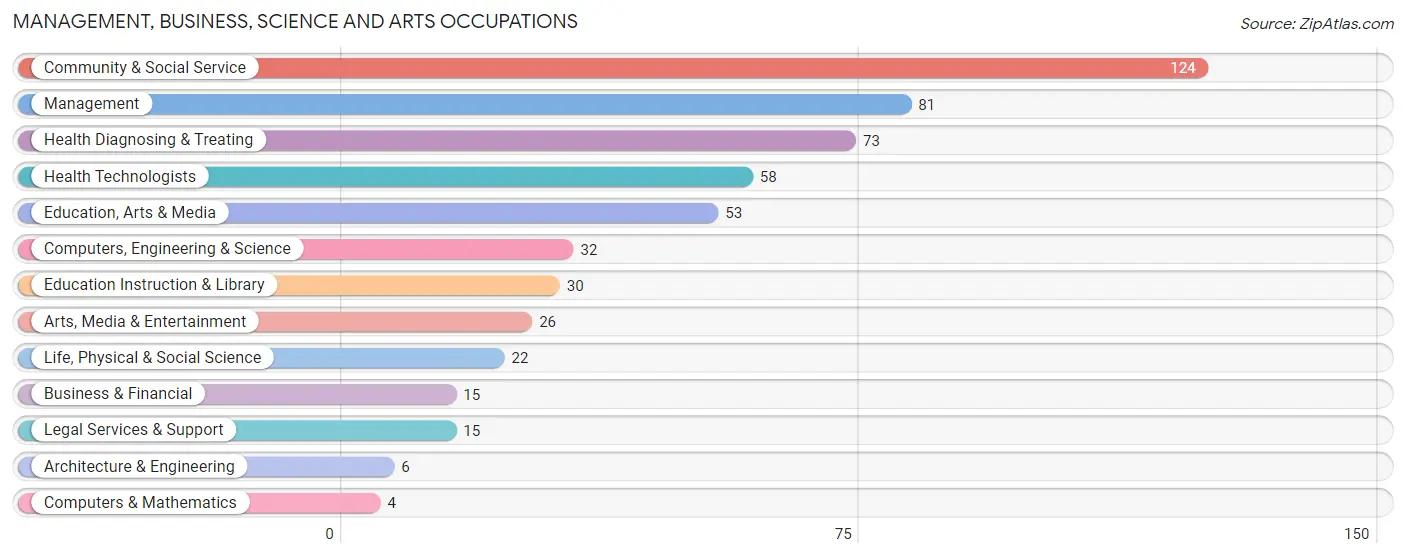
Management, Business, Science and Arts Occupations
The most common Management, Business, Science and Arts occupations in Manteo are Community & Social Service (124 | 14.8%), Management (81 | 9.7%), Health Diagnosing & Treating (73 | 8.7%), Health Technologists (58 | 7.0%), and Education, Arts & Media (53 | 6.4%).
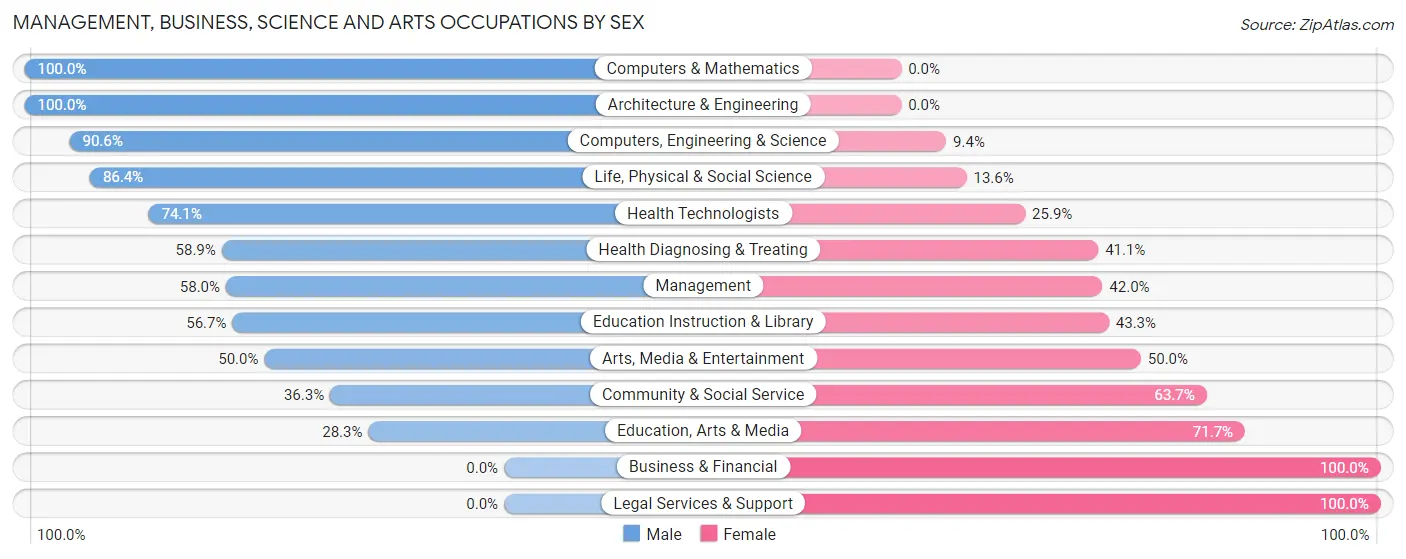
Management, Business, Science and Arts Occupations by Sex
Within the Management, Business, Science and Arts occupations in Manteo, the most male-oriented occupations are Computers & Mathematics (100.0%), Architecture & Engineering (100.0%), and Computers, Engineering & Science (90.6%), while the most female-oriented occupations are Business & Financial (100.0%), Legal Services & Support (100.0%), and Education, Arts & Media (71.7%).
| Occupation | Male | Female |
| Management | 47 (58.0%) | 34 (42.0%) |
| Business & Financial | 0 (0.0%) | 15 (100.0%) |
| Computers, Engineering & Science | 29 (90.6%) | 3 (9.4%) |
| Computers & Mathematics | 4 (100.0%) | 0 (0.0%) |
| Architecture & Engineering | 6 (100.0%) | 0 (0.0%) |
| Life, Physical & Social Science | 19 (86.4%) | 3 (13.6%) |
| Community & Social Service | 45 (36.3%) | 79 (63.7%) |
| Education, Arts & Media | 15 (28.3%) | 38 (71.7%) |
| Legal Services & Support | 0 (0.0%) | 15 (100.0%) |
| Education Instruction & Library | 17 (56.7%) | 13 (43.3%) |
| Arts, Media & Entertainment | 13 (50.0%) | 13 (50.0%) |
| Health Diagnosing & Treating | 43 (58.9%) | 30 (41.1%) |
| Health Technologists | 43 (74.1%) | 15 (25.9%) |
| Total (Category) | 164 (50.5%) | 161 (49.5%) |
| Total (Overall) | 451 (54.0%) | 384 (46.0%) |
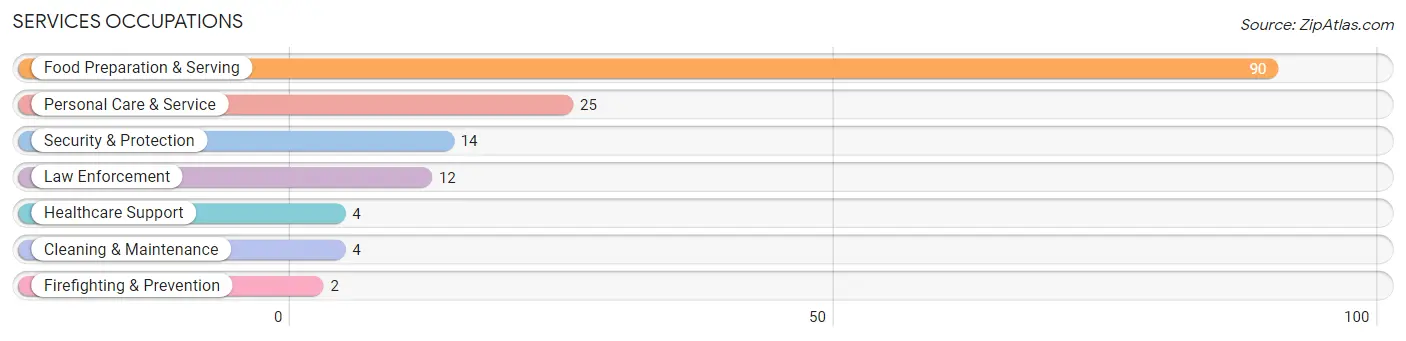
Services Occupations
The most common Services occupations in Manteo are Food Preparation & Serving (90 | 10.8%), Personal Care & Service (25 | 3.0%), Security & Protection (14 | 1.7%), Law Enforcement (12 | 1.4%), and Healthcare Support (4 | 0.5%).
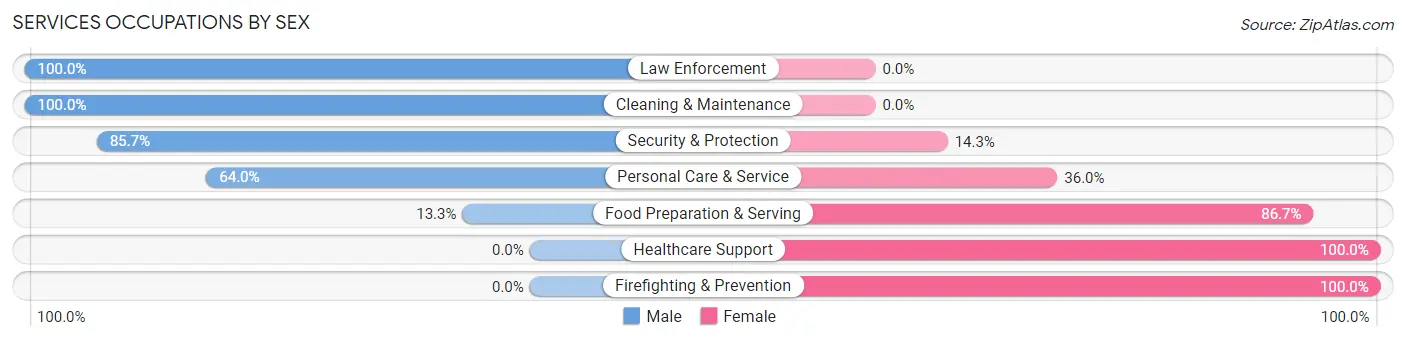
Services Occupations by Sex
Within the Services occupations in Manteo, the most male-oriented occupations are Law Enforcement (100.0%), Cleaning & Maintenance (100.0%), and Security & Protection (85.7%), while the most female-oriented occupations are Healthcare Support (100.0%), Firefighting & Prevention (100.0%), and Food Preparation & Serving (86.7%).
| Occupation | Male | Female |
| Healthcare Support | 0 (0.0%) | 4 (100.0%) |
| Security & Protection | 12 (85.7%) | 2 (14.3%) |
| Firefighting & Prevention | 0 (0.0%) | 2 (100.0%) |
| Law Enforcement | 12 (100.0%) | 0 (0.0%) |
| Food Preparation & Serving | 12 (13.3%) | 78 (86.7%) |
| Cleaning & Maintenance | 4 (100.0%) | 0 (0.0%) |
| Personal Care & Service | 16 (64.0%) | 9 (36.0%) |
| Total (Category) | 44 (32.1%) | 93 (67.9%) |
| Total (Overall) | 451 (54.0%) | 384 (46.0%) |
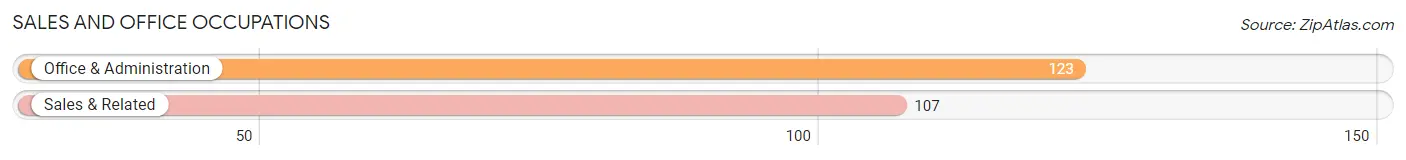
Sales and Office Occupations
The most common Sales and Office occupations in Manteo are Office & Administration (123 | 14.7%), and Sales & Related (107 | 12.8%).
Sales and Office Occupations by Sex
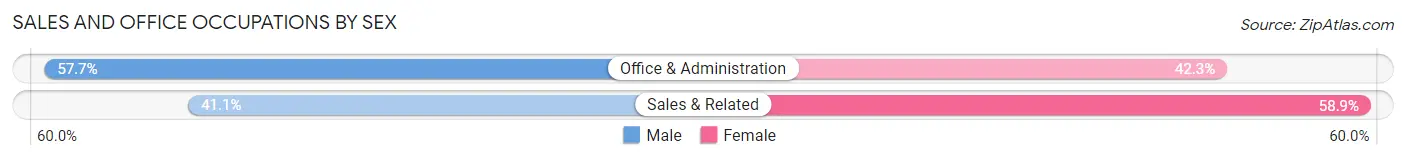
| Occupation | Male | Female |
| Sales & Related | 44 (41.1%) | 63 (58.9%) |
| Office & Administration | 71 (57.7%) | 52 (42.3%) |
| Total (Category) | 115 (50.0%) | 115 (50.0%) |
| Total (Overall) | 451 (54.0%) | 384 (46.0%) |
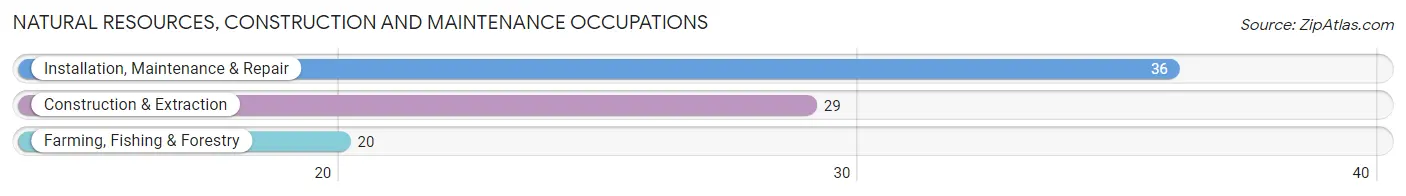
Natural Resources, Construction and Maintenance Occupations
The most common Natural Resources, Construction and Maintenance occupations in Manteo are Installation, Maintenance & Repair (36 | 4.3%), Construction & Extraction (29 | 3.5%), and Farming, Fishing & Forestry (20 | 2.4%).
Natural Resources, Construction and Maintenance Occupations by Sex
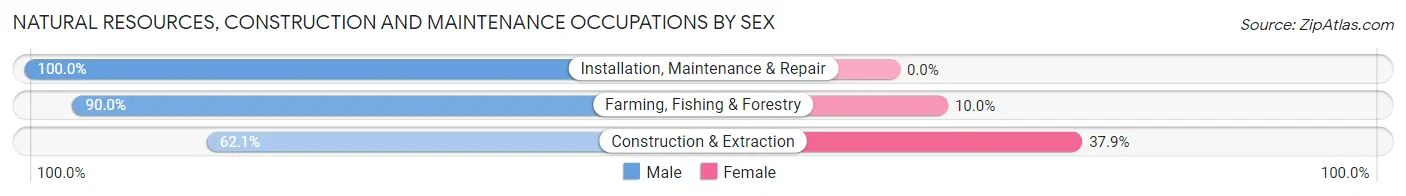
| Occupation | Male | Female |
| Farming, Fishing & Forestry | 18 (90.0%) | 2 (10.0%) |
| Construction & Extraction | 18 (62.1%) | 11 (37.9%) |
| Installation, Maintenance & Repair | 36 (100.0%) | 0 (0.0%) |
| Total (Category) | 72 (84.7%) | 13 (15.3%) |
| Total (Overall) | 451 (54.0%) | 384 (46.0%) |
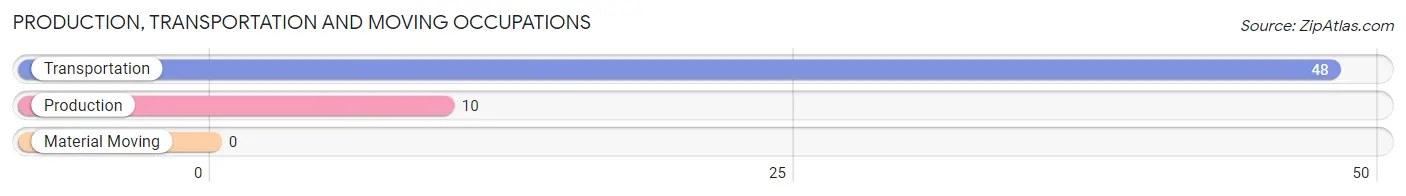
Production, Transportation and Moving Occupations
The most common Production, Transportation and Moving occupations in Manteo are Transportation (48 | 5.8%), and Production (10 | 1.2%).
Production, Transportation and Moving Occupations by Sex
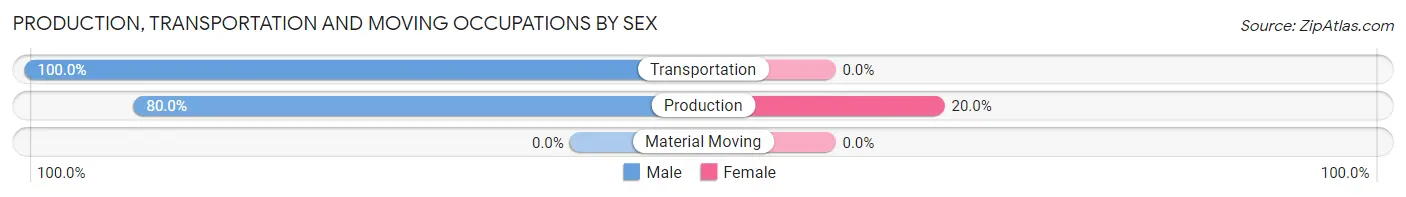
| Occupation | Male | Female |
| Production | 8 (80.0%) | 2 (20.0%) |
| Transportation | 48 (100.0%) | 0 (0.0%) |
| Material Moving | 0 (0.0%) | 0 (0.0%) |
| Total (Category) | 56 (96.6%) | 2 (3.5%) |
| Total (Overall) | 451 (54.0%) | 384 (46.0%) |
Employment Industries by Sex in Manteo
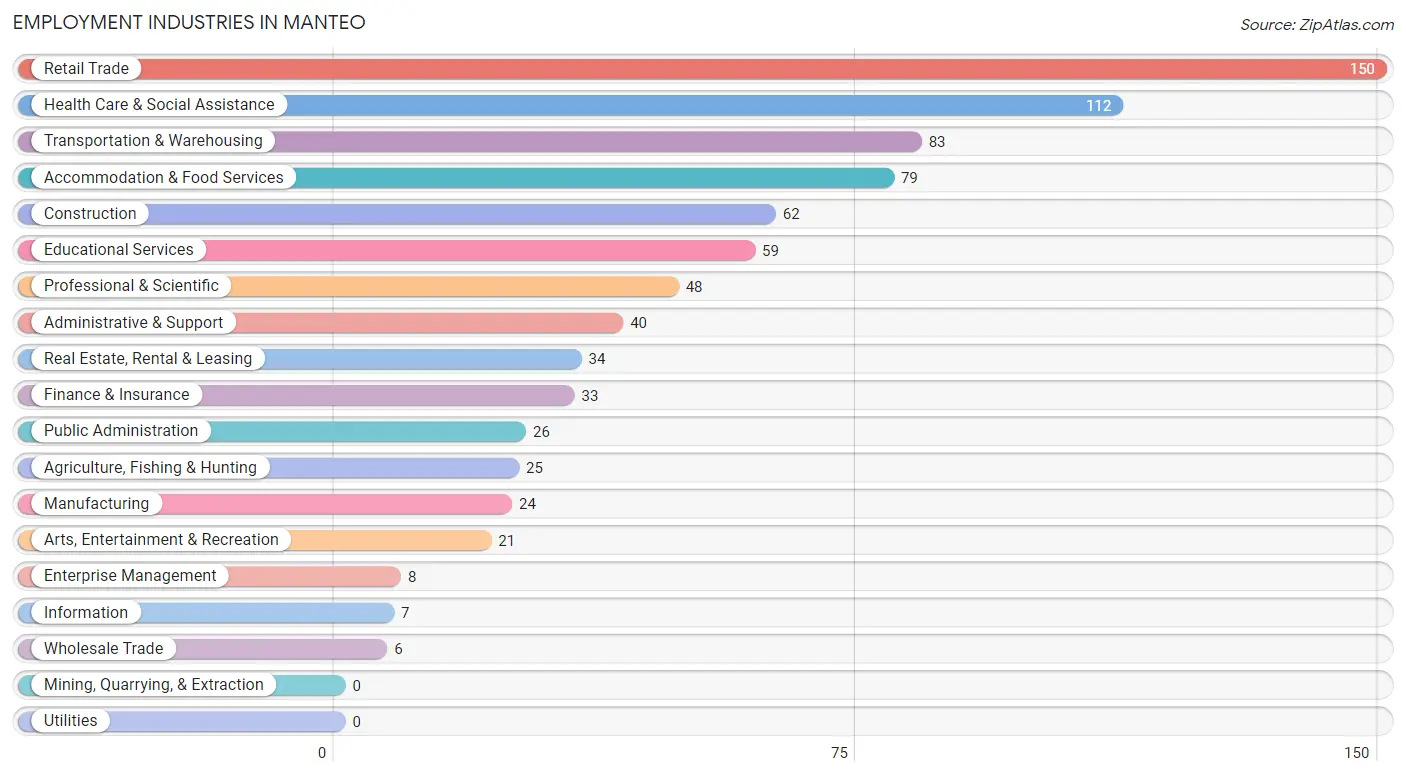
Employment Industries in Manteo
The major employment industries in Manteo include Retail Trade (150 | 18.0%), Health Care & Social Assistance (112 | 13.4%), Transportation & Warehousing (83 | 9.9%), Accommodation & Food Services (79 | 9.5%), and Construction (62 | 7.4%).
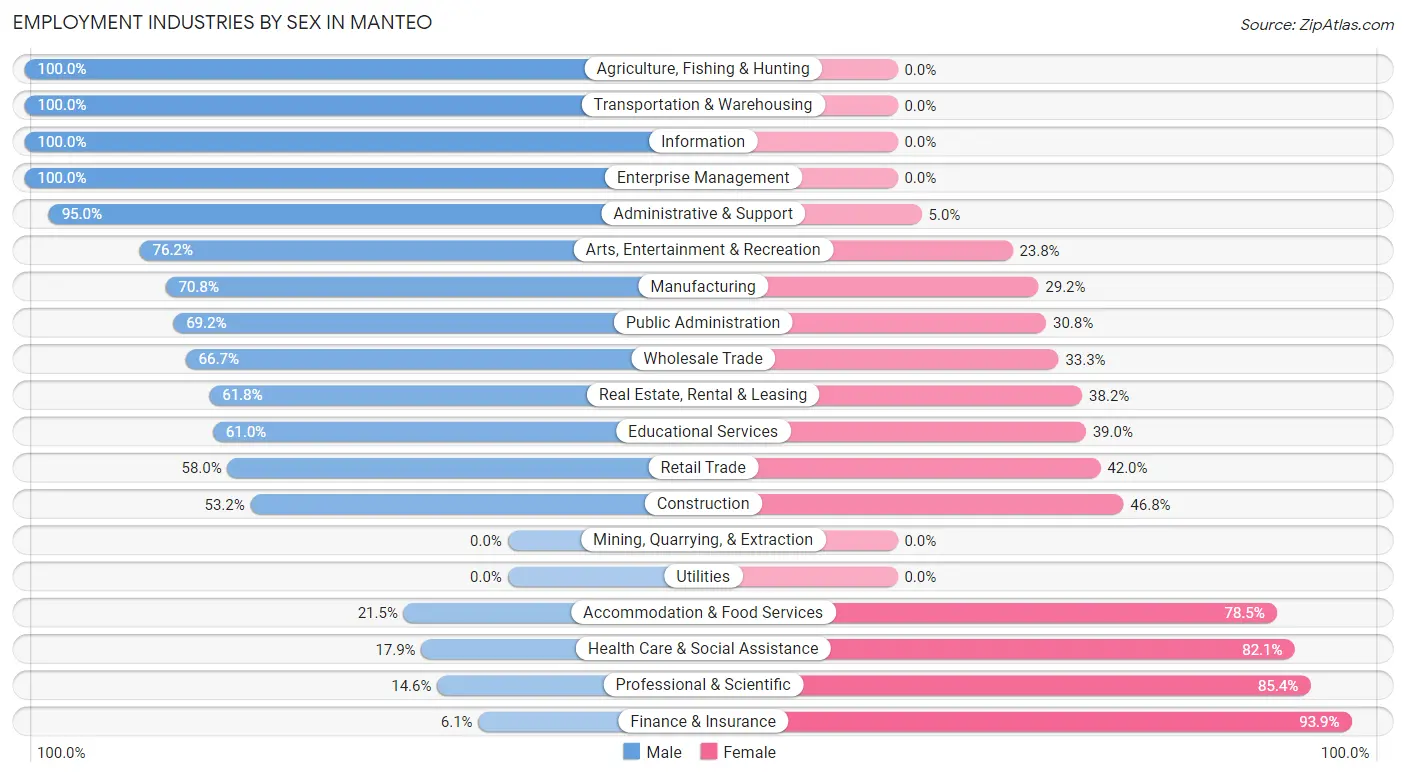
Employment Industries by Sex in Manteo
The Manteo industries that see more men than women are Agriculture, Fishing & Hunting (100.0%), Transportation & Warehousing (100.0%), and Information (100.0%), whereas the industries that tend to have a higher number of women are Finance & Insurance (93.9%), Professional & Scientific (85.4%), and Health Care & Social Assistance (82.1%).
| Industry | Male | Female |
| Agriculture, Fishing & Hunting | 25 (100.0%) | 0 (0.0%) |
| Mining, Quarrying, & Extraction | 0 (0.0%) | 0 (0.0%) |
| Construction | 33 (53.2%) | 29 (46.8%) |
| Manufacturing | 17 (70.8%) | 7 (29.2%) |
| Wholesale Trade | 4 (66.7%) | 2 (33.3%) |
| Retail Trade | 87 (58.0%) | 63 (42.0%) |
| Transportation & Warehousing | 83 (100.0%) | 0 (0.0%) |
| Utilities | 0 (0.0%) | 0 (0.0%) |
| Information | 7 (100.0%) | 0 (0.0%) |
| Finance & Insurance | 2 (6.1%) | 31 (93.9%) |
| Real Estate, Rental & Leasing | 21 (61.8%) | 13 (38.2%) |
| Professional & Scientific | 7 (14.6%) | 41 (85.4%) |
| Enterprise Management | 8 (100.0%) | 0 (0.0%) |
| Administrative & Support | 38 (95.0%) | 2 (5.0%) |
| Educational Services | 36 (61.0%) | 23 (39.0%) |
| Health Care & Social Assistance | 20 (17.9%) | 92 (82.1%) |
| Arts, Entertainment & Recreation | 16 (76.2%) | 5 (23.8%) |
| Accommodation & Food Services | 17 (21.5%) | 62 (78.5%) |
| Public Administration | 18 (69.2%) | 8 (30.8%) |
| Total | 451 (54.0%) | 384 (46.0%) |
Education in Manteo
School Enrollment in Manteo
The most common levels of schooling among the 409 students in Manteo are high school (129 | 31.5%), middle school (91 | 22.3%), and elementary school (89 | 21.8%).
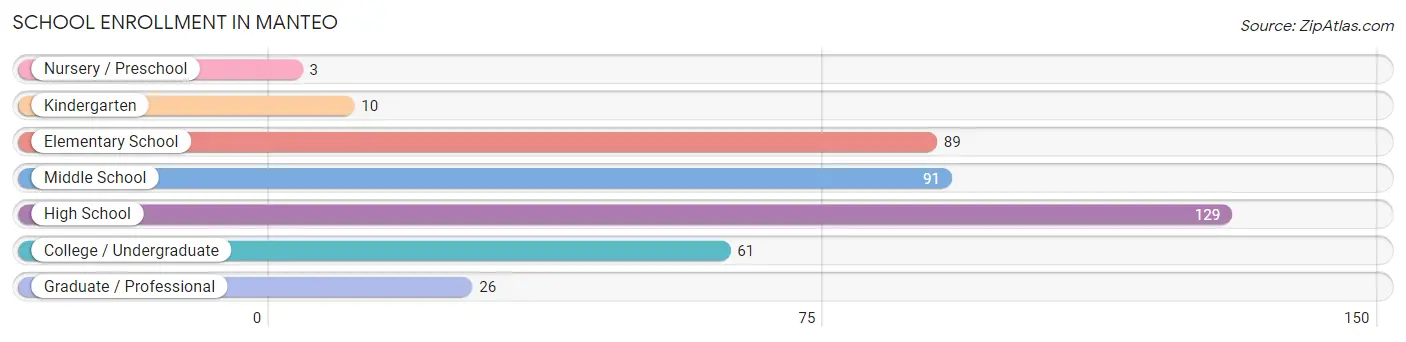
| School Level | # Students | % Students |
| Nursery / Preschool | 3 | 0.7% |
| Kindergarten | 10 | 2.4% |
| Elementary School | 89 | 21.8% |
| Middle School | 91 | 22.3% |
| High School | 129 | 31.5% |
| College / Undergraduate | 61 | 14.9% |
| Graduate / Professional | 26 | 6.4% |
| Total | 409 | 100.0% |
School Enrollment by Age by Funding Source in Manteo
Out of a total of 409 students who are enrolled in schools in Manteo, 50 (12.2%) attend a private institution, while the remaining 359 (87.8%) are enrolled in public schools. The age group of 35 years and over has the highest likelihood of being enrolled in private schools, with 31 (60.8% in the age bracket) enrolled. Conversely, the age group of 3 to 4 year olds has the lowest likelihood of being enrolled in a private school, with 3 (100.0% in the age bracket) attending a public institution.
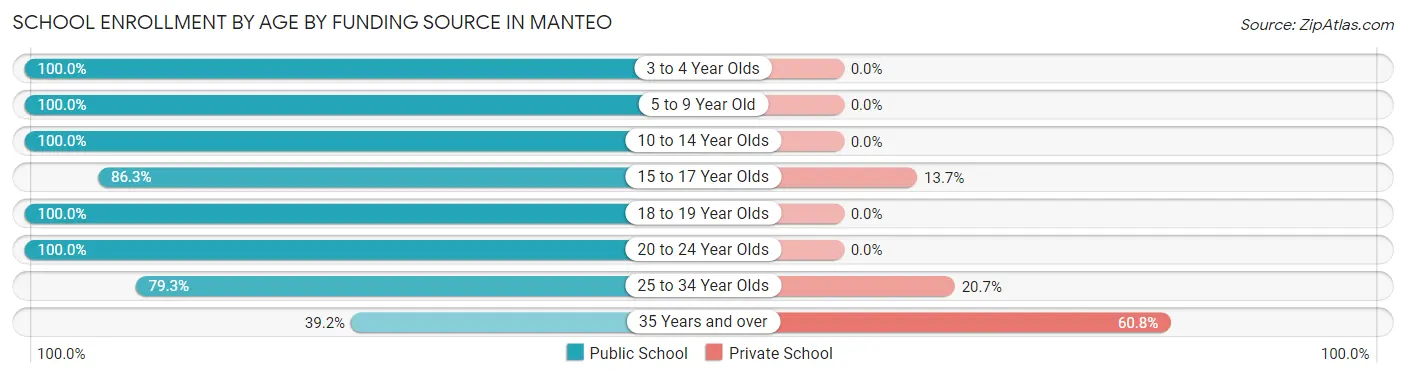
| Age Bracket | Public School | Private School |
| 3 to 4 Year Olds | 3 (100.0%) | 0 (0.0%) |
| 5 to 9 Year Old | 99 (100.0%) | 0 (0.0%) |
| 10 to 14 Year Olds | 100 (100.0%) | 0 (0.0%) |
| 15 to 17 Year Olds | 82 (86.3%) | 13 (13.7%) |
| 18 to 19 Year Olds | 25 (100.0%) | 0 (0.0%) |
| 20 to 24 Year Olds | 7 (100.0%) | 0 (0.0%) |
| 25 to 34 Year Olds | 23 (79.3%) | 6 (20.7%) |
| 35 Years and over | 20 (39.2%) | 31 (60.8%) |
| Total | 359 (87.8%) | 50 (12.2%) |
Educational Attainment by Field of Study in Manteo
Science & technology (127 | 17.0%), business (116 | 15.5%), education (94 | 12.6%), social sciences (77 | 10.3%), and arts & humanities (74 | 9.9%) are the most common fields of study among 748 individuals in Manteo who have obtained a bachelor's degree or higher.
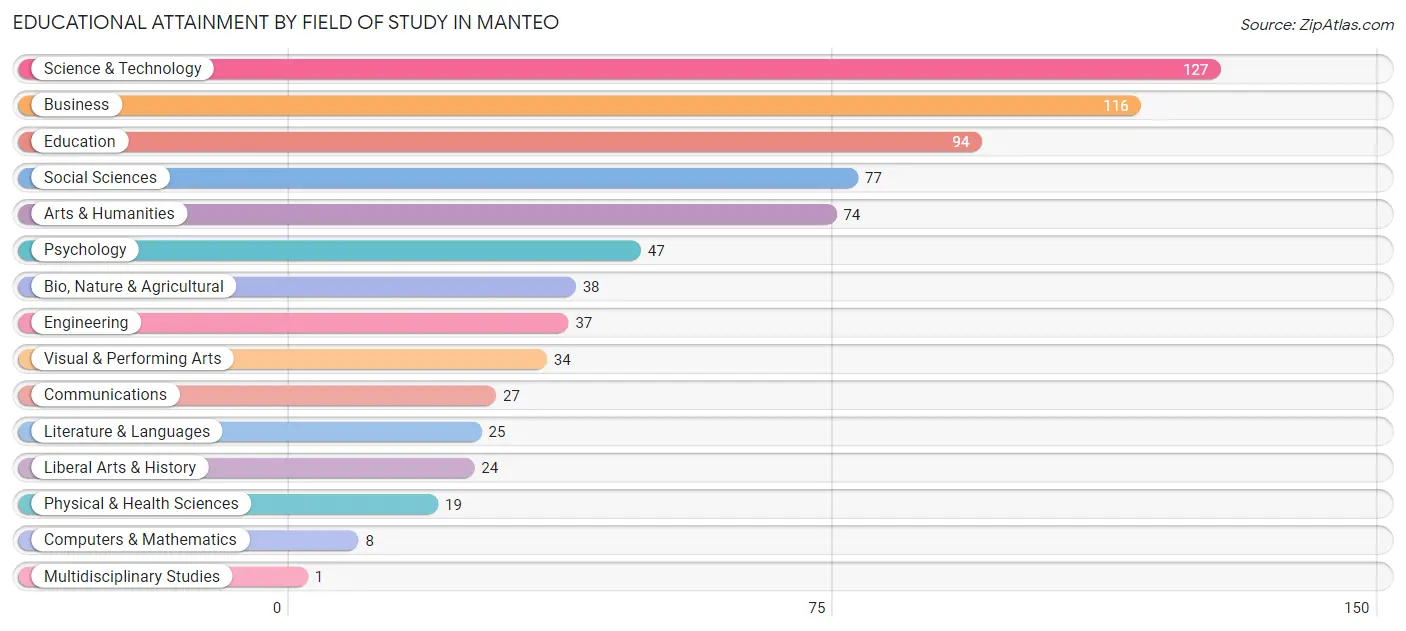
| Field of Study | # Graduates | % Graduates |
| Computers & Mathematics | 8 | 1.1% |
| Bio, Nature & Agricultural | 38 | 5.1% |
| Physical & Health Sciences | 19 | 2.5% |
| Psychology | 47 | 6.3% |
| Social Sciences | 77 | 10.3% |
| Engineering | 37 | 5.0% |
| Multidisciplinary Studies | 1 | 0.1% |
| Science & Technology | 127 | 17.0% |
| Business | 116 | 15.5% |
| Education | 94 | 12.6% |
| Literature & Languages | 25 | 3.3% |
| Liberal Arts & History | 24 | 3.2% |
| Visual & Performing Arts | 34 | 4.5% |
| Communications | 27 | 3.6% |
| Arts & Humanities | 74 | 9.9% |
| Total | 748 | 100.0% |
Transportation & Commute in Manteo
Vehicle Availability by Sex in Manteo
The most prevalent vehicle ownership categories in Manteo are males with 1 vehicle (198, accounting for 43.7%) and females with 1 vehicle (172, making up 51.6%).
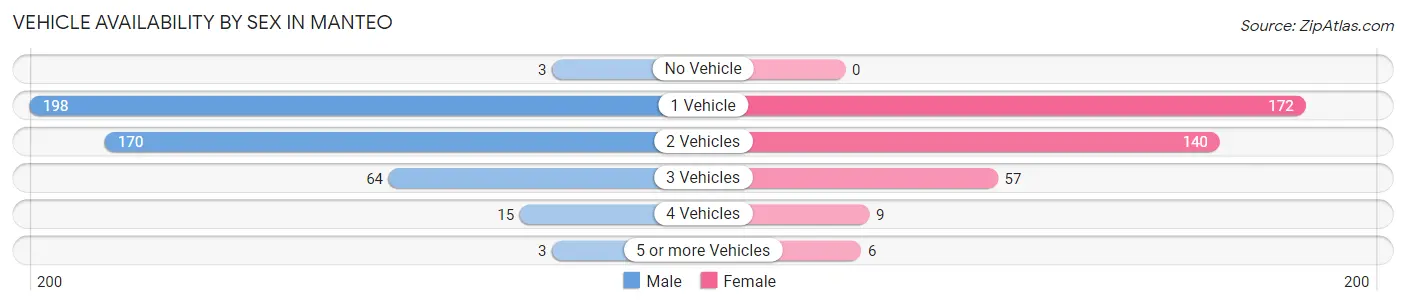
| Vehicles Available | Male | Female |
| No Vehicle | 3 (0.7%) | 0 (0.0%) |
| 1 Vehicle | 198 (43.7%) | 172 (44.8%) |
| 2 Vehicles | 170 (37.5%) | 140 (36.5%) |
| 3 Vehicles | 64 (14.1%) | 57 (14.8%) |
| 4 Vehicles | 15 (3.3%) | 9 (2.3%) |
| 5 or more Vehicles | 3 (0.7%) | 6 (1.6%) |
| Total | 453 (100.0%) | 384 (100.0%) |
Commute Time in Manteo
The most frequently occuring commute durations in Manteo are 5 to 9 minutes (172 commuters, 23.0%), less than 5 minutes (116 commuters, 15.5%), and 30 to 34 minutes (85 commuters, 11.4%).
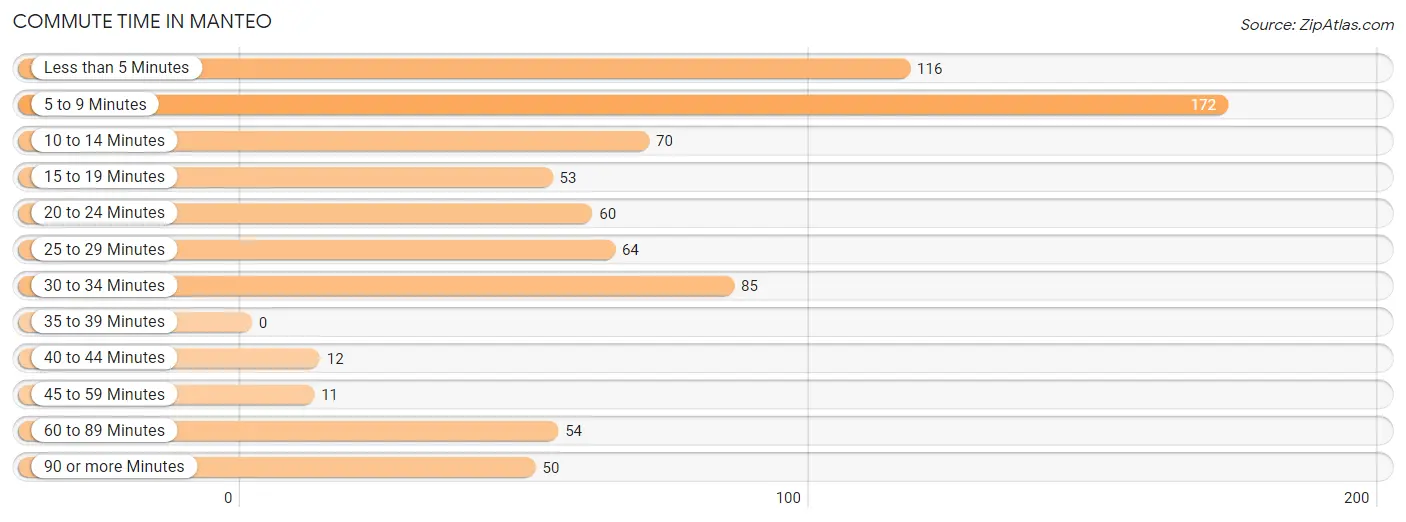
| Commute Time | # Commuters | % Commuters |
| Less than 5 Minutes | 116 | 15.5% |
| 5 to 9 Minutes | 172 | 23.0% |
| 10 to 14 Minutes | 70 | 9.4% |
| 15 to 19 Minutes | 53 | 7.1% |
| 20 to 24 Minutes | 60 | 8.0% |
| 25 to 29 Minutes | 64 | 8.6% |
| 30 to 34 Minutes | 85 | 11.4% |
| 35 to 39 Minutes | 0 | 0.0% |
| 40 to 44 Minutes | 12 | 1.6% |
| 45 to 59 Minutes | 11 | 1.5% |
| 60 to 89 Minutes | 54 | 7.2% |
| 90 or more Minutes | 50 | 6.7% |
Commute Time by Sex in Manteo
The most common commute times in Manteo are 5 to 9 minutes (89 commuters, 22.2%) for males and 5 to 9 minutes (83 commuters, 24.0%) for females.
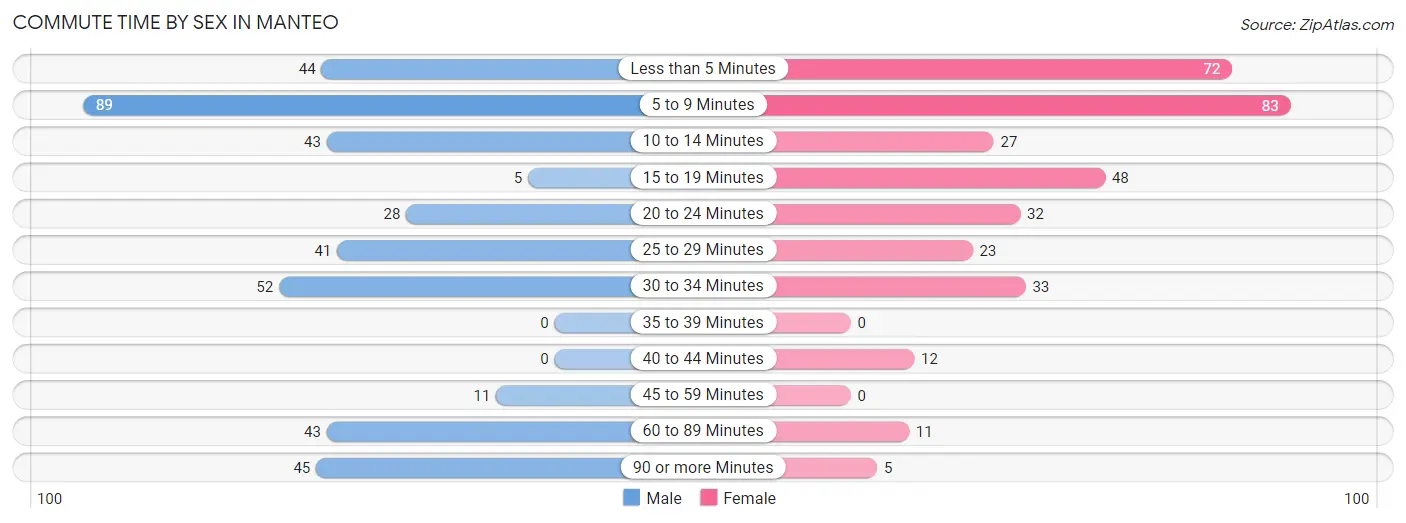
| Commute Time | Male | Female |
| Less than 5 Minutes | 44 (11.0%) | 72 (20.8%) |
| 5 to 9 Minutes | 89 (22.2%) | 83 (24.0%) |
| 10 to 14 Minutes | 43 (10.7%) | 27 (7.8%) |
| 15 to 19 Minutes | 5 (1.3%) | 48 (13.9%) |
| 20 to 24 Minutes | 28 (7.0%) | 32 (9.2%) |
| 25 to 29 Minutes | 41 (10.2%) | 23 (6.7%) |
| 30 to 34 Minutes | 52 (13.0%) | 33 (9.5%) |
| 35 to 39 Minutes | 0 (0.0%) | 0 (0.0%) |
| 40 to 44 Minutes | 0 (0.0%) | 12 (3.5%) |
| 45 to 59 Minutes | 11 (2.7%) | 0 (0.0%) |
| 60 to 89 Minutes | 43 (10.7%) | 11 (3.2%) |
| 90 or more Minutes | 45 (11.2%) | 5 (1.5%) |
Time of Departure to Work by Sex in Manteo
The most frequent times of departure to work in Manteo are 12:00 AM to 4:59 AM (74, 18.4%) for males and 8:00 AM to 8:29 AM (129, 37.3%) for females.
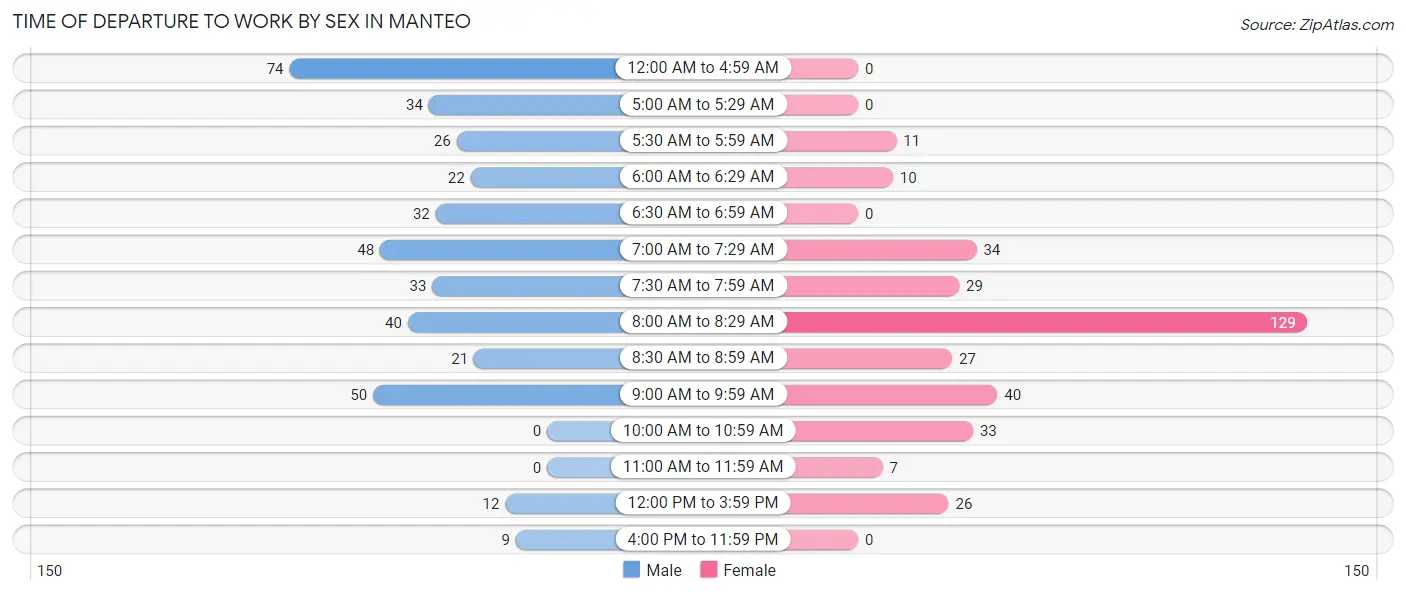
| Time of Departure | Male | Female |
| 12:00 AM to 4:59 AM | 74 (18.4%) | 0 (0.0%) |
| 5:00 AM to 5:29 AM | 34 (8.5%) | 0 (0.0%) |
| 5:30 AM to 5:59 AM | 26 (6.5%) | 11 (3.2%) |
| 6:00 AM to 6:29 AM | 22 (5.5%) | 10 (2.9%) |
| 6:30 AM to 6:59 AM | 32 (8.0%) | 0 (0.0%) |
| 7:00 AM to 7:29 AM | 48 (12.0%) | 34 (9.8%) |
| 7:30 AM to 7:59 AM | 33 (8.2%) | 29 (8.4%) |
| 8:00 AM to 8:29 AM | 40 (10.0%) | 129 (37.3%) |
| 8:30 AM to 8:59 AM | 21 (5.2%) | 27 (7.8%) |
| 9:00 AM to 9:59 AM | 50 (12.5%) | 40 (11.6%) |
| 10:00 AM to 10:59 AM | 0 (0.0%) | 33 (9.5%) |
| 11:00 AM to 11:59 AM | 0 (0.0%) | 7 (2.0%) |
| 12:00 PM to 3:59 PM | 12 (3.0%) | 26 (7.5%) |
| 4:00 PM to 11:59 PM | 9 (2.2%) | 0 (0.0%) |
| Total | 401 (100.0%) | 346 (100.0%) |
Housing Occupancy in Manteo
Occupancy by Ownership in Manteo
Of the total 889 dwellings in Manteo, owner-occupied units account for 585 (65.8%), while renter-occupied units make up 304 (34.2%).
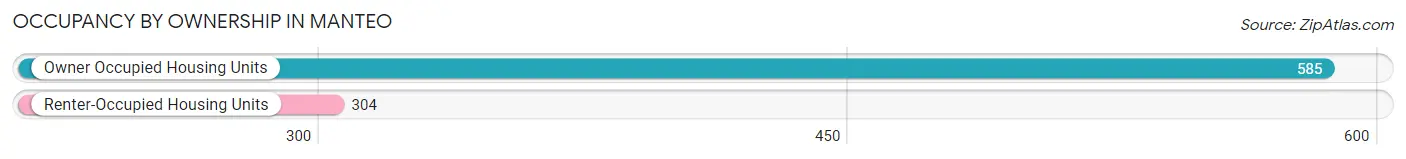
| Occupancy | # Housing Units | % Housing Units |
| Owner Occupied Housing Units | 585 | 65.8% |
| Renter-Occupied Housing Units | 304 | 34.2% |
| Total Occupied Housing Units | 889 | 100.0% |
Occupancy by Household Size in Manteo
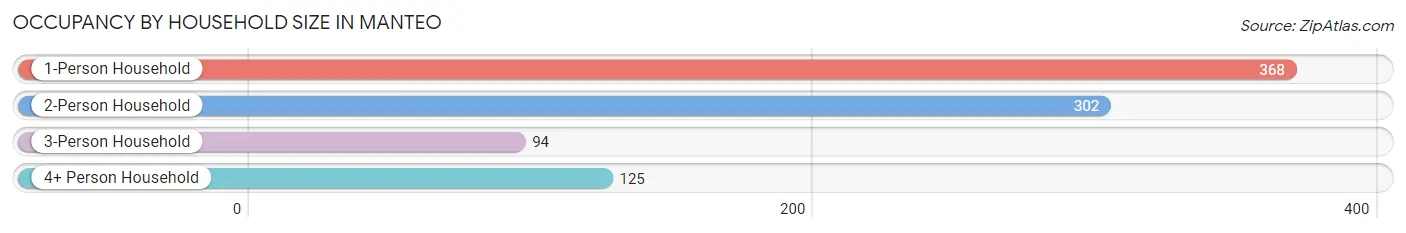
| Household Size | # Housing Units | % Housing Units |
| 1-Person Household | 368 | 41.4% |
| 2-Person Household | 302 | 34.0% |
| 3-Person Household | 94 | 10.6% |
| 4+ Person Household | 125 | 14.1% |
| Total Housing Units | 889 | 100.0% |
Occupancy by Ownership by Household Size in Manteo
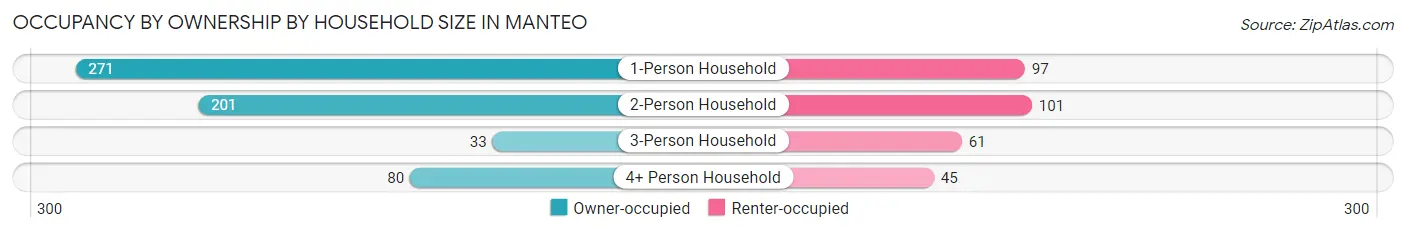
| Household Size | Owner-occupied | Renter-occupied |
| 1-Person Household | 271 (73.6%) | 97 (26.4%) |
| 2-Person Household | 201 (66.6%) | 101 (33.4%) |
| 3-Person Household | 33 (35.1%) | 61 (64.9%) |
| 4+ Person Household | 80 (64.0%) | 45 (36.0%) |
| Total Housing Units | 585 (65.8%) | 304 (34.2%) |
Occupancy by Educational Attainment in Manteo
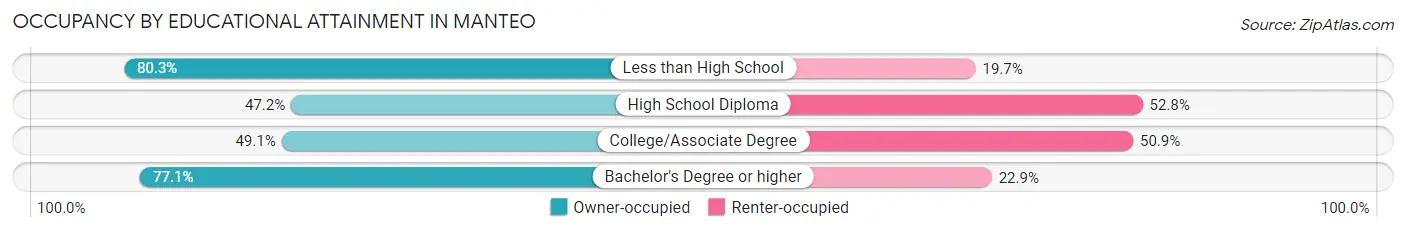
| Household Size | Owner-occupied | Renter-occupied |
| Less than High School | 53 (80.3%) | 13 (19.7%) |
| High School Diploma | 67 (47.2%) | 75 (52.8%) |
| College/Associate Degree | 105 (49.1%) | 109 (50.9%) |
| Bachelor's Degree or higher | 360 (77.1%) | 107 (22.9%) |
Occupancy by Age of Householder in Manteo
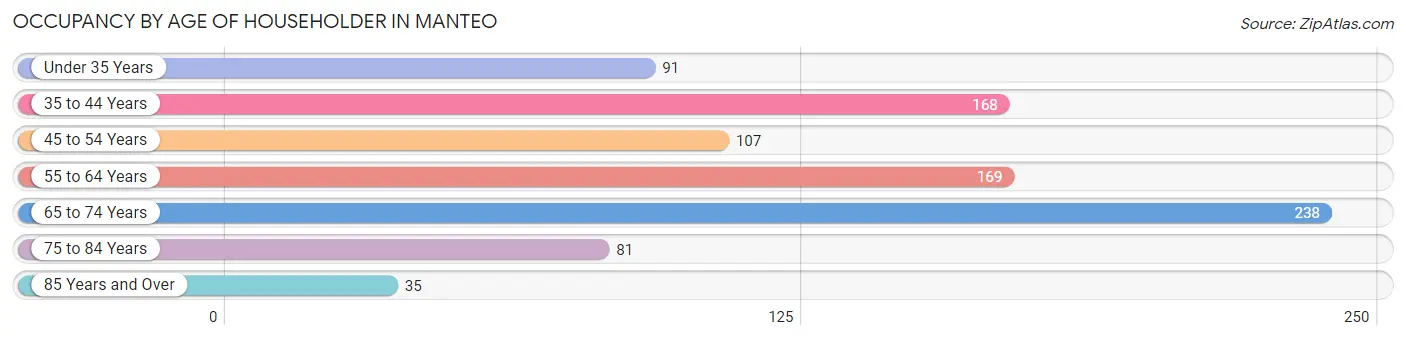
| Age Bracket | # Households | % Households |
| Under 35 Years | 91 | 10.2% |
| 35 to 44 Years | 168 | 18.9% |
| 45 to 54 Years | 107 | 12.0% |
| 55 to 64 Years | 169 | 19.0% |
| 65 to 74 Years | 238 | 26.8% |
| 75 to 84 Years | 81 | 9.1% |
| 85 Years and Over | 35 | 3.9% |
| Total | 889 | 100.0% |
Housing Finances in Manteo
Median Income by Occupancy in Manteo
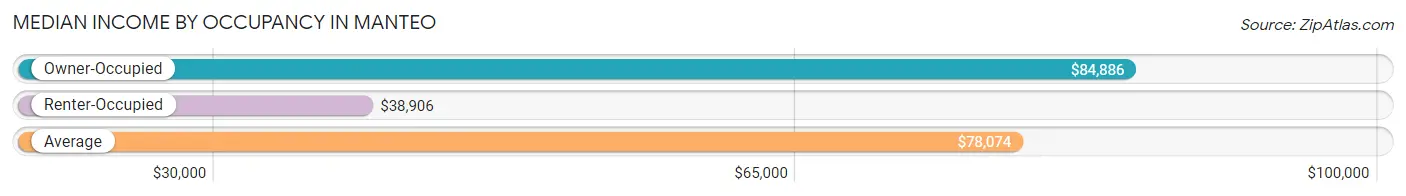
| Occupancy Type | # Households | Median Income |
| Owner-Occupied | 585 (65.8%) | $84,886 |
| Renter-Occupied | 304 (34.2%) | $38,906 |
| Average | 889 (100.0%) | $78,074 |
Occupancy by Householder Income Bracket in Manteo
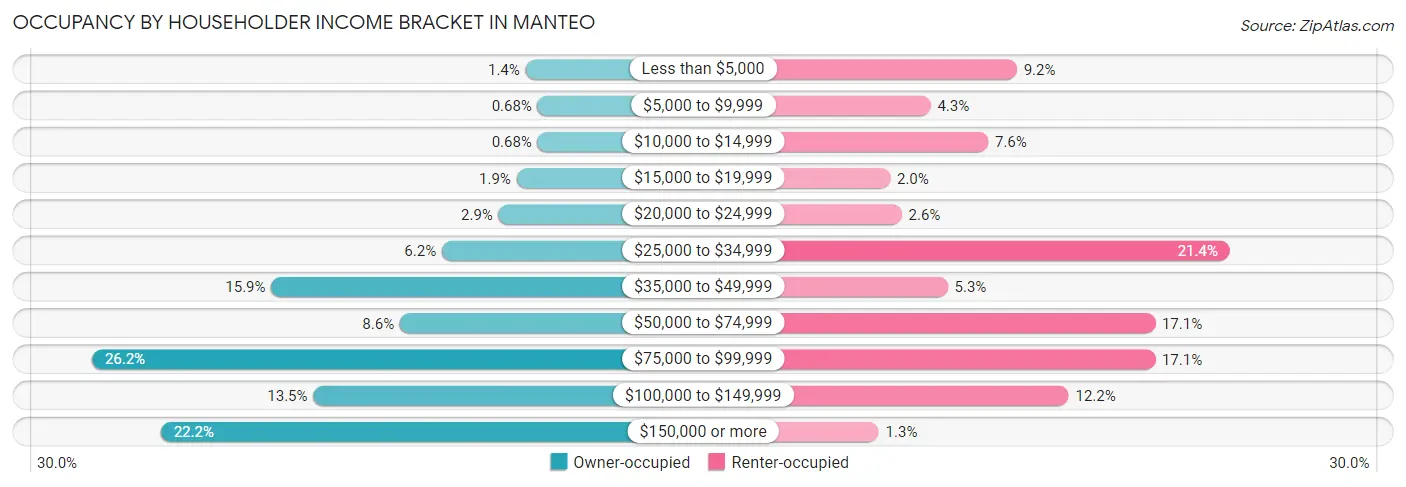
| Income Bracket | Owner-occupied | Renter-occupied |
| Less than $5,000 | 8 (1.4%) | 28 (9.2%) |
| $5,000 to $9,999 | 4 (0.7%) | 13 (4.3%) |
| $10,000 to $14,999 | 4 (0.7%) | 23 (7.6%) |
| $15,000 to $19,999 | 11 (1.9%) | 6 (2.0%) |
| $20,000 to $24,999 | 17 (2.9%) | 8 (2.6%) |
| $25,000 to $34,999 | 36 (6.1%) | 65 (21.4%) |
| $35,000 to $49,999 | 93 (15.9%) | 16 (5.3%) |
| $50,000 to $74,999 | 50 (8.6%) | 52 (17.1%) |
| $75,000 to $99,999 | 153 (26.2%) | 52 (17.1%) |
| $100,000 to $149,999 | 79 (13.5%) | 37 (12.2%) |
| $150,000 or more | 130 (22.2%) | 4 (1.3%) |
| Total | 585 (100.0%) | 304 (100.0%) |
Monthly Housing Cost Tiers in Manteo
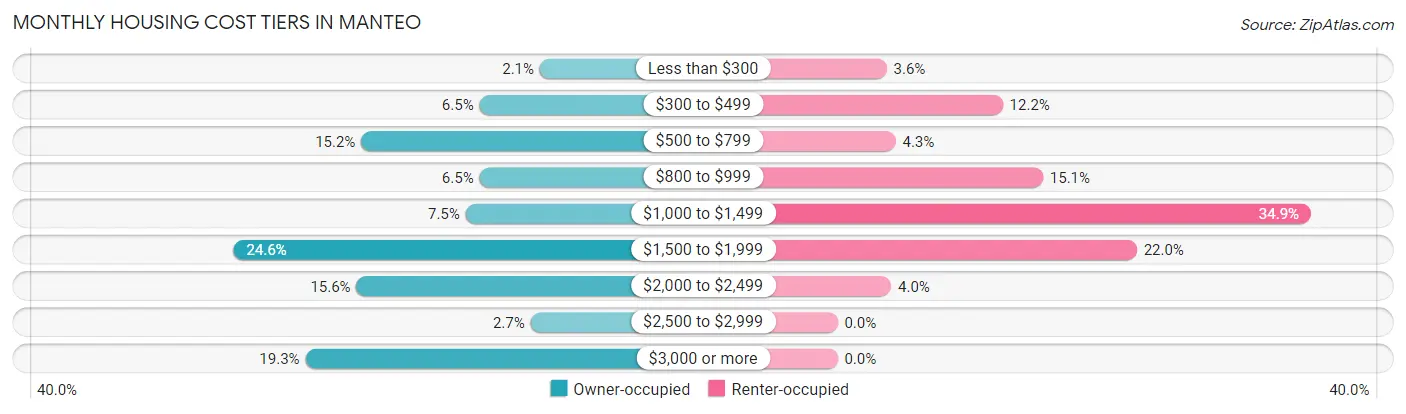
| Monthly Cost | Owner-occupied | Renter-occupied |
| Less than $300 | 12 (2.1%) | 11 (3.6%) |
| $300 to $499 | 38 (6.5%) | 37 (12.2%) |
| $500 to $799 | 89 (15.2%) | 13 (4.3%) |
| $800 to $999 | 38 (6.5%) | 46 (15.1%) |
| $1,000 to $1,499 | 44 (7.5%) | 106 (34.9%) |
| $1,500 to $1,999 | 144 (24.6%) | 67 (22.0%) |
| $2,000 to $2,499 | 91 (15.6%) | 12 (4.0%) |
| $2,500 to $2,999 | 16 (2.7%) | 0 (0.0%) |
| $3,000 or more | 113 (19.3%) | 0 (0.0%) |
| Total | 585 (100.0%) | 304 (100.0%) |
Physical Housing Characteristics in Manteo
Housing Structures in Manteo
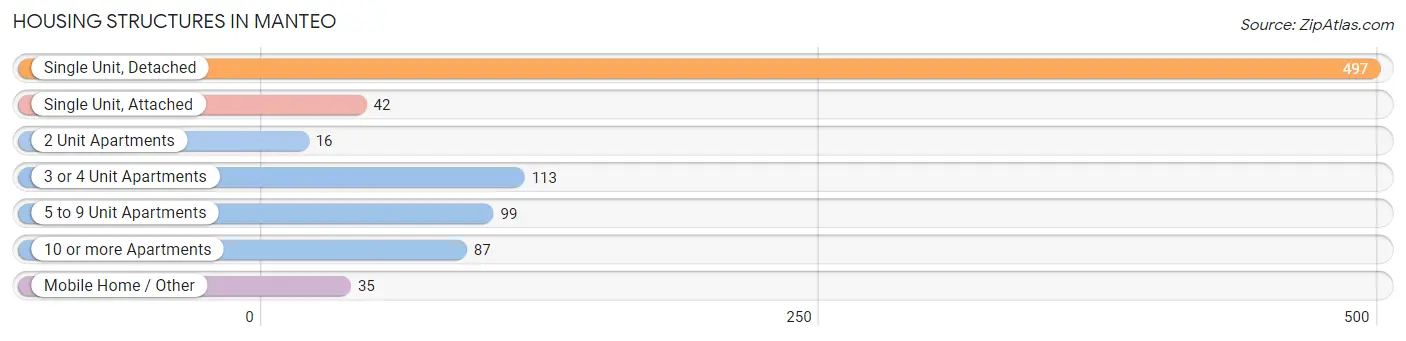
| Structure Type | # Housing Units | % Housing Units |
| Single Unit, Detached | 497 | 55.9% |
| Single Unit, Attached | 42 | 4.7% |
| 2 Unit Apartments | 16 | 1.8% |
| 3 or 4 Unit Apartments | 113 | 12.7% |
| 5 to 9 Unit Apartments | 99 | 11.1% |
| 10 or more Apartments | 87 | 9.8% |
| Mobile Home / Other | 35 | 3.9% |
| Total | 889 | 100.0% |
Housing Structures by Occupancy in Manteo
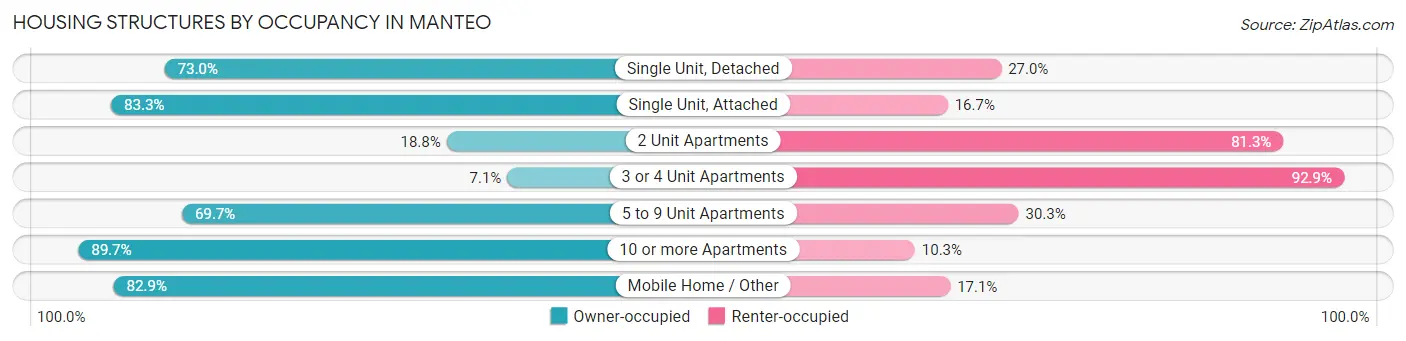
| Structure Type | Owner-occupied | Renter-occupied |
| Single Unit, Detached | 363 (73.0%) | 134 (27.0%) |
| Single Unit, Attached | 35 (83.3%) | 7 (16.7%) |
| 2 Unit Apartments | 3 (18.8%) | 13 (81.2%) |
| 3 or 4 Unit Apartments | 8 (7.1%) | 105 (92.9%) |
| 5 to 9 Unit Apartments | 69 (69.7%) | 30 (30.3%) |
| 10 or more Apartments | 78 (89.7%) | 9 (10.3%) |
| Mobile Home / Other | 29 (82.9%) | 6 (17.1%) |
| Total | 585 (65.8%) | 304 (34.2%) |
Housing Structures by Number of Rooms in Manteo
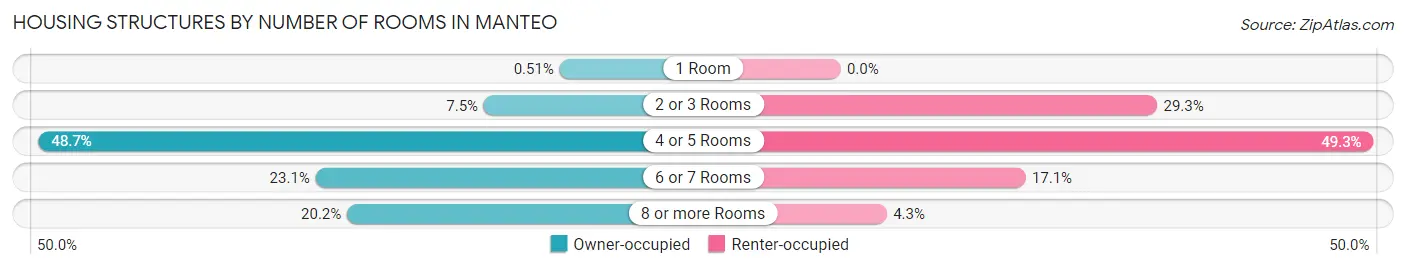
| Number of Rooms | Owner-occupied | Renter-occupied |
| 1 Room | 3 (0.5%) | 0 (0.0%) |
| 2 or 3 Rooms | 44 (7.5%) | 89 (29.3%) |
| 4 or 5 Rooms | 285 (48.7%) | 150 (49.3%) |
| 6 or 7 Rooms | 135 (23.1%) | 52 (17.1%) |
| 8 or more Rooms | 118 (20.2%) | 13 (4.3%) |
| Total | 585 (100.0%) | 304 (100.0%) |
Housing Structure by Heating Type in Manteo
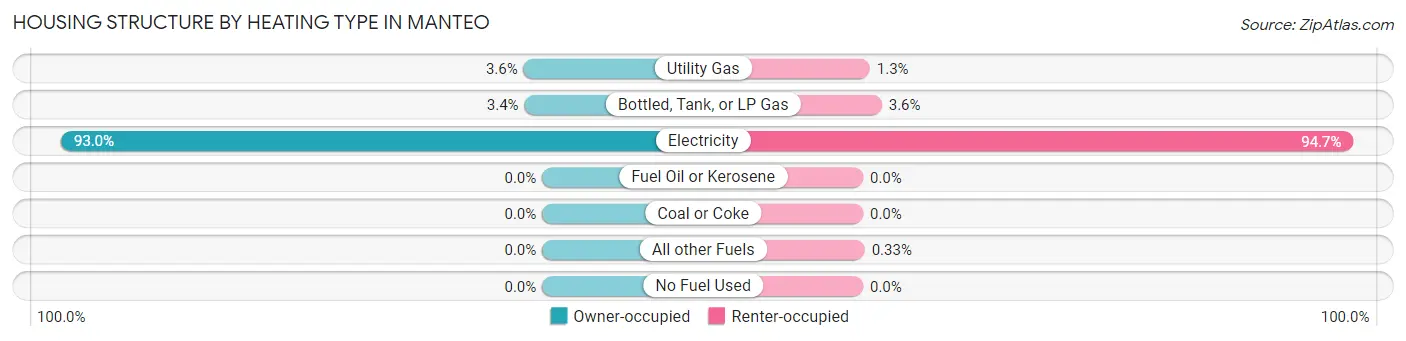
| Heating Type | Owner-occupied | Renter-occupied |
| Utility Gas | 21 (3.6%) | 4 (1.3%) |
| Bottled, Tank, or LP Gas | 20 (3.4%) | 11 (3.6%) |
| Electricity | 544 (93.0%) | 288 (94.7%) |
| Fuel Oil or Kerosene | 0 (0.0%) | 0 (0.0%) |
| Coal or Coke | 0 (0.0%) | 0 (0.0%) |
| All other Fuels | 0 (0.0%) | 1 (0.3%) |
| No Fuel Used | 0 (0.0%) | 0 (0.0%) |
| Total | 585 (100.0%) | 304 (100.0%) |
Household Vehicle Usage in Manteo
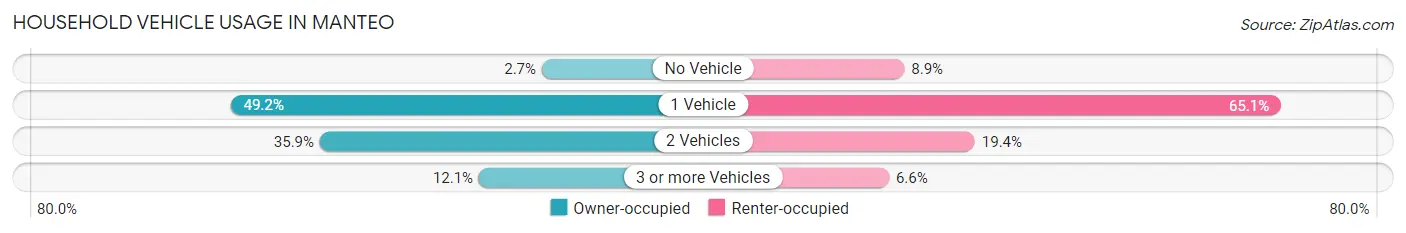
| Vehicles per Household | Owner-occupied | Renter-occupied |
| No Vehicle | 16 (2.7%) | 27 (8.9%) |
| 1 Vehicle | 288 (49.2%) | 198 (65.1%) |
| 2 Vehicles | 210 (35.9%) | 59 (19.4%) |
| 3 or more Vehicles | 71 (12.1%) | 20 (6.6%) |
| Total | 585 (100.0%) | 304 (100.0%) |
Real Estate & Mortgages in Manteo
Real Estate and Mortgage Overview in Manteo
| Characteristic | Without Mortgage | With Mortgage |
| Housing Units | 197 | 388 |
| Median Property Value | $312,000 | $428,800 |
| Median Household Income | $57,153 | $91 |
| Monthly Housing Costs | $625 | $113 |
| Real Estate Taxes | $1,724 | $6 |
Property Value by Mortgage Status in Manteo
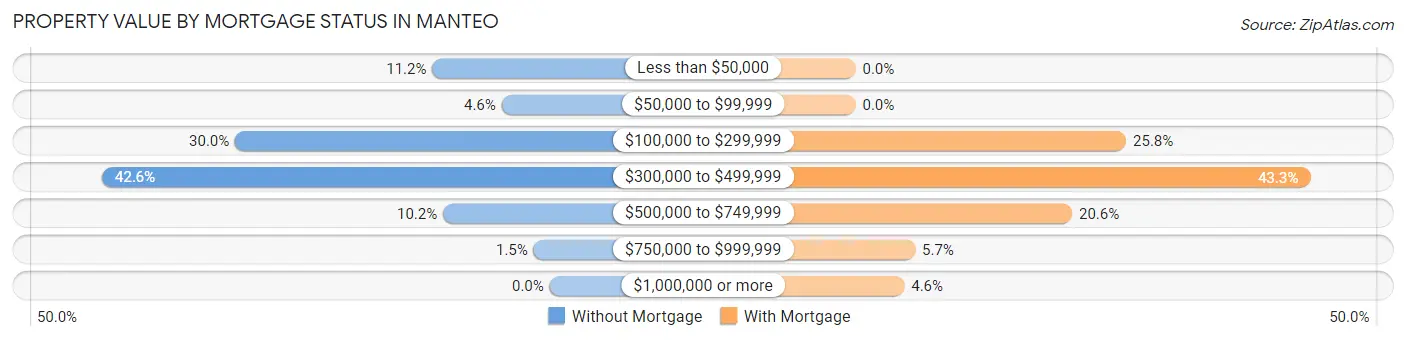
| Property Value | Without Mortgage | With Mortgage |
| Less than $50,000 | 22 (11.2%) | 0 (0.0%) |
| $50,000 to $99,999 | 9 (4.6%) | 0 (0.0%) |
| $100,000 to $299,999 | 59 (29.9%) | 100 (25.8%) |
| $300,000 to $499,999 | 84 (42.6%) | 168 (43.3%) |
| $500,000 to $749,999 | 20 (10.2%) | 80 (20.6%) |
| $750,000 to $999,999 | 3 (1.5%) | 22 (5.7%) |
| $1,000,000 or more | 0 (0.0%) | 18 (4.6%) |
| Total | 197 (100.0%) | 388 (100.0%) |
Household Income by Mortgage Status in Manteo
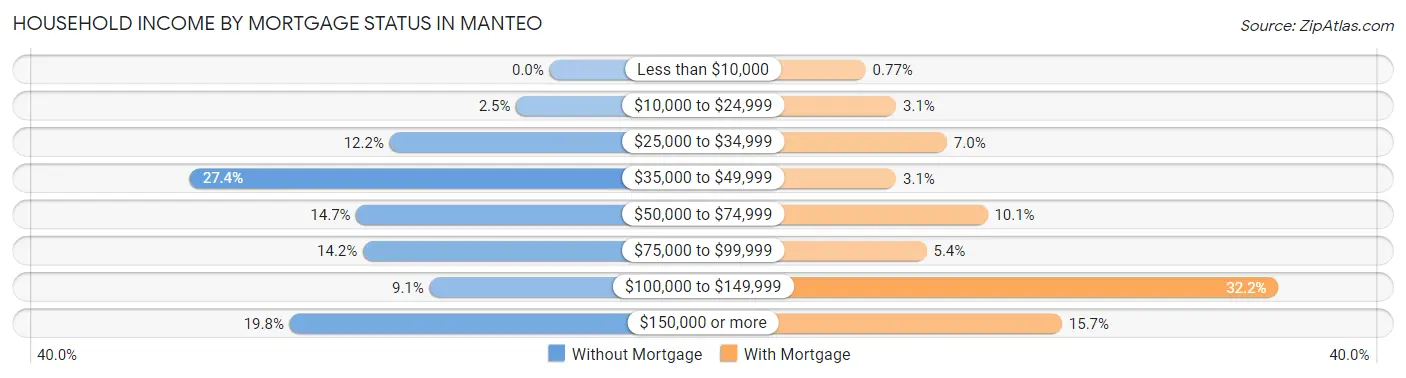
| Household Income | Without Mortgage | With Mortgage |
| Less than $10,000 | 0 (0.0%) | 3 (0.8%) |
| $10,000 to $24,999 | 5 (2.5%) | 12 (3.1%) |
| $25,000 to $34,999 | 24 (12.2%) | 27 (7.0%) |
| $35,000 to $49,999 | 54 (27.4%) | 12 (3.1%) |
| $50,000 to $74,999 | 29 (14.7%) | 39 (10.1%) |
| $75,000 to $99,999 | 28 (14.2%) | 21 (5.4%) |
| $100,000 to $149,999 | 18 (9.1%) | 125 (32.2%) |
| $150,000 or more | 39 (19.8%) | 61 (15.7%) |
| Total | 197 (100.0%) | 388 (100.0%) |
Property Value to Household Income Ratio in Manteo
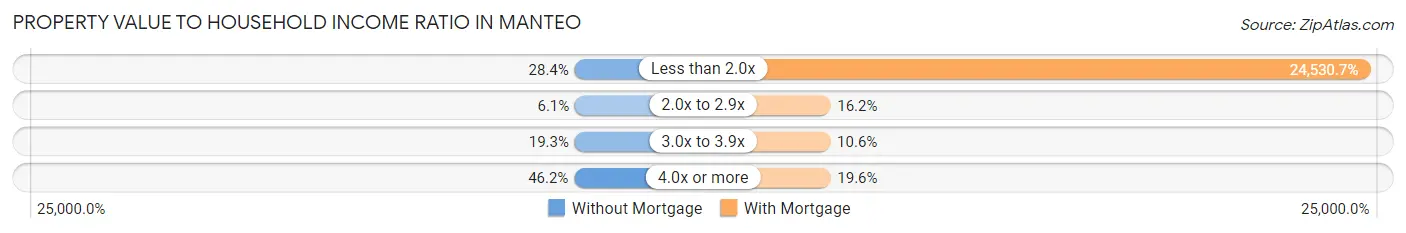
| Value-to-Income Ratio | Without Mortgage | With Mortgage |
| Less than 2.0x | 56 (28.4%) | 95,179 (24,530.7%) |
| 2.0x to 2.9x | 12 (6.1%) | 63 (16.2%) |
| 3.0x to 3.9x | 38 (19.3%) | 41 (10.6%) |
| 4.0x or more | 91 (46.2%) | 76 (19.6%) |
| Total | 197 (100.0%) | 388 (100.0%) |
Real Estate Taxes by Mortgage Status in Manteo
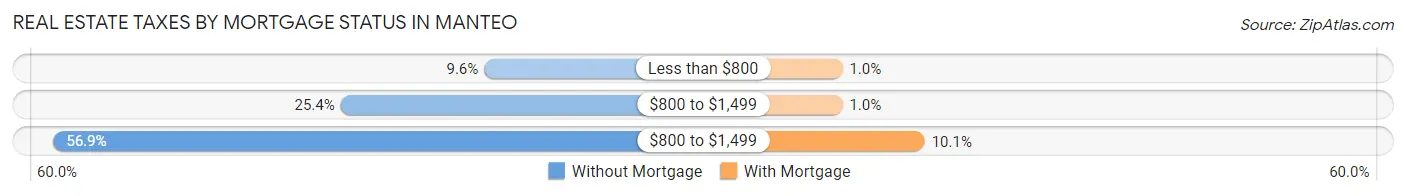
| Property Taxes | Without Mortgage | With Mortgage |
| Less than $800 | 19 (9.6%) | 4 (1.0%) |
| $800 to $1,499 | 50 (25.4%) | 4 (1.0%) |
| $800 to $1,499 | 112 (56.9%) | 39 (10.1%) |
| Total | 197 (100.0%) | 388 (100.0%) |
Health & Disability in Manteo
Health Insurance Coverage by Age in Manteo
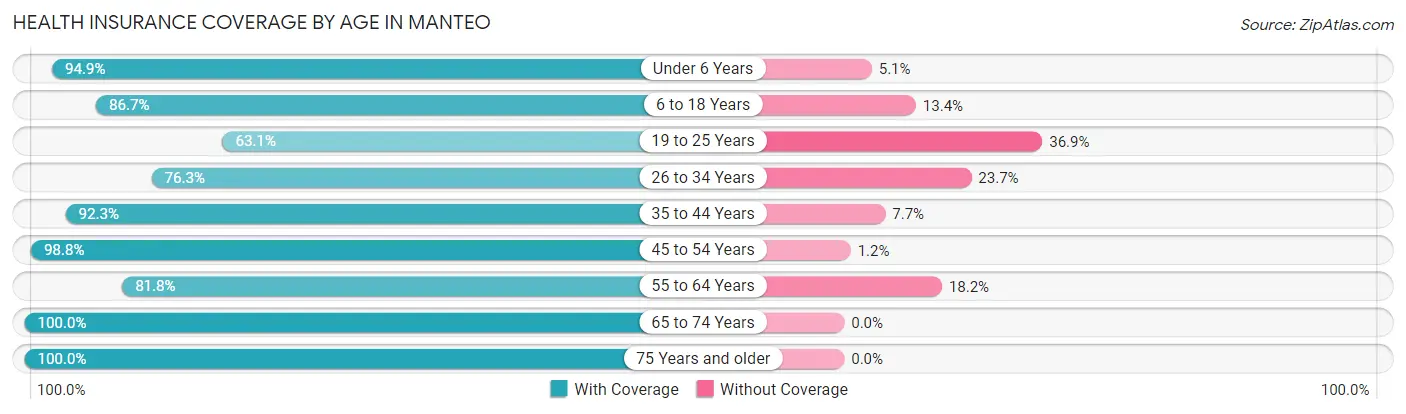
| Age Bracket | With Coverage | Without Coverage |
| Under 6 Years | 37 (94.9%) | 2 (5.1%) |
| 6 to 18 Years | 305 (86.7%) | 47 (13.4%) |
| 19 to 25 Years | 41 (63.1%) | 24 (36.9%) |
| 26 to 34 Years | 132 (76.3%) | 41 (23.7%) |
| 35 to 44 Years | 217 (92.3%) | 18 (7.7%) |
| 45 to 54 Years | 165 (98.8%) | 2 (1.2%) |
| 55 to 64 Years | 229 (81.8%) | 51 (18.2%) |
| 65 to 74 Years | 321 (100.0%) | 0 (0.0%) |
| 75 Years and older | 174 (100.0%) | 0 (0.0%) |
| Total | 1,621 (89.8%) | 185 (10.2%) |
Health Insurance Coverage by Citizenship Status in Manteo
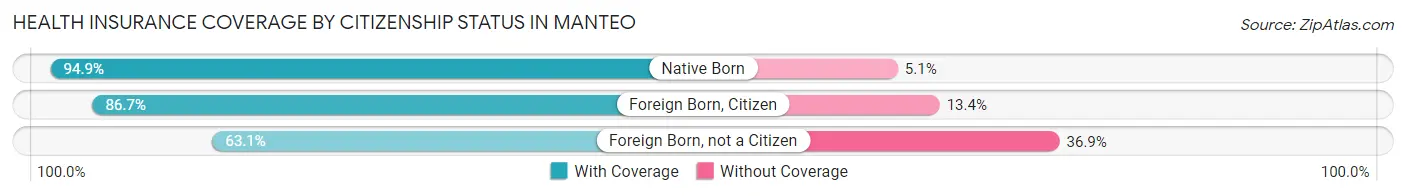
| Citizenship Status | With Coverage | Without Coverage |
| Native Born | 37 (94.9%) | 2 (5.1%) |
| Foreign Born, Citizen | 305 (86.7%) | 47 (13.4%) |
| Foreign Born, not a Citizen | 41 (63.1%) | 24 (36.9%) |
Health Insurance Coverage by Household Income in Manteo
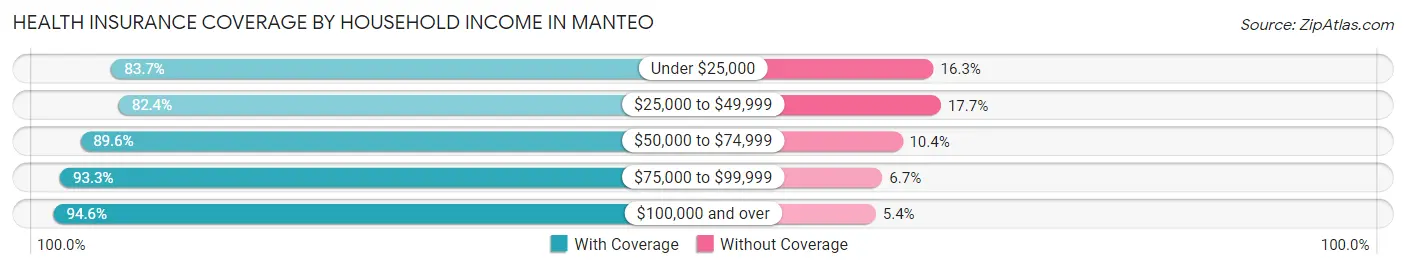
| Household Income | With Coverage | Without Coverage |
| Under $25,000 | 175 (83.7%) | 34 (16.3%) |
| $25,000 to $49,999 | 322 (82.4%) | 69 (17.6%) |
| $50,000 to $74,999 | 189 (89.6%) | 22 (10.4%) |
| $75,000 to $99,999 | 448 (93.3%) | 32 (6.7%) |
| $100,000 and over | 487 (94.6%) | 28 (5.4%) |
Public vs Private Health Insurance Coverage by Age in Manteo
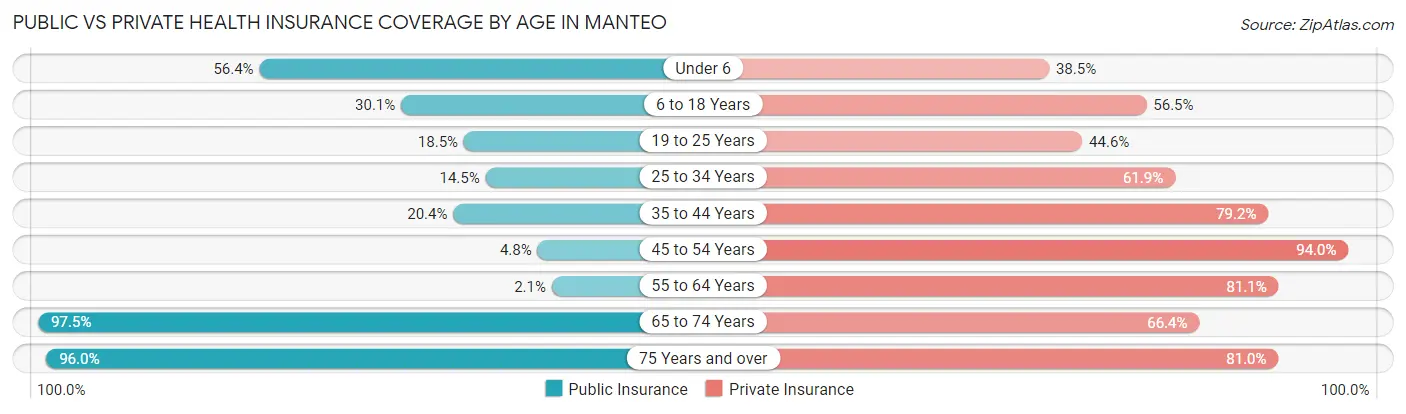
| Age Bracket | Public Insurance | Private Insurance |
| Under 6 | 22 (56.4%) | 15 (38.5%) |
| 6 to 18 Years | 106 (30.1%) | 199 (56.5%) |
| 19 to 25 Years | 12 (18.5%) | 29 (44.6%) |
| 25 to 34 Years | 25 (14.4%) | 107 (61.9%) |
| 35 to 44 Years | 48 (20.4%) | 186 (79.1%) |
| 45 to 54 Years | 8 (4.8%) | 157 (94.0%) |
| 55 to 64 Years | 6 (2.1%) | 227 (81.1%) |
| 65 to 74 Years | 313 (97.5%) | 213 (66.4%) |
| 75 Years and over | 167 (96.0%) | 141 (81.0%) |
| Total | 707 (39.2%) | 1,274 (70.5%) |
Disability Status by Sex by Age in Manteo
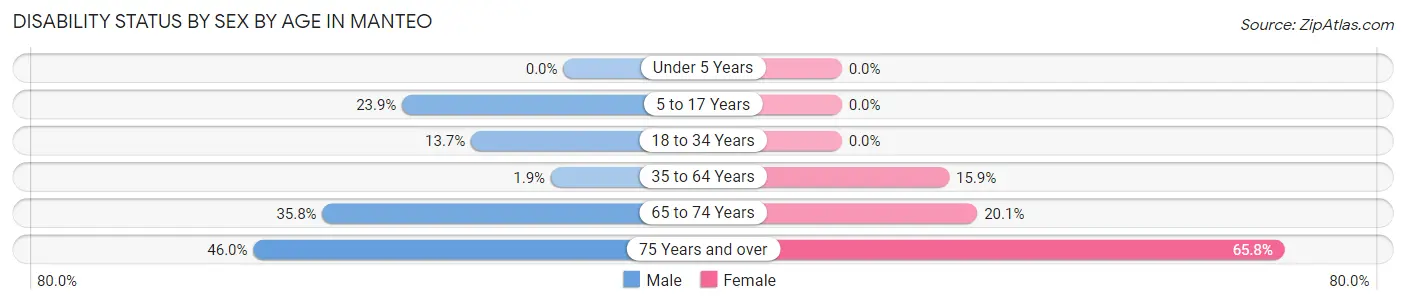
| Age Bracket | Male | Female |
| Under 5 Years | 0 (0.0%) | 0 (0.0%) |
| 5 to 17 Years | 39 (23.9%) | 0 (0.0%) |
| 18 to 34 Years | 20 (13.7%) | 0 (0.0%) |
| 35 to 64 Years | 6 (1.8%) | 57 (15.9%) |
| 65 to 74 Years | 49 (35.8%) | 37 (20.1%) |
| 75 Years and over | 29 (46.0%) | 73 (65.8%) |
Disability Class by Sex by Age in Manteo
Disability Class: Hearing Difficulty
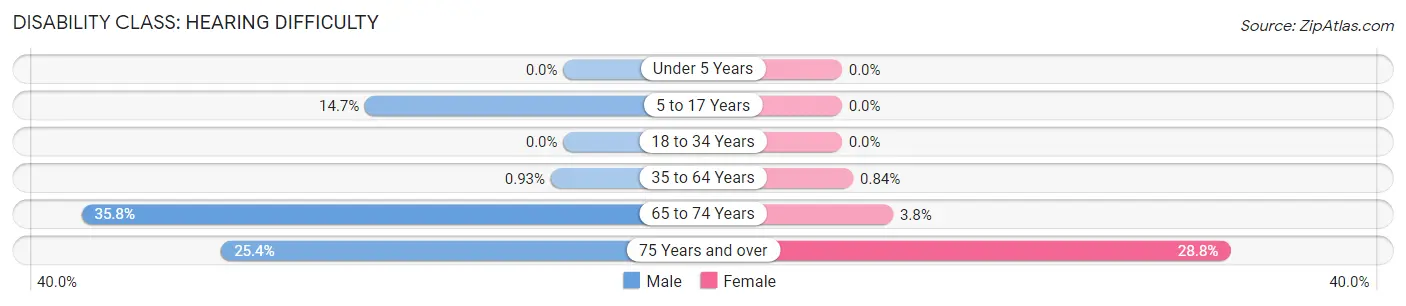
| Age Bracket | Male | Female |
| Under 5 Years | 0 (0.0%) | 0 (0.0%) |
| 5 to 17 Years | 24 (14.7%) | 0 (0.0%) |
| 18 to 34 Years | 0 (0.0%) | 0 (0.0%) |
| 35 to 64 Years | 3 (0.9%) | 3 (0.8%) |
| 65 to 74 Years | 49 (35.8%) | 7 (3.8%) |
| 75 Years and over | 16 (25.4%) | 32 (28.8%) |
Disability Class: Vision Difficulty
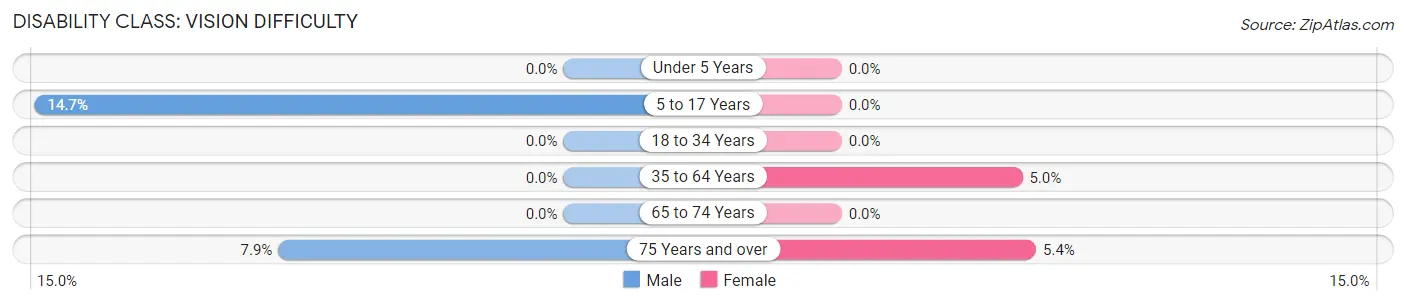
| Age Bracket | Male | Female |
| Under 5 Years | 0 (0.0%) | 0 (0.0%) |
| 5 to 17 Years | 24 (14.7%) | 0 (0.0%) |
| 18 to 34 Years | 0 (0.0%) | 0 (0.0%) |
| 35 to 64 Years | 0 (0.0%) | 18 (5.0%) |
| 65 to 74 Years | 0 (0.0%) | 0 (0.0%) |
| 75 Years and over | 5 (7.9%) | 6 (5.4%) |
Disability Class: Cognitive Difficulty
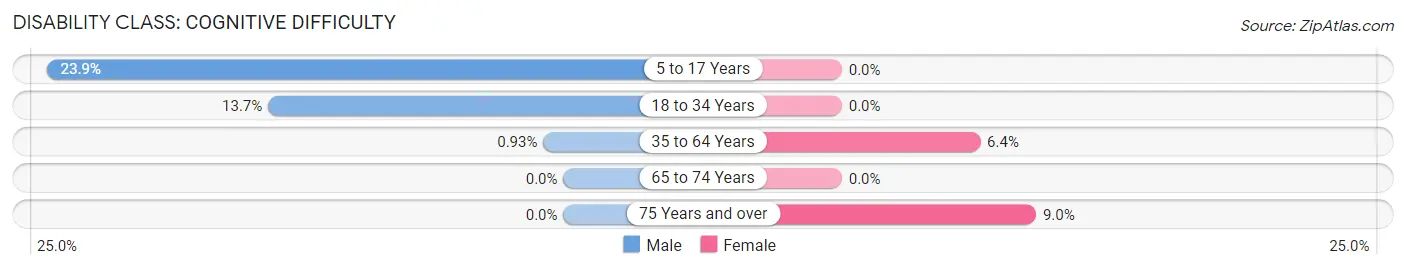
| Age Bracket | Male | Female |
| 5 to 17 Years | 39 (23.9%) | 0 (0.0%) |
| 18 to 34 Years | 20 (13.7%) | 0 (0.0%) |
| 35 to 64 Years | 3 (0.9%) | 23 (6.4%) |
| 65 to 74 Years | 0 (0.0%) | 0 (0.0%) |
| 75 Years and over | 0 (0.0%) | 10 (9.0%) |
Disability Class: Ambulatory Difficulty
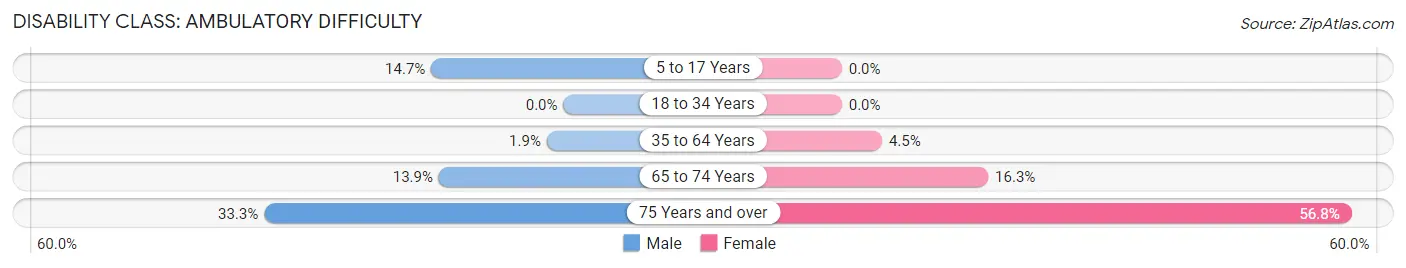
| Age Bracket | Male | Female |
| 5 to 17 Years | 24 (14.7%) | 0 (0.0%) |
| 18 to 34 Years | 0 (0.0%) | 0 (0.0%) |
| 35 to 64 Years | 6 (1.8%) | 16 (4.5%) |
| 65 to 74 Years | 19 (13.9%) | 30 (16.3%) |
| 75 Years and over | 21 (33.3%) | 63 (56.8%) |
Disability Class: Self-Care Difficulty
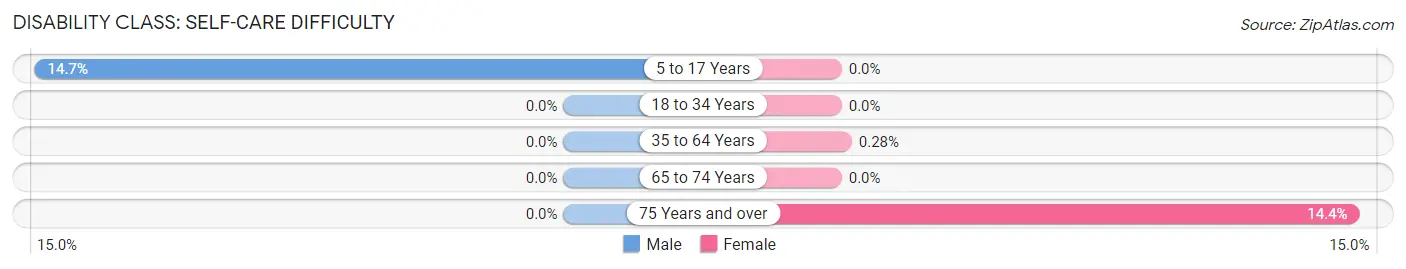
| Age Bracket | Male | Female |
| 5 to 17 Years | 24 (14.7%) | 0 (0.0%) |
| 18 to 34 Years | 0 (0.0%) | 0 (0.0%) |
| 35 to 64 Years | 0 (0.0%) | 1 (0.3%) |
| 65 to 74 Years | 0 (0.0%) | 0 (0.0%) |
| 75 Years and over | 0 (0.0%) | 16 (14.4%) |
Technology Access in Manteo
Computing Device Access in Manteo
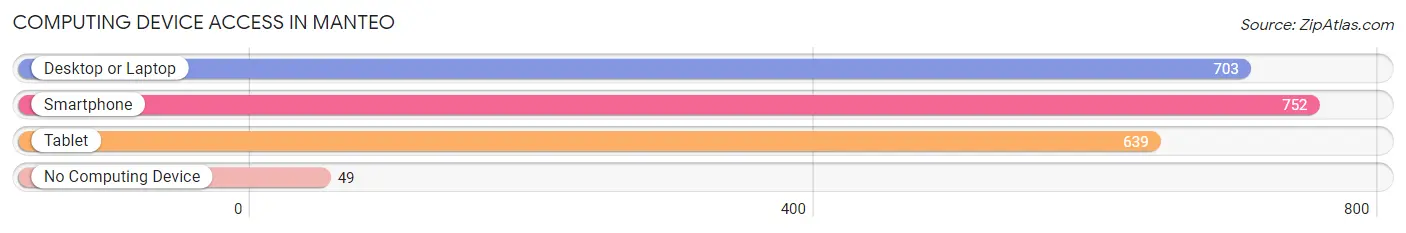
| Device Type | # Households | % Households |
| Desktop or Laptop | 703 | 79.1% |
| Smartphone | 752 | 84.6% |
| Tablet | 639 | 71.9% |
| No Computing Device | 49 | 5.5% |
| Total | 889 | 100.0% |
Internet Access in Manteo
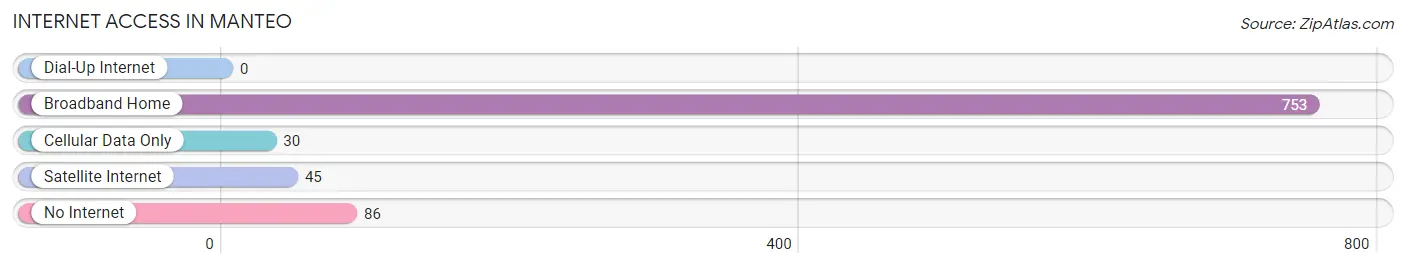
| Internet Type | # Households | % Households |
| Dial-Up Internet | 0 | 0.0% |
| Broadband Home | 753 | 84.7% |
| Cellular Data Only | 30 | 3.4% |
| Satellite Internet | 45 | 5.1% |
| No Internet | 86 | 9.7% |
| Total | 889 | 100.0% |
Manteo Summary
Manteo is a small town located on Roanoke Island in Dare County, North Carolina. It is the county seat of Dare County and is part of the Outer Banks region of North Carolina. The town has a population of 1,434 as of the 2010 census.
Geography
Manteo is located on the northern end of Roanoke Island, which is part of the Outer Banks of North Carolina. The town is situated on the western shore of the island, facing the Croatan Sound. The town is bordered by the town of Wanchese to the south and the town of Nags Head to the north. The town is located approximately 40 miles south of the Virginia border and is approximately 70 miles north of Wilmington, North Carolina.
The town of Manteo is located in a humid subtropical climate zone, with hot, humid summers and mild winters. The average annual temperature is around 68 degrees Fahrenheit, with an average high of around 86 degrees in the summer and an average low of around 50 degrees in the winter. The average annual precipitation is around 50 inches, with most of the precipitation occurring in the summer months.
History
Manteo was first settled in the late 16th century by English settlers. The town was named after Manteo, a Native American chief who helped the English settlers in their efforts to establish a colony on Roanoke Island. The town was officially incorporated in 1873.
In the late 19th century, Manteo became a popular tourist destination due to its proximity to the Outer Banks. The town was home to several hotels and resorts, as well as a number of fishing and hunting lodges.
In the early 20th century, Manteo was home to a number of military installations, including a Coast Guard station and a Naval Air Station. The town was also home to a number of businesses, including a cannery, a boat building company, and a number of seafood restaurants.
Economy
The economy of Manteo is largely based on tourism. The town is home to a number of hotels, restaurants, and other tourist attractions. The town is also home to a number of businesses that provide services to the local population, such as grocery stores, banks, and medical facilities.
The town is also home to a number of government offices, including the Dare County Courthouse and the Dare County Sheriff’s Office. The town is also home to a number of educational institutions, including the College of the Albemarle and the Dare County Schools.
Demographics
As of the 2010 census, the population of Manteo was 1,434. The racial makeup of the town was 94.3% White, 2.2% African American, 0.7% Native American, 0.7% Asian, 0.2% Pacific Islander, 0.7% from other races, and 1.4% from two or more races. Hispanic or Latino of any race were 2.2% of the population.
The median household income in Manteo was $41,250, and the median family income was $50,000. The per capita income for the town was $21,945. About 11.2% of families and 14.2% of the population were below the poverty line, including 18.2% of those under age 18 and 8.3% of those age 65 or over.
Common Questions
What is Per Capita Income in Manteo?
Per Capita income in Manteo is $49,939.
What is the Median Family Income in Manteo?
Median Family Income in Manteo is $81,080.
What is the Median Household income in Manteo?
Median Household Income in Manteo is $78,074.
What is Income or Wage Gap in Manteo?
Income or Wage Gap in Manteo is 33.6%.
Women in Manteo earn 66.4 cents for every dollar earned by a man.
What is Inequality or Gini Index in Manteo?
Inequality or Gini Index in Manteo is 0.50.
What is the Total Population of Manteo?
Total Population of Manteo is 1,808.
What is the Total Male Population of Manteo?
Total Male Population of Manteo is 857.
What is the Total Female Population of Manteo?
Total Female Population of Manteo is 951.
What is the Ratio of Males per 100 Females in Manteo?
There are 90.12 Males per 100 Females in Manteo.
What is the Ratio of Females per 100 Males in Manteo?
There are 110.97 Females per 100 Males in Manteo.
What is the Median Population Age in Manteo?
Median Population Age in Manteo is 49.4 Years.
What is the Average Family Size in Manteo
Average Family Size in Manteo is 2.8 People.
What is the Average Household Size in Manteo
Average Household Size in Manteo is 2.0 People.
How Large is the Labor Force in Manteo?
There are 860 People in the Labor Forcein in Manteo.
What is the Percentage of People in the Labor Force in Manteo?
57.5% of People are in the Labor Force in Manteo.
What is the Unemployment Rate in Manteo?
Unemployment Rate in Manteo is 2.6%.