Hope Mills, NC Map & Demographics
Hope Mills Map
Hope Mills Overview
$26,854
PER CAPITA INCOME
$70,259
AVG FAMILY INCOME
$57,864
AVG HOUSEHOLD INCOME
23.9%
WAGE / INCOME GAP [ % ]
76.1¢/ $1
WAGE / INCOME GAP [ $ ]
$10,258
FAMILY INCOME DEFICIT
0.42
INEQUALITY / GINI INDEX
17,671
TOTAL POPULATION
8,462
MALE POPULATION
9,209
FEMALE POPULATION
91.89
MALES / 100 FEMALES
108.83
FEMALES / 100 MALES
32.5
MEDIAN AGE
3.4
AVG FAMILY SIZE
2.8
AVG HOUSEHOLD SIZE
8,307
LABOR FORCE [ PEOPLE ]
62.6%
PERCENT IN LABOR FORCE
7.8%
UNEMPLOYMENT RATE
Hope Mills Zip Codes
Hope Mills Area Codes
Income in Hope Mills
Income Overview in Hope Mills
Per Capita Income in Hope Mills is $26,854, while median incomes of families and households are $70,259 and $57,864 respectively.
| Characteristic | Number | Measure |
| Per Capita Income | 17,671 | $26,854 |
| Median Family Income | 4,253 | $70,259 |
| Mean Family Income | 4,253 | $82,968 |
| Median Household Income | 6,235 | $57,864 |
| Mean Household Income | 6,235 | $72,120 |
| Income Deficit | 4,253 | $10,258 |
| Wage / Income Gap (%) | 17,671 | 23.87% |
| Wage / Income Gap ($) | 17,671 | 76.13¢ per $1 |
| Gini / Inequality Index | 17,671 | 0.42 |
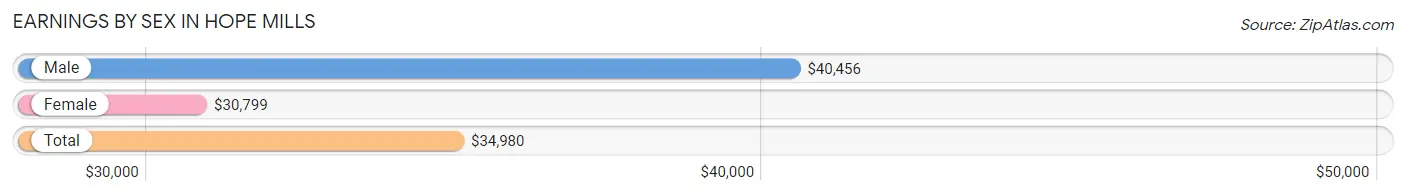
Earnings by Sex in Hope Mills
Average Earnings in Hope Mills are $34,980, $40,456 for men and $30,799 for women, a difference of 23.9%.
| Sex | Number | Average Earnings |
| Male | 4,082 (48.3%) | $40,456 |
| Female | 4,364 (51.7%) | $30,799 |
| Total | 8,446 (100.0%) | $34,980 |
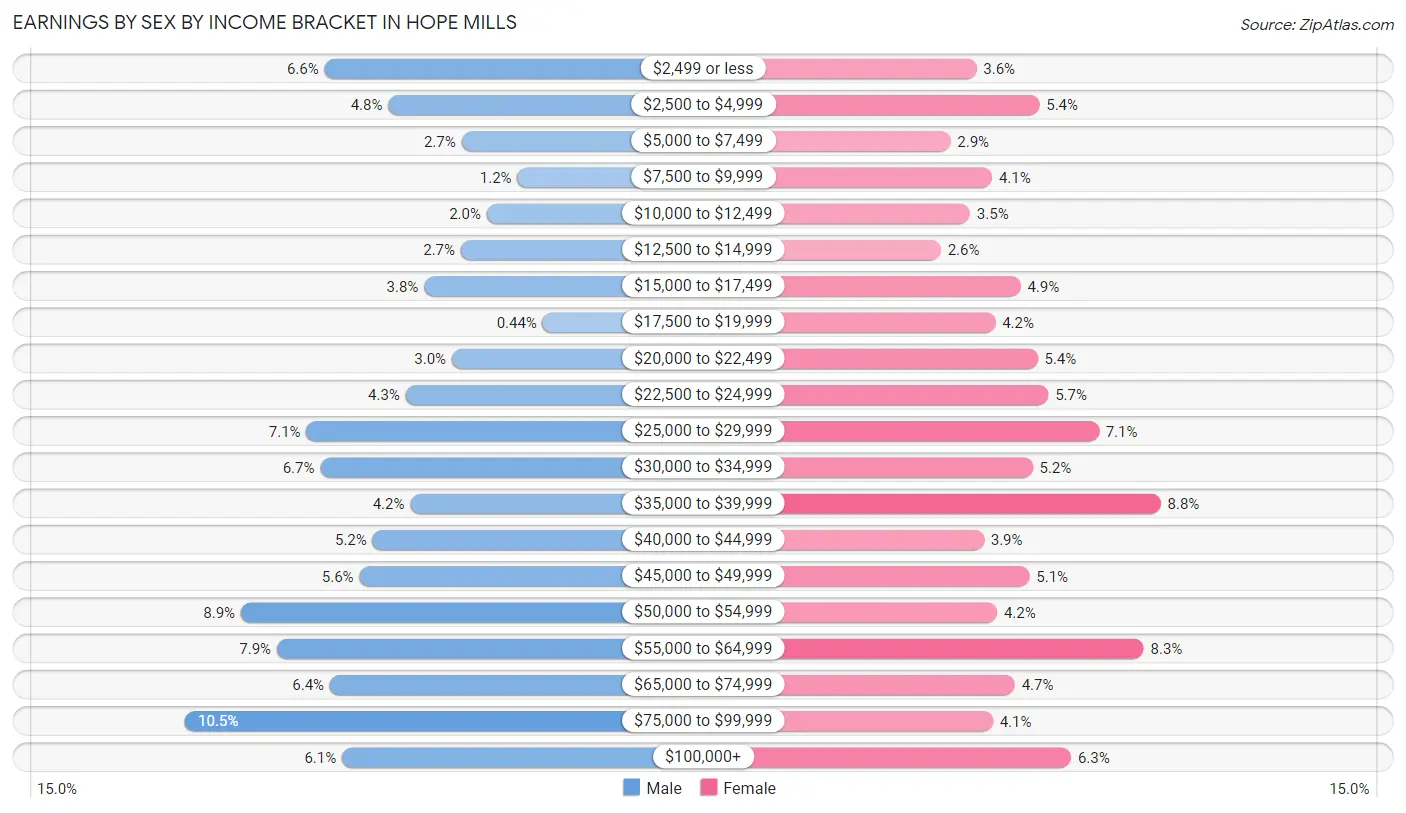
Earnings by Sex by Income Bracket in Hope Mills
The most common earnings brackets in Hope Mills are $75,000 to $99,999 for men (428 | 10.5%) and $35,000 to $39,999 for women (385 | 8.8%).
| Income | Male | Female |
| $2,499 or less | 268 (6.6%) | 159 (3.6%) |
| $2,500 to $4,999 | 195 (4.8%) | 236 (5.4%) |
| $5,000 to $7,499 | 111 (2.7%) | 127 (2.9%) |
| $7,500 to $9,999 | 47 (1.1%) | 178 (4.1%) |
| $10,000 to $12,499 | 82 (2.0%) | 151 (3.5%) |
| $12,500 to $14,999 | 112 (2.7%) | 115 (2.6%) |
| $15,000 to $17,499 | 154 (3.8%) | 213 (4.9%) |
| $17,500 to $19,999 | 18 (0.4%) | 182 (4.2%) |
| $20,000 to $22,499 | 122 (3.0%) | 234 (5.4%) |
| $22,500 to $24,999 | 175 (4.3%) | 247 (5.7%) |
| $25,000 to $29,999 | 289 (7.1%) | 309 (7.1%) |
| $30,000 to $34,999 | 273 (6.7%) | 228 (5.2%) |
| $35,000 to $39,999 | 170 (4.2%) | 385 (8.8%) |
| $40,000 to $44,999 | 213 (5.2%) | 168 (3.8%) |
| $45,000 to $49,999 | 228 (5.6%) | 224 (5.1%) |
| $50,000 to $54,999 | 364 (8.9%) | 184 (4.2%) |
| $55,000 to $64,999 | 323 (7.9%) | 364 (8.3%) |
| $65,000 to $74,999 | 262 (6.4%) | 206 (4.7%) |
| $75,000 to $99,999 | 428 (10.5%) | 179 (4.1%) |
| $100,000+ | 248 (6.1%) | 275 (6.3%) |
| Total | 4,082 (100.0%) | 4,364 (100.0%) |
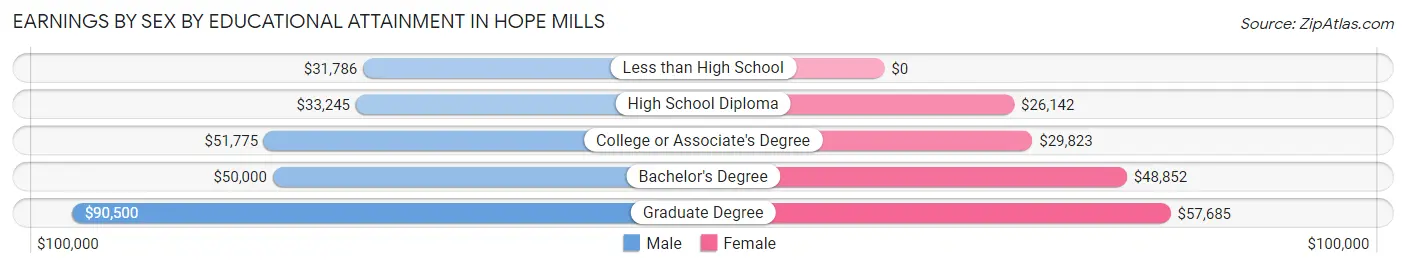
Earnings by Sex by Educational Attainment in Hope Mills
Average earnings in Hope Mills are $47,193 for men and $36,380 for women, a difference of 22.9%. Men with an educational attainment of graduate degree enjoy the highest average annual earnings of $90,500, while those with less than high school education earn the least with $31,786. Women with an educational attainment of graduate degree earn the most with the average annual earnings of $57,685, while those with high school diploma education have the smallest earnings of $26,142.
| Educational Attainment | Male Income | Female Income |
| Less than High School | $31,786 | $0 |
| High School Diploma | $33,245 | $26,142 |
| College or Associate's Degree | $51,775 | $29,823 |
| Bachelor's Degree | $50,000 | $48,852 |
| Graduate Degree | $90,500 | $57,685 |
| Total | $47,193 | $36,380 |
Family Income in Hope Mills
Family Income Brackets in Hope Mills
According to the Hope Mills family income data, there are 859 families falling into the $50,000 to $74,999 income range, which is the most common income bracket and makes up 20.2% of all families. Conversely, the $10,000 to $14,999 income bracket is the least frequent group with only 149 families (3.5%) belonging to this category.
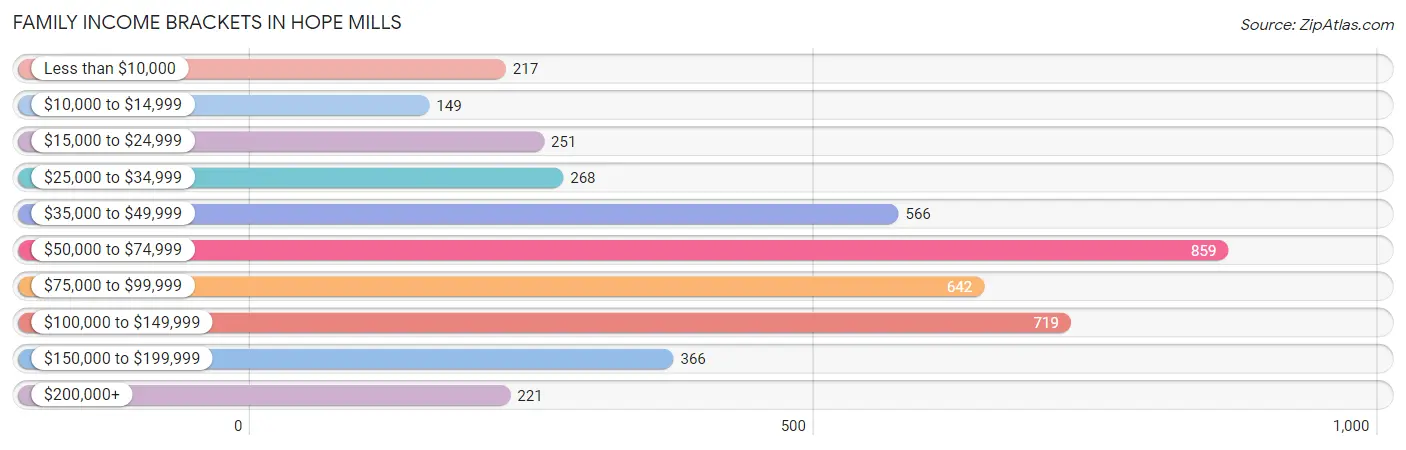
| Income Bracket | # Families | % Families |
| Less than $10,000 | 217 | 5.1% |
| $10,000 to $14,999 | 149 | 3.5% |
| $15,000 to $24,999 | 251 | 5.9% |
| $25,000 to $34,999 | 268 | 6.3% |
| $35,000 to $49,999 | 566 | 13.3% |
| $50,000 to $74,999 | 859 | 20.2% |
| $75,000 to $99,999 | 642 | 15.1% |
| $100,000 to $149,999 | 719 | 16.9% |
| $150,000 to $199,999 | 366 | 8.6% |
| $200,000+ | 221 | 5.2% |
Family Income by Famaliy Size in Hope Mills
7+ person families (90 | 2.1%) account for the highest median family income in Hope Mills with $124,018 per family, while 3-person families (1,048 | 24.6%) have the highest median income of $27,546 per family member.
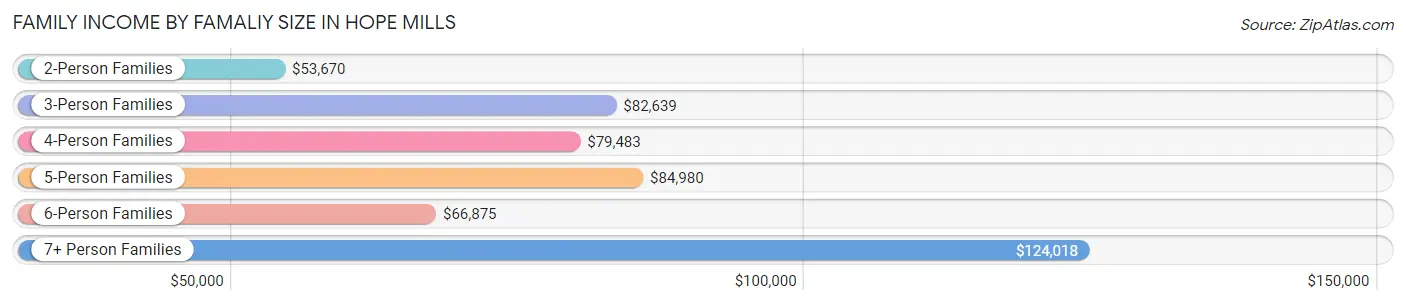
| Income Bracket | # Families | Median Income |
| 2-Person Families | 1,920 (45.1%) | $53,670 |
| 3-Person Families | 1,048 (24.6%) | $82,639 |
| 4-Person Families | 868 (20.4%) | $79,483 |
| 5-Person Families | 273 (6.4%) | $84,980 |
| 6-Person Families | 54 (1.3%) | $66,875 |
| 7+ Person Families | 90 (2.1%) | $124,018 |
| Total | 4,253 (100.0%) | $70,259 |
Family Income by Number of Earners in Hope Mills
The median family income in Hope Mills is $70,259, with families comprising 3+ earners (464) having the highest median family income of $123,214, while families with no earners (635) have the lowest median family income of $42,078, accounting for 10.9% and 14.9% of families, respectively.
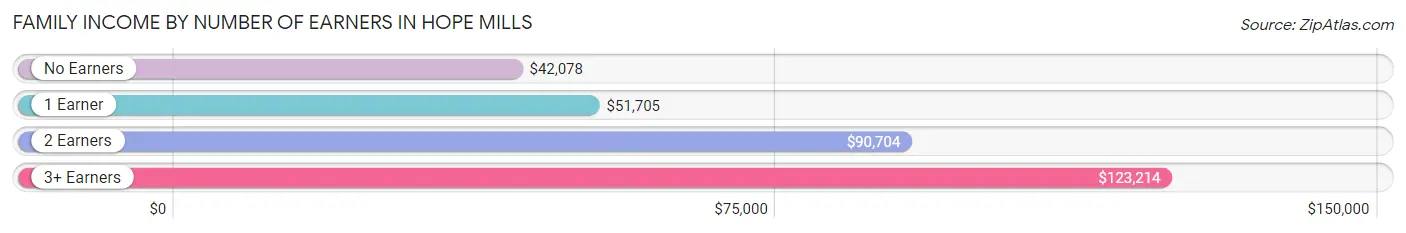
| Number of Earners | # Families | Median Income |
| No Earners | 635 (14.9%) | $42,078 |
| 1 Earner | 1,600 (37.6%) | $51,705 |
| 2 Earners | 1,554 (36.5%) | $90,704 |
| 3+ Earners | 464 (10.9%) | $123,214 |
| Total | 4,253 (100.0%) | $70,259 |
Household Income in Hope Mills
Household Income Brackets in Hope Mills
With 1,203 households falling in the category, the $50,000 to $74,999 income range is the most frequent in Hope Mills, accounting for 19.3% of all households. In contrast, only 249 households (4.0%) fall into the $200,000+ income bracket, making it the least populous group.
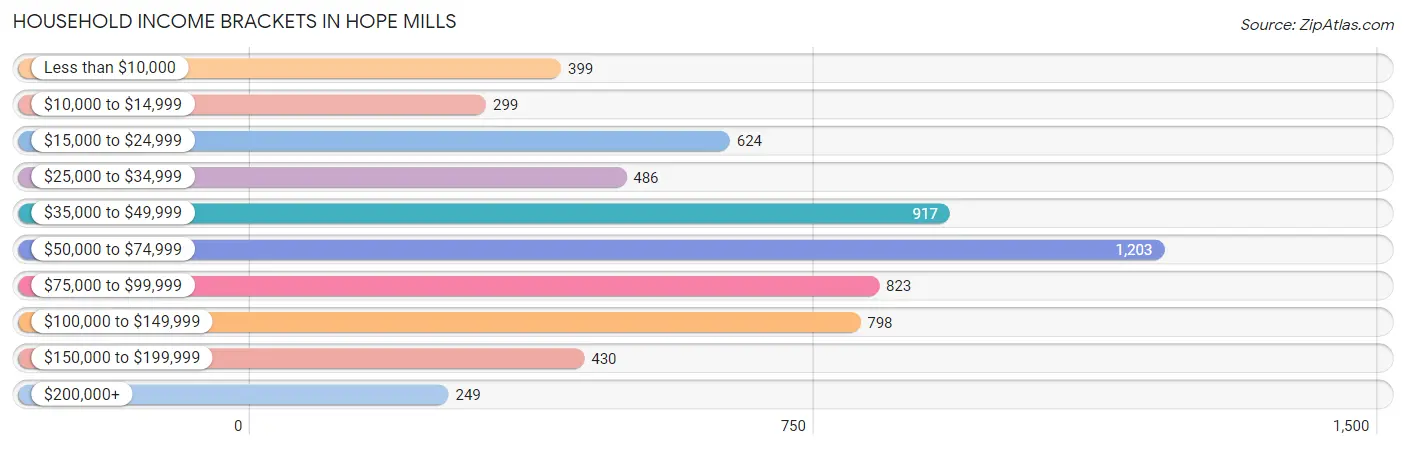
| Income Bracket | # Households | % Households |
| Less than $10,000 | 399 | 6.4% |
| $10,000 to $14,999 | 299 | 4.8% |
| $15,000 to $24,999 | 624 | 10.0% |
| $25,000 to $34,999 | 486 | 7.8% |
| $35,000 to $49,999 | 917 | 14.7% |
| $50,000 to $74,999 | 1,203 | 19.3% |
| $75,000 to $99,999 | 823 | 13.2% |
| $100,000 to $149,999 | 798 | 12.8% |
| $150,000 to $199,999 | 430 | 6.9% |
| $200,000+ | 249 | 4.0% |
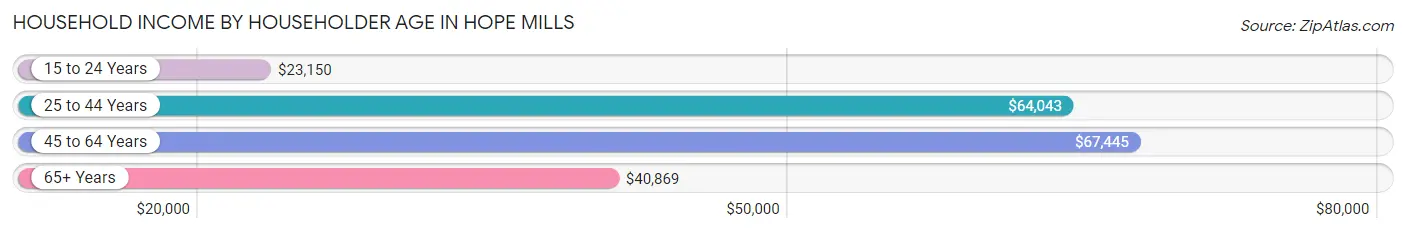
Household Income by Householder Age in Hope Mills
The median household income in Hope Mills is $57,864, with the highest median household income of $67,445 found in the 45 to 64 years age bracket for the primary householder. A total of 2,469 households (39.6%) fall into this category. Meanwhile, the 15 to 24 years age bracket for the primary householder has the lowest median household income of $23,150, with 287 households (4.6%) in this group.
| Income Bracket | # Households | Median Income |
| 15 to 24 Years | 287 (4.6%) | $23,150 |
| 25 to 44 Years | 2,436 (39.1%) | $64,043 |
| 45 to 64 Years | 2,469 (39.6%) | $67,445 |
| 65+ Years | 1,043 (16.7%) | $40,869 |
| Total | 6,235 (100.0%) | $57,864 |
Poverty in Hope Mills
Income Below Poverty by Sex and Age in Hope Mills
With 15.5% poverty level for males and 16.9% for females among the residents of Hope Mills, under 5 year old males and 15 year old females are the most vulnerable to poverty, with 267 males (36.7%) and 23 females (31.9%) in their respective age groups living below the poverty level.
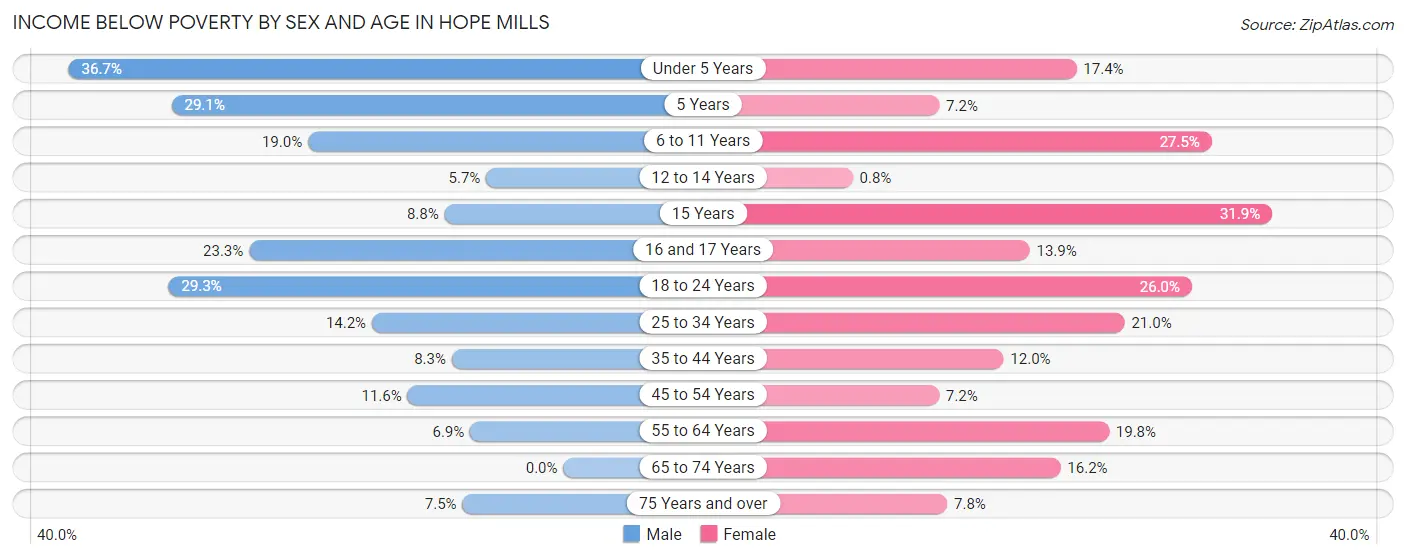
| Age Bracket | Male | Female |
| Under 5 Years | 267 (36.7%) | 93 (17.4%) |
| 5 Years | 32 (29.1%) | 12 (7.2%) |
| 6 to 11 Years | 161 (19.0%) | 229 (27.5%) |
| 12 to 14 Years | 20 (5.7%) | 2 (0.8%) |
| 15 Years | 15 (8.8%) | 23 (31.9%) |
| 16 and 17 Years | 63 (23.3%) | 46 (13.9%) |
| 18 to 24 Years | 236 (29.3%) | 229 (26.0%) |
| 25 to 34 Years | 182 (14.2%) | 325 (21.0%) |
| 35 to 44 Years | 81 (8.3%) | 147 (12.0%) |
| 45 to 54 Years | 137 (11.6%) | 84 (7.2%) |
| 55 to 64 Years | 50 (6.9%) | 204 (19.8%) |
| 65 to 74 Years | 0 (0.0%) | 106 (16.2%) |
| 75 Years and over | 23 (7.5%) | 28 (7.8%) |
| Total | 1,267 (15.5%) | 1,528 (16.9%) |
Income Above Poverty by Sex and Age in Hope Mills
According to the poverty statistics in Hope Mills, males aged 65 to 74 years and females aged 12 to 14 years are the age groups that are most secure financially, with 100.0% of males and 99.2% of females in these age groups living above the poverty line.
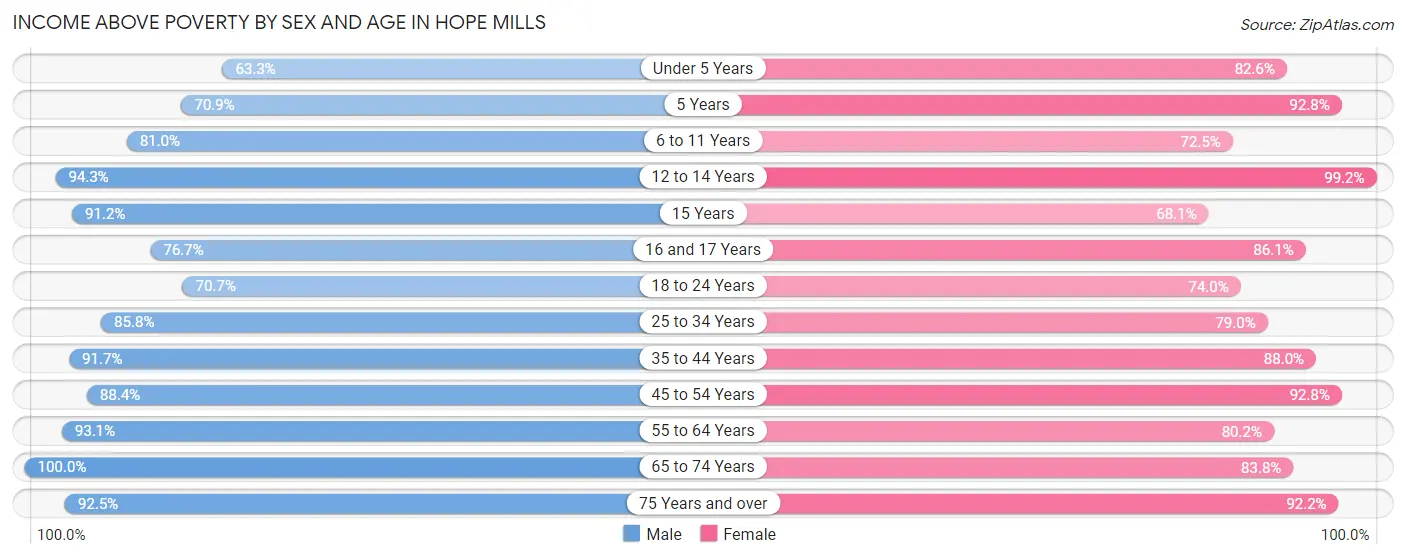
| Age Bracket | Male | Female |
| Under 5 Years | 460 (63.3%) | 441 (82.6%) |
| 5 Years | 78 (70.9%) | 154 (92.8%) |
| 6 to 11 Years | 688 (81.0%) | 605 (72.5%) |
| 12 to 14 Years | 329 (94.3%) | 247 (99.2%) |
| 15 Years | 155 (91.2%) | 49 (68.1%) |
| 16 and 17 Years | 207 (76.7%) | 284 (86.1%) |
| 18 to 24 Years | 569 (70.7%) | 652 (74.0%) |
| 25 to 34 Years | 1,099 (85.8%) | 1,223 (79.0%) |
| 35 to 44 Years | 897 (91.7%) | 1,078 (88.0%) |
| 45 to 54 Years | 1,047 (88.4%) | 1,081 (92.8%) |
| 55 to 64 Years | 673 (93.1%) | 825 (80.2%) |
| 65 to 74 Years | 409 (100.0%) | 547 (83.8%) |
| 75 Years and over | 284 (92.5%) | 330 (92.2%) |
| Total | 6,895 (84.5%) | 7,516 (83.1%) |
Income Below Poverty Among Married-Couple Families in Hope Mills
The poverty statistics for married-couple families in Hope Mills show that 8.4% or 220 of the total 2,629 families live below the poverty line. Families with no children have the highest poverty rate of 9.6%, comprising of 129 families. On the other hand, families with 5 or more children have the lowest poverty rate of 0.0%, which includes 0 families.
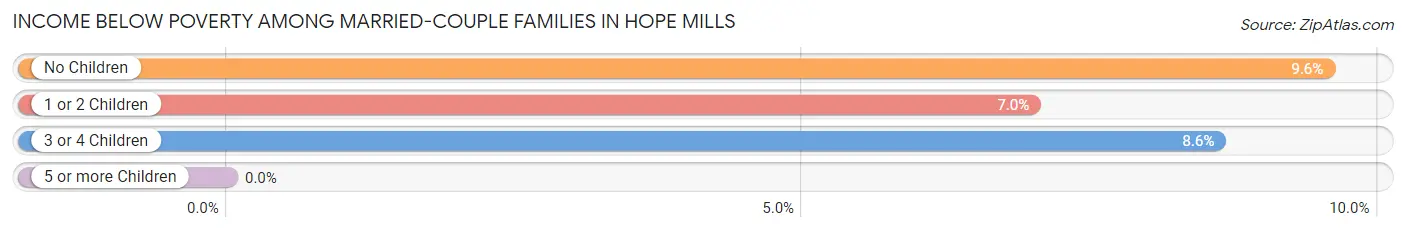
| Children | Above Poverty | Below Poverty |
| No Children | 1,222 (90.4%) | 129 (9.6%) |
| 1 or 2 Children | 998 (93.0%) | 75 (7.0%) |
| 3 or 4 Children | 170 (91.4%) | 16 (8.6%) |
| 5 or more Children | 19 (100.0%) | 0 (0.0%) |
| Total | 2,409 (91.6%) | 220 (8.4%) |
Income Below Poverty Among Single-Parent Households in Hope Mills
According to the poverty data in Hope Mills, 18.5% or 73 single-father households and 27.0% or 332 single-mother households are living below the poverty line. Among single-father households, those with 3 or 4 children have the highest poverty rate, with 10 households (35.7%) experiencing poverty. Likewise, among single-mother households, those with 3 or 4 children have the highest poverty rate, with 41 households (42.7%) falling below the poverty line.
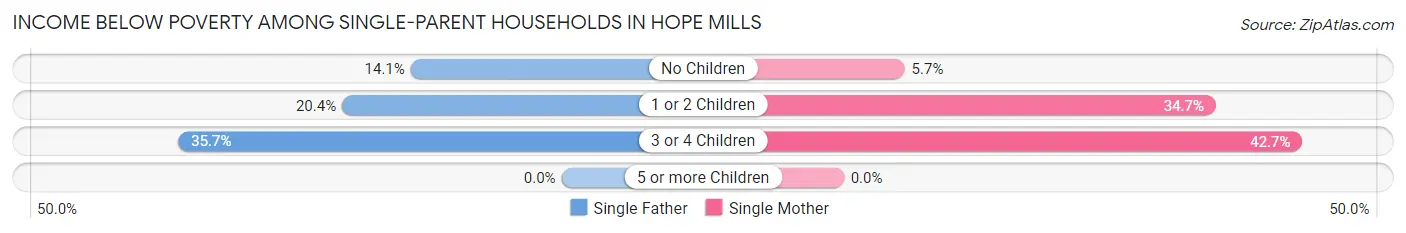
| Children | Single Father | Single Mother |
| No Children | 26 (14.1%) | 20 (5.7%) |
| 1 or 2 Children | 37 (20.4%) | 271 (34.6%) |
| 3 or 4 Children | 10 (35.7%) | 41 (42.7%) |
| 5 or more Children | 0 (0.0%) | 0 (0.0%) |
| Total | 73 (18.5%) | 332 (27.0%) |
Income Below Poverty Among Married-Couple vs Single-Parent Households in Hope Mills
The poverty data for Hope Mills shows that 220 of the married-couple family households (8.4%) and 405 of the single-parent households (24.9%) are living below the poverty level. Within the married-couple family households, those with no children have the highest poverty rate, with 129 households (9.6%) falling below the poverty line. Among the single-parent households, those with 3 or 4 children have the highest poverty rate, with 51 household (41.1%) living below poverty.
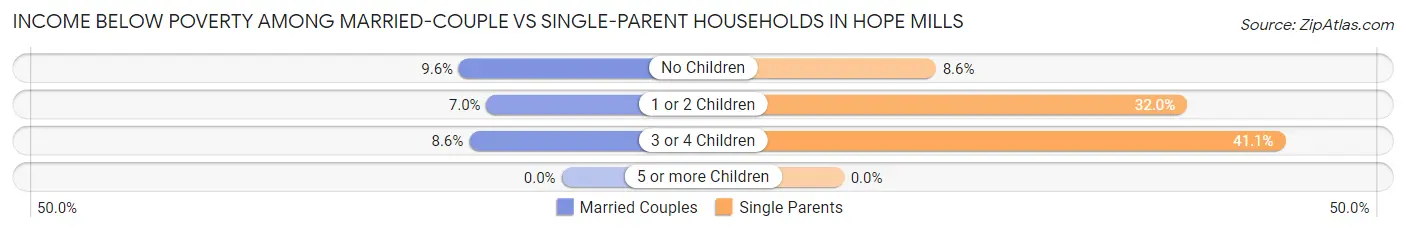
| Children | Married-Couple Families | Single-Parent Households |
| No Children | 129 (9.6%) | 46 (8.6%) |
| 1 or 2 Children | 75 (7.0%) | 308 (32.0%) |
| 3 or 4 Children | 16 (8.6%) | 51 (41.1%) |
| 5 or more Children | 0 (0.0%) | 0 (0.0%) |
| Total | 220 (8.4%) | 405 (24.9%) |
Race in Hope Mills
The most populous races in Hope Mills are White / Caucasian (8,310 | 47.0%), Black / African American (5,978 | 33.8%), and Hispanic or Latino (2,611 | 14.8%).
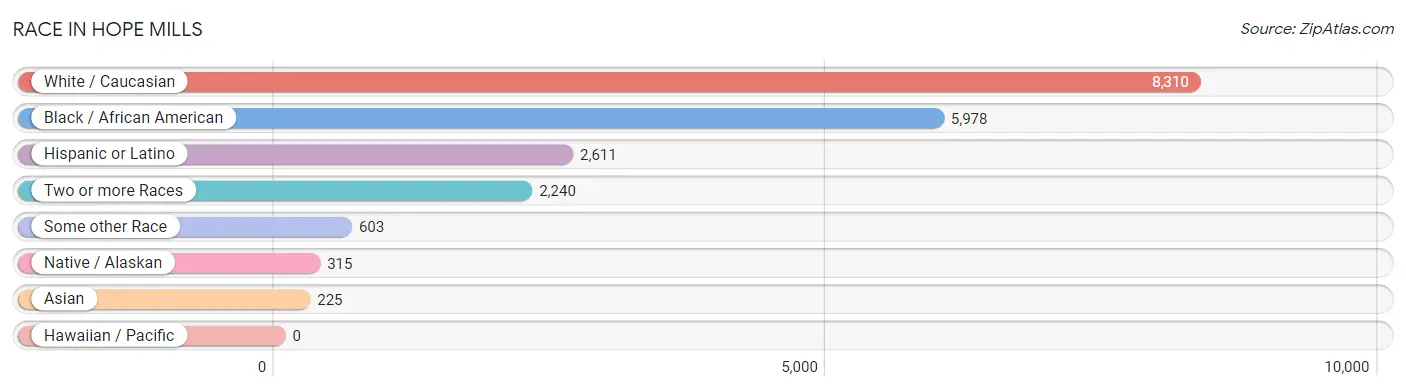
| Race | # Population | % Population |
| Asian | 225 | 1.3% |
| Black / African American | 5,978 | 33.8% |
| Hawaiian / Pacific | 0 | 0.0% |
| Hispanic or Latino | 2,611 | 14.8% |
| Native / Alaskan | 315 | 1.8% |
| White / Caucasian | 8,310 | 47.0% |
| Two or more Races | 2,240 | 12.7% |
| Some other Race | 603 | 3.4% |
| Total | 17,671 | 100.0% |
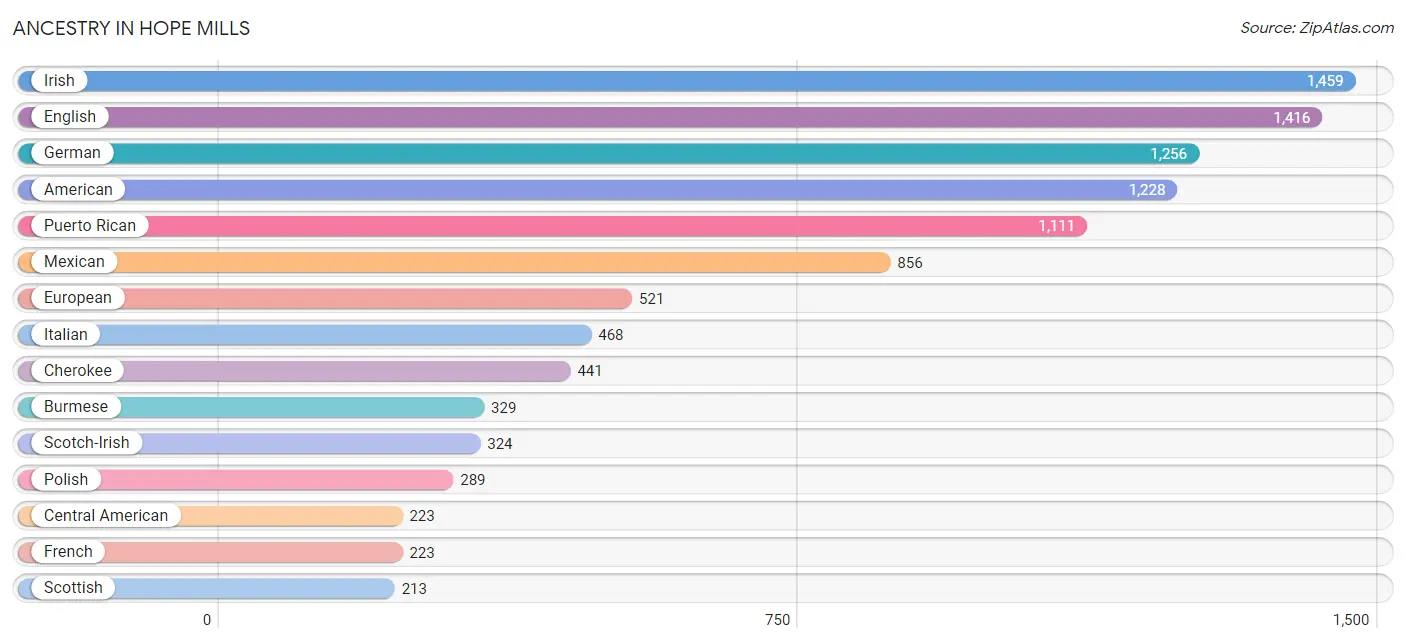
Ancestry in Hope Mills
The most populous ancestries reported in Hope Mills are Irish (1,459 | 8.3%), English (1,416 | 8.0%), German (1,256 | 7.1%), American (1,228 | 7.0%), and Puerto Rican (1,111 | 6.3%), together accounting for 36.6% of all Hope Mills residents.
| Ancestry | # Population | % Population |
| Afghan | 95 | 0.5% |
| African | 117 | 0.7% |
| American | 1,228 | 7.0% |
| Arab | 89 | 0.5% |
| Argentinean | 7 | 0.0% |
| Austrian | 14 | 0.1% |
| Belgian | 6 | 0.0% |
| Bhutanese | 21 | 0.1% |
| Brazilian | 41 | 0.2% |
| British | 67 | 0.4% |
| Burmese | 329 | 1.9% |
| Canadian | 22 | 0.1% |
| Central American | 223 | 1.3% |
| Cherokee | 441 | 2.5% |
| Colombian | 19 | 0.1% |
| Costa Rican | 21 | 0.1% |
| Cuban | 155 | 0.9% |
| Czechoslovakian | 13 | 0.1% |
| Dominican | 86 | 0.5% |
| Dutch | 94 | 0.5% |
| Eastern European | 11 | 0.1% |
| Ecuadorian | 37 | 0.2% |
| Egyptian | 76 | 0.4% |
| English | 1,416 | 8.0% |
| European | 521 | 2.9% |
| Finnish | 71 | 0.4% |
| French | 223 | 1.3% |
| French Canadian | 41 | 0.2% |
| German | 1,256 | 7.1% |
| German Russian | 10 | 0.1% |
| Greek | 162 | 0.9% |
| Honduran | 17 | 0.1% |
| Indian (Asian) | 12 | 0.1% |
| Iranian | 27 | 0.2% |
| Irish | 1,459 | 8.3% |
| Italian | 468 | 2.6% |
| Jamaican | 41 | 0.2% |
| Japanese | 22 | 0.1% |
| Jordanian | 13 | 0.1% |
| Korean | 58 | 0.3% |
| Lithuanian | 19 | 0.1% |
| Lumbee | 187 | 1.1% |
| Mexican | 856 | 4.8% |
| Nicaraguan | 28 | 0.2% |
| Northern European | 23 | 0.1% |
| Norwegian | 19 | 0.1% |
| Panamanian | 80 | 0.4% |
| Pennsylvania German | 15 | 0.1% |
| Peruvian | 63 | 0.4% |
| Polish | 289 | 1.6% |
| Portuguese | 24 | 0.1% |
| Puerto Rican | 1,111 | 6.3% |
| Russian | 39 | 0.2% |
| Salvadoran | 77 | 0.4% |
| Samoan | 77 | 0.4% |
| Scotch-Irish | 324 | 1.8% |
| Scottish | 213 | 1.2% |
| Seminole | 12 | 0.1% |
| Slovak | 32 | 0.2% |
| Slovene | 20 | 0.1% |
| South American | 126 | 0.7% |
| Spanish | 7 | 0.0% |
| Sri Lankan | 112 | 0.6% |
| Subsaharan African | 117 | 0.7% |
| Swedish | 105 | 0.6% |
| Swiss | 48 | 0.3% |
| Thai | 82 | 0.5% |
| Welsh | 39 | 0.2% |
| West Indian | 23 | 0.1% | View All 69 Rows |
Immigrants in Hope Mills
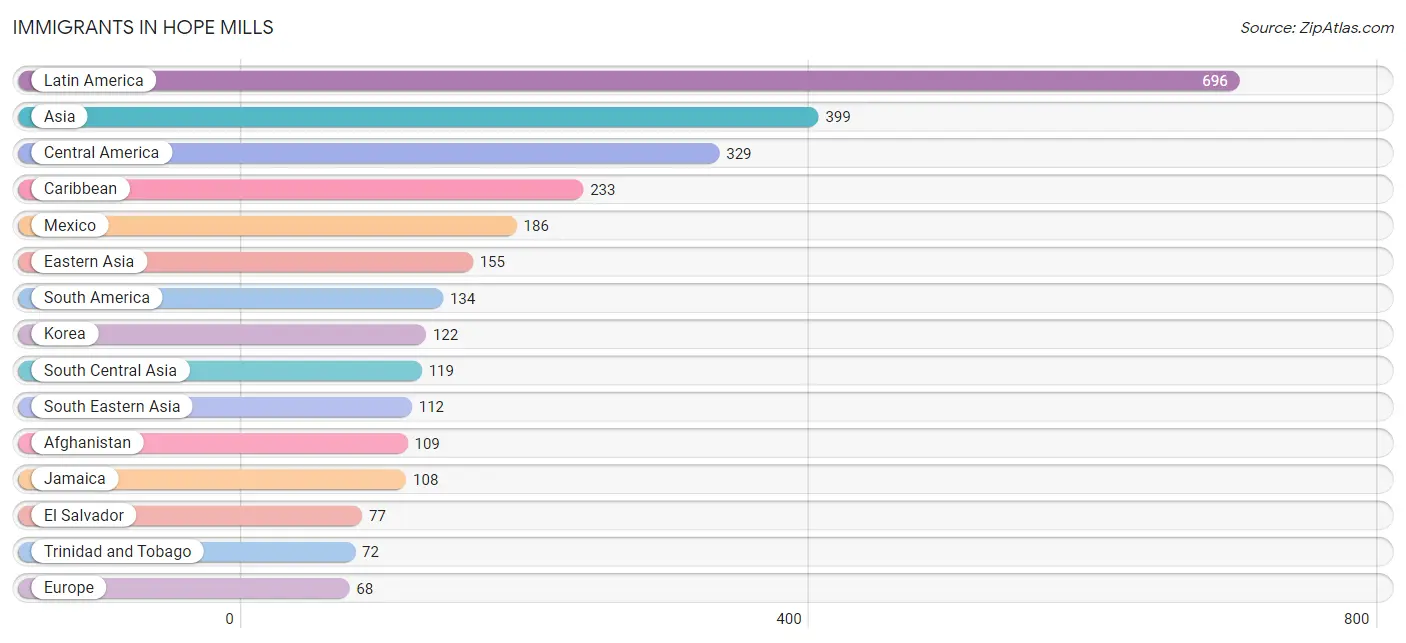
The most numerous immigrant groups reported in Hope Mills came from Latin America (696 | 3.9%), Asia (399 | 2.3%), Central America (329 | 1.9%), Caribbean (233 | 1.3%), and Mexico (186 | 1.1%), together accounting for 10.4% of all Hope Mills residents.
| Immigration Origin | # Population | % Population |
| Afghanistan | 109 | 0.6% |
| Africa | 36 | 0.2% |
| Argentina | 7 | 0.0% |
| Asia | 399 | 2.3% |
| Brazil | 19 | 0.1% |
| Cambodia | 22 | 0.1% |
| Caribbean | 233 | 1.3% |
| Central America | 329 | 1.9% |
| China | 12 | 0.1% |
| Colombia | 8 | 0.1% |
| Cuba | 15 | 0.1% |
| Dominican Republic | 21 | 0.1% |
| Eastern Asia | 155 | 0.9% |
| Ecuador | 37 | 0.2% |
| Egypt | 36 | 0.2% |
| El Salvador | 77 | 0.4% |
| England | 8 | 0.1% |
| Europe | 68 | 0.4% |
| Germany | 60 | 0.3% |
| Grenada | 8 | 0.1% |
| Honduras | 17 | 0.1% |
| Iran | 10 | 0.1% |
| Jamaica | 108 | 0.6% |
| Japan | 21 | 0.1% |
| Jordan | 13 | 0.1% |
| Korea | 122 | 0.7% |
| Latin America | 696 | 3.9% |
| Mexico | 186 | 1.1% |
| Nicaragua | 28 | 0.2% |
| Northern Africa | 36 | 0.2% |
| Northern Europe | 8 | 0.1% |
| Panama | 21 | 0.1% |
| Peru | 63 | 0.4% |
| Philippines | 33 | 0.2% |
| South America | 134 | 0.8% |
| South Central Asia | 119 | 0.7% |
| South Eastern Asia | 112 | 0.6% |
| Trinidad and Tobago | 72 | 0.4% |
| Vietnam | 57 | 0.3% |
| West Indies | 9 | 0.1% |
| Western Asia | 13 | 0.1% |
| Western Europe | 60 | 0.3% | View All 42 Rows |
Sex and Age in Hope Mills
Sex and Age in Hope Mills
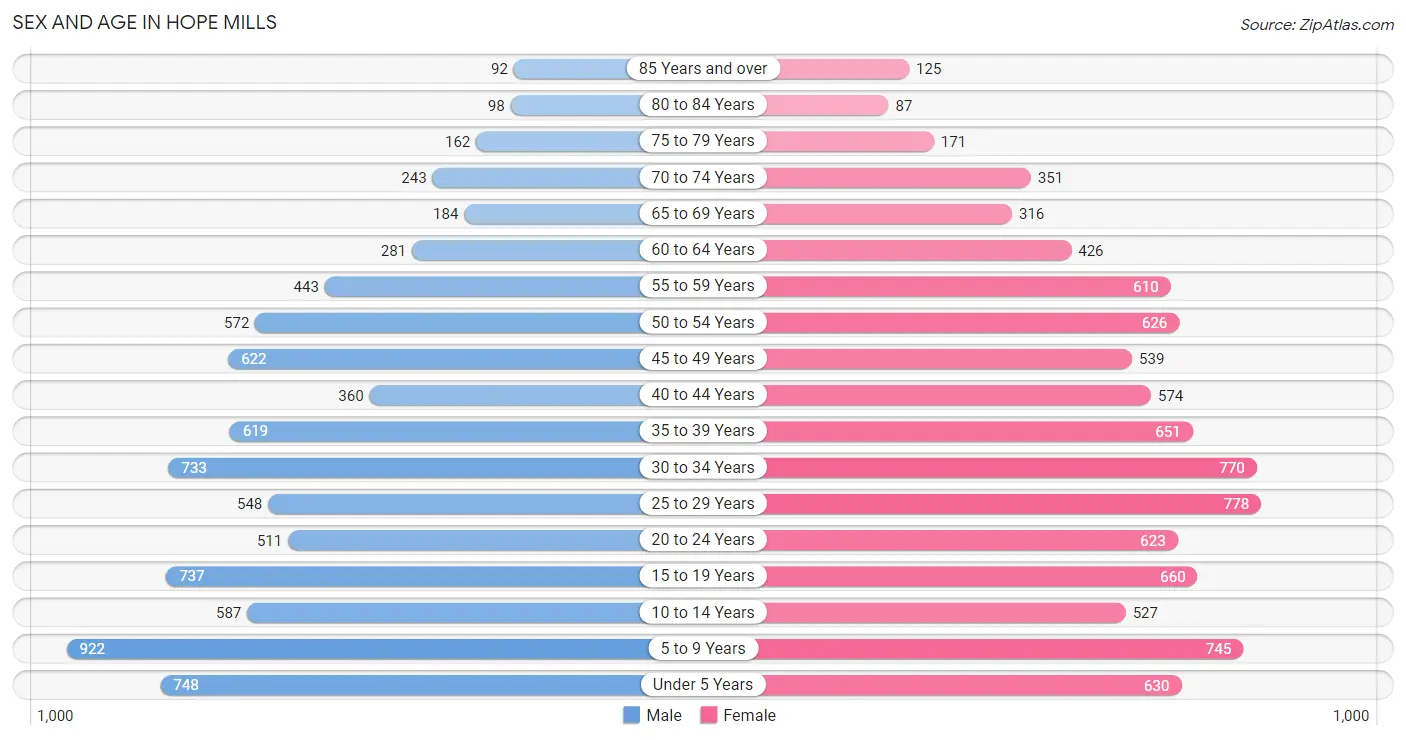
The most populous age groups in Hope Mills are 5 to 9 Years (922 | 10.9%) for men and 25 to 29 Years (778 | 8.5%) for women.
| Age Bracket | Male | Female |
| Under 5 Years | 748 (8.8%) | 630 (6.8%) |
| 5 to 9 Years | 922 (10.9%) | 745 (8.1%) |
| 10 to 14 Years | 587 (6.9%) | 527 (5.7%) |
| 15 to 19 Years | 737 (8.7%) | 660 (7.2%) |
| 20 to 24 Years | 511 (6.0%) | 623 (6.8%) |
| 25 to 29 Years | 548 (6.5%) | 778 (8.5%) |
| 30 to 34 Years | 733 (8.7%) | 770 (8.4%) |
| 35 to 39 Years | 619 (7.3%) | 651 (7.1%) |
| 40 to 44 Years | 360 (4.3%) | 574 (6.2%) |
| 45 to 49 Years | 622 (7.3%) | 539 (5.9%) |
| 50 to 54 Years | 572 (6.8%) | 626 (6.8%) |
| 55 to 59 Years | 443 (5.2%) | 610 (6.6%) |
| 60 to 64 Years | 281 (3.3%) | 426 (4.6%) |
| 65 to 69 Years | 184 (2.2%) | 316 (3.4%) |
| 70 to 74 Years | 243 (2.9%) | 351 (3.8%) |
| 75 to 79 Years | 162 (1.9%) | 171 (1.9%) |
| 80 to 84 Years | 98 (1.2%) | 87 (0.9%) |
| 85 Years and over | 92 (1.1%) | 125 (1.4%) |
| Total | 8,462 (100.0%) | 9,209 (100.0%) |
Families and Households in Hope Mills
Median Family Size in Hope Mills
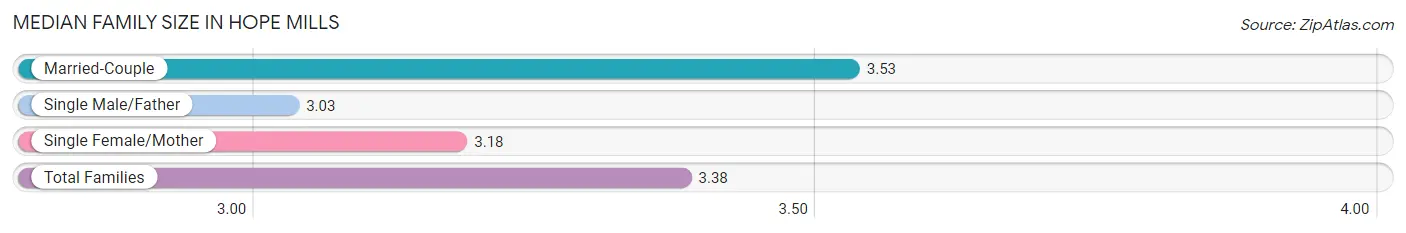
The median family size in Hope Mills is 3.38 persons per family, with married-couple families (2,629 | 61.8%) accounting for the largest median family size of 3.53 persons per family. On the other hand, single male/father families (394 | 9.3%) represent the smallest median family size with 3.03 persons per family.
| Family Type | # Families | Family Size |
| Married-Couple | 2,629 (61.8%) | 3.53 |
| Single Male/Father | 394 (9.3%) | 3.03 |
| Single Female/Mother | 1,230 (28.9%) | 3.18 |
| Total Families | 4,253 (100.0%) | 3.38 |
Median Household Size in Hope Mills
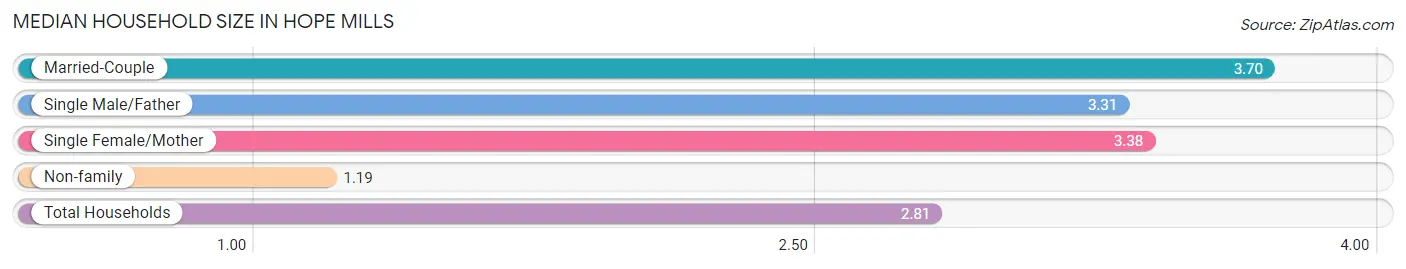
The median household size in Hope Mills is 2.81 persons per household, with married-couple households (2,629 | 42.2%) accounting for the largest median household size of 3.7 persons per household. non-family households (1,982 | 31.8%) represent the smallest median household size with 1.19 persons per household.
| Household Type | # Households | Household Size |
| Married-Couple | 2,629 (42.2%) | 3.70 |
| Single Male/Father | 394 (6.3%) | 3.31 |
| Single Female/Mother | 1,230 (19.7%) | 3.38 |
| Non-family | 1,982 (31.8%) | 1.19 |
| Total Households | 6,235 (100.0%) | 2.81 |
Household Size by Marriage Status in Hope Mills
Out of a total of 6,235 households in Hope Mills, 4,253 (68.2%) are family households, while 1,982 (31.8%) are nonfamily households. The most numerous type of family households are 2-person households, comprising 1,749, and the most common type of nonfamily households are 1-person households, comprising 1,732.
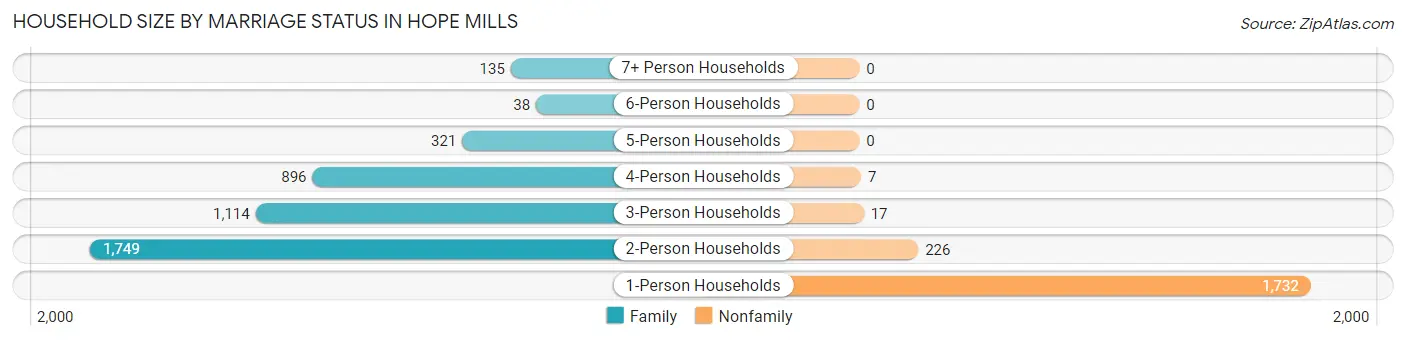
| Household Size | Family Households | Nonfamily Households |
| 1-Person Households | - | 1,732 (27.8%) |
| 2-Person Households | 1,749 (28.1%) | 226 (3.6%) |
| 3-Person Households | 1,114 (17.9%) | 17 (0.3%) |
| 4-Person Households | 896 (14.4%) | 7 (0.1%) |
| 5-Person Households | 321 (5.1%) | 0 (0.0%) |
| 6-Person Households | 38 (0.6%) | 0 (0.0%) |
| 7+ Person Households | 135 (2.2%) | 0 (0.0%) |
| Total | 4,253 (68.2%) | 1,982 (31.8%) |
Female Fertility in Hope Mills
Fertility by Age in Hope Mills
Average fertility rate in Hope Mills is 41.0 births per 1,000 women. Women in the age bracket of 20 to 34 years have the highest fertility rate with 74.0 births per 1,000 women. Women in the age bracket of 20 to 34 years acount for 84.2% of all women with births.
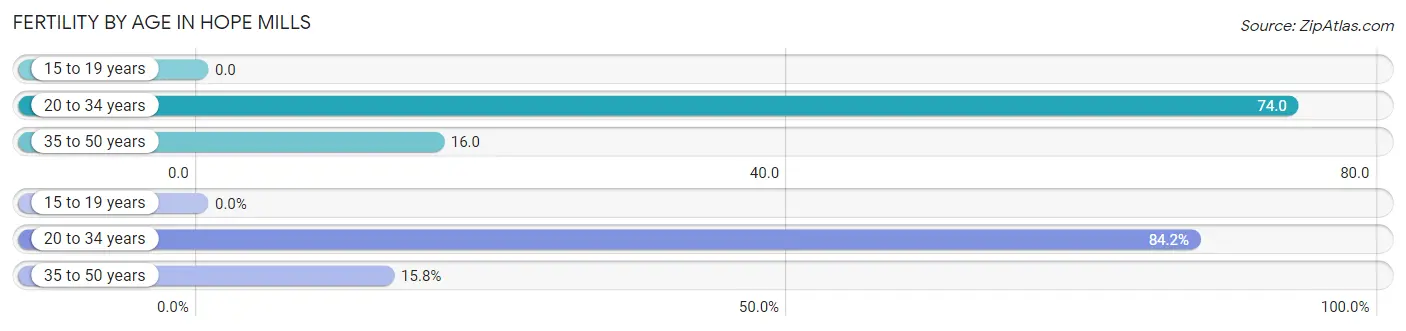
| Age Bracket | Women with Births | Births / 1,000 Women |
| 15 to 19 years | 0 (0.0%) | 0.0 |
| 20 to 34 years | 160 (84.2%) | 74.0 |
| 35 to 50 years | 30 (15.8%) | 16.0 |
| Total | 190 (100.0%) | 41.0 |
Fertility by Age by Marriage Status in Hope Mills
86.8% of women with births (190) in Hope Mills are married. The highest percentage of unmarried women with births falls into 20 to 34 years age bracket with 15.6% of them unmarried at the time of birth, while the lowest percentage of unmarried women with births belong to 35 to 50 years age bracket with 0.0% of them unmarried.
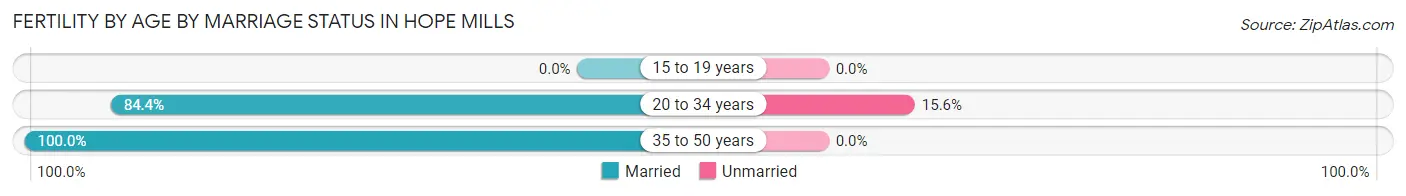
| Age Bracket | Married | Unmarried |
| 15 to 19 years | 0 (0.0%) | 0 (0.0%) |
| 20 to 34 years | 135 (84.4%) | 25 (15.6%) |
| 35 to 50 years | 30 (100.0%) | 0 (0.0%) |
| Total | 165 (86.8%) | 25 (13.2%) |
Fertility by Education in Hope Mills
Average fertility rate in Hope Mills is 41.0 births per 1,000 women. Women with the education attainment of bachelor's degree have the highest fertility rate of 77.0 births per 1,000 women, while women with the education attainment of high school diploma have the lowest fertility at 18.0 births per 1,000 women. Women with the education attainment of college or associate's degree represent 50.5% of all women with births.
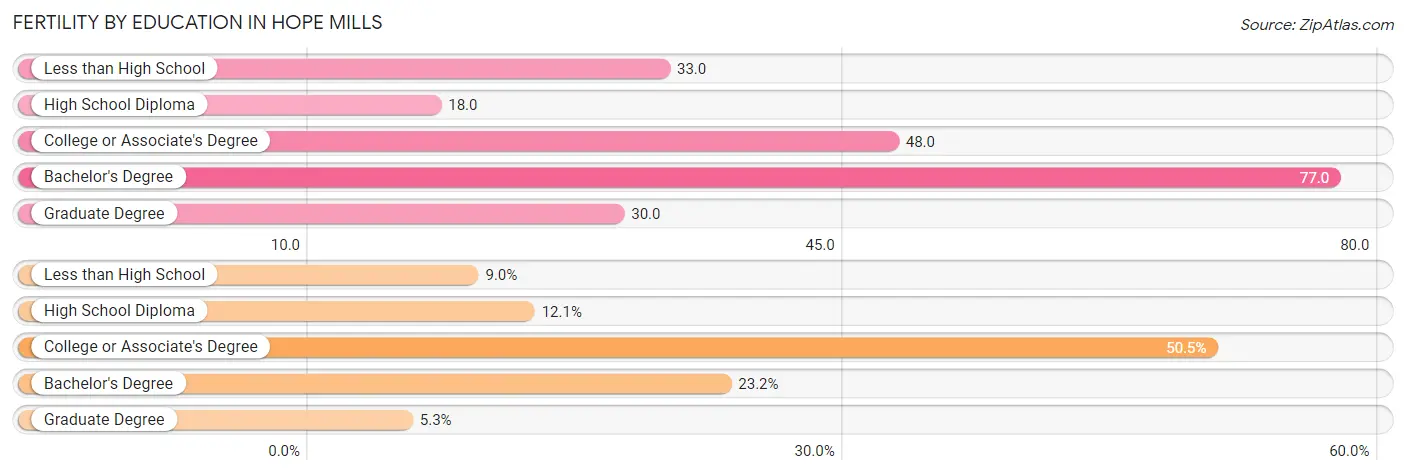
| Educational Attainment | Women with Births | Births / 1,000 Women |
| Less than High School | 17 (8.9%) | 33.0 |
| High School Diploma | 23 (12.1%) | 18.0 |
| College or Associate's Degree | 96 (50.5%) | 48.0 |
| Bachelor's Degree | 44 (23.2%) | 77.0 |
| Graduate Degree | 10 (5.3%) | 30.0 |
| Total | 190 (100.0%) | 41.0 |
Fertility by Education by Marriage Status in Hope Mills
13.2% of women with births in Hope Mills are unmarried. Women with the educational attainment of less than high school are most likely to be married with 100.0% of them married at childbirth, while women with the educational attainment of high school diploma are least likely to be married with 43.5% of them unmarried at childbirth.
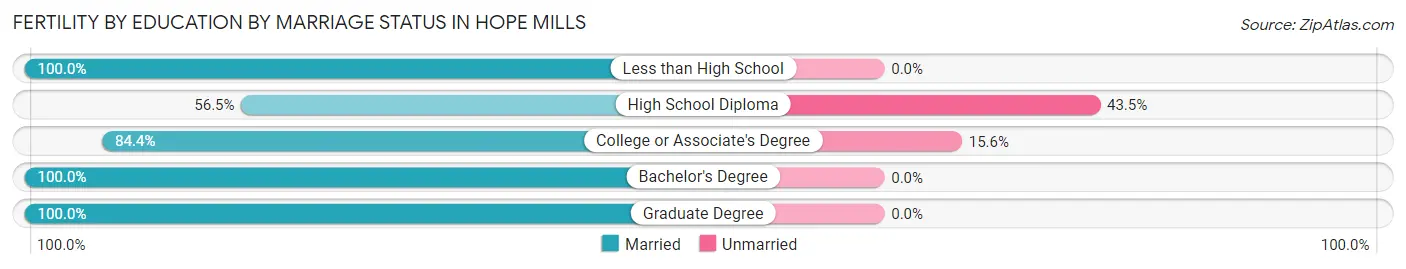
| Educational Attainment | Married | Unmarried |
| Less than High School | 17 (100.0%) | 0 (0.0%) |
| High School Diploma | 13 (56.5%) | 10 (43.5%) |
| College or Associate's Degree | 81 (84.4%) | 15 (15.6%) |
| Bachelor's Degree | 44 (100.0%) | 0 (0.0%) |
| Graduate Degree | 10 (100.0%) | 0 (0.0%) |
| Total | 165 (86.8%) | 25 (13.2%) |
Employment Characteristics in Hope Mills
Employment by Class of Employer in Hope Mills
Among the 7,478 employed individuals in Hope Mills, private company employees (4,564 | 61.0%), federal government employees (1,108 | 14.8%), and local government employees (660 | 8.8%) make up the most common classes of employment.
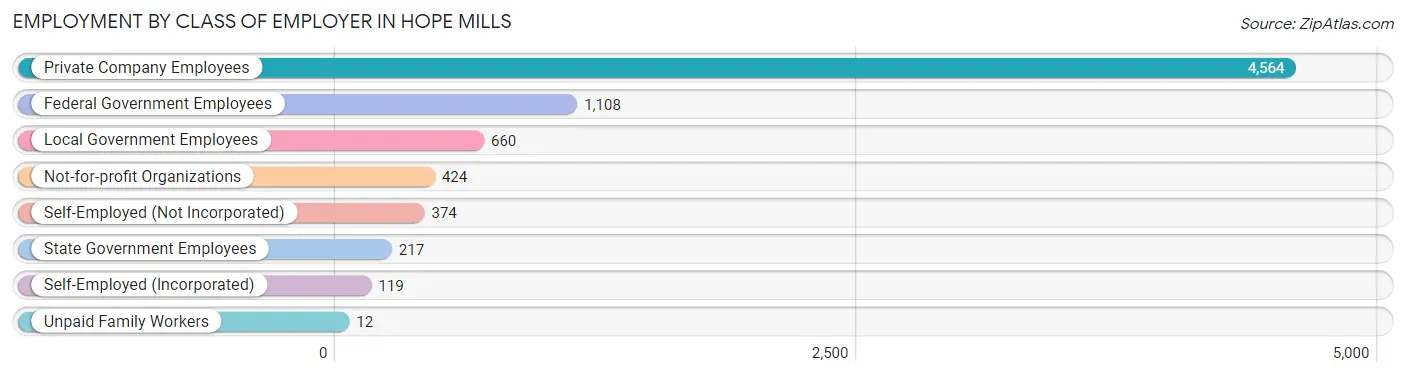
| Employer Class | # Employees | % Employees |
| Private Company Employees | 4,564 | 61.0% |
| Self-Employed (Incorporated) | 119 | 1.6% |
| Self-Employed (Not Incorporated) | 374 | 5.0% |
| Not-for-profit Organizations | 424 | 5.7% |
| Local Government Employees | 660 | 8.8% |
| State Government Employees | 217 | 2.9% |
| Federal Government Employees | 1,108 | 14.8% |
| Unpaid Family Workers | 12 | 0.2% |
| Total | 7,478 | 100.0% |
Employment Status by Age in Hope Mills
According to the labor force statistics for Hope Mills, out of the total population over 16 years of age (13,270), 62.6% or 8,307 individuals are in the labor force, with 7.8% or 648 of them unemployed. The age group with the highest labor force participation rate is 25 to 29 years, with 82.9% or 1,099 individuals in the labor force. Within the labor force, the 20 to 24 years age range has the highest percentage of unemployed individuals, with 28.6% or 243 of them being unemployed.
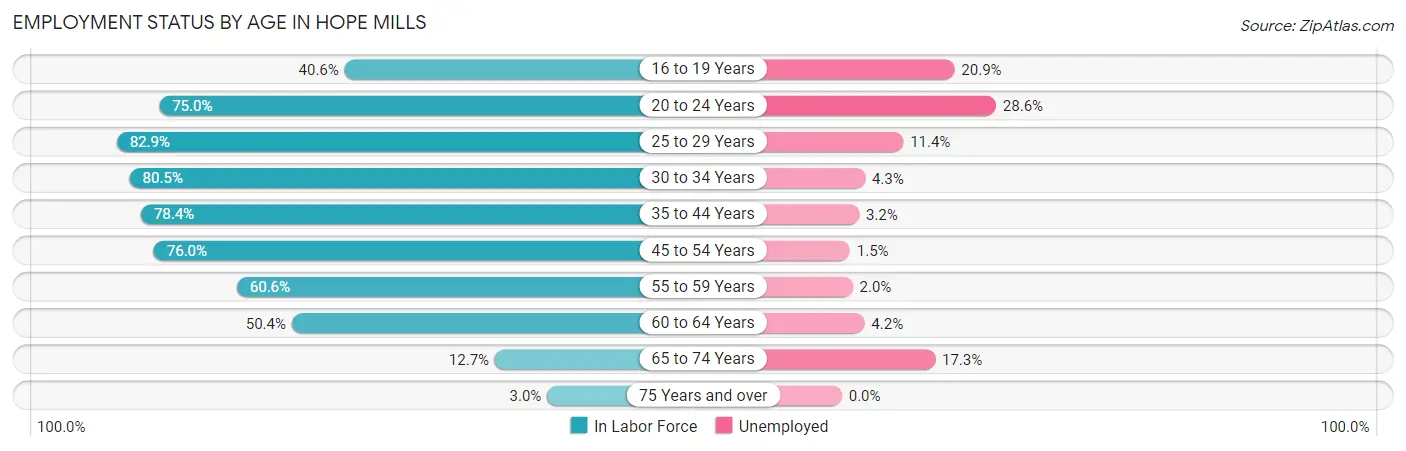
| Age Bracket | In Labor Force | Unemployed |
| 16 to 19 Years | 469 (40.6%) | 98 (20.9%) |
| 20 to 24 Years | 850 (75.0%) | 243 (28.6%) |
| 25 to 29 Years | 1,099 (82.9%) | 125 (11.4%) |
| 30 to 34 Years | 1,210 (80.5%) | 52 (4.3%) |
| 35 to 44 Years | 1,728 (78.4%) | 55 (3.2%) |
| 45 to 54 Years | 1,793 (76.0%) | 27 (1.5%) |
| 55 to 59 Years | 638 (60.6%) | 13 (2.0%) |
| 60 to 64 Years | 356 (50.4%) | 15 (4.2%) |
| 65 to 74 Years | 139 (12.7%) | 24 (17.3%) |
| 75 Years and over | 22 (3.0%) | 0 (0.0%) |
| Total | 8,307 (62.6%) | 648 (7.8%) |
Employment Status by Educational Attainment in Hope Mills
According to labor force statistics for Hope Mills, 74.6% of individuals (6,827) out of the total population between 25 and 64 years of age (9,152) are in the labor force, with 4.2% or 287 of them being unemployed. The group with the highest labor force participation rate are those with the educational attainment of bachelor's degree or higher, with 82.7% or 1,689 individuals in the labor force. Within the labor force, individuals with less than high school education have the highest percentage of unemployment, with 14.3% or 51 of them being unemployed.
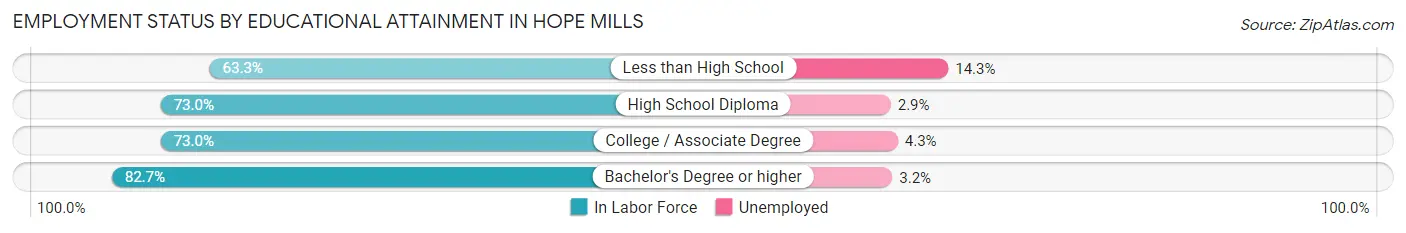
| Educational Attainment | In Labor Force | Unemployed |
| Less than High School | 356 (63.3%) | 80 (14.3%) |
| High School Diploma | 1,670 (73.0%) | 66 (2.9%) |
| College / Associate Degree | 3,111 (73.0%) | 183 (4.3%) |
| Bachelor's Degree or higher | 1,689 (82.7%) | 65 (3.2%) |
| Total | 6,827 (74.6%) | 384 (4.2%) |
Employment Occupations by Sex in Hope Mills
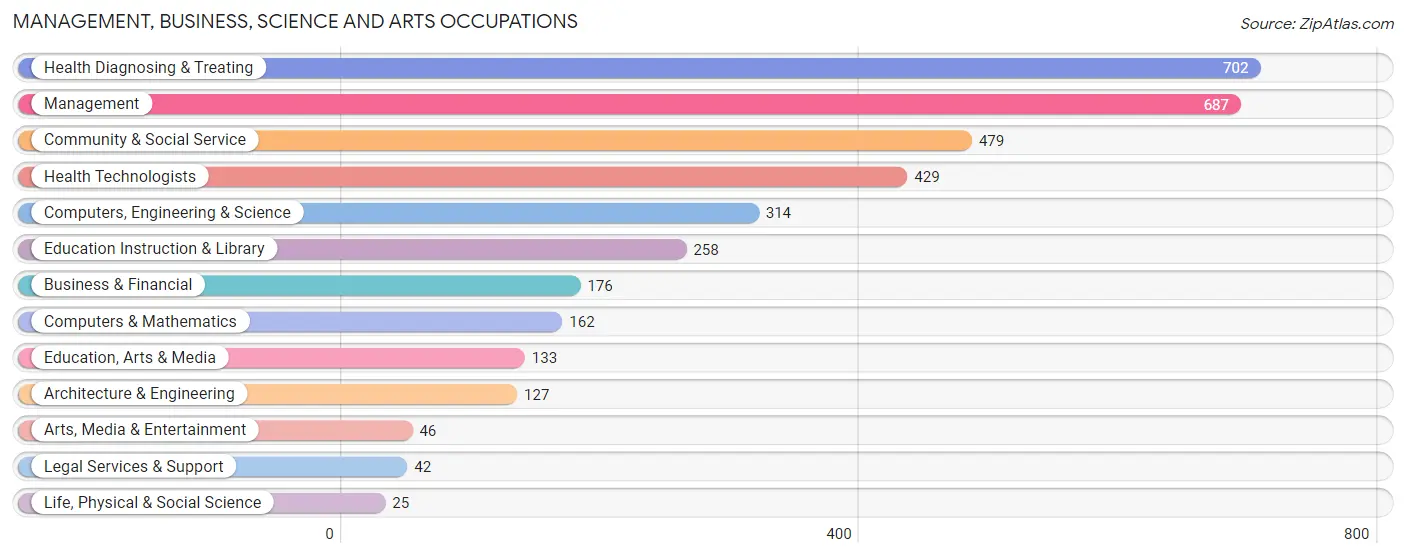
Management, Business, Science and Arts Occupations
The most common Management, Business, Science and Arts occupations in Hope Mills are Health Diagnosing & Treating (702 | 9.7%), Management (687 | 9.5%), Community & Social Service (479 | 6.6%), Health Technologists (429 | 5.9%), and Computers, Engineering & Science (314 | 4.3%).
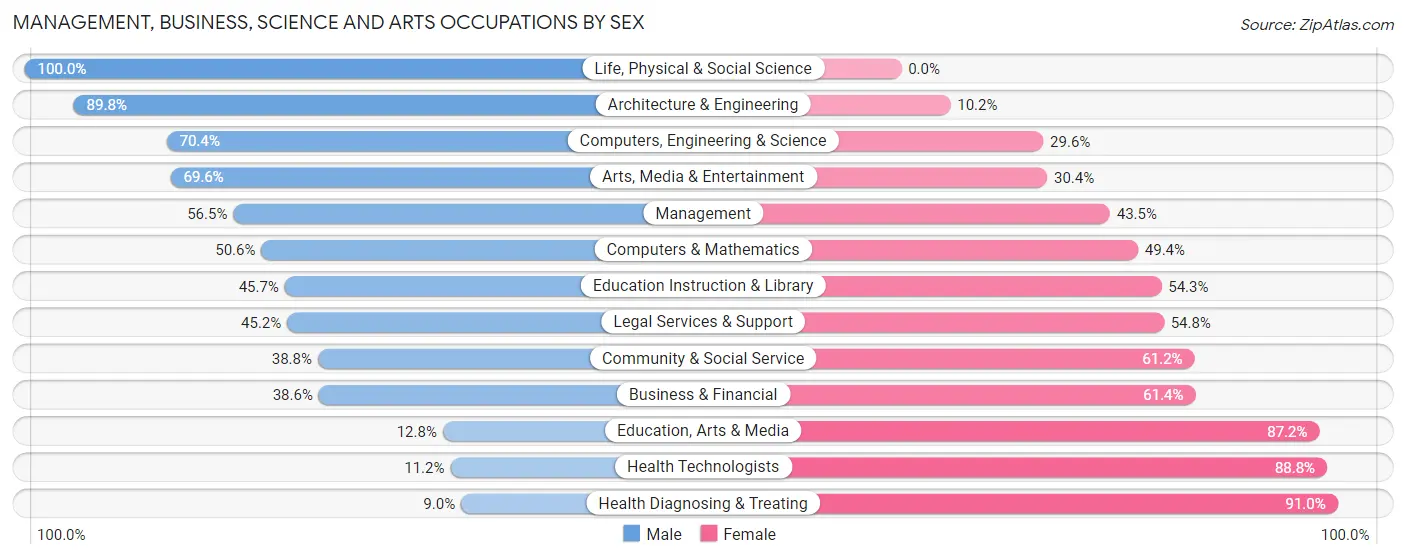
Management, Business, Science and Arts Occupations by Sex
Within the Management, Business, Science and Arts occupations in Hope Mills, the most male-oriented occupations are Life, Physical & Social Science (100.0%), Architecture & Engineering (89.8%), and Computers, Engineering & Science (70.4%), while the most female-oriented occupations are Health Diagnosing & Treating (91.0%), Health Technologists (88.8%), and Education, Arts & Media (87.2%).
| Occupation | Male | Female |
| Management | 388 (56.5%) | 299 (43.5%) |
| Business & Financial | 68 (38.6%) | 108 (61.4%) |
| Computers, Engineering & Science | 221 (70.4%) | 93 (29.6%) |
| Computers & Mathematics | 82 (50.6%) | 80 (49.4%) |
| Architecture & Engineering | 114 (89.8%) | 13 (10.2%) |
| Life, Physical & Social Science | 25 (100.0%) | 0 (0.0%) |
| Community & Social Service | 186 (38.8%) | 293 (61.2%) |
| Education, Arts & Media | 17 (12.8%) | 116 (87.2%) |
| Legal Services & Support | 19 (45.2%) | 23 (54.8%) |
| Education Instruction & Library | 118 (45.7%) | 140 (54.3%) |
| Arts, Media & Entertainment | 32 (69.6%) | 14 (30.4%) |
| Health Diagnosing & Treating | 63 (9.0%) | 639 (91.0%) |
| Health Technologists | 48 (11.2%) | 381 (88.8%) |
| Total (Category) | 926 (39.3%) | 1,432 (60.7%) |
| Total (Overall) | 3,390 (46.7%) | 3,866 (53.3%) |
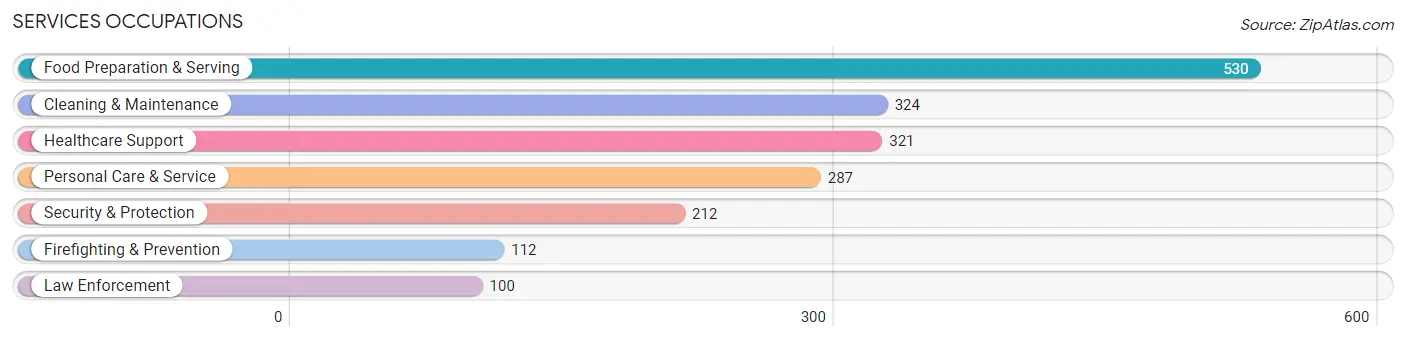
Services Occupations
The most common Services occupations in Hope Mills are Food Preparation & Serving (530 | 7.3%), Cleaning & Maintenance (324 | 4.5%), Healthcare Support (321 | 4.4%), Personal Care & Service (287 | 4.0%), and Security & Protection (212 | 2.9%).
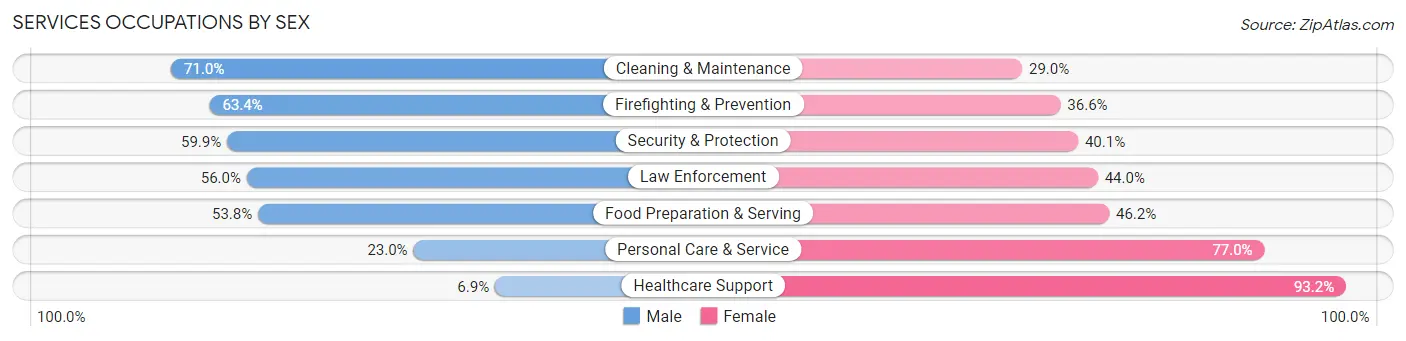
Services Occupations by Sex
Within the Services occupations in Hope Mills, the most male-oriented occupations are Cleaning & Maintenance (71.0%), Firefighting & Prevention (63.4%), and Security & Protection (59.9%), while the most female-oriented occupations are Healthcare Support (93.1%), Personal Care & Service (77.0%), and Food Preparation & Serving (46.2%).
| Occupation | Male | Female |
| Healthcare Support | 22 (6.9%) | 299 (93.1%) |
| Security & Protection | 127 (59.9%) | 85 (40.1%) |
| Firefighting & Prevention | 71 (63.4%) | 41 (36.6%) |
| Law Enforcement | 56 (56.0%) | 44 (44.0%) |
| Food Preparation & Serving | 285 (53.8%) | 245 (46.2%) |
| Cleaning & Maintenance | 230 (71.0%) | 94 (29.0%) |
| Personal Care & Service | 66 (23.0%) | 221 (77.0%) |
| Total (Category) | 730 (43.6%) | 944 (56.4%) |
| Total (Overall) | 3,390 (46.7%) | 3,866 (53.3%) |
Sales and Office Occupations
The most common Sales and Office occupations in Hope Mills are Office & Administration (943 | 13.0%), and Sales & Related (693 | 9.6%).

Sales and Office Occupations by Sex

| Occupation | Male | Female |
| Sales & Related | 246 (35.5%) | 447 (64.5%) |
| Office & Administration | 187 (19.8%) | 756 (80.2%) |
| Total (Category) | 433 (26.5%) | 1,203 (73.5%) |
| Total (Overall) | 3,390 (46.7%) | 3,866 (53.3%) |
Natural Resources, Construction and Maintenance Occupations
The most common Natural Resources, Construction and Maintenance occupations in Hope Mills are Construction & Extraction (262 | 3.6%), and Installation, Maintenance & Repair (257 | 3.5%).
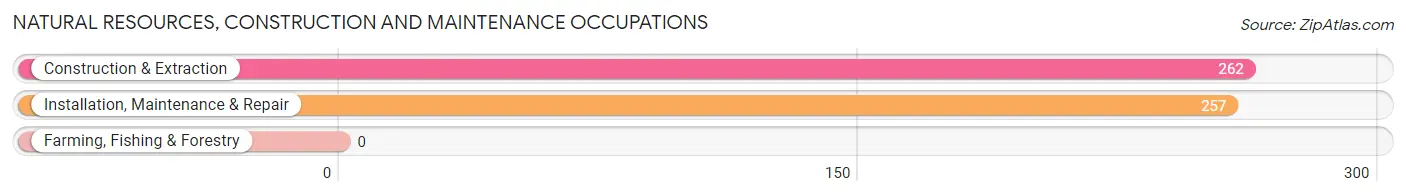
Natural Resources, Construction and Maintenance Occupations by Sex
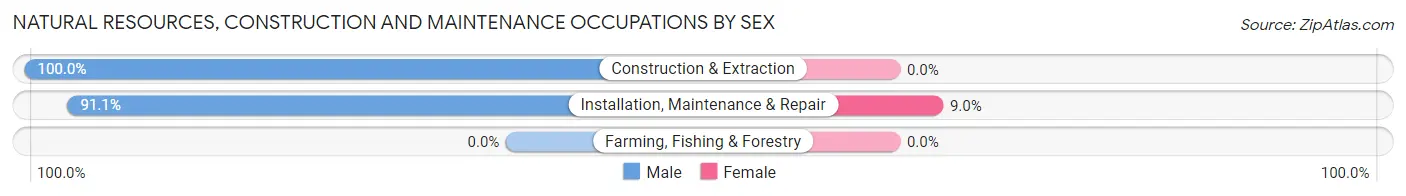
| Occupation | Male | Female |
| Farming, Fishing & Forestry | 0 (0.0%) | 0 (0.0%) |
| Construction & Extraction | 262 (100.0%) | 0 (0.0%) |
| Installation, Maintenance & Repair | 234 (91.0%) | 23 (8.9%) |
| Total (Category) | 496 (95.6%) | 23 (4.4%) |
| Total (Overall) | 3,390 (46.7%) | 3,866 (53.3%) |
Production, Transportation and Moving Occupations
The most common Production, Transportation and Moving occupations in Hope Mills are Material Moving (417 | 5.8%), Production (330 | 4.5%), and Transportation (322 | 4.4%).
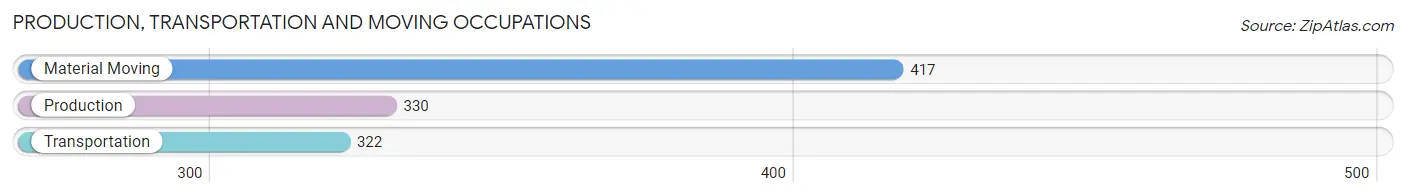
Production, Transportation and Moving Occupations by Sex
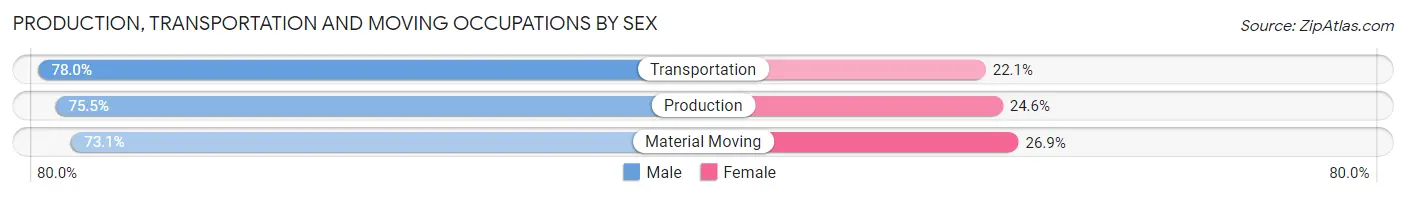
| Occupation | Male | Female |
| Production | 249 (75.4%) | 81 (24.5%) |
| Transportation | 251 (77.9%) | 71 (22.1%) |
| Material Moving | 305 (73.1%) | 112 (26.9%) |
| Total (Category) | 805 (75.3%) | 264 (24.7%) |
| Total (Overall) | 3,390 (46.7%) | 3,866 (53.3%) |
Employment Industries by Sex in Hope Mills
Employment Industries in Hope Mills
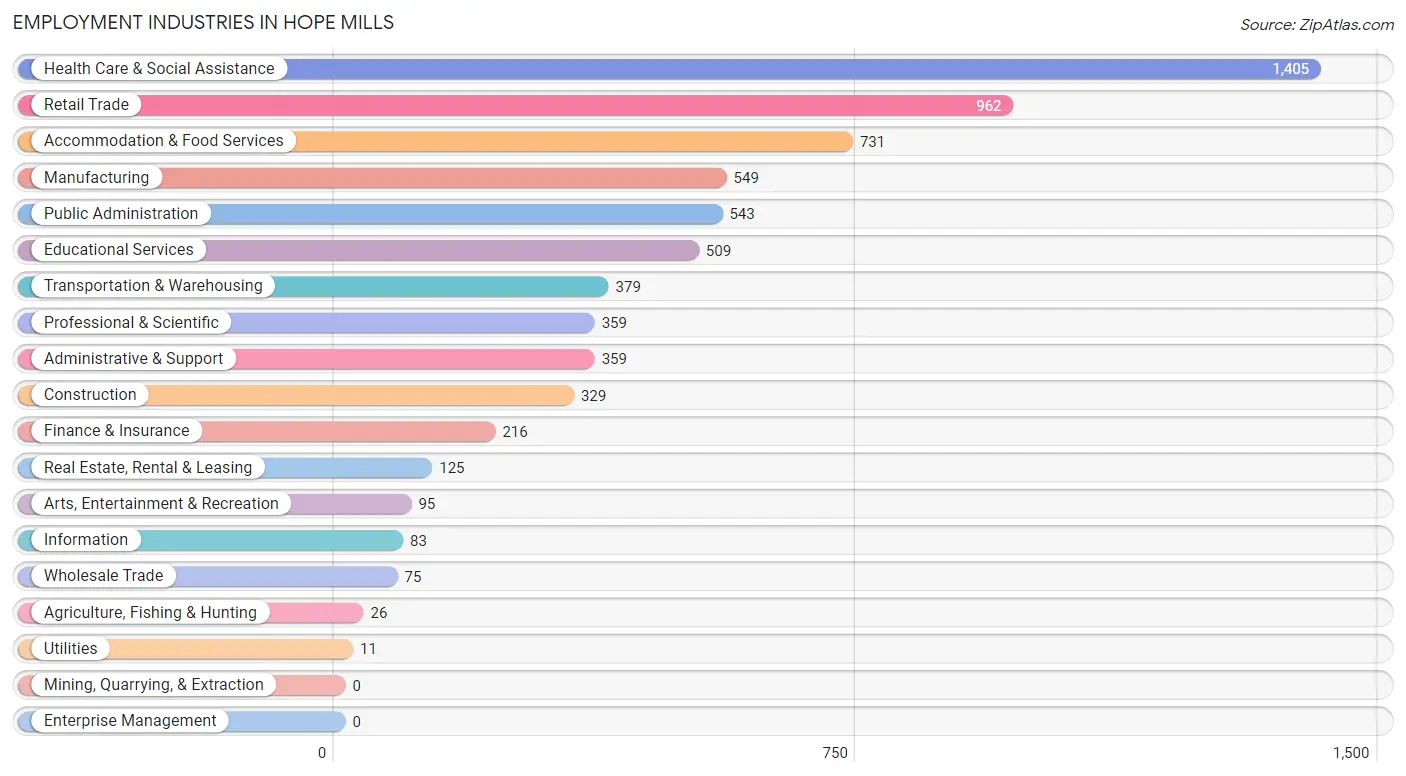
The major employment industries in Hope Mills include Health Care & Social Assistance (1,405 | 19.4%), Retail Trade (962 | 13.3%), Accommodation & Food Services (731 | 10.1%), Manufacturing (549 | 7.6%), and Public Administration (543 | 7.5%).
Employment Industries by Sex in Hope Mills
The Hope Mills industries that see more men than women are Agriculture, Fishing & Hunting (100.0%), Utilities (100.0%), and Construction (96.4%), whereas the industries that tend to have a higher number of women are Health Care & Social Assistance (86.1%), Finance & Insurance (64.8%), and Professional & Scientific (55.1%).
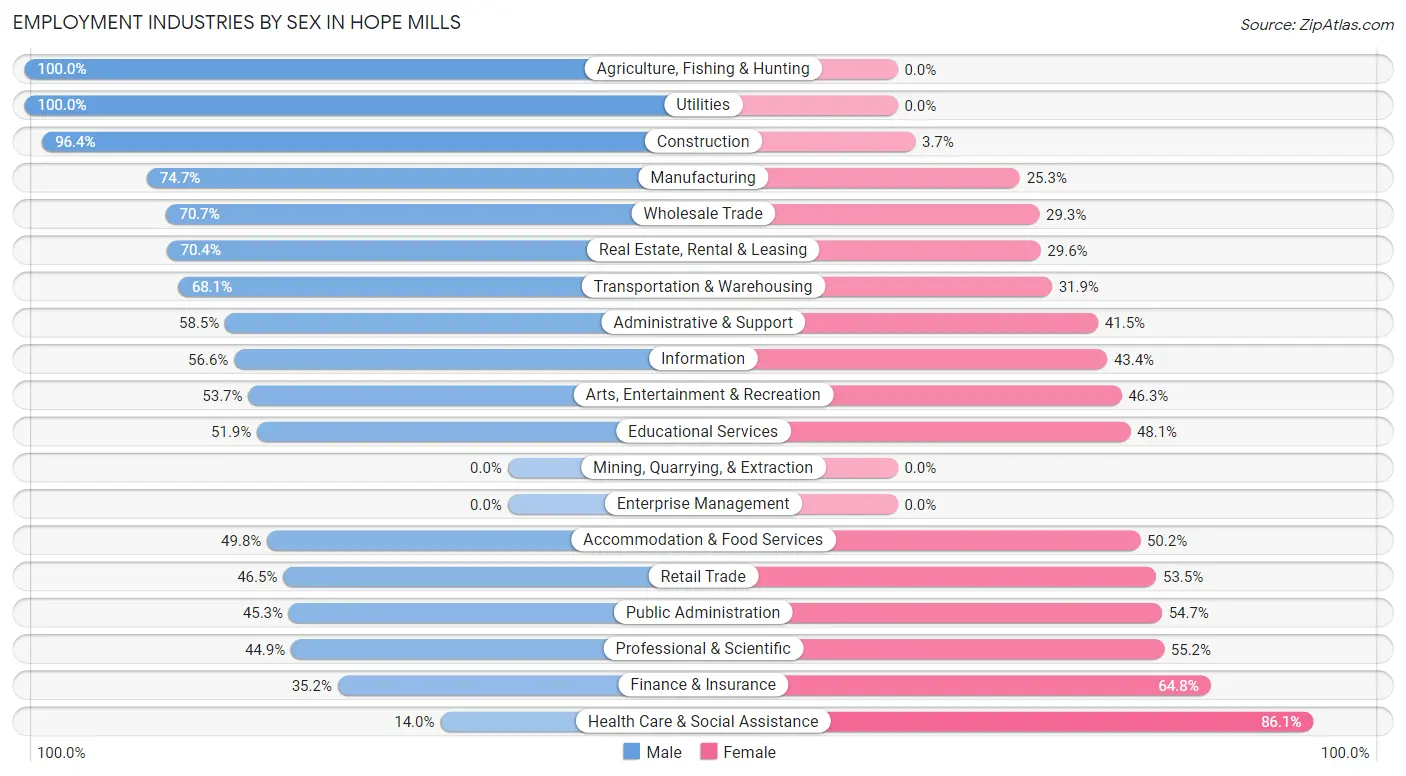
| Industry | Male | Female |
| Agriculture, Fishing & Hunting | 26 (100.0%) | 0 (0.0%) |
| Mining, Quarrying, & Extraction | 0 (0.0%) | 0 (0.0%) |
| Construction | 317 (96.4%) | 12 (3.6%) |
| Manufacturing | 410 (74.7%) | 139 (25.3%) |
| Wholesale Trade | 53 (70.7%) | 22 (29.3%) |
| Retail Trade | 447 (46.5%) | 515 (53.5%) |
| Transportation & Warehousing | 258 (68.1%) | 121 (31.9%) |
| Utilities | 11 (100.0%) | 0 (0.0%) |
| Information | 47 (56.6%) | 36 (43.4%) |
| Finance & Insurance | 76 (35.2%) | 140 (64.8%) |
| Real Estate, Rental & Leasing | 88 (70.4%) | 37 (29.6%) |
| Professional & Scientific | 161 (44.9%) | 198 (55.1%) |
| Enterprise Management | 0 (0.0%) | 0 (0.0%) |
| Administrative & Support | 210 (58.5%) | 149 (41.5%) |
| Educational Services | 264 (51.9%) | 245 (48.1%) |
| Health Care & Social Assistance | 196 (14.0%) | 1,209 (86.1%) |
| Arts, Entertainment & Recreation | 51 (53.7%) | 44 (46.3%) |
| Accommodation & Food Services | 364 (49.8%) | 367 (50.2%) |
| Public Administration | 246 (45.3%) | 297 (54.7%) |
| Total | 3,390 (46.7%) | 3,866 (53.3%) |
Education in Hope Mills
School Enrollment in Hope Mills
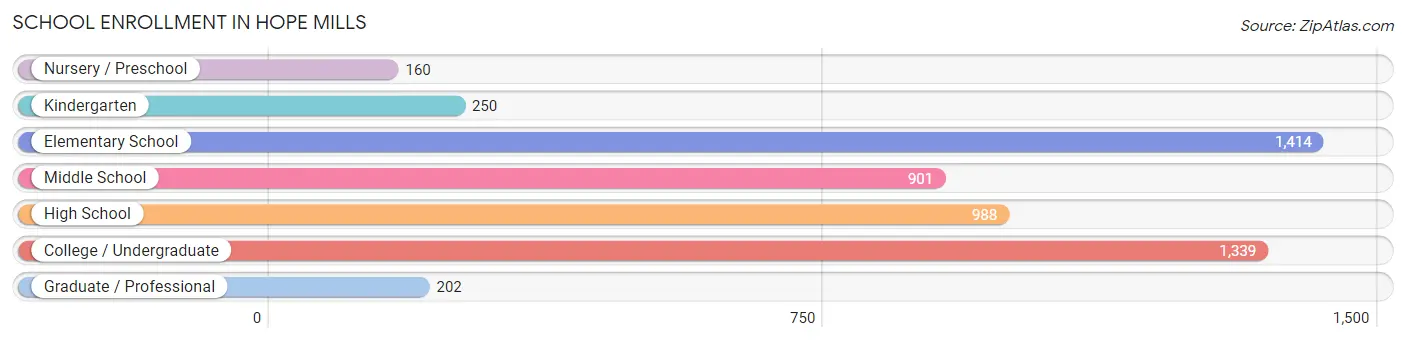
The most common levels of schooling among the 5,254 students in Hope Mills are elementary school (1,414 | 26.9%), college / undergraduate (1,339 | 25.5%), and high school (988 | 18.8%).
| School Level | # Students | % Students |
| Nursery / Preschool | 160 | 3.0% |
| Kindergarten | 250 | 4.8% |
| Elementary School | 1,414 | 26.9% |
| Middle School | 901 | 17.2% |
| High School | 988 | 18.8% |
| College / Undergraduate | 1,339 | 25.5% |
| Graduate / Professional | 202 | 3.8% |
| Total | 5,254 | 100.0% |
School Enrollment by Age by Funding Source in Hope Mills
Out of a total of 5,254 students who are enrolled in schools in Hope Mills, 1,014 (19.3%) attend a private institution, while the remaining 4,240 (80.7%) are enrolled in public schools. The age group of 25 to 34 year olds has the highest likelihood of being enrolled in private schools, with 189 (36.7% in the age bracket) enrolled. Conversely, the age group of 18 to 19 year olds has the lowest likelihood of being enrolled in a private school, with 275 (89.0% in the age bracket) attending a public institution.
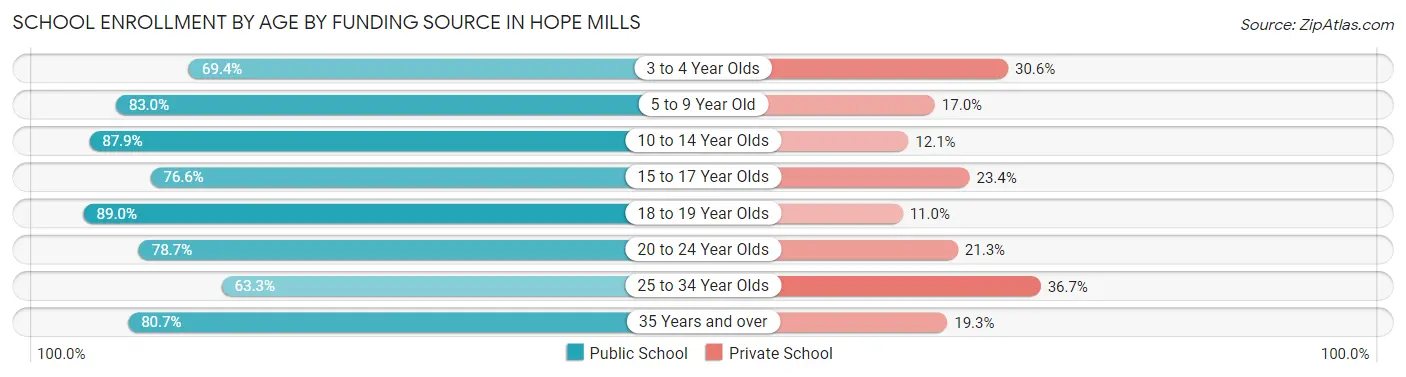
| Age Bracket | Public School | Private School |
| 3 to 4 Year Olds | 68 (69.4%) | 30 (30.6%) |
| 5 to 9 Year Old | 1,300 (83.0%) | 266 (17.0%) |
| 10 to 14 Year Olds | 977 (87.9%) | 134 (12.1%) |
| 15 to 17 Year Olds | 624 (76.6%) | 191 (23.4%) |
| 18 to 19 Year Olds | 275 (89.0%) | 34 (11.0%) |
| 20 to 24 Year Olds | 233 (78.7%) | 63 (21.3%) |
| 25 to 34 Year Olds | 326 (63.3%) | 189 (36.7%) |
| 35 Years and over | 439 (80.7%) | 105 (19.3%) |
| Total | 4,240 (80.7%) | 1,014 (19.3%) |
Educational Attainment by Field of Study in Hope Mills
Business (600 | 22.5%), education (411 | 15.4%), arts & humanities (364 | 13.7%), science & technology (304 | 11.4%), and social sciences (167 | 6.3%) are the most common fields of study among 2,667 individuals in Hope Mills who have obtained a bachelor's degree or higher.
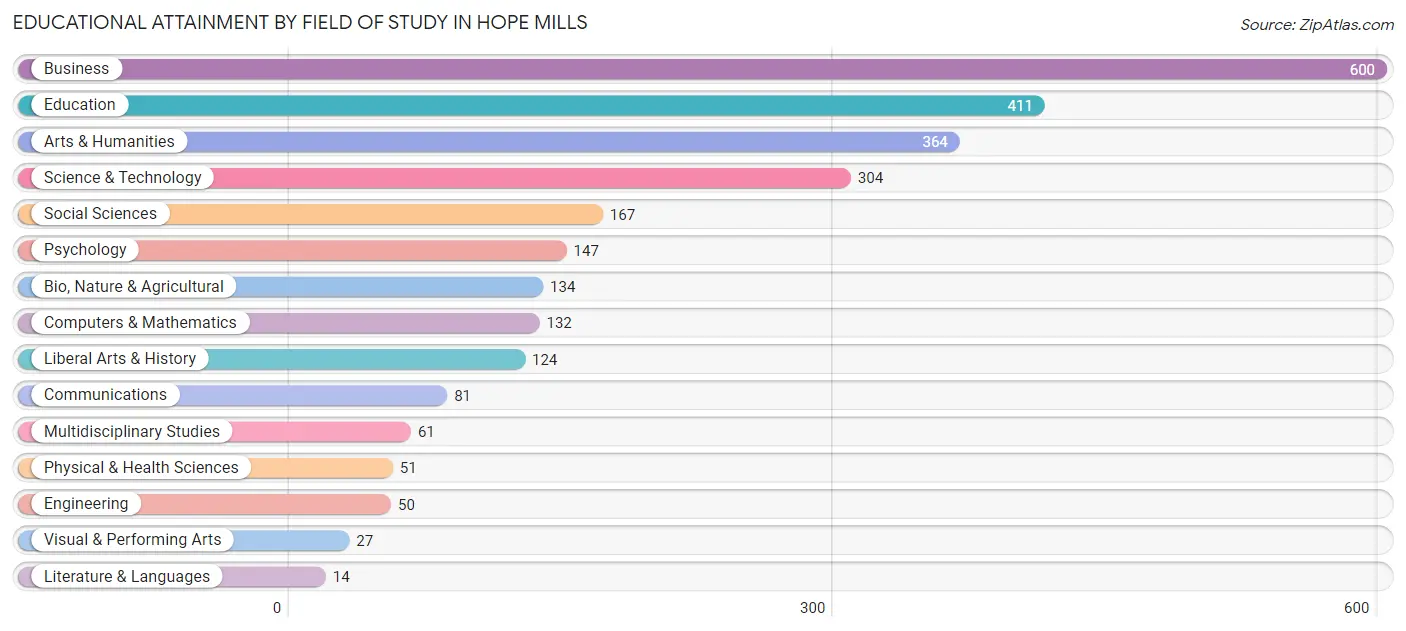
| Field of Study | # Graduates | % Graduates |
| Computers & Mathematics | 132 | 5.0% |
| Bio, Nature & Agricultural | 134 | 5.0% |
| Physical & Health Sciences | 51 | 1.9% |
| Psychology | 147 | 5.5% |
| Social Sciences | 167 | 6.3% |
| Engineering | 50 | 1.9% |
| Multidisciplinary Studies | 61 | 2.3% |
| Science & Technology | 304 | 11.4% |
| Business | 600 | 22.5% |
| Education | 411 | 15.4% |
| Literature & Languages | 14 | 0.5% |
| Liberal Arts & History | 124 | 4.6% |
| Visual & Performing Arts | 27 | 1.0% |
| Communications | 81 | 3.0% |
| Arts & Humanities | 364 | 13.7% |
| Total | 2,667 | 100.0% |
Transportation & Commute in Hope Mills
Vehicle Availability by Sex in Hope Mills
The most prevalent vehicle ownership categories in Hope Mills are males with 2 vehicles (1,563, accounting for 42.7%) and females with 2 vehicles (1,566, making up 41.0%).
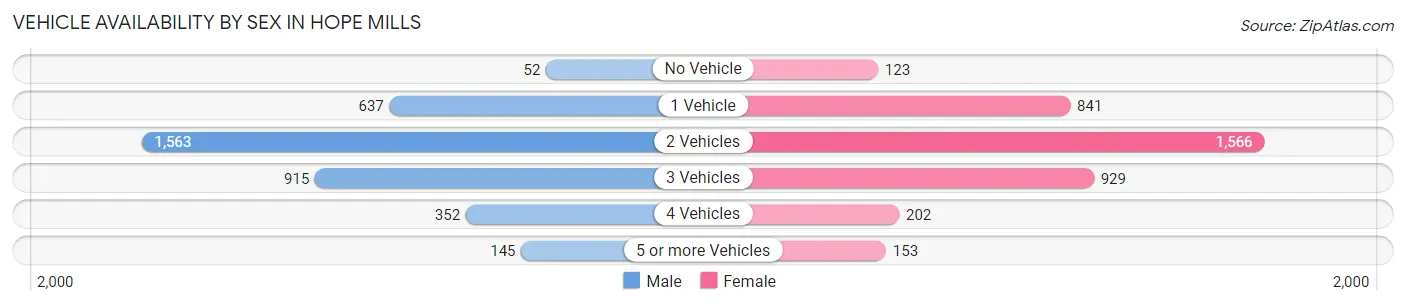
| Vehicles Available | Male | Female |
| No Vehicle | 52 (1.4%) | 123 (3.2%) |
| 1 Vehicle | 637 (17.4%) | 841 (22.1%) |
| 2 Vehicles | 1,563 (42.7%) | 1,566 (41.1%) |
| 3 Vehicles | 915 (25.0%) | 929 (24.4%) |
| 4 Vehicles | 352 (9.6%) | 202 (5.3%) |
| 5 or more Vehicles | 145 (4.0%) | 153 (4.0%) |
| Total | 3,664 (100.0%) | 3,814 (100.0%) |
Commute Time in Hope Mills
The most frequently occuring commute durations in Hope Mills are 15 to 19 minutes (1,465 commuters, 20.6%), 20 to 24 minutes (1,365 commuters, 19.2%), and 30 to 34 minutes (1,060 commuters, 14.9%).
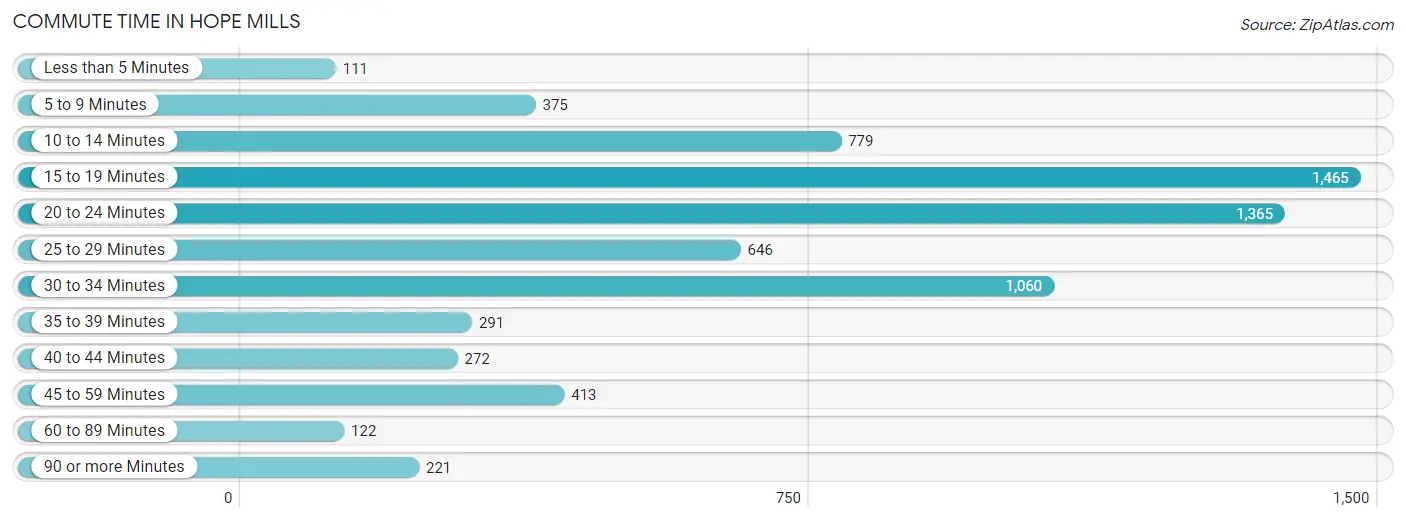
| Commute Time | # Commuters | % Commuters |
| Less than 5 Minutes | 111 | 1.6% |
| 5 to 9 Minutes | 375 | 5.3% |
| 10 to 14 Minutes | 779 | 10.9% |
| 15 to 19 Minutes | 1,465 | 20.6% |
| 20 to 24 Minutes | 1,365 | 19.2% |
| 25 to 29 Minutes | 646 | 9.1% |
| 30 to 34 Minutes | 1,060 | 14.9% |
| 35 to 39 Minutes | 291 | 4.1% |
| 40 to 44 Minutes | 272 | 3.8% |
| 45 to 59 Minutes | 413 | 5.8% |
| 60 to 89 Minutes | 122 | 1.7% |
| 90 or more Minutes | 221 | 3.1% |
Commute Time by Sex in Hope Mills
The most common commute times in Hope Mills are 15 to 19 minutes (748 commuters, 21.7%) for males and 20 to 24 minutes (920 commuters, 25.1%) for females.
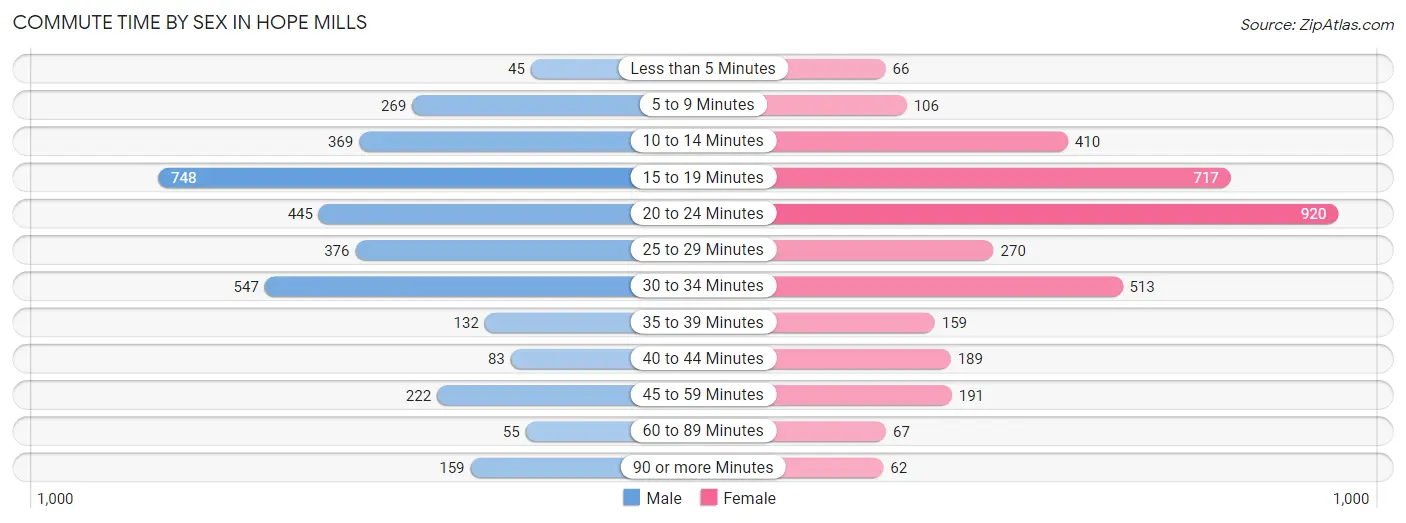
| Commute Time | Male | Female |
| Less than 5 Minutes | 45 (1.3%) | 66 (1.8%) |
| 5 to 9 Minutes | 269 (7.8%) | 106 (2.9%) |
| 10 to 14 Minutes | 369 (10.7%) | 410 (11.2%) |
| 15 to 19 Minutes | 748 (21.7%) | 717 (19.5%) |
| 20 to 24 Minutes | 445 (12.9%) | 920 (25.1%) |
| 25 to 29 Minutes | 376 (10.9%) | 270 (7.4%) |
| 30 to 34 Minutes | 547 (15.9%) | 513 (14.0%) |
| 35 to 39 Minutes | 132 (3.8%) | 159 (4.3%) |
| 40 to 44 Minutes | 83 (2.4%) | 189 (5.1%) |
| 45 to 59 Minutes | 222 (6.4%) | 191 (5.2%) |
| 60 to 89 Minutes | 55 (1.6%) | 67 (1.8%) |
| 90 or more Minutes | 159 (4.6%) | 62 (1.7%) |
Time of Departure to Work by Sex in Hope Mills
The most frequent times of departure to work in Hope Mills are 7:00 AM to 7:29 AM (436, 12.6%) for males and 7:00 AM to 7:29 AM (656, 17.9%) for females.
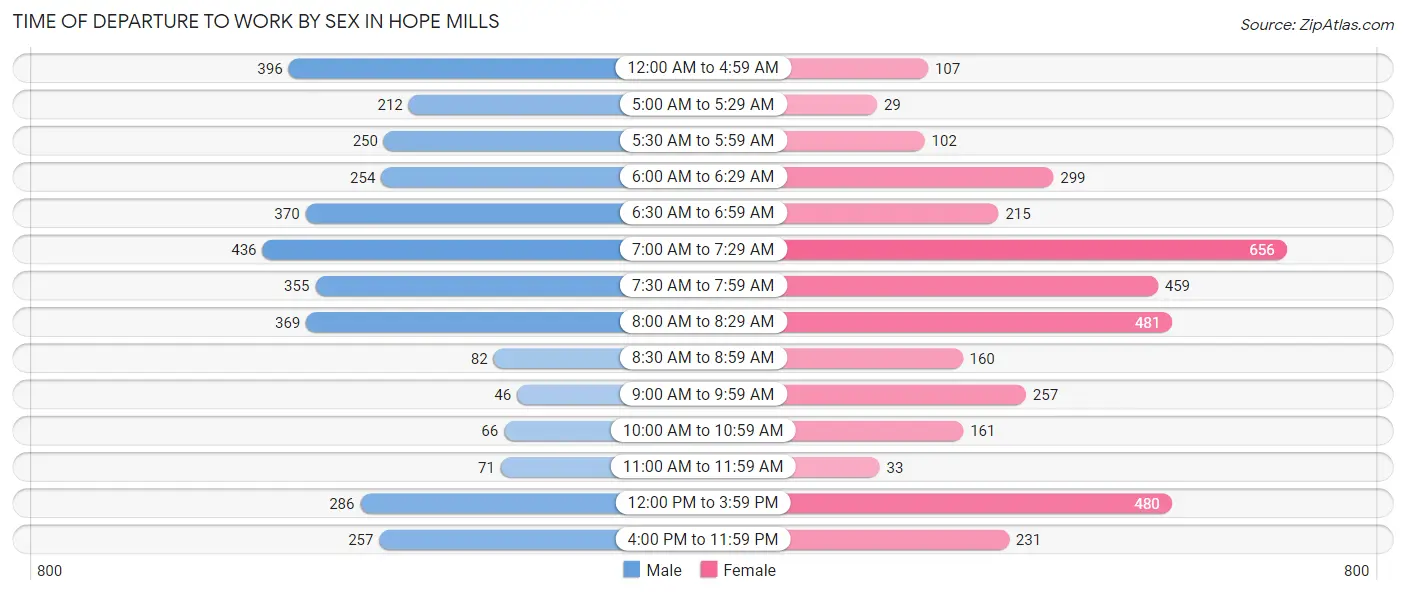
| Time of Departure | Male | Female |
| 12:00 AM to 4:59 AM | 396 (11.5%) | 107 (2.9%) |
| 5:00 AM to 5:29 AM | 212 (6.1%) | 29 (0.8%) |
| 5:30 AM to 5:59 AM | 250 (7.2%) | 102 (2.8%) |
| 6:00 AM to 6:29 AM | 254 (7.4%) | 299 (8.2%) |
| 6:30 AM to 6:59 AM | 370 (10.7%) | 215 (5.9%) |
| 7:00 AM to 7:29 AM | 436 (12.6%) | 656 (17.9%) |
| 7:30 AM to 7:59 AM | 355 (10.3%) | 459 (12.5%) |
| 8:00 AM to 8:29 AM | 369 (10.7%) | 481 (13.1%) |
| 8:30 AM to 8:59 AM | 82 (2.4%) | 160 (4.4%) |
| 9:00 AM to 9:59 AM | 46 (1.3%) | 257 (7.0%) |
| 10:00 AM to 10:59 AM | 66 (1.9%) | 161 (4.4%) |
| 11:00 AM to 11:59 AM | 71 (2.1%) | 33 (0.9%) |
| 12:00 PM to 3:59 PM | 286 (8.3%) | 480 (13.1%) |
| 4:00 PM to 11:59 PM | 257 (7.4%) | 231 (6.3%) |
| Total | 3,450 (100.0%) | 3,670 (100.0%) |
Housing Occupancy in Hope Mills
Occupancy by Ownership in Hope Mills
Of the total 6,235 dwellings in Hope Mills, owner-occupied units account for 3,927 (63.0%), while renter-occupied units make up 2,308 (37.0%).
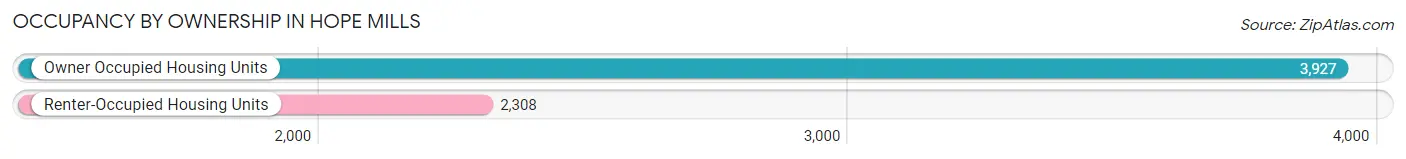
| Occupancy | # Housing Units | % Housing Units |
| Owner Occupied Housing Units | 3,927 | 63.0% |
| Renter-Occupied Housing Units | 2,308 | 37.0% |
| Total Occupied Housing Units | 6,235 | 100.0% |
Occupancy by Household Size in Hope Mills
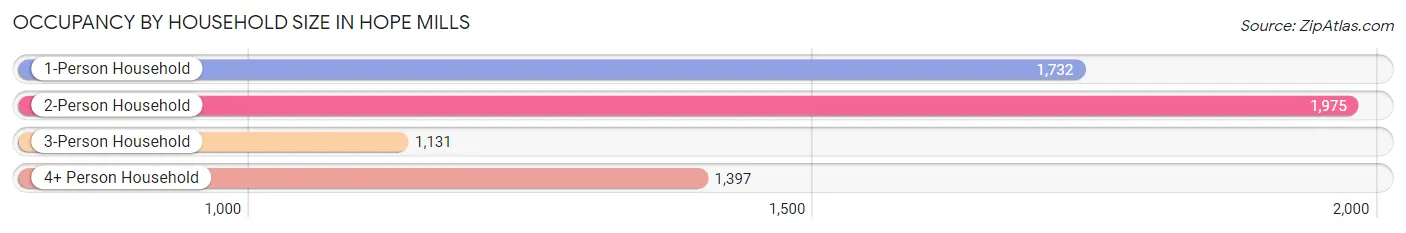
| Household Size | # Housing Units | % Housing Units |
| 1-Person Household | 1,732 | 27.8% |
| 2-Person Household | 1,975 | 31.7% |
| 3-Person Household | 1,131 | 18.1% |
| 4+ Person Household | 1,397 | 22.4% |
| Total Housing Units | 6,235 | 100.0% |
Occupancy by Ownership by Household Size in Hope Mills
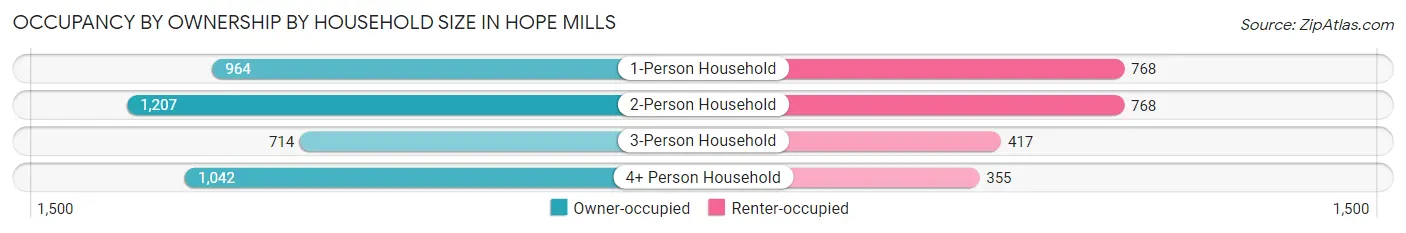
| Household Size | Owner-occupied | Renter-occupied |
| 1-Person Household | 964 (55.7%) | 768 (44.3%) |
| 2-Person Household | 1,207 (61.1%) | 768 (38.9%) |
| 3-Person Household | 714 (63.1%) | 417 (36.9%) |
| 4+ Person Household | 1,042 (74.6%) | 355 (25.4%) |
| Total Housing Units | 3,927 (63.0%) | 2,308 (37.0%) |
Occupancy by Educational Attainment in Hope Mills
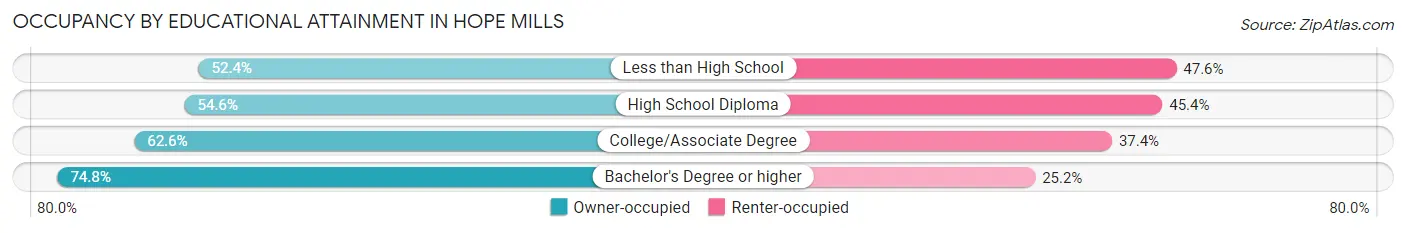
| Household Size | Owner-occupied | Renter-occupied |
| Less than High School | 230 (52.4%) | 209 (47.6%) |
| High School Diploma | 774 (54.6%) | 643 (45.4%) |
| College/Associate Degree | 1,808 (62.6%) | 1,080 (37.4%) |
| Bachelor's Degree or higher | 1,115 (74.8%) | 376 (25.2%) |
Occupancy by Age of Householder in Hope Mills
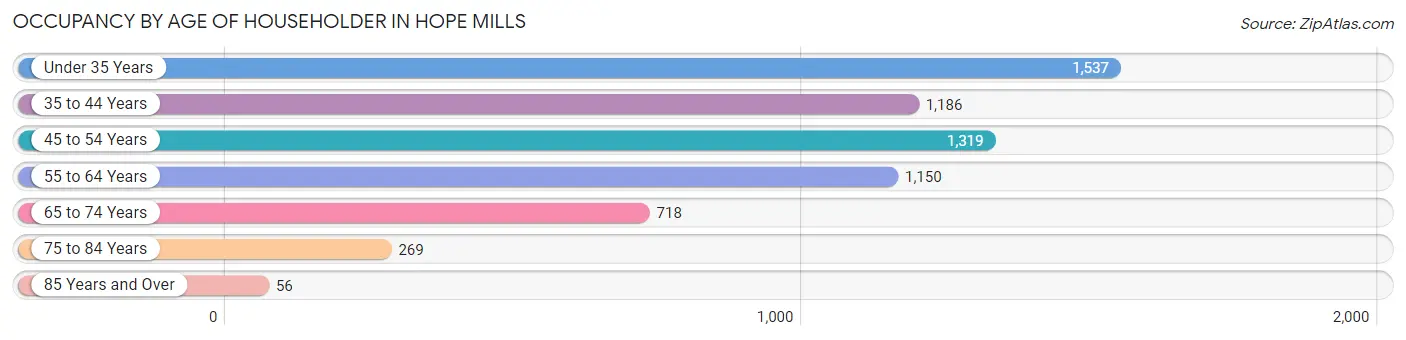
| Age Bracket | # Households | % Households |
| Under 35 Years | 1,537 | 24.6% |
| 35 to 44 Years | 1,186 | 19.0% |
| 45 to 54 Years | 1,319 | 21.1% |
| 55 to 64 Years | 1,150 | 18.4% |
| 65 to 74 Years | 718 | 11.5% |
| 75 to 84 Years | 269 | 4.3% |
| 85 Years and Over | 56 | 0.9% |
| Total | 6,235 | 100.0% |
Housing Finances in Hope Mills
Median Income by Occupancy in Hope Mills
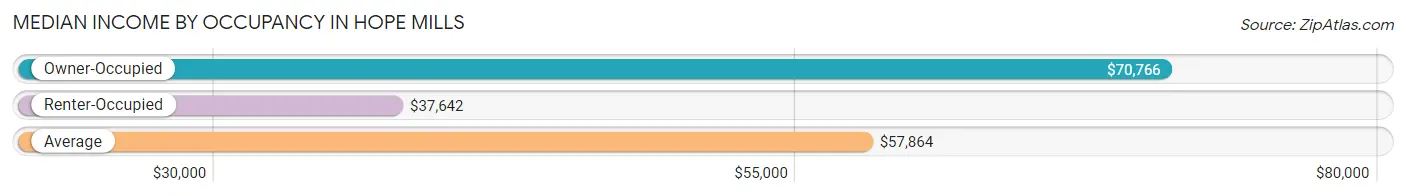
| Occupancy Type | # Households | Median Income |
| Owner-Occupied | 3,927 (63.0%) | $70,766 |
| Renter-Occupied | 2,308 (37.0%) | $37,642 |
| Average | 6,235 (100.0%) | $57,864 |
Occupancy by Householder Income Bracket in Hope Mills
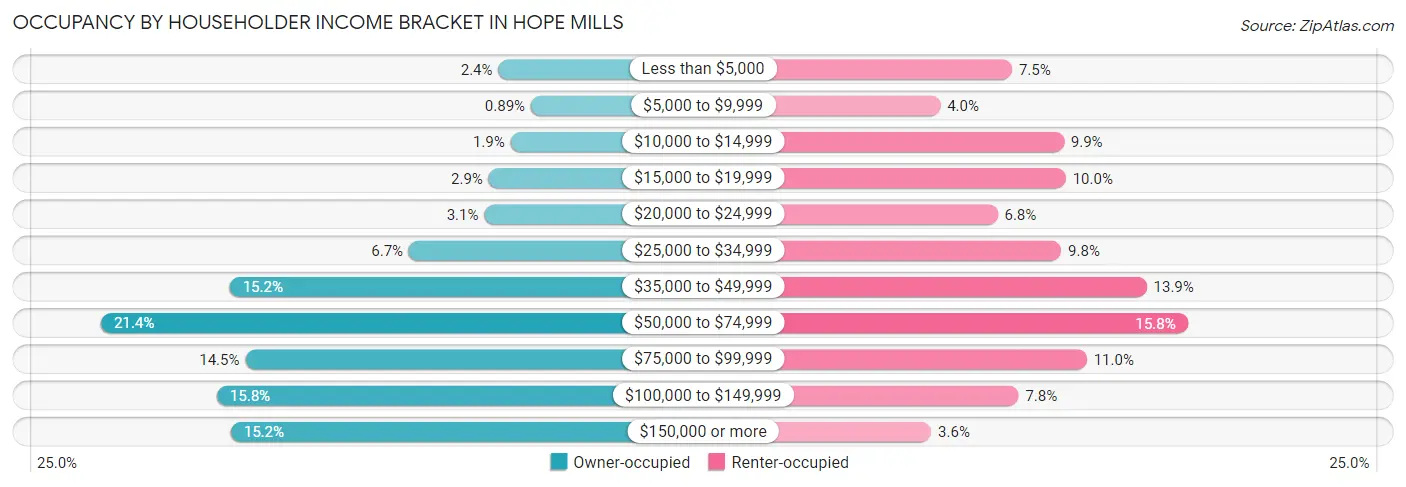
| Income Bracket | Owner-occupied | Renter-occupied |
| Less than $5,000 | 96 (2.4%) | 172 (7.4%) |
| $5,000 to $9,999 | 35 (0.9%) | 93 (4.0%) |
| $10,000 to $14,999 | 73 (1.9%) | 229 (9.9%) |
| $15,000 to $19,999 | 114 (2.9%) | 231 (10.0%) |
| $20,000 to $24,999 | 122 (3.1%) | 156 (6.8%) |
| $25,000 to $34,999 | 263 (6.7%) | 226 (9.8%) |
| $35,000 to $49,999 | 598 (15.2%) | 320 (13.9%) |
| $50,000 to $74,999 | 839 (21.4%) | 365 (15.8%) |
| $75,000 to $99,999 | 569 (14.5%) | 254 (11.0%) |
| $100,000 to $149,999 | 622 (15.8%) | 179 (7.8%) |
| $150,000 or more | 596 (15.2%) | 83 (3.6%) |
| Total | 3,927 (100.0%) | 2,308 (100.0%) |
Monthly Housing Cost Tiers in Hope Mills
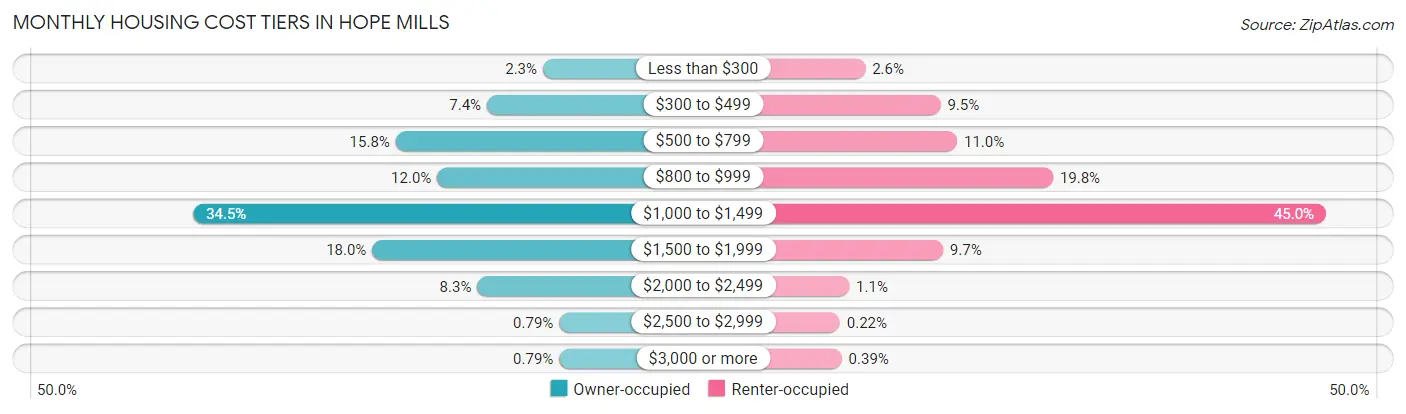
| Monthly Cost | Owner-occupied | Renter-occupied |
| Less than $300 | 90 (2.3%) | 59 (2.6%) |
| $300 to $499 | 292 (7.4%) | 219 (9.5%) |
| $500 to $799 | 622 (15.8%) | 254 (11.0%) |
| $800 to $999 | 472 (12.0%) | 458 (19.8%) |
| $1,000 to $1,499 | 1,355 (34.5%) | 1,038 (45.0%) |
| $1,500 to $1,999 | 707 (18.0%) | 224 (9.7%) |
| $2,000 to $2,499 | 327 (8.3%) | 25 (1.1%) |
| $2,500 to $2,999 | 31 (0.8%) | 5 (0.2%) |
| $3,000 or more | 31 (0.8%) | 9 (0.4%) |
| Total | 3,927 (100.0%) | 2,308 (100.0%) |
Physical Housing Characteristics in Hope Mills
Housing Structures in Hope Mills
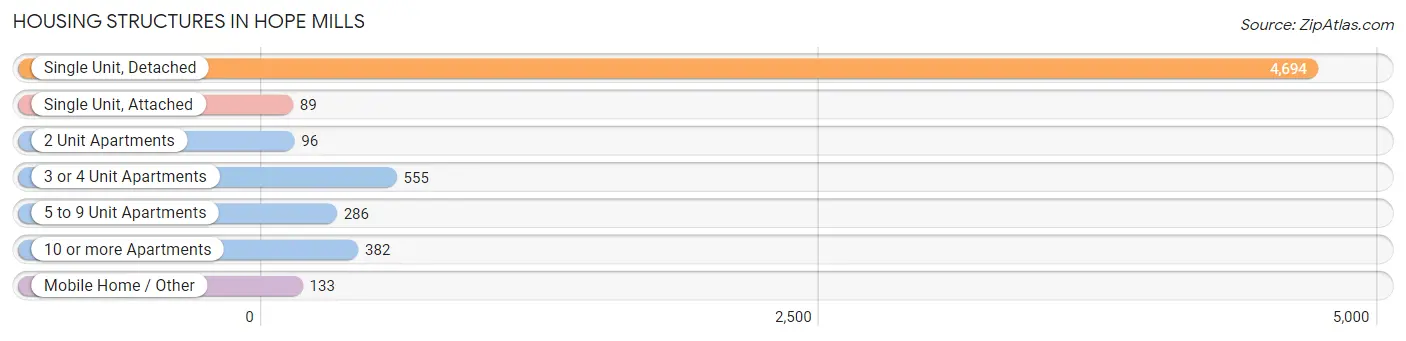
| Structure Type | # Housing Units | % Housing Units |
| Single Unit, Detached | 4,694 | 75.3% |
| Single Unit, Attached | 89 | 1.4% |
| 2 Unit Apartments | 96 | 1.5% |
| 3 or 4 Unit Apartments | 555 | 8.9% |
| 5 to 9 Unit Apartments | 286 | 4.6% |
| 10 or more Apartments | 382 | 6.1% |
| Mobile Home / Other | 133 | 2.1% |
| Total | 6,235 | 100.0% |
Housing Structures by Occupancy in Hope Mills
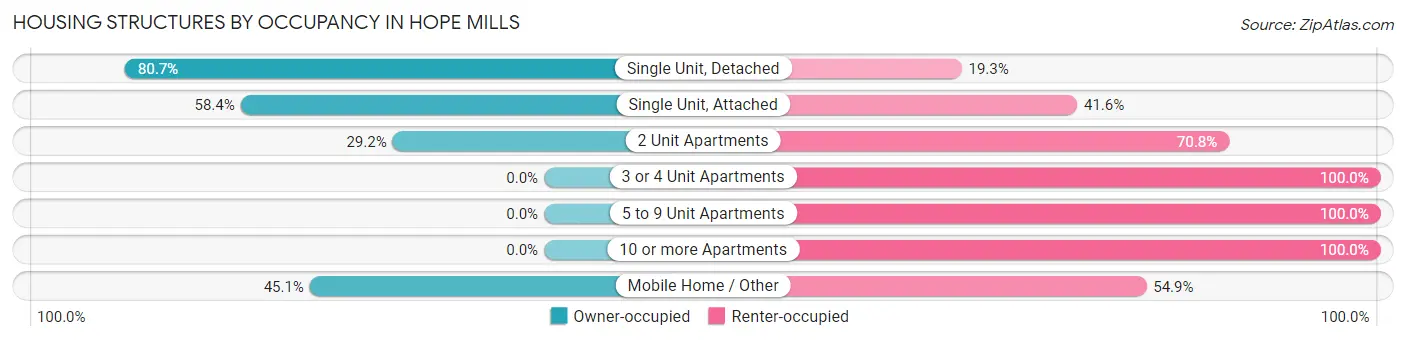
| Structure Type | Owner-occupied | Renter-occupied |
| Single Unit, Detached | 3,787 (80.7%) | 907 (19.3%) |
| Single Unit, Attached | 52 (58.4%) | 37 (41.6%) |
| 2 Unit Apartments | 28 (29.2%) | 68 (70.8%) |
| 3 or 4 Unit Apartments | 0 (0.0%) | 555 (100.0%) |
| 5 to 9 Unit Apartments | 0 (0.0%) | 286 (100.0%) |
| 10 or more Apartments | 0 (0.0%) | 382 (100.0%) |
| Mobile Home / Other | 60 (45.1%) | 73 (54.9%) |
| Total | 3,927 (63.0%) | 2,308 (37.0%) |
Housing Structures by Number of Rooms in Hope Mills
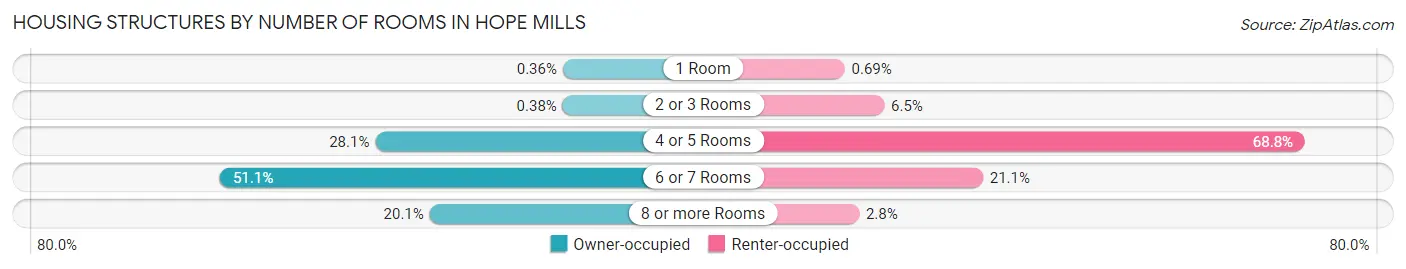
| Number of Rooms | Owner-occupied | Renter-occupied |
| 1 Room | 14 (0.4%) | 16 (0.7%) |
| 2 or 3 Rooms | 15 (0.4%) | 151 (6.5%) |
| 4 or 5 Rooms | 1,104 (28.1%) | 1,588 (68.8%) |
| 6 or 7 Rooms | 2,006 (51.1%) | 488 (21.1%) |
| 8 or more Rooms | 788 (20.1%) | 65 (2.8%) |
| Total | 3,927 (100.0%) | 2,308 (100.0%) |
Housing Structure by Heating Type in Hope Mills
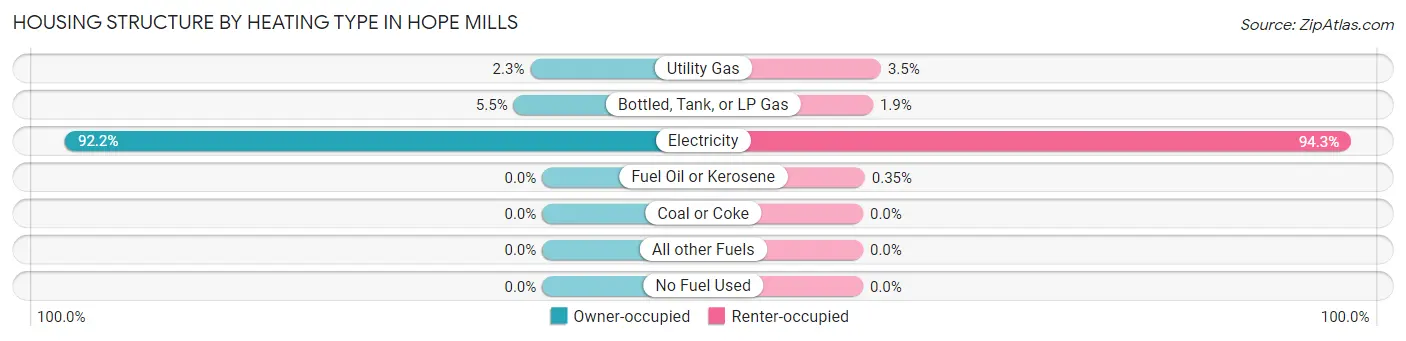
| Heating Type | Owner-occupied | Renter-occupied |
| Utility Gas | 90 (2.3%) | 80 (3.5%) |
| Bottled, Tank, or LP Gas | 217 (5.5%) | 44 (1.9%) |
| Electricity | 3,620 (92.2%) | 2,176 (94.3%) |
| Fuel Oil or Kerosene | 0 (0.0%) | 8 (0.4%) |
| Coal or Coke | 0 (0.0%) | 0 (0.0%) |
| All other Fuels | 0 (0.0%) | 0 (0.0%) |
| No Fuel Used | 0 (0.0%) | 0 (0.0%) |
| Total | 3,927 (100.0%) | 2,308 (100.0%) |
Household Vehicle Usage in Hope Mills
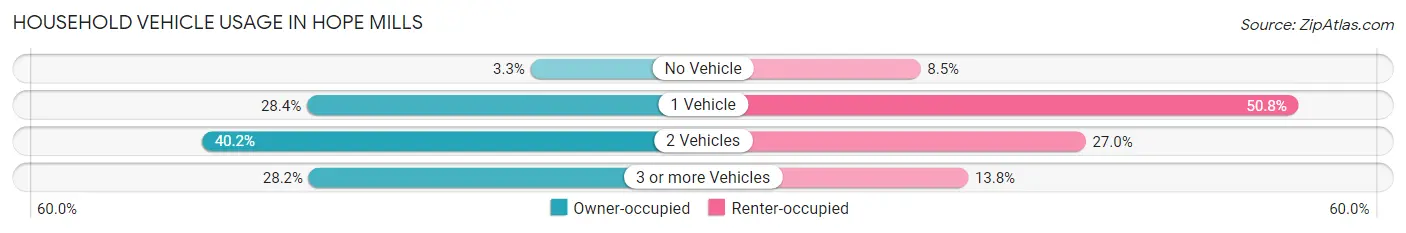
| Vehicles per Household | Owner-occupied | Renter-occupied |
| No Vehicle | 130 (3.3%) | 195 (8.5%) |
| 1 Vehicle | 1,114 (28.4%) | 1,173 (50.8%) |
| 2 Vehicles | 1,577 (40.2%) | 622 (27.0%) |
| 3 or more Vehicles | 1,106 (28.2%) | 318 (13.8%) |
| Total | 3,927 (100.0%) | 2,308 (100.0%) |
Real Estate & Mortgages in Hope Mills
Real Estate and Mortgage Overview in Hope Mills
| Characteristic | Without Mortgage | With Mortgage |
| Housing Units | 845 | 3,082 |
| Median Property Value | $143,500 | $168,000 |
| Median Household Income | $63,942 | $471 |
| Monthly Housing Costs | $532 | $31 |
| Real Estate Taxes | $1,768 | $46 |
Property Value by Mortgage Status in Hope Mills
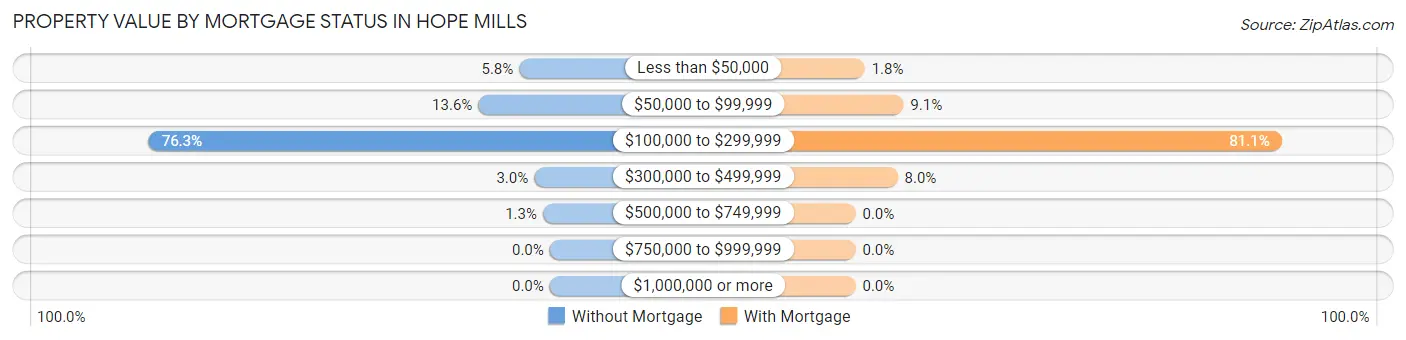
| Property Value | Without Mortgage | With Mortgage |
| Less than $50,000 | 49 (5.8%) | 54 (1.8%) |
| $50,000 to $99,999 | 115 (13.6%) | 281 (9.1%) |
| $100,000 to $299,999 | 645 (76.3%) | 2,500 (81.1%) |
| $300,000 to $499,999 | 25 (3.0%) | 247 (8.0%) |
| $500,000 to $749,999 | 11 (1.3%) | 0 (0.0%) |
| $750,000 to $999,999 | 0 (0.0%) | 0 (0.0%) |
| $1,000,000 or more | 0 (0.0%) | 0 (0.0%) |
| Total | 845 (100.0%) | 3,082 (100.0%) |
Household Income by Mortgage Status in Hope Mills
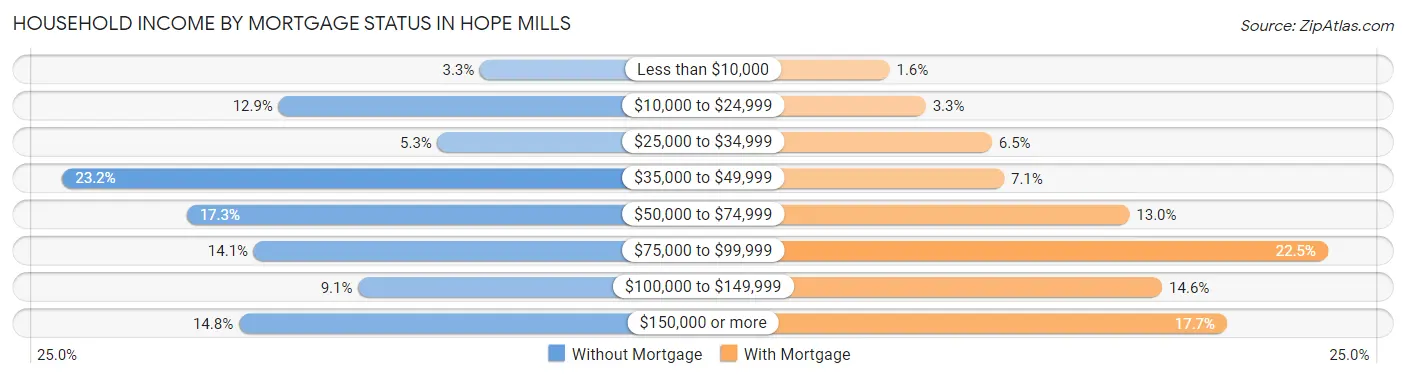
| Household Income | Without Mortgage | With Mortgage |
| Less than $10,000 | 28 (3.3%) | 50 (1.6%) |
| $10,000 to $24,999 | 109 (12.9%) | 103 (3.3%) |
| $25,000 to $34,999 | 45 (5.3%) | 200 (6.5%) |
| $35,000 to $49,999 | 196 (23.2%) | 218 (7.1%) |
| $50,000 to $74,999 | 146 (17.3%) | 402 (13.0%) |
| $75,000 to $99,999 | 119 (14.1%) | 693 (22.5%) |
| $100,000 to $149,999 | 77 (9.1%) | 450 (14.6%) |
| $150,000 or more | 125 (14.8%) | 545 (17.7%) |
| Total | 845 (100.0%) | 3,082 (100.0%) |
Property Value to Household Income Ratio in Hope Mills
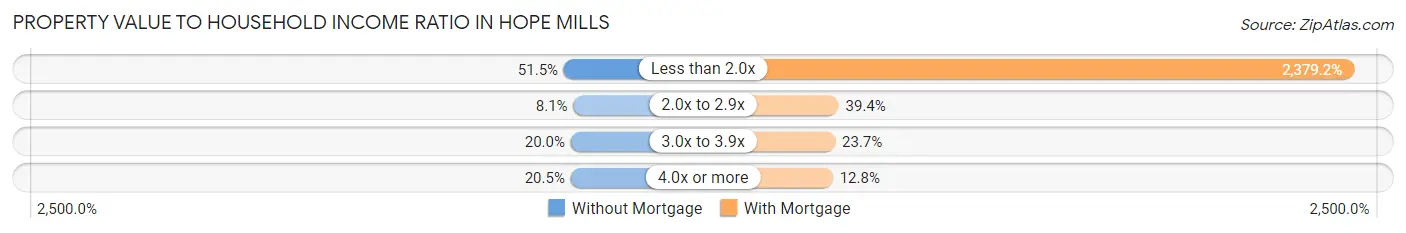
| Value-to-Income Ratio | Without Mortgage | With Mortgage |
| Less than 2.0x | 435 (51.5%) | 73,326 (2,379.2%) |
| 2.0x to 2.9x | 68 (8.1%) | 1,215 (39.4%) |
| 3.0x to 3.9x | 169 (20.0%) | 729 (23.6%) |
| 4.0x or more | 173 (20.5%) | 393 (12.8%) |
| Total | 845 (100.0%) | 3,082 (100.0%) |
Real Estate Taxes by Mortgage Status in Hope Mills
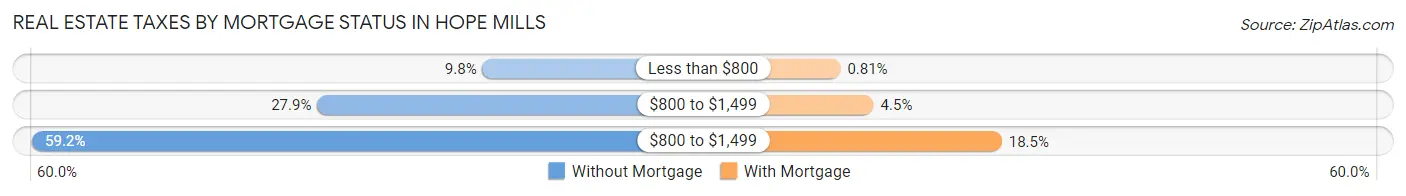
| Property Taxes | Without Mortgage | With Mortgage |
| Less than $800 | 83 (9.8%) | 25 (0.8%) |
| $800 to $1,499 | 236 (27.9%) | 137 (4.4%) |
| $800 to $1,499 | 500 (59.2%) | 570 (18.5%) |
| Total | 845 (100.0%) | 3,082 (100.0%) |
Health & Disability in Hope Mills
Health Insurance Coverage by Age in Hope Mills
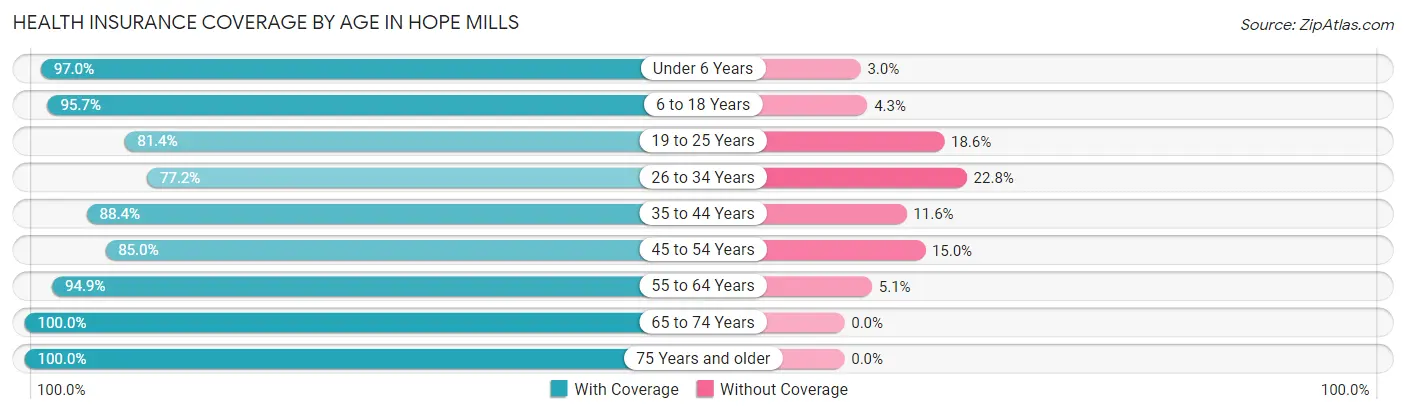
| Age Bracket | With Coverage | Without Coverage |
| Under 6 Years | 1,604 (97.0%) | 50 (3.0%) |
| 6 to 18 Years | 3,382 (95.7%) | 151 (4.3%) |
| 19 to 25 Years | 1,409 (81.4%) | 322 (18.6%) |
| 26 to 34 Years | 1,826 (77.2%) | 540 (22.8%) |
| 35 to 44 Years | 1,870 (88.4%) | 245 (11.6%) |
| 45 to 54 Years | 1,898 (85.0%) | 336 (15.0%) |
| 55 to 64 Years | 1,662 (94.9%) | 90 (5.1%) |
| 65 to 74 Years | 1,062 (100.0%) | 0 (0.0%) |
| 75 Years and older | 665 (100.0%) | 0 (0.0%) |
| Total | 15,378 (89.9%) | 1,734 (10.1%) |
Health Insurance Coverage by Citizenship Status in Hope Mills
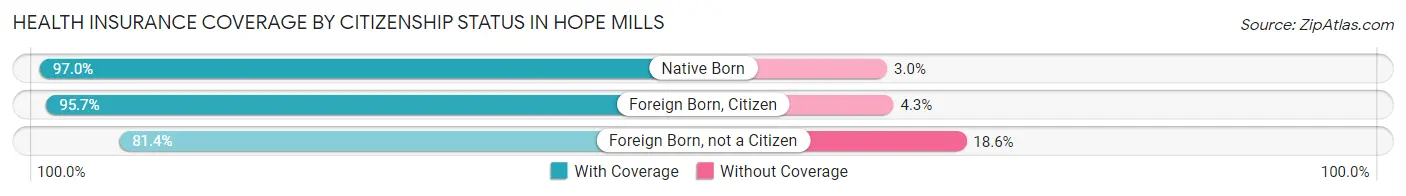
| Citizenship Status | With Coverage | Without Coverage |
| Native Born | 1,604 (97.0%) | 50 (3.0%) |
| Foreign Born, Citizen | 3,382 (95.7%) | 151 (4.3%) |
| Foreign Born, not a Citizen | 1,409 (81.4%) | 322 (18.6%) |
Health Insurance Coverage by Household Income in Hope Mills
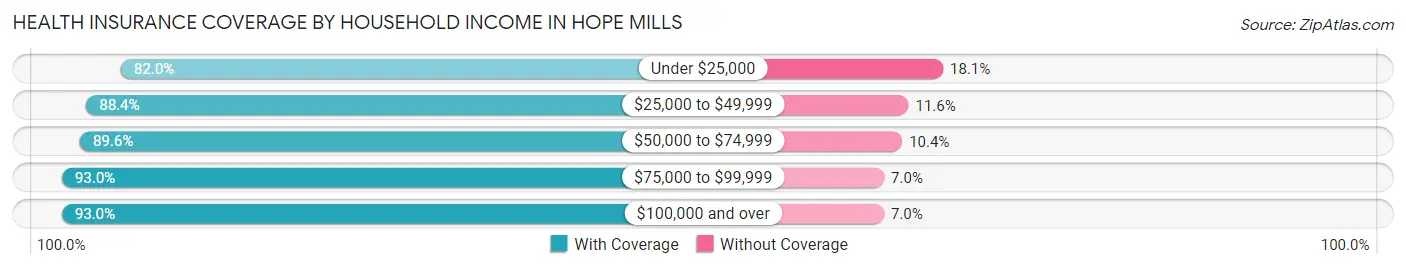
| Household Income | With Coverage | Without Coverage |
| Under $25,000 | 2,130 (82.0%) | 469 (18.0%) |
| $25,000 to $49,999 | 2,584 (88.4%) | 338 (11.6%) |
| $50,000 to $74,999 | 3,109 (89.6%) | 360 (10.4%) |
| $75,000 to $99,999 | 2,271 (93.0%) | 171 (7.0%) |
| $100,000 and over | 5,276 (93.0%) | 395 (7.0%) |
Public vs Private Health Insurance Coverage by Age in Hope Mills
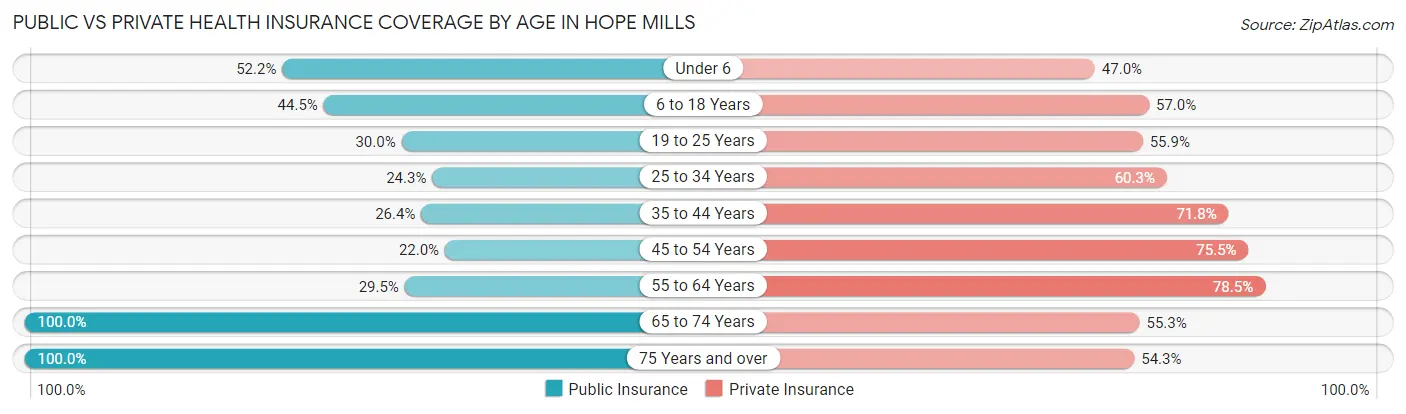
| Age Bracket | Public Insurance | Private Insurance |
| Under 6 | 863 (52.2%) | 777 (47.0%) |
| 6 to 18 Years | 1,572 (44.5%) | 2,015 (57.0%) |
| 19 to 25 Years | 520 (30.0%) | 967 (55.9%) |
| 25 to 34 Years | 576 (24.3%) | 1,427 (60.3%) |
| 35 to 44 Years | 558 (26.4%) | 1,518 (71.8%) |
| 45 to 54 Years | 491 (22.0%) | 1,686 (75.5%) |
| 55 to 64 Years | 516 (29.4%) | 1,376 (78.5%) |
| 65 to 74 Years | 1,062 (100.0%) | 587 (55.3%) |
| 75 Years and over | 665 (100.0%) | 361 (54.3%) |
| Total | 6,823 (39.9%) | 10,714 (62.6%) |
Disability Status by Sex by Age in Hope Mills
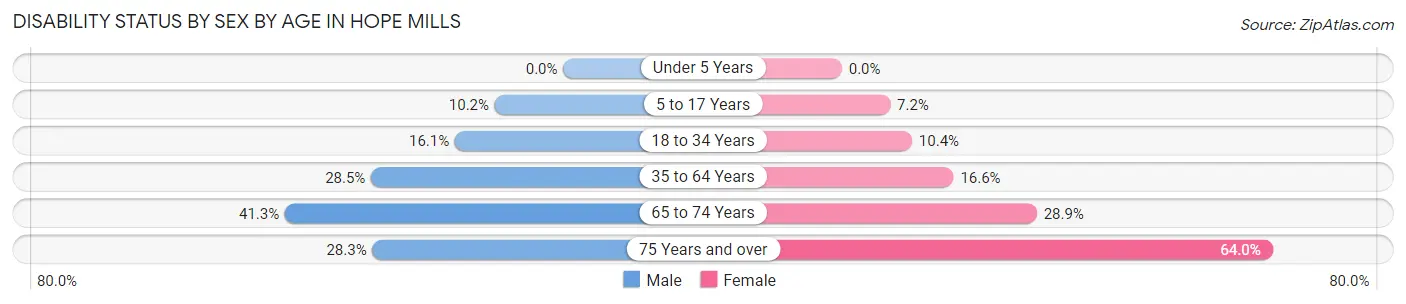
| Age Bracket | Male | Female |
| Under 5 Years | 0 (0.0%) | 0 (0.0%) |
| 5 to 17 Years | 198 (10.2%) | 120 (7.2%) |
| 18 to 34 Years | 309 (16.1%) | 246 (10.4%) |
| 35 to 64 Years | 772 (28.5%) | 563 (16.6%) |
| 65 to 74 Years | 169 (41.3%) | 189 (28.9%) |
| 75 Years and over | 87 (28.3%) | 229 (64.0%) |
Disability Class by Sex by Age in Hope Mills
Disability Class: Hearing Difficulty
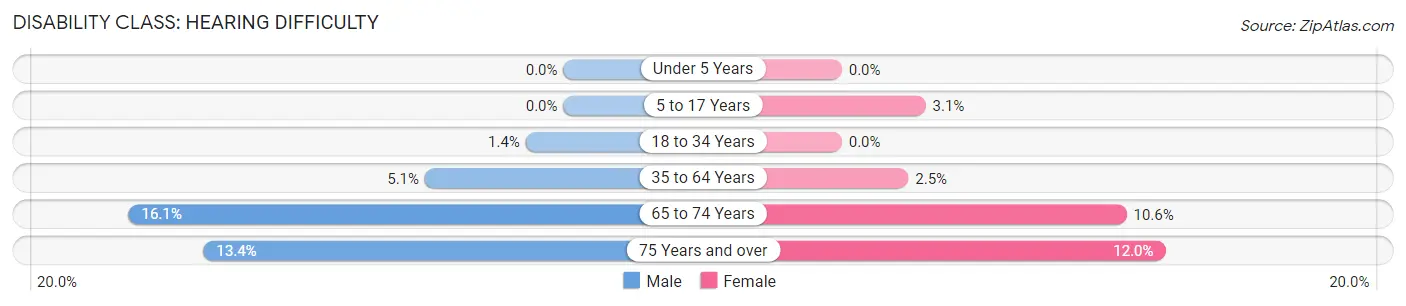
| Age Bracket | Male | Female |
| Under 5 Years | 0 (0.0%) | 0 (0.0%) |
| 5 to 17 Years | 0 (0.0%) | 52 (3.1%) |
| 18 to 34 Years | 27 (1.4%) | 0 (0.0%) |
| 35 to 64 Years | 139 (5.1%) | 84 (2.5%) |
| 65 to 74 Years | 66 (16.1%) | 69 (10.6%) |
| 75 Years and over | 41 (13.4%) | 43 (12.0%) |
Disability Class: Vision Difficulty
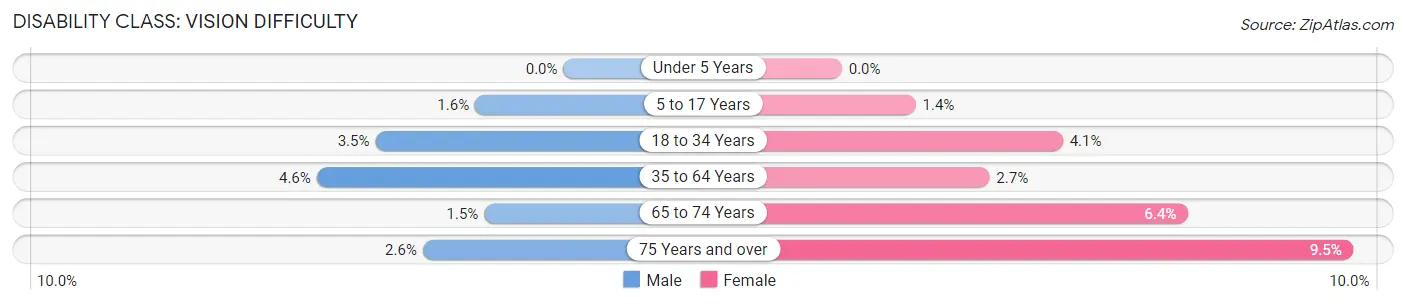
| Age Bracket | Male | Female |
| Under 5 Years | 0 (0.0%) | 0 (0.0%) |
| 5 to 17 Years | 32 (1.6%) | 23 (1.4%) |
| 18 to 34 Years | 67 (3.5%) | 97 (4.1%) |
| 35 to 64 Years | 124 (4.6%) | 93 (2.7%) |
| 65 to 74 Years | 6 (1.5%) | 42 (6.4%) |
| 75 Years and over | 8 (2.6%) | 34 (9.5%) |
Disability Class: Cognitive Difficulty
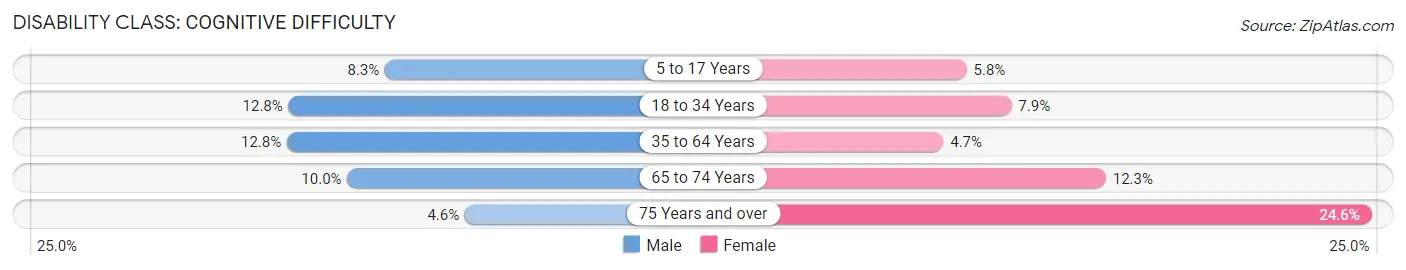
| Age Bracket | Male | Female |
| 5 to 17 Years | 161 (8.3%) | 97 (5.8%) |
| 18 to 34 Years | 245 (12.8%) | 186 (7.9%) |
| 35 to 64 Years | 347 (12.8%) | 160 (4.7%) |
| 65 to 74 Years | 41 (10.0%) | 80 (12.2%) |
| 75 Years and over | 14 (4.6%) | 88 (24.6%) |
Disability Class: Ambulatory Difficulty
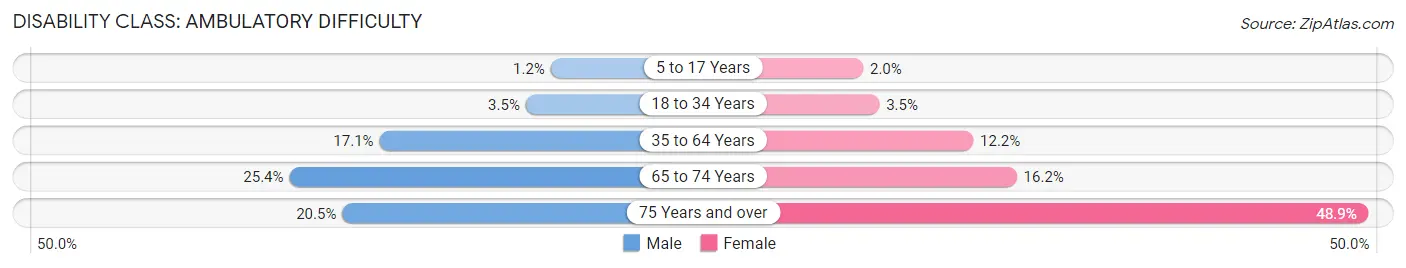
| Age Bracket | Male | Female |
| 5 to 17 Years | 23 (1.2%) | 33 (2.0%) |
| 18 to 34 Years | 67 (3.5%) | 82 (3.5%) |
| 35 to 64 Years | 462 (17.1%) | 414 (12.2%) |
| 65 to 74 Years | 104 (25.4%) | 106 (16.2%) |
| 75 Years and over | 63 (20.5%) | 175 (48.9%) |
Disability Class: Self-Care Difficulty
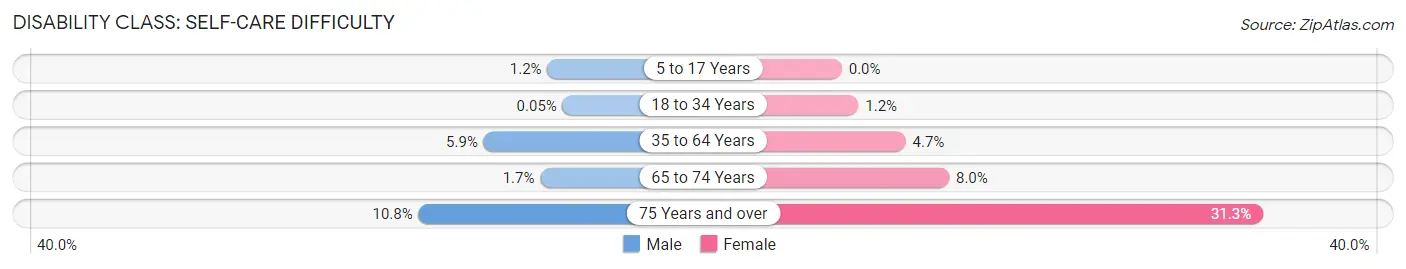
| Age Bracket | Male | Female |
| 5 to 17 Years | 23 (1.2%) | 0 (0.0%) |
| 18 to 34 Years | 1 (0.1%) | 29 (1.2%) |
| 35 to 64 Years | 160 (5.9%) | 161 (4.7%) |
| 65 to 74 Years | 7 (1.7%) | 52 (8.0%) |
| 75 Years and over | 33 (10.7%) | 112 (31.3%) |
Technology Access in Hope Mills
Computing Device Access in Hope Mills
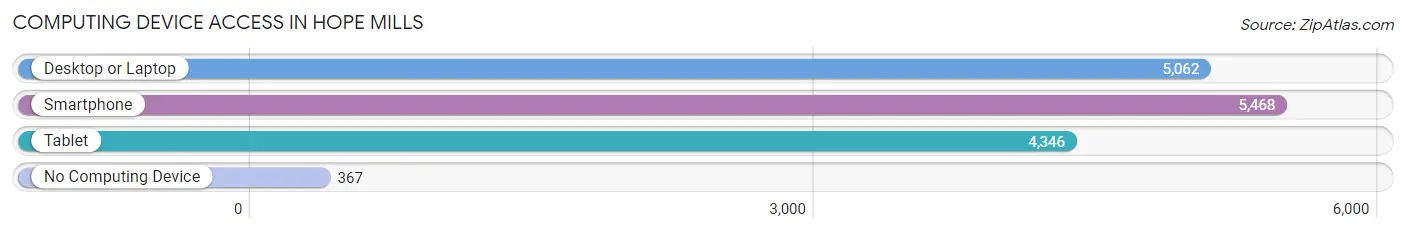
| Device Type | # Households | % Households |
| Desktop or Laptop | 5,062 | 81.2% |
| Smartphone | 5,468 | 87.7% |
| Tablet | 4,346 | 69.7% |
| No Computing Device | 367 | 5.9% |
| Total | 6,235 | 100.0% |
Internet Access in Hope Mills
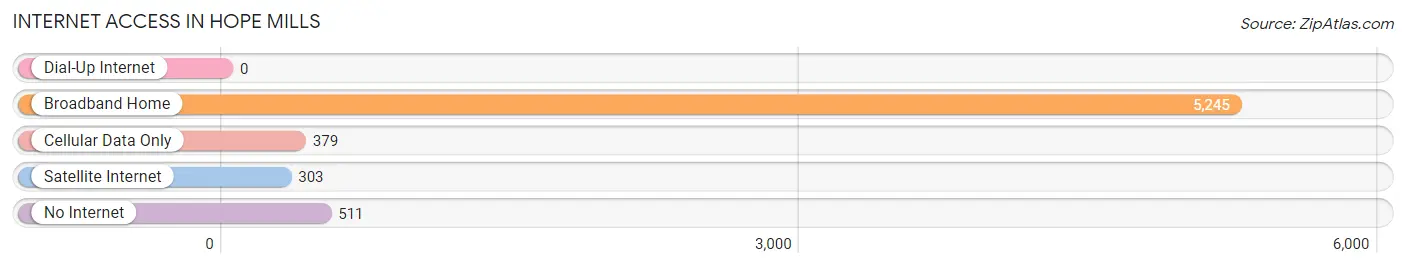
| Internet Type | # Households | % Households |
| Dial-Up Internet | 0 | 0.0% |
| Broadband Home | 5,245 | 84.1% |
| Cellular Data Only | 379 | 6.1% |
| Satellite Internet | 303 | 4.9% |
| No Internet | 511 | 8.2% |
| Total | 6,235 | 100.0% |
Hope Mills Summary
History
Hope Mills is a town located in Cumberland County, North Carolina. It was founded in 1855 by a group of settlers from Scotland, England, and Ireland. The town was named after the Hope Mills, a cotton mill that was built in the area in 1856. The mill was the first of its kind in the area and was a major source of employment for the town. The town grew rapidly in the late 19th and early 20th centuries, becoming a major center for the production of cotton and other agricultural products.
The town was also home to a number of other industries, including a brickyard, a sawmill, and a gristmill. The town was also home to a number of churches, schools, and other civic organizations.
In the late 19th and early 20th centuries, the town was a major center for the production of cotton and other agricultural products. The town was also home to a number of other industries, including a brickyard, a sawmill, and a gristmill.
The town was also home to a number of churches, schools, and other civic organizations. In the late 19th and early 20th centuries, the town was a major center for the production of cotton and other agricultural products.
The town was also home to a number of other industries, including a brickyard, a sawmill, and a gristmill. The town was also home to a number of churches, schools, and other civic organizations.
Geography
Hope Mills is located in the Sandhills region of North Carolina, approximately 20 miles south of Fayetteville. The town is situated on the banks of the Little River, which flows through the town and is a major source of water for the area. The town is surrounded by rolling hills and forests, and is home to a number of parks and recreational areas.
The town is located in the humid subtropical climate zone, with hot, humid summers and mild winters. The average annual temperature is around 70 degrees Fahrenheit, with an average high of around 90 degrees in the summer and an average low of around 50 degrees in the winter.
Economy
Hope Mills is a small town with a population of around 8,000 people. The town is home to a number of small businesses, including restaurants, retail stores, and service providers. The town is also home to a number of manufacturing and industrial businesses, including a paper mill, a furniture factory, and a plastics plant.
The town is also home to a number of agricultural businesses, including a number of farms and nurseries. The town is also home to a number of churches, schools, and other civic organizations.
Demographics
As of the 2010 census, the population of Hope Mills was 8,424. The racial makeup of the town was 79.3% White, 15.2% African American, 0.5% Native American, 1.2% Asian, 0.1% Pacific Islander, 1.7% from other races, and 2.2% from two or more races. Hispanic or Latino of any race were 4.2% of the population.
The median income for a household in the town was $37,917, and the median income for a family was $45,938. The per capita income for the town was $19,945. About 16.2% of families and 19.2% of the population were below the poverty line, including 28.2% of those under age 18 and 11.2% of those age 65 or over.
Conclusion
Hope Mills is a small town located in Cumberland County, North Carolina. It was founded in 1855 by a group of settlers from Scotland, England, and Ireland. The town was named after the Hope Mills, a cotton mill that was built in the area in 1856. The town grew rapidly in the late 19th and early 20th centuries, becoming a major center for the production of cotton and other agricultural products. The town is home to a number of small businesses, manufacturing and industrial businesses, and agricultural businesses. The population of Hope Mills was 8,424 as of the 2010 census, with a median household income of $37,917 and a median family income of $45,938. The town is home to a number of churches, schools, and other civic organizations.
Common Questions
What is Per Capita Income in Hope Mills?
Per Capita income in Hope Mills is $26,854.
What is the Median Family Income in Hope Mills?
Median Family Income in Hope Mills is $70,259.
What is the Median Household income in Hope Mills?
Median Household Income in Hope Mills is $57,864.
What is Income or Wage Gap in Hope Mills?
Income or Wage Gap in Hope Mills is 23.9%.
Women in Hope Mills earn 76.1 cents for every dollar earned by a man.
What is Family Income Deficit in Hope Mills?
Family Income Deficit in Hope Mills is $10,258.
Families that are below poverty line in Hope Mills earn $10,258 less on average than the poverty threshold level.
What is Inequality or Gini Index in Hope Mills?
Inequality or Gini Index in Hope Mills is 0.42.
What is the Total Population of Hope Mills?
Total Population of Hope Mills is 17,671.
What is the Total Male Population of Hope Mills?
Total Male Population of Hope Mills is 8,462.
What is the Total Female Population of Hope Mills?
Total Female Population of Hope Mills is 9,209.
What is the Ratio of Males per 100 Females in Hope Mills?
There are 91.89 Males per 100 Females in Hope Mills.
What is the Ratio of Females per 100 Males in Hope Mills?
There are 108.83 Females per 100 Males in Hope Mills.
What is the Median Population Age in Hope Mills?
Median Population Age in Hope Mills is 32.5 Years.
What is the Average Family Size in Hope Mills
Average Family Size in Hope Mills is 3.4 People.
What is the Average Household Size in Hope Mills
Average Household Size in Hope Mills is 2.8 People.
How Large is the Labor Force in Hope Mills?
There are 8,307 People in the Labor Forcein in Hope Mills.
What is the Percentage of People in the Labor Force in Hope Mills?
62.6% of People are in the Labor Force in Hope Mills.
What is the Unemployment Rate in Hope Mills?
Unemployment Rate in Hope Mills is 7.8%.