Walkertown, NC Map & Demographics
Walkertown Map
Walkertown Overview
$37,446
PER CAPITA INCOME
$64,161
AVG FAMILY INCOME
$58,900
AVG HOUSEHOLD INCOME
40.0%
WAGE / INCOME GAP [ % ]
60.0¢/ $1
WAGE / INCOME GAP [ $ ]
0.46
INEQUALITY / GINI INDEX
5,706
TOTAL POPULATION
2,784
MALE POPULATION
2,922
FEMALE POPULATION
95.28
MALES / 100 FEMALES
104.96
FEMALES / 100 MALES
43.6
MEDIAN AGE
2.9
AVG FAMILY SIZE
2.4
AVG HOUSEHOLD SIZE
2,772
LABOR FORCE [ PEOPLE ]
59.7%
PERCENT IN LABOR FORCE
1.9%
UNEMPLOYMENT RATE
Walkertown Zip Codes
Walkertown Area Codes
Income in Walkertown
Income Overview in Walkertown
Per Capita Income in Walkertown is $37,446, while median incomes of families and households are $64,161 and $58,900 respectively.
| Characteristic | Number | Measure |
| Per Capita Income | 5,706 | $37,446 |
| Median Family Income | 1,615 | $64,161 |
| Mean Family Income | 1,615 | $93,275 |
| Median Household Income | 2,394 | $58,900 |
| Mean Household Income | 2,394 | $84,959 |
| Income Deficit | 1,615 | $0 |
| Wage / Income Gap (%) | 5,706 | 39.96% |
| Wage / Income Gap ($) | 5,706 | 60.04¢ per $1 |
| Gini / Inequality Index | 5,706 | 0.46 |
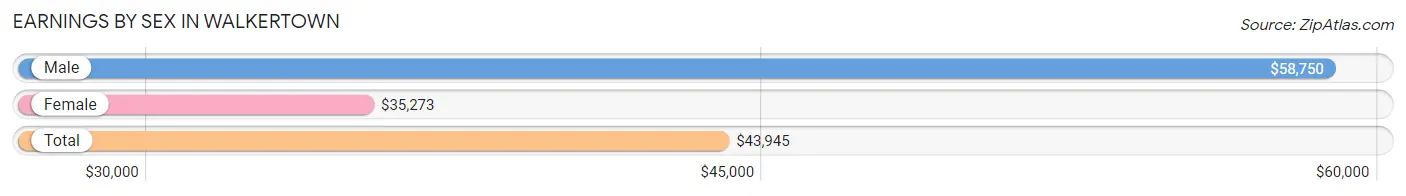
Earnings by Sex in Walkertown
Average Earnings in Walkertown are $43,945, $58,750 for men and $35,273 for women, a difference of 40.0%.
| Sex | Number | Average Earnings |
| Male | 1,408 (48.5%) | $58,750 |
| Female | 1,492 (51.4%) | $35,273 |
| Total | 2,900 (100.0%) | $43,945 |
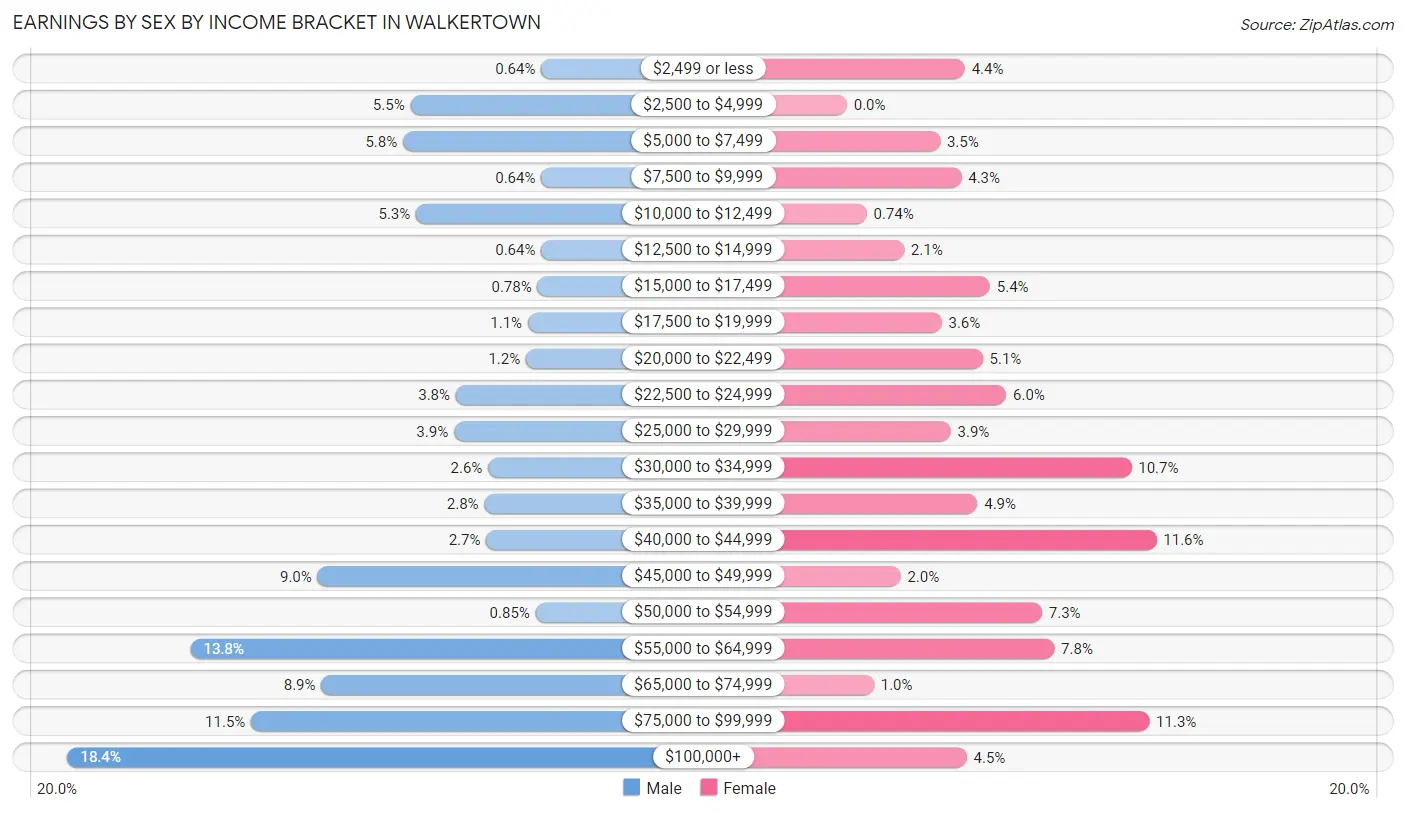
Earnings by Sex by Income Bracket in Walkertown
The most common earnings brackets in Walkertown are $100,000+ for men (259 | 18.4%) and $40,000 to $44,999 for women (173 | 11.6%).
| Income | Male | Female |
| $2,499 or less | 9 (0.6%) | 66 (4.4%) |
| $2,500 to $4,999 | 78 (5.5%) | 0 (0.0%) |
| $5,000 to $7,499 | 82 (5.8%) | 52 (3.5%) |
| $7,500 to $9,999 | 9 (0.6%) | 64 (4.3%) |
| $10,000 to $12,499 | 75 (5.3%) | 11 (0.7%) |
| $12,500 to $14,999 | 9 (0.6%) | 32 (2.1%) |
| $15,000 to $17,499 | 11 (0.8%) | 80 (5.4%) |
| $17,500 to $19,999 | 16 (1.1%) | 53 (3.5%) |
| $20,000 to $22,499 | 17 (1.2%) | 76 (5.1%) |
| $22,500 to $24,999 | 54 (3.8%) | 89 (6.0%) |
| $25,000 to $29,999 | 55 (3.9%) | 58 (3.9%) |
| $30,000 to $34,999 | 37 (2.6%) | 159 (10.7%) |
| $35,000 to $39,999 | 39 (2.8%) | 73 (4.9%) |
| $40,000 to $44,999 | 38 (2.7%) | 173 (11.6%) |
| $45,000 to $49,999 | 127 (9.0%) | 30 (2.0%) |
| $50,000 to $54,999 | 12 (0.9%) | 109 (7.3%) |
| $55,000 to $64,999 | 194 (13.8%) | 116 (7.8%) |
| $65,000 to $74,999 | 125 (8.9%) | 15 (1.0%) |
| $75,000 to $99,999 | 162 (11.5%) | 169 (11.3%) |
| $100,000+ | 259 (18.4%) | 67 (4.5%) |
| Total | 1,408 (100.0%) | 1,492 (100.0%) |
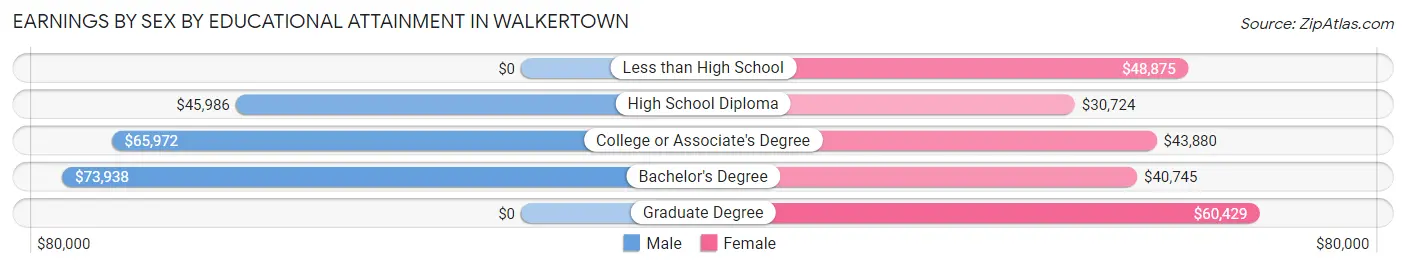
Earnings by Sex by Educational Attainment in Walkertown
Average earnings in Walkertown are $60,881 for men and $41,250 for women, a difference of 32.2%. Men with an educational attainment of bachelor's degree enjoy the highest average annual earnings of $73,938, while those with high school diploma education earn the least with $45,986. Women with an educational attainment of graduate degree earn the most with the average annual earnings of $60,429, while those with high school diploma education have the smallest earnings of $30,724.
| Educational Attainment | Male Income | Female Income |
| Less than High School | - | - |
| High School Diploma | $45,986 | $30,724 |
| College or Associate's Degree | $65,972 | $43,880 |
| Bachelor's Degree | $73,938 | $40,745 |
| Graduate Degree | - | - |
| Total | $60,881 | $41,250 |
Family Income in Walkertown
Family Income Brackets in Walkertown
According to the Walkertown family income data, there are 260 families falling into the $50,000 to $74,999 income range, which is the most common income bracket and makes up 16.1% of all families. Conversely, the $10,000 to $14,999 income bracket is the least frequent group with only 8 families (0.5%) belonging to this category.
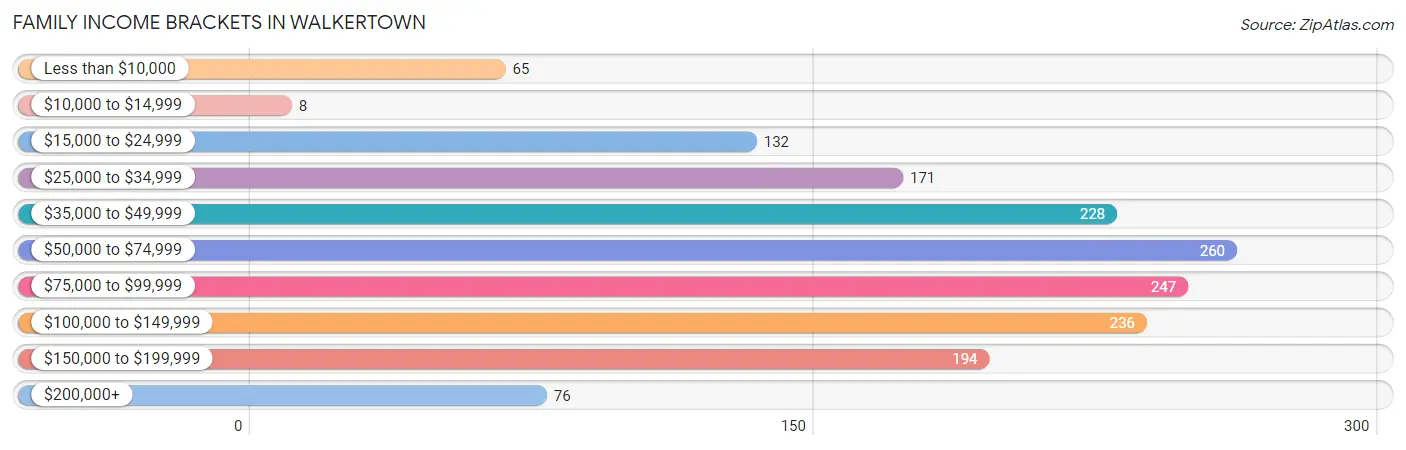
| Income Bracket | # Families | % Families |
| Less than $10,000 | 65 | 4.0% |
| $10,000 to $14,999 | 8 | 0.5% |
| $15,000 to $24,999 | 132 | 8.2% |
| $25,000 to $34,999 | 171 | 10.6% |
| $35,000 to $49,999 | 228 | 14.1% |
| $50,000 to $74,999 | 260 | 16.1% |
| $75,000 to $99,999 | 247 | 15.3% |
| $100,000 to $149,999 | 236 | 14.6% |
| $150,000 to $199,999 | 194 | 12.0% |
| $200,000+ | 76 | 4.7% |
Family Income by Famaliy Size in Walkertown
5-person families (67 | 4.2%) account for the highest median family income in Walkertown with $134,583 per family, while 3-person families (204 | 12.6%) have the highest median income of $32,874 per family member.
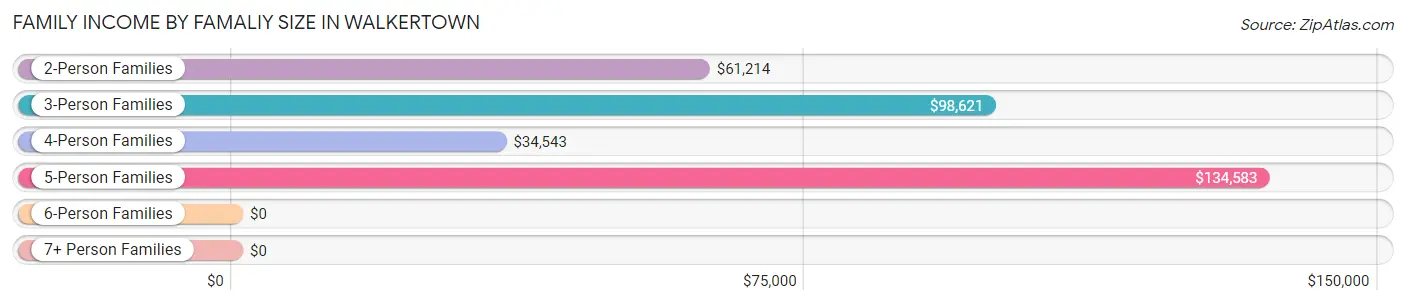
| Income Bracket | # Families | Median Income |
| 2-Person Families | 1,086 (67.2%) | $61,214 |
| 3-Person Families | 204 (12.6%) | $98,621 |
| 4-Person Families | 251 (15.5%) | $34,543 |
| 5-Person Families | 67 (4.2%) | $134,583 |
| 6-Person Families | 7 (0.4%) | $0 |
| 7+ Person Families | 0 (0.0%) | $0 |
| Total | 1,615 (100.0%) | $64,161 |
Family Income by Number of Earners in Walkertown
The median family income in Walkertown is $64,161, with families comprising 3+ earners (109) having the highest median family income of $132,639, while families with no earners (387) have the lowest median family income of $37,361, accounting for 6.8% and 24.0% of families, respectively.
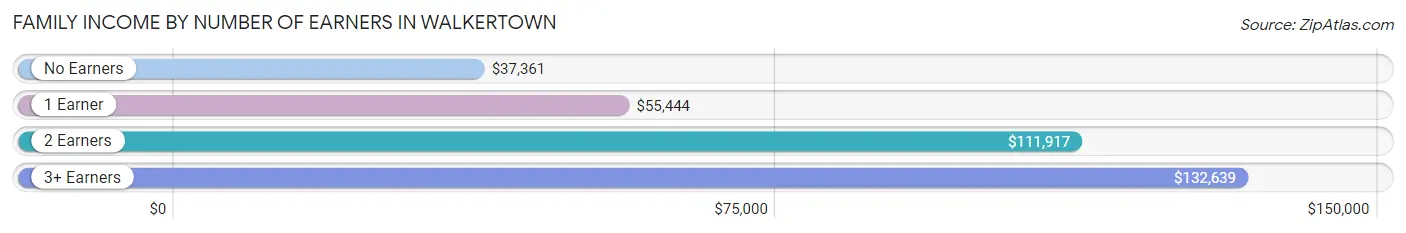
| Number of Earners | # Families | Median Income |
| No Earners | 387 (24.0%) | $37,361 |
| 1 Earner | 578 (35.8%) | $55,444 |
| 2 Earners | 541 (33.5%) | $111,917 |
| 3+ Earners | 109 (6.8%) | $132,639 |
| Total | 1,615 (100.0%) | $64,161 |
Household Income in Walkertown
Household Income Brackets in Walkertown
With 421 households falling in the category, the $100,000 to $149,999 income range is the most frequent in Walkertown, accounting for 17.6% of all households. In contrast, only 72 households (3.0%) fall into the $10,000 to $14,999 income bracket, making it the least populous group.
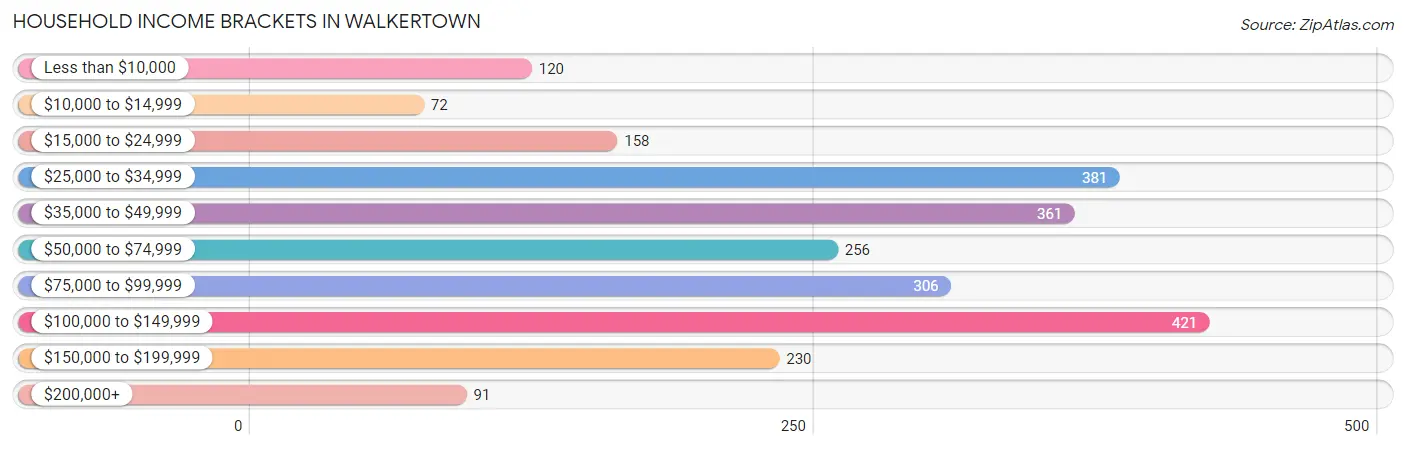
| Income Bracket | # Households | % Households |
| Less than $10,000 | 120 | 5.0% |
| $10,000 to $14,999 | 72 | 3.0% |
| $15,000 to $24,999 | 158 | 6.6% |
| $25,000 to $34,999 | 381 | 15.9% |
| $35,000 to $49,999 | 361 | 15.1% |
| $50,000 to $74,999 | 256 | 10.7% |
| $75,000 to $99,999 | 306 | 12.8% |
| $100,000 to $149,999 | 421 | 17.6% |
| $150,000 to $199,999 | 230 | 9.6% |
| $200,000+ | 91 | 3.8% |
Household Income by Householder Age in Walkertown
The median household income in Walkertown is $58,900, with the highest median household income of $87,850 found in the 45 to 64 years age bracket for the primary householder. A total of 851 households (35.5%) fall into this category. Meanwhile, the 15 to 24 years age bracket for the primary householder has the lowest median household income of $0, with 41 households (1.7%) in this group.
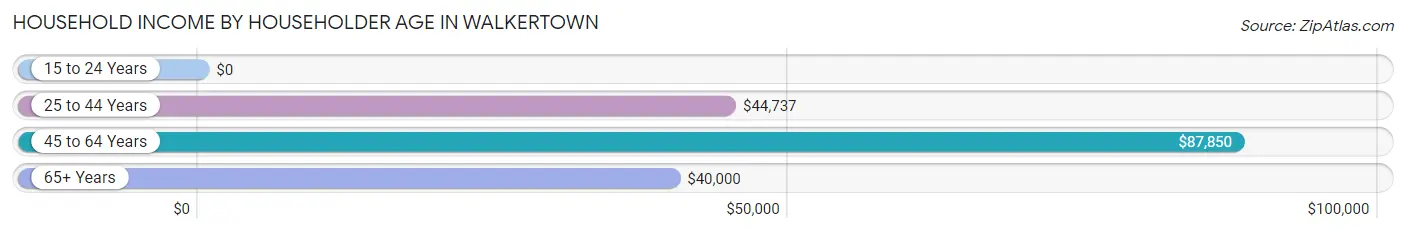
| Income Bracket | # Households | Median Income |
| 15 to 24 Years | 41 (1.7%) | $0 |
| 25 to 44 Years | 848 (35.4%) | $44,737 |
| 45 to 64 Years | 851 (35.5%) | $87,850 |
| 65+ Years | 654 (27.3%) | $40,000 |
| Total | 2,394 (100.0%) | $58,900 |
Poverty in Walkertown
Income Below Poverty by Sex and Age in Walkertown
With 8.4% poverty level for males and 9.7% for females among the residents of Walkertown, 15 year old males and 6 to 11 year old females are the most vulnerable to poverty, with 36 males (75.0%) and 62 females (29.5%) in their respective age groups living below the poverty level.
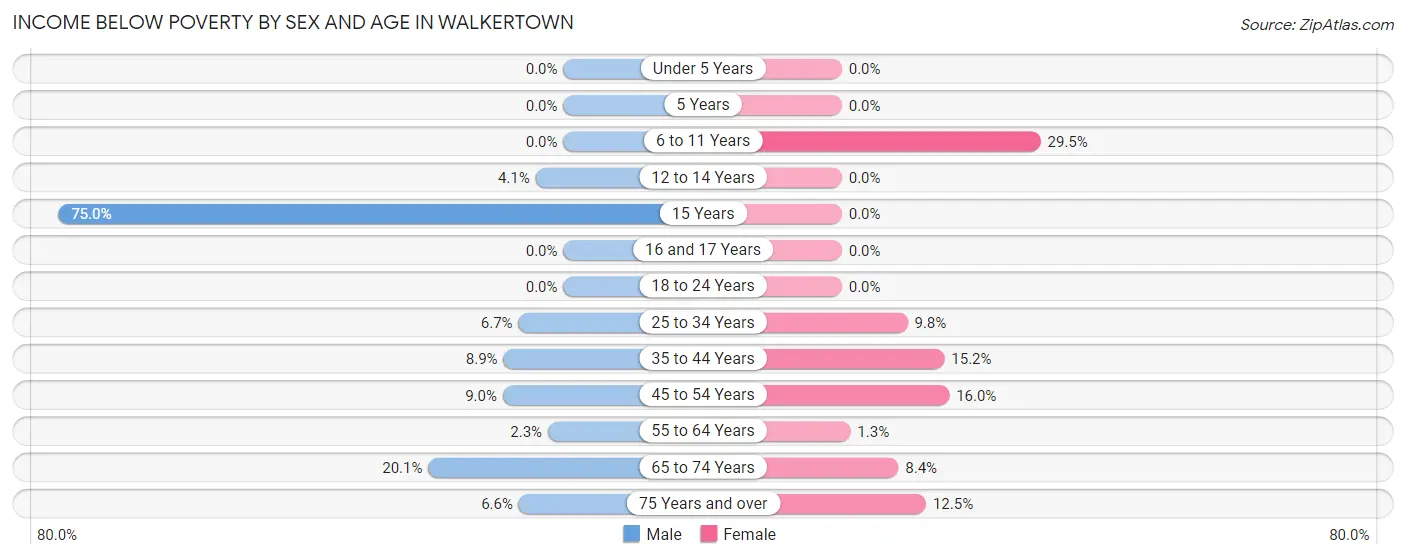
| Age Bracket | Male | Female |
| Under 5 Years | 0 (0.0%) | 0 (0.0%) |
| 5 Years | 0 (0.0%) | 0 (0.0%) |
| 6 to 11 Years | 0 (0.0%) | 62 (29.5%) |
| 12 to 14 Years | 10 (4.1%) | 0 (0.0%) |
| 15 Years | 36 (75.0%) | 0 (0.0%) |
| 16 and 17 Years | 0 (0.0%) | 0 (0.0%) |
| 18 to 24 Years | 0 (0.0%) | 0 (0.0%) |
| 25 to 34 Years | 20 (6.7%) | 41 (9.8%) |
| 35 to 44 Years | 25 (8.9%) | 67 (15.2%) |
| 45 to 54 Years | 42 (9.0%) | 56 (16.0%) |
| 55 to 64 Years | 7 (2.3%) | 6 (1.3%) |
| 65 to 74 Years | 76 (20.1%) | 22 (8.4%) |
| 75 Years and over | 17 (6.6%) | 28 (12.5%) |
| Total | 233 (8.4%) | 282 (9.7%) |
Income Above Poverty by Sex and Age in Walkertown
According to the poverty statistics in Walkertown, males aged under 5 years and females aged under 5 years are the age groups that are most secure financially, with 100.0% of males and 100.0% of females in these age groups living above the poverty line.
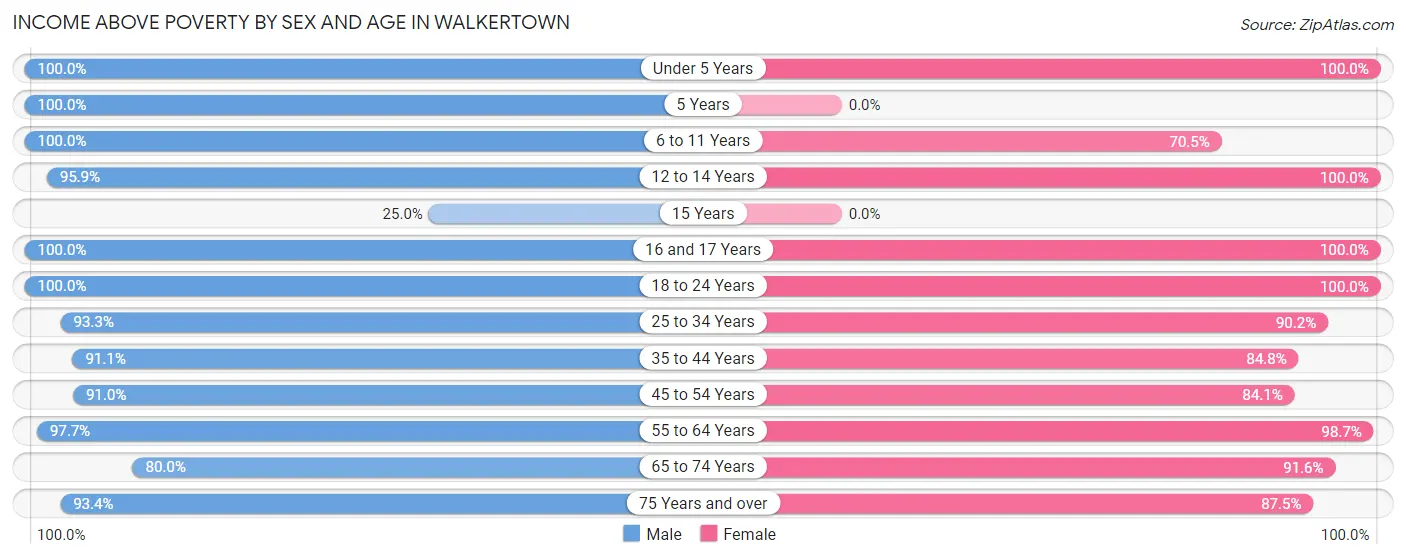
| Age Bracket | Male | Female |
| Under 5 Years | 107 (100.0%) | 125 (100.0%) |
| 5 Years | 7 (100.0%) | 0 (0.0%) |
| 6 to 11 Years | 231 (100.0%) | 148 (70.5%) |
| 12 to 14 Years | 232 (95.9%) | 92 (100.0%) |
| 15 Years | 12 (25.0%) | 0 (0.0%) |
| 16 and 17 Years | 53 (100.0%) | 41 (100.0%) |
| 18 to 24 Years | 106 (100.0%) | 290 (100.0%) |
| 25 to 34 Years | 280 (93.3%) | 379 (90.2%) |
| 35 to 44 Years | 256 (91.1%) | 373 (84.8%) |
| 45 to 54 Years | 425 (91.0%) | 295 (84.1%) |
| 55 to 64 Years | 299 (97.7%) | 461 (98.7%) |
| 65 to 74 Years | 303 (79.9%) | 240 (91.6%) |
| 75 Years and over | 240 (93.4%) | 196 (87.5%) |
| Total | 2,551 (91.6%) | 2,640 (90.3%) |
Income Below Poverty Among Married-Couple Families in Walkertown
The poverty statistics for married-couple families in Walkertown show that 1.3% or 15 of the total 1,130 families live below the poverty line. Families with 1 or 2 children have the highest poverty rate of 2.2%, comprising of 7 families. On the other hand, families with 3 or 4 children have the lowest poverty rate of 0.0%, which includes 0 families.
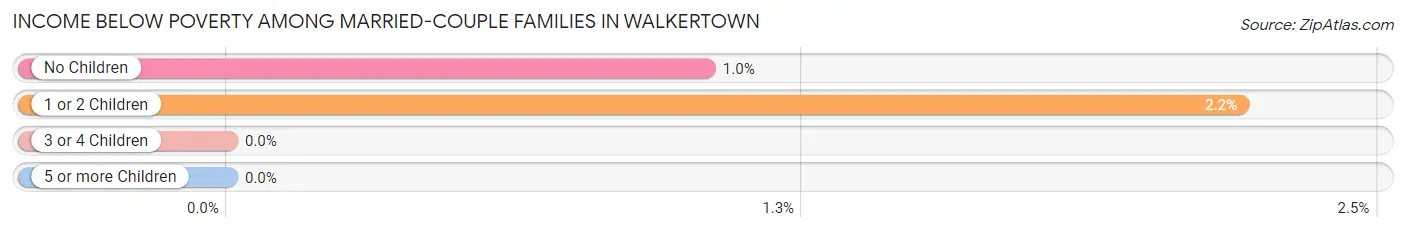
| Children | Above Poverty | Below Poverty |
| No Children | 760 (99.0%) | 8 (1.0%) |
| 1 or 2 Children | 311 (97.8%) | 7 (2.2%) |
| 3 or 4 Children | 44 (100.0%) | 0 (0.0%) |
| 5 or more Children | 0 (0.0%) | 0 (0.0%) |
| Total | 1,115 (98.7%) | 15 (1.3%) |
Income Below Poverty Among Single-Parent Households in Walkertown
According to the poverty data in Walkertown, 37.9% or 75 single-father households and 8.4% or 24 single-mother households are living below the poverty line. Among single-father households, those with no children have the highest poverty rate, with 75 households (53.2%) experiencing poverty. Likewise, among single-mother households, those with 3 or 4 children have the highest poverty rate, with 24 households (61.5%) falling below the poverty line.
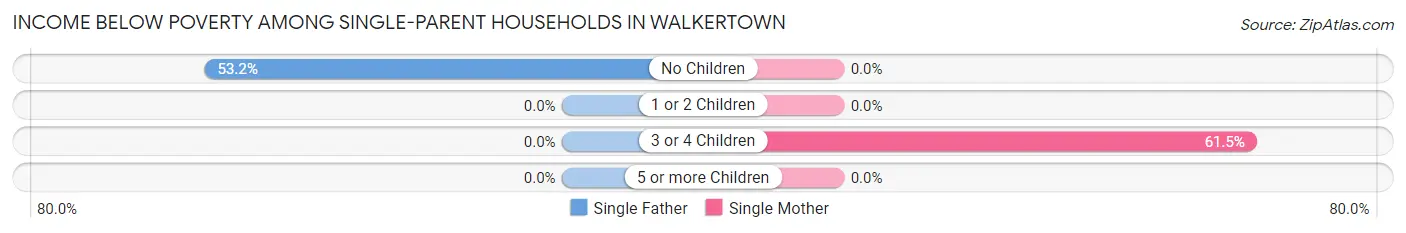
| Children | Single Father | Single Mother |
| No Children | 75 (53.2%) | 0 (0.0%) |
| 1 or 2 Children | 0 (0.0%) | 0 (0.0%) |
| 3 or 4 Children | 0 (0.0%) | 24 (61.5%) |
| 5 or more Children | 0 (0.0%) | 0 (0.0%) |
| Total | 75 (37.9%) | 24 (8.4%) |
Income Below Poverty Among Married-Couple vs Single-Parent Households in Walkertown
The poverty data for Walkertown shows that 15 of the married-couple family households (1.3%) and 99 of the single-parent households (20.4%) are living below the poverty level. Within the married-couple family households, those with 1 or 2 children have the highest poverty rate, with 7 households (2.2%) falling below the poverty line. Among the single-parent households, those with 3 or 4 children have the highest poverty rate, with 24 household (61.5%) living below poverty.
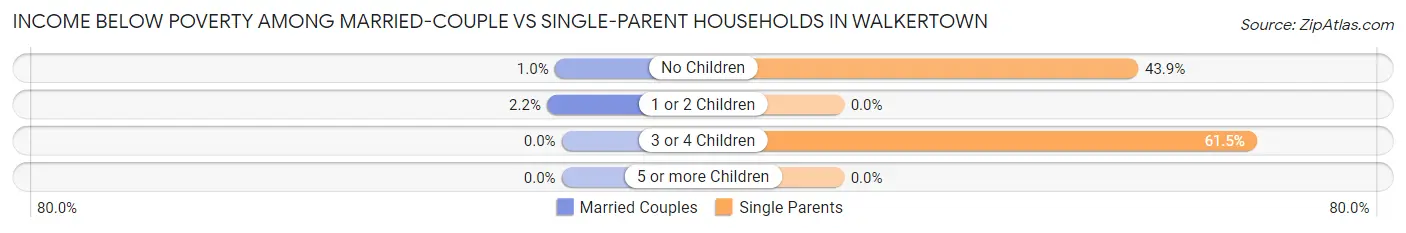
| Children | Married-Couple Families | Single-Parent Households |
| No Children | 8 (1.0%) | 75 (43.9%) |
| 1 or 2 Children | 7 (2.2%) | 0 (0.0%) |
| 3 or 4 Children | 0 (0.0%) | 24 (61.5%) |
| 5 or more Children | 0 (0.0%) | 0 (0.0%) |
| Total | 15 (1.3%) | 99 (20.4%) |
Race in Walkertown
The most populous races in Walkertown are White / Caucasian (4,204 | 73.7%), Black / African American (1,148 | 20.1%), and Hispanic or Latino (460 | 8.1%).
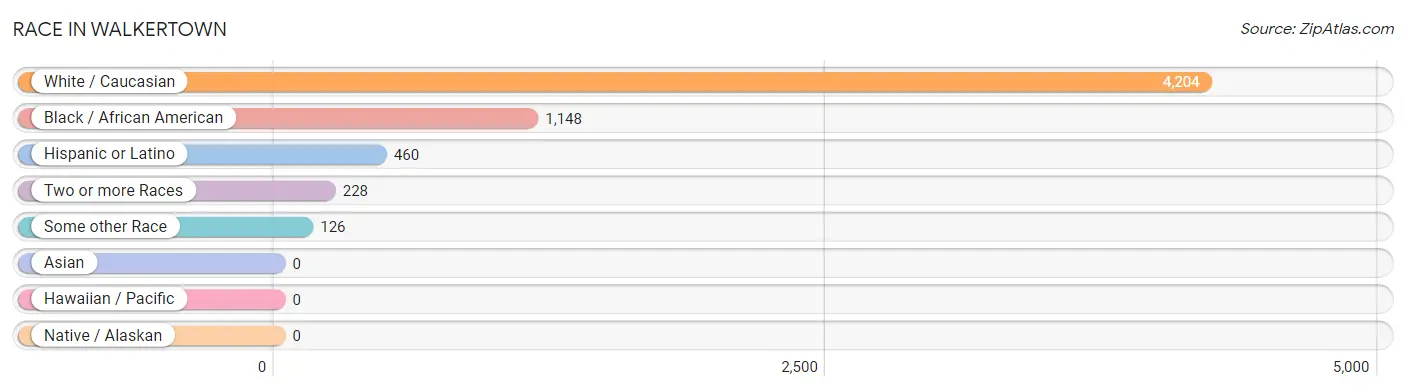
| Race | # Population | % Population |
| Asian | 0 | 0.0% |
| Black / African American | 1,148 | 20.1% |
| Hawaiian / Pacific | 0 | 0.0% |
| Hispanic or Latino | 460 | 8.1% |
| Native / Alaskan | 0 | 0.0% |
| White / Caucasian | 4,204 | 73.7% |
| Two or more Races | 228 | 4.0% |
| Some other Race | 126 | 2.2% |
| Total | 5,706 | 100.0% |
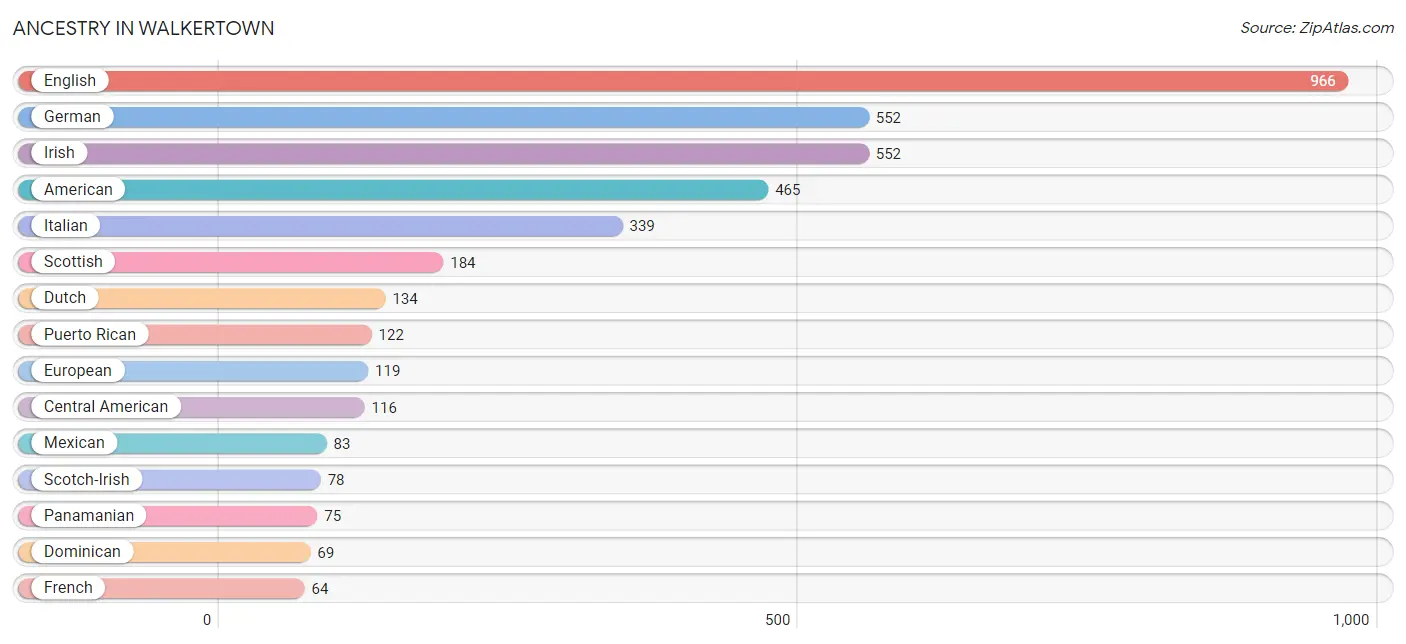
Ancestry in Walkertown
The most populous ancestries reported in Walkertown are English (966 | 16.9%), German (552 | 9.7%), Irish (552 | 9.7%), American (465 | 8.2%), and Italian (339 | 5.9%), together accounting for 50.4% of all Walkertown residents.
| Ancestry | # Population | % Population |
| African | 36 | 0.6% |
| American | 465 | 8.2% |
| Austrian | 6 | 0.1% |
| British | 14 | 0.3% |
| Central American | 116 | 2.0% |
| Cherokee | 24 | 0.4% |
| Colombian | 52 | 0.9% |
| Cuban | 18 | 0.3% |
| Czechoslovakian | 38 | 0.7% |
| Danish | 9 | 0.2% |
| Dominican | 69 | 1.2% |
| Dutch | 134 | 2.4% |
| Eastern European | 16 | 0.3% |
| English | 966 | 16.9% |
| European | 119 | 2.1% |
| French | 64 | 1.1% |
| French Canadian | 8 | 0.1% |
| German | 552 | 9.7% |
| Greek | 11 | 0.2% |
| Guatemalan | 31 | 0.5% |
| Guyanese | 60 | 1.1% |
| Irish | 552 | 9.7% |
| Italian | 339 | 5.9% |
| Jamaican | 60 | 1.1% |
| Macedonian | 52 | 0.9% |
| Mexican | 83 | 1.5% |
| Mexican American Indian | 13 | 0.2% |
| Native Hawaiian | 13 | 0.2% |
| Panamanian | 75 | 1.3% |
| Puerto Rican | 122 | 2.1% |
| Salvadoran | 10 | 0.2% |
| Scandinavian | 30 | 0.5% |
| Scotch-Irish | 78 | 1.4% |
| Scottish | 184 | 3.2% |
| Slavic | 11 | 0.2% |
| South American | 52 | 0.9% |
| Subsaharan African | 36 | 0.6% |
| Ukrainian | 12 | 0.2% |
| Yugoslavian | 45 | 0.8% | View All 39 Rows |
Immigrants in Walkertown
The most numerous immigrant groups reported in Walkertown came from Europe (116 | 2.0%), Latin America (91 | 1.6%), England (60 | 1.1%), Northern Europe (60 | 1.1%), and Caribbean (50 | 0.9%), together accounting for 6.6% of all Walkertown residents.
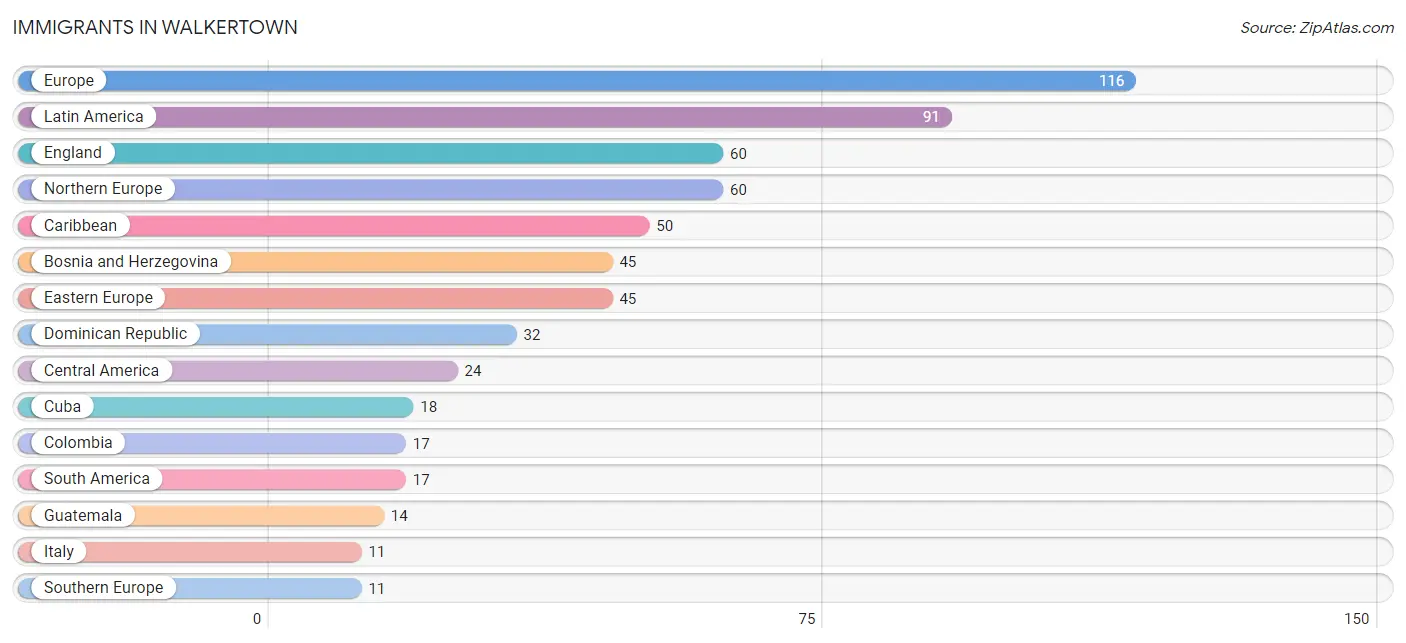
| Immigration Origin | # Population | % Population |
| Bosnia and Herzegovina | 45 | 0.8% |
| Caribbean | 50 | 0.9% |
| Central America | 24 | 0.4% |
| Colombia | 17 | 0.3% |
| Cuba | 18 | 0.3% |
| Dominican Republic | 32 | 0.6% |
| Eastern Europe | 45 | 0.8% |
| El Salvador | 10 | 0.2% |
| England | 60 | 1.1% |
| Europe | 116 | 2.0% |
| Guatemala | 14 | 0.3% |
| Italy | 11 | 0.2% |
| Latin America | 91 | 1.6% |
| Northern Europe | 60 | 1.1% |
| South America | 17 | 0.3% |
| Southern Europe | 11 | 0.2% | View All 16 Rows |
Sex and Age in Walkertown
Sex and Age in Walkertown
The most populous age groups in Walkertown are 10 to 14 Years (315 | 11.3%) for men and 40 to 44 Years (339 | 11.6%) for women.
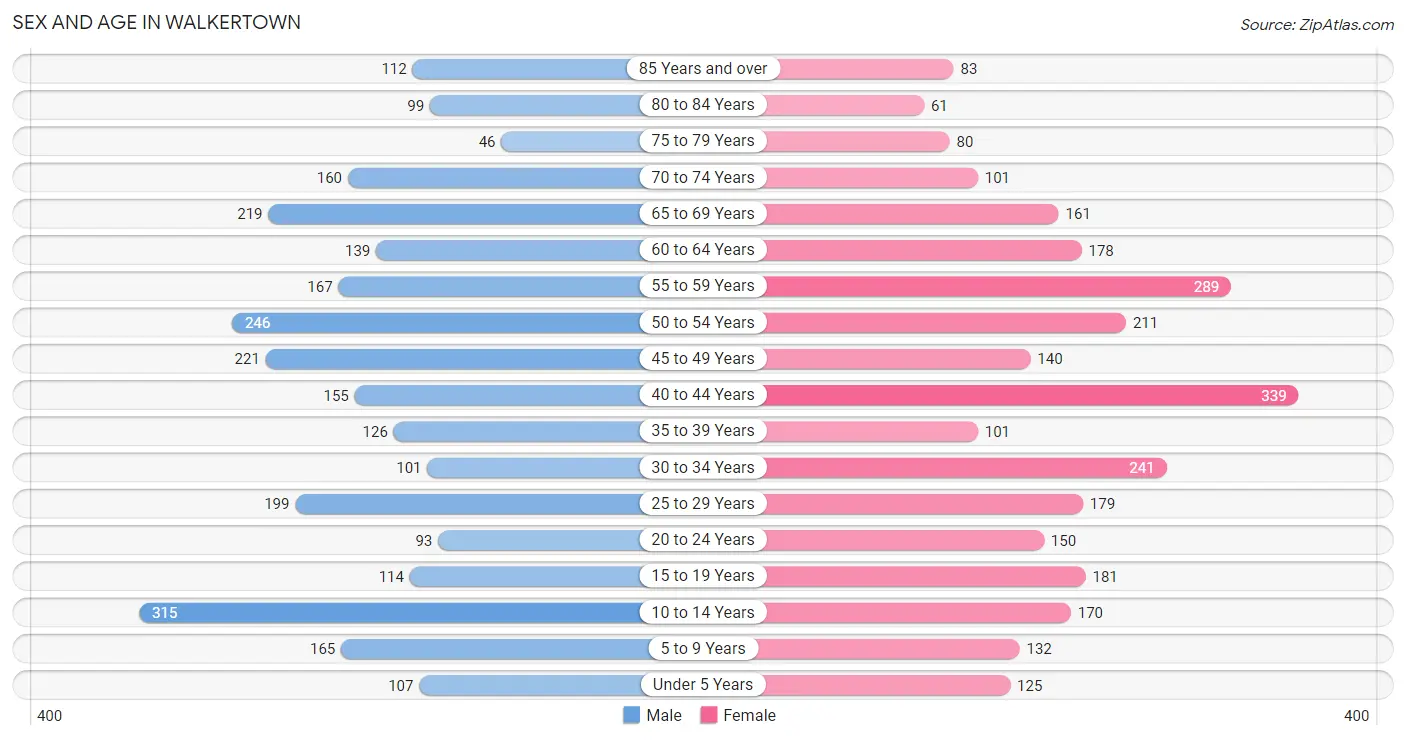
| Age Bracket | Male | Female |
| Under 5 Years | 107 (3.8%) | 125 (4.3%) |
| 5 to 9 Years | 165 (5.9%) | 132 (4.5%) |
| 10 to 14 Years | 315 (11.3%) | 170 (5.8%) |
| 15 to 19 Years | 114 (4.1%) | 181 (6.2%) |
| 20 to 24 Years | 93 (3.3%) | 150 (5.1%) |
| 25 to 29 Years | 199 (7.1%) | 179 (6.1%) |
| 30 to 34 Years | 101 (3.6%) | 241 (8.3%) |
| 35 to 39 Years | 126 (4.5%) | 101 (3.5%) |
| 40 to 44 Years | 155 (5.6%) | 339 (11.6%) |
| 45 to 49 Years | 221 (7.9%) | 140 (4.8%) |
| 50 to 54 Years | 246 (8.8%) | 211 (7.2%) |
| 55 to 59 Years | 167 (6.0%) | 289 (9.9%) |
| 60 to 64 Years | 139 (5.0%) | 178 (6.1%) |
| 65 to 69 Years | 219 (7.9%) | 161 (5.5%) |
| 70 to 74 Years | 160 (5.8%) | 101 (3.5%) |
| 75 to 79 Years | 46 (1.7%) | 80 (2.7%) |
| 80 to 84 Years | 99 (3.6%) | 61 (2.1%) |
| 85 Years and over | 112 (4.0%) | 83 (2.8%) |
| Total | 2,784 (100.0%) | 2,922 (100.0%) |
Families and Households in Walkertown
Median Family Size in Walkertown
The median family size in Walkertown is 2.88 persons per family, with single female/mother families (287 | 17.8%) accounting for the largest median family size of 3.06 persons per family. On the other hand, single male/father families (198 | 12.3%) represent the smallest median family size with 2.32 persons per family.
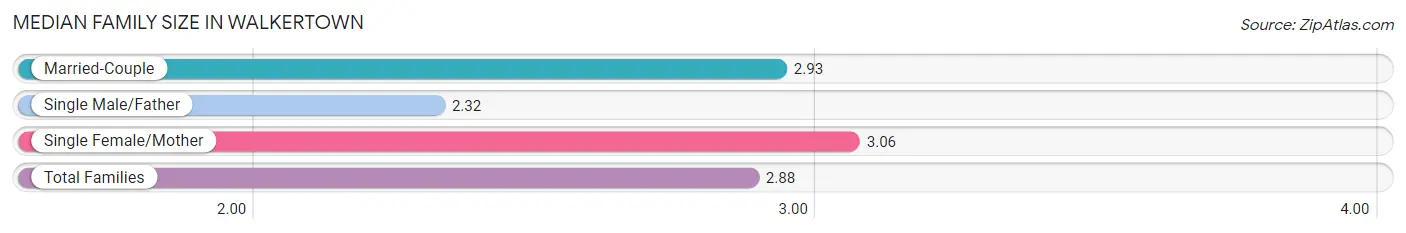
| Family Type | # Families | Family Size |
| Married-Couple | 1,130 (70.0%) | 2.93 |
| Single Male/Father | 198 (12.3%) | 2.32 |
| Single Female/Mother | 287 (17.8%) | 3.06 |
| Total Families | 1,615 (100.0%) | 2.88 |
Median Household Size in Walkertown
The median household size in Walkertown is 2.38 persons per household, with single female/mother households (287 | 12.0%) accounting for the largest median household size of 3.31 persons per household. non-family households (779 | 32.5%) represent the smallest median household size with 1.13 persons per household.
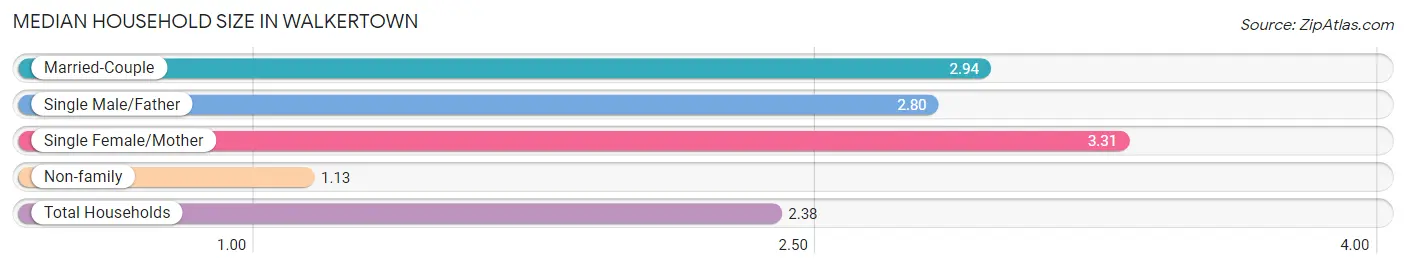
| Household Type | # Households | Household Size |
| Married-Couple | 1,130 (47.2%) | 2.94 |
| Single Male/Father | 198 (8.3%) | 2.80 |
| Single Female/Mother | 287 (12.0%) | 3.31 |
| Non-family | 779 (32.5%) | 1.13 |
| Total Households | 2,394 (100.0%) | 2.38 |
Household Size by Marriage Status in Walkertown
Out of a total of 2,394 households in Walkertown, 1,615 (67.5%) are family households, while 779 (32.5%) are nonfamily households. The most numerous type of family households are 2-person households, comprising 930, and the most common type of nonfamily households are 1-person households, comprising 691.
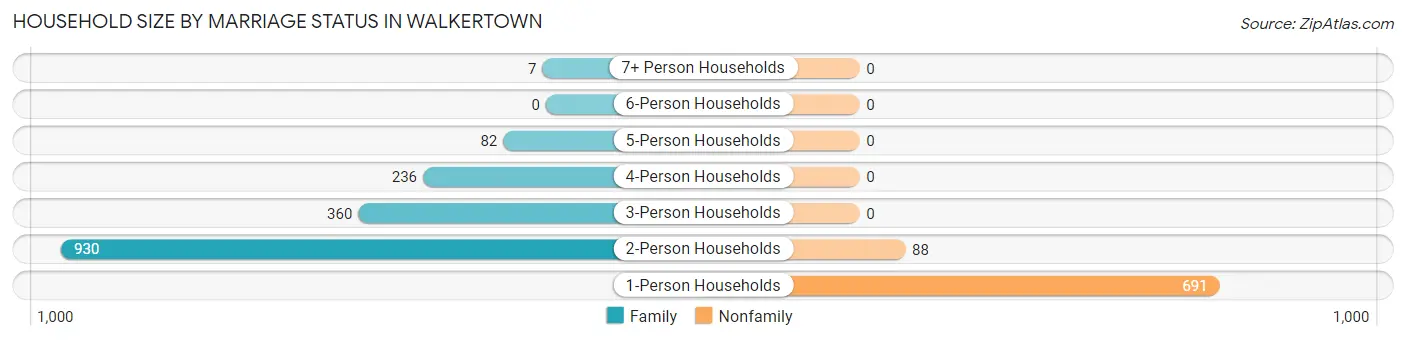
| Household Size | Family Households | Nonfamily Households |
| 1-Person Households | - | 691 (28.9%) |
| 2-Person Households | 930 (38.9%) | 88 (3.7%) |
| 3-Person Households | 360 (15.0%) | 0 (0.0%) |
| 4-Person Households | 236 (9.9%) | 0 (0.0%) |
| 5-Person Households | 82 (3.4%) | 0 (0.0%) |
| 6-Person Households | 0 (0.0%) | 0 (0.0%) |
| 7+ Person Households | 7 (0.3%) | 0 (0.0%) |
| Total | 1,615 (67.5%) | 779 (32.5%) |
Female Fertility in Walkertown
Fertility by Age in Walkertown
Average fertility rate in Walkertown is 82.0 births per 1,000 women. Women in the age bracket of 20 to 34 years have the highest fertility rate with 191.0 births per 1,000 women. Women in the age bracket of 20 to 34 years acount for 100.0% of all women with births.
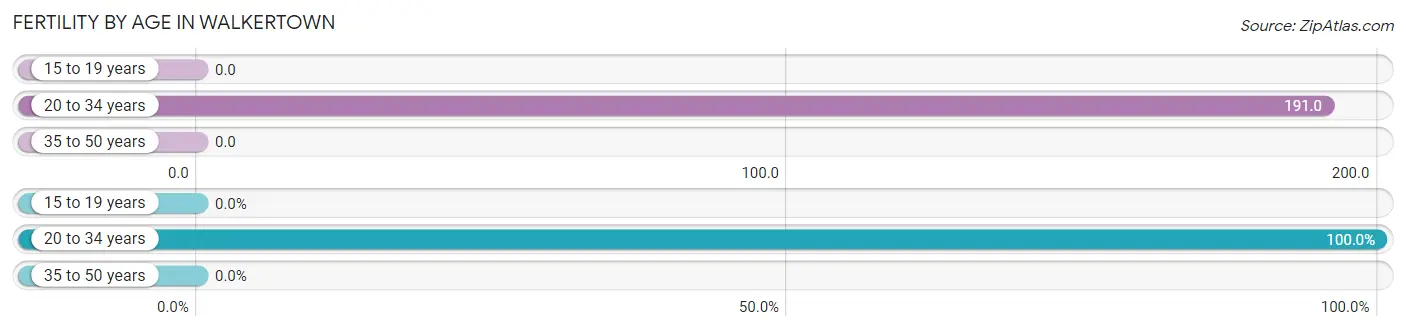
| Age Bracket | Women with Births | Births / 1,000 Women |
| 15 to 19 years | 0 (0.0%) | 0.0 |
| 20 to 34 years | 109 (100.0%) | 191.0 |
| 35 to 50 years | 0 (0.0%) | 0.0 |
| Total | 109 (100.0%) | 82.0 |
Fertility by Age by Marriage Status in Walkertown
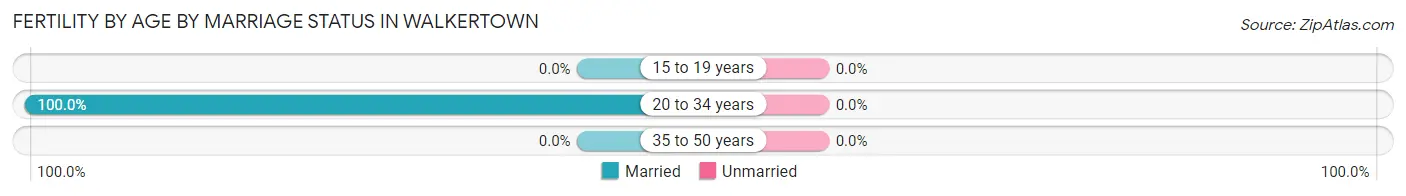
| Age Bracket | Married | Unmarried |
| 15 to 19 years | 0 (0.0%) | 0 (0.0%) |
| 20 to 34 years | 109 (100.0%) | 0 (0.0%) |
| 35 to 50 years | 0 (0.0%) | 0 (0.0%) |
| Total | 109 (100.0%) | 0 (0.0%) |
Fertility by Education in Walkertown
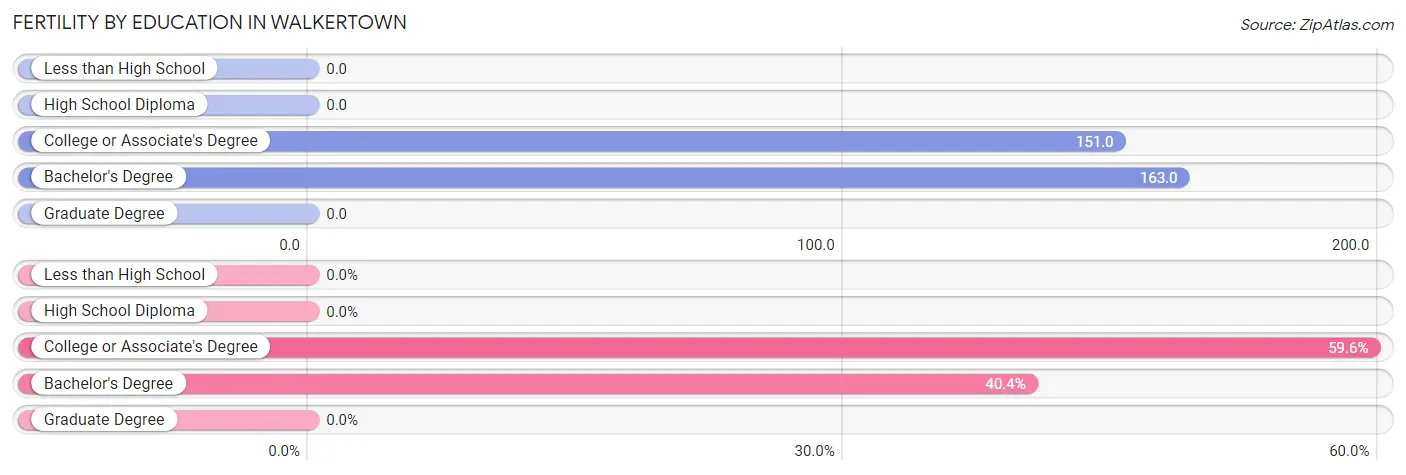
| Educational Attainment | Women with Births | Births / 1,000 Women |
| Less than High School | 0 (0.0%) | 0.0 |
| High School Diploma | 0 (0.0%) | 0.0 |
| College or Associate's Degree | 65 (59.6%) | 151.0 |
| Bachelor's Degree | 44 (40.4%) | 163.0 |
| Graduate Degree | 0 (0.0%) | 0.0 |
| Total | 109 (100.0%) | 82.0 |
Fertility by Education by Marriage Status in Walkertown
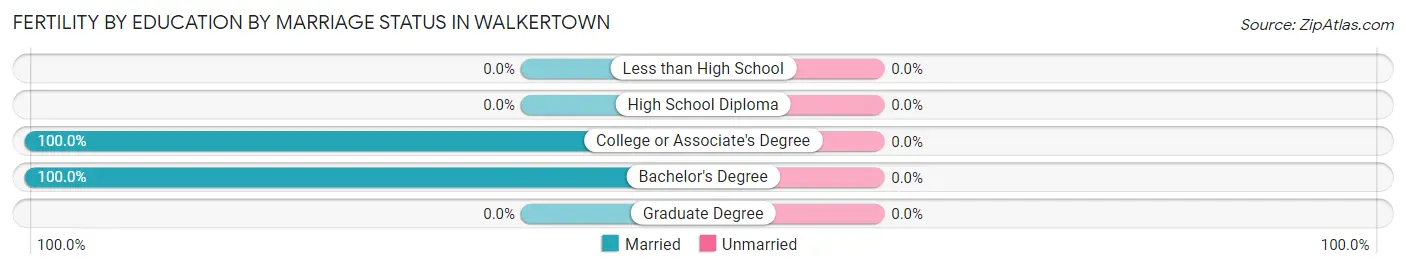
| Educational Attainment | Married | Unmarried |
| Less than High School | 0 (0.0%) | 0 (0.0%) |
| High School Diploma | 0 (0.0%) | 0 (0.0%) |
| College or Associate's Degree | 65 (100.0%) | 0 (0.0%) |
| Bachelor's Degree | 44 (100.0%) | 0 (0.0%) |
| Graduate Degree | 0 (0.0%) | 0 (0.0%) |
| Total | 109 (100.0%) | 0 (0.0%) |
Employment Characteristics in Walkertown
Employment by Class of Employer in Walkertown
Among the 2,612 employed individuals in Walkertown, private company employees (1,893 | 72.5%), not-for-profit organizations (240 | 9.2%), and local government employees (168 | 6.4%) make up the most common classes of employment.
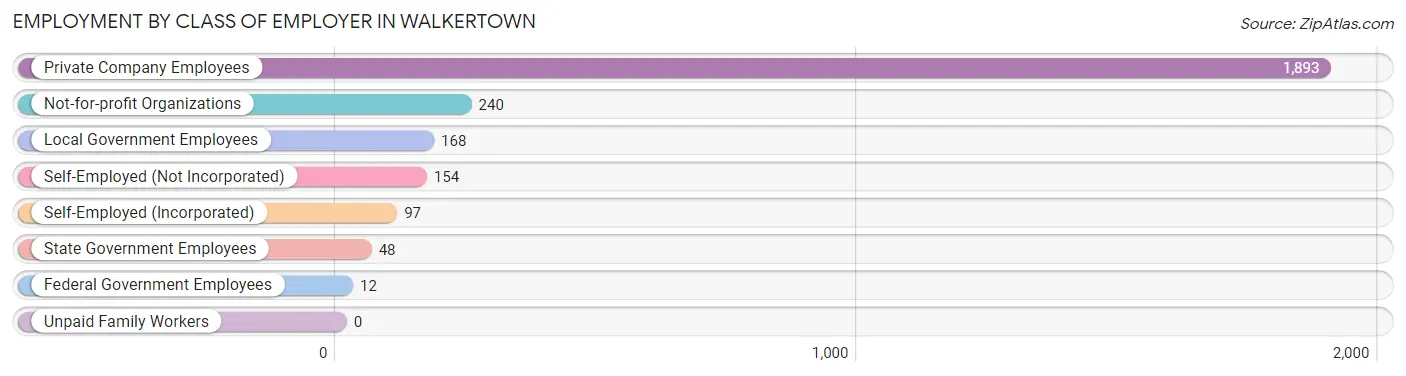
| Employer Class | # Employees | % Employees |
| Private Company Employees | 1,893 | 72.5% |
| Self-Employed (Incorporated) | 97 | 3.7% |
| Self-Employed (Not Incorporated) | 154 | 5.9% |
| Not-for-profit Organizations | 240 | 9.2% |
| Local Government Employees | 168 | 6.4% |
| State Government Employees | 48 | 1.8% |
| Federal Government Employees | 12 | 0.5% |
| Unpaid Family Workers | 0 | 0.0% |
| Total | 2,612 | 100.0% |
Employment Status by Age in Walkertown
According to the labor force statistics for Walkertown, out of the total population over 16 years of age (4,644), 59.7% or 2,772 individuals are in the labor force, with 1.9% or 53 of them unemployed. The age group with the highest labor force participation rate is 25 to 29 years, with 86.0% or 325 individuals in the labor force. Within the labor force, the 16 to 19 years age range has the highest percentage of unemployed individuals, with 21.5% or 34 of them being unemployed.
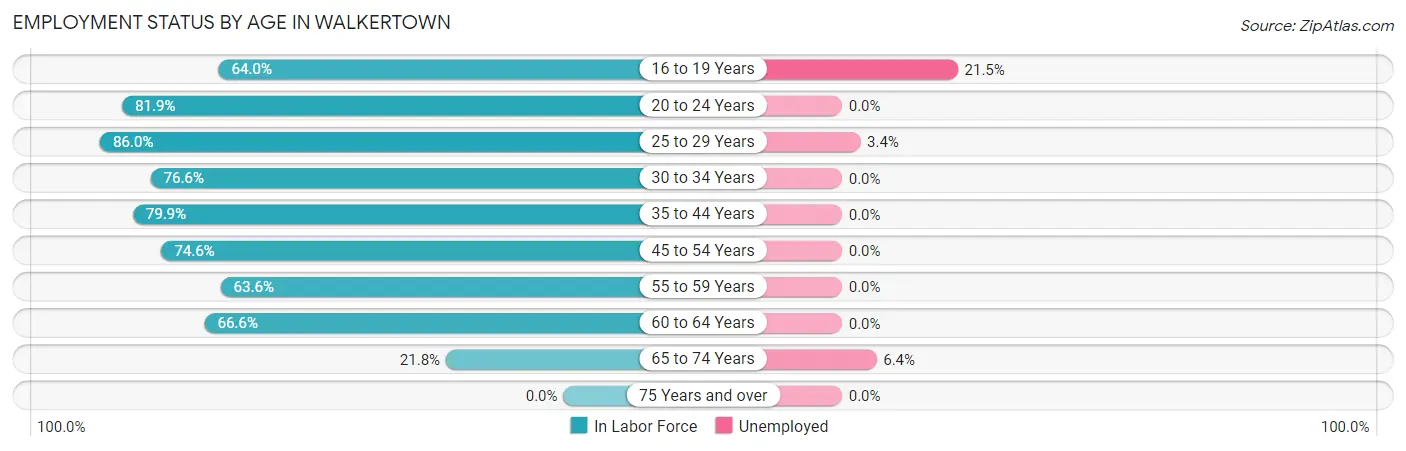
| Age Bracket | In Labor Force | Unemployed |
| 16 to 19 Years | 158 (64.0%) | 34 (21.5%) |
| 20 to 24 Years | 199 (81.9%) | 0 (0.0%) |
| 25 to 29 Years | 325 (86.0%) | 11 (3.4%) |
| 30 to 34 Years | 262 (76.6%) | 0 (0.0%) |
| 35 to 44 Years | 576 (79.9%) | 0 (0.0%) |
| 45 to 54 Years | 610 (74.6%) | 0 (0.0%) |
| 55 to 59 Years | 290 (63.6%) | 0 (0.0%) |
| 60 to 64 Years | 211 (66.6%) | 0 (0.0%) |
| 65 to 74 Years | 140 (21.8%) | 9 (6.4%) |
| 75 Years and over | 0 (0.0%) | 0 (0.0%) |
| Total | 2,772 (59.7%) | 53 (1.9%) |
Employment Status by Educational Attainment in Walkertown
According to labor force statistics for Walkertown, 75.0% of individuals (2,274) out of the total population between 25 and 64 years of age (3,032) are in the labor force, with 0.5% or 11 of them being unemployed. The group with the highest labor force participation rate are those with the educational attainment of college / associate degree, with 89.2% or 777 individuals in the labor force. Within the labor force, individuals with bachelor's degree or higher education have the highest percentage of unemployment, with 1.3% or 11 of them being unemployed.
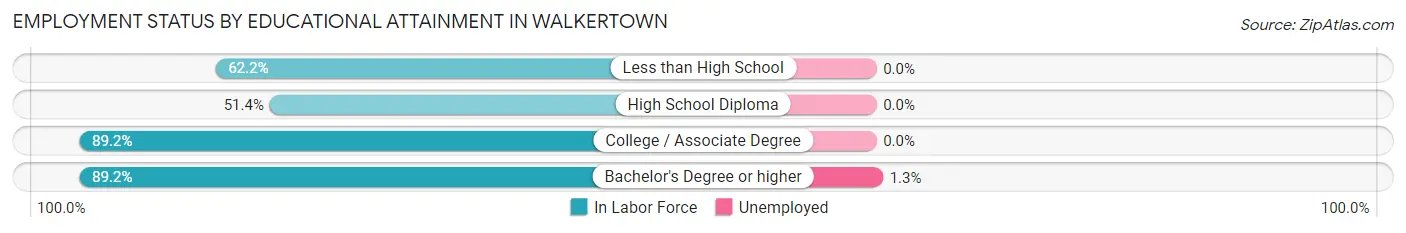
| Educational Attainment | In Labor Force | Unemployed |
| Less than High School | 143 (62.2%) | 0 (0.0%) |
| High School Diploma | 501 (51.4%) | 0 (0.0%) |
| College / Associate Degree | 777 (89.2%) | 0 (0.0%) |
| Bachelor's Degree or higher | 853 (89.2%) | 12 (1.3%) |
| Total | 2,274 (75.0%) | 15 (0.5%) |
Employment Occupations by Sex in Walkertown
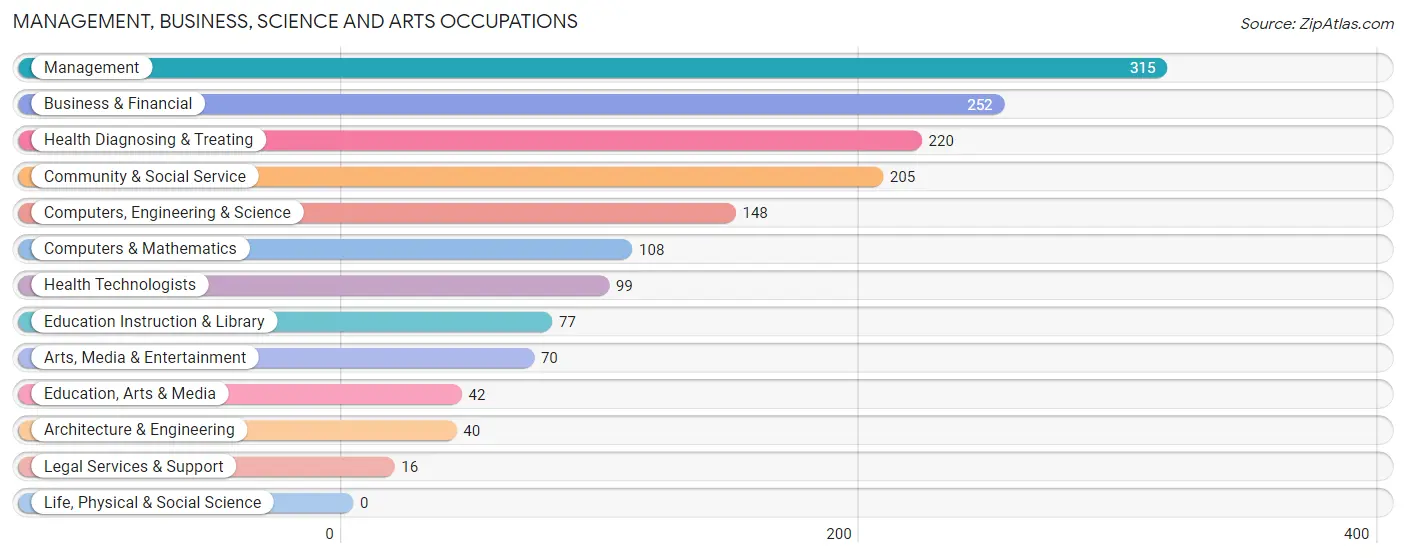
Management, Business, Science and Arts Occupations
The most common Management, Business, Science and Arts occupations in Walkertown are Management (315 | 11.6%), Business & Financial (252 | 9.3%), Health Diagnosing & Treating (220 | 8.1%), Community & Social Service (205 | 7.5%), and Computers, Engineering & Science (148 | 5.4%).
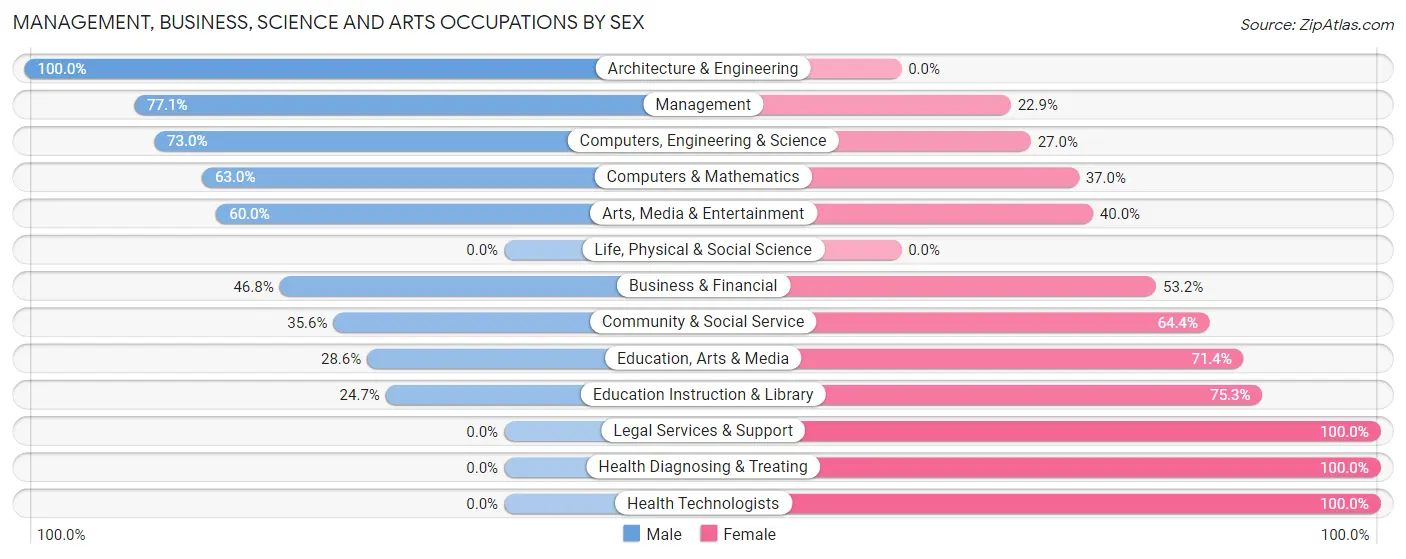
Management, Business, Science and Arts Occupations by Sex
Within the Management, Business, Science and Arts occupations in Walkertown, the most male-oriented occupations are Architecture & Engineering (100.0%), Management (77.1%), and Computers, Engineering & Science (73.0%), while the most female-oriented occupations are Legal Services & Support (100.0%), Health Diagnosing & Treating (100.0%), and Health Technologists (100.0%).
| Occupation | Male | Female |
| Management | 243 (77.1%) | 72 (22.9%) |
| Business & Financial | 118 (46.8%) | 134 (53.2%) |
| Computers, Engineering & Science | 108 (73.0%) | 40 (27.0%) |
| Computers & Mathematics | 68 (63.0%) | 40 (37.0%) |
| Architecture & Engineering | 40 (100.0%) | 0 (0.0%) |
| Life, Physical & Social Science | 0 (0.0%) | 0 (0.0%) |
| Community & Social Service | 73 (35.6%) | 132 (64.4%) |
| Education, Arts & Media | 12 (28.6%) | 30 (71.4%) |
| Legal Services & Support | 0 (0.0%) | 16 (100.0%) |
| Education Instruction & Library | 19 (24.7%) | 58 (75.3%) |
| Arts, Media & Entertainment | 42 (60.0%) | 28 (40.0%) |
| Health Diagnosing & Treating | 0 (0.0%) | 220 (100.0%) |
| Health Technologists | 0 (0.0%) | 99 (100.0%) |
| Total (Category) | 542 (47.5%) | 598 (52.5%) |
| Total (Overall) | 1,345 (49.5%) | 1,372 (50.5%) |
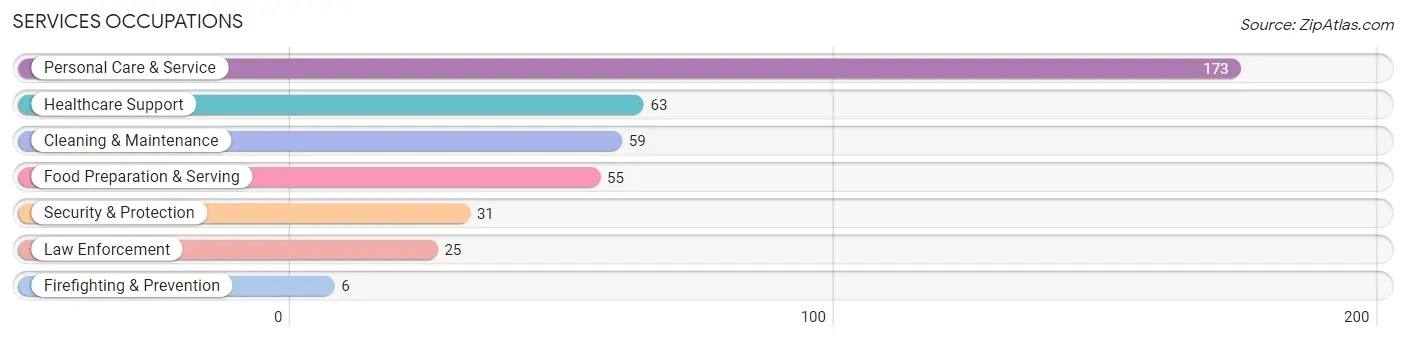
Services Occupations
The most common Services occupations in Walkertown are Personal Care & Service (173 | 6.4%), Healthcare Support (63 | 2.3%), Cleaning & Maintenance (59 | 2.2%), Food Preparation & Serving (55 | 2.0%), and Security & Protection (31 | 1.1%).
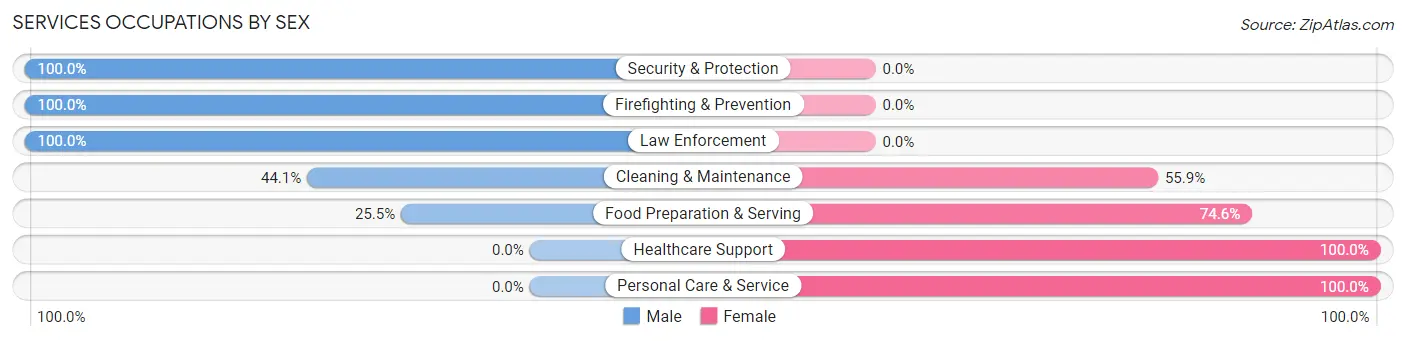
Services Occupations by Sex
Within the Services occupations in Walkertown, the most male-oriented occupations are Security & Protection (100.0%), Firefighting & Prevention (100.0%), and Law Enforcement (100.0%), while the most female-oriented occupations are Healthcare Support (100.0%), Personal Care & Service (100.0%), and Food Preparation & Serving (74.6%).
| Occupation | Male | Female |
| Healthcare Support | 0 (0.0%) | 63 (100.0%) |
| Security & Protection | 31 (100.0%) | 0 (0.0%) |
| Firefighting & Prevention | 6 (100.0%) | 0 (0.0%) |
| Law Enforcement | 25 (100.0%) | 0 (0.0%) |
| Food Preparation & Serving | 14 (25.5%) | 41 (74.6%) |
| Cleaning & Maintenance | 26 (44.1%) | 33 (55.9%) |
| Personal Care & Service | 0 (0.0%) | 173 (100.0%) |
| Total (Category) | 71 (18.6%) | 310 (81.4%) |
| Total (Overall) | 1,345 (49.5%) | 1,372 (50.5%) |
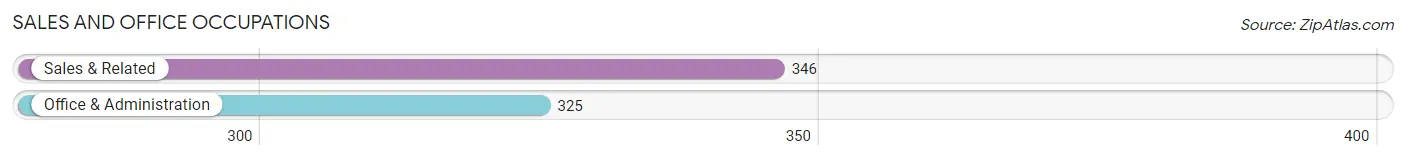
Sales and Office Occupations
The most common Sales and Office occupations in Walkertown are Sales & Related (346 | 12.7%), and Office & Administration (325 | 12.0%).
Sales and Office Occupations by Sex

| Occupation | Male | Female |
| Sales & Related | 188 (54.3%) | 158 (45.7%) |
| Office & Administration | 27 (8.3%) | 298 (91.7%) |
| Total (Category) | 215 (32.0%) | 456 (68.0%) |
| Total (Overall) | 1,345 (49.5%) | 1,372 (50.5%) |
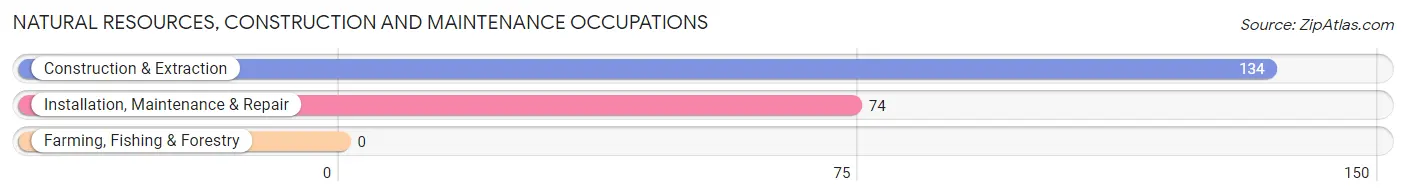
Natural Resources, Construction and Maintenance Occupations
The most common Natural Resources, Construction and Maintenance occupations in Walkertown are Construction & Extraction (134 | 4.9%), and Installation, Maintenance & Repair (74 | 2.7%).
Natural Resources, Construction and Maintenance Occupations by Sex
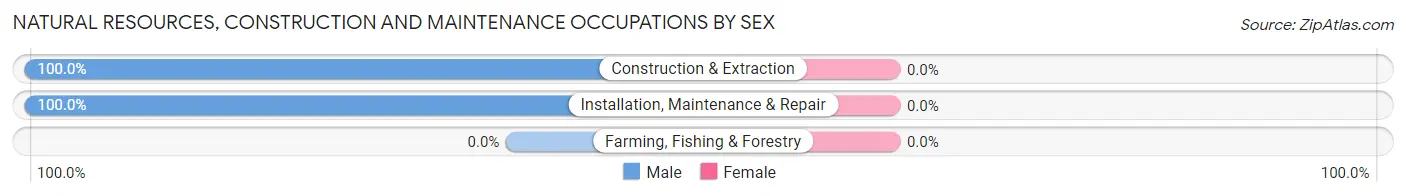
| Occupation | Male | Female |
| Farming, Fishing & Forestry | 0 (0.0%) | 0 (0.0%) |
| Construction & Extraction | 134 (100.0%) | 0 (0.0%) |
| Installation, Maintenance & Repair | 74 (100.0%) | 0 (0.0%) |
| Total (Category) | 208 (100.0%) | 0 (0.0%) |
| Total (Overall) | 1,345 (49.5%) | 1,372 (50.5%) |
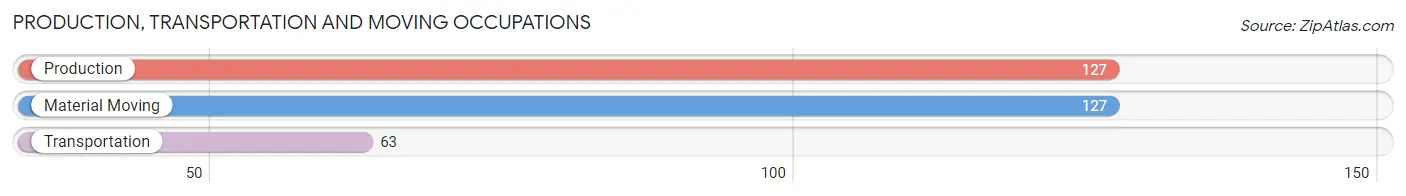
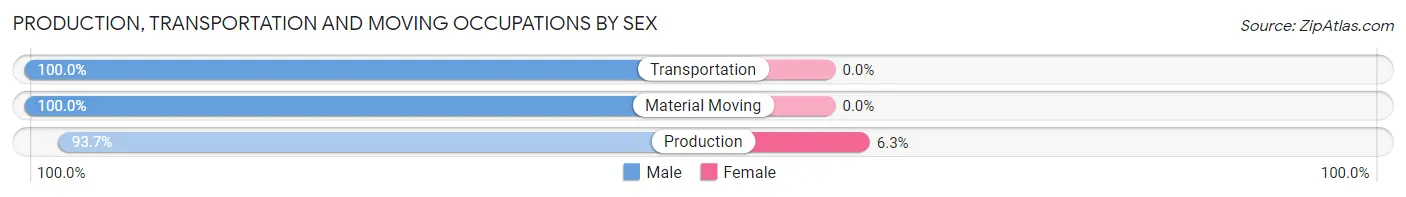
Production, Transportation and Moving Occupations
The most common Production, Transportation and Moving occupations in Walkertown are Production (127 | 4.7%), Material Moving (127 | 4.7%), and Transportation (63 | 2.3%).
Production, Transportation and Moving Occupations by Sex
| Occupation | Male | Female |
| Production | 119 (93.7%) | 8 (6.3%) |
| Transportation | 63 (100.0%) | 0 (0.0%) |
| Material Moving | 127 (100.0%) | 0 (0.0%) |
| Total (Category) | 309 (97.5%) | 8 (2.5%) |
| Total (Overall) | 1,345 (49.5%) | 1,372 (50.5%) |
Employment Industries by Sex in Walkertown
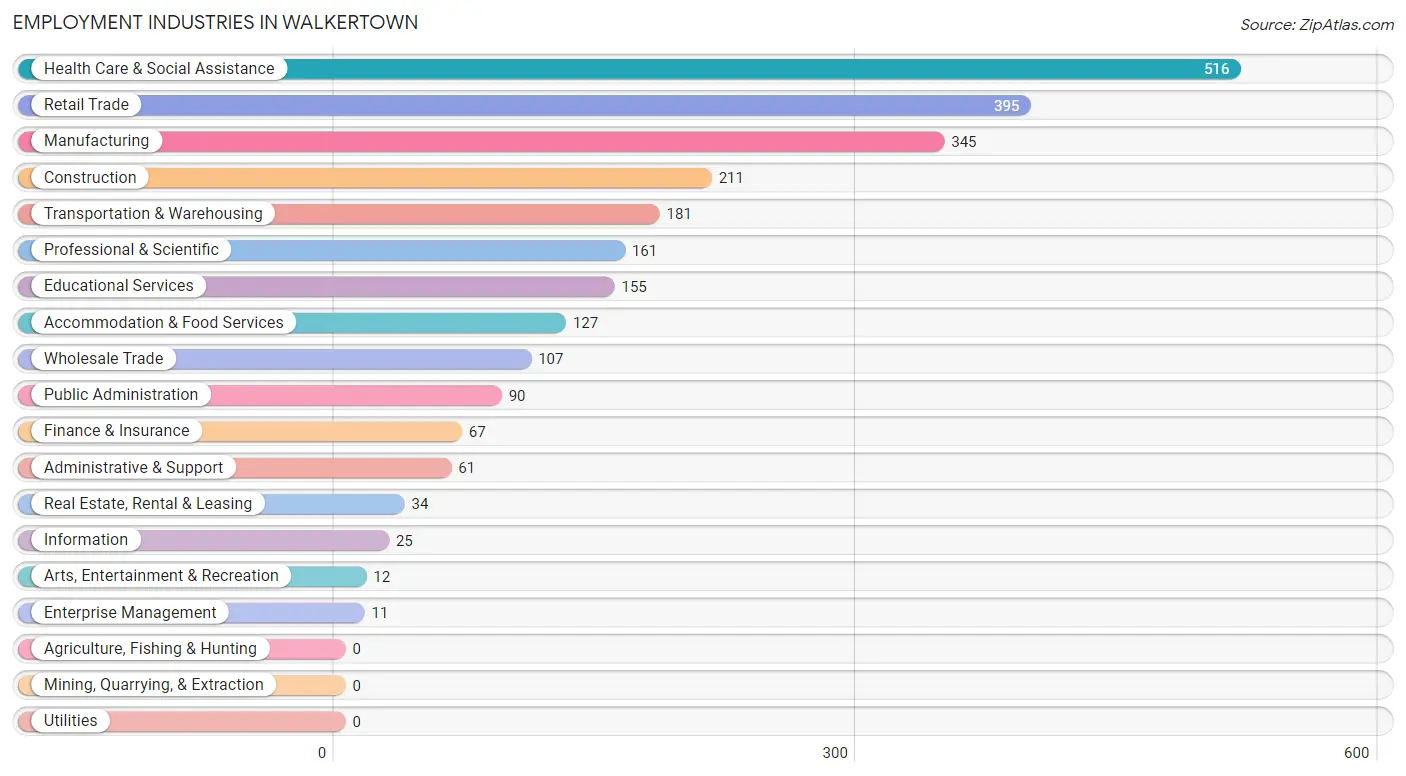
Employment Industries in Walkertown
The major employment industries in Walkertown include Health Care & Social Assistance (516 | 19.0%), Retail Trade (395 | 14.5%), Manufacturing (345 | 12.7%), Construction (211 | 7.8%), and Transportation & Warehousing (181 | 6.7%).
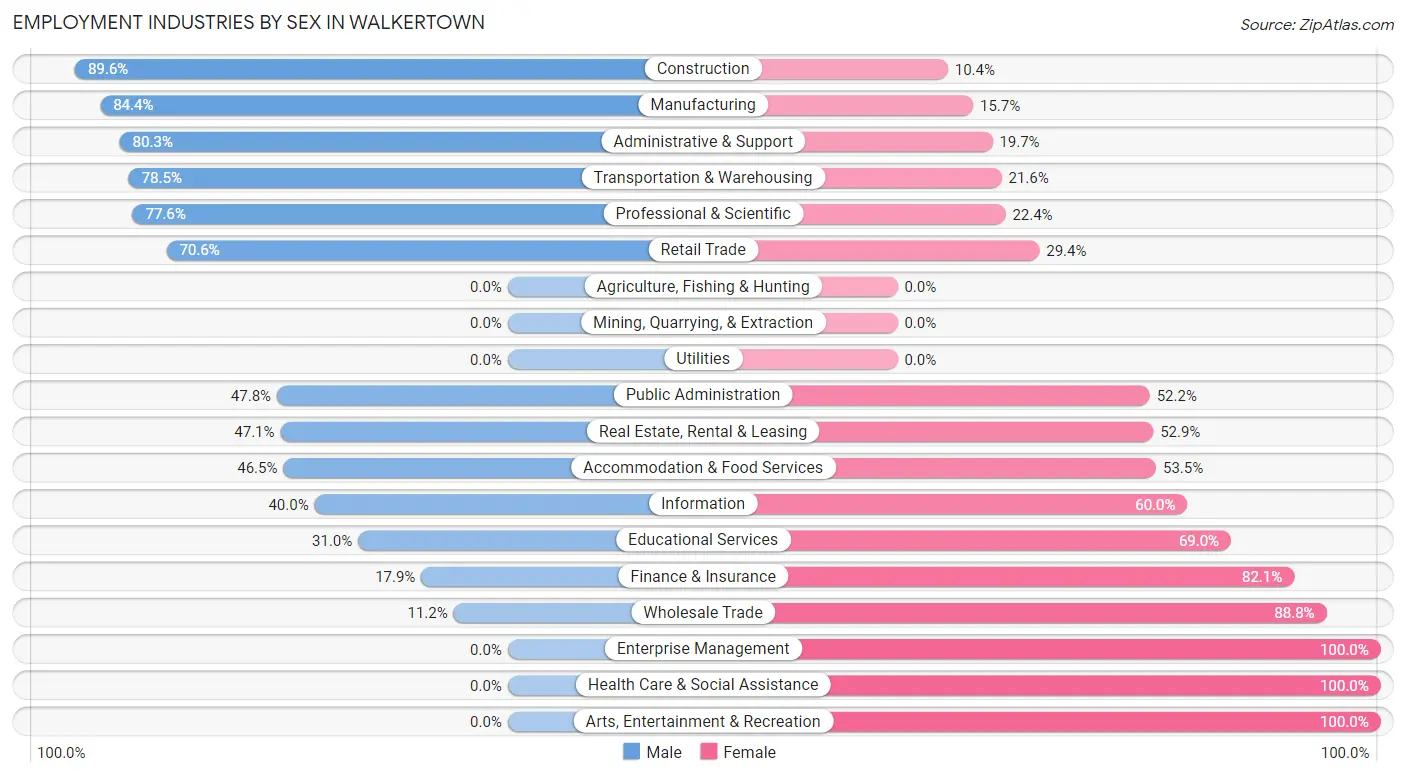
Employment Industries by Sex in Walkertown
The Walkertown industries that see more men than women are Construction (89.6%), Manufacturing (84.4%), and Administrative & Support (80.3%), whereas the industries that tend to have a higher number of women are Enterprise Management (100.0%), Health Care & Social Assistance (100.0%), and Arts, Entertainment & Recreation (100.0%).
| Industry | Male | Female |
| Agriculture, Fishing & Hunting | 0 (0.0%) | 0 (0.0%) |
| Mining, Quarrying, & Extraction | 0 (0.0%) | 0 (0.0%) |
| Construction | 189 (89.6%) | 22 (10.4%) |
| Manufacturing | 291 (84.4%) | 54 (15.7%) |
| Wholesale Trade | 12 (11.2%) | 95 (88.8%) |
| Retail Trade | 279 (70.6%) | 116 (29.4%) |
| Transportation & Warehousing | 142 (78.4%) | 39 (21.5%) |
| Utilities | 0 (0.0%) | 0 (0.0%) |
| Information | 10 (40.0%) | 15 (60.0%) |
| Finance & Insurance | 12 (17.9%) | 55 (82.1%) |
| Real Estate, Rental & Leasing | 16 (47.1%) | 18 (52.9%) |
| Professional & Scientific | 125 (77.6%) | 36 (22.4%) |
| Enterprise Management | 0 (0.0%) | 11 (100.0%) |
| Administrative & Support | 49 (80.3%) | 12 (19.7%) |
| Educational Services | 48 (31.0%) | 107 (69.0%) |
| Health Care & Social Assistance | 0 (0.0%) | 516 (100.0%) |
| Arts, Entertainment & Recreation | 0 (0.0%) | 12 (100.0%) |
| Accommodation & Food Services | 59 (46.5%) | 68 (53.5%) |
| Public Administration | 43 (47.8%) | 47 (52.2%) |
| Total | 1,345 (49.5%) | 1,372 (50.5%) |
Education in Walkertown
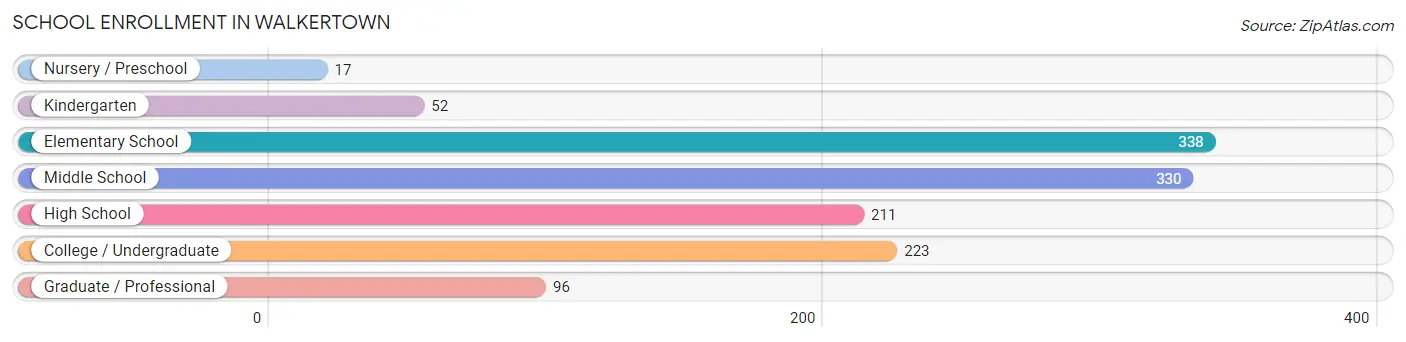
School Enrollment in Walkertown
The most common levels of schooling among the 1,267 students in Walkertown are elementary school (338 | 26.7%), middle school (330 | 26.1%), and college / undergraduate (223 | 17.6%).
| School Level | # Students | % Students |
| Nursery / Preschool | 17 | 1.3% |
| Kindergarten | 52 | 4.1% |
| Elementary School | 338 | 26.7% |
| Middle School | 330 | 26.1% |
| High School | 211 | 16.7% |
| College / Undergraduate | 223 | 17.6% |
| Graduate / Professional | 96 | 7.6% |
| Total | 1,267 | 100.0% |
School Enrollment by Age by Funding Source in Walkertown
Out of a total of 1,267 students who are enrolled in schools in Walkertown, 136 (10.7%) attend a private institution, while the remaining 1,131 (89.3%) are enrolled in public schools. The age group of 3 to 4 year olds has the highest likelihood of being enrolled in private schools, with 17 (100.0% in the age bracket) enrolled. Conversely, the age group of 15 to 17 year olds has the lowest likelihood of being enrolled in a private school, with 142 (100.0% in the age bracket) attending a public institution.
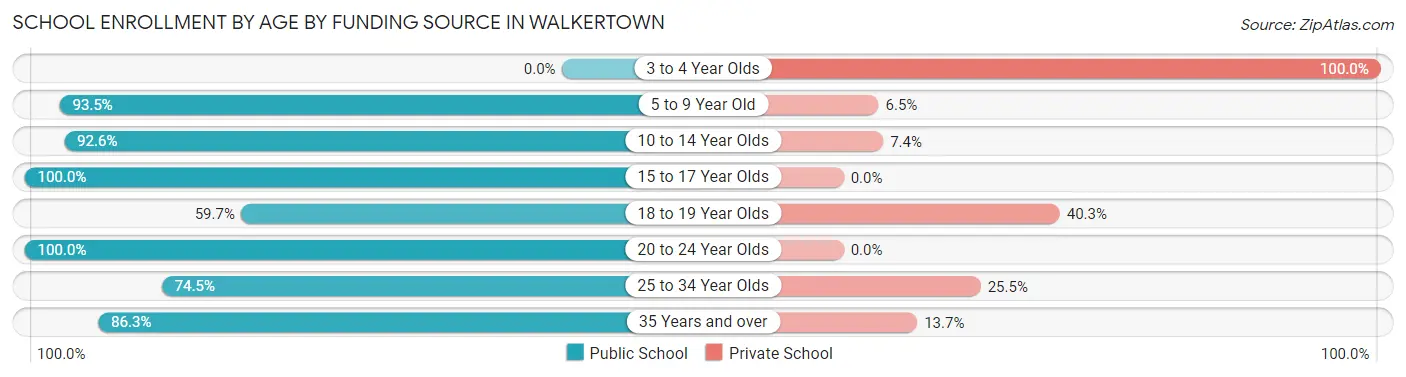
| Age Bracket | Public School | Private School |
| 3 to 4 Year Olds | 0 (0.0%) | 17 (100.0%) |
| 5 to 9 Year Old | 259 (93.5%) | 18 (6.5%) |
| 10 to 14 Year Olds | 440 (92.6%) | 35 (7.4%) |
| 15 to 17 Year Olds | 142 (100.0%) | 0 (0.0%) |
| 18 to 19 Year Olds | 46 (59.7%) | 31 (40.3%) |
| 20 to 24 Year Olds | 112 (100.0%) | 0 (0.0%) |
| 25 to 34 Year Olds | 70 (74.5%) | 24 (25.5%) |
| 35 Years and over | 63 (86.3%) | 10 (13.7%) |
| Total | 1,131 (89.3%) | 136 (10.7%) |
Educational Attainment by Field of Study in Walkertown
Business (223 | 17.1%), arts & humanities (166 | 12.7%), education (128 | 9.8%), science & technology (125 | 9.6%), and communications (125 | 9.6%) are the most common fields of study among 1,305 individuals in Walkertown who have obtained a bachelor's degree or higher.
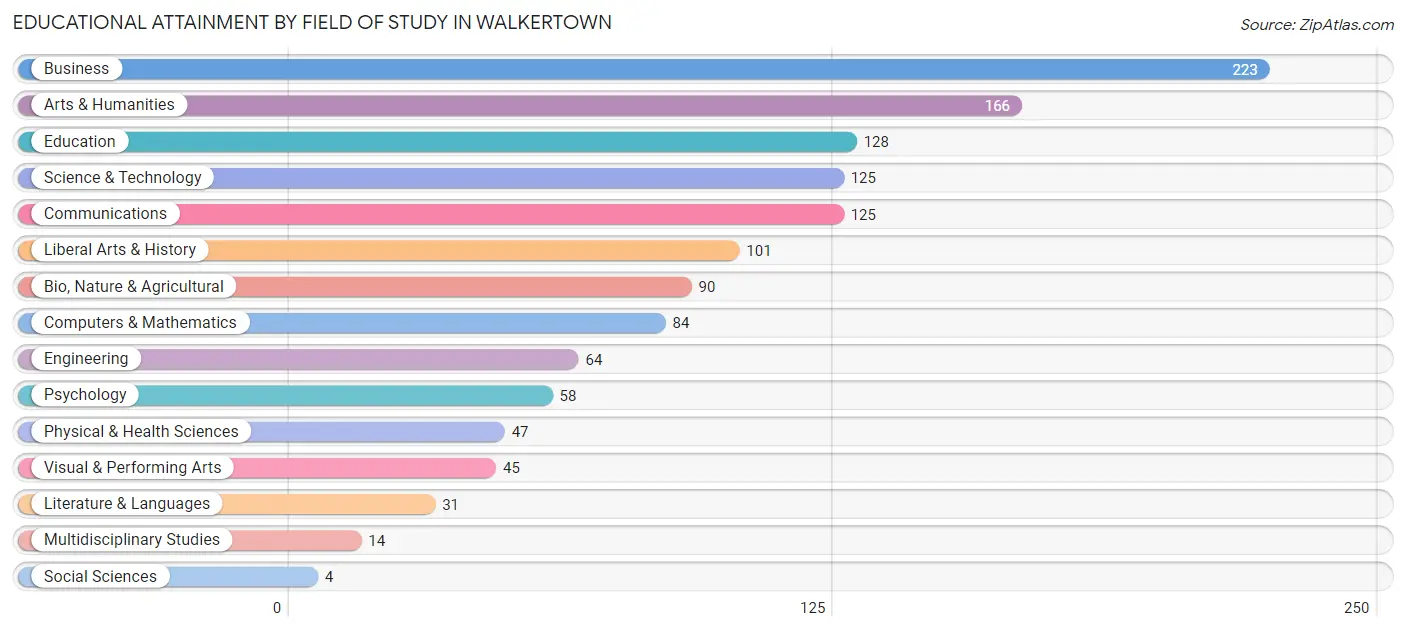
| Field of Study | # Graduates | % Graduates |
| Computers & Mathematics | 84 | 6.4% |
| Bio, Nature & Agricultural | 90 | 6.9% |
| Physical & Health Sciences | 47 | 3.6% |
| Psychology | 58 | 4.4% |
| Social Sciences | 4 | 0.3% |
| Engineering | 64 | 4.9% |
| Multidisciplinary Studies | 14 | 1.1% |
| Science & Technology | 125 | 9.6% |
| Business | 223 | 17.1% |
| Education | 128 | 9.8% |
| Literature & Languages | 31 | 2.4% |
| Liberal Arts & History | 101 | 7.7% |
| Visual & Performing Arts | 45 | 3.5% |
| Communications | 125 | 9.6% |
| Arts & Humanities | 166 | 12.7% |
| Total | 1,305 | 100.0% |
Transportation & Commute in Walkertown
Vehicle Availability by Sex in Walkertown
The most prevalent vehicle ownership categories in Walkertown are males with 2 vehicles (535, accounting for 40.2%) and females with 2 vehicles (381, making up 41.8%).
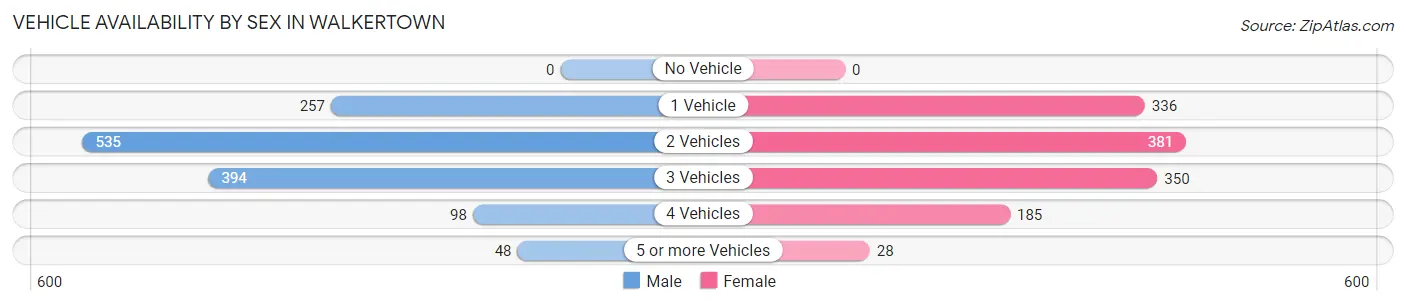
| Vehicles Available | Male | Female |
| No Vehicle | 0 (0.0%) | 0 (0.0%) |
| 1 Vehicle | 257 (19.3%) | 336 (26.3%) |
| 2 Vehicles | 535 (40.2%) | 381 (29.8%) |
| 3 Vehicles | 394 (29.6%) | 350 (27.3%) |
| 4 Vehicles | 98 (7.4%) | 185 (14.4%) |
| 5 or more Vehicles | 48 (3.6%) | 28 (2.2%) |
| Total | 1,332 (100.0%) | 1,280 (100.0%) |
Commute Time in Walkertown
The most frequently occuring commute durations in Walkertown are 20 to 24 minutes (459 commuters, 19.5%), 10 to 14 minutes (422 commuters, 17.9%), and 15 to 19 minutes (392 commuters, 16.7%).
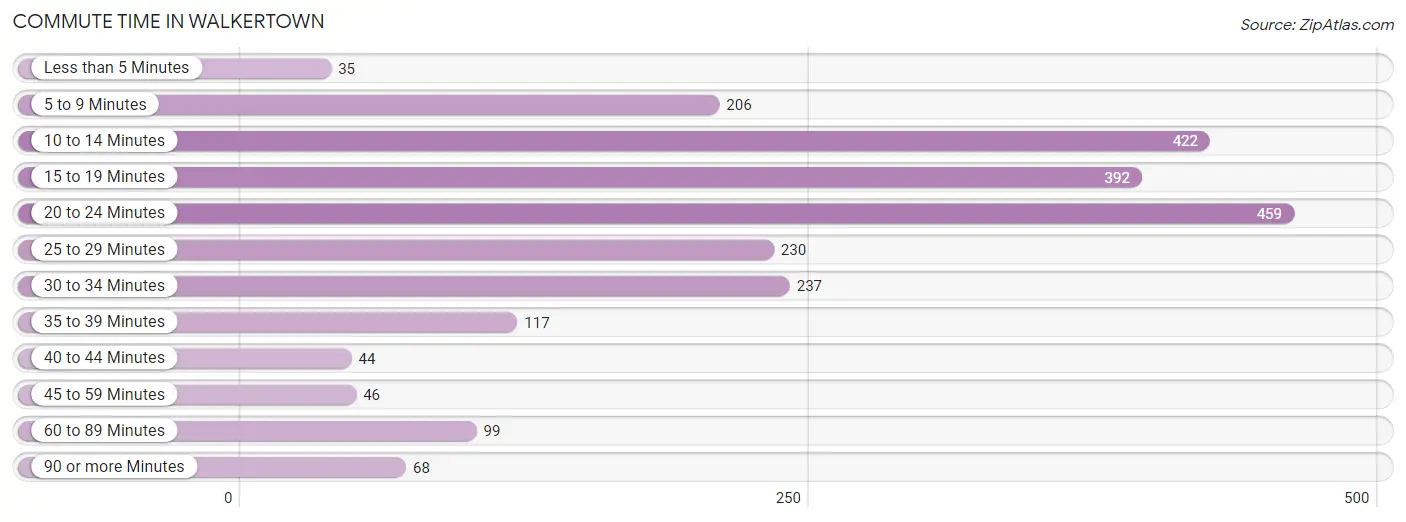
| Commute Time | # Commuters | % Commuters |
| Less than 5 Minutes | 35 | 1.5% |
| 5 to 9 Minutes | 206 | 8.7% |
| 10 to 14 Minutes | 422 | 17.9% |
| 15 to 19 Minutes | 392 | 16.7% |
| 20 to 24 Minutes | 459 | 19.5% |
| 25 to 29 Minutes | 230 | 9.8% |
| 30 to 34 Minutes | 237 | 10.1% |
| 35 to 39 Minutes | 117 | 5.0% |
| 40 to 44 Minutes | 44 | 1.9% |
| 45 to 59 Minutes | 46 | 1.9% |
| 60 to 89 Minutes | 99 | 4.2% |
| 90 or more Minutes | 68 | 2.9% |
Commute Time by Sex in Walkertown
The most common commute times in Walkertown are 20 to 24 minutes (257 commuters, 20.8%) for males and 10 to 14 minutes (238 commuters, 21.3%) for females.
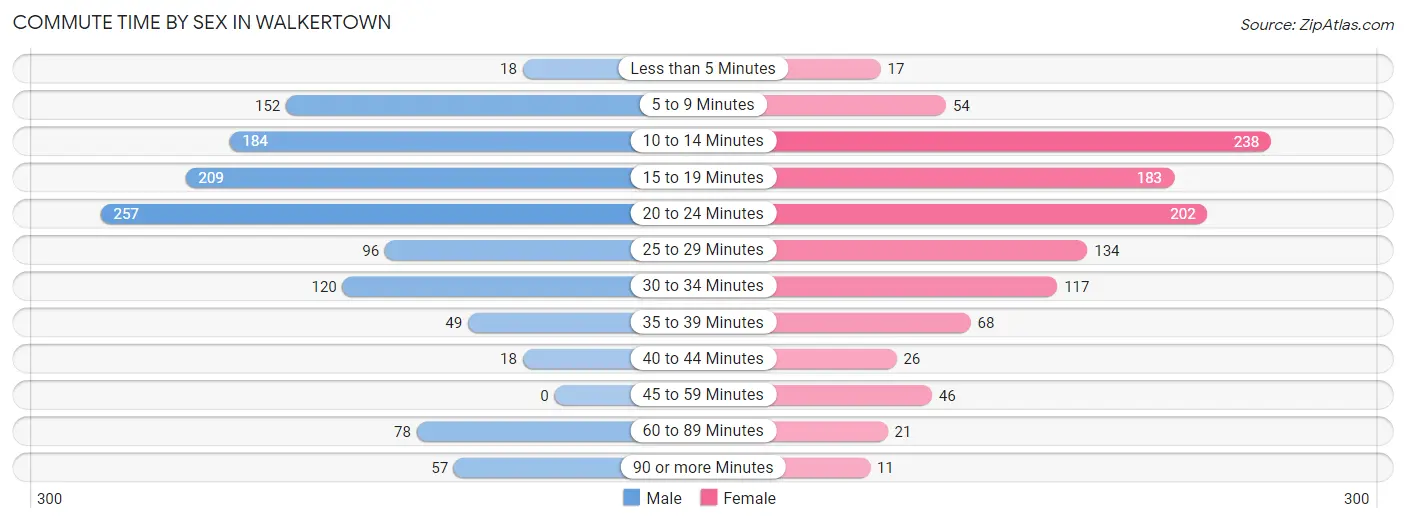
| Commute Time | Male | Female |
| Less than 5 Minutes | 18 (1.5%) | 17 (1.5%) |
| 5 to 9 Minutes | 152 (12.3%) | 54 (4.8%) |
| 10 to 14 Minutes | 184 (14.9%) | 238 (21.3%) |
| 15 to 19 Minutes | 209 (16.9%) | 183 (16.4%) |
| 20 to 24 Minutes | 257 (20.8%) | 202 (18.1%) |
| 25 to 29 Minutes | 96 (7.7%) | 134 (12.0%) |
| 30 to 34 Minutes | 120 (9.7%) | 117 (10.5%) |
| 35 to 39 Minutes | 49 (4.0%) | 68 (6.1%) |
| 40 to 44 Minutes | 18 (1.5%) | 26 (2.3%) |
| 45 to 59 Minutes | 0 (0.0%) | 46 (4.1%) |
| 60 to 89 Minutes | 78 (6.3%) | 21 (1.9%) |
| 90 or more Minutes | 57 (4.6%) | 11 (1.0%) |
Time of Departure to Work by Sex in Walkertown
The most frequent times of departure to work in Walkertown are 7:30 AM to 7:59 AM (180, 14.5%) for males and 7:00 AM to 7:29 AM (397, 35.5%) for females.
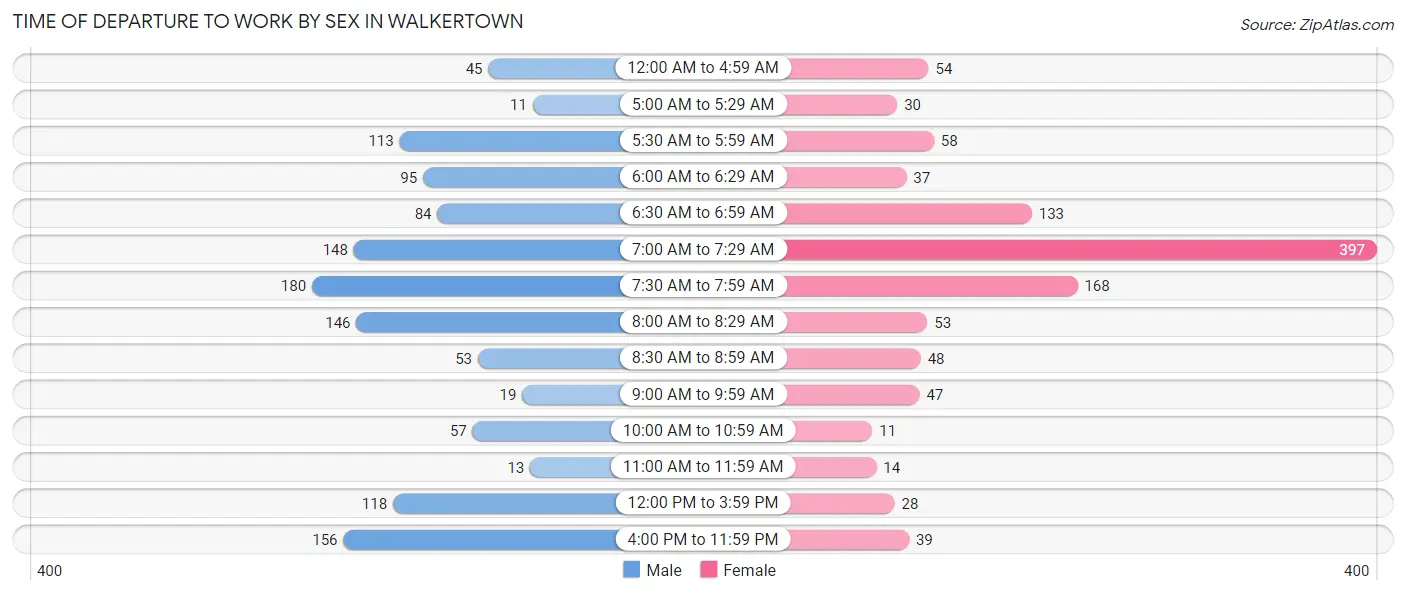
| Time of Departure | Male | Female |
| 12:00 AM to 4:59 AM | 45 (3.6%) | 54 (4.8%) |
| 5:00 AM to 5:29 AM | 11 (0.9%) | 30 (2.7%) |
| 5:30 AM to 5:59 AM | 113 (9.1%) | 58 (5.2%) |
| 6:00 AM to 6:29 AM | 95 (7.7%) | 37 (3.3%) |
| 6:30 AM to 6:59 AM | 84 (6.8%) | 133 (11.9%) |
| 7:00 AM to 7:29 AM | 148 (11.9%) | 397 (35.5%) |
| 7:30 AM to 7:59 AM | 180 (14.5%) | 168 (15.0%) |
| 8:00 AM to 8:29 AM | 146 (11.8%) | 53 (4.7%) |
| 8:30 AM to 8:59 AM | 53 (4.3%) | 48 (4.3%) |
| 9:00 AM to 9:59 AM | 19 (1.5%) | 47 (4.2%) |
| 10:00 AM to 10:59 AM | 57 (4.6%) | 11 (1.0%) |
| 11:00 AM to 11:59 AM | 13 (1.1%) | 14 (1.3%) |
| 12:00 PM to 3:59 PM | 118 (9.5%) | 28 (2.5%) |
| 4:00 PM to 11:59 PM | 156 (12.6%) | 39 (3.5%) |
| Total | 1,238 (100.0%) | 1,117 (100.0%) |
Housing Occupancy in Walkertown
Occupancy by Ownership in Walkertown
Of the total 2,394 dwellings in Walkertown, owner-occupied units account for 1,727 (72.1%), while renter-occupied units make up 667 (27.9%).
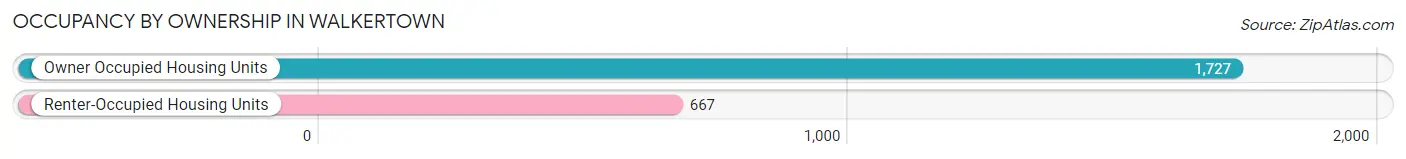
| Occupancy | # Housing Units | % Housing Units |
| Owner Occupied Housing Units | 1,727 | 72.1% |
| Renter-Occupied Housing Units | 667 | 27.9% |
| Total Occupied Housing Units | 2,394 | 100.0% |
Occupancy by Household Size in Walkertown
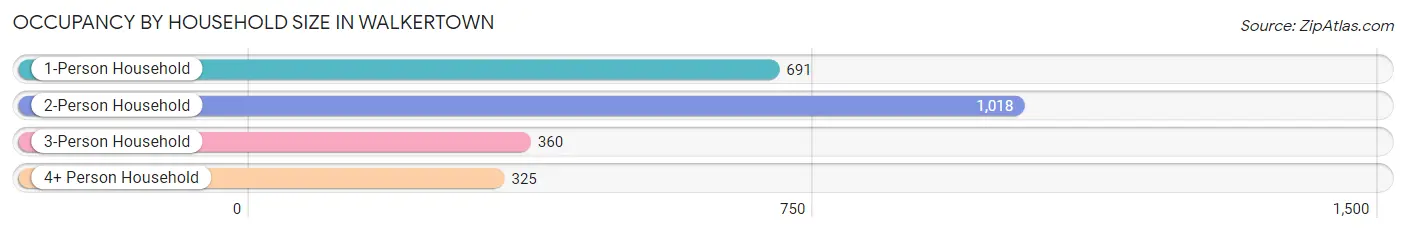
| Household Size | # Housing Units | % Housing Units |
| 1-Person Household | 691 | 28.9% |
| 2-Person Household | 1,018 | 42.5% |
| 3-Person Household | 360 | 15.0% |
| 4+ Person Household | 325 | 13.6% |
| Total Housing Units | 2,394 | 100.0% |
Occupancy by Ownership by Household Size in Walkertown
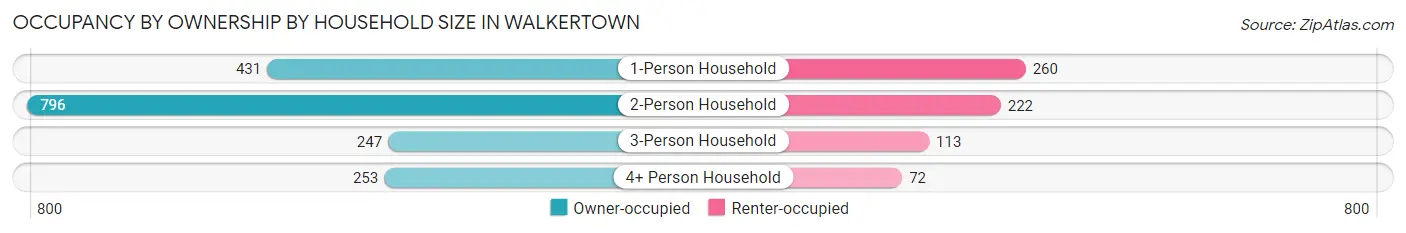
| Household Size | Owner-occupied | Renter-occupied |
| 1-Person Household | 431 (62.4%) | 260 (37.6%) |
| 2-Person Household | 796 (78.2%) | 222 (21.8%) |
| 3-Person Household | 247 (68.6%) | 113 (31.4%) |
| 4+ Person Household | 253 (77.8%) | 72 (22.2%) |
| Total Housing Units | 1,727 (72.1%) | 667 (27.9%) |
Occupancy by Educational Attainment in Walkertown
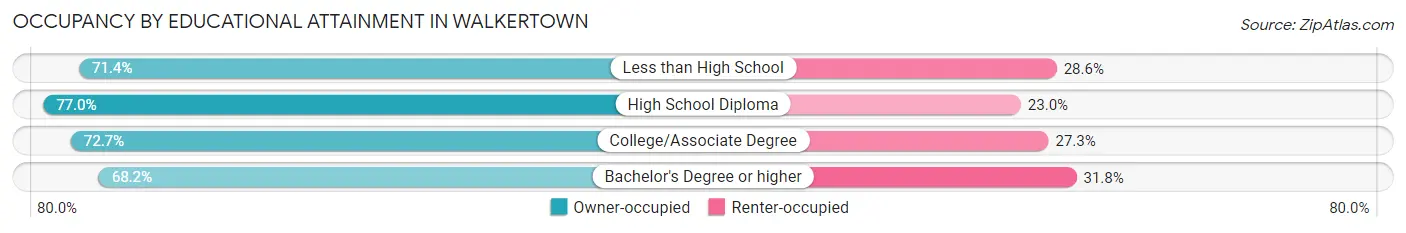
| Household Size | Owner-occupied | Renter-occupied |
| Less than High School | 142 (71.4%) | 57 (28.6%) |
| High School Diploma | 463 (77.0%) | 138 (23.0%) |
| College/Associate Degree | 566 (72.7%) | 213 (27.3%) |
| Bachelor's Degree or higher | 556 (68.2%) | 259 (31.8%) |
Occupancy by Age of Householder in Walkertown
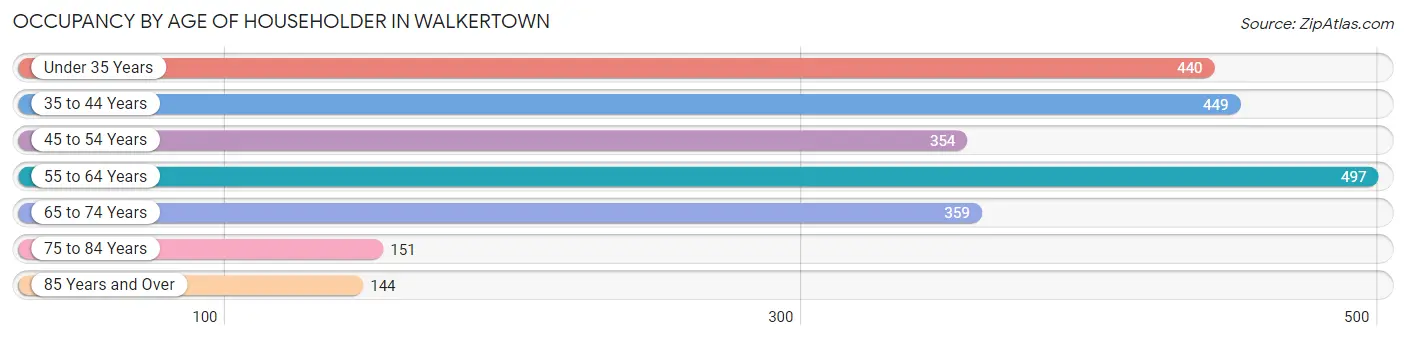
| Age Bracket | # Households | % Households |
| Under 35 Years | 440 | 18.4% |
| 35 to 44 Years | 449 | 18.8% |
| 45 to 54 Years | 354 | 14.8% |
| 55 to 64 Years | 497 | 20.8% |
| 65 to 74 Years | 359 | 15.0% |
| 75 to 84 Years | 151 | 6.3% |
| 85 Years and Over | 144 | 6.0% |
| Total | 2,394 | 100.0% |
Housing Finances in Walkertown
Median Income by Occupancy in Walkertown
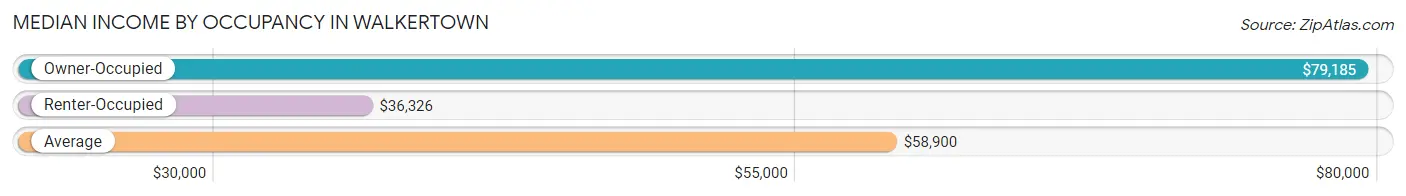
| Occupancy Type | # Households | Median Income |
| Owner-Occupied | 1,727 (72.1%) | $79,185 |
| Renter-Occupied | 667 (27.9%) | $36,326 |
| Average | 2,394 (100.0%) | $58,900 |
Occupancy by Householder Income Bracket in Walkertown
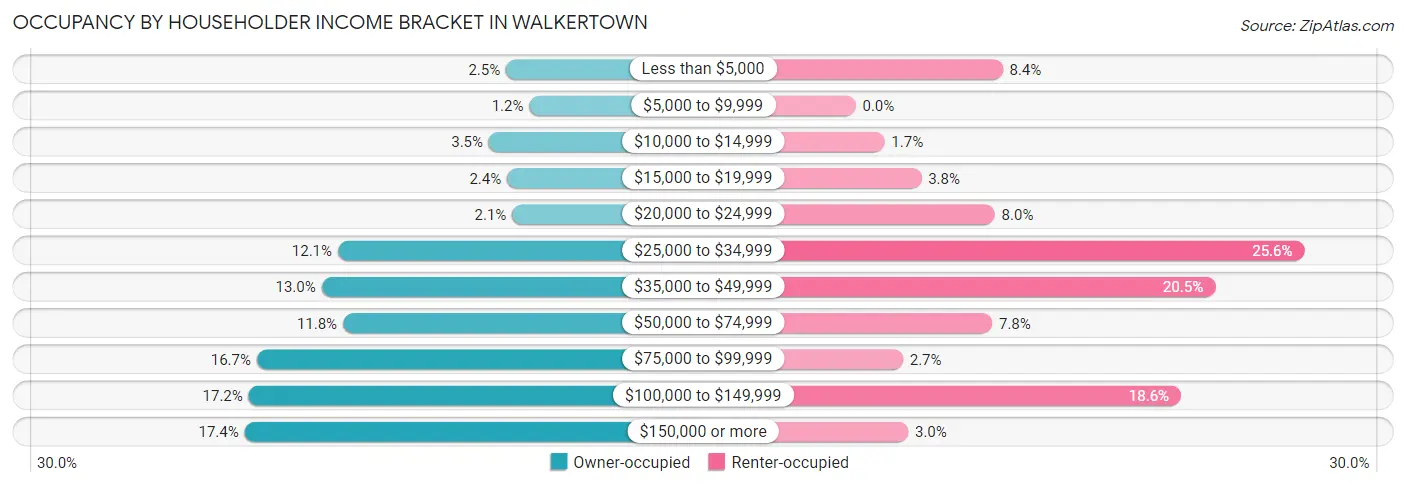
| Income Bracket | Owner-occupied | Renter-occupied |
| Less than $5,000 | 43 (2.5%) | 56 (8.4%) |
| $5,000 to $9,999 | 20 (1.2%) | 0 (0.0%) |
| $10,000 to $14,999 | 60 (3.5%) | 11 (1.7%) |
| $15,000 to $19,999 | 42 (2.4%) | 25 (3.7%) |
| $20,000 to $24,999 | 37 (2.1%) | 53 (8.0%) |
| $25,000 to $34,999 | 209 (12.1%) | 171 (25.6%) |
| $35,000 to $49,999 | 225 (13.0%) | 137 (20.5%) |
| $50,000 to $74,999 | 204 (11.8%) | 52 (7.8%) |
| $75,000 to $99,999 | 289 (16.7%) | 18 (2.7%) |
| $100,000 to $149,999 | 297 (17.2%) | 124 (18.6%) |
| $150,000 or more | 301 (17.4%) | 20 (3.0%) |
| Total | 1,727 (100.0%) | 667 (100.0%) |
Monthly Housing Cost Tiers in Walkertown
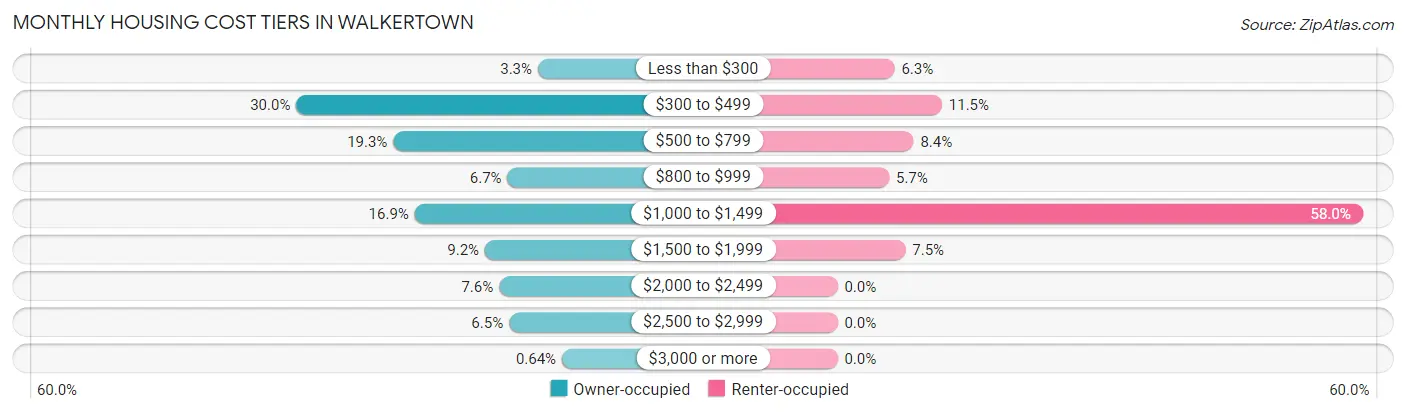
| Monthly Cost | Owner-occupied | Renter-occupied |
| Less than $300 | 57 (3.3%) | 42 (6.3%) |
| $300 to $499 | 518 (30.0%) | 77 (11.5%) |
| $500 to $799 | 333 (19.3%) | 56 (8.4%) |
| $800 to $999 | 115 (6.7%) | 38 (5.7%) |
| $1,000 to $1,499 | 292 (16.9%) | 387 (58.0%) |
| $1,500 to $1,999 | 158 (9.1%) | 50 (7.5%) |
| $2,000 to $2,499 | 131 (7.6%) | 0 (0.0%) |
| $2,500 to $2,999 | 112 (6.5%) | 0 (0.0%) |
| $3,000 or more | 11 (0.6%) | 0 (0.0%) |
| Total | 1,727 (100.0%) | 667 (100.0%) |
Physical Housing Characteristics in Walkertown
Housing Structures in Walkertown
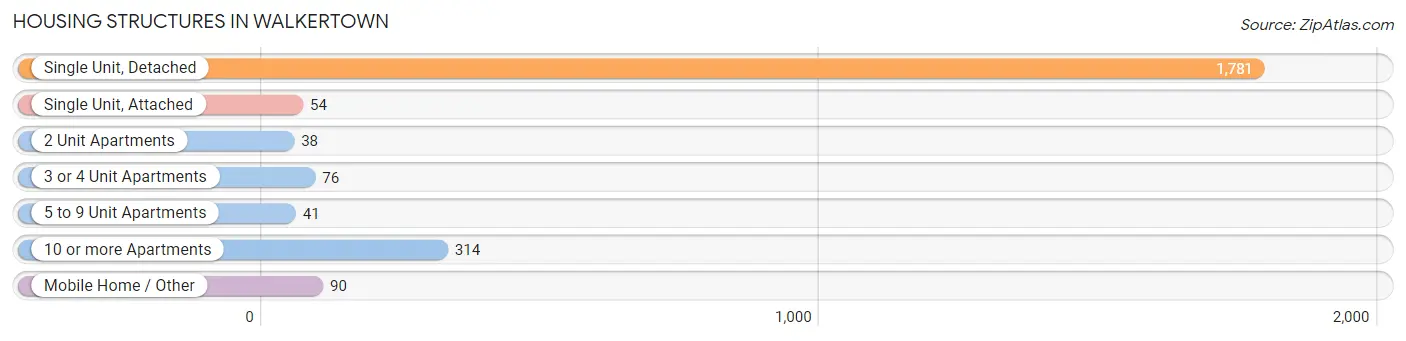
| Structure Type | # Housing Units | % Housing Units |
| Single Unit, Detached | 1,781 | 74.4% |
| Single Unit, Attached | 54 | 2.3% |
| 2 Unit Apartments | 38 | 1.6% |
| 3 or 4 Unit Apartments | 76 | 3.2% |
| 5 to 9 Unit Apartments | 41 | 1.7% |
| 10 or more Apartments | 314 | 13.1% |
| Mobile Home / Other | 90 | 3.8% |
| Total | 2,394 | 100.0% |
Housing Structures by Occupancy in Walkertown
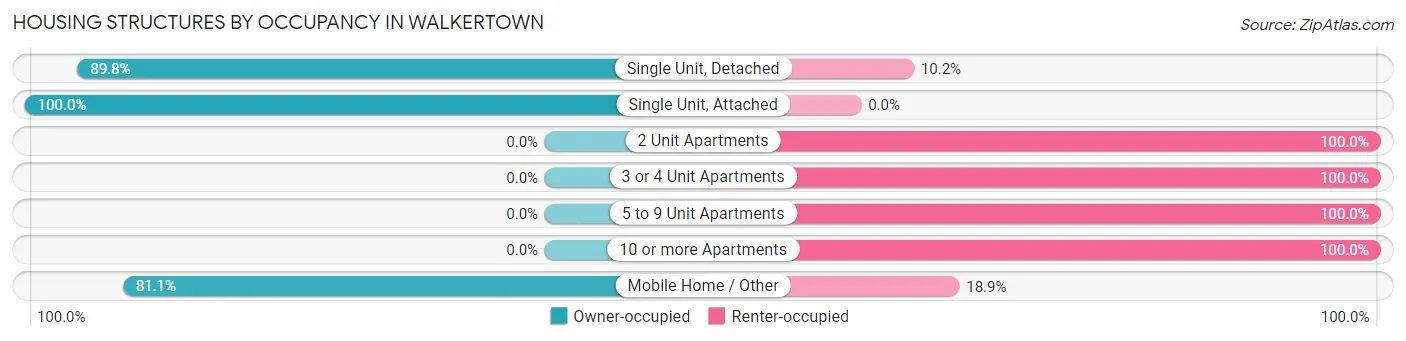
| Structure Type | Owner-occupied | Renter-occupied |
| Single Unit, Detached | 1,600 (89.8%) | 181 (10.2%) |
| Single Unit, Attached | 54 (100.0%) | 0 (0.0%) |
| 2 Unit Apartments | 0 (0.0%) | 38 (100.0%) |
| 3 or 4 Unit Apartments | 0 (0.0%) | 76 (100.0%) |
| 5 to 9 Unit Apartments | 0 (0.0%) | 41 (100.0%) |
| 10 or more Apartments | 0 (0.0%) | 314 (100.0%) |
| Mobile Home / Other | 73 (81.1%) | 17 (18.9%) |
| Total | 1,727 (72.1%) | 667 (27.9%) |
Housing Structures by Number of Rooms in Walkertown
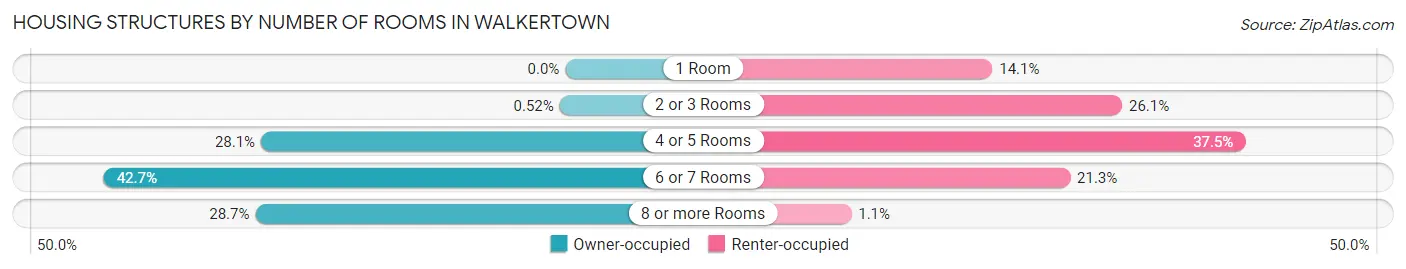
| Number of Rooms | Owner-occupied | Renter-occupied |
| 1 Room | 0 (0.0%) | 94 (14.1%) |
| 2 or 3 Rooms | 9 (0.5%) | 174 (26.1%) |
| 4 or 5 Rooms | 486 (28.1%) | 250 (37.5%) |
| 6 or 7 Rooms | 737 (42.7%) | 142 (21.3%) |
| 8 or more Rooms | 495 (28.7%) | 7 (1.1%) |
| Total | 1,727 (100.0%) | 667 (100.0%) |
Housing Structure by Heating Type in Walkertown
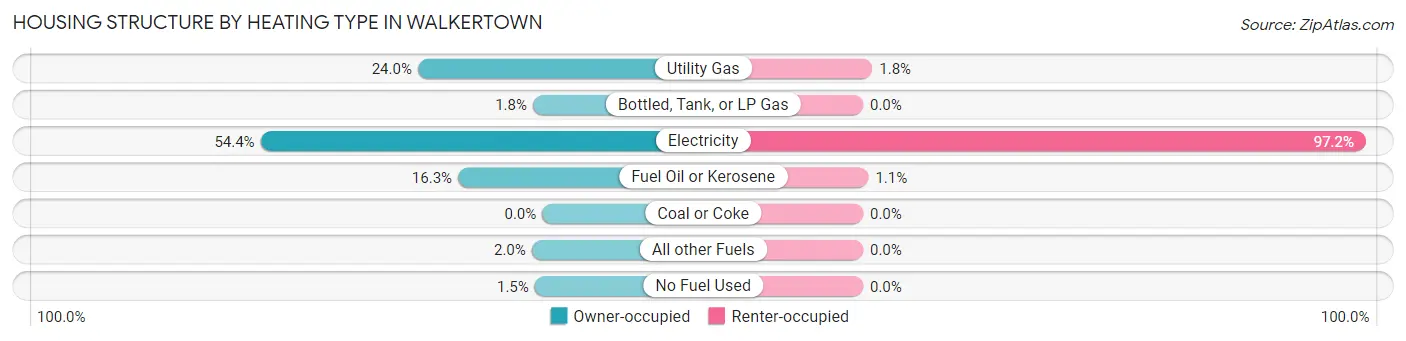
| Heating Type | Owner-occupied | Renter-occupied |
| Utility Gas | 415 (24.0%) | 12 (1.8%) |
| Bottled, Tank, or LP Gas | 31 (1.8%) | 0 (0.0%) |
| Electricity | 940 (54.4%) | 648 (97.2%) |
| Fuel Oil or Kerosene | 281 (16.3%) | 7 (1.1%) |
| Coal or Coke | 0 (0.0%) | 0 (0.0%) |
| All other Fuels | 35 (2.0%) | 0 (0.0%) |
| No Fuel Used | 25 (1.5%) | 0 (0.0%) |
| Total | 1,727 (100.0%) | 667 (100.0%) |
Household Vehicle Usage in Walkertown
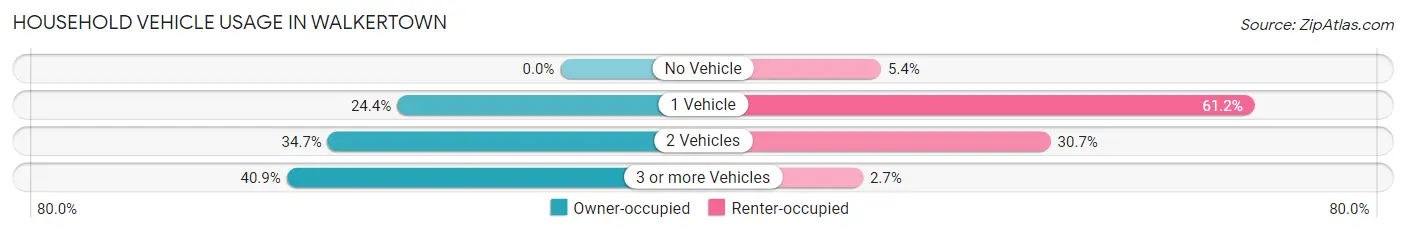
| Vehicles per Household | Owner-occupied | Renter-occupied |
| No Vehicle | 0 (0.0%) | 36 (5.4%) |
| 1 Vehicle | 421 (24.4%) | 408 (61.2%) |
| 2 Vehicles | 600 (34.7%) | 205 (30.7%) |
| 3 or more Vehicles | 706 (40.9%) | 18 (2.7%) |
| Total | 1,727 (100.0%) | 667 (100.0%) |
Real Estate & Mortgages in Walkertown
Real Estate and Mortgage Overview in Walkertown
| Characteristic | Without Mortgage | With Mortgage |
| Housing Units | 770 | 957 |
| Median Property Value | $178,300 | $230,500 |
| Median Household Income | $57,727 | $182 |
| Monthly Housing Costs | $399 | $11 |
| Real Estate Taxes | $1,202 | $0 |
Property Value by Mortgage Status in Walkertown
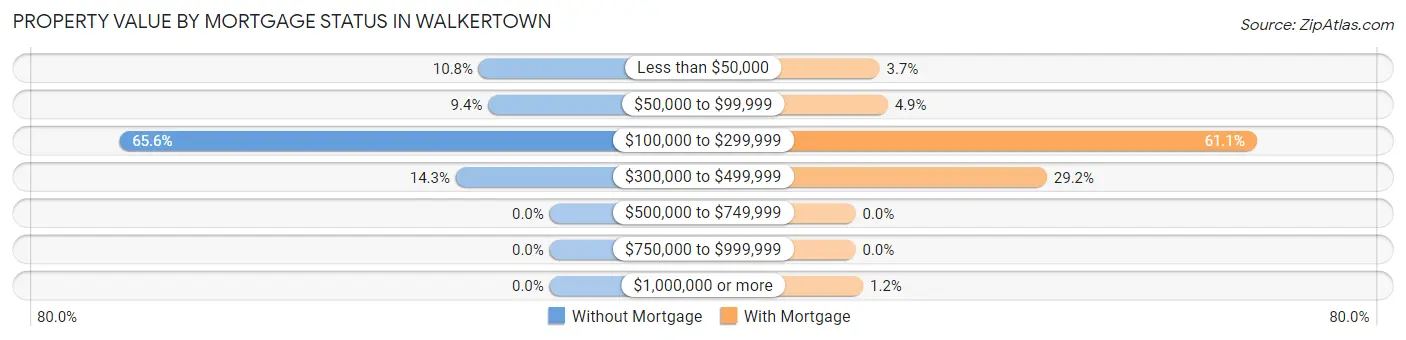
| Property Value | Without Mortgage | With Mortgage |
| Less than $50,000 | 83 (10.8%) | 35 (3.7%) |
| $50,000 to $99,999 | 72 (9.3%) | 47 (4.9%) |
| $100,000 to $299,999 | 505 (65.6%) | 585 (61.1%) |
| $300,000 to $499,999 | 110 (14.3%) | 279 (29.1%) |
| $500,000 to $749,999 | 0 (0.0%) | 0 (0.0%) |
| $750,000 to $999,999 | 0 (0.0%) | 0 (0.0%) |
| $1,000,000 or more | 0 (0.0%) | 11 (1.1%) |
| Total | 770 (100.0%) | 957 (100.0%) |
Household Income by Mortgage Status in Walkertown
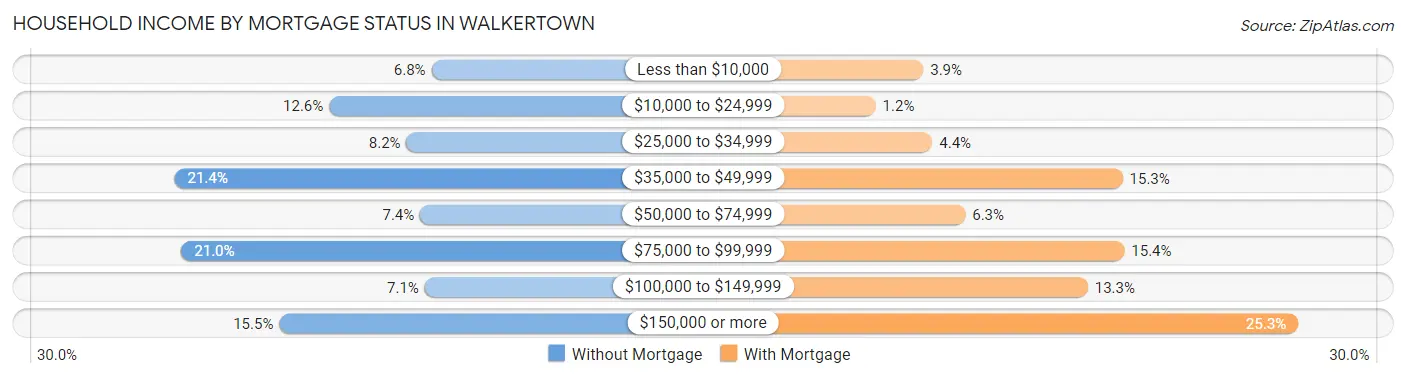
| Household Income | Without Mortgage | With Mortgage |
| Less than $10,000 | 52 (6.8%) | 37 (3.9%) |
| $10,000 to $24,999 | 97 (12.6%) | 11 (1.1%) |
| $25,000 to $34,999 | 63 (8.2%) | 42 (4.4%) |
| $35,000 to $49,999 | 165 (21.4%) | 146 (15.3%) |
| $50,000 to $74,999 | 57 (7.4%) | 60 (6.3%) |
| $75,000 to $99,999 | 162 (21.0%) | 147 (15.4%) |
| $100,000 to $149,999 | 55 (7.1%) | 127 (13.3%) |
| $150,000 or more | 119 (15.4%) | 242 (25.3%) |
| Total | 770 (100.0%) | 957 (100.0%) |
Property Value to Household Income Ratio in Walkertown
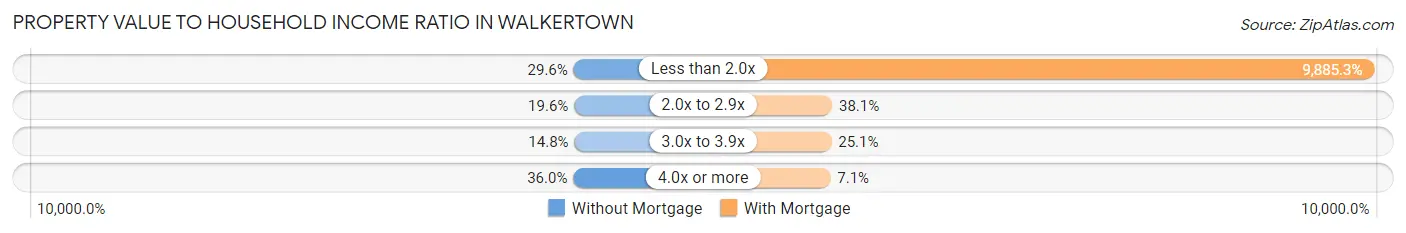
| Value-to-Income Ratio | Without Mortgage | With Mortgage |
| Less than 2.0x | 228 (29.6%) | 94,602 (9,885.3%) |
| 2.0x to 2.9x | 151 (19.6%) | 365 (38.1%) |
| 3.0x to 3.9x | 114 (14.8%) | 240 (25.1%) |
| 4.0x or more | 277 (36.0%) | 68 (7.1%) |
| Total | 770 (100.0%) | 957 (100.0%) |
Real Estate Taxes by Mortgage Status in Walkertown
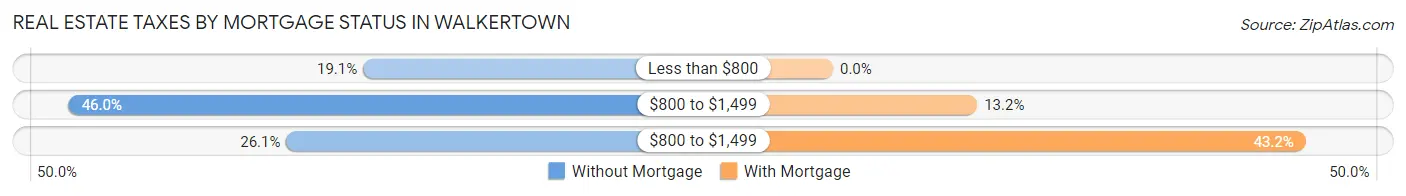
| Property Taxes | Without Mortgage | With Mortgage |
| Less than $800 | 147 (19.1%) | 0 (0.0%) |
| $800 to $1,499 | 354 (46.0%) | 126 (13.2%) |
| $800 to $1,499 | 201 (26.1%) | 413 (43.2%) |
| Total | 770 (100.0%) | 957 (100.0%) |
Health & Disability in Walkertown
Health Insurance Coverage by Age in Walkertown
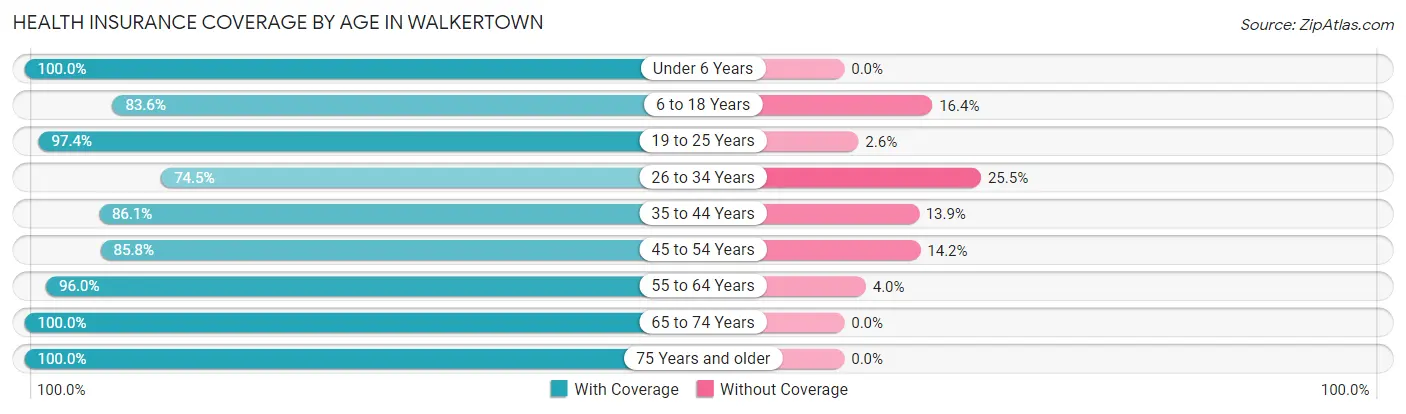
| Age Bracket | With Coverage | Without Coverage |
| Under 6 Years | 239 (100.0%) | 0 (0.0%) |
| 6 to 18 Years | 831 (83.6%) | 163 (16.4%) |
| 19 to 25 Years | 370 (97.4%) | 10 (2.6%) |
| 26 to 34 Years | 491 (74.5%) | 168 (25.5%) |
| 35 to 44 Years | 621 (86.1%) | 100 (13.9%) |
| 45 to 54 Years | 702 (85.8%) | 116 (14.2%) |
| 55 to 64 Years | 742 (96.0%) | 31 (4.0%) |
| 65 to 74 Years | 641 (100.0%) | 0 (0.0%) |
| 75 Years and older | 481 (100.0%) | 0 (0.0%) |
| Total | 5,118 (89.7%) | 588 (10.3%) |
Health Insurance Coverage by Citizenship Status in Walkertown
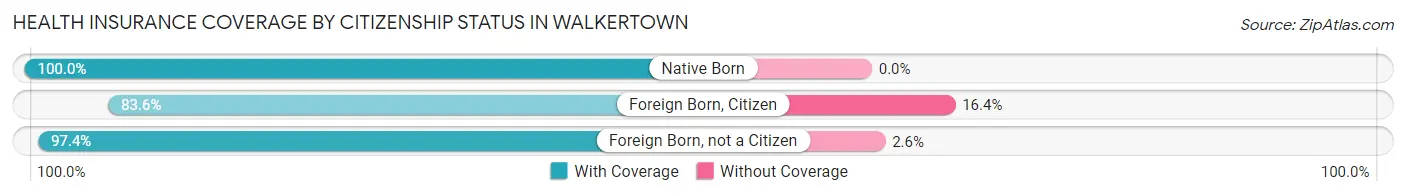
| Citizenship Status | With Coverage | Without Coverage |
| Native Born | 239 (100.0%) | 0 (0.0%) |
| Foreign Born, Citizen | 831 (83.6%) | 163 (16.4%) |
| Foreign Born, not a Citizen | 370 (97.4%) | 10 (2.6%) |
Health Insurance Coverage by Household Income in Walkertown
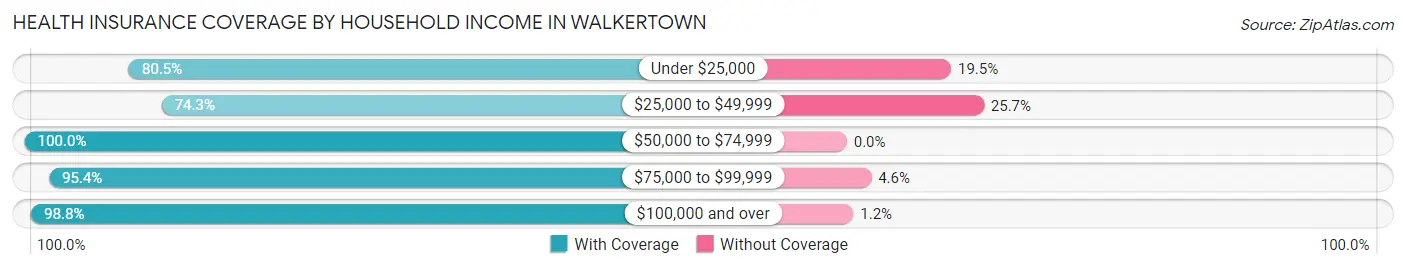
| Household Income | With Coverage | Without Coverage |
| Under $25,000 | 523 (80.5%) | 127 (19.5%) |
| $25,000 to $49,999 | 1,143 (74.3%) | 395 (25.7%) |
| $50,000 to $74,999 | 587 (100.0%) | 0 (0.0%) |
| $75,000 to $99,999 | 857 (95.4%) | 41 (4.6%) |
| $100,000 and over | 2,008 (98.8%) | 25 (1.2%) |
Public vs Private Health Insurance Coverage by Age in Walkertown
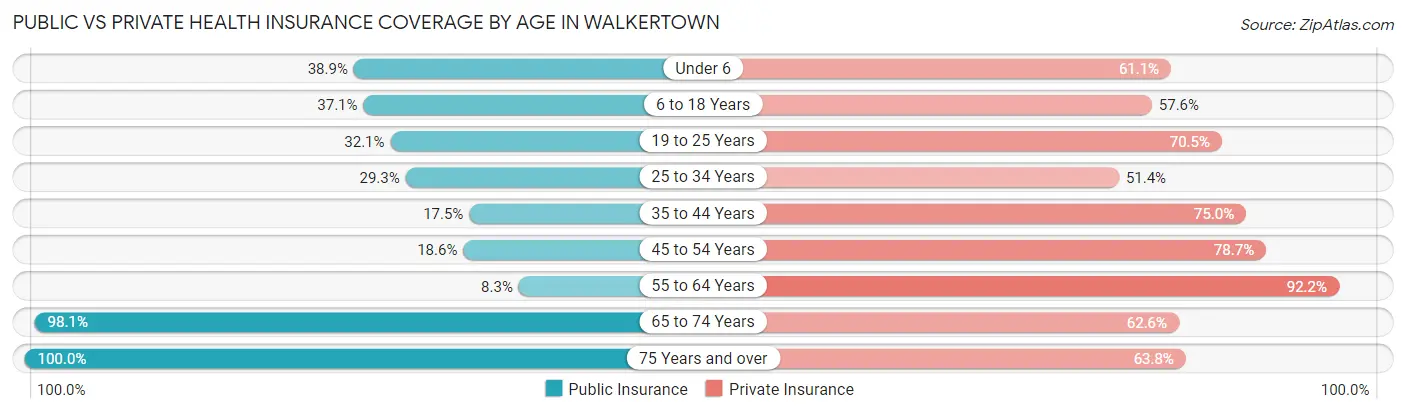
| Age Bracket | Public Insurance | Private Insurance |
| Under 6 | 93 (38.9%) | 146 (61.1%) |
| 6 to 18 Years | 369 (37.1%) | 572 (57.6%) |
| 19 to 25 Years | 122 (32.1%) | 268 (70.5%) |
| 25 to 34 Years | 193 (29.3%) | 339 (51.4%) |
| 35 to 44 Years | 126 (17.5%) | 541 (75.0%) |
| 45 to 54 Years | 152 (18.6%) | 644 (78.7%) |
| 55 to 64 Years | 64 (8.3%) | 713 (92.2%) |
| 65 to 74 Years | 629 (98.1%) | 401 (62.6%) |
| 75 Years and over | 481 (100.0%) | 307 (63.8%) |
| Total | 2,229 (39.1%) | 3,931 (68.9%) |
Disability Status by Sex by Age in Walkertown
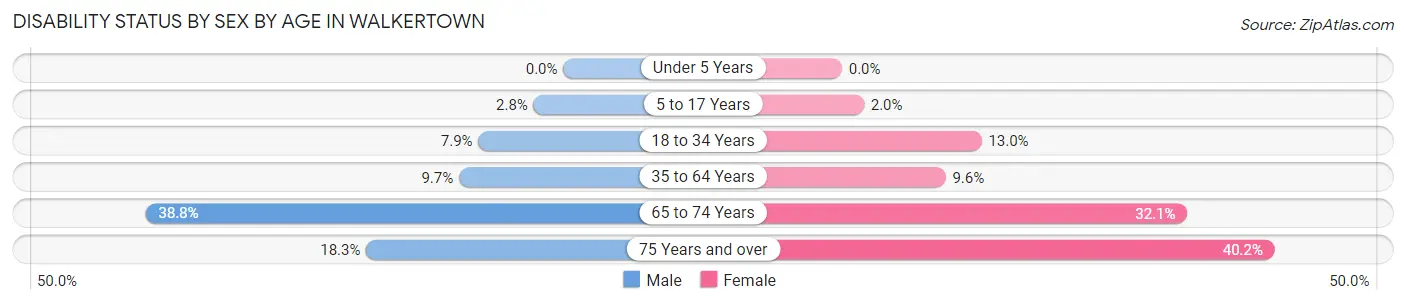
| Age Bracket | Male | Female |
| Under 5 Years | 0 (0.0%) | 0 (0.0%) |
| 5 to 17 Years | 16 (2.8%) | 7 (2.0%) |
| 18 to 34 Years | 32 (7.9%) | 92 (13.0%) |
| 35 to 64 Years | 102 (9.7%) | 121 (9.6%) |
| 65 to 74 Years | 147 (38.8%) | 84 (32.1%) |
| 75 Years and over | 47 (18.3%) | 90 (40.2%) |
Disability Class by Sex by Age in Walkertown
Disability Class: Hearing Difficulty
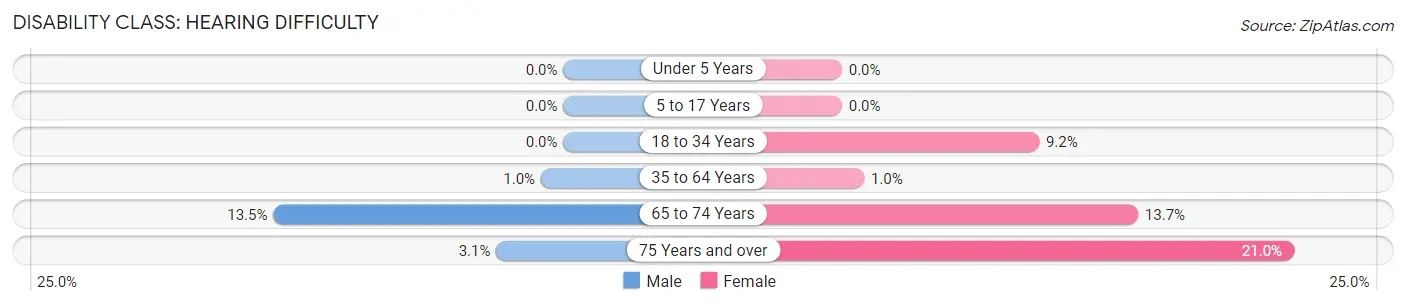
| Age Bracket | Male | Female |
| Under 5 Years | 0 (0.0%) | 0 (0.0%) |
| 5 to 17 Years | 0 (0.0%) | 0 (0.0%) |
| 18 to 34 Years | 0 (0.0%) | 65 (9.1%) |
| 35 to 64 Years | 11 (1.0%) | 13 (1.0%) |
| 65 to 74 Years | 51 (13.5%) | 36 (13.7%) |
| 75 Years and over | 8 (3.1%) | 47 (21.0%) |
Disability Class: Vision Difficulty
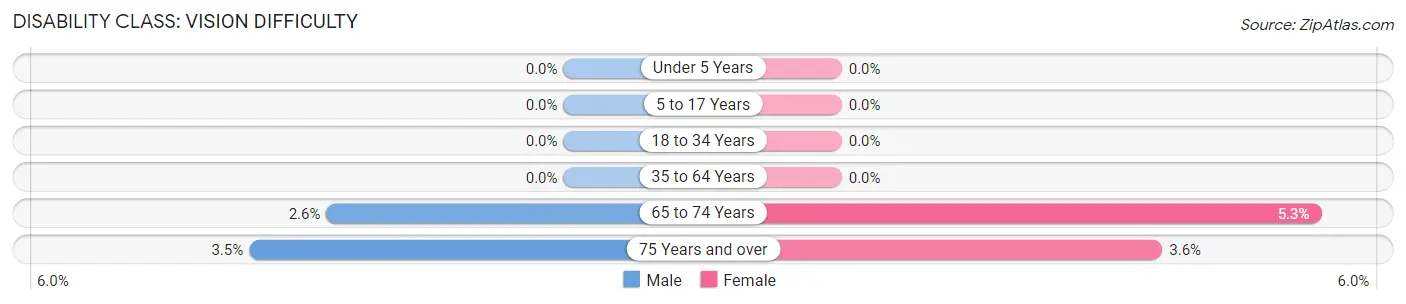
| Age Bracket | Male | Female |
| Under 5 Years | 0 (0.0%) | 0 (0.0%) |
| 5 to 17 Years | 0 (0.0%) | 0 (0.0%) |
| 18 to 34 Years | 0 (0.0%) | 0 (0.0%) |
| 35 to 64 Years | 0 (0.0%) | 0 (0.0%) |
| 65 to 74 Years | 10 (2.6%) | 14 (5.3%) |
| 75 Years and over | 9 (3.5%) | 8 (3.6%) |
Disability Class: Cognitive Difficulty
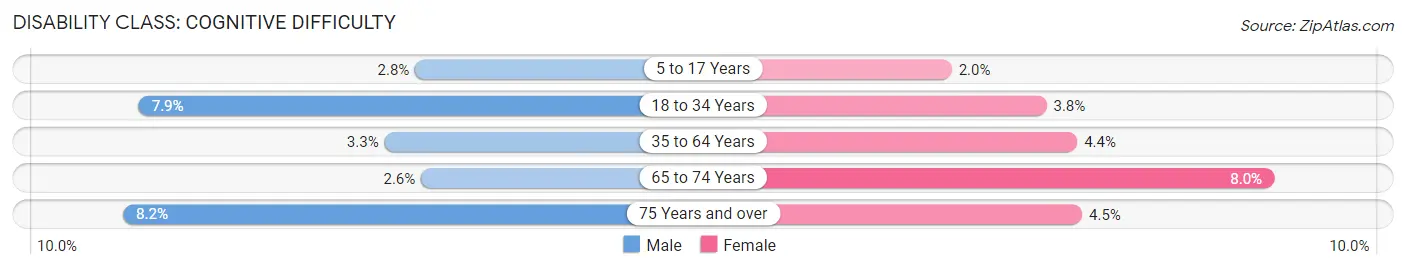
| Age Bracket | Male | Female |
| 5 to 17 Years | 16 (2.8%) | 7 (2.0%) |
| 18 to 34 Years | 32 (7.9%) | 27 (3.8%) |
| 35 to 64 Years | 35 (3.3%) | 55 (4.4%) |
| 65 to 74 Years | 10 (2.6%) | 21 (8.0%) |
| 75 Years and over | 21 (8.2%) | 10 (4.5%) |
Disability Class: Ambulatory Difficulty
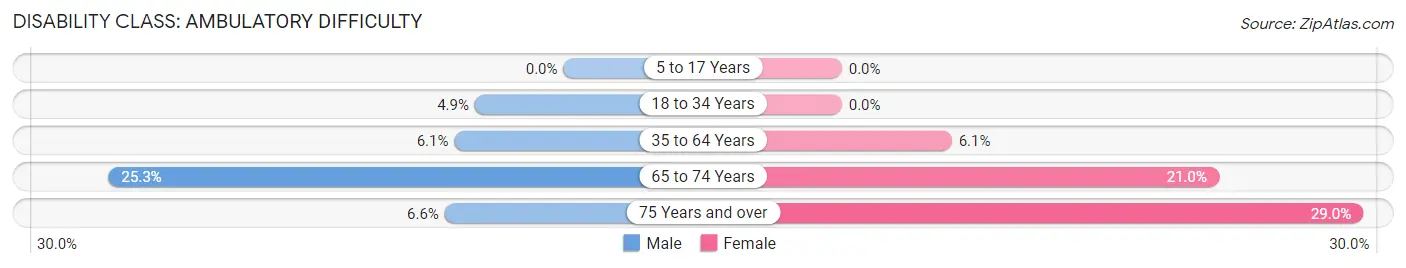
| Age Bracket | Male | Female |
| 5 to 17 Years | 0 (0.0%) | 0 (0.0%) |
| 18 to 34 Years | 20 (4.9%) | 0 (0.0%) |
| 35 to 64 Years | 64 (6.1%) | 77 (6.1%) |
| 65 to 74 Years | 96 (25.3%) | 55 (21.0%) |
| 75 Years and over | 17 (6.6%) | 65 (29.0%) |
Disability Class: Self-Care Difficulty
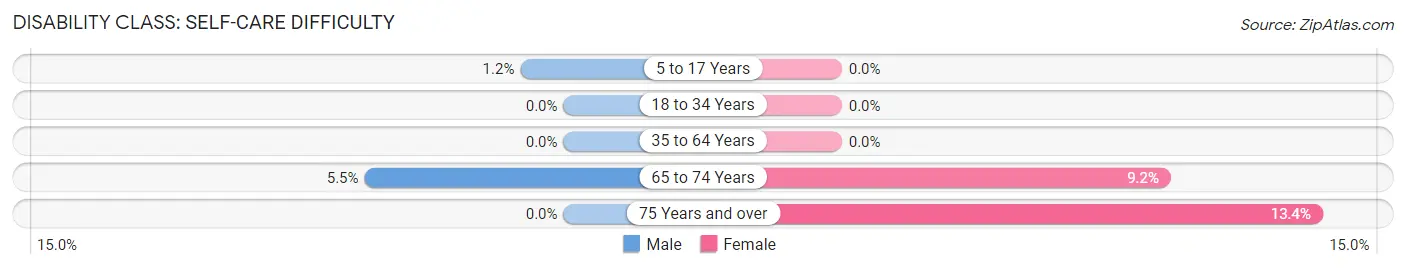
| Age Bracket | Male | Female |
| 5 to 17 Years | 7 (1.2%) | 0 (0.0%) |
| 18 to 34 Years | 0 (0.0%) | 0 (0.0%) |
| 35 to 64 Years | 0 (0.0%) | 0 (0.0%) |
| 65 to 74 Years | 21 (5.5%) | 24 (9.2%) |
| 75 Years and over | 0 (0.0%) | 30 (13.4%) |
Technology Access in Walkertown
Computing Device Access in Walkertown
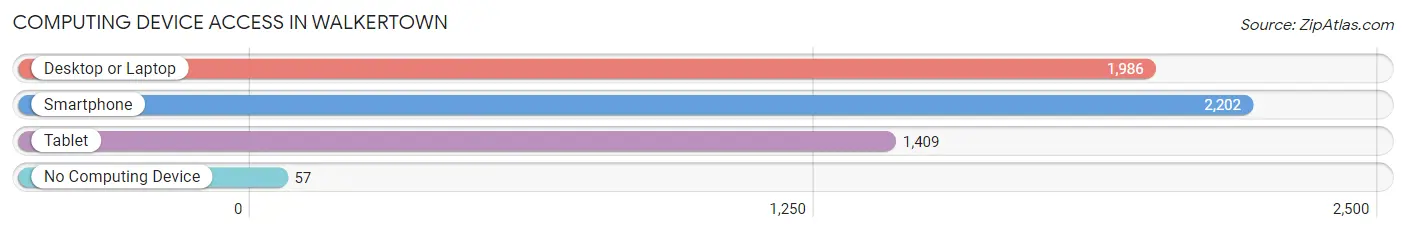
| Device Type | # Households | % Households |
| Desktop or Laptop | 1,986 | 83.0% |
| Smartphone | 2,202 | 92.0% |
| Tablet | 1,409 | 58.9% |
| No Computing Device | 57 | 2.4% |
| Total | 2,394 | 100.0% |
Internet Access in Walkertown
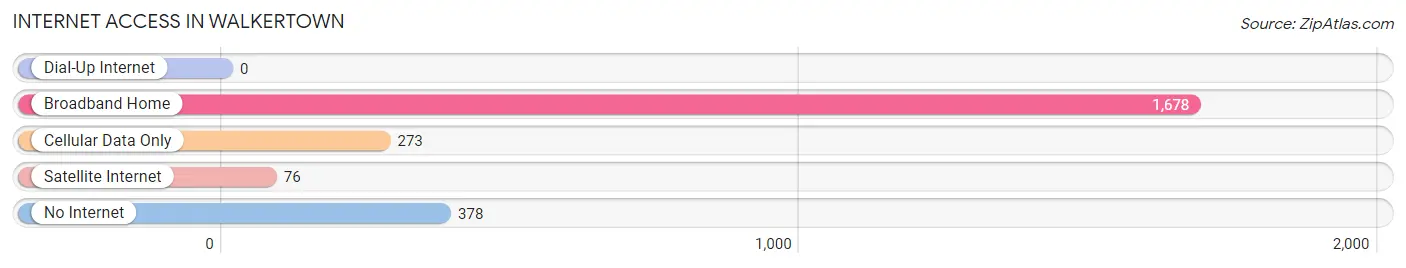
| Internet Type | # Households | % Households |
| Dial-Up Internet | 0 | 0.0% |
| Broadband Home | 1,678 | 70.1% |
| Cellular Data Only | 273 | 11.4% |
| Satellite Internet | 76 | 3.2% |
| No Internet | 378 | 15.8% |
| Total | 2,394 | 100.0% |
Walkertown Summary
WalkerTown, NC is a small town located in the foothills of the Blue Ridge Mountains in Forsyth County, North Carolina. The town was founded in 1845 and is named after the Walker family, who were among the first settlers in the area. The town has a population of approximately 2,000 people and is located about 20 miles northeast of Winston-Salem.
History
WalkerTown was founded in 1845 by the Walker family, who were among the first settlers in the area. The town was originally known as Walker’s Crossroads, and was a small farming community. In the late 1800s, the town began to grow and develop, and in 1891, the town was officially incorporated as WalkerTown.
In the early 1900s, WalkerTown was a thriving community with a variety of businesses, including a general store, a blacksmith shop, a grist mill, and a sawmill. The town also had a post office, a school, and a church.
In the 1950s, WalkerTown began to decline as many of the businesses closed and the population began to decline. In the 1970s, the town began to experience a resurgence as new businesses opened and the population began to increase.
Geography
WalkerTown is located in the foothills of the Blue Ridge Mountains in Forsyth County, North Carolina. The town is situated at an elevation of 1,000 feet and is located about 20 miles northeast of Winston-Salem. The town is surrounded by rolling hills and is located near the Yadkin River.
Economy
WalkerTown’s economy is largely based on agriculture and tourism. The town is home to several farms, which produce a variety of crops, including corn, soybeans, and tobacco. The town is also home to several wineries, which produce a variety of wines.
In addition to agriculture, WalkerTown is home to several small businesses, including restaurants, shops, and a variety of other services. The town is also home to a number of manufacturing companies, which produce a variety of products, including furniture, textiles, and electronics.
Demographics
As of the 2010 census, WalkerTown had a population of 2,000 people. The town is predominantly white, with approximately 90% of the population being white. The town also has a small African American population, with approximately 5% of the population being African American. The town also has a small Hispanic population, with approximately 2% of the population being Hispanic.
Conclusion
WalkerTown, NC is a small town located in the foothills of the Blue Ridge Mountains in Forsyth County, North Carolina. The town was founded in 1845 and is named after the Walker family, who were among the first settlers in the area. The town has a population of approximately 2,000 people and is located about 20 miles northeast of Winston-Salem. WalkerTown’s economy is largely based on agriculture and tourism, and the town is home to several farms, wineries, and small businesses. The town is predominantly white, with approximately 90% of the population being white. The town also has a small African American population, with approximately 5% of the population being African American, and a small Hispanic population, with approximately 2% of the population being Hispanic.
Common Questions
What is Per Capita Income in Walkertown?
Per Capita income in Walkertown is $37,446.
What is the Median Family Income in Walkertown?
Median Family Income in Walkertown is $64,161.
What is the Median Household income in Walkertown?
Median Household Income in Walkertown is $58,900.
What is Income or Wage Gap in Walkertown?
Income or Wage Gap in Walkertown is 40.0%.
Women in Walkertown earn 60.0 cents for every dollar earned by a man.
What is Inequality or Gini Index in Walkertown?
Inequality or Gini Index in Walkertown is 0.46.
What is the Total Population of Walkertown?
Total Population of Walkertown is 5,706.
What is the Total Male Population of Walkertown?
Total Male Population of Walkertown is 2,784.
What is the Total Female Population of Walkertown?
Total Female Population of Walkertown is 2,922.
What is the Ratio of Males per 100 Females in Walkertown?
There are 95.28 Males per 100 Females in Walkertown.
What is the Ratio of Females per 100 Males in Walkertown?
There are 104.96 Females per 100 Males in Walkertown.
What is the Median Population Age in Walkertown?
Median Population Age in Walkertown is 43.6 Years.
What is the Average Family Size in Walkertown
Average Family Size in Walkertown is 2.9 People.
What is the Average Household Size in Walkertown
Average Household Size in Walkertown is 2.4 People.
How Large is the Labor Force in Walkertown?
There are 2,772 People in the Labor Forcein in Walkertown.
What is the Percentage of People in the Labor Force in Walkertown?
59.7% of People are in the Labor Force in Walkertown.
What is the Unemployment Rate in Walkertown?
Unemployment Rate in Walkertown is 1.9%.