Bethel, NC Map & Demographics
Bethel Map
Bethel Overview
$29,622
PER CAPITA INCOME
$72,344
AVG FAMILY INCOME
$51,107
AVG HOUSEHOLD INCOME
39.1%
WAGE / INCOME GAP [ % ]
60.9¢/ $1
WAGE / INCOME GAP [ $ ]
0.46
INEQUALITY / GINI INDEX
1,604
TOTAL POPULATION
717
MALE POPULATION
887
FEMALE POPULATION
80.83
MALES / 100 FEMALES
123.71
FEMALES / 100 MALES
42.8
MEDIAN AGE
3.0
AVG FAMILY SIZE
2.2
AVG HOUSEHOLD SIZE
784
LABOR FORCE [ PEOPLE ]
62.5%
PERCENT IN LABOR FORCE
7.5%
UNEMPLOYMENT RATE
Bethel Zip Codes
Bethel Area Codes
Income in Bethel
Income Overview in Bethel
Per Capita Income in Bethel is $29,622, while median incomes of families and households are $72,344 and $51,107 respectively.
| Characteristic | Number | Measure |
| Per Capita Income | 1,604 | $29,622 |
| Median Family Income | 419 | $72,344 |
| Mean Family Income | 419 | $79,674 |
| Median Household Income | 728 | $51,107 |
| Mean Household Income | 728 | $63,992 |
| Income Deficit | 419 | $0 |
| Wage / Income Gap (%) | 1,604 | 39.14% |
| Wage / Income Gap ($) | 1,604 | 60.86¢ per $1 |
| Gini / Inequality Index | 1,604 | 0.46 |
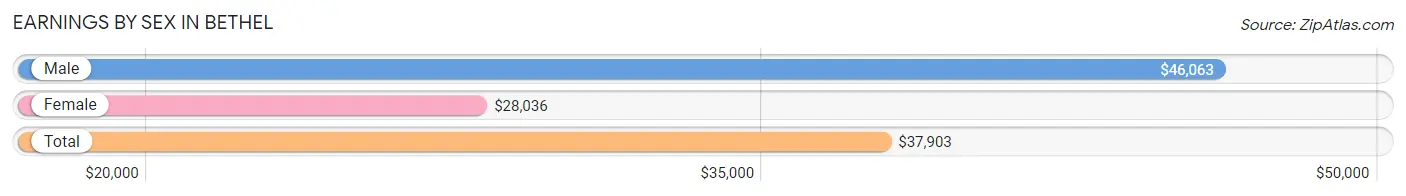
Earnings by Sex in Bethel
Average Earnings in Bethel are $37,903, $46,063 for men and $28,036 for women, a difference of 39.1%.
| Sex | Number | Average Earnings |
| Male | 339 (42.9%) | $46,063 |
| Female | 451 (57.1%) | $28,036 |
| Total | 790 (100.0%) | $37,903 |
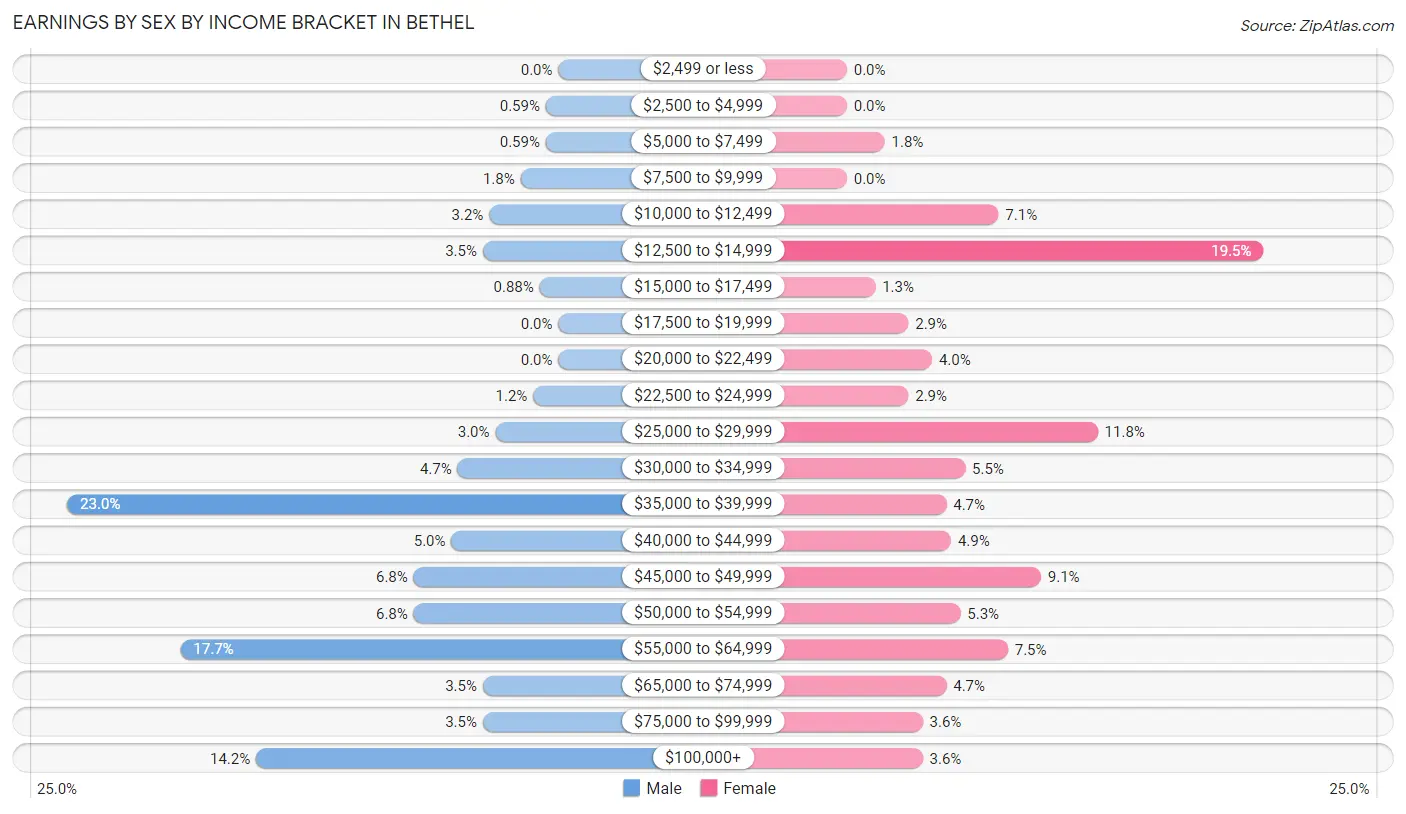
Earnings by Sex by Income Bracket in Bethel
The most common earnings brackets in Bethel are $35,000 to $39,999 for men (78 | 23.0%) and $12,500 to $14,999 for women (88 | 19.5%).
| Income | Male | Female |
| $2,499 or less | 0 (0.0%) | 0 (0.0%) |
| $2,500 to $4,999 | 2 (0.6%) | 0 (0.0%) |
| $5,000 to $7,499 | 2 (0.6%) | 8 (1.8%) |
| $7,500 to $9,999 | 6 (1.8%) | 0 (0.0%) |
| $10,000 to $12,499 | 11 (3.2%) | 32 (7.1%) |
| $12,500 to $14,999 | 12 (3.5%) | 88 (19.5%) |
| $15,000 to $17,499 | 3 (0.9%) | 6 (1.3%) |
| $17,500 to $19,999 | 0 (0.0%) | 13 (2.9%) |
| $20,000 to $22,499 | 0 (0.0%) | 18 (4.0%) |
| $22,500 to $24,999 | 4 (1.2%) | 13 (2.9%) |
| $25,000 to $29,999 | 10 (2.9%) | 53 (11.7%) |
| $30,000 to $34,999 | 16 (4.7%) | 25 (5.5%) |
| $35,000 to $39,999 | 78 (23.0%) | 21 (4.7%) |
| $40,000 to $44,999 | 17 (5.0%) | 22 (4.9%) |
| $45,000 to $49,999 | 23 (6.8%) | 41 (9.1%) |
| $50,000 to $54,999 | 23 (6.8%) | 24 (5.3%) |
| $55,000 to $64,999 | 60 (17.7%) | 34 (7.5%) |
| $65,000 to $74,999 | 12 (3.5%) | 21 (4.7%) |
| $75,000 to $99,999 | 12 (3.5%) | 16 (3.5%) |
| $100,000+ | 48 (14.2%) | 16 (3.5%) |
| Total | 339 (100.0%) | 451 (100.0%) |
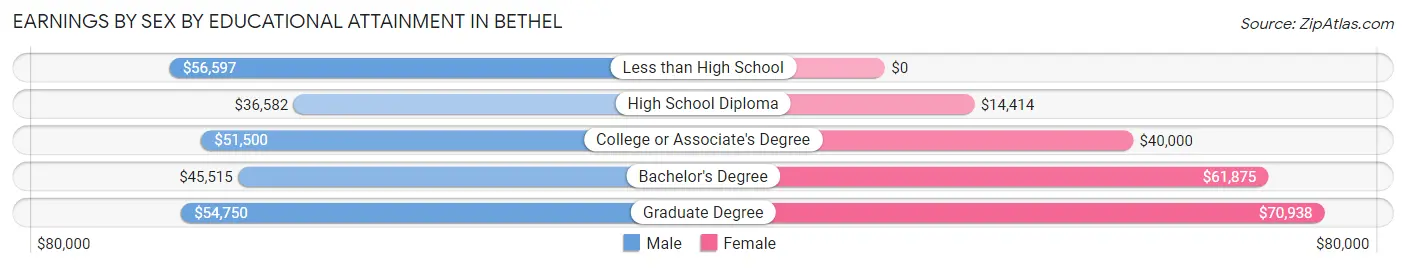
Earnings by Sex by Educational Attainment in Bethel
Average earnings in Bethel are $46,063 for men and $32,167 for women, a difference of 30.2%. Men with an educational attainment of less than high school enjoy the highest average annual earnings of $56,597, while those with high school diploma education earn the least with $36,582. Women with an educational attainment of graduate degree earn the most with the average annual earnings of $70,938, while those with high school diploma education have the smallest earnings of $14,414.
| Educational Attainment | Male Income | Female Income |
| Less than High School | $56,597 | $0 |
| High School Diploma | $36,582 | $14,414 |
| College or Associate's Degree | $51,500 | $40,000 |
| Bachelor's Degree | $45,515 | $61,875 |
| Graduate Degree | $54,750 | $70,938 |
| Total | $46,063 | $32,167 |
Family Income in Bethel
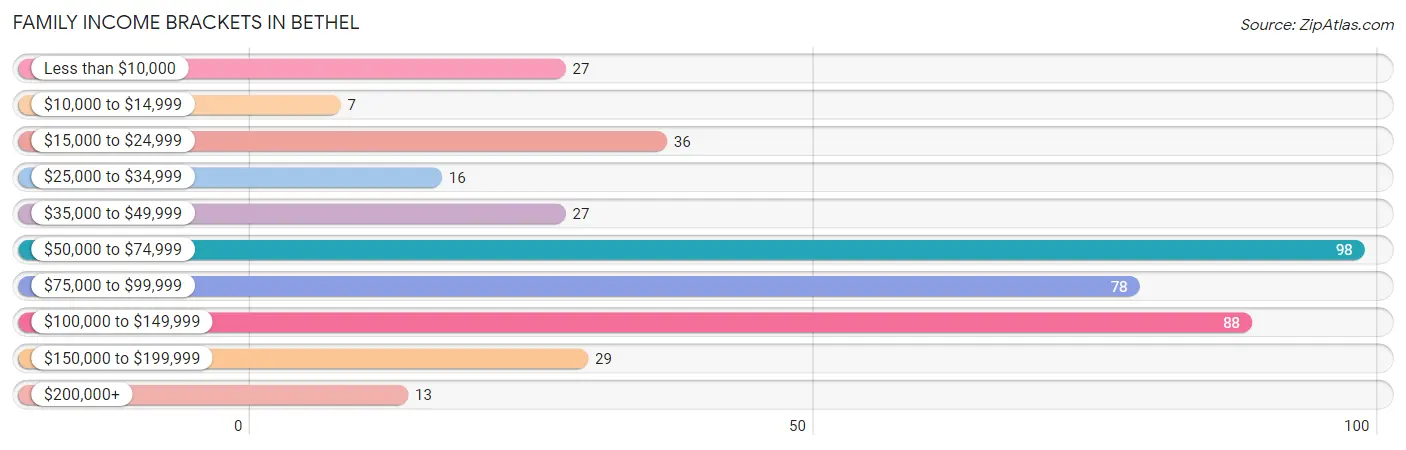
Family Income Brackets in Bethel
According to the Bethel family income data, there are 98 families falling into the $50,000 to $74,999 income range, which is the most common income bracket and makes up 23.4% of all families. Conversely, the $10,000 to $14,999 income bracket is the least frequent group with only 7 families (1.7%) belonging to this category.
| Income Bracket | # Families | % Families |
| Less than $10,000 | 27 | 6.4% |
| $10,000 to $14,999 | 7 | 1.7% |
| $15,000 to $24,999 | 36 | 8.6% |
| $25,000 to $34,999 | 16 | 3.8% |
| $35,000 to $49,999 | 27 | 6.4% |
| $50,000 to $74,999 | 98 | 23.4% |
| $75,000 to $99,999 | 78 | 18.6% |
| $100,000 to $149,999 | 88 | 21.0% |
| $150,000 to $199,999 | 29 | 6.9% |
| $200,000+ | 13 | 3.1% |
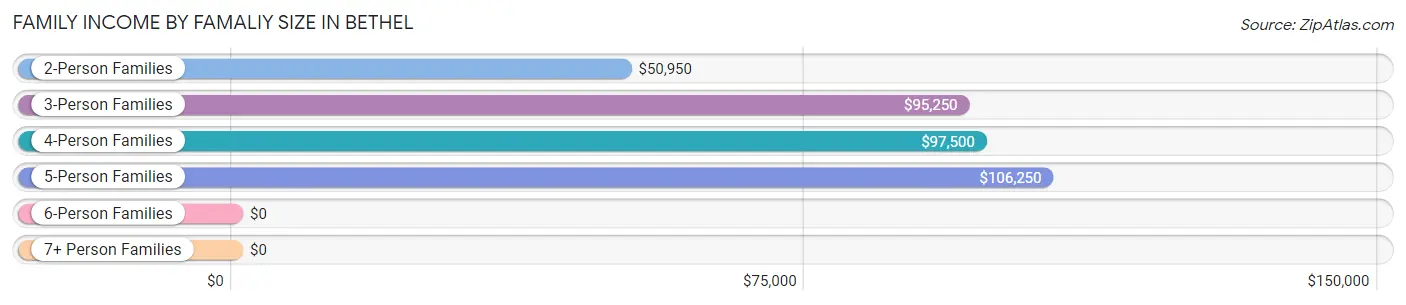
Family Income by Famaliy Size in Bethel
5-person families (24 | 5.7%) account for the highest median family income in Bethel with $106,250 per family, while 3-person families (85 | 20.3%) have the highest median income of $31,750 per family member.
| Income Bracket | # Families | Median Income |
| 2-Person Families | 220 (52.5%) | $50,950 |
| 3-Person Families | 85 (20.3%) | $95,250 |
| 4-Person Families | 72 (17.2%) | $97,500 |
| 5-Person Families | 24 (5.7%) | $106,250 |
| 6-Person Families | 18 (4.3%) | $0 |
| 7+ Person Families | 0 (0.0%) | $0 |
| Total | 419 (100.0%) | $72,344 |
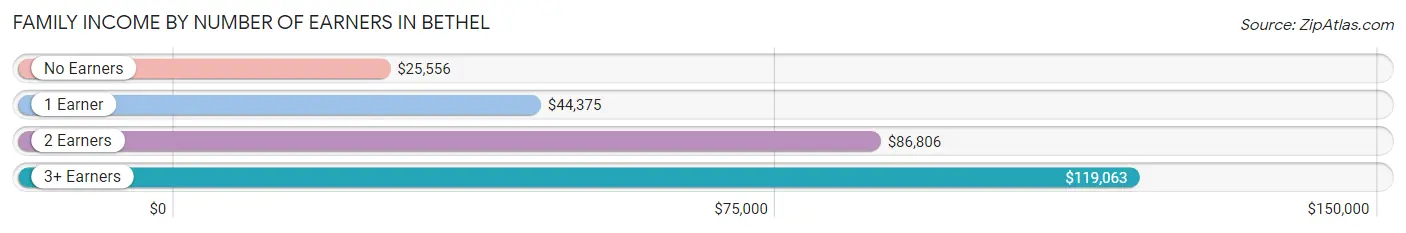
Family Income by Number of Earners in Bethel
The median family income in Bethel is $72,344, with families comprising 3+ earners (21) having the highest median family income of $119,063, while families with no earners (98) have the lowest median family income of $25,556, accounting for 5.0% and 23.4% of families, respectively.
| Number of Earners | # Families | Median Income |
| No Earners | 98 (23.4%) | $25,556 |
| 1 Earner | 78 (18.6%) | $44,375 |
| 2 Earners | 222 (53.0%) | $86,806 |
| 3+ Earners | 21 (5.0%) | $119,063 |
| Total | 419 (100.0%) | $72,344 |
Household Income in Bethel
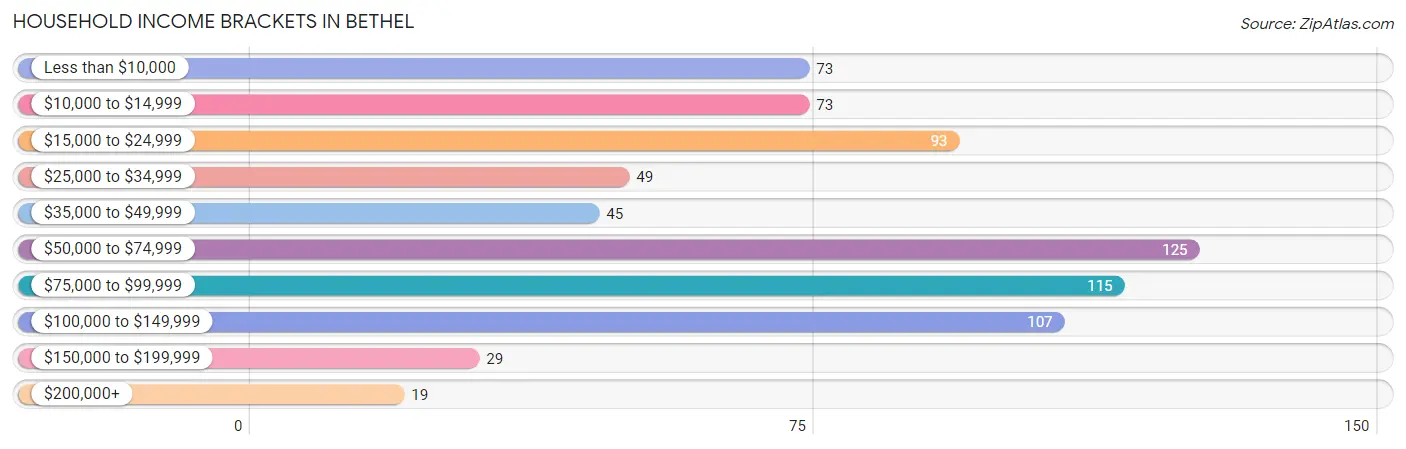
Household Income Brackets in Bethel
With 125 households falling in the category, the $50,000 to $74,999 income range is the most frequent in Bethel, accounting for 17.2% of all households. In contrast, only 19 households (2.6%) fall into the $200,000+ income bracket, making it the least populous group.
| Income Bracket | # Households | % Households |
| Less than $10,000 | 73 | 10.0% |
| $10,000 to $14,999 | 73 | 10.0% |
| $15,000 to $24,999 | 93 | 12.8% |
| $25,000 to $34,999 | 49 | 6.7% |
| $35,000 to $49,999 | 45 | 6.2% |
| $50,000 to $74,999 | 125 | 17.2% |
| $75,000 to $99,999 | 115 | 15.8% |
| $100,000 to $149,999 | 107 | 14.7% |
| $150,000 to $199,999 | 29 | 4.0% |
| $200,000+ | 19 | 2.6% |
Household Income by Householder Age in Bethel
The median household income in Bethel is $51,107, with the highest median household income of $70,726 found in the 45 to 64 years age bracket for the primary householder. A total of 268 households (36.8%) fall into this category.
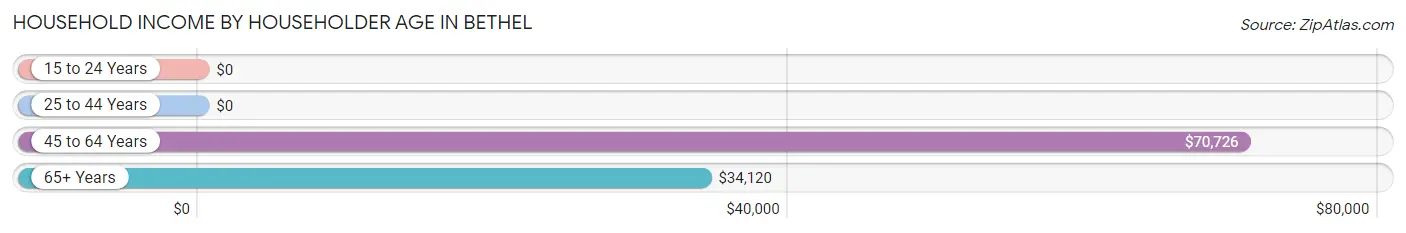
| Income Bracket | # Households | Median Income |
| 15 to 24 Years | 0 (0.0%) | $0 |
| 25 to 44 Years | 203 (27.9%) | $0 |
| 45 to 64 Years | 268 (36.8%) | $70,726 |
| 65+ Years | 257 (35.3%) | $34,120 |
| Total | 728 (100.0%) | $51,107 |
Poverty in Bethel
Income Below Poverty by Sex and Age in Bethel
With 14.2% poverty level for males and 17.1% for females among the residents of Bethel, 6 to 11 year old males and 25 to 34 year old females are the most vulnerable to poverty, with 39 males (35.1%) and 39 females (35.1%) in their respective age groups living below the poverty level.
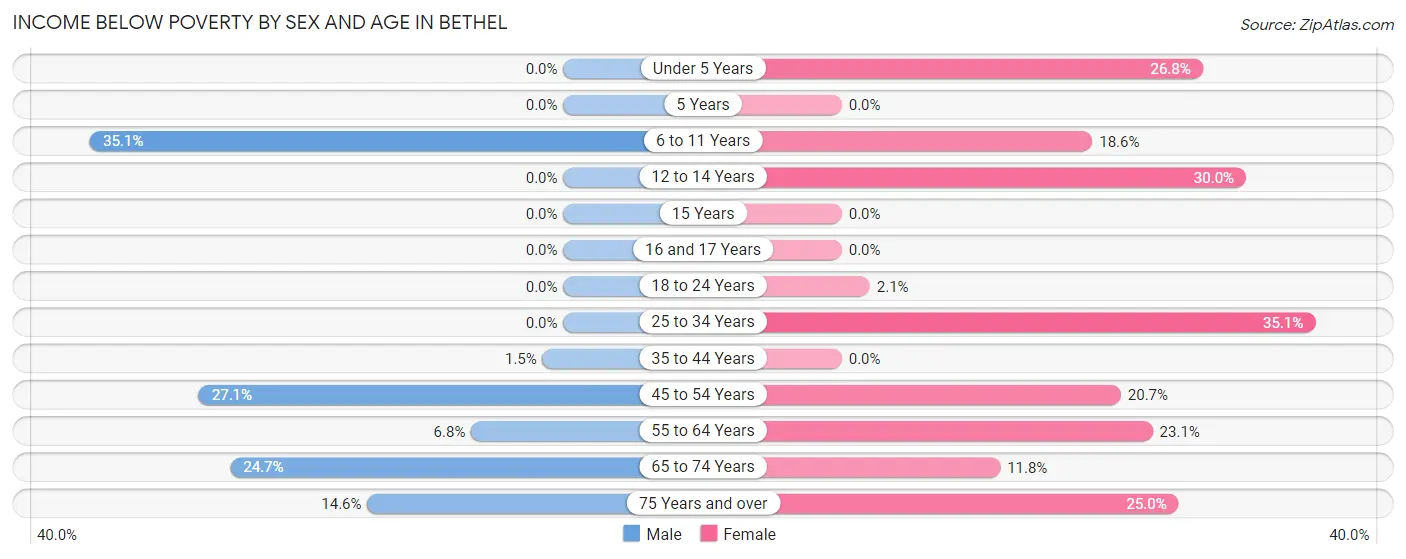
| Age Bracket | Male | Female |
| Under 5 Years | 0 (0.0%) | 15 (26.8%) |
| 5 Years | 0 (0.0%) | 0 (0.0%) |
| 6 to 11 Years | 39 (35.1%) | 8 (18.6%) |
| 12 to 14 Years | 0 (0.0%) | 6 (30.0%) |
| 15 Years | 0 (0.0%) | 0 (0.0%) |
| 16 and 17 Years | 0 (0.0%) | 0 (0.0%) |
| 18 to 24 Years | 0 (0.0%) | 1 (2.1%) |
| 25 to 34 Years | 0 (0.0%) | 39 (35.1%) |
| 35 to 44 Years | 2 (1.5%) | 0 (0.0%) |
| 45 to 54 Years | 23 (27.1%) | 23 (20.7%) |
| 55 to 64 Years | 8 (6.8%) | 30 (23.1%) |
| 65 to 74 Years | 22 (24.7%) | 16 (11.8%) |
| 75 Years and over | 8 (14.5%) | 14 (25.0%) |
| Total | 102 (14.2%) | 152 (17.1%) |
Income Above Poverty by Sex and Age in Bethel
According to the poverty statistics in Bethel, males aged under 5 years and females aged 5 years are the age groups that are most secure financially, with 100.0% of males and 100.0% of females in these age groups living above the poverty line.
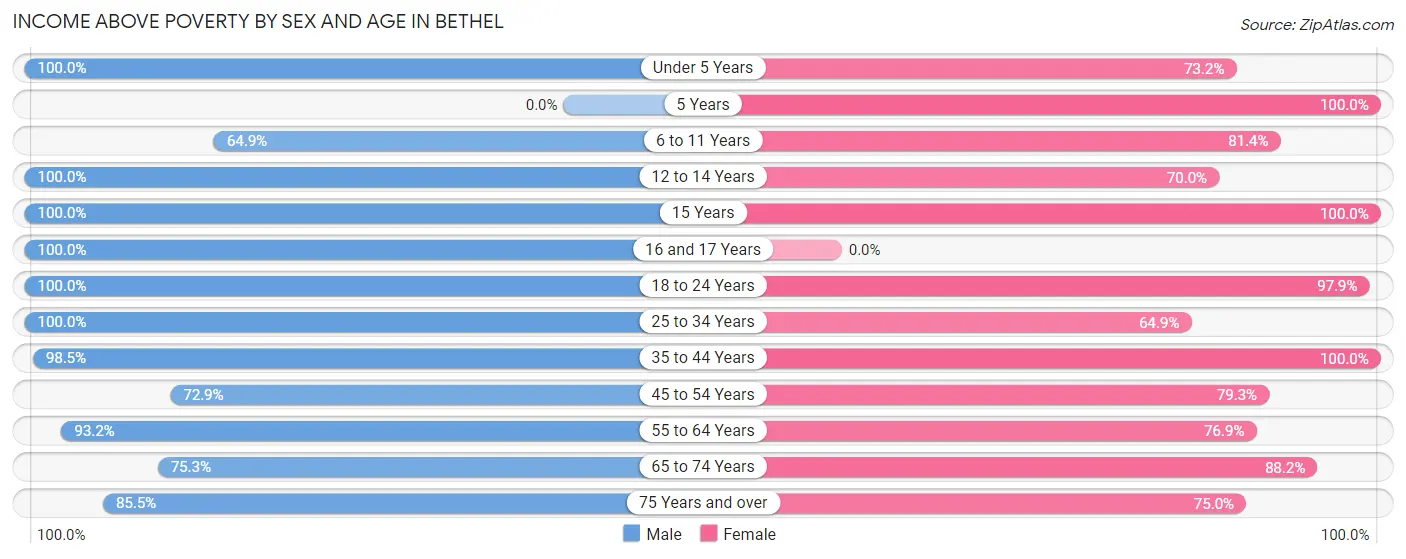
| Age Bracket | Male | Female |
| Under 5 Years | 8 (100.0%) | 41 (73.2%) |
| 5 Years | 0 (0.0%) | 31 (100.0%) |
| 6 to 11 Years | 72 (64.9%) | 35 (81.4%) |
| 12 to 14 Years | 62 (100.0%) | 14 (70.0%) |
| 15 Years | 5 (100.0%) | 13 (100.0%) |
| 16 and 17 Years | 3 (100.0%) | 0 (0.0%) |
| 18 to 24 Years | 11 (100.0%) | 47 (97.9%) |
| 25 to 34 Years | 41 (100.0%) | 72 (64.9%) |
| 35 to 44 Years | 128 (98.5%) | 132 (100.0%) |
| 45 to 54 Years | 62 (72.9%) | 88 (79.3%) |
| 55 to 64 Years | 109 (93.2%) | 100 (76.9%) |
| 65 to 74 Years | 67 (75.3%) | 120 (88.2%) |
| 75 Years and over | 47 (85.5%) | 42 (75.0%) |
| Total | 615 (85.8%) | 735 (82.9%) |
Income Below Poverty Among Married-Couple Families in Bethel
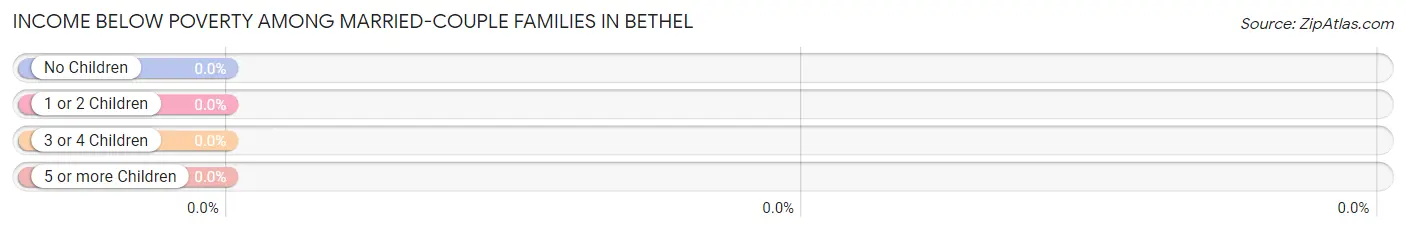
| Children | Above Poverty | Below Poverty |
| No Children | 122 (100.0%) | 0 (0.0%) |
| 1 or 2 Children | 95 (100.0%) | 0 (0.0%) |
| 3 or 4 Children | 6 (100.0%) | 0 (0.0%) |
| 5 or more Children | 0 (0.0%) | 0 (0.0%) |
| Total | 223 (100.0%) | 0 (0.0%) |
Income Below Poverty Among Single-Parent Households in Bethel
According to the poverty data in Bethel, 11.1% or 7 single-father households and 37.6% or 50 single-mother households are living below the poverty line. Among single-father households, those with no children have the highest poverty rate, with 7 households (11.1%) experiencing poverty. Likewise, among single-mother households, those with 1 or 2 children have the highest poverty rate, with 38 households (57.6%) falling below the poverty line.
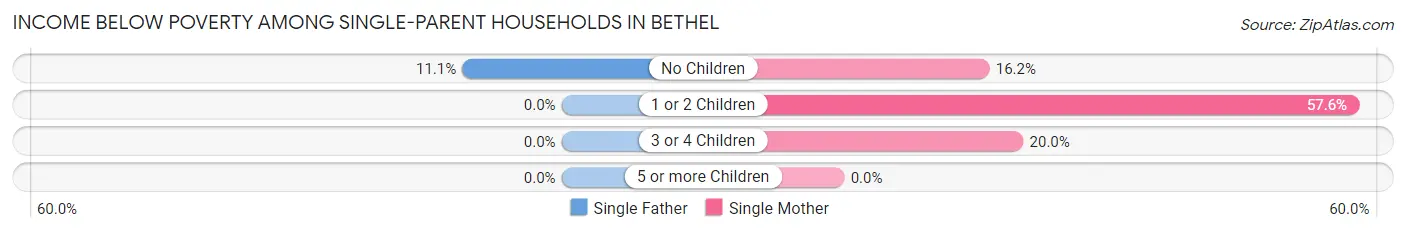
| Children | Single Father | Single Mother |
| No Children | 7 (11.1%) | 6 (16.2%) |
| 1 or 2 Children | 0 (0.0%) | 38 (57.6%) |
| 3 or 4 Children | 0 (0.0%) | 6 (20.0%) |
| 5 or more Children | 0 (0.0%) | 0 (0.0%) |
| Total | 7 (11.1%) | 50 (37.6%) |
Income Below Poverty Among Married-Couple vs Single-Parent Households in Bethel
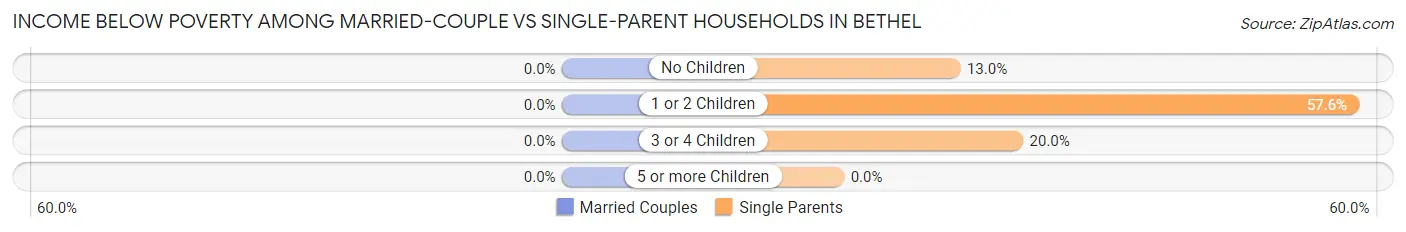
| Children | Married-Couple Families | Single-Parent Households |
| No Children | 0 (0.0%) | 13 (13.0%) |
| 1 or 2 Children | 0 (0.0%) | 38 (57.6%) |
| 3 or 4 Children | 0 (0.0%) | 6 (20.0%) |
| 5 or more Children | 0 (0.0%) | 0 (0.0%) |
| Total | 0 (0.0%) | 57 (29.1%) |
Race in Bethel
The most populous races in Bethel are Black / African American (895 | 55.8%), White / Caucasian (642 | 40.0%), and Two or more Races (50 | 3.1%).
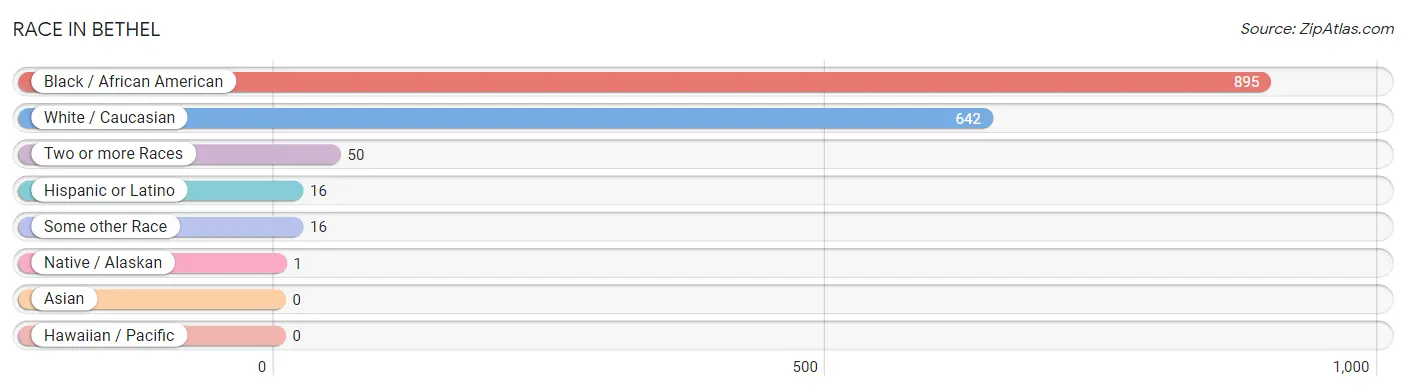
| Race | # Population | % Population |
| Asian | 0 | 0.0% |
| Black / African American | 895 | 55.8% |
| Hawaiian / Pacific | 0 | 0.0% |
| Hispanic or Latino | 16 | 1.0% |
| Native / Alaskan | 1 | 0.1% |
| White / Caucasian | 642 | 40.0% |
| Two or more Races | 50 | 3.1% |
| Some other Race | 16 | 1.0% |
| Total | 1,604 | 100.0% |
Ancestry in Bethel
The most populous ancestries reported in Bethel are English (104 | 6.5%), European (77 | 4.8%), American (75 | 4.7%), Irish (50 | 3.1%), and German (35 | 2.2%), together accounting for 21.3% of all Bethel residents.
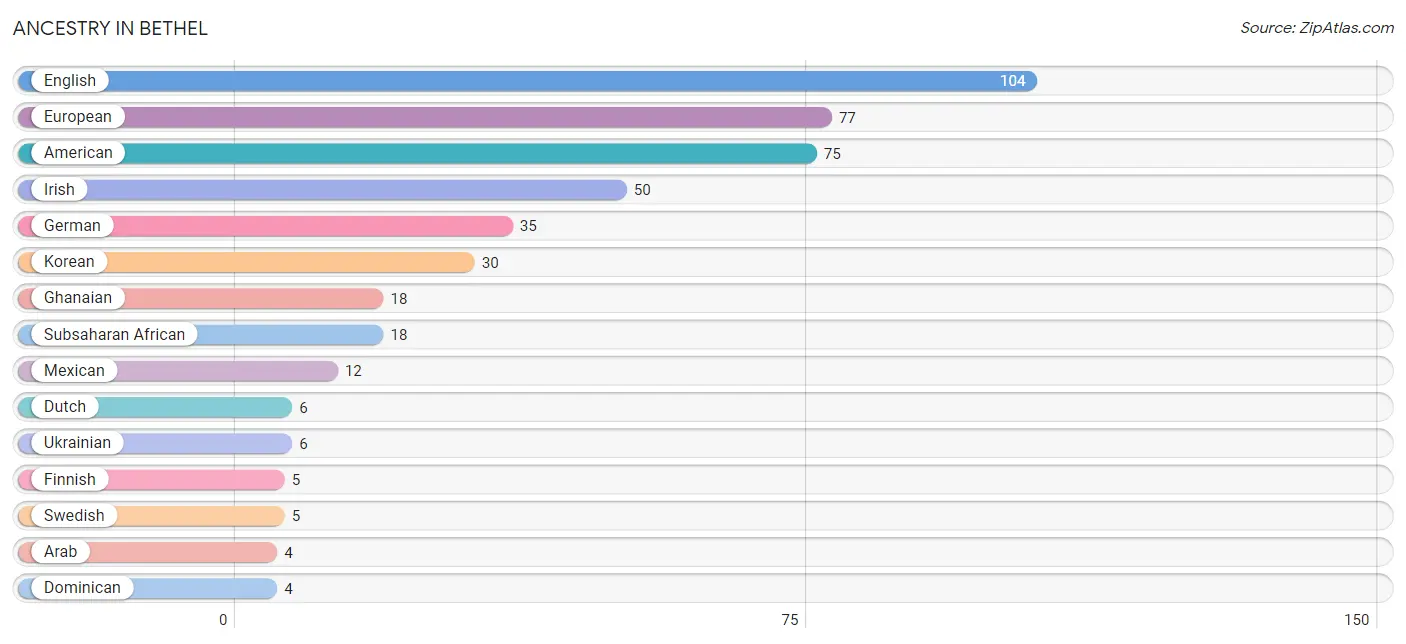
| Ancestry | # Population | % Population |
| American | 75 | 4.7% |
| Arab | 4 | 0.3% |
| Cherokee | 1 | 0.1% |
| Dominican | 4 | 0.3% |
| Dutch | 6 | 0.4% |
| English | 104 | 6.5% |
| European | 77 | 4.8% |
| Finnish | 5 | 0.3% |
| German | 35 | 2.2% |
| Ghanaian | 18 | 1.1% |
| Irish | 50 | 3.1% |
| Italian | 2 | 0.1% |
| Korean | 30 | 1.9% |
| Lebanese | 4 | 0.3% |
| Mexican | 12 | 0.7% |
| Scottish | 3 | 0.2% |
| Subsaharan African | 18 | 1.1% |
| Swedish | 5 | 0.3% |
| Ukrainian | 6 | 0.4% | View All 19 Rows |
Immigrants in Bethel
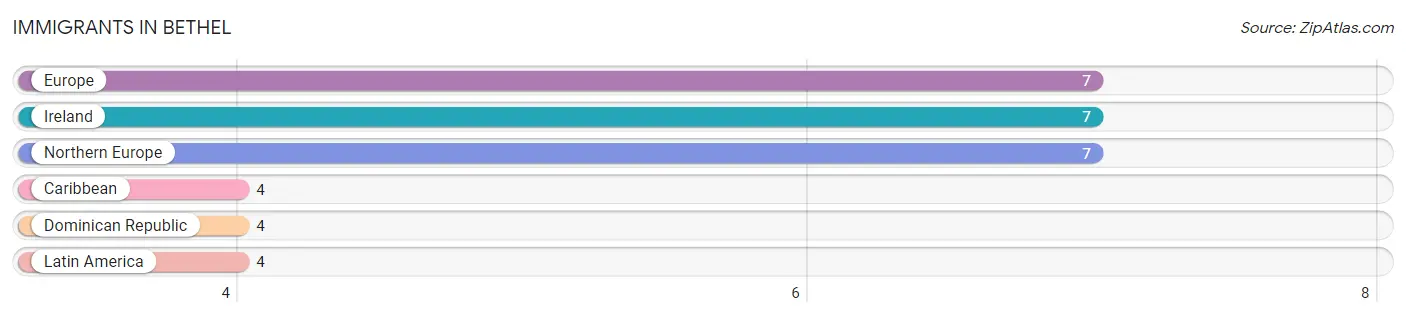
The most numerous immigrant groups reported in Bethel came from Europe (7 | 0.4%), Ireland (7 | 0.4%), Northern Europe (7 | 0.4%), Caribbean (4 | 0.3%), and Dominican Republic (4 | 0.3%), together accounting for 1.8% of all Bethel residents.
| Immigration Origin | # Population | % Population |
| Caribbean | 4 | 0.3% |
| Dominican Republic | 4 | 0.3% |
| Europe | 7 | 0.4% |
| Ireland | 7 | 0.4% |
| Latin America | 4 | 0.3% |
| Northern Europe | 7 | 0.4% | View All 6 Rows |
Sex and Age in Bethel
Sex and Age in Bethel
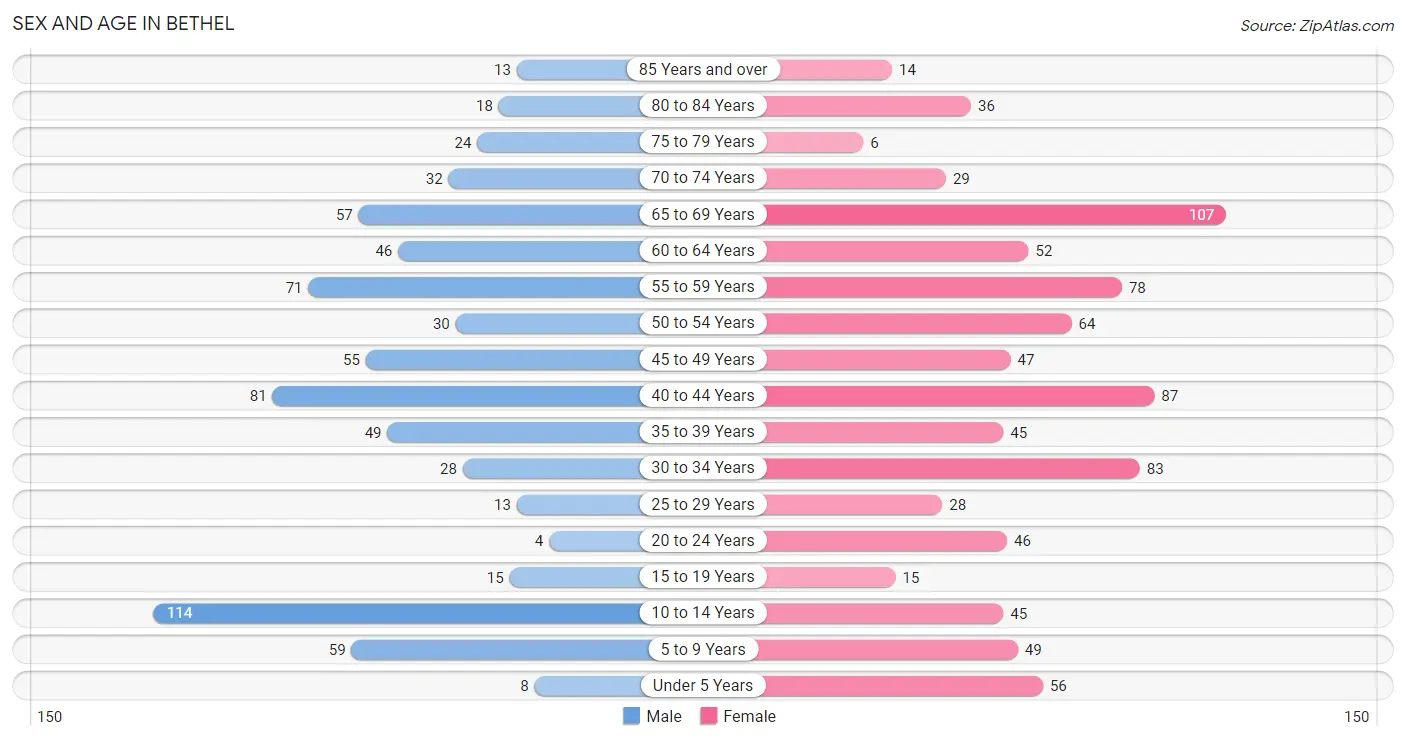
The most populous age groups in Bethel are 10 to 14 Years (114 | 15.9%) for men and 65 to 69 Years (107 | 12.1%) for women.
| Age Bracket | Male | Female |
| Under 5 Years | 8 (1.1%) | 56 (6.3%) |
| 5 to 9 Years | 59 (8.2%) | 49 (5.5%) |
| 10 to 14 Years | 114 (15.9%) | 45 (5.1%) |
| 15 to 19 Years | 15 (2.1%) | 15 (1.7%) |
| 20 to 24 Years | 4 (0.6%) | 46 (5.2%) |
| 25 to 29 Years | 13 (1.8%) | 28 (3.2%) |
| 30 to 34 Years | 28 (3.9%) | 83 (9.4%) |
| 35 to 39 Years | 49 (6.8%) | 45 (5.1%) |
| 40 to 44 Years | 81 (11.3%) | 87 (9.8%) |
| 45 to 49 Years | 55 (7.7%) | 47 (5.3%) |
| 50 to 54 Years | 30 (4.2%) | 64 (7.2%) |
| 55 to 59 Years | 71 (9.9%) | 78 (8.8%) |
| 60 to 64 Years | 46 (6.4%) | 52 (5.9%) |
| 65 to 69 Years | 57 (8.0%) | 107 (12.1%) |
| 70 to 74 Years | 32 (4.5%) | 29 (3.3%) |
| 75 to 79 Years | 24 (3.4%) | 6 (0.7%) |
| 80 to 84 Years | 18 (2.5%) | 36 (4.1%) |
| 85 Years and over | 13 (1.8%) | 14 (1.6%) |
| Total | 717 (100.0%) | 887 (100.0%) |
Families and Households in Bethel
Median Family Size in Bethel
The median family size in Bethel is 2.97 persons per family, with single female/mother families (133 | 31.7%) accounting for the largest median family size of 3.12 persons per family. On the other hand, single male/father families (63 | 15.0%) represent the smallest median family size with 2.27 persons per family.
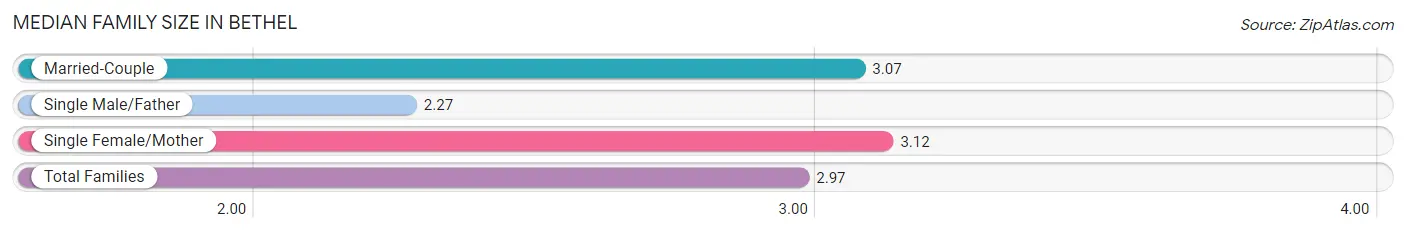
| Family Type | # Families | Family Size |
| Married-Couple | 223 (53.2%) | 3.07 |
| Single Male/Father | 63 (15.0%) | 2.27 |
| Single Female/Mother | 133 (31.7%) | 3.12 |
| Total Families | 419 (100.0%) | 2.97 |
Median Household Size in Bethel
The median household size in Bethel is 2.20 persons per household, with single female/mother households (133 | 18.3%) accounting for the largest median household size of 3.26 persons per household. non-family households (309 | 42.4%) represent the smallest median household size with 1.10 persons per household.
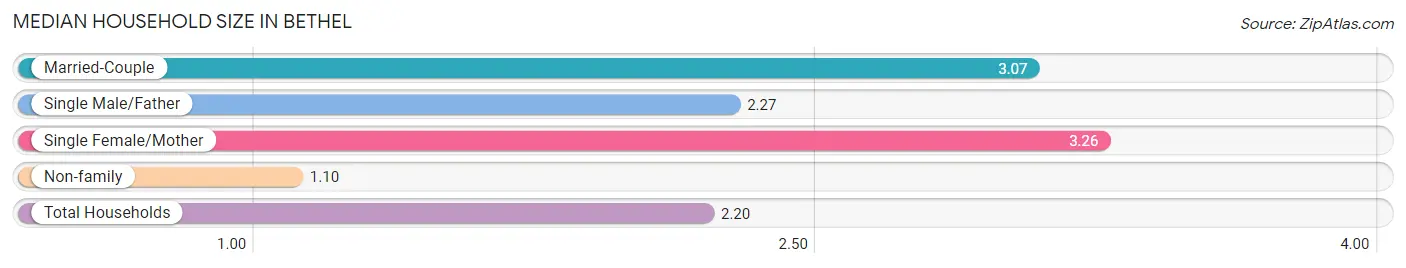
| Household Type | # Households | Household Size |
| Married-Couple | 223 (30.6%) | 3.07 |
| Single Male/Father | 63 (8.6%) | 2.27 |
| Single Female/Mother | 133 (18.3%) | 3.26 |
| Non-family | 309 (42.4%) | 1.10 |
| Total Households | 728 (100.0%) | 2.20 |
Household Size by Marriage Status in Bethel
Out of a total of 728 households in Bethel, 419 (57.6%) are family households, while 309 (42.4%) are nonfamily households. The most numerous type of family households are 2-person households, comprising 220, and the most common type of nonfamily households are 1-person households, comprising 281.
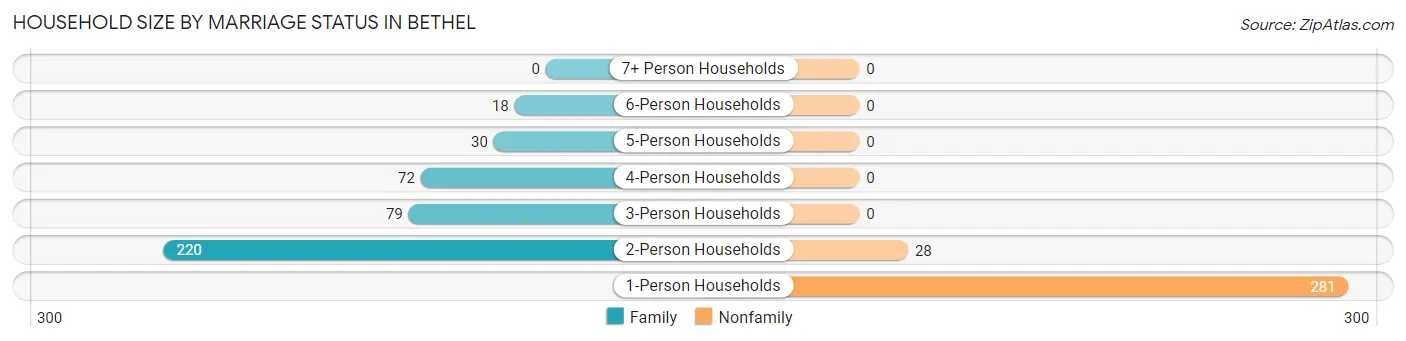
| Household Size | Family Households | Nonfamily Households |
| 1-Person Households | - | 281 (38.6%) |
| 2-Person Households | 220 (30.2%) | 28 (3.8%) |
| 3-Person Households | 79 (10.8%) | 0 (0.0%) |
| 4-Person Households | 72 (9.9%) | 0 (0.0%) |
| 5-Person Households | 30 (4.1%) | 0 (0.0%) |
| 6-Person Households | 18 (2.5%) | 0 (0.0%) |
| 7+ Person Households | 0 (0.0%) | 0 (0.0%) |
| Total | 419 (57.6%) | 309 (42.4%) |
Female Fertility in Bethel
Fertility by Age in Bethel
Average fertility rate in Bethel is 77.0 births per 1,000 women. Women in the age bracket of 20 to 34 years have the highest fertility rate with 178.0 births per 1,000 women. Women in the age bracket of 20 to 34 years acount for 100.0% of all women with births.
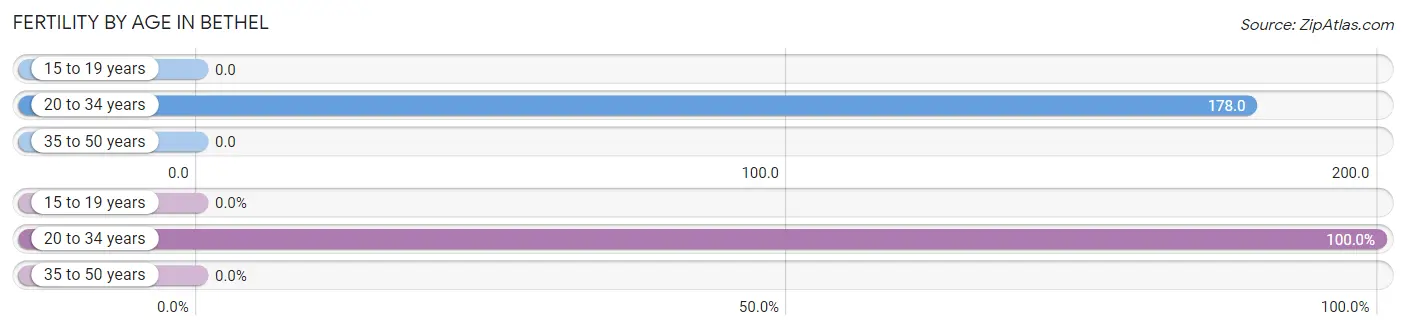
| Age Bracket | Women with Births | Births / 1,000 Women |
| 15 to 19 years | 0 (0.0%) | 0.0 |
| 20 to 34 years | 28 (100.0%) | 178.0 |
| 35 to 50 years | 0 (0.0%) | 0.0 |
| Total | 28 (100.0%) | 77.0 |
Fertility by Age by Marriage Status in Bethel
60.7% of women with births (28) in Bethel are married. The highest percentage of unmarried women with births falls into 20 to 34 years age bracket with 39.3% of them unmarried at the time of birth, while the lowest percentage of unmarried women with births belong to 20 to 34 years age bracket with 39.3% of them unmarried.
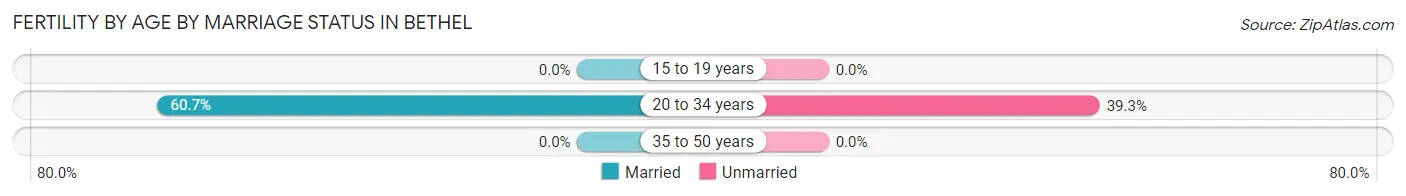
| Age Bracket | Married | Unmarried |
| 15 to 19 years | 0 (0.0%) | 0 (0.0%) |
| 20 to 34 years | 17 (60.7%) | 11 (39.3%) |
| 35 to 50 years | 0 (0.0%) | 0 (0.0%) |
| Total | 17 (60.7%) | 11 (39.3%) |
Fertility by Education in Bethel
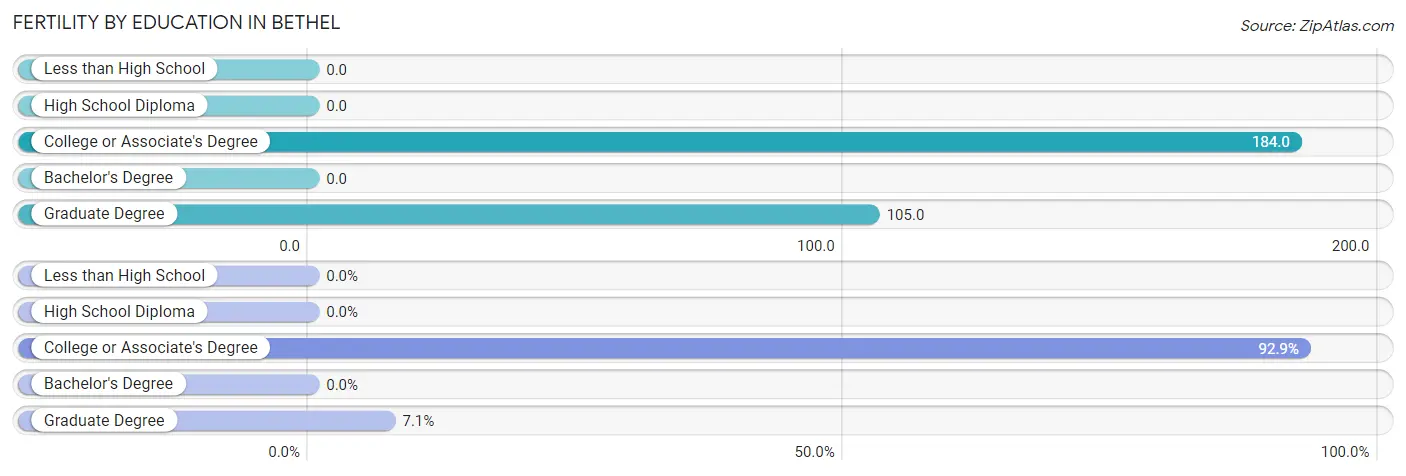
| Educational Attainment | Women with Births | Births / 1,000 Women |
| Less than High School | 0 (0.0%) | 0.0 |
| High School Diploma | 0 (0.0%) | 0.0 |
| College or Associate's Degree | 26 (92.9%) | 184.0 |
| Bachelor's Degree | 0 (0.0%) | 0.0 |
| Graduate Degree | 2 (7.1%) | 105.0 |
| Total | 28 (100.0%) | 77.0 |
Fertility by Education by Marriage Status in Bethel
39.3% of women with births in Bethel are unmarried. Women with the educational attainment of graduate degree are most likely to be married with 100.0% of them married at childbirth, while women with the educational attainment of college or associate's degree are least likely to be married with 42.3% of them unmarried at childbirth.
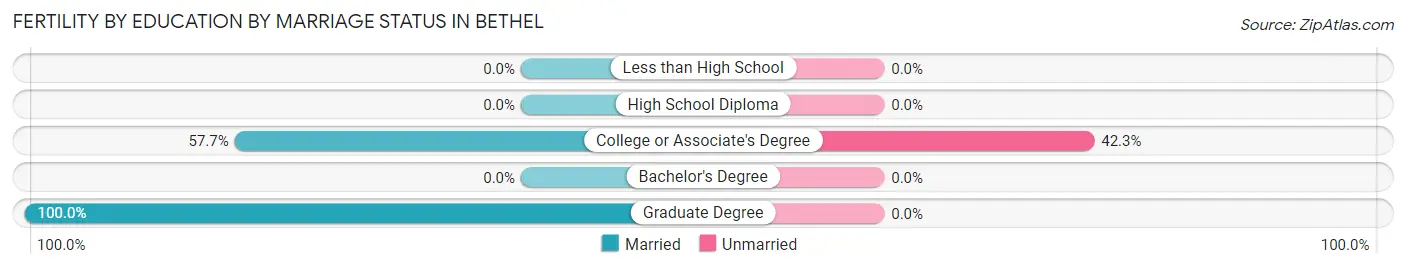
| Educational Attainment | Married | Unmarried |
| Less than High School | 0 (0.0%) | 0 (0.0%) |
| High School Diploma | 0 (0.0%) | 0 (0.0%) |
| College or Associate's Degree | 15 (57.7%) | 11 (42.3%) |
| Bachelor's Degree | 0 (0.0%) | 0 (0.0%) |
| Graduate Degree | 2 (100.0%) | 0 (0.0%) |
| Total | 17 (60.7%) | 11 (39.3%) |
Employment Characteristics in Bethel
Employment by Class of Employer in Bethel
Among the 721 employed individuals in Bethel, private company employees (464 | 64.4%), local government employees (104 | 14.4%), and state government employees (78 | 10.8%) make up the most common classes of employment.
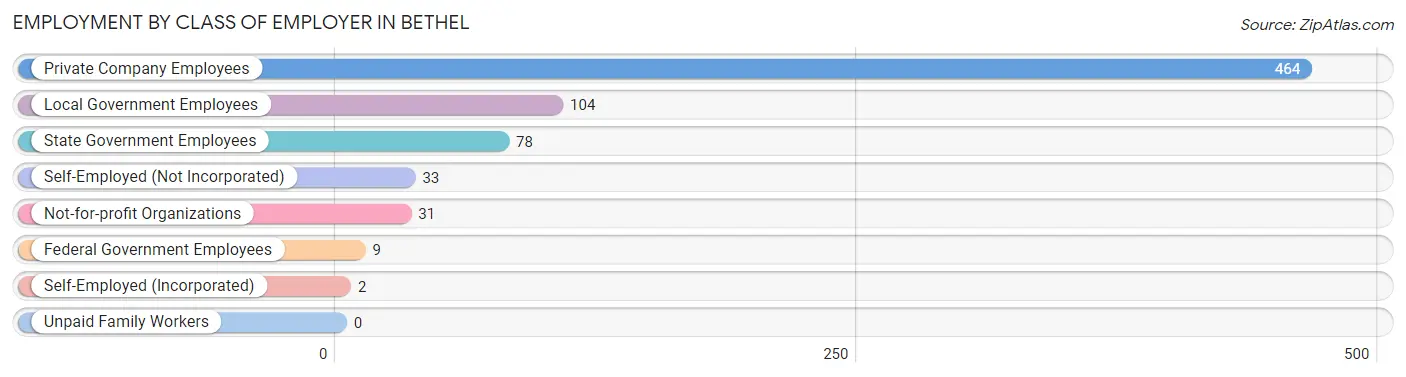
| Employer Class | # Employees | % Employees |
| Private Company Employees | 464 | 64.4% |
| Self-Employed (Incorporated) | 2 | 0.3% |
| Self-Employed (Not Incorporated) | 33 | 4.6% |
| Not-for-profit Organizations | 31 | 4.3% |
| Local Government Employees | 104 | 14.4% |
| State Government Employees | 78 | 10.8% |
| Federal Government Employees | 9 | 1.3% |
| Unpaid Family Workers | 0 | 0.0% |
| Total | 721 | 100.0% |
Employment Status by Age in Bethel
According to the labor force statistics for Bethel, out of the total population over 16 years of age (1,255), 62.5% or 784 individuals are in the labor force, with 7.5% or 59 of them unemployed. The age group with the highest labor force participation rate is 25 to 29 years, with 100.0% or 41 individuals in the labor force. Within the labor force, the 20 to 24 years age range has the highest percentage of unemployed individuals, with 61.2% or 30 of them being unemployed.
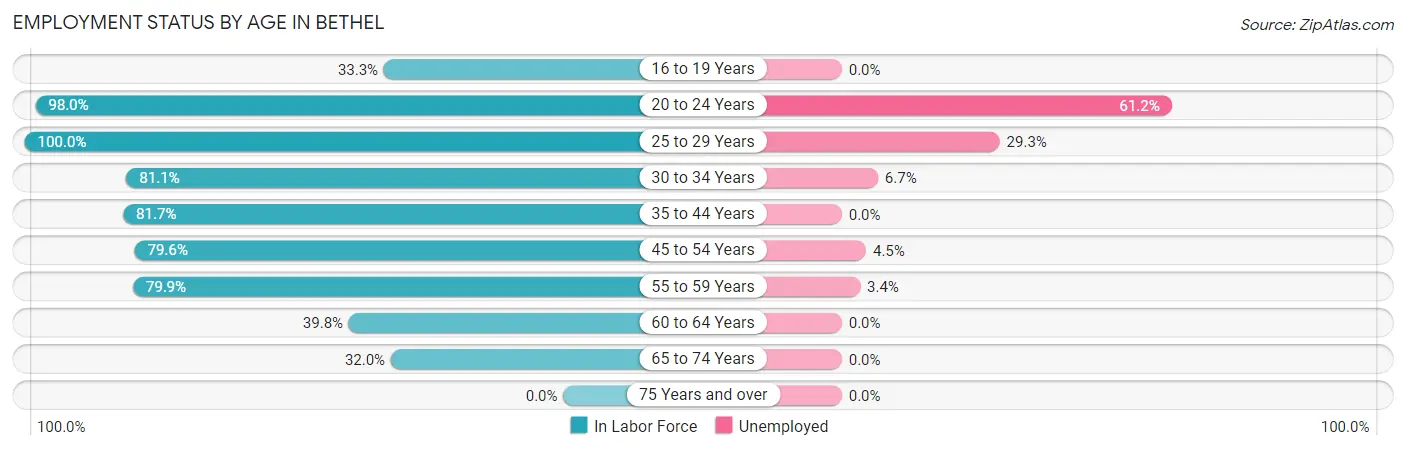
| Age Bracket | In Labor Force | Unemployed |
| 16 to 19 Years | 4 (33.3%) | 0 (0.0%) |
| 20 to 24 Years | 49 (98.0%) | 30 (61.2%) |
| 25 to 29 Years | 41 (100.0%) | 12 (29.3%) |
| 30 to 34 Years | 90 (81.1%) | 6 (6.7%) |
| 35 to 44 Years | 214 (81.7%) | 0 (0.0%) |
| 45 to 54 Years | 156 (79.6%) | 7 (4.5%) |
| 55 to 59 Years | 119 (79.9%) | 4 (3.4%) |
| 60 to 64 Years | 39 (39.8%) | 0 (0.0%) |
| 65 to 74 Years | 72 (32.0%) | 0 (0.0%) |
| 75 Years and over | 0 (0.0%) | 0 (0.0%) |
| Total | 784 (62.5%) | 59 (7.5%) |
Employment Status by Educational Attainment in Bethel
According to labor force statistics for Bethel, 76.9% of individuals (659) out of the total population between 25 and 64 years of age (857) are in the labor force, with 4.4% or 29 of them being unemployed. The group with the highest labor force participation rate are those with the educational attainment of high school diploma, with 81.7% or 228 individuals in the labor force. Within the labor force, individuals with less than high school education have the highest percentage of unemployment, with 13.5% or 7 of them being unemployed.
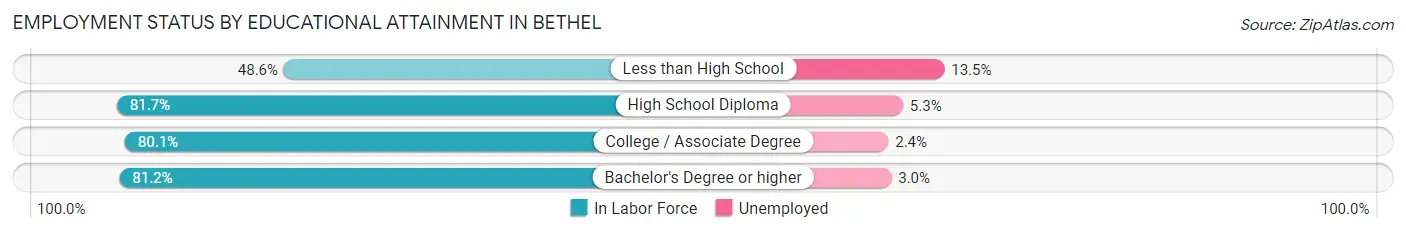
| Educational Attainment | In Labor Force | Unemployed |
| Less than High School | 52 (48.6%) | 14 (13.5%) |
| High School Diploma | 228 (81.7%) | 15 (5.3%) |
| College / Associate Degree | 245 (80.1%) | 7 (2.4%) |
| Bachelor's Degree or higher | 134 (81.2%) | 5 (3.0%) |
| Total | 659 (76.9%) | 38 (4.4%) |
Employment Occupations by Sex in Bethel
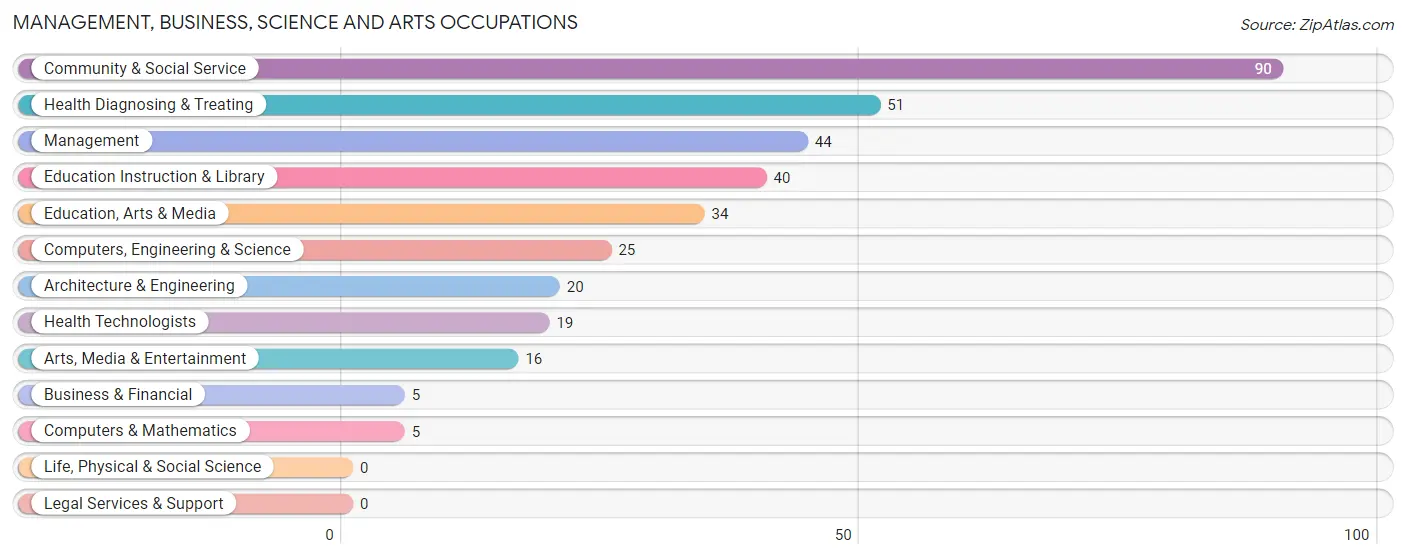
Management, Business, Science and Arts Occupations
The most common Management, Business, Science and Arts occupations in Bethel are Community & Social Service (90 | 12.4%), Health Diagnosing & Treating (51 | 7.0%), Management (44 | 6.1%), Education Instruction & Library (40 | 5.5%), and Education, Arts & Media (34 | 4.7%).
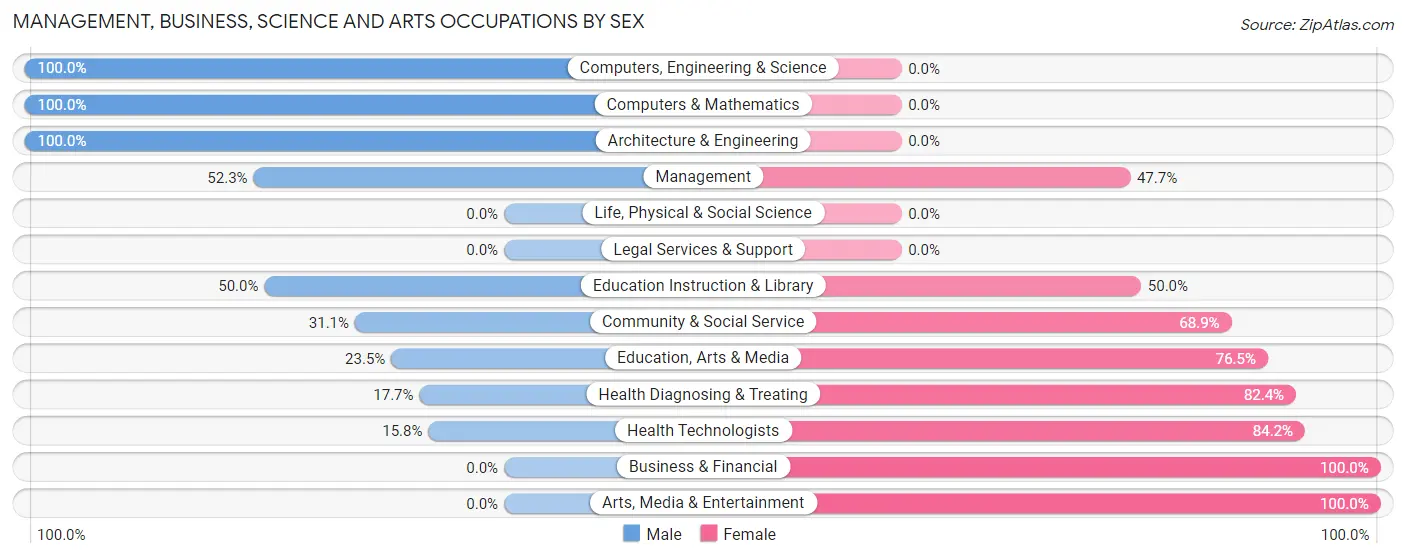
Management, Business, Science and Arts Occupations by Sex
Within the Management, Business, Science and Arts occupations in Bethel, the most male-oriented occupations are Computers, Engineering & Science (100.0%), Computers & Mathematics (100.0%), and Architecture & Engineering (100.0%), while the most female-oriented occupations are Business & Financial (100.0%), Arts, Media & Entertainment (100.0%), and Health Technologists (84.2%).
| Occupation | Male | Female |
| Management | 23 (52.3%) | 21 (47.7%) |
| Business & Financial | 0 (0.0%) | 5 (100.0%) |
| Computers, Engineering & Science | 25 (100.0%) | 0 (0.0%) |
| Computers & Mathematics | 5 (100.0%) | 0 (0.0%) |
| Architecture & Engineering | 20 (100.0%) | 0 (0.0%) |
| Life, Physical & Social Science | 0 (0.0%) | 0 (0.0%) |
| Community & Social Service | 28 (31.1%) | 62 (68.9%) |
| Education, Arts & Media | 8 (23.5%) | 26 (76.5%) |
| Legal Services & Support | 0 (0.0%) | 0 (0.0%) |
| Education Instruction & Library | 20 (50.0%) | 20 (50.0%) |
| Arts, Media & Entertainment | 0 (0.0%) | 16 (100.0%) |
| Health Diagnosing & Treating | 9 (17.6%) | 42 (82.4%) |
| Health Technologists | 3 (15.8%) | 16 (84.2%) |
| Total (Category) | 85 (39.5%) | 130 (60.5%) |
| Total (Overall) | 339 (46.8%) | 386 (53.2%) |
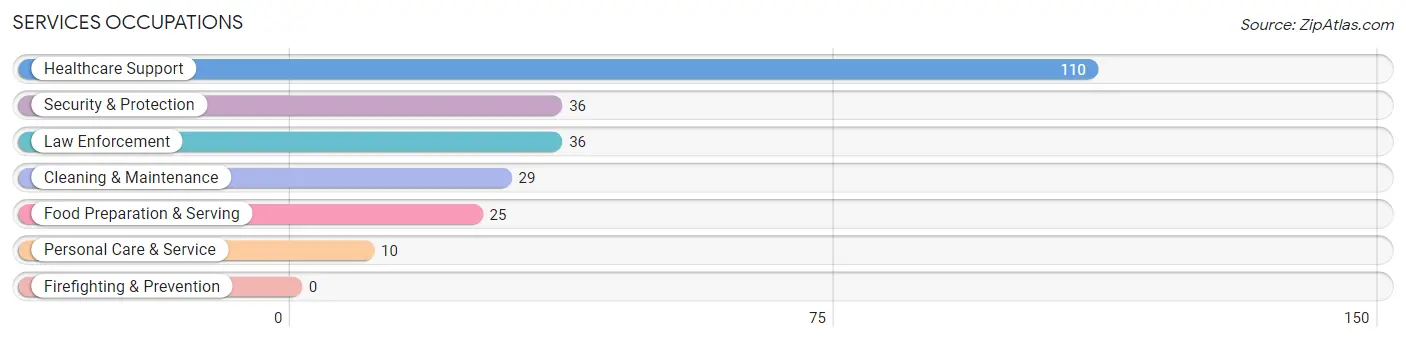
Services Occupations
The most common Services occupations in Bethel are Healthcare Support (110 | 15.2%), Security & Protection (36 | 5.0%), Law Enforcement (36 | 5.0%), Cleaning & Maintenance (29 | 4.0%), and Food Preparation & Serving (25 | 3.5%).
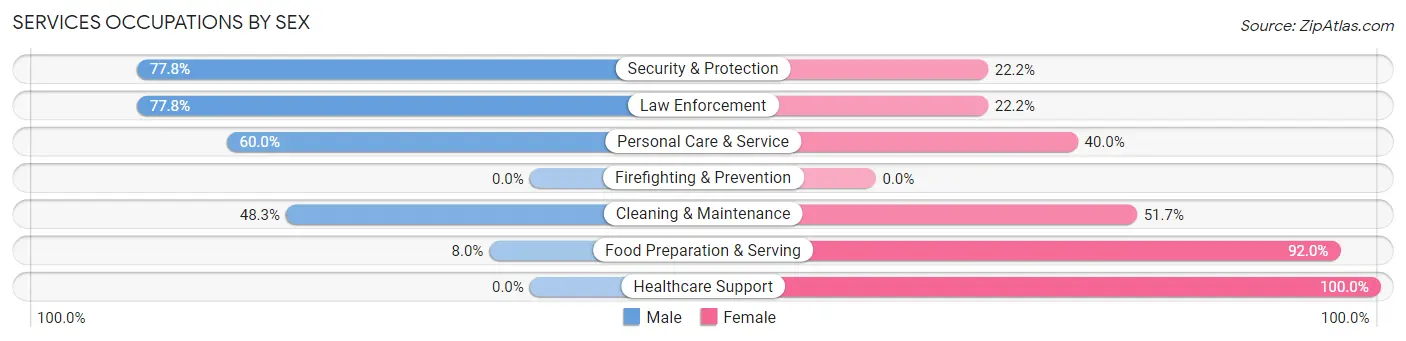
Services Occupations by Sex
Within the Services occupations in Bethel, the most male-oriented occupations are Security & Protection (77.8%), Law Enforcement (77.8%), and Personal Care & Service (60.0%), while the most female-oriented occupations are Healthcare Support (100.0%), Food Preparation & Serving (92.0%), and Cleaning & Maintenance (51.7%).
| Occupation | Male | Female |
| Healthcare Support | 0 (0.0%) | 110 (100.0%) |
| Security & Protection | 28 (77.8%) | 8 (22.2%) |
| Firefighting & Prevention | 0 (0.0%) | 0 (0.0%) |
| Law Enforcement | 28 (77.8%) | 8 (22.2%) |
| Food Preparation & Serving | 2 (8.0%) | 23 (92.0%) |
| Cleaning & Maintenance | 14 (48.3%) | 15 (51.7%) |
| Personal Care & Service | 6 (60.0%) | 4 (40.0%) |
| Total (Category) | 50 (23.8%) | 160 (76.2%) |
| Total (Overall) | 339 (46.8%) | 386 (53.2%) |
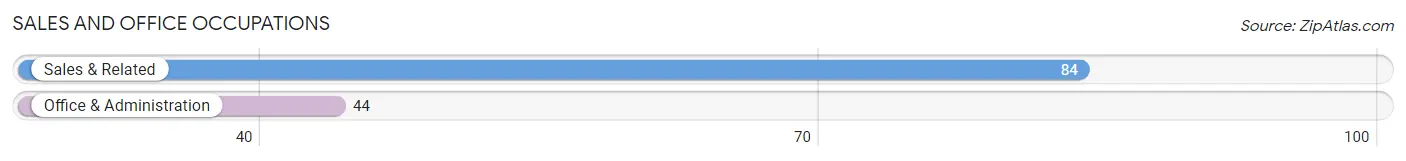
Sales and Office Occupations
The most common Sales and Office occupations in Bethel are Sales & Related (84 | 11.6%), and Office & Administration (44 | 6.1%).
Sales and Office Occupations by Sex
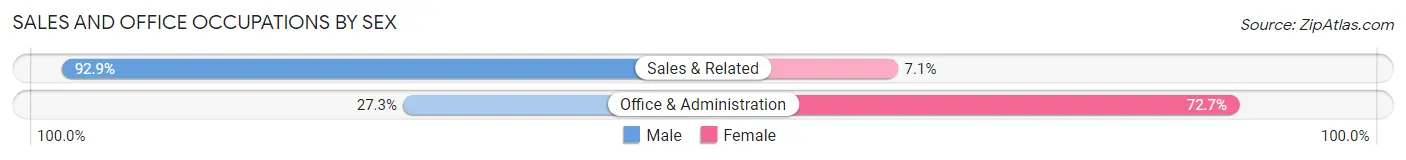
| Occupation | Male | Female |
| Sales & Related | 78 (92.9%) | 6 (7.1%) |
| Office & Administration | 12 (27.3%) | 32 (72.7%) |
| Total (Category) | 90 (70.3%) | 38 (29.7%) |
| Total (Overall) | 339 (46.8%) | 386 (53.2%) |
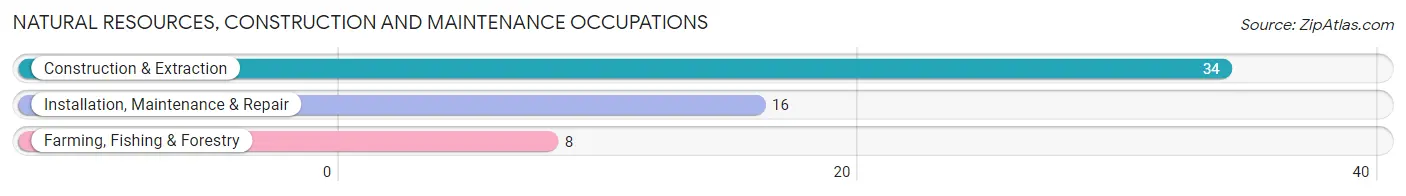
Natural Resources, Construction and Maintenance Occupations
The most common Natural Resources, Construction and Maintenance occupations in Bethel are Construction & Extraction (34 | 4.7%), Installation, Maintenance & Repair (16 | 2.2%), and Farming, Fishing & Forestry (8 | 1.1%).
Natural Resources, Construction and Maintenance Occupations by Sex
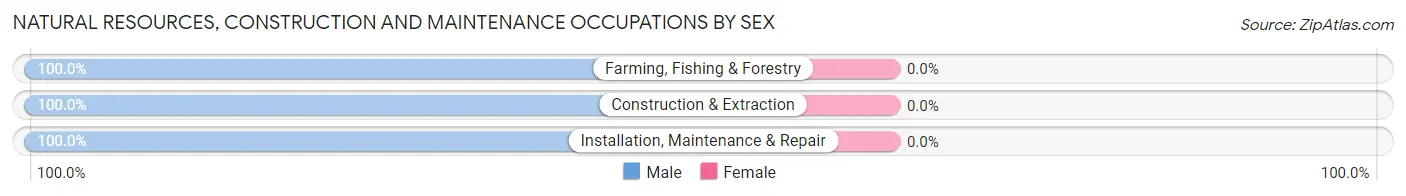
| Occupation | Male | Female |
| Farming, Fishing & Forestry | 8 (100.0%) | 0 (0.0%) |
| Construction & Extraction | 34 (100.0%) | 0 (0.0%) |
| Installation, Maintenance & Repair | 16 (100.0%) | 0 (0.0%) |
| Total (Category) | 58 (100.0%) | 0 (0.0%) |
| Total (Overall) | 339 (46.8%) | 386 (53.2%) |
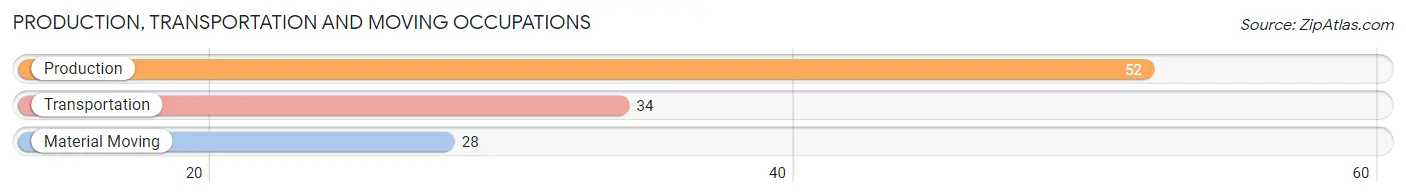
Production, Transportation and Moving Occupations
The most common Production, Transportation and Moving occupations in Bethel are Production (52 | 7.2%), Transportation (34 | 4.7%), and Material Moving (28 | 3.9%).
Production, Transportation and Moving Occupations by Sex
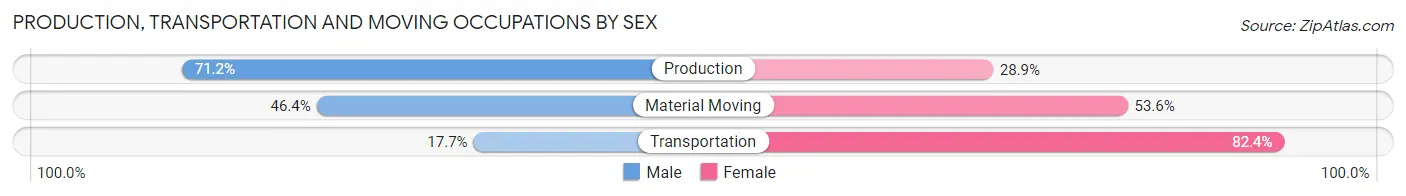
| Occupation | Male | Female |
| Production | 37 (71.2%) | 15 (28.8%) |
| Transportation | 6 (17.6%) | 28 (82.4%) |
| Material Moving | 13 (46.4%) | 15 (53.6%) |
| Total (Category) | 56 (49.1%) | 58 (50.9%) |
| Total (Overall) | 339 (46.8%) | 386 (53.2%) |
Employment Industries by Sex in Bethel
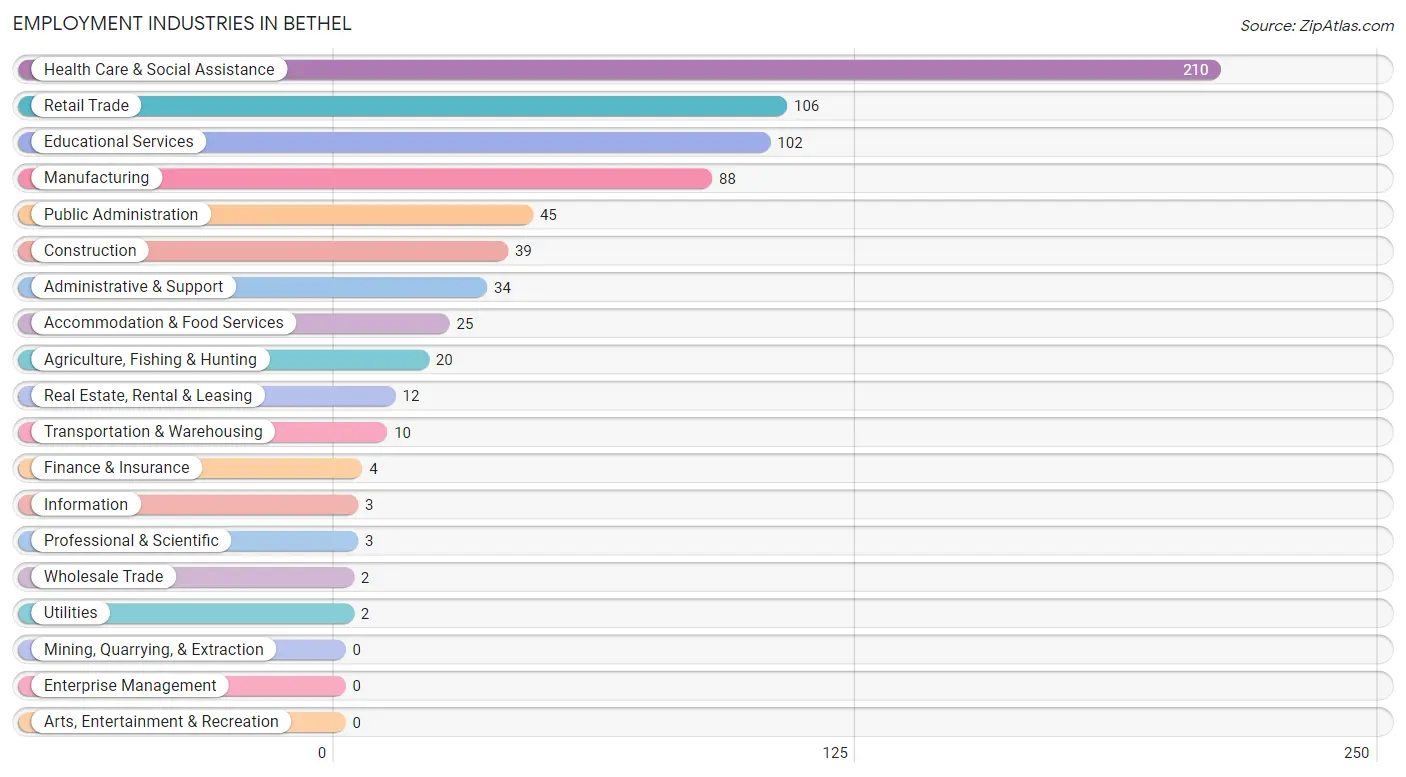
Employment Industries in Bethel
The major employment industries in Bethel include Health Care & Social Assistance (210 | 29.0%), Retail Trade (106 | 14.6%), Educational Services (102 | 14.1%), Manufacturing (88 | 12.1%), and Public Administration (45 | 6.2%).
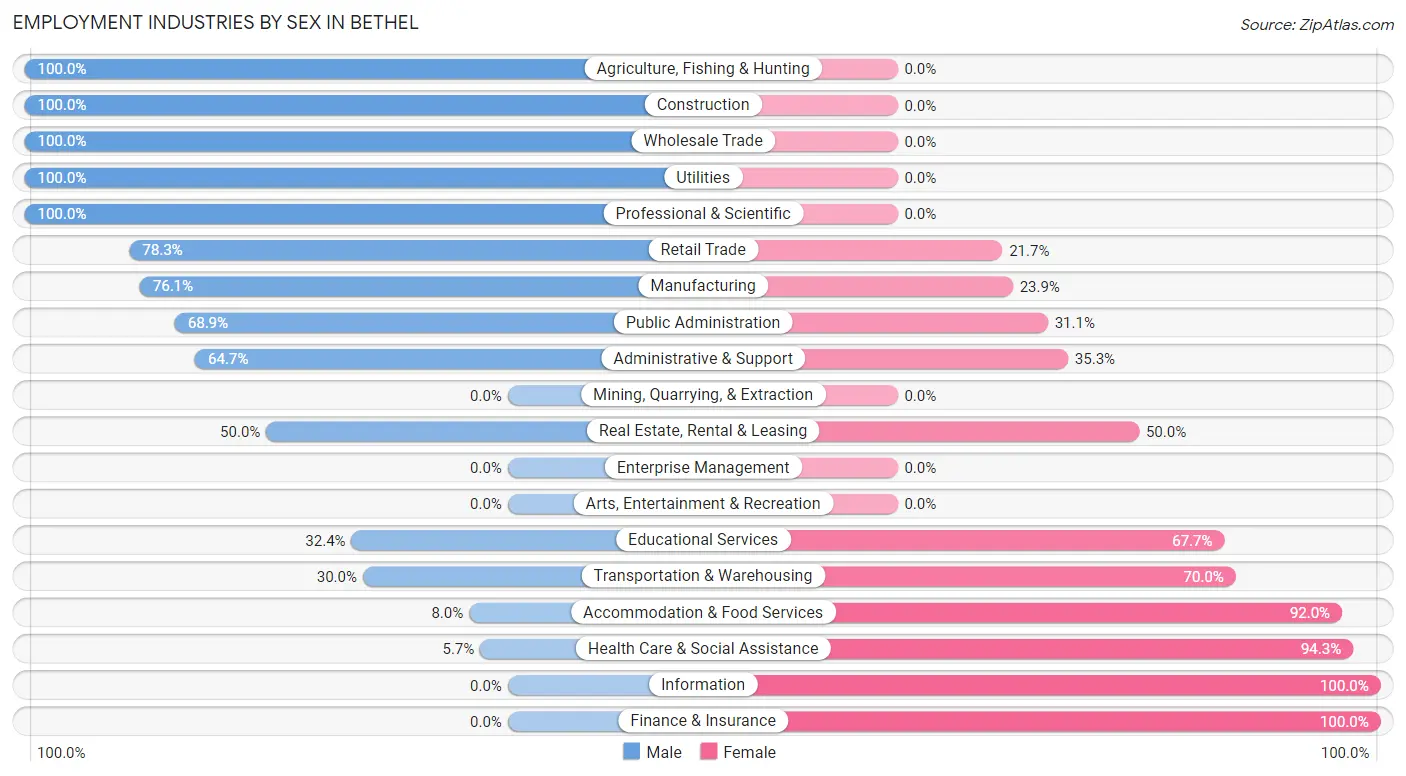
Employment Industries by Sex in Bethel
The Bethel industries that see more men than women are Agriculture, Fishing & Hunting (100.0%), Construction (100.0%), and Wholesale Trade (100.0%), whereas the industries that tend to have a higher number of women are Information (100.0%), Finance & Insurance (100.0%), and Health Care & Social Assistance (94.3%).
| Industry | Male | Female |
| Agriculture, Fishing & Hunting | 20 (100.0%) | 0 (0.0%) |
| Mining, Quarrying, & Extraction | 0 (0.0%) | 0 (0.0%) |
| Construction | 39 (100.0%) | 0 (0.0%) |
| Manufacturing | 67 (76.1%) | 21 (23.9%) |
| Wholesale Trade | 2 (100.0%) | 0 (0.0%) |
| Retail Trade | 83 (78.3%) | 23 (21.7%) |
| Transportation & Warehousing | 3 (30.0%) | 7 (70.0%) |
| Utilities | 2 (100.0%) | 0 (0.0%) |
| Information | 0 (0.0%) | 3 (100.0%) |
| Finance & Insurance | 0 (0.0%) | 4 (100.0%) |
| Real Estate, Rental & Leasing | 6 (50.0%) | 6 (50.0%) |
| Professional & Scientific | 3 (100.0%) | 0 (0.0%) |
| Enterprise Management | 0 (0.0%) | 0 (0.0%) |
| Administrative & Support | 22 (64.7%) | 12 (35.3%) |
| Educational Services | 33 (32.4%) | 69 (67.6%) |
| Health Care & Social Assistance | 12 (5.7%) | 198 (94.3%) |
| Arts, Entertainment & Recreation | 0 (0.0%) | 0 (0.0%) |
| Accommodation & Food Services | 2 (8.0%) | 23 (92.0%) |
| Public Administration | 31 (68.9%) | 14 (31.1%) |
| Total | 339 (46.8%) | 386 (53.2%) |
Education in Bethel
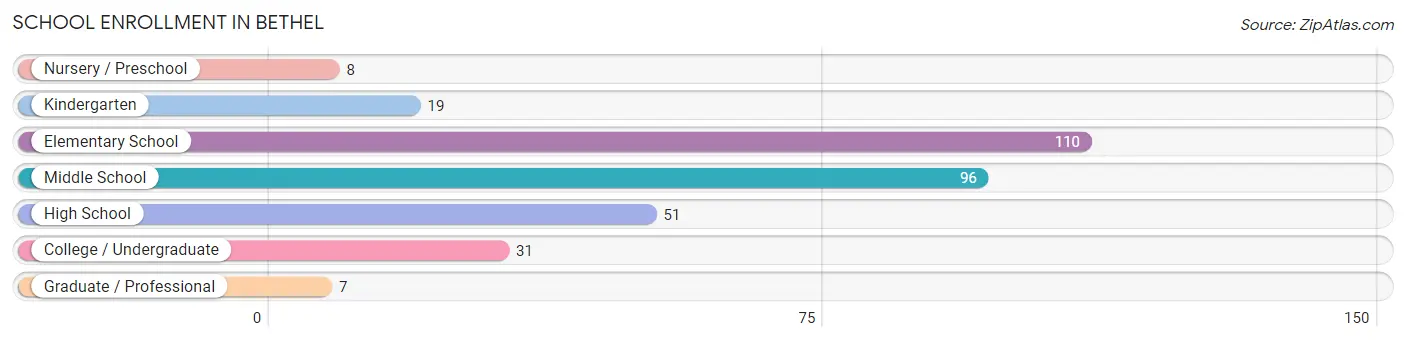
School Enrollment in Bethel
The most common levels of schooling among the 322 students in Bethel are elementary school (110 | 34.2%), middle school (96 | 29.8%), and high school (51 | 15.8%).
| School Level | # Students | % Students |
| Nursery / Preschool | 8 | 2.5% |
| Kindergarten | 19 | 5.9% |
| Elementary School | 110 | 34.2% |
| Middle School | 96 | 29.8% |
| High School | 51 | 15.8% |
| College / Undergraduate | 31 | 9.6% |
| Graduate / Professional | 7 | 2.2% |
| Total | 322 | 100.0% |
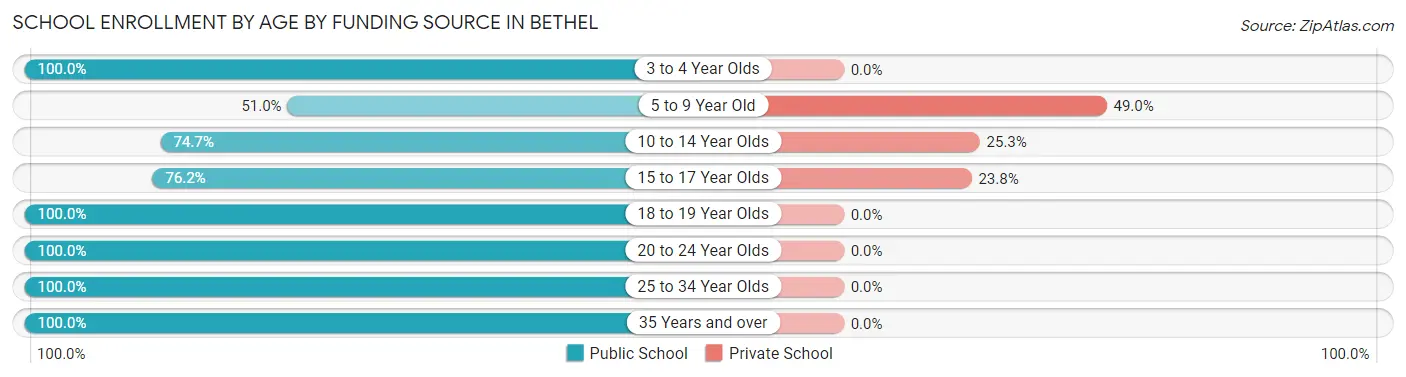
School Enrollment by Age by Funding Source in Bethel
Out of a total of 322 students who are enrolled in schools in Bethel, 91 (28.3%) attend a private institution, while the remaining 231 (71.7%) are enrolled in public schools. The age group of 5 to 9 year old has the highest likelihood of being enrolled in private schools, with 47 (49.0% in the age bracket) enrolled. Conversely, the age group of 3 to 4 year olds has the lowest likelihood of being enrolled in a private school, with 8 (100.0% in the age bracket) attending a public institution.
| Age Bracket | Public School | Private School |
| 3 to 4 Year Olds | 8 (100.0%) | 0 (0.0%) |
| 5 to 9 Year Old | 49 (51.0%) | 47 (49.0%) |
| 10 to 14 Year Olds | 115 (74.7%) | 39 (25.3%) |
| 15 to 17 Year Olds | 16 (76.2%) | 5 (23.8%) |
| 18 to 19 Year Olds | 5 (100.0%) | 0 (0.0%) |
| 20 to 24 Year Olds | 11 (100.0%) | 0 (0.0%) |
| 25 to 34 Year Olds | 7 (100.0%) | 0 (0.0%) |
| 35 Years and over | 20 (100.0%) | 0 (0.0%) |
| Total | 231 (71.7%) | 91 (28.3%) |
Educational Attainment by Field of Study in Bethel
Education (42 | 17.8%), business (41 | 17.4%), engineering (35 | 14.8%), arts & humanities (26 | 11.0%), and communications (25 | 10.6%) are the most common fields of study among 236 individuals in Bethel who have obtained a bachelor's degree or higher.
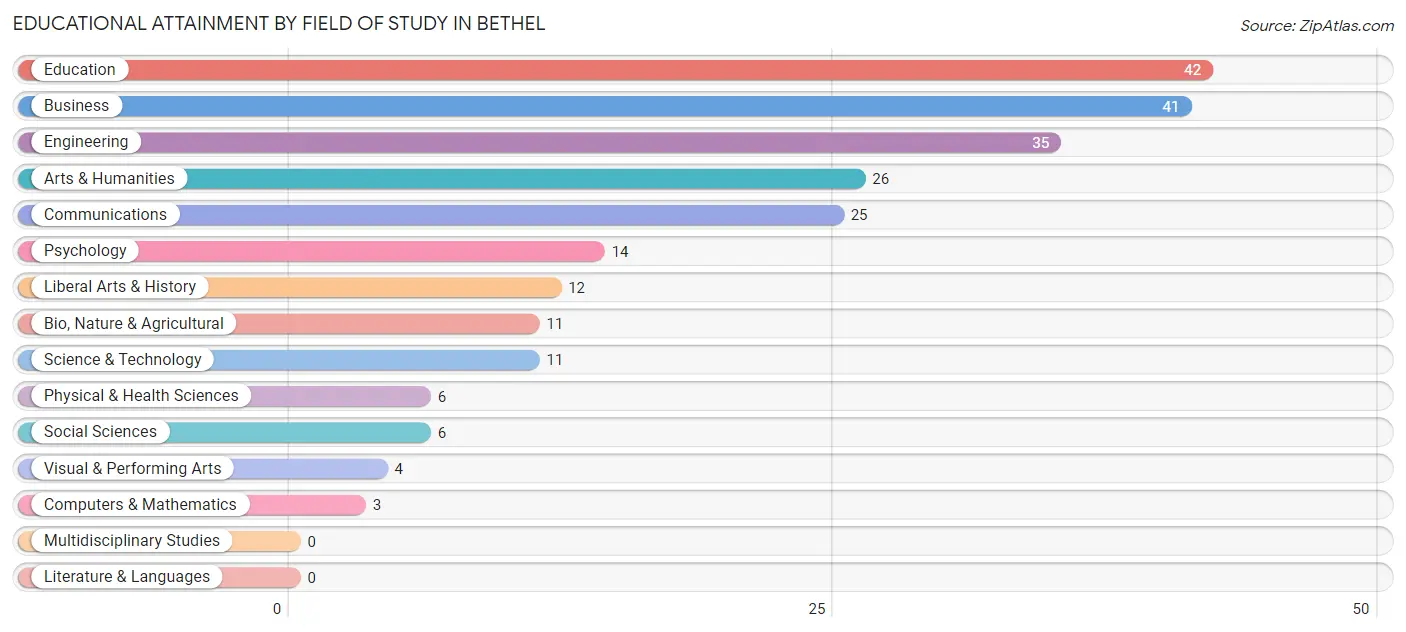
| Field of Study | # Graduates | % Graduates |
| Computers & Mathematics | 3 | 1.3% |
| Bio, Nature & Agricultural | 11 | 4.7% |
| Physical & Health Sciences | 6 | 2.5% |
| Psychology | 14 | 5.9% |
| Social Sciences | 6 | 2.5% |
| Engineering | 35 | 14.8% |
| Multidisciplinary Studies | 0 | 0.0% |
| Science & Technology | 11 | 4.7% |
| Business | 41 | 17.4% |
| Education | 42 | 17.8% |
| Literature & Languages | 0 | 0.0% |
| Liberal Arts & History | 12 | 5.1% |
| Visual & Performing Arts | 4 | 1.7% |
| Communications | 25 | 10.6% |
| Arts & Humanities | 26 | 11.0% |
| Total | 236 | 100.0% |
Transportation & Commute in Bethel
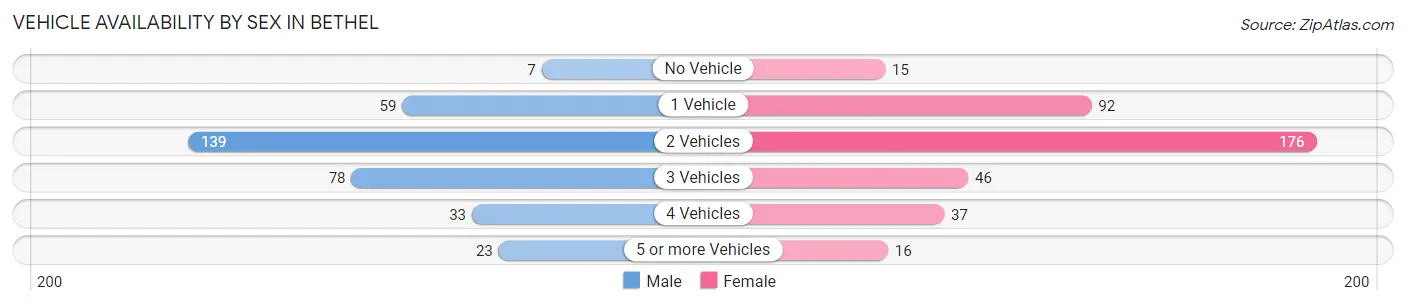
Vehicle Availability by Sex in Bethel
The most prevalent vehicle ownership categories in Bethel are males with 2 vehicles (139, accounting for 41.0%) and females with 2 vehicles (176, making up 36.4%).
| Vehicles Available | Male | Female |
| No Vehicle | 7 (2.1%) | 15 (3.9%) |
| 1 Vehicle | 59 (17.4%) | 92 (24.1%) |
| 2 Vehicles | 139 (41.0%) | 176 (46.1%) |
| 3 Vehicles | 78 (23.0%) | 46 (12.0%) |
| 4 Vehicles | 33 (9.7%) | 37 (9.7%) |
| 5 or more Vehicles | 23 (6.8%) | 16 (4.2%) |
| Total | 339 (100.0%) | 382 (100.0%) |
Commute Time in Bethel
The most frequently occuring commute durations in Bethel are 30 to 34 minutes (173 commuters, 24.1%), 25 to 29 minutes (134 commuters, 18.7%), and 15 to 19 minutes (131 commuters, 18.2%).
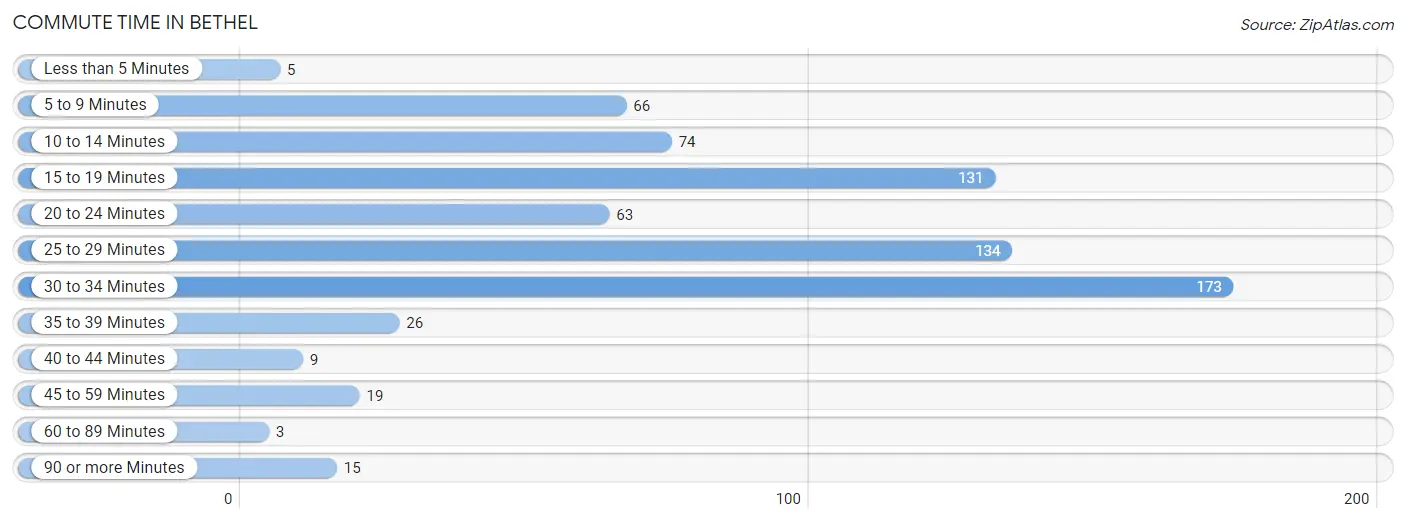
| Commute Time | # Commuters | % Commuters |
| Less than 5 Minutes | 5 | 0.7% |
| 5 to 9 Minutes | 66 | 9.2% |
| 10 to 14 Minutes | 74 | 10.3% |
| 15 to 19 Minutes | 131 | 18.2% |
| 20 to 24 Minutes | 63 | 8.8% |
| 25 to 29 Minutes | 134 | 18.7% |
| 30 to 34 Minutes | 173 | 24.1% |
| 35 to 39 Minutes | 26 | 3.6% |
| 40 to 44 Minutes | 9 | 1.3% |
| 45 to 59 Minutes | 19 | 2.6% |
| 60 to 89 Minutes | 3 | 0.4% |
| 90 or more Minutes | 15 | 2.1% |
Commute Time by Sex in Bethel
The most common commute times in Bethel are 25 to 29 minutes (77 commuters, 22.7%) for males and 30 to 34 minutes (148 commuters, 39.1%) for females.
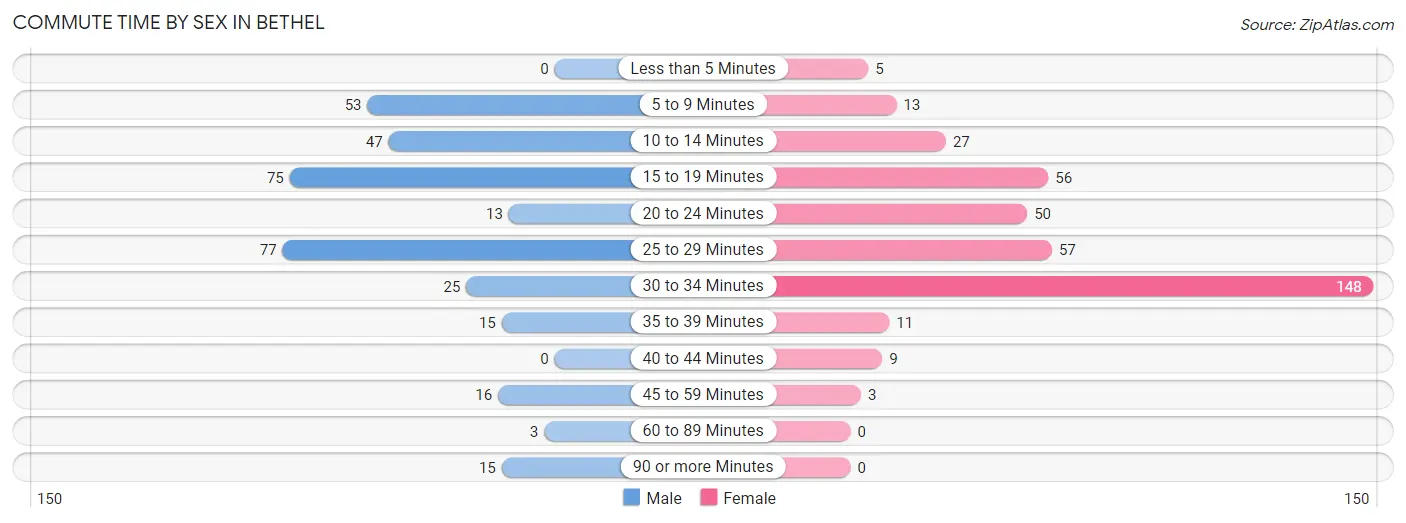
| Commute Time | Male | Female |
| Less than 5 Minutes | 0 (0.0%) | 5 (1.3%) |
| 5 to 9 Minutes | 53 (15.6%) | 13 (3.4%) |
| 10 to 14 Minutes | 47 (13.9%) | 27 (7.1%) |
| 15 to 19 Minutes | 75 (22.1%) | 56 (14.8%) |
| 20 to 24 Minutes | 13 (3.8%) | 50 (13.2%) |
| 25 to 29 Minutes | 77 (22.7%) | 57 (15.0%) |
| 30 to 34 Minutes | 25 (7.4%) | 148 (39.1%) |
| 35 to 39 Minutes | 15 (4.4%) | 11 (2.9%) |
| 40 to 44 Minutes | 0 (0.0%) | 9 (2.4%) |
| 45 to 59 Minutes | 16 (4.7%) | 3 (0.8%) |
| 60 to 89 Minutes | 3 (0.9%) | 0 (0.0%) |
| 90 or more Minutes | 15 (4.4%) | 0 (0.0%) |
Time of Departure to Work by Sex in Bethel
The most frequent times of departure to work in Bethel are 7:00 AM to 7:29 AM (61, 18.0%) for males and 6:00 AM to 6:29 AM (75, 19.8%) for females.
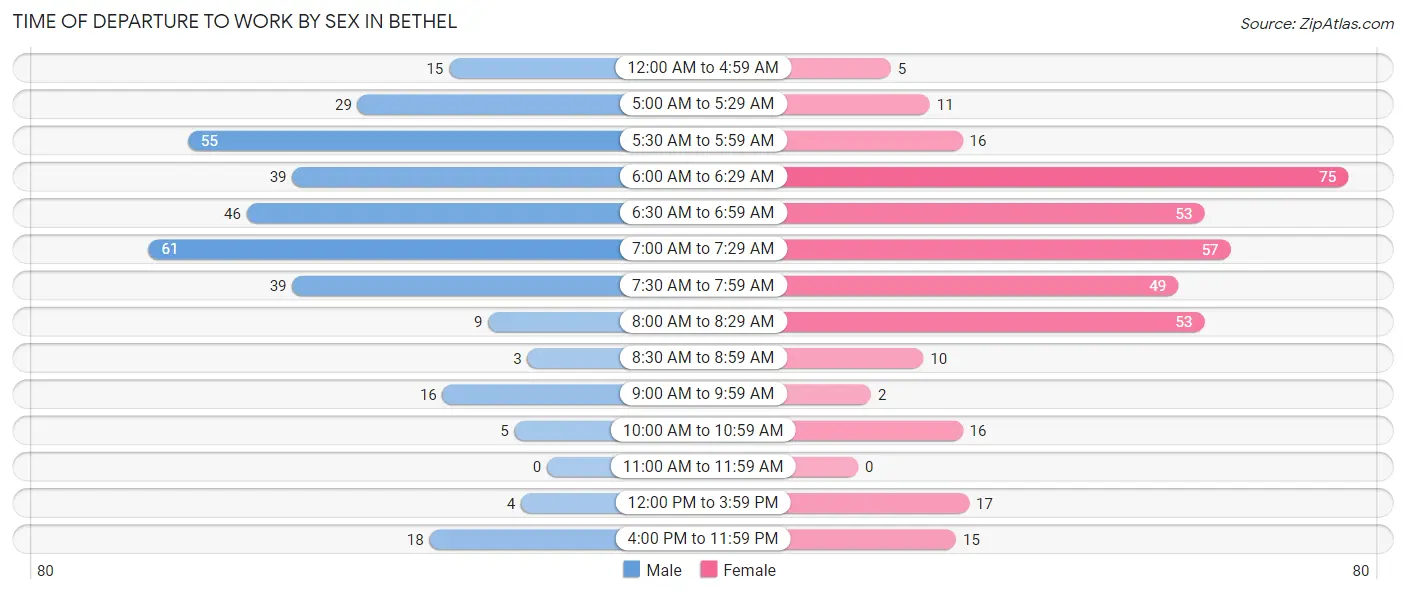
| Time of Departure | Male | Female |
| 12:00 AM to 4:59 AM | 15 (4.4%) | 5 (1.3%) |
| 5:00 AM to 5:29 AM | 29 (8.6%) | 11 (2.9%) |
| 5:30 AM to 5:59 AM | 55 (16.2%) | 16 (4.2%) |
| 6:00 AM to 6:29 AM | 39 (11.5%) | 75 (19.8%) |
| 6:30 AM to 6:59 AM | 46 (13.6%) | 53 (14.0%) |
| 7:00 AM to 7:29 AM | 61 (18.0%) | 57 (15.0%) |
| 7:30 AM to 7:59 AM | 39 (11.5%) | 49 (12.9%) |
| 8:00 AM to 8:29 AM | 9 (2.6%) | 53 (14.0%) |
| 8:30 AM to 8:59 AM | 3 (0.9%) | 10 (2.6%) |
| 9:00 AM to 9:59 AM | 16 (4.7%) | 2 (0.5%) |
| 10:00 AM to 10:59 AM | 5 (1.5%) | 16 (4.2%) |
| 11:00 AM to 11:59 AM | 0 (0.0%) | 0 (0.0%) |
| 12:00 PM to 3:59 PM | 4 (1.2%) | 17 (4.5%) |
| 4:00 PM to 11:59 PM | 18 (5.3%) | 15 (4.0%) |
| Total | 339 (100.0%) | 379 (100.0%) |
Housing Occupancy in Bethel
Occupancy by Ownership in Bethel
Of the total 728 dwellings in Bethel, owner-occupied units account for 489 (67.2%), while renter-occupied units make up 239 (32.8%).
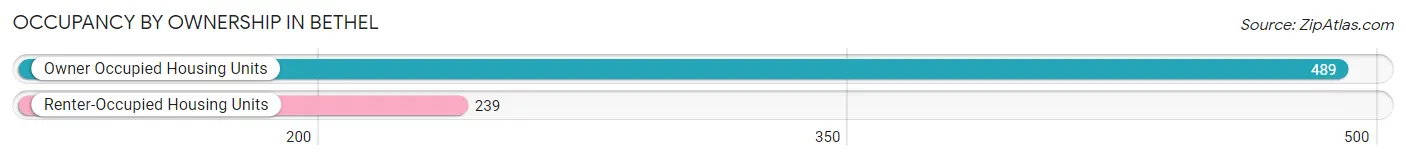
| Occupancy | # Housing Units | % Housing Units |
| Owner Occupied Housing Units | 489 | 67.2% |
| Renter-Occupied Housing Units | 239 | 32.8% |
| Total Occupied Housing Units | 728 | 100.0% |
Occupancy by Household Size in Bethel
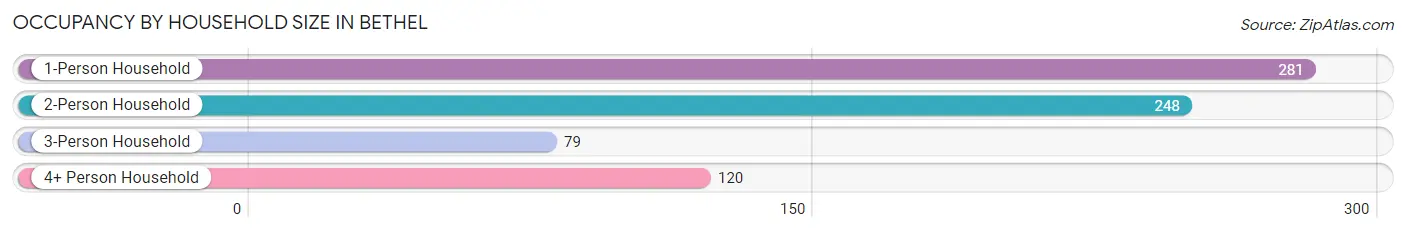
| Household Size | # Housing Units | % Housing Units |
| 1-Person Household | 281 | 38.6% |
| 2-Person Household | 248 | 34.1% |
| 3-Person Household | 79 | 10.8% |
| 4+ Person Household | 120 | 16.5% |
| Total Housing Units | 728 | 100.0% |
Occupancy by Ownership by Household Size in Bethel
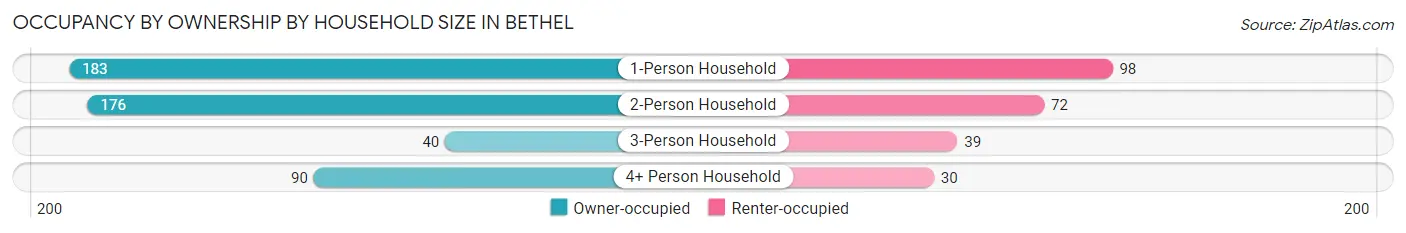
| Household Size | Owner-occupied | Renter-occupied |
| 1-Person Household | 183 (65.1%) | 98 (34.9%) |
| 2-Person Household | 176 (71.0%) | 72 (29.0%) |
| 3-Person Household | 40 (50.6%) | 39 (49.4%) |
| 4+ Person Household | 90 (75.0%) | 30 (25.0%) |
| Total Housing Units | 489 (67.2%) | 239 (32.8%) |
Occupancy by Educational Attainment in Bethel
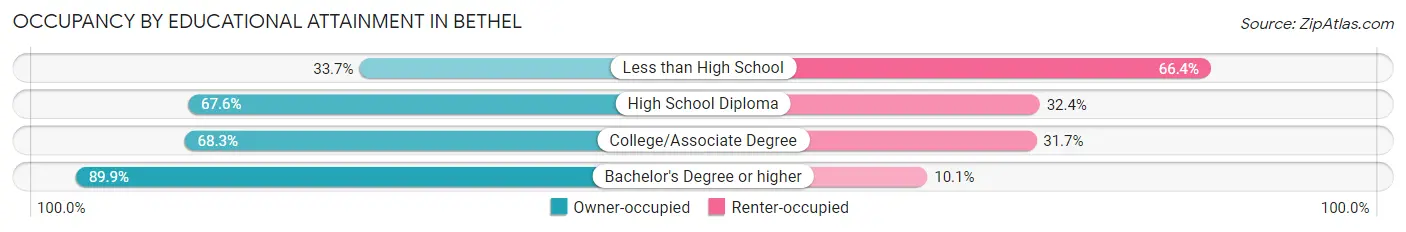
| Household Size | Owner-occupied | Renter-occupied |
| Less than High School | 35 (33.7%) | 69 (66.3%) |
| High School Diploma | 173 (67.6%) | 83 (32.4%) |
| College/Associate Degree | 157 (68.3%) | 73 (31.7%) |
| Bachelor's Degree or higher | 124 (89.9%) | 14 (10.1%) |
Occupancy by Age of Householder in Bethel
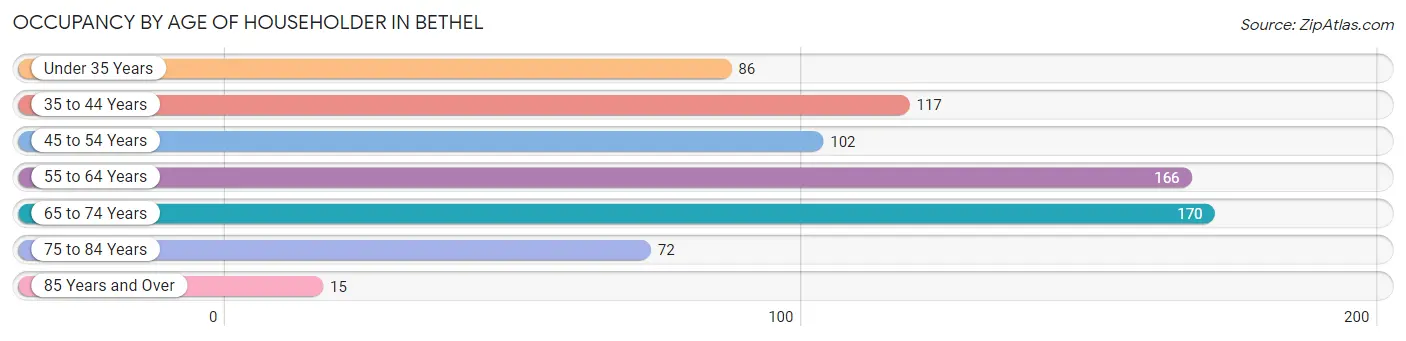
| Age Bracket | # Households | % Households |
| Under 35 Years | 86 | 11.8% |
| 35 to 44 Years | 117 | 16.1% |
| 45 to 54 Years | 102 | 14.0% |
| 55 to 64 Years | 166 | 22.8% |
| 65 to 74 Years | 170 | 23.4% |
| 75 to 84 Years | 72 | 9.9% |
| 85 Years and Over | 15 | 2.1% |
| Total | 728 | 100.0% |
Housing Finances in Bethel
Median Income by Occupancy in Bethel
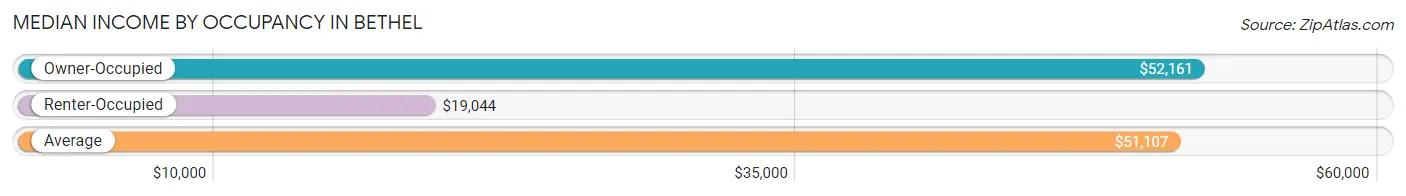
| Occupancy Type | # Households | Median Income |
| Owner-Occupied | 489 (67.2%) | $52,161 |
| Renter-Occupied | 239 (32.8%) | $19,044 |
| Average | 728 (100.0%) | $51,107 |
Occupancy by Householder Income Bracket in Bethel
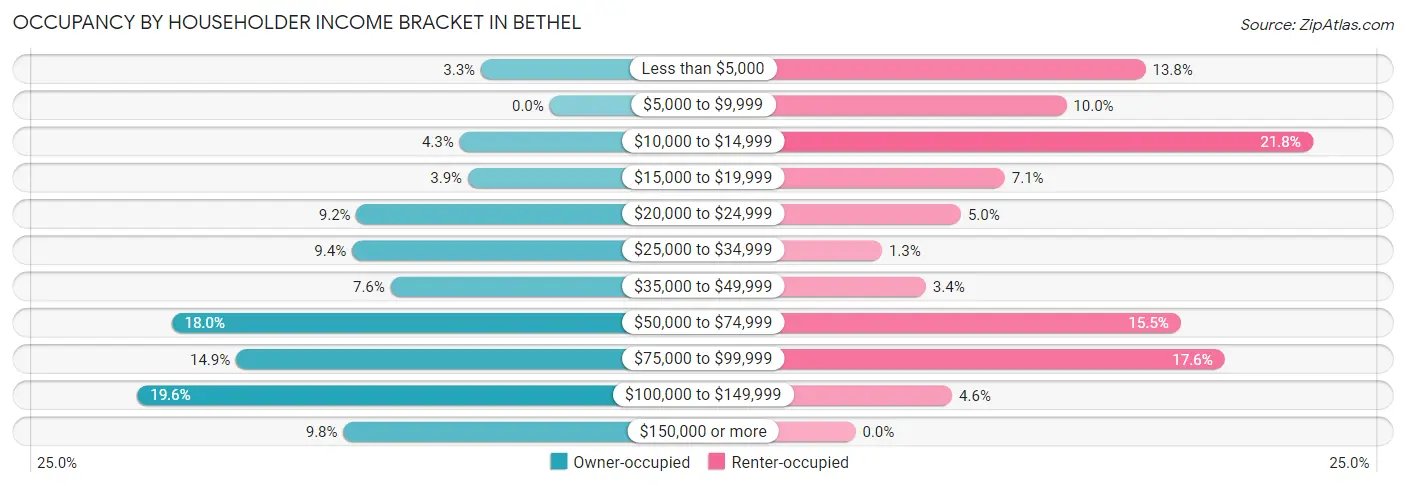
| Income Bracket | Owner-occupied | Renter-occupied |
| Less than $5,000 | 16 (3.3%) | 33 (13.8%) |
| $5,000 to $9,999 | 0 (0.0%) | 24 (10.0%) |
| $10,000 to $14,999 | 21 (4.3%) | 52 (21.8%) |
| $15,000 to $19,999 | 19 (3.9%) | 17 (7.1%) |
| $20,000 to $24,999 | 45 (9.2%) | 12 (5.0%) |
| $25,000 to $34,999 | 46 (9.4%) | 3 (1.3%) |
| $35,000 to $49,999 | 37 (7.6%) | 8 (3.4%) |
| $50,000 to $74,999 | 88 (18.0%) | 37 (15.5%) |
| $75,000 to $99,999 | 73 (14.9%) | 42 (17.6%) |
| $100,000 to $149,999 | 96 (19.6%) | 11 (4.6%) |
| $150,000 or more | 48 (9.8%) | 0 (0.0%) |
| Total | 489 (100.0%) | 239 (100.0%) |
Monthly Housing Cost Tiers in Bethel
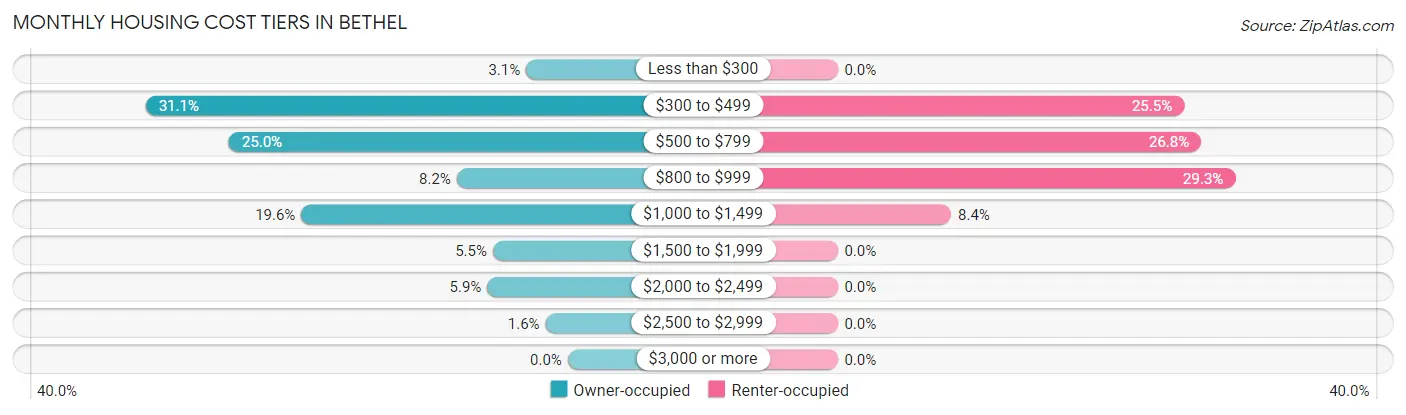
| Monthly Cost | Owner-occupied | Renter-occupied |
| Less than $300 | 15 (3.1%) | 0 (0.0%) |
| $300 to $499 | 152 (31.1%) | 61 (25.5%) |
| $500 to $799 | 122 (24.9%) | 64 (26.8%) |
| $800 to $999 | 40 (8.2%) | 70 (29.3%) |
| $1,000 to $1,499 | 96 (19.6%) | 20 (8.4%) |
| $1,500 to $1,999 | 27 (5.5%) | 0 (0.0%) |
| $2,000 to $2,499 | 29 (5.9%) | 0 (0.0%) |
| $2,500 to $2,999 | 8 (1.6%) | 0 (0.0%) |
| $3,000 or more | 0 (0.0%) | 0 (0.0%) |
| Total | 489 (100.0%) | 239 (100.0%) |
Physical Housing Characteristics in Bethel
Housing Structures in Bethel
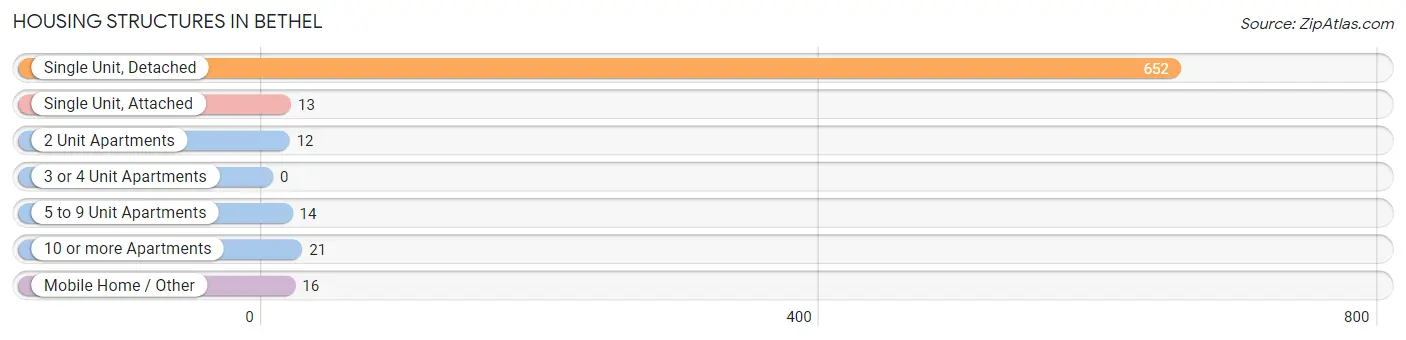
| Structure Type | # Housing Units | % Housing Units |
| Single Unit, Detached | 652 | 89.6% |
| Single Unit, Attached | 13 | 1.8% |
| 2 Unit Apartments | 12 | 1.7% |
| 3 or 4 Unit Apartments | 0 | 0.0% |
| 5 to 9 Unit Apartments | 14 | 1.9% |
| 10 or more Apartments | 21 | 2.9% |
| Mobile Home / Other | 16 | 2.2% |
| Total | 728 | 100.0% |
Housing Structures by Occupancy in Bethel
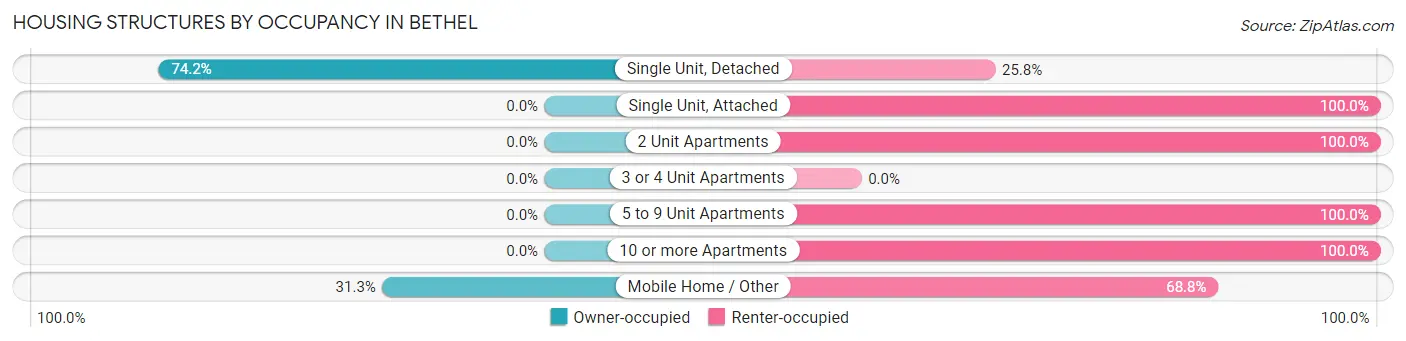
| Structure Type | Owner-occupied | Renter-occupied |
| Single Unit, Detached | 484 (74.2%) | 168 (25.8%) |
| Single Unit, Attached | 0 (0.0%) | 13 (100.0%) |
| 2 Unit Apartments | 0 (0.0%) | 12 (100.0%) |
| 3 or 4 Unit Apartments | 0 (0.0%) | 0 (0.0%) |
| 5 to 9 Unit Apartments | 0 (0.0%) | 14 (100.0%) |
| 10 or more Apartments | 0 (0.0%) | 21 (100.0%) |
| Mobile Home / Other | 5 (31.2%) | 11 (68.8%) |
| Total | 489 (67.2%) | 239 (32.8%) |
Housing Structures by Number of Rooms in Bethel
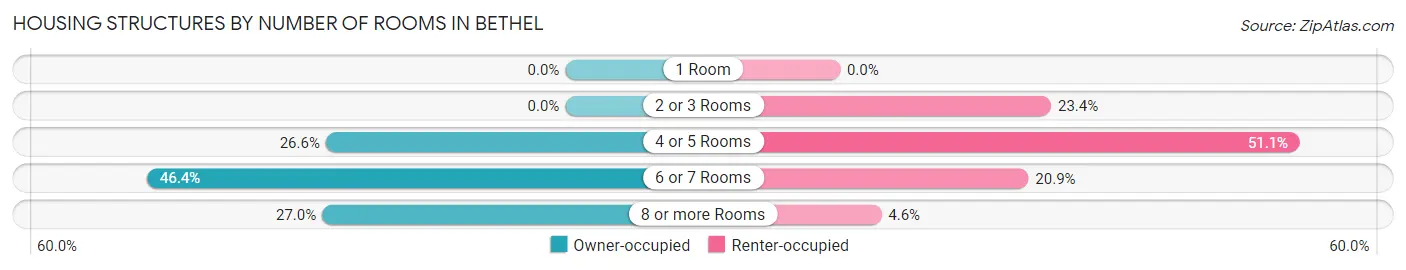
| Number of Rooms | Owner-occupied | Renter-occupied |
| 1 Room | 0 (0.0%) | 0 (0.0%) |
| 2 or 3 Rooms | 0 (0.0%) | 56 (23.4%) |
| 4 or 5 Rooms | 130 (26.6%) | 122 (51.0%) |
| 6 or 7 Rooms | 227 (46.4%) | 50 (20.9%) |
| 8 or more Rooms | 132 (27.0%) | 11 (4.6%) |
| Total | 489 (100.0%) | 239 (100.0%) |
Housing Structure by Heating Type in Bethel
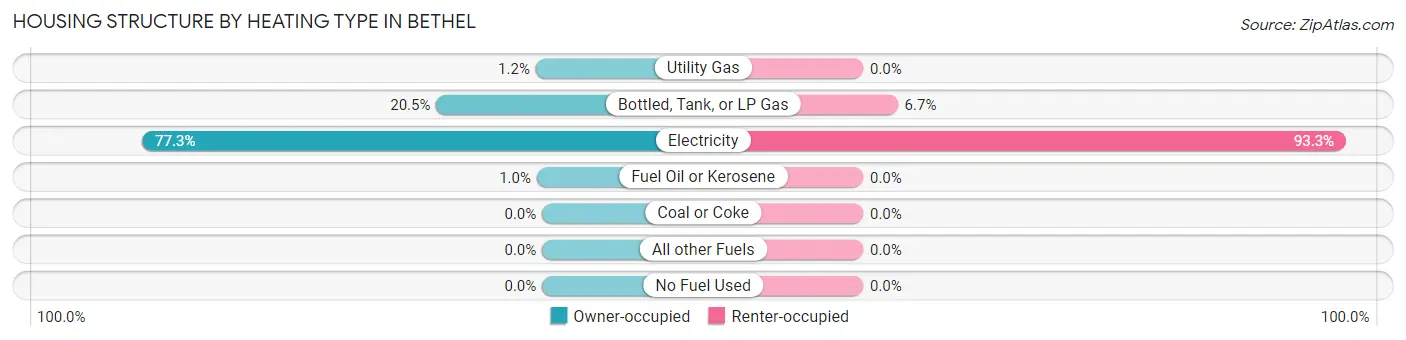
| Heating Type | Owner-occupied | Renter-occupied |
| Utility Gas | 6 (1.2%) | 0 (0.0%) |
| Bottled, Tank, or LP Gas | 100 (20.4%) | 16 (6.7%) |
| Electricity | 378 (77.3%) | 223 (93.3%) |
| Fuel Oil or Kerosene | 5 (1.0%) | 0 (0.0%) |
| Coal or Coke | 0 (0.0%) | 0 (0.0%) |
| All other Fuels | 0 (0.0%) | 0 (0.0%) |
| No Fuel Used | 0 (0.0%) | 0 (0.0%) |
| Total | 489 (100.0%) | 239 (100.0%) |
Household Vehicle Usage in Bethel
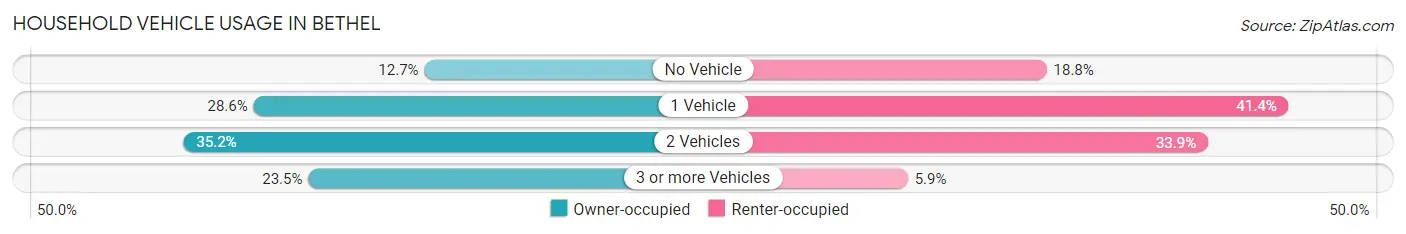
| Vehicles per Household | Owner-occupied | Renter-occupied |
| No Vehicle | 62 (12.7%) | 45 (18.8%) |
| 1 Vehicle | 140 (28.6%) | 99 (41.4%) |
| 2 Vehicles | 172 (35.2%) | 81 (33.9%) |
| 3 or more Vehicles | 115 (23.5%) | 14 (5.9%) |
| Total | 489 (100.0%) | 239 (100.0%) |
Real Estate & Mortgages in Bethel
Real Estate and Mortgage Overview in Bethel
| Characteristic | Without Mortgage | With Mortgage |
| Housing Units | 279 | 210 |
| Median Property Value | $77,200 | $140,100 |
| Median Household Income | $47,813 | $29 |
| Monthly Housing Costs | $475 | $0 |
| Real Estate Taxes | $1,272 | $0 |
Property Value by Mortgage Status in Bethel
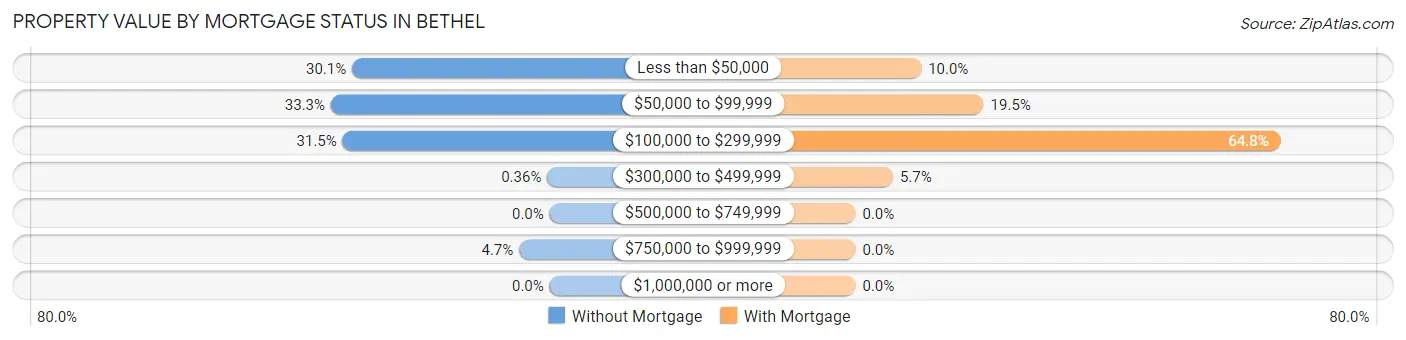
| Property Value | Without Mortgage | With Mortgage |
| Less than $50,000 | 84 (30.1%) | 21 (10.0%) |
| $50,000 to $99,999 | 93 (33.3%) | 41 (19.5%) |
| $100,000 to $299,999 | 88 (31.5%) | 136 (64.8%) |
| $300,000 to $499,999 | 1 (0.4%) | 12 (5.7%) |
| $500,000 to $749,999 | 0 (0.0%) | 0 (0.0%) |
| $750,000 to $999,999 | 13 (4.7%) | 0 (0.0%) |
| $1,000,000 or more | 0 (0.0%) | 0 (0.0%) |
| Total | 279 (100.0%) | 210 (100.0%) |
Household Income by Mortgage Status in Bethel
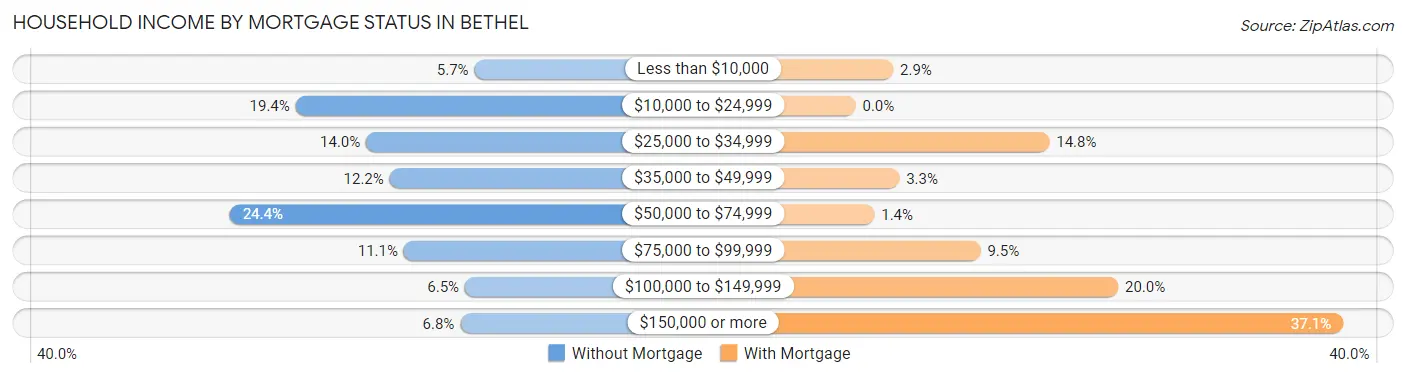
| Household Income | Without Mortgage | With Mortgage |
| Less than $10,000 | 16 (5.7%) | 6 (2.9%) |
| $10,000 to $24,999 | 54 (19.4%) | 0 (0.0%) |
| $25,000 to $34,999 | 39 (14.0%) | 31 (14.8%) |
| $35,000 to $49,999 | 34 (12.2%) | 7 (3.3%) |
| $50,000 to $74,999 | 68 (24.4%) | 3 (1.4%) |
| $75,000 to $99,999 | 31 (11.1%) | 20 (9.5%) |
| $100,000 to $149,999 | 18 (6.5%) | 42 (20.0%) |
| $150,000 or more | 19 (6.8%) | 78 (37.1%) |
| Total | 279 (100.0%) | 210 (100.0%) |
Property Value to Household Income Ratio in Bethel
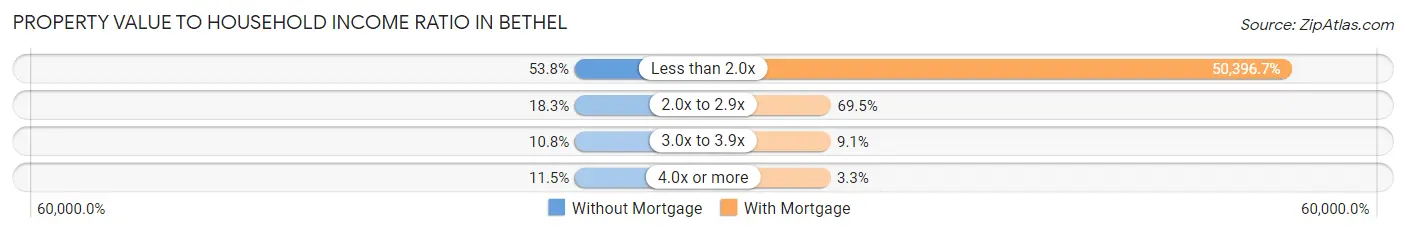
| Value-to-Income Ratio | Without Mortgage | With Mortgage |
| Less than 2.0x | 150 (53.8%) | 105,833 (50,396.7%) |
| 2.0x to 2.9x | 51 (18.3%) | 146 (69.5%) |
| 3.0x to 3.9x | 30 (10.7%) | 19 (9.0%) |
| 4.0x or more | 32 (11.5%) | 7 (3.3%) |
| Total | 279 (100.0%) | 210 (100.0%) |
Real Estate Taxes by Mortgage Status in Bethel
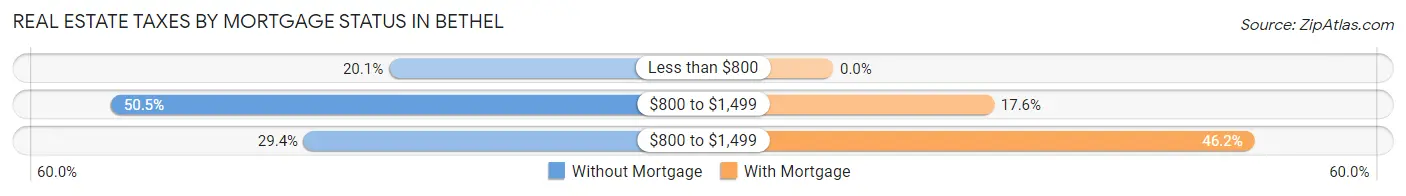
| Property Taxes | Without Mortgage | With Mortgage |
| Less than $800 | 56 (20.1%) | 0 (0.0%) |
| $800 to $1,499 | 141 (50.5%) | 37 (17.6%) |
| $800 to $1,499 | 82 (29.4%) | 97 (46.2%) |
| Total | 279 (100.0%) | 210 (100.0%) |
Health & Disability in Bethel
Health Insurance Coverage by Age in Bethel
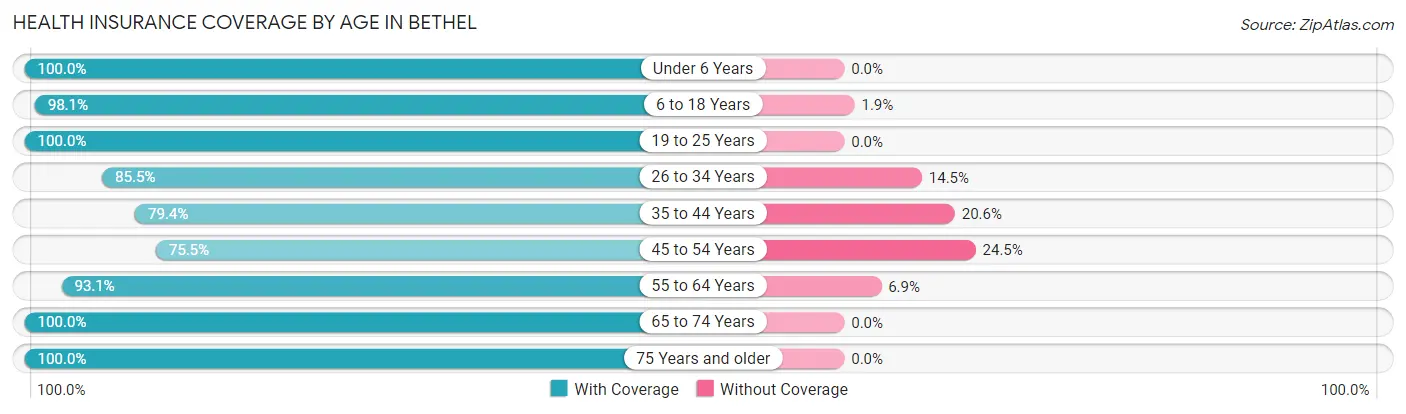
| Age Bracket | With Coverage | Without Coverage |
| Under 6 Years | 95 (100.0%) | 0 (0.0%) |
| 6 to 18 Years | 257 (98.1%) | 5 (1.9%) |
| 19 to 25 Years | 54 (100.0%) | 0 (0.0%) |
| 26 to 34 Years | 130 (85.5%) | 22 (14.5%) |
| 35 to 44 Years | 208 (79.4%) | 54 (20.6%) |
| 45 to 54 Years | 148 (75.5%) | 48 (24.5%) |
| 55 to 64 Years | 230 (93.1%) | 17 (6.9%) |
| 65 to 74 Years | 225 (100.0%) | 0 (0.0%) |
| 75 Years and older | 111 (100.0%) | 0 (0.0%) |
| Total | 1,458 (90.9%) | 146 (9.1%) |
Health Insurance Coverage by Citizenship Status in Bethel
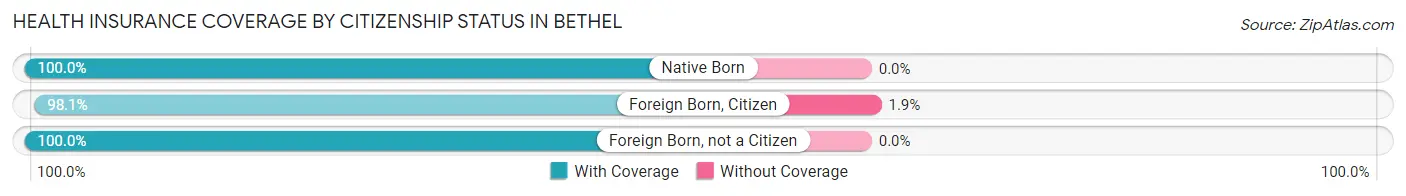
| Citizenship Status | With Coverage | Without Coverage |
| Native Born | 95 (100.0%) | 0 (0.0%) |
| Foreign Born, Citizen | 257 (98.1%) | 5 (1.9%) |
| Foreign Born, not a Citizen | 54 (100.0%) | 0 (0.0%) |
Health Insurance Coverage by Household Income in Bethel
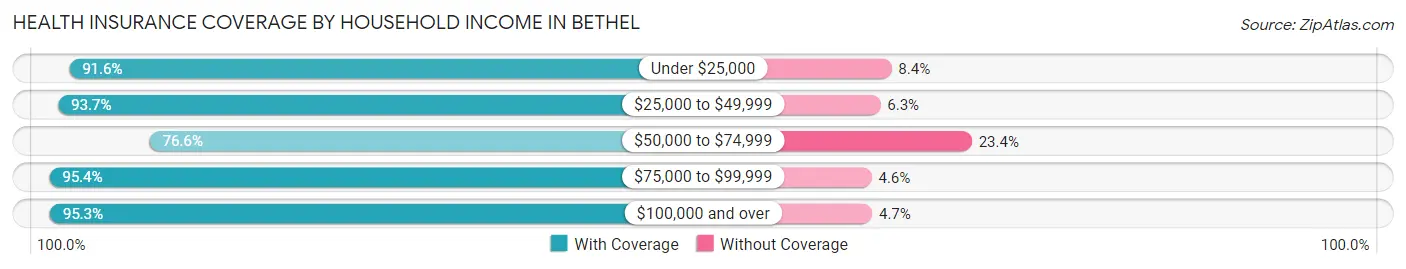
| Household Income | With Coverage | Without Coverage |
| Under $25,000 | 318 (91.6%) | 29 (8.4%) |
| $25,000 to $49,999 | 134 (93.7%) | 9 (6.3%) |
| $50,000 to $74,999 | 229 (76.6%) | 70 (23.4%) |
| $75,000 to $99,999 | 350 (95.4%) | 17 (4.6%) |
| $100,000 and over | 423 (95.3%) | 21 (4.7%) |
Public vs Private Health Insurance Coverage by Age in Bethel
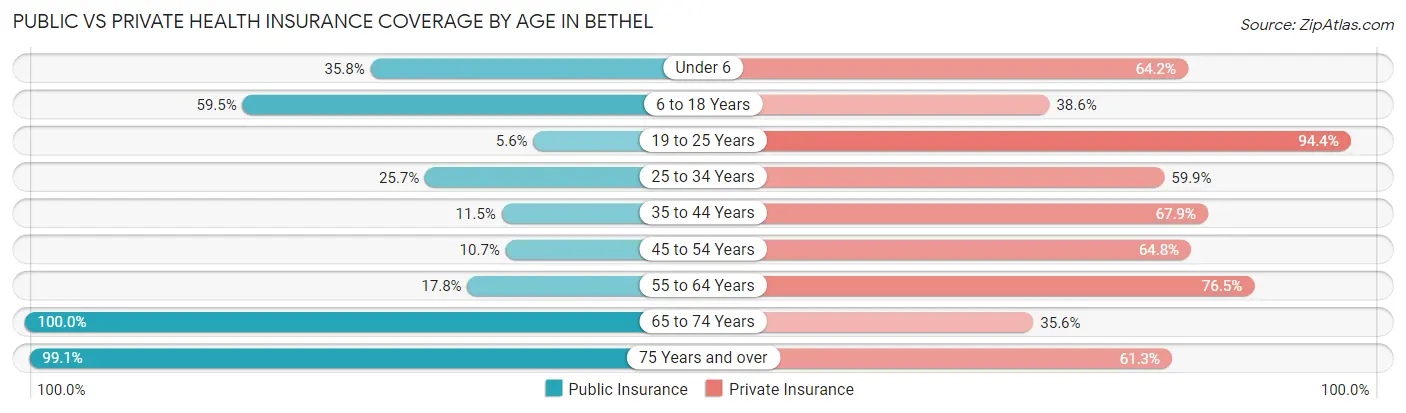
| Age Bracket | Public Insurance | Private Insurance |
| Under 6 | 34 (35.8%) | 61 (64.2%) |
| 6 to 18 Years | 156 (59.5%) | 101 (38.6%) |
| 19 to 25 Years | 3 (5.6%) | 51 (94.4%) |
| 25 to 34 Years | 39 (25.7%) | 91 (59.9%) |
| 35 to 44 Years | 30 (11.5%) | 178 (67.9%) |
| 45 to 54 Years | 21 (10.7%) | 127 (64.8%) |
| 55 to 64 Years | 44 (17.8%) | 189 (76.5%) |
| 65 to 74 Years | 225 (100.0%) | 80 (35.6%) |
| 75 Years and over | 110 (99.1%) | 68 (61.3%) |
| Total | 662 (41.3%) | 946 (59.0%) |
Disability Status by Sex by Age in Bethel
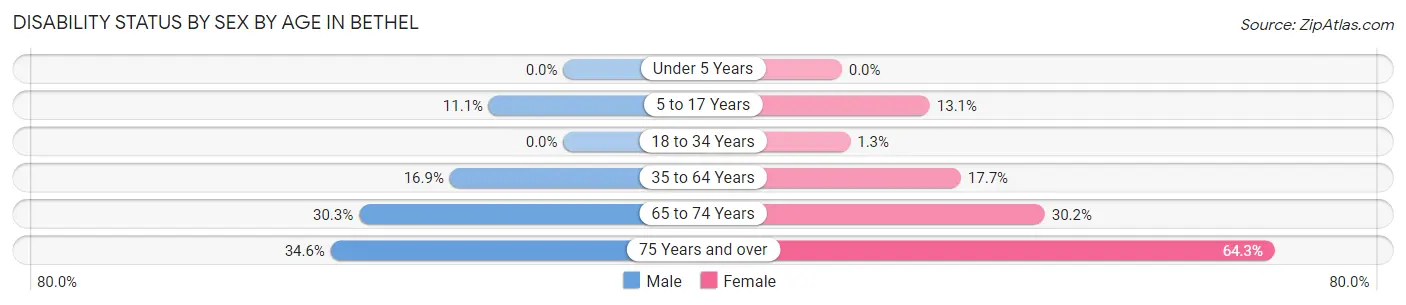
| Age Bracket | Male | Female |
| Under 5 Years | 0 (0.0%) | 0 (0.0%) |
| 5 to 17 Years | 20 (11.1%) | 14 (13.1%) |
| 18 to 34 Years | 0 (0.0%) | 2 (1.3%) |
| 35 to 64 Years | 56 (16.9%) | 66 (17.7%) |
| 65 to 74 Years | 27 (30.3%) | 41 (30.1%) |
| 75 Years and over | 19 (34.5%) | 36 (64.3%) |
Disability Class by Sex by Age in Bethel
Disability Class: Hearing Difficulty
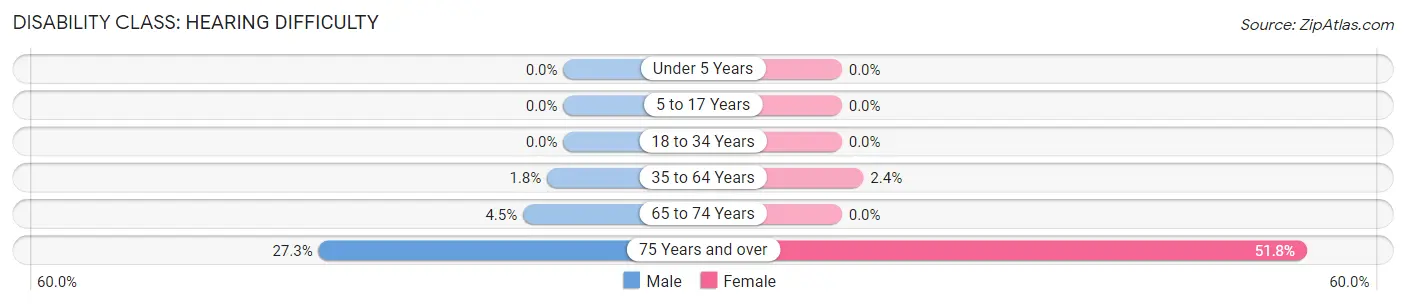
| Age Bracket | Male | Female |
| Under 5 Years | 0 (0.0%) | 0 (0.0%) |
| 5 to 17 Years | 0 (0.0%) | 0 (0.0%) |
| 18 to 34 Years | 0 (0.0%) | 0 (0.0%) |
| 35 to 64 Years | 6 (1.8%) | 9 (2.4%) |
| 65 to 74 Years | 4 (4.5%) | 0 (0.0%) |
| 75 Years and over | 15 (27.3%) | 29 (51.8%) |
Disability Class: Vision Difficulty
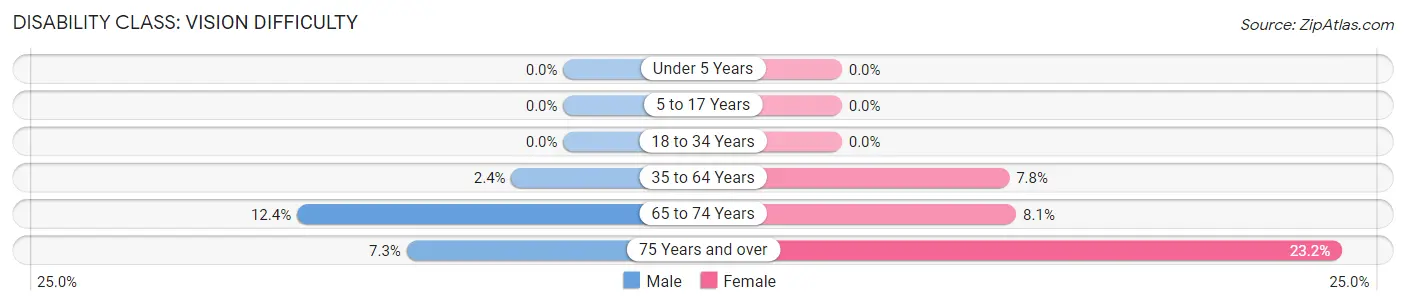
| Age Bracket | Male | Female |
| Under 5 Years | 0 (0.0%) | 0 (0.0%) |
| 5 to 17 Years | 0 (0.0%) | 0 (0.0%) |
| 18 to 34 Years | 0 (0.0%) | 0 (0.0%) |
| 35 to 64 Years | 8 (2.4%) | 29 (7.8%) |
| 65 to 74 Years | 11 (12.4%) | 11 (8.1%) |
| 75 Years and over | 4 (7.3%) | 13 (23.2%) |
Disability Class: Cognitive Difficulty
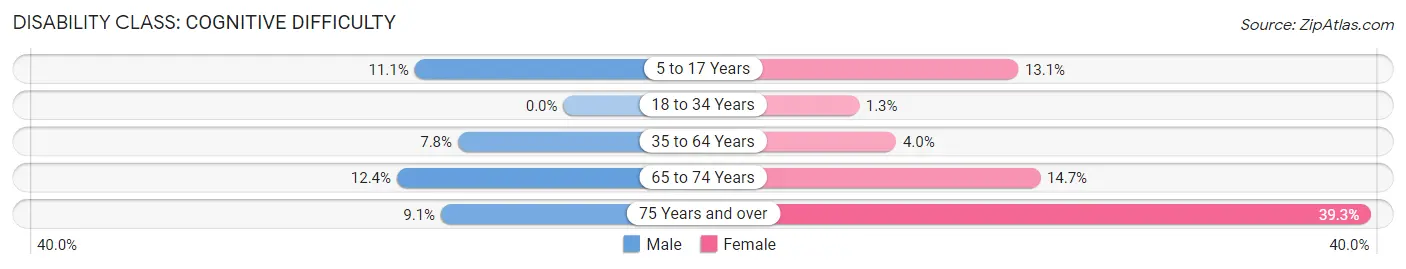
| Age Bracket | Male | Female |
| 5 to 17 Years | 20 (11.1%) | 14 (13.1%) |
| 18 to 34 Years | 0 (0.0%) | 2 (1.3%) |
| 35 to 64 Years | 26 (7.8%) | 15 (4.0%) |
| 65 to 74 Years | 11 (12.4%) | 20 (14.7%) |
| 75 Years and over | 5 (9.1%) | 22 (39.3%) |
Disability Class: Ambulatory Difficulty
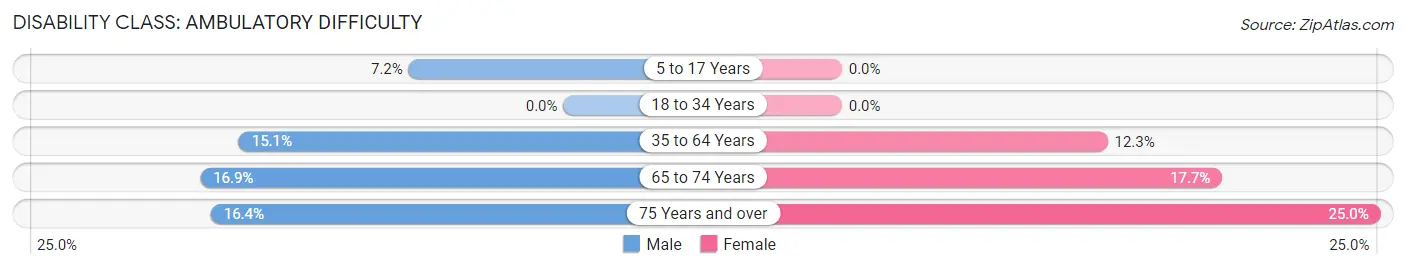
| Age Bracket | Male | Female |
| 5 to 17 Years | 13 (7.2%) | 0 (0.0%) |
| 18 to 34 Years | 0 (0.0%) | 0 (0.0%) |
| 35 to 64 Years | 50 (15.1%) | 46 (12.3%) |
| 65 to 74 Years | 15 (16.9%) | 24 (17.6%) |
| 75 Years and over | 9 (16.4%) | 14 (25.0%) |
Disability Class: Self-Care Difficulty
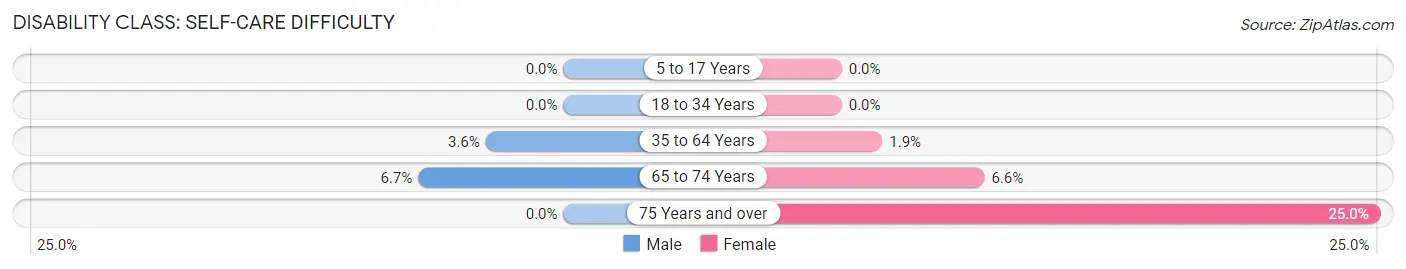
| Age Bracket | Male | Female |
| 5 to 17 Years | 0 (0.0%) | 0 (0.0%) |
| 18 to 34 Years | 0 (0.0%) | 0 (0.0%) |
| 35 to 64 Years | 12 (3.6%) | 7 (1.9%) |
| 65 to 74 Years | 6 (6.7%) | 9 (6.6%) |
| 75 Years and over | 0 (0.0%) | 14 (25.0%) |
Technology Access in Bethel
Computing Device Access in Bethel
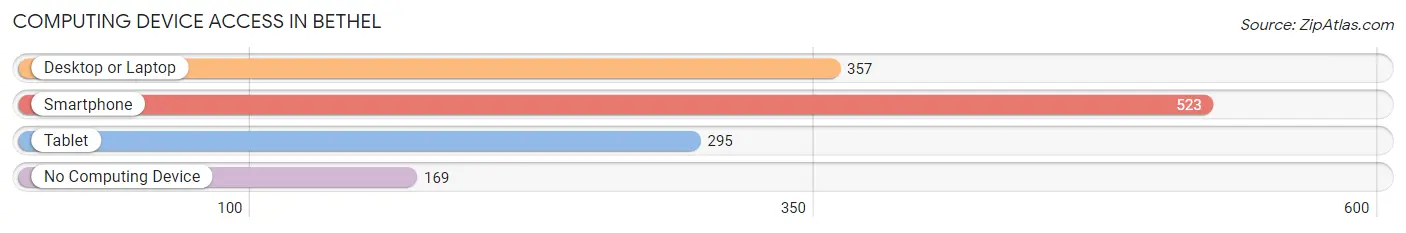
| Device Type | # Households | % Households |
| Desktop or Laptop | 357 | 49.0% |
| Smartphone | 523 | 71.8% |
| Tablet | 295 | 40.5% |
| No Computing Device | 169 | 23.2% |
| Total | 728 | 100.0% |
Internet Access in Bethel
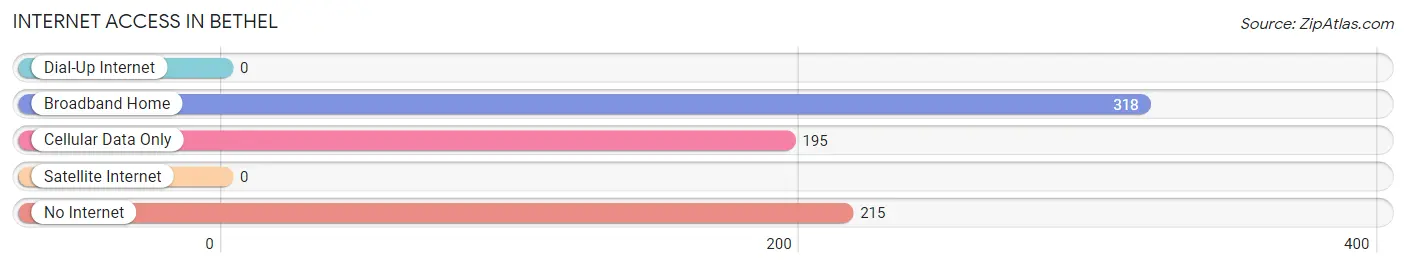
| Internet Type | # Households | % Households |
| Dial-Up Internet | 0 | 0.0% |
| Broadband Home | 318 | 43.7% |
| Cellular Data Only | 195 | 26.8% |
| Satellite Internet | 0 | 0.0% |
| No Internet | 215 | 29.5% |
| Total | 728 | 100.0% |
Bethel Summary
Bethel, North Carolina is a small town located in Pitt County, in the eastern part of the state. It is situated on the banks of the Tar River, and is part of the Greenville Metropolitan Statistical Area. The town has a population of approximately 1,400 people, and is known for its rural charm and friendly atmosphere.
History
Bethel was first settled in the late 1700s by a group of Quakers from Pennsylvania. The town was originally known as Bethel Meeting House, and was named after the Bethel Meeting House in Pennsylvania. The town was officially incorporated in 1871, and the first post office was established in 1872.
In the late 1800s, Bethel was a thriving agricultural community, with cotton, tobacco, and corn being the main crops. The town also had a number of sawmills and gristmills, which provided employment for many of the town’s residents.
In the early 1900s, Bethel began to experience a decline in population as many of its residents moved away in search of better economic opportunities. The town’s population continued to decline until the 1950s, when the town began to experience a resurgence in population growth.
Geography
Bethel is located in Pitt County, in the eastern part of North Carolina. The town is situated on the banks of the Tar River, and is part of the Greenville Metropolitan Statistical Area. The town is located approximately 25 miles east of Greenville, and is approximately 50 miles east of Raleigh.
The town is located in a rural area, and is surrounded by farmland and forests. The town is located in a humid subtropical climate zone, and experiences hot, humid summers and mild winters.
Economy
Bethel’s economy is largely based on agriculture, with cotton, tobacco, and corn being the main crops. The town also has a number of sawmills and gristmills, which provide employment for many of the town’s residents.
In recent years, Bethel has experienced a resurgence in population growth, and the town has seen an increase in the number of businesses and industries. The town is home to a number of small businesses, including restaurants, retail stores, and service providers.
Demographics
As of the 2010 census, Bethel had a population of 1,400 people. The town has a median household income of $35,000, and the median age is 39. The town is predominantly white, with African Americans making up approximately 10% of the population.
Conclusion
Bethel, North Carolina is a small town located in Pitt County, in the eastern part of the state. It is situated on the banks of the Tar River, and is part of the Greenville Metropolitan Statistical Area. The town has a population of approximately 1,400 people, and is known for its rural charm and friendly atmosphere. The town’s economy is largely based on agriculture, with cotton, tobacco, and corn being the main crops. In recent years, Bethel has experienced a resurgence in population growth, and the town has seen an increase in the number of businesses and industries. The town is predominantly white, with African Americans making up approximately 10% of the population.
Common Questions
What is Per Capita Income in Bethel?
Per Capita income in Bethel is $29,622.
What is the Median Family Income in Bethel?
Median Family Income in Bethel is $72,344.
What is the Median Household income in Bethel?
Median Household Income in Bethel is $51,107.
What is Income or Wage Gap in Bethel?
Income or Wage Gap in Bethel is 39.1%.
Women in Bethel earn 60.9 cents for every dollar earned by a man.
What is Inequality or Gini Index in Bethel?
Inequality or Gini Index in Bethel is 0.46.
What is the Total Population of Bethel?
Total Population of Bethel is 1,604.
What is the Total Male Population of Bethel?
Total Male Population of Bethel is 717.
What is the Total Female Population of Bethel?
Total Female Population of Bethel is 887.
What is the Ratio of Males per 100 Females in Bethel?
There are 80.83 Males per 100 Females in Bethel.
What is the Ratio of Females per 100 Males in Bethel?
There are 123.71 Females per 100 Males in Bethel.
What is the Median Population Age in Bethel?
Median Population Age in Bethel is 42.8 Years.
What is the Average Family Size in Bethel
Average Family Size in Bethel is 3.0 People.
What is the Average Household Size in Bethel
Average Household Size in Bethel is 2.2 People.
How Large is the Labor Force in Bethel?
There are 784 People in the Labor Forcein in Bethel.
What is the Percentage of People in the Labor Force in Bethel?
62.5% of People are in the Labor Force in Bethel.
What is the Unemployment Rate in Bethel?
Unemployment Rate in Bethel is 7.5%.