Bay City, MI Map & Demographics
Bay City Map
Bay City Overview
$27,970
PER CAPITA INCOME
$62,443
AVG FAMILY INCOME
$45,026
AVG HOUSEHOLD INCOME
30.4%
WAGE / INCOME GAP [ % ]
69.6¢/ $1
WAGE / INCOME GAP [ $ ]
$11,011
FAMILY INCOME DEFICIT
0.46
INEQUALITY / GINI INDEX
32,664
TOTAL POPULATION
15,474
MALE POPULATION
17,190
FEMALE POPULATION
90.02
MALES / 100 FEMALES
111.09
FEMALES / 100 MALES
39.2
MEDIAN AGE
3.0
AVG FAMILY SIZE
2.2
AVG HOUSEHOLD SIZE
16,010
LABOR FORCE [ PEOPLE ]
60.0%
PERCENT IN LABOR FORCE
6.2%
UNEMPLOYMENT RATE
Bay City Area Codes
Income in Bay City
Income Overview in Bay City
Per Capita Income in Bay City is $27,970, while median incomes of families and households are $62,443 and $45,026 respectively.
| Characteristic | Number | Measure |
| Per Capita Income | 32,664 | $27,970 |
| Median Family Income | 7,676 | $62,443 |
| Mean Family Income | 7,676 | $73,183 |
| Median Household Income | 14,379 | $45,026 |
| Mean Household Income | 14,379 | $61,666 |
| Income Deficit | 7,676 | $11,011 |
| Wage / Income Gap (%) | 32,664 | 30.40% |
| Wage / Income Gap ($) | 32,664 | 69.60¢ per $1 |
| Gini / Inequality Index | 32,664 | 0.46 |
Earnings by Sex in Bay City
Average Earnings in Bay City are $28,957, $34,931 for men and $24,311 for women, a difference of 30.4%.
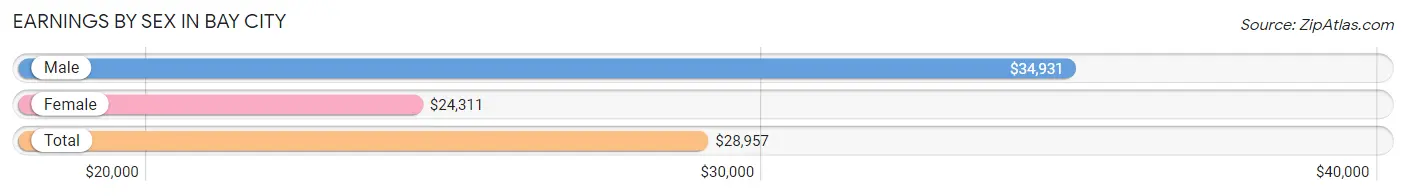
| Sex | Number | Average Earnings |
| Male | 8,118 (49.5%) | $34,931 |
| Female | 8,294 (50.5%) | $24,311 |
| Total | 16,412 (100.0%) | $28,957 |
Earnings by Sex by Income Bracket in Bay City
The most common earnings brackets in Bay City are $100,000+ for men (811 | 10.0%) and $25,000 to $29,999 for women (727 | 8.8%).
| Income | Male | Female |
| $2,499 or less | 440 (5.4%) | 359 (4.3%) |
| $2,500 to $4,999 | 338 (4.2%) | 445 (5.4%) |
| $5,000 to $7,499 | 286 (3.5%) | 637 (7.7%) |
| $7,500 to $9,999 | 237 (2.9%) | 389 (4.7%) |
| $10,000 to $12,499 | 342 (4.2%) | 578 (7.0%) |
| $12,500 to $14,999 | 314 (3.9%) | 365 (4.4%) |
| $15,000 to $17,499 | 209 (2.6%) | 213 (2.6%) |
| $17,500 to $19,999 | 233 (2.9%) | 419 (5.1%) |
| $20,000 to $22,499 | 201 (2.5%) | 350 (4.2%) |
| $22,500 to $24,999 | 243 (3.0%) | 541 (6.5%) |
| $25,000 to $29,999 | 645 (8.0%) | 727 (8.8%) |
| $30,000 to $34,999 | 580 (7.1%) | 427 (5.1%) |
| $35,000 to $39,999 | 448 (5.5%) | 328 (4.0%) |
| $40,000 to $44,999 | 614 (7.6%) | 468 (5.6%) |
| $45,000 to $49,999 | 432 (5.3%) | 291 (3.5%) |
| $50,000 to $54,999 | 353 (4.3%) | 257 (3.1%) |
| $55,000 to $64,999 | 592 (7.3%) | 646 (7.8%) |
| $65,000 to $74,999 | 497 (6.1%) | 240 (2.9%) |
| $75,000 to $99,999 | 303 (3.7%) | 366 (4.4%) |
| $100,000+ | 811 (10.0%) | 248 (3.0%) |
| Total | 8,118 (100.0%) | 8,294 (100.0%) |
Earnings by Sex by Educational Attainment in Bay City
Average earnings in Bay City are $40,413 for men and $28,869 for women, a difference of 28.6%. Men with an educational attainment of graduate degree enjoy the highest average annual earnings of $109,183, while those with less than high school education earn the least with $19,531. Women with an educational attainment of graduate degree earn the most with the average annual earnings of $64,781, while those with less than high school education have the smallest earnings of $21,819.
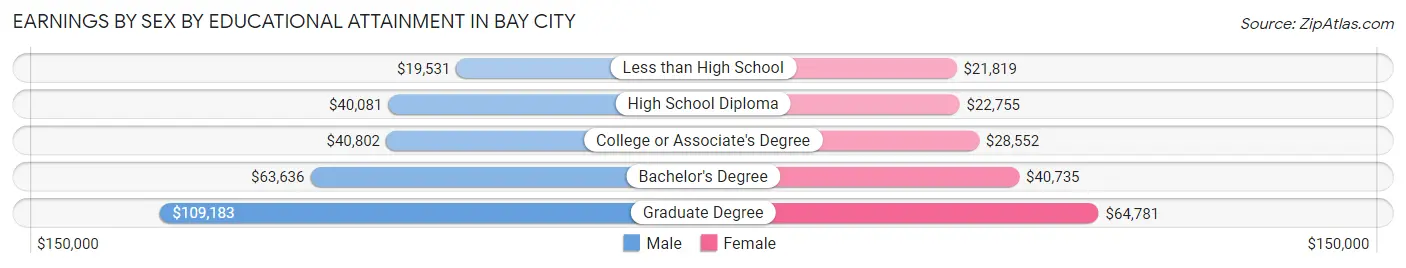
| Educational Attainment | Male Income | Female Income |
| Less than High School | $19,531 | $21,819 |
| High School Diploma | $40,081 | $22,755 |
| College or Associate's Degree | $40,802 | $28,552 |
| Bachelor's Degree | $63,636 | $40,735 |
| Graduate Degree | $109,183 | $64,781 |
| Total | $40,413 | $28,869 |
Family Income in Bay City
Family Income Brackets in Bay City
According to the Bay City family income data, there are 1,597 families falling into the $50,000 to $74,999 income range, which is the most common income bracket and makes up 20.8% of all families. Conversely, the less than $10,000 income bracket is the least frequent group with only 299 families (3.9%) belonging to this category.
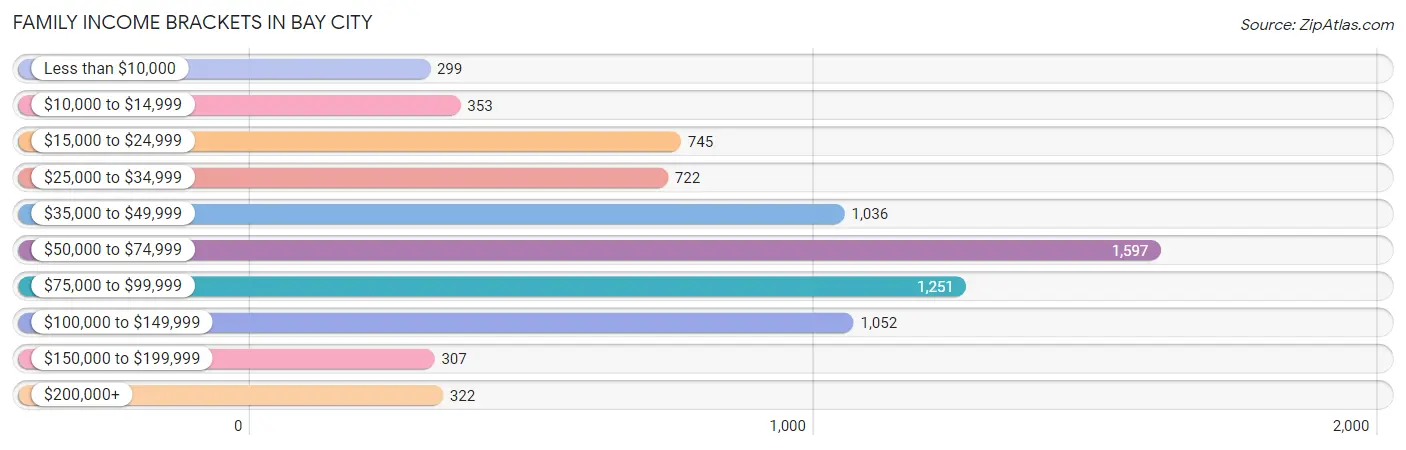
| Income Bracket | # Families | % Families |
| Less than $10,000 | 299 | 3.9% |
| $10,000 to $14,999 | 353 | 4.6% |
| $15,000 to $24,999 | 745 | 9.7% |
| $25,000 to $34,999 | 722 | 9.4% |
| $35,000 to $49,999 | 1,036 | 13.5% |
| $50,000 to $74,999 | 1,597 | 20.8% |
| $75,000 to $99,999 | 1,251 | 16.3% |
| $100,000 to $149,999 | 1,052 | 13.7% |
| $150,000 to $199,999 | 307 | 4.0% |
| $200,000+ | 322 | 4.2% |
Family Income by Famaliy Size in Bay City
5-person families (592 | 7.7%) account for the highest median family income in Bay City with $81,651 per family, while 2-person families (3,666 | 47.8%) have the highest median income of $27,720 per family member.
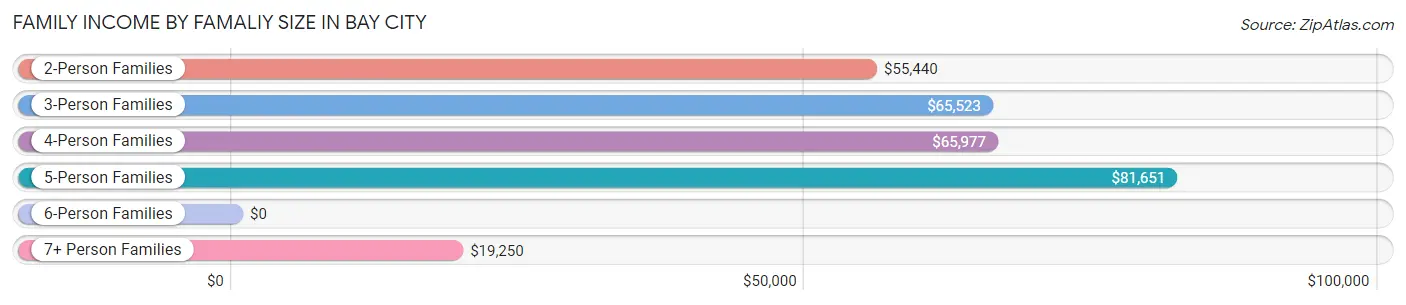
| Income Bracket | # Families | Median Income |
| 2-Person Families | 3,666 (47.8%) | $55,440 |
| 3-Person Families | 1,919 (25.0%) | $65,523 |
| 4-Person Families | 1,213 (15.8%) | $65,977 |
| 5-Person Families | 592 (7.7%) | $81,651 |
| 6-Person Families | 168 (2.2%) | $0 |
| 7+ Person Families | 118 (1.5%) | $19,250 |
| Total | 7,676 (100.0%) | $62,443 |
Family Income by Number of Earners in Bay City
The median family income in Bay City is $62,443, with families comprising 3+ earners (753) having the highest median family income of $104,213, while families with no earners (1,237) have the lowest median family income of $38,598, accounting for 9.8% and 16.1% of families, respectively.
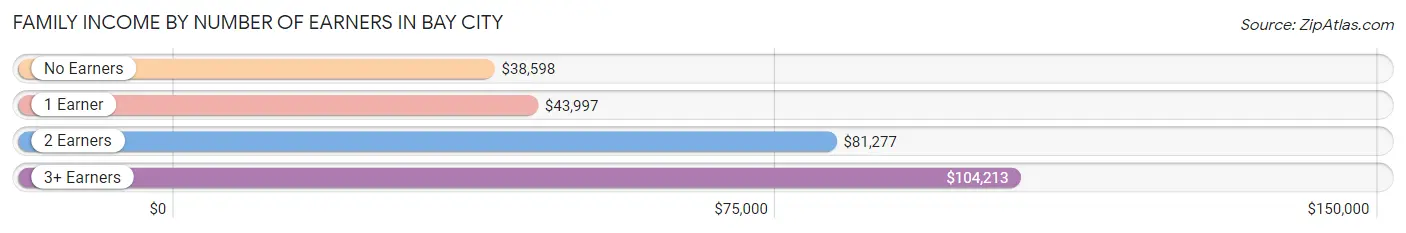
| Number of Earners | # Families | Median Income |
| No Earners | 1,237 (16.1%) | $38,598 |
| 1 Earner | 3,068 (40.0%) | $43,997 |
| 2 Earners | 2,618 (34.1%) | $81,277 |
| 3+ Earners | 753 (9.8%) | $104,213 |
| Total | 7,676 (100.0%) | $62,443 |
Household Income in Bay City
Household Income Brackets in Bay City
With 2,459 households falling in the category, the $50,000 to $74,999 income range is the most frequent in Bay City, accounting for 17.1% of all households. In contrast, only 403 households (2.8%) fall into the $150,000 to $199,999 income bracket, making it the least populous group.
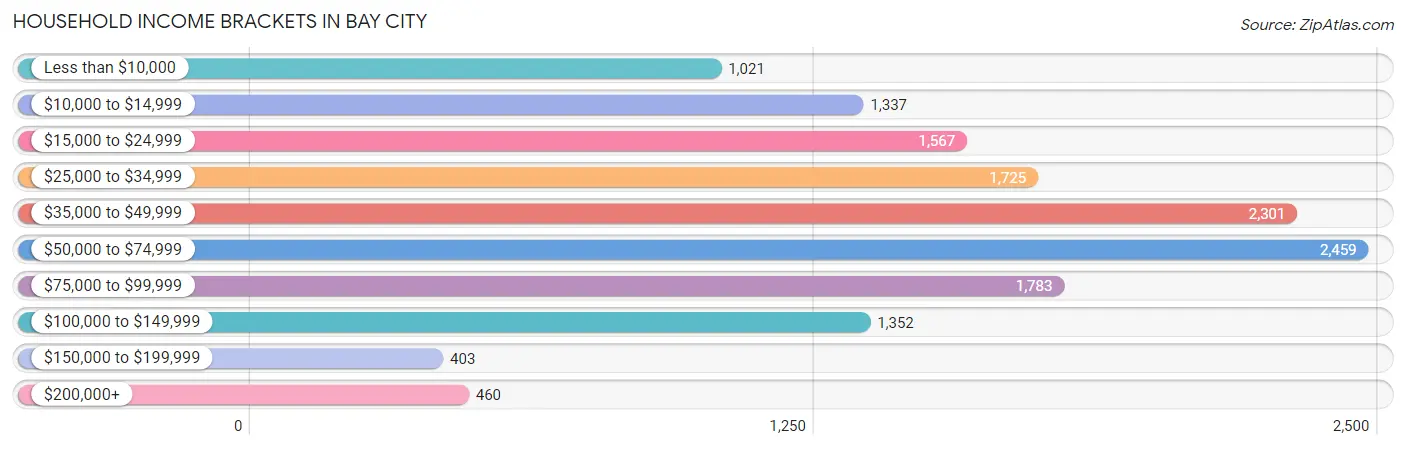
| Income Bracket | # Households | % Households |
| Less than $10,000 | 1,021 | 7.1% |
| $10,000 to $14,999 | 1,337 | 9.3% |
| $15,000 to $24,999 | 1,567 | 10.9% |
| $25,000 to $34,999 | 1,725 | 12.0% |
| $35,000 to $49,999 | 2,301 | 16.0% |
| $50,000 to $74,999 | 2,459 | 17.1% |
| $75,000 to $99,999 | 1,783 | 12.4% |
| $100,000 to $149,999 | 1,352 | 9.4% |
| $150,000 to $199,999 | 403 | 2.8% |
| $200,000+ | 460 | 3.2% |
Household Income by Householder Age in Bay City
The median household income in Bay City is $45,026, with the highest median household income of $52,953 found in the 25 to 44 years age bracket for the primary householder. A total of 4,600 households (32.0%) fall into this category. Meanwhile, the 15 to 24 years age bracket for the primary householder has the lowest median household income of $35,714, with 812 households (5.7%) in this group.
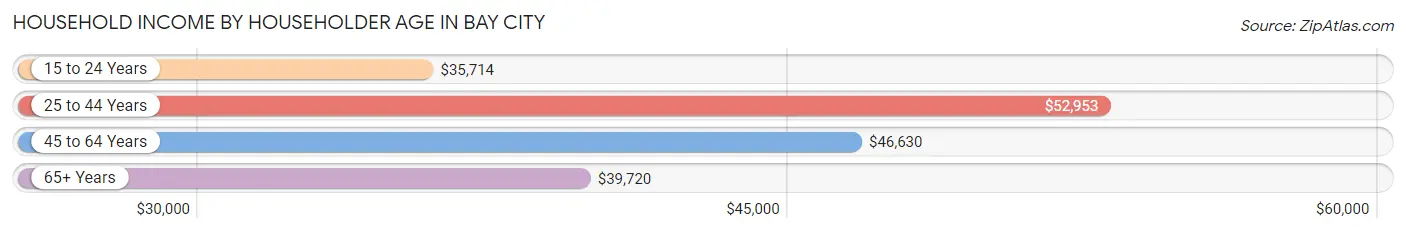
| Income Bracket | # Households | Median Income |
| 15 to 24 Years | 812 (5.7%) | $35,714 |
| 25 to 44 Years | 4,600 (32.0%) | $52,953 |
| 45 to 64 Years | 5,416 (37.7%) | $46,630 |
| 65+ Years | 3,551 (24.7%) | $39,720 |
| Total | 14,379 (100.0%) | $45,026 |
Poverty in Bay City
Income Below Poverty by Sex and Age in Bay City
With 22.0% poverty level for males and 27.4% for females among the residents of Bay City, under 5 year old males and 5 year old females are the most vulnerable to poverty, with 387 males (54.0%) and 103 females (49.5%) in their respective age groups living below the poverty level.
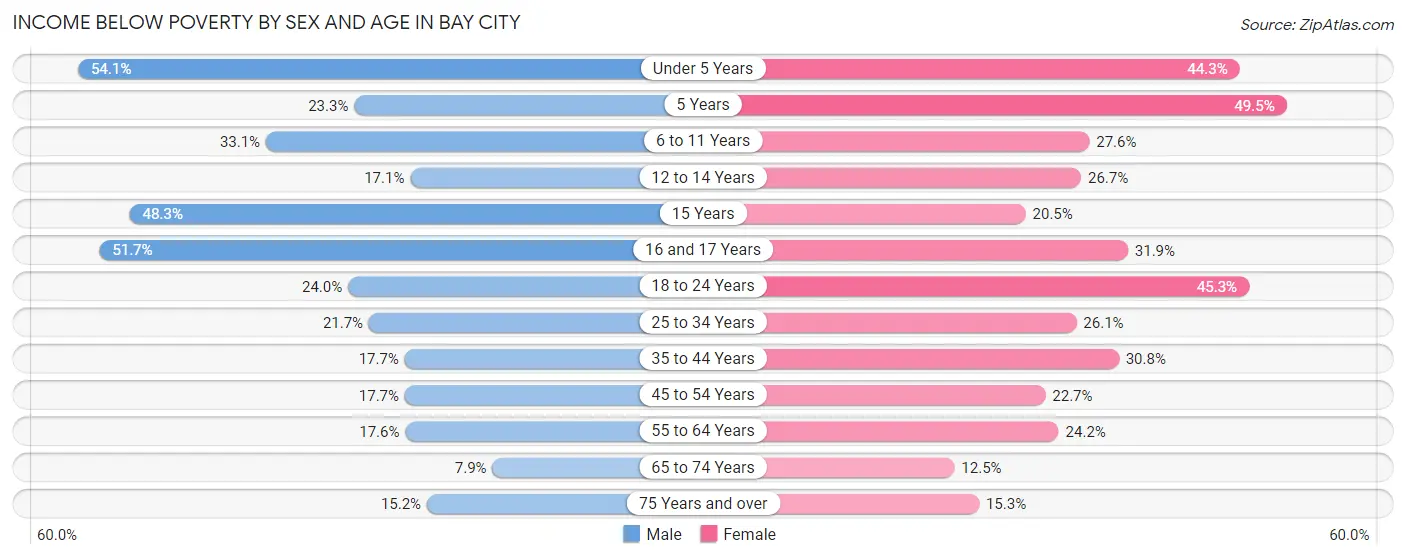
| Age Bracket | Male | Female |
| Under 5 Years | 387 (54.0%) | 403 (44.3%) |
| 5 Years | 34 (23.3%) | 103 (49.5%) |
| 6 to 11 Years | 364 (33.1%) | 304 (27.6%) |
| 12 to 14 Years | 112 (17.1%) | 174 (26.7%) |
| 15 Years | 114 (48.3%) | 35 (20.5%) |
| 16 and 17 Years | 217 (51.7%) | 187 (31.9%) |
| 18 to 24 Years | 346 (24.0%) | 745 (45.3%) |
| 25 to 34 Years | 472 (21.6%) | 585 (26.1%) |
| 35 to 44 Years | 358 (17.7%) | 655 (30.8%) |
| 45 to 54 Years | 371 (17.6%) | 472 (22.7%) |
| 55 to 64 Years | 348 (17.6%) | 638 (24.1%) |
| 65 to 74 Years | 122 (7.9%) | 183 (12.5%) |
| 75 Years and over | 110 (15.2%) | 191 (15.3%) |
| Total | 3,355 (22.0%) | 4,675 (27.4%) |
Income Above Poverty by Sex and Age in Bay City
According to the poverty statistics in Bay City, males aged 65 to 74 years and females aged 65 to 74 years are the age groups that are most secure financially, with 92.1% of males and 87.5% of females in these age groups living above the poverty line.
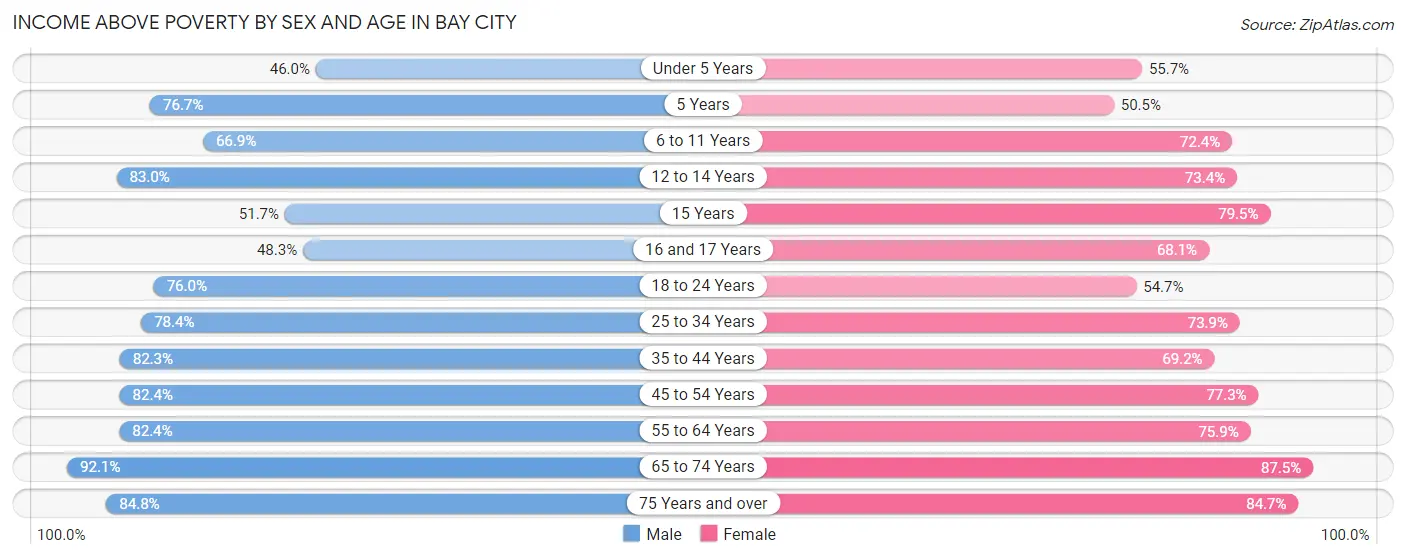
| Age Bracket | Male | Female |
| Under 5 Years | 329 (46.0%) | 507 (55.7%) |
| 5 Years | 112 (76.7%) | 105 (50.5%) |
| 6 to 11 Years | 735 (66.9%) | 799 (72.4%) |
| 12 to 14 Years | 545 (83.0%) | 479 (73.4%) |
| 15 Years | 122 (51.7%) | 136 (79.5%) |
| 16 and 17 Years | 203 (48.3%) | 400 (68.1%) |
| 18 to 24 Years | 1,097 (76.0%) | 898 (54.7%) |
| 25 to 34 Years | 1,708 (78.3%) | 1,654 (73.9%) |
| 35 to 44 Years | 1,668 (82.3%) | 1,469 (69.2%) |
| 45 to 54 Years | 1,731 (82.4%) | 1,610 (77.3%) |
| 55 to 64 Years | 1,629 (82.4%) | 2,004 (75.8%) |
| 65 to 74 Years | 1,423 (92.1%) | 1,276 (87.5%) |
| 75 Years and over | 614 (84.8%) | 1,059 (84.7%) |
| Total | 11,916 (78.0%) | 12,396 (72.6%) |
Income Below Poverty Among Married-Couple Families in Bay City
The poverty statistics for married-couple families in Bay City show that 7.8% or 359 of the total 4,616 families live below the poverty line. Families with 5 or more children have the highest poverty rate of 100.0%, comprising of 32 families. On the other hand, families with no children have the lowest poverty rate of 1.4%, which includes 41 families.
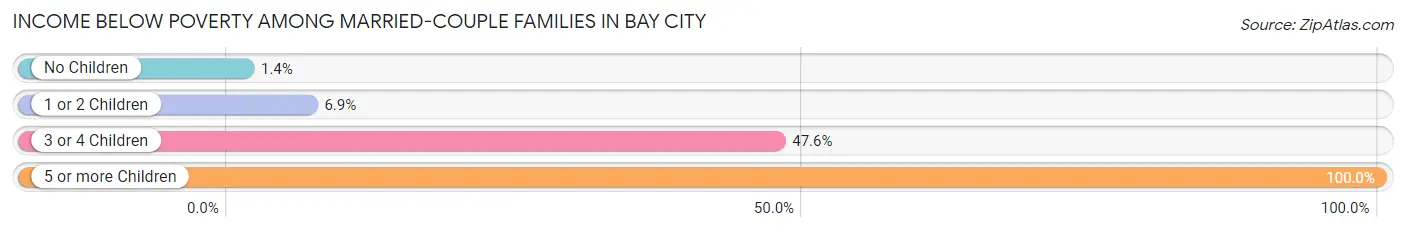
| Children | Above Poverty | Below Poverty |
| No Children | 2,903 (98.6%) | 41 (1.4%) |
| 1 or 2 Children | 1,132 (93.1%) | 84 (6.9%) |
| 3 or 4 Children | 222 (52.4%) | 202 (47.6%) |
| 5 or more Children | 0 (0.0%) | 32 (100.0%) |
| Total | 4,257 (92.2%) | 359 (7.8%) |
Income Below Poverty Among Single-Parent Households in Bay City
According to the poverty data in Bay City, 25.3% or 197 single-father households and 33.2% or 756 single-mother households are living below the poverty line. Among single-father households, those with 3 or 4 children have the highest poverty rate, with 75 households (60.5%) experiencing poverty. Likewise, among single-mother households, those with 5 or more children have the highest poverty rate, with 45 households (100.0%) falling below the poverty line.
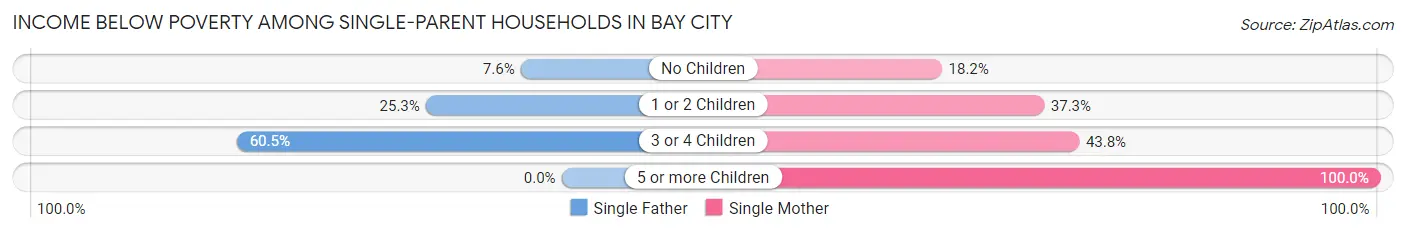
| Children | Single Father | Single Mother |
| No Children | 19 (7.6%) | 133 (18.2%) |
| 1 or 2 Children | 103 (25.3%) | 468 (37.3%) |
| 3 or 4 Children | 75 (60.5%) | 110 (43.8%) |
| 5 or more Children | 0 (0.0%) | 45 (100.0%) |
| Total | 197 (25.3%) | 756 (33.2%) |
Income Below Poverty Among Married-Couple vs Single-Parent Households in Bay City
The poverty data for Bay City shows that 359 of the married-couple family households (7.8%) and 953 of the single-parent households (31.1%) are living below the poverty level. Within the married-couple family households, those with 5 or more children have the highest poverty rate, with 32 households (100.0%) falling below the poverty line. Among the single-parent households, those with 5 or more children have the highest poverty rate, with 45 household (100.0%) living below poverty.
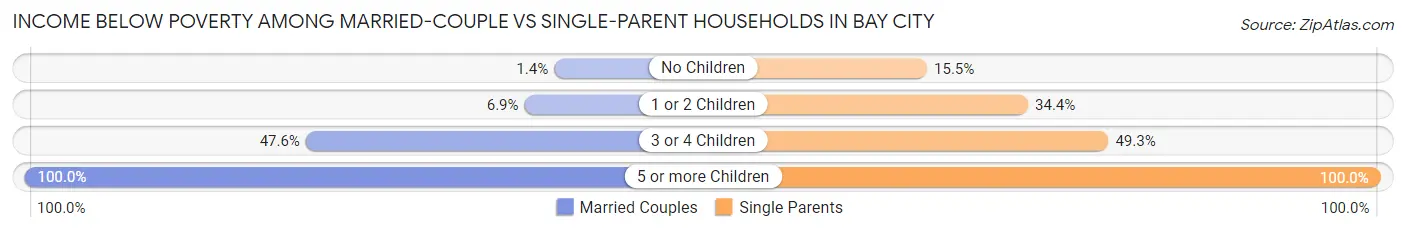
| Children | Married-Couple Families | Single-Parent Households |
| No Children | 41 (1.4%) | 152 (15.5%) |
| 1 or 2 Children | 84 (6.9%) | 571 (34.4%) |
| 3 or 4 Children | 202 (47.6%) | 185 (49.3%) |
| 5 or more Children | 32 (100.0%) | 45 (100.0%) |
| Total | 359 (7.8%) | 953 (31.1%) |
Race in Bay City
The most populous races in Bay City are White / Caucasian (28,466 | 87.2%), Hispanic or Latino (3,472 | 10.6%), and Two or more Races (2,663 | 8.2%).
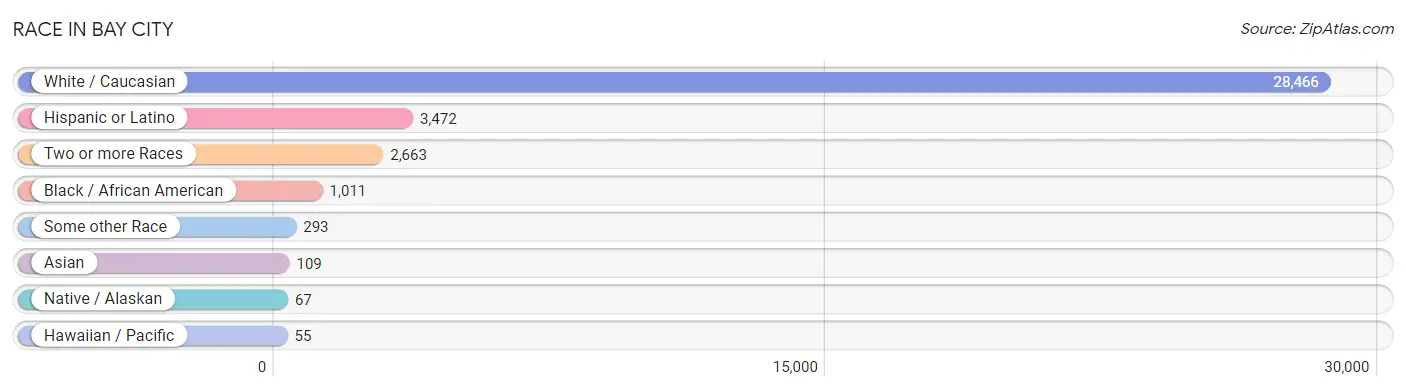
| Race | # Population | % Population |
| Asian | 109 | 0.3% |
| Black / African American | 1,011 | 3.1% |
| Hawaiian / Pacific | 55 | 0.2% |
| Hispanic or Latino | 3,472 | 10.6% |
| Native / Alaskan | 67 | 0.2% |
| White / Caucasian | 28,466 | 87.2% |
| Two or more Races | 2,663 | 8.2% |
| Some other Race | 293 | 0.9% |
| Total | 32,664 | 100.0% |
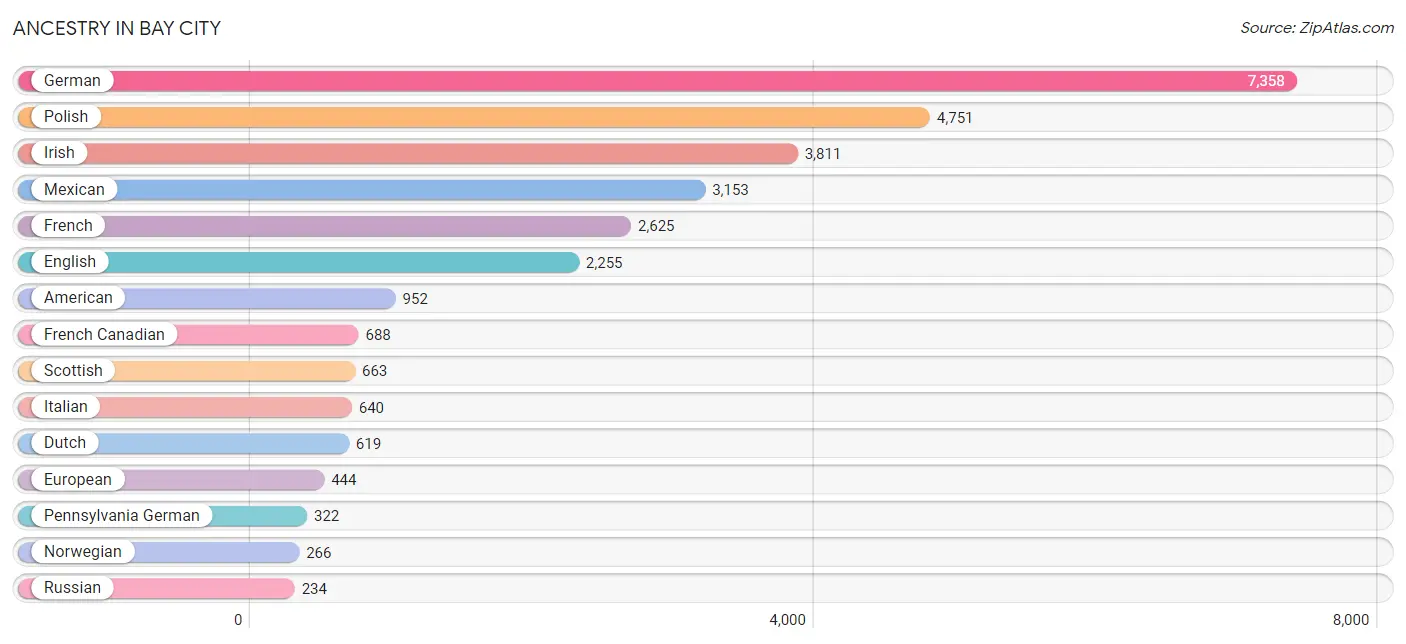
Ancestry in Bay City
The most populous ancestries reported in Bay City are German (7,358 | 22.5%), Polish (4,751 | 14.5%), Irish (3,811 | 11.7%), Mexican (3,153 | 9.7%), and French (2,625 | 8.0%), together accounting for 66.4% of all Bay City residents.
| Ancestry | # Population | % Population |
| African | 23 | 0.1% |
| American | 952 | 2.9% |
| Arab | 13 | 0.0% |
| Austrian | 31 | 0.1% |
| Belgian | 79 | 0.2% |
| Bhutanese | 91 | 0.3% |
| Blackfeet | 114 | 0.4% |
| Brazilian | 60 | 0.2% |
| British | 70 | 0.2% |
| Burmese | 72 | 0.2% |
| Canadian | 43 | 0.1% |
| Cherokee | 63 | 0.2% |
| Chippewa | 96 | 0.3% |
| Colombian | 27 | 0.1% |
| Croatian | 25 | 0.1% |
| Cuban | 32 | 0.1% |
| Czech | 62 | 0.2% |
| Czechoslovakian | 23 | 0.1% |
| Danish | 32 | 0.1% |
| Dominican | 52 | 0.2% |
| Dutch | 619 | 1.9% |
| Eastern European | 92 | 0.3% |
| English | 2,255 | 6.9% |
| European | 444 | 1.4% |
| Finnish | 62 | 0.2% |
| French | 2,625 | 8.0% |
| French American Indian | 2 | 0.0% |
| French Canadian | 688 | 2.1% |
| German | 7,358 | 22.5% |
| German Russian | 14 | 0.0% |
| Greek | 33 | 0.1% |
| Haitian | 13 | 0.0% |
| Hmong | 59 | 0.2% |
| Houma | 5 | 0.0% |
| Hungarian | 216 | 0.7% |
| Indian (Asian) | 78 | 0.2% |
| Irish | 3,811 | 11.7% |
| Italian | 640 | 2.0% |
| Jordanian | 6 | 0.0% |
| Latvian | 17 | 0.1% |
| Lebanese | 7 | 0.0% |
| Lithuanian | 40 | 0.1% |
| Lumbee | 5 | 0.0% |
| Luxembourger | 6 | 0.0% |
| Malaysian | 53 | 0.2% |
| Mexican | 3,153 | 9.7% |
| Native Hawaiian | 53 | 0.2% |
| Nigerian | 10 | 0.0% |
| Northern European | 8 | 0.0% |
| Norwegian | 266 | 0.8% |
| Ottawa | 16 | 0.1% |
| Pennsylvania German | 322 | 1.0% |
| Polish | 4,751 | 14.5% |
| Portuguese | 24 | 0.1% |
| Pueblo | 12 | 0.0% |
| Puerto Rican | 29 | 0.1% |
| Romanian | 15 | 0.1% |
| Russian | 234 | 0.7% |
| Samoan | 8 | 0.0% |
| Scandinavian | 103 | 0.3% |
| Scotch-Irish | 204 | 0.6% |
| Scottish | 663 | 2.0% |
| Slavic | 14 | 0.0% |
| Slovak | 81 | 0.3% |
| Slovene | 3 | 0.0% |
| South American | 27 | 0.1% |
| Spaniard | 22 | 0.1% |
| Spanish | 44 | 0.1% |
| Subsaharan African | 38 | 0.1% |
| Swedish | 167 | 0.5% |
| Swiss | 48 | 0.2% |
| Thai | 20 | 0.1% |
| Ukrainian | 85 | 0.3% |
| Welsh | 73 | 0.2% |
| Yugoslavian | 17 | 0.1% | View All 75 Rows |
Immigrants in Bay City
The most numerous immigrant groups reported in Bay City came from Europe (130 | 0.4%), Latin America (101 | 0.3%), Asia (90 | 0.3%), Eastern Asia (90 | 0.3%), and Western Europe (63 | 0.2%), together accounting for 1.5% of all Bay City residents.
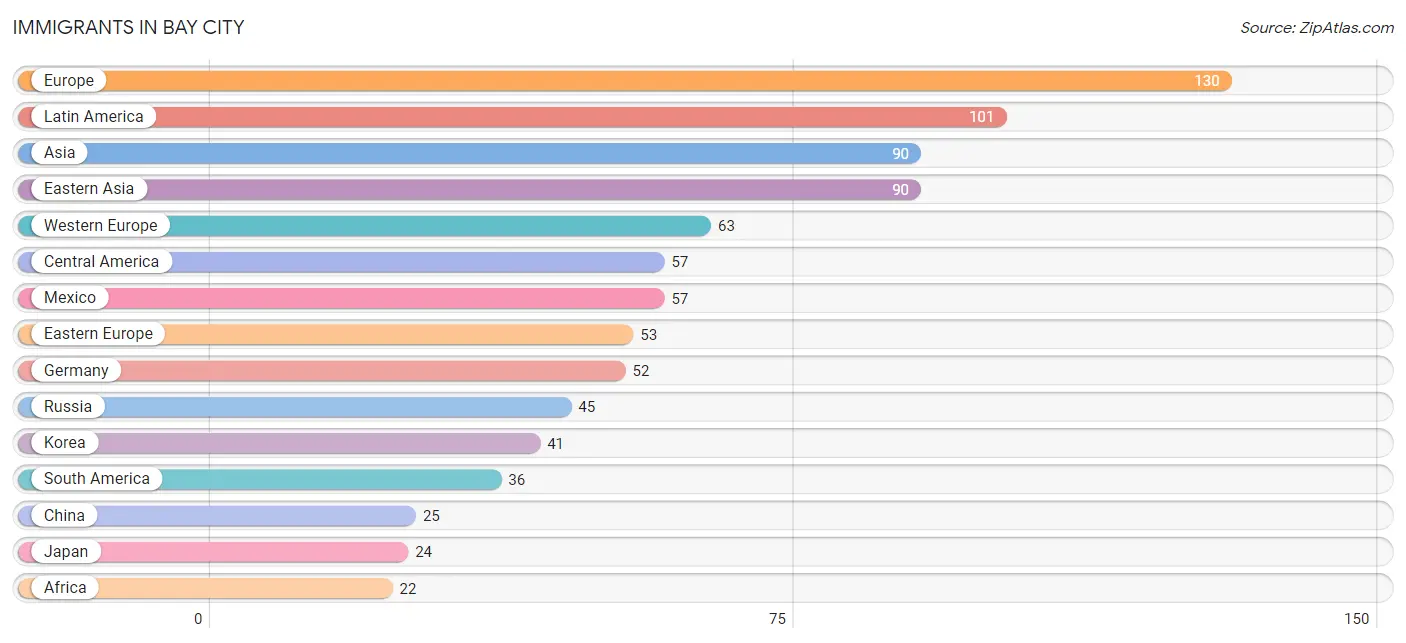
| Immigration Origin | # Population | % Population |
| Africa | 22 | 0.1% |
| Asia | 90 | 0.3% |
| Brazil | 21 | 0.1% |
| Caribbean | 8 | 0.0% |
| Central America | 57 | 0.2% |
| China | 25 | 0.1% |
| Colombia | 15 | 0.1% |
| Croatia | 8 | 0.0% |
| Eastern Asia | 90 | 0.3% |
| Eastern Europe | 53 | 0.2% |
| Egypt | 12 | 0.0% |
| Europe | 130 | 0.4% |
| Germany | 52 | 0.2% |
| Haiti | 8 | 0.0% |
| Italy | 10 | 0.0% |
| Japan | 24 | 0.1% |
| Korea | 41 | 0.1% |
| Latin America | 101 | 0.3% |
| Mexico | 57 | 0.2% |
| Netherlands | 11 | 0.0% |
| Nigeria | 10 | 0.0% |
| Northern Africa | 12 | 0.0% |
| Northern Europe | 4 | 0.0% |
| Oceania | 8 | 0.0% |
| Russia | 45 | 0.1% |
| Scotland | 4 | 0.0% |
| South America | 36 | 0.1% |
| Southern Europe | 10 | 0.0% |
| Western Africa | 10 | 0.0% |
| Western Europe | 63 | 0.2% | View All 30 Rows |
Sex and Age in Bay City
Sex and Age in Bay City
The most populous age groups in Bay City are 60 to 64 Years (1,194 | 7.7%) for men and 60 to 64 Years (1,408 | 8.2%) for women.
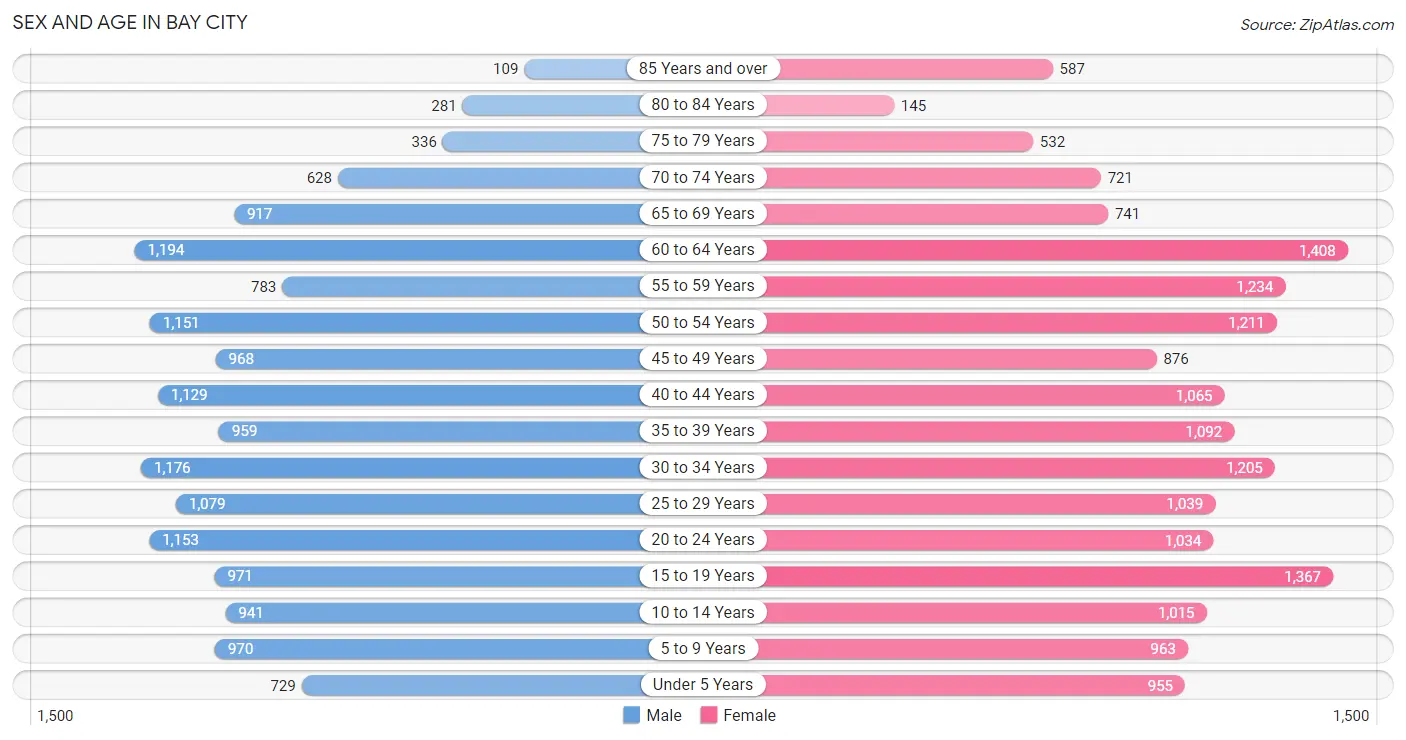
| Age Bracket | Male | Female |
| Under 5 Years | 729 (4.7%) | 955 (5.6%) |
| 5 to 9 Years | 970 (6.3%) | 963 (5.6%) |
| 10 to 14 Years | 941 (6.1%) | 1,015 (5.9%) |
| 15 to 19 Years | 971 (6.3%) | 1,367 (8.0%) |
| 20 to 24 Years | 1,153 (7.4%) | 1,034 (6.0%) |
| 25 to 29 Years | 1,079 (7.0%) | 1,039 (6.0%) |
| 30 to 34 Years | 1,176 (7.6%) | 1,205 (7.0%) |
| 35 to 39 Years | 959 (6.2%) | 1,092 (6.4%) |
| 40 to 44 Years | 1,129 (7.3%) | 1,065 (6.2%) |
| 45 to 49 Years | 968 (6.3%) | 876 (5.1%) |
| 50 to 54 Years | 1,151 (7.4%) | 1,211 (7.0%) |
| 55 to 59 Years | 783 (5.1%) | 1,234 (7.2%) |
| 60 to 64 Years | 1,194 (7.7%) | 1,408 (8.2%) |
| 65 to 69 Years | 917 (5.9%) | 741 (4.3%) |
| 70 to 74 Years | 628 (4.1%) | 721 (4.2%) |
| 75 to 79 Years | 336 (2.2%) | 532 (3.1%) |
| 80 to 84 Years | 281 (1.8%) | 145 (0.8%) |
| 85 Years and over | 109 (0.7%) | 587 (3.4%) |
| Total | 15,474 (100.0%) | 17,190 (100.0%) |
Families and Households in Bay City
Median Family Size in Bay City
The median family size in Bay City is 2.98 persons per family, with single male/father families (780 | 10.2%) accounting for the largest median family size of 3.17 persons per family. On the other hand, married-couple families (4,616 | 60.1%) represent the smallest median family size with 2.95 persons per family.
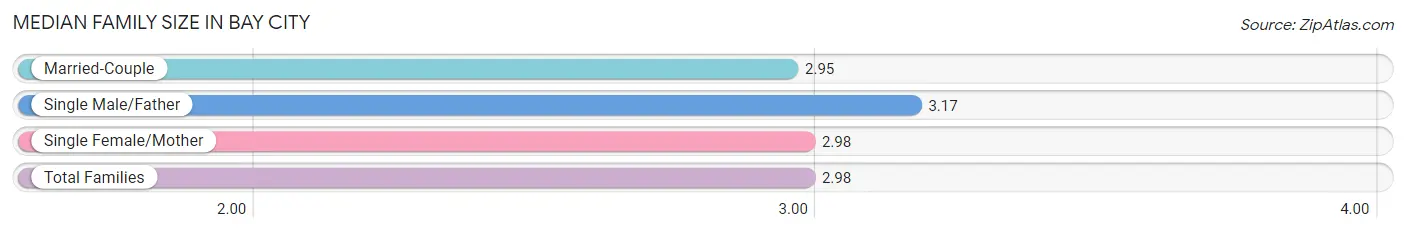
| Family Type | # Families | Family Size |
| Married-Couple | 4,616 (60.1%) | 2.95 |
| Single Male/Father | 780 (10.2%) | 3.17 |
| Single Female/Mother | 2,280 (29.7%) | 2.98 |
| Total Families | 7,676 (100.0%) | 2.98 |
Median Household Size in Bay City
The median household size in Bay City is 2.24 persons per household, with single male/father households (780 | 5.4%) accounting for the largest median household size of 3.47 persons per household. non-family households (6,703 | 46.6%) represent the smallest median household size with 1.21 persons per household.
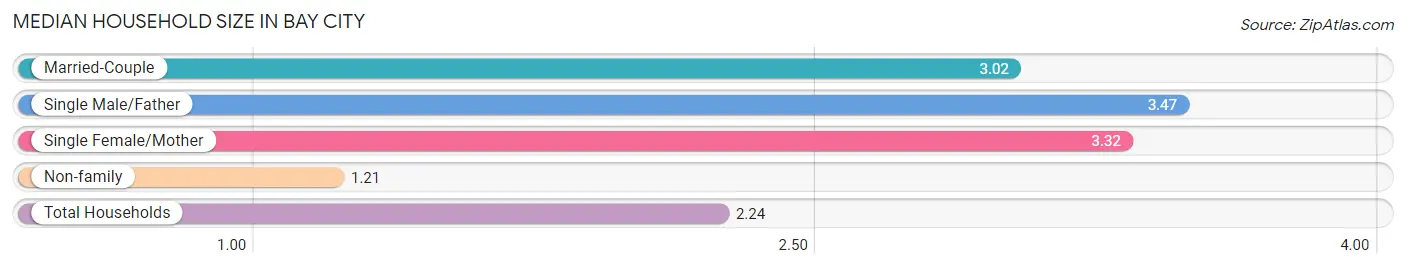
| Household Type | # Households | Household Size |
| Married-Couple | 4,616 (32.1%) | 3.02 |
| Single Male/Father | 780 (5.4%) | 3.47 |
| Single Female/Mother | 2,280 (15.9%) | 3.32 |
| Non-family | 6,703 (46.6%) | 1.21 |
| Total Households | 14,379 (100.0%) | 2.24 |
Household Size by Marriage Status in Bay City
Out of a total of 14,379 households in Bay City, 7,676 (53.4%) are family households, while 6,703 (46.6%) are nonfamily households. The most numerous type of family households are 2-person households, comprising 3,370, and the most common type of nonfamily households are 1-person households, comprising 5,495.
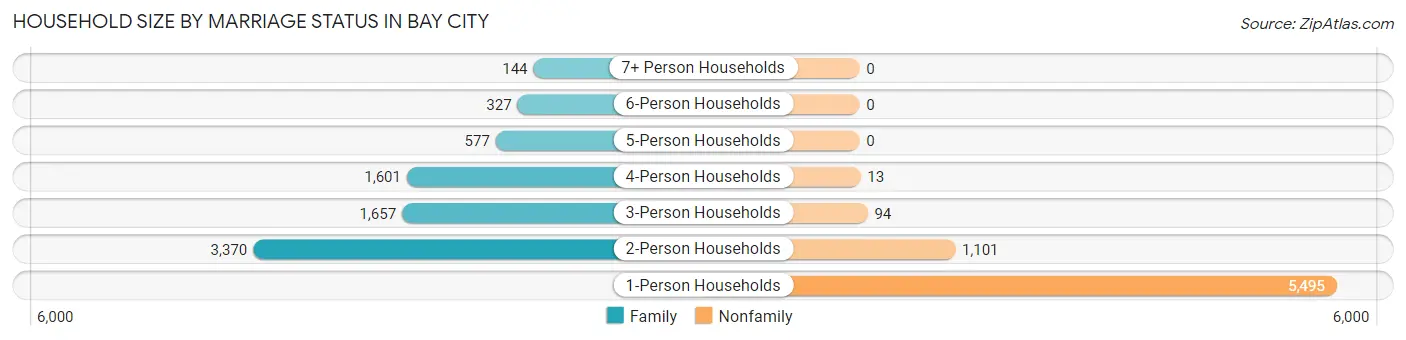
| Household Size | Family Households | Nonfamily Households |
| 1-Person Households | - | 5,495 (38.2%) |
| 2-Person Households | 3,370 (23.4%) | 1,101 (7.7%) |
| 3-Person Households | 1,657 (11.5%) | 94 (0.6%) |
| 4-Person Households | 1,601 (11.1%) | 13 (0.1%) |
| 5-Person Households | 577 (4.0%) | 0 (0.0%) |
| 6-Person Households | 327 (2.3%) | 0 (0.0%) |
| 7+ Person Households | 144 (1.0%) | 0 (0.0%) |
| Total | 7,676 (53.4%) | 6,703 (46.6%) |
Female Fertility in Bay City
Fertility by Age in Bay City
Average fertility rate in Bay City is 44.0 births per 1,000 women. Women in the age bracket of 20 to 34 years have the highest fertility rate with 94.0 births per 1,000 women. Women in the age bracket of 20 to 34 years acount for 88.0% of all women with births.
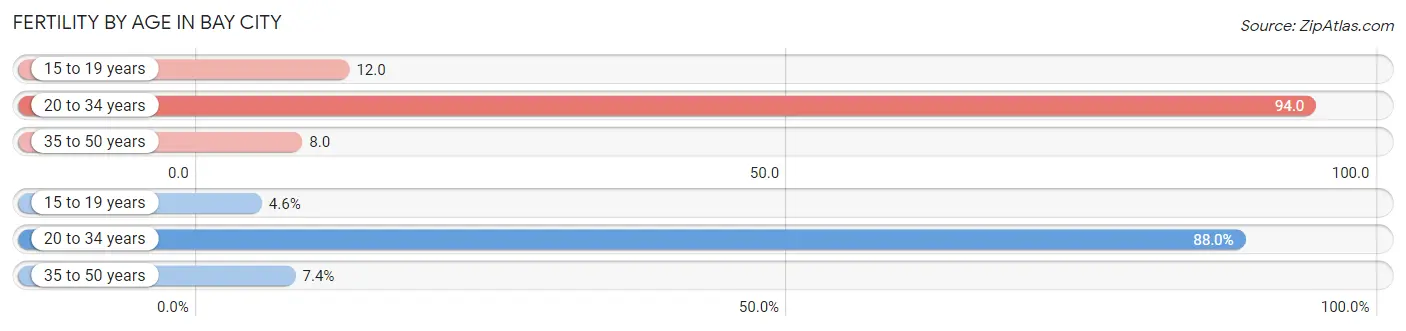
| Age Bracket | Women with Births | Births / 1,000 Women |
| 15 to 19 years | 16 (4.6%) | 12.0 |
| 20 to 34 years | 308 (88.0%) | 94.0 |
| 35 to 50 years | 26 (7.4%) | 8.0 |
| Total | 350 (100.0%) | 44.0 |
Fertility by Age by Marriage Status in Bay City
35.1% of women with births (350) in Bay City are married. The highest percentage of unmarried women with births falls into 15 to 19 years age bracket with 100.0% of them unmarried at the time of birth, while the lowest percentage of unmarried women with births belong to 20 to 34 years age bracket with 60.1% of them unmarried.
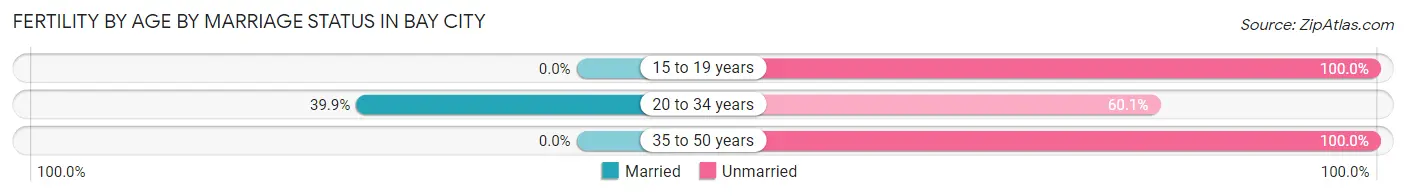
| Age Bracket | Married | Unmarried |
| 15 to 19 years | 0 (0.0%) | 16 (100.0%) |
| 20 to 34 years | 123 (39.9%) | 185 (60.1%) |
| 35 to 50 years | 0 (0.0%) | 26 (100.0%) |
| Total | 123 (35.1%) | 227 (64.9%) |
Fertility by Education in Bay City
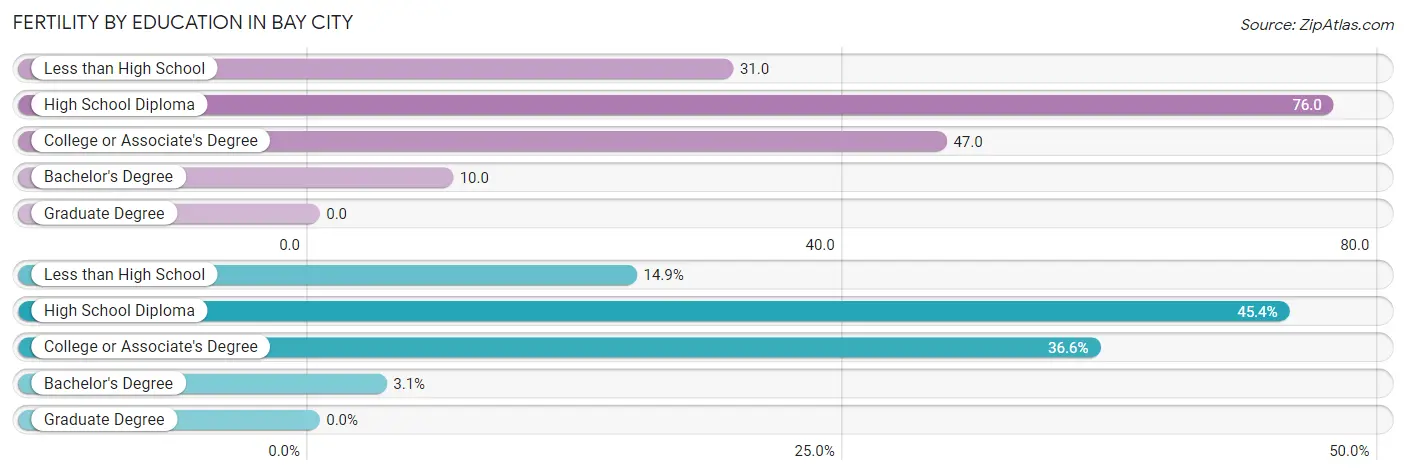
| Educational Attainment | Women with Births | Births / 1,000 Women |
| Less than High School | 52 (14.9%) | 31.0 |
| High School Diploma | 159 (45.4%) | 76.0 |
| College or Associate's Degree | 128 (36.6%) | 47.0 |
| Bachelor's Degree | 11 (3.1%) | 10.0 |
| Graduate Degree | 0 (0.0%) | 0.0 |
| Total | 350 (100.0%) | 44.0 |
Fertility by Education by Marriage Status in Bay City
64.9% of women with births in Bay City are unmarried. Women with the educational attainment of bachelor's degree are most likely to be married with 100.0% of them married at childbirth, while women with the educational attainment of less than high school are least likely to be married with 82.7% of them unmarried at childbirth.
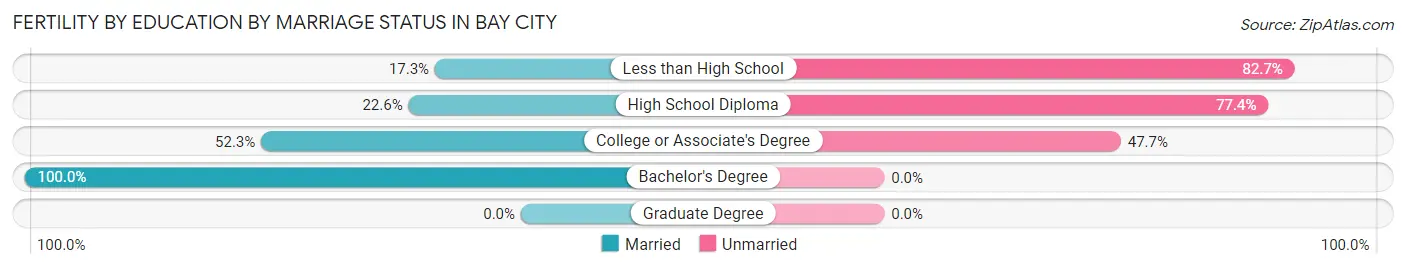
| Educational Attainment | Married | Unmarried |
| Less than High School | 9 (17.3%) | 43 (82.7%) |
| High School Diploma | 36 (22.6%) | 123 (77.4%) |
| College or Associate's Degree | 67 (52.3%) | 61 (47.7%) |
| Bachelor's Degree | 11 (100.0%) | 0 (0.0%) |
| Graduate Degree | 0 (0.0%) | 0 (0.0%) |
| Total | 123 (35.1%) | 227 (64.9%) |
Employment Characteristics in Bay City
Employment by Class of Employer in Bay City
Among the 14,585 employed individuals in Bay City, private company employees (10,282 | 70.5%), not-for-profit organizations (1,729 | 11.8%), and self-employed (not incorporated) (917 | 6.3%) make up the most common classes of employment.
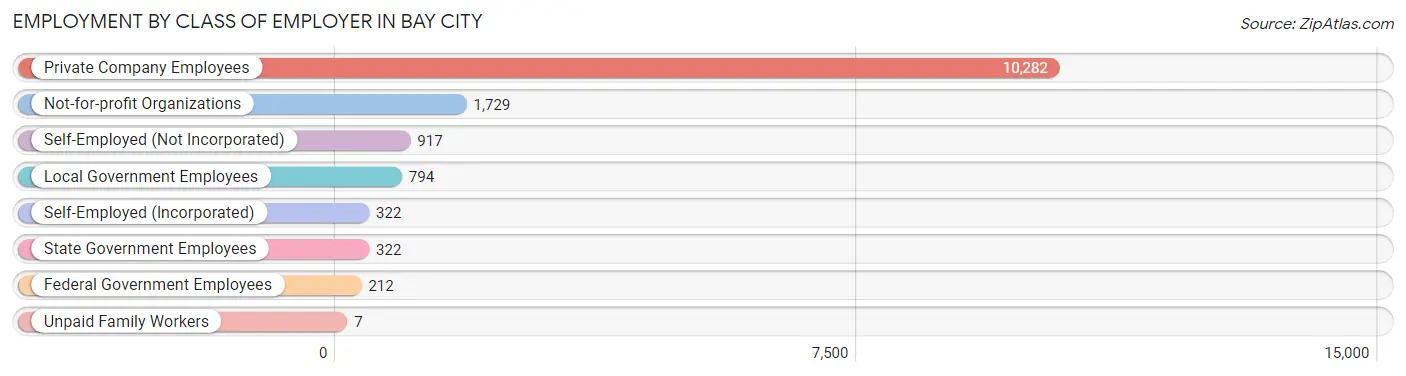
| Employer Class | # Employees | % Employees |
| Private Company Employees | 10,282 | 70.5% |
| Self-Employed (Incorporated) | 322 | 2.2% |
| Self-Employed (Not Incorporated) | 917 | 6.3% |
| Not-for-profit Organizations | 1,729 | 11.8% |
| Local Government Employees | 794 | 5.4% |
| State Government Employees | 322 | 2.2% |
| Federal Government Employees | 212 | 1.5% |
| Unpaid Family Workers | 7 | 0.1% |
| Total | 14,585 | 100.0% |
Employment Status by Age in Bay City
According to the labor force statistics for Bay City, out of the total population over 16 years of age (26,684), 60.0% or 16,010 individuals are in the labor force, with 6.2% or 993 of them unemployed. The age group with the highest labor force participation rate is 20 to 24 years, with 84.2% or 1,841 individuals in the labor force. Within the labor force, the 20 to 24 years age range has the highest percentage of unemployed individuals, with 11.3% or 208 of them being unemployed.
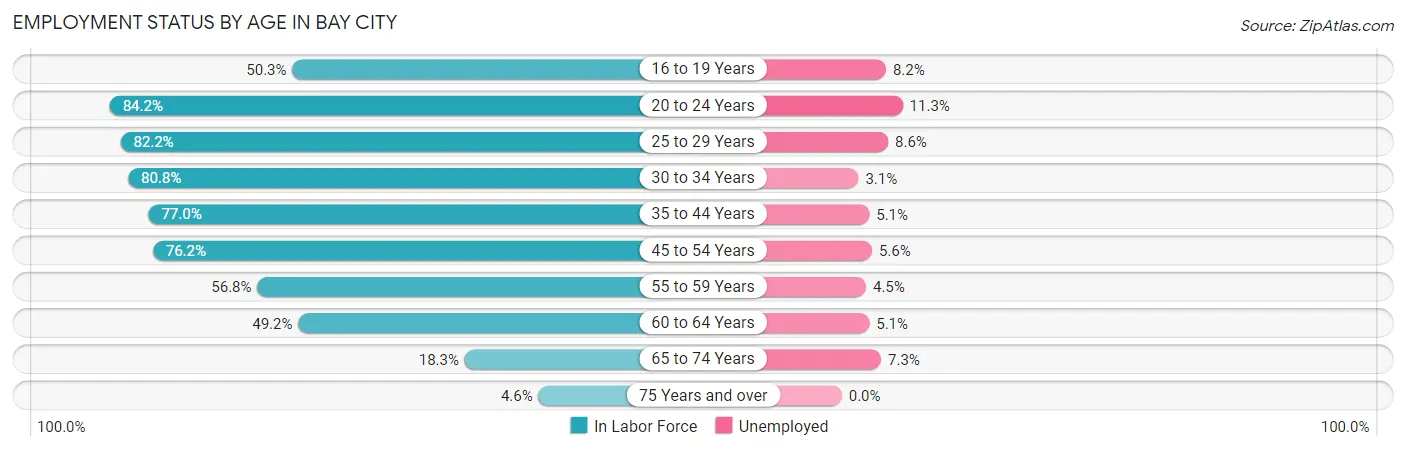
| Age Bracket | In Labor Force | Unemployed |
| 16 to 19 Years | 971 (50.3%) | 80 (8.2%) |
| 20 to 24 Years | 1,841 (84.2%) | 208 (11.3%) |
| 25 to 29 Years | 1,741 (82.2%) | 150 (8.6%) |
| 30 to 34 Years | 1,924 (80.8%) | 60 (3.1%) |
| 35 to 44 Years | 3,269 (77.0%) | 167 (5.1%) |
| 45 to 54 Years | 3,205 (76.2%) | 179 (5.6%) |
| 55 to 59 Years | 1,146 (56.8%) | 52 (4.5%) |
| 60 to 64 Years | 1,280 (49.2%) | 65 (5.1%) |
| 65 to 74 Years | 550 (18.3%) | 40 (7.3%) |
| 75 Years and over | 92 (4.6%) | 0 (0.0%) |
| Total | 16,010 (60.0%) | 993 (6.2%) |
Employment Status by Educational Attainment in Bay City
According to labor force statistics for Bay City, 71.5% of individuals (12,562) out of the total population between 25 and 64 years of age (17,569) are in the labor force, with 5.4% or 678 of them being unemployed. The group with the highest labor force participation rate are those with the educational attainment of bachelor's degree or higher, with 87.9% or 2,510 individuals in the labor force. Within the labor force, individuals with less than high school education have the highest percentage of unemployment, with 13.6% or 166 of them being unemployed.
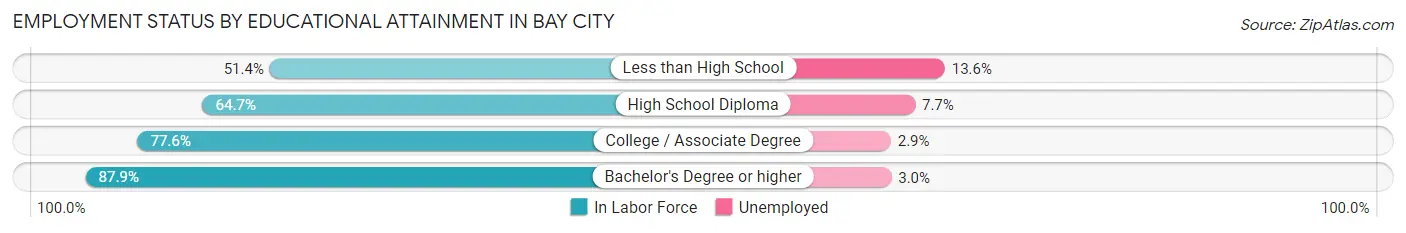
| Educational Attainment | In Labor Force | Unemployed |
| Less than High School | 1,224 (51.4%) | 324 (13.6%) |
| High School Diploma | 3,694 (64.7%) | 440 (7.7%) |
| College / Associate Degree | 5,139 (77.6%) | 192 (2.9%) |
| Bachelor's Degree or higher | 2,510 (87.9%) | 86 (3.0%) |
| Total | 12,562 (71.5%) | 949 (5.4%) |
Employment Occupations by Sex in Bay City
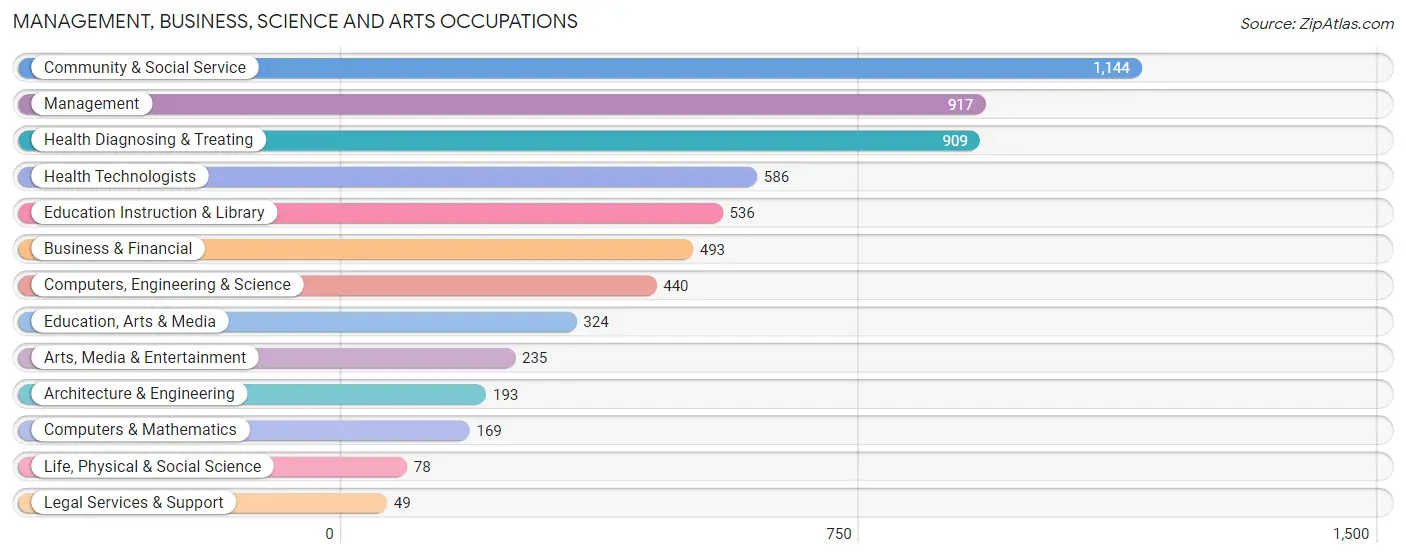
Management, Business, Science and Arts Occupations
The most common Management, Business, Science and Arts occupations in Bay City are Community & Social Service (1,144 | 7.6%), Management (917 | 6.1%), Health Diagnosing & Treating (909 | 6.0%), Health Technologists (586 | 3.9%), and Education Instruction & Library (536 | 3.6%).
Management, Business, Science and Arts Occupations by Sex
Within the Management, Business, Science and Arts occupations in Bay City, the most male-oriented occupations are Architecture & Engineering (93.8%), Computers & Mathematics (82.3%), and Computers, Engineering & Science (79.5%), while the most female-oriented occupations are Education, Arts & Media (88.0%), Health Diagnosing & Treating (86.8%), and Health Technologists (82.9%).
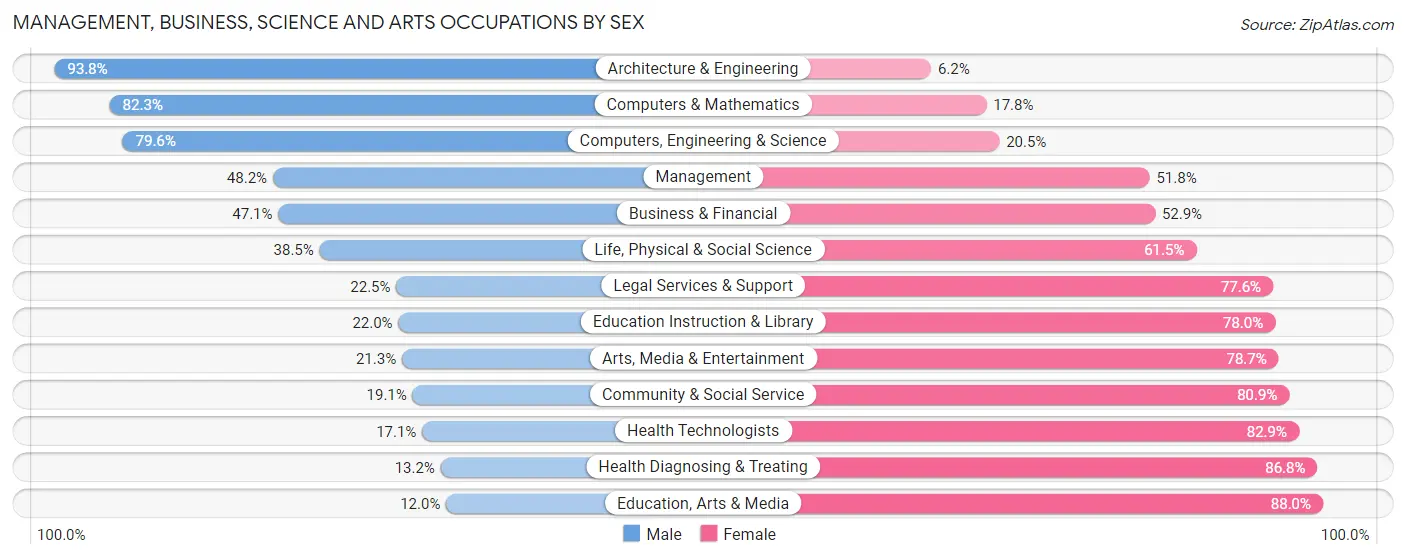
| Occupation | Male | Female |
| Management | 442 (48.2%) | 475 (51.8%) |
| Business & Financial | 232 (47.1%) | 261 (52.9%) |
| Computers, Engineering & Science | 350 (79.5%) | 90 (20.4%) |
| Computers & Mathematics | 139 (82.3%) | 30 (17.7%) |
| Architecture & Engineering | 181 (93.8%) | 12 (6.2%) |
| Life, Physical & Social Science | 30 (38.5%) | 48 (61.5%) |
| Community & Social Service | 218 (19.1%) | 926 (80.9%) |
| Education, Arts & Media | 39 (12.0%) | 285 (88.0%) |
| Legal Services & Support | 11 (22.5%) | 38 (77.5%) |
| Education Instruction & Library | 118 (22.0%) | 418 (78.0%) |
| Arts, Media & Entertainment | 50 (21.3%) | 185 (78.7%) |
| Health Diagnosing & Treating | 120 (13.2%) | 789 (86.8%) |
| Health Technologists | 100 (17.1%) | 486 (82.9%) |
| Total (Category) | 1,362 (34.9%) | 2,541 (65.1%) |
| Total (Overall) | 7,290 (48.5%) | 7,728 (51.5%) |
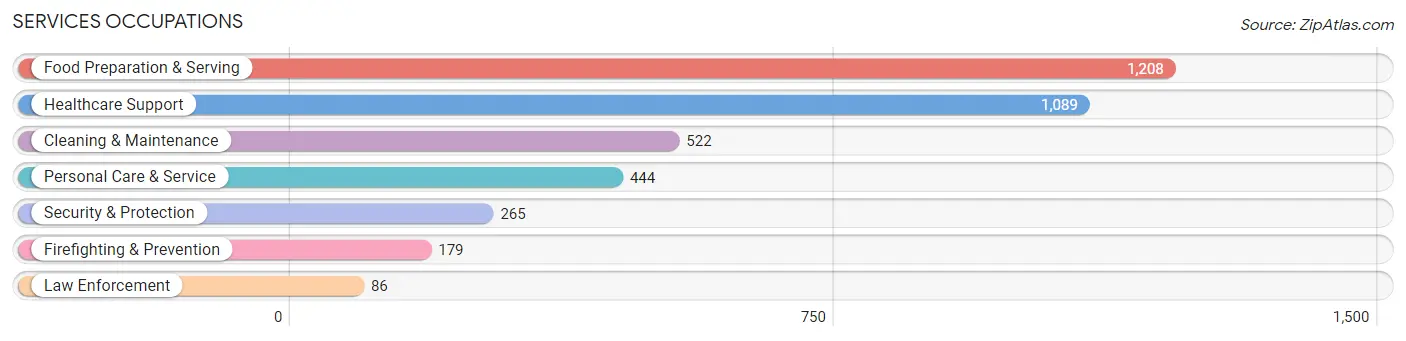
Services Occupations
The most common Services occupations in Bay City are Food Preparation & Serving (1,208 | 8.0%), Healthcare Support (1,089 | 7.2%), Cleaning & Maintenance (522 | 3.5%), Personal Care & Service (444 | 3.0%), and Security & Protection (265 | 1.8%).
Services Occupations by Sex
Within the Services occupations in Bay City, the most male-oriented occupations are Law Enforcement (100.0%), Security & Protection (76.6%), and Firefighting & Prevention (65.4%), while the most female-oriented occupations are Healthcare Support (83.3%), Personal Care & Service (61.9%), and Food Preparation & Serving (50.2%).
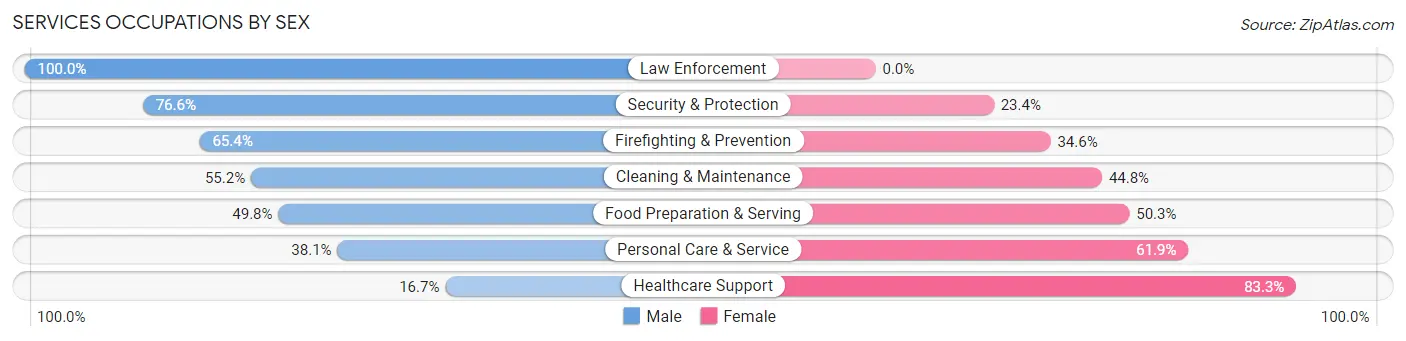
| Occupation | Male | Female |
| Healthcare Support | 182 (16.7%) | 907 (83.3%) |
| Security & Protection | 203 (76.6%) | 62 (23.4%) |
| Firefighting & Prevention | 117 (65.4%) | 62 (34.6%) |
| Law Enforcement | 86 (100.0%) | 0 (0.0%) |
| Food Preparation & Serving | 601 (49.7%) | 607 (50.2%) |
| Cleaning & Maintenance | 288 (55.2%) | 234 (44.8%) |
| Personal Care & Service | 169 (38.1%) | 275 (61.9%) |
| Total (Category) | 1,443 (40.9%) | 2,085 (59.1%) |
| Total (Overall) | 7,290 (48.5%) | 7,728 (51.5%) |
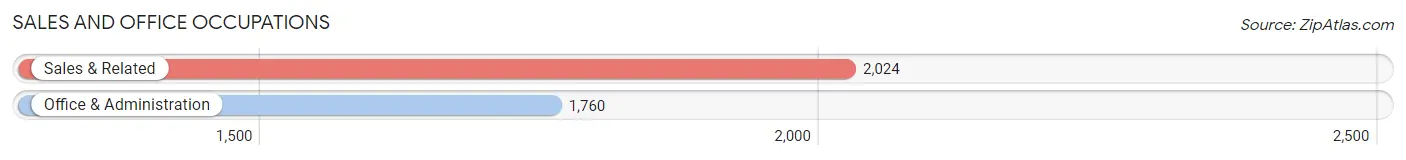
Sales and Office Occupations
The most common Sales and Office occupations in Bay City are Sales & Related (2,024 | 13.5%), and Office & Administration (1,760 | 11.7%).
Sales and Office Occupations by Sex
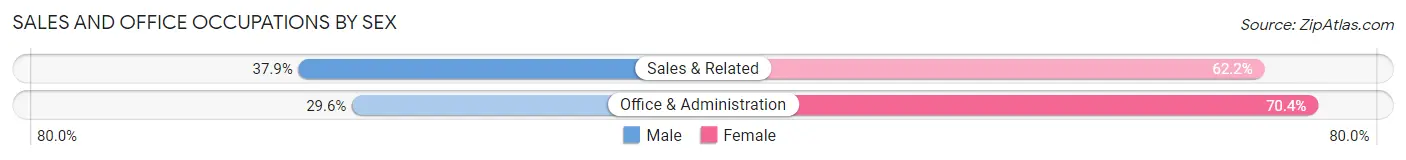
| Occupation | Male | Female |
| Sales & Related | 766 (37.9%) | 1,258 (62.2%) |
| Office & Administration | 521 (29.6%) | 1,239 (70.4%) |
| Total (Category) | 1,287 (34.0%) | 2,497 (66.0%) |
| Total (Overall) | 7,290 (48.5%) | 7,728 (51.5%) |
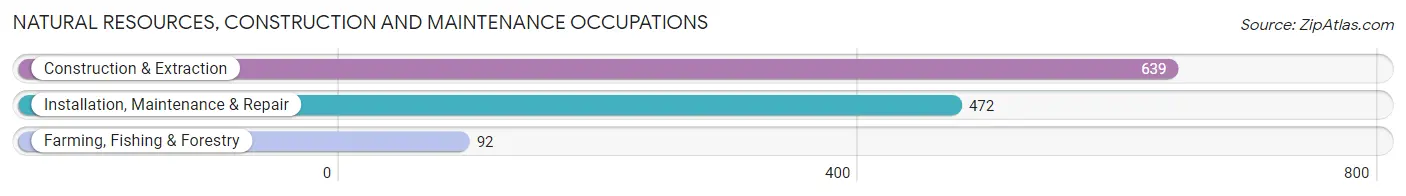
Natural Resources, Construction and Maintenance Occupations
The most common Natural Resources, Construction and Maintenance occupations in Bay City are Construction & Extraction (639 | 4.3%), Installation, Maintenance & Repair (472 | 3.1%), and Farming, Fishing & Forestry (92 | 0.6%).
Natural Resources, Construction and Maintenance Occupations by Sex
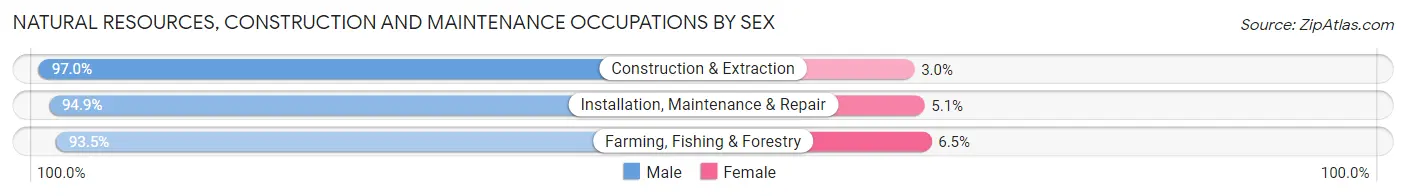
| Occupation | Male | Female |
| Farming, Fishing & Forestry | 86 (93.5%) | 6 (6.5%) |
| Construction & Extraction | 620 (97.0%) | 19 (3.0%) |
| Installation, Maintenance & Repair | 448 (94.9%) | 24 (5.1%) |
| Total (Category) | 1,154 (95.9%) | 49 (4.1%) |
| Total (Overall) | 7,290 (48.5%) | 7,728 (51.5%) |
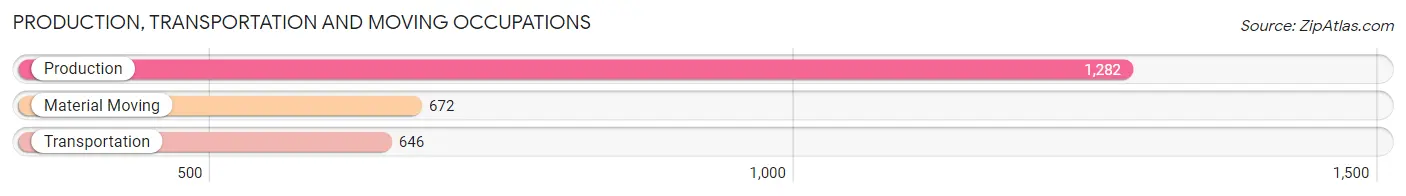
Production, Transportation and Moving Occupations
The most common Production, Transportation and Moving occupations in Bay City are Production (1,282 | 8.5%), Material Moving (672 | 4.5%), and Transportation (646 | 4.3%).
Production, Transportation and Moving Occupations by Sex
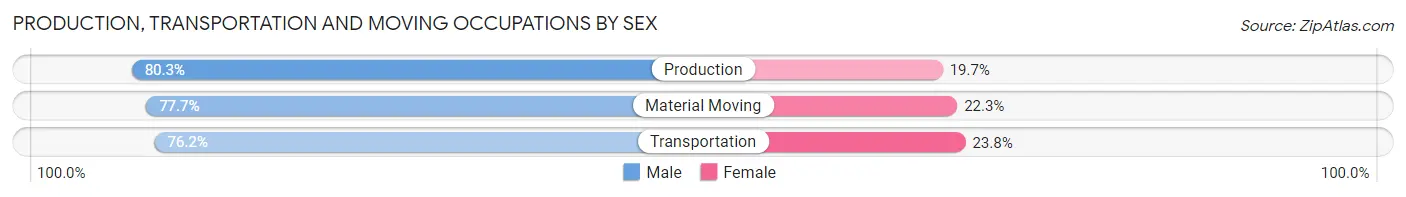
| Occupation | Male | Female |
| Production | 1,030 (80.3%) | 252 (19.7%) |
| Transportation | 492 (76.2%) | 154 (23.8%) |
| Material Moving | 522 (77.7%) | 150 (22.3%) |
| Total (Category) | 2,044 (78.6%) | 556 (21.4%) |
| Total (Overall) | 7,290 (48.5%) | 7,728 (51.5%) |
Employment Industries by Sex in Bay City
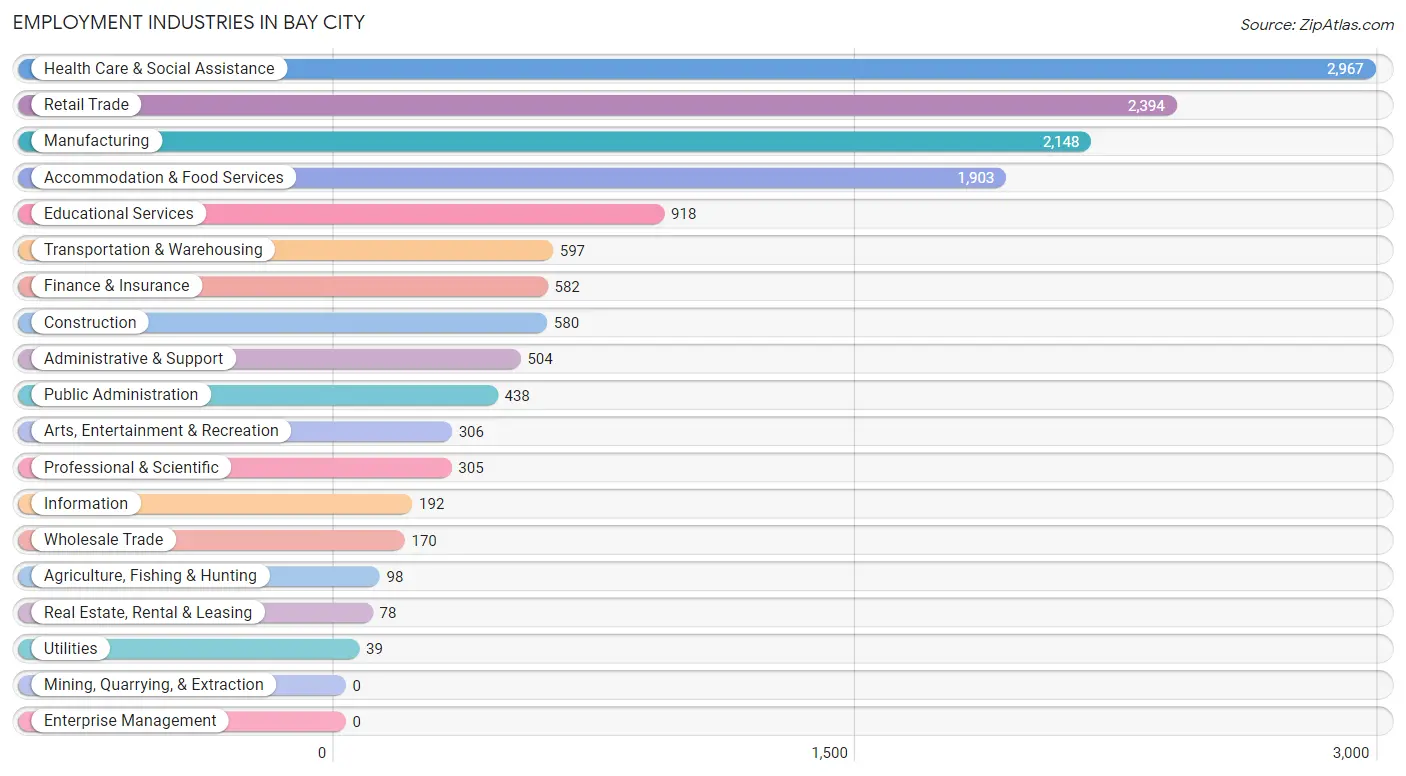
Employment Industries in Bay City
The major employment industries in Bay City include Health Care & Social Assistance (2,967 | 19.8%), Retail Trade (2,394 | 15.9%), Manufacturing (2,148 | 14.3%), Accommodation & Food Services (1,903 | 12.7%), and Educational Services (918 | 6.1%).
Employment Industries by Sex in Bay City
The Bay City industries that see more men than women are Construction (95.2%), Agriculture, Fishing & Hunting (87.8%), and Manufacturing (77.1%), whereas the industries that tend to have a higher number of women are Health Care & Social Assistance (80.9%), Educational Services (60.6%), and Public Administration (58.0%).
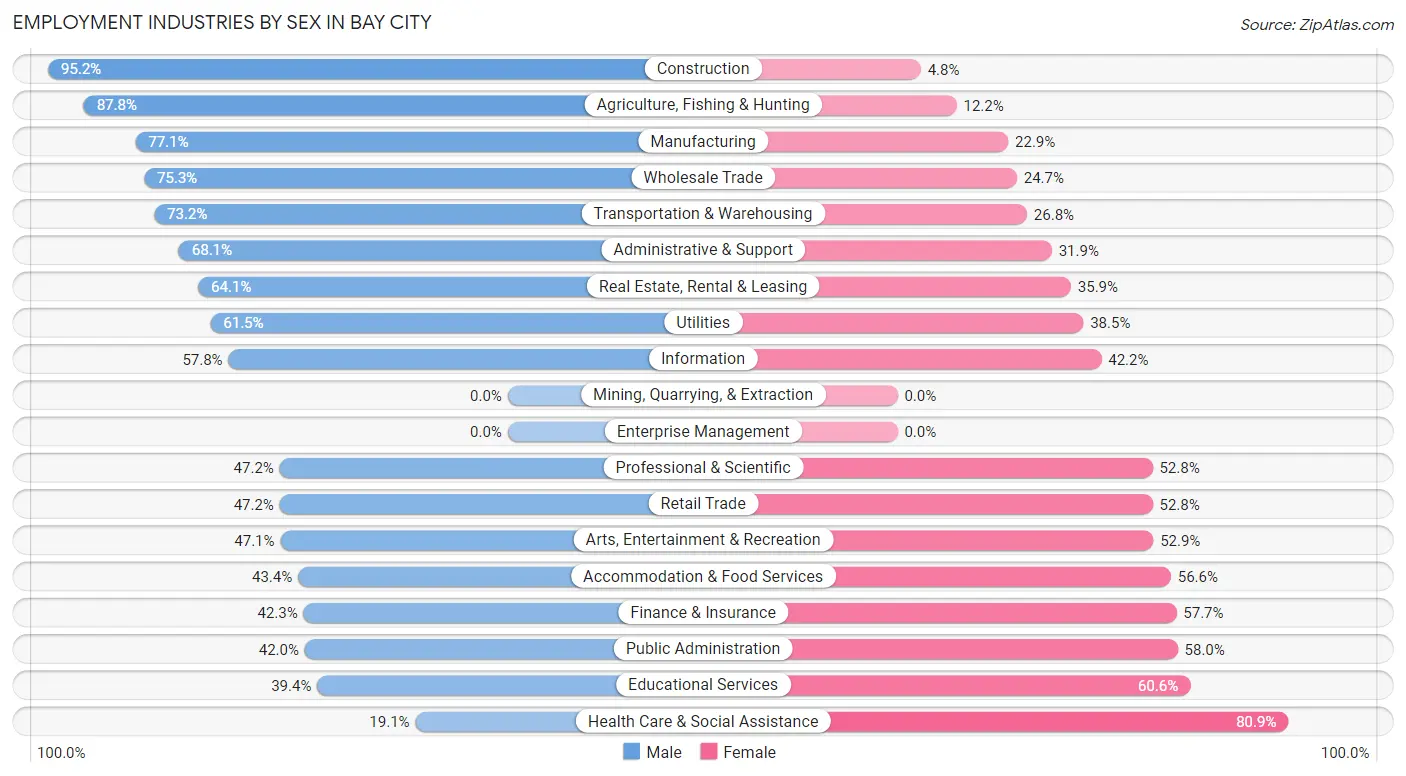
| Industry | Male | Female |
| Agriculture, Fishing & Hunting | 86 (87.8%) | 12 (12.2%) |
| Mining, Quarrying, & Extraction | 0 (0.0%) | 0 (0.0%) |
| Construction | 552 (95.2%) | 28 (4.8%) |
| Manufacturing | 1,656 (77.1%) | 492 (22.9%) |
| Wholesale Trade | 128 (75.3%) | 42 (24.7%) |
| Retail Trade | 1,130 (47.2%) | 1,264 (52.8%) |
| Transportation & Warehousing | 437 (73.2%) | 160 (26.8%) |
| Utilities | 24 (61.5%) | 15 (38.5%) |
| Information | 111 (57.8%) | 81 (42.2%) |
| Finance & Insurance | 246 (42.3%) | 336 (57.7%) |
| Real Estate, Rental & Leasing | 50 (64.1%) | 28 (35.9%) |
| Professional & Scientific | 144 (47.2%) | 161 (52.8%) |
| Enterprise Management | 0 (0.0%) | 0 (0.0%) |
| Administrative & Support | 343 (68.1%) | 161 (31.9%) |
| Educational Services | 362 (39.4%) | 556 (60.6%) |
| Health Care & Social Assistance | 567 (19.1%) | 2,400 (80.9%) |
| Arts, Entertainment & Recreation | 144 (47.1%) | 162 (52.9%) |
| Accommodation & Food Services | 826 (43.4%) | 1,077 (56.6%) |
| Public Administration | 184 (42.0%) | 254 (58.0%) |
| Total | 7,290 (48.5%) | 7,728 (51.5%) |
Education in Bay City
School Enrollment in Bay City
The most common levels of schooling among the 7,100 students in Bay City are high school (1,899 | 26.8%), middle school (1,594 | 22.5%), and elementary school (1,509 | 21.2%).
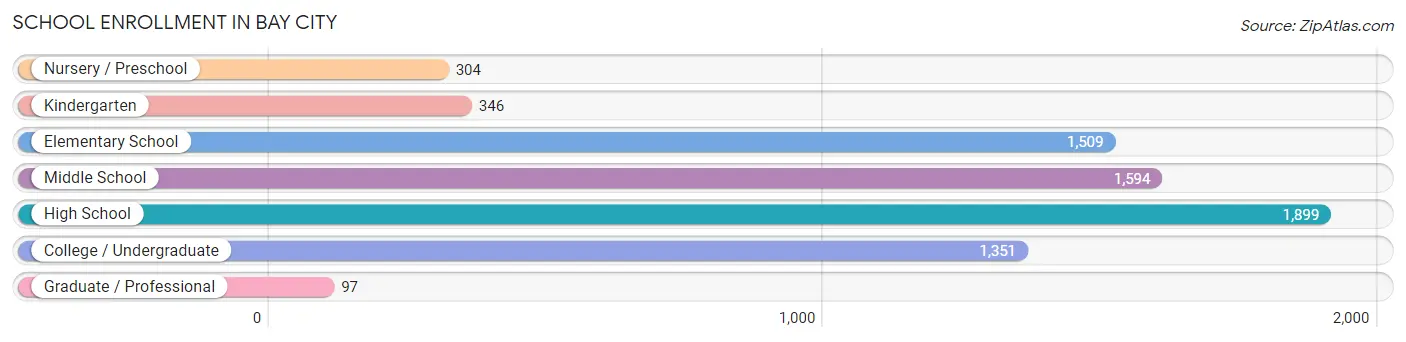
| School Level | # Students | % Students |
| Nursery / Preschool | 304 | 4.3% |
| Kindergarten | 346 | 4.9% |
| Elementary School | 1,509 | 21.2% |
| Middle School | 1,594 | 22.5% |
| High School | 1,899 | 26.8% |
| College / Undergraduate | 1,351 | 19.0% |
| Graduate / Professional | 97 | 1.4% |
| Total | 7,100 | 100.0% |
School Enrollment by Age by Funding Source in Bay City
Out of a total of 7,100 students who are enrolled in schools in Bay City, 795 (11.2%) attend a private institution, while the remaining 6,305 (88.8%) are enrolled in public schools. The age group of 3 to 4 year olds has the highest likelihood of being enrolled in private schools, with 78 (40.4% in the age bracket) enrolled. Conversely, the age group of 20 to 24 year olds has the lowest likelihood of being enrolled in a private school, with 599 (96.0% in the age bracket) attending a public institution.
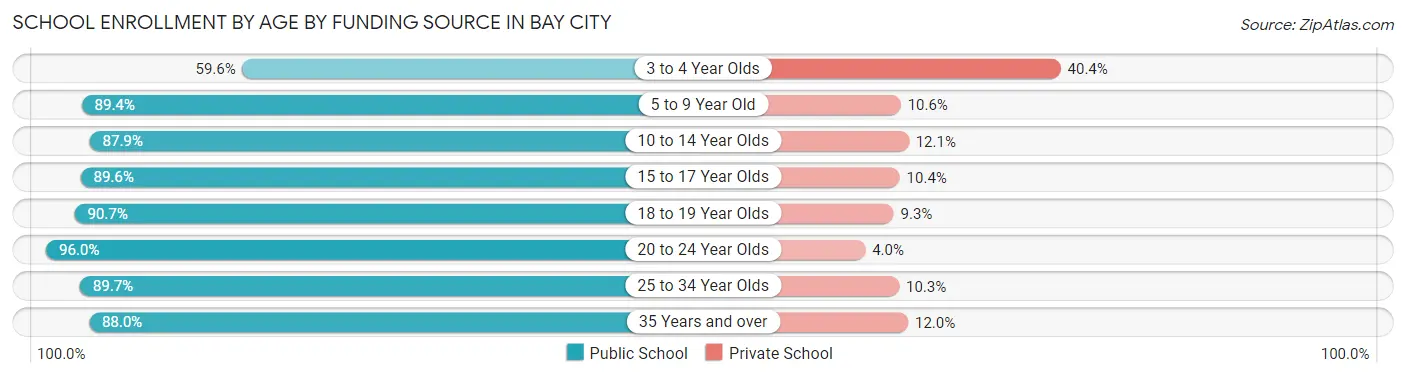
| Age Bracket | Public School | Private School |
| 3 to 4 Year Olds | 115 (59.6%) | 78 (40.4%) |
| 5 to 9 Year Old | 1,557 (89.4%) | 185 (10.6%) |
| 10 to 14 Year Olds | 1,719 (87.9%) | 237 (12.1%) |
| 15 to 17 Year Olds | 1,202 (89.6%) | 140 (10.4%) |
| 18 to 19 Year Olds | 507 (90.7%) | 52 (9.3%) |
| 20 to 24 Year Olds | 599 (96.0%) | 25 (4.0%) |
| 25 to 34 Year Olds | 374 (89.7%) | 43 (10.3%) |
| 35 Years and over | 235 (88.0%) | 32 (12.0%) |
| Total | 6,305 (88.8%) | 795 (11.2%) |
Educational Attainment by Field of Study in Bay City
Business (1,033 | 26.4%), education (522 | 13.4%), science & technology (447 | 11.4%), arts & humanities (380 | 9.7%), and bio, nature & agricultural (234 | 6.0%) are the most common fields of study among 3,911 individuals in Bay City who have obtained a bachelor's degree or higher.
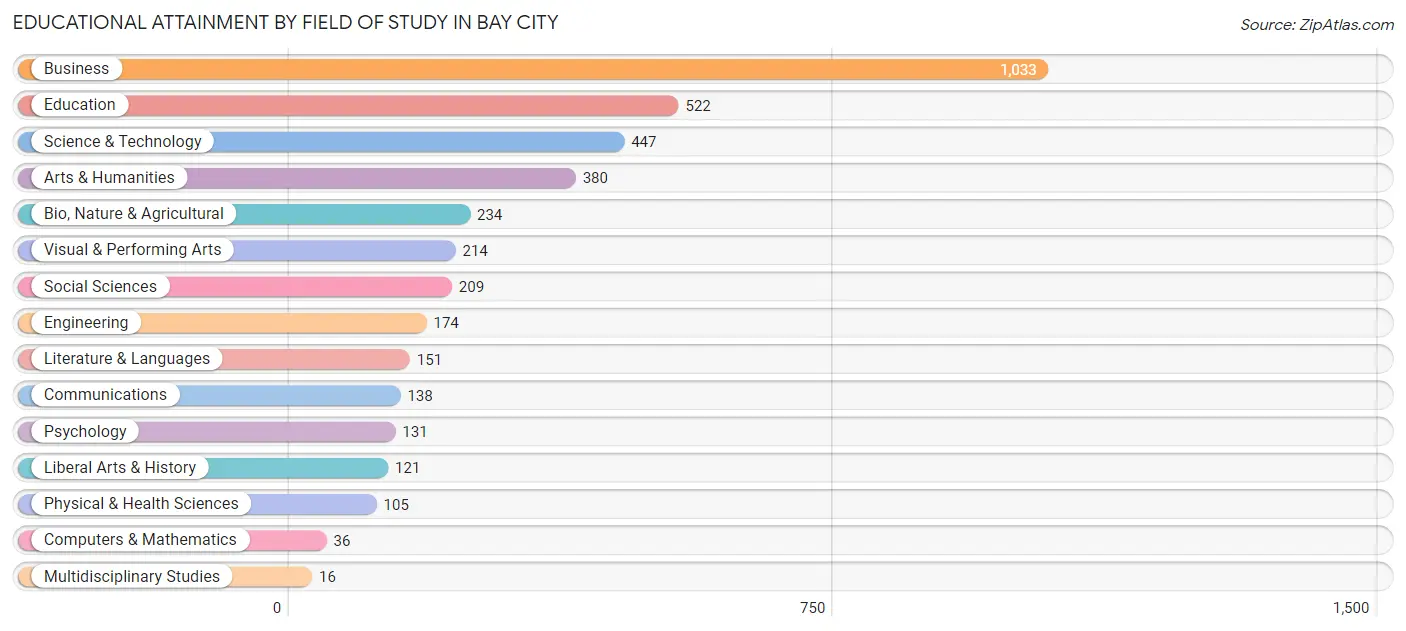
| Field of Study | # Graduates | % Graduates |
| Computers & Mathematics | 36 | 0.9% |
| Bio, Nature & Agricultural | 234 | 6.0% |
| Physical & Health Sciences | 105 | 2.7% |
| Psychology | 131 | 3.4% |
| Social Sciences | 209 | 5.3% |
| Engineering | 174 | 4.4% |
| Multidisciplinary Studies | 16 | 0.4% |
| Science & Technology | 447 | 11.4% |
| Business | 1,033 | 26.4% |
| Education | 522 | 13.4% |
| Literature & Languages | 151 | 3.9% |
| Liberal Arts & History | 121 | 3.1% |
| Visual & Performing Arts | 214 | 5.5% |
| Communications | 138 | 3.5% |
| Arts & Humanities | 380 | 9.7% |
| Total | 3,911 | 100.0% |
Transportation & Commute in Bay City
Vehicle Availability by Sex in Bay City
The most prevalent vehicle ownership categories in Bay City are males with 2 vehicles (3,012, accounting for 42.2%) and females with 2 vehicles (3,020, making up 40.6%).
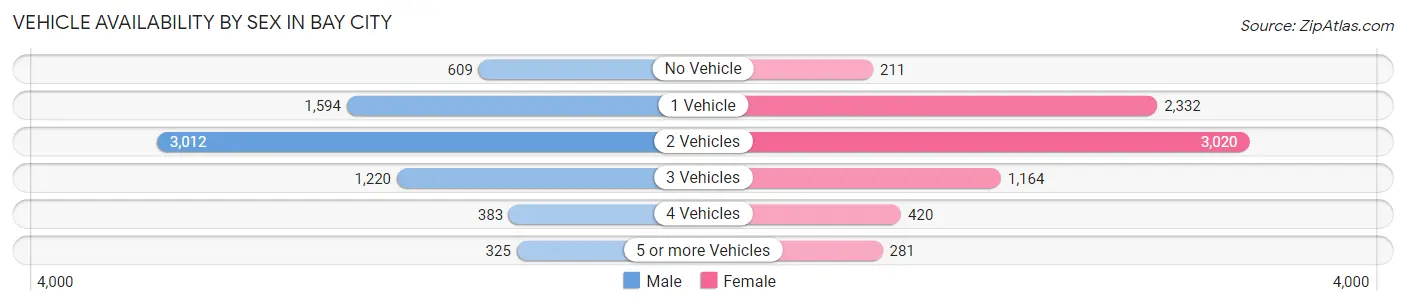
| Vehicles Available | Male | Female |
| No Vehicle | 609 (8.5%) | 211 (2.8%) |
| 1 Vehicle | 1,594 (22.3%) | 2,332 (31.4%) |
| 2 Vehicles | 3,012 (42.2%) | 3,020 (40.7%) |
| 3 Vehicles | 1,220 (17.1%) | 1,164 (15.7%) |
| 4 Vehicles | 383 (5.4%) | 420 (5.7%) |
| 5 or more Vehicles | 325 (4.5%) | 281 (3.8%) |
| Total | 7,143 (100.0%) | 7,428 (100.0%) |
Commute Time in Bay City
The most frequently occuring commute durations in Bay City are 10 to 14 minutes (2,830 commuters, 20.6%), 20 to 24 minutes (2,148 commuters, 15.7%), and 15 to 19 minutes (2,139 commuters, 15.6%).
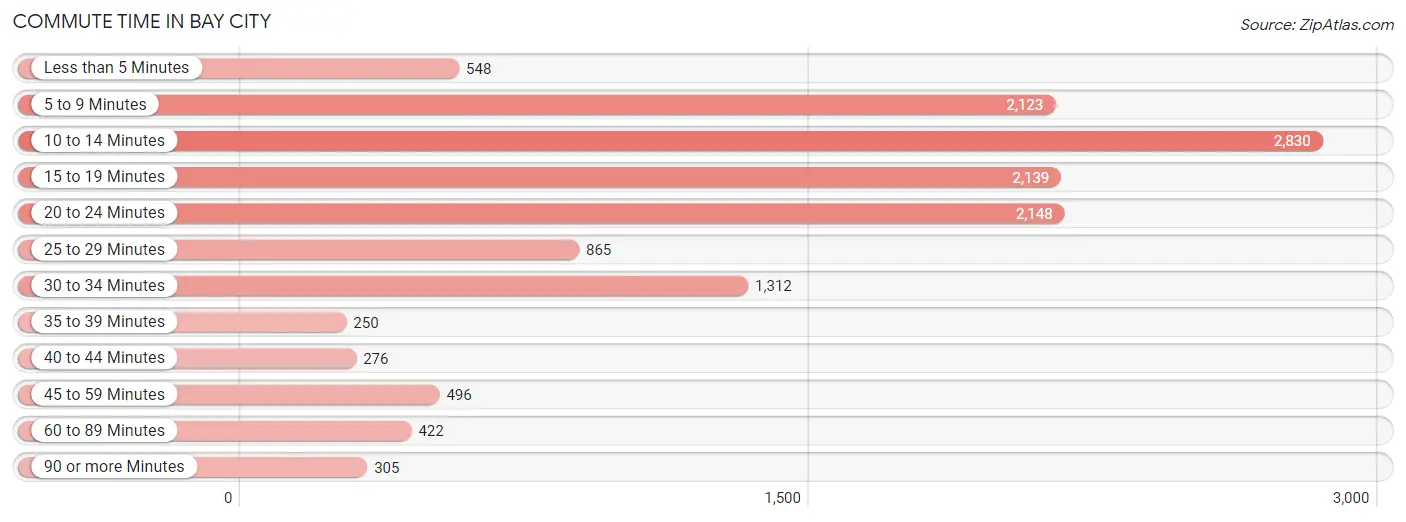
| Commute Time | # Commuters | % Commuters |
| Less than 5 Minutes | 548 | 4.0% |
| 5 to 9 Minutes | 2,123 | 15.5% |
| 10 to 14 Minutes | 2,830 | 20.6% |
| 15 to 19 Minutes | 2,139 | 15.6% |
| 20 to 24 Minutes | 2,148 | 15.7% |
| 25 to 29 Minutes | 865 | 6.3% |
| 30 to 34 Minutes | 1,312 | 9.6% |
| 35 to 39 Minutes | 250 | 1.8% |
| 40 to 44 Minutes | 276 | 2.0% |
| 45 to 59 Minutes | 496 | 3.6% |
| 60 to 89 Minutes | 422 | 3.1% |
| 90 or more Minutes | 305 | 2.2% |
Commute Time by Sex in Bay City
The most common commute times in Bay City are 10 to 14 minutes (1,151 commuters, 16.8%) for males and 10 to 14 minutes (1,679 commuters, 24.5%) for females.
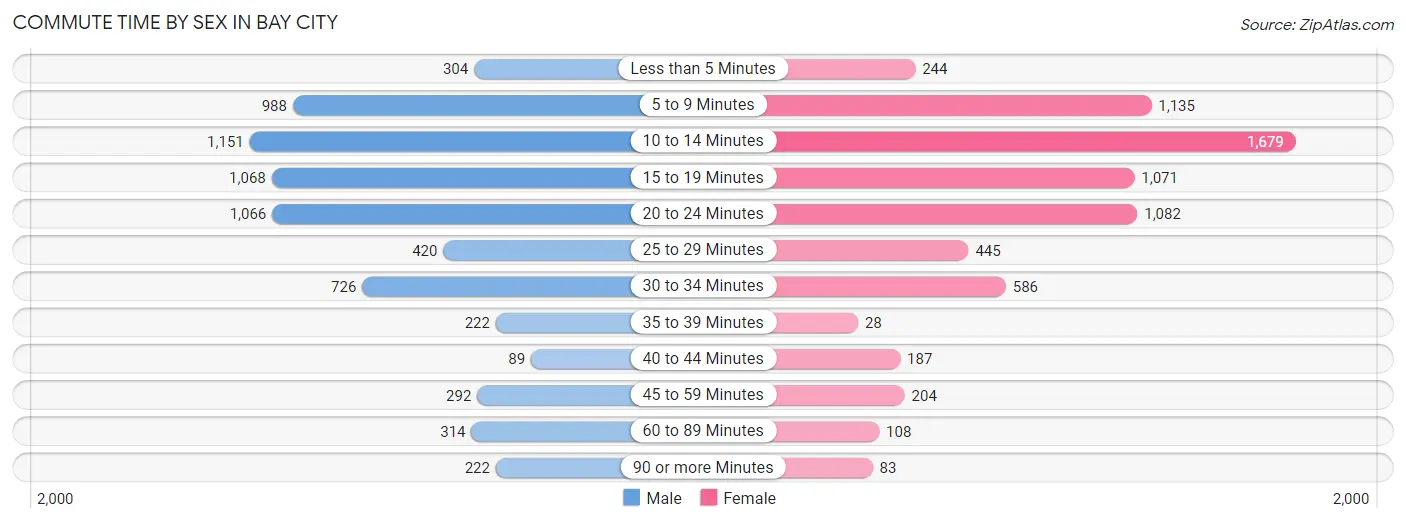
| Commute Time | Male | Female |
| Less than 5 Minutes | 304 (4.4%) | 244 (3.6%) |
| 5 to 9 Minutes | 988 (14.4%) | 1,135 (16.6%) |
| 10 to 14 Minutes | 1,151 (16.8%) | 1,679 (24.5%) |
| 15 to 19 Minutes | 1,068 (15.6%) | 1,071 (15.6%) |
| 20 to 24 Minutes | 1,066 (15.5%) | 1,082 (15.8%) |
| 25 to 29 Minutes | 420 (6.1%) | 445 (6.5%) |
| 30 to 34 Minutes | 726 (10.6%) | 586 (8.6%) |
| 35 to 39 Minutes | 222 (3.2%) | 28 (0.4%) |
| 40 to 44 Minutes | 89 (1.3%) | 187 (2.7%) |
| 45 to 59 Minutes | 292 (4.3%) | 204 (3.0%) |
| 60 to 89 Minutes | 314 (4.6%) | 108 (1.6%) |
| 90 or more Minutes | 222 (3.2%) | 83 (1.2%) |
Time of Departure to Work by Sex in Bay City
The most frequent times of departure to work in Bay City are 12:00 PM to 3:59 PM (776, 11.3%) for males and 7:30 AM to 7:59 AM (1,332, 19.4%) for females.
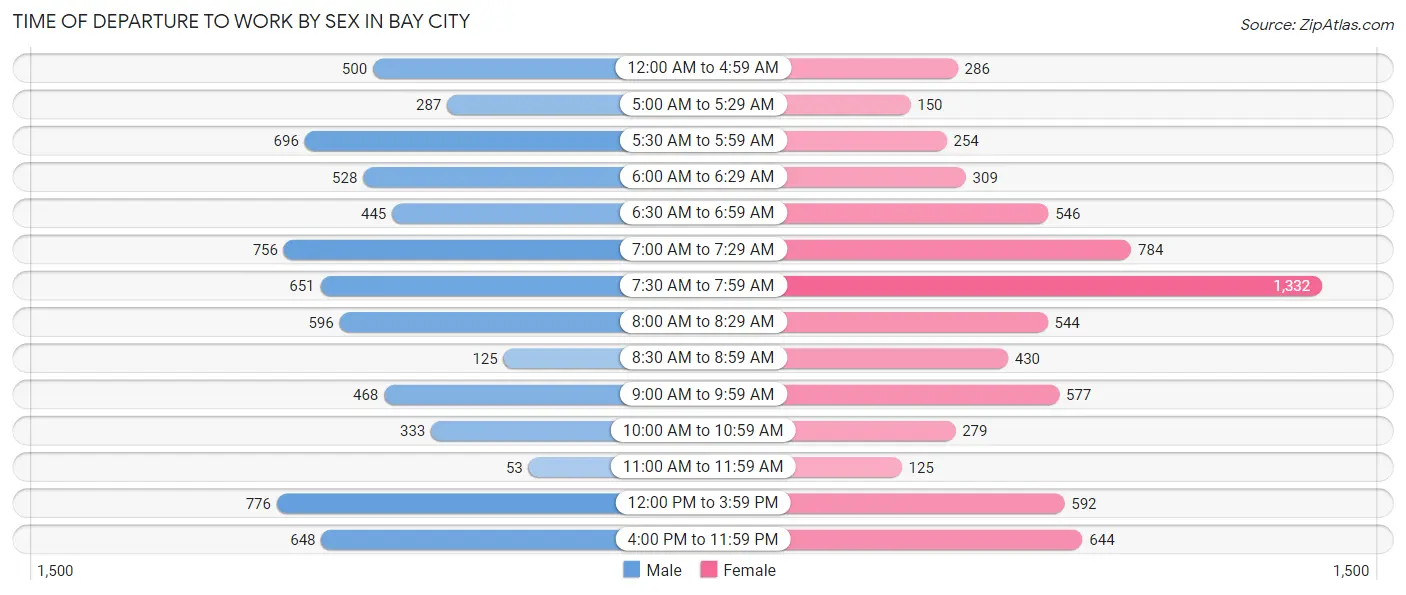
| Time of Departure | Male | Female |
| 12:00 AM to 4:59 AM | 500 (7.3%) | 286 (4.2%) |
| 5:00 AM to 5:29 AM | 287 (4.2%) | 150 (2.2%) |
| 5:30 AM to 5:59 AM | 696 (10.1%) | 254 (3.7%) |
| 6:00 AM to 6:29 AM | 528 (7.7%) | 309 (4.5%) |
| 6:30 AM to 6:59 AM | 445 (6.5%) | 546 (8.0%) |
| 7:00 AM to 7:29 AM | 756 (11.0%) | 784 (11.4%) |
| 7:30 AM to 7:59 AM | 651 (9.5%) | 1,332 (19.4%) |
| 8:00 AM to 8:29 AM | 596 (8.7%) | 544 (7.9%) |
| 8:30 AM to 8:59 AM | 125 (1.8%) | 430 (6.3%) |
| 9:00 AM to 9:59 AM | 468 (6.8%) | 577 (8.4%) |
| 10:00 AM to 10:59 AM | 333 (4.9%) | 279 (4.1%) |
| 11:00 AM to 11:59 AM | 53 (0.8%) | 125 (1.8%) |
| 12:00 PM to 3:59 PM | 776 (11.3%) | 592 (8.6%) |
| 4:00 PM to 11:59 PM | 648 (9.4%) | 644 (9.4%) |
| Total | 6,862 (100.0%) | 6,852 (100.0%) |
Housing Occupancy in Bay City
Occupancy by Ownership in Bay City
Of the total 14,379 dwellings in Bay City, owner-occupied units account for 9,650 (67.1%), while renter-occupied units make up 4,729 (32.9%).
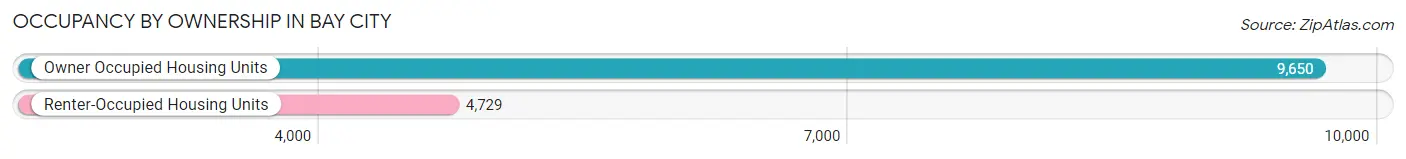
| Occupancy | # Housing Units | % Housing Units |
| Owner Occupied Housing Units | 9,650 | 67.1% |
| Renter-Occupied Housing Units | 4,729 | 32.9% |
| Total Occupied Housing Units | 14,379 | 100.0% |
Occupancy by Household Size in Bay City
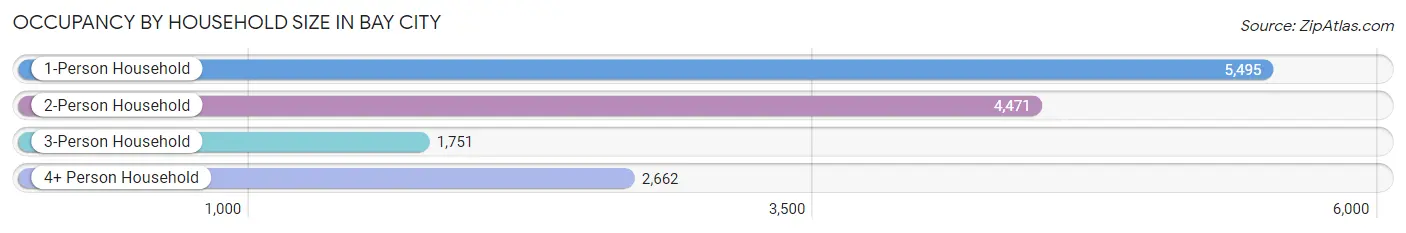
| Household Size | # Housing Units | % Housing Units |
| 1-Person Household | 5,495 | 38.2% |
| 2-Person Household | 4,471 | 31.1% |
| 3-Person Household | 1,751 | 12.2% |
| 4+ Person Household | 2,662 | 18.5% |
| Total Housing Units | 14,379 | 100.0% |
Occupancy by Ownership by Household Size in Bay City
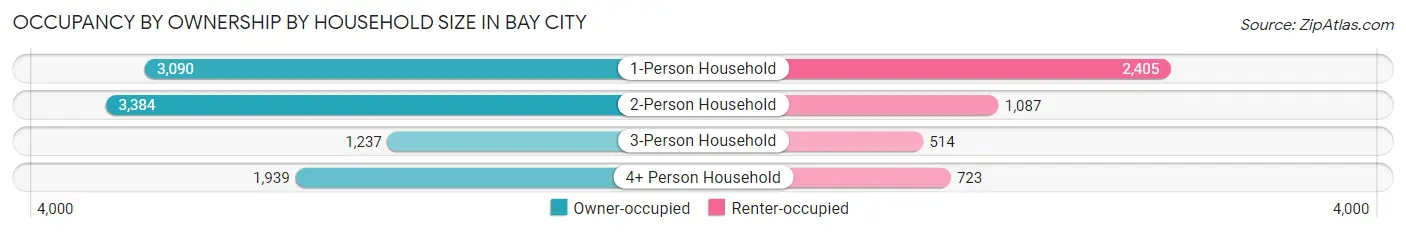
| Household Size | Owner-occupied | Renter-occupied |
| 1-Person Household | 3,090 (56.2%) | 2,405 (43.8%) |
| 2-Person Household | 3,384 (75.7%) | 1,087 (24.3%) |
| 3-Person Household | 1,237 (70.7%) | 514 (29.3%) |
| 4+ Person Household | 1,939 (72.8%) | 723 (27.2%) |
| Total Housing Units | 9,650 (67.1%) | 4,729 (32.9%) |
Occupancy by Educational Attainment in Bay City
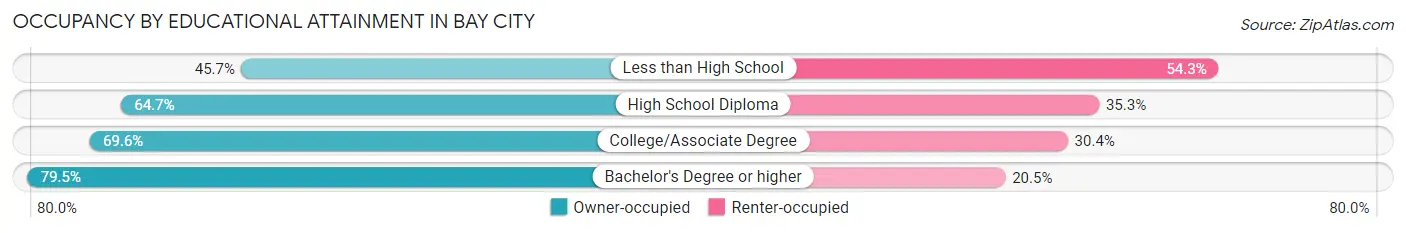
| Household Size | Owner-occupied | Renter-occupied |
| Less than High School | 725 (45.7%) | 861 (54.3%) |
| High School Diploma | 3,138 (64.7%) | 1,715 (35.3%) |
| College/Associate Degree | 3,709 (69.6%) | 1,618 (30.4%) |
| Bachelor's Degree or higher | 2,078 (79.5%) | 535 (20.5%) |
Occupancy by Age of Householder in Bay City
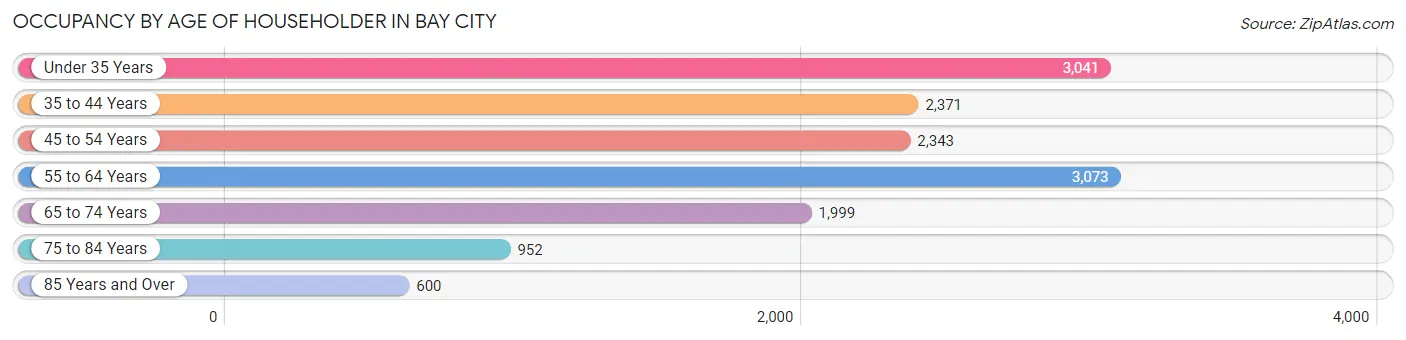
| Age Bracket | # Households | % Households |
| Under 35 Years | 3,041 | 21.1% |
| 35 to 44 Years | 2,371 | 16.5% |
| 45 to 54 Years | 2,343 | 16.3% |
| 55 to 64 Years | 3,073 | 21.4% |
| 65 to 74 Years | 1,999 | 13.9% |
| 75 to 84 Years | 952 | 6.6% |
| 85 Years and Over | 600 | 4.2% |
| Total | 14,379 | 100.0% |
Housing Finances in Bay City
Median Income by Occupancy in Bay City
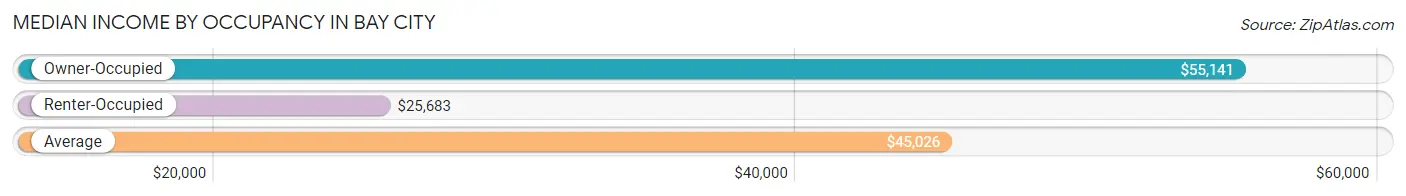
| Occupancy Type | # Households | Median Income |
| Owner-Occupied | 9,650 (67.1%) | $55,141 |
| Renter-Occupied | 4,729 (32.9%) | $25,683 |
| Average | 14,379 (100.0%) | $45,026 |
Occupancy by Householder Income Bracket in Bay City
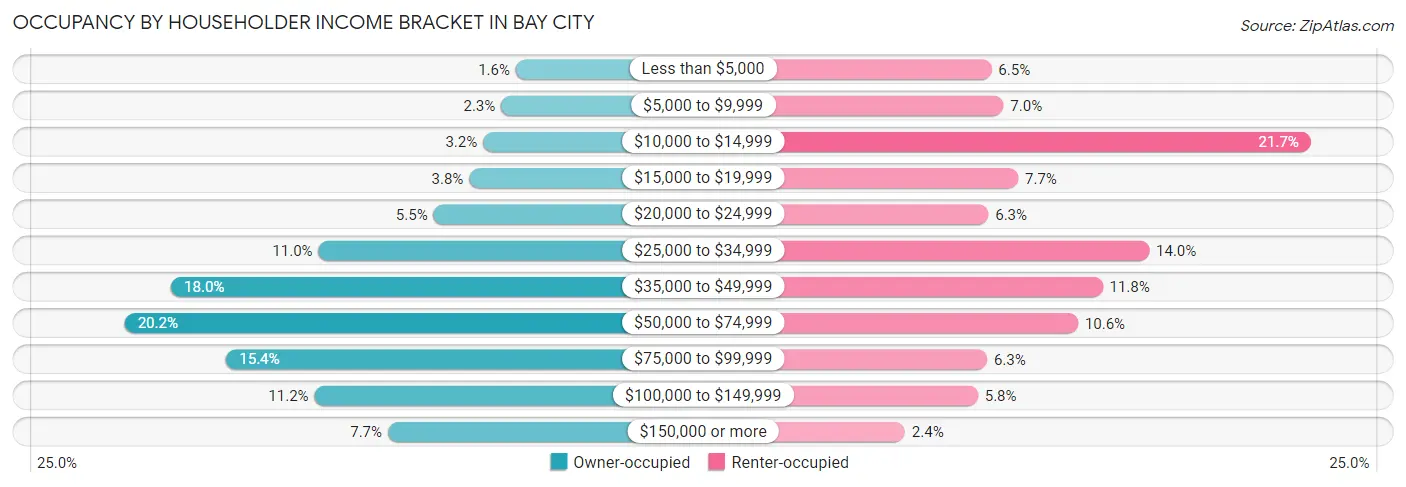
| Income Bracket | Owner-occupied | Renter-occupied |
| Less than $5,000 | 155 (1.6%) | 306 (6.5%) |
| $5,000 to $9,999 | 223 (2.3%) | 333 (7.0%) |
| $10,000 to $14,999 | 306 (3.2%) | 1,025 (21.7%) |
| $15,000 to $19,999 | 370 (3.8%) | 366 (7.7%) |
| $20,000 to $24,999 | 534 (5.5%) | 299 (6.3%) |
| $25,000 to $34,999 | 1,062 (11.0%) | 661 (14.0%) |
| $35,000 to $49,999 | 1,739 (18.0%) | 556 (11.8%) |
| $50,000 to $74,999 | 1,952 (20.2%) | 501 (10.6%) |
| $75,000 to $99,999 | 1,485 (15.4%) | 296 (6.3%) |
| $100,000 to $149,999 | 1,081 (11.2%) | 275 (5.8%) |
| $150,000 or more | 743 (7.7%) | 111 (2.4%) |
| Total | 9,650 (100.0%) | 4,729 (100.0%) |
Monthly Housing Cost Tiers in Bay City
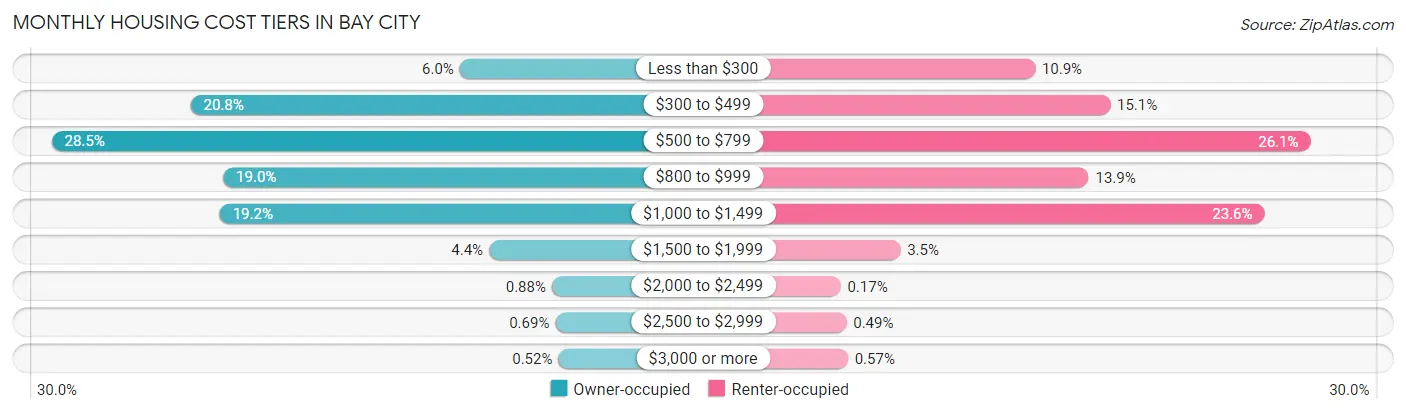
| Monthly Cost | Owner-occupied | Renter-occupied |
| Less than $300 | 576 (6.0%) | 516 (10.9%) |
| $300 to $499 | 2,010 (20.8%) | 712 (15.1%) |
| $500 to $799 | 2,751 (28.5%) | 1,235 (26.1%) |
| $800 to $999 | 1,836 (19.0%) | 656 (13.9%) |
| $1,000 to $1,499 | 1,855 (19.2%) | 1,115 (23.6%) |
| $1,500 to $1,999 | 420 (4.3%) | 164 (3.5%) |
| $2,000 to $2,499 | 85 (0.9%) | 8 (0.2%) |
| $2,500 to $2,999 | 67 (0.7%) | 23 (0.5%) |
| $3,000 or more | 50 (0.5%) | 27 (0.6%) |
| Total | 9,650 (100.0%) | 4,729 (100.0%) |
Physical Housing Characteristics in Bay City
Housing Structures in Bay City
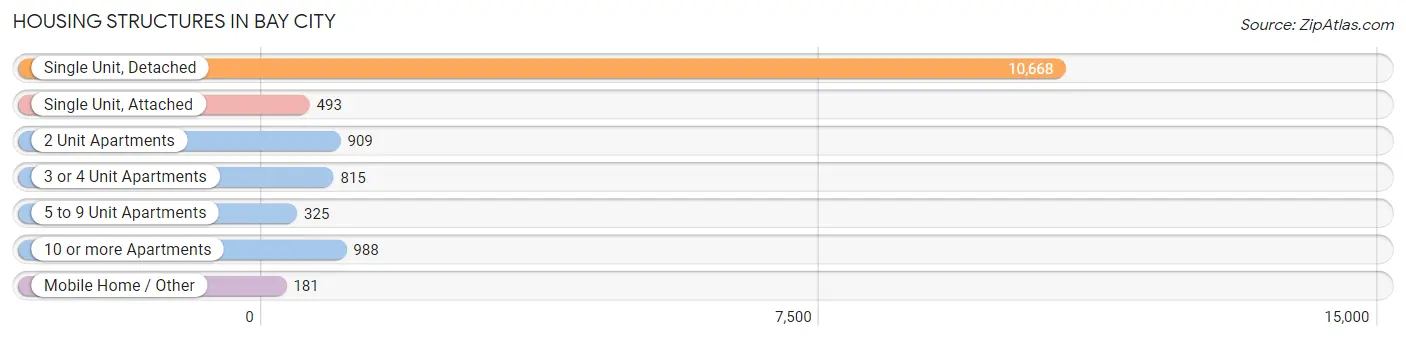
| Structure Type | # Housing Units | % Housing Units |
| Single Unit, Detached | 10,668 | 74.2% |
| Single Unit, Attached | 493 | 3.4% |
| 2 Unit Apartments | 909 | 6.3% |
| 3 or 4 Unit Apartments | 815 | 5.7% |
| 5 to 9 Unit Apartments | 325 | 2.3% |
| 10 or more Apartments | 988 | 6.9% |
| Mobile Home / Other | 181 | 1.3% |
| Total | 14,379 | 100.0% |
Housing Structures by Occupancy in Bay City
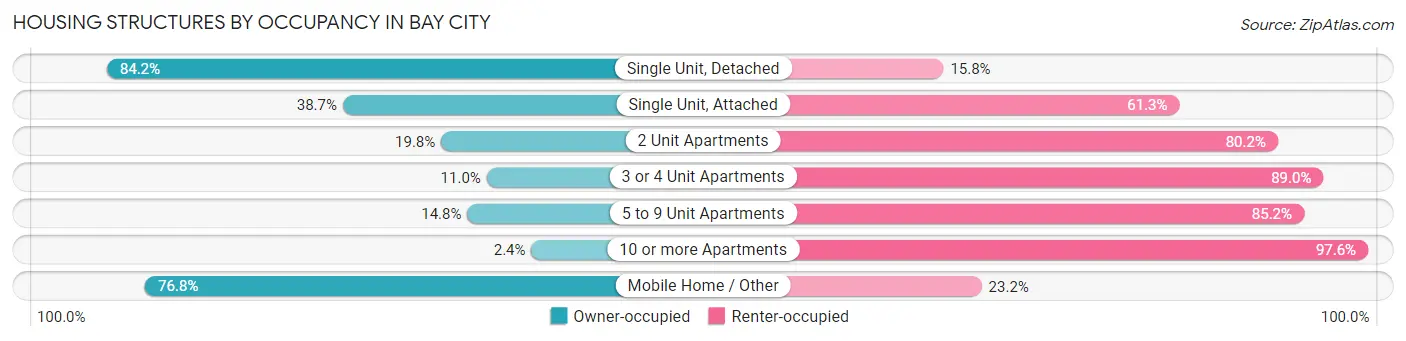
| Structure Type | Owner-occupied | Renter-occupied |
| Single Unit, Detached | 8,978 (84.2%) | 1,690 (15.8%) |
| Single Unit, Attached | 191 (38.7%) | 302 (61.3%) |
| 2 Unit Apartments | 180 (19.8%) | 729 (80.2%) |
| 3 or 4 Unit Apartments | 90 (11.0%) | 725 (89.0%) |
| 5 to 9 Unit Apartments | 48 (14.8%) | 277 (85.2%) |
| 10 or more Apartments | 24 (2.4%) | 964 (97.6%) |
| Mobile Home / Other | 139 (76.8%) | 42 (23.2%) |
| Total | 9,650 (67.1%) | 4,729 (32.9%) |
Housing Structures by Number of Rooms in Bay City
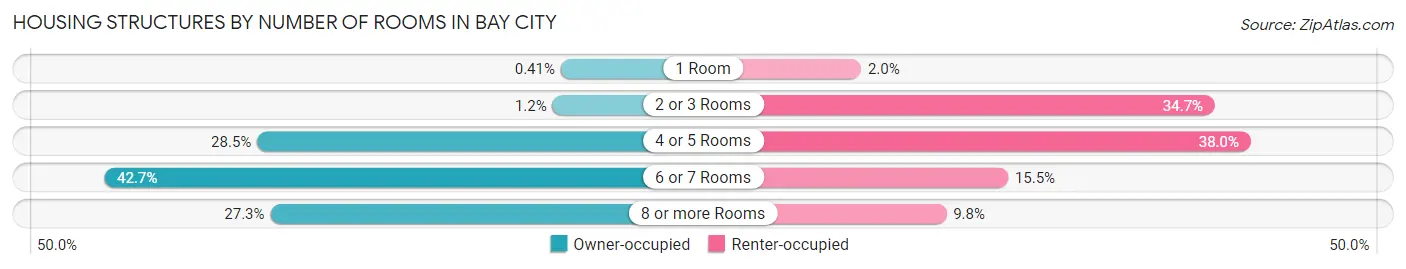
| Number of Rooms | Owner-occupied | Renter-occupied |
| 1 Room | 40 (0.4%) | 92 (1.9%) |
| 2 or 3 Rooms | 113 (1.2%) | 1,640 (34.7%) |
| 4 or 5 Rooms | 2,749 (28.5%) | 1,797 (38.0%) |
| 6 or 7 Rooms | 4,116 (42.6%) | 735 (15.5%) |
| 8 or more Rooms | 2,632 (27.3%) | 465 (9.8%) |
| Total | 9,650 (100.0%) | 4,729 (100.0%) |
Housing Structure by Heating Type in Bay City
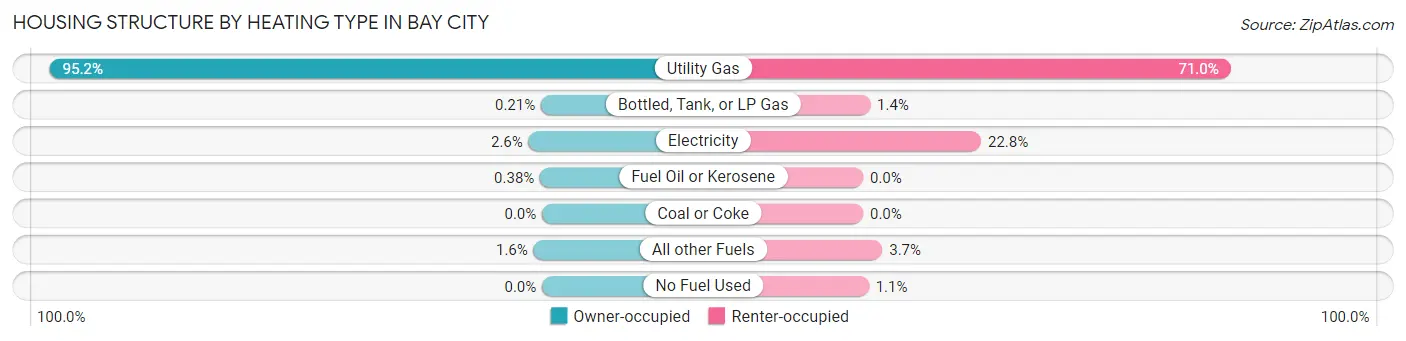
| Heating Type | Owner-occupied | Renter-occupied |
| Utility Gas | 9,183 (95.2%) | 3,358 (71.0%) |
| Bottled, Tank, or LP Gas | 20 (0.2%) | 65 (1.4%) |
| Electricity | 252 (2.6%) | 1,078 (22.8%) |
| Fuel Oil or Kerosene | 37 (0.4%) | 0 (0.0%) |
| Coal or Coke | 0 (0.0%) | 0 (0.0%) |
| All other Fuels | 158 (1.6%) | 176 (3.7%) |
| No Fuel Used | 0 (0.0%) | 52 (1.1%) |
| Total | 9,650 (100.0%) | 4,729 (100.0%) |
Household Vehicle Usage in Bay City
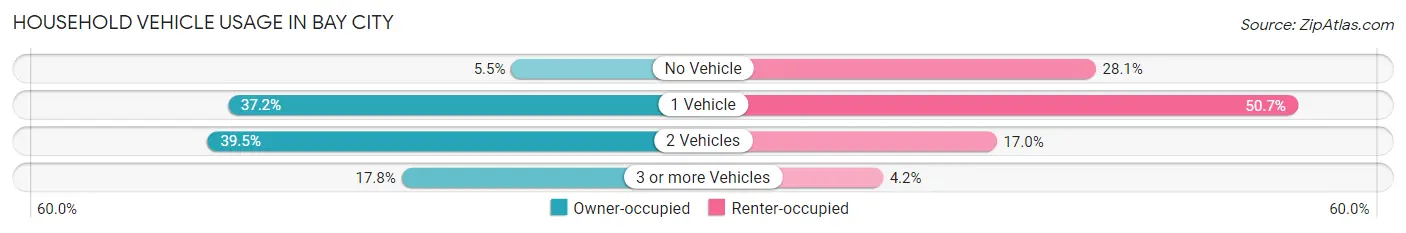
| Vehicles per Household | Owner-occupied | Renter-occupied |
| No Vehicle | 529 (5.5%) | 1,328 (28.1%) |
| 1 Vehicle | 3,593 (37.2%) | 2,398 (50.7%) |
| 2 Vehicles | 3,813 (39.5%) | 803 (17.0%) |
| 3 or more Vehicles | 1,715 (17.8%) | 200 (4.2%) |
| Total | 9,650 (100.0%) | 4,729 (100.0%) |
Real Estate & Mortgages in Bay City
Real Estate and Mortgage Overview in Bay City
| Characteristic | Without Mortgage | With Mortgage |
| Housing Units | 4,710 | 4,940 |
| Median Property Value | $79,100 | $85,700 |
| Median Household Income | $45,990 | $484 |
| Monthly Housing Costs | $487 | $45 |
| Real Estate Taxes | $1,679 | $203 |
Property Value by Mortgage Status in Bay City
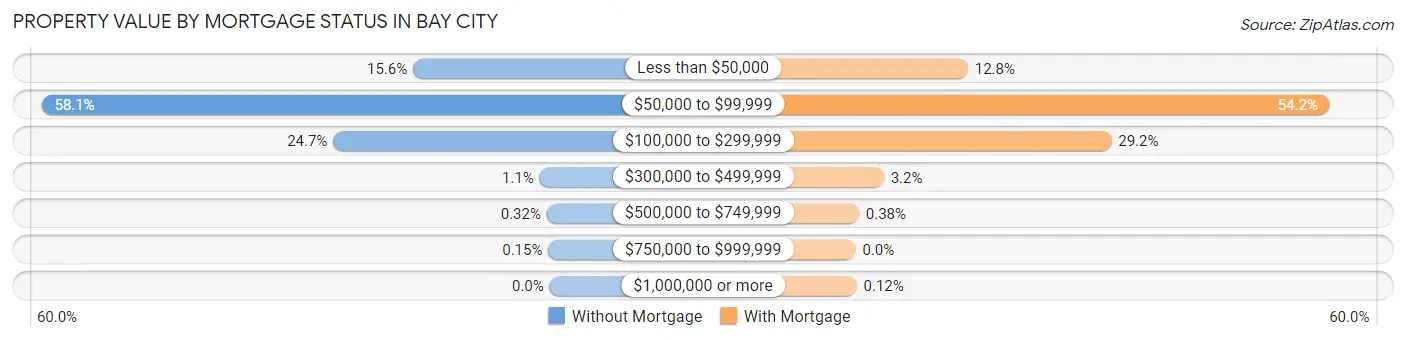
| Property Value | Without Mortgage | With Mortgage |
| Less than $50,000 | 735 (15.6%) | 634 (12.8%) |
| $50,000 to $99,999 | 2,735 (58.1%) | 2,678 (54.2%) |
| $100,000 to $299,999 | 1,165 (24.7%) | 1,444 (29.2%) |
| $300,000 to $499,999 | 53 (1.1%) | 159 (3.2%) |
| $500,000 to $749,999 | 15 (0.3%) | 19 (0.4%) |
| $750,000 to $999,999 | 7 (0.2%) | 0 (0.0%) |
| $1,000,000 or more | 0 (0.0%) | 6 (0.1%) |
| Total | 4,710 (100.0%) | 4,940 (100.0%) |
Household Income by Mortgage Status in Bay City
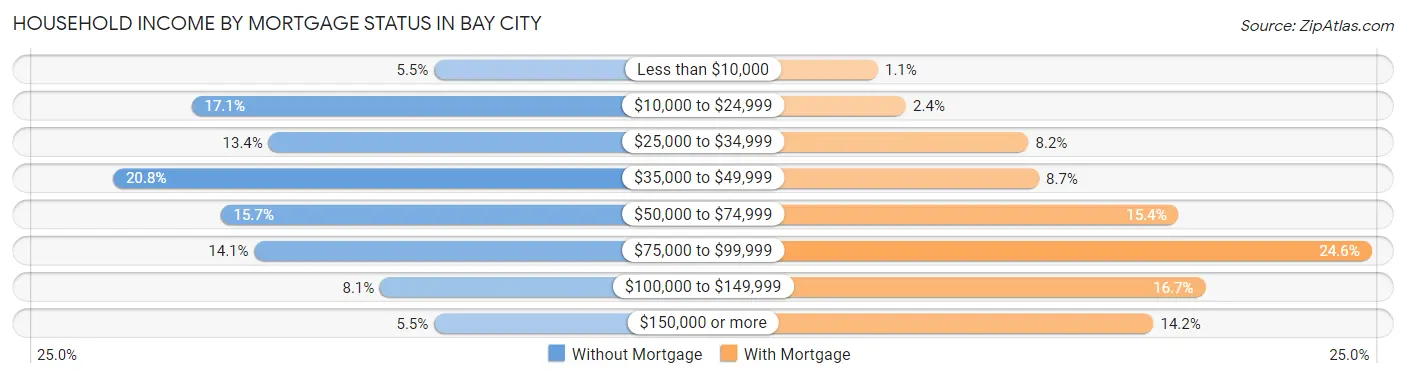
| Household Income | Without Mortgage | With Mortgage |
| Less than $10,000 | 259 (5.5%) | 53 (1.1%) |
| $10,000 to $24,999 | 803 (17.1%) | 119 (2.4%) |
| $25,000 to $34,999 | 630 (13.4%) | 407 (8.2%) |
| $35,000 to $49,999 | 979 (20.8%) | 432 (8.7%) |
| $50,000 to $74,999 | 738 (15.7%) | 760 (15.4%) |
| $75,000 to $99,999 | 662 (14.1%) | 1,214 (24.6%) |
| $100,000 to $149,999 | 380 (8.1%) | 823 (16.7%) |
| $150,000 or more | 259 (5.5%) | 701 (14.2%) |
| Total | 4,710 (100.0%) | 4,940 (100.0%) |
Property Value to Household Income Ratio in Bay City
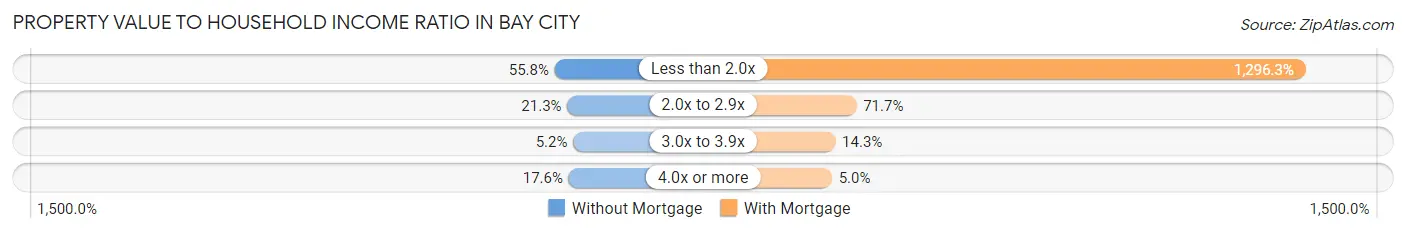
| Value-to-Income Ratio | Without Mortgage | With Mortgage |
| Less than 2.0x | 2,626 (55.7%) | 64,038 (1,296.3%) |
| 2.0x to 2.9x | 1,001 (21.2%) | 3,540 (71.7%) |
| 3.0x to 3.9x | 246 (5.2%) | 705 (14.3%) |
| 4.0x or more | 829 (17.6%) | 246 (5.0%) |
| Total | 4,710 (100.0%) | 4,940 (100.0%) |
Real Estate Taxes by Mortgage Status in Bay City
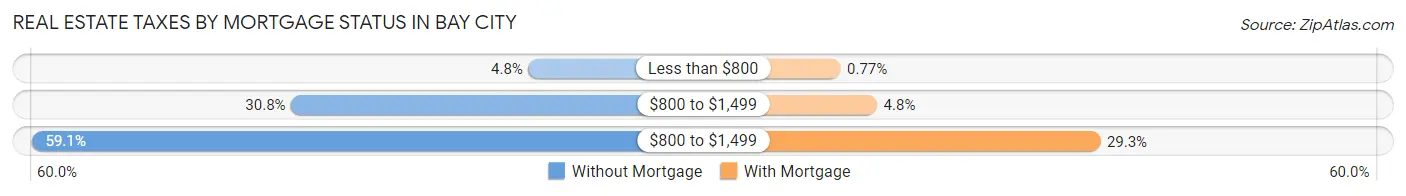
| Property Taxes | Without Mortgage | With Mortgage |
| Less than $800 | 224 (4.8%) | 38 (0.8%) |
| $800 to $1,499 | 1,449 (30.8%) | 236 (4.8%) |
| $800 to $1,499 | 2,785 (59.1%) | 1,445 (29.2%) |
| Total | 4,710 (100.0%) | 4,940 (100.0%) |
Health & Disability in Bay City
Health Insurance Coverage by Age in Bay City
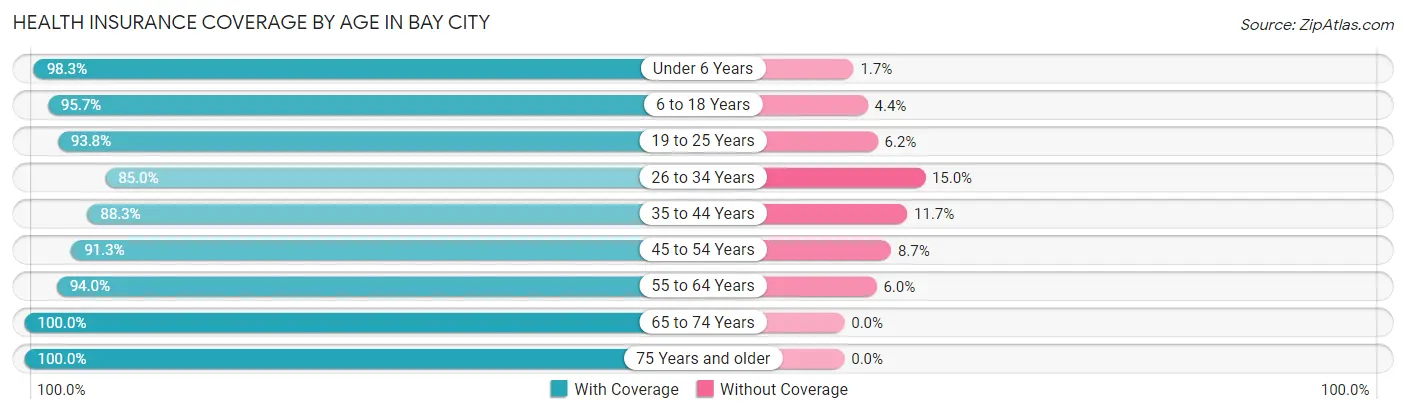
| Age Bracket | With Coverage | Without Coverage |
| Under 6 Years | 2,011 (98.3%) | 35 (1.7%) |
| 6 to 18 Years | 5,166 (95.7%) | 235 (4.3%) |
| 19 to 25 Years | 2,928 (93.8%) | 194 (6.2%) |
| 26 to 34 Years | 3,333 (85.0%) | 590 (15.0%) |
| 35 to 44 Years | 3,664 (88.3%) | 486 (11.7%) |
| 45 to 54 Years | 3,820 (91.3%) | 364 (8.7%) |
| 55 to 64 Years | 4,342 (94.0%) | 277 (6.0%) |
| 65 to 74 Years | 3,004 (100.0%) | 0 (0.0%) |
| 75 Years and older | 1,974 (100.0%) | 0 (0.0%) |
| Total | 30,242 (93.3%) | 2,181 (6.7%) |
Health Insurance Coverage by Citizenship Status in Bay City
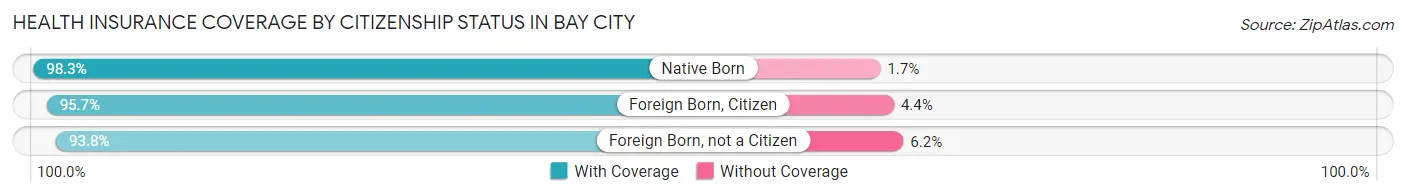
| Citizenship Status | With Coverage | Without Coverage |
| Native Born | 2,011 (98.3%) | 35 (1.7%) |
| Foreign Born, Citizen | 5,166 (95.7%) | 235 (4.3%) |
| Foreign Born, not a Citizen | 2,928 (93.8%) | 194 (6.2%) |
Health Insurance Coverage by Household Income in Bay City
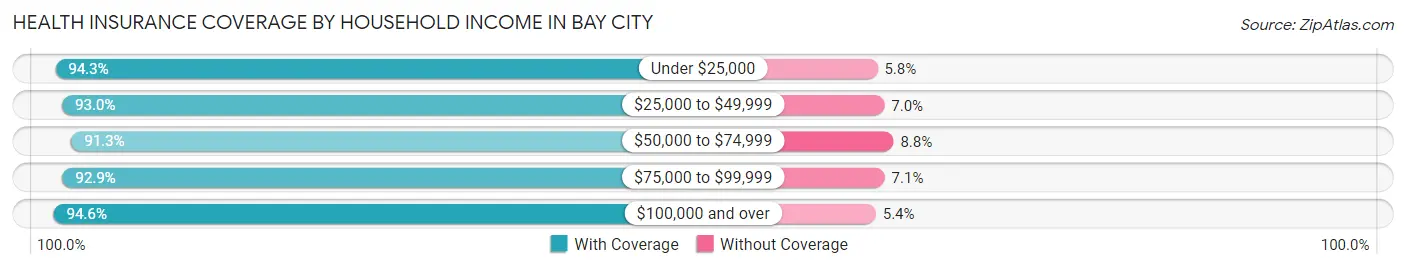
| Household Income | With Coverage | Without Coverage |
| Under $25,000 | 6,066 (94.3%) | 370 (5.8%) |
| $25,000 to $49,999 | 7,845 (93.0%) | 594 (7.0%) |
| $50,000 to $74,999 | 5,430 (91.2%) | 521 (8.7%) |
| $75,000 to $99,999 | 4,167 (92.9%) | 318 (7.1%) |
| $100,000 and over | 6,581 (94.6%) | 378 (5.4%) |
Public vs Private Health Insurance Coverage by Age in Bay City
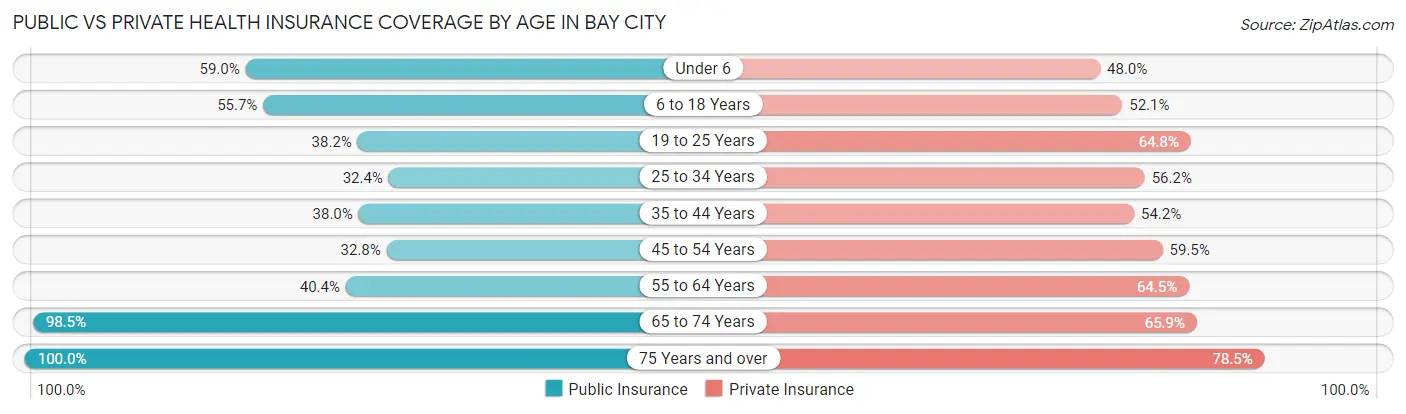
| Age Bracket | Public Insurance | Private Insurance |
| Under 6 | 1,207 (59.0%) | 981 (47.9%) |
| 6 to 18 Years | 3,009 (55.7%) | 2,812 (52.1%) |
| 19 to 25 Years | 1,192 (38.2%) | 2,022 (64.8%) |
| 25 to 34 Years | 1,272 (32.4%) | 2,206 (56.2%) |
| 35 to 44 Years | 1,577 (38.0%) | 2,251 (54.2%) |
| 45 to 54 Years | 1,373 (32.8%) | 2,491 (59.5%) |
| 55 to 64 Years | 1,865 (40.4%) | 2,977 (64.4%) |
| 65 to 74 Years | 2,958 (98.5%) | 1,979 (65.9%) |
| 75 Years and over | 1,973 (100.0%) | 1,549 (78.5%) |
| Total | 16,426 (50.7%) | 19,268 (59.4%) |
Disability Status by Sex by Age in Bay City
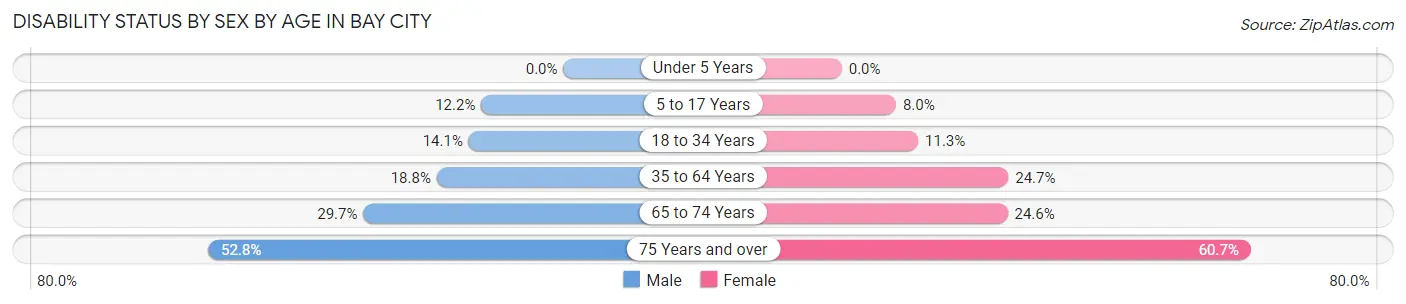
| Age Bracket | Male | Female |
| Under 5 Years | 0 (0.0%) | 0 (0.0%) |
| 5 to 17 Years | 313 (12.2%) | 220 (8.0%) |
| 18 to 34 Years | 509 (14.1%) | 440 (11.3%) |
| 35 to 64 Years | 1,148 (18.8%) | 1,693 (24.7%) |
| 65 to 74 Years | 459 (29.7%) | 359 (24.6%) |
| 75 Years and over | 382 (52.8%) | 759 (60.7%) |
Disability Class by Sex by Age in Bay City
Disability Class: Hearing Difficulty
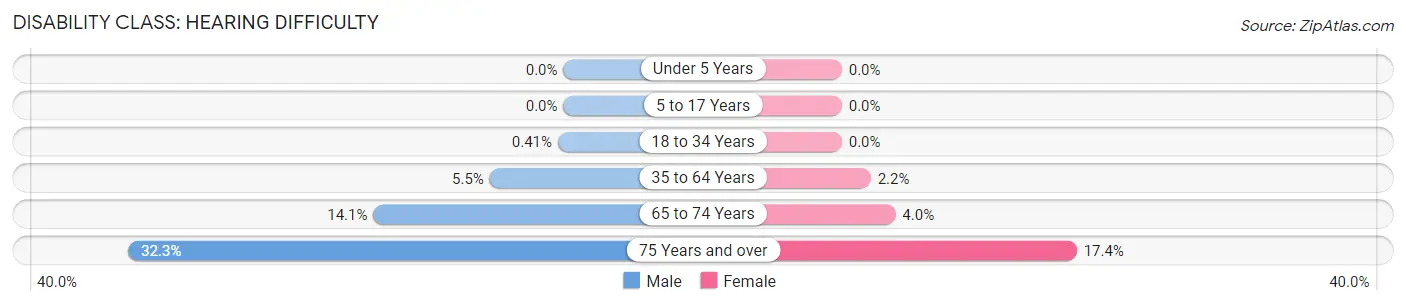
| Age Bracket | Male | Female |
| Under 5 Years | 0 (0.0%) | 0 (0.0%) |
| 5 to 17 Years | 0 (0.0%) | 0 (0.0%) |
| 18 to 34 Years | 15 (0.4%) | 0 (0.0%) |
| 35 to 64 Years | 334 (5.5%) | 147 (2.1%) |
| 65 to 74 Years | 218 (14.1%) | 58 (4.0%) |
| 75 Years and over | 234 (32.3%) | 218 (17.4%) |
Disability Class: Vision Difficulty
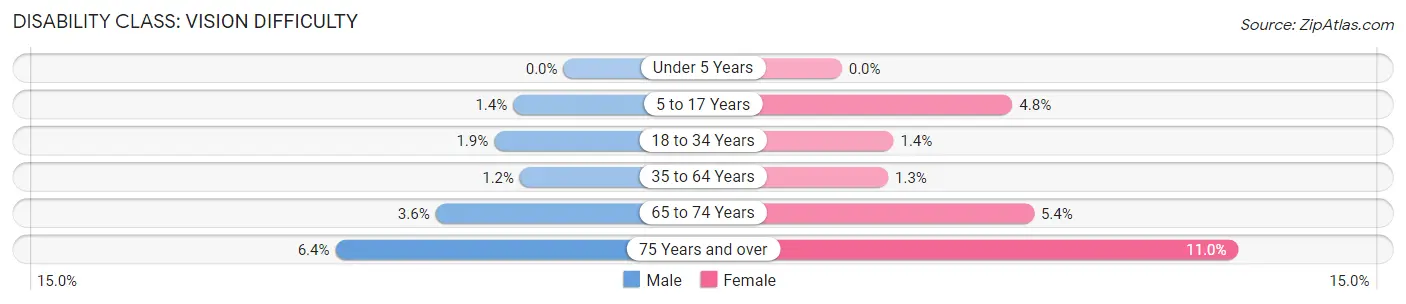
| Age Bracket | Male | Female |
| Under 5 Years | 0 (0.0%) | 0 (0.0%) |
| 5 to 17 Years | 36 (1.4%) | 130 (4.8%) |
| 18 to 34 Years | 70 (1.9%) | 56 (1.4%) |
| 35 to 64 Years | 74 (1.2%) | 88 (1.3%) |
| 65 to 74 Years | 55 (3.6%) | 78 (5.3%) |
| 75 Years and over | 46 (6.4%) | 138 (11.0%) |
Disability Class: Cognitive Difficulty
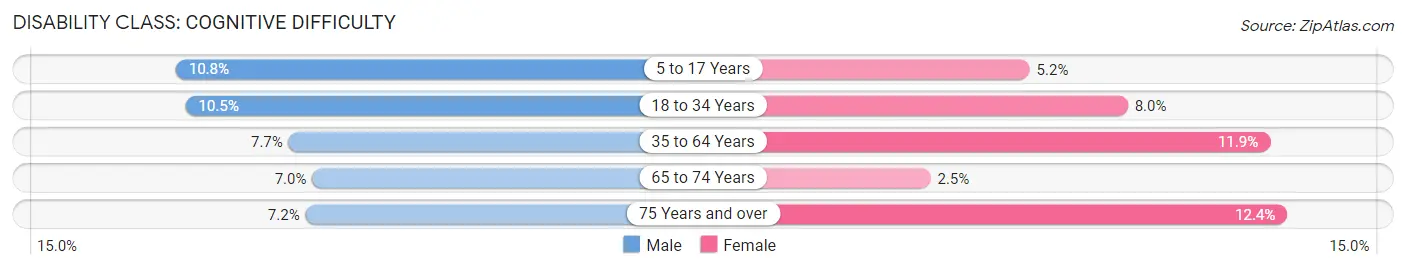
| Age Bracket | Male | Female |
| 5 to 17 Years | 277 (10.8%) | 143 (5.2%) |
| 18 to 34 Years | 381 (10.5%) | 309 (8.0%) |
| 35 to 64 Years | 467 (7.6%) | 816 (11.9%) |
| 65 to 74 Years | 108 (7.0%) | 36 (2.5%) |
| 75 Years and over | 52 (7.2%) | 155 (12.4%) |
Disability Class: Ambulatory Difficulty
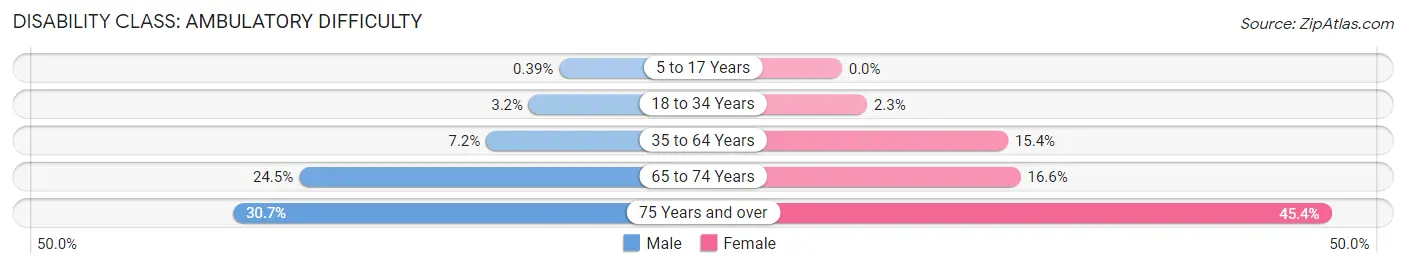
| Age Bracket | Male | Female |
| 5 to 17 Years | 10 (0.4%) | 0 (0.0%) |
| 18 to 34 Years | 116 (3.2%) | 91 (2.3%) |
| 35 to 64 Years | 438 (7.2%) | 1,056 (15.4%) |
| 65 to 74 Years | 379 (24.5%) | 242 (16.6%) |
| 75 Years and over | 222 (30.7%) | 568 (45.4%) |
Disability Class: Self-Care Difficulty
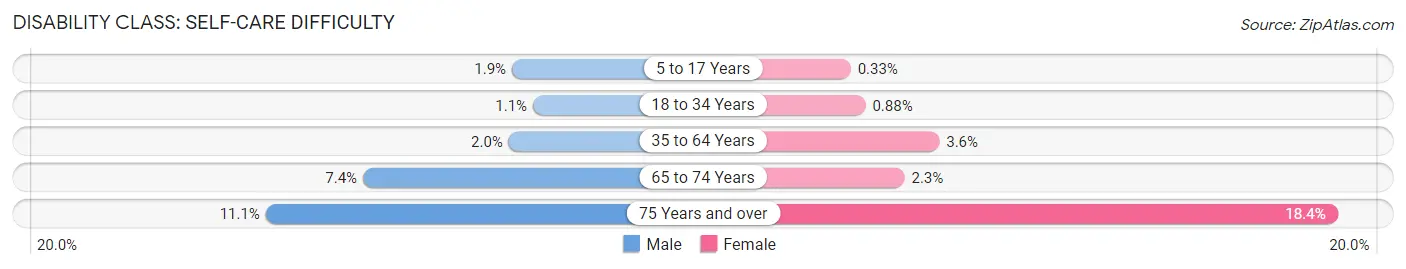
| Age Bracket | Male | Female |
| 5 to 17 Years | 49 (1.9%) | 9 (0.3%) |
| 18 to 34 Years | 41 (1.1%) | 34 (0.9%) |
| 35 to 64 Years | 124 (2.0%) | 248 (3.6%) |
| 65 to 74 Years | 115 (7.4%) | 34 (2.3%) |
| 75 Years and over | 80 (11.1%) | 230 (18.4%) |
Technology Access in Bay City
Computing Device Access in Bay City
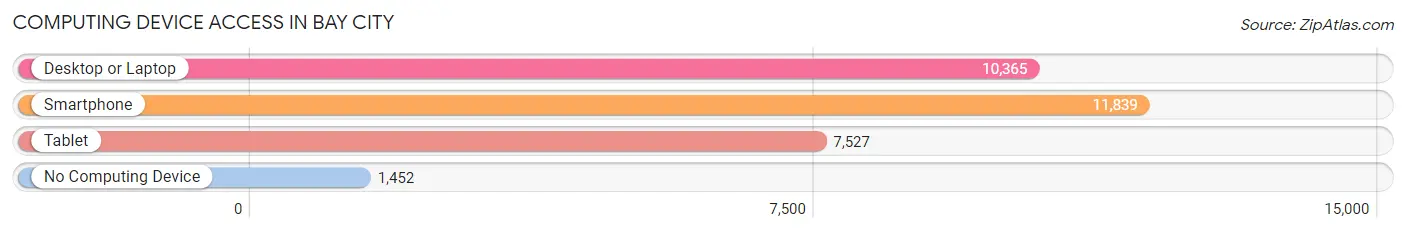
| Device Type | # Households | % Households |
| Desktop or Laptop | 10,365 | 72.1% |
| Smartphone | 11,839 | 82.3% |
| Tablet | 7,527 | 52.3% |
| No Computing Device | 1,452 | 10.1% |
| Total | 14,379 | 100.0% |
Internet Access in Bay City
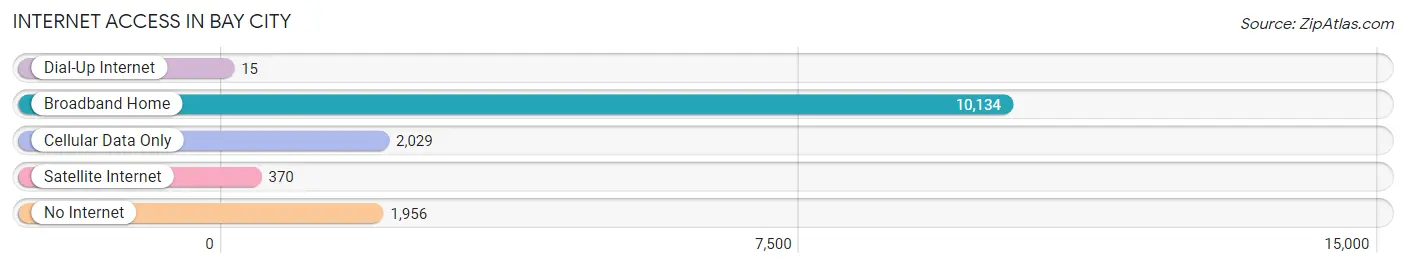
| Internet Type | # Households | % Households |
| Dial-Up Internet | 15 | 0.1% |
| Broadband Home | 10,134 | 70.5% |
| Cellular Data Only | 2,029 | 14.1% |
| Satellite Internet | 370 | 2.6% |
| No Internet | 1,956 | 13.6% |
| Total | 14,379 | 100.0% |
Bay City Summary
Bay City, Michigan is a city located in the U.S. state of Michigan. It is located in Bay County, on the Saginaw Bay of Lake Huron. The city is situated along the Saginaw River, and is the county seat of Bay County. As of the 2010 census, the city had a population of 34,932, making it the fifth-largest city in Michigan.
History
The area that is now Bay City was originally inhabited by the Ojibwe people. The first European settlers arrived in the area in 1831, and the city was founded in 1837. The city was originally named Lower Saginaw, and was later renamed Bay City in 1857.
The city grew rapidly in the late 19th century, due to its location on the Saginaw River and its proximity to the Great Lakes. The city was a major lumbering center, and was home to several large sawmills. The city also became a major shipbuilding center, and was home to several large shipyards.
The city was also a major center of the automotive industry, and was home to several large automotive factories. The city was also home to several large steel mills.
Geography
Bay City is located in the Saginaw Bay region of Michigan, on the Saginaw River. The city is situated at the mouth of the river, and is bordered by the cities of Essexville and Kawkawlin to the north, and by the cities of Auburn and Midland to the south. The city is located approximately 60 miles north of Detroit, and approximately 90 miles east of Lansing.
The city has a total area of 16.2 square miles, of which 15.7 square miles is land and 0.5 square miles is water. The city is located at an elevation of 590 feet above sea level.
Economy
The economy of Bay City is largely based on manufacturing and tourism. The city is home to several large manufacturing companies, including Dow Chemical, Dow Corning, and Nexteer Automotive. The city is also home to several large shipbuilding companies, including Bay Shipbuilding and Marinette Marine.
The city is also a major tourist destination, and is home to several popular attractions, including the Bay City State Park, the Bay City Riverwalk, and the Bay City Mall.
Demographics
As of the 2010 census, the city had a population of 34,932. The racial makeup of the city was 87.2% White, 8.2% African American, 0.7% Native American, 0.7% Asian, 0.3% from other races, and 2.9% from two or more races. Hispanic or Latino of any race were 2.2% of the population.
The median income for a household in the city was $37,945, and the median income for a family was $45,945. The per capita income for the city was $20,845. About 15.2% of the population was below the poverty line.
Common Questions
What is Per Capita Income in Bay City?
Per Capita income in Bay City is $27,970.
What is the Median Family Income in Bay City?
Median Family Income in Bay City is $62,443.
What is the Median Household income in Bay City?
Median Household Income in Bay City is $45,026.
What is Income or Wage Gap in Bay City?
Income or Wage Gap in Bay City is 30.4%.
Women in Bay City earn 69.6 cents for every dollar earned by a man.
What is Family Income Deficit in Bay City?
Family Income Deficit in Bay City is $11,011.
Families that are below poverty line in Bay City earn $11,011 less on average than the poverty threshold level.
What is Inequality or Gini Index in Bay City?
Inequality or Gini Index in Bay City is 0.46.
What is the Total Population of Bay City?
Total Population of Bay City is 32,664.
What is the Total Male Population of Bay City?
Total Male Population of Bay City is 15,474.
What is the Total Female Population of Bay City?
Total Female Population of Bay City is 17,190.
What is the Ratio of Males per 100 Females in Bay City?
There are 90.02 Males per 100 Females in Bay City.
What is the Ratio of Females per 100 Males in Bay City?
There are 111.09 Females per 100 Males in Bay City.
What is the Median Population Age in Bay City?
Median Population Age in Bay City is 39.2 Years.
What is the Average Family Size in Bay City
Average Family Size in Bay City is 3.0 People.
What is the Average Household Size in Bay City
Average Household Size in Bay City is 2.2 People.
How Large is the Labor Force in Bay City?
There are 16,010 People in the Labor Forcein in Bay City.
What is the Percentage of People in the Labor Force in Bay City?
60.0% of People are in the Labor Force in Bay City.
What is the Unemployment Rate in Bay City?
Unemployment Rate in Bay City is 6.2%.