Roscommon, MI Map & Demographics
Roscommon Map
Roscommon Overview
$24,526
PER CAPITA INCOME
$64,583
AVG FAMILY INCOME
$48,967
AVG HOUSEHOLD INCOME
39.1%
WAGE / INCOME GAP [ % ]
60.9¢/ $1
WAGE / INCOME GAP [ $ ]
0.39
INEQUALITY / GINI INDEX
1,123
TOTAL POPULATION
596
MALE POPULATION
527
FEMALE POPULATION
113.09
MALES / 100 FEMALES
88.42
FEMALES / 100 MALES
55.9
MEDIAN AGE
2.6
AVG FAMILY SIZE
1.9
AVG HOUSEHOLD SIZE
360
LABOR FORCE [ PEOPLE ]
36.5%
PERCENT IN LABOR FORCE
0.8%
UNEMPLOYMENT RATE
Roscommon Zip Codes
Roscommon Area Codes
Income in Roscommon
Income Overview in Roscommon
Per Capita Income in Roscommon is $24,526, while median incomes of families and households are $64,583 and $48,967 respectively.
| Characteristic | Number | Measure |
| Per Capita Income | 1,123 | $24,526 |
| Median Family Income | 269 | $64,583 |
| Mean Family Income | 269 | $66,188 |
| Median Household Income | 533 | $48,967 |
| Mean Household Income | 533 | $51,149 |
| Income Deficit | 269 | $0 |
| Wage / Income Gap (%) | 1,123 | 39.07% |
| Wage / Income Gap ($) | 1,123 | 60.93¢ per $1 |
| Gini / Inequality Index | 1,123 | 0.39 |
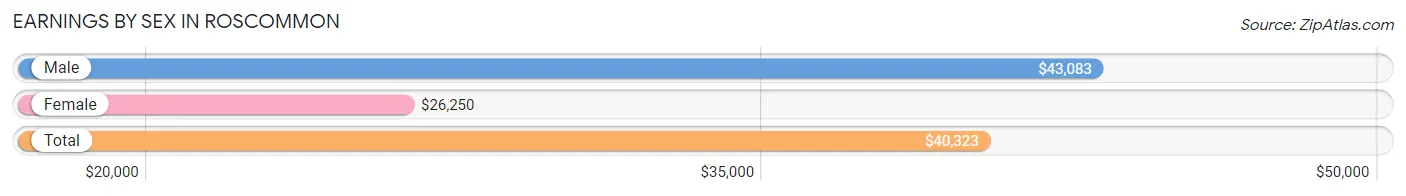
Earnings by Sex in Roscommon
Average Earnings in Roscommon are $40,323, $43,083 for men and $26,250 for women, a difference of 39.1%.
| Sex | Number | Average Earnings |
| Male | 257 (60.6%) | $43,083 |
| Female | 167 (39.4%) | $26,250 |
| Total | 424 (100.0%) | $40,323 |
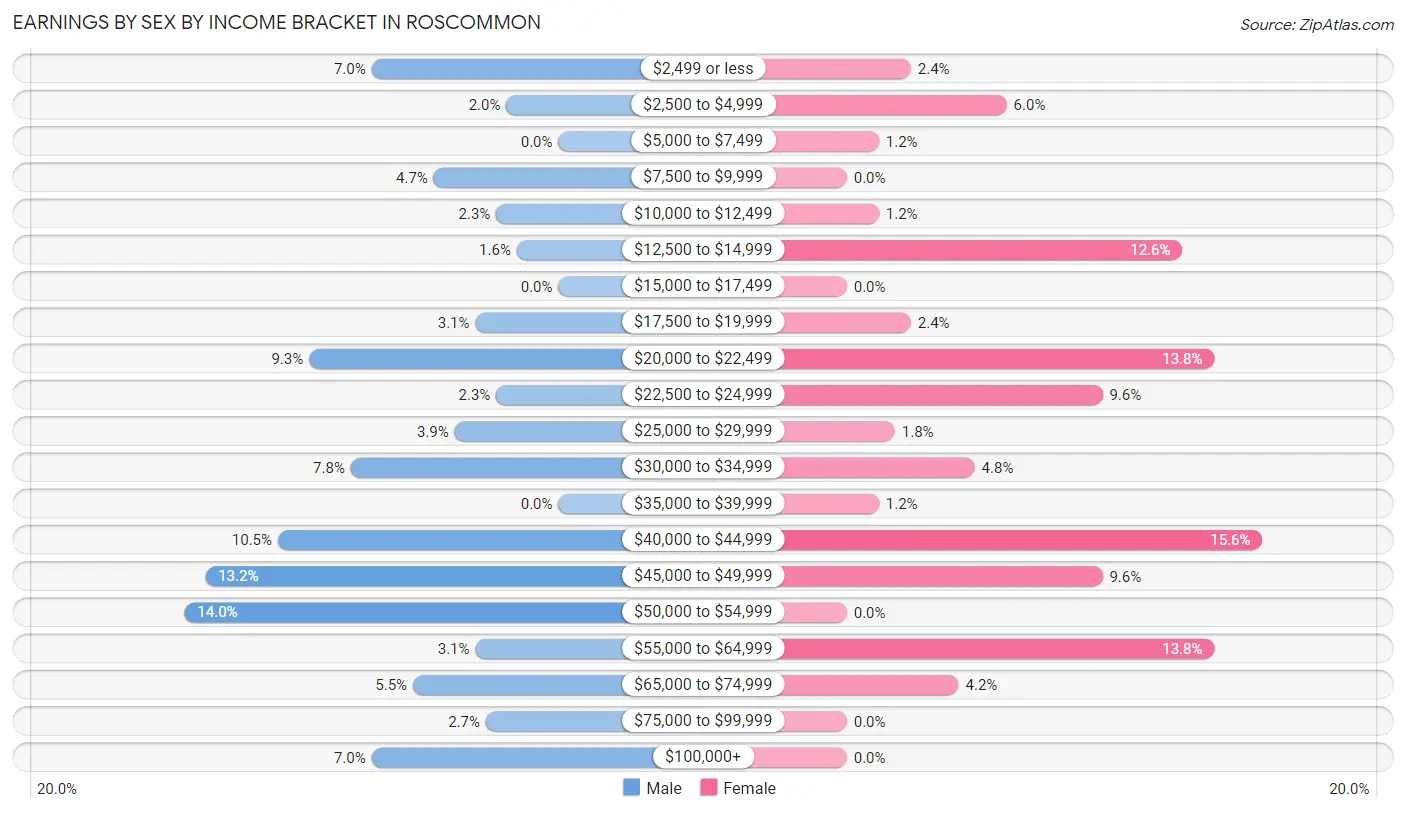
Earnings by Sex by Income Bracket in Roscommon
The most common earnings brackets in Roscommon are $50,000 to $54,999 for men (36 | 14.0%) and $40,000 to $44,999 for women (26 | 15.6%).
| Income | Male | Female |
| $2,499 or less | 18 (7.0%) | 4 (2.4%) |
| $2,500 to $4,999 | 5 (1.9%) | 10 (6.0%) |
| $5,000 to $7,499 | 0 (0.0%) | 2 (1.2%) |
| $7,500 to $9,999 | 12 (4.7%) | 0 (0.0%) |
| $10,000 to $12,499 | 6 (2.3%) | 2 (1.2%) |
| $12,500 to $14,999 | 4 (1.6%) | 21 (12.6%) |
| $15,000 to $17,499 | 0 (0.0%) | 0 (0.0%) |
| $17,500 to $19,999 | 8 (3.1%) | 4 (2.4%) |
| $20,000 to $22,499 | 24 (9.3%) | 23 (13.8%) |
| $22,500 to $24,999 | 6 (2.3%) | 16 (9.6%) |
| $25,000 to $29,999 | 10 (3.9%) | 3 (1.8%) |
| $30,000 to $34,999 | 20 (7.8%) | 8 (4.8%) |
| $35,000 to $39,999 | 0 (0.0%) | 2 (1.2%) |
| $40,000 to $44,999 | 27 (10.5%) | 26 (15.6%) |
| $45,000 to $49,999 | 34 (13.2%) | 16 (9.6%) |
| $50,000 to $54,999 | 36 (14.0%) | 0 (0.0%) |
| $55,000 to $64,999 | 8 (3.1%) | 23 (13.8%) |
| $65,000 to $74,999 | 14 (5.4%) | 7 (4.2%) |
| $75,000 to $99,999 | 7 (2.7%) | 0 (0.0%) |
| $100,000+ | 18 (7.0%) | 0 (0.0%) |
| Total | 257 (100.0%) | 167 (100.0%) |
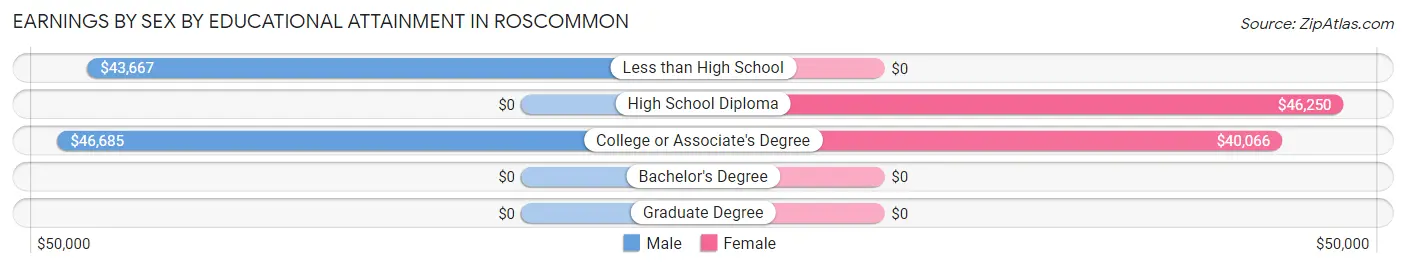
Earnings by Sex by Educational Attainment in Roscommon
Average earnings in Roscommon are $45,217 for men and $41,645 for women, a difference of 7.9%. Men with an educational attainment of college or associate's degree enjoy the highest average annual earnings of $46,685, while those with less than high school education earn the least with $43,667. Women with an educational attainment of high school diploma earn the most with the average annual earnings of $46,250, while those with college or associate's degree education have the smallest earnings of $40,066.
| Educational Attainment | Male Income | Female Income |
| Less than High School | $43,667 | $0 |
| High School Diploma | - | - |
| College or Associate's Degree | $46,685 | $40,066 |
| Bachelor's Degree | - | - |
| Graduate Degree | - | - |
| Total | $45,217 | $41,645 |
Family Income in Roscommon
Family Income Brackets in Roscommon
According to the Roscommon family income data, there are 156 families falling into the $50,000 to $74,999 income range, which is the most common income bracket and makes up 58.0% of all families.
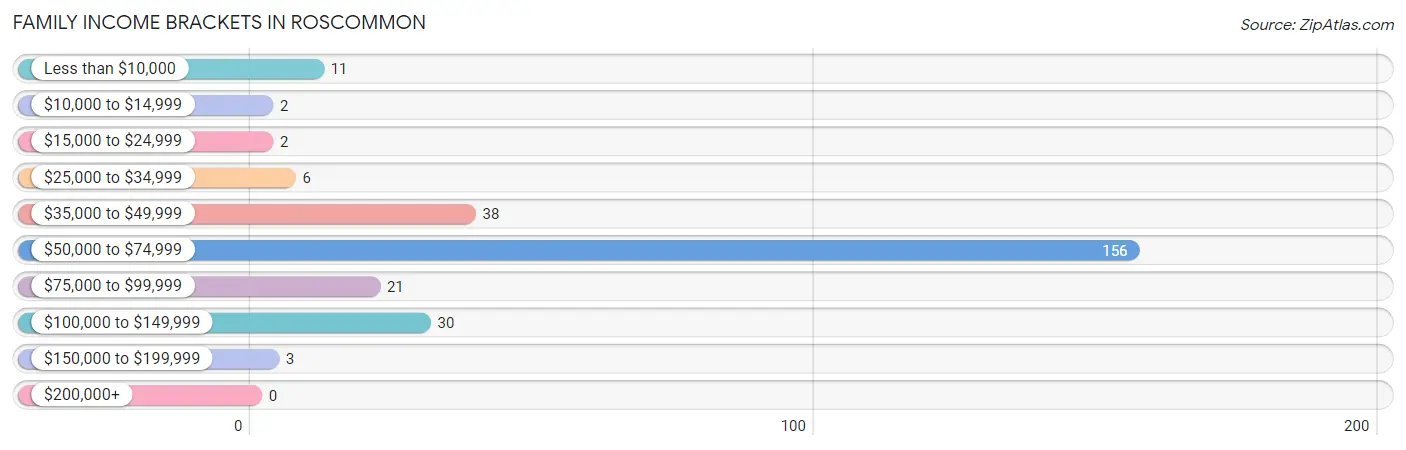
| Income Bracket | # Families | % Families |
| Less than $10,000 | 11 | 4.1% |
| $10,000 to $14,999 | 2 | 0.7% |
| $15,000 to $24,999 | 2 | 0.7% |
| $25,000 to $34,999 | 6 | 2.2% |
| $35,000 to $49,999 | 38 | 14.1% |
| $50,000 to $74,999 | 156 | 58.0% |
| $75,000 to $99,999 | 21 | 7.8% |
| $100,000 to $149,999 | 30 | 11.2% |
| $150,000 to $199,999 | 3 | 1.1% |
| $200,000+ | 0 | 0.0% |
Family Income by Famaliy Size in Roscommon
3-person families (55 | 20.4%) account for the highest median family income in Roscommon with $73,487 per family, while 2-person families (135 | 50.2%) have the highest median income of $29,688 per family member.
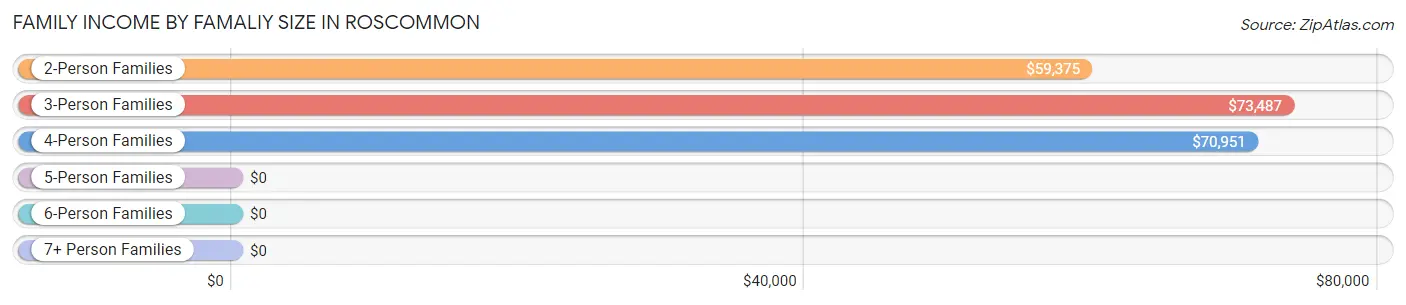
| Income Bracket | # Families | Median Income |
| 2-Person Families | 135 (50.2%) | $59,375 |
| 3-Person Families | 55 (20.4%) | $73,487 |
| 4-Person Families | 63 (23.4%) | $70,951 |
| 5-Person Families | 16 (5.9%) | $0 |
| 6-Person Families | 0 (0.0%) | $0 |
| 7+ Person Families | 0 (0.0%) | $0 |
| Total | 269 (100.0%) | $64,583 |
Family Income by Number of Earners in Roscommon
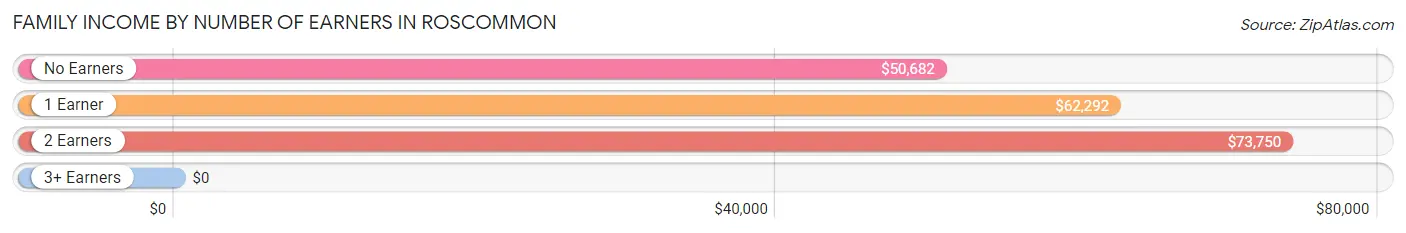
| Number of Earners | # Families | Median Income |
| No Earners | 54 (20.1%) | $50,682 |
| 1 Earner | 126 (46.8%) | $62,292 |
| 2 Earners | 75 (27.9%) | $73,750 |
| 3+ Earners | 14 (5.2%) | $0 |
| Total | 269 (100.0%) | $64,583 |
Household Income in Roscommon
Household Income Brackets in Roscommon
With 189 households falling in the category, the $50,000 to $74,999 income range is the most frequent in Roscommon, accounting for 35.5% of all households. In contrast, only 3 households (0.6%) fall into the $150,000 to $199,999 income bracket, making it the least populous group.
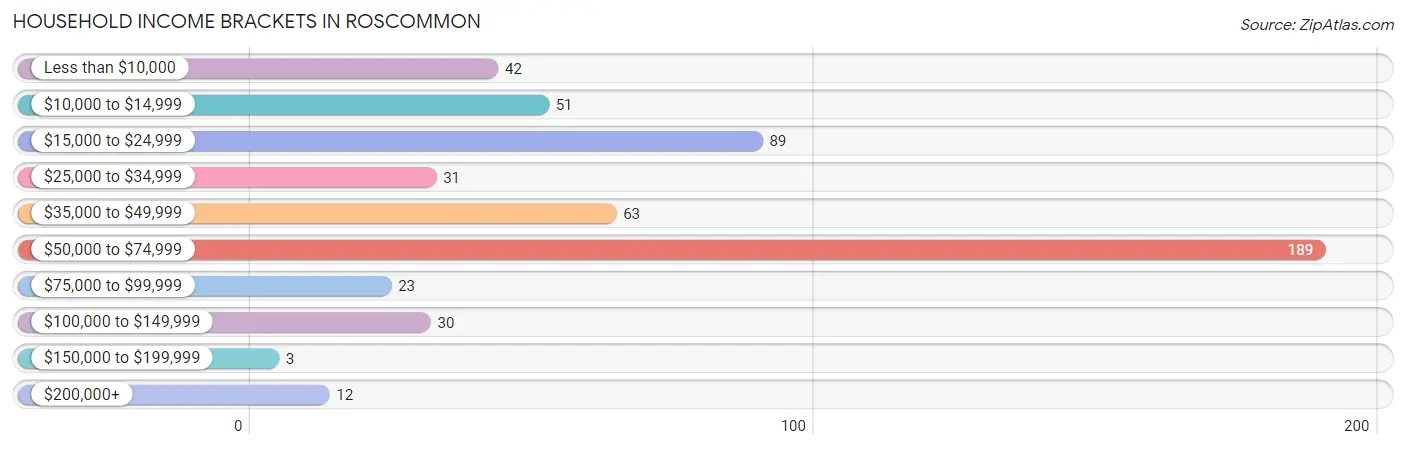
| Income Bracket | # Households | % Households |
| Less than $10,000 | 42 | 7.9% |
| $10,000 to $14,999 | 51 | 9.6% |
| $15,000 to $24,999 | 89 | 16.7% |
| $25,000 to $34,999 | 31 | 5.8% |
| $35,000 to $49,999 | 63 | 11.8% |
| $50,000 to $74,999 | 189 | 35.5% |
| $75,000 to $99,999 | 23 | 4.3% |
| $100,000 to $149,999 | 30 | 5.6% |
| $150,000 to $199,999 | 3 | 0.6% |
| $200,000+ | 12 | 2.3% |
Household Income by Householder Age in Roscommon
The median household income in Roscommon is $48,967, with the highest median household income of $73,750 found in the 15 to 24 years age bracket for the primary householder. A total of 45 households (8.4%) fall into this category. Meanwhile, the 65+ years age bracket for the primary householder has the lowest median household income of $38,167, with 124 households (23.3%) in this group.
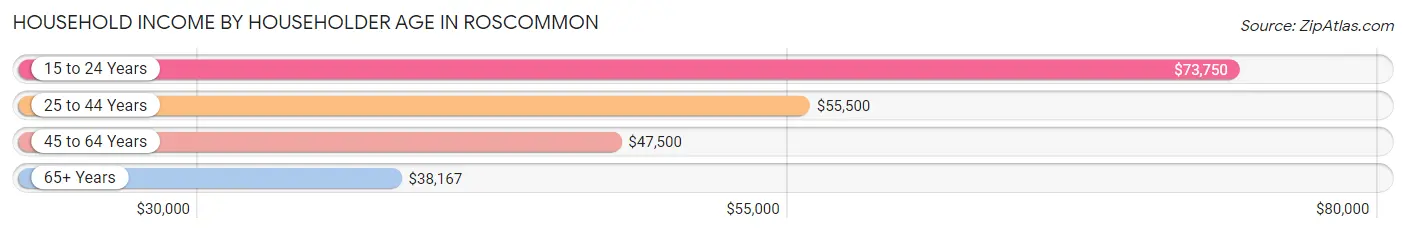
| Income Bracket | # Households | Median Income |
| 15 to 24 Years | 45 (8.4%) | $73,750 |
| 25 to 44 Years | 78 (14.6%) | $55,500 |
| 45 to 64 Years | 286 (53.7%) | $47,500 |
| 65+ Years | 124 (23.3%) | $38,167 |
| Total | 533 (100.0%) | $48,967 |
Poverty in Roscommon
Income Below Poverty by Sex and Age in Roscommon
With 7.3% poverty level for males and 18.1% for females among the residents of Roscommon, 18 to 24 year old males and 12 to 14 year old females are the most vulnerable to poverty, with 18 males (27.7%) and 3 females (100.0%) in their respective age groups living below the poverty level.
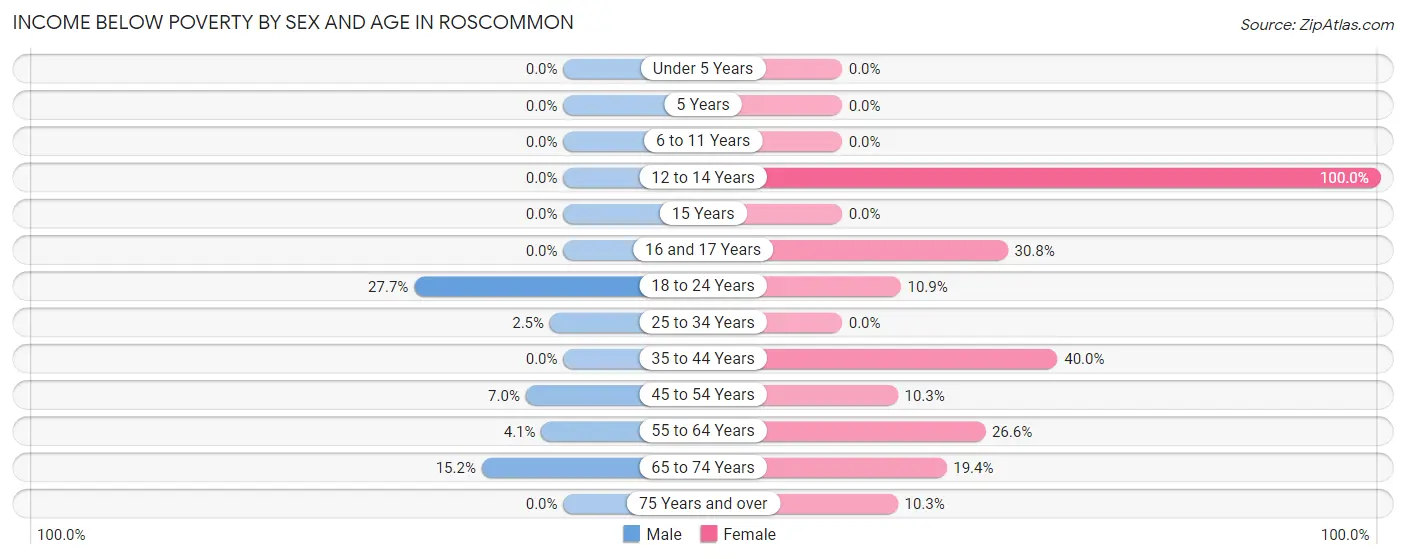
| Age Bracket | Male | Female |
| Under 5 Years | 0 (0.0%) | 0 (0.0%) |
| 5 Years | 0 (0.0%) | 0 (0.0%) |
| 6 to 11 Years | 0 (0.0%) | 0 (0.0%) |
| 12 to 14 Years | 0 (0.0%) | 3 (100.0%) |
| 15 Years | 0 (0.0%) | 0 (0.0%) |
| 16 and 17 Years | 0 (0.0%) | 4 (30.8%) |
| 18 to 24 Years | 18 (27.7%) | 6 (10.9%) |
| 25 to 34 Years | 1 (2.5%) | 0 (0.0%) |
| 35 to 44 Years | 0 (0.0%) | 10 (40.0%) |
| 45 to 54 Years | 3 (7.0%) | 3 (10.3%) |
| 55 to 64 Years | 6 (4.1%) | 42 (26.6%) |
| 65 to 74 Years | 10 (15.1%) | 13 (19.4%) |
| 75 Years and over | 0 (0.0%) | 6 (10.3%) |
| Total | 38 (7.3%) | 87 (18.1%) |
Income Above Poverty by Sex and Age in Roscommon
According to the poverty statistics in Roscommon, males aged under 5 years and females aged under 5 years are the age groups that are most secure financially, with 100.0% of males and 100.0% of females in these age groups living above the poverty line.
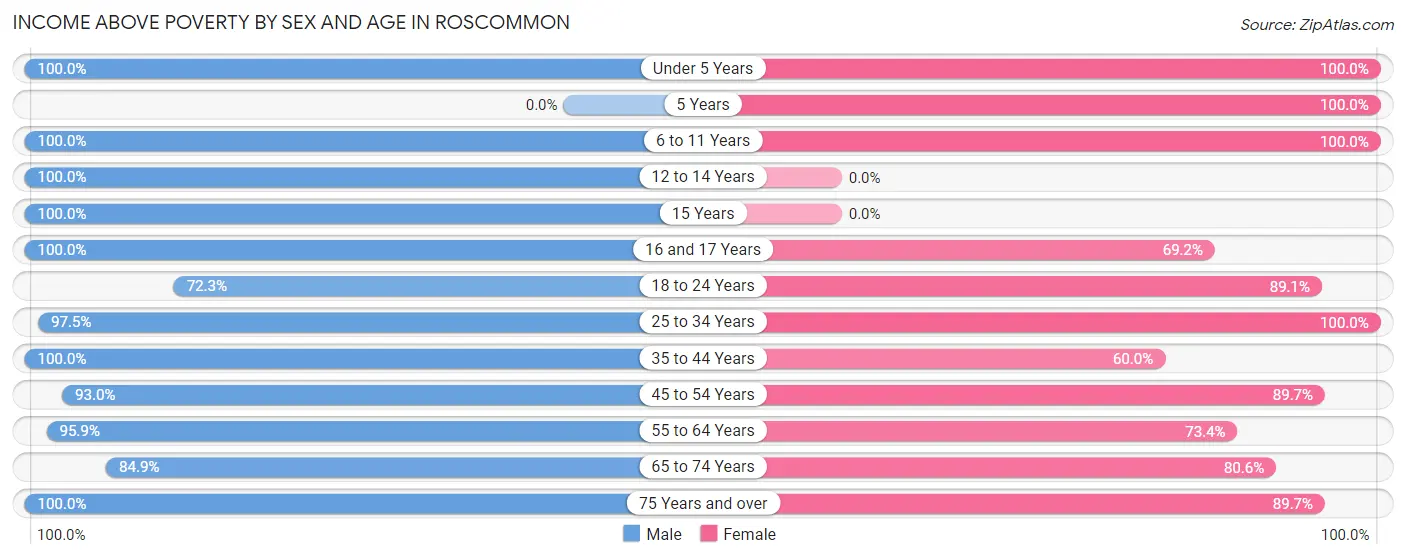
| Age Bracket | Male | Female |
| Under 5 Years | 29 (100.0%) | 21 (100.0%) |
| 5 Years | 0 (0.0%) | 8 (100.0%) |
| 6 to 11 Years | 29 (100.0%) | 8 (100.0%) |
| 12 to 14 Years | 12 (100.0%) | 0 (0.0%) |
| 15 Years | 26 (100.0%) | 0 (0.0%) |
| 16 and 17 Years | 14 (100.0%) | 9 (69.2%) |
| 18 to 24 Years | 47 (72.3%) | 49 (89.1%) |
| 25 to 34 Years | 39 (97.5%) | 36 (100.0%) |
| 35 to 44 Years | 24 (100.0%) | 15 (60.0%) |
| 45 to 54 Years | 40 (93.0%) | 26 (89.7%) |
| 55 to 64 Years | 141 (95.9%) | 116 (73.4%) |
| 65 to 74 Years | 56 (84.9%) | 54 (80.6%) |
| 75 Years and over | 28 (100.0%) | 52 (89.7%) |
| Total | 485 (92.7%) | 394 (81.9%) |
Income Below Poverty Among Married-Couple Families in Roscommon
The poverty statistics for married-couple families in Roscommon show that 4.1% or 8 of the total 194 families live below the poverty line. Families with 1 or 2 children have the highest poverty rate of 9.6%, comprising of 5 families. On the other hand, families with 3 or 4 children have the lowest poverty rate of 0.0%, which includes 0 families.
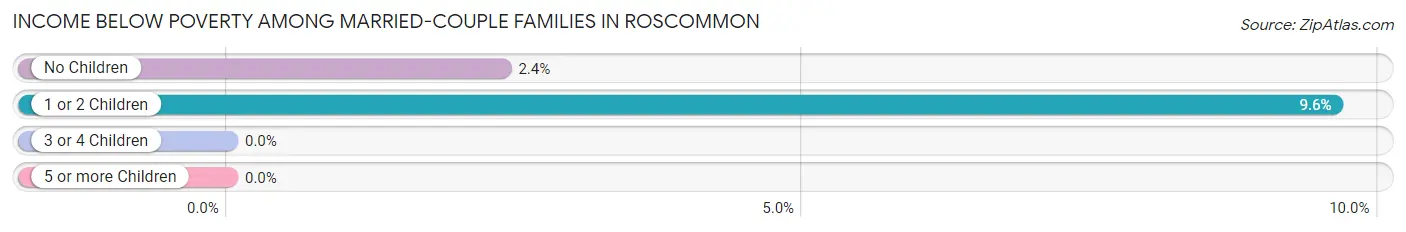
| Children | Above Poverty | Below Poverty |
| No Children | 123 (97.6%) | 3 (2.4%) |
| 1 or 2 Children | 47 (90.4%) | 5 (9.6%) |
| 3 or 4 Children | 16 (100.0%) | 0 (0.0%) |
| 5 or more Children | 0 (0.0%) | 0 (0.0%) |
| Total | 186 (95.9%) | 8 (4.1%) |
Income Below Poverty Among Single-Parent Households in Roscommon
According to the poverty data in Roscommon, 6.5% or 2 single-father households and 6.8% or 3 single-mother households are living below the poverty line. Among single-father households, those with no children have the highest poverty rate, with 2 households (28.6%) experiencing poverty. Likewise, among single-mother households, those with 1 or 2 children have the highest poverty rate, with 3 households (15.8%) falling below the poverty line.
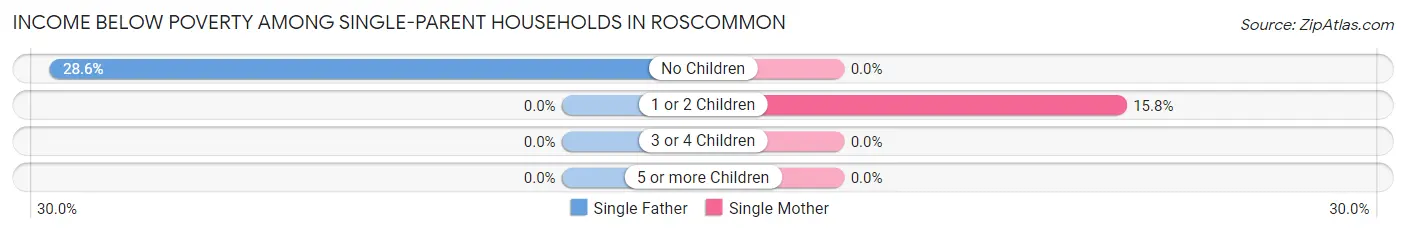
| Children | Single Father | Single Mother |
| No Children | 2 (28.6%) | 0 (0.0%) |
| 1 or 2 Children | 0 (0.0%) | 3 (15.8%) |
| 3 or 4 Children | 0 (0.0%) | 0 (0.0%) |
| 5 or more Children | 0 (0.0%) | 0 (0.0%) |
| Total | 2 (6.5%) | 3 (6.8%) |
Income Below Poverty Among Married-Couple vs Single-Parent Households in Roscommon
The poverty data for Roscommon shows that 8 of the married-couple family households (4.1%) and 5 of the single-parent households (6.7%) are living below the poverty level. Within the married-couple family households, those with 1 or 2 children have the highest poverty rate, with 5 households (9.6%) falling below the poverty line. Among the single-parent households, those with 1 or 2 children have the highest poverty rate, with 3 household (7.0%) living below poverty.
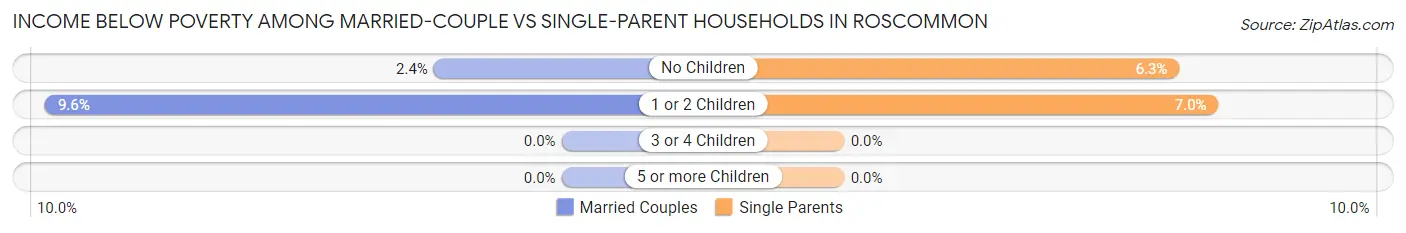
| Children | Married-Couple Families | Single-Parent Households |
| No Children | 3 (2.4%) | 2 (6.2%) |
| 1 or 2 Children | 5 (9.6%) | 3 (7.0%) |
| 3 or 4 Children | 0 (0.0%) | 0 (0.0%) |
| 5 or more Children | 0 (0.0%) | 0 (0.0%) |
| Total | 8 (4.1%) | 5 (6.7%) |
Race in Roscommon
The most populous races in Roscommon are White / Caucasian (1,015 | 90.4%), Two or more Races (90 | 8.0%), and Hispanic or Latino (31 | 2.8%).
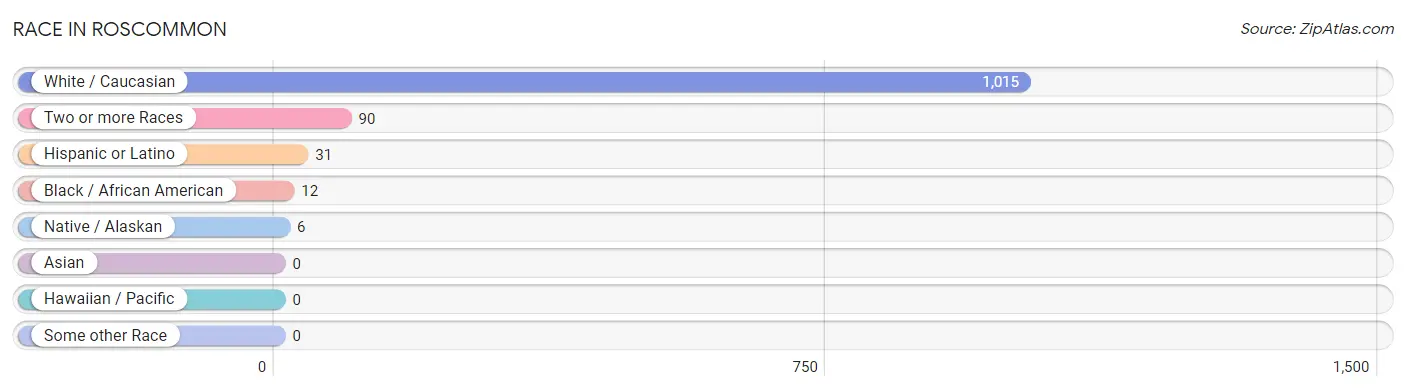
| Race | # Population | % Population |
| Asian | 0 | 0.0% |
| Black / African American | 12 | 1.1% |
| Hawaiian / Pacific | 0 | 0.0% |
| Hispanic or Latino | 31 | 2.8% |
| Native / Alaskan | 6 | 0.5% |
| White / Caucasian | 1,015 | 90.4% |
| Two or more Races | 90 | 8.0% |
| Some other Race | 0 | 0.0% |
| Total | 1,123 | 100.0% |
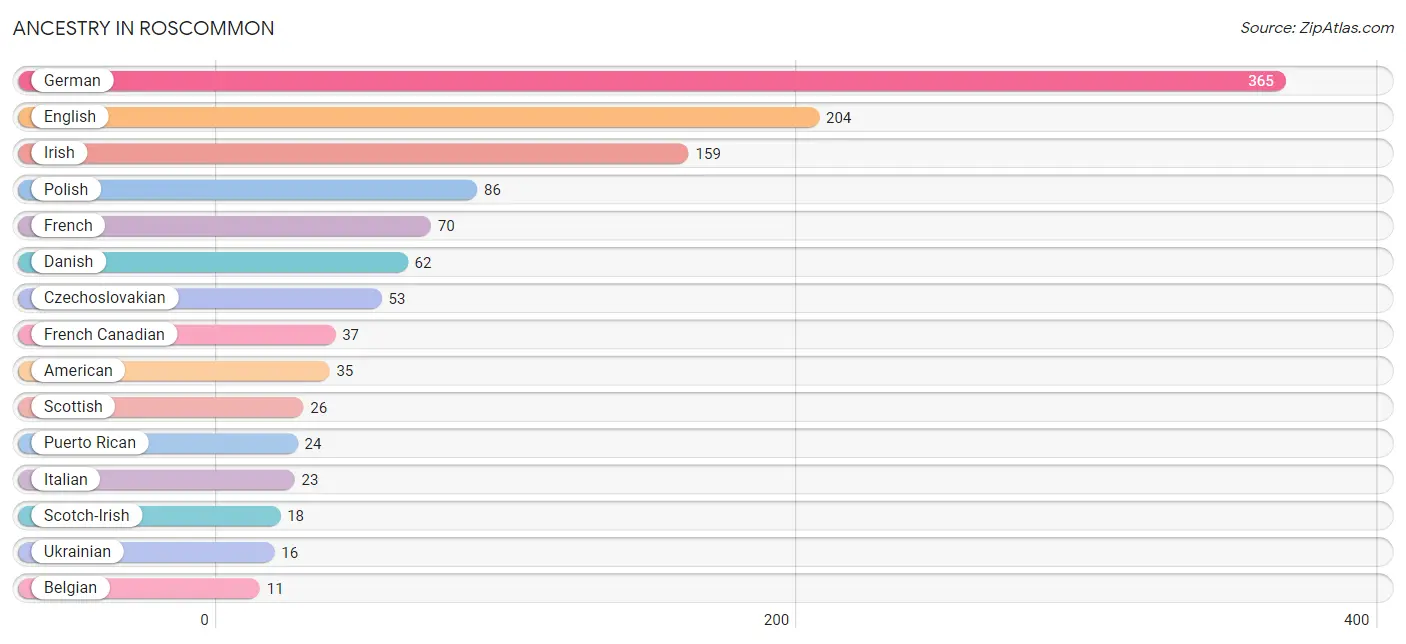
Ancestry in Roscommon
The most populous ancestries reported in Roscommon are German (365 | 32.5%), English (204 | 18.2%), Irish (159 | 14.2%), Polish (86 | 7.7%), and French (70 | 6.2%), together accounting for 78.7% of all Roscommon residents.
| Ancestry | # Population | % Population |
| African | 3 | 0.3% |
| American | 35 | 3.1% |
| Belgian | 11 | 1.0% |
| British | 3 | 0.3% |
| Canadian | 7 | 0.6% |
| Cherokee | 6 | 0.5% |
| Chippewa | 7 | 0.6% |
| Czech | 5 | 0.4% |
| Czechoslovakian | 53 | 4.7% |
| Danish | 62 | 5.5% |
| Dutch | 8 | 0.7% |
| Eastern European | 3 | 0.3% |
| English | 204 | 18.2% |
| European | 4 | 0.4% |
| Finnish | 7 | 0.6% |
| French | 70 | 6.2% |
| French Canadian | 37 | 3.3% |
| German | 365 | 32.5% |
| Greek | 5 | 0.4% |
| Irish | 159 | 14.2% |
| Italian | 23 | 2.1% |
| Jamaican | 2 | 0.2% |
| Lithuanian | 6 | 0.5% |
| Mexican | 7 | 0.6% |
| Norwegian | 5 | 0.4% |
| Ottawa | 2 | 0.2% |
| Pennsylvania German | 5 | 0.4% |
| Polish | 86 | 7.7% |
| Puerto Rican | 24 | 2.1% |
| Russian | 7 | 0.6% |
| Scotch-Irish | 18 | 1.6% |
| Scottish | 26 | 2.3% |
| Subsaharan African | 3 | 0.3% |
| Swedish | 6 | 0.5% |
| Ukrainian | 16 | 1.4% |
| Welsh | 7 | 0.6% | View All 36 Rows |
Immigrants in Roscommon
The most numerous immigrant groups reported in Roscommon came from Europe (10 | 0.9%), Eastern Europe (8 | 0.7%), Ukraine (7 | 0.6%), Canada (3 | 0.3%), and Greece (2 | 0.2%), together accounting for 2.7% of all Roscommon residents.
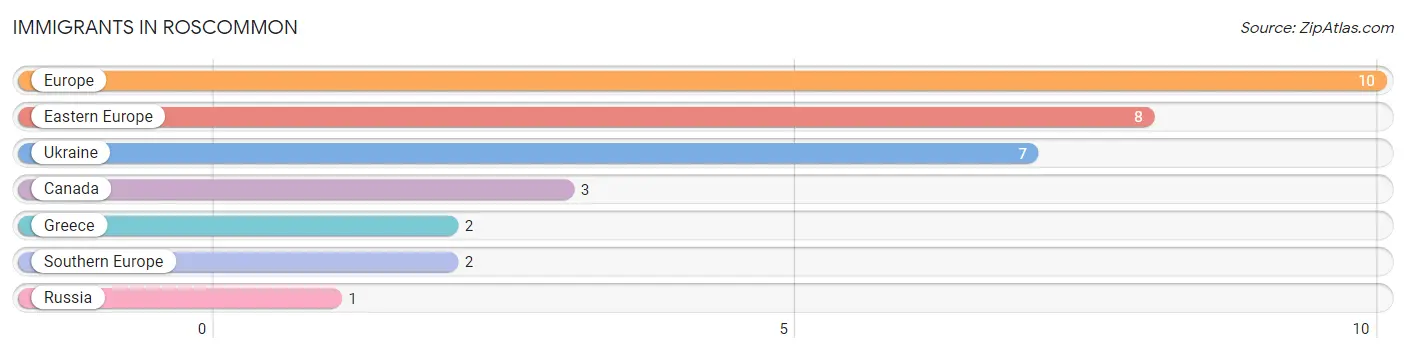
| Immigration Origin | # Population | % Population |
| Canada | 3 | 0.3% |
| Eastern Europe | 8 | 0.7% |
| Europe | 10 | 0.9% |
| Greece | 2 | 0.2% |
| Russia | 1 | 0.1% |
| Southern Europe | 2 | 0.2% |
| Ukraine | 7 | 0.6% | View All 7 Rows |
Sex and Age in Roscommon
Sex and Age in Roscommon
The most populous age groups in Roscommon are 60 to 64 Years (90 | 15.1%) for men and 60 to 64 Years (107 | 20.3%) for women.
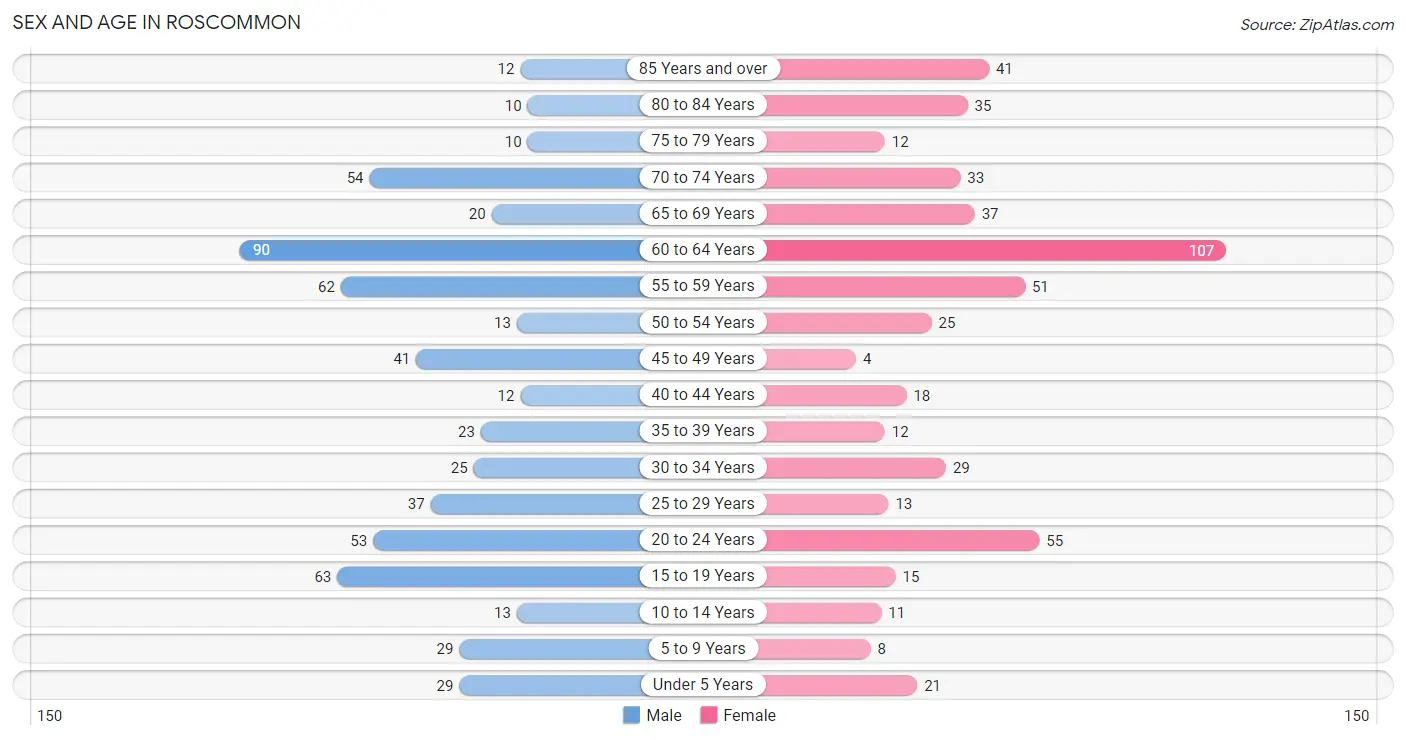
| Age Bracket | Male | Female |
| Under 5 Years | 29 (4.9%) | 21 (4.0%) |
| 5 to 9 Years | 29 (4.9%) | 8 (1.5%) |
| 10 to 14 Years | 13 (2.2%) | 11 (2.1%) |
| 15 to 19 Years | 63 (10.6%) | 15 (2.9%) |
| 20 to 24 Years | 53 (8.9%) | 55 (10.4%) |
| 25 to 29 Years | 37 (6.2%) | 13 (2.5%) |
| 30 to 34 Years | 25 (4.2%) | 29 (5.5%) |
| 35 to 39 Years | 23 (3.9%) | 12 (2.3%) |
| 40 to 44 Years | 12 (2.0%) | 18 (3.4%) |
| 45 to 49 Years | 41 (6.9%) | 4 (0.8%) |
| 50 to 54 Years | 13 (2.2%) | 25 (4.7%) |
| 55 to 59 Years | 62 (10.4%) | 51 (9.7%) |
| 60 to 64 Years | 90 (15.1%) | 107 (20.3%) |
| 65 to 69 Years | 20 (3.4%) | 37 (7.0%) |
| 70 to 74 Years | 54 (9.1%) | 33 (6.3%) |
| 75 to 79 Years | 10 (1.7%) | 12 (2.3%) |
| 80 to 84 Years | 10 (1.7%) | 35 (6.6%) |
| 85 Years and over | 12 (2.0%) | 41 (7.8%) |
| Total | 596 (100.0%) | 527 (100.0%) |
Families and Households in Roscommon
Median Family Size in Roscommon
The median family size in Roscommon is 2.59 persons per family, with married-couple families (194 | 72.1%) accounting for the largest median family size of 2.75 persons per family. On the other hand, single female/mother families (44 | 16.4%) represent the smallest median family size with 2.16 persons per family.
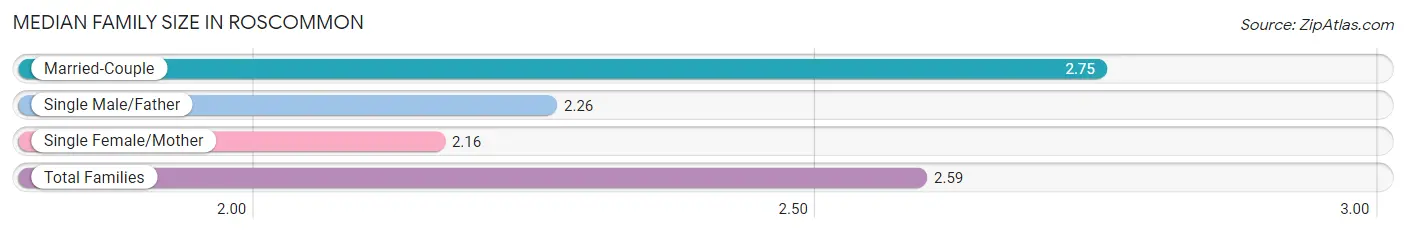
| Family Type | # Families | Family Size |
| Married-Couple | 194 (72.1%) | 2.75 |
| Single Male/Father | 31 (11.5%) | 2.26 |
| Single Female/Mother | 44 (16.4%) | 2.16 |
| Total Families | 269 (100.0%) | 2.59 |
Median Household Size in Roscommon
The median household size in Roscommon is 1.88 persons per household, with married-couple households (194 | 36.4%) accounting for the largest median household size of 2.86 persons per household. non-family households (264 | 49.5%) represent the smallest median household size with 1.03 persons per household.
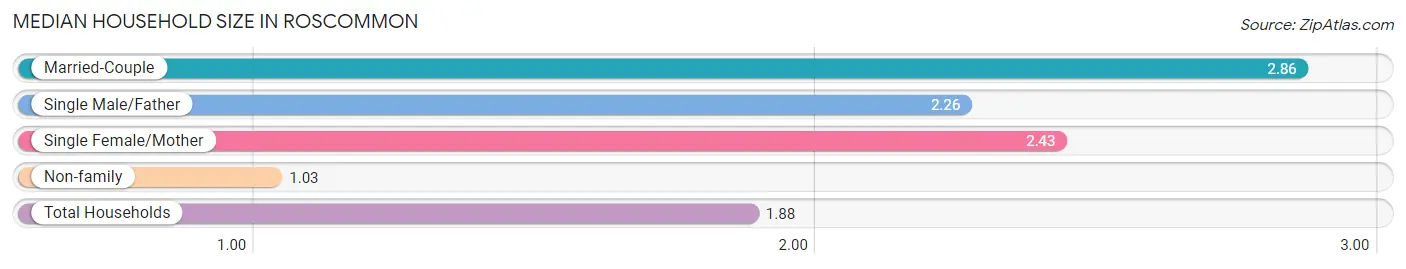
| Household Type | # Households | Household Size |
| Married-Couple | 194 (36.4%) | 2.86 |
| Single Male/Father | 31 (5.8%) | 2.26 |
| Single Female/Mother | 44 (8.3%) | 2.43 |
| Non-family | 264 (49.5%) | 1.03 |
| Total Households | 533 (100.0%) | 1.88 |
Household Size by Marriage Status in Roscommon
Out of a total of 533 households in Roscommon, 269 (50.5%) are family households, while 264 (49.5%) are nonfamily households. The most numerous type of family households are 2-person households, comprising 121, and the most common type of nonfamily households are 1-person households, comprising 255.
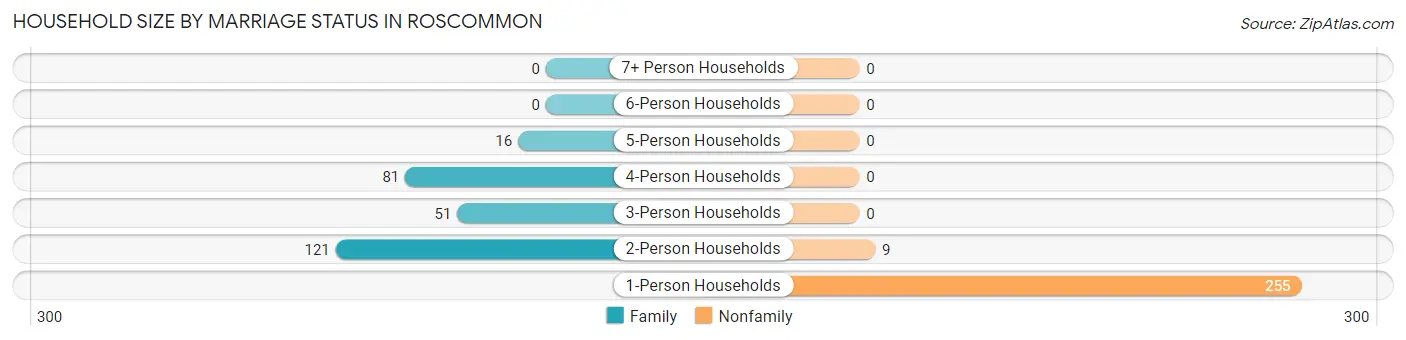
| Household Size | Family Households | Nonfamily Households |
| 1-Person Households | - | 255 (47.8%) |
| 2-Person Households | 121 (22.7%) | 9 (1.7%) |
| 3-Person Households | 51 (9.6%) | 0 (0.0%) |
| 4-Person Households | 81 (15.2%) | 0 (0.0%) |
| 5-Person Households | 16 (3.0%) | 0 (0.0%) |
| 6-Person Households | 0 (0.0%) | 0 (0.0%) |
| 7+ Person Households | 0 (0.0%) | 0 (0.0%) |
| Total | 269 (50.5%) | 264 (49.5%) |
Female Fertility in Roscommon
Fertility by Age in Roscommon
| Age Bracket | Women with Births | Births / 1,000 Women |
| 15 to 19 years | 0 (0.0%) | 0.0 |
| 20 to 34 years | 0 (0.0%) | 0.0 |
| 35 to 50 years | 0 (0.0%) | 0.0 |
| Total | 0 (0.0%) | 0.0 |
Fertility by Age by Marriage Status in Roscommon

| Age Bracket | Married | Unmarried |
| 15 to 19 years | 0 (0.0%) | 0 (0.0%) |
| 20 to 34 years | 0 (0.0%) | 0 (0.0%) |
| 35 to 50 years | 0 (0.0%) | 0 (0.0%) |
| Total | 0 (0.0%) | 0 (0.0%) |
Fertility by Education in Roscommon
| Educational Attainment | Women with Births | Births / 1,000 Women |
| Less than High School | 0 (0.0%) | 0.0 |
| High School Diploma | 0 (0.0%) | 0.0 |
| College or Associate's Degree | 0 (0.0%) | 0.0 |
| Bachelor's Degree | 0 (0.0%) | 0.0 |
| Graduate Degree | 0 (0.0%) | 0.0 |
| Total | 0 (0.0%) | 0.0 |
Fertility by Education by Marriage Status in Roscommon
| Educational Attainment | Married | Unmarried |
| Less than High School | 0 (0.0%) | 0 (0.0%) |
| High School Diploma | 0 (0.0%) | 0 (0.0%) |
| College or Associate's Degree | 0 (0.0%) | 0 (0.0%) |
| Bachelor's Degree | 0 (0.0%) | 0 (0.0%) |
| Graduate Degree | 0 (0.0%) | 0 (0.0%) |
| Total | 0 (0.0%) | 0 (0.0%) |
Employment Characteristics in Roscommon
Employment by Class of Employer in Roscommon
Among the 356 employed individuals in Roscommon, private company employees (216 | 60.7%), self-employed (not incorporated) (35 | 9.8%), and self-employed (incorporated) (30 | 8.4%) make up the most common classes of employment.
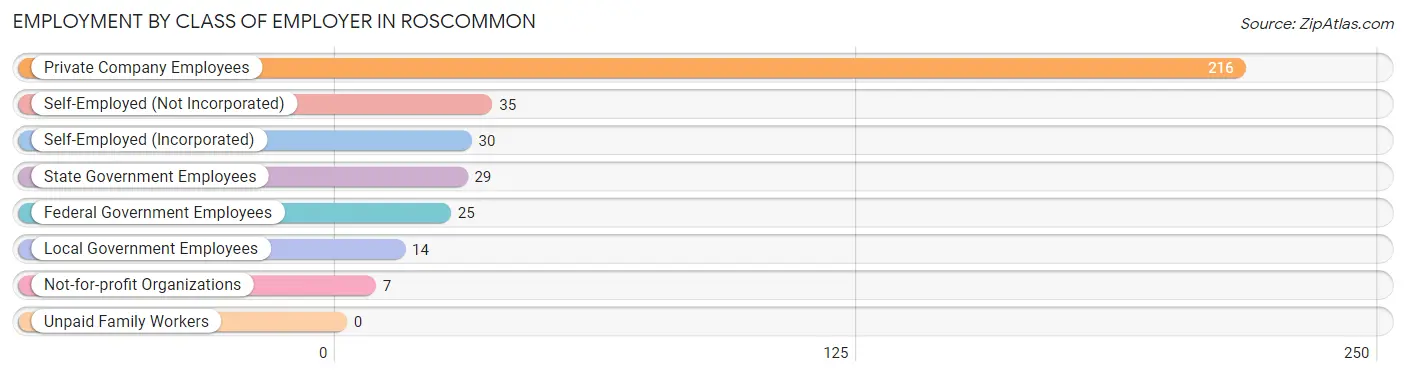
| Employer Class | # Employees | % Employees |
| Private Company Employees | 216 | 60.7% |
| Self-Employed (Incorporated) | 30 | 8.4% |
| Self-Employed (Not Incorporated) | 35 | 9.8% |
| Not-for-profit Organizations | 7 | 2.0% |
| Local Government Employees | 14 | 3.9% |
| State Government Employees | 29 | 8.2% |
| Federal Government Employees | 25 | 7.0% |
| Unpaid Family Workers | 0 | 0.0% |
| Total | 356 | 100.0% |
Employment Status by Age in Roscommon
According to the labor force statistics for Roscommon, out of the total population over 16 years of age (985), 36.5% or 360 individuals are in the labor force, with 0.8% or 3 of them unemployed. The age group with the highest labor force participation rate is 20 to 24 years, with 83.3% or 90 individuals in the labor force. Within the labor force, the 55 to 59 years age range has the highest percentage of unemployed individuals, with 5.4% or 3 of them being unemployed.
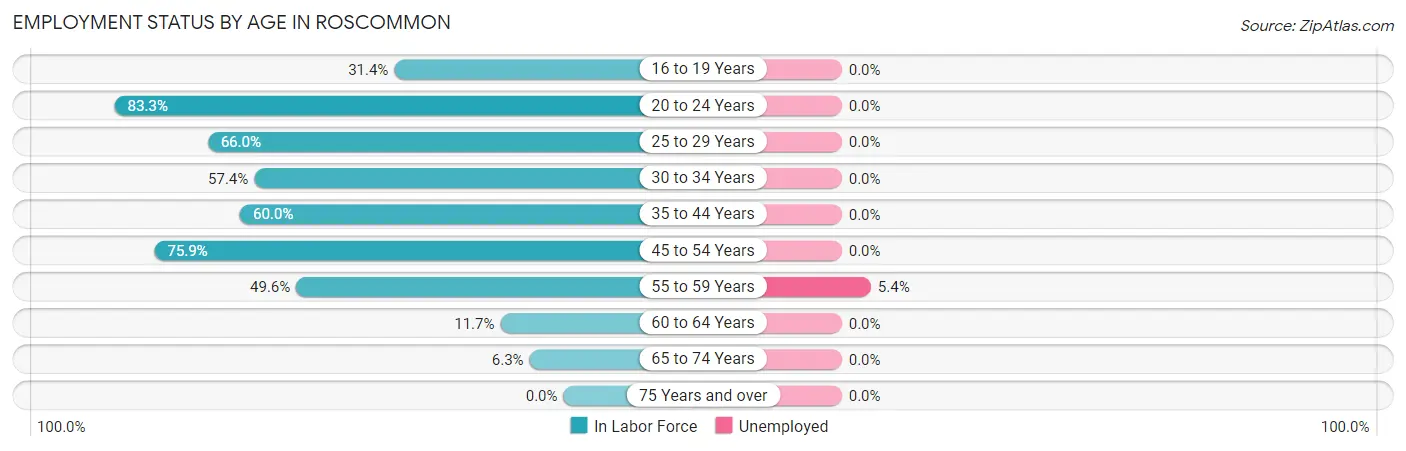
| Age Bracket | In Labor Force | Unemployed |
| 16 to 19 Years | 16 (31.4%) | 0 (0.0%) |
| 20 to 24 Years | 90 (83.3%) | 0 (0.0%) |
| 25 to 29 Years | 33 (66.0%) | 0 (0.0%) |
| 30 to 34 Years | 31 (57.4%) | 0 (0.0%) |
| 35 to 44 Years | 39 (60.0%) | 0 (0.0%) |
| 45 to 54 Years | 63 (75.9%) | 0 (0.0%) |
| 55 to 59 Years | 56 (49.6%) | 3 (5.4%) |
| 60 to 64 Years | 23 (11.7%) | 0 (0.0%) |
| 65 to 74 Years | 9 (6.3%) | 0 (0.0%) |
| 75 Years and over | 0 (0.0%) | 0 (0.0%) |
| Total | 360 (36.5%) | 3 (0.8%) |
Employment Status by Educational Attainment in Roscommon
According to labor force statistics for Roscommon, 43.6% of individuals (245) out of the total population between 25 and 64 years of age (562) are in the labor force, with 1.2% or 3 of them being unemployed. The group with the highest labor force participation rate are those with the educational attainment of bachelor's degree or higher, with 67.9% or 19 individuals in the labor force. Within the labor force, individuals with college / associate degree education have the highest percentage of unemployment, with 1.7% or 3 of them being unemployed.
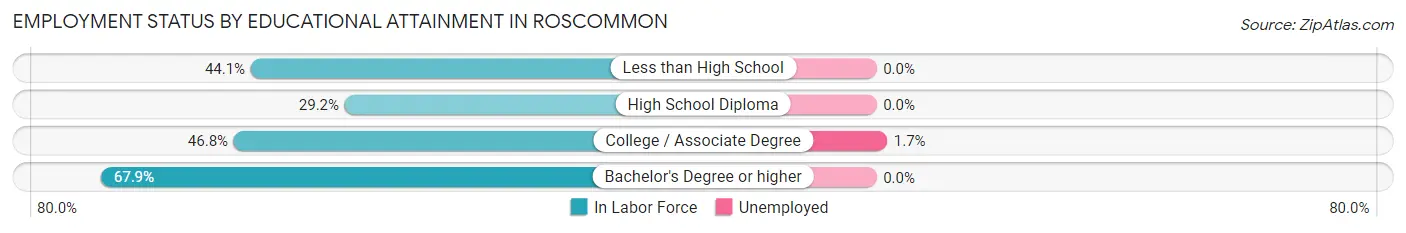
| Educational Attainment | In Labor Force | Unemployed |
| Less than High School | 15 (44.1%) | 0 (0.0%) |
| High School Diploma | 38 (29.2%) | 0 (0.0%) |
| College / Associate Degree | 173 (46.8%) | 6 (1.7%) |
| Bachelor's Degree or higher | 19 (67.9%) | 0 (0.0%) |
| Total | 245 (43.6%) | 7 (1.2%) |
Employment Occupations by Sex in Roscommon
Management, Business, Science and Arts Occupations
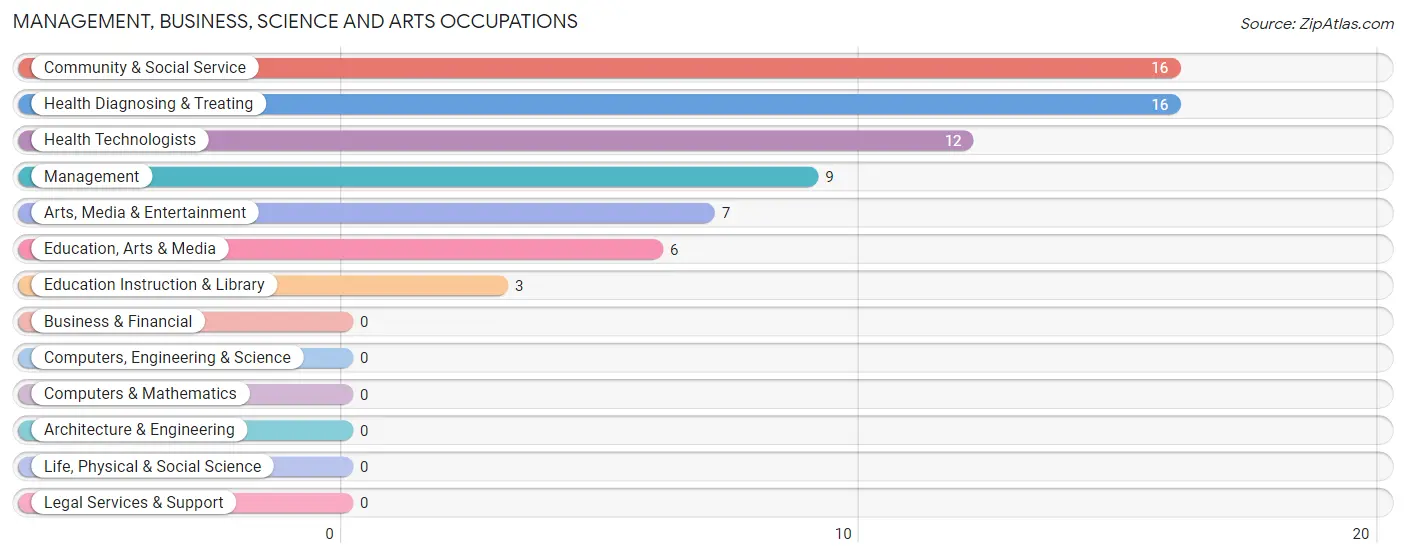
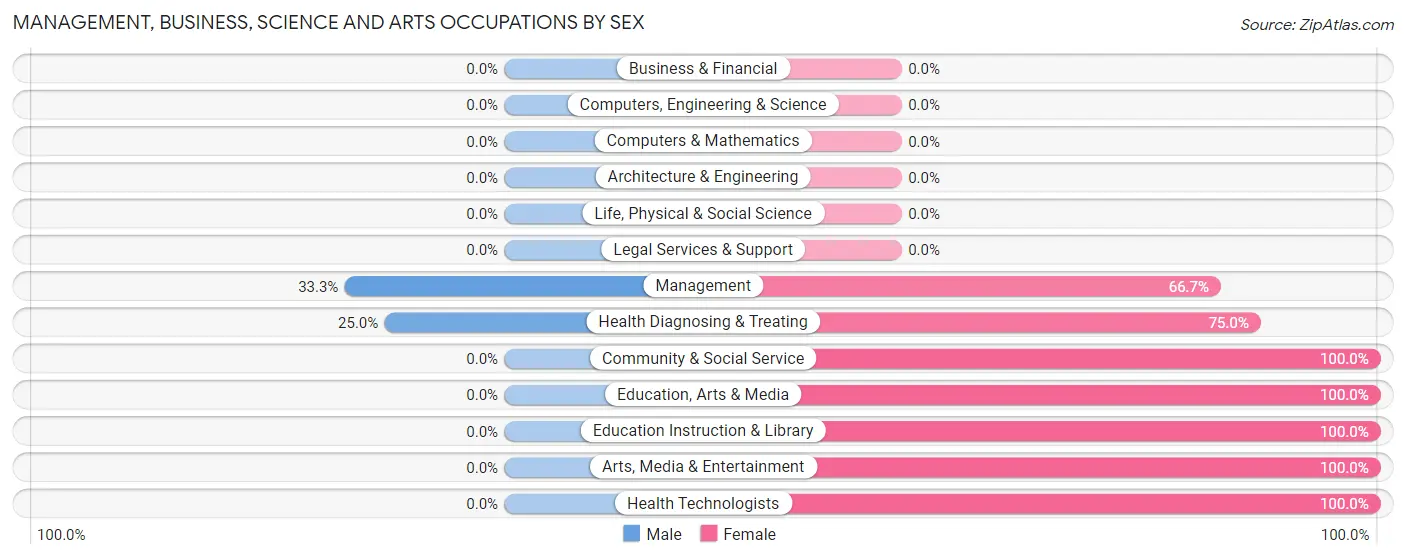
The most common Management, Business, Science and Arts occupations in Roscommon are Community & Social Service (16 | 4.5%), Health Diagnosing & Treating (16 | 4.5%), Health Technologists (12 | 3.4%), Management (9 | 2.5%), and Arts, Media & Entertainment (7 | 2.0%).
Management, Business, Science and Arts Occupations by Sex
Within the Management, Business, Science and Arts occupations in Roscommon, the most male-oriented occupations are Management (33.3%), and Health Diagnosing & Treating (25.0%), while the most female-oriented occupations are Community & Social Service (100.0%), Education, Arts & Media (100.0%), and Education Instruction & Library (100.0%).
| Occupation | Male | Female |
| Management | 3 (33.3%) | 6 (66.7%) |
| Business & Financial | 0 (0.0%) | 0 (0.0%) |
| Computers, Engineering & Science | 0 (0.0%) | 0 (0.0%) |
| Computers & Mathematics | 0 (0.0%) | 0 (0.0%) |
| Architecture & Engineering | 0 (0.0%) | 0 (0.0%) |
| Life, Physical & Social Science | 0 (0.0%) | 0 (0.0%) |
| Community & Social Service | 0 (0.0%) | 16 (100.0%) |
| Education, Arts & Media | 0 (0.0%) | 6 (100.0%) |
| Legal Services & Support | 0 (0.0%) | 0 (0.0%) |
| Education Instruction & Library | 0 (0.0%) | 3 (100.0%) |
| Arts, Media & Entertainment | 0 (0.0%) | 7 (100.0%) |
| Health Diagnosing & Treating | 4 (25.0%) | 12 (75.0%) |
| Health Technologists | 0 (0.0%) | 12 (100.0%) |
| Total (Category) | 7 (17.1%) | 34 (82.9%) |
| Total (Overall) | 199 (55.7%) | 158 (44.3%) |
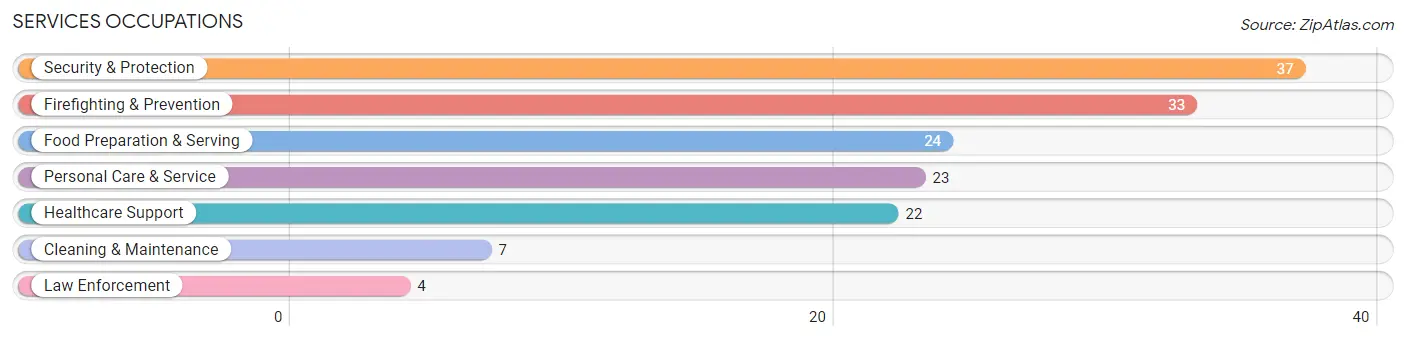
Services Occupations
The most common Services occupations in Roscommon are Security & Protection (37 | 10.4%), Firefighting & Prevention (33 | 9.2%), Food Preparation & Serving (24 | 6.7%), Personal Care & Service (23 | 6.4%), and Healthcare Support (22 | 6.2%).
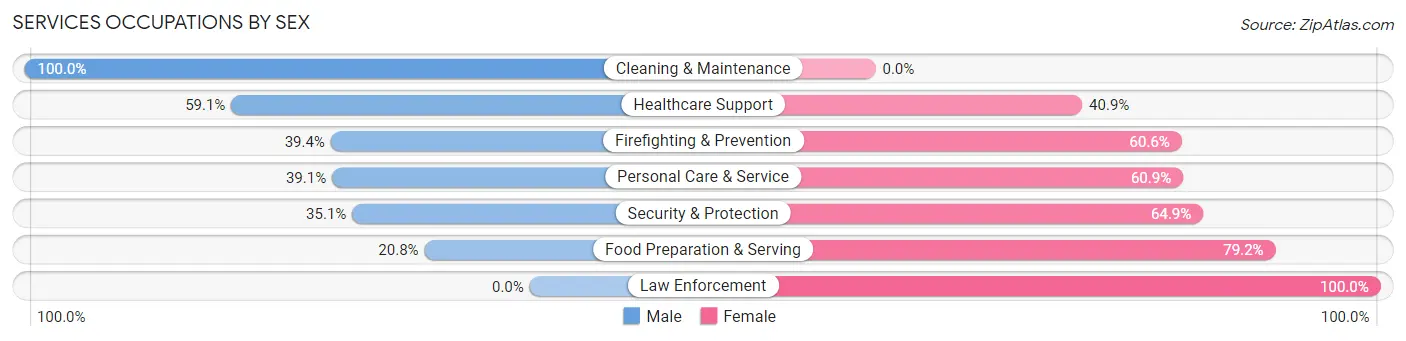
Services Occupations by Sex
Within the Services occupations in Roscommon, the most male-oriented occupations are Cleaning & Maintenance (100.0%), Healthcare Support (59.1%), and Firefighting & Prevention (39.4%), while the most female-oriented occupations are Law Enforcement (100.0%), Food Preparation & Serving (79.2%), and Security & Protection (64.9%).
| Occupation | Male | Female |
| Healthcare Support | 13 (59.1%) | 9 (40.9%) |
| Security & Protection | 13 (35.1%) | 24 (64.9%) |
| Firefighting & Prevention | 13 (39.4%) | 20 (60.6%) |
| Law Enforcement | 0 (0.0%) | 4 (100.0%) |
| Food Preparation & Serving | 5 (20.8%) | 19 (79.2%) |
| Cleaning & Maintenance | 7 (100.0%) | 0 (0.0%) |
| Personal Care & Service | 9 (39.1%) | 14 (60.9%) |
| Total (Category) | 47 (41.6%) | 66 (58.4%) |
| Total (Overall) | 199 (55.7%) | 158 (44.3%) |
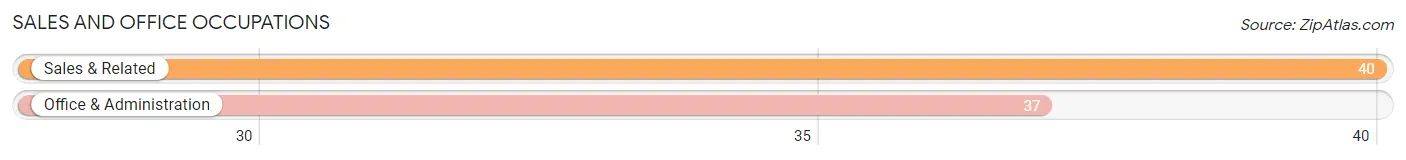
Sales and Office Occupations
The most common Sales and Office occupations in Roscommon are Sales & Related (40 | 11.2%), and Office & Administration (37 | 10.4%).
Sales and Office Occupations by Sex
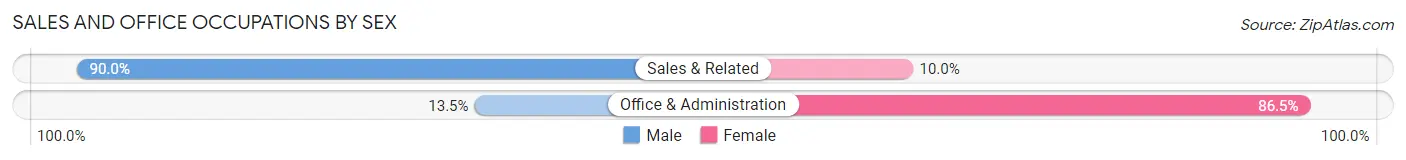
| Occupation | Male | Female |
| Sales & Related | 36 (90.0%) | 4 (10.0%) |
| Office & Administration | 5 (13.5%) | 32 (86.5%) |
| Total (Category) | 41 (53.2%) | 36 (46.8%) |
| Total (Overall) | 199 (55.7%) | 158 (44.3%) |
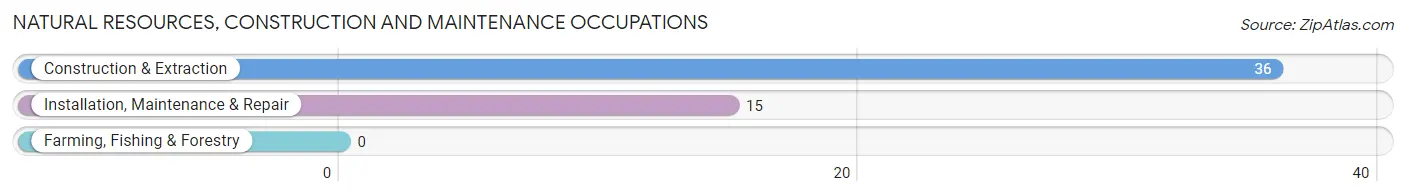
Natural Resources, Construction and Maintenance Occupations
The most common Natural Resources, Construction and Maintenance occupations in Roscommon are Construction & Extraction (36 | 10.1%), and Installation, Maintenance & Repair (15 | 4.2%).
Natural Resources, Construction and Maintenance Occupations by Sex
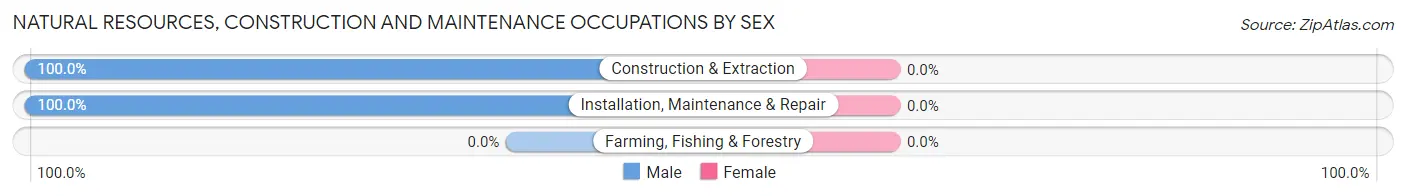
| Occupation | Male | Female |
| Farming, Fishing & Forestry | 0 (0.0%) | 0 (0.0%) |
| Construction & Extraction | 36 (100.0%) | 0 (0.0%) |
| Installation, Maintenance & Repair | 15 (100.0%) | 0 (0.0%) |
| Total (Category) | 51 (100.0%) | 0 (0.0%) |
| Total (Overall) | 199 (55.7%) | 158 (44.3%) |
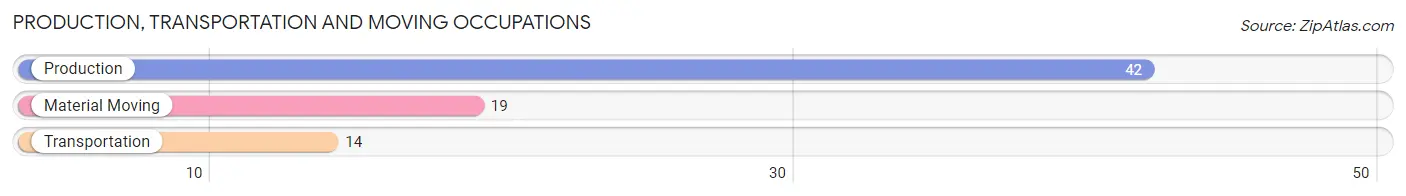
Production, Transportation and Moving Occupations
The most common Production, Transportation and Moving occupations in Roscommon are Production (42 | 11.8%), Material Moving (19 | 5.3%), and Transportation (14 | 3.9%).
Production, Transportation and Moving Occupations by Sex
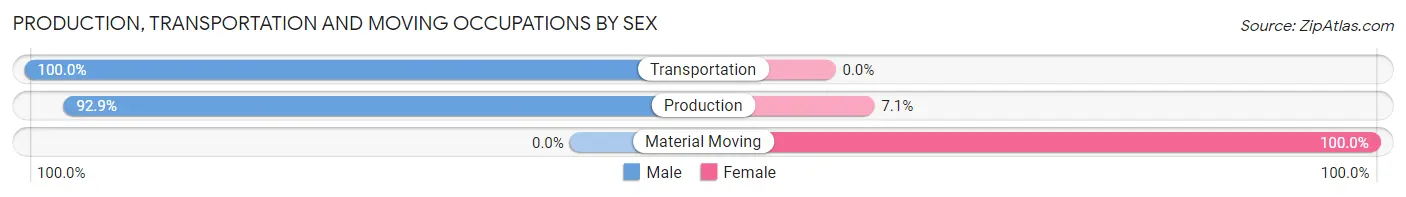
| Occupation | Male | Female |
| Production | 39 (92.9%) | 3 (7.1%) |
| Transportation | 14 (100.0%) | 0 (0.0%) |
| Material Moving | 0 (0.0%) | 19 (100.0%) |
| Total (Category) | 53 (70.7%) | 22 (29.3%) |
| Total (Overall) | 199 (55.7%) | 158 (44.3%) |
Employment Industries by Sex in Roscommon
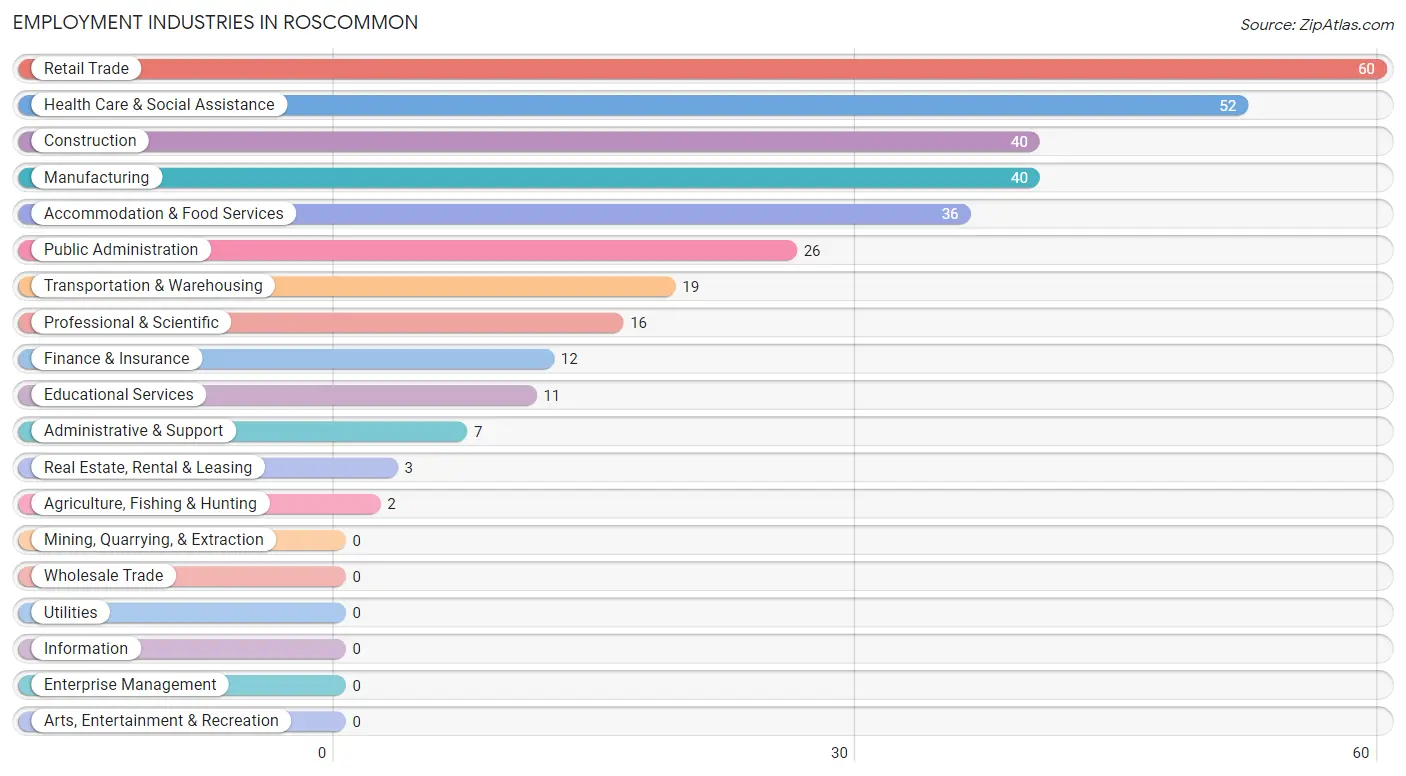
Employment Industries in Roscommon
The major employment industries in Roscommon include Retail Trade (60 | 16.8%), Health Care & Social Assistance (52 | 14.6%), Construction (40 | 11.2%), Manufacturing (40 | 11.2%), and Accommodation & Food Services (36 | 10.1%).
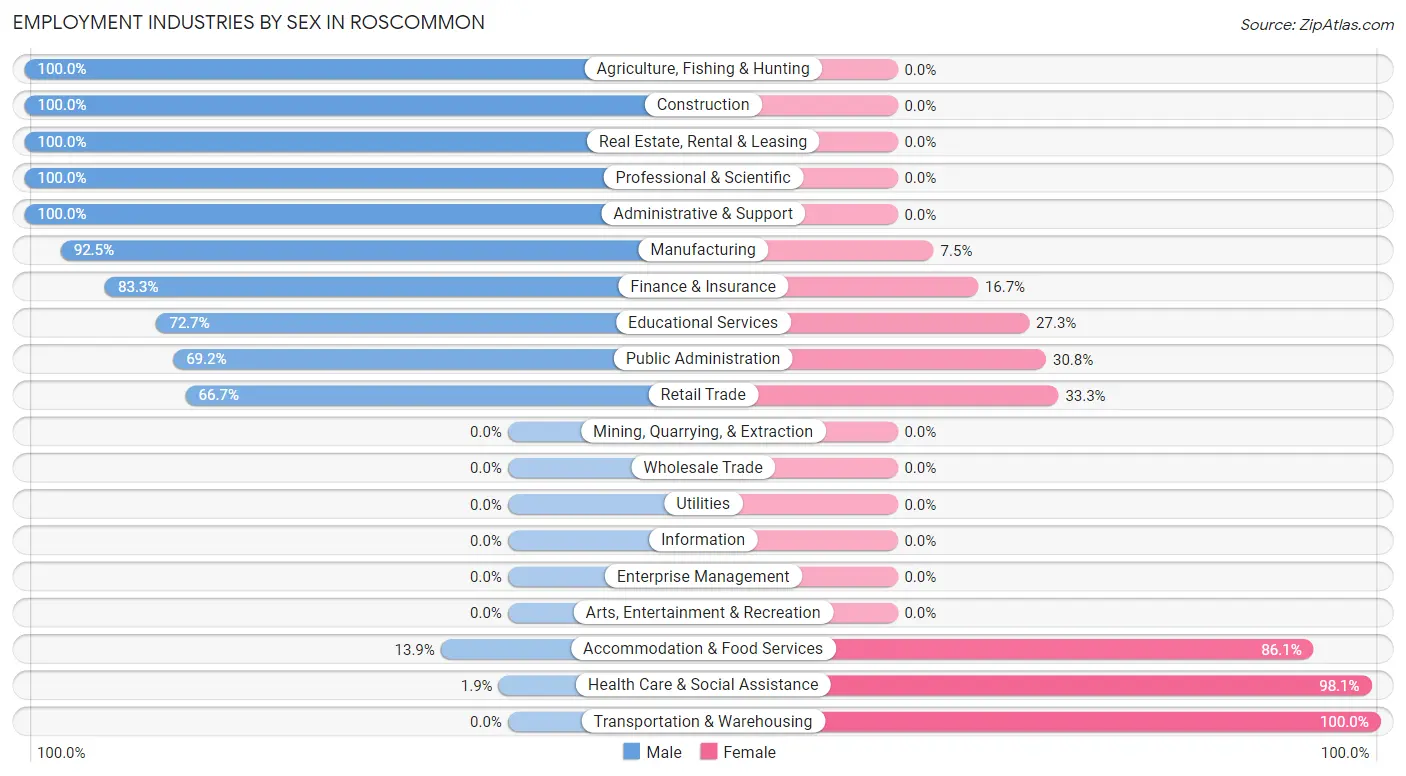
Employment Industries by Sex in Roscommon
The Roscommon industries that see more men than women are Agriculture, Fishing & Hunting (100.0%), Construction (100.0%), and Real Estate, Rental & Leasing (100.0%), whereas the industries that tend to have a higher number of women are Transportation & Warehousing (100.0%), Health Care & Social Assistance (98.1%), and Accommodation & Food Services (86.1%).
| Industry | Male | Female |
| Agriculture, Fishing & Hunting | 2 (100.0%) | 0 (0.0%) |
| Mining, Quarrying, & Extraction | 0 (0.0%) | 0 (0.0%) |
| Construction | 40 (100.0%) | 0 (0.0%) |
| Manufacturing | 37 (92.5%) | 3 (7.5%) |
| Wholesale Trade | 0 (0.0%) | 0 (0.0%) |
| Retail Trade | 40 (66.7%) | 20 (33.3%) |
| Transportation & Warehousing | 0 (0.0%) | 19 (100.0%) |
| Utilities | 0 (0.0%) | 0 (0.0%) |
| Information | 0 (0.0%) | 0 (0.0%) |
| Finance & Insurance | 10 (83.3%) | 2 (16.7%) |
| Real Estate, Rental & Leasing | 3 (100.0%) | 0 (0.0%) |
| Professional & Scientific | 16 (100.0%) | 0 (0.0%) |
| Enterprise Management | 0 (0.0%) | 0 (0.0%) |
| Administrative & Support | 7 (100.0%) | 0 (0.0%) |
| Educational Services | 8 (72.7%) | 3 (27.3%) |
| Health Care & Social Assistance | 1 (1.9%) | 51 (98.1%) |
| Arts, Entertainment & Recreation | 0 (0.0%) | 0 (0.0%) |
| Accommodation & Food Services | 5 (13.9%) | 31 (86.1%) |
| Public Administration | 18 (69.2%) | 8 (30.8%) |
| Total | 199 (55.7%) | 158 (44.3%) |
Education in Roscommon
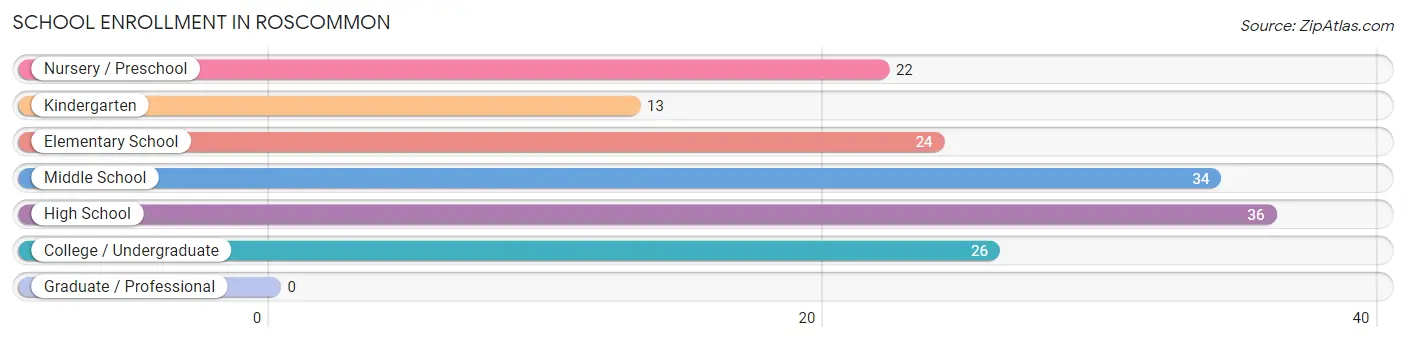
School Enrollment in Roscommon
The most common levels of schooling among the 155 students in Roscommon are high school (36 | 23.2%), middle school (34 | 21.9%), and college / undergraduate (26 | 16.8%).
| School Level | # Students | % Students |
| Nursery / Preschool | 22 | 14.2% |
| Kindergarten | 13 | 8.4% |
| Elementary School | 24 | 15.5% |
| Middle School | 34 | 21.9% |
| High School | 36 | 23.2% |
| College / Undergraduate | 26 | 16.8% |
| Graduate / Professional | 0 | 0.0% |
| Total | 155 | 100.0% |
School Enrollment by Age by Funding Source in Roscommon
Out of a total of 155 students who are enrolled in schools in Roscommon, 11 (7.1%) attend a private institution, while the remaining 144 (92.9%) are enrolled in public schools. The age group of 20 to 24 year olds has the highest likelihood of being enrolled in private schools, with 3 (100.0% in the age bracket) enrolled. Conversely, the age group of 3 to 4 year olds has the lowest likelihood of being enrolled in a private school, with 14 (100.0% in the age bracket) attending a public institution.
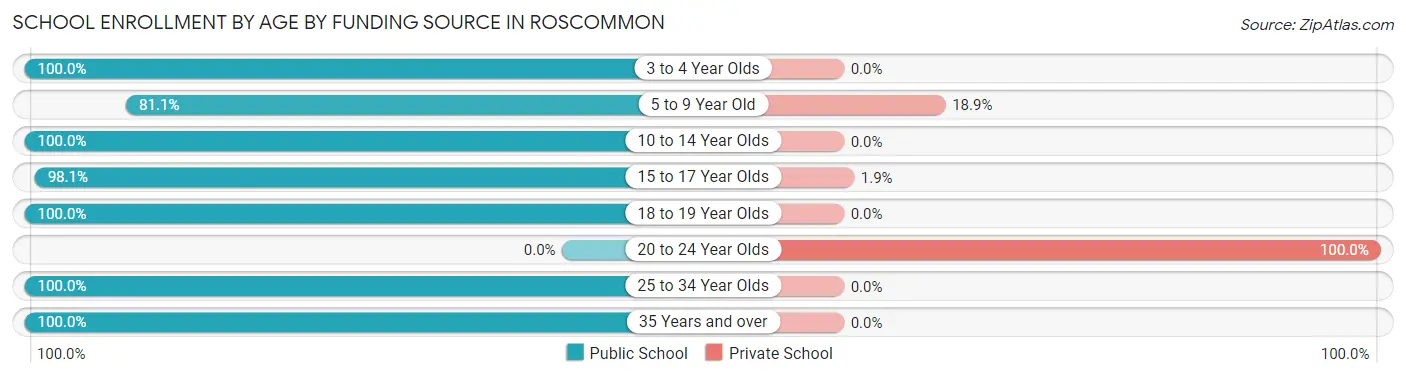
| Age Bracket | Public School | Private School |
| 3 to 4 Year Olds | 14 (100.0%) | 0 (0.0%) |
| 5 to 9 Year Old | 30 (81.1%) | 7 (18.9%) |
| 10 to 14 Year Olds | 24 (100.0%) | 0 (0.0%) |
| 15 to 17 Year Olds | 52 (98.1%) | 1 (1.9%) |
| 18 to 19 Year Olds | 5 (100.0%) | 0 (0.0%) |
| 20 to 24 Year Olds | 0 (0.0%) | 3 (100.0%) |
| 25 to 34 Year Olds | 4 (100.0%) | 0 (0.0%) |
| 35 Years and over | 15 (100.0%) | 0 (0.0%) |
| Total | 144 (92.9%) | 11 (7.1%) |
Educational Attainment by Field of Study in Roscommon
Education (24 | 35.8%), social sciences (11 | 16.4%), business (9 | 13.4%), arts & humanities (7 | 10.4%), and science & technology (6 | 9.0%) are the most common fields of study among 67 individuals in Roscommon who have obtained a bachelor's degree or higher.
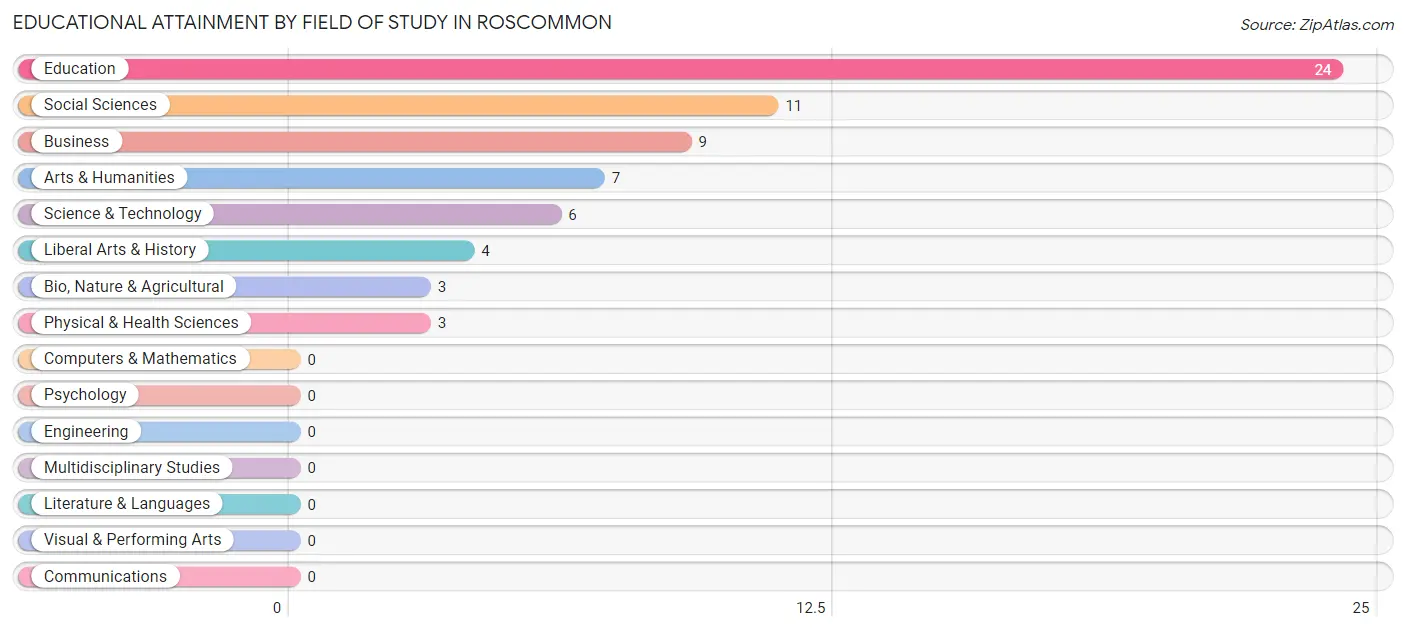
| Field of Study | # Graduates | % Graduates |
| Computers & Mathematics | 0 | 0.0% |
| Bio, Nature & Agricultural | 3 | 4.5% |
| Physical & Health Sciences | 3 | 4.5% |
| Psychology | 0 | 0.0% |
| Social Sciences | 11 | 16.4% |
| Engineering | 0 | 0.0% |
| Multidisciplinary Studies | 0 | 0.0% |
| Science & Technology | 6 | 9.0% |
| Business | 9 | 13.4% |
| Education | 24 | 35.8% |
| Literature & Languages | 0 | 0.0% |
| Liberal Arts & History | 4 | 6.0% |
| Visual & Performing Arts | 0 | 0.0% |
| Communications | 0 | 0.0% |
| Arts & Humanities | 7 | 10.4% |
| Total | 67 | 100.0% |
Transportation & Commute in Roscommon
Vehicle Availability by Sex in Roscommon
The most prevalent vehicle ownership categories in Roscommon are males with 1 vehicle (72, accounting for 36.4%) and females with 1 vehicle (38, making up 45.6%).
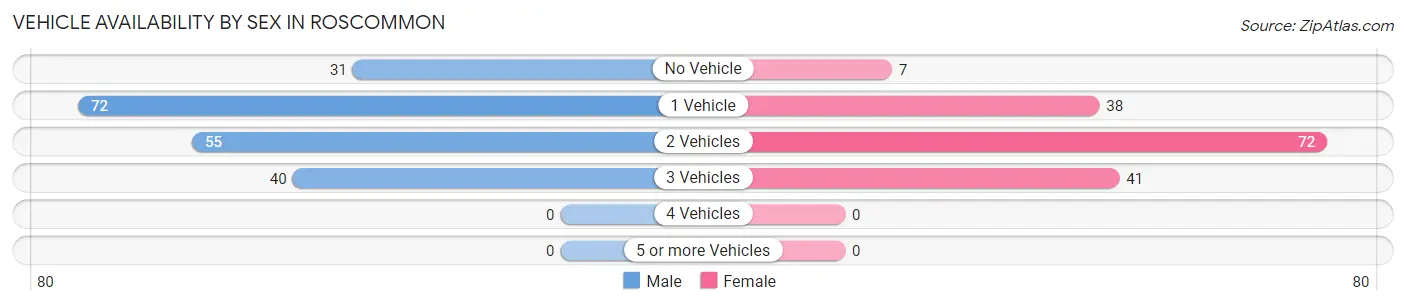
| Vehicles Available | Male | Female |
| No Vehicle | 31 (15.7%) | 7 (4.4%) |
| 1 Vehicle | 72 (36.4%) | 38 (24.0%) |
| 2 Vehicles | 55 (27.8%) | 72 (45.6%) |
| 3 Vehicles | 40 (20.2%) | 41 (26.0%) |
| 4 Vehicles | 0 (0.0%) | 0 (0.0%) |
| 5 or more Vehicles | 0 (0.0%) | 0 (0.0%) |
| Total | 198 (100.0%) | 158 (100.0%) |
Commute Time in Roscommon
The most frequently occuring commute durations in Roscommon are less than 5 minutes (92 commuters, 27.9%), 5 to 9 minutes (73 commuters, 22.1%), and 20 to 24 minutes (51 commuters, 15.4%).
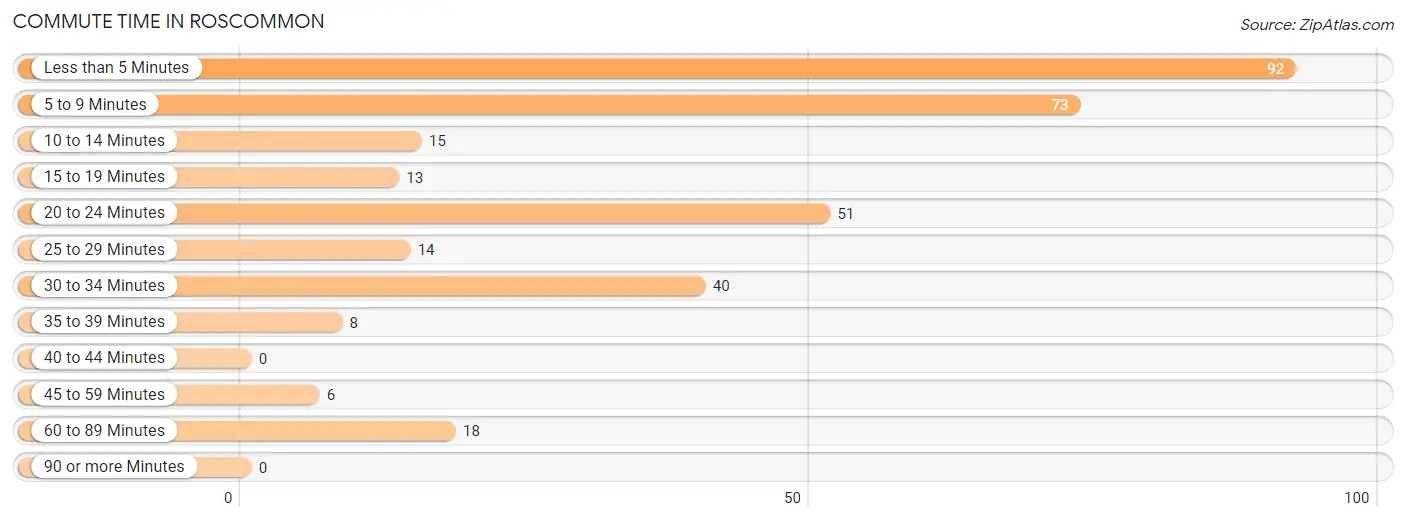
| Commute Time | # Commuters | % Commuters |
| Less than 5 Minutes | 92 | 27.9% |
| 5 to 9 Minutes | 73 | 22.1% |
| 10 to 14 Minutes | 15 | 4.5% |
| 15 to 19 Minutes | 13 | 3.9% |
| 20 to 24 Minutes | 51 | 15.4% |
| 25 to 29 Minutes | 14 | 4.2% |
| 30 to 34 Minutes | 40 | 12.1% |
| 35 to 39 Minutes | 8 | 2.4% |
| 40 to 44 Minutes | 0 | 0.0% |
| 45 to 59 Minutes | 6 | 1.8% |
| 60 to 89 Minutes | 18 | 5.4% |
| 90 or more Minutes | 0 | 0.0% |
Commute Time by Sex in Roscommon
The most common commute times in Roscommon are 5 to 9 minutes (65 commuters, 33.7%) for males and less than 5 minutes (59 commuters, 43.1%) for females.
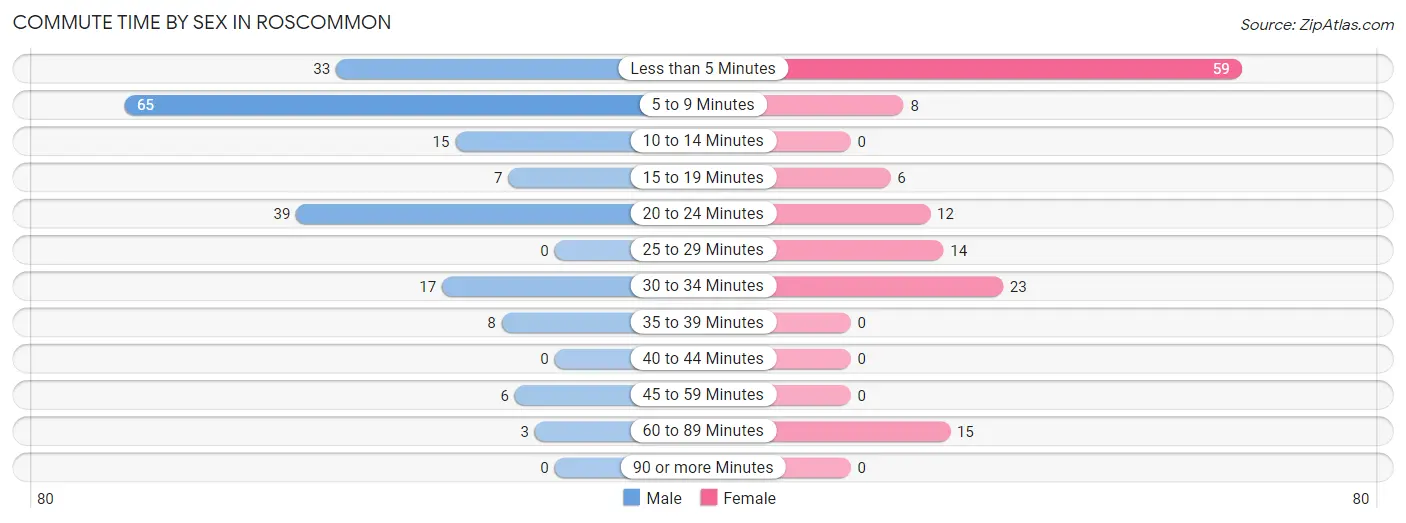
| Commute Time | Male | Female |
| Less than 5 Minutes | 33 (17.1%) | 59 (43.1%) |
| 5 to 9 Minutes | 65 (33.7%) | 8 (5.8%) |
| 10 to 14 Minutes | 15 (7.8%) | 0 (0.0%) |
| 15 to 19 Minutes | 7 (3.6%) | 6 (4.4%) |
| 20 to 24 Minutes | 39 (20.2%) | 12 (8.8%) |
| 25 to 29 Minutes | 0 (0.0%) | 14 (10.2%) |
| 30 to 34 Minutes | 17 (8.8%) | 23 (16.8%) |
| 35 to 39 Minutes | 8 (4.2%) | 0 (0.0%) |
| 40 to 44 Minutes | 0 (0.0%) | 0 (0.0%) |
| 45 to 59 Minutes | 6 (3.1%) | 0 (0.0%) |
| 60 to 89 Minutes | 3 (1.5%) | 15 (11.0%) |
| 90 or more Minutes | 0 (0.0%) | 0 (0.0%) |
Time of Departure to Work by Sex in Roscommon
The most frequent times of departure to work in Roscommon are 12:00 PM to 3:59 PM (40, 20.7%) for males and 4:00 PM to 11:59 PM (33, 24.1%) for females.
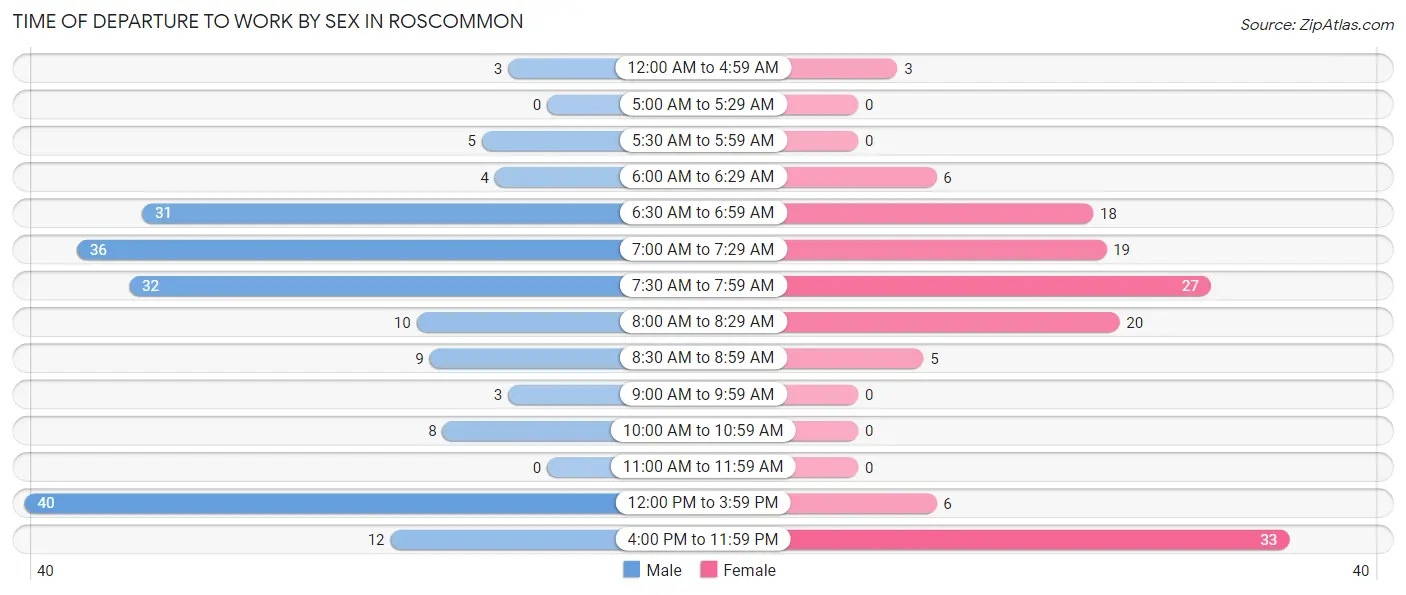
| Time of Departure | Male | Female |
| 12:00 AM to 4:59 AM | 3 (1.5%) | 3 (2.2%) |
| 5:00 AM to 5:29 AM | 0 (0.0%) | 0 (0.0%) |
| 5:30 AM to 5:59 AM | 5 (2.6%) | 0 (0.0%) |
| 6:00 AM to 6:29 AM | 4 (2.1%) | 6 (4.4%) |
| 6:30 AM to 6:59 AM | 31 (16.1%) | 18 (13.1%) |
| 7:00 AM to 7:29 AM | 36 (18.6%) | 19 (13.9%) |
| 7:30 AM to 7:59 AM | 32 (16.6%) | 27 (19.7%) |
| 8:00 AM to 8:29 AM | 10 (5.2%) | 20 (14.6%) |
| 8:30 AM to 8:59 AM | 9 (4.7%) | 5 (3.6%) |
| 9:00 AM to 9:59 AM | 3 (1.5%) | 0 (0.0%) |
| 10:00 AM to 10:59 AM | 8 (4.2%) | 0 (0.0%) |
| 11:00 AM to 11:59 AM | 0 (0.0%) | 0 (0.0%) |
| 12:00 PM to 3:59 PM | 40 (20.7%) | 6 (4.4%) |
| 4:00 PM to 11:59 PM | 12 (6.2%) | 33 (24.1%) |
| Total | 193 (100.0%) | 137 (100.0%) |
Housing Occupancy in Roscommon
Occupancy by Ownership in Roscommon
Of the total 533 dwellings in Roscommon, owner-occupied units account for 348 (65.3%), while renter-occupied units make up 185 (34.7%).
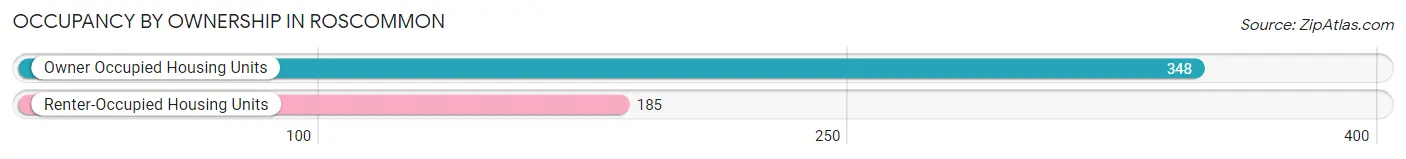
| Occupancy | # Housing Units | % Housing Units |
| Owner Occupied Housing Units | 348 | 65.3% |
| Renter-Occupied Housing Units | 185 | 34.7% |
| Total Occupied Housing Units | 533 | 100.0% |
Occupancy by Household Size in Roscommon
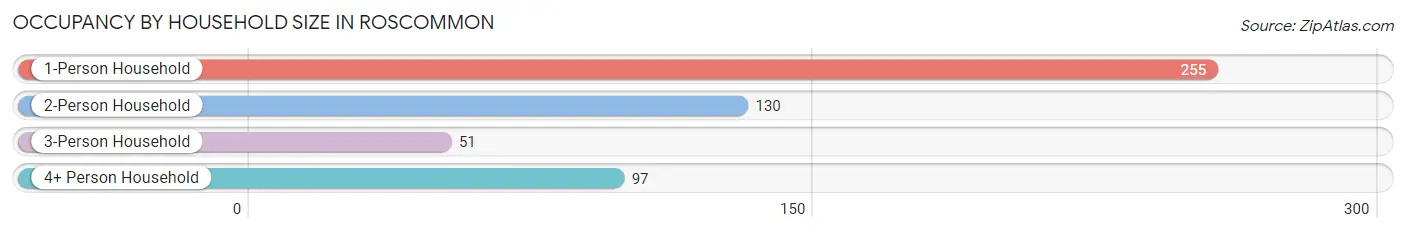
| Household Size | # Housing Units | % Housing Units |
| 1-Person Household | 255 | 47.8% |
| 2-Person Household | 130 | 24.4% |
| 3-Person Household | 51 | 9.6% |
| 4+ Person Household | 97 | 18.2% |
| Total Housing Units | 533 | 100.0% |
Occupancy by Ownership by Household Size in Roscommon
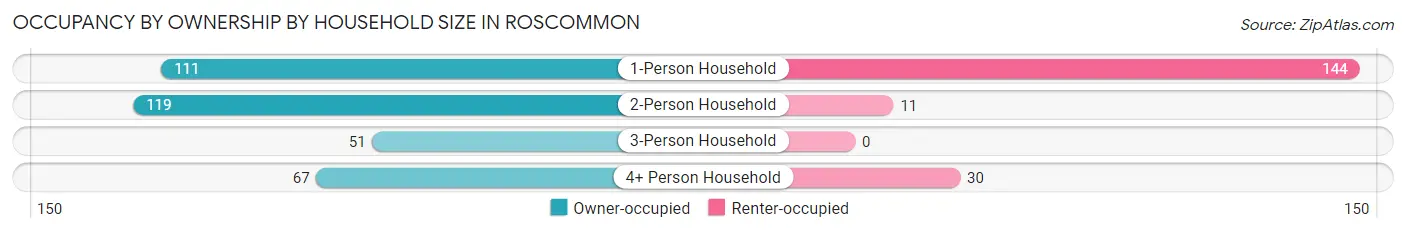
| Household Size | Owner-occupied | Renter-occupied |
| 1-Person Household | 111 (43.5%) | 144 (56.5%) |
| 2-Person Household | 119 (91.5%) | 11 (8.5%) |
| 3-Person Household | 51 (100.0%) | 0 (0.0%) |
| 4+ Person Household | 67 (69.1%) | 30 (30.9%) |
| Total Housing Units | 348 (65.3%) | 185 (34.7%) |
Occupancy by Educational Attainment in Roscommon
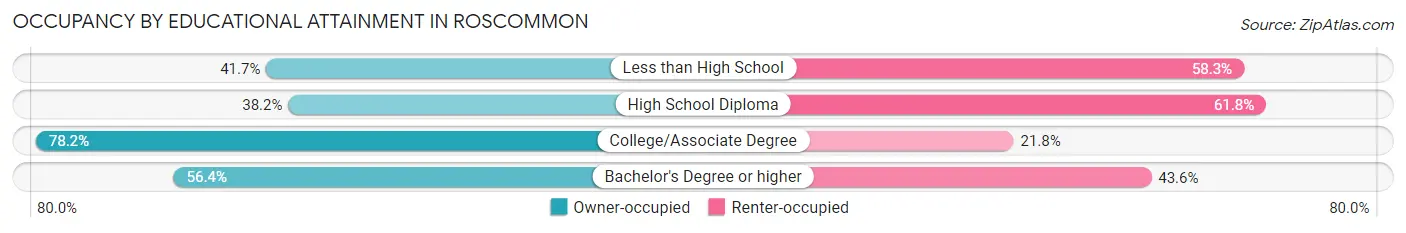
| Household Size | Owner-occupied | Renter-occupied |
| Less than High School | 5 (41.7%) | 7 (58.3%) |
| High School Diploma | 50 (38.2%) | 81 (61.8%) |
| College/Associate Degree | 262 (78.2%) | 73 (21.8%) |
| Bachelor's Degree or higher | 31 (56.4%) | 24 (43.6%) |
Occupancy by Age of Householder in Roscommon
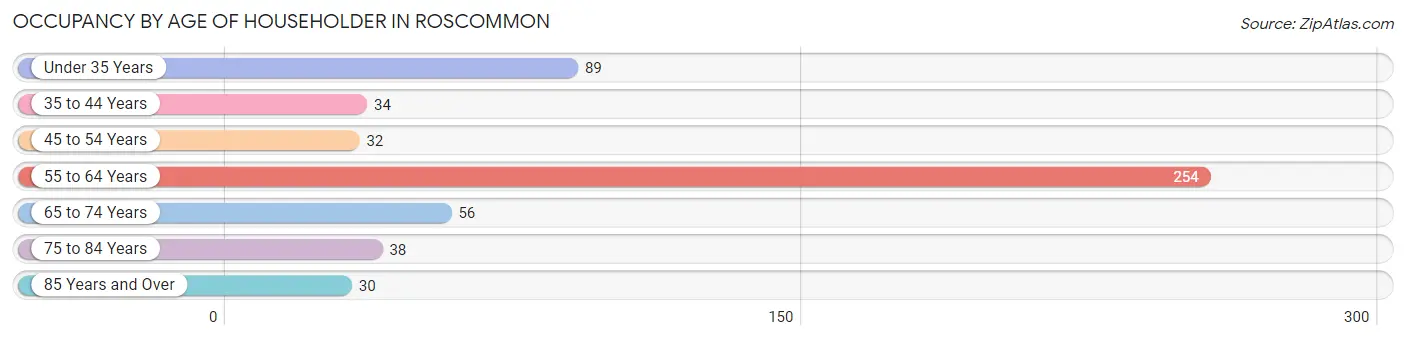
| Age Bracket | # Households | % Households |
| Under 35 Years | 89 | 16.7% |
| 35 to 44 Years | 34 | 6.4% |
| 45 to 54 Years | 32 | 6.0% |
| 55 to 64 Years | 254 | 47.6% |
| 65 to 74 Years | 56 | 10.5% |
| 75 to 84 Years | 38 | 7.1% |
| 85 Years and Over | 30 | 5.6% |
| Total | 533 | 100.0% |
Housing Finances in Roscommon
Median Income by Occupancy in Roscommon
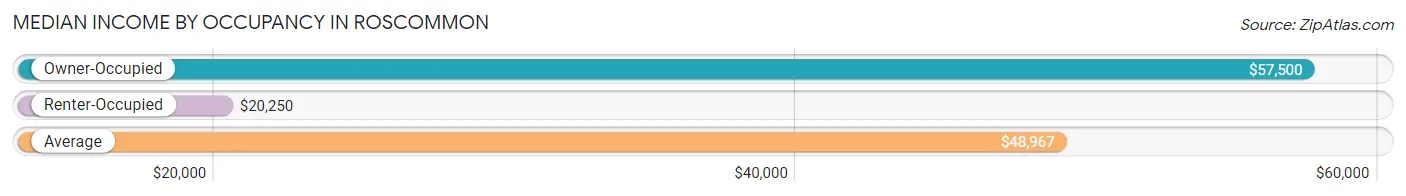
| Occupancy Type | # Households | Median Income |
| Owner-Occupied | 348 (65.3%) | $57,500 |
| Renter-Occupied | 185 (34.7%) | $20,250 |
| Average | 533 (100.0%) | $48,967 |
Occupancy by Householder Income Bracket in Roscommon
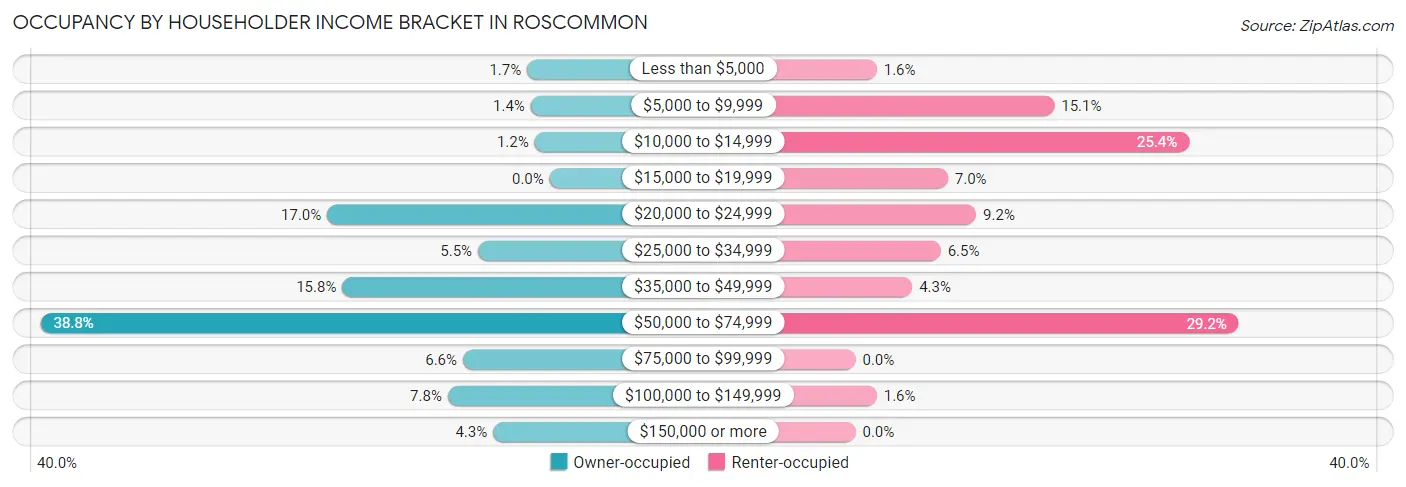
| Income Bracket | Owner-occupied | Renter-occupied |
| Less than $5,000 | 6 (1.7%) | 3 (1.6%) |
| $5,000 to $9,999 | 5 (1.4%) | 28 (15.1%) |
| $10,000 to $14,999 | 4 (1.1%) | 47 (25.4%) |
| $15,000 to $19,999 | 0 (0.0%) | 13 (7.0%) |
| $20,000 to $24,999 | 59 (17.0%) | 17 (9.2%) |
| $25,000 to $34,999 | 19 (5.5%) | 12 (6.5%) |
| $35,000 to $49,999 | 55 (15.8%) | 8 (4.3%) |
| $50,000 to $74,999 | 135 (38.8%) | 54 (29.2%) |
| $75,000 to $99,999 | 23 (6.6%) | 0 (0.0%) |
| $100,000 to $149,999 | 27 (7.8%) | 3 (1.6%) |
| $150,000 or more | 15 (4.3%) | 0 (0.0%) |
| Total | 348 (100.0%) | 185 (100.0%) |
Monthly Housing Cost Tiers in Roscommon
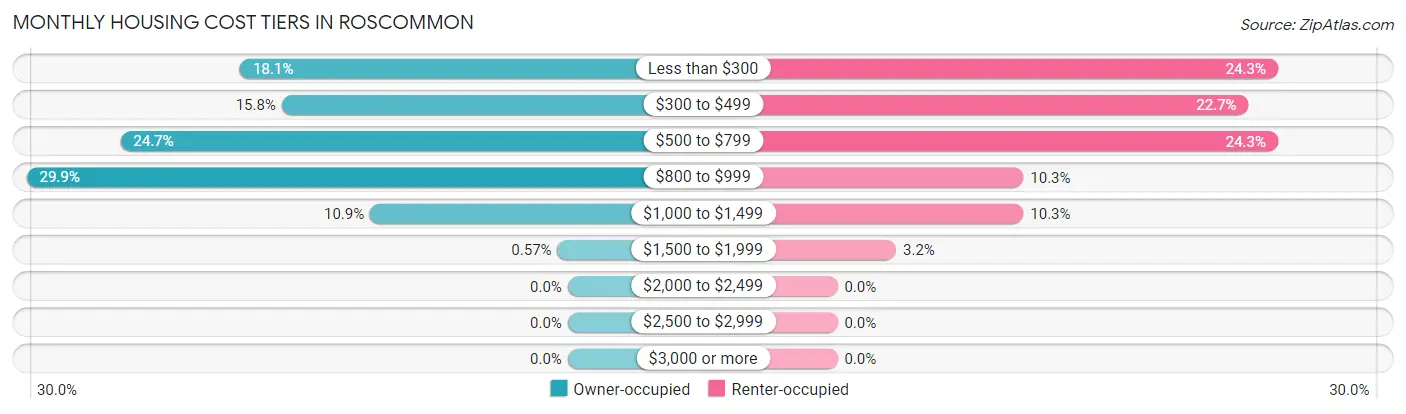
| Monthly Cost | Owner-occupied | Renter-occupied |
| Less than $300 | 63 (18.1%) | 45 (24.3%) |
| $300 to $499 | 55 (15.8%) | 42 (22.7%) |
| $500 to $799 | 86 (24.7%) | 45 (24.3%) |
| $800 to $999 | 104 (29.9%) | 19 (10.3%) |
| $1,000 to $1,499 | 38 (10.9%) | 19 (10.3%) |
| $1,500 to $1,999 | 2 (0.6%) | 6 (3.2%) |
| $2,000 to $2,499 | 0 (0.0%) | 0 (0.0%) |
| $2,500 to $2,999 | 0 (0.0%) | 0 (0.0%) |
| $3,000 or more | 0 (0.0%) | 0 (0.0%) |
| Total | 348 (100.0%) | 185 (100.0%) |
Physical Housing Characteristics in Roscommon
Housing Structures in Roscommon
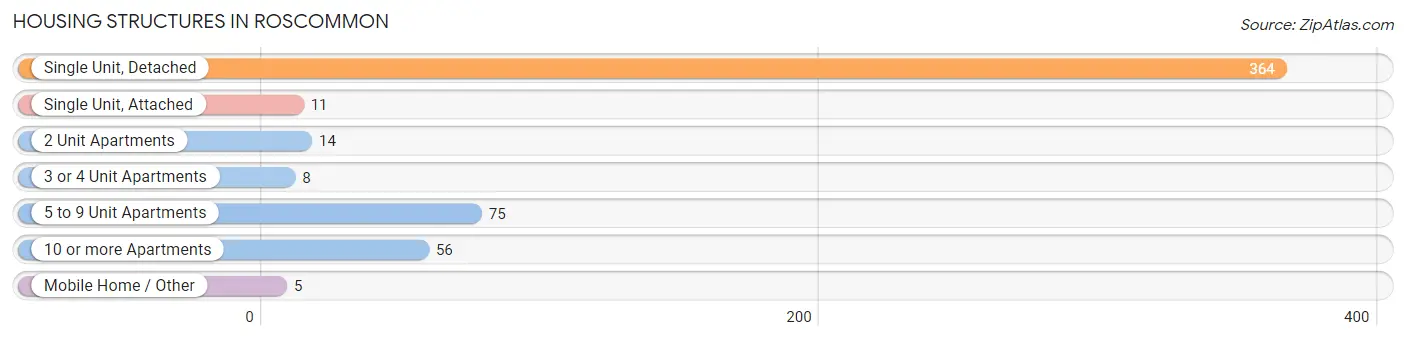
| Structure Type | # Housing Units | % Housing Units |
| Single Unit, Detached | 364 | 68.3% |
| Single Unit, Attached | 11 | 2.1% |
| 2 Unit Apartments | 14 | 2.6% |
| 3 or 4 Unit Apartments | 8 | 1.5% |
| 5 to 9 Unit Apartments | 75 | 14.1% |
| 10 or more Apartments | 56 | 10.5% |
| Mobile Home / Other | 5 | 0.9% |
| Total | 533 | 100.0% |
Housing Structures by Occupancy in Roscommon
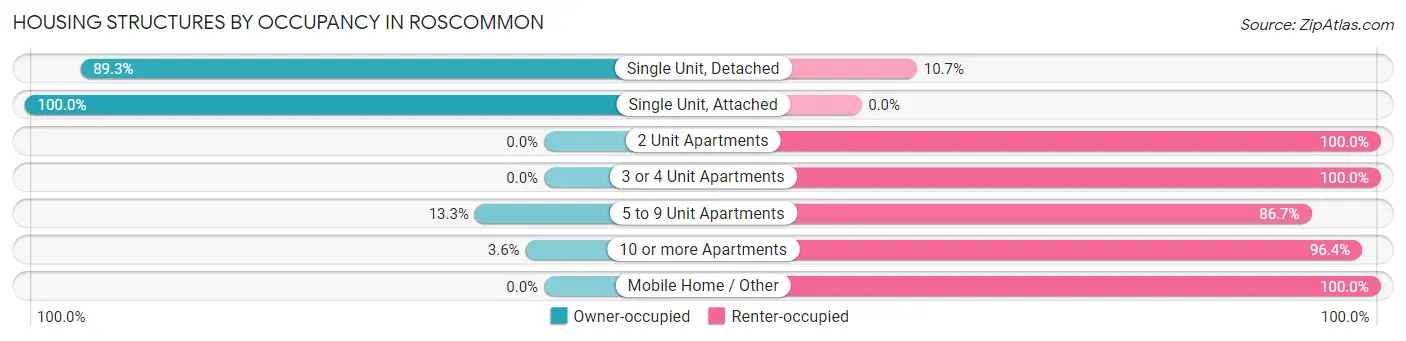
| Structure Type | Owner-occupied | Renter-occupied |
| Single Unit, Detached | 325 (89.3%) | 39 (10.7%) |
| Single Unit, Attached | 11 (100.0%) | 0 (0.0%) |
| 2 Unit Apartments | 0 (0.0%) | 14 (100.0%) |
| 3 or 4 Unit Apartments | 0 (0.0%) | 8 (100.0%) |
| 5 to 9 Unit Apartments | 10 (13.3%) | 65 (86.7%) |
| 10 or more Apartments | 2 (3.6%) | 54 (96.4%) |
| Mobile Home / Other | 0 (0.0%) | 5 (100.0%) |
| Total | 348 (65.3%) | 185 (34.7%) |
Housing Structures by Number of Rooms in Roscommon
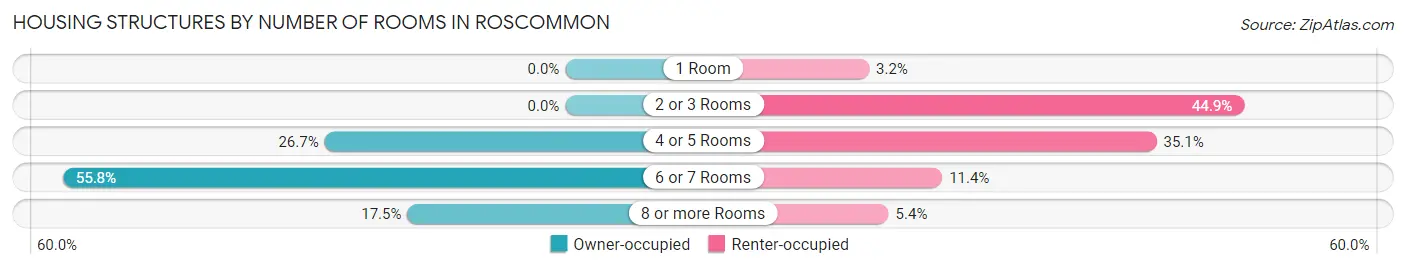
| Number of Rooms | Owner-occupied | Renter-occupied |
| 1 Room | 0 (0.0%) | 6 (3.2%) |
| 2 or 3 Rooms | 0 (0.0%) | 83 (44.9%) |
| 4 or 5 Rooms | 93 (26.7%) | 65 (35.1%) |
| 6 or 7 Rooms | 194 (55.7%) | 21 (11.4%) |
| 8 or more Rooms | 61 (17.5%) | 10 (5.4%) |
| Total | 348 (100.0%) | 185 (100.0%) |
Housing Structure by Heating Type in Roscommon
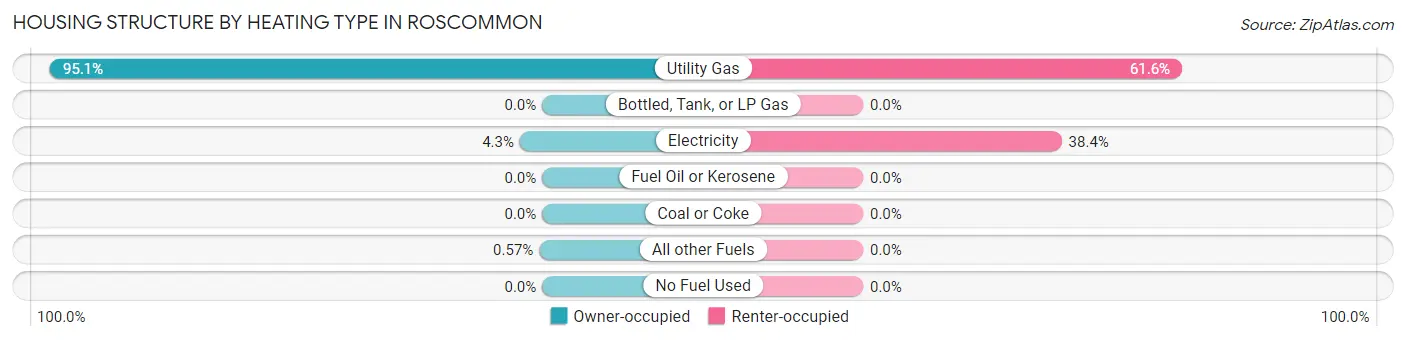
| Heating Type | Owner-occupied | Renter-occupied |
| Utility Gas | 331 (95.1%) | 114 (61.6%) |
| Bottled, Tank, or LP Gas | 0 (0.0%) | 0 (0.0%) |
| Electricity | 15 (4.3%) | 71 (38.4%) |
| Fuel Oil or Kerosene | 0 (0.0%) | 0 (0.0%) |
| Coal or Coke | 0 (0.0%) | 0 (0.0%) |
| All other Fuels | 2 (0.6%) | 0 (0.0%) |
| No Fuel Used | 0 (0.0%) | 0 (0.0%) |
| Total | 348 (100.0%) | 185 (100.0%) |
Household Vehicle Usage in Roscommon
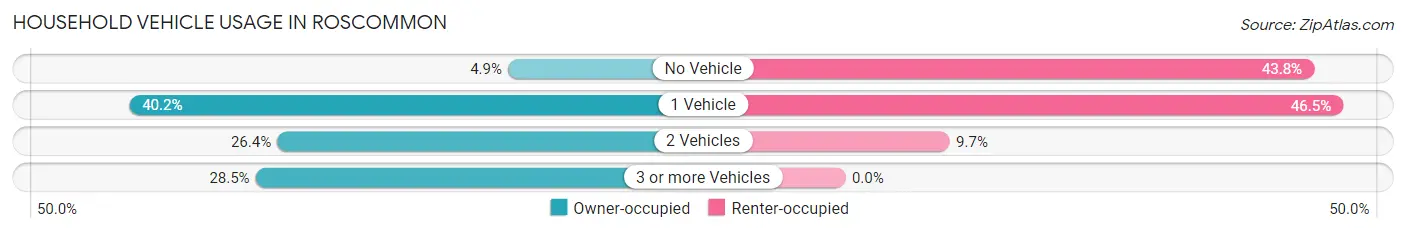
| Vehicles per Household | Owner-occupied | Renter-occupied |
| No Vehicle | 17 (4.9%) | 81 (43.8%) |
| 1 Vehicle | 140 (40.2%) | 86 (46.5%) |
| 2 Vehicles | 92 (26.4%) | 18 (9.7%) |
| 3 or more Vehicles | 99 (28.4%) | 0 (0.0%) |
| Total | 348 (100.0%) | 185 (100.0%) |
Real Estate & Mortgages in Roscommon
Real Estate and Mortgage Overview in Roscommon
| Characteristic | Without Mortgage | With Mortgage |
| Housing Units | 138 | 210 |
| Median Property Value | $74,500 | $82,800 |
| Median Household Income | $30,000 | $12 |
| Monthly Housing Costs | $319 | $0 |
| Real Estate Taxes | $950 | $0 |
Property Value by Mortgage Status in Roscommon
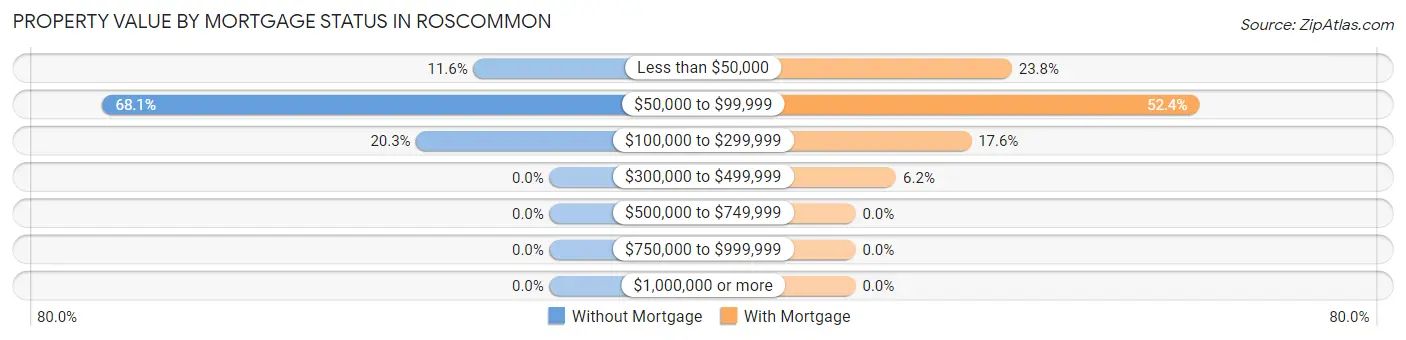
| Property Value | Without Mortgage | With Mortgage |
| Less than $50,000 | 16 (11.6%) | 50 (23.8%) |
| $50,000 to $99,999 | 94 (68.1%) | 110 (52.4%) |
| $100,000 to $299,999 | 28 (20.3%) | 37 (17.6%) |
| $300,000 to $499,999 | 0 (0.0%) | 13 (6.2%) |
| $500,000 to $749,999 | 0 (0.0%) | 0 (0.0%) |
| $750,000 to $999,999 | 0 (0.0%) | 0 (0.0%) |
| $1,000,000 or more | 0 (0.0%) | 0 (0.0%) |
| Total | 138 (100.0%) | 210 (100.0%) |
Household Income by Mortgage Status in Roscommon
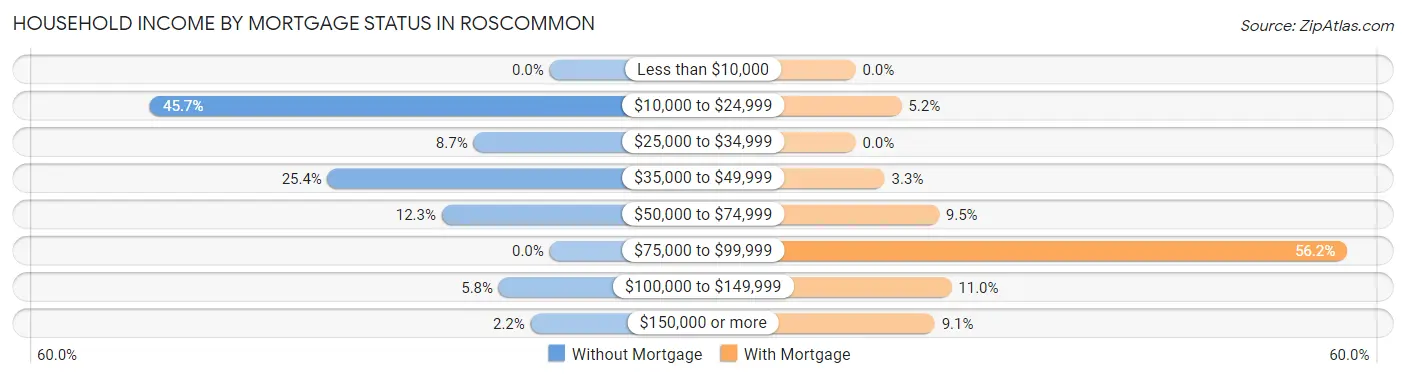
| Household Income | Without Mortgage | With Mortgage |
| Less than $10,000 | 0 (0.0%) | 0 (0.0%) |
| $10,000 to $24,999 | 63 (45.7%) | 11 (5.2%) |
| $25,000 to $34,999 | 12 (8.7%) | 0 (0.0%) |
| $35,000 to $49,999 | 35 (25.4%) | 7 (3.3%) |
| $50,000 to $74,999 | 17 (12.3%) | 20 (9.5%) |
| $75,000 to $99,999 | 0 (0.0%) | 118 (56.2%) |
| $100,000 to $149,999 | 8 (5.8%) | 23 (11.0%) |
| $150,000 or more | 3 (2.2%) | 19 (9.0%) |
| Total | 138 (100.0%) | 210 (100.0%) |
Property Value to Household Income Ratio in Roscommon
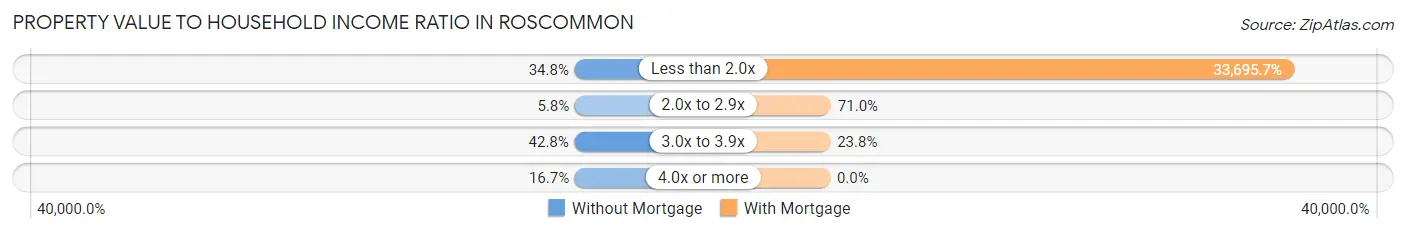
| Value-to-Income Ratio | Without Mortgage | With Mortgage |
| Less than 2.0x | 48 (34.8%) | 70,761 (33,695.7%) |
| 2.0x to 2.9x | 8 (5.8%) | 149 (71.0%) |
| 3.0x to 3.9x | 59 (42.7%) | 50 (23.8%) |
| 4.0x or more | 23 (16.7%) | 0 (0.0%) |
| Total | 138 (100.0%) | 210 (100.0%) |
Real Estate Taxes by Mortgage Status in Roscommon
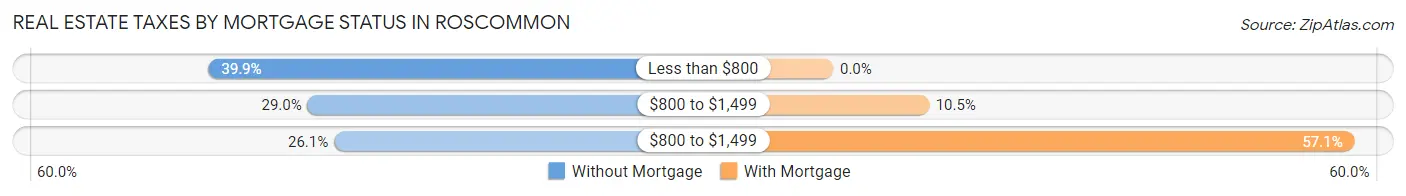
| Property Taxes | Without Mortgage | With Mortgage |
| Less than $800 | 55 (39.9%) | 0 (0.0%) |
| $800 to $1,499 | 40 (29.0%) | 22 (10.5%) |
| $800 to $1,499 | 36 (26.1%) | 120 (57.1%) |
| Total | 138 (100.0%) | 210 (100.0%) |
Health & Disability in Roscommon
Health Insurance Coverage by Age in Roscommon
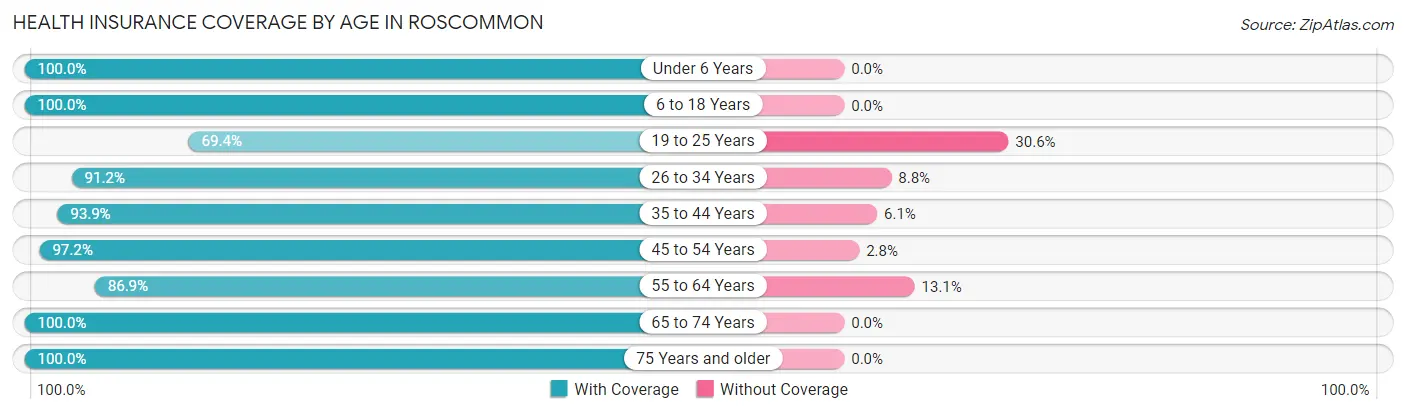
| Age Bracket | With Coverage | Without Coverage |
| Under 6 Years | 58 (100.0%) | 0 (0.0%) |
| 6 to 18 Years | 110 (100.0%) | 0 (0.0%) |
| 19 to 25 Years | 93 (69.4%) | 41 (30.6%) |
| 26 to 34 Years | 52 (91.2%) | 5 (8.8%) |
| 35 to 44 Years | 46 (93.9%) | 3 (6.1%) |
| 45 to 54 Years | 70 (97.2%) | 2 (2.8%) |
| 55 to 64 Years | 265 (86.9%) | 40 (13.1%) |
| 65 to 74 Years | 133 (100.0%) | 0 (0.0%) |
| 75 Years and older | 86 (100.0%) | 0 (0.0%) |
| Total | 913 (90.9%) | 91 (9.1%) |
Health Insurance Coverage by Citizenship Status in Roscommon
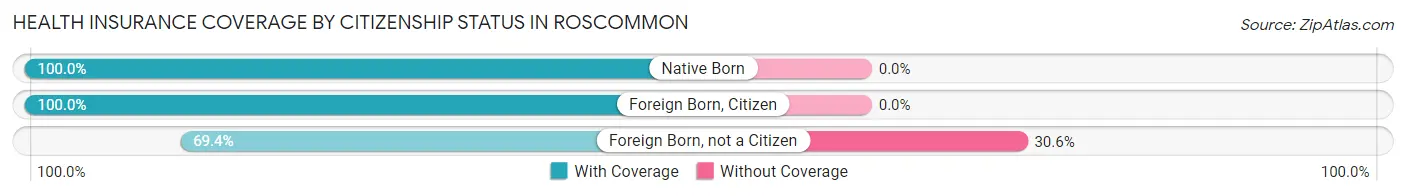
| Citizenship Status | With Coverage | Without Coverage |
| Native Born | 58 (100.0%) | 0 (0.0%) |
| Foreign Born, Citizen | 110 (100.0%) | 0 (0.0%) |
| Foreign Born, not a Citizen | 93 (69.4%) | 41 (30.6%) |
Health Insurance Coverage by Household Income in Roscommon
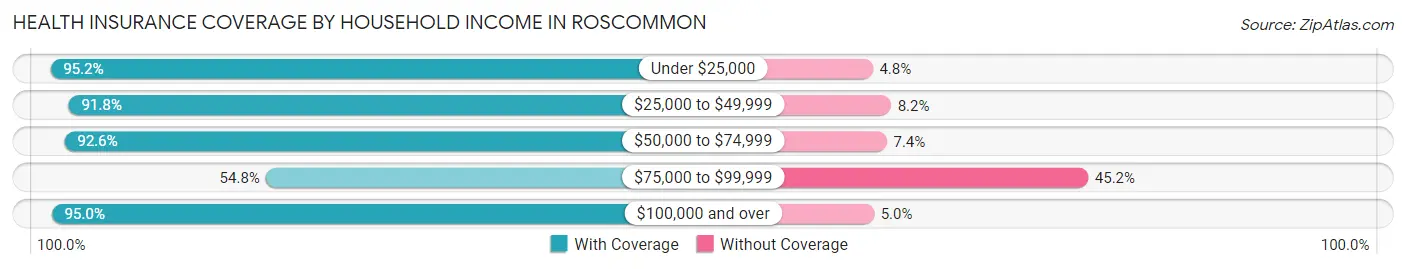
| Household Income | With Coverage | Without Coverage |
| Under $25,000 | 198 (95.2%) | 10 (4.8%) |
| $25,000 to $49,999 | 145 (91.8%) | 13 (8.2%) |
| $50,000 to $74,999 | 423 (92.6%) | 34 (7.4%) |
| $75,000 to $99,999 | 34 (54.8%) | 28 (45.2%) |
| $100,000 and over | 113 (95.0%) | 6 (5.0%) |
Public vs Private Health Insurance Coverage by Age in Roscommon
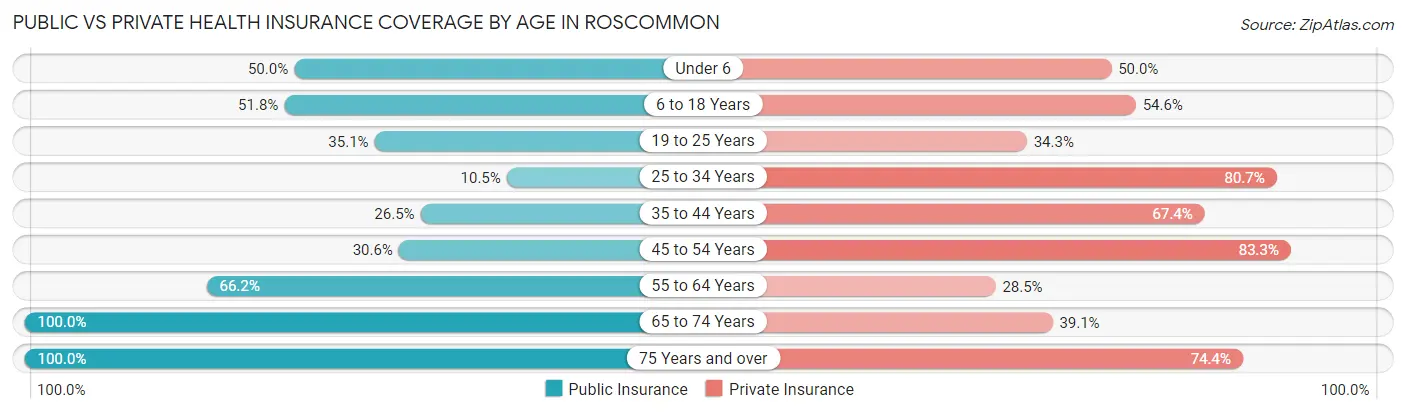
| Age Bracket | Public Insurance | Private Insurance |
| Under 6 | 29 (50.0%) | 29 (50.0%) |
| 6 to 18 Years | 57 (51.8%) | 60 (54.5%) |
| 19 to 25 Years | 47 (35.1%) | 46 (34.3%) |
| 25 to 34 Years | 6 (10.5%) | 46 (80.7%) |
| 35 to 44 Years | 13 (26.5%) | 33 (67.3%) |
| 45 to 54 Years | 22 (30.6%) | 60 (83.3%) |
| 55 to 64 Years | 202 (66.2%) | 87 (28.5%) |
| 65 to 74 Years | 133 (100.0%) | 52 (39.1%) |
| 75 Years and over | 86 (100.0%) | 64 (74.4%) |
| Total | 595 (59.3%) | 477 (47.5%) |
Disability Status by Sex by Age in Roscommon
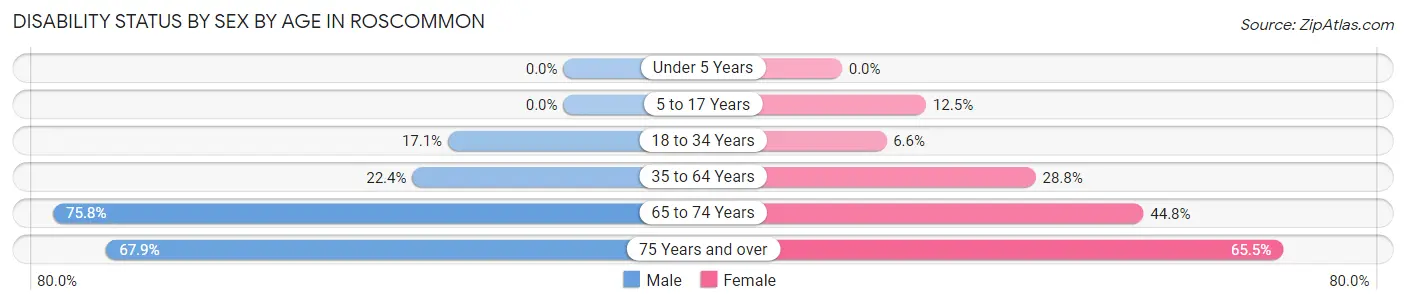
| Age Bracket | Male | Female |
| Under 5 Years | 0 (0.0%) | 0 (0.0%) |
| 5 to 17 Years | 0 (0.0%) | 4 (12.5%) |
| 18 to 34 Years | 18 (17.1%) | 6 (6.6%) |
| 35 to 64 Years | 48 (22.4%) | 61 (28.8%) |
| 65 to 74 Years | 50 (75.8%) | 30 (44.8%) |
| 75 Years and over | 19 (67.9%) | 38 (65.5%) |
Disability Class by Sex by Age in Roscommon
Disability Class: Hearing Difficulty

| Age Bracket | Male | Female |
| Under 5 Years | 0 (0.0%) | 0 (0.0%) |
| 5 to 17 Years | 0 (0.0%) | 0 (0.0%) |
| 18 to 34 Years | 0 (0.0%) | 0 (0.0%) |
| 35 to 64 Years | 33 (15.4%) | 13 (6.1%) |
| 65 to 74 Years | 42 (63.6%) | 5 (7.5%) |
| 75 Years and over | 16 (57.1%) | 30 (51.7%) |
Disability Class: Vision Difficulty
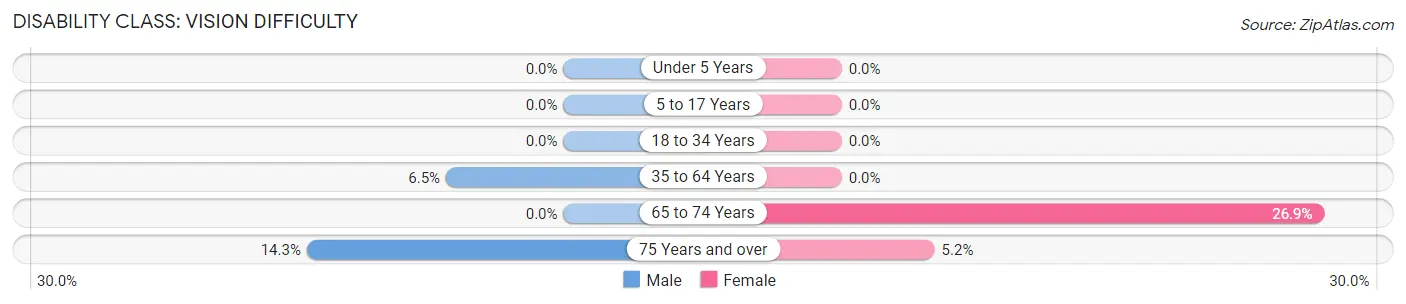
| Age Bracket | Male | Female |
| Under 5 Years | 0 (0.0%) | 0 (0.0%) |
| 5 to 17 Years | 0 (0.0%) | 0 (0.0%) |
| 18 to 34 Years | 0 (0.0%) | 0 (0.0%) |
| 35 to 64 Years | 14 (6.5%) | 0 (0.0%) |
| 65 to 74 Years | 0 (0.0%) | 18 (26.9%) |
| 75 Years and over | 4 (14.3%) | 3 (5.2%) |
Disability Class: Cognitive Difficulty
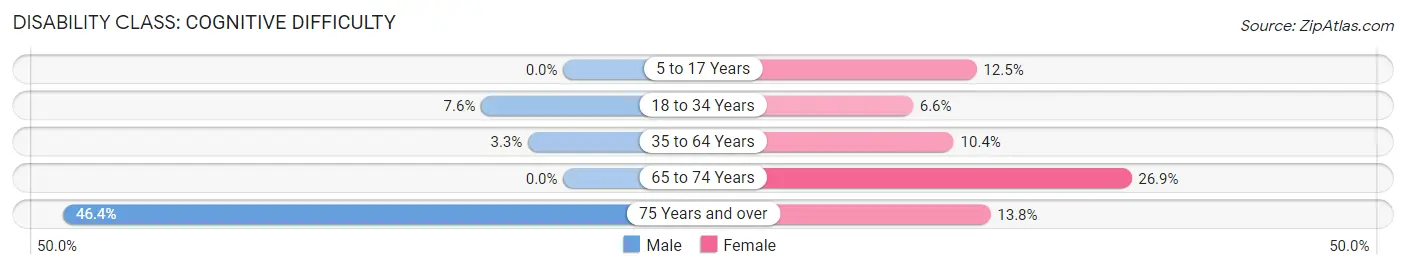
| Age Bracket | Male | Female |
| 5 to 17 Years | 0 (0.0%) | 4 (12.5%) |
| 18 to 34 Years | 8 (7.6%) | 6 (6.6%) |
| 35 to 64 Years | 7 (3.3%) | 22 (10.4%) |
| 65 to 74 Years | 0 (0.0%) | 18 (26.9%) |
| 75 Years and over | 13 (46.4%) | 8 (13.8%) |
Disability Class: Ambulatory Difficulty
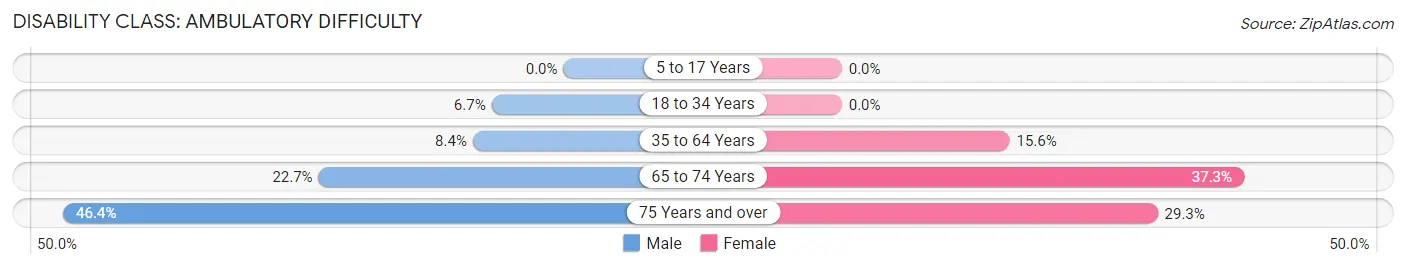
| Age Bracket | Male | Female |
| 5 to 17 Years | 0 (0.0%) | 0 (0.0%) |
| 18 to 34 Years | 7 (6.7%) | 0 (0.0%) |
| 35 to 64 Years | 18 (8.4%) | 33 (15.6%) |
| 65 to 74 Years | 15 (22.7%) | 25 (37.3%) |
| 75 Years and over | 13 (46.4%) | 17 (29.3%) |
Disability Class: Self-Care Difficulty
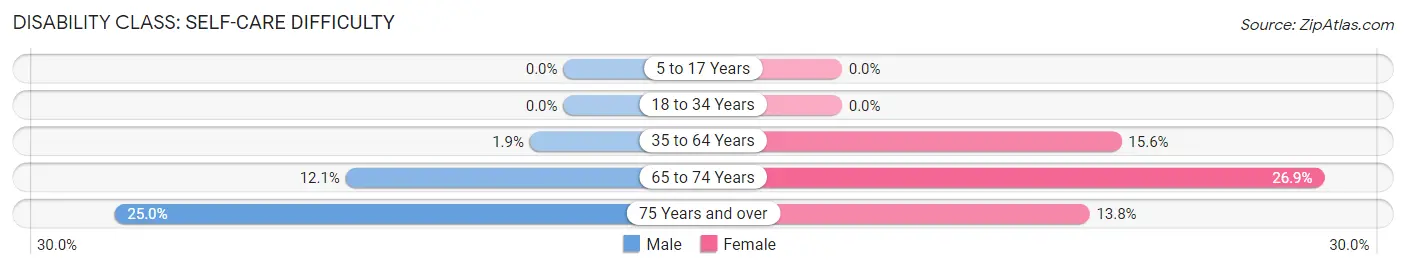
| Age Bracket | Male | Female |
| 5 to 17 Years | 0 (0.0%) | 0 (0.0%) |
| 18 to 34 Years | 0 (0.0%) | 0 (0.0%) |
| 35 to 64 Years | 4 (1.9%) | 33 (15.6%) |
| 65 to 74 Years | 8 (12.1%) | 18 (26.9%) |
| 75 Years and over | 7 (25.0%) | 8 (13.8%) |
Technology Access in Roscommon
Computing Device Access in Roscommon
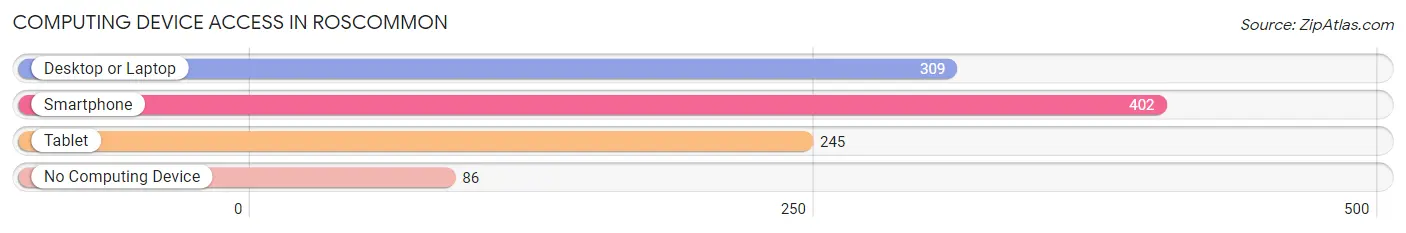
| Device Type | # Households | % Households |
| Desktop or Laptop | 309 | 58.0% |
| Smartphone | 402 | 75.4% |
| Tablet | 245 | 46.0% |
| No Computing Device | 86 | 16.1% |
| Total | 533 | 100.0% |
Internet Access in Roscommon
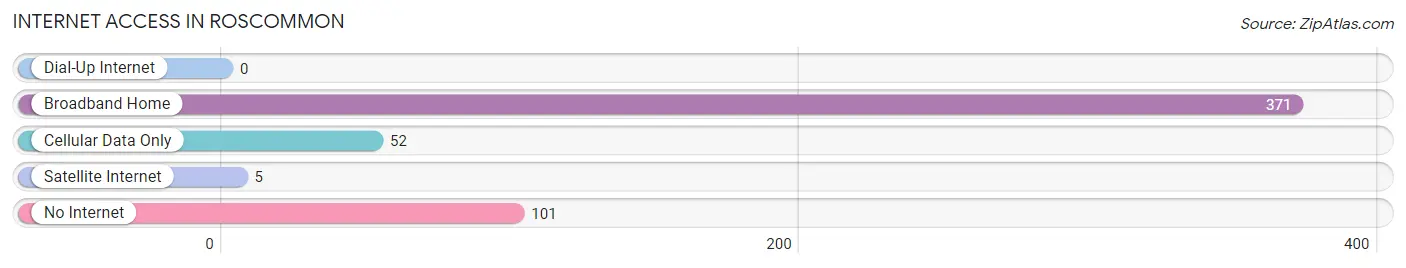
| Internet Type | # Households | % Households |
| Dial-Up Internet | 0 | 0.0% |
| Broadband Home | 371 | 69.6% |
| Cellular Data Only | 52 | 9.8% |
| Satellite Internet | 5 | 0.9% |
| No Internet | 101 | 19.0% |
| Total | 533 | 100.0% |
Roscommon Summary
Roscommon, Michigan is a small town located in the northern part of the state, in the heart of Michigan’s Lower Peninsula. It is situated in the middle of the Houghton Lake area, which is known for its many lakes and outdoor recreational activities. The town is home to a population of just over 1,000 people, and is the county seat of Roscommon County.
History
The area that is now Roscommon was first settled in the early 1800s by a group of French-Canadian fur traders. The town was officially founded in 1875, and was named after the county of Roscommon in Ireland. The town was originally a logging and lumbering center, and the first sawmill was built in 1876. The town grew rapidly in the late 19th century, and by the early 20th century, it had become a popular tourist destination.
In the early 1900s, the town was home to several resorts, including the Roscommon Hotel, which was built in 1906. The hotel was a popular destination for wealthy tourists from Detroit and other nearby cities. The town also had a thriving agricultural industry, and was home to several dairy farms.
In the 1950s, the town began to decline as the logging and lumbering industry declined. The town’s population dropped from over 1,500 in 1950 to just over 1,000 in 2000.
Geography
Roscommon is located in the northern part of Michigan’s Lower Peninsula, in the heart of the Houghton Lake area. The town is situated on the banks of the Au Sable River, and is surrounded by several lakes, including Houghton Lake, Higgins Lake, and Lake St. Helen. The town is located about 30 miles north of Grayling, and about 90 miles north of Detroit.
The town has a total area of 2.2 square miles, all of which is land. The town is located at an elevation of 1,068 feet above sea level.
Economy
The economy of Roscommon is largely based on tourism and outdoor recreation. The town is home to several resorts and campgrounds, and is a popular destination for fishing, boating, and other outdoor activities. The town is also home to several small businesses, including restaurants, retail stores, and service providers.
The town is also home to several manufacturing companies, including a furniture manufacturer and a plastics manufacturer. The town is also home to a small airport, which serves the local area.
Demographics
As of the 2010 census, the population of Roscommon was 1,072. The racial makeup of the town was 97.2% White, 0.7% African American, 0.3% Native American, 0.2% Asian, 0.1% Pacific Islander, 0.3% from other races, and 1.2% from two or more races. Hispanic or Latino of any race were 1.2% of the population.
The median household income in Roscommon was $35,938, and the median family income was $41,250. The per capita income for the town was $18,945. About 16.2% of families and 19.2% of the population were below the poverty line, including 28.3% of those under age 18 and 8.3% of those age 65 or over.
Common Questions
What is Per Capita Income in Roscommon?
Per Capita income in Roscommon is $24,526.
What is the Median Family Income in Roscommon?
Median Family Income in Roscommon is $64,583.
What is the Median Household income in Roscommon?
Median Household Income in Roscommon is $48,967.
What is Income or Wage Gap in Roscommon?
Income or Wage Gap in Roscommon is 39.1%.
Women in Roscommon earn 60.9 cents for every dollar earned by a man.
What is Inequality or Gini Index in Roscommon?
Inequality or Gini Index in Roscommon is 0.39.
What is the Total Population of Roscommon?
Total Population of Roscommon is 1,123.
What is the Total Male Population of Roscommon?
Total Male Population of Roscommon is 596.
What is the Total Female Population of Roscommon?
Total Female Population of Roscommon is 527.
What is the Ratio of Males per 100 Females in Roscommon?
There are 113.09 Males per 100 Females in Roscommon.
What is the Ratio of Females per 100 Males in Roscommon?
There are 88.42 Females per 100 Males in Roscommon.
What is the Median Population Age in Roscommon?
Median Population Age in Roscommon is 55.9 Years.
What is the Average Family Size in Roscommon
Average Family Size in Roscommon is 2.6 People.
What is the Average Household Size in Roscommon
Average Household Size in Roscommon is 1.9 People.
How Large is the Labor Force in Roscommon?
There are 360 People in the Labor Forcein in Roscommon.
What is the Percentage of People in the Labor Force in Roscommon?
36.5% of People are in the Labor Force in Roscommon.
What is the Unemployment Rate in Roscommon?
Unemployment Rate in Roscommon is 0.8%.