Jackson, MI Map & Demographics
Jackson Map
Jackson Overview
$23,447
PER CAPITA INCOME
$58,350
AVG FAMILY INCOME
$41,988
AVG HOUSEHOLD INCOME
19.3%
WAGE / INCOME GAP [ % ]
80.7¢/ $1
WAGE / INCOME GAP [ $ ]
$11,370
FAMILY INCOME DEFICIT
0.46
INEQUALITY / GINI INDEX
31,420
TOTAL POPULATION
14,962
MALE POPULATION
16,458
FEMALE POPULATION
90.91
MALES / 100 FEMALES
110.00
FEMALES / 100 MALES
35.0
MEDIAN AGE
3.3
AVG FAMILY SIZE
2.3
AVG HOUSEHOLD SIZE
14,984
LABOR FORCE [ PEOPLE ]
60.6%
PERCENT IN LABOR FORCE
10.9%
UNEMPLOYMENT RATE
Jackson Area Codes
Income in Jackson
Income Overview in Jackson
Per Capita Income in Jackson is $23,447, while median incomes of families and households are $58,350 and $41,988 respectively.
| Characteristic | Number | Measure |
| Per Capita Income | 31,420 | $23,447 |
| Median Family Income | 6,829 | $58,350 |
| Mean Family Income | 6,829 | $71,997 |
| Median Household Income | 13,131 | $41,988 |
| Mean Household Income | 13,131 | $55,341 |
| Income Deficit | 6,829 | $11,370 |
| Wage / Income Gap (%) | 31,420 | 19.32% |
| Wage / Income Gap ($) | 31,420 | 80.68¢ per $1 |
| Gini / Inequality Index | 31,420 | 0.46 |
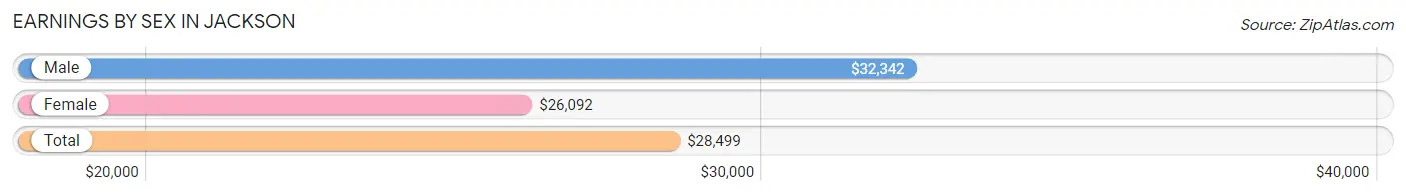
Earnings by Sex in Jackson
Average Earnings in Jackson are $28,499, $32,342 for men and $26,092 for women, a difference of 19.3%.
| Sex | Number | Average Earnings |
| Male | 7,609 (48.9%) | $32,342 |
| Female | 7,949 (51.1%) | $26,092 |
| Total | 15,558 (100.0%) | $28,499 |
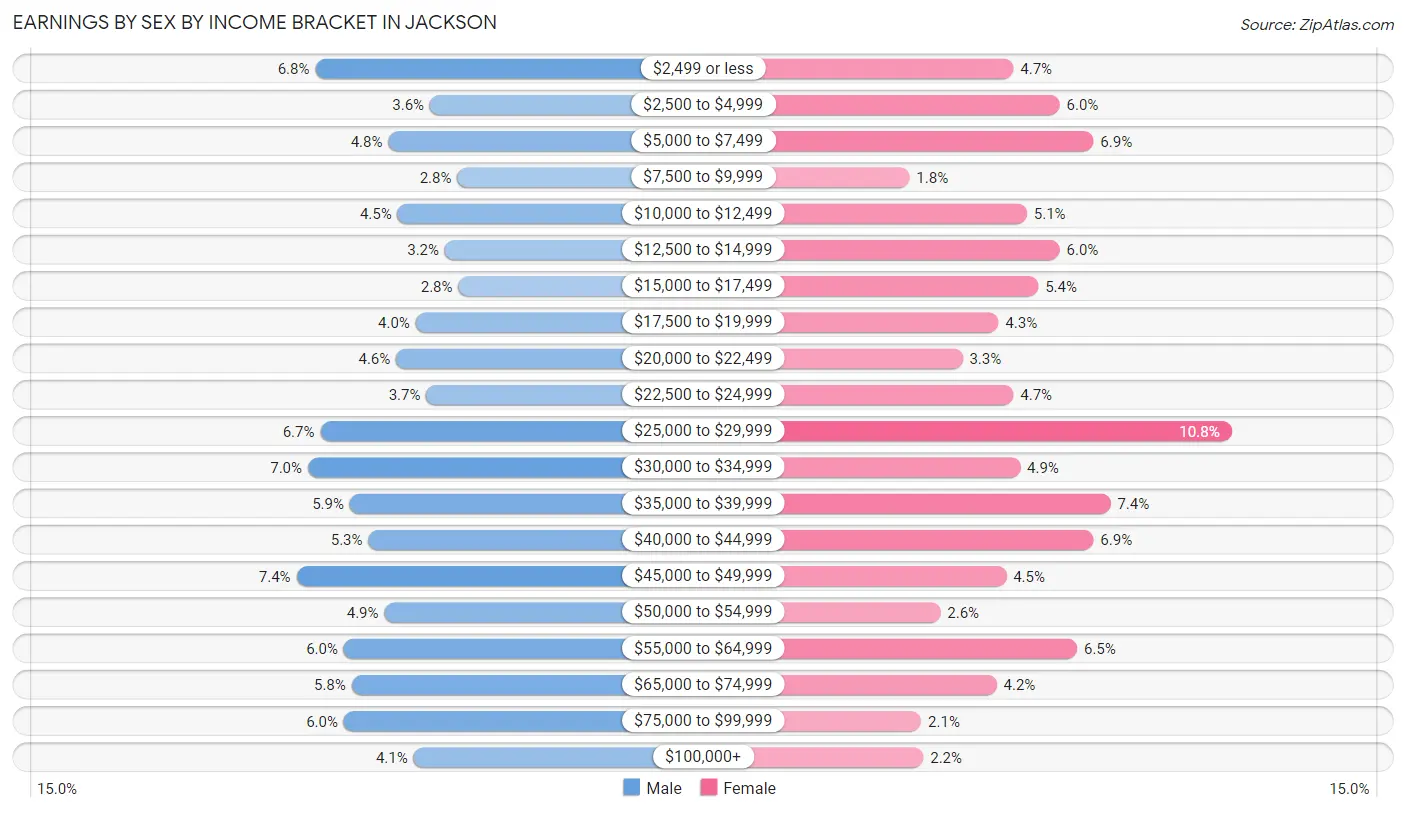
Earnings by Sex by Income Bracket in Jackson
The most common earnings brackets in Jackson are $45,000 to $49,999 for men (560 | 7.4%) and $25,000 to $29,999 for women (859 | 10.8%).
| Income | Male | Female |
| $2,499 or less | 520 (6.8%) | 372 (4.7%) |
| $2,500 to $4,999 | 275 (3.6%) | 475 (6.0%) |
| $5,000 to $7,499 | 364 (4.8%) | 551 (6.9%) |
| $7,500 to $9,999 | 216 (2.8%) | 140 (1.8%) |
| $10,000 to $12,499 | 344 (4.5%) | 402 (5.1%) |
| $12,500 to $14,999 | 243 (3.2%) | 475 (6.0%) |
| $15,000 to $17,499 | 214 (2.8%) | 428 (5.4%) |
| $17,500 to $19,999 | 305 (4.0%) | 339 (4.3%) |
| $20,000 to $22,499 | 347 (4.6%) | 258 (3.3%) |
| $22,500 to $24,999 | 282 (3.7%) | 372 (4.7%) |
| $25,000 to $29,999 | 509 (6.7%) | 859 (10.8%) |
| $30,000 to $34,999 | 536 (7.0%) | 387 (4.9%) |
| $35,000 to $39,999 | 446 (5.9%) | 589 (7.4%) |
| $40,000 to $44,999 | 406 (5.3%) | 551 (6.9%) |
| $45,000 to $49,999 | 560 (7.4%) | 356 (4.5%) |
| $50,000 to $54,999 | 372 (4.9%) | 209 (2.6%) |
| $55,000 to $64,999 | 459 (6.0%) | 514 (6.5%) |
| $65,000 to $74,999 | 442 (5.8%) | 335 (4.2%) |
| $75,000 to $99,999 | 459 (6.0%) | 166 (2.1%) |
| $100,000+ | 310 (4.1%) | 171 (2.1%) |
| Total | 7,609 (100.0%) | 7,949 (100.0%) |
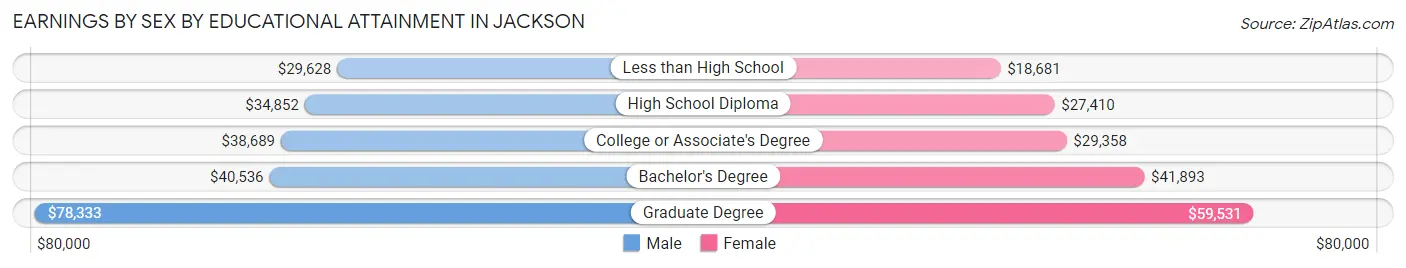
Earnings by Sex by Educational Attainment in Jackson
Average earnings in Jackson are $36,981 for men and $29,270 for women, a difference of 20.8%. Men with an educational attainment of graduate degree enjoy the highest average annual earnings of $78,333, while those with less than high school education earn the least with $29,628. Women with an educational attainment of graduate degree earn the most with the average annual earnings of $59,531, while those with less than high school education have the smallest earnings of $18,681.
| Educational Attainment | Male Income | Female Income |
| Less than High School | $29,628 | $18,681 |
| High School Diploma | $34,852 | $27,410 |
| College or Associate's Degree | $38,689 | $29,358 |
| Bachelor's Degree | $40,536 | $41,893 |
| Graduate Degree | $78,333 | $59,531 |
| Total | $36,981 | $29,270 |
Family Income in Jackson
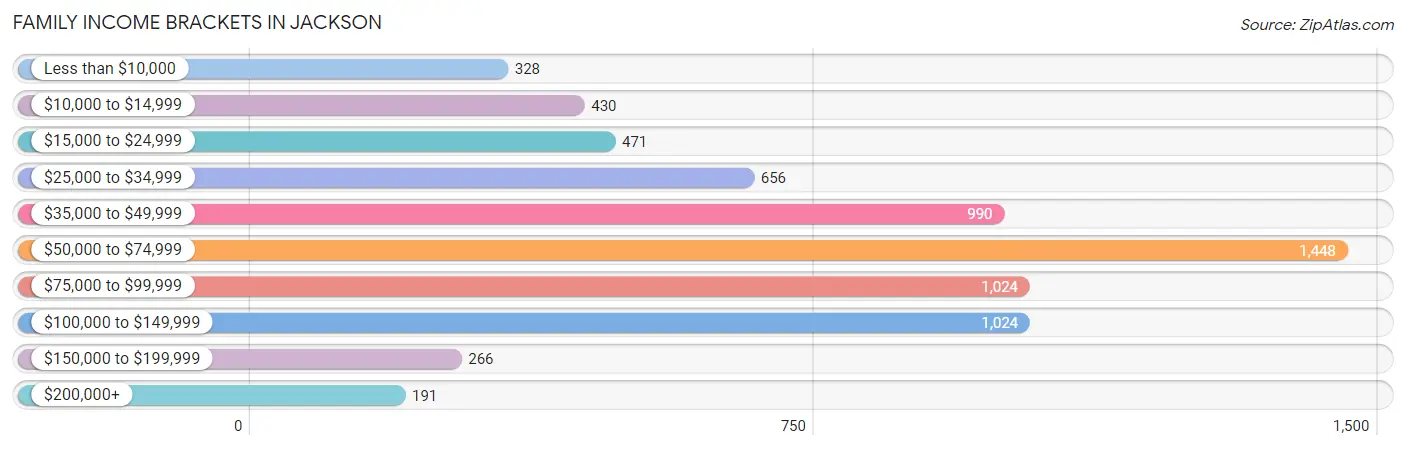
Family Income Brackets in Jackson
According to the Jackson family income data, there are 1,448 families falling into the $50,000 to $74,999 income range, which is the most common income bracket and makes up 21.2% of all families. Conversely, the $200,000+ income bracket is the least frequent group with only 191 families (2.8%) belonging to this category.
| Income Bracket | # Families | % Families |
| Less than $10,000 | 328 | 4.8% |
| $10,000 to $14,999 | 430 | 6.3% |
| $15,000 to $24,999 | 471 | 6.9% |
| $25,000 to $34,999 | 656 | 9.6% |
| $35,000 to $49,999 | 990 | 14.5% |
| $50,000 to $74,999 | 1,448 | 21.2% |
| $75,000 to $99,999 | 1,024 | 15.0% |
| $100,000 to $149,999 | 1,024 | 15.0% |
| $150,000 to $199,999 | 266 | 3.9% |
| $200,000+ | 191 | 2.8% |
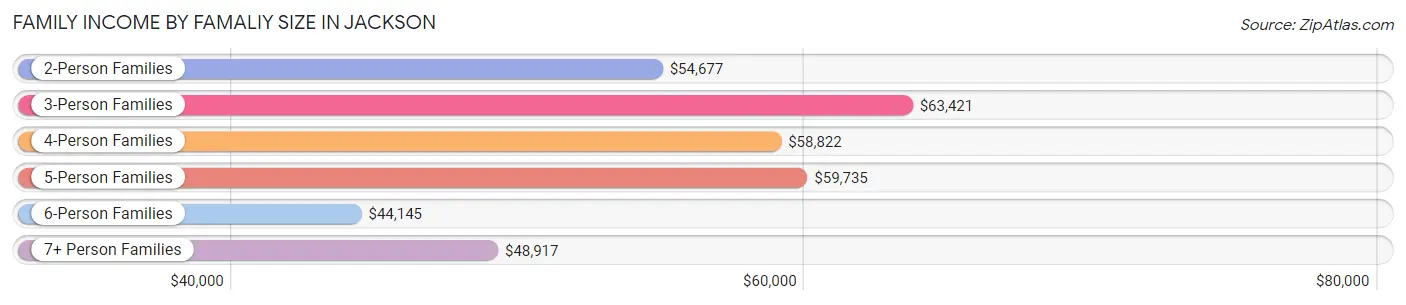
Family Income by Famaliy Size in Jackson
3-person families (1,850 | 27.1%) account for the highest median family income in Jackson with $63,421 per family, while 2-person families (3,113 | 45.6%) have the highest median income of $27,338 per family member.
| Income Bracket | # Families | Median Income |
| 2-Person Families | 3,113 (45.6%) | $54,677 |
| 3-Person Families | 1,850 (27.1%) | $63,421 |
| 4-Person Families | 1,047 (15.3%) | $58,822 |
| 5-Person Families | 467 (6.8%) | $59,735 |
| 6-Person Families | 230 (3.4%) | $44,145 |
| 7+ Person Families | 122 (1.8%) | $48,917 |
| Total | 6,829 (100.0%) | $58,350 |
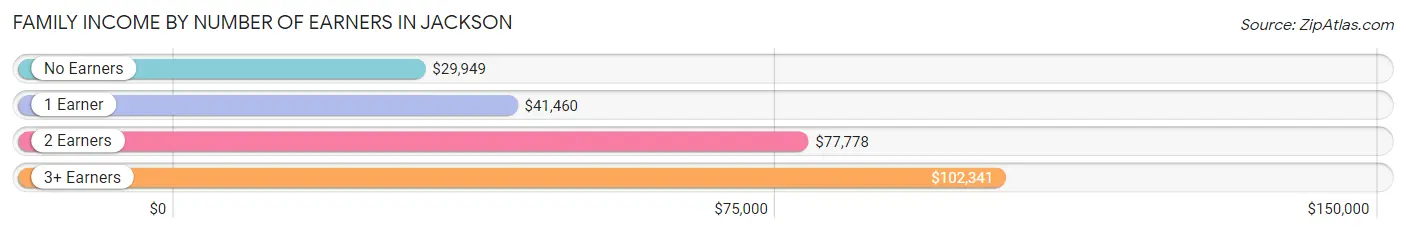
Family Income by Number of Earners in Jackson
The median family income in Jackson is $58,350, with families comprising 3+ earners (641) having the highest median family income of $102,341, while families with no earners (940) have the lowest median family income of $29,949, accounting for 9.4% and 13.8% of families, respectively.
| Number of Earners | # Families | Median Income |
| No Earners | 940 (13.8%) | $29,949 |
| 1 Earner | 2,702 (39.6%) | $41,460 |
| 2 Earners | 2,546 (37.3%) | $77,778 |
| 3+ Earners | 641 (9.4%) | $102,341 |
| Total | 6,829 (100.0%) | $58,350 |
Household Income in Jackson
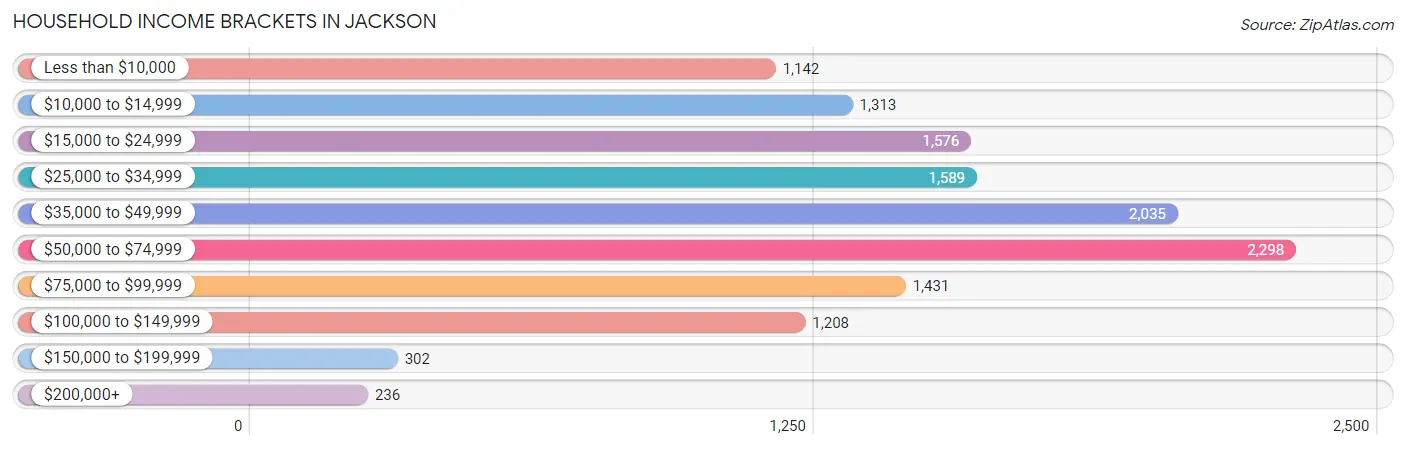
Household Income Brackets in Jackson
With 2,298 households falling in the category, the $50,000 to $74,999 income range is the most frequent in Jackson, accounting for 17.5% of all households. In contrast, only 236 households (1.8%) fall into the $200,000+ income bracket, making it the least populous group.
| Income Bracket | # Households | % Households |
| Less than $10,000 | 1,142 | 8.7% |
| $10,000 to $14,999 | 1,313 | 10.0% |
| $15,000 to $24,999 | 1,576 | 12.0% |
| $25,000 to $34,999 | 1,589 | 12.1% |
| $35,000 to $49,999 | 2,035 | 15.5% |
| $50,000 to $74,999 | 2,298 | 17.5% |
| $75,000 to $99,999 | 1,431 | 10.9% |
| $100,000 to $149,999 | 1,208 | 9.2% |
| $150,000 to $199,999 | 302 | 2.3% |
| $200,000+ | 236 | 1.8% |
Household Income by Householder Age in Jackson
The median household income in Jackson is $41,988, with the highest median household income of $45,122 found in the 65+ years age bracket for the primary householder. A total of 2,501 households (19.1%) fall into this category. Meanwhile, the 15 to 24 years age bracket for the primary householder has the lowest median household income of $18,790, with 857 households (6.5%) in this group.
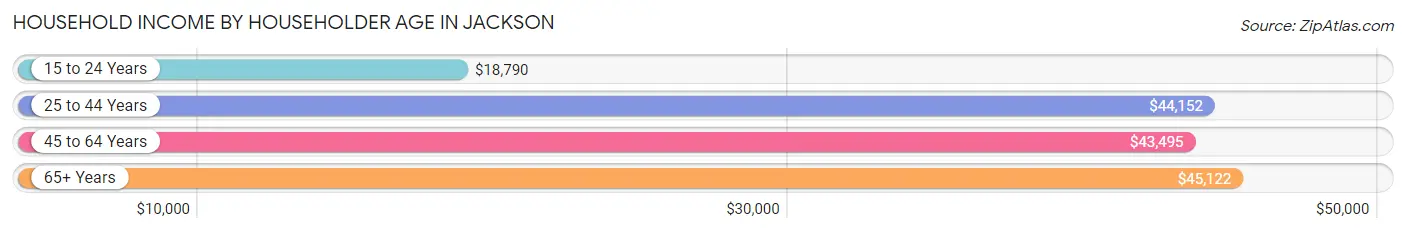
| Income Bracket | # Households | Median Income |
| 15 to 24 Years | 857 (6.5%) | $18,790 |
| 25 to 44 Years | 4,628 (35.2%) | $44,152 |
| 45 to 64 Years | 5,145 (39.2%) | $43,495 |
| 65+ Years | 2,501 (19.1%) | $45,122 |
| Total | 13,131 (100.0%) | $41,988 |
Poverty in Jackson
Income Below Poverty by Sex and Age in Jackson
With 21.2% poverty level for males and 26.6% for females among the residents of Jackson, 5 year old males and under 5 year old females are the most vulnerable to poverty, with 105 males (47.9%) and 467 females (46.3%) in their respective age groups living below the poverty level.
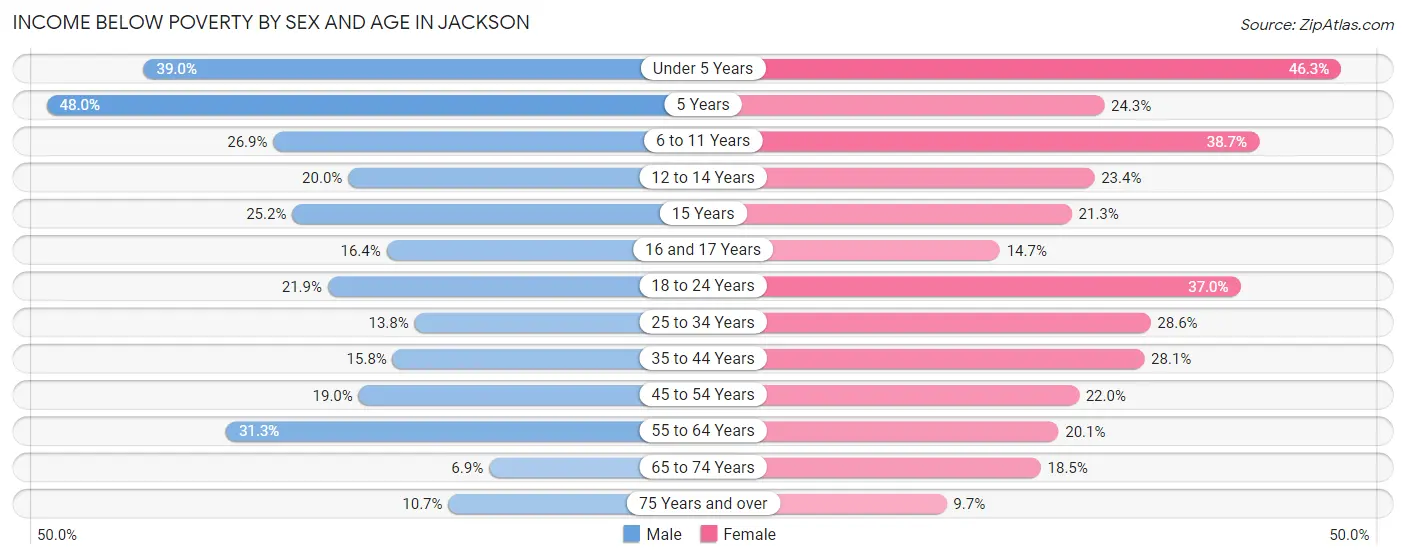
| Age Bracket | Male | Female |
| Under 5 Years | 351 (39.0%) | 467 (46.3%) |
| 5 Years | 105 (47.9%) | 37 (24.3%) |
| 6 to 11 Years | 354 (26.9%) | 411 (38.7%) |
| 12 to 14 Years | 125 (20.0%) | 164 (23.4%) |
| 15 Years | 40 (25.2%) | 77 (21.3%) |
| 16 and 17 Years | 76 (16.4%) | 56 (14.7%) |
| 18 to 24 Years | 371 (21.9%) | 591 (37.0%) |
| 25 to 34 Years | 294 (13.8%) | 712 (28.6%) |
| 35 to 44 Years | 275 (15.8%) | 528 (28.1%) |
| 45 to 54 Years | 372 (19.0%) | 431 (22.0%) |
| 55 to 64 Years | 608 (31.3%) | 479 (20.1%) |
| 65 to 74 Years | 70 (6.9%) | 267 (18.4%) |
| 75 Years and over | 46 (10.7%) | 66 (9.7%) |
| Total | 3,087 (21.2%) | 4,286 (26.6%) |
Income Above Poverty by Sex and Age in Jackson
According to the poverty statistics in Jackson, males aged 65 to 74 years and females aged 75 years and over are the age groups that are most secure financially, with 93.1% of males and 90.3% of females in these age groups living above the poverty line.
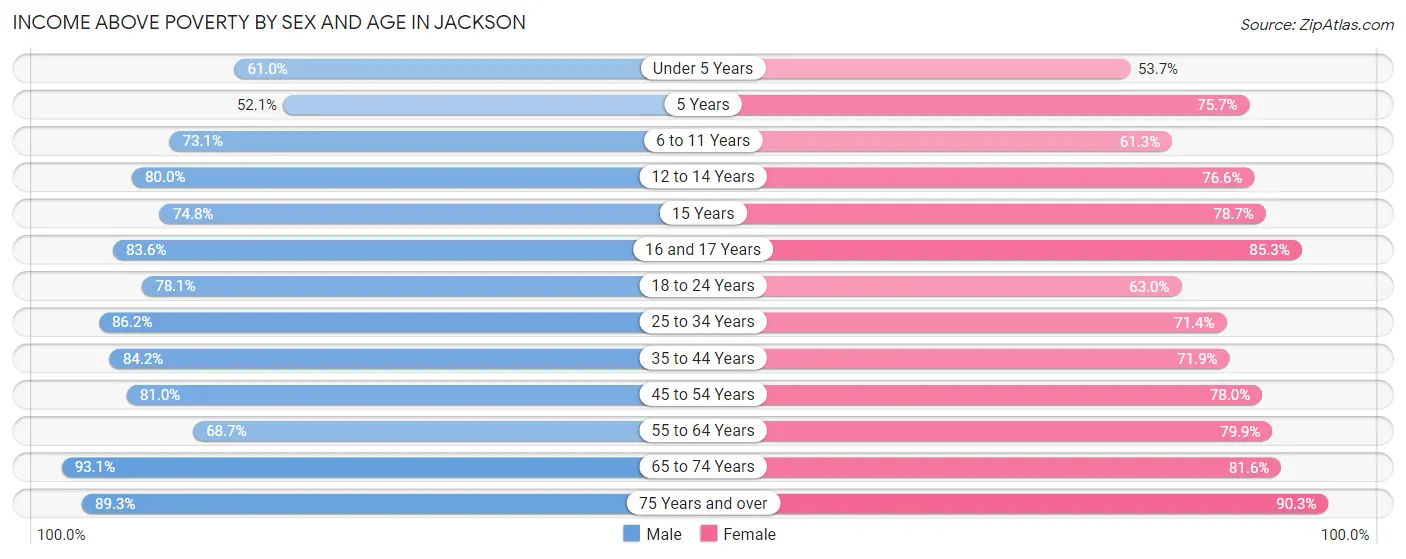
| Age Bracket | Male | Female |
| Under 5 Years | 550 (61.0%) | 541 (53.7%) |
| 5 Years | 114 (52.0%) | 115 (75.7%) |
| 6 to 11 Years | 961 (73.1%) | 651 (61.3%) |
| 12 to 14 Years | 501 (80.0%) | 536 (76.6%) |
| 15 Years | 119 (74.8%) | 284 (78.7%) |
| 16 and 17 Years | 387 (83.6%) | 326 (85.3%) |
| 18 to 24 Years | 1,326 (78.1%) | 1,007 (63.0%) |
| 25 to 34 Years | 1,835 (86.2%) | 1,774 (71.4%) |
| 35 to 44 Years | 1,461 (84.2%) | 1,354 (71.9%) |
| 45 to 54 Years | 1,586 (81.0%) | 1,529 (78.0%) |
| 55 to 64 Years | 1,334 (68.7%) | 1,905 (79.9%) |
| 65 to 74 Years | 944 (93.1%) | 1,180 (81.6%) |
| 75 Years and over | 385 (89.3%) | 614 (90.3%) |
| Total | 11,503 (78.8%) | 11,816 (73.4%) |
Income Below Poverty Among Married-Couple Families in Jackson
The poverty statistics for married-couple families in Jackson show that 8.1% or 312 of the total 3,870 families live below the poverty line. Families with 5 or more children have the highest poverty rate of 53.0%, comprising of 44 families. On the other hand, families with no children have the lowest poverty rate of 5.0%, which includes 117 families.
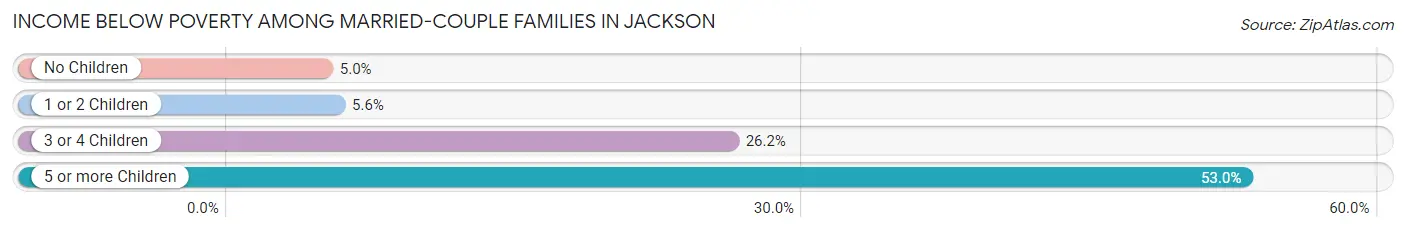
| Children | Above Poverty | Below Poverty |
| No Children | 2,249 (95.1%) | 117 (5.0%) |
| 1 or 2 Children | 1,013 (94.4%) | 60 (5.6%) |
| 3 or 4 Children | 257 (73.9%) | 91 (26.2%) |
| 5 or more Children | 39 (47.0%) | 44 (53.0%) |
| Total | 3,558 (91.9%) | 312 (8.1%) |
Income Below Poverty Among Single-Parent Households in Jackson
According to the poverty data in Jackson, 19.3% or 128 single-father households and 33.6% or 770 single-mother households are living below the poverty line. Among single-father households, those with 3 or 4 children have the highest poverty rate, with 55 households (49.1%) experiencing poverty. Likewise, among single-mother households, those with 5 or more children have the highest poverty rate, with 41 households (100.0%) falling below the poverty line.
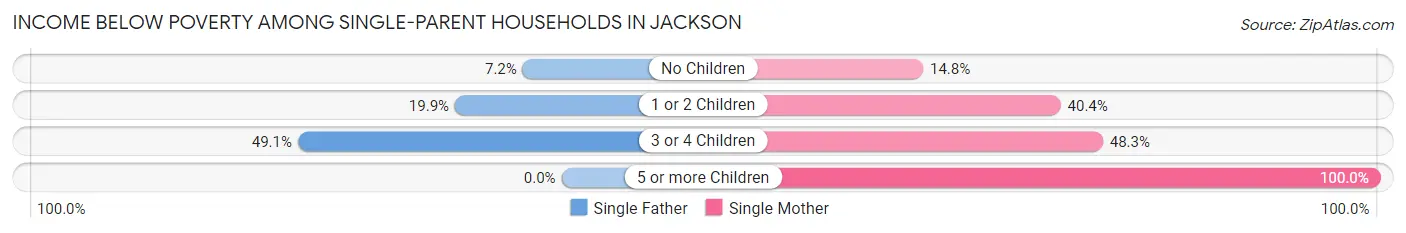
| Children | Single Father | Single Mother |
| No Children | 21 (7.2%) | 118 (14.8%) |
| 1 or 2 Children | 52 (19.9%) | 472 (40.4%) |
| 3 or 4 Children | 55 (49.1%) | 139 (48.3%) |
| 5 or more Children | 0 (0.0%) | 41 (100.0%) |
| Total | 128 (19.3%) | 770 (33.6%) |
Income Below Poverty Among Married-Couple vs Single-Parent Households in Jackson
The poverty data for Jackson shows that 312 of the married-couple family households (8.1%) and 898 of the single-parent households (30.3%) are living below the poverty level. Within the married-couple family households, those with 5 or more children have the highest poverty rate, with 44 households (53.0%) falling below the poverty line. Among the single-parent households, those with 5 or more children have the highest poverty rate, with 41 household (100.0%) living below poverty.
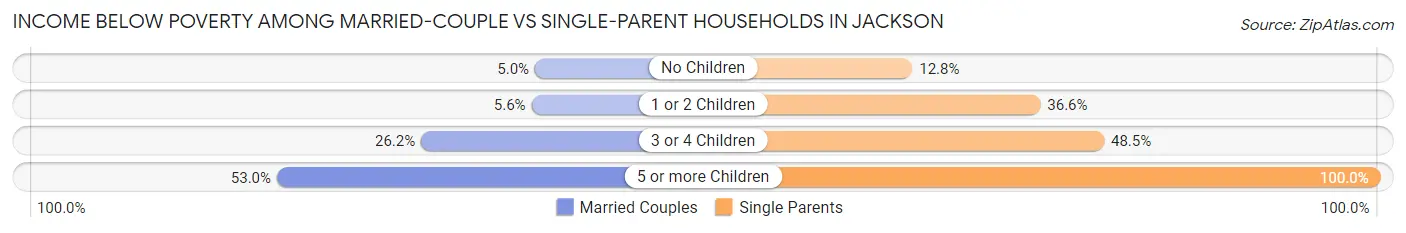
| Children | Married-Couple Families | Single-Parent Households |
| No Children | 117 (5.0%) | 139 (12.8%) |
| 1 or 2 Children | 60 (5.6%) | 524 (36.6%) |
| 3 or 4 Children | 91 (26.2%) | 194 (48.5%) |
| 5 or more Children | 44 (53.0%) | 41 (100.0%) |
| Total | 312 (8.1%) | 898 (30.3%) |
Race in Jackson
The most populous races in Jackson are White / Caucasian (21,307 | 67.8%), Black / African American (6,432 | 20.5%), and Two or more Races (3,040 | 9.7%).
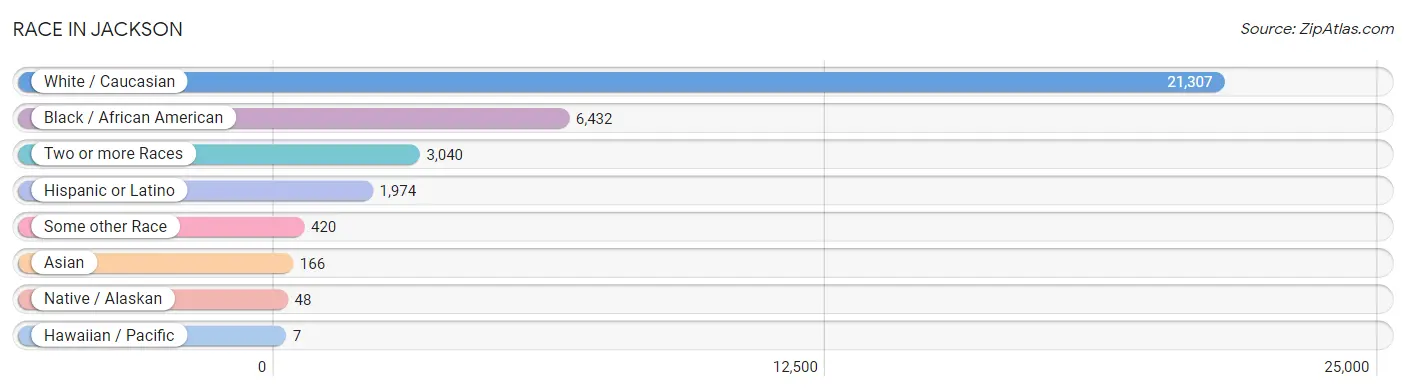
| Race | # Population | % Population |
| Asian | 166 | 0.5% |
| Black / African American | 6,432 | 20.5% |
| Hawaiian / Pacific | 7 | 0.0% |
| Hispanic or Latino | 1,974 | 6.3% |
| Native / Alaskan | 48 | 0.2% |
| White / Caucasian | 21,307 | 67.8% |
| Two or more Races | 3,040 | 9.7% |
| Some other Race | 420 | 1.3% |
| Total | 31,420 | 100.0% |
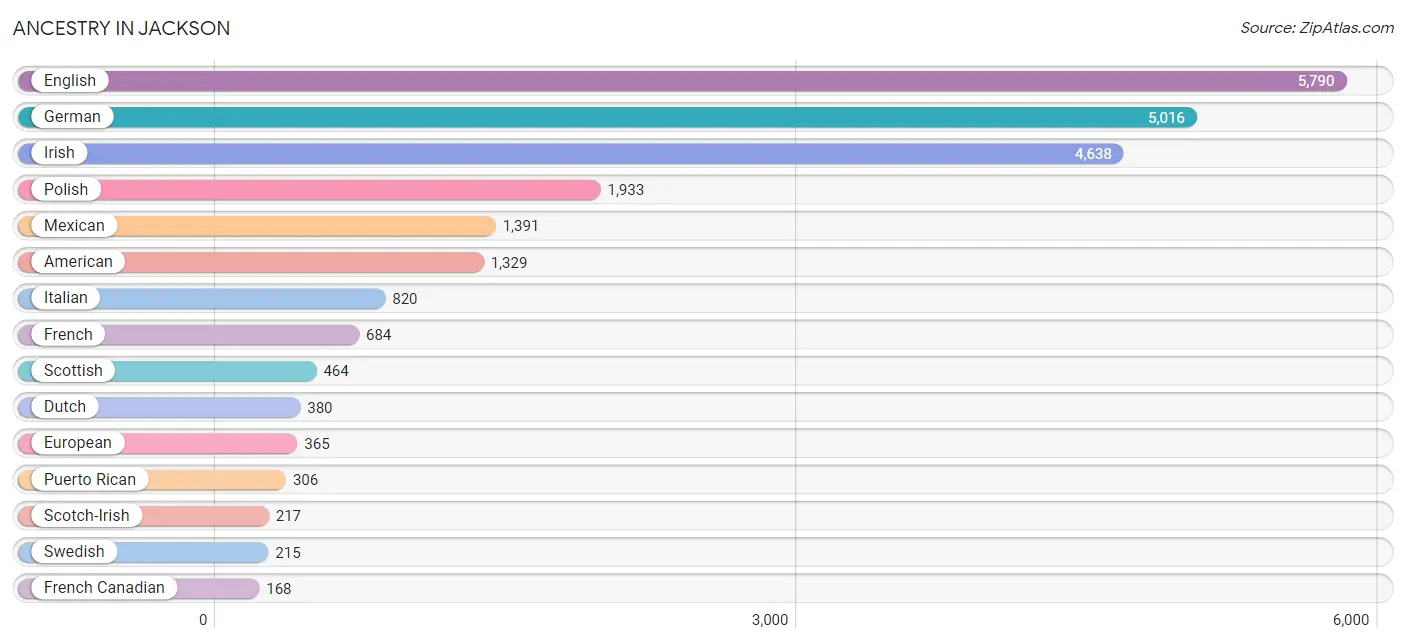
Ancestry in Jackson
The most populous ancestries reported in Jackson are English (5,790 | 18.4%), German (5,016 | 16.0%), Irish (4,638 | 14.8%), Polish (1,933 | 6.1%), and Mexican (1,391 | 4.4%), together accounting for 59.7% of all Jackson residents.
| Ancestry | # Population | % Population |
| African | 51 | 0.2% |
| American | 1,329 | 4.2% |
| Apache | 2 | 0.0% |
| Arab | 140 | 0.4% |
| Armenian | 9 | 0.0% |
| Australian | 9 | 0.0% |
| Basque | 4 | 0.0% |
| Belgian | 36 | 0.1% |
| Bhutanese | 159 | 0.5% |
| Blackfeet | 31 | 0.1% |
| British | 88 | 0.3% |
| Burmese | 28 | 0.1% |
| Canadian | 74 | 0.2% |
| Celtic | 5 | 0.0% |
| Central American | 75 | 0.2% |
| Central American Indian | 13 | 0.0% |
| Cherokee | 92 | 0.3% |
| Chilean | 10 | 0.0% |
| Chippewa | 5 | 0.0% |
| Croatian | 28 | 0.1% |
| Cuban | 101 | 0.3% |
| Czech | 21 | 0.1% |
| Czechoslovakian | 10 | 0.0% |
| Danish | 38 | 0.1% |
| Dutch | 380 | 1.2% |
| Eastern European | 31 | 0.1% |
| English | 5,790 | 18.4% |
| European | 365 | 1.2% |
| Filipino | 4 | 0.0% |
| Finnish | 162 | 0.5% |
| French | 684 | 2.2% |
| French American Indian | 13 | 0.0% |
| French Canadian | 168 | 0.5% |
| German | 5,016 | 16.0% |
| Greek | 104 | 0.3% |
| Guatemalan | 24 | 0.1% |
| Honduran | 37 | 0.1% |
| Hungarian | 113 | 0.4% |
| Indian (Asian) | 90 | 0.3% |
| Iraqi | 51 | 0.2% |
| Irish | 4,638 | 14.8% |
| Iroquois | 9 | 0.0% |
| Italian | 820 | 2.6% |
| Japanese | 1 | 0.0% |
| Korean | 112 | 0.4% |
| Lebanese | 7 | 0.0% |
| Lithuanian | 18 | 0.1% |
| Maltese | 60 | 0.2% |
| Mexican | 1,391 | 4.4% |
| Mexican American Indian | 30 | 0.1% |
| Native Hawaiian | 19 | 0.1% |
| Nicaraguan | 14 | 0.0% |
| Nigerian | 54 | 0.2% |
| Northern European | 12 | 0.0% |
| Norwegian | 143 | 0.5% |
| Polish | 1,933 | 6.1% |
| Portuguese | 7 | 0.0% |
| Potawatomi | 6 | 0.0% |
| Puerto Rican | 306 | 1.0% |
| Romanian | 47 | 0.2% |
| Russian | 76 | 0.2% |
| Scandinavian | 31 | 0.1% |
| Scotch-Irish | 217 | 0.7% |
| Scottish | 464 | 1.5% |
| Serbian | 14 | 0.0% |
| Sioux | 9 | 0.0% |
| Slovak | 83 | 0.3% |
| South American | 10 | 0.0% |
| Spaniard | 14 | 0.0% |
| Spanish | 42 | 0.1% |
| Sri Lankan | 1 | 0.0% |
| Subsaharan African | 142 | 0.4% |
| Sudanese | 37 | 0.1% |
| Swedish | 215 | 0.7% |
| Swiss | 48 | 0.2% |
| Thai | 37 | 0.1% |
| Ukrainian | 37 | 0.1% |
| Welsh | 151 | 0.5% |
| Yaqui | 17 | 0.1% | View All 79 Rows |
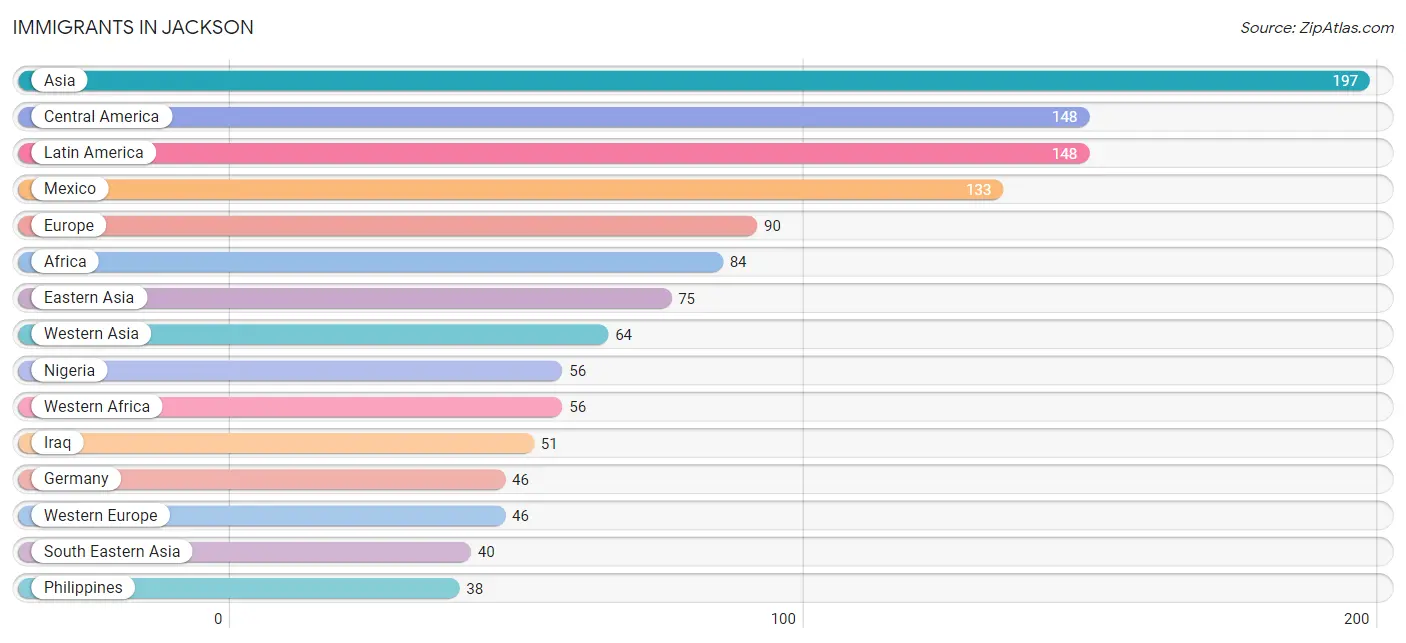
Immigrants in Jackson
The most numerous immigrant groups reported in Jackson came from Asia (197 | 0.6%), Central America (148 | 0.5%), Latin America (148 | 0.5%), Mexico (133 | 0.4%), and Europe (90 | 0.3%), together accounting for 2.3% of all Jackson residents.
| Immigration Origin | # Population | % Population |
| Africa | 84 | 0.3% |
| Asia | 197 | 0.6% |
| Australia | 9 | 0.0% |
| Cambodia | 1 | 0.0% |
| Canada | 24 | 0.1% |
| Central America | 148 | 0.5% |
| China | 31 | 0.1% |
| Eastern Africa | 28 | 0.1% |
| Eastern Asia | 75 | 0.2% |
| Eastern Europe | 9 | 0.0% |
| Europe | 90 | 0.3% |
| Fiji | 7 | 0.0% |
| Germany | 46 | 0.2% |
| Honduras | 15 | 0.1% |
| India | 13 | 0.0% |
| Iraq | 51 | 0.2% |
| Japan | 12 | 0.0% |
| Korea | 28 | 0.1% |
| Latin America | 148 | 0.5% |
| Mexico | 133 | 0.4% |
| Nigeria | 56 | 0.2% |
| Oceania | 16 | 0.1% |
| Pakistan | 5 | 0.0% |
| Philippines | 38 | 0.1% |
| Russia | 9 | 0.0% |
| South Central Asia | 18 | 0.1% |
| South Eastern Asia | 40 | 0.1% |
| Southern Europe | 35 | 0.1% |
| Vietnam | 1 | 0.0% |
| Western Africa | 56 | 0.2% |
| Western Asia | 64 | 0.2% |
| Western Europe | 46 | 0.2% |
| Yemen | 13 | 0.0% | View All 33 Rows |
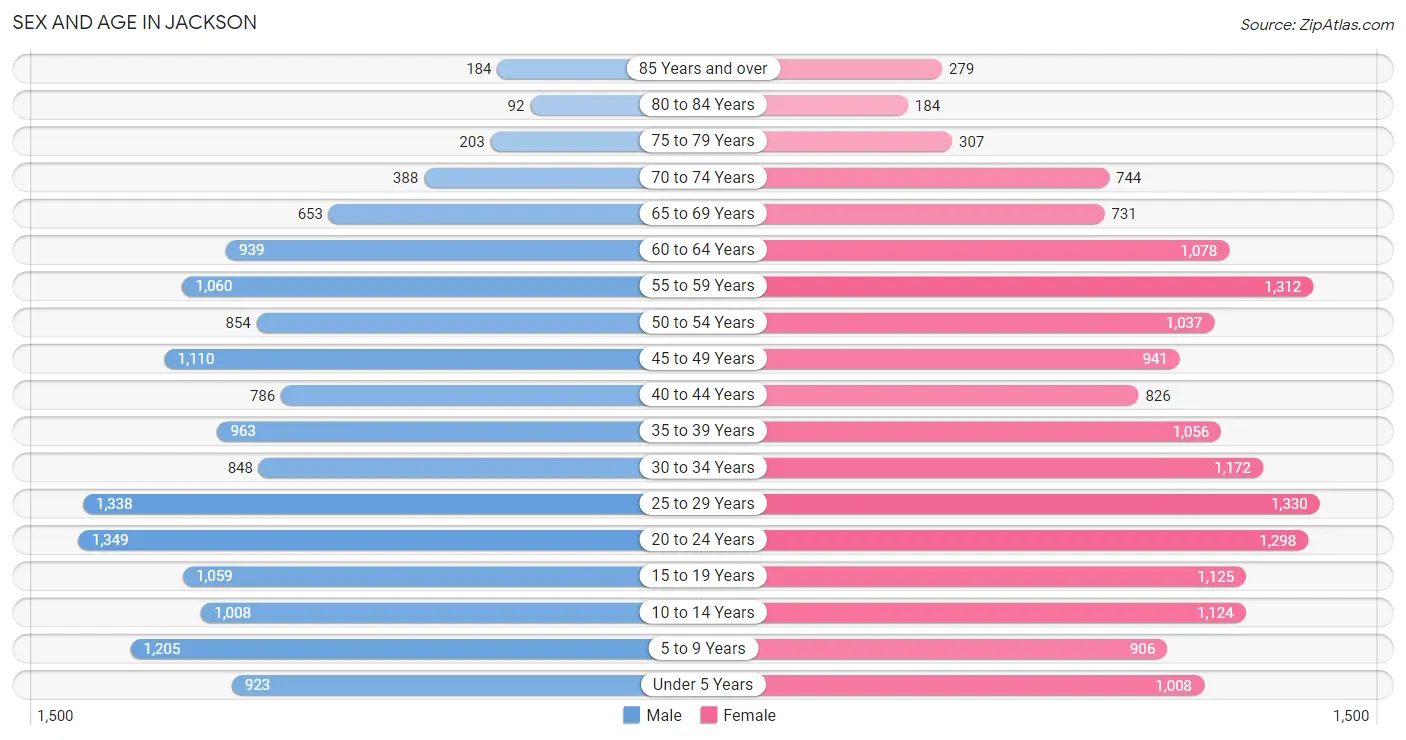
Sex and Age in Jackson
Sex and Age in Jackson
The most populous age groups in Jackson are 20 to 24 Years (1,349 | 9.0%) for men and 25 to 29 Years (1,330 | 8.1%) for women.
| Age Bracket | Male | Female |
| Under 5 Years | 923 (6.2%) | 1,008 (6.1%) |
| 5 to 9 Years | 1,205 (8.1%) | 906 (5.5%) |
| 10 to 14 Years | 1,008 (6.7%) | 1,124 (6.8%) |
| 15 to 19 Years | 1,059 (7.1%) | 1,125 (6.8%) |
| 20 to 24 Years | 1,349 (9.0%) | 1,298 (7.9%) |
| 25 to 29 Years | 1,338 (8.9%) | 1,330 (8.1%) |
| 30 to 34 Years | 848 (5.7%) | 1,172 (7.1%) |
| 35 to 39 Years | 963 (6.4%) | 1,056 (6.4%) |
| 40 to 44 Years | 786 (5.2%) | 826 (5.0%) |
| 45 to 49 Years | 1,110 (7.4%) | 941 (5.7%) |
| 50 to 54 Years | 854 (5.7%) | 1,037 (6.3%) |
| 55 to 59 Years | 1,060 (7.1%) | 1,312 (8.0%) |
| 60 to 64 Years | 939 (6.3%) | 1,078 (6.6%) |
| 65 to 69 Years | 653 (4.4%) | 731 (4.4%) |
| 70 to 74 Years | 388 (2.6%) | 744 (4.5%) |
| 75 to 79 Years | 203 (1.4%) | 307 (1.9%) |
| 80 to 84 Years | 92 (0.6%) | 184 (1.1%) |
| 85 Years and over | 184 (1.2%) | 279 (1.7%) |
| Total | 14,962 (100.0%) | 16,458 (100.0%) |
Families and Households in Jackson
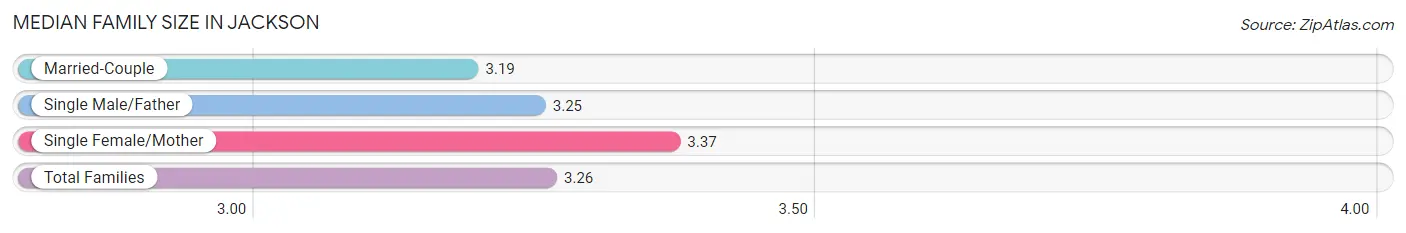
Median Family Size in Jackson
The median family size in Jackson is 3.26 persons per family, with single female/mother families (2,295 | 33.6%) accounting for the largest median family size of 3.37 persons per family. On the other hand, married-couple families (3,870 | 56.7%) represent the smallest median family size with 3.19 persons per family.
| Family Type | # Families | Family Size |
| Married-Couple | 3,870 (56.7%) | 3.19 |
| Single Male/Father | 664 (9.7%) | 3.25 |
| Single Female/Mother | 2,295 (33.6%) | 3.37 |
| Total Families | 6,829 (100.0%) | 3.26 |
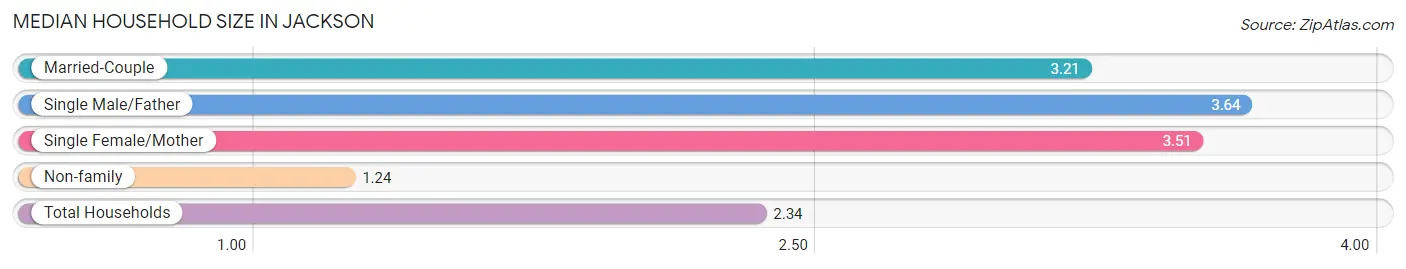
Median Household Size in Jackson
The median household size in Jackson is 2.34 persons per household, with single male/father households (664 | 5.1%) accounting for the largest median household size of 3.64 persons per household. non-family households (6,302 | 48.0%) represent the smallest median household size with 1.24 persons per household.
| Household Type | # Households | Household Size |
| Married-Couple | 3,870 (29.5%) | 3.21 |
| Single Male/Father | 664 (5.1%) | 3.64 |
| Single Female/Mother | 2,295 (17.5%) | 3.51 |
| Non-family | 6,302 (48.0%) | 1.24 |
| Total Households | 13,131 (100.0%) | 2.34 |
Household Size by Marriage Status in Jackson
Out of a total of 13,131 households in Jackson, 6,829 (52.0%) are family households, while 6,302 (48.0%) are nonfamily households. The most numerous type of family households are 2-person households, comprising 2,873, and the most common type of nonfamily households are 1-person households, comprising 5,231.
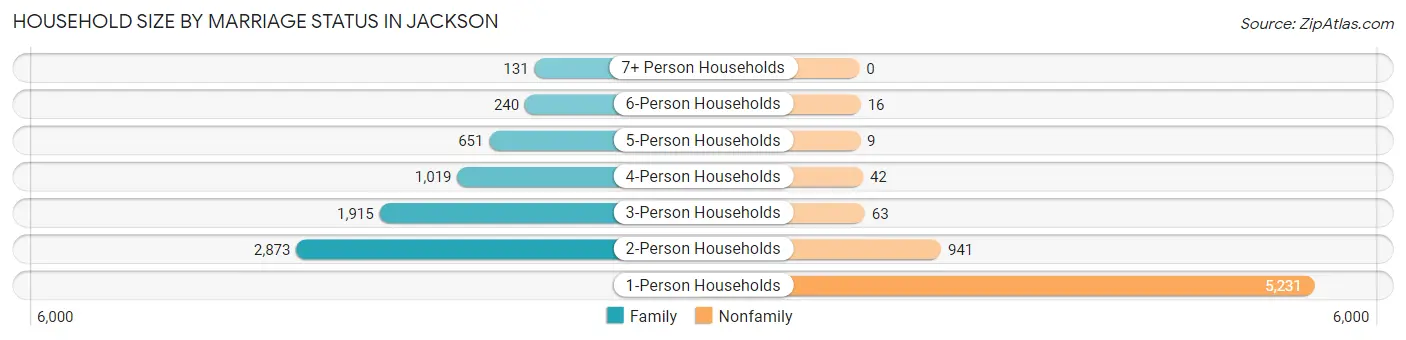
| Household Size | Family Households | Nonfamily Households |
| 1-Person Households | - | 5,231 (39.8%) |
| 2-Person Households | 2,873 (21.9%) | 941 (7.2%) |
| 3-Person Households | 1,915 (14.6%) | 63 (0.5%) |
| 4-Person Households | 1,019 (7.8%) | 42 (0.3%) |
| 5-Person Households | 651 (5.0%) | 9 (0.1%) |
| 6-Person Households | 240 (1.8%) | 16 (0.1%) |
| 7+ Person Households | 131 (1.0%) | 0 (0.0%) |
| Total | 6,829 (52.0%) | 6,302 (48.0%) |
Female Fertility in Jackson
Fertility by Age in Jackson
Average fertility rate in Jackson is 40.0 births per 1,000 women. Women in the age bracket of 20 to 34 years have the highest fertility rate with 63.0 births per 1,000 women. Women in the age bracket of 20 to 34 years acount for 73.7% of all women with births.
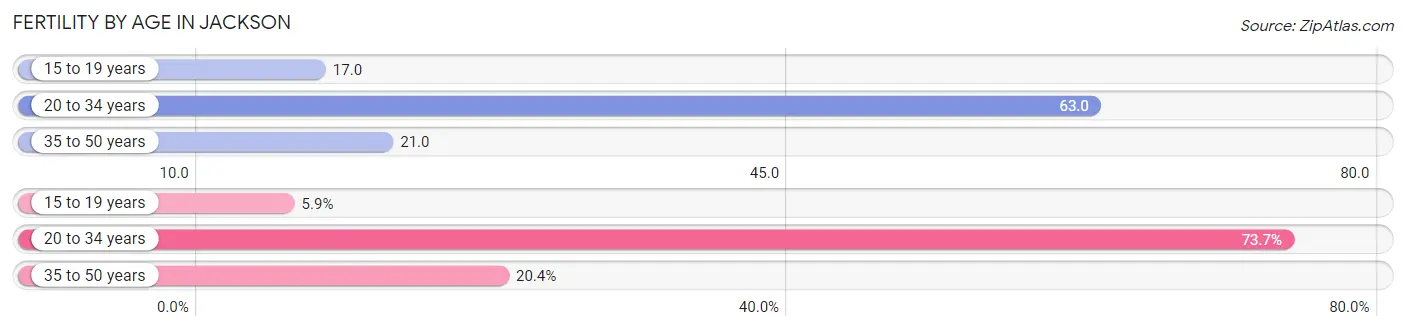
| Age Bracket | Women with Births | Births / 1,000 Women |
| 15 to 19 years | 19 (5.9%) | 17.0 |
| 20 to 34 years | 238 (73.7%) | 63.0 |
| 35 to 50 years | 66 (20.4%) | 21.0 |
| Total | 323 (100.0%) | 40.0 |
Fertility by Age by Marriage Status in Jackson
39.6% of women with births (323) in Jackson are married. The highest percentage of unmarried women with births falls into 15 to 19 years age bracket with 100.0% of them unmarried at the time of birth, while the lowest percentage of unmarried women with births belong to 35 to 50 years age bracket with 27.3% of them unmarried.
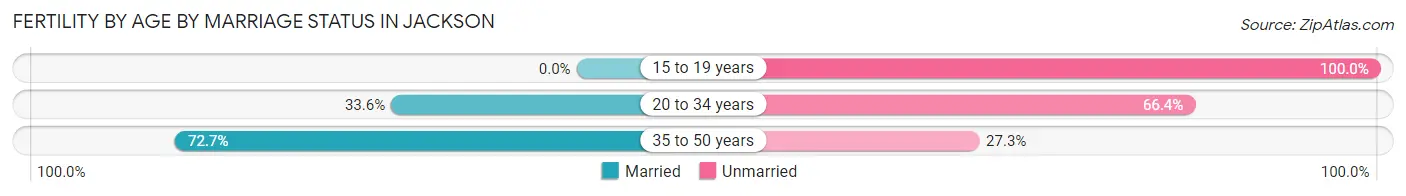
| Age Bracket | Married | Unmarried |
| 15 to 19 years | 0 (0.0%) | 19 (100.0%) |
| 20 to 34 years | 80 (33.6%) | 158 (66.4%) |
| 35 to 50 years | 48 (72.7%) | 18 (27.3%) |
| Total | 128 (39.6%) | 195 (60.4%) |
Fertility by Education in Jackson
Average fertility rate in Jackson is 40.0 births per 1,000 women. Women with the education attainment of graduate degree have the highest fertility rate of 96.0 births per 1,000 women, while women with the education attainment of less than high school have the lowest fertility at 10.0 births per 1,000 women. Women with the education attainment of college or associate's degree represent 40.9% of all women with births.
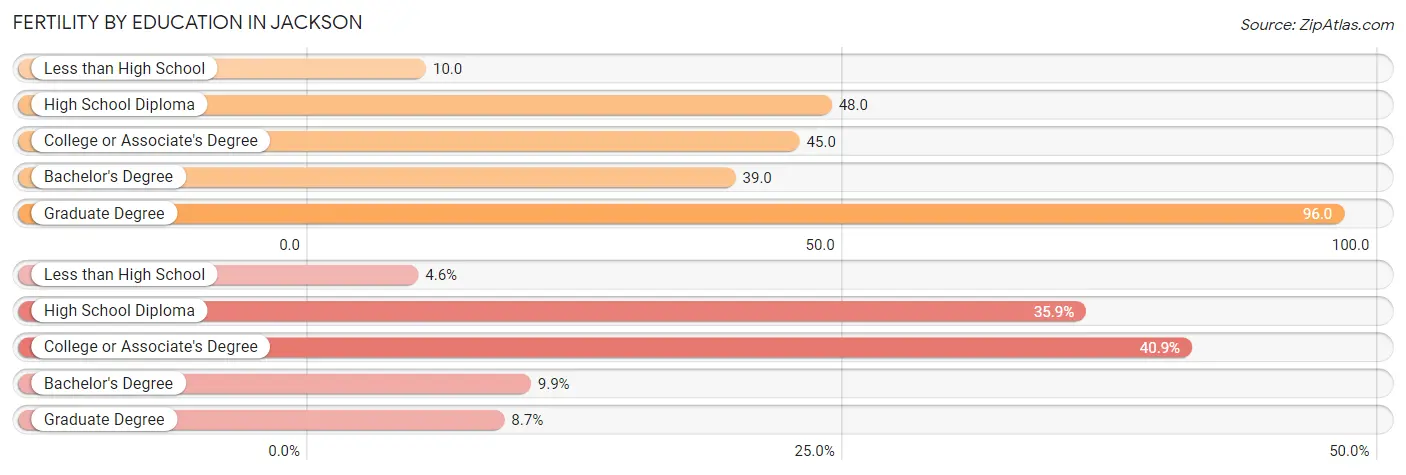
| Educational Attainment | Women with Births | Births / 1,000 Women |
| Less than High School | 15 (4.6%) | 10.0 |
| High School Diploma | 116 (35.9%) | 48.0 |
| College or Associate's Degree | 132 (40.9%) | 45.0 |
| Bachelor's Degree | 32 (9.9%) | 39.0 |
| Graduate Degree | 28 (8.7%) | 96.0 |
| Total | 323 (100.0%) | 40.0 |
Fertility by Education by Marriage Status in Jackson
60.4% of women with births in Jackson are unmarried. Women with the educational attainment of graduate degree are most likely to be married with 100.0% of them married at childbirth, while women with the educational attainment of high school diploma are least likely to be married with 86.2% of them unmarried at childbirth.
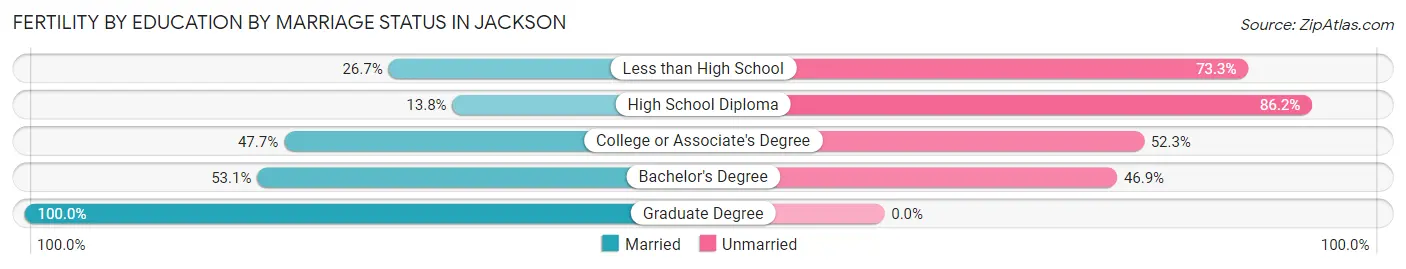
| Educational Attainment | Married | Unmarried |
| Less than High School | 4 (26.7%) | 11 (73.3%) |
| High School Diploma | 16 (13.8%) | 100 (86.2%) |
| College or Associate's Degree | 63 (47.7%) | 69 (52.3%) |
| Bachelor's Degree | 17 (53.1%) | 15 (46.9%) |
| Graduate Degree | 28 (100.0%) | 0 (0.0%) |
| Total | 128 (39.6%) | 195 (60.4%) |
Employment Characteristics in Jackson
Employment by Class of Employer in Jackson
Among the 13,157 employed individuals in Jackson, private company employees (9,664 | 73.5%), not-for-profit organizations (1,183 | 9.0%), and local government employees (690 | 5.2%) make up the most common classes of employment.
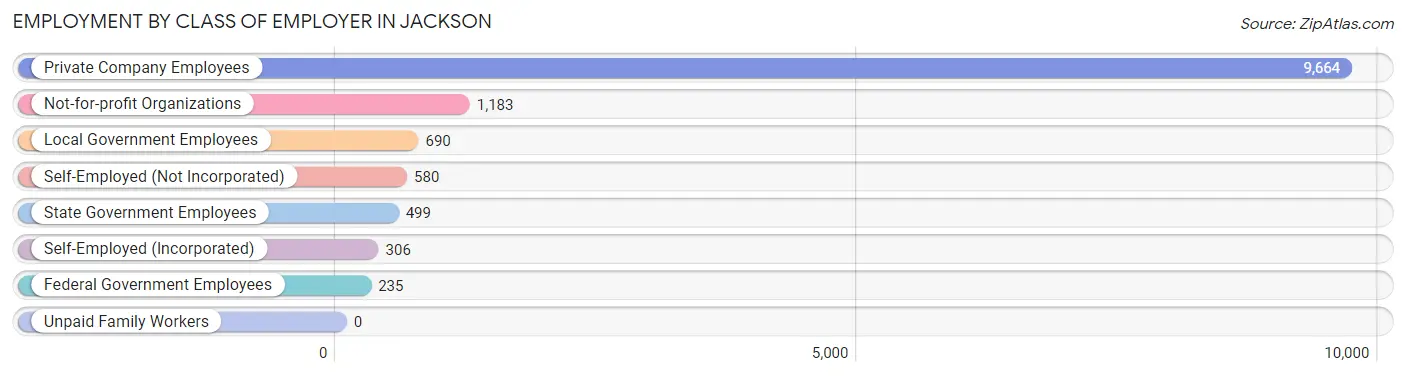
| Employer Class | # Employees | % Employees |
| Private Company Employees | 9,664 | 73.5% |
| Self-Employed (Incorporated) | 306 | 2.3% |
| Self-Employed (Not Incorporated) | 580 | 4.4% |
| Not-for-profit Organizations | 1,183 | 9.0% |
| Local Government Employees | 690 | 5.2% |
| State Government Employees | 499 | 3.8% |
| Federal Government Employees | 235 | 1.8% |
| Unpaid Family Workers | 0 | 0.0% |
| Total | 13,157 | 100.0% |
Employment Status by Age in Jackson
According to the labor force statistics for Jackson, out of the total population over 16 years of age (24,726), 60.6% or 14,984 individuals are in the labor force, with 10.9% or 1,633 of them unemployed. The age group with the highest labor force participation rate is 35 to 44 years, with 81.1% or 2,945 individuals in the labor force. Within the labor force, the 16 to 19 years age range has the highest percentage of unemployed individuals, with 23.5% or 169 of them being unemployed.
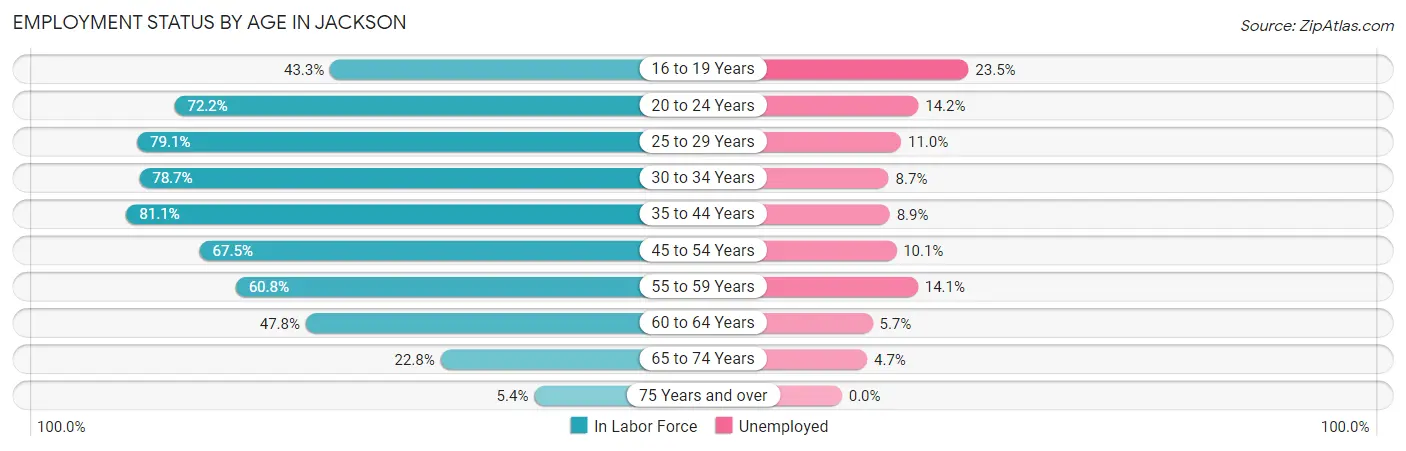
| Age Bracket | In Labor Force | Unemployed |
| 16 to 19 Years | 721 (43.3%) | 169 (23.5%) |
| 20 to 24 Years | 1,911 (72.2%) | 271 (14.2%) |
| 25 to 29 Years | 2,110 (79.1%) | 232 (11.0%) |
| 30 to 34 Years | 1,590 (78.7%) | 138 (8.7%) |
| 35 to 44 Years | 2,945 (81.1%) | 262 (8.9%) |
| 45 to 54 Years | 2,661 (67.5%) | 269 (10.1%) |
| 55 to 59 Years | 1,442 (60.8%) | 203 (14.1%) |
| 60 to 64 Years | 964 (47.8%) | 55 (5.7%) |
| 65 to 74 Years | 574 (22.8%) | 27 (4.7%) |
| 75 Years and over | 67 (5.4%) | 0 (0.0%) |
| Total | 14,984 (60.6%) | 1,633 (10.9%) |
Employment Status by Educational Attainment in Jackson
According to labor force statistics for Jackson, 70.3% of individuals (11,705) out of the total population between 25 and 64 years of age (16,650) are in the labor force, with 9.9% or 1,159 of them being unemployed. The group with the highest labor force participation rate are those with the educational attainment of bachelor's degree or higher, with 90.1% or 2,321 individuals in the labor force. Within the labor force, individuals with high school diploma education have the highest percentage of unemployment, with 14.6% or 579 of them being unemployed.
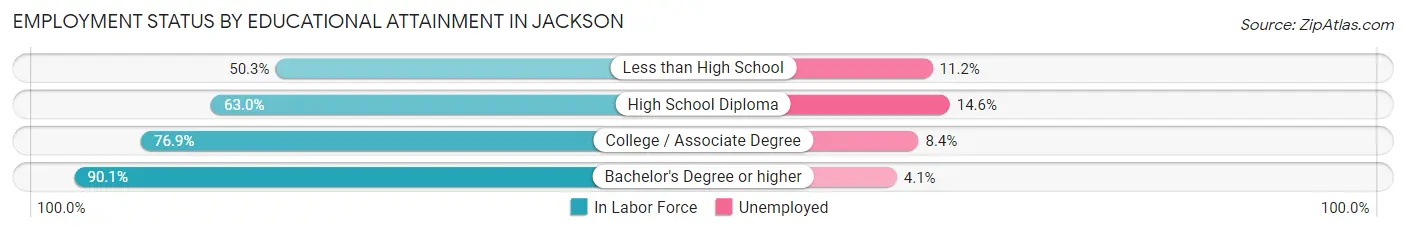
| Educational Attainment | In Labor Force | Unemployed |
| Less than High School | 1,059 (50.3%) | 236 (11.2%) |
| High School Diploma | 3,966 (63.0%) | 919 (14.6%) |
| College / Associate Degree | 4,363 (76.9%) | 477 (8.4%) |
| Bachelor's Degree or higher | 2,321 (90.1%) | 106 (4.1%) |
| Total | 11,705 (70.3%) | 1,648 (9.9%) |
Employment Occupations by Sex in Jackson
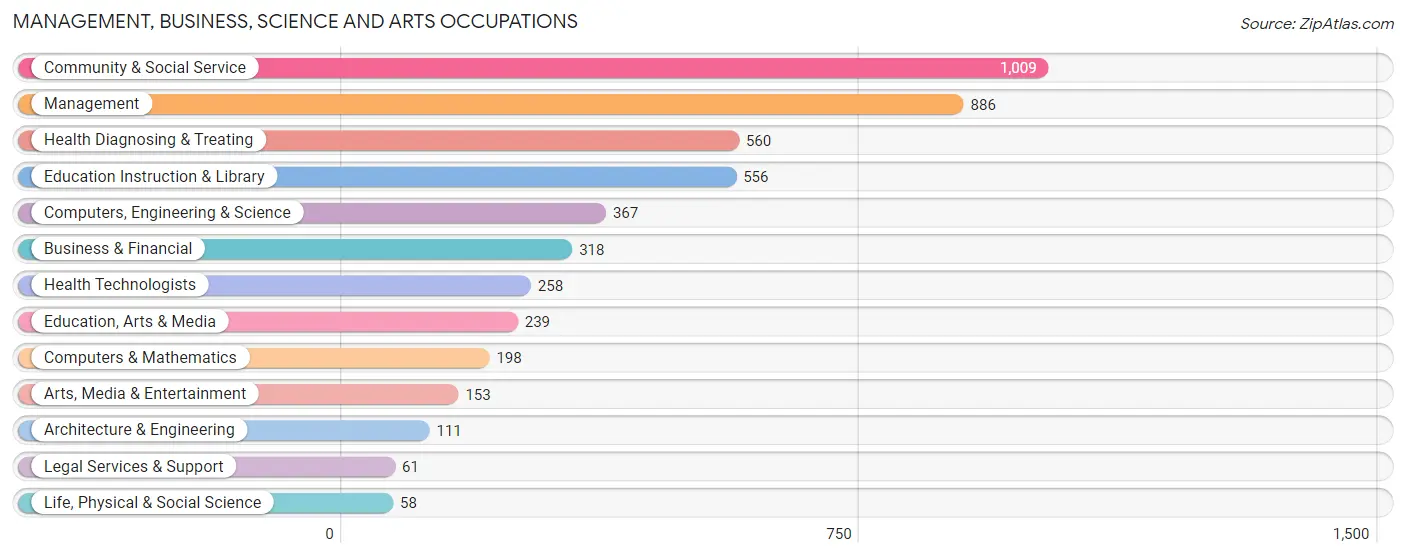
Management, Business, Science and Arts Occupations
The most common Management, Business, Science and Arts occupations in Jackson are Community & Social Service (1,009 | 7.6%), Management (886 | 6.7%), Health Diagnosing & Treating (560 | 4.2%), Education Instruction & Library (556 | 4.2%), and Computers, Engineering & Science (367 | 2.8%).
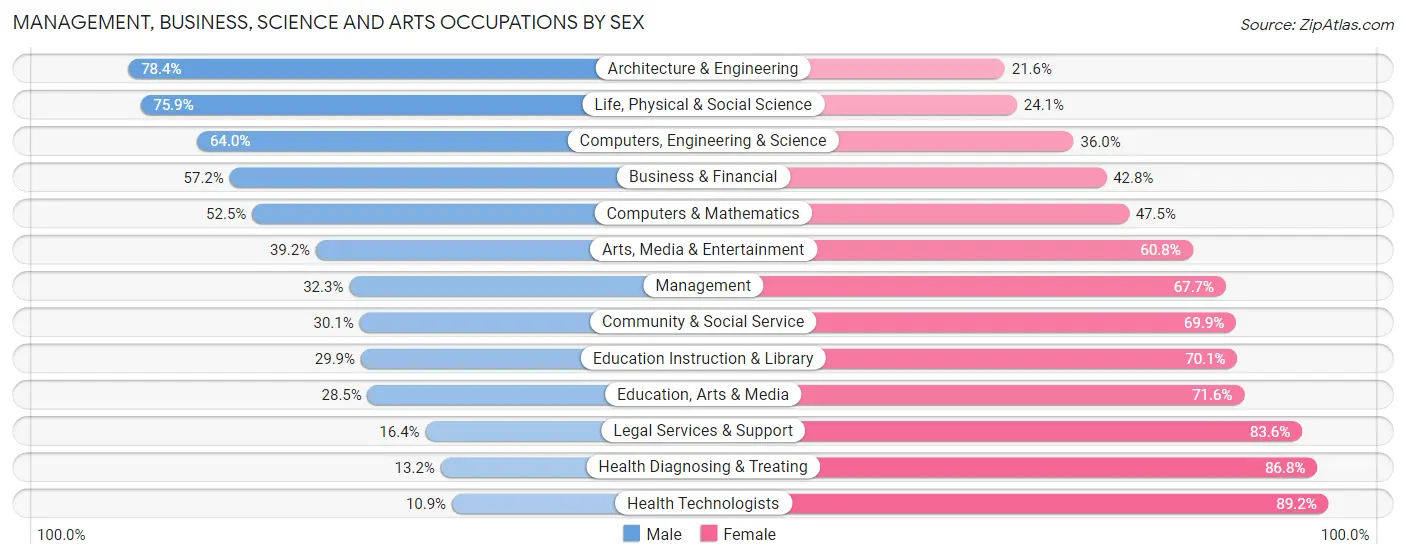
Management, Business, Science and Arts Occupations by Sex
Within the Management, Business, Science and Arts occupations in Jackson, the most male-oriented occupations are Architecture & Engineering (78.4%), Life, Physical & Social Science (75.9%), and Computers, Engineering & Science (64.0%), while the most female-oriented occupations are Health Technologists (89.1%), Health Diagnosing & Treating (86.8%), and Legal Services & Support (83.6%).
| Occupation | Male | Female |
| Management | 286 (32.3%) | 600 (67.7%) |
| Business & Financial | 182 (57.2%) | 136 (42.8%) |
| Computers, Engineering & Science | 235 (64.0%) | 132 (36.0%) |
| Computers & Mathematics | 104 (52.5%) | 94 (47.5%) |
| Architecture & Engineering | 87 (78.4%) | 24 (21.6%) |
| Life, Physical & Social Science | 44 (75.9%) | 14 (24.1%) |
| Community & Social Service | 304 (30.1%) | 705 (69.9%) |
| Education, Arts & Media | 68 (28.4%) | 171 (71.6%) |
| Legal Services & Support | 10 (16.4%) | 51 (83.6%) |
| Education Instruction & Library | 166 (29.9%) | 390 (70.1%) |
| Arts, Media & Entertainment | 60 (39.2%) | 93 (60.8%) |
| Health Diagnosing & Treating | 74 (13.2%) | 486 (86.8%) |
| Health Technologists | 28 (10.8%) | 230 (89.1%) |
| Total (Category) | 1,081 (34.4%) | 2,059 (65.6%) |
| Total (Overall) | 6,474 (48.6%) | 6,856 (51.4%) |
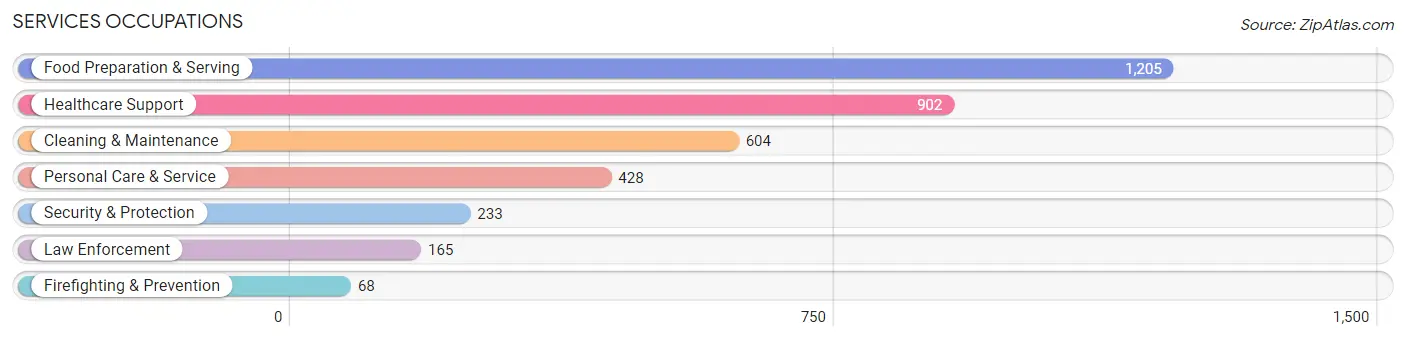
Services Occupations
The most common Services occupations in Jackson are Food Preparation & Serving (1,205 | 9.0%), Healthcare Support (902 | 6.8%), Cleaning & Maintenance (604 | 4.5%), Personal Care & Service (428 | 3.2%), and Security & Protection (233 | 1.8%).
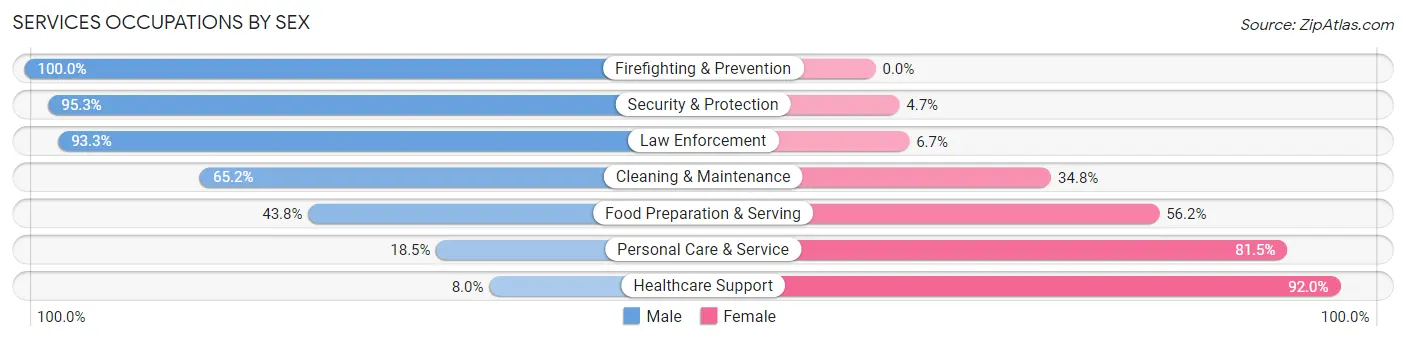
Services Occupations by Sex
Within the Services occupations in Jackson, the most male-oriented occupations are Firefighting & Prevention (100.0%), Security & Protection (95.3%), and Law Enforcement (93.3%), while the most female-oriented occupations are Healthcare Support (92.0%), Personal Care & Service (81.5%), and Food Preparation & Serving (56.2%).
| Occupation | Male | Female |
| Healthcare Support | 72 (8.0%) | 830 (92.0%) |
| Security & Protection | 222 (95.3%) | 11 (4.7%) |
| Firefighting & Prevention | 68 (100.0%) | 0 (0.0%) |
| Law Enforcement | 154 (93.3%) | 11 (6.7%) |
| Food Preparation & Serving | 528 (43.8%) | 677 (56.2%) |
| Cleaning & Maintenance | 394 (65.2%) | 210 (34.8%) |
| Personal Care & Service | 79 (18.5%) | 349 (81.5%) |
| Total (Category) | 1,295 (38.4%) | 2,077 (61.6%) |
| Total (Overall) | 6,474 (48.6%) | 6,856 (51.4%) |
Sales and Office Occupations
The most common Sales and Office occupations in Jackson are Sales & Related (1,528 | 11.5%), and Office & Administration (1,243 | 9.3%).
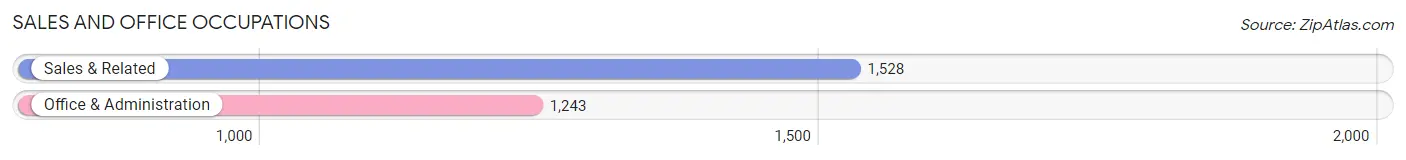
Sales and Office Occupations by Sex
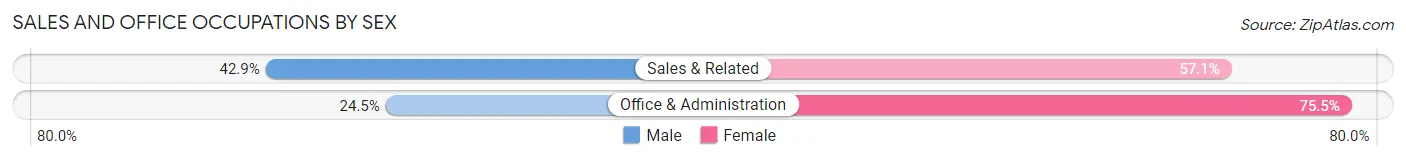
| Occupation | Male | Female |
| Sales & Related | 656 (42.9%) | 872 (57.1%) |
| Office & Administration | 304 (24.5%) | 939 (75.5%) |
| Total (Category) | 960 (34.6%) | 1,811 (65.4%) |
| Total (Overall) | 6,474 (48.6%) | 6,856 (51.4%) |
Natural Resources, Construction and Maintenance Occupations
The most common Natural Resources, Construction and Maintenance occupations in Jackson are Construction & Extraction (630 | 4.7%), Installation, Maintenance & Repair (377 | 2.8%), and Farming, Fishing & Forestry (32 | 0.2%).
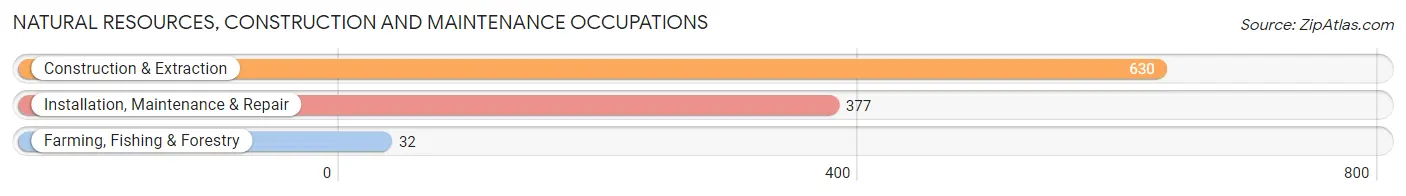
Natural Resources, Construction and Maintenance Occupations by Sex
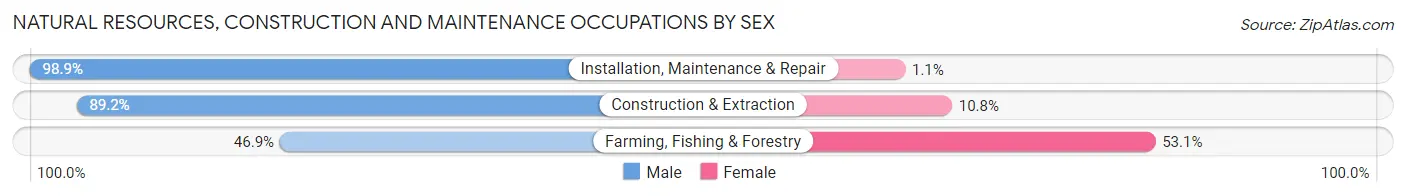
| Occupation | Male | Female |
| Farming, Fishing & Forestry | 15 (46.9%) | 17 (53.1%) |
| Construction & Extraction | 562 (89.2%) | 68 (10.8%) |
| Installation, Maintenance & Repair | 373 (98.9%) | 4 (1.1%) |
| Total (Category) | 950 (91.4%) | 89 (8.6%) |
| Total (Overall) | 6,474 (48.6%) | 6,856 (51.4%) |
Production, Transportation and Moving Occupations
The most common Production, Transportation and Moving occupations in Jackson are Production (1,677 | 12.6%), Material Moving (707 | 5.3%), and Transportation (624 | 4.7%).
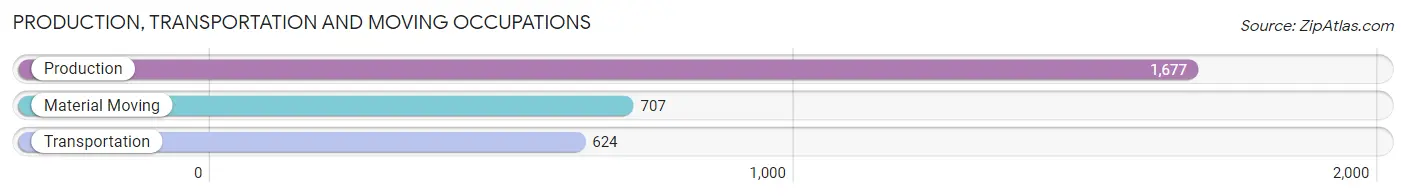
Production, Transportation and Moving Occupations by Sex
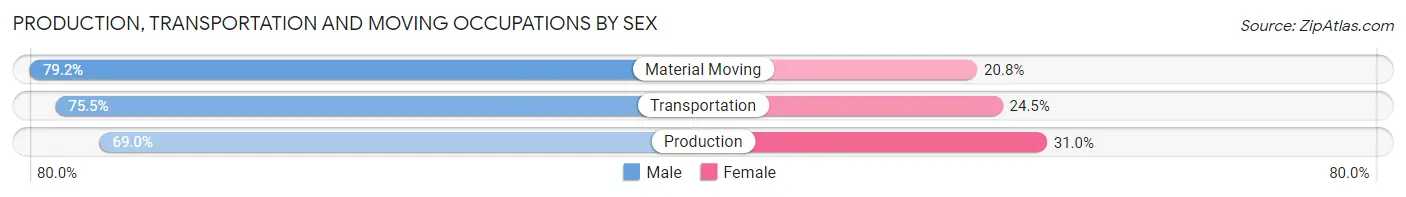
| Occupation | Male | Female |
| Production | 1,157 (69.0%) | 520 (31.0%) |
| Transportation | 471 (75.5%) | 153 (24.5%) |
| Material Moving | 560 (79.2%) | 147 (20.8%) |
| Total (Category) | 2,188 (72.7%) | 820 (27.3%) |
| Total (Overall) | 6,474 (48.6%) | 6,856 (51.4%) |
Employment Industries by Sex in Jackson
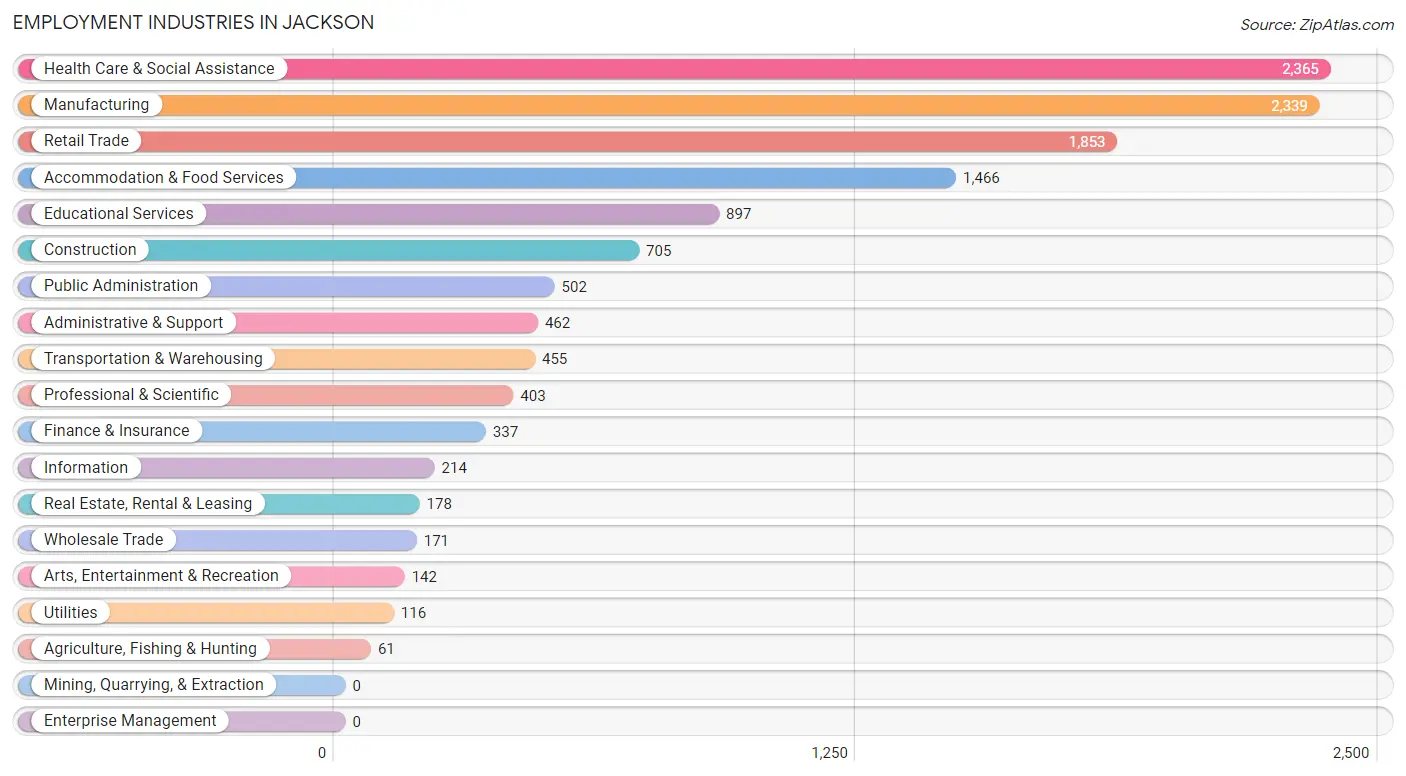
Employment Industries in Jackson
The major employment industries in Jackson include Health Care & Social Assistance (2,365 | 17.7%), Manufacturing (2,339 | 17.5%), Retail Trade (1,853 | 13.9%), Accommodation & Food Services (1,466 | 11.0%), and Educational Services (897 | 6.7%).
Employment Industries by Sex in Jackson
The Jackson industries that see more men than women are Construction (87.9%), Manufacturing (69.9%), and Administrative & Support (66.4%), whereas the industries that tend to have a higher number of women are Health Care & Social Assistance (78.8%), Educational Services (65.2%), and Information (64.5%).
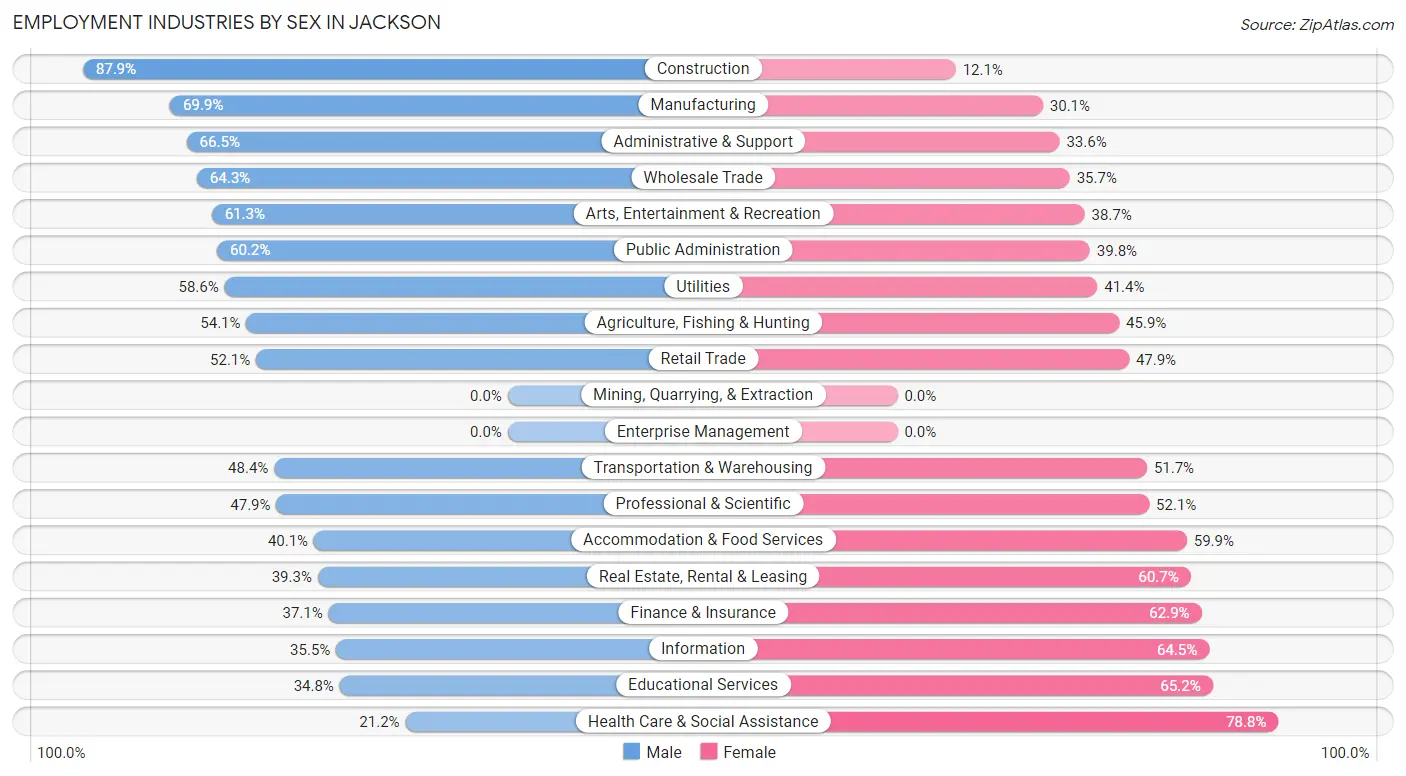
| Industry | Male | Female |
| Agriculture, Fishing & Hunting | 33 (54.1%) | 28 (45.9%) |
| Mining, Quarrying, & Extraction | 0 (0.0%) | 0 (0.0%) |
| Construction | 620 (87.9%) | 85 (12.1%) |
| Manufacturing | 1,635 (69.9%) | 704 (30.1%) |
| Wholesale Trade | 110 (64.3%) | 61 (35.7%) |
| Retail Trade | 965 (52.1%) | 888 (47.9%) |
| Transportation & Warehousing | 220 (48.3%) | 235 (51.6%) |
| Utilities | 68 (58.6%) | 48 (41.4%) |
| Information | 76 (35.5%) | 138 (64.5%) |
| Finance & Insurance | 125 (37.1%) | 212 (62.9%) |
| Real Estate, Rental & Leasing | 70 (39.3%) | 108 (60.7%) |
| Professional & Scientific | 193 (47.9%) | 210 (52.1%) |
| Enterprise Management | 0 (0.0%) | 0 (0.0%) |
| Administrative & Support | 307 (66.4%) | 155 (33.6%) |
| Educational Services | 312 (34.8%) | 585 (65.2%) |
| Health Care & Social Assistance | 501 (21.2%) | 1,864 (78.8%) |
| Arts, Entertainment & Recreation | 87 (61.3%) | 55 (38.7%) |
| Accommodation & Food Services | 588 (40.1%) | 878 (59.9%) |
| Public Administration | 302 (60.2%) | 200 (39.8%) |
| Total | 6,474 (48.6%) | 6,856 (51.4%) |
Education in Jackson
School Enrollment in Jackson
The most common levels of schooling among the 7,456 students in Jackson are high school (1,932 | 25.9%), elementary school (1,663 | 22.3%), and middle school (1,592 | 21.3%).
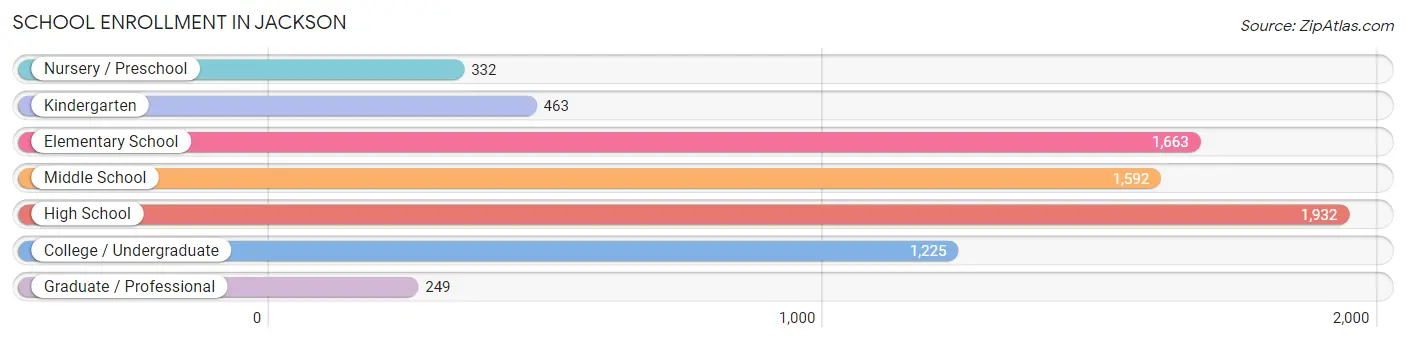
| School Level | # Students | % Students |
| Nursery / Preschool | 332 | 4.4% |
| Kindergarten | 463 | 6.2% |
| Elementary School | 1,663 | 22.3% |
| Middle School | 1,592 | 21.3% |
| High School | 1,932 | 25.9% |
| College / Undergraduate | 1,225 | 16.4% |
| Graduate / Professional | 249 | 3.3% |
| Total | 7,456 | 100.0% |
School Enrollment by Age by Funding Source in Jackson
Out of a total of 7,456 students who are enrolled in schools in Jackson, 910 (12.2%) attend a private institution, while the remaining 6,546 (87.8%) are enrolled in public schools. The age group of 3 to 4 year olds has the highest likelihood of being enrolled in private schools, with 62 (23.7% in the age bracket) enrolled. Conversely, the age group of 35 years and over has the lowest likelihood of being enrolled in a private school, with 209 (94.6% in the age bracket) attending a public institution.
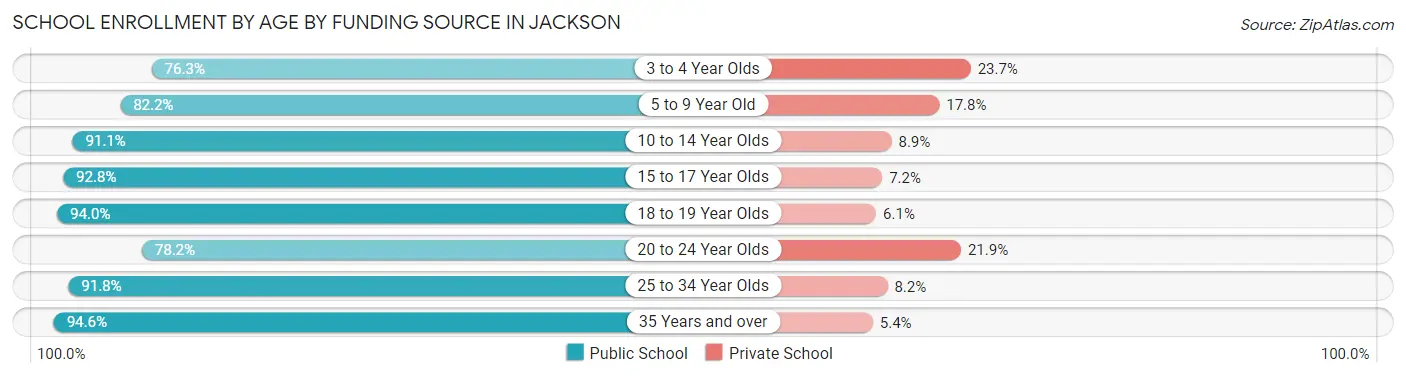
| Age Bracket | Public School | Private School |
| 3 to 4 Year Olds | 200 (76.3%) | 62 (23.7%) |
| 5 to 9 Year Old | 1,643 (82.2%) | 356 (17.8%) |
| 10 to 14 Year Olds | 1,848 (91.1%) | 181 (8.9%) |
| 15 to 17 Year Olds | 1,216 (92.8%) | 94 (7.2%) |
| 18 to 19 Year Olds | 528 (94.0%) | 34 (6.0%) |
| 20 to 24 Year Olds | 465 (78.1%) | 130 (21.8%) |
| 25 to 34 Year Olds | 439 (91.8%) | 39 (8.2%) |
| 35 Years and over | 209 (94.6%) | 12 (5.4%) |
| Total | 6,546 (87.8%) | 910 (12.2%) |
Educational Attainment by Field of Study in Jackson
Business (688 | 19.9%), education (530 | 15.3%), science & technology (414 | 11.9%), arts & humanities (302 | 8.7%), and psychology (282 | 8.1%) are the most common fields of study among 3,464 individuals in Jackson who have obtained a bachelor's degree or higher.
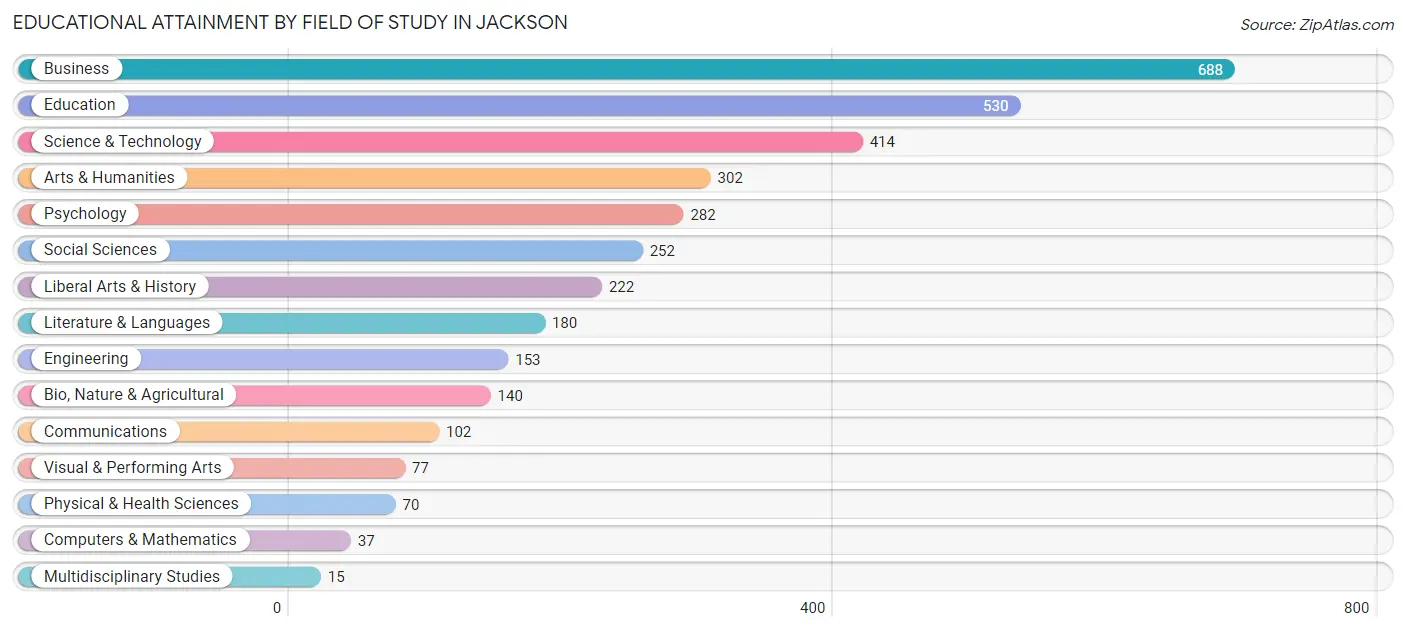
| Field of Study | # Graduates | % Graduates |
| Computers & Mathematics | 37 | 1.1% |
| Bio, Nature & Agricultural | 140 | 4.0% |
| Physical & Health Sciences | 70 | 2.0% |
| Psychology | 282 | 8.1% |
| Social Sciences | 252 | 7.3% |
| Engineering | 153 | 4.4% |
| Multidisciplinary Studies | 15 | 0.4% |
| Science & Technology | 414 | 11.9% |
| Business | 688 | 19.9% |
| Education | 530 | 15.3% |
| Literature & Languages | 180 | 5.2% |
| Liberal Arts & History | 222 | 6.4% |
| Visual & Performing Arts | 77 | 2.2% |
| Communications | 102 | 2.9% |
| Arts & Humanities | 302 | 8.7% |
| Total | 3,464 | 100.0% |
Transportation & Commute in Jackson
Vehicle Availability by Sex in Jackson
The most prevalent vehicle ownership categories in Jackson are males with 2 vehicles (2,581, accounting for 40.7%) and females with 2 vehicles (2,486, making up 38.3%).
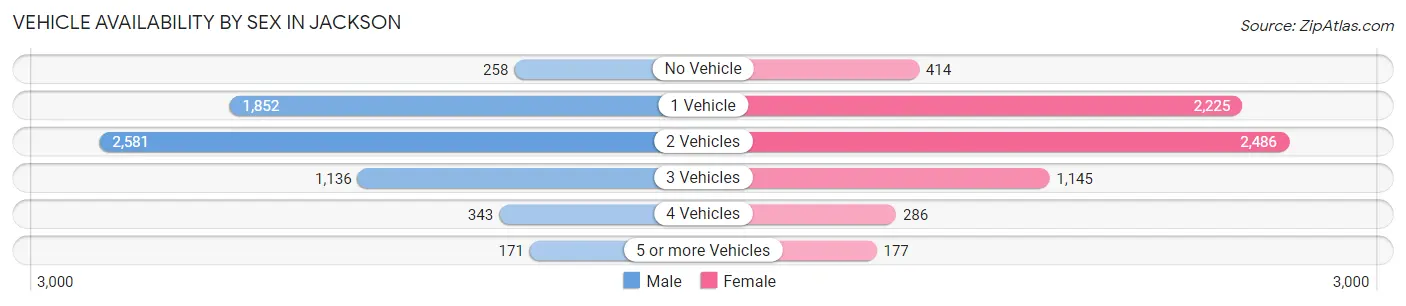
| Vehicles Available | Male | Female |
| No Vehicle | 258 (4.1%) | 414 (6.1%) |
| 1 Vehicle | 1,852 (29.2%) | 2,225 (33.1%) |
| 2 Vehicles | 2,581 (40.7%) | 2,486 (36.9%) |
| 3 Vehicles | 1,136 (17.9%) | 1,145 (17.0%) |
| 4 Vehicles | 343 (5.4%) | 286 (4.3%) |
| 5 or more Vehicles | 171 (2.7%) | 177 (2.6%) |
| Total | 6,341 (100.0%) | 6,733 (100.0%) |
Commute Time in Jackson
The most frequently occuring commute durations in Jackson are 5 to 9 minutes (3,388 commuters, 27.3%), 10 to 14 minutes (3,115 commuters, 25.1%), and 15 to 19 minutes (2,005 commuters, 16.1%).
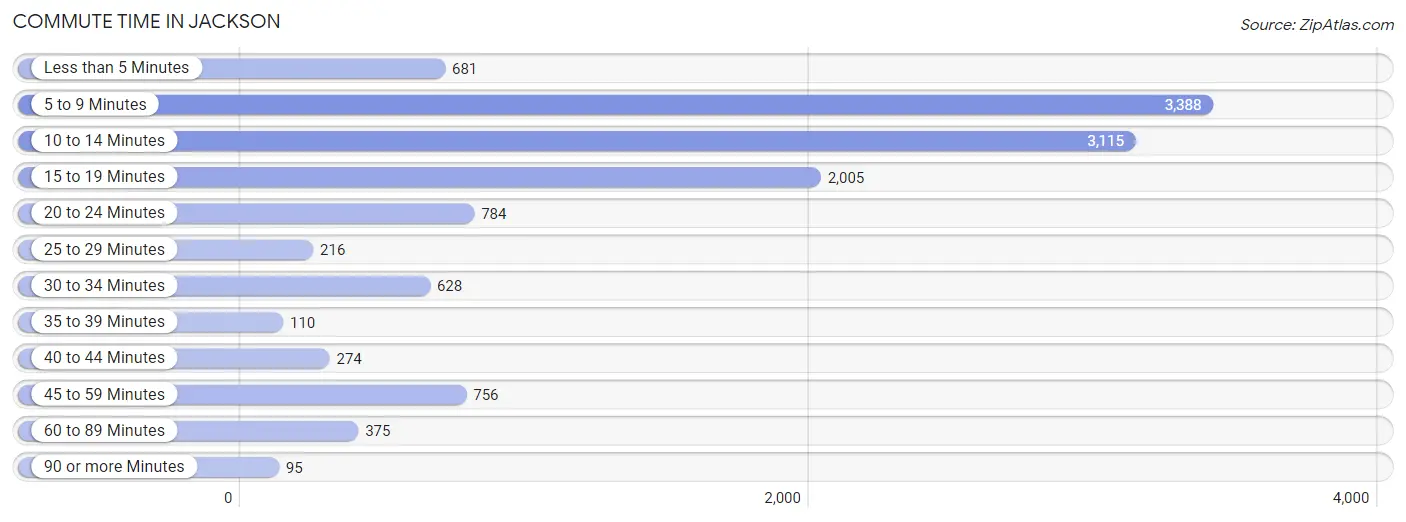
| Commute Time | # Commuters | % Commuters |
| Less than 5 Minutes | 681 | 5.5% |
| 5 to 9 Minutes | 3,388 | 27.3% |
| 10 to 14 Minutes | 3,115 | 25.1% |
| 15 to 19 Minutes | 2,005 | 16.1% |
| 20 to 24 Minutes | 784 | 6.3% |
| 25 to 29 Minutes | 216 | 1.7% |
| 30 to 34 Minutes | 628 | 5.1% |
| 35 to 39 Minutes | 110 | 0.9% |
| 40 to 44 Minutes | 274 | 2.2% |
| 45 to 59 Minutes | 756 | 6.1% |
| 60 to 89 Minutes | 375 | 3.0% |
| 90 or more Minutes | 95 | 0.8% |
Commute Time by Sex in Jackson
The most common commute times in Jackson are 10 to 14 minutes (1,453 commuters, 23.7%) for males and 5 to 9 minutes (1,997 commuters, 31.7%) for females.
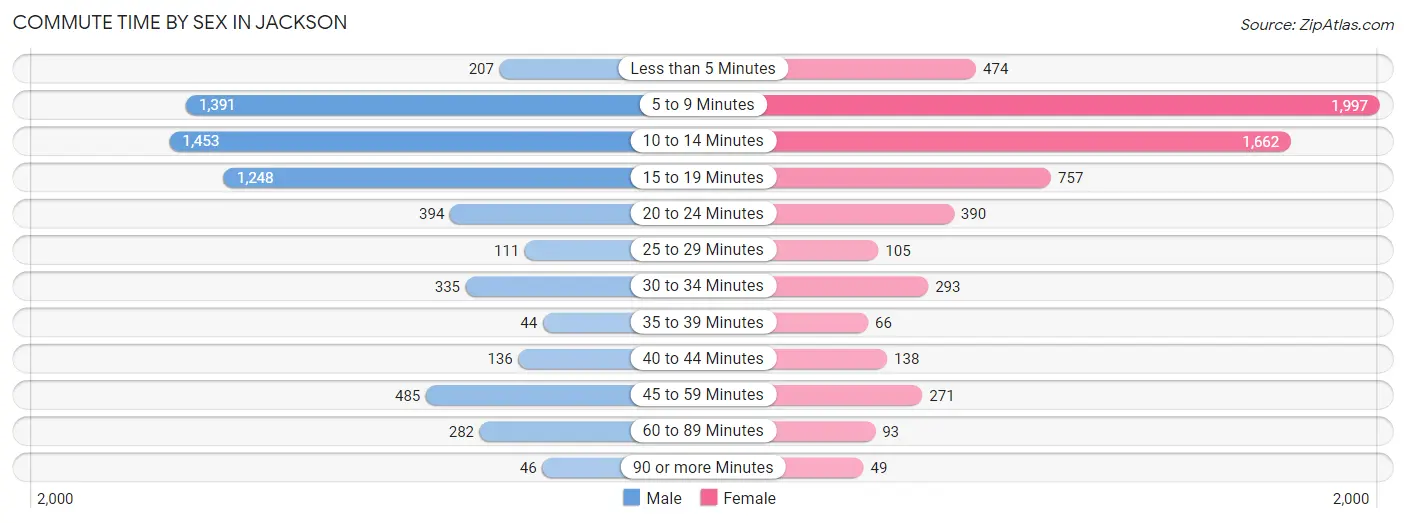
| Commute Time | Male | Female |
| Less than 5 Minutes | 207 (3.4%) | 474 (7.5%) |
| 5 to 9 Minutes | 1,391 (22.7%) | 1,997 (31.7%) |
| 10 to 14 Minutes | 1,453 (23.7%) | 1,662 (26.4%) |
| 15 to 19 Minutes | 1,248 (20.3%) | 757 (12.0%) |
| 20 to 24 Minutes | 394 (6.4%) | 390 (6.2%) |
| 25 to 29 Minutes | 111 (1.8%) | 105 (1.7%) |
| 30 to 34 Minutes | 335 (5.5%) | 293 (4.6%) |
| 35 to 39 Minutes | 44 (0.7%) | 66 (1.1%) |
| 40 to 44 Minutes | 136 (2.2%) | 138 (2.2%) |
| 45 to 59 Minutes | 485 (7.9%) | 271 (4.3%) |
| 60 to 89 Minutes | 282 (4.6%) | 93 (1.5%) |
| 90 or more Minutes | 46 (0.7%) | 49 (0.8%) |
Time of Departure to Work by Sex in Jackson
The most frequent times of departure to work in Jackson are 12:00 PM to 3:59 PM (944, 15.4%) for males and 7:30 AM to 7:59 AM (834, 13.3%) for females.
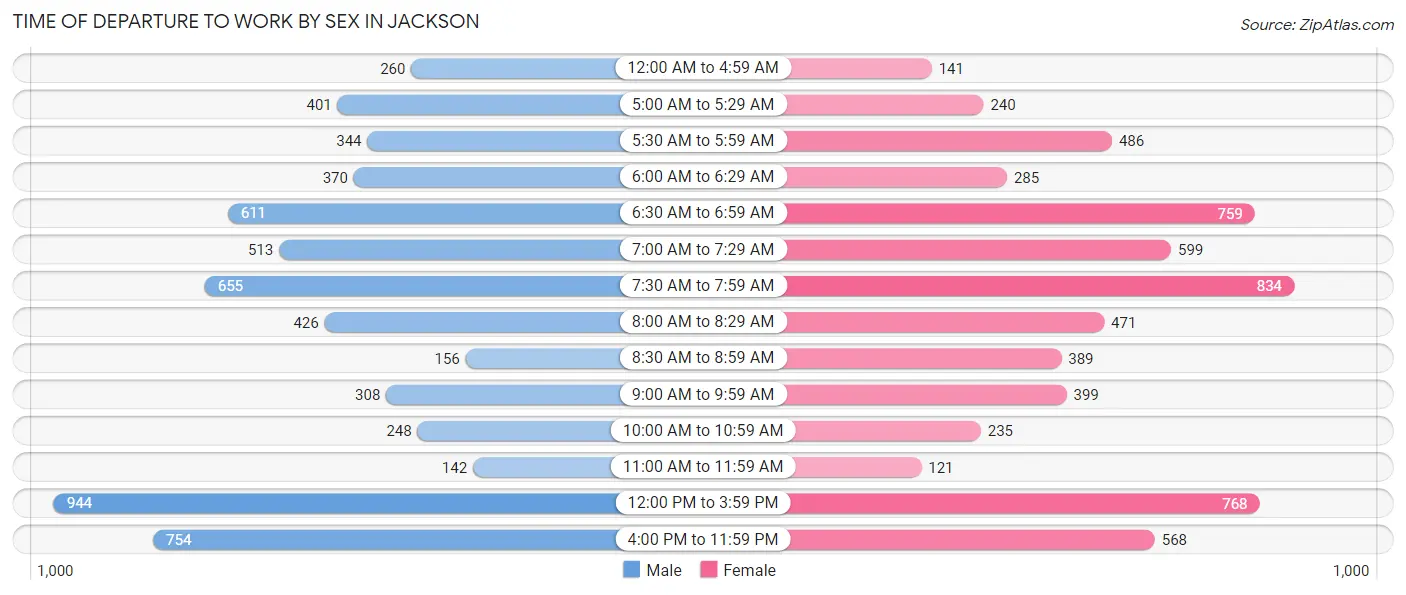
| Time of Departure | Male | Female |
| 12:00 AM to 4:59 AM | 260 (4.2%) | 141 (2.2%) |
| 5:00 AM to 5:29 AM | 401 (6.5%) | 240 (3.8%) |
| 5:30 AM to 5:59 AM | 344 (5.6%) | 486 (7.7%) |
| 6:00 AM to 6:29 AM | 370 (6.0%) | 285 (4.5%) |
| 6:30 AM to 6:59 AM | 611 (10.0%) | 759 (12.1%) |
| 7:00 AM to 7:29 AM | 513 (8.4%) | 599 (9.5%) |
| 7:30 AM to 7:59 AM | 655 (10.7%) | 834 (13.3%) |
| 8:00 AM to 8:29 AM | 426 (7.0%) | 471 (7.5%) |
| 8:30 AM to 8:59 AM | 156 (2.5%) | 389 (6.2%) |
| 9:00 AM to 9:59 AM | 308 (5.0%) | 399 (6.3%) |
| 10:00 AM to 10:59 AM | 248 (4.0%) | 235 (3.7%) |
| 11:00 AM to 11:59 AM | 142 (2.3%) | 121 (1.9%) |
| 12:00 PM to 3:59 PM | 944 (15.4%) | 768 (12.2%) |
| 4:00 PM to 11:59 PM | 754 (12.3%) | 568 (9.0%) |
| Total | 6,132 (100.0%) | 6,295 (100.0%) |
Housing Occupancy in Jackson
Occupancy by Ownership in Jackson
Of the total 13,131 dwellings in Jackson, owner-occupied units account for 7,186 (54.7%), while renter-occupied units make up 5,945 (45.3%).
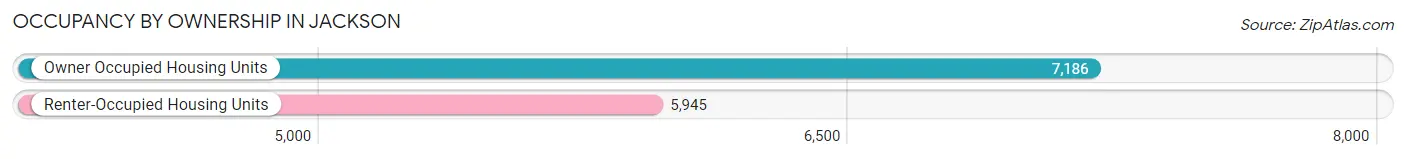
| Occupancy | # Housing Units | % Housing Units |
| Owner Occupied Housing Units | 7,186 | 54.7% |
| Renter-Occupied Housing Units | 5,945 | 45.3% |
| Total Occupied Housing Units | 13,131 | 100.0% |
Occupancy by Household Size in Jackson
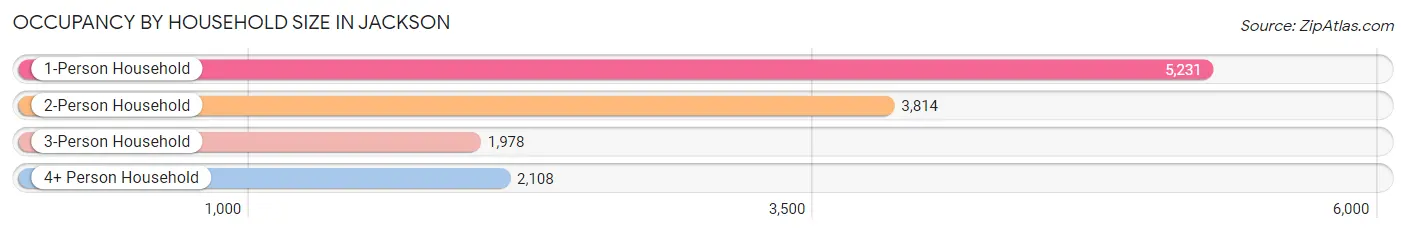
| Household Size | # Housing Units | % Housing Units |
| 1-Person Household | 5,231 | 39.8% |
| 2-Person Household | 3,814 | 29.0% |
| 3-Person Household | 1,978 | 15.1% |
| 4+ Person Household | 2,108 | 16.1% |
| Total Housing Units | 13,131 | 100.0% |
Occupancy by Ownership by Household Size in Jackson
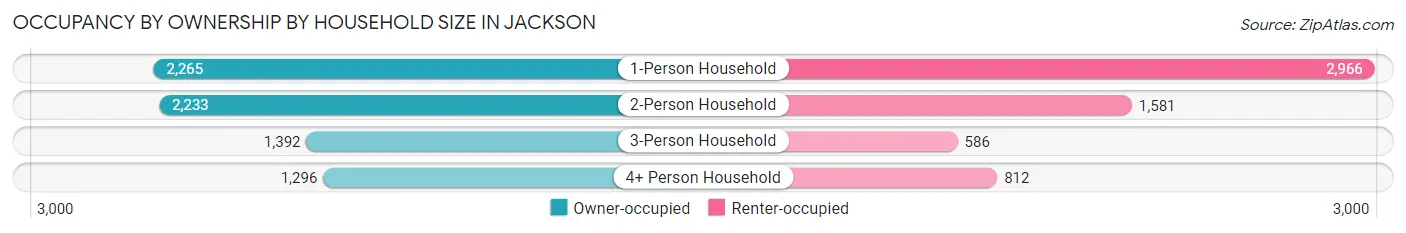
| Household Size | Owner-occupied | Renter-occupied |
| 1-Person Household | 2,265 (43.3%) | 2,966 (56.7%) |
| 2-Person Household | 2,233 (58.6%) | 1,581 (41.4%) |
| 3-Person Household | 1,392 (70.4%) | 586 (29.6%) |
| 4+ Person Household | 1,296 (61.5%) | 812 (38.5%) |
| Total Housing Units | 7,186 (54.7%) | 5,945 (45.3%) |
Occupancy by Educational Attainment in Jackson
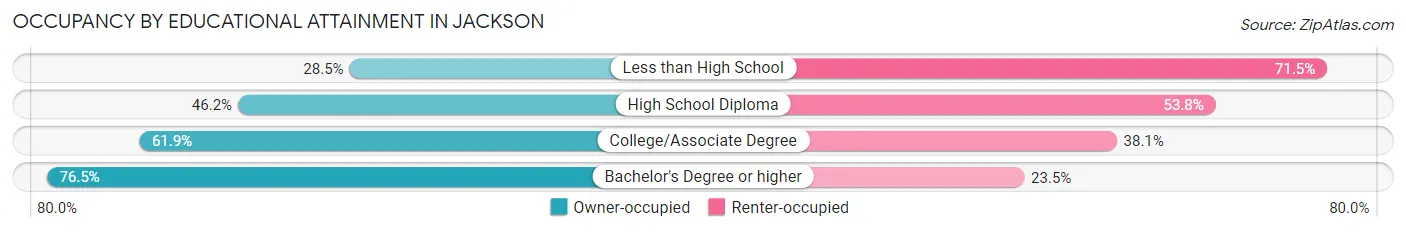
| Household Size | Owner-occupied | Renter-occupied |
| Less than High School | 428 (28.5%) | 1,075 (71.5%) |
| High School Diploma | 2,155 (46.2%) | 2,513 (53.8%) |
| College/Associate Degree | 3,051 (61.9%) | 1,881 (38.1%) |
| Bachelor's Degree or higher | 1,552 (76.5%) | 476 (23.5%) |
Occupancy by Age of Householder in Jackson
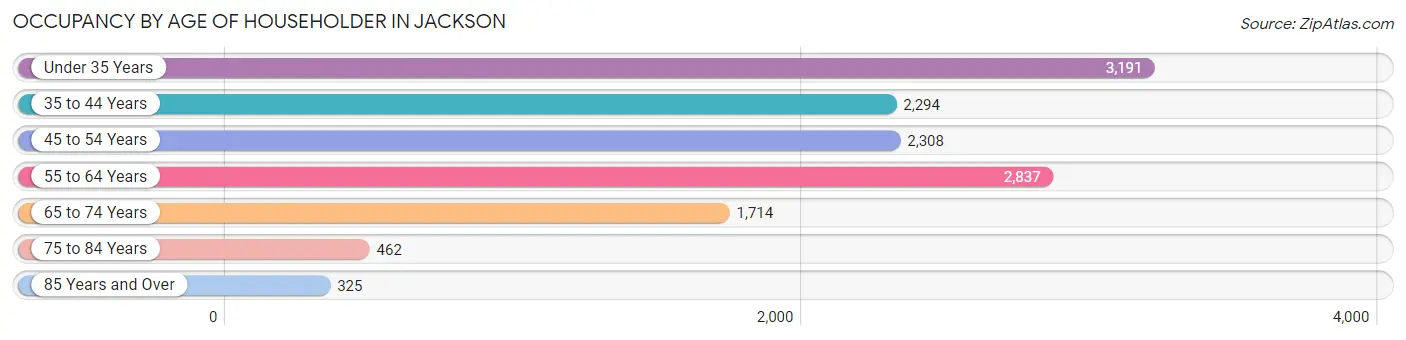
| Age Bracket | # Households | % Households |
| Under 35 Years | 3,191 | 24.3% |
| 35 to 44 Years | 2,294 | 17.5% |
| 45 to 54 Years | 2,308 | 17.6% |
| 55 to 64 Years | 2,837 | 21.6% |
| 65 to 74 Years | 1,714 | 13.1% |
| 75 to 84 Years | 462 | 3.5% |
| 85 Years and Over | 325 | 2.5% |
| Total | 13,131 | 100.0% |
Housing Finances in Jackson
Median Income by Occupancy in Jackson
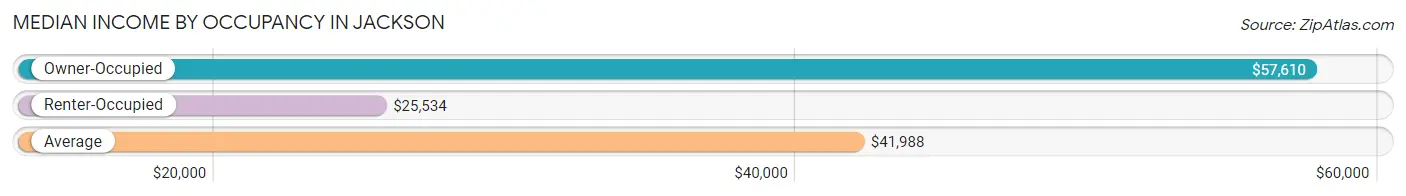
| Occupancy Type | # Households | Median Income |
| Owner-Occupied | 7,186 (54.7%) | $57,610 |
| Renter-Occupied | 5,945 (45.3%) | $25,534 |
| Average | 13,131 (100.0%) | $41,988 |
Occupancy by Householder Income Bracket in Jackson
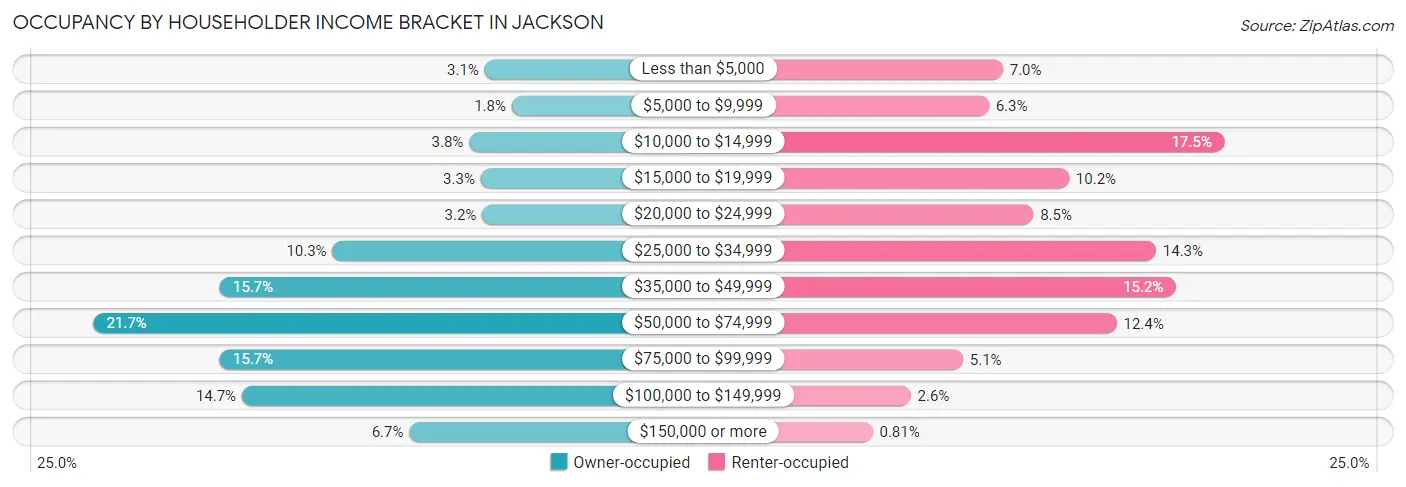
| Income Bracket | Owner-occupied | Renter-occupied |
| Less than $5,000 | 222 (3.1%) | 417 (7.0%) |
| $5,000 to $9,999 | 129 (1.8%) | 377 (6.3%) |
| $10,000 to $14,999 | 275 (3.8%) | 1,042 (17.5%) |
| $15,000 to $19,999 | 236 (3.3%) | 604 (10.2%) |
| $20,000 to $24,999 | 231 (3.2%) | 503 (8.5%) |
| $25,000 to $34,999 | 743 (10.3%) | 850 (14.3%) |
| $35,000 to $49,999 | 1,128 (15.7%) | 905 (15.2%) |
| $50,000 to $74,999 | 1,561 (21.7%) | 739 (12.4%) |
| $75,000 to $99,999 | 1,128 (15.7%) | 304 (5.1%) |
| $100,000 to $149,999 | 1,053 (14.6%) | 156 (2.6%) |
| $150,000 or more | 480 (6.7%) | 48 (0.8%) |
| Total | 7,186 (100.0%) | 5,945 (100.0%) |
Monthly Housing Cost Tiers in Jackson
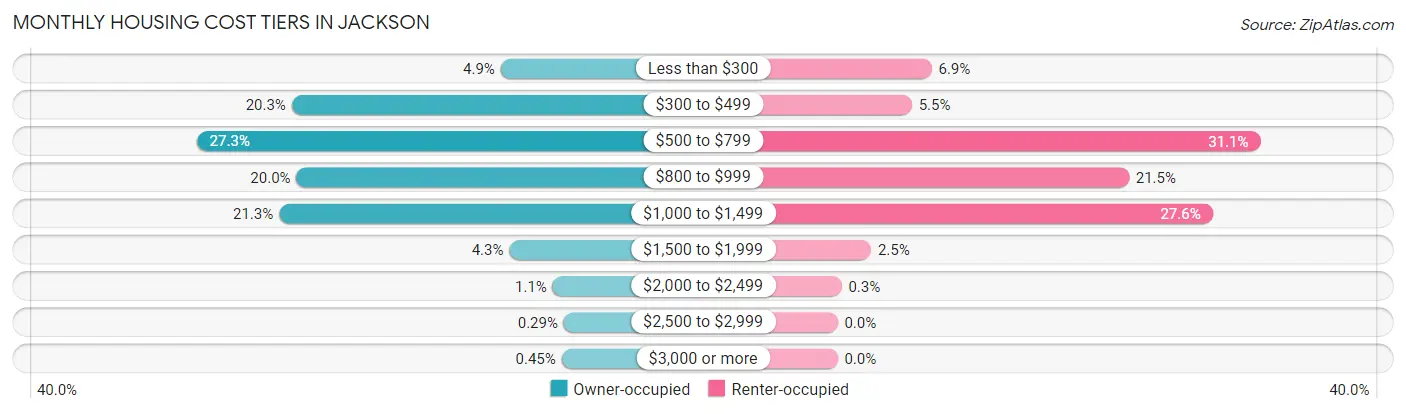
| Monthly Cost | Owner-occupied | Renter-occupied |
| Less than $300 | 355 (4.9%) | 412 (6.9%) |
| $300 to $499 | 1,461 (20.3%) | 325 (5.5%) |
| $500 to $799 | 1,964 (27.3%) | 1,851 (31.1%) |
| $800 to $999 | 1,436 (20.0%) | 1,276 (21.5%) |
| $1,000 to $1,499 | 1,528 (21.3%) | 1,642 (27.6%) |
| $1,500 to $1,999 | 309 (4.3%) | 147 (2.5%) |
| $2,000 to $2,499 | 80 (1.1%) | 18 (0.3%) |
| $2,500 to $2,999 | 21 (0.3%) | 0 (0.0%) |
| $3,000 or more | 32 (0.4%) | 0 (0.0%) |
| Total | 7,186 (100.0%) | 5,945 (100.0%) |
Physical Housing Characteristics in Jackson
Housing Structures in Jackson
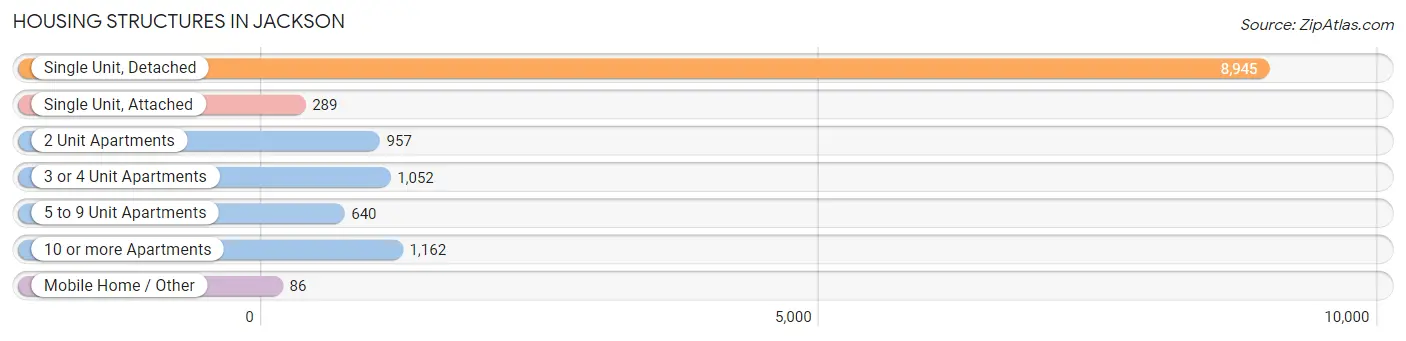
| Structure Type | # Housing Units | % Housing Units |
| Single Unit, Detached | 8,945 | 68.1% |
| Single Unit, Attached | 289 | 2.2% |
| 2 Unit Apartments | 957 | 7.3% |
| 3 or 4 Unit Apartments | 1,052 | 8.0% |
| 5 to 9 Unit Apartments | 640 | 4.9% |
| 10 or more Apartments | 1,162 | 8.8% |
| Mobile Home / Other | 86 | 0.6% |
| Total | 13,131 | 100.0% |
Housing Structures by Occupancy in Jackson
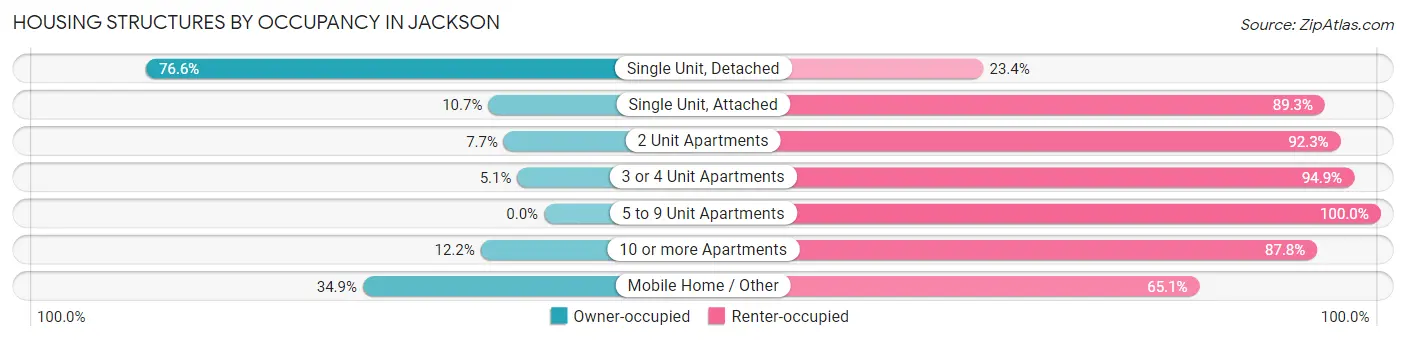
| Structure Type | Owner-occupied | Renter-occupied |
| Single Unit, Detached | 6,855 (76.6%) | 2,090 (23.4%) |
| Single Unit, Attached | 31 (10.7%) | 258 (89.3%) |
| 2 Unit Apartments | 74 (7.7%) | 883 (92.3%) |
| 3 or 4 Unit Apartments | 54 (5.1%) | 998 (94.9%) |
| 5 to 9 Unit Apartments | 0 (0.0%) | 640 (100.0%) |
| 10 or more Apartments | 142 (12.2%) | 1,020 (87.8%) |
| Mobile Home / Other | 30 (34.9%) | 56 (65.1%) |
| Total | 7,186 (54.7%) | 5,945 (45.3%) |
Housing Structures by Number of Rooms in Jackson
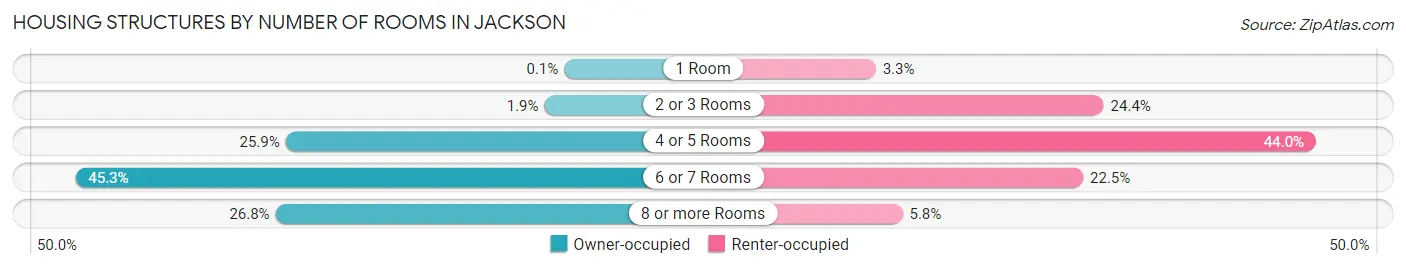
| Number of Rooms | Owner-occupied | Renter-occupied |
| 1 Room | 7 (0.1%) | 197 (3.3%) |
| 2 or 3 Rooms | 139 (1.9%) | 1,450 (24.4%) |
| 4 or 5 Rooms | 1,859 (25.9%) | 2,617 (44.0%) |
| 6 or 7 Rooms | 3,255 (45.3%) | 1,337 (22.5%) |
| 8 or more Rooms | 1,926 (26.8%) | 344 (5.8%) |
| Total | 7,186 (100.0%) | 5,945 (100.0%) |
Housing Structure by Heating Type in Jackson
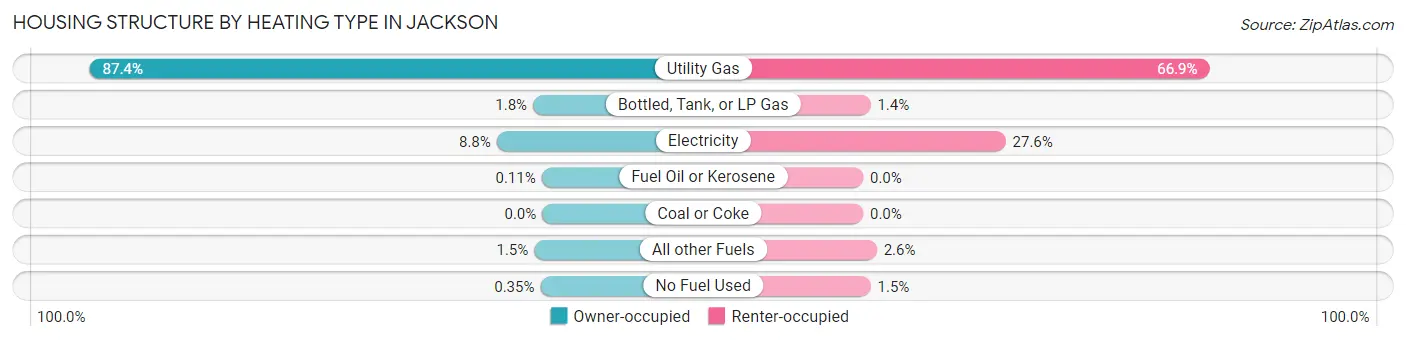
| Heating Type | Owner-occupied | Renter-occupied |
| Utility Gas | 6,283 (87.4%) | 3,978 (66.9%) |
| Bottled, Tank, or LP Gas | 127 (1.8%) | 85 (1.4%) |
| Electricity | 632 (8.8%) | 1,638 (27.6%) |
| Fuel Oil or Kerosene | 8 (0.1%) | 0 (0.0%) |
| Coal or Coke | 0 (0.0%) | 0 (0.0%) |
| All other Fuels | 111 (1.5%) | 157 (2.6%) |
| No Fuel Used | 25 (0.4%) | 87 (1.5%) |
| Total | 7,186 (100.0%) | 5,945 (100.0%) |
Household Vehicle Usage in Jackson
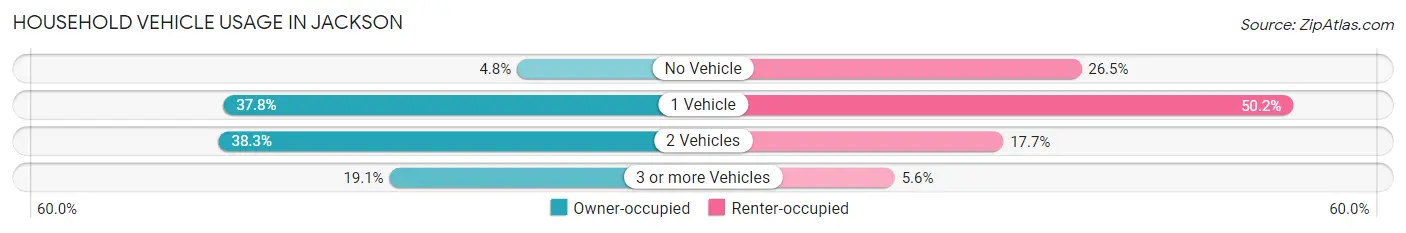
| Vehicles per Household | Owner-occupied | Renter-occupied |
| No Vehicle | 348 (4.8%) | 1,574 (26.5%) |
| 1 Vehicle | 2,713 (37.8%) | 2,985 (50.2%) |
| 2 Vehicles | 2,750 (38.3%) | 1,054 (17.7%) |
| 3 or more Vehicles | 1,375 (19.1%) | 332 (5.6%) |
| Total | 7,186 (100.0%) | 5,945 (100.0%) |
Real Estate & Mortgages in Jackson
Real Estate and Mortgage Overview in Jackson
| Characteristic | Without Mortgage | With Mortgage |
| Housing Units | 2,738 | 4,448 |
| Median Property Value | $77,500 | $93,500 |
| Median Household Income | $47,734 | $393 |
| Monthly Housing Costs | $436 | $28 |
| Real Estate Taxes | $1,371 | $151 |
Property Value by Mortgage Status in Jackson
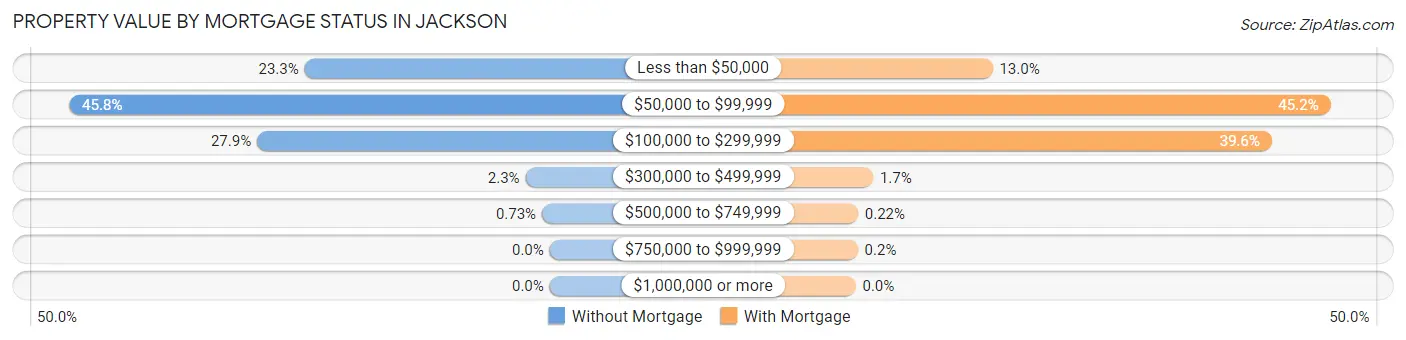
| Property Value | Without Mortgage | With Mortgage |
| Less than $50,000 | 639 (23.3%) | 580 (13.0%) |
| $50,000 to $99,999 | 1,253 (45.8%) | 2,012 (45.2%) |
| $100,000 to $299,999 | 763 (27.9%) | 1,763 (39.6%) |
| $300,000 to $499,999 | 63 (2.3%) | 74 (1.7%) |
| $500,000 to $749,999 | 20 (0.7%) | 10 (0.2%) |
| $750,000 to $999,999 | 0 (0.0%) | 9 (0.2%) |
| $1,000,000 or more | 0 (0.0%) | 0 (0.0%) |
| Total | 2,738 (100.0%) | 4,448 (100.0%) |
Household Income by Mortgage Status in Jackson
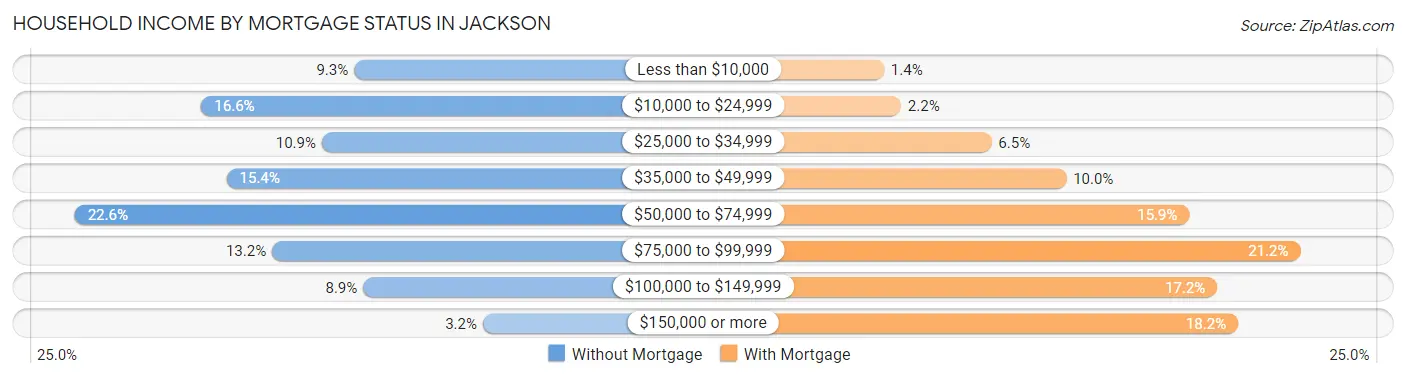
| Household Income | Without Mortgage | With Mortgage |
| Less than $10,000 | 255 (9.3%) | 60 (1.3%) |
| $10,000 to $24,999 | 454 (16.6%) | 96 (2.2%) |
| $25,000 to $34,999 | 297 (10.8%) | 288 (6.5%) |
| $35,000 to $49,999 | 421 (15.4%) | 446 (10.0%) |
| $50,000 to $74,999 | 619 (22.6%) | 707 (15.9%) |
| $75,000 to $99,999 | 362 (13.2%) | 942 (21.2%) |
| $100,000 to $149,999 | 243 (8.9%) | 766 (17.2%) |
| $150,000 or more | 87 (3.2%) | 810 (18.2%) |
| Total | 2,738 (100.0%) | 4,448 (100.0%) |
Property Value to Household Income Ratio in Jackson
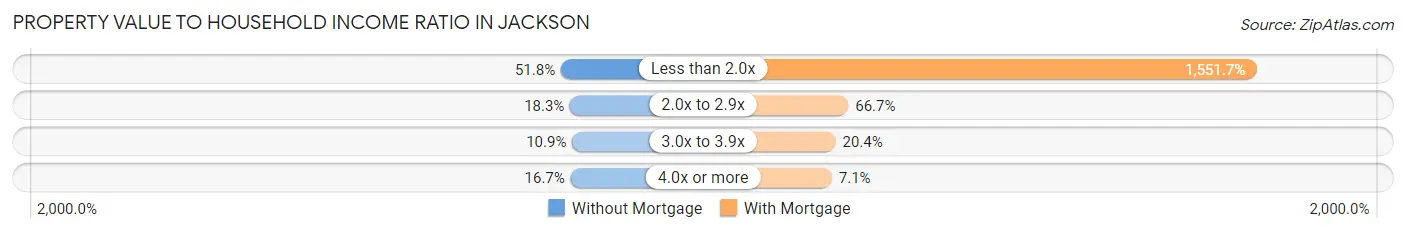
| Value-to-Income Ratio | Without Mortgage | With Mortgage |
| Less than 2.0x | 1,417 (51.7%) | 69,019 (1,551.7%) |
| 2.0x to 2.9x | 500 (18.3%) | 2,968 (66.7%) |
| 3.0x to 3.9x | 298 (10.9%) | 907 (20.4%) |
| 4.0x or more | 458 (16.7%) | 317 (7.1%) |
| Total | 2,738 (100.0%) | 4,448 (100.0%) |
Real Estate Taxes by Mortgage Status in Jackson
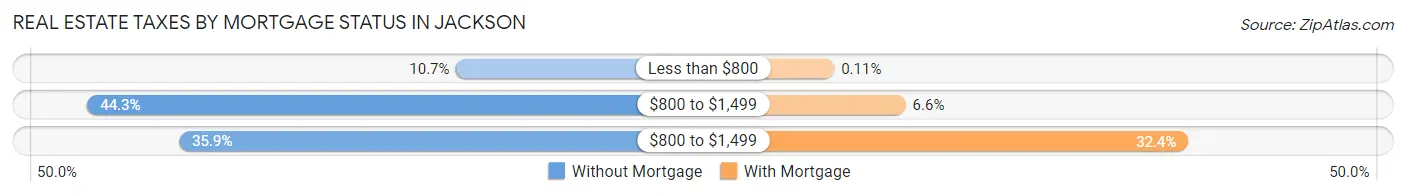
| Property Taxes | Without Mortgage | With Mortgage |
| Less than $800 | 292 (10.7%) | 5 (0.1%) |
| $800 to $1,499 | 1,212 (44.3%) | 295 (6.6%) |
| $800 to $1,499 | 983 (35.9%) | 1,443 (32.4%) |
| Total | 2,738 (100.0%) | 4,448 (100.0%) |
Health & Disability in Jackson
Health Insurance Coverage by Age in Jackson
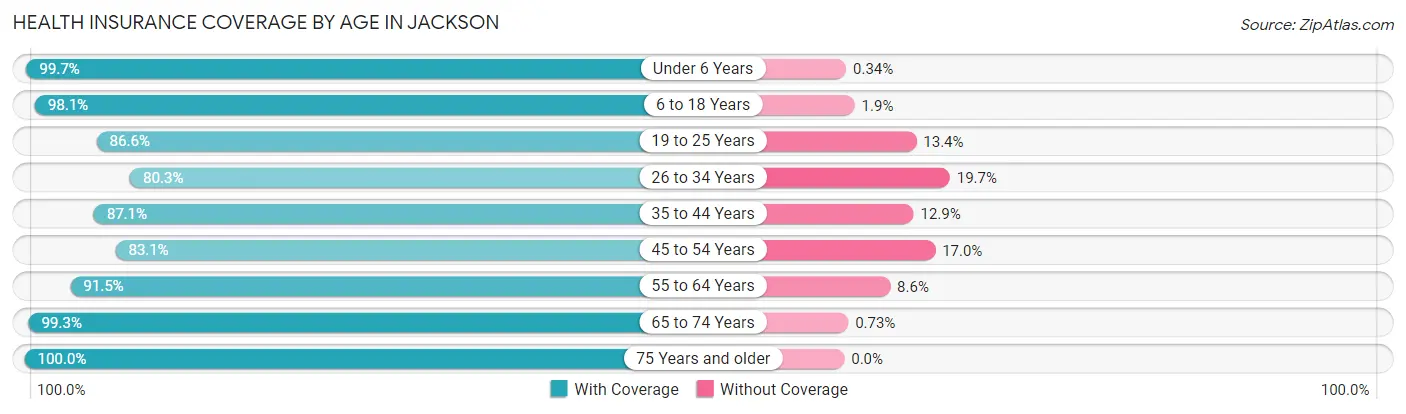
| Age Bracket | With Coverage | Without Coverage |
| Under 6 Years | 2,327 (99.7%) | 8 (0.3%) |
| 6 to 18 Years | 5,588 (98.1%) | 110 (1.9%) |
| 19 to 25 Years | 2,796 (86.6%) | 434 (13.4%) |
| 26 to 34 Years | 3,436 (80.3%) | 842 (19.7%) |
| 35 to 44 Years | 3,151 (87.1%) | 467 (12.9%) |
| 45 to 54 Years | 3,229 (83.1%) | 659 (17.0%) |
| 55 to 64 Years | 3,956 (91.4%) | 370 (8.6%) |
| 65 to 74 Years | 2,443 (99.3%) | 18 (0.7%) |
| 75 Years and older | 1,111 (100.0%) | 0 (0.0%) |
| Total | 28,037 (90.6%) | 2,908 (9.4%) |
Health Insurance Coverage by Citizenship Status in Jackson
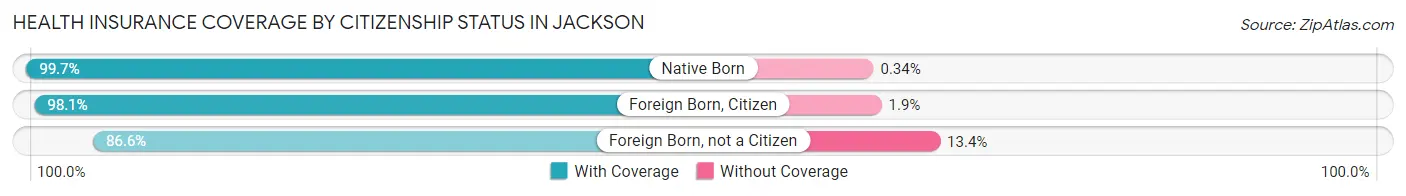
| Citizenship Status | With Coverage | Without Coverage |
| Native Born | 2,327 (99.7%) | 8 (0.3%) |
| Foreign Born, Citizen | 5,588 (98.1%) | 110 (1.9%) |
| Foreign Born, not a Citizen | 2,796 (86.6%) | 434 (13.4%) |
Health Insurance Coverage by Household Income in Jackson
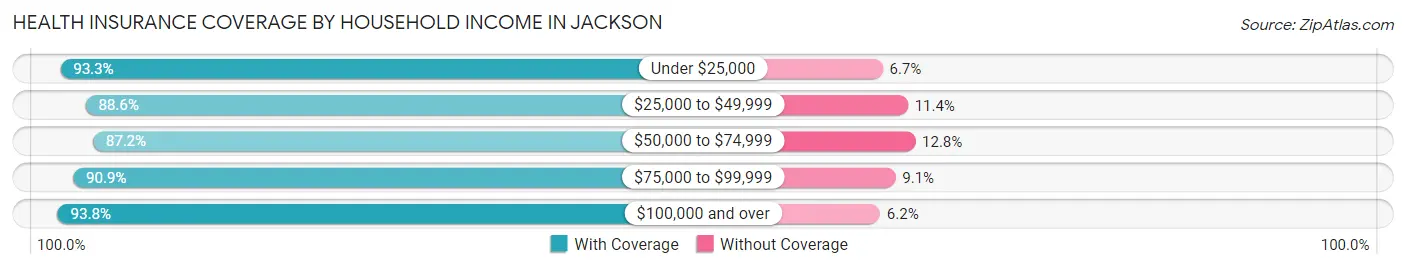
| Household Income | With Coverage | Without Coverage |
| Under $25,000 | 6,440 (93.3%) | 462 (6.7%) |
| $25,000 to $49,999 | 7,192 (88.6%) | 926 (11.4%) |
| $50,000 to $74,999 | 5,374 (87.2%) | 789 (12.8%) |
| $75,000 to $99,999 | 3,891 (90.9%) | 389 (9.1%) |
| $100,000 and over | 4,890 (93.8%) | 323 (6.2%) |
Public vs Private Health Insurance Coverage by Age in Jackson
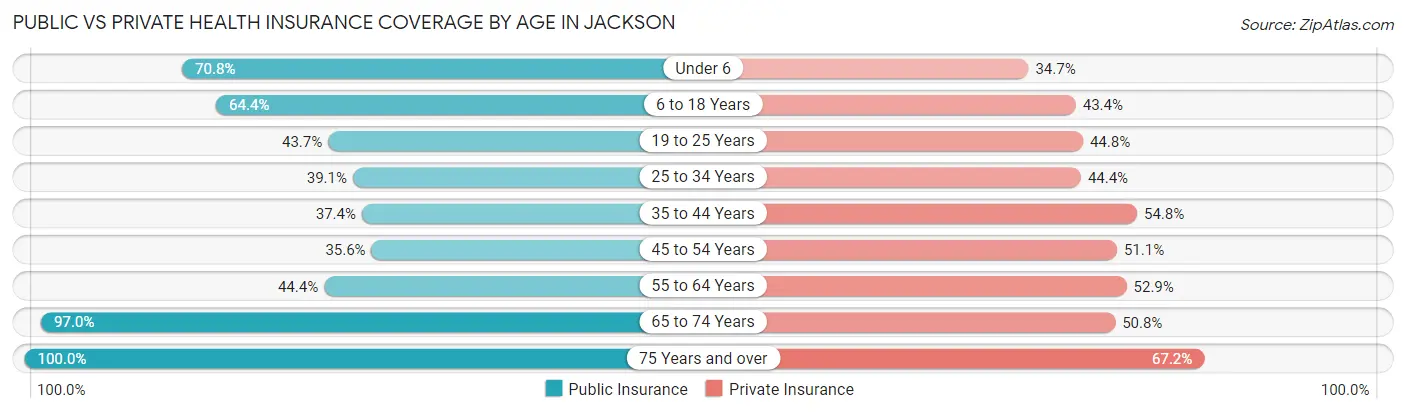
| Age Bracket | Public Insurance | Private Insurance |
| Under 6 | 1,652 (70.8%) | 809 (34.6%) |
| 6 to 18 Years | 3,672 (64.4%) | 2,475 (43.4%) |
| 19 to 25 Years | 1,411 (43.7%) | 1,446 (44.8%) |
| 25 to 34 Years | 1,672 (39.1%) | 1,899 (44.4%) |
| 35 to 44 Years | 1,354 (37.4%) | 1,983 (54.8%) |
| 45 to 54 Years | 1,385 (35.6%) | 1,986 (51.1%) |
| 55 to 64 Years | 1,922 (44.4%) | 2,287 (52.9%) |
| 65 to 74 Years | 2,386 (97.0%) | 1,249 (50.7%) |
| 75 Years and over | 1,111 (100.0%) | 747 (67.2%) |
| Total | 16,565 (53.5%) | 14,881 (48.1%) |
Disability Status by Sex by Age in Jackson
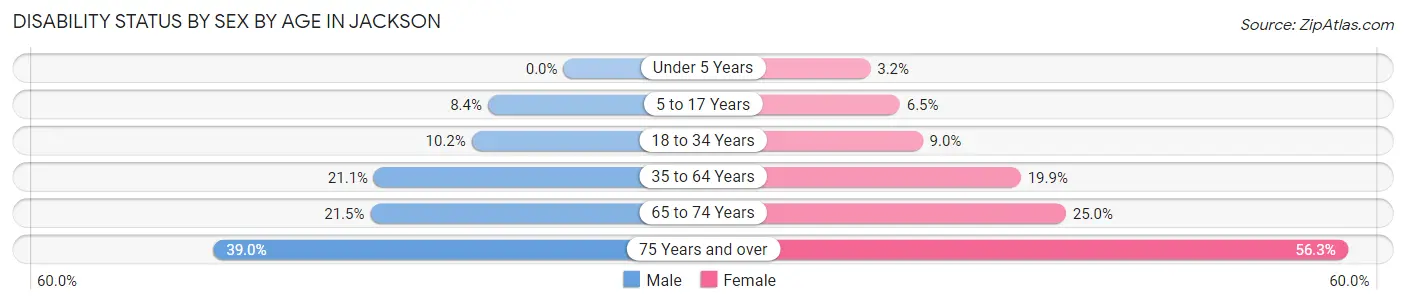
| Age Bracket | Male | Female |
| Under 5 Years | 0 (0.0%) | 32 (3.2%) |
| 5 to 17 Years | 238 (8.4%) | 179 (6.5%) |
| 18 to 34 Years | 394 (10.2%) | 374 (9.0%) |
| 35 to 64 Years | 1,183 (21.1%) | 1,241 (19.9%) |
| 65 to 74 Years | 218 (21.5%) | 361 (24.9%) |
| 75 Years and over | 168 (39.0%) | 383 (56.3%) |
Disability Class by Sex by Age in Jackson
Disability Class: Hearing Difficulty
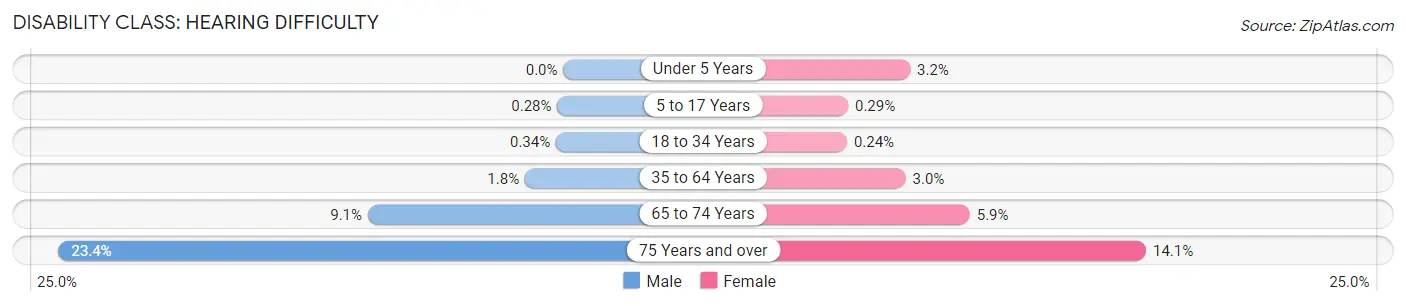
| Age Bracket | Male | Female |
| Under 5 Years | 0 (0.0%) | 32 (3.2%) |
| 5 to 17 Years | 8 (0.3%) | 8 (0.3%) |
| 18 to 34 Years | 13 (0.3%) | 10 (0.2%) |
| 35 to 64 Years | 100 (1.8%) | 184 (3.0%) |
| 65 to 74 Years | 92 (9.1%) | 86 (5.9%) |
| 75 Years and over | 101 (23.4%) | 96 (14.1%) |
Disability Class: Vision Difficulty
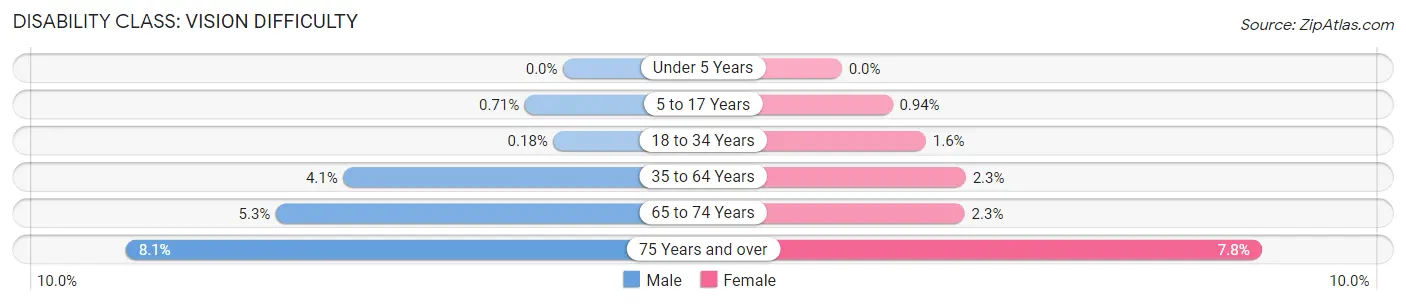
| Age Bracket | Male | Female |
| Under 5 Years | 0 (0.0%) | 0 (0.0%) |
| 5 to 17 Years | 20 (0.7%) | 26 (0.9%) |
| 18 to 34 Years | 7 (0.2%) | 65 (1.6%) |
| 35 to 64 Years | 229 (4.1%) | 143 (2.3%) |
| 65 to 74 Years | 54 (5.3%) | 33 (2.3%) |
| 75 Years and over | 35 (8.1%) | 53 (7.8%) |
Disability Class: Cognitive Difficulty
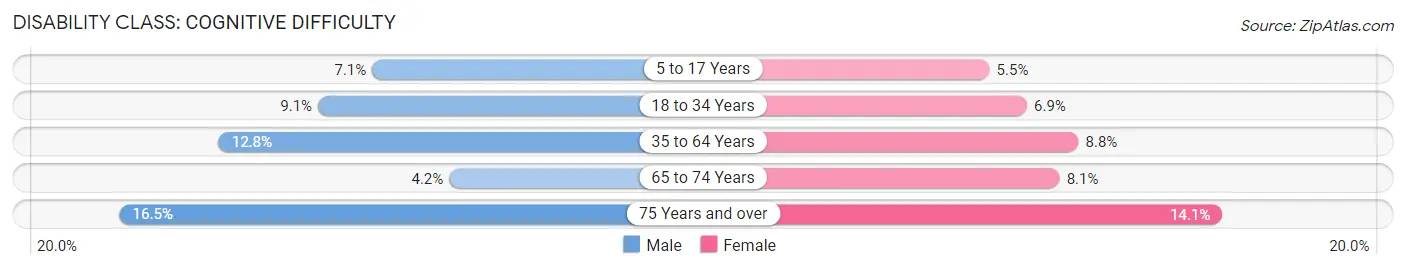
| Age Bracket | Male | Female |
| 5 to 17 Years | 201 (7.1%) | 152 (5.5%) |
| 18 to 34 Years | 351 (9.1%) | 286 (6.9%) |
| 35 to 64 Years | 717 (12.8%) | 547 (8.8%) |
| 65 to 74 Years | 43 (4.2%) | 117 (8.1%) |
| 75 Years and over | 71 (16.5%) | 96 (14.1%) |
Disability Class: Ambulatory Difficulty
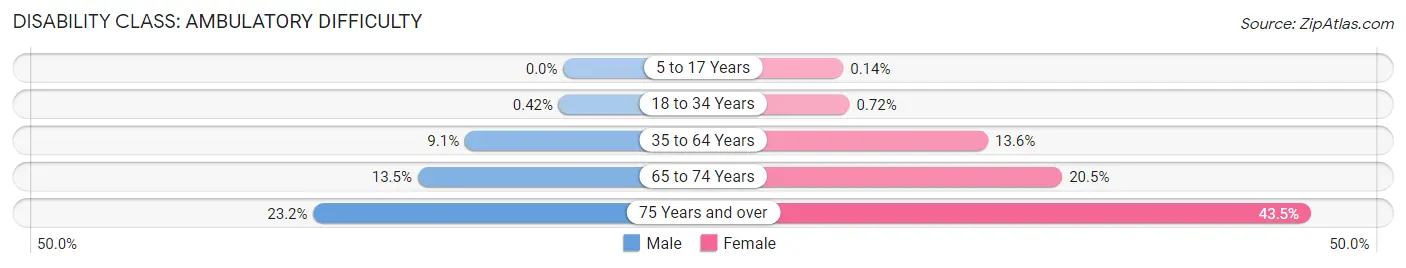
| Age Bracket | Male | Female |
| 5 to 17 Years | 0 (0.0%) | 4 (0.1%) |
| 18 to 34 Years | 16 (0.4%) | 30 (0.7%) |
| 35 to 64 Years | 512 (9.1%) | 845 (13.6%) |
| 65 to 74 Years | 137 (13.5%) | 296 (20.5%) |
| 75 Years and over | 100 (23.2%) | 296 (43.5%) |
Disability Class: Self-Care Difficulty
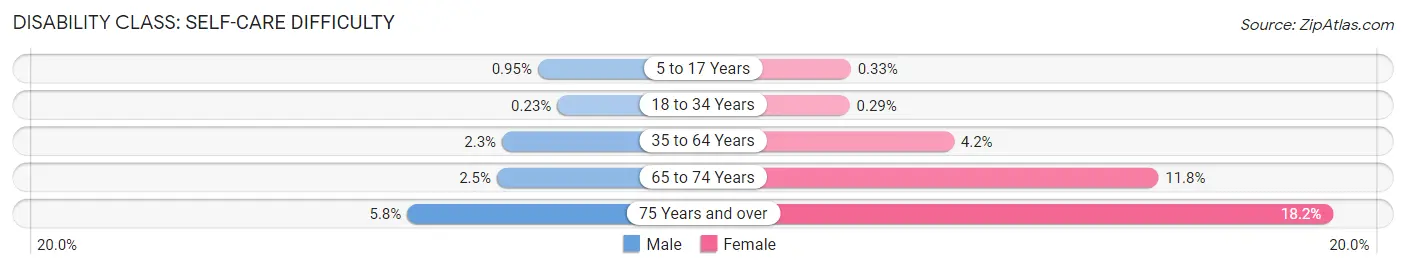
| Age Bracket | Male | Female |
| 5 to 17 Years | 27 (0.9%) | 9 (0.3%) |
| 18 to 34 Years | 9 (0.2%) | 12 (0.3%) |
| 35 to 64 Years | 128 (2.3%) | 259 (4.2%) |
| 65 to 74 Years | 25 (2.5%) | 170 (11.7%) |
| 75 Years and over | 25 (5.8%) | 124 (18.2%) |
Technology Access in Jackson
Computing Device Access in Jackson
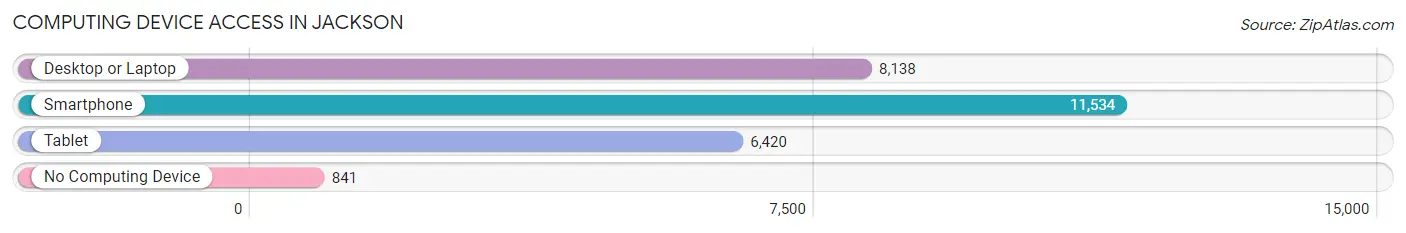
| Device Type | # Households | % Households |
| Desktop or Laptop | 8,138 | 62.0% |
| Smartphone | 11,534 | 87.8% |
| Tablet | 6,420 | 48.9% |
| No Computing Device | 841 | 6.4% |
| Total | 13,131 | 100.0% |
Internet Access in Jackson

| Internet Type | # Households | % Households |
| Dial-Up Internet | 12 | 0.1% |
| Broadband Home | 8,530 | 65.0% |
| Cellular Data Only | 2,901 | 22.1% |
| Satellite Internet | 596 | 4.5% |
| No Internet | 1,371 | 10.4% |
| Total | 13,131 | 100.0% |
Jackson Summary
Jackson, Michigan is a city located in the south-central region of the state, about 40 miles west of Ann Arbor and 60 miles south of Lansing. It is the county seat of Jackson County and the largest city in the county. The city is situated along the Grand River and is home to a population of 33,534 people, according to the 2010 census.
History
The area that is now Jackson was first settled in 1829 by Horace Blackman, who built a log cabin on the banks of the Grand River. The city was officially founded in 1832 and named after President Andrew Jackson. The city was incorporated in 1839 and quickly became a major center for the lumber industry. The city was also a major hub for the railroad industry, with the Michigan Central Railroad and the Grand Trunk Western Railroad both having major operations in the city.
In the late 19th century, Jackson became a major center for the automotive industry, with the Jackson Automobile Company being founded in 1904. The company was later renamed the Jackson Motor Car Company and was one of the first automobile manufacturers in the United States. The company was eventually sold to the Chrysler Corporation in 1954.
Geography
Jackson is located in south-central Michigan, about 40 miles west of Ann Arbor and 60 miles south of Lansing. The city is situated along the Grand River and is surrounded by several smaller towns and villages, including Parma, Spring Arbor, and Concord. The city covers an area of 16.3 square miles and has an elevation of 845 feet.
Economy
Jackson’s economy is largely based on manufacturing and healthcare. The city is home to several major employers, including the Jackson County Medical Center, the Jackson Automotive Company, and the Jackson County Airport. The city is also home to several smaller businesses, including restaurants, retail stores, and service providers.
Demographics
According to the 2010 census, Jackson has a population of 33,534 people. The city has a median household income of $37,945 and a median age of 36.7 years. The city is predominantly white (83.3%), with African Americans making up 8.3% of the population and Hispanics making up 4.2%.
Jackson is a diverse city with a variety of cultures and backgrounds. The city is home to several churches, including the First United Methodist Church, the First Presbyterian Church, and the First Baptist Church. The city also has several parks, including Ella Sharp Park, Cascade Falls Park, and the Jackson County Fairgrounds.
Jackson is a vibrant city with a rich history and a bright future. The city is home to a diverse population and a strong economy. With its close proximity to major cities and its diverse culture, Jackson is an ideal place to live and work.
Common Questions
What is Per Capita Income in Jackson?
Per Capita income in Jackson is $23,447.
What is the Median Family Income in Jackson?
Median Family Income in Jackson is $58,350.
What is the Median Household income in Jackson?
Median Household Income in Jackson is $41,988.
What is Income or Wage Gap in Jackson?
Income or Wage Gap in Jackson is 19.3%.
Women in Jackson earn 80.7 cents for every dollar earned by a man.
What is Family Income Deficit in Jackson?
Family Income Deficit in Jackson is $11,370.
Families that are below poverty line in Jackson earn $11,370 less on average than the poverty threshold level.
What is Inequality or Gini Index in Jackson?
Inequality or Gini Index in Jackson is 0.46.
What is the Total Population of Jackson?
Total Population of Jackson is 31,420.
What is the Total Male Population of Jackson?
Total Male Population of Jackson is 14,962.
What is the Total Female Population of Jackson?
Total Female Population of Jackson is 16,458.
What is the Ratio of Males per 100 Females in Jackson?
There are 90.91 Males per 100 Females in Jackson.
What is the Ratio of Females per 100 Males in Jackson?
There are 110.00 Females per 100 Males in Jackson.
What is the Median Population Age in Jackson?
Median Population Age in Jackson is 35.0 Years.
What is the Average Family Size in Jackson
Average Family Size in Jackson is 3.3 People.
What is the Average Household Size in Jackson
Average Household Size in Jackson is 2.3 People.
How Large is the Labor Force in Jackson?
There are 14,984 People in the Labor Forcein in Jackson.
What is the Percentage of People in the Labor Force in Jackson?
60.6% of People are in the Labor Force in Jackson.
What is the Unemployment Rate in Jackson?
Unemployment Rate in Jackson is 10.9%.