St Johns, MI Map & Demographics
St Johns Map
St Johns Overview
$32,726
PER CAPITA INCOME
$86,686
AVG FAMILY INCOME
$60,991
AVG HOUSEHOLD INCOME
33.5%
WAGE / INCOME GAP [ % ]
66.5¢/ $1
WAGE / INCOME GAP [ $ ]
0.43
INEQUALITY / GINI INDEX
7,711
TOTAL POPULATION
3,748
MALE POPULATION
3,963
FEMALE POPULATION
94.57
MALES / 100 FEMALES
105.74
FEMALES / 100 MALES
41.3
MEDIAN AGE
3.1
AVG FAMILY SIZE
2.4
AVG HOUSEHOLD SIZE
3,751
LABOR FORCE [ PEOPLE ]
62.2%
PERCENT IN LABOR FORCE
2.7%
UNEMPLOYMENT RATE
Income in St Johns
Income Overview in St Johns
Per Capita Income in St Johns is $32,726, while median incomes of families and households are $86,686 and $60,991 respectively.
| Characteristic | Number | Measure |
| Per Capita Income | 7,711 | $32,726 |
| Median Family Income | 1,898 | $86,686 |
| Mean Family Income | 1,898 | $99,578 |
| Median Household Income | 3,089 | $60,991 |
| Mean Household Income | 3,089 | $78,128 |
| Income Deficit | 1,898 | $0 |
| Wage / Income Gap (%) | 7,711 | 33.54% |
| Wage / Income Gap ($) | 7,711 | 66.46¢ per $1 |
| Gini / Inequality Index | 7,711 | 0.43 |
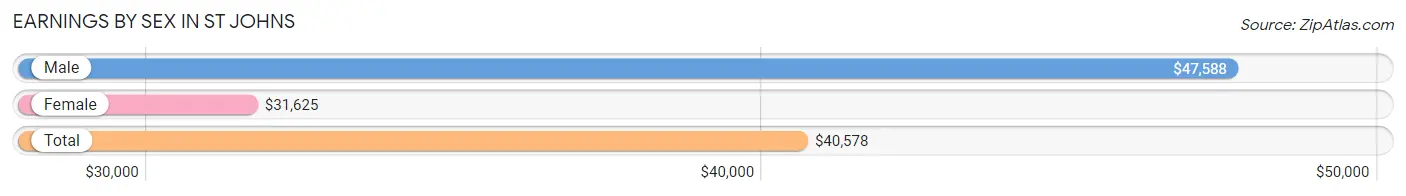
Earnings by Sex in St Johns
Average Earnings in St Johns are $40,578, $47,588 for men and $31,625 for women, a difference of 33.5%.
| Sex | Number | Average Earnings |
| Male | 2,025 (51.4%) | $47,588 |
| Female | 1,913 (48.6%) | $31,625 |
| Total | 3,938 (100.0%) | $40,578 |
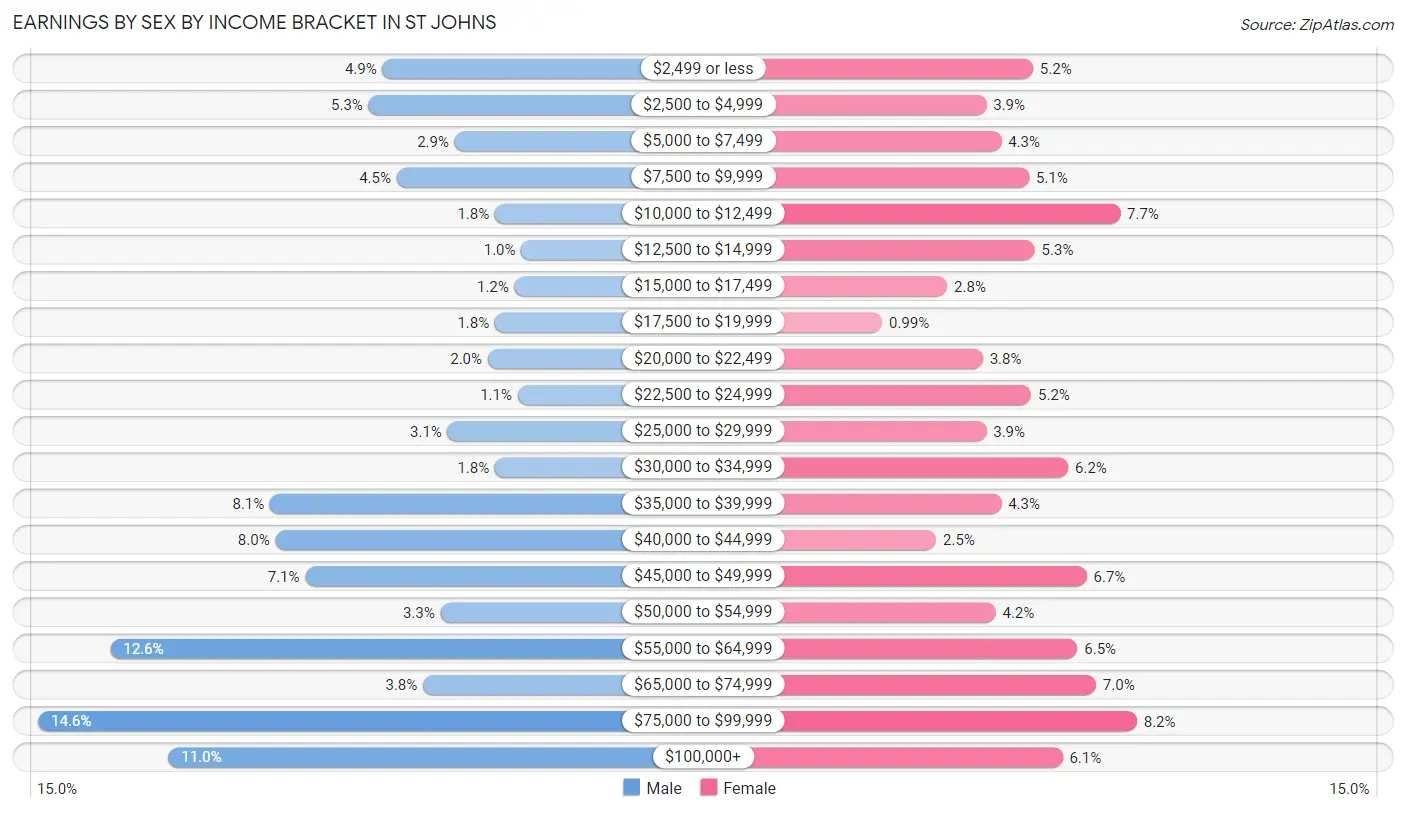
Earnings by Sex by Income Bracket in St Johns
The most common earnings brackets in St Johns are $75,000 to $99,999 for men (296 | 14.6%) and $75,000 to $99,999 for women (156 | 8.2%).
| Income | Male | Female |
| $2,499 or less | 100 (4.9%) | 100 (5.2%) |
| $2,500 to $4,999 | 108 (5.3%) | 75 (3.9%) |
| $5,000 to $7,499 | 59 (2.9%) | 83 (4.3%) |
| $7,500 to $9,999 | 92 (4.5%) | 98 (5.1%) |
| $10,000 to $12,499 | 36 (1.8%) | 147 (7.7%) |
| $12,500 to $14,999 | 21 (1.0%) | 101 (5.3%) |
| $15,000 to $17,499 | 25 (1.2%) | 54 (2.8%) |
| $17,500 to $19,999 | 36 (1.8%) | 19 (1.0%) |
| $20,000 to $22,499 | 40 (2.0%) | 73 (3.8%) |
| $22,500 to $24,999 | 23 (1.1%) | 99 (5.2%) |
| $25,000 to $29,999 | 63 (3.1%) | 75 (3.9%) |
| $30,000 to $34,999 | 36 (1.8%) | 119 (6.2%) |
| $35,000 to $39,999 | 164 (8.1%) | 83 (4.3%) |
| $40,000 to $44,999 | 161 (8.0%) | 48 (2.5%) |
| $45,000 to $49,999 | 144 (7.1%) | 129 (6.7%) |
| $50,000 to $54,999 | 67 (3.3%) | 80 (4.2%) |
| $55,000 to $64,999 | 255 (12.6%) | 124 (6.5%) |
| $65,000 to $74,999 | 77 (3.8%) | 134 (7.0%) |
| $75,000 to $99,999 | 296 (14.6%) | 156 (8.2%) |
| $100,000+ | 222 (11.0%) | 116 (6.1%) |
| Total | 2,025 (100.0%) | 1,913 (100.0%) |
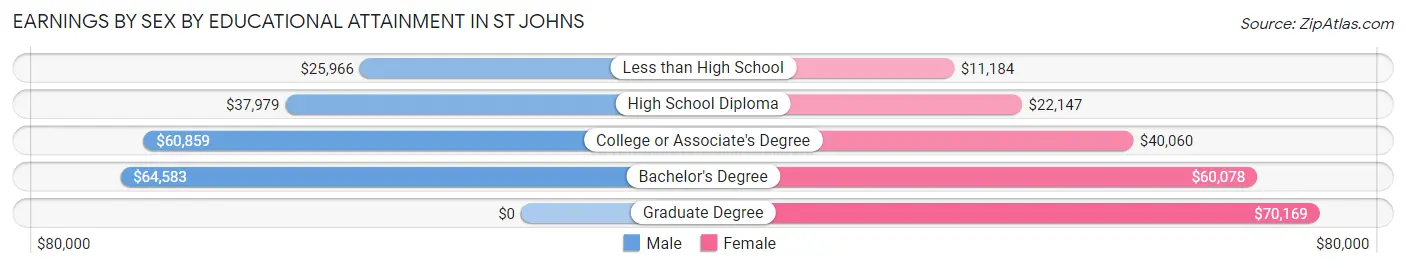
Earnings by Sex by Educational Attainment in St Johns
Average earnings in St Johns are $54,279 for men and $34,167 for women, a difference of 37.0%. Men with an educational attainment of bachelor's degree enjoy the highest average annual earnings of $64,583, while those with less than high school education earn the least with $25,966. Women with an educational attainment of graduate degree earn the most with the average annual earnings of $70,169, while those with less than high school education have the smallest earnings of $11,184.
| Educational Attainment | Male Income | Female Income |
| Less than High School | $25,966 | $11,184 |
| High School Diploma | $37,979 | $22,147 |
| College or Associate's Degree | $60,859 | $40,060 |
| Bachelor's Degree | $64,583 | $60,078 |
| Graduate Degree | - | - |
| Total | $54,279 | $34,167 |
Family Income in St Johns
Family Income Brackets in St Johns
According to the St Johns family income data, there are 469 families falling into the $100,000 to $149,999 income range, which is the most common income bracket and makes up 24.7% of all families. Conversely, the $10,000 to $14,999 income bracket is the least frequent group with only 38 families (2.0%) belonging to this category.
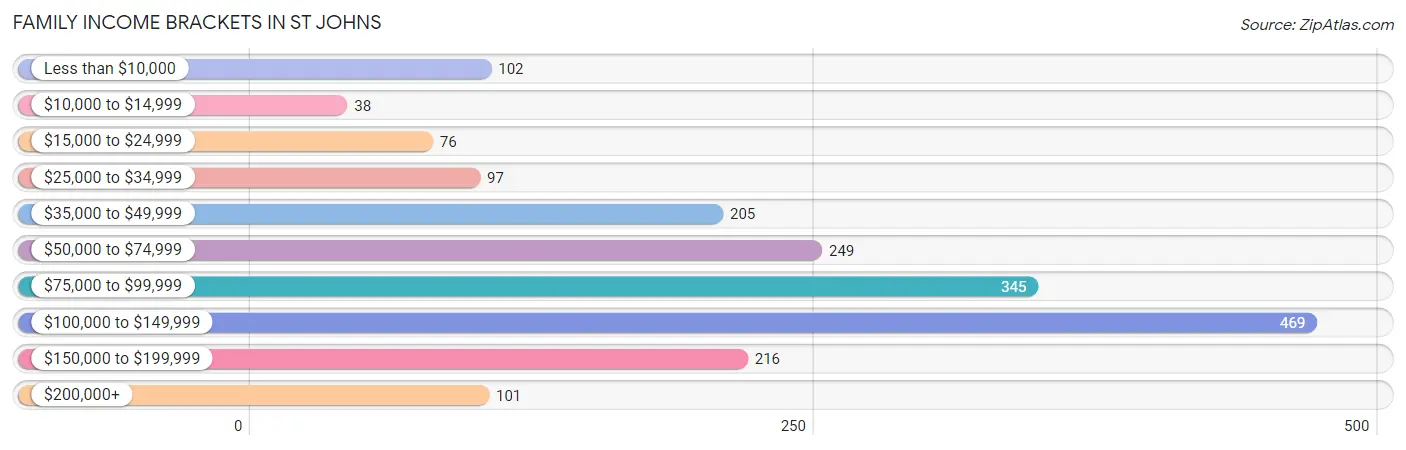
| Income Bracket | # Families | % Families |
| Less than $10,000 | 102 | 5.4% |
| $10,000 to $14,999 | 38 | 2.0% |
| $15,000 to $24,999 | 76 | 4.0% |
| $25,000 to $34,999 | 97 | 5.1% |
| $35,000 to $49,999 | 205 | 10.8% |
| $50,000 to $74,999 | 249 | 13.1% |
| $75,000 to $99,999 | 345 | 18.2% |
| $100,000 to $149,999 | 469 | 24.7% |
| $150,000 to $199,999 | 216 | 11.4% |
| $200,000+ | 101 | 5.3% |
Family Income by Famaliy Size in St Johns
7+ person families (100 | 5.3%) account for the highest median family income in St Johns with $183,077 per family, while 2-person families (1,000 | 52.7%) have the highest median income of $38,080 per family member.
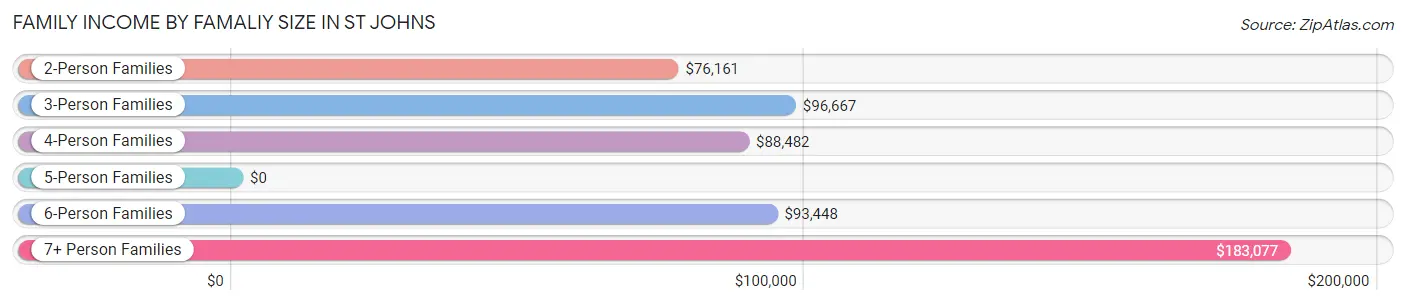
| Income Bracket | # Families | Median Income |
| 2-Person Families | 1,000 (52.7%) | $76,161 |
| 3-Person Families | 346 (18.2%) | $96,667 |
| 4-Person Families | 253 (13.3%) | $88,482 |
| 5-Person Families | 145 (7.6%) | $0 |
| 6-Person Families | 54 (2.9%) | $93,448 |
| 7+ Person Families | 100 (5.3%) | $183,077 |
| Total | 1,898 (100.0%) | $86,686 |
Family Income by Number of Earners in St Johns
The median family income in St Johns is $86,686, with families comprising 3+ earners (289) having the highest median family income of $150,341, while families with no earners (389) have the lowest median family income of $46,607, accounting for 15.2% and 20.5% of families, respectively.
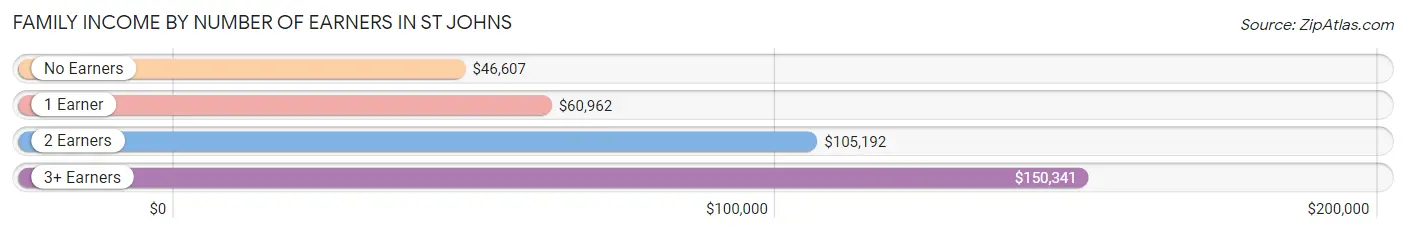
| Number of Earners | # Families | Median Income |
| No Earners | 389 (20.5%) | $46,607 |
| 1 Earner | 446 (23.5%) | $60,962 |
| 2 Earners | 774 (40.8%) | $105,192 |
| 3+ Earners | 289 (15.2%) | $150,341 |
| Total | 1,898 (100.0%) | $86,686 |
Household Income in St Johns
Household Income Brackets in St Johns
With 537 households falling in the category, the $100,000 to $149,999 income range is the most frequent in St Johns, accounting for 17.4% of all households. In contrast, only 99 households (3.2%) fall into the $200,000+ income bracket, making it the least populous group.
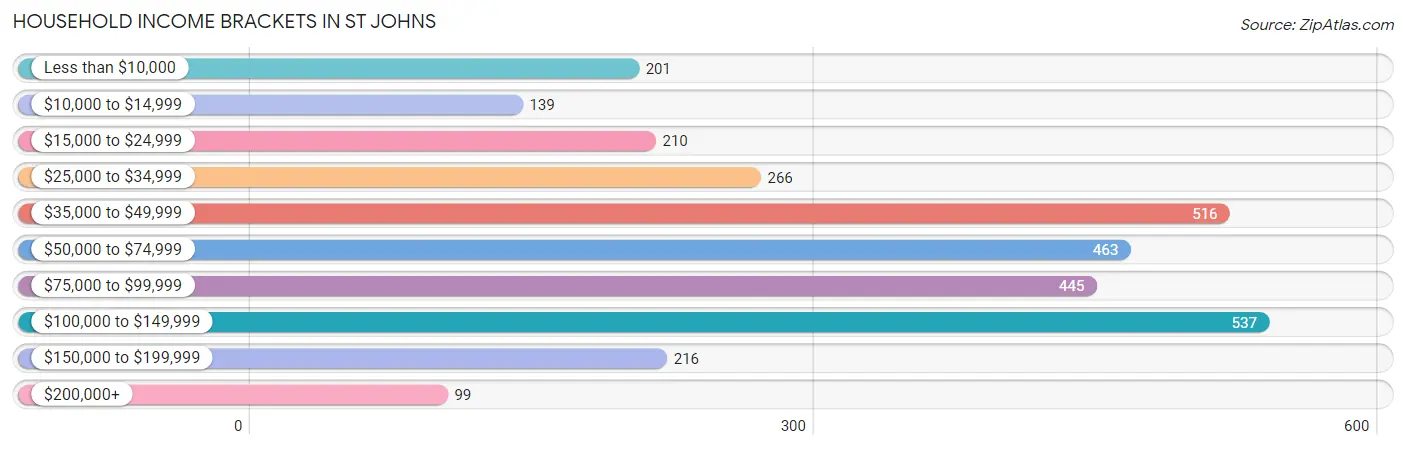
| Income Bracket | # Households | % Households |
| Less than $10,000 | 201 | 6.5% |
| $10,000 to $14,999 | 139 | 4.5% |
| $15,000 to $24,999 | 210 | 6.8% |
| $25,000 to $34,999 | 266 | 8.6% |
| $35,000 to $49,999 | 516 | 16.7% |
| $50,000 to $74,999 | 463 | 15.0% |
| $75,000 to $99,999 | 445 | 14.4% |
| $100,000 to $149,999 | 537 | 17.4% |
| $150,000 to $199,999 | 216 | 7.0% |
| $200,000+ | 99 | 3.2% |
Household Income by Householder Age in St Johns
The median household income in St Johns is $60,991, with the highest median household income of $80,227 found in the 45 to 64 years age bracket for the primary householder. A total of 1,228 households (39.8%) fall into this category. Meanwhile, the 15 to 24 years age bracket for the primary householder has the lowest median household income of $45,982, with 57 households (1.8%) in this group.
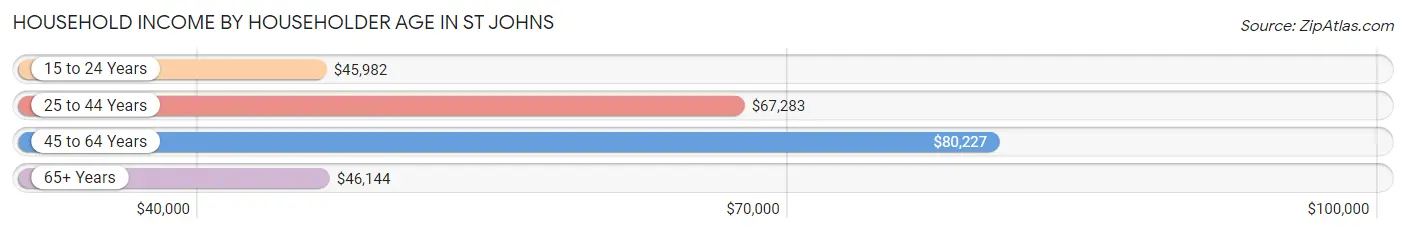
| Income Bracket | # Households | Median Income |
| 15 to 24 Years | 57 (1.8%) | $45,982 |
| 25 to 44 Years | 902 (29.2%) | $67,283 |
| 45 to 64 Years | 1,228 (39.8%) | $80,227 |
| 65+ Years | 902 (29.2%) | $46,144 |
| Total | 3,089 (100.0%) | $60,991 |
Poverty in St Johns
Income Below Poverty by Sex and Age in St Johns
With 12.9% poverty level for males and 15.8% for females among the residents of St Johns, under 5 year old males and 6 to 11 year old females are the most vulnerable to poverty, with 88 males (37.3%) and 65 females (33.2%) in their respective age groups living below the poverty level.
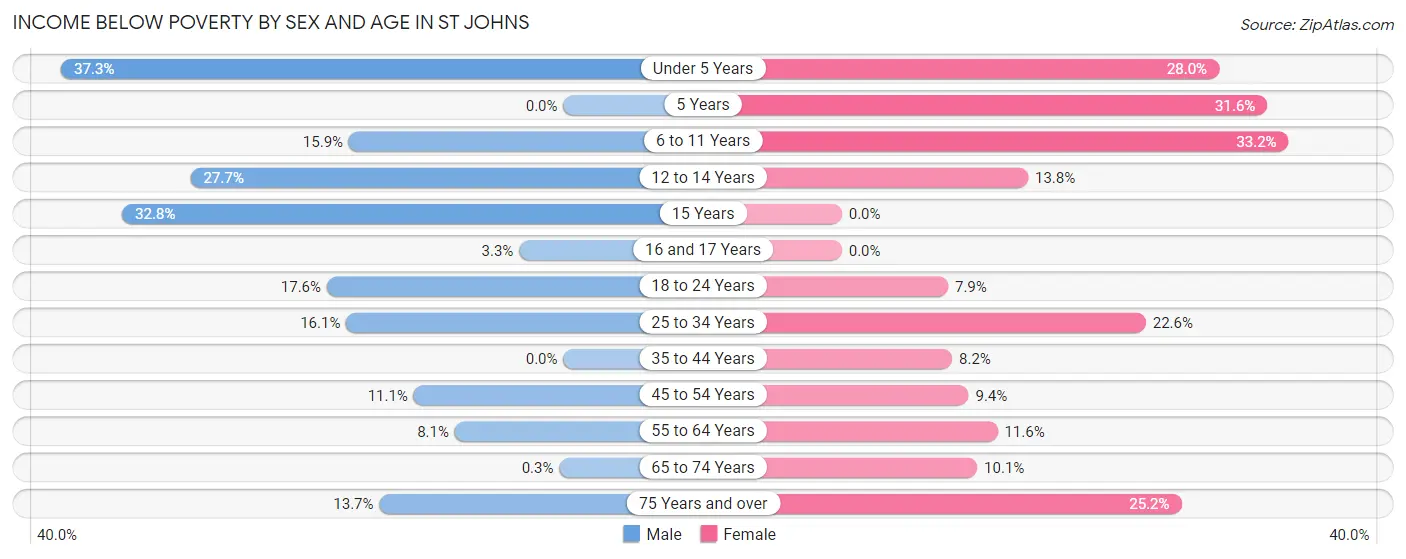
| Age Bracket | Male | Female |
| Under 5 Years | 88 (37.3%) | 56 (28.0%) |
| 5 Years | 0 (0.0%) | 24 (31.6%) |
| 6 to 11 Years | 64 (15.9%) | 65 (33.2%) |
| 12 to 14 Years | 49 (27.7%) | 26 (13.8%) |
| 15 Years | 19 (32.8%) | 0 (0.0%) |
| 16 and 17 Years | 6 (3.3%) | 0 (0.0%) |
| 18 to 24 Years | 36 (17.6%) | 12 (7.9%) |
| 25 to 34 Years | 84 (16.1%) | 107 (22.6%) |
| 35 to 44 Years | 0 (0.0%) | 34 (8.2%) |
| 45 to 54 Years | 42 (11.1%) | 48 (9.4%) |
| 55 to 64 Years | 42 (8.1%) | 68 (11.6%) |
| 65 to 74 Years | 1 (0.3%) | 38 (10.1%) |
| 75 Years and over | 25 (13.7%) | 122 (25.2%) |
| Total | 456 (12.9%) | 600 (15.8%) |
Income Above Poverty by Sex and Age in St Johns
According to the poverty statistics in St Johns, males aged 5 years and females aged 15 years are the age groups that are most secure financially, with 100.0% of males and 100.0% of females in these age groups living above the poverty line.
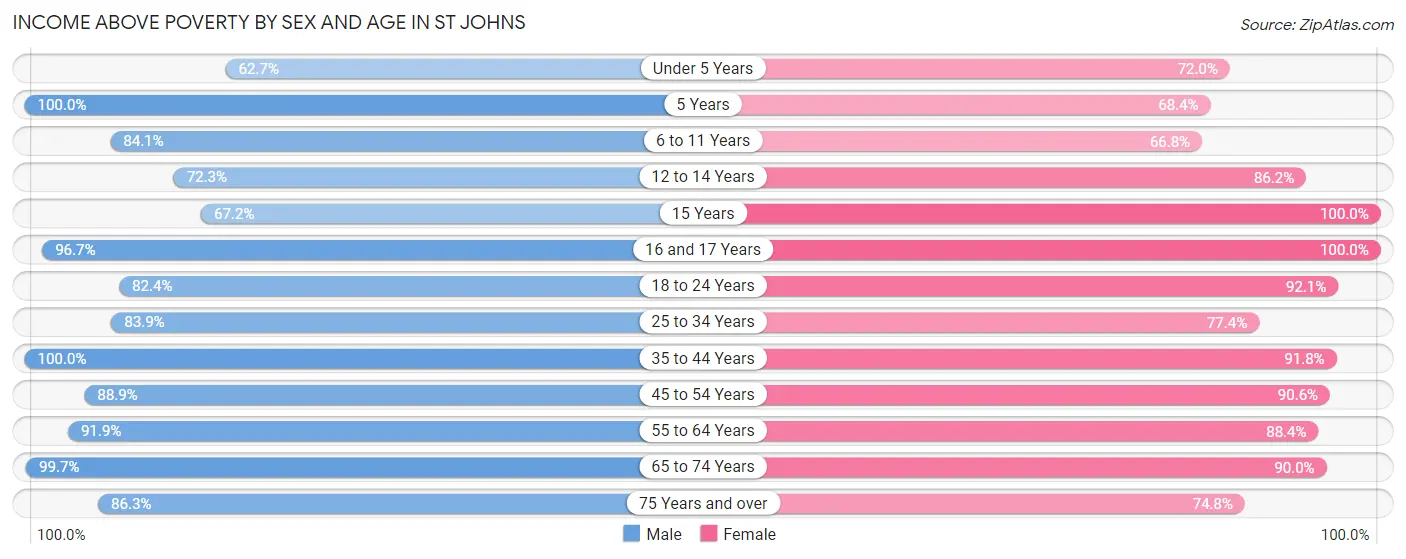
| Age Bracket | Male | Female |
| Under 5 Years | 148 (62.7%) | 144 (72.0%) |
| 5 Years | 46 (100.0%) | 52 (68.4%) |
| 6 to 11 Years | 338 (84.1%) | 131 (66.8%) |
| 12 to 14 Years | 128 (72.3%) | 162 (86.2%) |
| 15 Years | 39 (67.2%) | 58 (100.0%) |
| 16 and 17 Years | 177 (96.7%) | 90 (100.0%) |
| 18 to 24 Years | 169 (82.4%) | 140 (92.1%) |
| 25 to 34 Years | 437 (83.9%) | 367 (77.4%) |
| 35 to 44 Years | 297 (100.0%) | 381 (91.8%) |
| 45 to 54 Years | 336 (88.9%) | 462 (90.6%) |
| 55 to 64 Years | 479 (91.9%) | 520 (88.4%) |
| 65 to 74 Years | 327 (99.7%) | 340 (89.9%) |
| 75 Years and over | 158 (86.3%) | 362 (74.8%) |
| Total | 3,079 (87.1%) | 3,209 (84.3%) |
Income Below Poverty Among Married-Couple Families in St Johns
The poverty statistics for married-couple families in St Johns show that 5.1% or 68 of the total 1,342 families live below the poverty line. Families with 3 or 4 children have the highest poverty rate of 26.7%, comprising of 8 families. On the other hand, families with 1 or 2 children have the lowest poverty rate of 0.0%, which includes 0 families.
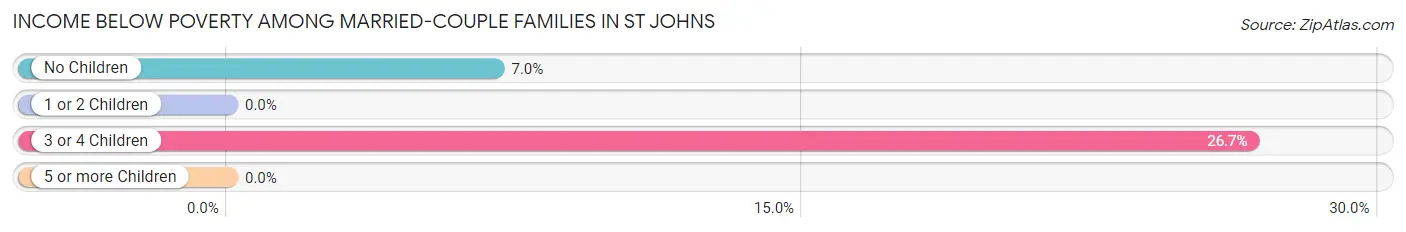
| Children | Above Poverty | Below Poverty |
| No Children | 802 (93.0%) | 60 (7.0%) |
| 1 or 2 Children | 362 (100.0%) | 0 (0.0%) |
| 3 or 4 Children | 22 (73.3%) | 8 (26.7%) |
| 5 or more Children | 88 (100.0%) | 0 (0.0%) |
| Total | 1,274 (94.9%) | 68 (5.1%) |
Income Below Poverty Among Single-Parent Households in St Johns
According to the poverty data in St Johns, 27.0% or 41 single-father households and 27.5% or 111 single-mother households are living below the poverty line. Among single-father households, those with 1 or 2 children have the highest poverty rate, with 41 households (47.7%) experiencing poverty. Likewise, among single-mother households, those with 5 or more children have the highest poverty rate, with 8 households (100.0%) falling below the poverty line.
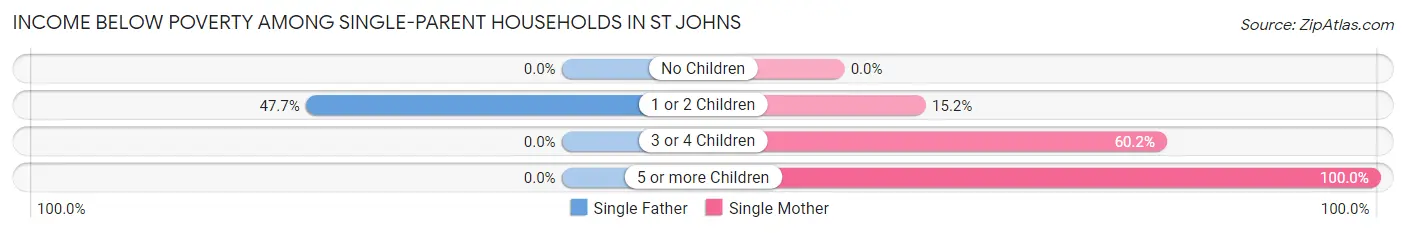
| Children | Single Father | Single Mother |
| No Children | 0 (0.0%) | 0 (0.0%) |
| 1 or 2 Children | 41 (47.7%) | 32 (15.2%) |
| 3 or 4 Children | 0 (0.0%) | 71 (60.2%) |
| 5 or more Children | 0 (0.0%) | 8 (100.0%) |
| Total | 41 (27.0%) | 111 (27.5%) |
Income Below Poverty Among Married-Couple vs Single-Parent Households in St Johns
The poverty data for St Johns shows that 68 of the married-couple family households (5.1%) and 152 of the single-parent households (27.3%) are living below the poverty level. Within the married-couple family households, those with 3 or 4 children have the highest poverty rate, with 8 households (26.7%) falling below the poverty line. Among the single-parent households, those with 5 or more children have the highest poverty rate, with 8 household (100.0%) living below poverty.
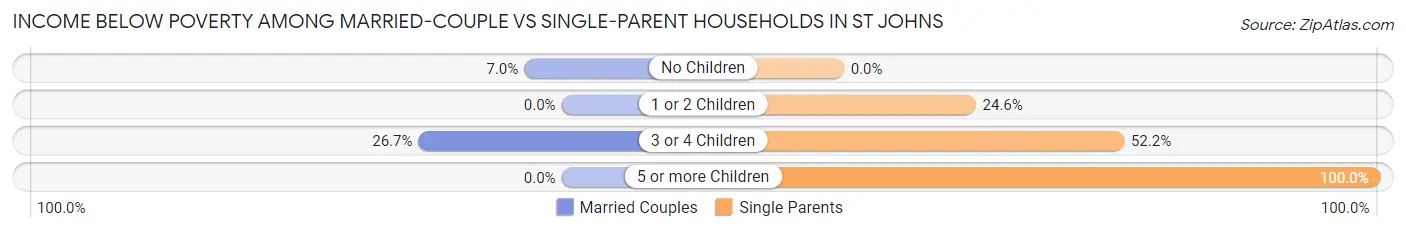
| Children | Married-Couple Families | Single-Parent Households |
| No Children | 60 (7.0%) | 0 (0.0%) |
| 1 or 2 Children | 0 (0.0%) | 73 (24.6%) |
| 3 or 4 Children | 8 (26.7%) | 71 (52.2%) |
| 5 or more Children | 0 (0.0%) | 8 (100.0%) |
| Total | 68 (5.1%) | 152 (27.3%) |
Race in St Johns
The most populous races in St Johns are White / Caucasian (7,115 | 92.3%), Two or more Races (285 | 3.7%), and Hispanic or Latino (211 | 2.7%).
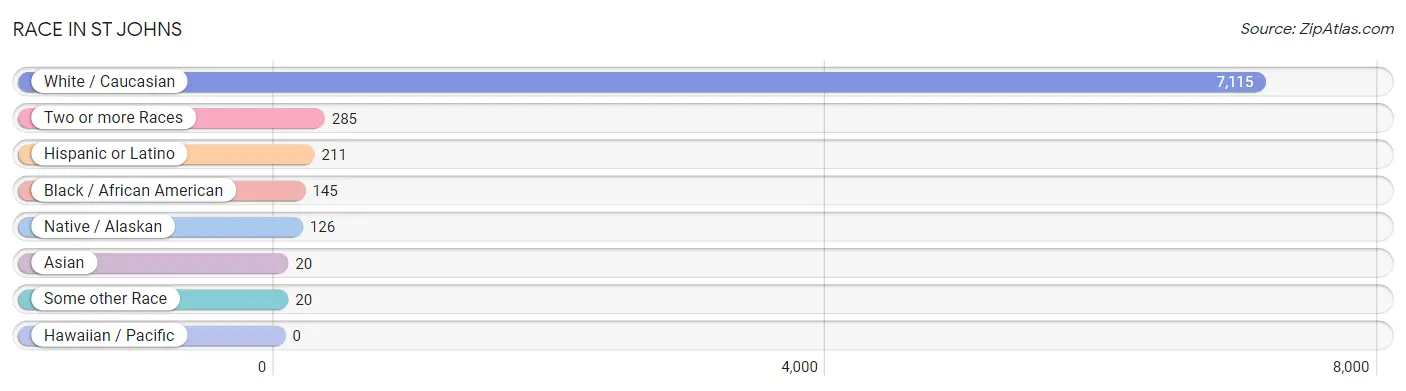
| Race | # Population | % Population |
| Asian | 20 | 0.3% |
| Black / African American | 145 | 1.9% |
| Hawaiian / Pacific | 0 | 0.0% |
| Hispanic or Latino | 211 | 2.7% |
| Native / Alaskan | 126 | 1.6% |
| White / Caucasian | 7,115 | 92.3% |
| Two or more Races | 285 | 3.7% |
| Some other Race | 20 | 0.3% |
| Total | 7,711 | 100.0% |
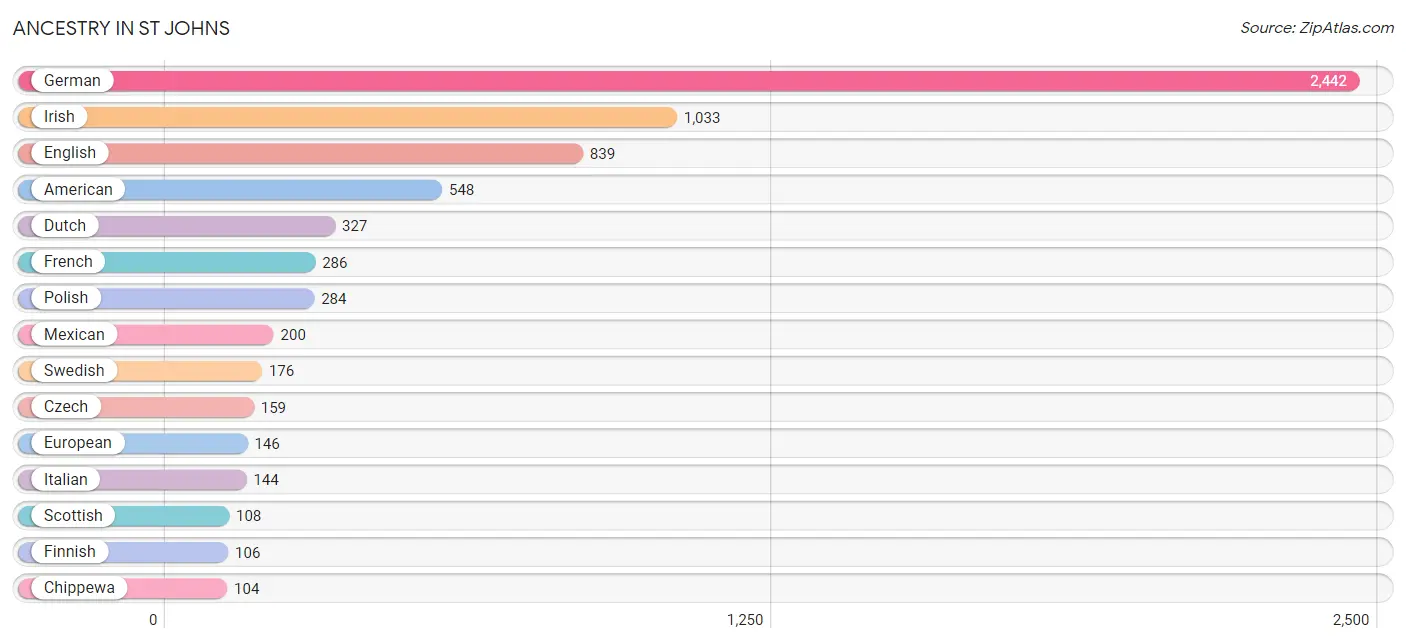
Ancestry in St Johns
The most populous ancestries reported in St Johns are German (2,442 | 31.7%), Irish (1,033 | 13.4%), English (839 | 10.9%), American (548 | 7.1%), and Dutch (327 | 4.2%), together accounting for 67.3% of all St Johns residents.
| Ancestry | # Population | % Population |
| African | 42 | 0.5% |
| American | 548 | 7.1% |
| Apache | 63 | 0.8% |
| Austrian | 7 | 0.1% |
| Belgian | 16 | 0.2% |
| Blackfeet | 31 | 0.4% |
| British | 48 | 0.6% |
| Burmese | 2 | 0.0% |
| Canadian | 45 | 0.6% |
| Central American | 3 | 0.0% |
| Cherokee | 14 | 0.2% |
| Chippewa | 104 | 1.3% |
| Cuban | 5 | 0.1% |
| Czech | 159 | 2.1% |
| Danish | 21 | 0.3% |
| Dutch | 327 | 4.2% |
| Eastern European | 13 | 0.2% |
| English | 839 | 10.9% |
| European | 146 | 1.9% |
| Finnish | 106 | 1.4% |
| French | 286 | 3.7% |
| French Canadian | 67 | 0.9% |
| German | 2,442 | 31.7% |
| Greek | 19 | 0.3% |
| Honduran | 3 | 0.0% |
| Hungarian | 31 | 0.4% |
| Indian (Asian) | 5 | 0.1% |
| Irish | 1,033 | 13.4% |
| Italian | 144 | 1.9% |
| Korean | 12 | 0.2% |
| Lithuanian | 54 | 0.7% |
| Mexican | 200 | 2.6% |
| Northern European | 13 | 0.2% |
| Norwegian | 63 | 0.8% |
| Pennsylvania German | 8 | 0.1% |
| Polish | 284 | 3.7% |
| Russian | 23 | 0.3% |
| Scandinavian | 24 | 0.3% |
| Scottish | 108 | 1.4% |
| Seminole | 9 | 0.1% |
| Slovak | 81 | 1.1% |
| Subsaharan African | 42 | 0.5% |
| Swedish | 176 | 2.3% |
| Swiss | 27 | 0.4% |
| Thai | 15 | 0.2% |
| Welsh | 57 | 0.7% |
| Yugoslavian | 32 | 0.4% | View All 47 Rows |
Immigrants in St Johns
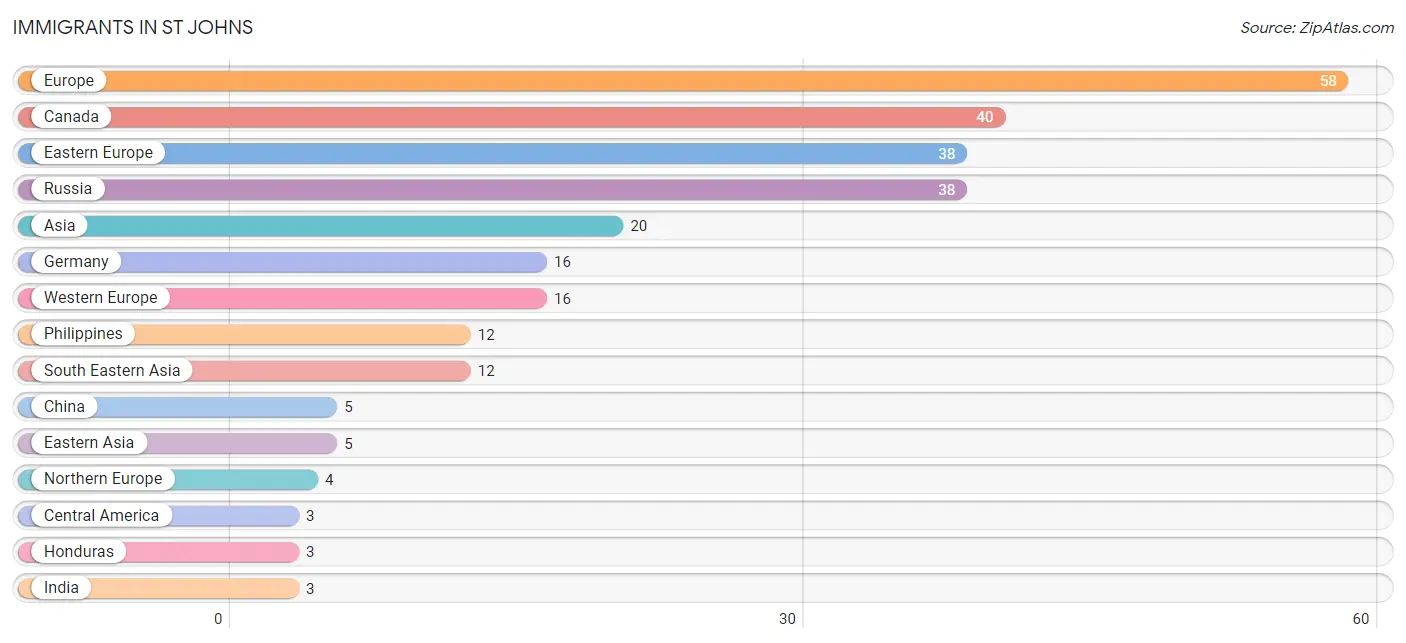
The most numerous immigrant groups reported in St Johns came from Europe (58 | 0.7%), Canada (40 | 0.5%), Eastern Europe (38 | 0.5%), Russia (38 | 0.5%), and Asia (20 | 0.3%), together accounting for 2.5% of all St Johns residents.
| Immigration Origin | # Population | % Population |
| Asia | 20 | 0.3% |
| Canada | 40 | 0.5% |
| Central America | 3 | 0.0% |
| China | 5 | 0.1% |
| Eastern Asia | 5 | 0.1% |
| Eastern Europe | 38 | 0.5% |
| Europe | 58 | 0.7% |
| Germany | 16 | 0.2% |
| Honduras | 3 | 0.0% |
| India | 3 | 0.0% |
| Latin America | 3 | 0.0% |
| Northern Europe | 4 | 0.1% |
| Philippines | 12 | 0.2% |
| Russia | 38 | 0.5% |
| South Central Asia | 3 | 0.0% |
| South Eastern Asia | 12 | 0.2% |
| Western Europe | 16 | 0.2% | View All 17 Rows |
Sex and Age in St Johns
Sex and Age in St Johns
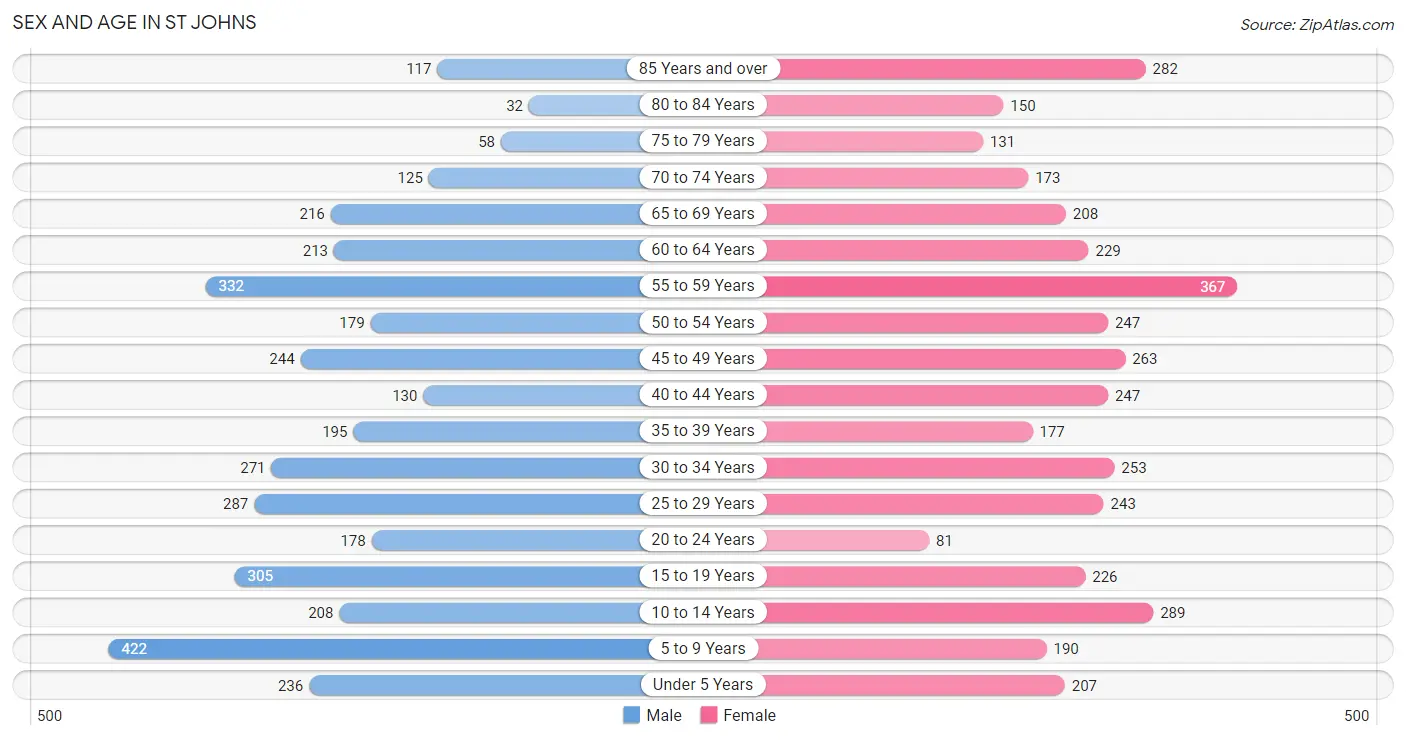
The most populous age groups in St Johns are 5 to 9 Years (422 | 11.3%) for men and 55 to 59 Years (367 | 9.3%) for women.
| Age Bracket | Male | Female |
| Under 5 Years | 236 (6.3%) | 207 (5.2%) |
| 5 to 9 Years | 422 (11.3%) | 190 (4.8%) |
| 10 to 14 Years | 208 (5.6%) | 289 (7.3%) |
| 15 to 19 Years | 305 (8.1%) | 226 (5.7%) |
| 20 to 24 Years | 178 (4.8%) | 81 (2.0%) |
| 25 to 29 Years | 287 (7.7%) | 243 (6.1%) |
| 30 to 34 Years | 271 (7.2%) | 253 (6.4%) |
| 35 to 39 Years | 195 (5.2%) | 177 (4.5%) |
| 40 to 44 Years | 130 (3.5%) | 247 (6.2%) |
| 45 to 49 Years | 244 (6.5%) | 263 (6.6%) |
| 50 to 54 Years | 179 (4.8%) | 247 (6.2%) |
| 55 to 59 Years | 332 (8.9%) | 367 (9.3%) |
| 60 to 64 Years | 213 (5.7%) | 229 (5.8%) |
| 65 to 69 Years | 216 (5.8%) | 208 (5.2%) |
| 70 to 74 Years | 125 (3.3%) | 173 (4.4%) |
| 75 to 79 Years | 58 (1.5%) | 131 (3.3%) |
| 80 to 84 Years | 32 (0.9%) | 150 (3.8%) |
| 85 Years and over | 117 (3.1%) | 282 (7.1%) |
| Total | 3,748 (100.0%) | 3,963 (100.0%) |
Families and Households in St Johns
Median Family Size in St Johns
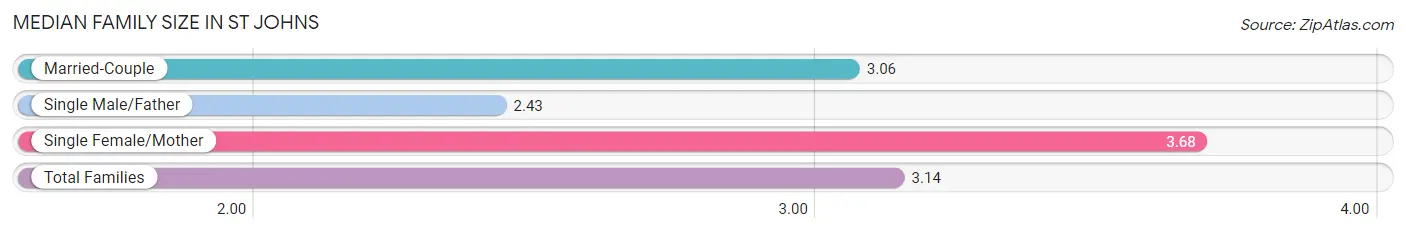
The median family size in St Johns is 3.14 persons per family, with single female/mother families (404 | 21.3%) accounting for the largest median family size of 3.68 persons per family. On the other hand, single male/father families (152 | 8.0%) represent the smallest median family size with 2.43 persons per family.
| Family Type | # Families | Family Size |
| Married-Couple | 1,342 (70.7%) | 3.06 |
| Single Male/Father | 152 (8.0%) | 2.43 |
| Single Female/Mother | 404 (21.3%) | 3.68 |
| Total Families | 1,898 (100.0%) | 3.14 |
Median Household Size in St Johns
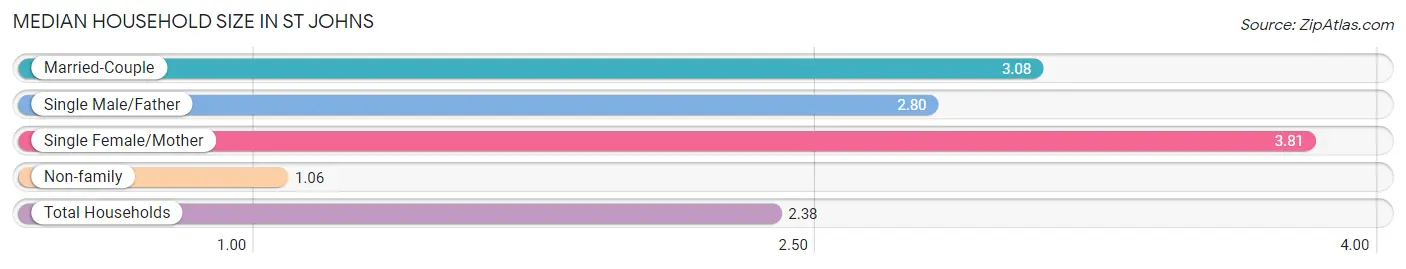
The median household size in St Johns is 2.38 persons per household, with single female/mother households (404 | 13.1%) accounting for the largest median household size of 3.81 persons per household. non-family households (1,191 | 38.6%) represent the smallest median household size with 1.06 persons per household.
| Household Type | # Households | Household Size |
| Married-Couple | 1,342 (43.4%) | 3.08 |
| Single Male/Father | 152 (4.9%) | 2.80 |
| Single Female/Mother | 404 (13.1%) | 3.81 |
| Non-family | 1,191 (38.6%) | 1.06 |
| Total Households | 3,089 (100.0%) | 2.38 |
Household Size by Marriage Status in St Johns
Out of a total of 3,089 households in St Johns, 1,898 (61.4%) are family households, while 1,191 (38.6%) are nonfamily households. The most numerous type of family households are 2-person households, comprising 932, and the most common type of nonfamily households are 1-person households, comprising 1,130.
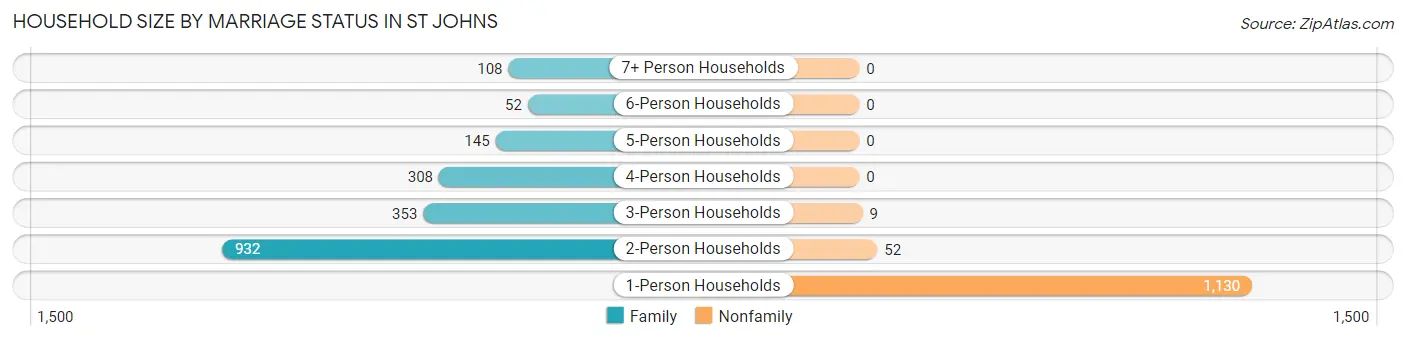
| Household Size | Family Households | Nonfamily Households |
| 1-Person Households | - | 1,130 (36.6%) |
| 2-Person Households | 932 (30.2%) | 52 (1.7%) |
| 3-Person Households | 353 (11.4%) | 9 (0.3%) |
| 4-Person Households | 308 (10.0%) | 0 (0.0%) |
| 5-Person Households | 145 (4.7%) | 0 (0.0%) |
| 6-Person Households | 52 (1.7%) | 0 (0.0%) |
| 7+ Person Households | 108 (3.5%) | 0 (0.0%) |
| Total | 1,898 (61.4%) | 1,191 (38.6%) |
Female Fertility in St Johns
Fertility by Age in St Johns
Average fertility rate in St Johns is 45.0 births per 1,000 women. Women in the age bracket of 20 to 34 years have the highest fertility rate with 102.0 births per 1,000 women. Women in the age bracket of 20 to 34 years acount for 85.5% of all women with births.
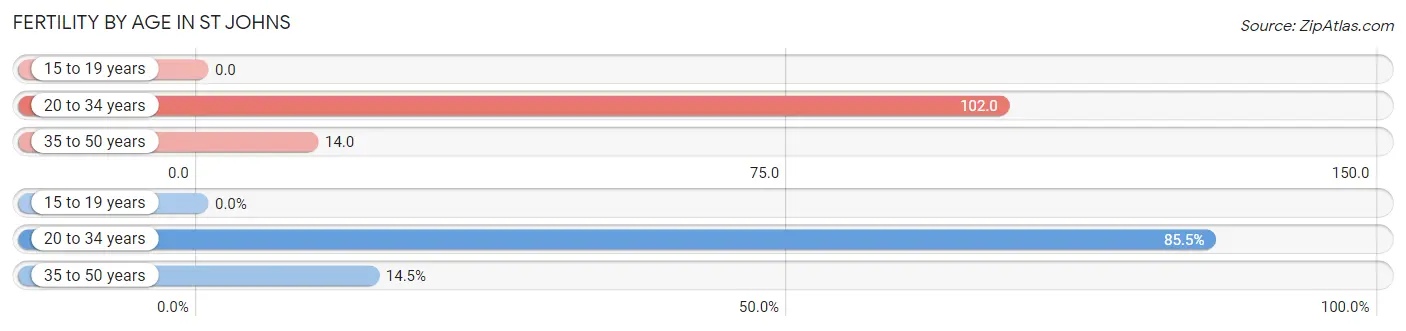
| Age Bracket | Women with Births | Births / 1,000 Women |
| 15 to 19 years | 0 (0.0%) | 0.0 |
| 20 to 34 years | 59 (85.5%) | 102.0 |
| 35 to 50 years | 10 (14.5%) | 14.0 |
| Total | 69 (100.0%) | 45.0 |
Fertility by Age by Marriage Status in St Johns
72.5% of women with births (69) in St Johns are married. The highest percentage of unmarried women with births falls into 20 to 34 years age bracket with 32.2% of them unmarried at the time of birth, while the lowest percentage of unmarried women with births belong to 35 to 50 years age bracket with 0.0% of them unmarried.
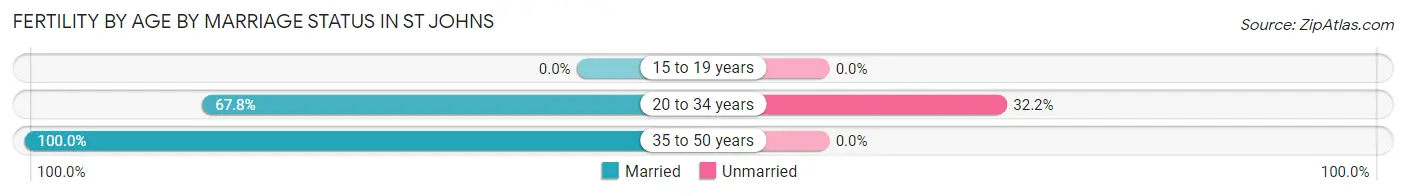
| Age Bracket | Married | Unmarried |
| 15 to 19 years | 0 (0.0%) | 0 (0.0%) |
| 20 to 34 years | 40 (67.8%) | 19 (32.2%) |
| 35 to 50 years | 10 (100.0%) | 0 (0.0%) |
| Total | 50 (72.5%) | 19 (27.5%) |
Fertility by Education in St Johns
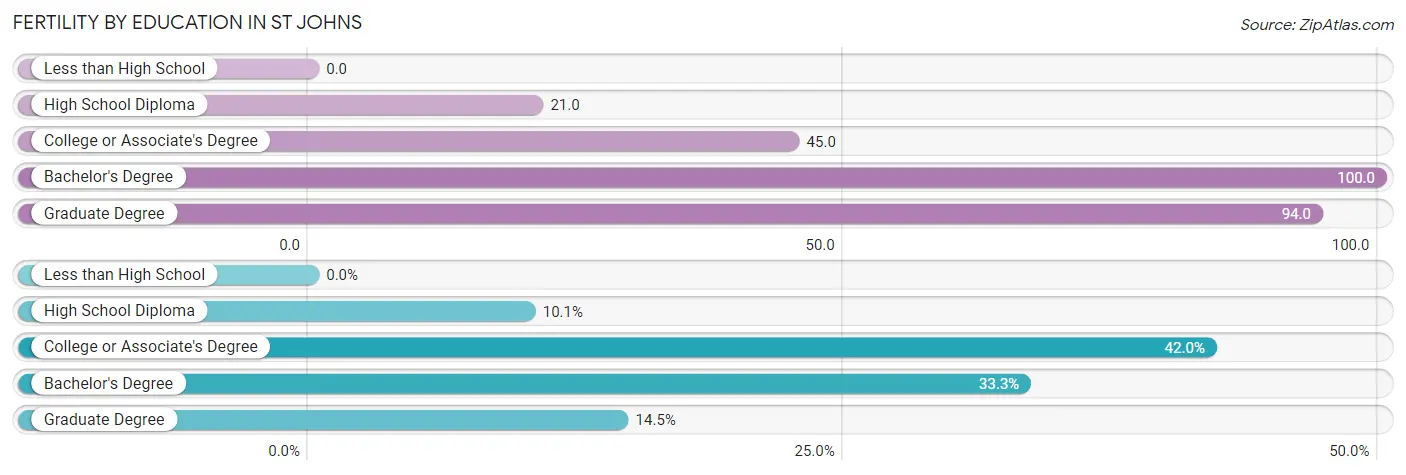
| Educational Attainment | Women with Births | Births / 1,000 Women |
| Less than High School | 0 (0.0%) | 0.0 |
| High School Diploma | 7 (10.1%) | 21.0 |
| College or Associate's Degree | 29 (42.0%) | 45.0 |
| Bachelor's Degree | 23 (33.3%) | 100.0 |
| Graduate Degree | 10 (14.5%) | 94.0 |
| Total | 69 (100.0%) | 45.0 |
Fertility by Education by Marriage Status in St Johns
27.5% of women with births in St Johns are unmarried. Women with the educational attainment of bachelor's degree are most likely to be married with 100.0% of them married at childbirth, while women with the educational attainment of high school diploma are least likely to be married with 100.0% of them unmarried at childbirth.
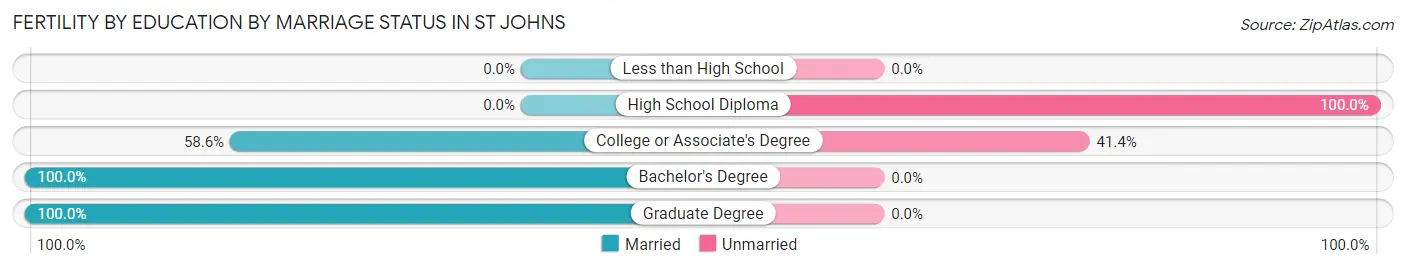
| Educational Attainment | Married | Unmarried |
| Less than High School | 0 (0.0%) | 0 (0.0%) |
| High School Diploma | 0 (0.0%) | 7 (100.0%) |
| College or Associate's Degree | 17 (58.6%) | 12 (41.4%) |
| Bachelor's Degree | 23 (100.0%) | 0 (0.0%) |
| Graduate Degree | 10 (100.0%) | 0 (0.0%) |
| Total | 50 (72.5%) | 19 (27.5%) |
Employment Characteristics in St Johns
Employment by Class of Employer in St Johns
Among the 3,571 employed individuals in St Johns, private company employees (2,198 | 61.6%), state government employees (356 | 10.0%), and not-for-profit organizations (323 | 9.0%) make up the most common classes of employment.
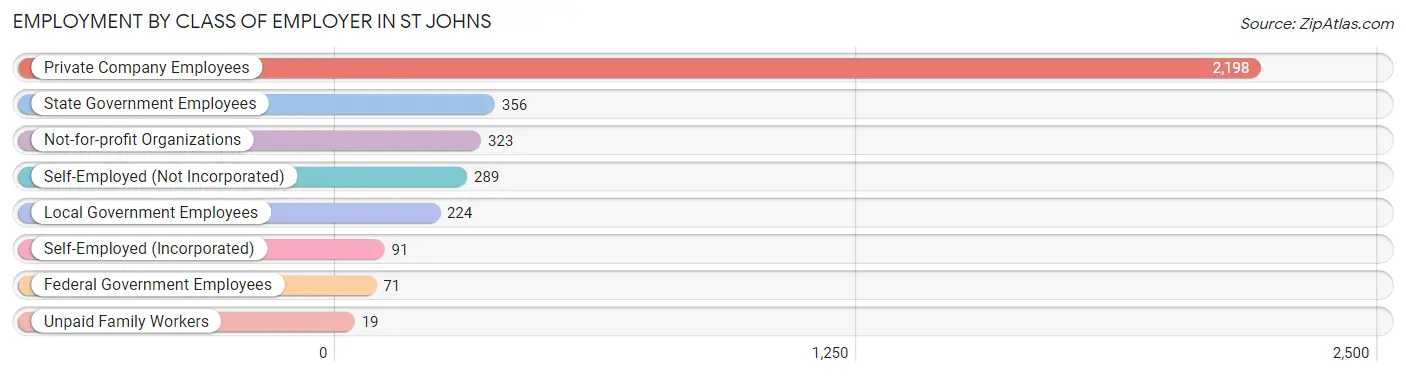
| Employer Class | # Employees | % Employees |
| Private Company Employees | 2,198 | 61.6% |
| Self-Employed (Incorporated) | 91 | 2.5% |
| Self-Employed (Not Incorporated) | 289 | 8.1% |
| Not-for-profit Organizations | 323 | 9.0% |
| Local Government Employees | 224 | 6.3% |
| State Government Employees | 356 | 10.0% |
| Federal Government Employees | 71 | 2.0% |
| Unpaid Family Workers | 19 | 0.5% |
| Total | 3,571 | 100.0% |
Employment Status by Age in St Johns
According to the labor force statistics for St Johns, out of the total population over 16 years of age (6,030), 62.2% or 3,751 individuals are in the labor force, with 2.7% or 101 of them unemployed. The age group with the highest labor force participation rate is 20 to 24 years, with 91.1% or 236 individuals in the labor force. Within the labor force, the 65 to 74 years age range has the highest percentage of unemployed individuals, with 10.6% or 17 of them being unemployed.
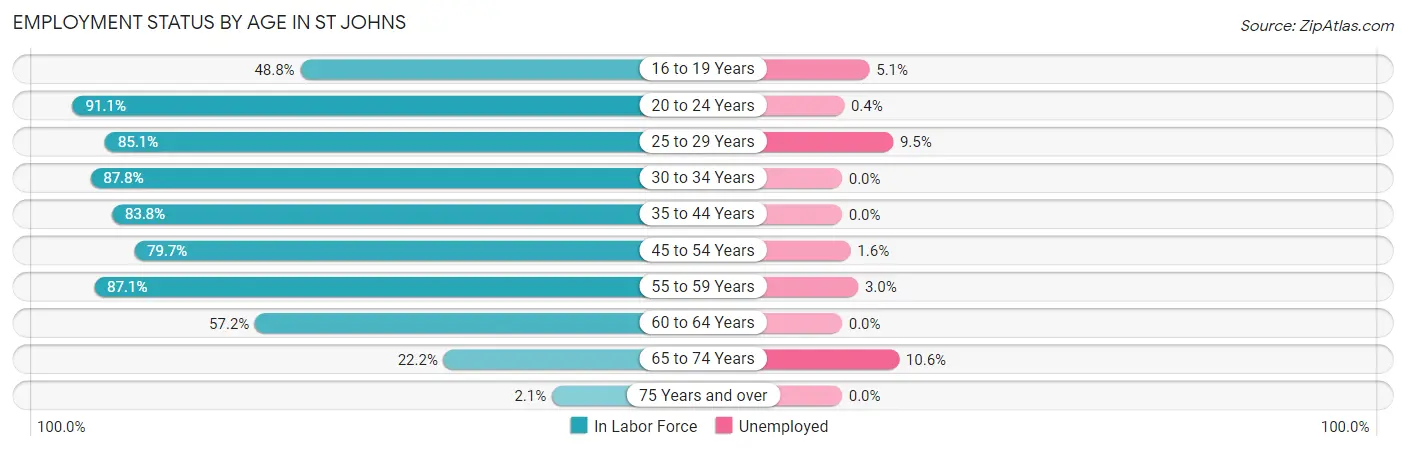
| Age Bracket | In Labor Force | Unemployed |
| 16 to 19 Years | 196 (48.8%) | 10 (5.1%) |
| 20 to 24 Years | 236 (91.1%) | 1 (0.4%) |
| 25 to 29 Years | 451 (85.1%) | 43 (9.5%) |
| 30 to 34 Years | 460 (87.8%) | 0 (0.0%) |
| 35 to 44 Years | 628 (83.8%) | 0 (0.0%) |
| 45 to 54 Years | 744 (79.7%) | 12 (1.6%) |
| 55 to 59 Years | 609 (87.1%) | 18 (3.0%) |
| 60 to 64 Years | 253 (57.2%) | 0 (0.0%) |
| 65 to 74 Years | 160 (22.2%) | 17 (10.6%) |
| 75 Years and over | 16 (2.1%) | 0 (0.0%) |
| Total | 3,751 (62.2%) | 101 (2.7%) |
Employment Status by Educational Attainment in St Johns
According to labor force statistics for St Johns, 81.1% of individuals (3,144) out of the total population between 25 and 64 years of age (3,877) are in the labor force, with 2.3% or 72 of them being unemployed. The group with the highest labor force participation rate are those with the educational attainment of bachelor's degree or higher, with 90.3% or 893 individuals in the labor force. Within the labor force, individuals with college / associate degree education have the highest percentage of unemployment, with 3.5% or 50 of them being unemployed.
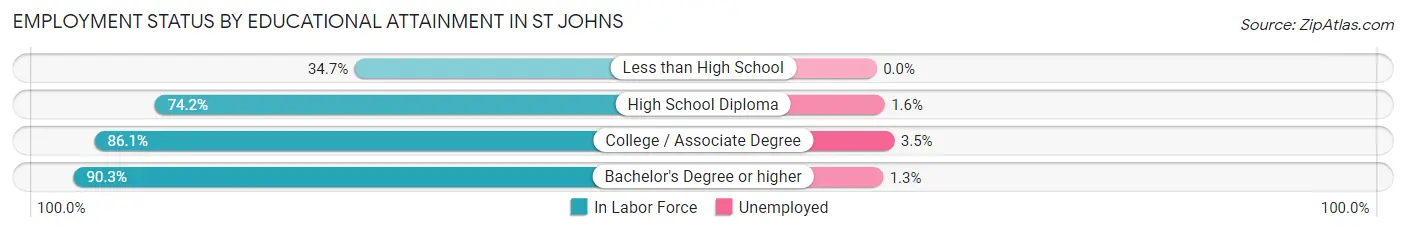
| Educational Attainment | In Labor Force | Unemployed |
| Less than High School | 76 (34.7%) | 0 (0.0%) |
| High School Diploma | 758 (74.2%) | 16 (1.6%) |
| College / Associate Degree | 1,418 (86.1%) | 58 (3.5%) |
| Bachelor's Degree or higher | 893 (90.3%) | 13 (1.3%) |
| Total | 3,144 (81.1%) | 89 (2.3%) |
Employment Occupations by Sex in St Johns
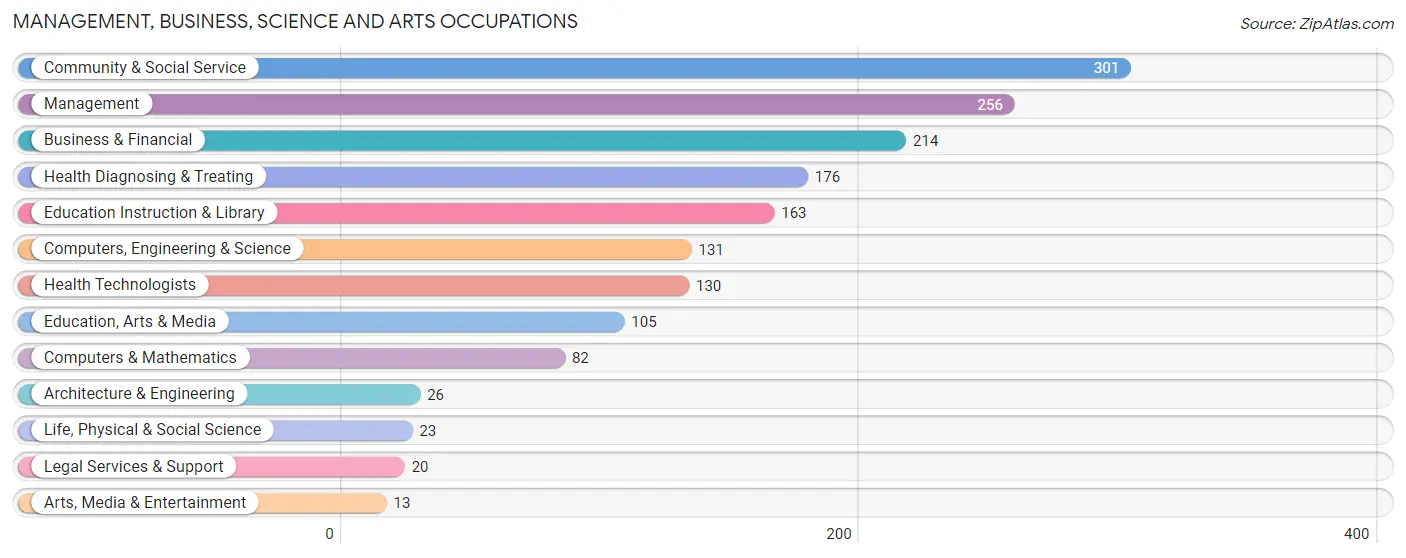
Management, Business, Science and Arts Occupations
The most common Management, Business, Science and Arts occupations in St Johns are Community & Social Service (301 | 8.3%), Management (256 | 7.0%), Business & Financial (214 | 5.9%), Health Diagnosing & Treating (176 | 4.8%), and Education Instruction & Library (163 | 4.5%).
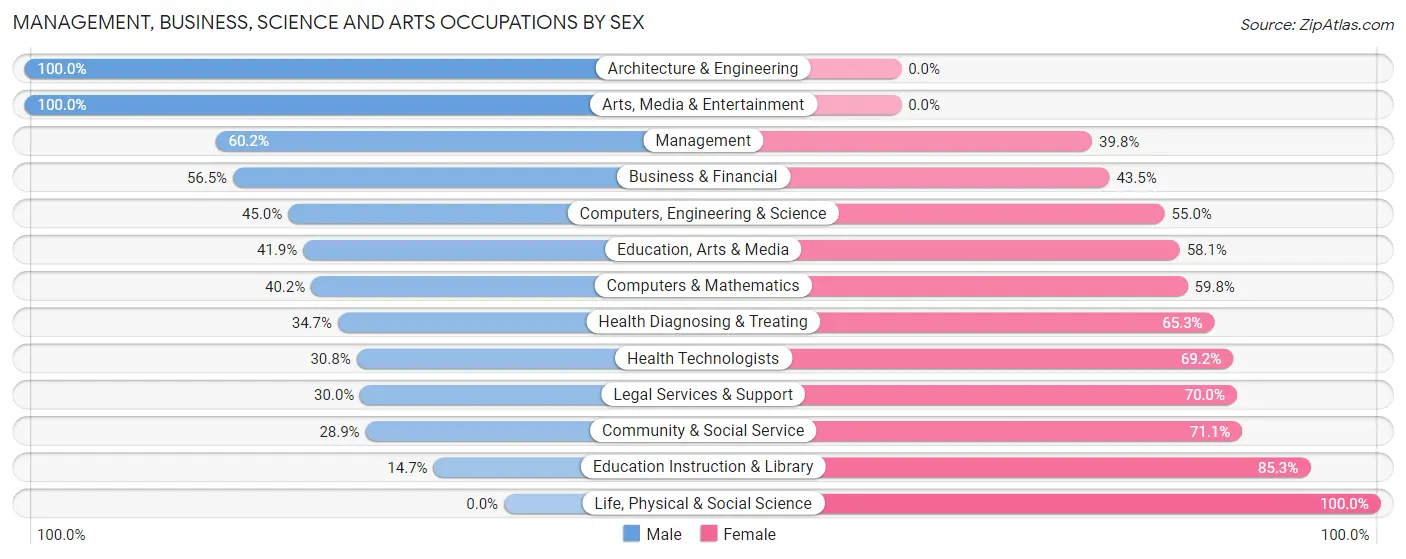
Management, Business, Science and Arts Occupations by Sex
Within the Management, Business, Science and Arts occupations in St Johns, the most male-oriented occupations are Architecture & Engineering (100.0%), Arts, Media & Entertainment (100.0%), and Management (60.2%), while the most female-oriented occupations are Life, Physical & Social Science (100.0%), Education Instruction & Library (85.3%), and Community & Social Service (71.1%).
| Occupation | Male | Female |
| Management | 154 (60.2%) | 102 (39.8%) |
| Business & Financial | 121 (56.5%) | 93 (43.5%) |
| Computers, Engineering & Science | 59 (45.0%) | 72 (55.0%) |
| Computers & Mathematics | 33 (40.2%) | 49 (59.8%) |
| Architecture & Engineering | 26 (100.0%) | 0 (0.0%) |
| Life, Physical & Social Science | 0 (0.0%) | 23 (100.0%) |
| Community & Social Service | 87 (28.9%) | 214 (71.1%) |
| Education, Arts & Media | 44 (41.9%) | 61 (58.1%) |
| Legal Services & Support | 6 (30.0%) | 14 (70.0%) |
| Education Instruction & Library | 24 (14.7%) | 139 (85.3%) |
| Arts, Media & Entertainment | 13 (100.0%) | 0 (0.0%) |
| Health Diagnosing & Treating | 61 (34.7%) | 115 (65.3%) |
| Health Technologists | 40 (30.8%) | 90 (69.2%) |
| Total (Category) | 482 (44.7%) | 596 (55.3%) |
| Total (Overall) | 1,820 (50.0%) | 1,820 (50.0%) |
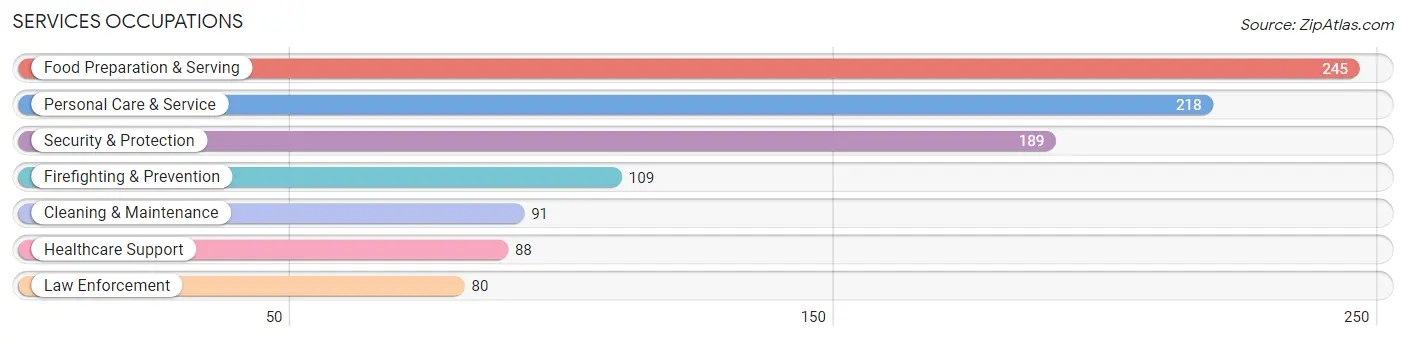
Services Occupations
The most common Services occupations in St Johns are Food Preparation & Serving (245 | 6.7%), Personal Care & Service (218 | 6.0%), Security & Protection (189 | 5.2%), Firefighting & Prevention (109 | 3.0%), and Cleaning & Maintenance (91 | 2.5%).
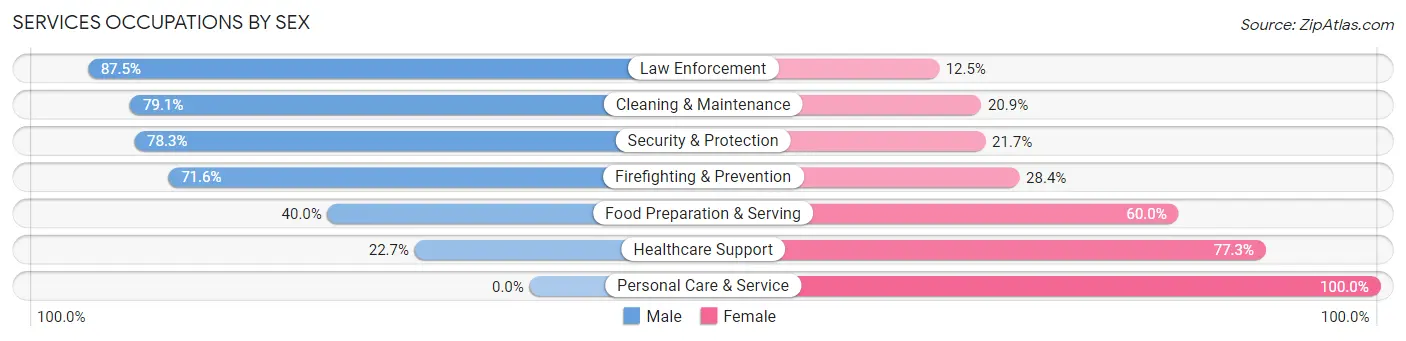
Services Occupations by Sex
Within the Services occupations in St Johns, the most male-oriented occupations are Law Enforcement (87.5%), Cleaning & Maintenance (79.1%), and Security & Protection (78.3%), while the most female-oriented occupations are Personal Care & Service (100.0%), Healthcare Support (77.3%), and Food Preparation & Serving (60.0%).
| Occupation | Male | Female |
| Healthcare Support | 20 (22.7%) | 68 (77.3%) |
| Security & Protection | 148 (78.3%) | 41 (21.7%) |
| Firefighting & Prevention | 78 (71.6%) | 31 (28.4%) |
| Law Enforcement | 70 (87.5%) | 10 (12.5%) |
| Food Preparation & Serving | 98 (40.0%) | 147 (60.0%) |
| Cleaning & Maintenance | 72 (79.1%) | 19 (20.9%) |
| Personal Care & Service | 0 (0.0%) | 218 (100.0%) |
| Total (Category) | 338 (40.7%) | 493 (59.3%) |
| Total (Overall) | 1,820 (50.0%) | 1,820 (50.0%) |
Sales and Office Occupations
The most common Sales and Office occupations in St Johns are Office & Administration (519 | 14.3%), and Sales & Related (356 | 9.8%).
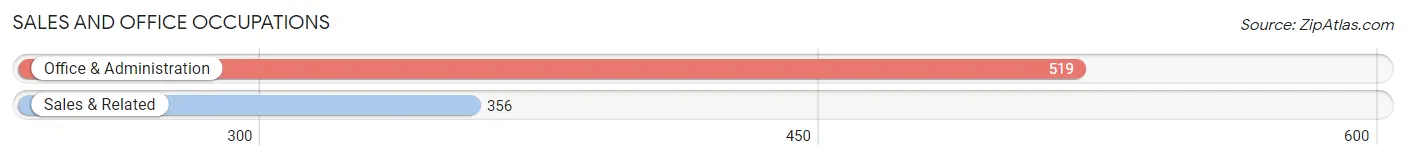
Sales and Office Occupations by Sex
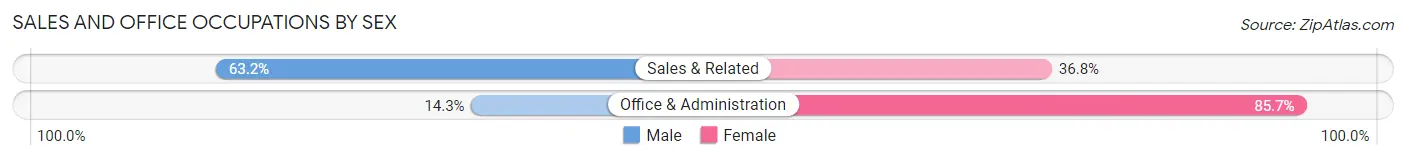
| Occupation | Male | Female |
| Sales & Related | 225 (63.2%) | 131 (36.8%) |
| Office & Administration | 74 (14.3%) | 445 (85.7%) |
| Total (Category) | 299 (34.2%) | 576 (65.8%) |
| Total (Overall) | 1,820 (50.0%) | 1,820 (50.0%) |
Natural Resources, Construction and Maintenance Occupations
The most common Natural Resources, Construction and Maintenance occupations in St Johns are Construction & Extraction (139 | 3.8%), Installation, Maintenance & Repair (105 | 2.9%), and Farming, Fishing & Forestry (33 | 0.9%).
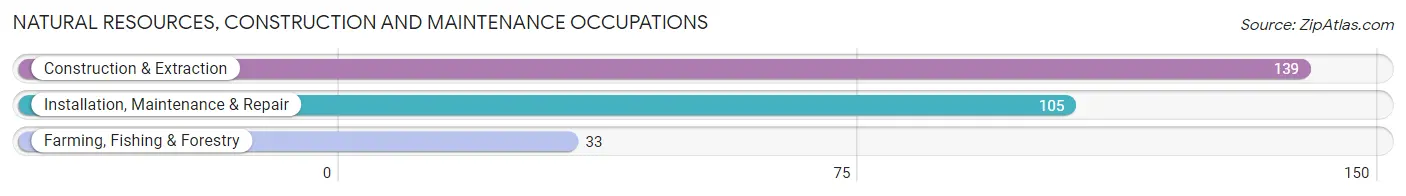
Natural Resources, Construction and Maintenance Occupations by Sex
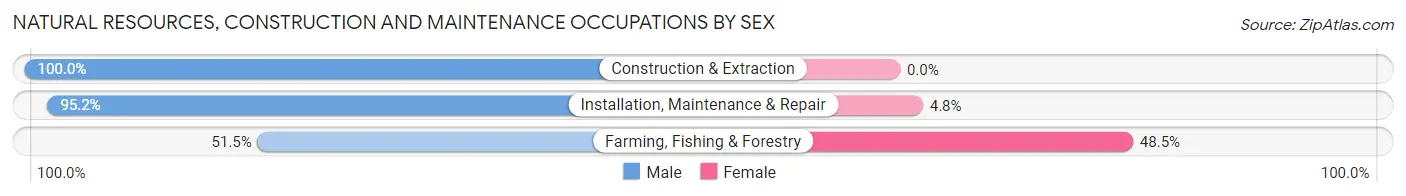
| Occupation | Male | Female |
| Farming, Fishing & Forestry | 17 (51.5%) | 16 (48.5%) |
| Construction & Extraction | 139 (100.0%) | 0 (0.0%) |
| Installation, Maintenance & Repair | 100 (95.2%) | 5 (4.8%) |
| Total (Category) | 256 (92.4%) | 21 (7.6%) |
| Total (Overall) | 1,820 (50.0%) | 1,820 (50.0%) |
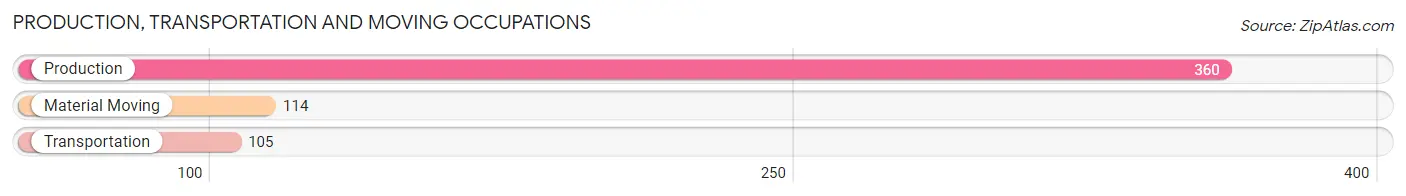
Production, Transportation and Moving Occupations
The most common Production, Transportation and Moving occupations in St Johns are Production (360 | 9.9%), Material Moving (114 | 3.1%), and Transportation (105 | 2.9%).
Production, Transportation and Moving Occupations by Sex
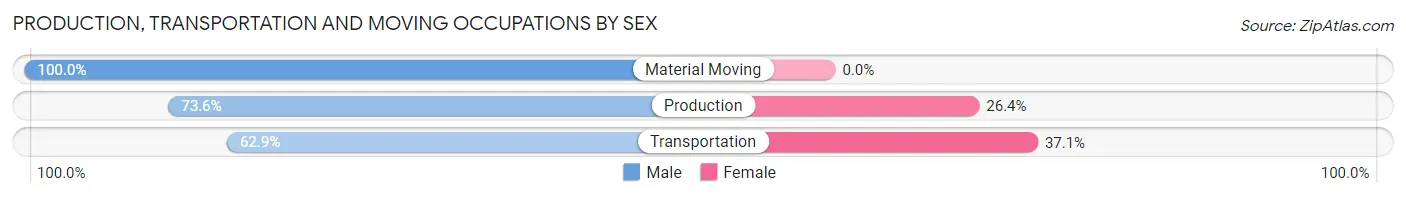
| Occupation | Male | Female |
| Production | 265 (73.6%) | 95 (26.4%) |
| Transportation | 66 (62.9%) | 39 (37.1%) |
| Material Moving | 114 (100.0%) | 0 (0.0%) |
| Total (Category) | 445 (76.9%) | 134 (23.1%) |
| Total (Overall) | 1,820 (50.0%) | 1,820 (50.0%) |
Employment Industries by Sex in St Johns
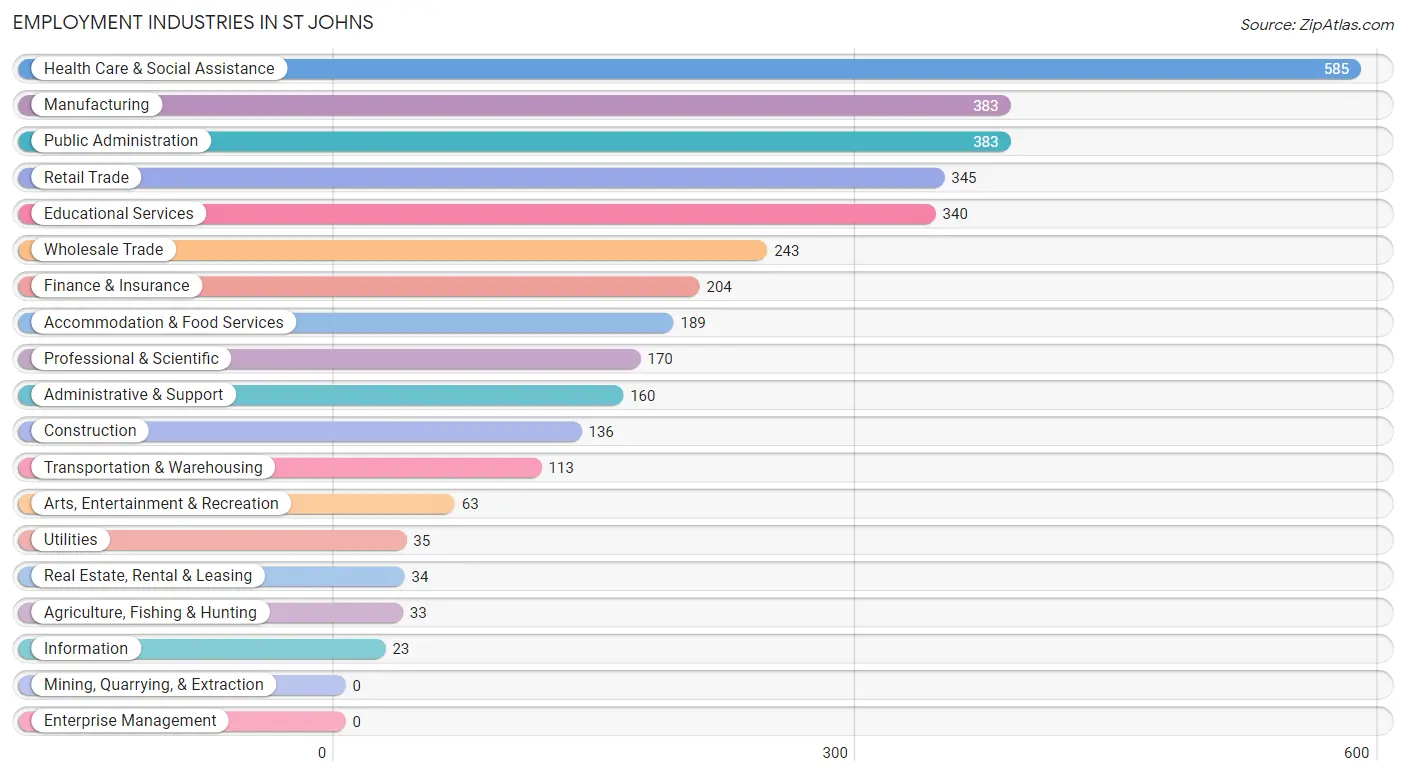
Employment Industries in St Johns
The major employment industries in St Johns include Health Care & Social Assistance (585 | 16.1%), Manufacturing (383 | 10.5%), Public Administration (383 | 10.5%), Retail Trade (345 | 9.5%), and Educational Services (340 | 9.3%).
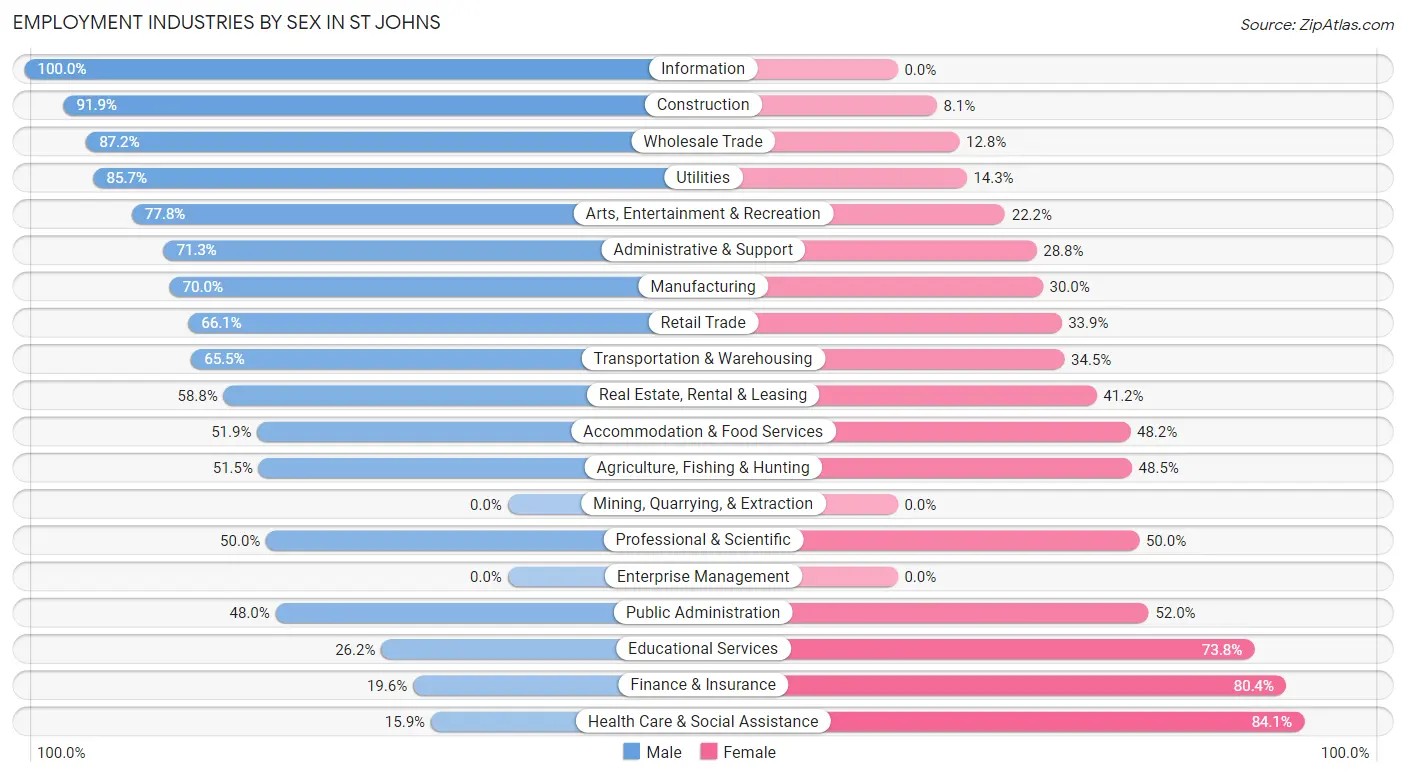
Employment Industries by Sex in St Johns
The St Johns industries that see more men than women are Information (100.0%), Construction (91.9%), and Wholesale Trade (87.2%), whereas the industries that tend to have a higher number of women are Health Care & Social Assistance (84.1%), Finance & Insurance (80.4%), and Educational Services (73.8%).
| Industry | Male | Female |
| Agriculture, Fishing & Hunting | 17 (51.5%) | 16 (48.5%) |
| Mining, Quarrying, & Extraction | 0 (0.0%) | 0 (0.0%) |
| Construction | 125 (91.9%) | 11 (8.1%) |
| Manufacturing | 268 (70.0%) | 115 (30.0%) |
| Wholesale Trade | 212 (87.2%) | 31 (12.8%) |
| Retail Trade | 228 (66.1%) | 117 (33.9%) |
| Transportation & Warehousing | 74 (65.5%) | 39 (34.5%) |
| Utilities | 30 (85.7%) | 5 (14.3%) |
| Information | 23 (100.0%) | 0 (0.0%) |
| Finance & Insurance | 40 (19.6%) | 164 (80.4%) |
| Real Estate, Rental & Leasing | 20 (58.8%) | 14 (41.2%) |
| Professional & Scientific | 85 (50.0%) | 85 (50.0%) |
| Enterprise Management | 0 (0.0%) | 0 (0.0%) |
| Administrative & Support | 114 (71.3%) | 46 (28.7%) |
| Educational Services | 89 (26.2%) | 251 (73.8%) |
| Health Care & Social Assistance | 93 (15.9%) | 492 (84.1%) |
| Arts, Entertainment & Recreation | 49 (77.8%) | 14 (22.2%) |
| Accommodation & Food Services | 98 (51.8%) | 91 (48.1%) |
| Public Administration | 184 (48.0%) | 199 (52.0%) |
| Total | 1,820 (50.0%) | 1,820 (50.0%) |
Education in St Johns
School Enrollment in St Johns
The most common levels of schooling among the 1,824 students in St Johns are high school (503 | 27.6%), middle school (438 | 24.0%), and elementary school (414 | 22.7%).
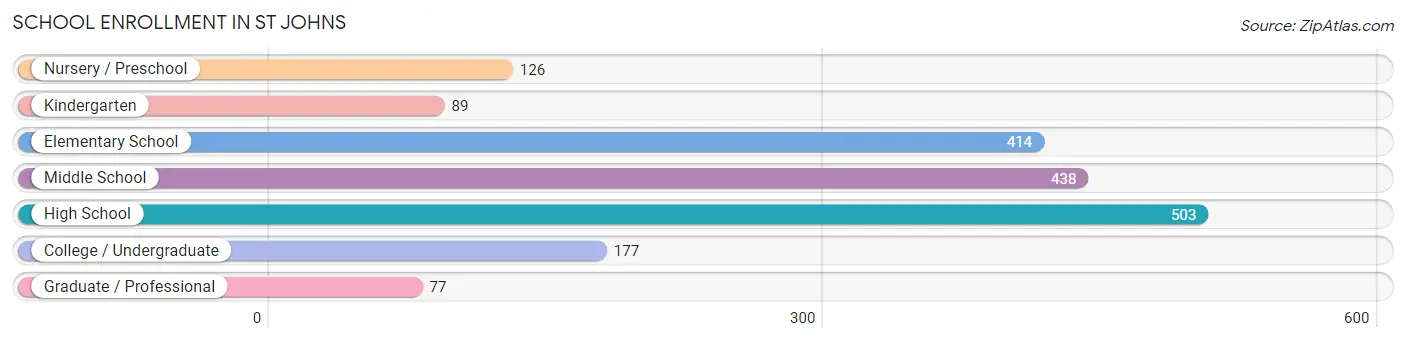
| School Level | # Students | % Students |
| Nursery / Preschool | 126 | 6.9% |
| Kindergarten | 89 | 4.9% |
| Elementary School | 414 | 22.7% |
| Middle School | 438 | 24.0% |
| High School | 503 | 27.6% |
| College / Undergraduate | 177 | 9.7% |
| Graduate / Professional | 77 | 4.2% |
| Total | 1,824 | 100.0% |
School Enrollment by Age by Funding Source in St Johns
Out of a total of 1,824 students who are enrolled in schools in St Johns, 235 (12.9%) attend a private institution, while the remaining 1,589 (87.1%) are enrolled in public schools. The age group of 35 years and over has the highest likelihood of being enrolled in private schools, with 20 (42.5% in the age bracket) enrolled. Conversely, the age group of 18 to 19 year olds has the lowest likelihood of being enrolled in a private school, with 100 (100.0% in the age bracket) attending a public institution.
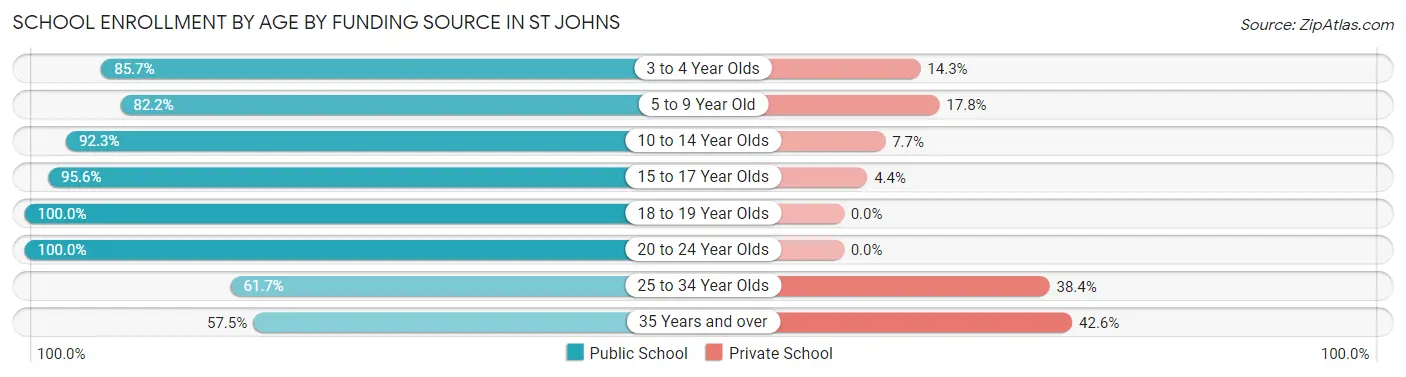
| Age Bracket | Public School | Private School |
| 3 to 4 Year Olds | 48 (85.7%) | 8 (14.3%) |
| 5 to 9 Year Old | 461 (82.2%) | 100 (17.8%) |
| 10 to 14 Year Olds | 453 (92.3%) | 38 (7.7%) |
| 15 to 17 Year Olds | 392 (95.6%) | 18 (4.4%) |
| 18 to 19 Year Olds | 100 (100.0%) | 0 (0.0%) |
| 20 to 24 Year Olds | 26 (100.0%) | 0 (0.0%) |
| 25 to 34 Year Olds | 82 (61.7%) | 51 (38.4%) |
| 35 Years and over | 27 (57.5%) | 20 (42.5%) |
| Total | 1,589 (87.1%) | 235 (12.9%) |
Educational Attainment by Field of Study in St Johns
Business (380 | 27.5%), education (221 | 16.0%), arts & humanities (171 | 12.4%), science & technology (166 | 12.0%), and bio, nature & agricultural (95 | 6.9%) are the most common fields of study among 1,380 individuals in St Johns who have obtained a bachelor's degree or higher.
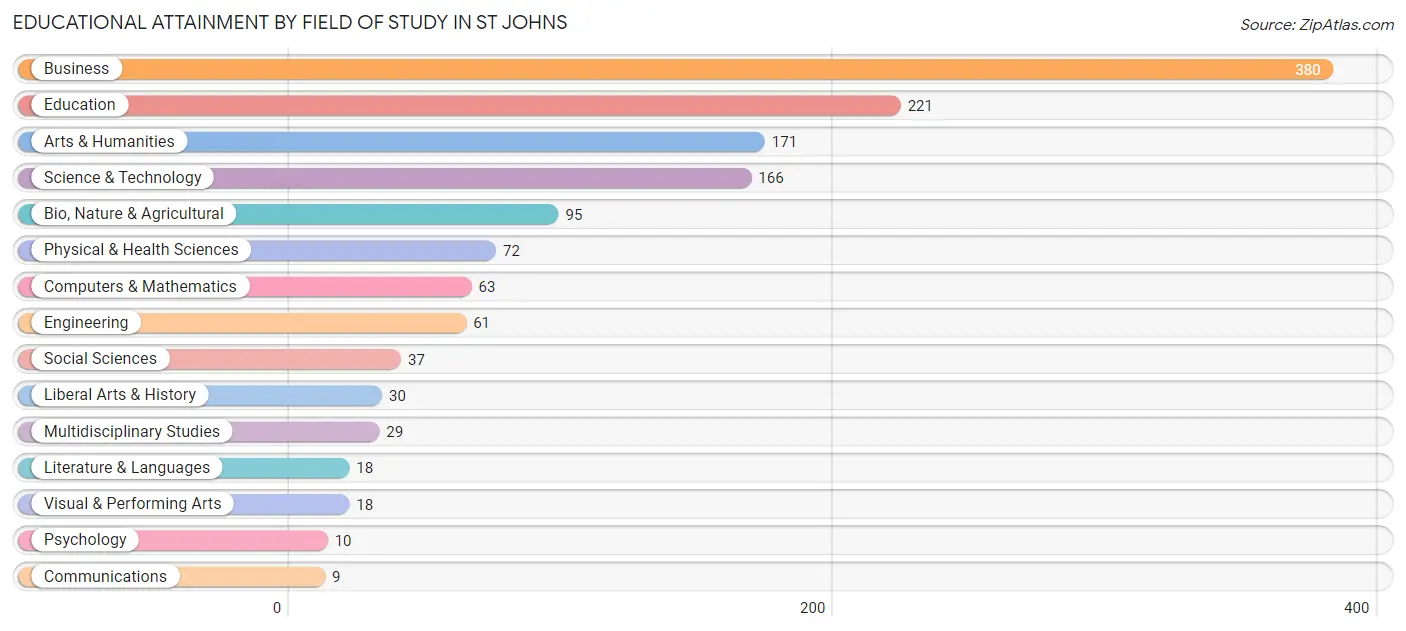
| Field of Study | # Graduates | % Graduates |
| Computers & Mathematics | 63 | 4.6% |
| Bio, Nature & Agricultural | 95 | 6.9% |
| Physical & Health Sciences | 72 | 5.2% |
| Psychology | 10 | 0.7% |
| Social Sciences | 37 | 2.7% |
| Engineering | 61 | 4.4% |
| Multidisciplinary Studies | 29 | 2.1% |
| Science & Technology | 166 | 12.0% |
| Business | 380 | 27.5% |
| Education | 221 | 16.0% |
| Literature & Languages | 18 | 1.3% |
| Liberal Arts & History | 30 | 2.2% |
| Visual & Performing Arts | 18 | 1.3% |
| Communications | 9 | 0.6% |
| Arts & Humanities | 171 | 12.4% |
| Total | 1,380 | 100.0% |
Transportation & Commute in St Johns
Vehicle Availability by Sex in St Johns
The most prevalent vehicle ownership categories in St Johns are males with 2 vehicles (953, accounting for 52.2%) and females with 2 vehicles (922, making up 54.6%).
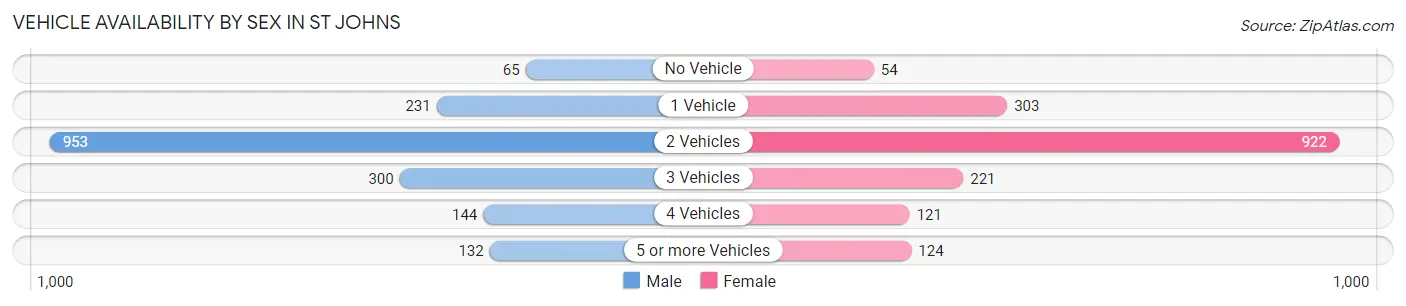
| Vehicles Available | Male | Female |
| No Vehicle | 65 (3.6%) | 54 (3.1%) |
| 1 Vehicle | 231 (12.7%) | 303 (17.4%) |
| 2 Vehicles | 953 (52.2%) | 922 (52.8%) |
| 3 Vehicles | 300 (16.4%) | 221 (12.7%) |
| 4 Vehicles | 144 (7.9%) | 121 (6.9%) |
| 5 or more Vehicles | 132 (7.2%) | 124 (7.1%) |
| Total | 1,825 (100.0%) | 1,745 (100.0%) |
Commute Time in St Johns
The most frequently occuring commute durations in St Johns are 5 to 9 minutes (727 commuters, 23.4%), 30 to 34 minutes (640 commuters, 20.6%), and 25 to 29 minutes (373 commuters, 12.0%).
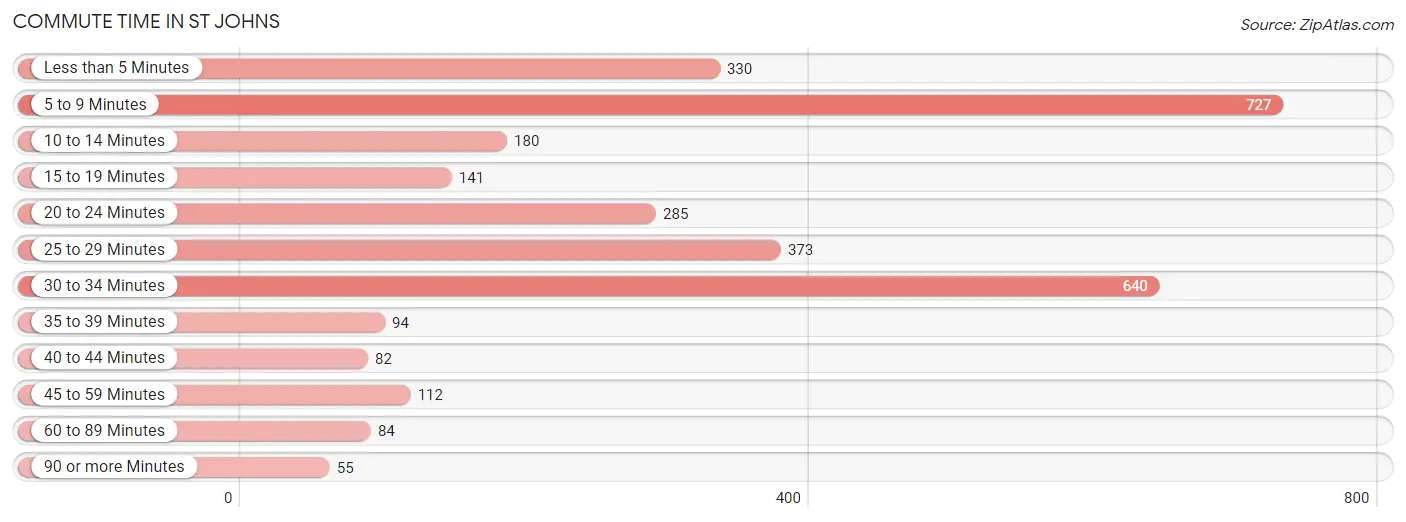
| Commute Time | # Commuters | % Commuters |
| Less than 5 Minutes | 330 | 10.6% |
| 5 to 9 Minutes | 727 | 23.4% |
| 10 to 14 Minutes | 180 | 5.8% |
| 15 to 19 Minutes | 141 | 4.5% |
| 20 to 24 Minutes | 285 | 9.2% |
| 25 to 29 Minutes | 373 | 12.0% |
| 30 to 34 Minutes | 640 | 20.6% |
| 35 to 39 Minutes | 94 | 3.0% |
| 40 to 44 Minutes | 82 | 2.6% |
| 45 to 59 Minutes | 112 | 3.6% |
| 60 to 89 Minutes | 84 | 2.7% |
| 90 or more Minutes | 55 | 1.8% |
Commute Time by Sex in St Johns
The most common commute times in St Johns are 5 to 9 minutes (353 commuters, 21.3%) for males and 5 to 9 minutes (374 commuters, 25.8%) for females.
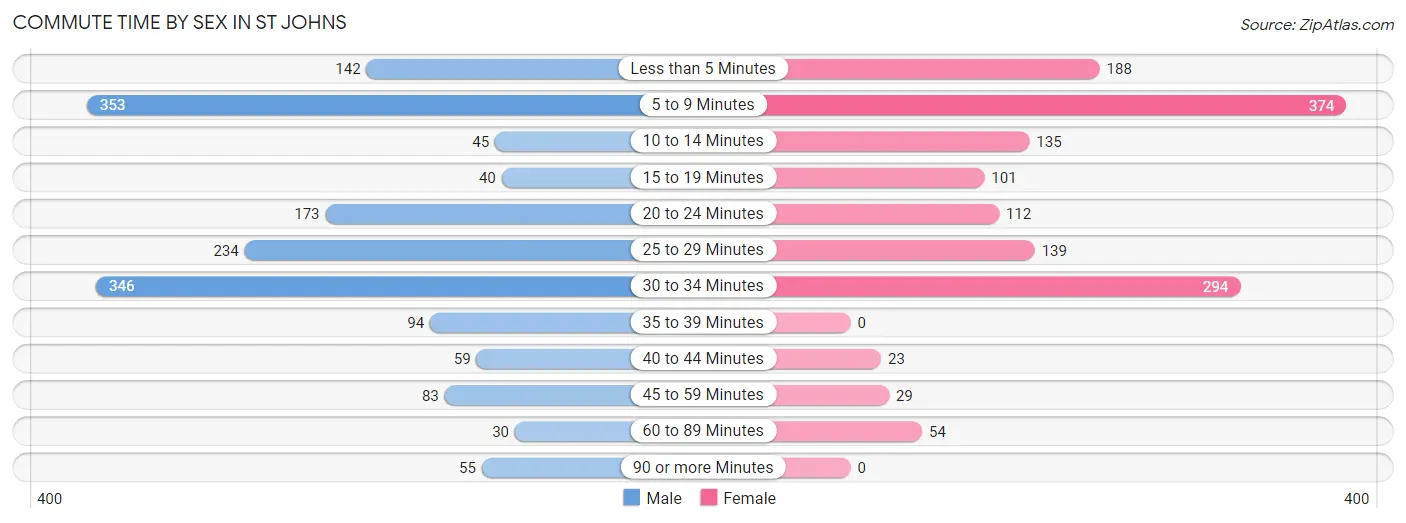
| Commute Time | Male | Female |
| Less than 5 Minutes | 142 (8.6%) | 188 (13.0%) |
| 5 to 9 Minutes | 353 (21.3%) | 374 (25.8%) |
| 10 to 14 Minutes | 45 (2.7%) | 135 (9.3%) |
| 15 to 19 Minutes | 40 (2.4%) | 101 (7.0%) |
| 20 to 24 Minutes | 173 (10.5%) | 112 (7.7%) |
| 25 to 29 Minutes | 234 (14.1%) | 139 (9.6%) |
| 30 to 34 Minutes | 346 (20.9%) | 294 (20.3%) |
| 35 to 39 Minutes | 94 (5.7%) | 0 (0.0%) |
| 40 to 44 Minutes | 59 (3.6%) | 23 (1.6%) |
| 45 to 59 Minutes | 83 (5.0%) | 29 (2.0%) |
| 60 to 89 Minutes | 30 (1.8%) | 54 (3.7%) |
| 90 or more Minutes | 55 (3.3%) | 0 (0.0%) |
Time of Departure to Work by Sex in St Johns
The most frequent times of departure to work in St Johns are 8:00 AM to 8:29 AM (322, 19.5%) for males and 7:30 AM to 7:59 AM (271, 18.7%) for females.
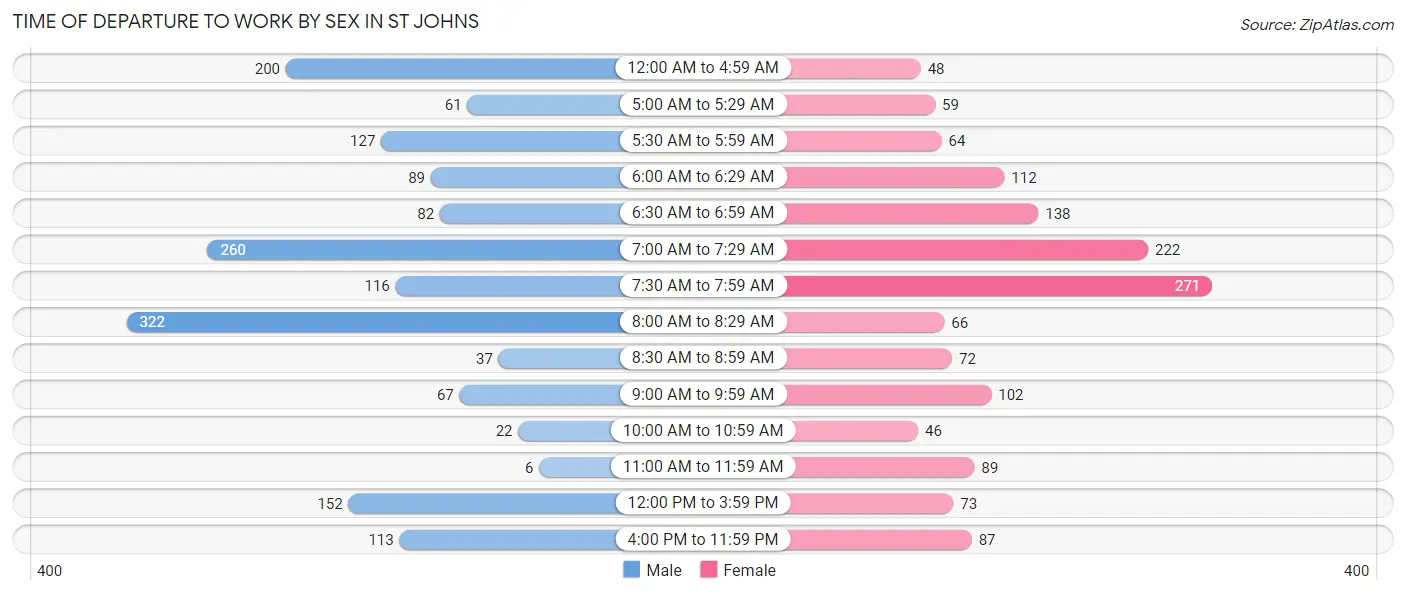
| Time of Departure | Male | Female |
| 12:00 AM to 4:59 AM | 200 (12.1%) | 48 (3.3%) |
| 5:00 AM to 5:29 AM | 61 (3.7%) | 59 (4.1%) |
| 5:30 AM to 5:59 AM | 127 (7.7%) | 64 (4.4%) |
| 6:00 AM to 6:29 AM | 89 (5.4%) | 112 (7.7%) |
| 6:30 AM to 6:59 AM | 82 (5.0%) | 138 (9.5%) |
| 7:00 AM to 7:29 AM | 260 (15.7%) | 222 (15.3%) |
| 7:30 AM to 7:59 AM | 116 (7.0%) | 271 (18.7%) |
| 8:00 AM to 8:29 AM | 322 (19.5%) | 66 (4.5%) |
| 8:30 AM to 8:59 AM | 37 (2.2%) | 72 (5.0%) |
| 9:00 AM to 9:59 AM | 67 (4.1%) | 102 (7.0%) |
| 10:00 AM to 10:59 AM | 22 (1.3%) | 46 (3.2%) |
| 11:00 AM to 11:59 AM | 6 (0.4%) | 89 (6.1%) |
| 12:00 PM to 3:59 PM | 152 (9.2%) | 73 (5.0%) |
| 4:00 PM to 11:59 PM | 113 (6.8%) | 87 (6.0%) |
| Total | 1,654 (100.0%) | 1,449 (100.0%) |
Housing Occupancy in St Johns
Occupancy by Ownership in St Johns
Of the total 3,089 dwellings in St Johns, owner-occupied units account for 2,202 (71.3%), while renter-occupied units make up 887 (28.7%).
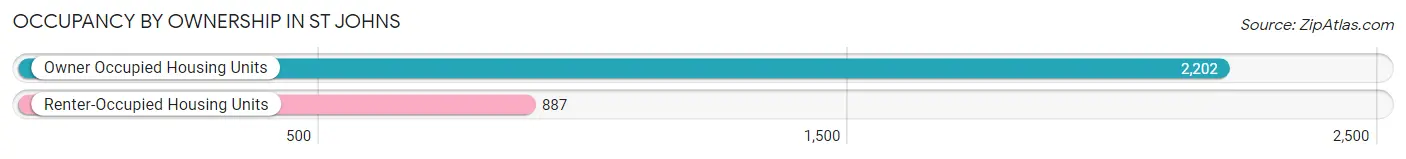
| Occupancy | # Housing Units | % Housing Units |
| Owner Occupied Housing Units | 2,202 | 71.3% |
| Renter-Occupied Housing Units | 887 | 28.7% |
| Total Occupied Housing Units | 3,089 | 100.0% |
Occupancy by Household Size in St Johns
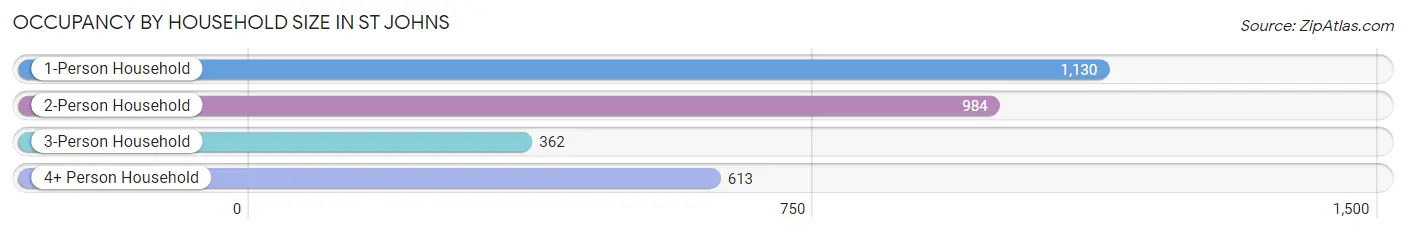
| Household Size | # Housing Units | % Housing Units |
| 1-Person Household | 1,130 | 36.6% |
| 2-Person Household | 984 | 31.9% |
| 3-Person Household | 362 | 11.7% |
| 4+ Person Household | 613 | 19.8% |
| Total Housing Units | 3,089 | 100.0% |
Occupancy by Ownership by Household Size in St Johns
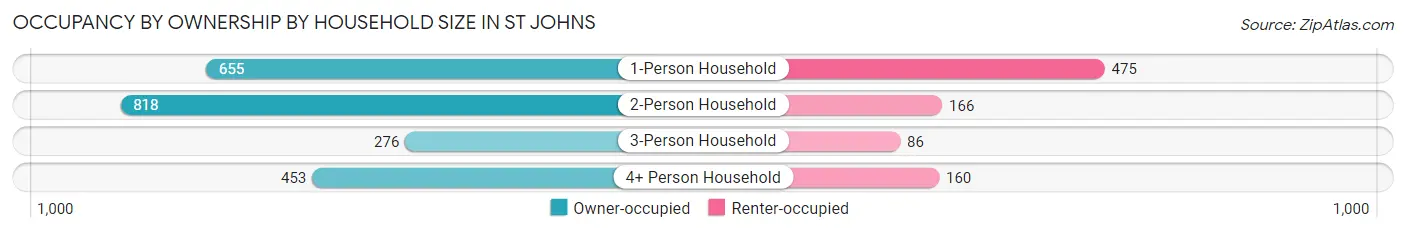
| Household Size | Owner-occupied | Renter-occupied |
| 1-Person Household | 655 (58.0%) | 475 (42.0%) |
| 2-Person Household | 818 (83.1%) | 166 (16.9%) |
| 3-Person Household | 276 (76.2%) | 86 (23.8%) |
| 4+ Person Household | 453 (73.9%) | 160 (26.1%) |
| Total Housing Units | 2,202 (71.3%) | 887 (28.7%) |
Occupancy by Educational Attainment in St Johns
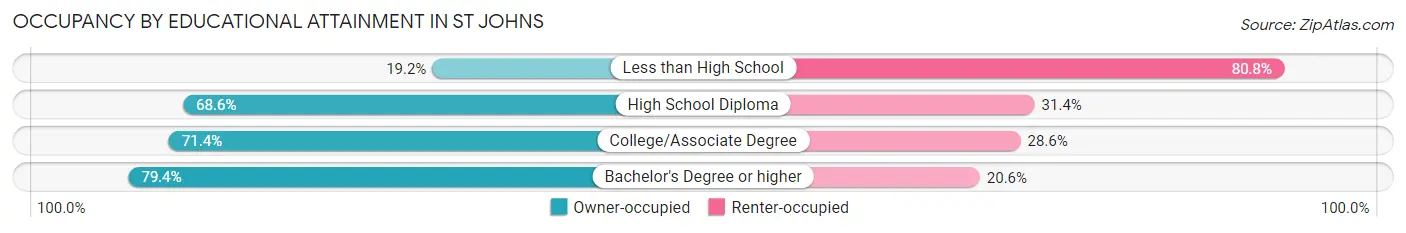
| Household Size | Owner-occupied | Renter-occupied |
| Less than High School | 19 (19.2%) | 80 (80.8%) |
| High School Diploma | 419 (68.6%) | 192 (31.4%) |
| College/Associate Degree | 1,115 (71.4%) | 447 (28.6%) |
| Bachelor's Degree or higher | 649 (79.4%) | 168 (20.6%) |
Occupancy by Age of Householder in St Johns
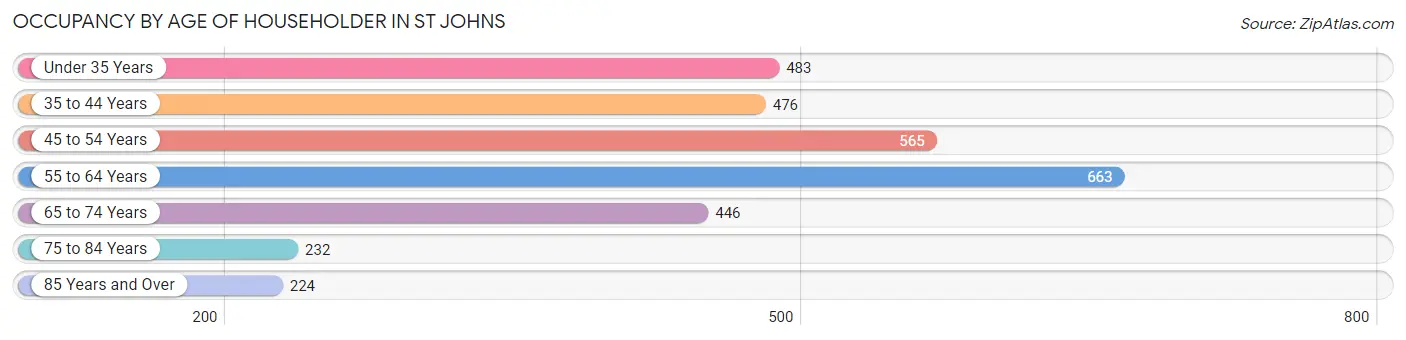
| Age Bracket | # Households | % Households |
| Under 35 Years | 483 | 15.6% |
| 35 to 44 Years | 476 | 15.4% |
| 45 to 54 Years | 565 | 18.3% |
| 55 to 64 Years | 663 | 21.5% |
| 65 to 74 Years | 446 | 14.4% |
| 75 to 84 Years | 232 | 7.5% |
| 85 Years and Over | 224 | 7.2% |
| Total | 3,089 | 100.0% |
Housing Finances in St Johns
Median Income by Occupancy in St Johns
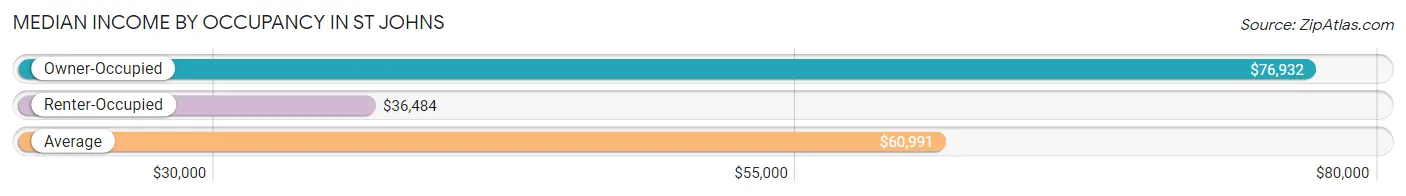
| Occupancy Type | # Households | Median Income |
| Owner-Occupied | 2,202 (71.3%) | $76,932 |
| Renter-Occupied | 887 (28.7%) | $36,484 |
| Average | 3,089 (100.0%) | $60,991 |
Occupancy by Householder Income Bracket in St Johns
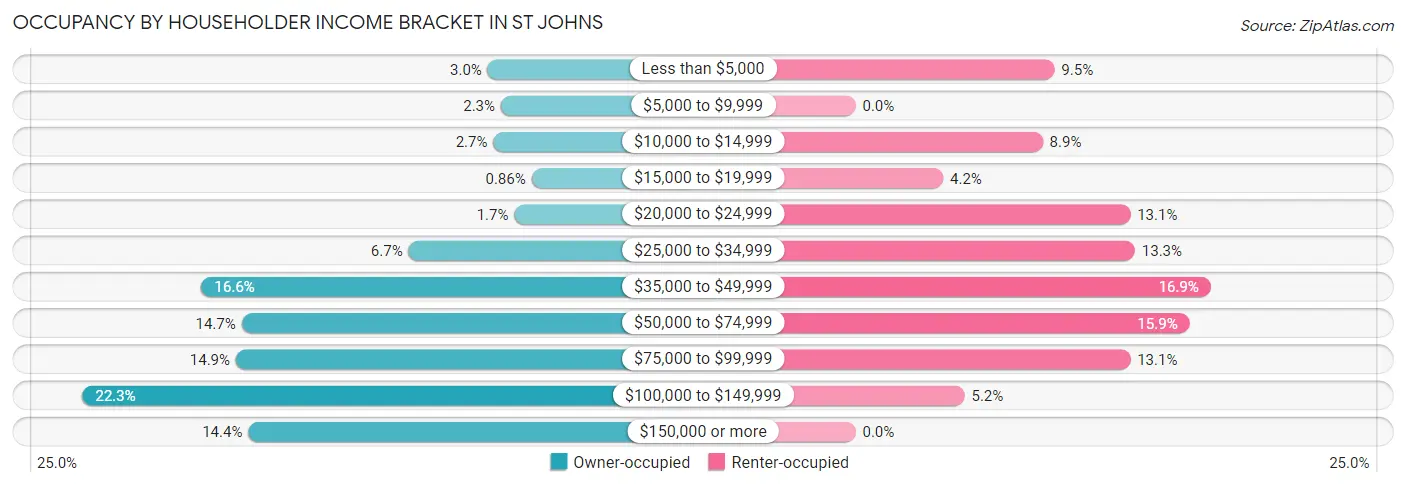
| Income Bracket | Owner-occupied | Renter-occupied |
| Less than $5,000 | 65 (2.9%) | 84 (9.5%) |
| $5,000 to $9,999 | 51 (2.3%) | 0 (0.0%) |
| $10,000 to $14,999 | 59 (2.7%) | 79 (8.9%) |
| $15,000 to $19,999 | 19 (0.9%) | 37 (4.2%) |
| $20,000 to $24,999 | 37 (1.7%) | 116 (13.1%) |
| $25,000 to $34,999 | 148 (6.7%) | 118 (13.3%) |
| $35,000 to $49,999 | 365 (16.6%) | 150 (16.9%) |
| $50,000 to $74,999 | 323 (14.7%) | 141 (15.9%) |
| $75,000 to $99,999 | 329 (14.9%) | 116 (13.1%) |
| $100,000 to $149,999 | 490 (22.3%) | 46 (5.2%) |
| $150,000 or more | 316 (14.3%) | 0 (0.0%) |
| Total | 2,202 (100.0%) | 887 (100.0%) |
Monthly Housing Cost Tiers in St Johns
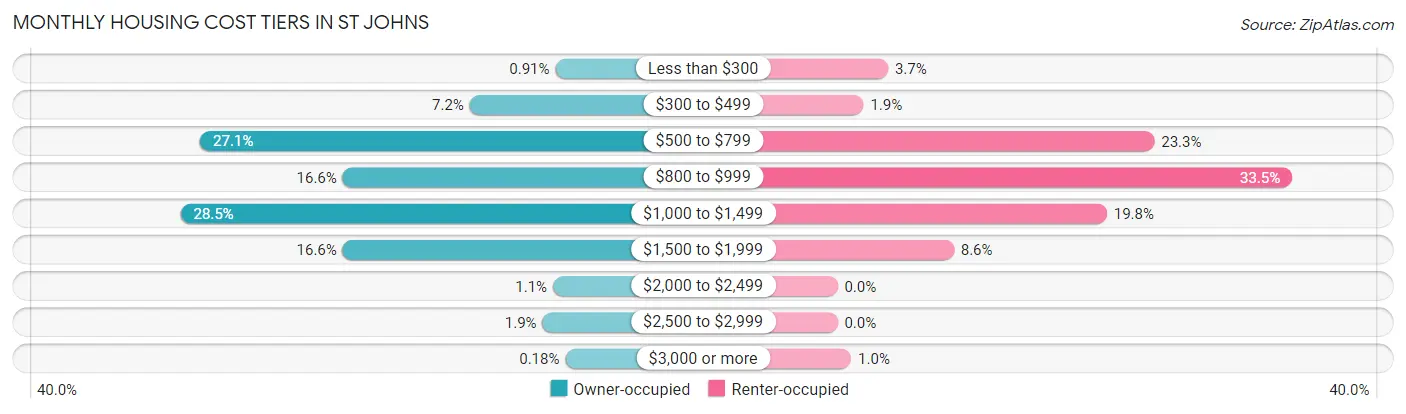
| Monthly Cost | Owner-occupied | Renter-occupied |
| Less than $300 | 20 (0.9%) | 33 (3.7%) |
| $300 to $499 | 159 (7.2%) | 17 (1.9%) |
| $500 to $799 | 596 (27.1%) | 207 (23.3%) |
| $800 to $999 | 365 (16.6%) | 297 (33.5%) |
| $1,000 to $1,499 | 628 (28.5%) | 176 (19.8%) |
| $1,500 to $1,999 | 365 (16.6%) | 76 (8.6%) |
| $2,000 to $2,499 | 24 (1.1%) | 0 (0.0%) |
| $2,500 to $2,999 | 41 (1.9%) | 0 (0.0%) |
| $3,000 or more | 4 (0.2%) | 9 (1.0%) |
| Total | 2,202 (100.0%) | 887 (100.0%) |
Physical Housing Characteristics in St Johns
Housing Structures in St Johns
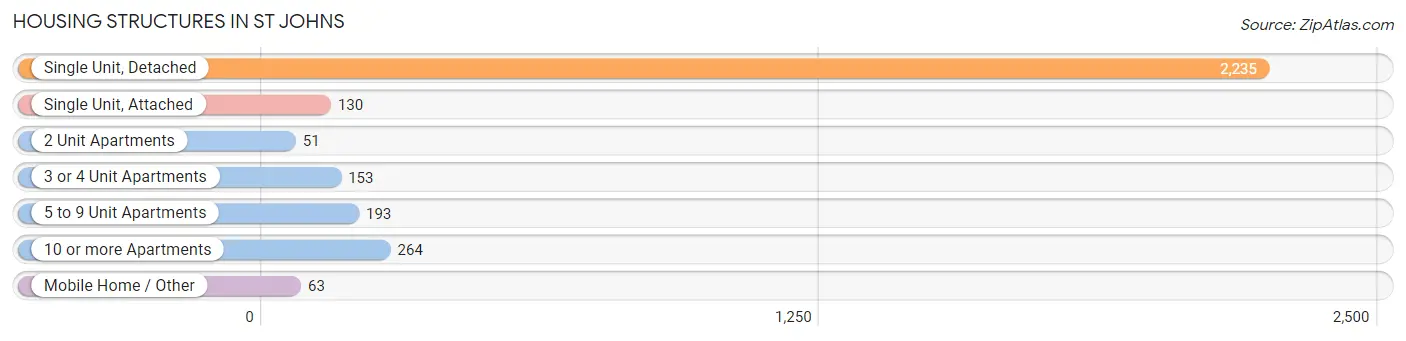
| Structure Type | # Housing Units | % Housing Units |
| Single Unit, Detached | 2,235 | 72.4% |
| Single Unit, Attached | 130 | 4.2% |
| 2 Unit Apartments | 51 | 1.7% |
| 3 or 4 Unit Apartments | 153 | 5.0% |
| 5 to 9 Unit Apartments | 193 | 6.2% |
| 10 or more Apartments | 264 | 8.6% |
| Mobile Home / Other | 63 | 2.0% |
| Total | 3,089 | 100.0% |
Housing Structures by Occupancy in St Johns
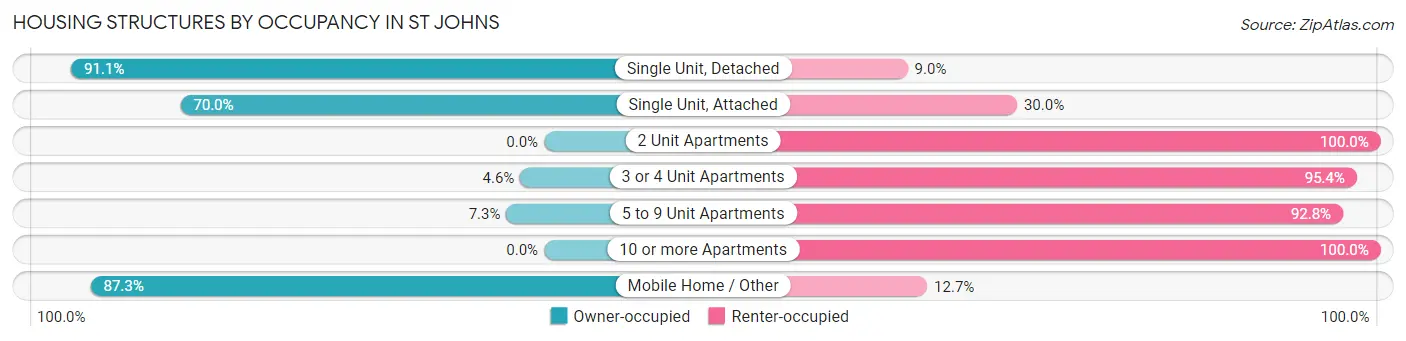
| Structure Type | Owner-occupied | Renter-occupied |
| Single Unit, Detached | 2,035 (91.0%) | 200 (8.9%) |
| Single Unit, Attached | 91 (70.0%) | 39 (30.0%) |
| 2 Unit Apartments | 0 (0.0%) | 51 (100.0%) |
| 3 or 4 Unit Apartments | 7 (4.6%) | 146 (95.4%) |
| 5 to 9 Unit Apartments | 14 (7.2%) | 179 (92.7%) |
| 10 or more Apartments | 0 (0.0%) | 264 (100.0%) |
| Mobile Home / Other | 55 (87.3%) | 8 (12.7%) |
| Total | 2,202 (71.3%) | 887 (28.7%) |
Housing Structures by Number of Rooms in St Johns
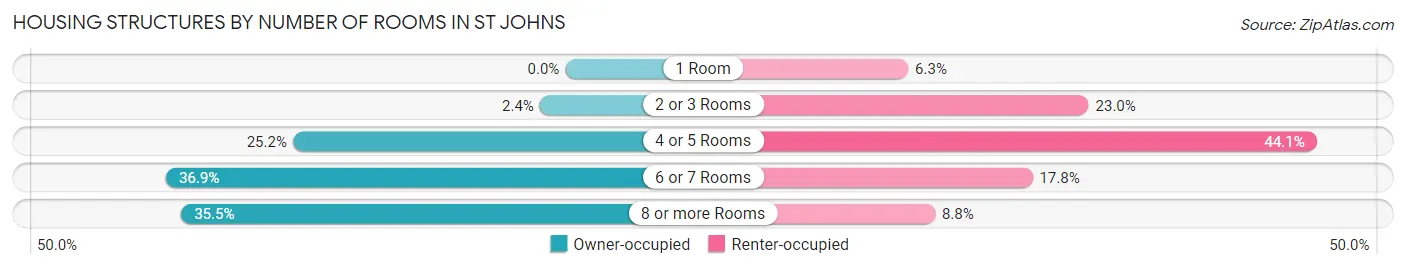
| Number of Rooms | Owner-occupied | Renter-occupied |
| 1 Room | 0 (0.0%) | 56 (6.3%) |
| 2 or 3 Rooms | 52 (2.4%) | 204 (23.0%) |
| 4 or 5 Rooms | 555 (25.2%) | 391 (44.1%) |
| 6 or 7 Rooms | 813 (36.9%) | 158 (17.8%) |
| 8 or more Rooms | 782 (35.5%) | 78 (8.8%) |
| Total | 2,202 (100.0%) | 887 (100.0%) |
Housing Structure by Heating Type in St Johns
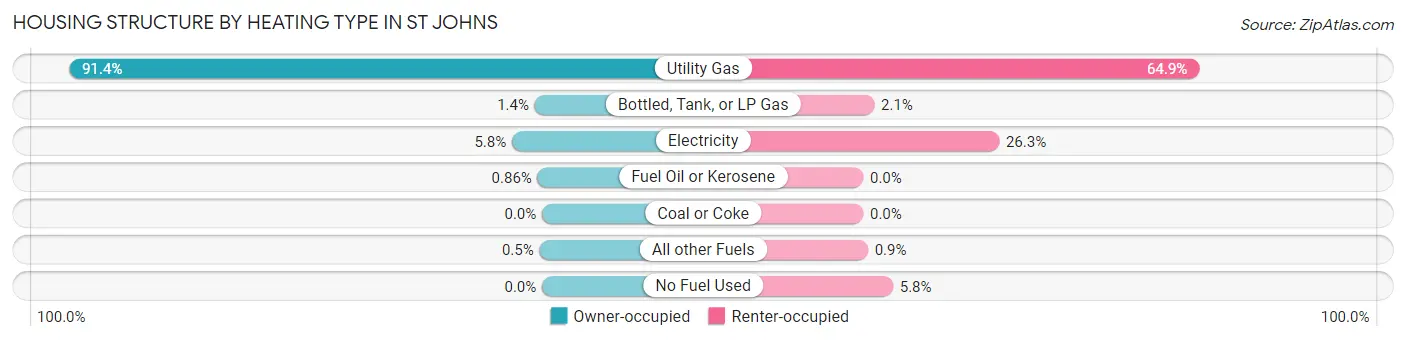
| Heating Type | Owner-occupied | Renter-occupied |
| Utility Gas | 2,013 (91.4%) | 576 (64.9%) |
| Bottled, Tank, or LP Gas | 31 (1.4%) | 19 (2.1%) |
| Electricity | 128 (5.8%) | 233 (26.3%) |
| Fuel Oil or Kerosene | 19 (0.9%) | 0 (0.0%) |
| Coal or Coke | 0 (0.0%) | 0 (0.0%) |
| All other Fuels | 11 (0.5%) | 8 (0.9%) |
| No Fuel Used | 0 (0.0%) | 51 (5.8%) |
| Total | 2,202 (100.0%) | 887 (100.0%) |
Household Vehicle Usage in St Johns
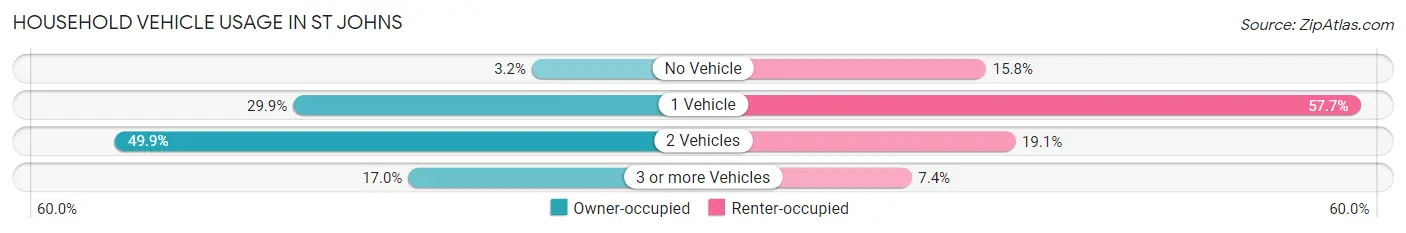
| Vehicles per Household | Owner-occupied | Renter-occupied |
| No Vehicle | 70 (3.2%) | 140 (15.8%) |
| 1 Vehicle | 659 (29.9%) | 512 (57.7%) |
| 2 Vehicles | 1,098 (49.9%) | 169 (19.1%) |
| 3 or more Vehicles | 375 (17.0%) | 66 (7.4%) |
| Total | 2,202 (100.0%) | 887 (100.0%) |
Real Estate & Mortgages in St Johns
Real Estate and Mortgage Overview in St Johns
| Characteristic | Without Mortgage | With Mortgage |
| Housing Units | 785 | 1,417 |
| Median Property Value | $183,100 | $149,600 |
| Median Household Income | $55,298 | $244 |
| Monthly Housing Costs | $630 | $4 |
| Real Estate Taxes | $2,797 | $24 |
Property Value by Mortgage Status in St Johns
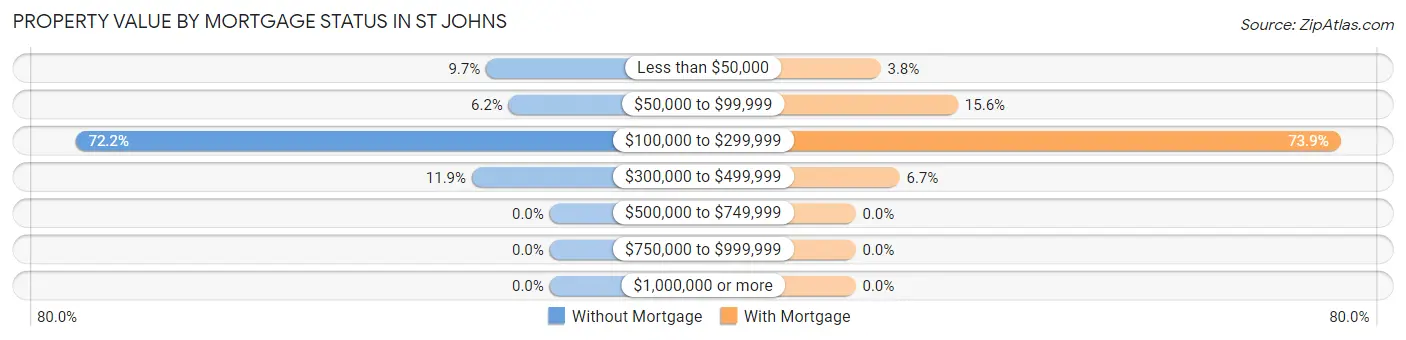
| Property Value | Without Mortgage | With Mortgage |
| Less than $50,000 | 76 (9.7%) | 54 (3.8%) |
| $50,000 to $99,999 | 49 (6.2%) | 221 (15.6%) |
| $100,000 to $299,999 | 567 (72.2%) | 1,047 (73.9%) |
| $300,000 to $499,999 | 93 (11.8%) | 95 (6.7%) |
| $500,000 to $749,999 | 0 (0.0%) | 0 (0.0%) |
| $750,000 to $999,999 | 0 (0.0%) | 0 (0.0%) |
| $1,000,000 or more | 0 (0.0%) | 0 (0.0%) |
| Total | 785 (100.0%) | 1,417 (100.0%) |
Household Income by Mortgage Status in St Johns
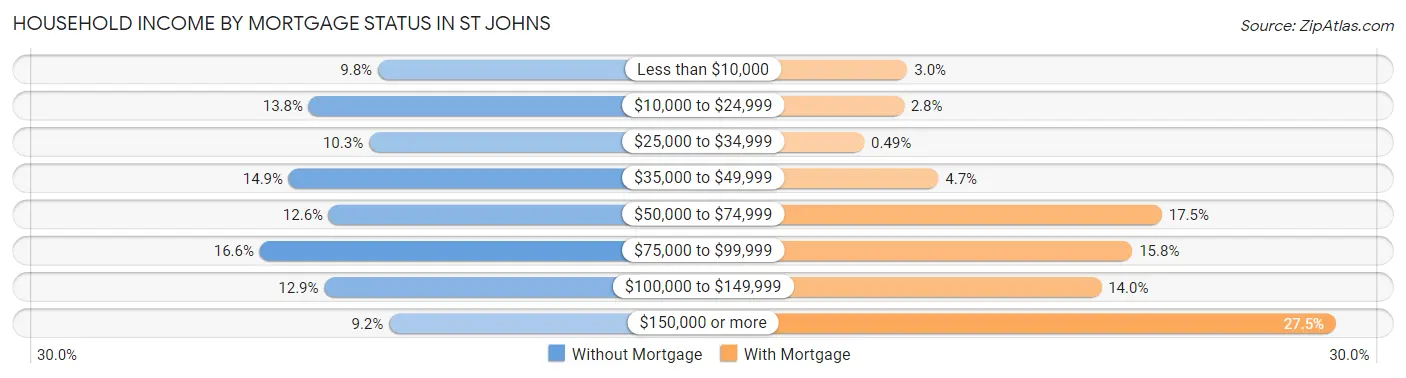
| Household Income | Without Mortgage | With Mortgage |
| Less than $10,000 | 77 (9.8%) | 42 (3.0%) |
| $10,000 to $24,999 | 108 (13.8%) | 39 (2.8%) |
| $25,000 to $34,999 | 81 (10.3%) | 7 (0.5%) |
| $35,000 to $49,999 | 117 (14.9%) | 67 (4.7%) |
| $50,000 to $74,999 | 99 (12.6%) | 248 (17.5%) |
| $75,000 to $99,999 | 130 (16.6%) | 224 (15.8%) |
| $100,000 to $149,999 | 101 (12.9%) | 199 (14.0%) |
| $150,000 or more | 72 (9.2%) | 389 (27.5%) |
| Total | 785 (100.0%) | 1,417 (100.0%) |
Property Value to Household Income Ratio in St Johns
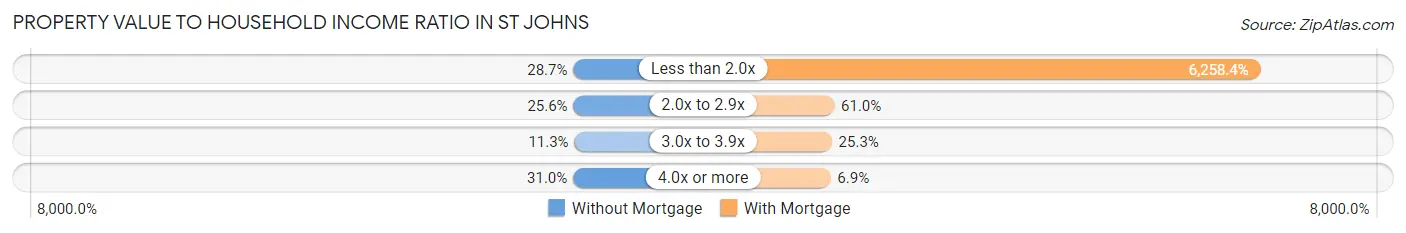
| Value-to-Income Ratio | Without Mortgage | With Mortgage |
| Less than 2.0x | 225 (28.7%) | 88,682 (6,258.4%) |
| 2.0x to 2.9x | 201 (25.6%) | 864 (61.0%) |
| 3.0x to 3.9x | 89 (11.3%) | 358 (25.3%) |
| 4.0x or more | 243 (31.0%) | 97 (6.9%) |
| Total | 785 (100.0%) | 1,417 (100.0%) |
Real Estate Taxes by Mortgage Status in St Johns
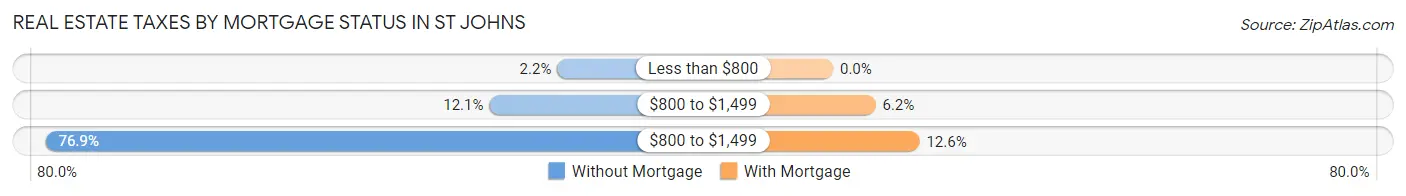
| Property Taxes | Without Mortgage | With Mortgage |
| Less than $800 | 17 (2.2%) | 0 (0.0%) |
| $800 to $1,499 | 95 (12.1%) | 88 (6.2%) |
| $800 to $1,499 | 604 (76.9%) | 179 (12.6%) |
| Total | 785 (100.0%) | 1,417 (100.0%) |
Health & Disability in St Johns
Health Insurance Coverage by Age in St Johns
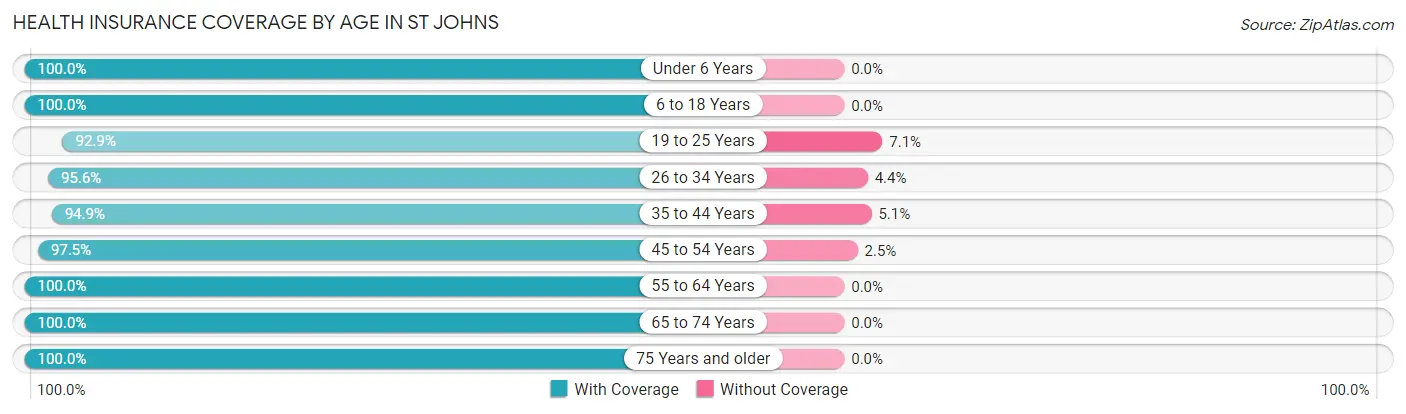
| Age Bracket | With Coverage | Without Coverage |
| Under 6 Years | 575 (100.0%) | 0 (0.0%) |
| 6 to 18 Years | 1,443 (100.0%) | 0 (0.0%) |
| 19 to 25 Years | 380 (92.9%) | 29 (7.1%) |
| 26 to 34 Years | 812 (95.6%) | 37 (4.4%) |
| 35 to 44 Years | 676 (94.9%) | 36 (5.1%) |
| 45 to 54 Years | 866 (97.5%) | 22 (2.5%) |
| 55 to 64 Years | 1,109 (100.0%) | 0 (0.0%) |
| 65 to 74 Years | 706 (100.0%) | 0 (0.0%) |
| 75 Years and older | 667 (100.0%) | 0 (0.0%) |
| Total | 7,234 (98.3%) | 124 (1.7%) |
Health Insurance Coverage by Citizenship Status in St Johns
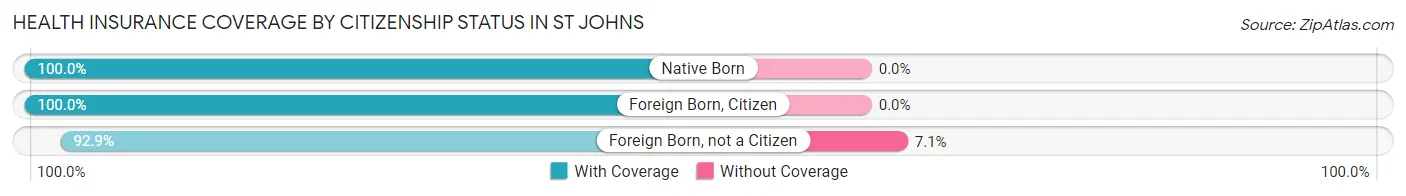
| Citizenship Status | With Coverage | Without Coverage |
| Native Born | 575 (100.0%) | 0 (0.0%) |
| Foreign Born, Citizen | 1,443 (100.0%) | 0 (0.0%) |
| Foreign Born, not a Citizen | 380 (92.9%) | 29 (7.1%) |
Health Insurance Coverage by Household Income in St Johns
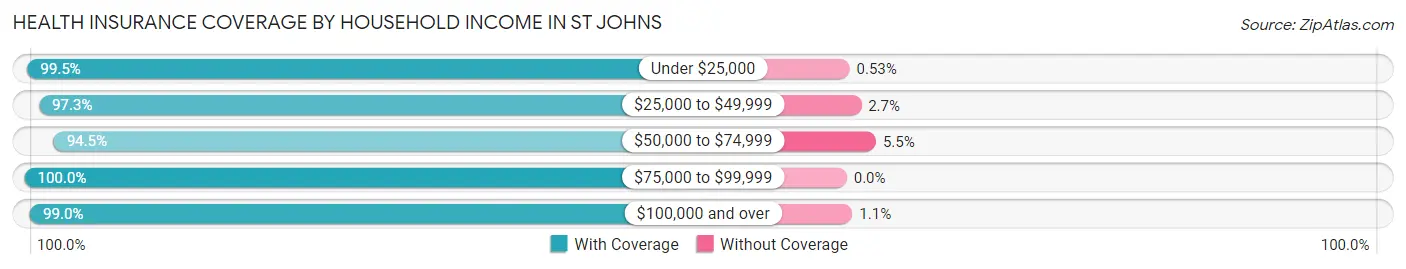
| Household Income | With Coverage | Without Coverage |
| Under $25,000 | 938 (99.5%) | 5 (0.5%) |
| $25,000 to $49,999 | 1,335 (97.3%) | 37 (2.7%) |
| $50,000 to $74,999 | 898 (94.5%) | 52 (5.5%) |
| $75,000 to $99,999 | 1,236 (100.0%) | 0 (0.0%) |
| $100,000 and over | 2,819 (99.0%) | 30 (1.1%) |
Public vs Private Health Insurance Coverage by Age in St Johns
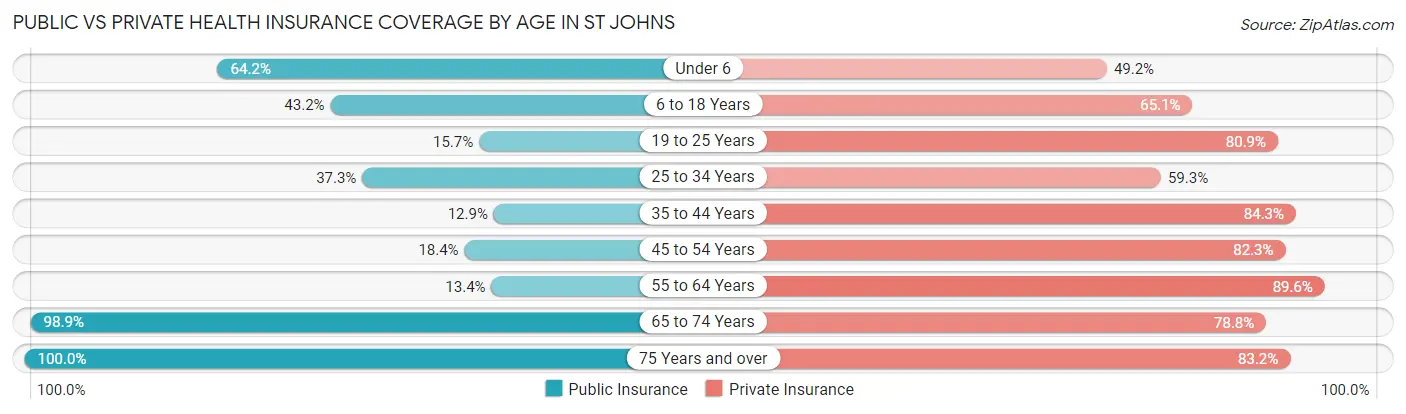
| Age Bracket | Public Insurance | Private Insurance |
| Under 6 | 369 (64.2%) | 283 (49.2%) |
| 6 to 18 Years | 624 (43.2%) | 939 (65.1%) |
| 19 to 25 Years | 64 (15.7%) | 331 (80.9%) |
| 25 to 34 Years | 317 (37.3%) | 503 (59.3%) |
| 35 to 44 Years | 92 (12.9%) | 600 (84.3%) |
| 45 to 54 Years | 163 (18.4%) | 731 (82.3%) |
| 55 to 64 Years | 148 (13.4%) | 994 (89.6%) |
| 65 to 74 Years | 698 (98.9%) | 556 (78.7%) |
| 75 Years and over | 667 (100.0%) | 555 (83.2%) |
| Total | 3,142 (42.7%) | 5,492 (74.6%) |
Disability Status by Sex by Age in St Johns
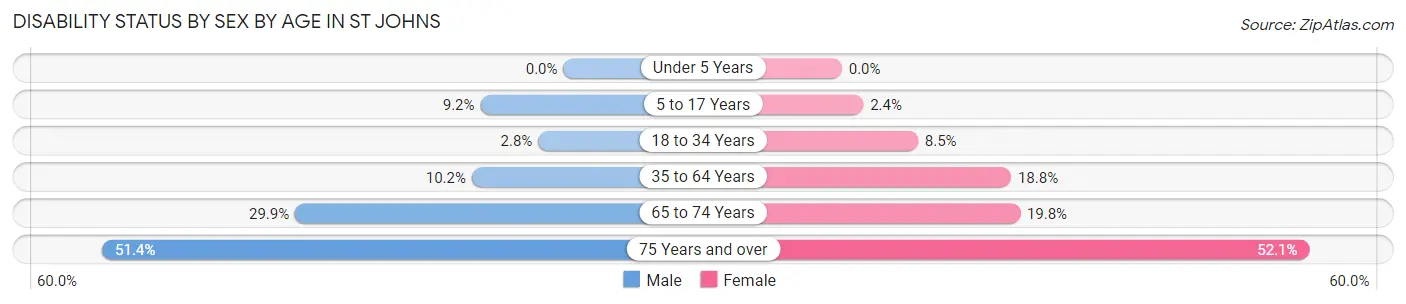
| Age Bracket | Male | Female |
| Under 5 Years | 0 (0.0%) | 0 (0.0%) |
| 5 to 17 Years | 80 (9.2%) | 15 (2.4%) |
| 18 to 34 Years | 20 (2.8%) | 53 (8.5%) |
| 35 to 64 Years | 122 (10.2%) | 285 (18.8%) |
| 65 to 74 Years | 98 (29.9%) | 75 (19.8%) |
| 75 Years and over | 94 (51.4%) | 252 (52.1%) |
Disability Class by Sex by Age in St Johns
Disability Class: Hearing Difficulty
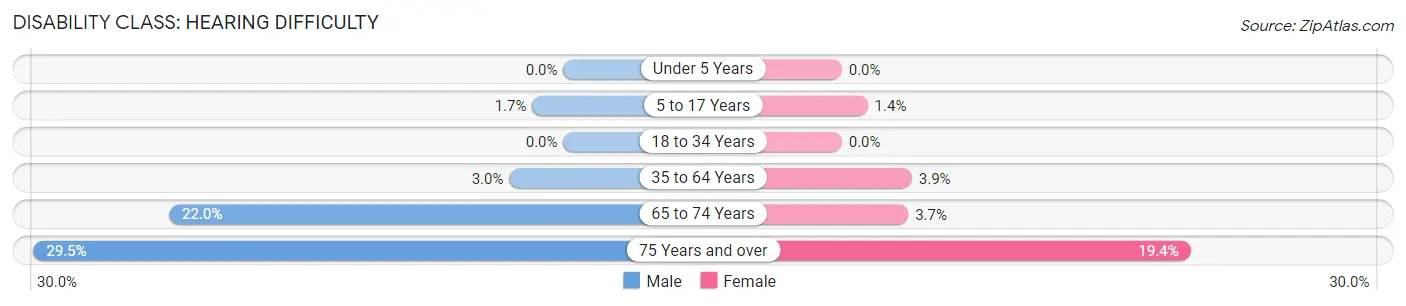
| Age Bracket | Male | Female |
| Under 5 Years | 0 (0.0%) | 0 (0.0%) |
| 5 to 17 Years | 15 (1.7%) | 9 (1.4%) |
| 18 to 34 Years | 0 (0.0%) | 0 (0.0%) |
| 35 to 64 Years | 36 (3.0%) | 59 (3.9%) |
| 65 to 74 Years | 72 (22.0%) | 14 (3.7%) |
| 75 Years and over | 54 (29.5%) | 94 (19.4%) |
Disability Class: Vision Difficulty
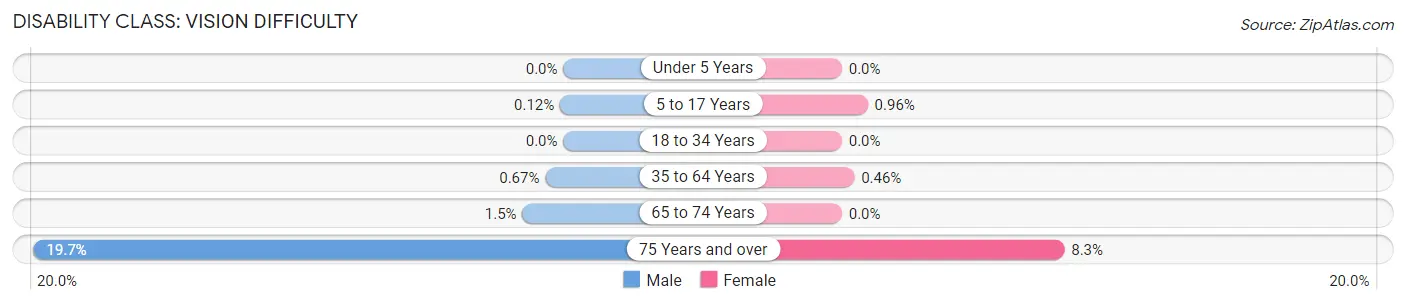
| Age Bracket | Male | Female |
| Under 5 Years | 0 (0.0%) | 0 (0.0%) |
| 5 to 17 Years | 1 (0.1%) | 6 (1.0%) |
| 18 to 34 Years | 0 (0.0%) | 0 (0.0%) |
| 35 to 64 Years | 8 (0.7%) | 7 (0.5%) |
| 65 to 74 Years | 5 (1.5%) | 0 (0.0%) |
| 75 Years and over | 36 (19.7%) | 40 (8.3%) |
Disability Class: Cognitive Difficulty
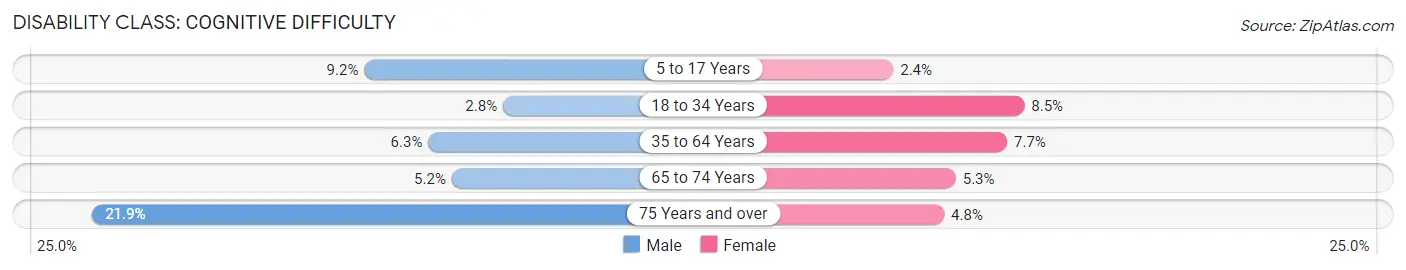
| Age Bracket | Male | Female |
| 5 to 17 Years | 80 (9.2%) | 15 (2.4%) |
| 18 to 34 Years | 20 (2.8%) | 53 (8.5%) |
| 35 to 64 Years | 75 (6.3%) | 116 (7.7%) |
| 65 to 74 Years | 17 (5.2%) | 20 (5.3%) |
| 75 Years and over | 40 (21.9%) | 23 (4.8%) |
Disability Class: Ambulatory Difficulty
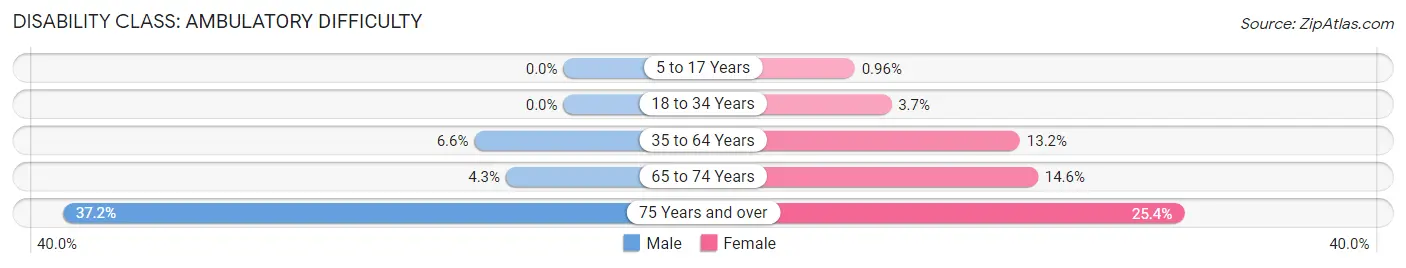
| Age Bracket | Male | Female |
| 5 to 17 Years | 0 (0.0%) | 6 (1.0%) |
| 18 to 34 Years | 0 (0.0%) | 23 (3.7%) |
| 35 to 64 Years | 79 (6.6%) | 200 (13.2%) |
| 65 to 74 Years | 14 (4.3%) | 55 (14.5%) |
| 75 Years and over | 68 (37.2%) | 123 (25.4%) |
Disability Class: Self-Care Difficulty
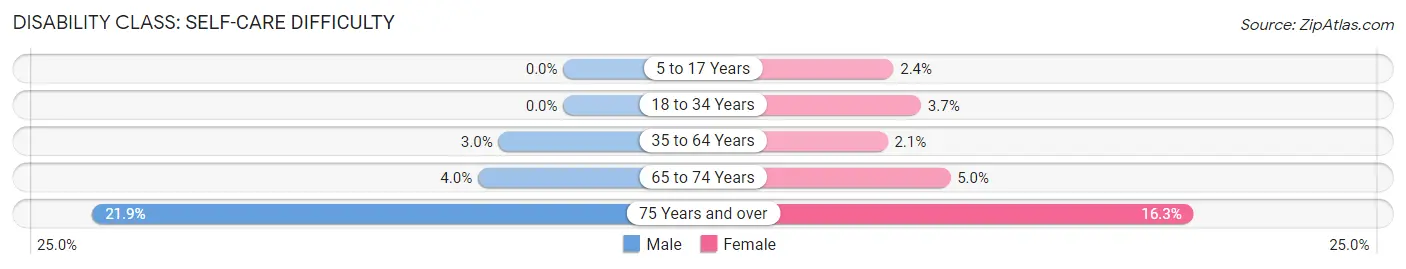
| Age Bracket | Male | Female |
| 5 to 17 Years | 0 (0.0%) | 15 (2.4%) |
| 18 to 34 Years | 0 (0.0%) | 23 (3.7%) |
| 35 to 64 Years | 36 (3.0%) | 32 (2.1%) |
| 65 to 74 Years | 13 (4.0%) | 19 (5.0%) |
| 75 Years and over | 40 (21.9%) | 79 (16.3%) |
Technology Access in St Johns
Computing Device Access in St Johns
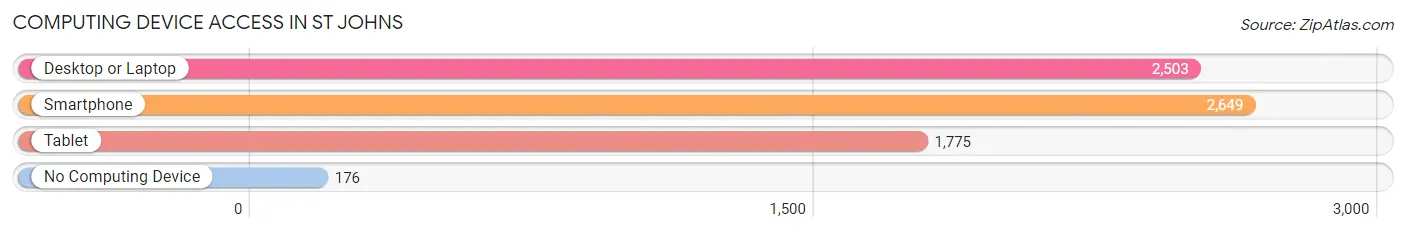
| Device Type | # Households | % Households |
| Desktop or Laptop | 2,503 | 81.0% |
| Smartphone | 2,649 | 85.8% |
| Tablet | 1,775 | 57.5% |
| No Computing Device | 176 | 5.7% |
| Total | 3,089 | 100.0% |
Internet Access in St Johns
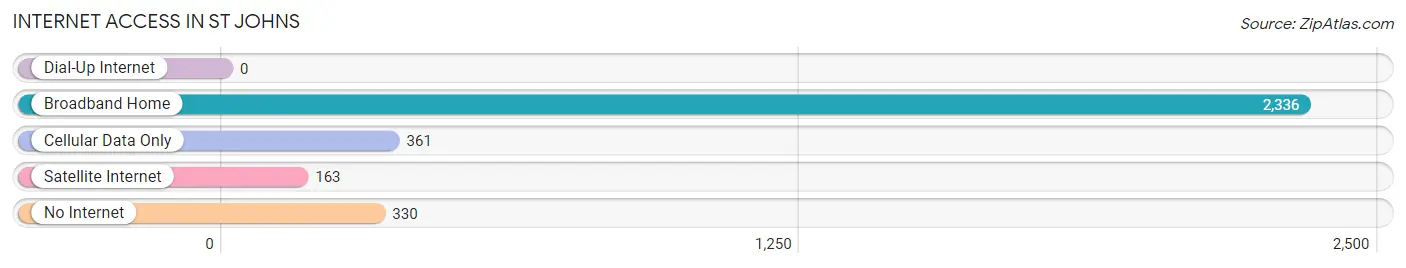
| Internet Type | # Households | % Households |
| Dial-Up Internet | 0 | 0.0% |
| Broadband Home | 2,336 | 75.6% |
| Cellular Data Only | 361 | 11.7% |
| Satellite Internet | 163 | 5.3% |
| No Internet | 330 | 10.7% |
| Total | 3,089 | 100.0% |
St Johns Summary
St. Johns is a city located in Clinton County, Michigan, United States. The population was 7,841 at the 2010 census. It is the county seat of Clinton County. The city is located within DeWitt Charter Township, but is politically independent.
History
The area that is now St. Johns was first settled in 1836 by a group of settlers from New York. The settlement was originally known as "Newburg" and was located on the banks of the Maple River. In 1837, the settlement was renamed "St. Johns" after the nearby St. Johns Episcopal Church.
In 1838, the first post office was established in St. Johns. The same year, the first school was built. In 1839, the first bridge was built across the Maple River.
In 1841, St. Johns was incorporated as a village. The same year, the first newspaper, the St. Johns Herald, was established.
In 1845, the first bank was established in St. Johns. In 1846, the first railroad line was built through St. Johns.
In 1848, St. Johns was incorporated as a city. The same year, the first fire department was established.
In 1851, the first public library was established in St. Johns. In 1853, the first hospital was established.
In 1854, the first telegraph line was established in St. Johns. In 1855, the first telephone line was established.
In 1856, the first gas street lights were installed in St. Johns. In 1857, the first water works were established.
In 1858, the first public park was established in St. Johns. In 1859, the first electric street lights were installed.
In 1860, the first public school was established in St. Johns. In 1861, the first public library building was constructed.
In 1864, the first public high school was established in St. Johns. In 1867, the first public library building was completed.
In 1868, the first public library building was dedicated. In 1869, the first public library building was expanded.
In 1870, the first public library building was remodeled. In 1871, the first public library building was enlarged.
In 1872, the first public library building was renovated. In 1873, the first public library building was destroyed by fire.
In 1874, the first public library building was rebuilt. In 1875, the first public library building was again destroyed by fire.
In 1876, the first public library building was again rebuilt. In 1877, the first public library building was again destroyed by fire.
In 1878, the first public library building was again rebuilt. In 1879, the first public library building was again destroyed by fire.
In 1880, the first public library building was again rebuilt. In 1881, the first public library building was again destroyed by fire.
In 1882, the first public library building was again rebuilt. In 1883, the first public library building was again destroyed by fire.
In 1884, the first public library building was again rebuilt. In 1885, the first public library building was again destroyed by fire.
In 1886, the first public library building was again rebuilt. In 1887, the first public library building was again destroyed by fire.
In 1888, the first public library building was again rebuilt. In 1889, the first public library building was again destroyed by fire.
In 1890, the first public library building was again rebuilt. In 1891, the first public library building was again destroyed by fire.
In 1892, the first public library building was again rebuilt. In 1893, the first public library building was again destroyed by fire.
In 1894, the first public library building was again rebuilt. In 1895, the first public library building was again destroyed by fire.
In 1896, the first public library building was again rebuilt. In 1897, the first public library building was again destroyed by fire.
In 1898, the first public library building was again rebuilt. In 1899, the first public library building was again destroyed by fire.
In 1900, the first public library building was again rebuilt. In 1901, the first public library building was again destroyed by fire.
In 1902, the first public library building was again rebuilt. In 1903, the first public library building was again destroyed by fire.
In 1904, the first public library building was again rebuilt. In 1905, the first public library building was again destroyed by fire.
In 1906, the first public library building was again rebuilt. In 1907, the first public library building was again destroyed by fire.
In 1908, the first public library building was again rebuilt. In 1909, the first public library building was again destroyed by fire.
In 1910, the first public library building was again rebuilt. In 1911, the first public library building was again destroyed by fire.
In 1912, the first public library building was again rebuilt. In 1913, the first public library building was again destroyed by fire.
In 1914, the first public library building was again rebuilt. In 1915, the first public library building was again destroyed by fire.
In 1916, the first public library building was again rebuilt. In 1917, the first public library building was again destroyed by fire.
In 1918, the first public library building was again rebuilt. In 1919, the first public library building was again destroyed by fire.
In 1920, the first public library building was again rebuilt. In 1921, the first public library building was again destroyed by fire.
In 1922, the first public library building was again rebuilt. In 1923, the first public library building was again destroyed by fire.
In 1924, the first public library building was again rebuilt. In 1925, the first public library building was again destroyed by fire.
In 1926, the first public library building was again rebuilt. In 1927, the first public library building was again destroyed by fire.
In 1928, the first public library building was again rebuilt. In 1929, the first public library building was again destroyed by fire.
In 1930, the first public library building was again rebuilt. In 1931, the first public library building was again destroyed by fire.
In 1932, the first public library building was again rebuilt. In 1933, the first public library building was again destroyed by fire.
In 1934, the first public library building was again rebuilt. In 1935, the first public library building was again destroyed by fire.
In 1936, the first public library building was again rebuilt. In 1937, the first public library building was again destroyed by fire.
In 1938, the first public library building was again rebuilt. In 1939, the first public library building was again destroyed by fire.
In 1940, the first public library building was again rebuilt. In 1941, the first public library building was again destroyed by fire.
In 1942, the first public library building was again rebuilt. In 1943, the first public library building was again destroyed by fire.
In 1944, the first public library building was again rebuilt. In 1945, the first public library building was again destroyed by fire.
In 1946, the first public library building was again rebuilt. In 1947, the first public library building was again destroyed by fire.
In 1948, the first public library building was again rebuilt. In 1949, the first public library building was again destroyed by fire.
In 1950, the first public library building was again rebuilt. In 1951, the first public library building was again destroyed by fire.
In 1952, the first public library building was again rebuilt. In 1953, the first public library building was again destroyed by fire.
In 1954, the first public library building was again rebuilt. In 1955, the first public library building was again destroyed by fire.
In 1956, the first public library building was again rebuilt. In 1957, the first public library building was again destroyed by fire.
In 1958, the first public library building was again rebuilt. In 1959, the first public library building was again destroyed by fire.
In 1960, the first public library building was again rebuilt. In 1961, the first public library building was again destroyed by fire.
In 1962, the first public library building was again rebuilt. In 1963, the first public library building was again destroyed by fire.
In 1964, the first public library building was again rebuilt. In 1965, the first public library building was again destroyed by fire.
In 1966, the first public library building was again rebuilt. In 1967, the first public library building was again destroyed by fire.
In 1968, the first public library building was again rebuilt. In 1969, the first public library building was again destroyed by fire.
In 1970, the first public library building was again rebuilt. In 1971, the first public library building was again destroyed by fire.
In 1972, the first public library building was again rebuilt. In 1973, the first public library building was again destroyed by fire.
In 1974, the first public library building was again rebuilt. In 1975, the first public library building was again destroyed by fire.
In 1976, the first public library building was again rebuilt. In 1977, the first public library building was again destroyed by fire.
In 1978, the first public library building was again rebuilt. In 1979, the first public library building was again destroyed by fire.
In 1980, the first public library building was again rebuilt. In 1981, the first public library building was again destroyed by fire.
In 1982, the first public library building was again rebuilt. In 1983, the first public library building was again destroyed by fire.
In 1984, the first public library building was again rebuilt. In 1985, the first public library building was again destroyed by fire.
In 1986, the first public library building was again rebuilt. In 1987, the first public library building was again destroyed by fire.
In 1988, the first public library building was again rebuilt. In 1989, the first public library building was again destroyed by fire.
In 1990, the first public library building was again rebuilt. In 1991, the first public library building was again destroyed by fire.
In 1992, the first public library building was again rebuilt. In 1993, the first public library building was again destroyed by fire.
In 1994, the first public library building was again rebuilt. In 1995, the first public library building was again destroyed by fire.
In 1996, the first public library building was again rebuilt. In 1997, the first public library building was again destroyed by fire.
In 1998, the first public library building was again rebuilt. In 1999, the first public library building was again destroyed by fire.
In 2000 the first public library building was again rebuilt
Geography
St. Johns is located at 42°54′N 84°30′W (42.9000, -84.5000). According to the United States Census Bureau, the city has a total area of 4.50 square miles (11.67 km2), of which 4.48 square miles (11.62 km2) is land and 0.02 square miles (0.05 km2) is water.
Economy
St. Johns is home to several businesses, including a variety of manufacturing, retail, and service businesses. The city is also home to several large employers, including the St. Johns Public Schools, the Clinton County government, and the St. Johns Community Hospital.
Demographics
As of the census of 2010, there were 7,841 people, 3,093 households, and 2,072 families residing in the city. The population density was 1,744.2 inhabitants per square mile (673.3/km2). There were 3,323 housing units at an average density of 741.2 per square mile (286.2/km2). The racial makeup of the city was 95.2% White, 0.7% African American, 0.4% Native American, 0.7% Asian, 0.1% Pacific Islander, 1.3% from other races, and 1.6% from two or more races. Hispanic or Latino of any race were 4.2% of the population.
There were 3,093 households of which 33.2% had children under the age of 18 living with them, 49.2% were married couples living together, 13.2% had a female householder with no husband present, 5.2% had a male householder with no wife present, and 32.4% were non-families. 27.2% of all households were made up of individuals and 11.3% had someone living alone who was 65 years of age or older. The average household size was 2.50 and the average family size was 3.02.
The median age in the city was 37.7 years. 25.7% of residents were under the age of 18; 8.2% were between the ages of 18 and 24; 25.3% were from 25 to 44; 25.7% were from 45 to 64; and 14.9% were 65 years of age or older. The gender makeup of the city was 48.2% male and 51.8% female.
In 2000, the median income for a household in the city was $41,945, and the median income for a family was $50,945. Males had a median income of $37,945 versus $25,945 for females. The per capita income for the city was $19,945. About 5.2% of families and 7.2% of the population were below the poverty line, including 8.2% of those under age 18 and 8.2% of those age 65 or over.
Common Questions
What is Per Capita Income in St Johns?
Per Capita income in St Johns is $32,726.
What is the Median Family Income in St Johns?
Median Family Income in St Johns is $86,686.
What is the Median Household income in St Johns?
Median Household Income in St Johns is $60,991.
What is Income or Wage Gap in St Johns?
Income or Wage Gap in St Johns is 33.5%.
Women in St Johns earn 66.5 cents for every dollar earned by a man.
What is Inequality or Gini Index in St Johns?
Inequality or Gini Index in St Johns is 0.43.
What is the Total Population of St Johns?
Total Population of St Johns is 7,711.
What is the Total Male Population of St Johns?
Total Male Population of St Johns is 3,748.
What is the Total Female Population of St Johns?
Total Female Population of St Johns is 3,963.
What is the Ratio of Males per 100 Females in St Johns?
There are 94.57 Males per 100 Females in St Johns.
What is the Ratio of Females per 100 Males in St Johns?
There are 105.74 Females per 100 Males in St Johns.
What is the Median Population Age in St Johns?
Median Population Age in St Johns is 41.3 Years.
What is the Average Family Size in St Johns
Average Family Size in St Johns is 3.1 People.
What is the Average Household Size in St Johns
Average Household Size in St Johns is 2.4 People.
How Large is the Labor Force in St Johns?
There are 3,751 People in the Labor Forcein in St Johns.
What is the Percentage of People in the Labor Force in St Johns?
62.2% of People are in the Labor Force in St Johns.
What is the Unemployment Rate in St Johns?
Unemployment Rate in St Johns is 2.7%.