Whitmore Lake, MI Map & Demographics
Whitmore Lake Map
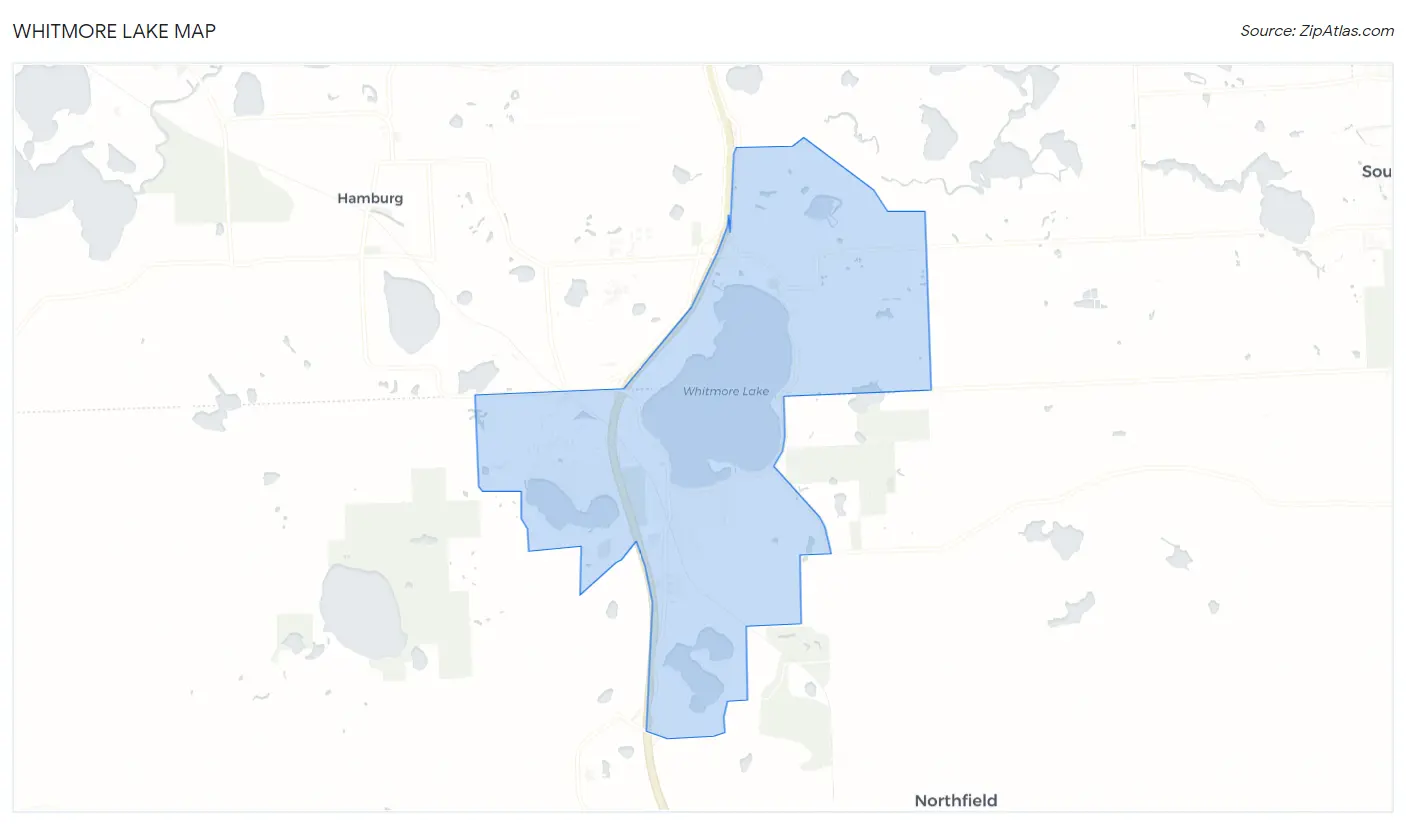
Whitmore Lake Overview
$49,698
PER CAPITA INCOME
$106,353
AVG FAMILY INCOME
$76,653
AVG HOUSEHOLD INCOME
32.7%
WAGE / INCOME GAP [ % ]
67.3¢/ $1
WAGE / INCOME GAP [ $ ]
0.44
INEQUALITY / GINI INDEX
7,911
TOTAL POPULATION
4,175
MALE POPULATION
3,736
FEMALE POPULATION
111.75
MALES / 100 FEMALES
89.49
FEMALES / 100 MALES
37.4
MEDIAN AGE
3.0
AVG FAMILY SIZE
2.1
AVG HOUSEHOLD SIZE
4,561
LABOR FORCE [ PEOPLE ]
69.4%
PERCENT IN LABOR FORCE
2.6%
UNEMPLOYMENT RATE
Whitmore Lake Zip Codes
Whitmore Lake Area Codes
Income in Whitmore Lake
Income Overview in Whitmore Lake
Per Capita Income in Whitmore Lake is $49,698, while median incomes of families and households are $106,353 and $76,653 respectively.
| Characteristic | Number | Measure |
| Per Capita Income | 7,911 | $49,698 |
| Median Family Income | 1,865 | $106,353 |
| Mean Family Income | 1,865 | $138,412 |
| Median Household Income | 3,618 | $76,653 |
| Mean Household Income | 3,618 | $100,280 |
| Income Deficit | 1,865 | $0 |
| Wage / Income Gap (%) | 7,911 | 32.67% |
| Wage / Income Gap ($) | 7,911 | 67.33¢ per $1 |
| Gini / Inequality Index | 7,911 | 0.44 |
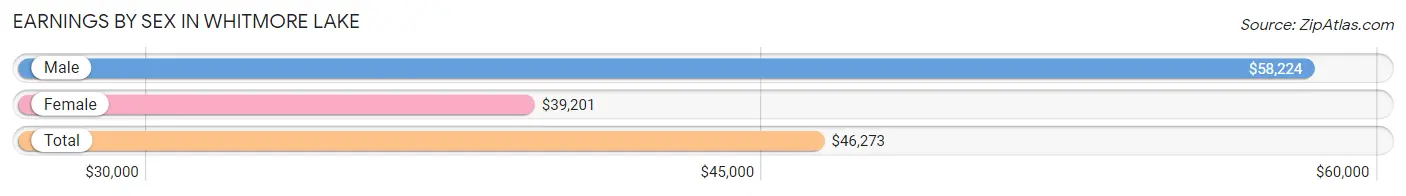
Earnings by Sex in Whitmore Lake
Average Earnings in Whitmore Lake are $46,273, $58,224 for men and $39,201 for women, a difference of 32.7%.
| Sex | Number | Average Earnings |
| Male | 2,815 (56.4%) | $58,224 |
| Female | 2,175 (43.6%) | $39,201 |
| Total | 4,990 (100.0%) | $46,273 |
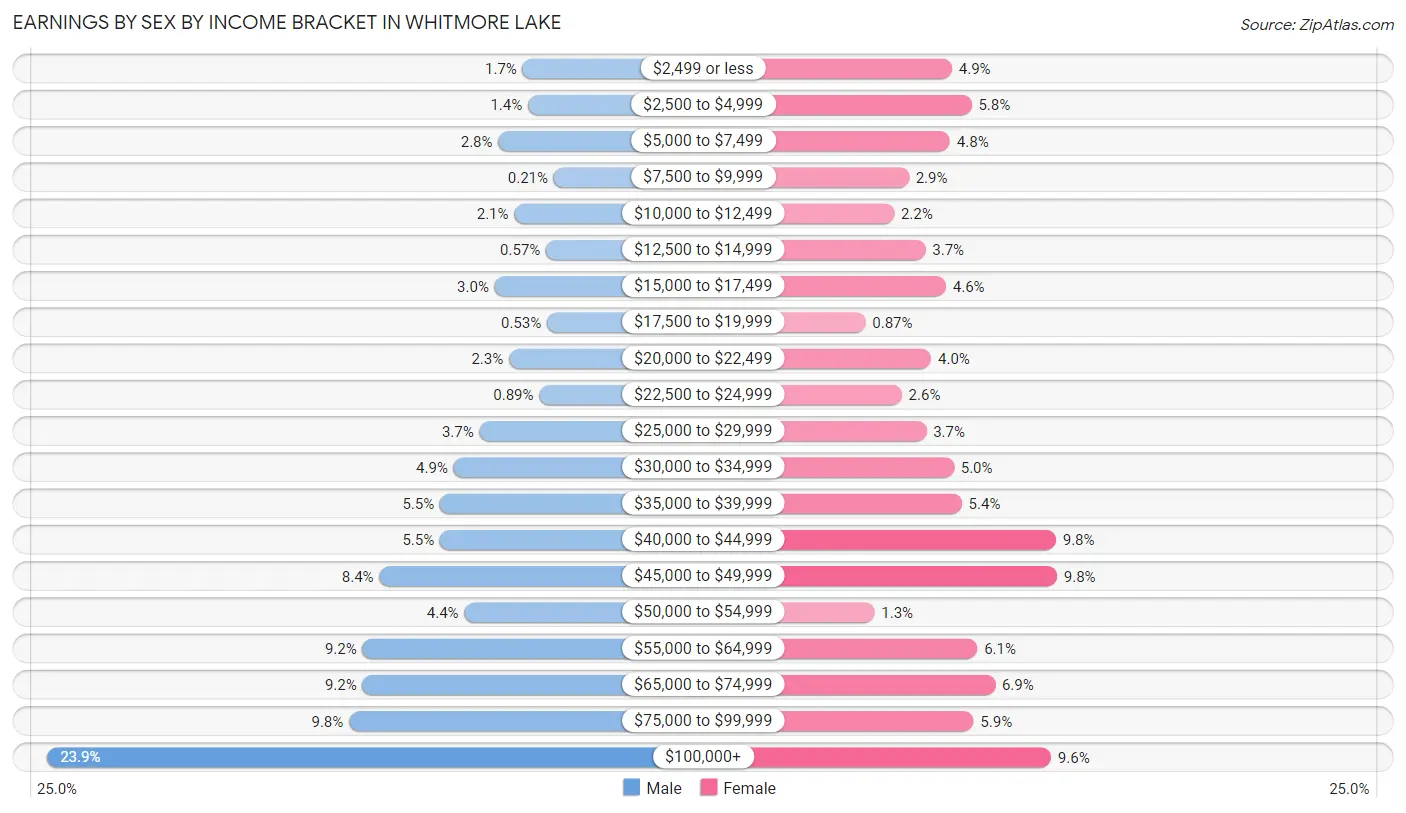
Earnings by Sex by Income Bracket in Whitmore Lake
The most common earnings brackets in Whitmore Lake are $100,000+ for men (674 | 23.9%) and $45,000 to $49,999 for women (214 | 9.8%).
| Income | Male | Female |
| $2,499 or less | 47 (1.7%) | 107 (4.9%) |
| $2,500 to $4,999 | 40 (1.4%) | 127 (5.8%) |
| $5,000 to $7,499 | 79 (2.8%) | 105 (4.8%) |
| $7,500 to $9,999 | 6 (0.2%) | 63 (2.9%) |
| $10,000 to $12,499 | 58 (2.1%) | 48 (2.2%) |
| $12,500 to $14,999 | 16 (0.6%) | 80 (3.7%) |
| $15,000 to $17,499 | 84 (3.0%) | 101 (4.6%) |
| $17,500 to $19,999 | 15 (0.5%) | 19 (0.9%) |
| $20,000 to $22,499 | 65 (2.3%) | 86 (4.0%) |
| $22,500 to $24,999 | 25 (0.9%) | 56 (2.6%) |
| $25,000 to $29,999 | 104 (3.7%) | 81 (3.7%) |
| $30,000 to $34,999 | 138 (4.9%) | 109 (5.0%) |
| $35,000 to $39,999 | 156 (5.5%) | 117 (5.4%) |
| $40,000 to $44,999 | 156 (5.5%) | 213 (9.8%) |
| $45,000 to $49,999 | 236 (8.4%) | 214 (9.8%) |
| $50,000 to $54,999 | 124 (4.4%) | 28 (1.3%) |
| $55,000 to $64,999 | 258 (9.2%) | 133 (6.1%) |
| $65,000 to $74,999 | 258 (9.2%) | 151 (6.9%) |
| $75,000 to $99,999 | 276 (9.8%) | 129 (5.9%) |
| $100,000+ | 674 (23.9%) | 208 (9.6%) |
| Total | 2,815 (100.0%) | 2,175 (100.0%) |
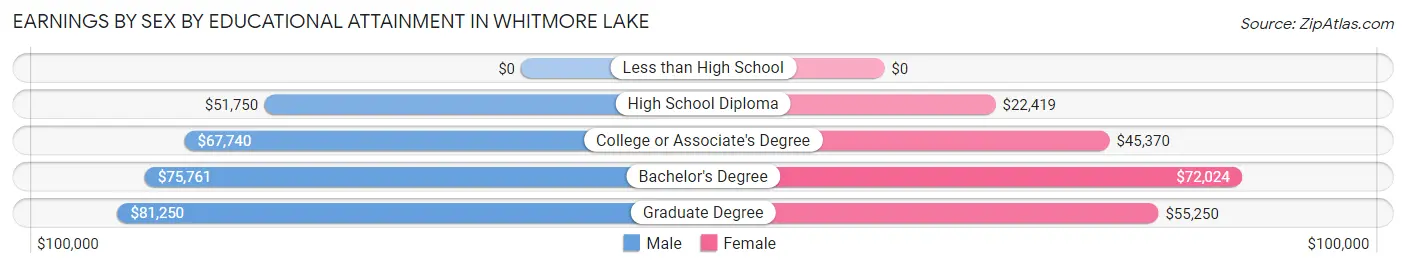
Earnings by Sex by Educational Attainment in Whitmore Lake
Average earnings in Whitmore Lake are $61,922 for men and $42,523 for women, a difference of 31.3%. Men with an educational attainment of graduate degree enjoy the highest average annual earnings of $81,250, while those with high school diploma education earn the least with $51,750. Women with an educational attainment of bachelor's degree earn the most with the average annual earnings of $72,024, while those with high school diploma education have the smallest earnings of $22,419.
| Educational Attainment | Male Income | Female Income |
| Less than High School | - | - |
| High School Diploma | $51,750 | $22,419 |
| College or Associate's Degree | $67,740 | $45,370 |
| Bachelor's Degree | $75,761 | $72,024 |
| Graduate Degree | $81,250 | $55,250 |
| Total | $61,922 | $42,523 |
Family Income in Whitmore Lake
Family Income Brackets in Whitmore Lake
According to the Whitmore Lake family income data, there are 496 families falling into the $100,000 to $149,999 income range, which is the most common income bracket and makes up 26.6% of all families.
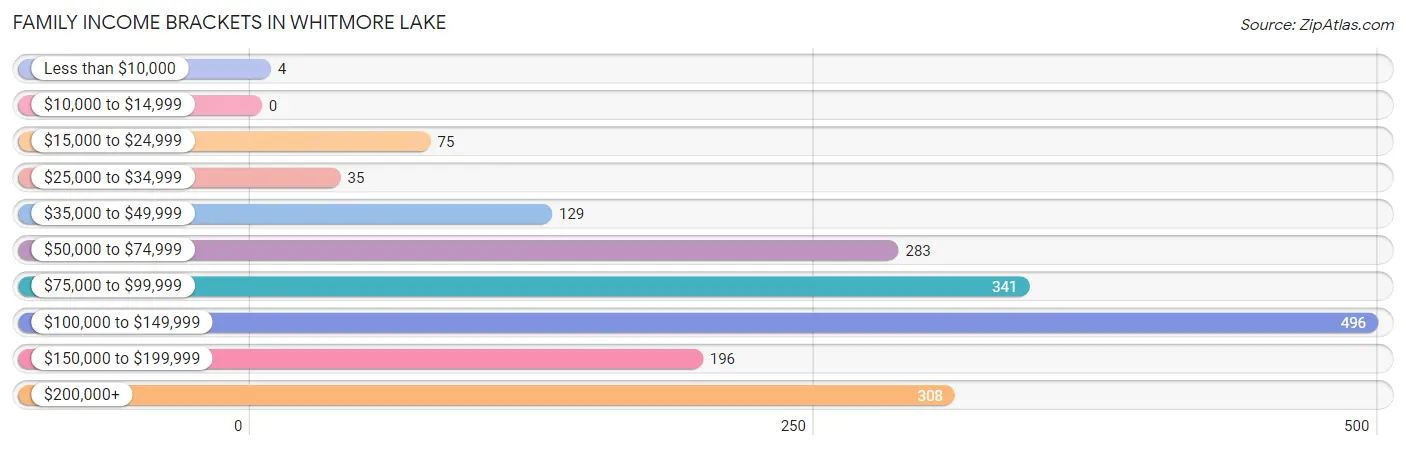
| Income Bracket | # Families | % Families |
| Less than $10,000 | 4 | 0.2% |
| $10,000 to $14,999 | 0 | 0.0% |
| $15,000 to $24,999 | 75 | 4.0% |
| $25,000 to $34,999 | 35 | 1.9% |
| $35,000 to $49,999 | 129 | 6.9% |
| $50,000 to $74,999 | 283 | 15.2% |
| $75,000 to $99,999 | 341 | 18.3% |
| $100,000 to $149,999 | 496 | 26.6% |
| $150,000 to $199,999 | 196 | 10.5% |
| $200,000+ | 308 | 16.5% |
Family Income by Famaliy Size in Whitmore Lake
4-person families (312 | 16.7%) account for the highest median family income in Whitmore Lake with $154,667 per family, while 2-person families (885 | 47.4%) have the highest median income of $48,201 per family member.
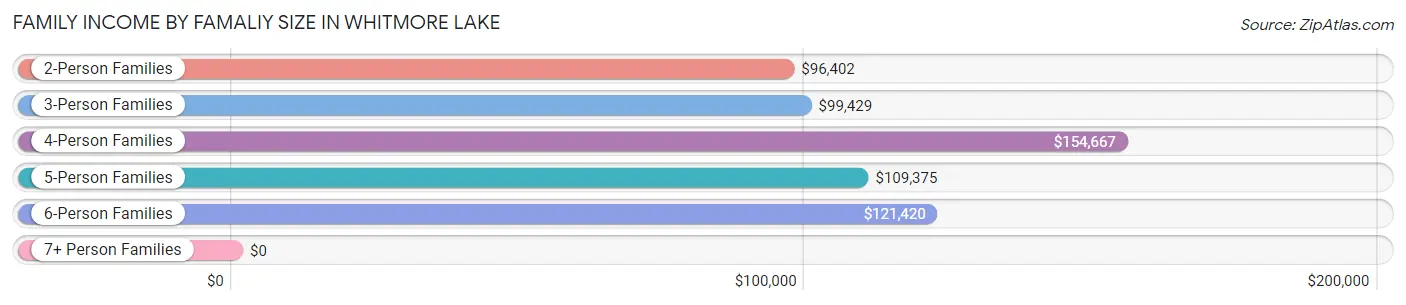
| Income Bracket | # Families | Median Income |
| 2-Person Families | 885 (47.4%) | $96,402 |
| 3-Person Families | 494 (26.5%) | $99,429 |
| 4-Person Families | 312 (16.7%) | $154,667 |
| 5-Person Families | 129 (6.9%) | $109,375 |
| 6-Person Families | 45 (2.4%) | $121,420 |
| 7+ Person Families | 0 (0.0%) | $0 |
| Total | 1,865 (100.0%) | $106,353 |
Family Income by Number of Earners in Whitmore Lake
The median family income in Whitmore Lake is $106,353, with families comprising 3+ earners (216) having the highest median family income of $154,706, while families with no earners (86) have the lowest median family income of $55,278, accounting for 11.6% and 4.6% of families, respectively.
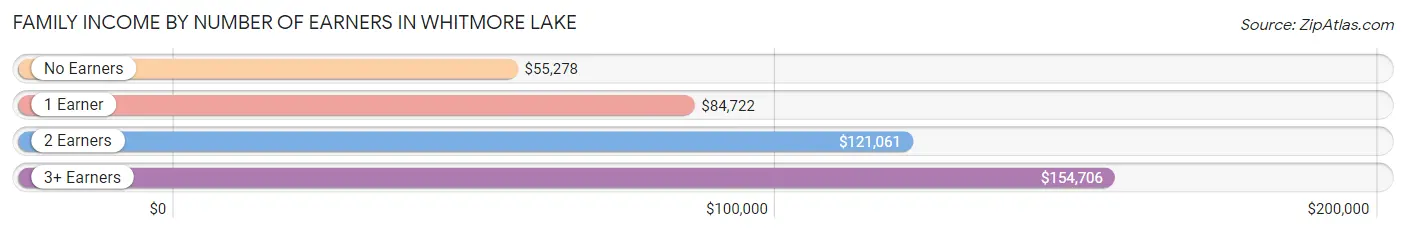
| Number of Earners | # Families | Median Income |
| No Earners | 86 (4.6%) | $55,278 |
| 1 Earner | 598 (32.1%) | $84,722 |
| 2 Earners | 965 (51.7%) | $121,061 |
| 3+ Earners | 216 (11.6%) | $154,706 |
| Total | 1,865 (100.0%) | $106,353 |
Household Income in Whitmore Lake
Household Income Brackets in Whitmore Lake
With 637 households falling in the category, the $100,000 to $149,999 income range is the most frequent in Whitmore Lake, accounting for 17.6% of all households. In contrast, only 54 households (1.5%) fall into the $10,000 to $14,999 income bracket, making it the least populous group.
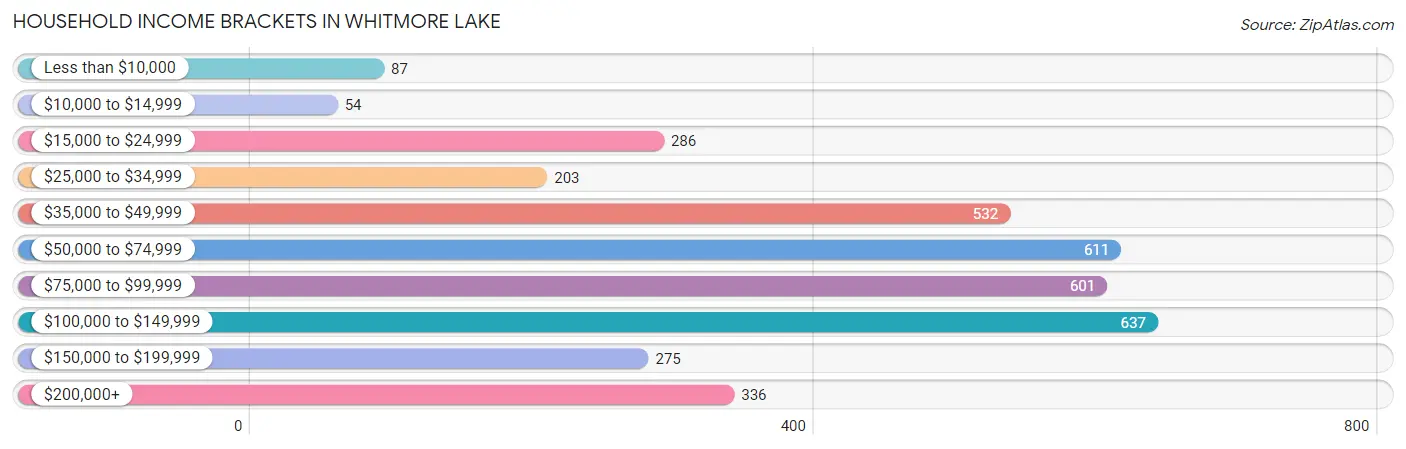
| Income Bracket | # Households | % Households |
| Less than $10,000 | 87 | 2.4% |
| $10,000 to $14,999 | 54 | 1.5% |
| $15,000 to $24,999 | 286 | 7.9% |
| $25,000 to $34,999 | 203 | 5.6% |
| $35,000 to $49,999 | 532 | 14.7% |
| $50,000 to $74,999 | 611 | 16.9% |
| $75,000 to $99,999 | 601 | 16.6% |
| $100,000 to $149,999 | 637 | 17.6% |
| $150,000 to $199,999 | 275 | 7.6% |
| $200,000+ | 336 | 9.3% |
Household Income by Householder Age in Whitmore Lake
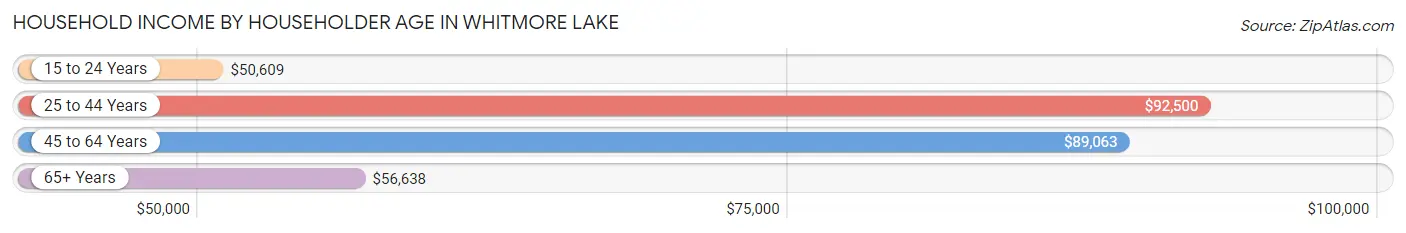
The median household income in Whitmore Lake is $76,653, with the highest median household income of $92,500 found in the 25 to 44 years age bracket for the primary householder. A total of 1,282 households (35.4%) fall into this category. Meanwhile, the 15 to 24 years age bracket for the primary householder has the lowest median household income of $50,609, with 215 households (5.9%) in this group.
| Income Bracket | # Households | Median Income |
| 15 to 24 Years | 215 (5.9%) | $50,609 |
| 25 to 44 Years | 1,282 (35.4%) | $92,500 |
| 45 to 64 Years | 1,381 (38.2%) | $89,063 |
| 65+ Years | 740 (20.4%) | $56,638 |
| Total | 3,618 (100.0%) | $76,653 |
Poverty in Whitmore Lake
Income Below Poverty by Sex and Age in Whitmore Lake
With 3.3% poverty level for males and 10.3% for females among the residents of Whitmore Lake, under 5 year old males and 18 to 24 year old females are the most vulnerable to poverty, with 39 males (13.6%) and 92 females (26.8%) in their respective age groups living below the poverty level.
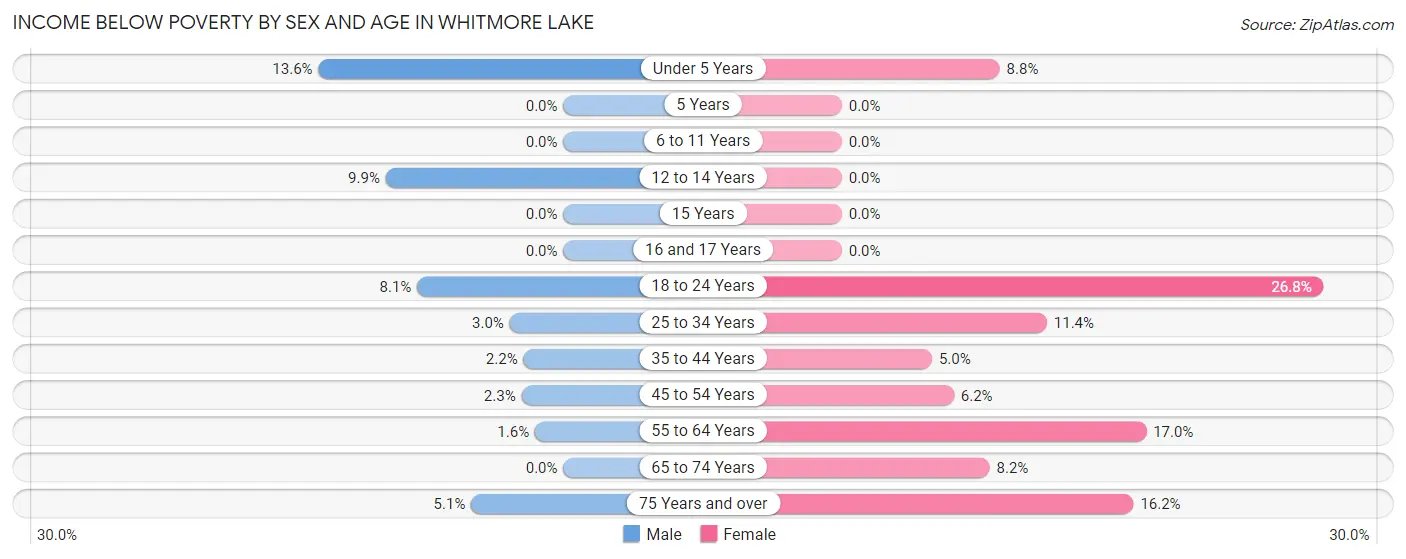
| Age Bracket | Male | Female |
| Under 5 Years | 39 (13.6%) | 16 (8.8%) |
| 5 Years | 0 (0.0%) | 0 (0.0%) |
| 6 to 11 Years | 0 (0.0%) | 0 (0.0%) |
| 12 to 14 Years | 9 (9.9%) | 0 (0.0%) |
| 15 Years | 0 (0.0%) | 0 (0.0%) |
| 16 and 17 Years | 0 (0.0%) | 0 (0.0%) |
| 18 to 24 Years | 21 (8.1%) | 92 (26.8%) |
| 25 to 34 Years | 21 (3.0%) | 77 (11.4%) |
| 35 to 44 Years | 15 (2.2%) | 22 (5.0%) |
| 45 to 54 Years | 15 (2.3%) | 28 (6.2%) |
| 55 to 64 Years | 10 (1.6%) | 71 (17.0%) |
| 65 to 74 Years | 0 (0.0%) | 33 (8.2%) |
| 75 Years and over | 8 (5.1%) | 44 (16.2%) |
| Total | 138 (3.3%) | 383 (10.3%) |
Income Above Poverty by Sex and Age in Whitmore Lake
According to the poverty statistics in Whitmore Lake, males aged 5 years and females aged 5 years are the age groups that are most secure financially, with 100.0% of males and 100.0% of females in these age groups living above the poverty line.
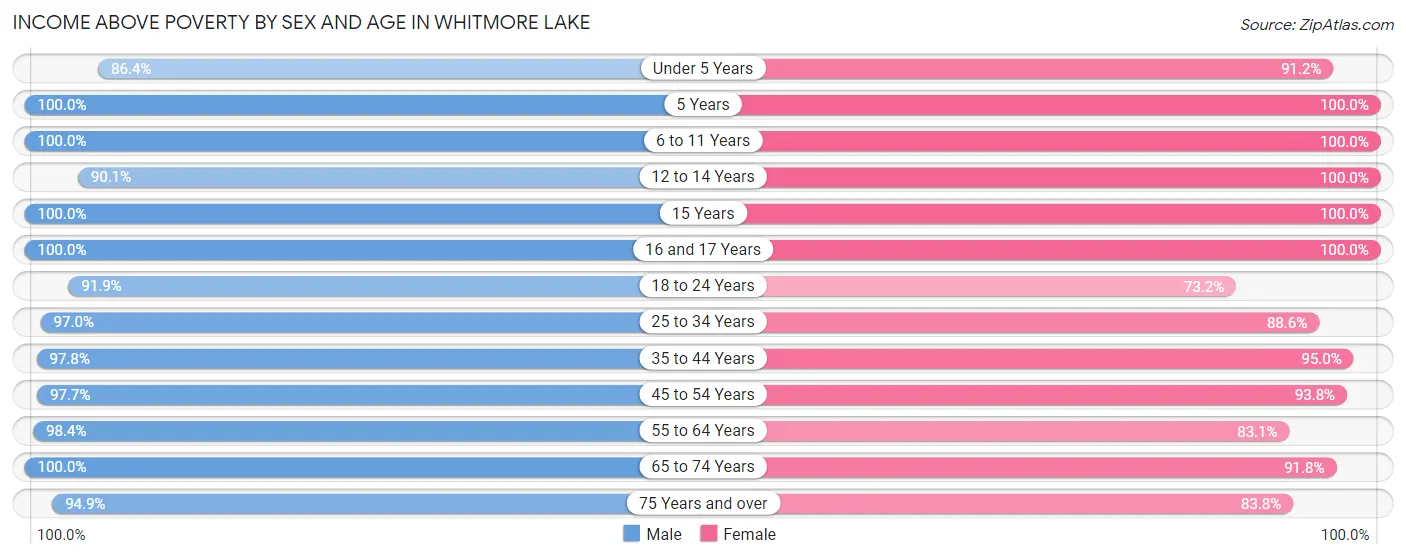
| Age Bracket | Male | Female |
| Under 5 Years | 247 (86.4%) | 166 (91.2%) |
| 5 Years | 93 (100.0%) | 62 (100.0%) |
| 6 to 11 Years | 195 (100.0%) | 270 (100.0%) |
| 12 to 14 Years | 82 (90.1%) | 68 (100.0%) |
| 15 Years | 40 (100.0%) | 41 (100.0%) |
| 16 and 17 Years | 108 (100.0%) | 97 (100.0%) |
| 18 to 24 Years | 237 (91.9%) | 251 (73.2%) |
| 25 to 34 Years | 681 (97.0%) | 597 (88.6%) |
| 35 to 44 Years | 662 (97.8%) | 416 (95.0%) |
| 45 to 54 Years | 628 (97.7%) | 421 (93.8%) |
| 55 to 64 Years | 623 (98.4%) | 348 (83.1%) |
| 65 to 74 Years | 275 (100.0%) | 368 (91.8%) |
| 75 Years and over | 148 (94.9%) | 227 (83.8%) |
| Total | 4,019 (96.7%) | 3,332 (89.7%) |
Income Below Poverty Among Married-Couple Families in Whitmore Lake
The poverty statistics for married-couple families in Whitmore Lake show that 2.2% or 31 of the total 1,423 families live below the poverty line. Families with 1 or 2 children have the highest poverty rate of 2.8%, comprising of 15 families. On the other hand, families with 3 or 4 children have the lowest poverty rate of 0.0%, which includes 0 families.
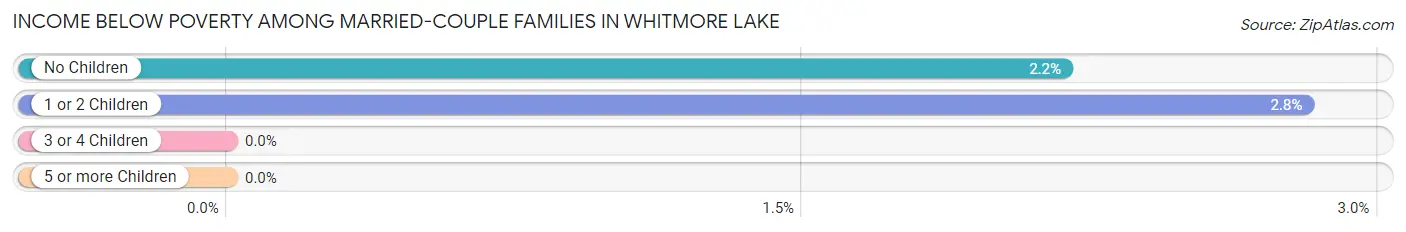
| Children | Above Poverty | Below Poverty |
| No Children | 718 (97.8%) | 16 (2.2%) |
| 1 or 2 Children | 519 (97.2%) | 15 (2.8%) |
| 3 or 4 Children | 155 (100.0%) | 0 (0.0%) |
| 5 or more Children | 0 (0.0%) | 0 (0.0%) |
| Total | 1,392 (97.8%) | 31 (2.2%) |
Income Below Poverty Among Single-Parent Households in Whitmore Lake
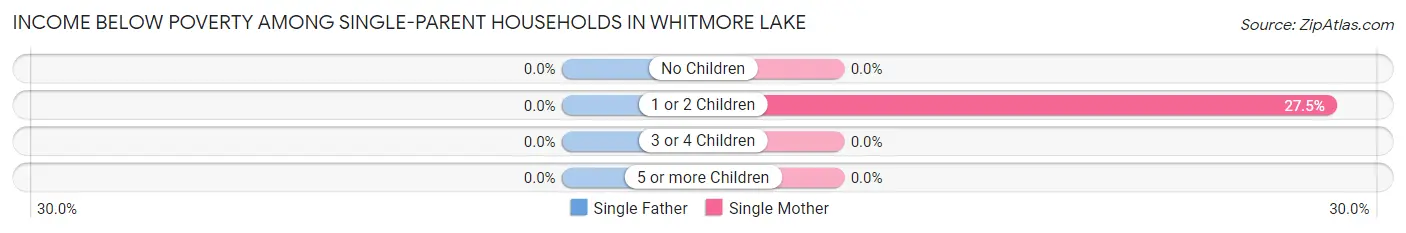
| Children | Single Father | Single Mother |
| No Children | 0 (0.0%) | 0 (0.0%) |
| 1 or 2 Children | 0 (0.0%) | 46 (27.5%) |
| 3 or 4 Children | 0 (0.0%) | 0 (0.0%) |
| 5 or more Children | 0 (0.0%) | 0 (0.0%) |
| Total | 0 (0.0%) | 46 (15.2%) |
Income Below Poverty Among Married-Couple vs Single-Parent Households in Whitmore Lake
The poverty data for Whitmore Lake shows that 31 of the married-couple family households (2.2%) and 46 of the single-parent households (10.4%) are living below the poverty level. Within the married-couple family households, those with 1 or 2 children have the highest poverty rate, with 15 households (2.8%) falling below the poverty line. Among the single-parent households, those with 1 or 2 children have the highest poverty rate, with 46 household (20.1%) living below poverty.
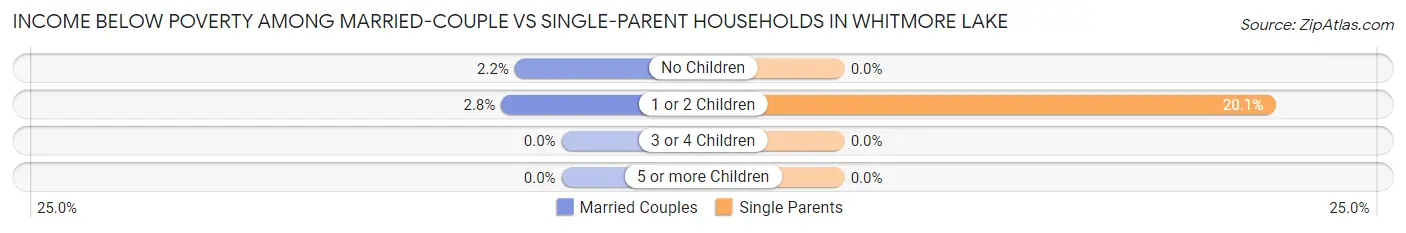
| Children | Married-Couple Families | Single-Parent Households |
| No Children | 16 (2.2%) | 0 (0.0%) |
| 1 or 2 Children | 15 (2.8%) | 46 (20.1%) |
| 3 or 4 Children | 0 (0.0%) | 0 (0.0%) |
| 5 or more Children | 0 (0.0%) | 0 (0.0%) |
| Total | 31 (2.2%) | 46 (10.4%) |
Race in Whitmore Lake
The most populous races in Whitmore Lake are White / Caucasian (7,597 | 96.0%), Hispanic or Latino (279 | 3.5%), and Two or more Races (117 | 1.5%).
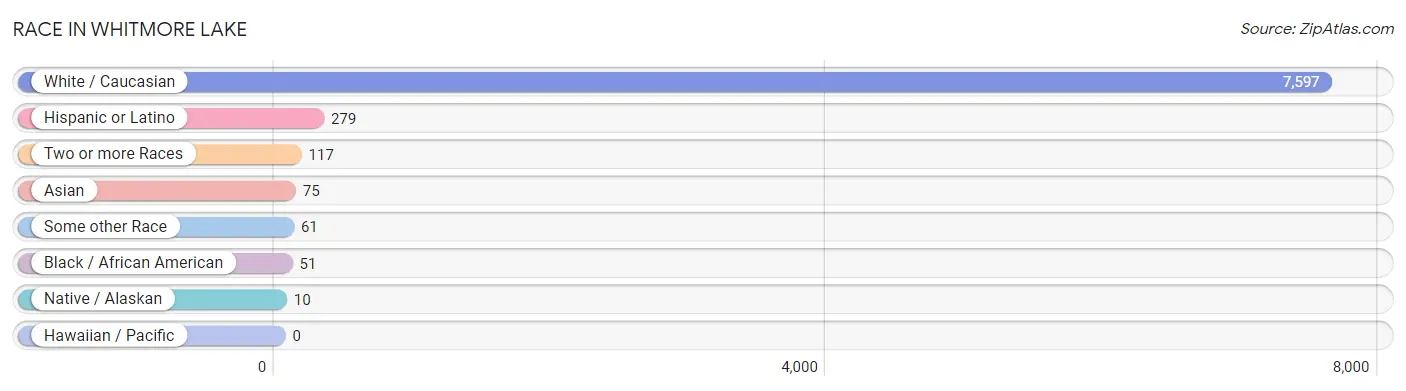
| Race | # Population | % Population |
| Asian | 75 | 0.9% |
| Black / African American | 51 | 0.6% |
| Hawaiian / Pacific | 0 | 0.0% |
| Hispanic or Latino | 279 | 3.5% |
| Native / Alaskan | 10 | 0.1% |
| White / Caucasian | 7,597 | 96.0% |
| Two or more Races | 117 | 1.5% |
| Some other Race | 61 | 0.8% |
| Total | 7,911 | 100.0% |
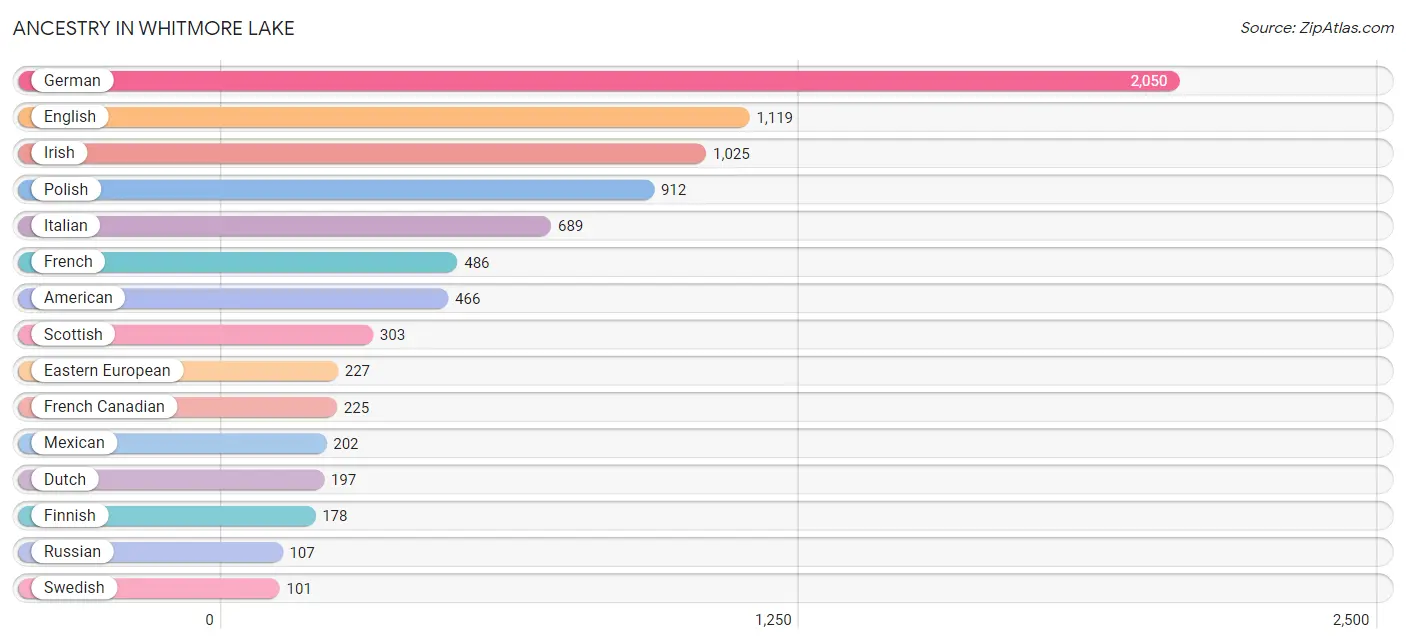
Ancestry in Whitmore Lake
The most populous ancestries reported in Whitmore Lake are German (2,050 | 25.9%), English (1,119 | 14.1%), Irish (1,025 | 13.0%), Polish (912 | 11.5%), and Italian (689 | 8.7%), together accounting for 73.2% of all Whitmore Lake residents.
| Ancestry | # Population | % Population |
| American | 466 | 5.9% |
| Arab | 56 | 0.7% |
| Austrian | 37 | 0.5% |
| Belgian | 19 | 0.2% |
| Burmese | 19 | 0.2% |
| Canadian | 7 | 0.1% |
| Cherokee | 46 | 0.6% |
| Chippewa | 8 | 0.1% |
| Croatian | 9 | 0.1% |
| Cuban | 23 | 0.3% |
| Czech | 28 | 0.4% |
| Czechoslovakian | 39 | 0.5% |
| Danish | 26 | 0.3% |
| Dutch | 197 | 2.5% |
| Eastern European | 227 | 2.9% |
| English | 1,119 | 14.1% |
| European | 70 | 0.9% |
| Finnish | 178 | 2.2% |
| French | 486 | 6.1% |
| French Canadian | 225 | 2.8% |
| German | 2,050 | 25.9% |
| Greek | 21 | 0.3% |
| Hungarian | 51 | 0.6% |
| Irish | 1,025 | 13.0% |
| Italian | 689 | 8.7% |
| Korean | 38 | 0.5% |
| Lebanese | 46 | 0.6% |
| Lithuanian | 41 | 0.5% |
| Macedonian | 15 | 0.2% |
| Maltese | 68 | 0.9% |
| Mexican | 202 | 2.5% |
| Northern European | 22 | 0.3% |
| Norwegian | 73 | 0.9% |
| Polish | 912 | 11.5% |
| Potawatomi | 13 | 0.2% |
| Puerto Rican | 27 | 0.3% |
| Romanian | 43 | 0.5% |
| Russian | 107 | 1.3% |
| Scandinavian | 29 | 0.4% |
| Scotch-Irish | 62 | 0.8% |
| Scottish | 303 | 3.8% |
| Serbian | 84 | 1.1% |
| Spaniard | 15 | 0.2% |
| Spanish American | 12 | 0.2% |
| Swedish | 101 | 1.3% |
| Swiss | 31 | 0.4% |
| Syrian | 27 | 0.3% |
| Thai | 17 | 0.2% |
| Welsh | 36 | 0.5% |
| Yugoslavian | 31 | 0.4% | View All 50 Rows |
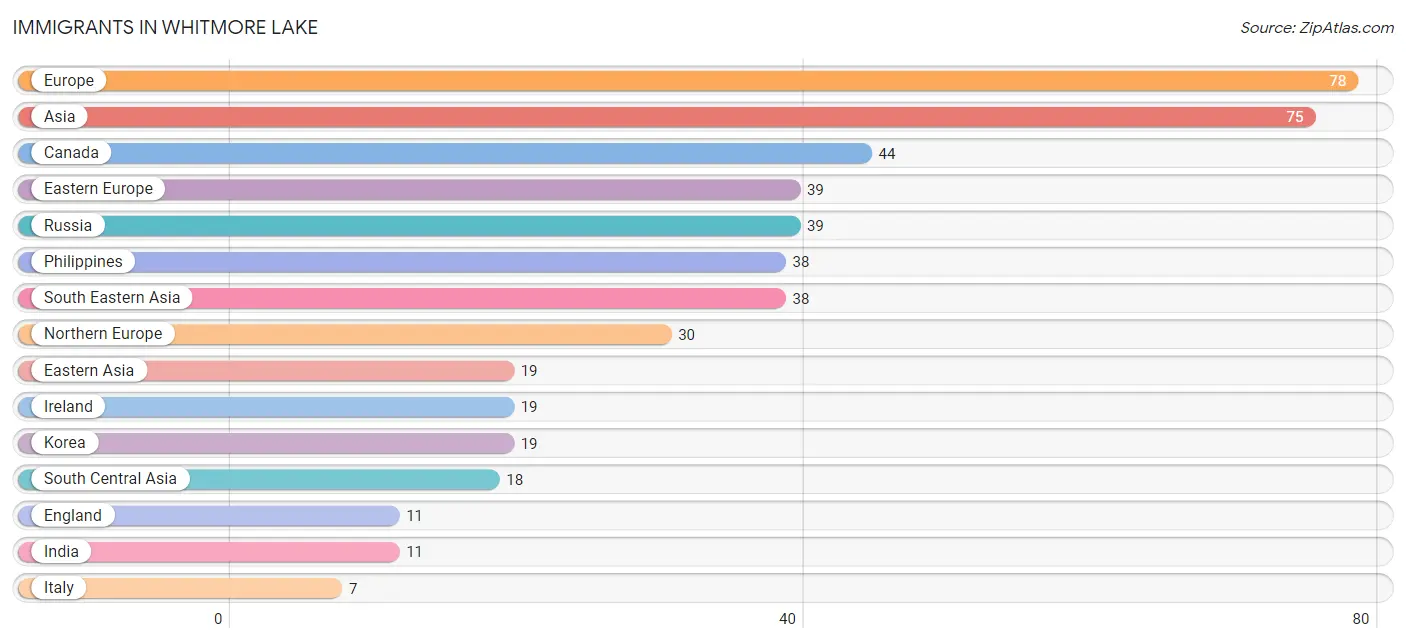
Immigrants in Whitmore Lake
The most numerous immigrant groups reported in Whitmore Lake came from Europe (78 | 1.0%), Asia (75 | 0.9%), Canada (44 | 0.6%), Eastern Europe (39 | 0.5%), and Russia (39 | 0.5%), together accounting for 3.5% of all Whitmore Lake residents.
| Immigration Origin | # Population | % Population |
| Asia | 75 | 0.9% |
| Canada | 44 | 0.6% |
| Eastern Asia | 19 | 0.2% |
| Eastern Europe | 39 | 0.5% |
| England | 11 | 0.1% |
| Europe | 78 | 1.0% |
| France | 2 | 0.0% |
| India | 11 | 0.1% |
| Ireland | 19 | 0.2% |
| Italy | 7 | 0.1% |
| Korea | 19 | 0.2% |
| Northern Europe | 30 | 0.4% |
| Philippines | 38 | 0.5% |
| Russia | 39 | 0.5% |
| South Central Asia | 18 | 0.2% |
| South Eastern Asia | 38 | 0.5% |
| Southern Europe | 7 | 0.1% |
| Western Europe | 2 | 0.0% | View All 18 Rows |
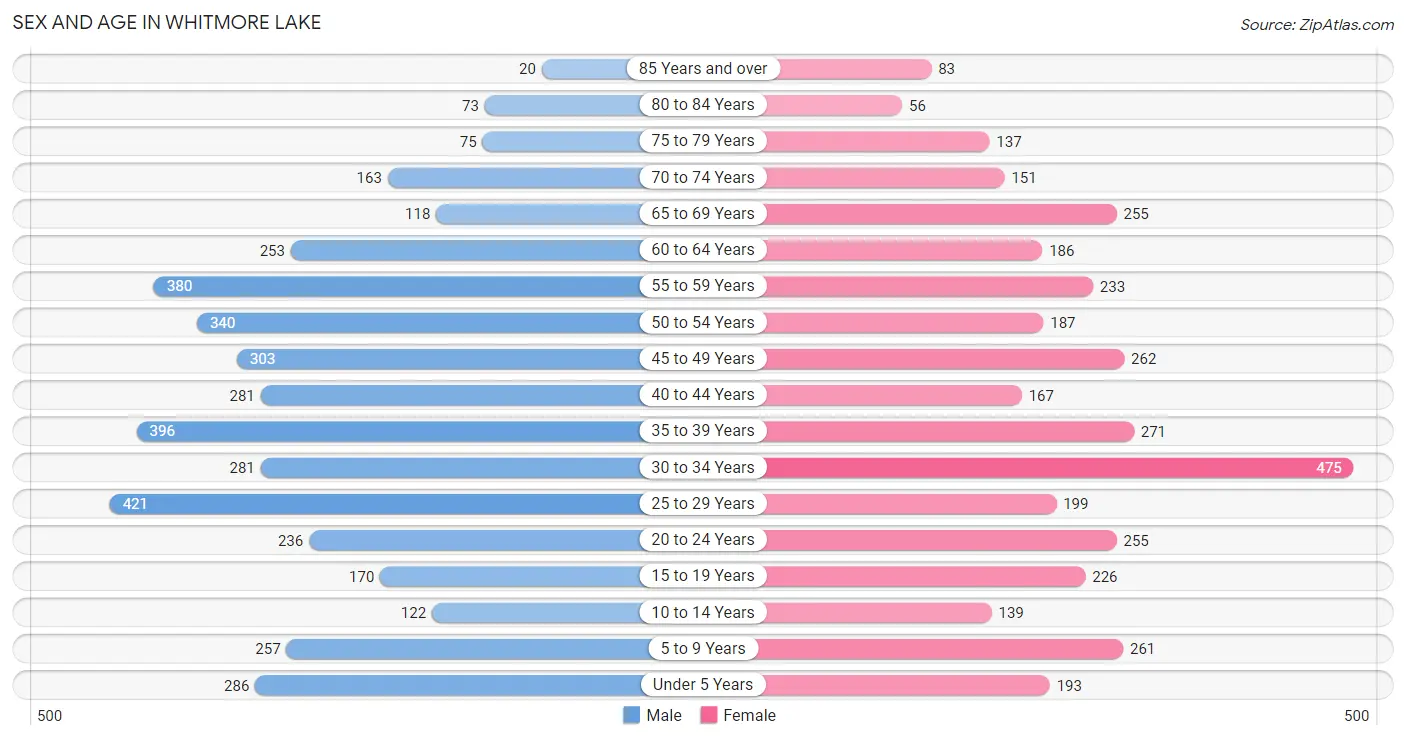
Sex and Age in Whitmore Lake
Sex and Age in Whitmore Lake
The most populous age groups in Whitmore Lake are 25 to 29 Years (421 | 10.1%) for men and 30 to 34 Years (475 | 12.7%) for women.
| Age Bracket | Male | Female |
| Under 5 Years | 286 (6.9%) | 193 (5.2%) |
| 5 to 9 Years | 257 (6.2%) | 261 (7.0%) |
| 10 to 14 Years | 122 (2.9%) | 139 (3.7%) |
| 15 to 19 Years | 170 (4.1%) | 226 (6.0%) |
| 20 to 24 Years | 236 (5.7%) | 255 (6.8%) |
| 25 to 29 Years | 421 (10.1%) | 199 (5.3%) |
| 30 to 34 Years | 281 (6.7%) | 475 (12.7%) |
| 35 to 39 Years | 396 (9.5%) | 271 (7.2%) |
| 40 to 44 Years | 281 (6.7%) | 167 (4.5%) |
| 45 to 49 Years | 303 (7.3%) | 262 (7.0%) |
| 50 to 54 Years | 340 (8.1%) | 187 (5.0%) |
| 55 to 59 Years | 380 (9.1%) | 233 (6.2%) |
| 60 to 64 Years | 253 (6.1%) | 186 (5.0%) |
| 65 to 69 Years | 118 (2.8%) | 255 (6.8%) |
| 70 to 74 Years | 163 (3.9%) | 151 (4.0%) |
| 75 to 79 Years | 75 (1.8%) | 137 (3.7%) |
| 80 to 84 Years | 73 (1.8%) | 56 (1.5%) |
| 85 Years and over | 20 (0.5%) | 83 (2.2%) |
| Total | 4,175 (100.0%) | 3,736 (100.0%) |
Families and Households in Whitmore Lake
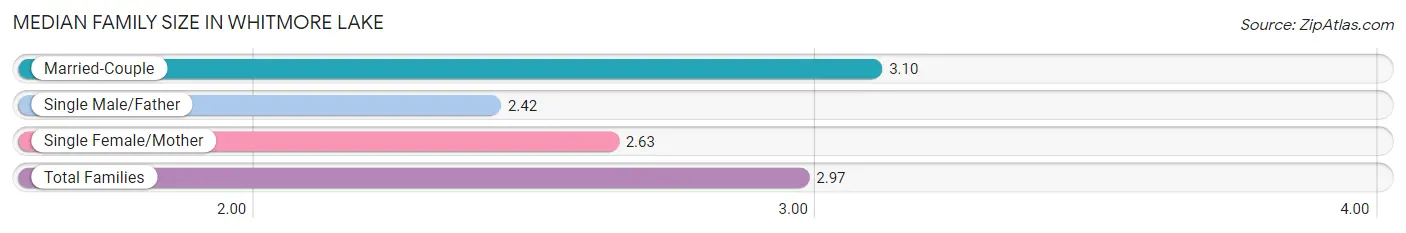
Median Family Size in Whitmore Lake
The median family size in Whitmore Lake is 2.97 persons per family, with married-couple families (1,423 | 76.3%) accounting for the largest median family size of 3.1 persons per family. On the other hand, single male/father families (140 | 7.5%) represent the smallest median family size with 2.42 persons per family.
| Family Type | # Families | Family Size |
| Married-Couple | 1,423 (76.3%) | 3.10 |
| Single Male/Father | 140 (7.5%) | 2.42 |
| Single Female/Mother | 302 (16.2%) | 2.63 |
| Total Families | 1,865 (100.0%) | 2.97 |
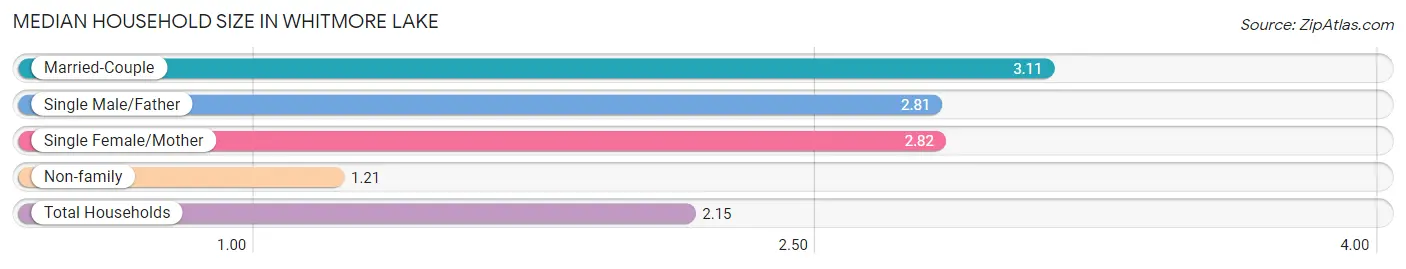
Median Household Size in Whitmore Lake
The median household size in Whitmore Lake is 2.15 persons per household, with married-couple households (1,423 | 39.3%) accounting for the largest median household size of 3.11 persons per household. non-family households (1,753 | 48.4%) represent the smallest median household size with 1.21 persons per household.
| Household Type | # Households | Household Size |
| Married-Couple | 1,423 (39.3%) | 3.11 |
| Single Male/Father | 140 (3.9%) | 2.81 |
| Single Female/Mother | 302 (8.4%) | 2.82 |
| Non-family | 1,753 (48.4%) | 1.21 |
| Total Households | 3,618 (100.0%) | 2.15 |
Household Size by Marriage Status in Whitmore Lake
Out of a total of 3,618 households in Whitmore Lake, 1,865 (51.5%) are family households, while 1,753 (48.4%) are nonfamily households. The most numerous type of family households are 2-person households, comprising 811, and the most common type of nonfamily households are 1-person households, comprising 1,442.
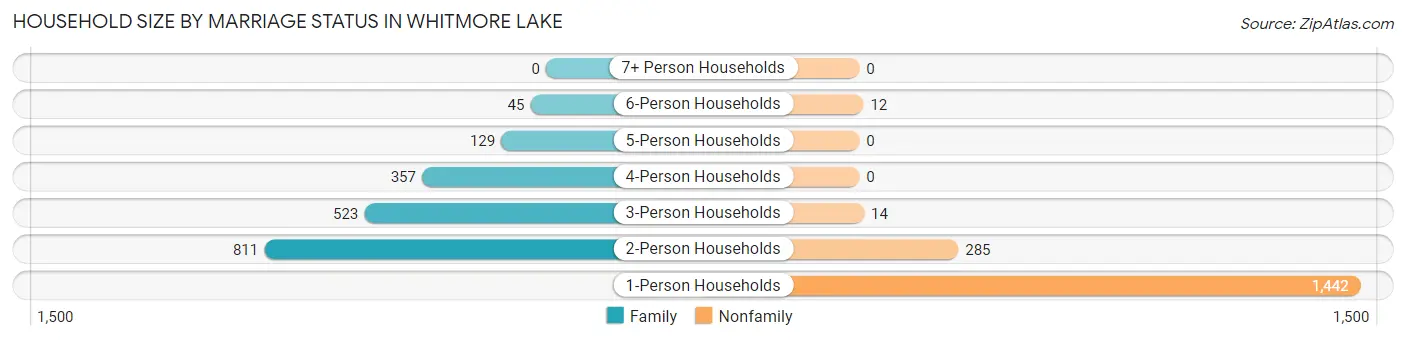
| Household Size | Family Households | Nonfamily Households |
| 1-Person Households | - | 1,442 (39.9%) |
| 2-Person Households | 811 (22.4%) | 285 (7.9%) |
| 3-Person Households | 523 (14.5%) | 14 (0.4%) |
| 4-Person Households | 357 (9.9%) | 0 (0.0%) |
| 5-Person Households | 129 (3.6%) | 0 (0.0%) |
| 6-Person Households | 45 (1.2%) | 12 (0.3%) |
| 7+ Person Households | 0 (0.0%) | 0 (0.0%) |
| Total | 1,865 (51.5%) | 1,753 (48.4%) |
Female Fertility in Whitmore Lake
Fertility by Age in Whitmore Lake
Average fertility rate in Whitmore Lake is 19.0 births per 1,000 women. Women in the age bracket of 20 to 34 years have the highest fertility rate with 29.0 births per 1,000 women. Women in the age bracket of 20 to 34 years acount for 75.0% of all women with births.
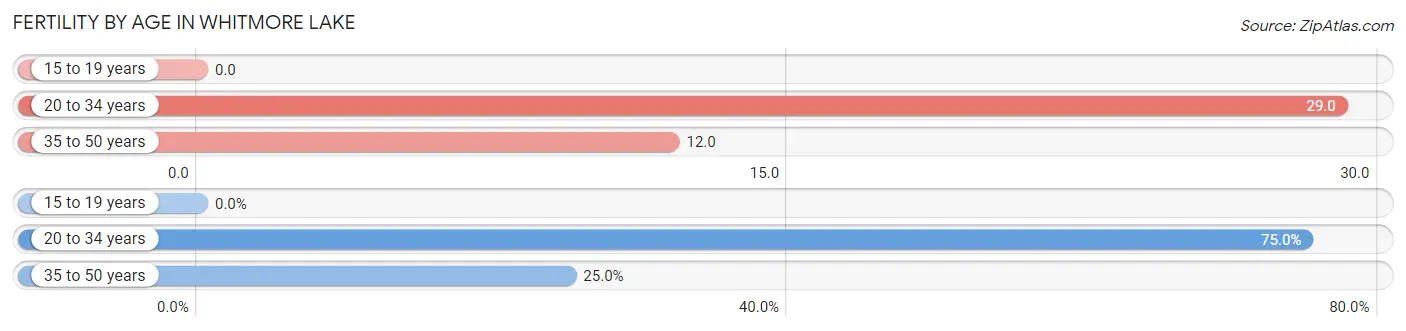
| Age Bracket | Women with Births | Births / 1,000 Women |
| 15 to 19 years | 0 (0.0%) | 0.0 |
| 20 to 34 years | 27 (75.0%) | 29.0 |
| 35 to 50 years | 9 (25.0%) | 12.0 |
| Total | 36 (100.0%) | 19.0 |
Fertility by Age by Marriage Status in Whitmore Lake
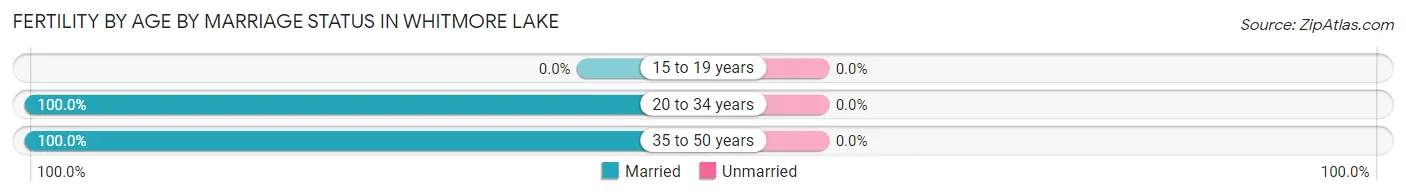
| Age Bracket | Married | Unmarried |
| 15 to 19 years | 0 (0.0%) | 0 (0.0%) |
| 20 to 34 years | 27 (100.0%) | 0 (0.0%) |
| 35 to 50 years | 9 (100.0%) | 0 (0.0%) |
| Total | 36 (100.0%) | 0 (0.0%) |
Fertility by Education in Whitmore Lake
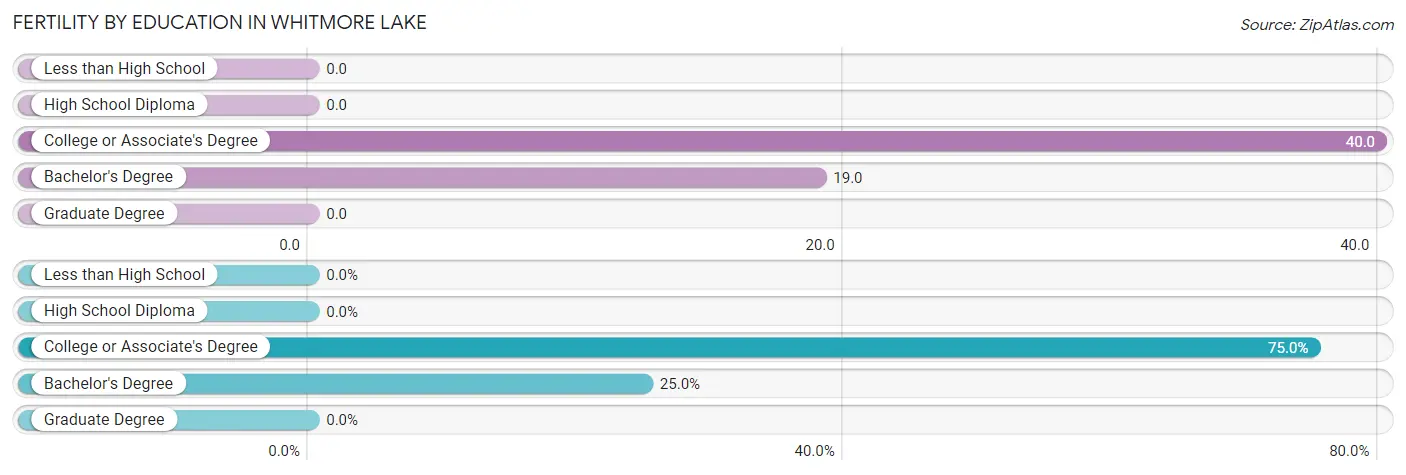
| Educational Attainment | Women with Births | Births / 1,000 Women |
| Less than High School | 0 (0.0%) | 0.0 |
| High School Diploma | 0 (0.0%) | 0.0 |
| College or Associate's Degree | 27 (75.0%) | 40.0 |
| Bachelor's Degree | 9 (25.0%) | 19.0 |
| Graduate Degree | 0 (0.0%) | 0.0 |
| Total | 36 (100.0%) | 19.0 |
Fertility by Education by Marriage Status in Whitmore Lake
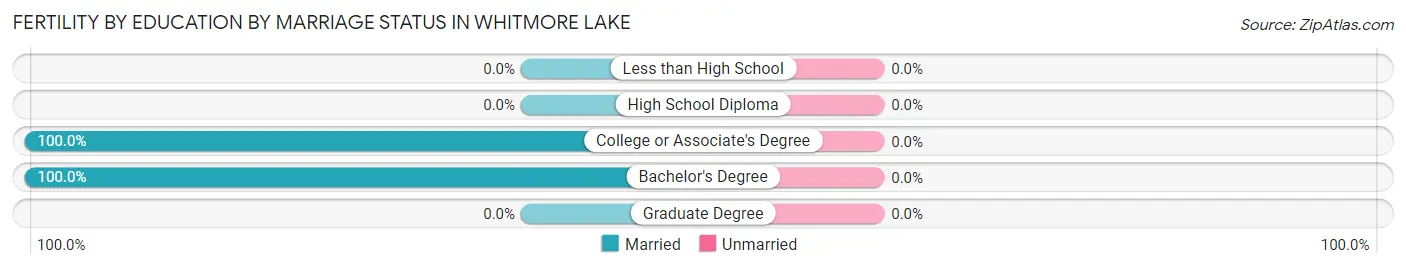
| Educational Attainment | Married | Unmarried |
| Less than High School | 0 (0.0%) | 0 (0.0%) |
| High School Diploma | 0 (0.0%) | 0 (0.0%) |
| College or Associate's Degree | 27 (100.0%) | 0 (0.0%) |
| Bachelor's Degree | 9 (100.0%) | 0 (0.0%) |
| Graduate Degree | 0 (0.0%) | 0 (0.0%) |
| Total | 36 (100.0%) | 0 (0.0%) |
Employment Characteristics in Whitmore Lake
Employment by Class of Employer in Whitmore Lake
Among the 4,377 employed individuals in Whitmore Lake, private company employees (3,014 | 68.9%), not-for-profit organizations (534 | 12.2%), and state government employees (306 | 7.0%) make up the most common classes of employment.
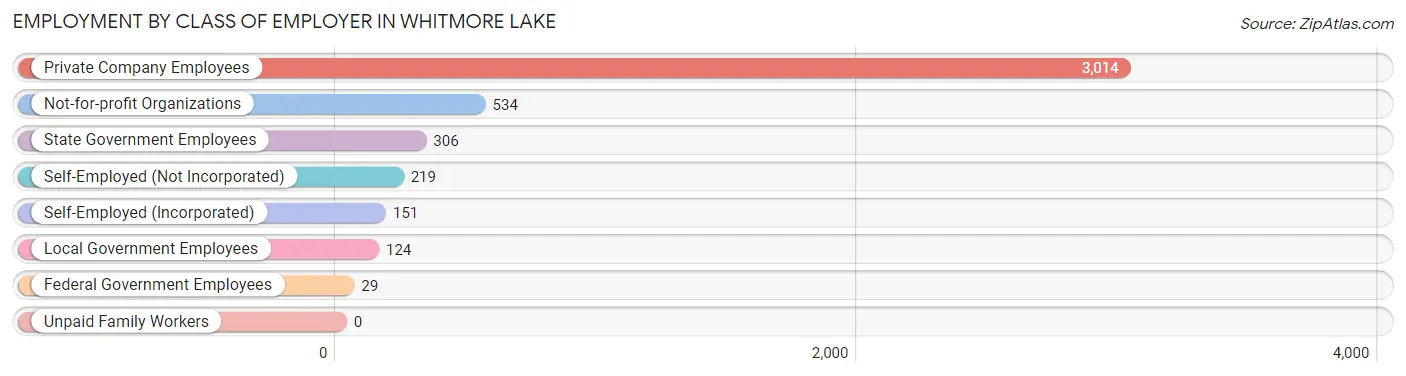
| Employer Class | # Employees | % Employees |
| Private Company Employees | 3,014 | 68.9% |
| Self-Employed (Incorporated) | 151 | 3.5% |
| Self-Employed (Not Incorporated) | 219 | 5.0% |
| Not-for-profit Organizations | 534 | 12.2% |
| Local Government Employees | 124 | 2.8% |
| State Government Employees | 306 | 7.0% |
| Federal Government Employees | 29 | 0.7% |
| Unpaid Family Workers | 0 | 0.0% |
| Total | 4,377 | 100.0% |
Employment Status by Age in Whitmore Lake
According to the labor force statistics for Whitmore Lake, out of the total population over 16 years of age (6,572), 69.4% or 4,561 individuals are in the labor force, with 2.6% or 119 of them unemployed. The age group with the highest labor force participation rate is 20 to 24 years, with 92.7% or 455 individuals in the labor force. Within the labor force, the 16 to 19 years age range has the highest percentage of unemployed individuals, with 11.7% or 12 of them being unemployed.
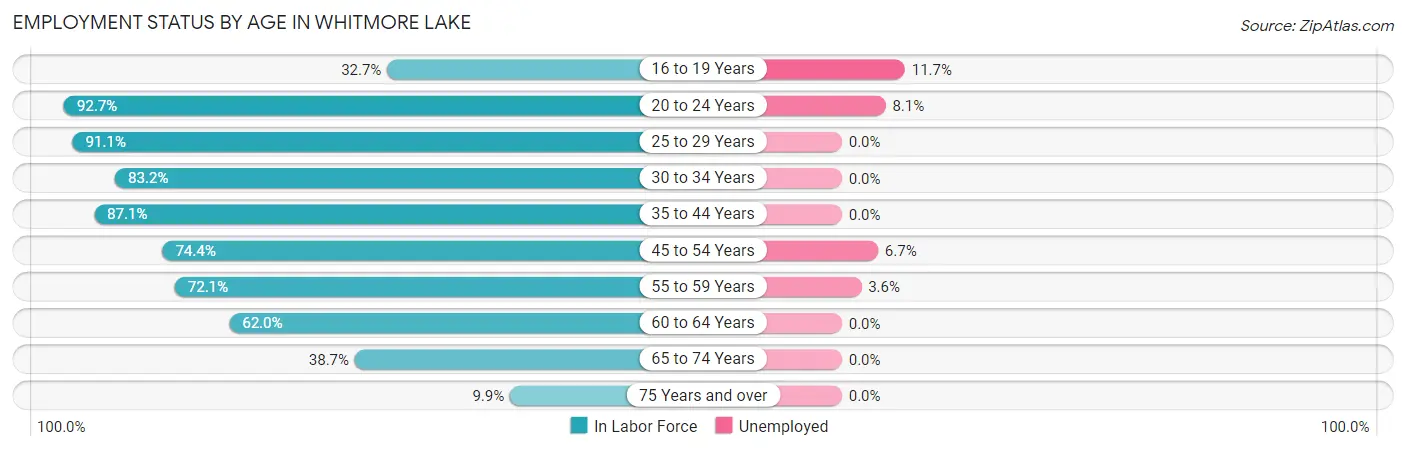
| Age Bracket | In Labor Force | Unemployed |
| 16 to 19 Years | 103 (32.7%) | 12 (11.7%) |
| 20 to 24 Years | 455 (92.7%) | 37 (8.1%) |
| 25 to 29 Years | 565 (91.1%) | 0 (0.0%) |
| 30 to 34 Years | 629 (83.2%) | 0 (0.0%) |
| 35 to 44 Years | 971 (87.1%) | 0 (0.0%) |
| 45 to 54 Years | 812 (74.4%) | 54 (6.7%) |
| 55 to 59 Years | 442 (72.1%) | 16 (3.6%) |
| 60 to 64 Years | 272 (62.0%) | 0 (0.0%) |
| 65 to 74 Years | 266 (38.7%) | 0 (0.0%) |
| 75 Years and over | 44 (9.9%) | 0 (0.0%) |
| Total | 4,561 (69.4%) | 119 (2.6%) |
Employment Status by Educational Attainment in Whitmore Lake
According to labor force statistics for Whitmore Lake, 79.6% of individuals (3,689) out of the total population between 25 and 64 years of age (4,635) are in the labor force, with 1.9% or 70 of them being unemployed. The group with the highest labor force participation rate are those with the educational attainment of bachelor's degree or higher, with 85.5% or 1,368 individuals in the labor force. Within the labor force, individuals with high school diploma education have the highest percentage of unemployment, with 5.1% or 43 of them being unemployed.
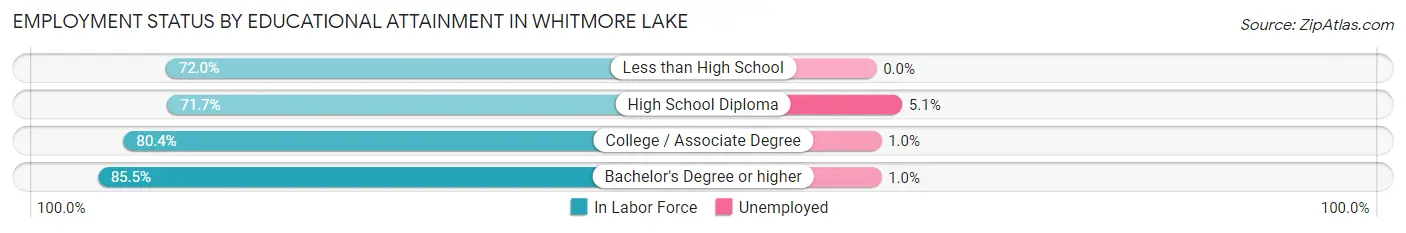
| Educational Attainment | In Labor Force | Unemployed |
| Less than High School | 118 (72.0%) | 0 (0.0%) |
| High School Diploma | 850 (71.7%) | 60 (5.1%) |
| College / Associate Degree | 1,355 (80.4%) | 17 (1.0%) |
| Bachelor's Degree or higher | 1,368 (85.5%) | 16 (1.0%) |
| Total | 3,689 (79.6%) | 88 (1.9%) |
Employment Occupations by Sex in Whitmore Lake
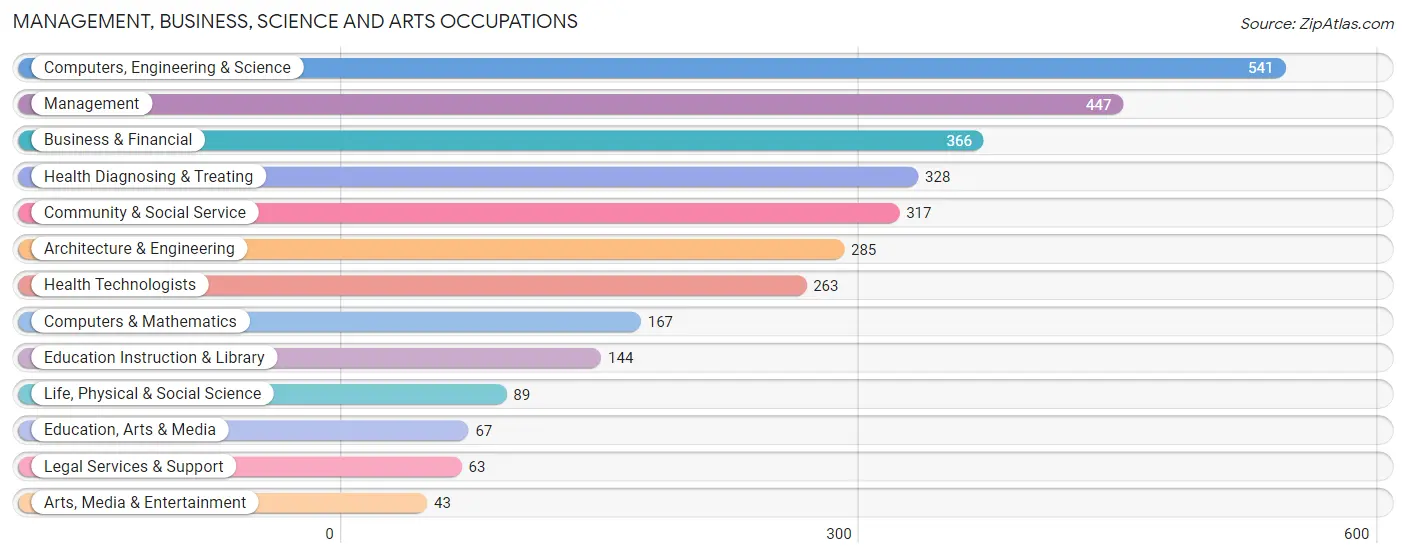
Management, Business, Science and Arts Occupations
The most common Management, Business, Science and Arts occupations in Whitmore Lake are Computers, Engineering & Science (541 | 12.2%), Management (447 | 10.1%), Business & Financial (366 | 8.2%), Health Diagnosing & Treating (328 | 7.4%), and Community & Social Service (317 | 7.1%).
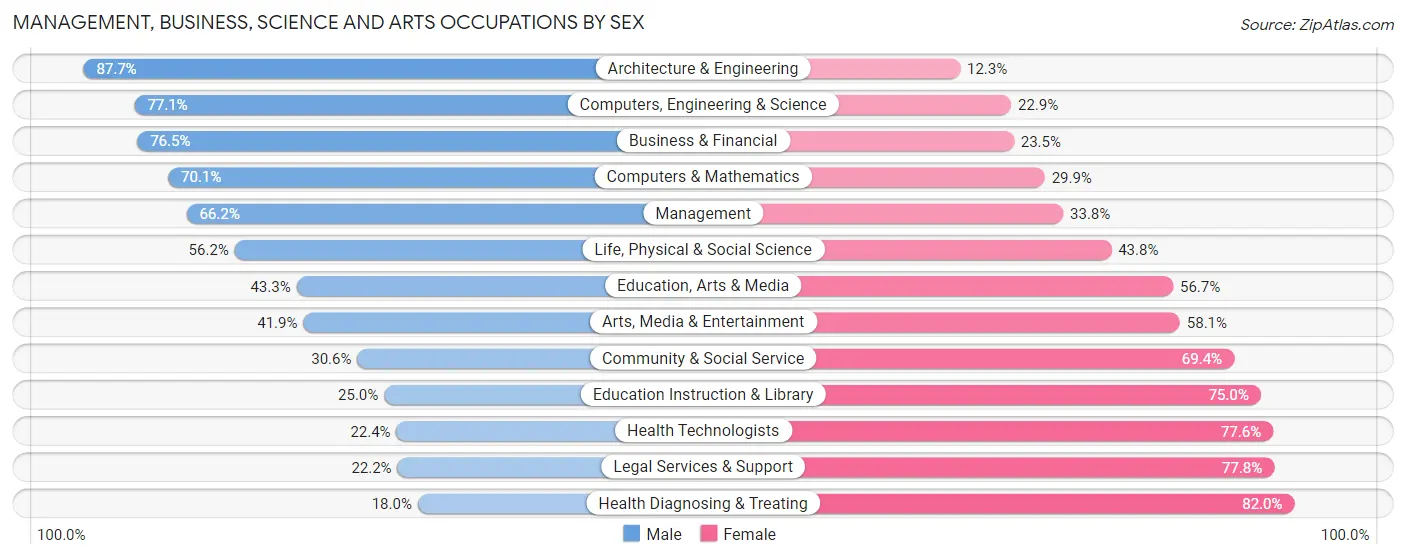
Management, Business, Science and Arts Occupations by Sex
Within the Management, Business, Science and Arts occupations in Whitmore Lake, the most male-oriented occupations are Architecture & Engineering (87.7%), Computers, Engineering & Science (77.1%), and Business & Financial (76.5%), while the most female-oriented occupations are Health Diagnosing & Treating (82.0%), Legal Services & Support (77.8%), and Health Technologists (77.6%).
| Occupation | Male | Female |
| Management | 296 (66.2%) | 151 (33.8%) |
| Business & Financial | 280 (76.5%) | 86 (23.5%) |
| Computers, Engineering & Science | 417 (77.1%) | 124 (22.9%) |
| Computers & Mathematics | 117 (70.1%) | 50 (29.9%) |
| Architecture & Engineering | 250 (87.7%) | 35 (12.3%) |
| Life, Physical & Social Science | 50 (56.2%) | 39 (43.8%) |
| Community & Social Service | 97 (30.6%) | 220 (69.4%) |
| Education, Arts & Media | 29 (43.3%) | 38 (56.7%) |
| Legal Services & Support | 14 (22.2%) | 49 (77.8%) |
| Education Instruction & Library | 36 (25.0%) | 108 (75.0%) |
| Arts, Media & Entertainment | 18 (41.9%) | 25 (58.1%) |
| Health Diagnosing & Treating | 59 (18.0%) | 269 (82.0%) |
| Health Technologists | 59 (22.4%) | 204 (77.6%) |
| Total (Category) | 1,149 (57.5%) | 850 (42.5%) |
| Total (Overall) | 2,532 (57.0%) | 1,908 (43.0%) |
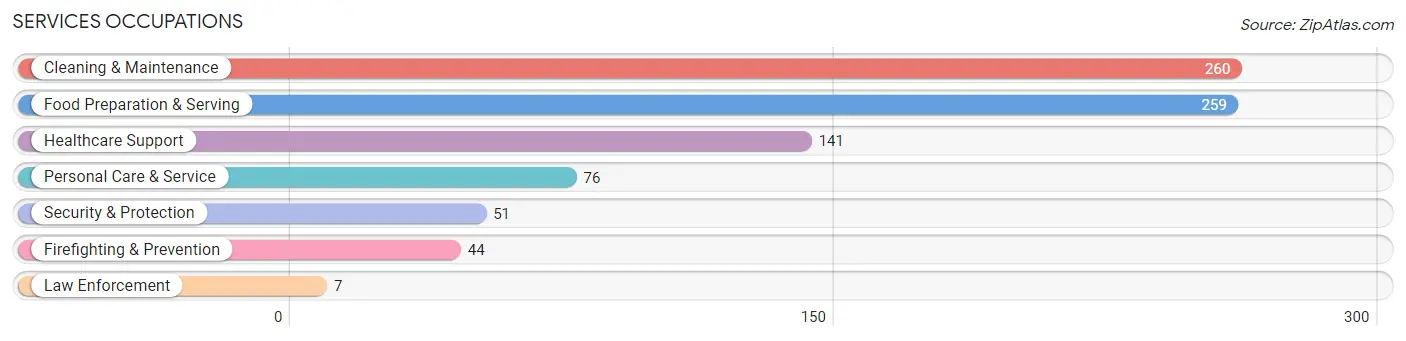
Services Occupations
The most common Services occupations in Whitmore Lake are Cleaning & Maintenance (260 | 5.9%), Food Preparation & Serving (259 | 5.8%), Healthcare Support (141 | 3.2%), Personal Care & Service (76 | 1.7%), and Security & Protection (51 | 1.1%).
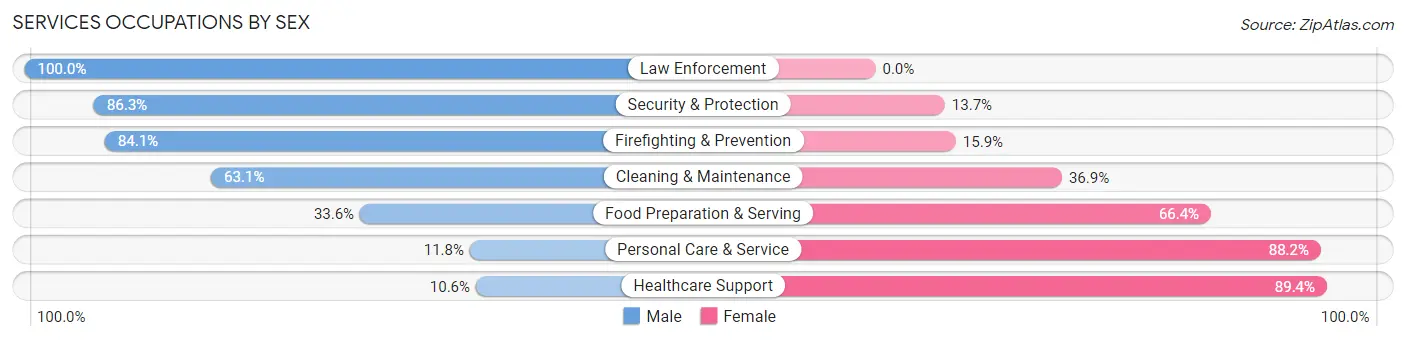
Services Occupations by Sex
Within the Services occupations in Whitmore Lake, the most male-oriented occupations are Law Enforcement (100.0%), Security & Protection (86.3%), and Firefighting & Prevention (84.1%), while the most female-oriented occupations are Healthcare Support (89.4%), Personal Care & Service (88.2%), and Food Preparation & Serving (66.4%).
| Occupation | Male | Female |
| Healthcare Support | 15 (10.6%) | 126 (89.4%) |
| Security & Protection | 44 (86.3%) | 7 (13.7%) |
| Firefighting & Prevention | 37 (84.1%) | 7 (15.9%) |
| Law Enforcement | 7 (100.0%) | 0 (0.0%) |
| Food Preparation & Serving | 87 (33.6%) | 172 (66.4%) |
| Cleaning & Maintenance | 164 (63.1%) | 96 (36.9%) |
| Personal Care & Service | 9 (11.8%) | 67 (88.2%) |
| Total (Category) | 319 (40.5%) | 468 (59.5%) |
| Total (Overall) | 2,532 (57.0%) | 1,908 (43.0%) |
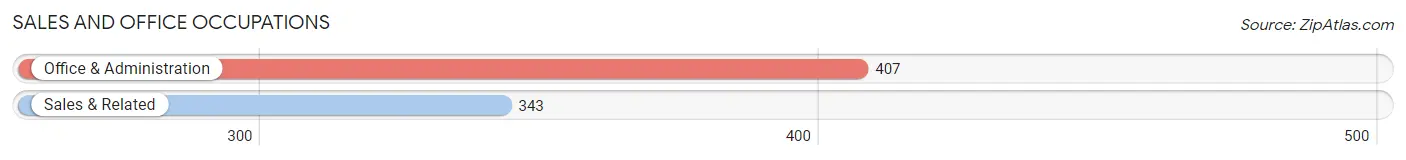
Sales and Office Occupations
The most common Sales and Office occupations in Whitmore Lake are Office & Administration (407 | 9.2%), and Sales & Related (343 | 7.7%).
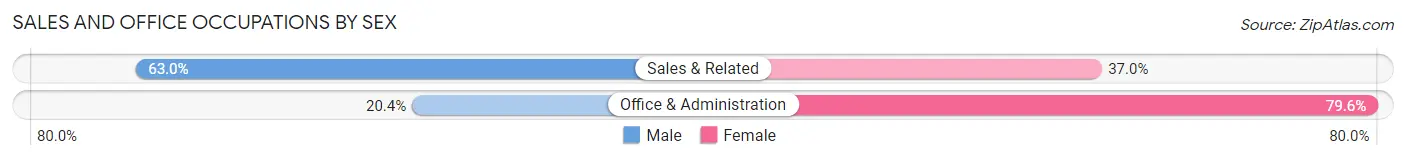
Sales and Office Occupations by Sex
| Occupation | Male | Female |
| Sales & Related | 216 (63.0%) | 127 (37.0%) |
| Office & Administration | 83 (20.4%) | 324 (79.6%) |
| Total (Category) | 299 (39.9%) | 451 (60.1%) |
| Total (Overall) | 2,532 (57.0%) | 1,908 (43.0%) |
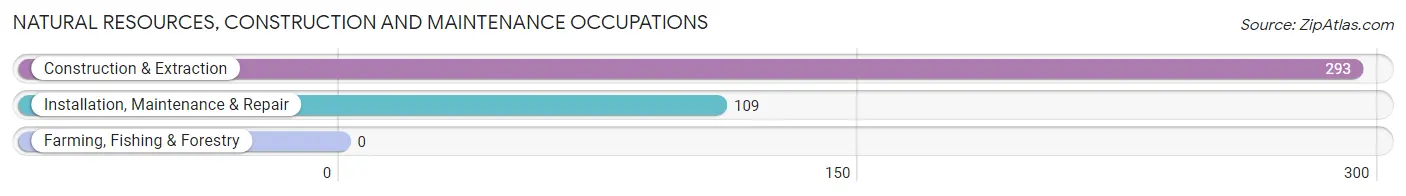
Natural Resources, Construction and Maintenance Occupations
The most common Natural Resources, Construction and Maintenance occupations in Whitmore Lake are Construction & Extraction (293 | 6.6%), and Installation, Maintenance & Repair (109 | 2.5%).
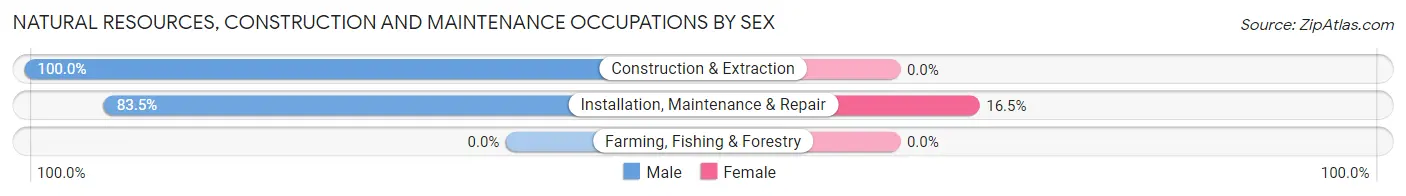
Natural Resources, Construction and Maintenance Occupations by Sex
| Occupation | Male | Female |
| Farming, Fishing & Forestry | 0 (0.0%) | 0 (0.0%) |
| Construction & Extraction | 293 (100.0%) | 0 (0.0%) |
| Installation, Maintenance & Repair | 91 (83.5%) | 18 (16.5%) |
| Total (Category) | 384 (95.5%) | 18 (4.5%) |
| Total (Overall) | 2,532 (57.0%) | 1,908 (43.0%) |
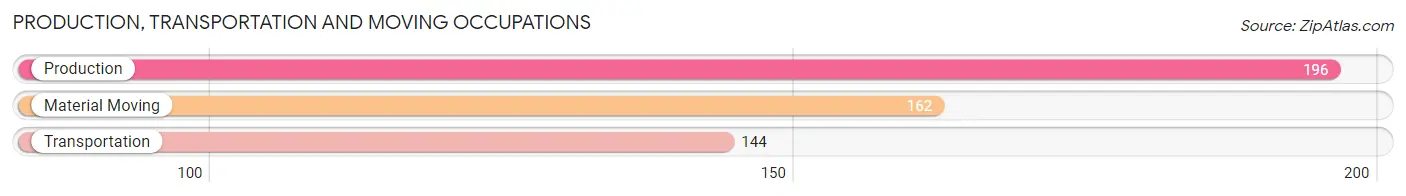
Production, Transportation and Moving Occupations
The most common Production, Transportation and Moving occupations in Whitmore Lake are Production (196 | 4.4%), Material Moving (162 | 3.6%), and Transportation (144 | 3.2%).
Production, Transportation and Moving Occupations by Sex
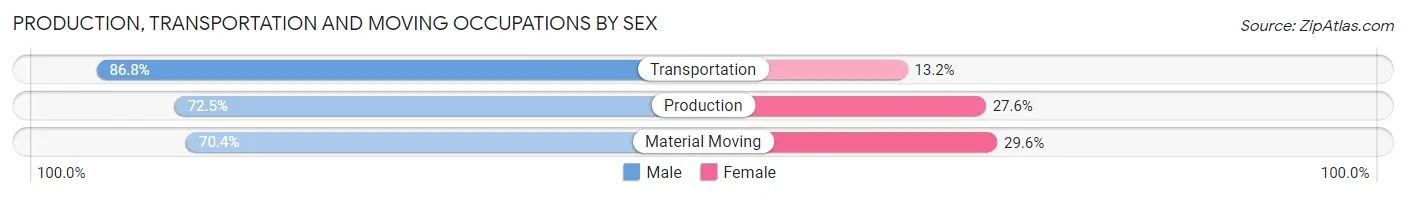
| Occupation | Male | Female |
| Production | 142 (72.5%) | 54 (27.6%) |
| Transportation | 125 (86.8%) | 19 (13.2%) |
| Material Moving | 114 (70.4%) | 48 (29.6%) |
| Total (Category) | 381 (75.9%) | 121 (24.1%) |
| Total (Overall) | 2,532 (57.0%) | 1,908 (43.0%) |
Employment Industries by Sex in Whitmore Lake
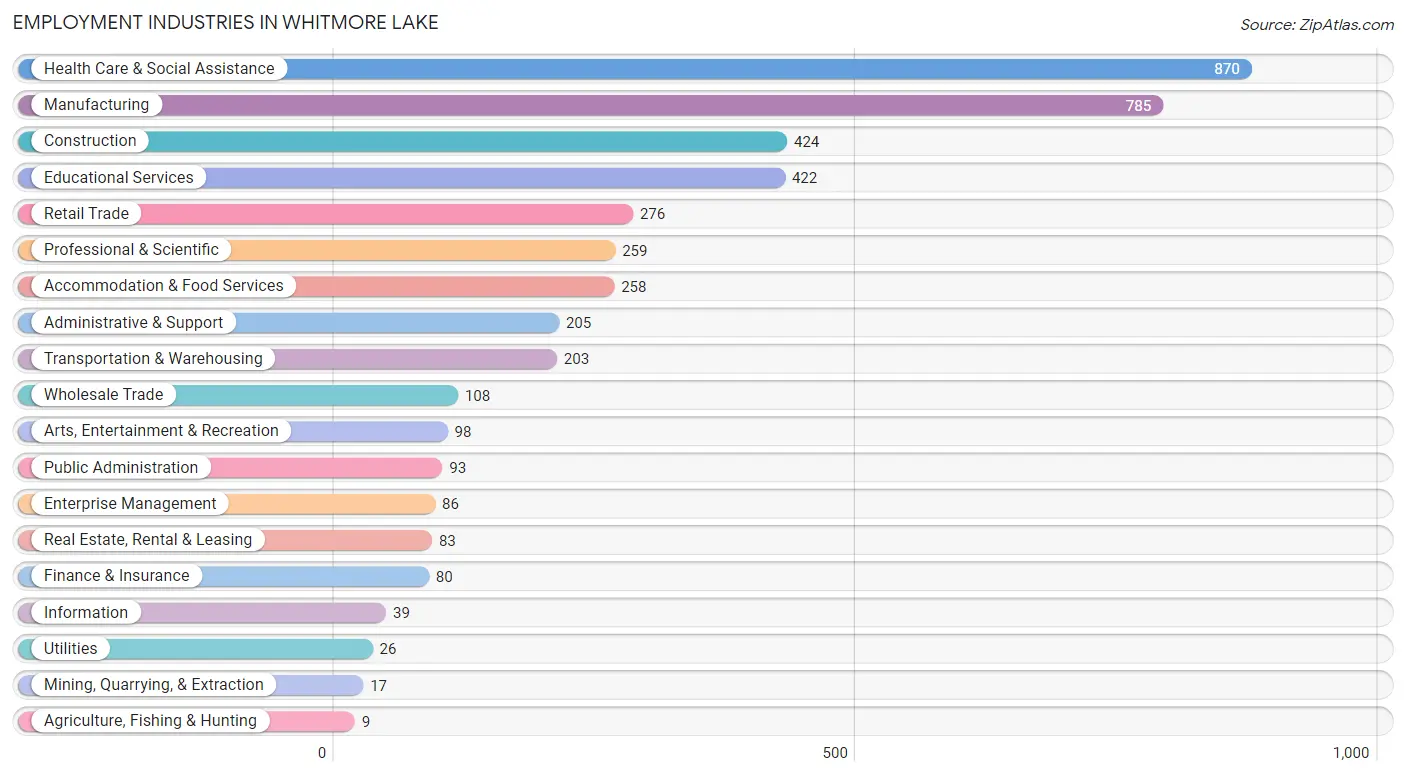
Employment Industries in Whitmore Lake
The major employment industries in Whitmore Lake include Health Care & Social Assistance (870 | 19.6%), Manufacturing (785 | 17.7%), Construction (424 | 9.6%), Educational Services (422 | 9.5%), and Retail Trade (276 | 6.2%).
Employment Industries by Sex in Whitmore Lake
The Whitmore Lake industries that see more men than women are Agriculture, Fishing & Hunting (100.0%), Mining, Quarrying, & Extraction (100.0%), and Wholesale Trade (100.0%), whereas the industries that tend to have a higher number of women are Finance & Insurance (88.7%), Arts, Entertainment & Recreation (79.6%), and Retail Trade (63.8%).
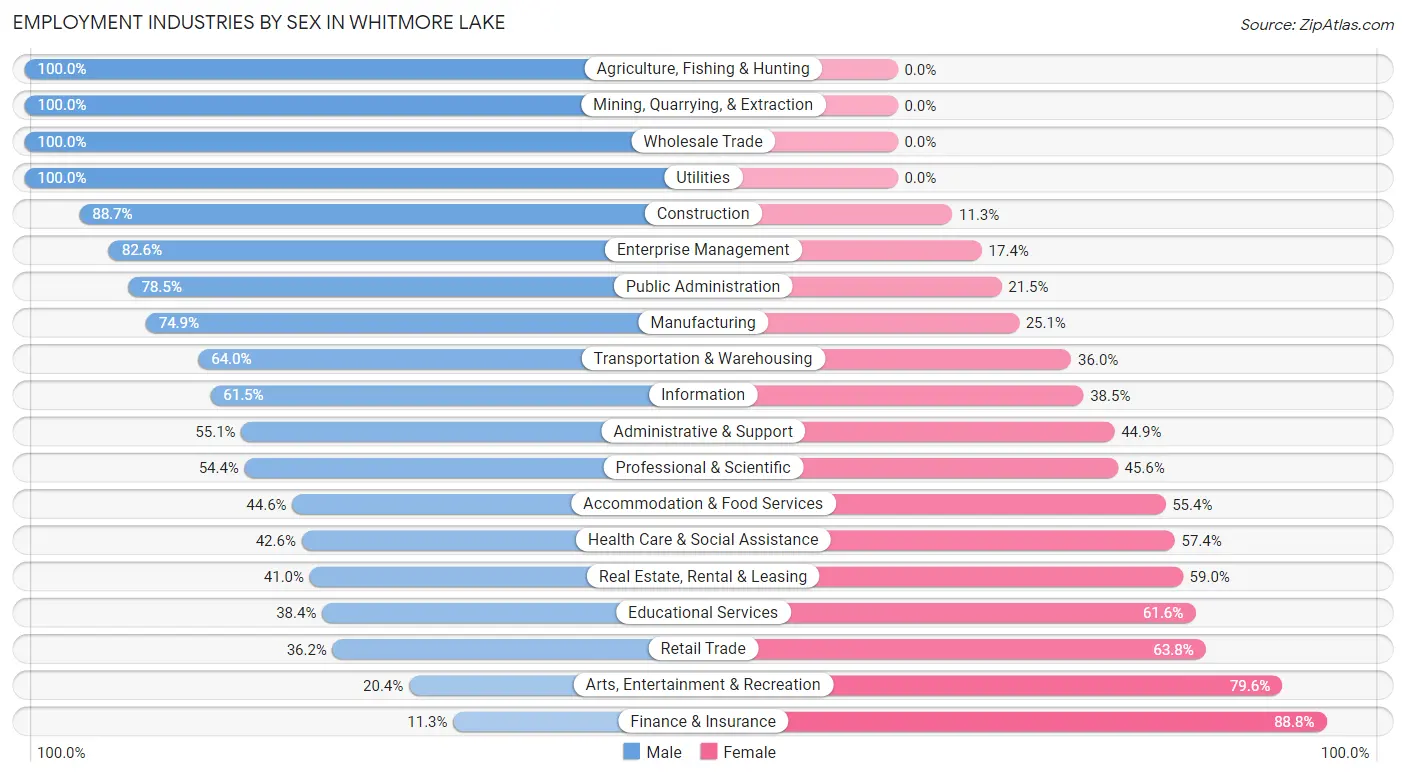
| Industry | Male | Female |
| Agriculture, Fishing & Hunting | 9 (100.0%) | 0 (0.0%) |
| Mining, Quarrying, & Extraction | 17 (100.0%) | 0 (0.0%) |
| Construction | 376 (88.7%) | 48 (11.3%) |
| Manufacturing | 588 (74.9%) | 197 (25.1%) |
| Wholesale Trade | 108 (100.0%) | 0 (0.0%) |
| Retail Trade | 100 (36.2%) | 176 (63.8%) |
| Transportation & Warehousing | 130 (64.0%) | 73 (36.0%) |
| Utilities | 26 (100.0%) | 0 (0.0%) |
| Information | 24 (61.5%) | 15 (38.5%) |
| Finance & Insurance | 9 (11.3%) | 71 (88.7%) |
| Real Estate, Rental & Leasing | 34 (41.0%) | 49 (59.0%) |
| Professional & Scientific | 141 (54.4%) | 118 (45.6%) |
| Enterprise Management | 71 (82.6%) | 15 (17.4%) |
| Administrative & Support | 113 (55.1%) | 92 (44.9%) |
| Educational Services | 162 (38.4%) | 260 (61.6%) |
| Health Care & Social Assistance | 371 (42.6%) | 499 (57.4%) |
| Arts, Entertainment & Recreation | 20 (20.4%) | 78 (79.6%) |
| Accommodation & Food Services | 115 (44.6%) | 143 (55.4%) |
| Public Administration | 73 (78.5%) | 20 (21.5%) |
| Total | 2,532 (57.0%) | 1,908 (43.0%) |
Education in Whitmore Lake
School Enrollment in Whitmore Lake
The most common levels of schooling among the 1,684 students in Whitmore Lake are college / undergraduate (454 | 27.0%), high school (387 | 23.0%), and elementary school (291 | 17.3%).
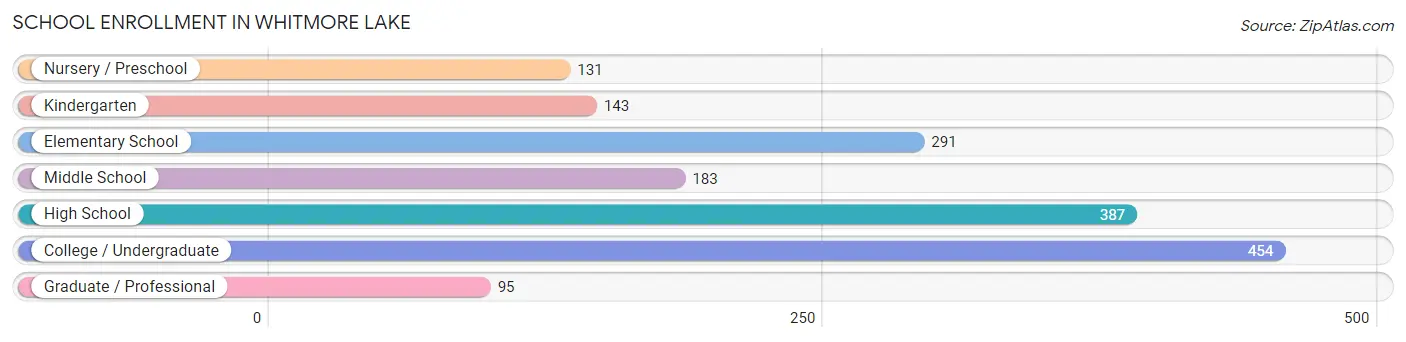
| School Level | # Students | % Students |
| Nursery / Preschool | 131 | 7.8% |
| Kindergarten | 143 | 8.5% |
| Elementary School | 291 | 17.3% |
| Middle School | 183 | 10.9% |
| High School | 387 | 23.0% |
| College / Undergraduate | 454 | 27.0% |
| Graduate / Professional | 95 | 5.6% |
| Total | 1,684 | 100.0% |
School Enrollment by Age by Funding Source in Whitmore Lake
Out of a total of 1,684 students who are enrolled in schools in Whitmore Lake, 263 (15.6%) attend a private institution, while the remaining 1,421 (84.4%) are enrolled in public schools. The age group of 18 to 19 year olds has the highest likelihood of being enrolled in private schools, with 40 (36.4% in the age bracket) enrolled. Conversely, the age group of 15 to 17 year olds has the lowest likelihood of being enrolled in a private school, with 283 (99.0% in the age bracket) attending a public institution.
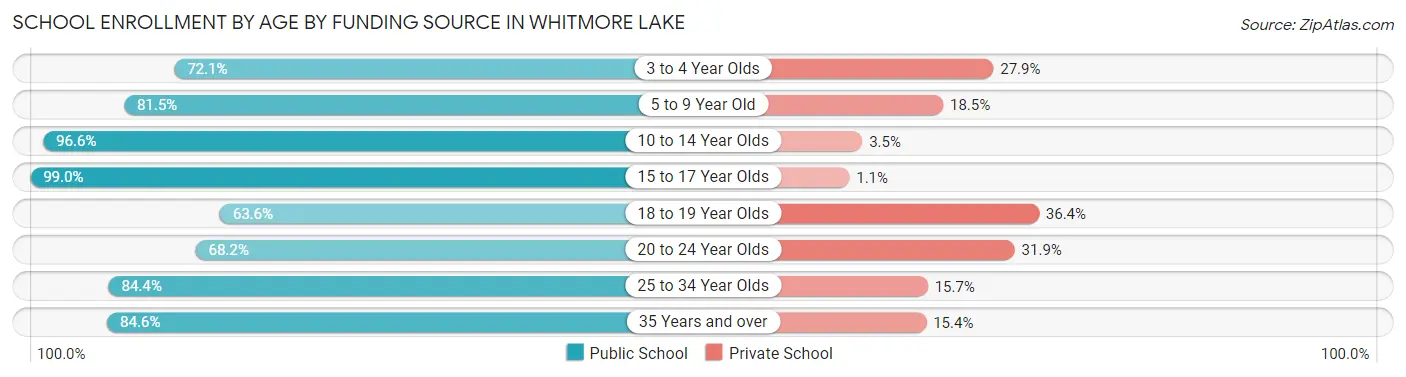
| Age Bracket | Public School | Private School |
| 3 to 4 Year Olds | 88 (72.1%) | 34 (27.9%) |
| 5 to 9 Year Old | 361 (81.5%) | 82 (18.5%) |
| 10 to 14 Year Olds | 252 (96.6%) | 9 (3.5%) |
| 15 to 17 Year Olds | 283 (99.0%) | 3 (1.1%) |
| 18 to 19 Year Olds | 70 (63.6%) | 40 (36.4%) |
| 20 to 24 Year Olds | 92 (68.1%) | 43 (31.9%) |
| 25 to 34 Year Olds | 221 (84.4%) | 41 (15.7%) |
| 35 Years and over | 55 (84.6%) | 10 (15.4%) |
| Total | 1,421 (84.4%) | 263 (15.6%) |
Educational Attainment by Field of Study in Whitmore Lake
Business (574 | 25.6%), science & technology (360 | 16.0%), education (256 | 11.4%), bio, nature & agricultural (179 | 8.0%), and arts & humanities (172 | 7.7%) are the most common fields of study among 2,245 individuals in Whitmore Lake who have obtained a bachelor's degree or higher.
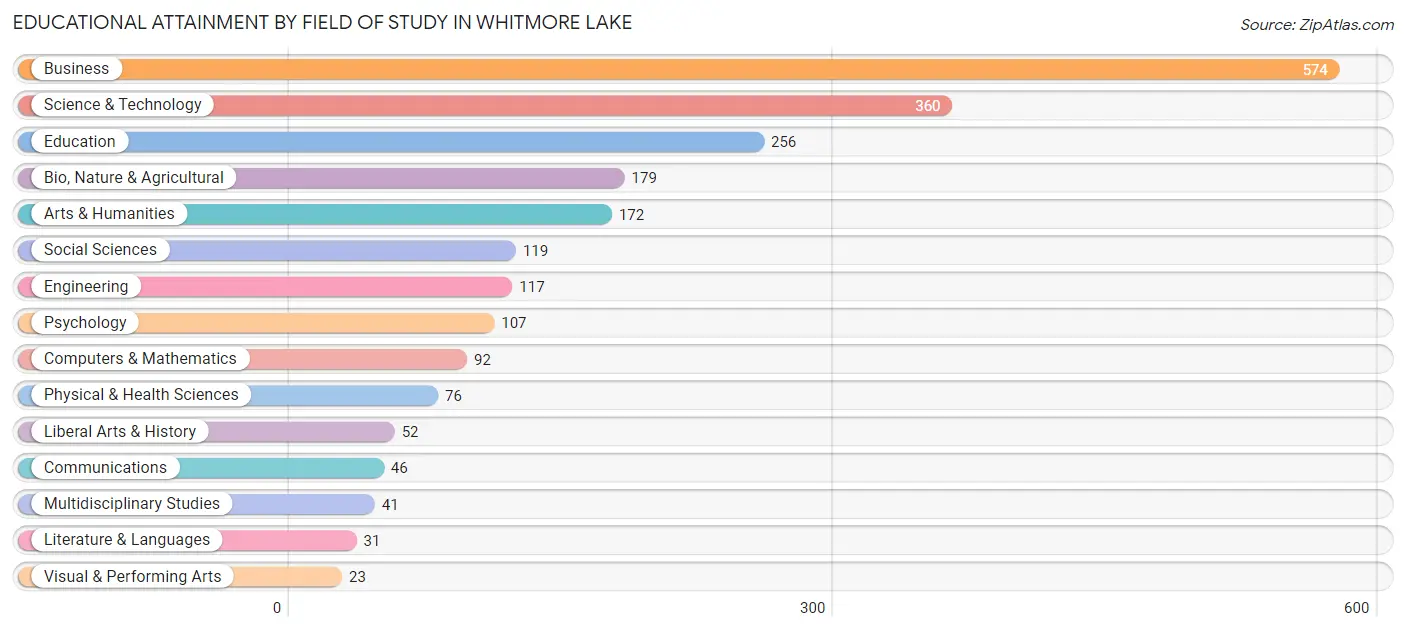
| Field of Study | # Graduates | % Graduates |
| Computers & Mathematics | 92 | 4.1% |
| Bio, Nature & Agricultural | 179 | 8.0% |
| Physical & Health Sciences | 76 | 3.4% |
| Psychology | 107 | 4.8% |
| Social Sciences | 119 | 5.3% |
| Engineering | 117 | 5.2% |
| Multidisciplinary Studies | 41 | 1.8% |
| Science & Technology | 360 | 16.0% |
| Business | 574 | 25.6% |
| Education | 256 | 11.4% |
| Literature & Languages | 31 | 1.4% |
| Liberal Arts & History | 52 | 2.3% |
| Visual & Performing Arts | 23 | 1.0% |
| Communications | 46 | 2.1% |
| Arts & Humanities | 172 | 7.7% |
| Total | 2,245 | 100.0% |
Transportation & Commute in Whitmore Lake
Vehicle Availability by Sex in Whitmore Lake
The most prevalent vehicle ownership categories in Whitmore Lake are males with 2 vehicles (1,210, accounting for 48.0%) and females with 2 vehicles (1,098, making up 65.2%).
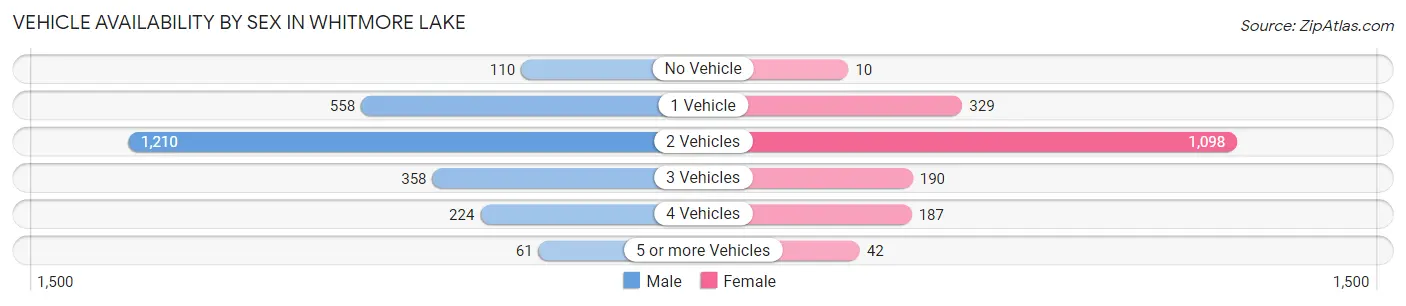
| Vehicles Available | Male | Female |
| No Vehicle | 110 (4.4%) | 10 (0.5%) |
| 1 Vehicle | 558 (22.1%) | 329 (17.7%) |
| 2 Vehicles | 1,210 (48.0%) | 1,098 (59.2%) |
| 3 Vehicles | 358 (14.2%) | 190 (10.2%) |
| 4 Vehicles | 224 (8.9%) | 187 (10.1%) |
| 5 or more Vehicles | 61 (2.4%) | 42 (2.3%) |
| Total | 2,521 (100.0%) | 1,856 (100.0%) |
Commute Time in Whitmore Lake
The most frequently occuring commute durations in Whitmore Lake are 20 to 24 minutes (744 commuters, 19.5%), 15 to 19 minutes (682 commuters, 17.8%), and 30 to 34 minutes (610 commuters, 16.0%).
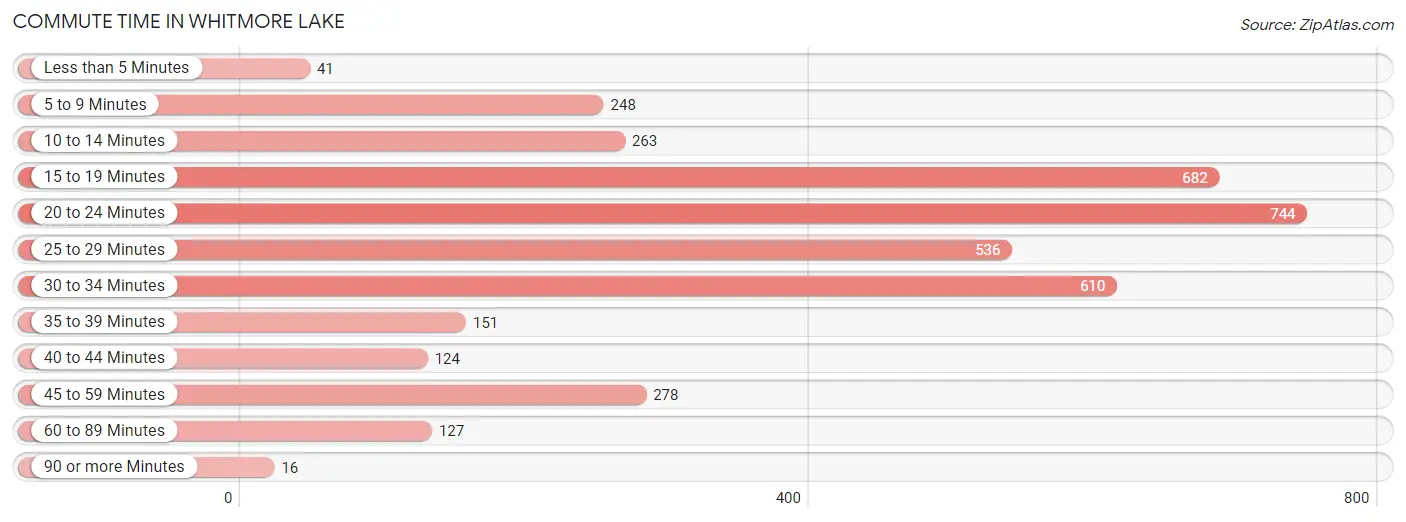
| Commute Time | # Commuters | % Commuters |
| Less than 5 Minutes | 41 | 1.1% |
| 5 to 9 Minutes | 248 | 6.5% |
| 10 to 14 Minutes | 263 | 6.9% |
| 15 to 19 Minutes | 682 | 17.8% |
| 20 to 24 Minutes | 744 | 19.5% |
| 25 to 29 Minutes | 536 | 14.0% |
| 30 to 34 Minutes | 610 | 16.0% |
| 35 to 39 Minutes | 151 | 4.0% |
| 40 to 44 Minutes | 124 | 3.3% |
| 45 to 59 Minutes | 278 | 7.3% |
| 60 to 89 Minutes | 127 | 3.3% |
| 90 or more Minutes | 16 | 0.4% |
Commute Time by Sex in Whitmore Lake
The most common commute times in Whitmore Lake are 25 to 29 minutes (395 commuters, 18.4%) for males and 20 to 24 minutes (367 commuters, 21.9%) for females.
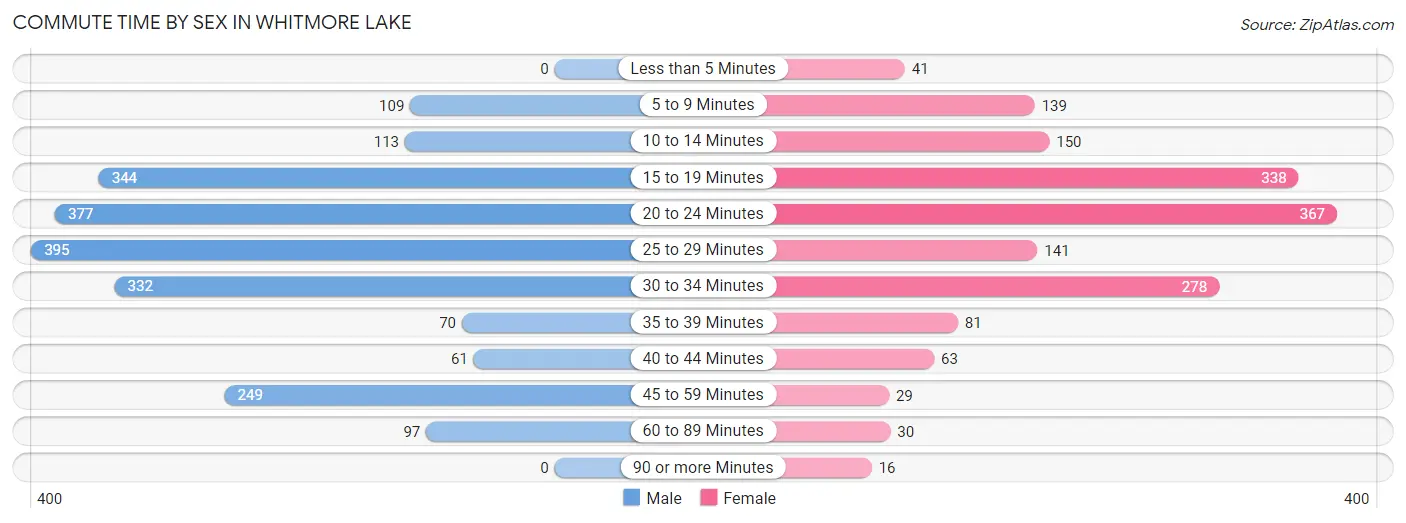
| Commute Time | Male | Female |
| Less than 5 Minutes | 0 (0.0%) | 41 (2.5%) |
| 5 to 9 Minutes | 109 (5.1%) | 139 (8.3%) |
| 10 to 14 Minutes | 113 (5.3%) | 150 (9.0%) |
| 15 to 19 Minutes | 344 (16.0%) | 338 (20.2%) |
| 20 to 24 Minutes | 377 (17.6%) | 367 (21.9%) |
| 25 to 29 Minutes | 395 (18.4%) | 141 (8.4%) |
| 30 to 34 Minutes | 332 (15.5%) | 278 (16.6%) |
| 35 to 39 Minutes | 70 (3.3%) | 81 (4.8%) |
| 40 to 44 Minutes | 61 (2.8%) | 63 (3.8%) |
| 45 to 59 Minutes | 249 (11.6%) | 29 (1.7%) |
| 60 to 89 Minutes | 97 (4.5%) | 30 (1.8%) |
| 90 or more Minutes | 0 (0.0%) | 16 (1.0%) |
Time of Departure to Work by Sex in Whitmore Lake
The most frequent times of departure to work in Whitmore Lake are 7:00 AM to 7:29 AM (382, 17.8%) for males and 6:30 AM to 6:59 AM (316, 18.9%) for females.
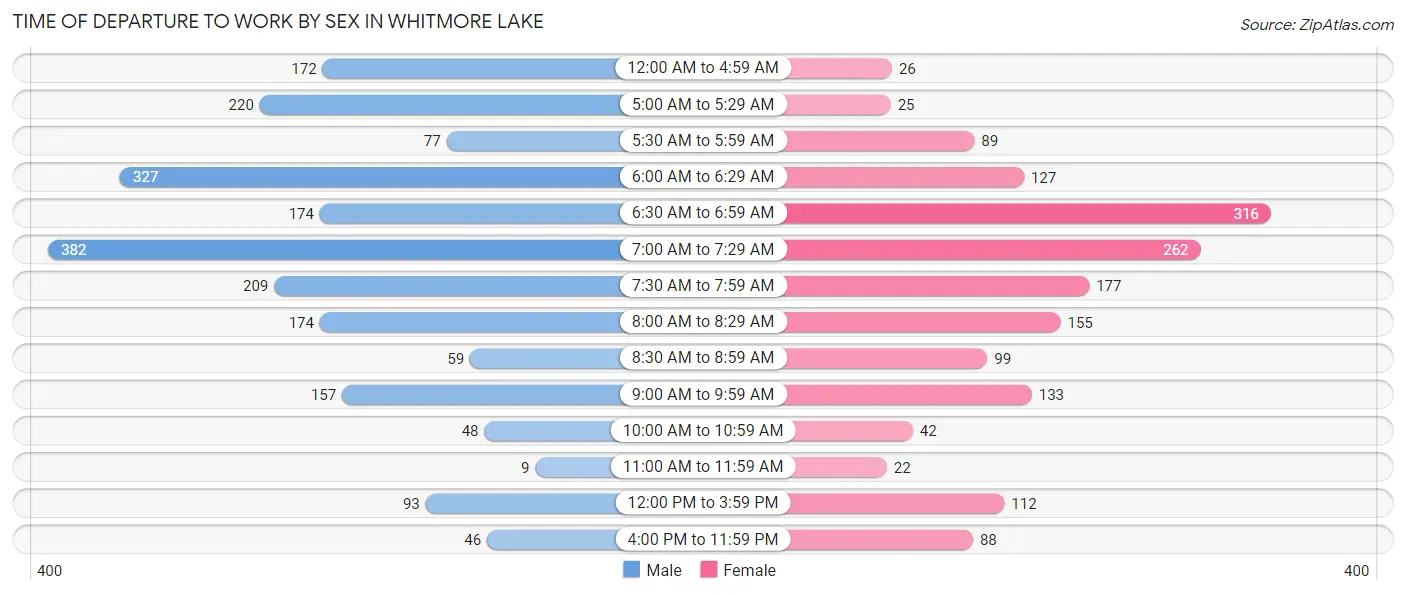
| Time of Departure | Male | Female |
| 12:00 AM to 4:59 AM | 172 (8.0%) | 26 (1.5%) |
| 5:00 AM to 5:29 AM | 220 (10.2%) | 25 (1.5%) |
| 5:30 AM to 5:59 AM | 77 (3.6%) | 89 (5.3%) |
| 6:00 AM to 6:29 AM | 327 (15.2%) | 127 (7.6%) |
| 6:30 AM to 6:59 AM | 174 (8.1%) | 316 (18.9%) |
| 7:00 AM to 7:29 AM | 382 (17.8%) | 262 (15.7%) |
| 7:30 AM to 7:59 AM | 209 (9.7%) | 177 (10.6%) |
| 8:00 AM to 8:29 AM | 174 (8.1%) | 155 (9.3%) |
| 8:30 AM to 8:59 AM | 59 (2.8%) | 99 (5.9%) |
| 9:00 AM to 9:59 AM | 157 (7.3%) | 133 (8.0%) |
| 10:00 AM to 10:59 AM | 48 (2.2%) | 42 (2.5%) |
| 11:00 AM to 11:59 AM | 9 (0.4%) | 22 (1.3%) |
| 12:00 PM to 3:59 PM | 93 (4.3%) | 112 (6.7%) |
| 4:00 PM to 11:59 PM | 46 (2.1%) | 88 (5.3%) |
| Total | 2,147 (100.0%) | 1,673 (100.0%) |
Housing Occupancy in Whitmore Lake
Occupancy by Ownership in Whitmore Lake
Of the total 3,618 dwellings in Whitmore Lake, owner-occupied units account for 2,550 (70.5%), while renter-occupied units make up 1,068 (29.5%).
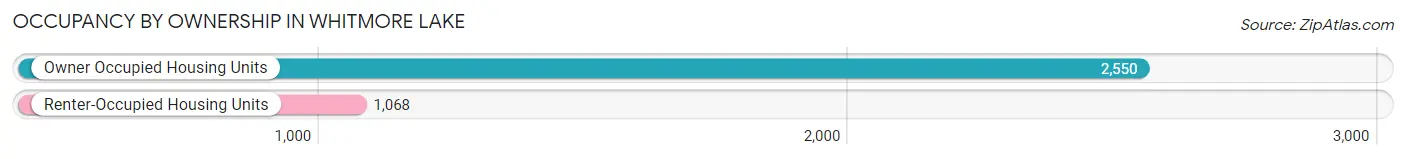
| Occupancy | # Housing Units | % Housing Units |
| Owner Occupied Housing Units | 2,550 | 70.5% |
| Renter-Occupied Housing Units | 1,068 | 29.5% |
| Total Occupied Housing Units | 3,618 | 100.0% |
Occupancy by Household Size in Whitmore Lake
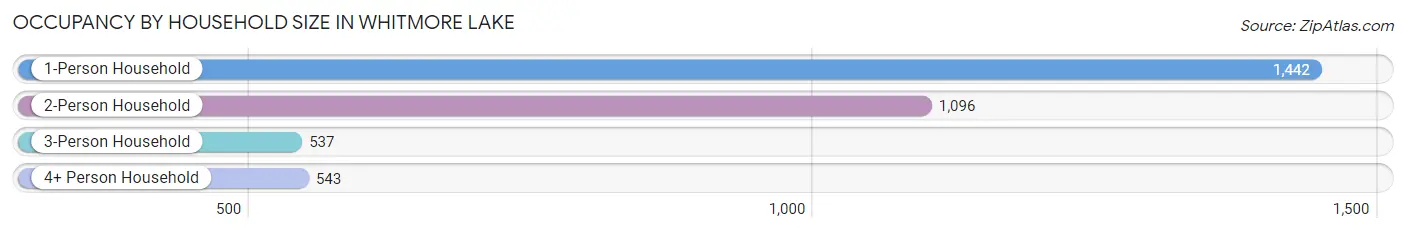
| Household Size | # Housing Units | % Housing Units |
| 1-Person Household | 1,442 | 39.9% |
| 2-Person Household | 1,096 | 30.3% |
| 3-Person Household | 537 | 14.8% |
| 4+ Person Household | 543 | 15.0% |
| Total Housing Units | 3,618 | 100.0% |
Occupancy by Ownership by Household Size in Whitmore Lake
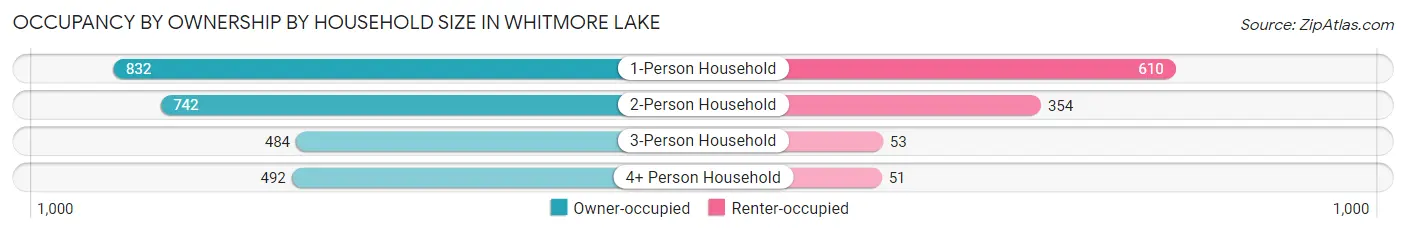
| Household Size | Owner-occupied | Renter-occupied |
| 1-Person Household | 832 (57.7%) | 610 (42.3%) |
| 2-Person Household | 742 (67.7%) | 354 (32.3%) |
| 3-Person Household | 484 (90.1%) | 53 (9.9%) |
| 4+ Person Household | 492 (90.6%) | 51 (9.4%) |
| Total Housing Units | 2,550 (70.5%) | 1,068 (29.5%) |
Occupancy by Educational Attainment in Whitmore Lake
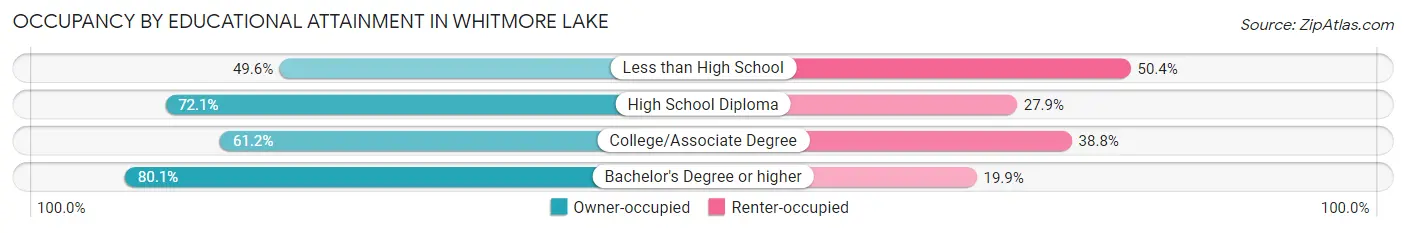
| Household Size | Owner-occupied | Renter-occupied |
| Less than High School | 56 (49.6%) | 57 (50.4%) |
| High School Diploma | 582 (72.1%) | 225 (27.9%) |
| College/Associate Degree | 809 (61.2%) | 512 (38.8%) |
| Bachelor's Degree or higher | 1,103 (80.1%) | 274 (19.9%) |
Occupancy by Age of Householder in Whitmore Lake
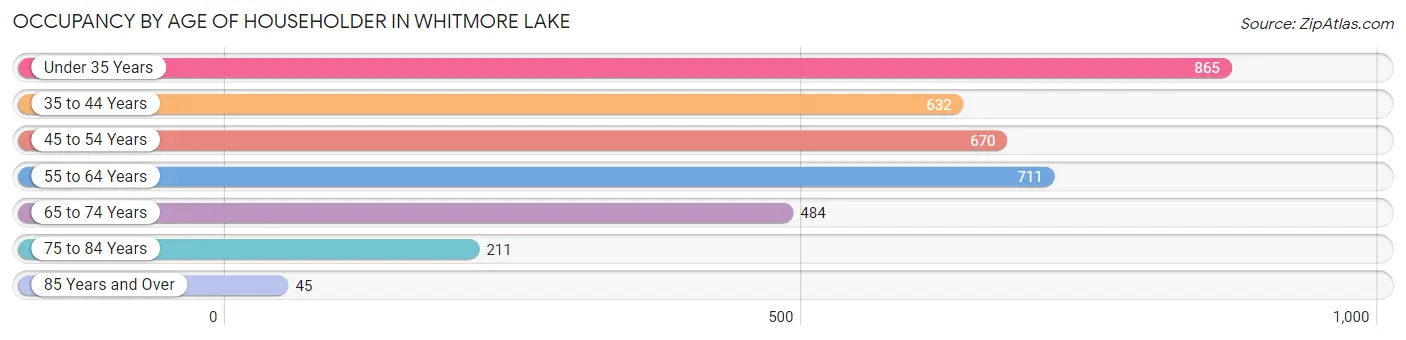
| Age Bracket | # Households | % Households |
| Under 35 Years | 865 | 23.9% |
| 35 to 44 Years | 632 | 17.5% |
| 45 to 54 Years | 670 | 18.5% |
| 55 to 64 Years | 711 | 19.7% |
| 65 to 74 Years | 484 | 13.4% |
| 75 to 84 Years | 211 | 5.8% |
| 85 Years and Over | 45 | 1.2% |
| Total | 3,618 | 100.0% |
Housing Finances in Whitmore Lake
Median Income by Occupancy in Whitmore Lake
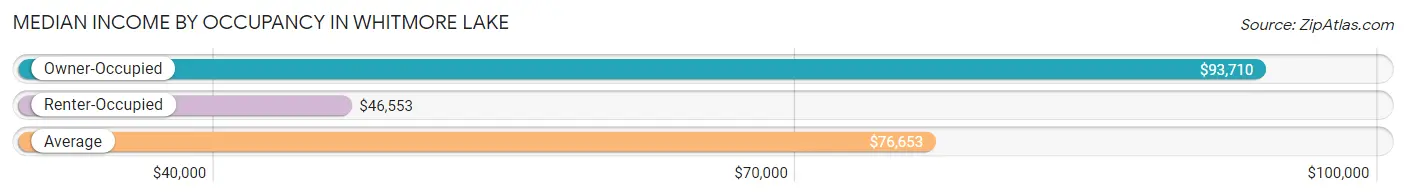
| Occupancy Type | # Households | Median Income |
| Owner-Occupied | 2,550 (70.5%) | $93,710 |
| Renter-Occupied | 1,068 (29.5%) | $46,553 |
| Average | 3,618 (100.0%) | $76,653 |
Occupancy by Householder Income Bracket in Whitmore Lake
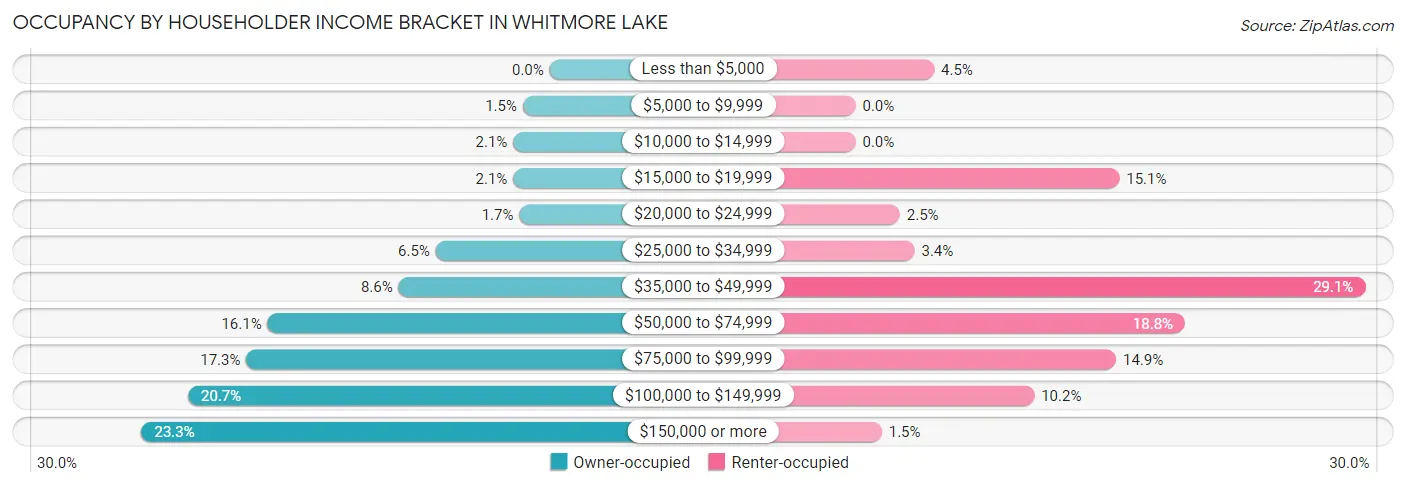
| Income Bracket | Owner-occupied | Renter-occupied |
| Less than $5,000 | 0 (0.0%) | 48 (4.5%) |
| $5,000 to $9,999 | 39 (1.5%) | 0 (0.0%) |
| $10,000 to $14,999 | 53 (2.1%) | 0 (0.0%) |
| $15,000 to $19,999 | 53 (2.1%) | 161 (15.1%) |
| $20,000 to $24,999 | 44 (1.7%) | 27 (2.5%) |
| $25,000 to $34,999 | 166 (6.5%) | 36 (3.4%) |
| $35,000 to $49,999 | 220 (8.6%) | 311 (29.1%) |
| $50,000 to $74,999 | 411 (16.1%) | 201 (18.8%) |
| $75,000 to $99,999 | 442 (17.3%) | 159 (14.9%) |
| $100,000 to $149,999 | 527 (20.7%) | 109 (10.2%) |
| $150,000 or more | 595 (23.3%) | 16 (1.5%) |
| Total | 2,550 (100.0%) | 1,068 (100.0%) |
Monthly Housing Cost Tiers in Whitmore Lake
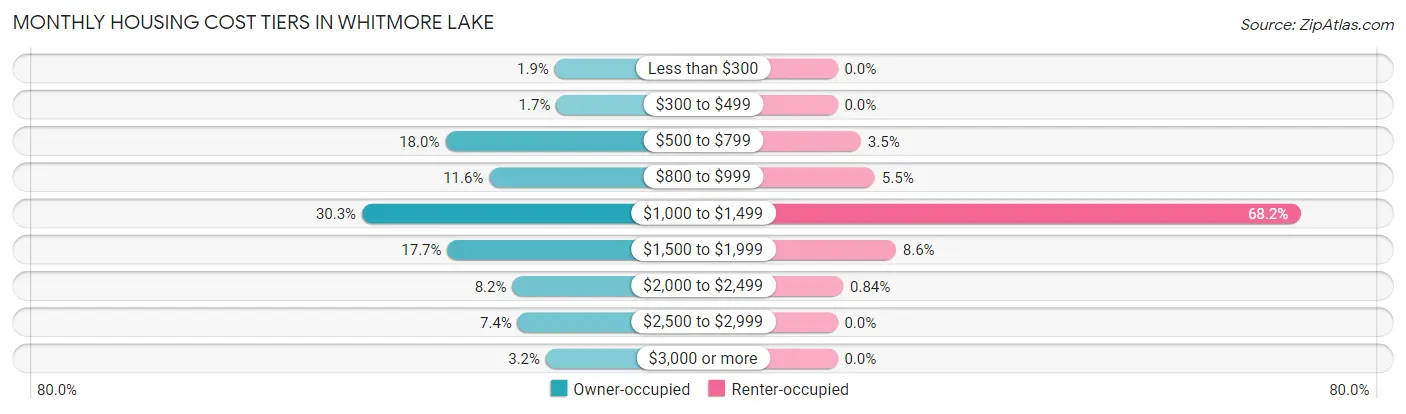
| Monthly Cost | Owner-occupied | Renter-occupied |
| Less than $300 | 49 (1.9%) | 0 (0.0%) |
| $300 to $499 | 43 (1.7%) | 0 (0.0%) |
| $500 to $799 | 460 (18.0%) | 37 (3.5%) |
| $800 to $999 | 295 (11.6%) | 59 (5.5%) |
| $1,000 to $1,499 | 773 (30.3%) | 728 (68.2%) |
| $1,500 to $1,999 | 452 (17.7%) | 92 (8.6%) |
| $2,000 to $2,499 | 208 (8.2%) | 9 (0.8%) |
| $2,500 to $2,999 | 188 (7.4%) | 0 (0.0%) |
| $3,000 or more | 82 (3.2%) | 0 (0.0%) |
| Total | 2,550 (100.0%) | 1,068 (100.0%) |
Physical Housing Characteristics in Whitmore Lake
Housing Structures in Whitmore Lake
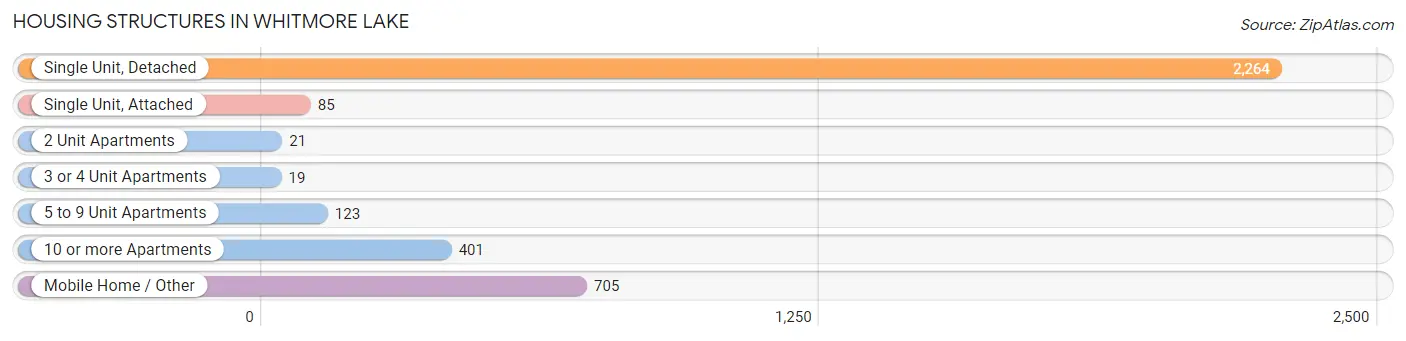
| Structure Type | # Housing Units | % Housing Units |
| Single Unit, Detached | 2,264 | 62.6% |
| Single Unit, Attached | 85 | 2.4% |
| 2 Unit Apartments | 21 | 0.6% |
| 3 or 4 Unit Apartments | 19 | 0.5% |
| 5 to 9 Unit Apartments | 123 | 3.4% |
| 10 or more Apartments | 401 | 11.1% |
| Mobile Home / Other | 705 | 19.5% |
| Total | 3,618 | 100.0% |
Housing Structures by Occupancy in Whitmore Lake
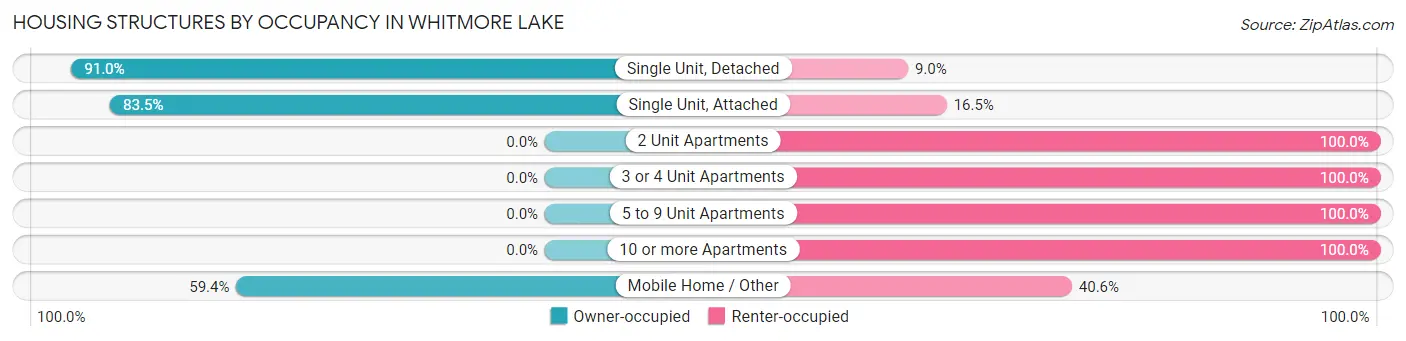
| Structure Type | Owner-occupied | Renter-occupied |
| Single Unit, Detached | 2,060 (91.0%) | 204 (9.0%) |
| Single Unit, Attached | 71 (83.5%) | 14 (16.5%) |
| 2 Unit Apartments | 0 (0.0%) | 21 (100.0%) |
| 3 or 4 Unit Apartments | 0 (0.0%) | 19 (100.0%) |
| 5 to 9 Unit Apartments | 0 (0.0%) | 123 (100.0%) |
| 10 or more Apartments | 0 (0.0%) | 401 (100.0%) |
| Mobile Home / Other | 419 (59.4%) | 286 (40.6%) |
| Total | 2,550 (70.5%) | 1,068 (29.5%) |
Housing Structures by Number of Rooms in Whitmore Lake
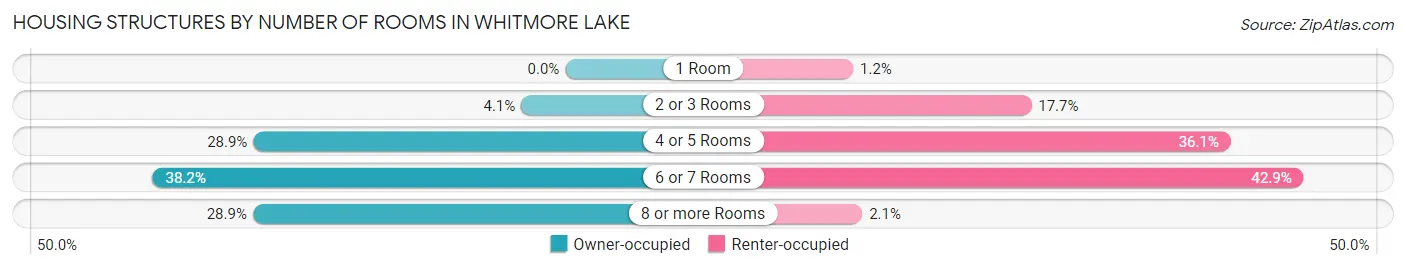
| Number of Rooms | Owner-occupied | Renter-occupied |
| 1 Room | 0 (0.0%) | 13 (1.2%) |
| 2 or 3 Rooms | 104 (4.1%) | 189 (17.7%) |
| 4 or 5 Rooms | 736 (28.9%) | 386 (36.1%) |
| 6 or 7 Rooms | 973 (38.2%) | 458 (42.9%) |
| 8 or more Rooms | 737 (28.9%) | 22 (2.1%) |
| Total | 2,550 (100.0%) | 1,068 (100.0%) |
Housing Structure by Heating Type in Whitmore Lake
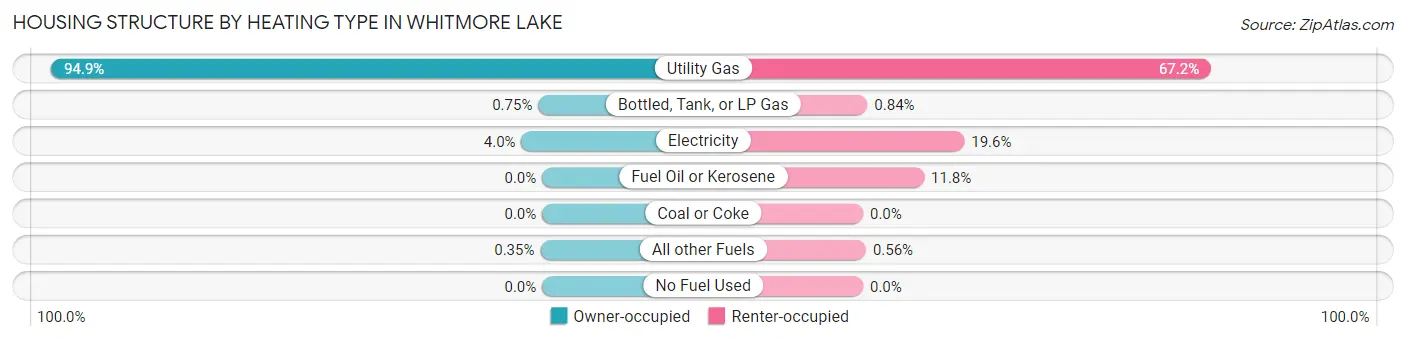
| Heating Type | Owner-occupied | Renter-occupied |
| Utility Gas | 2,420 (94.9%) | 718 (67.2%) |
| Bottled, Tank, or LP Gas | 19 (0.7%) | 9 (0.8%) |
| Electricity | 102 (4.0%) | 209 (19.6%) |
| Fuel Oil or Kerosene | 0 (0.0%) | 126 (11.8%) |
| Coal or Coke | 0 (0.0%) | 0 (0.0%) |
| All other Fuels | 9 (0.4%) | 6 (0.6%) |
| No Fuel Used | 0 (0.0%) | 0 (0.0%) |
| Total | 2,550 (100.0%) | 1,068 (100.0%) |
Household Vehicle Usage in Whitmore Lake
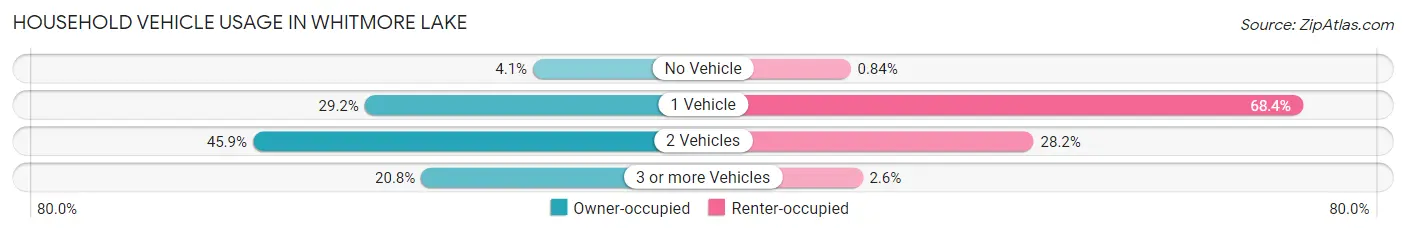
| Vehicles per Household | Owner-occupied | Renter-occupied |
| No Vehicle | 104 (4.1%) | 9 (0.8%) |
| 1 Vehicle | 745 (29.2%) | 730 (68.3%) |
| 2 Vehicles | 1,171 (45.9%) | 301 (28.2%) |
| 3 or more Vehicles | 530 (20.8%) | 28 (2.6%) |
| Total | 2,550 (100.0%) | 1,068 (100.0%) |
Real Estate & Mortgages in Whitmore Lake
Real Estate and Mortgage Overview in Whitmore Lake
| Characteristic | Without Mortgage | With Mortgage |
| Housing Units | 769 | 1,781 |
| Median Property Value | $205,800 | $271,200 |
| Median Household Income | $54,176 | $524 |
| Monthly Housing Costs | $698 | $82 |
| Real Estate Taxes | $3,327 | $21 |
Property Value by Mortgage Status in Whitmore Lake
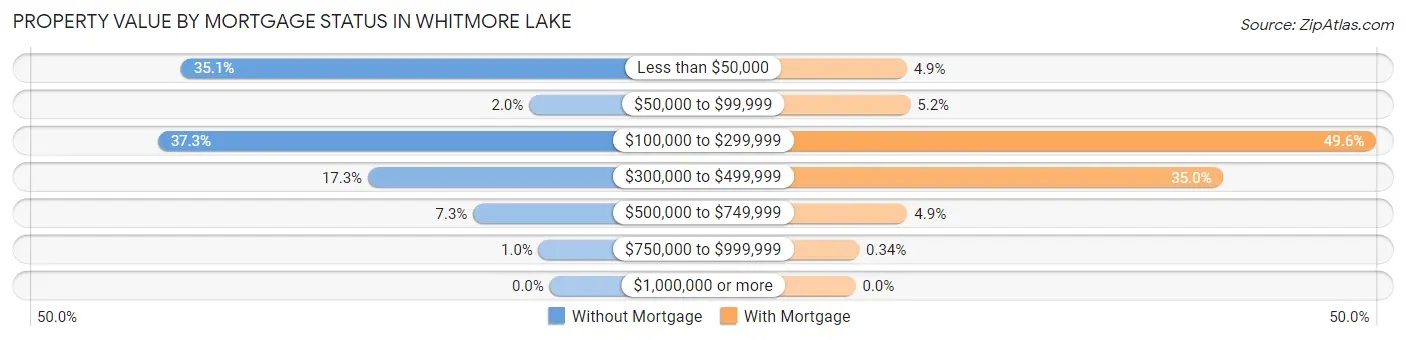
| Property Value | Without Mortgage | With Mortgage |
| Less than $50,000 | 270 (35.1%) | 87 (4.9%) |
| $50,000 to $99,999 | 15 (1.9%) | 93 (5.2%) |
| $100,000 to $299,999 | 287 (37.3%) | 883 (49.6%) |
| $300,000 to $499,999 | 133 (17.3%) | 624 (35.0%) |
| $500,000 to $749,999 | 56 (7.3%) | 88 (4.9%) |
| $750,000 to $999,999 | 8 (1.0%) | 6 (0.3%) |
| $1,000,000 or more | 0 (0.0%) | 0 (0.0%) |
| Total | 769 (100.0%) | 1,781 (100.0%) |
Household Income by Mortgage Status in Whitmore Lake
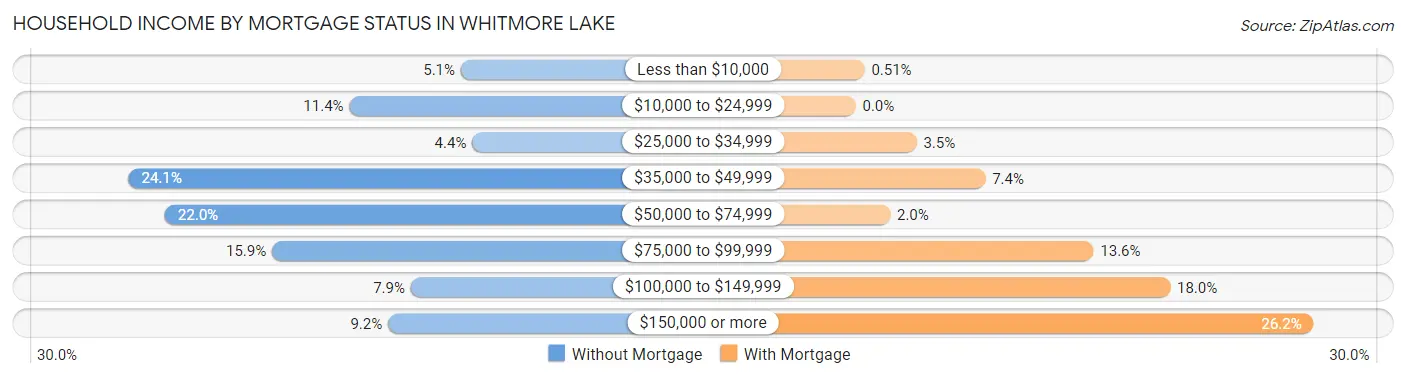
| Household Income | Without Mortgage | With Mortgage |
| Less than $10,000 | 39 (5.1%) | 9 (0.5%) |
| $10,000 to $24,999 | 88 (11.4%) | 0 (0.0%) |
| $25,000 to $34,999 | 34 (4.4%) | 62 (3.5%) |
| $35,000 to $49,999 | 185 (24.1%) | 132 (7.4%) |
| $50,000 to $74,999 | 169 (22.0%) | 35 (2.0%) |
| $75,000 to $99,999 | 122 (15.9%) | 242 (13.6%) |
| $100,000 to $149,999 | 61 (7.9%) | 320 (18.0%) |
| $150,000 or more | 71 (9.2%) | 466 (26.2%) |
| Total | 769 (100.0%) | 1,781 (100.0%) |
Property Value to Household Income Ratio in Whitmore Lake
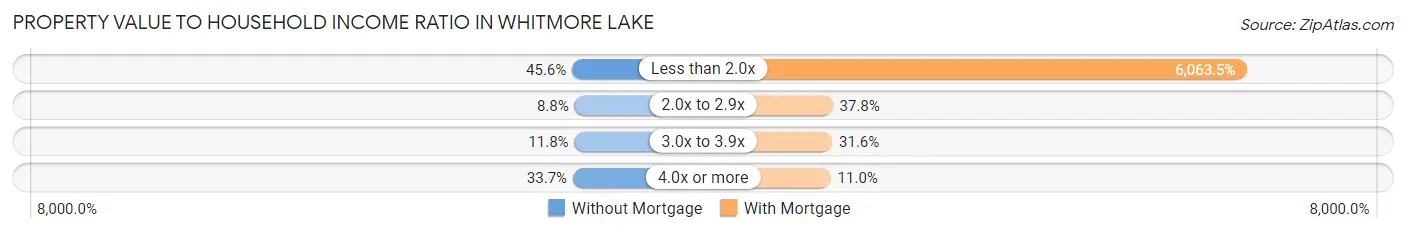
| Value-to-Income Ratio | Without Mortgage | With Mortgage |
| Less than 2.0x | 351 (45.6%) | 107,991 (6,063.5%) |
| 2.0x to 2.9x | 68 (8.8%) | 674 (37.8%) |
| 3.0x to 3.9x | 91 (11.8%) | 563 (31.6%) |
| 4.0x or more | 259 (33.7%) | 196 (11.0%) |
| Total | 769 (100.0%) | 1,781 (100.0%) |
Real Estate Taxes by Mortgage Status in Whitmore Lake
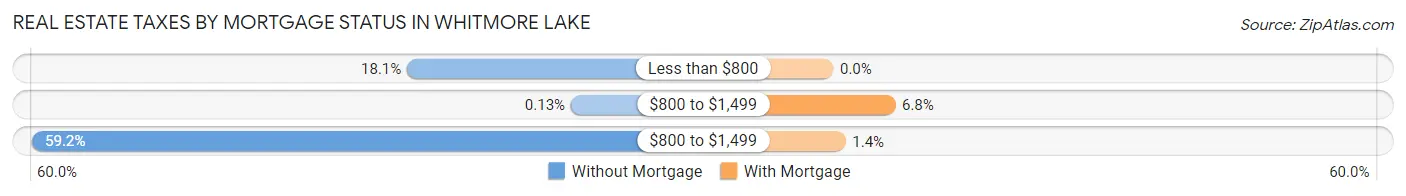
| Property Taxes | Without Mortgage | With Mortgage |
| Less than $800 | 139 (18.1%) | 0 (0.0%) |
| $800 to $1,499 | 1 (0.1%) | 121 (6.8%) |
| $800 to $1,499 | 455 (59.2%) | 24 (1.3%) |
| Total | 769 (100.0%) | 1,781 (100.0%) |
Health & Disability in Whitmore Lake
Health Insurance Coverage by Age in Whitmore Lake
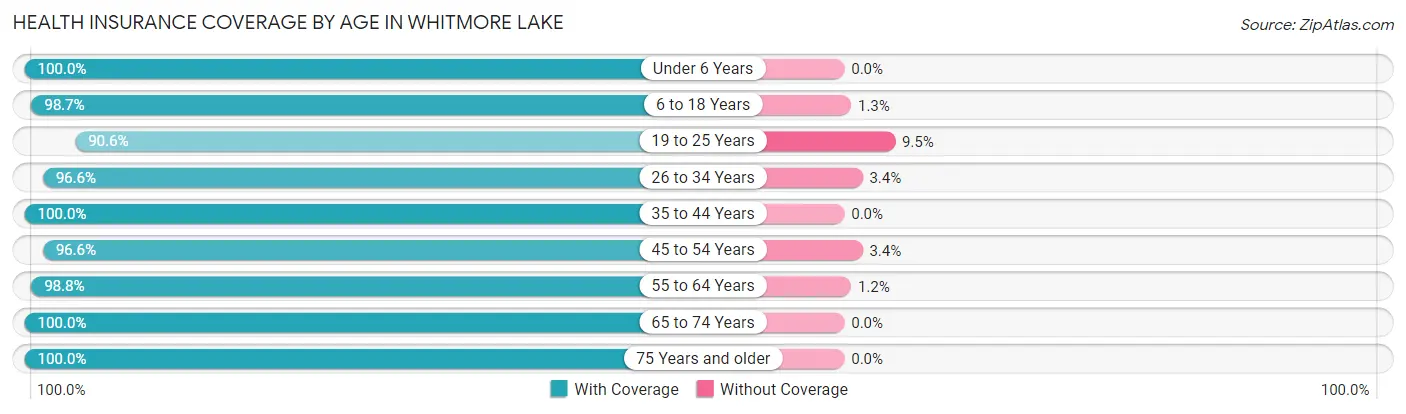
| Age Bracket | With Coverage | Without Coverage |
| Under 6 Years | 634 (100.0%) | 0 (0.0%) |
| 6 to 18 Years | 944 (98.7%) | 12 (1.3%) |
| 19 to 25 Years | 623 (90.5%) | 65 (9.5%) |
| 26 to 34 Years | 1,201 (96.6%) | 42 (3.4%) |
| 35 to 44 Years | 1,115 (100.0%) | 0 (0.0%) |
| 45 to 54 Years | 1,055 (96.6%) | 37 (3.4%) |
| 55 to 64 Years | 1,039 (98.8%) | 13 (1.2%) |
| 65 to 74 Years | 676 (100.0%) | 0 (0.0%) |
| 75 Years and older | 427 (100.0%) | 0 (0.0%) |
| Total | 7,714 (97.9%) | 169 (2.1%) |
Health Insurance Coverage by Citizenship Status in Whitmore Lake
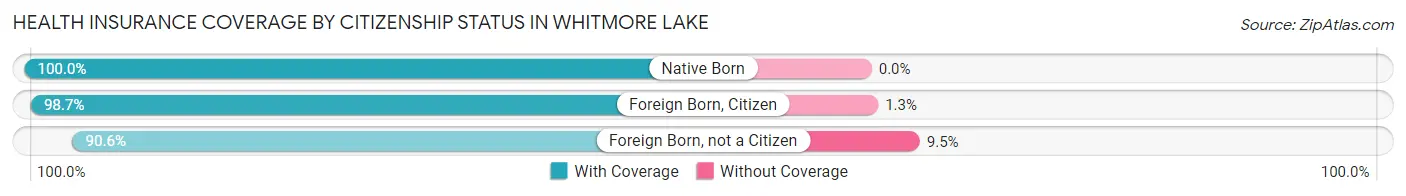
| Citizenship Status | With Coverage | Without Coverage |
| Native Born | 634 (100.0%) | 0 (0.0%) |
| Foreign Born, Citizen | 944 (98.7%) | 12 (1.3%) |
| Foreign Born, not a Citizen | 623 (90.5%) | 65 (9.5%) |
Health Insurance Coverage by Household Income in Whitmore Lake
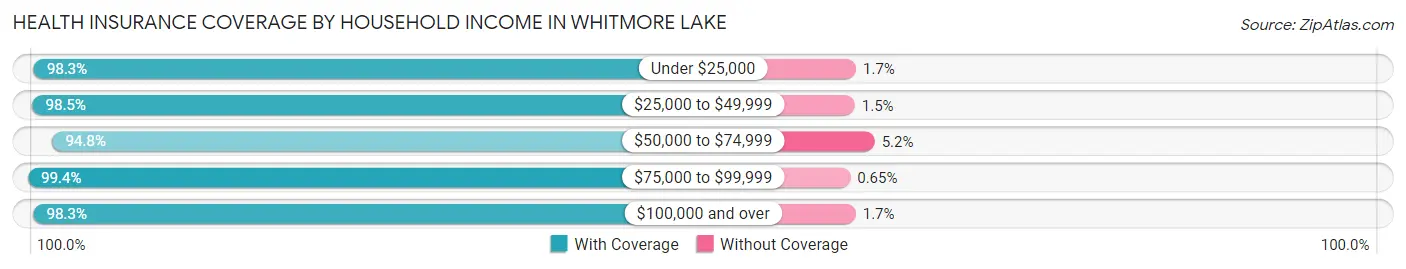
| Household Income | With Coverage | Without Coverage |
| Under $25,000 | 509 (98.3%) | 9 (1.7%) |
| $25,000 to $49,999 | 976 (98.5%) | 15 (1.5%) |
| $50,000 to $74,999 | 1,105 (94.8%) | 61 (5.2%) |
| $75,000 to $99,999 | 1,374 (99.4%) | 9 (0.6%) |
| $100,000 and over | 3,661 (98.3%) | 63 (1.7%) |
Public vs Private Health Insurance Coverage by Age in Whitmore Lake
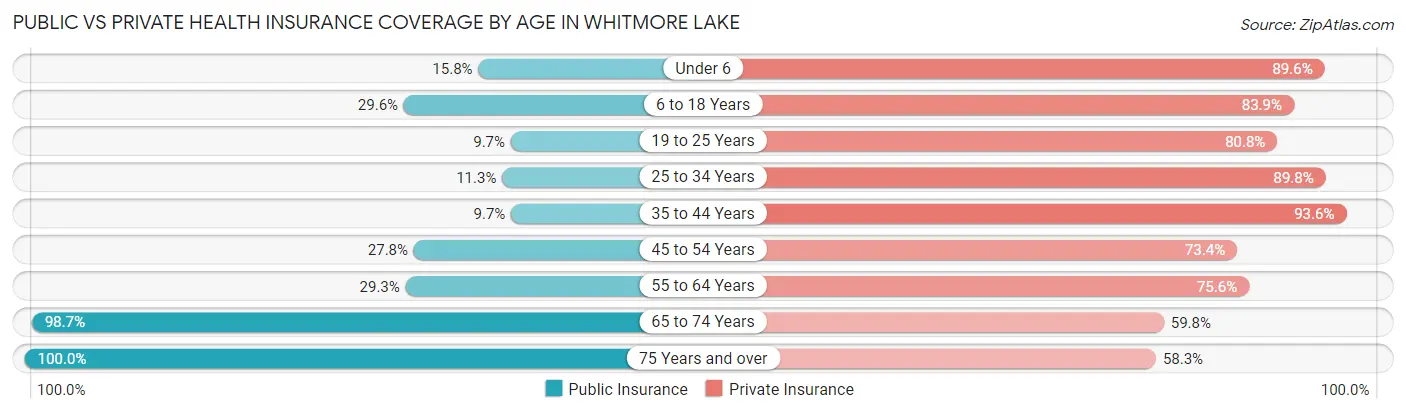
| Age Bracket | Public Insurance | Private Insurance |
| Under 6 | 100 (15.8%) | 568 (89.6%) |
| 6 to 18 Years | 283 (29.6%) | 802 (83.9%) |
| 19 to 25 Years | 67 (9.7%) | 556 (80.8%) |
| 25 to 34 Years | 141 (11.3%) | 1,116 (89.8%) |
| 35 to 44 Years | 108 (9.7%) | 1,044 (93.6%) |
| 45 to 54 Years | 303 (27.8%) | 801 (73.4%) |
| 55 to 64 Years | 308 (29.3%) | 795 (75.6%) |
| 65 to 74 Years | 667 (98.7%) | 404 (59.8%) |
| 75 Years and over | 427 (100.0%) | 249 (58.3%) |
| Total | 2,404 (30.5%) | 6,335 (80.4%) |
Disability Status by Sex by Age in Whitmore Lake
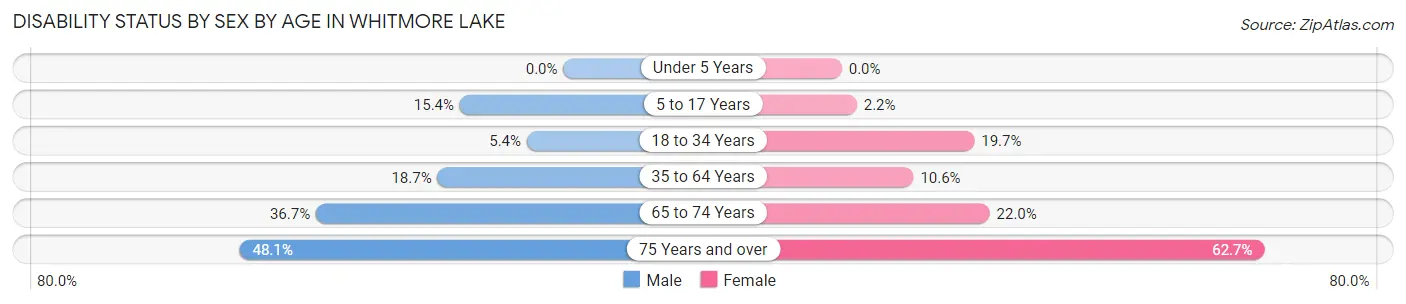
| Age Bracket | Male | Female |
| Under 5 Years | 0 (0.0%) | 0 (0.0%) |
| 5 to 17 Years | 81 (15.4%) | 12 (2.2%) |
| 18 to 34 Years | 52 (5.4%) | 200 (19.7%) |
| 35 to 64 Years | 365 (18.7%) | 139 (10.6%) |
| 65 to 74 Years | 101 (36.7%) | 88 (22.0%) |
| 75 Years and over | 75 (48.1%) | 170 (62.7%) |
Disability Class by Sex by Age in Whitmore Lake
Disability Class: Hearing Difficulty
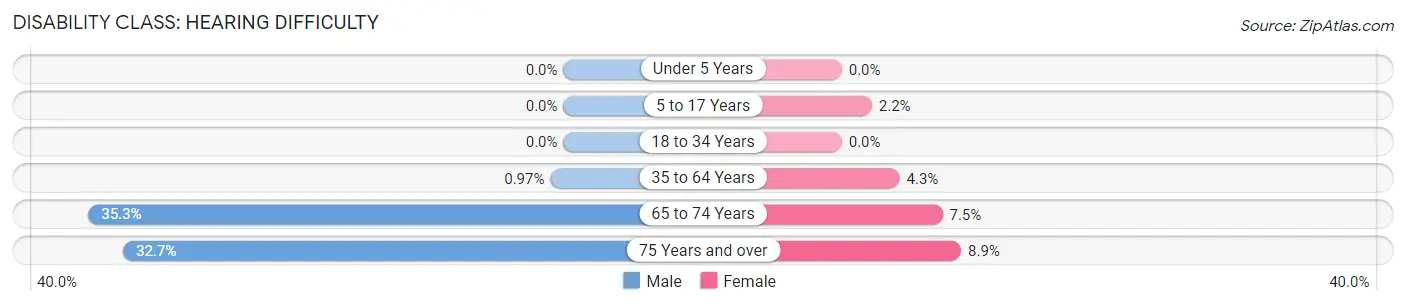
| Age Bracket | Male | Female |
| Under 5 Years | 0 (0.0%) | 0 (0.0%) |
| 5 to 17 Years | 0 (0.0%) | 12 (2.2%) |
| 18 to 34 Years | 0 (0.0%) | 0 (0.0%) |
| 35 to 64 Years | 19 (1.0%) | 56 (4.3%) |
| 65 to 74 Years | 97 (35.3%) | 30 (7.5%) |
| 75 Years and over | 51 (32.7%) | 24 (8.9%) |
Disability Class: Vision Difficulty
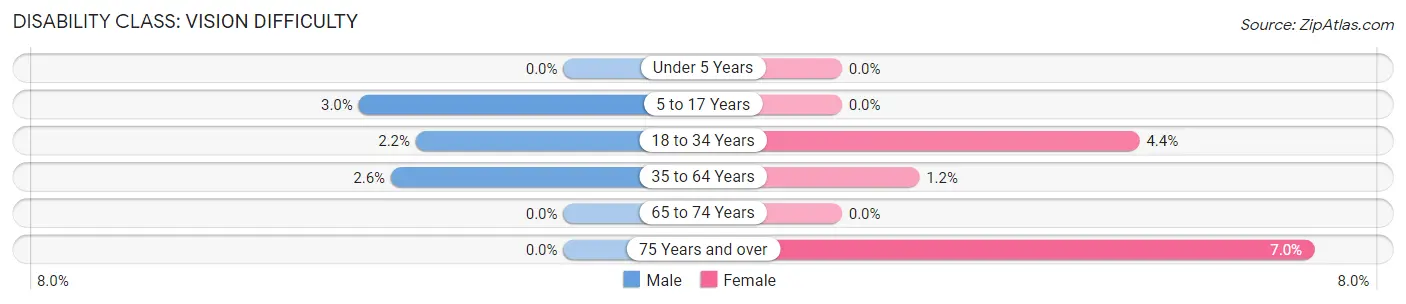
| Age Bracket | Male | Female |
| Under 5 Years | 0 (0.0%) | 0 (0.0%) |
| 5 to 17 Years | 16 (3.0%) | 0 (0.0%) |
| 18 to 34 Years | 21 (2.2%) | 45 (4.4%) |
| 35 to 64 Years | 50 (2.6%) | 15 (1.1%) |
| 65 to 74 Years | 0 (0.0%) | 0 (0.0%) |
| 75 Years and over | 0 (0.0%) | 19 (7.0%) |
Disability Class: Cognitive Difficulty
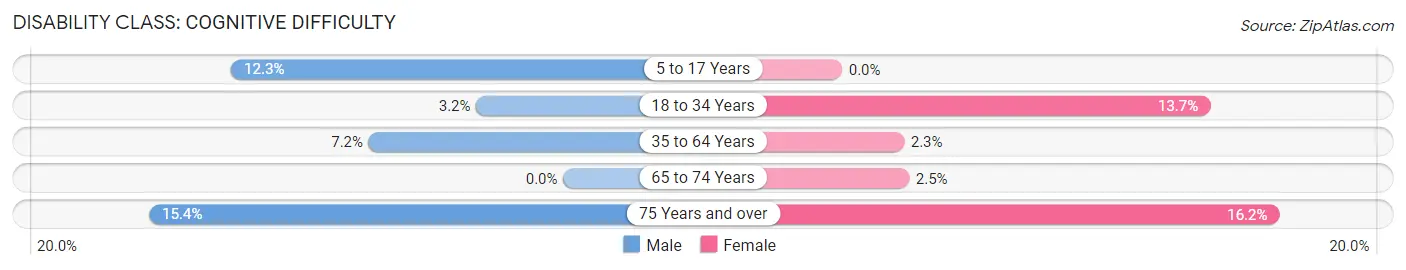
| Age Bracket | Male | Female |
| 5 to 17 Years | 65 (12.3%) | 0 (0.0%) |
| 18 to 34 Years | 31 (3.2%) | 139 (13.7%) |
| 35 to 64 Years | 141 (7.2%) | 30 (2.3%) |
| 65 to 74 Years | 0 (0.0%) | 10 (2.5%) |
| 75 Years and over | 24 (15.4%) | 44 (16.2%) |
Disability Class: Ambulatory Difficulty
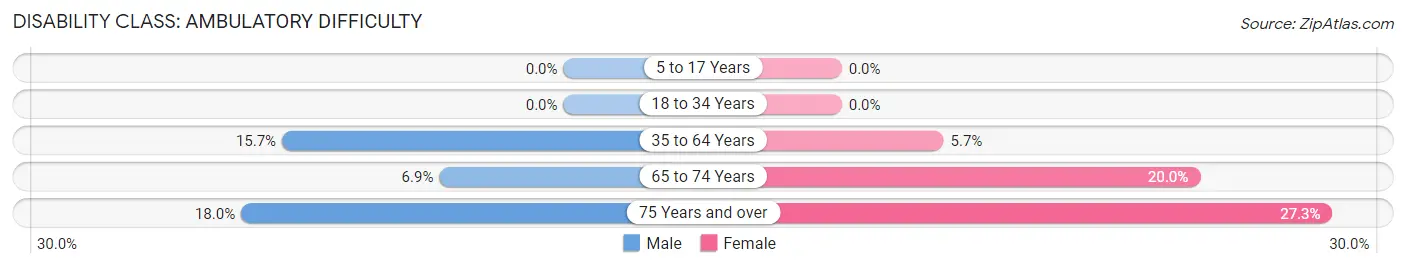
| Age Bracket | Male | Female |
| 5 to 17 Years | 0 (0.0%) | 0 (0.0%) |
| 18 to 34 Years | 0 (0.0%) | 0 (0.0%) |
| 35 to 64 Years | 306 (15.7%) | 74 (5.7%) |
| 65 to 74 Years | 19 (6.9%) | 80 (20.0%) |
| 75 Years and over | 28 (17.9%) | 74 (27.3%) |
Disability Class: Self-Care Difficulty
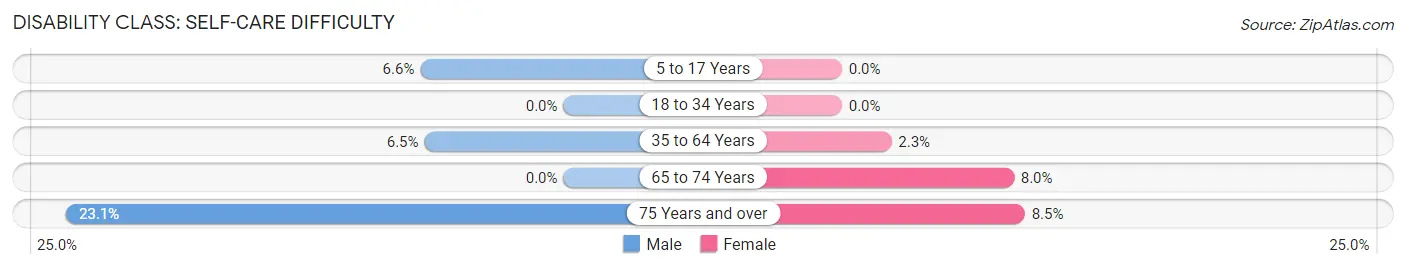
| Age Bracket | Male | Female |
| 5 to 17 Years | 35 (6.6%) | 0 (0.0%) |
| 18 to 34 Years | 0 (0.0%) | 0 (0.0%) |
| 35 to 64 Years | 126 (6.5%) | 30 (2.3%) |
| 65 to 74 Years | 0 (0.0%) | 32 (8.0%) |
| 75 Years and over | 36 (23.1%) | 23 (8.5%) |
Technology Access in Whitmore Lake
Computing Device Access in Whitmore Lake
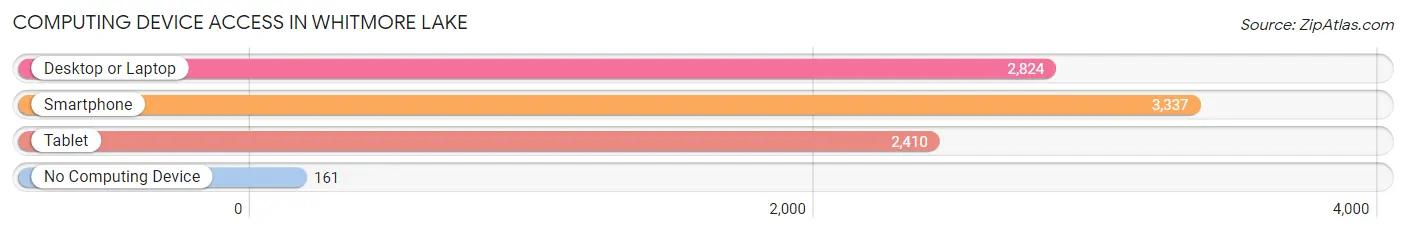
| Device Type | # Households | % Households |
| Desktop or Laptop | 2,824 | 78.0% |
| Smartphone | 3,337 | 92.2% |
| Tablet | 2,410 | 66.6% |
| No Computing Device | 161 | 4.4% |
| Total | 3,618 | 100.0% |
Internet Access in Whitmore Lake
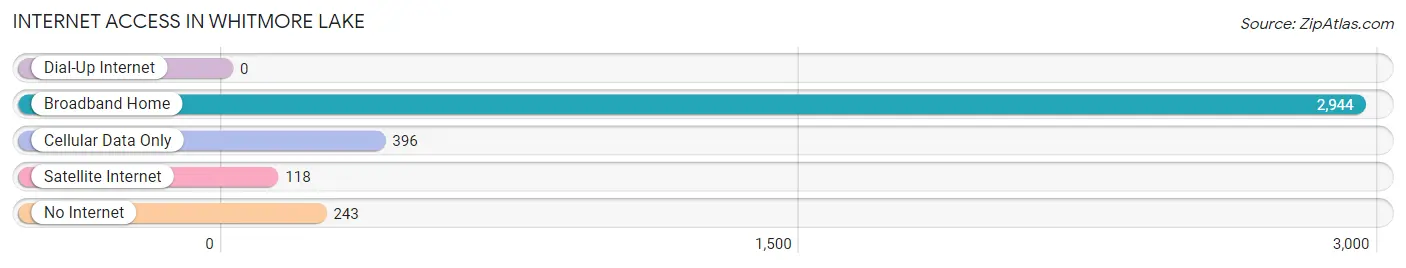
| Internet Type | # Households | % Households |
| Dial-Up Internet | 0 | 0.0% |
| Broadband Home | 2,944 | 81.4% |
| Cellular Data Only | 396 | 11.0% |
| Satellite Internet | 118 | 3.3% |
| No Internet | 243 | 6.7% |
| Total | 3,618 | 100.0% |
Whitmore Lake Summary
Whitmore Lake is a small unincorporated community located in Washtenaw County, Michigan. It is situated on the northern shore of Whitmore Lake, a natural lake that is approximately 6 miles in circumference. The community is located approximately 10 miles north of Ann Arbor and 30 miles west of Detroit.
History
The area around Whitmore Lake has been inhabited for thousands of years. The earliest known inhabitants were the Potawatomi people, who lived in the area until the early 19th century. The first European settlers arrived in the area in the 1830s, and the community of Whitmore Lake was officially established in 1837. The community was named after the lake, which was named after an early settler, William Whitmore.
In the late 19th century, the community began to grow as a resort destination. The lake was a popular spot for fishing and swimming, and several hotels and resorts were built in the area. The community also became a popular spot for summer homes, and many wealthy Detroiters built homes in the area.
In the early 20th century, the community began to decline as a resort destination. The Great Depression and World War II caused many of the resorts to close, and the population of the community began to decline. In the 1950s, the community began to experience a resurgence as a bedroom community for Ann Arbor and Detroit. The population of the community has grown steadily since then, and it is now home to over 6,000 people.
Geography
Whitmore Lake is located in southeastern Michigan, approximately 10 miles north of Ann Arbor and 30 miles west of Detroit. The community is situated on the northern shore of Whitmore Lake, a natural lake that is approximately 6 miles in circumference. The lake is fed by several small streams, and it is a popular spot for fishing and swimming.
The community is located in a rural area, and it is surrounded by rolling hills and farmland. The area is home to several small lakes, including Whitmore Lake, and it is a popular spot for outdoor recreation.
Economy
The economy of Whitmore Lake is largely based on tourism and retail. The community is a popular spot for fishing and swimming, and it is home to several resorts and hotels. The community is also home to several small businesses, including restaurants, shops, and other retail establishments.
The community is also home to several manufacturing companies, including a plastics manufacturer and a metal fabrication company. The community is also home to several technology companies, including a software development company and a web design firm.
Demographics
As of the 2010 census, the population of Whitmore Lake was 6,423. The racial makeup of the community was 94.3% White, 1.3% African American, 0.3% Native American, 1.2% Asian, 0.1% Pacific Islander, 1.2% from other races, and 1.6% from two or more races. Hispanic or Latino of any race were 3.2% of the population.
The median household income in Whitmore Lake was $60,938, and the median family income was $68,958. The per capita income was $27,945. About 5.2% of families and 7.2% of the population were below the poverty line, including 8.3% of those under age 18 and 4.2% of those age 65 or over.
Common Questions
What is Per Capita Income in Whitmore Lake?
Per Capita income in Whitmore Lake is $49,698.
What is the Median Family Income in Whitmore Lake?
Median Family Income in Whitmore Lake is $106,353.
What is the Median Household income in Whitmore Lake?
Median Household Income in Whitmore Lake is $76,653.
What is Income or Wage Gap in Whitmore Lake?
Income or Wage Gap in Whitmore Lake is 32.7%.
Women in Whitmore Lake earn 67.3 cents for every dollar earned by a man.
What is Inequality or Gini Index in Whitmore Lake?
Inequality or Gini Index in Whitmore Lake is 0.44.
What is the Total Population of Whitmore Lake?
Total Population of Whitmore Lake is 7,911.
What is the Total Male Population of Whitmore Lake?
Total Male Population of Whitmore Lake is 4,175.
What is the Total Female Population of Whitmore Lake?
Total Female Population of Whitmore Lake is 3,736.
What is the Ratio of Males per 100 Females in Whitmore Lake?
There are 111.75 Males per 100 Females in Whitmore Lake.
What is the Ratio of Females per 100 Males in Whitmore Lake?
There are 89.49 Females per 100 Males in Whitmore Lake.
What is the Median Population Age in Whitmore Lake?
Median Population Age in Whitmore Lake is 37.4 Years.
What is the Average Family Size in Whitmore Lake
Average Family Size in Whitmore Lake is 3.0 People.
What is the Average Household Size in Whitmore Lake
Average Household Size in Whitmore Lake is 2.1 People.
How Large is the Labor Force in Whitmore Lake?
There are 4,561 People in the Labor Forcein in Whitmore Lake.
What is the Percentage of People in the Labor Force in Whitmore Lake?
69.4% of People are in the Labor Force in Whitmore Lake.
What is the Unemployment Rate in Whitmore Lake?
Unemployment Rate in Whitmore Lake is 2.6%.