Saginaw, MI Map & Demographics
Saginaw Map
Saginaw Overview
$19,591
PER CAPITA INCOME
$44,688
AVG FAMILY INCOME
$35,521
AVG HOUSEHOLD INCOME
18.8%
WAGE / INCOME GAP [ % ]
81.2¢/ $1
WAGE / INCOME GAP [ $ ]
$12,688
FAMILY INCOME DEFICIT
0.46
INEQUALITY / GINI INDEX
44,316
TOTAL POPULATION
21,667
MALE POPULATION
22,649
FEMALE POPULATION
95.66
MALES / 100 FEMALES
104.53
FEMALES / 100 MALES
34.5
MEDIAN AGE
3.4
AVG FAMILY SIZE
2.5
AVG HOUSEHOLD SIZE
18,149
LABOR FORCE [ PEOPLE ]
54.4%
PERCENT IN LABOR FORCE
11.7%
UNEMPLOYMENT RATE
Saginaw Area Codes
Income in Saginaw
Income Overview in Saginaw
Per Capita Income in Saginaw is $19,591, while median incomes of families and households are $44,688 and $35,521 respectively.
| Characteristic | Number | Measure |
| Per Capita Income | 44,316 | $19,591 |
| Median Family Income | 9,554 | $44,688 |
| Mean Family Income | 9,554 | $55,707 |
| Median Household Income | 17,520 | $35,521 |
| Mean Household Income | 17,520 | $47,532 |
| Income Deficit | 9,554 | $12,688 |
| Wage / Income Gap (%) | 44,316 | 18.85% |
| Wage / Income Gap ($) | 44,316 | 81.15¢ per $1 |
| Gini / Inequality Index | 44,316 | 0.46 |
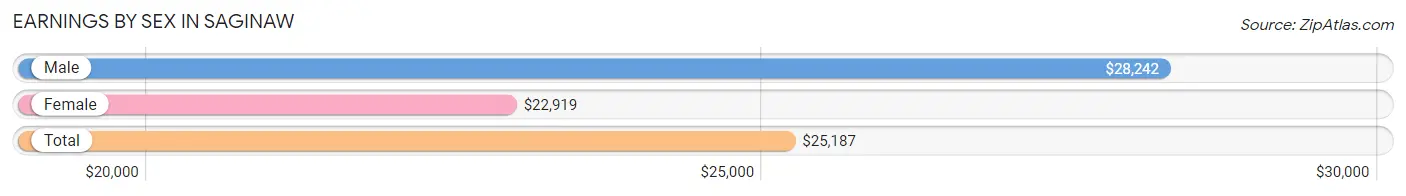
Earnings by Sex in Saginaw
Average Earnings in Saginaw are $25,187, $28,242 for men and $22,919 for women, a difference of 18.9%.
| Sex | Number | Average Earnings |
| Male | 8,549 (47.0%) | $28,242 |
| Female | 9,653 (53.0%) | $22,919 |
| Total | 18,202 (100.0%) | $25,187 |
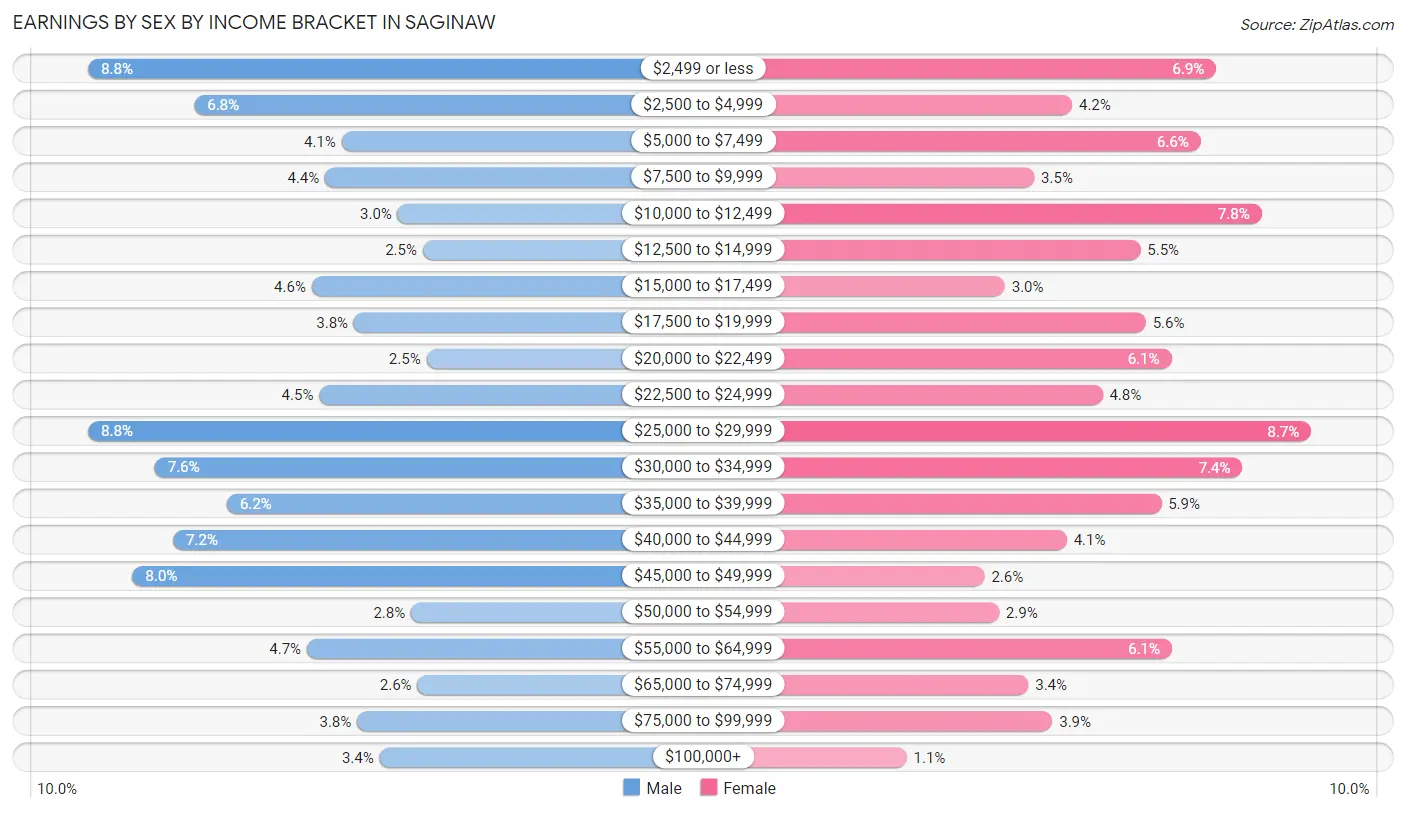
Earnings by Sex by Income Bracket in Saginaw
The most common earnings brackets in Saginaw are $2,499 or less for men (753 | 8.8%) and $25,000 to $29,999 for women (840 | 8.7%).
| Income | Male | Female |
| $2,499 or less | 753 (8.8%) | 668 (6.9%) |
| $2,500 to $4,999 | 583 (6.8%) | 407 (4.2%) |
| $5,000 to $7,499 | 347 (4.1%) | 640 (6.6%) |
| $7,500 to $9,999 | 374 (4.4%) | 339 (3.5%) |
| $10,000 to $12,499 | 257 (3.0%) | 750 (7.8%) |
| $12,500 to $14,999 | 217 (2.5%) | 531 (5.5%) |
| $15,000 to $17,499 | 395 (4.6%) | 286 (3.0%) |
| $17,500 to $19,999 | 327 (3.8%) | 541 (5.6%) |
| $20,000 to $22,499 | 211 (2.5%) | 587 (6.1%) |
| $22,500 to $24,999 | 383 (4.5%) | 462 (4.8%) |
| $25,000 to $29,999 | 753 (8.8%) | 840 (8.7%) |
| $30,000 to $34,999 | 646 (7.6%) | 715 (7.4%) |
| $35,000 to $39,999 | 531 (6.2%) | 569 (5.9%) |
| $40,000 to $44,999 | 617 (7.2%) | 398 (4.1%) |
| $45,000 to $49,999 | 682 (8.0%) | 249 (2.6%) |
| $50,000 to $54,999 | 236 (2.8%) | 275 (2.9%) |
| $55,000 to $64,999 | 403 (4.7%) | 588 (6.1%) |
| $65,000 to $74,999 | 226 (2.6%) | 328 (3.4%) |
| $75,000 to $99,999 | 322 (3.8%) | 372 (3.8%) |
| $100,000+ | 286 (3.4%) | 108 (1.1%) |
| Total | 8,549 (100.0%) | 9,653 (100.0%) |
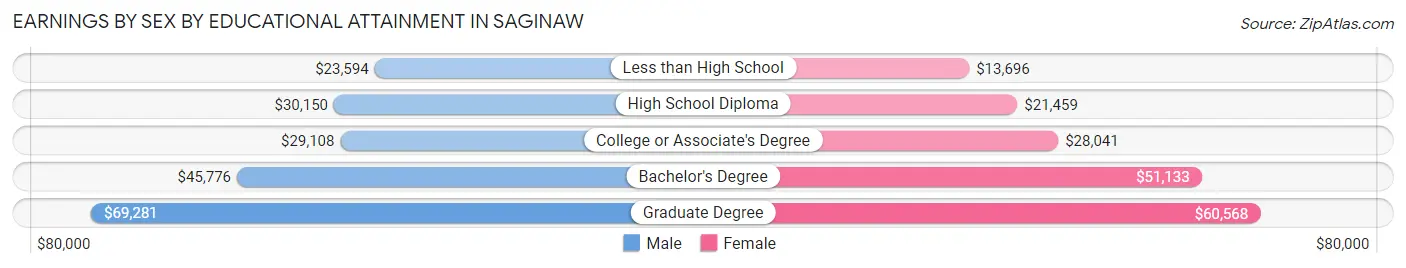
Earnings by Sex by Educational Attainment in Saginaw
Average earnings in Saginaw are $31,117 for men and $26,482 for women, a difference of 14.9%. Men with an educational attainment of graduate degree enjoy the highest average annual earnings of $69,281, while those with less than high school education earn the least with $23,594. Women with an educational attainment of graduate degree earn the most with the average annual earnings of $60,568, while those with less than high school education have the smallest earnings of $13,696.
| Educational Attainment | Male Income | Female Income |
| Less than High School | $23,594 | $13,696 |
| High School Diploma | $30,150 | $21,459 |
| College or Associate's Degree | $29,108 | $28,041 |
| Bachelor's Degree | $45,776 | $51,133 |
| Graduate Degree | $69,281 | $60,568 |
| Total | $31,117 | $26,482 |
Family Income in Saginaw
Family Income Brackets in Saginaw
According to the Saginaw family income data, there are 2,092 families falling into the $50,000 to $74,999 income range, which is the most common income bracket and makes up 21.9% of all families. Conversely, the $150,000 to $199,999 income bracket is the least frequent group with only 153 families (1.6%) belonging to this category.
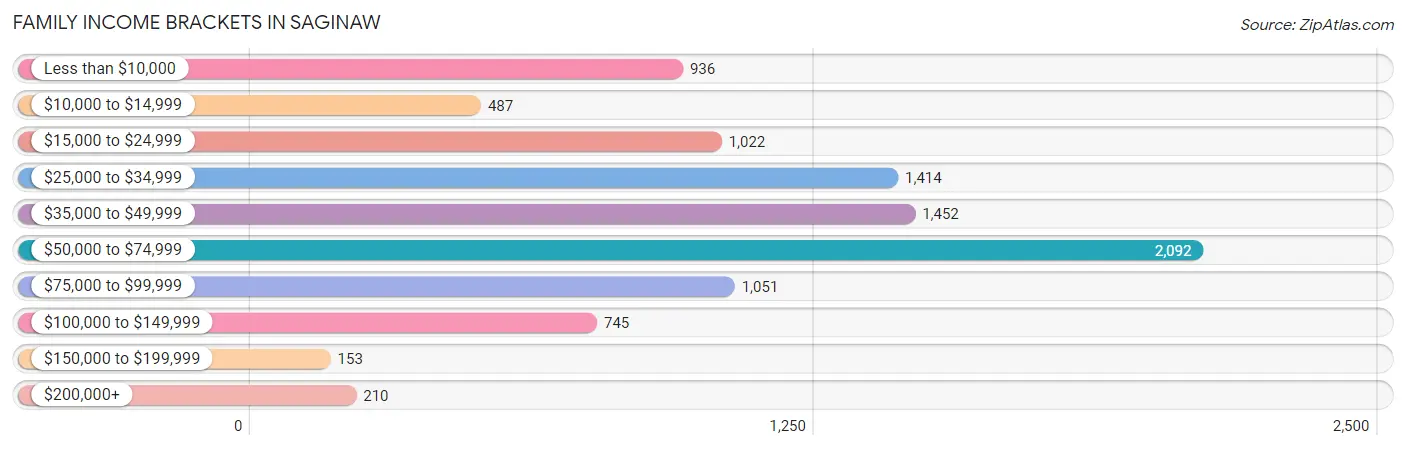
| Income Bracket | # Families | % Families |
| Less than $10,000 | 936 | 9.8% |
| $10,000 to $14,999 | 487 | 5.1% |
| $15,000 to $24,999 | 1,022 | 10.7% |
| $25,000 to $34,999 | 1,414 | 14.8% |
| $35,000 to $49,999 | 1,452 | 15.2% |
| $50,000 to $74,999 | 2,092 | 21.9% |
| $75,000 to $99,999 | 1,051 | 11.0% |
| $100,000 to $149,999 | 745 | 7.8% |
| $150,000 to $199,999 | 153 | 1.6% |
| $200,000+ | 210 | 2.2% |
Family Income by Famaliy Size in Saginaw
4-person families (1,841 | 19.3%) account for the highest median family income in Saginaw with $52,363 per family, while 2-person families (3,827 | 40.1%) have the highest median income of $23,075 per family member.
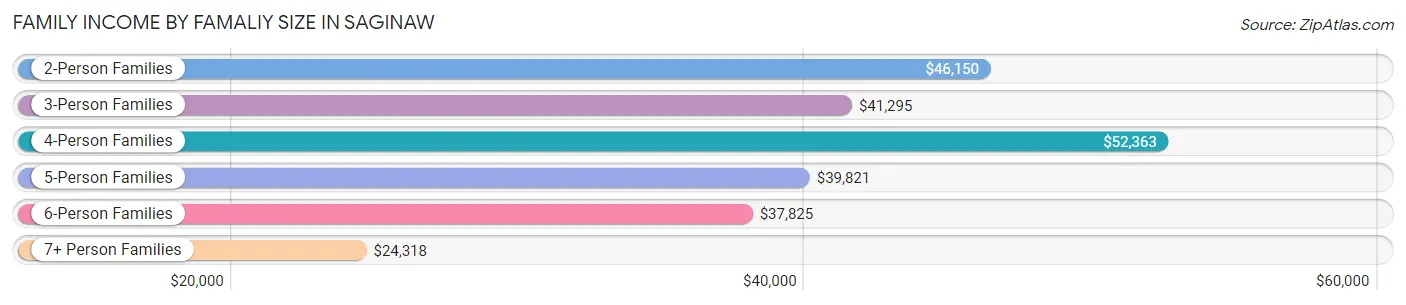
| Income Bracket | # Families | Median Income |
| 2-Person Families | 3,827 (40.1%) | $46,150 |
| 3-Person Families | 2,335 (24.4%) | $41,295 |
| 4-Person Families | 1,841 (19.3%) | $52,363 |
| 5-Person Families | 830 (8.7%) | $39,821 |
| 6-Person Families | 541 (5.7%) | $37,825 |
| 7+ Person Families | 180 (1.9%) | $24,318 |
| Total | 9,554 (100.0%) | $44,688 |
Family Income by Number of Earners in Saginaw
The median family income in Saginaw is $44,688, with families comprising 3+ earners (795) having the highest median family income of $84,861, while families with no earners (1,899) have the lowest median family income of $26,662, accounting for 8.3% and 19.9% of families, respectively.
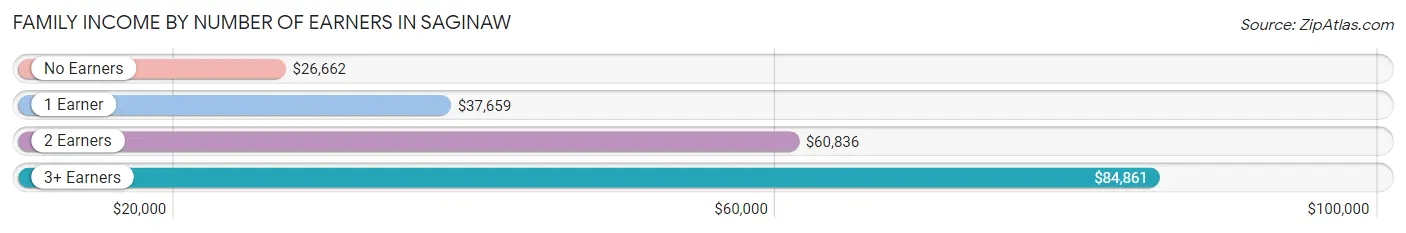
| Number of Earners | # Families | Median Income |
| No Earners | 1,899 (19.9%) | $26,662 |
| 1 Earner | 4,749 (49.7%) | $37,659 |
| 2 Earners | 2,111 (22.1%) | $60,836 |
| 3+ Earners | 795 (8.3%) | $84,861 |
| Total | 9,554 (100.0%) | $44,688 |
Household Income in Saginaw
Household Income Brackets in Saginaw
With 3,206 households falling in the category, the $50,000 to $74,999 income range is the most frequent in Saginaw, accounting for 18.3% of all households. In contrast, only 228 households (1.3%) fall into the $150,000 to $199,999 income bracket, making it the least populous group.
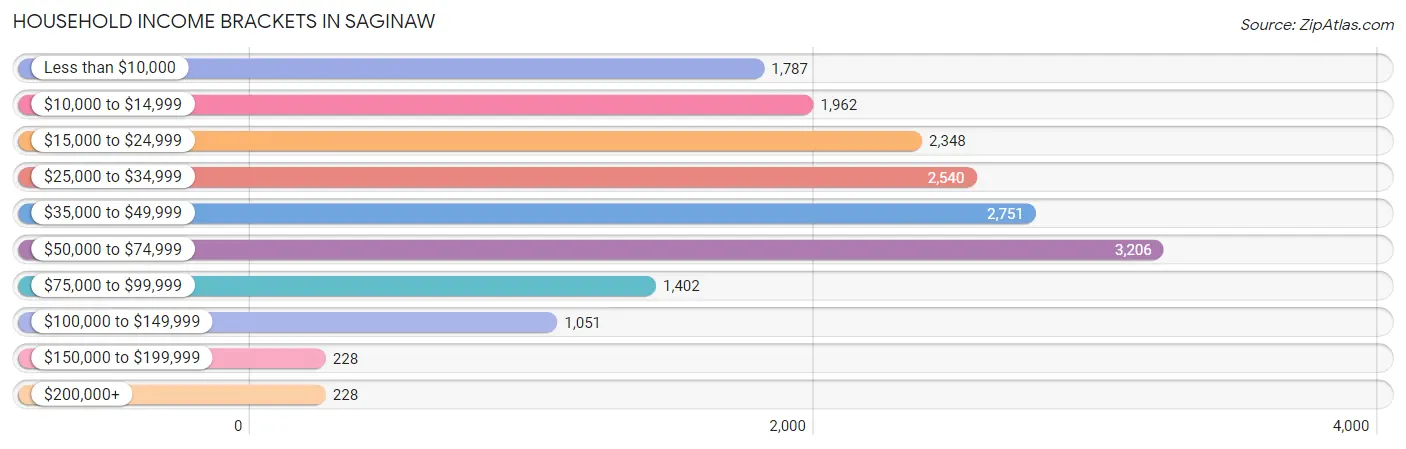
| Income Bracket | # Households | % Households |
| Less than $10,000 | 1,787 | 10.2% |
| $10,000 to $14,999 | 1,962 | 11.2% |
| $15,000 to $24,999 | 2,348 | 13.4% |
| $25,000 to $34,999 | 2,540 | 14.5% |
| $35,000 to $49,999 | 2,751 | 15.7% |
| $50,000 to $74,999 | 3,206 | 18.3% |
| $75,000 to $99,999 | 1,402 | 8.0% |
| $100,000 to $149,999 | 1,051 | 6.0% |
| $150,000 to $199,999 | 228 | 1.3% |
| $200,000+ | 228 | 1.3% |
Household Income by Householder Age in Saginaw
The median household income in Saginaw is $35,521, with the highest median household income of $38,993 found in the 15 to 24 years age bracket for the primary householder. A total of 761 households (4.3%) fall into this category. Meanwhile, the 25 to 44 years age bracket for the primary householder has the lowest median household income of $32,830, with 6,407 households (36.6%) in this group.
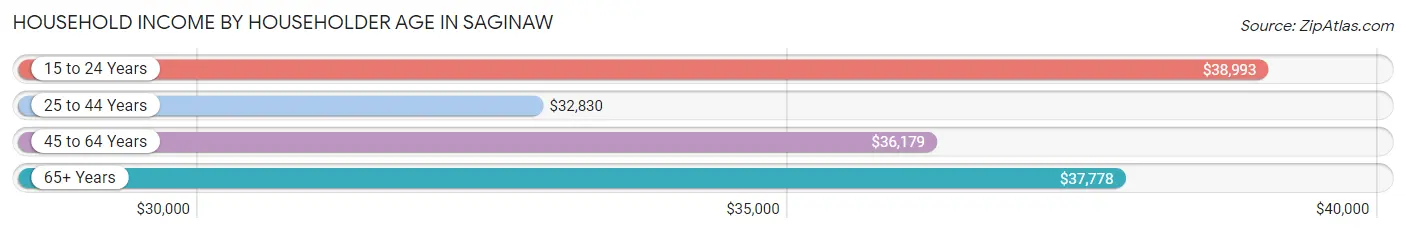
| Income Bracket | # Households | Median Income |
| 15 to 24 Years | 761 (4.3%) | $38,993 |
| 25 to 44 Years | 6,407 (36.6%) | $32,830 |
| 45 to 64 Years | 6,172 (35.2%) | $36,179 |
| 65+ Years | 4,180 (23.9%) | $37,778 |
| Total | 17,520 (100.0%) | $35,521 |
Poverty in Saginaw
Income Below Poverty by Sex and Age in Saginaw
With 32.6% poverty level for males and 36.2% for females among the residents of Saginaw, 5 year old males and 5 year old females are the most vulnerable to poverty, with 328 males (74.7%) and 195 females (74.7%) in their respective age groups living below the poverty level.
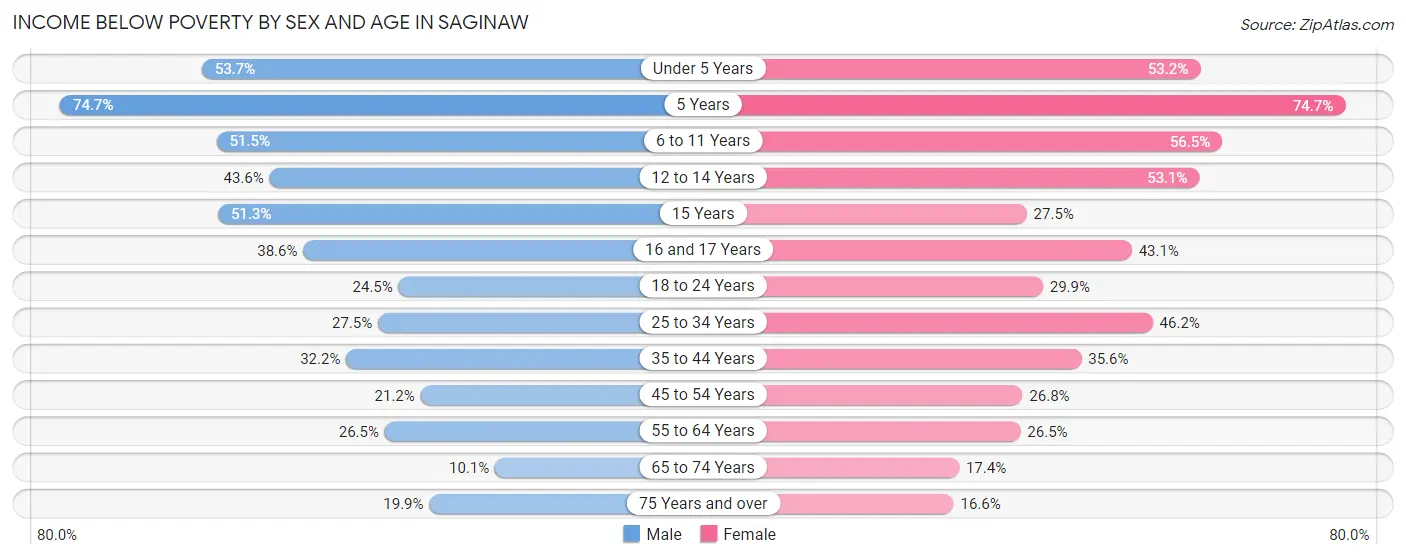
| Age Bracket | Male | Female |
| Under 5 Years | 1,066 (53.7%) | 837 (53.2%) |
| 5 Years | 328 (74.7%) | 195 (74.7%) |
| 6 to 11 Years | 977 (51.5%) | 1,072 (56.5%) |
| 12 to 14 Years | 483 (43.6%) | 515 (53.1%) |
| 15 Years | 180 (51.3%) | 84 (27.5%) |
| 16 and 17 Years | 212 (38.6%) | 344 (43.0%) |
| 18 to 24 Years | 441 (24.5%) | 585 (29.8%) |
| 25 to 34 Years | 791 (27.5%) | 1,479 (46.2%) |
| 35 to 44 Years | 916 (32.2%) | 1,017 (35.6%) |
| 45 to 54 Years | 472 (21.2%) | 657 (26.8%) |
| 55 to 64 Years | 648 (26.5%) | 778 (26.5%) |
| 65 to 74 Years | 172 (10.1%) | 322 (17.4%) |
| 75 Years and over | 163 (19.9%) | 211 (16.6%) |
| Total | 6,849 (32.6%) | 8,096 (36.2%) |
Income Above Poverty by Sex and Age in Saginaw
According to the poverty statistics in Saginaw, males aged 65 to 74 years and females aged 75 years and over are the age groups that are most secure financially, with 89.9% of males and 83.4% of females in these age groups living above the poverty line.
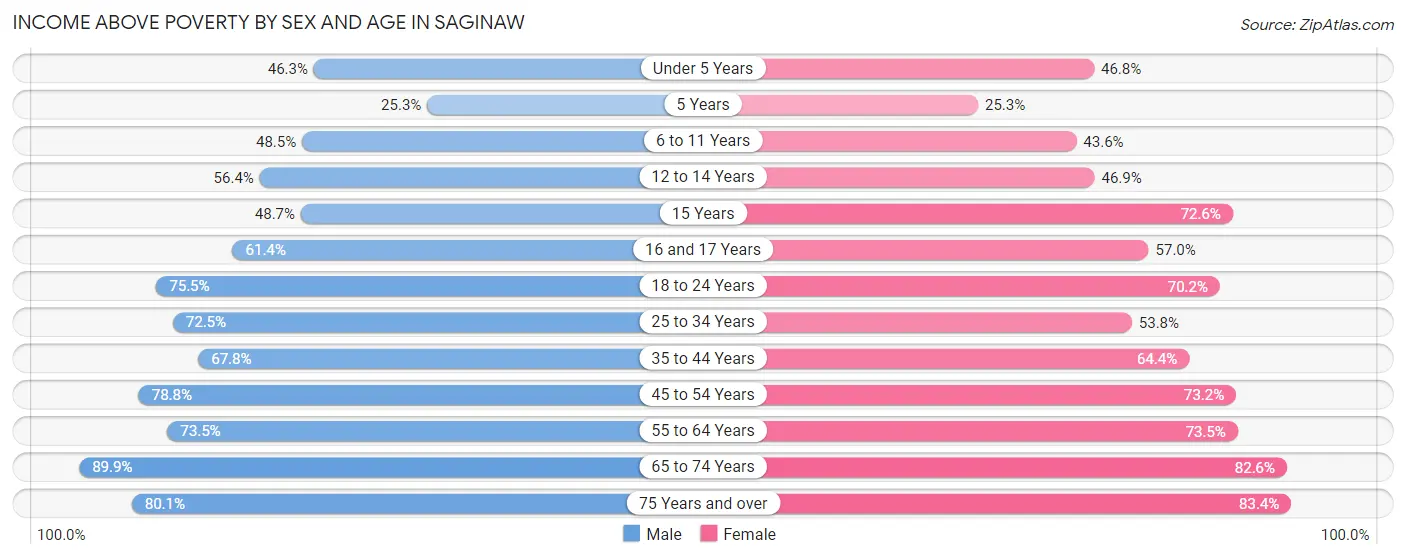
| Age Bracket | Male | Female |
| Under 5 Years | 920 (46.3%) | 737 (46.8%) |
| 5 Years | 111 (25.3%) | 66 (25.3%) |
| 6 to 11 Years | 920 (48.5%) | 827 (43.5%) |
| 12 to 14 Years | 624 (56.4%) | 455 (46.9%) |
| 15 Years | 171 (48.7%) | 222 (72.6%) |
| 16 and 17 Years | 337 (61.4%) | 455 (57.0%) |
| 18 to 24 Years | 1,362 (75.5%) | 1,375 (70.2%) |
| 25 to 34 Years | 2,083 (72.5%) | 1,725 (53.8%) |
| 35 to 44 Years | 1,925 (67.8%) | 1,843 (64.4%) |
| 45 to 54 Years | 1,754 (78.8%) | 1,793 (73.2%) |
| 55 to 64 Years | 1,796 (73.5%) | 2,156 (73.5%) |
| 65 to 74 Years | 1,525 (89.9%) | 1,529 (82.6%) |
| 75 Years and over | 656 (80.1%) | 1,060 (83.4%) |
| Total | 14,184 (67.4%) | 14,243 (63.8%) |
Income Below Poverty Among Married-Couple Families in Saginaw
The poverty statistics for married-couple families in Saginaw show that 12.5% or 534 of the total 4,261 families live below the poverty line. Families with 5 or more children have the highest poverty rate of 81.8%, comprising of 81 families. On the other hand, families with no children have the lowest poverty rate of 3.9%, which includes 95 families.
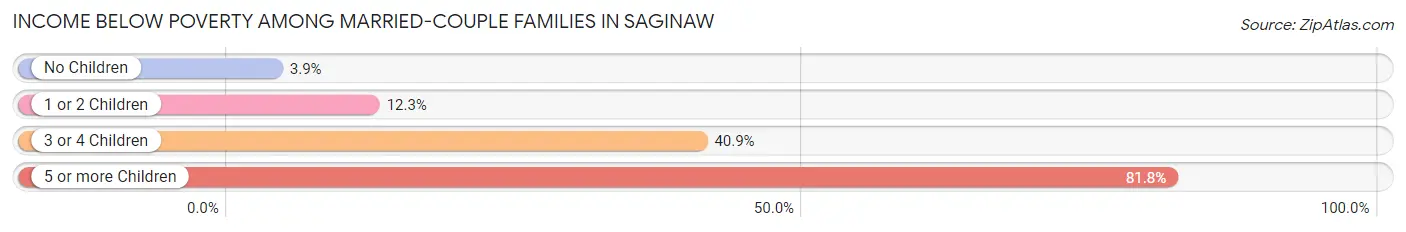
| Children | Above Poverty | Below Poverty |
| No Children | 2,341 (96.1%) | 95 (3.9%) |
| 1 or 2 Children | 1,067 (87.7%) | 150 (12.3%) |
| 3 or 4 Children | 301 (59.1%) | 208 (40.9%) |
| 5 or more Children | 18 (18.2%) | 81 (81.8%) |
| Total | 3,727 (87.5%) | 534 (12.5%) |
Income Below Poverty Among Single-Parent Households in Saginaw
According to the poverty data in Saginaw, 27.6% or 289 single-father households and 43.3% or 1,838 single-mother households are living below the poverty line. Among single-father households, those with 3 or 4 children have the highest poverty rate, with 103 households (68.7%) experiencing poverty. Likewise, among single-mother households, those with 5 or more children have the highest poverty rate, with 187 households (95.4%) falling below the poverty line.
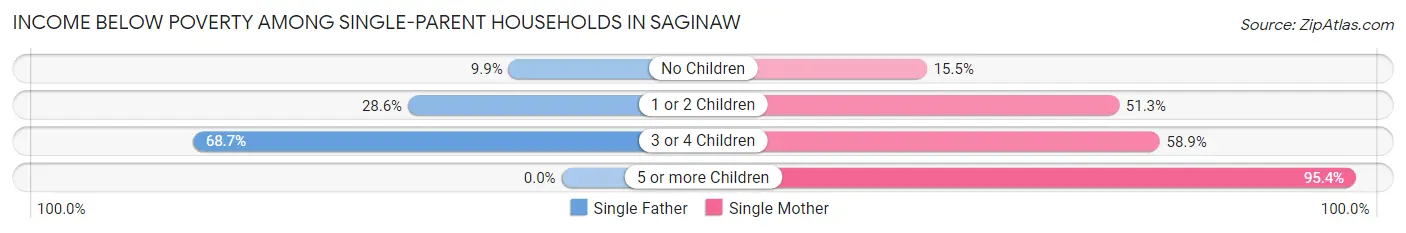
| Children | Single Father | Single Mother |
| No Children | 37 (9.9%) | 213 (15.5%) |
| 1 or 2 Children | 149 (28.6%) | 916 (51.3%) |
| 3 or 4 Children | 103 (68.7%) | 522 (58.9%) |
| 5 or more Children | 0 (0.0%) | 187 (95.4%) |
| Total | 289 (27.6%) | 1,838 (43.3%) |
Income Below Poverty Among Married-Couple vs Single-Parent Households in Saginaw
The poverty data for Saginaw shows that 534 of the married-couple family households (12.5%) and 2,127 of the single-parent households (40.2%) are living below the poverty level. Within the married-couple family households, those with 5 or more children have the highest poverty rate, with 81 households (81.8%) falling below the poverty line. Among the single-parent households, those with 5 or more children have the highest poverty rate, with 187 household (95.4%) living below poverty.
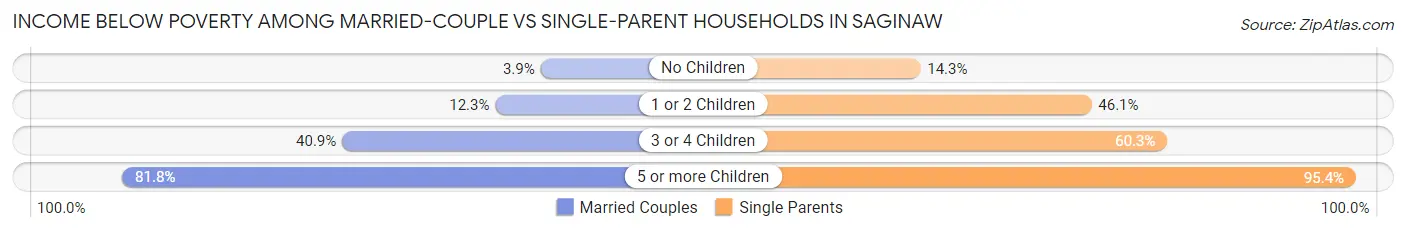
| Children | Married-Couple Families | Single-Parent Households |
| No Children | 95 (3.9%) | 250 (14.3%) |
| 1 or 2 Children | 150 (12.3%) | 1,065 (46.1%) |
| 3 or 4 Children | 208 (40.9%) | 625 (60.3%) |
| 5 or more Children | 81 (81.8%) | 187 (95.4%) |
| Total | 534 (12.5%) | 2,127 (40.2%) |
Race in Saginaw
The most populous races in Saginaw are Black / African American (20,222 | 45.6%), White / Caucasian (17,774 | 40.1%), and Hispanic or Latino (7,273 | 16.4%).
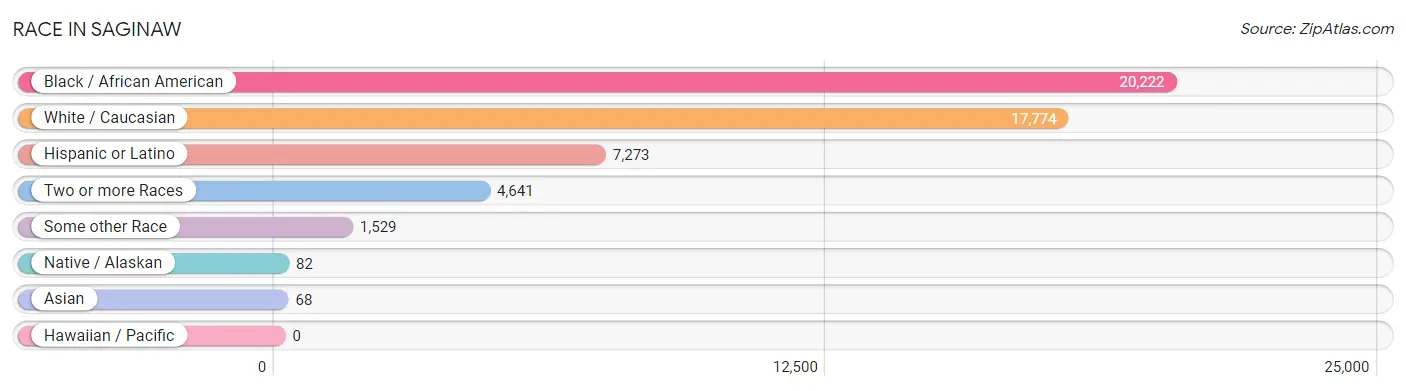
| Race | # Population | % Population |
| Asian | 68 | 0.2% |
| Black / African American | 20,222 | 45.6% |
| Hawaiian / Pacific | 0 | 0.0% |
| Hispanic or Latino | 7,273 | 16.4% |
| Native / Alaskan | 82 | 0.2% |
| White / Caucasian | 17,774 | 40.1% |
| Two or more Races | 4,641 | 10.5% |
| Some other Race | 1,529 | 3.5% |
| Total | 44,316 | 100.0% |
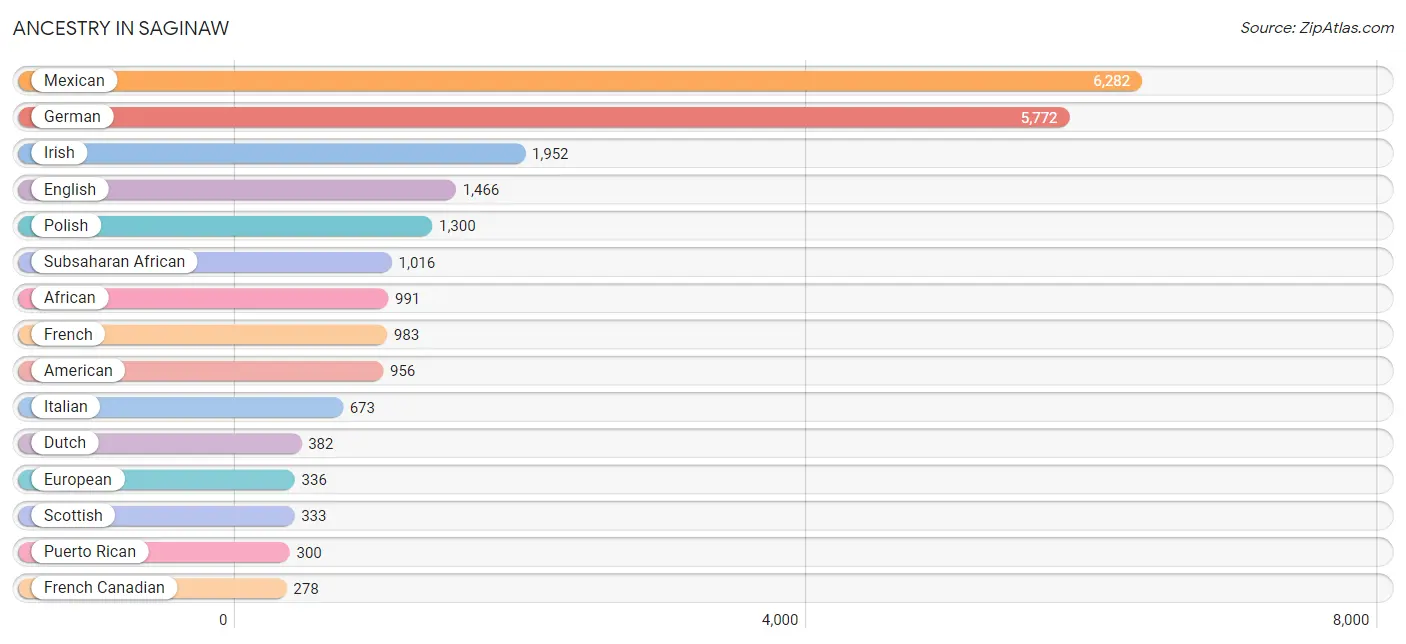
Ancestry in Saginaw
The most populous ancestries reported in Saginaw are Mexican (6,282 | 14.2%), German (5,772 | 13.0%), Irish (1,952 | 4.4%), English (1,466 | 3.3%), and Polish (1,300 | 2.9%), together accounting for 37.8% of all Saginaw residents.
| Ancestry | # Population | % Population |
| African | 991 | 2.2% |
| American | 956 | 2.2% |
| Arab | 96 | 0.2% |
| Armenian | 27 | 0.1% |
| Assyrian / Chaldean / Syriac | 11 | 0.0% |
| Australian | 24 | 0.1% |
| Austrian | 20 | 0.1% |
| Belgian | 1 | 0.0% |
| Bhutanese | 5 | 0.0% |
| Blackfeet | 10 | 0.0% |
| British | 65 | 0.2% |
| Burmese | 53 | 0.1% |
| Cajun | 37 | 0.1% |
| Canadian | 26 | 0.1% |
| Celtic | 70 | 0.2% |
| Central American | 60 | 0.1% |
| Cherokee | 117 | 0.3% |
| Chilean | 23 | 0.1% |
| Chippewa | 169 | 0.4% |
| Colombian | 15 | 0.0% |
| Comanche | 2 | 0.0% |
| Croatian | 21 | 0.1% |
| Cuban | 5 | 0.0% |
| Czech | 90 | 0.2% |
| Czechoslovakian | 8 | 0.0% |
| Danish | 15 | 0.0% |
| Dominican | 63 | 0.1% |
| Dutch | 382 | 0.9% |
| Eastern European | 4 | 0.0% |
| Egyptian | 15 | 0.0% |
| English | 1,466 | 3.3% |
| European | 336 | 0.8% |
| Finnish | 192 | 0.4% |
| French | 983 | 2.2% |
| French American Indian | 84 | 0.2% |
| French Canadian | 278 | 0.6% |
| German | 5,772 | 13.0% |
| Greek | 31 | 0.1% |
| Guamanian / Chamorro | 10 | 0.0% |
| Guatemalan | 46 | 0.1% |
| Guyanese | 8 | 0.0% |
| Hungarian | 188 | 0.4% |
| Indian (Asian) | 16 | 0.0% |
| Iraqi | 22 | 0.1% |
| Irish | 1,952 | 4.4% |
| Israeli | 27 | 0.1% |
| Italian | 673 | 1.5% |
| Kiowa | 6 | 0.0% |
| Korean | 15 | 0.0% |
| Latvian | 5 | 0.0% |
| Lebanese | 36 | 0.1% |
| Lithuanian | 58 | 0.1% |
| Malaysian | 11 | 0.0% |
| Mexican | 6,282 | 14.2% |
| Mexican American Indian | 37 | 0.1% |
| Native Hawaiian | 7 | 0.0% |
| Navajo | 4 | 0.0% |
| Northern European | 41 | 0.1% |
| Norwegian | 47 | 0.1% |
| Ottawa | 69 | 0.2% |
| Panamanian | 7 | 0.0% |
| Pennsylvania German | 7 | 0.0% |
| Polish | 1,300 | 2.9% |
| Portuguese | 8 | 0.0% |
| Puerto Rican | 300 | 0.7% |
| Romanian | 19 | 0.0% |
| Russian | 112 | 0.3% |
| Salvadoran | 7 | 0.0% |
| Scandinavian | 13 | 0.0% |
| Scotch-Irish | 239 | 0.5% |
| Scottish | 333 | 0.7% |
| Senegalese | 5 | 0.0% |
| Sioux | 10 | 0.0% |
| Slovak | 33 | 0.1% |
| South African | 6 | 0.0% |
| South American | 44 | 0.1% |
| South American Indian | 1 | 0.0% |
| Spaniard | 147 | 0.3% |
| Spanish | 37 | 0.1% |
| Sri Lankan | 28 | 0.1% |
| Subsaharan African | 1,016 | 2.3% |
| Swedish | 82 | 0.2% |
| Swiss | 10 | 0.0% |
| Thai | 25 | 0.1% |
| Ukrainian | 17 | 0.0% |
| Venezuelan | 6 | 0.0% |
| Welsh | 49 | 0.1% |
| West Indian | 72 | 0.2% |
| Yugoslavian | 23 | 0.1% | View All 89 Rows |
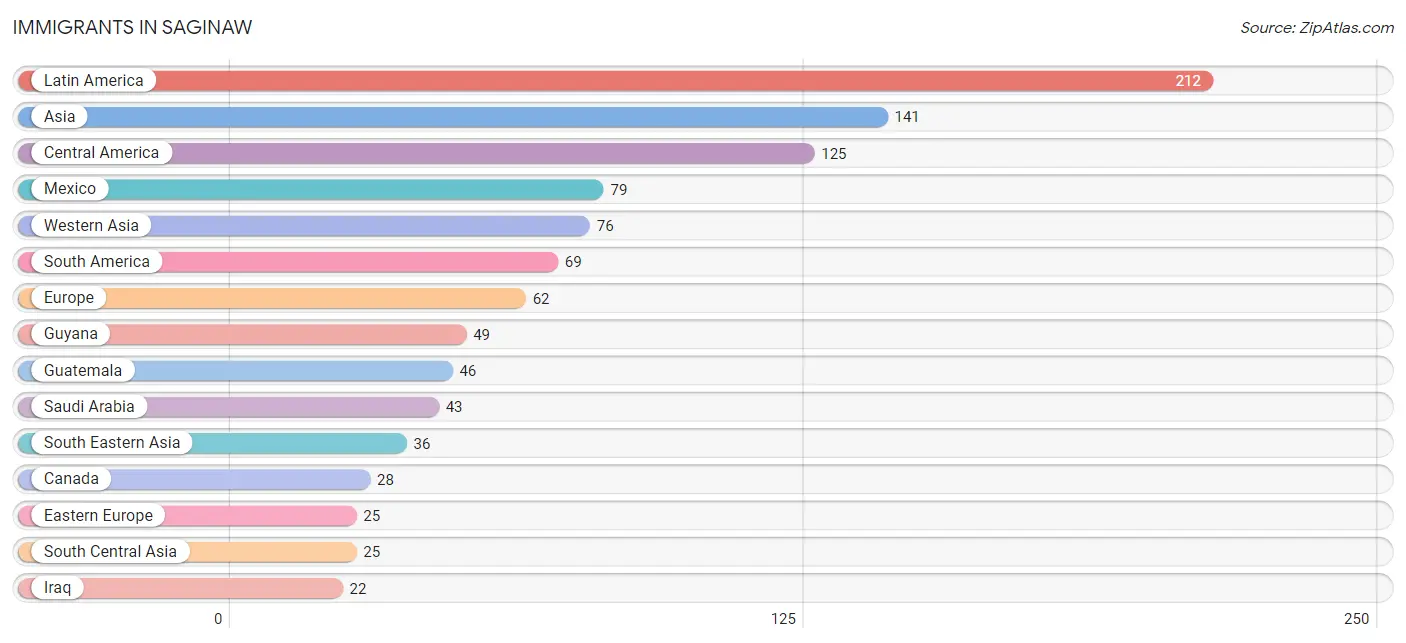
Immigrants in Saginaw
The most numerous immigrant groups reported in Saginaw came from Latin America (212 | 0.5%), Asia (141 | 0.3%), Central America (125 | 0.3%), Mexico (79 | 0.2%), and Western Asia (76 | 0.2%), together accounting for 1.4% of all Saginaw residents.
| Immigration Origin | # Population | % Population |
| Asia | 141 | 0.3% |
| Australia | 11 | 0.0% |
| Canada | 28 | 0.1% |
| Caribbean | 18 | 0.0% |
| Central America | 125 | 0.3% |
| China | 4 | 0.0% |
| Colombia | 14 | 0.0% |
| Cuba | 5 | 0.0% |
| Eastern Asia | 4 | 0.0% |
| Eastern Europe | 25 | 0.1% |
| England | 1 | 0.0% |
| Europe | 62 | 0.1% |
| France | 10 | 0.0% |
| Germany | 5 | 0.0% |
| Guatemala | 46 | 0.1% |
| Guyana | 49 | 0.1% |
| India | 15 | 0.0% |
| Iran | 3 | 0.0% |
| Iraq | 22 | 0.1% |
| Italy | 8 | 0.0% |
| Jamaica | 13 | 0.0% |
| Laos | 11 | 0.0% |
| Latin America | 212 | 0.5% |
| Lebanon | 11 | 0.0% |
| Mexico | 79 | 0.2% |
| Northern Europe | 14 | 0.0% |
| Oceania | 11 | 0.0% |
| Pakistan | 7 | 0.0% |
| Philippines | 19 | 0.0% |
| Poland | 9 | 0.0% |
| Russia | 10 | 0.0% |
| Saudi Arabia | 43 | 0.1% |
| South America | 69 | 0.2% |
| South Central Asia | 25 | 0.1% |
| South Eastern Asia | 36 | 0.1% |
| Southern Europe | 8 | 0.0% |
| Ukraine | 6 | 0.0% |
| Venezuela | 6 | 0.0% |
| Vietnam | 6 | 0.0% |
| Western Asia | 76 | 0.2% |
| Western Europe | 15 | 0.0% | View All 41 Rows |
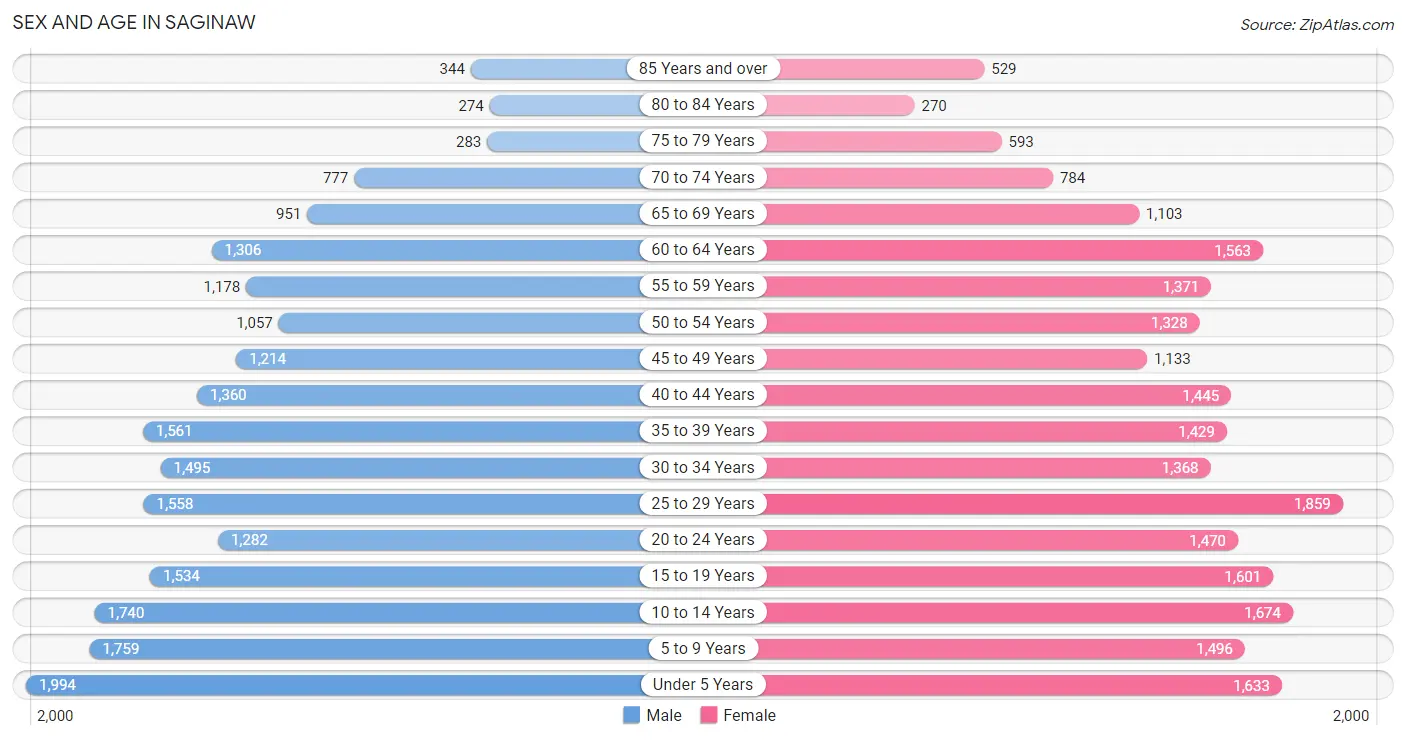
Sex and Age in Saginaw
Sex and Age in Saginaw
The most populous age groups in Saginaw are Under 5 Years (1,994 | 9.2%) for men and 25 to 29 Years (1,859 | 8.2%) for women.
| Age Bracket | Male | Female |
| Under 5 Years | 1,994 (9.2%) | 1,633 (7.2%) |
| 5 to 9 Years | 1,759 (8.1%) | 1,496 (6.6%) |
| 10 to 14 Years | 1,740 (8.0%) | 1,674 (7.4%) |
| 15 to 19 Years | 1,534 (7.1%) | 1,601 (7.1%) |
| 20 to 24 Years | 1,282 (5.9%) | 1,470 (6.5%) |
| 25 to 29 Years | 1,558 (7.2%) | 1,859 (8.2%) |
| 30 to 34 Years | 1,495 (6.9%) | 1,368 (6.0%) |
| 35 to 39 Years | 1,561 (7.2%) | 1,429 (6.3%) |
| 40 to 44 Years | 1,360 (6.3%) | 1,445 (6.4%) |
| 45 to 49 Years | 1,214 (5.6%) | 1,133 (5.0%) |
| 50 to 54 Years | 1,057 (4.9%) | 1,328 (5.9%) |
| 55 to 59 Years | 1,178 (5.4%) | 1,371 (6.0%) |
| 60 to 64 Years | 1,306 (6.0%) | 1,563 (6.9%) |
| 65 to 69 Years | 951 (4.4%) | 1,103 (4.9%) |
| 70 to 74 Years | 777 (3.6%) | 784 (3.5%) |
| 75 to 79 Years | 283 (1.3%) | 593 (2.6%) |
| 80 to 84 Years | 274 (1.3%) | 270 (1.2%) |
| 85 Years and over | 344 (1.6%) | 529 (2.3%) |
| Total | 21,667 (100.0%) | 22,649 (100.0%) |
Families and Households in Saginaw
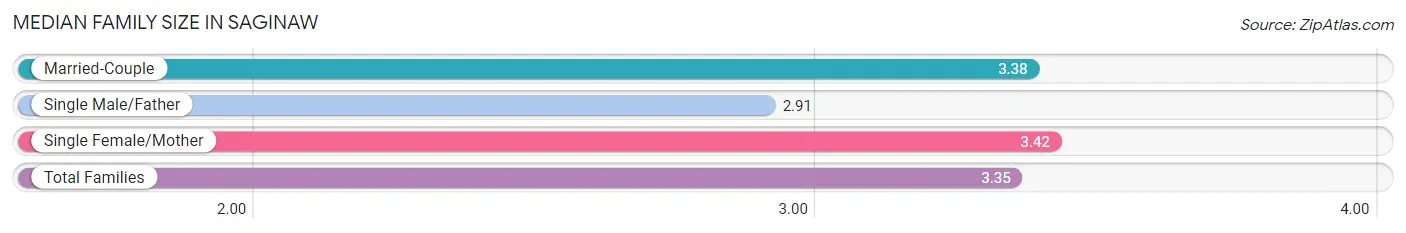
Median Family Size in Saginaw
The median family size in Saginaw is 3.35 persons per family, with single female/mother families (4,247 | 44.5%) accounting for the largest median family size of 3.42 persons per family. On the other hand, single male/father families (1,046 | 11.0%) represent the smallest median family size with 2.91 persons per family.
| Family Type | # Families | Family Size |
| Married-Couple | 4,261 (44.6%) | 3.38 |
| Single Male/Father | 1,046 (11.0%) | 2.91 |
| Single Female/Mother | 4,247 (44.5%) | 3.42 |
| Total Families | 9,554 (100.0%) | 3.35 |
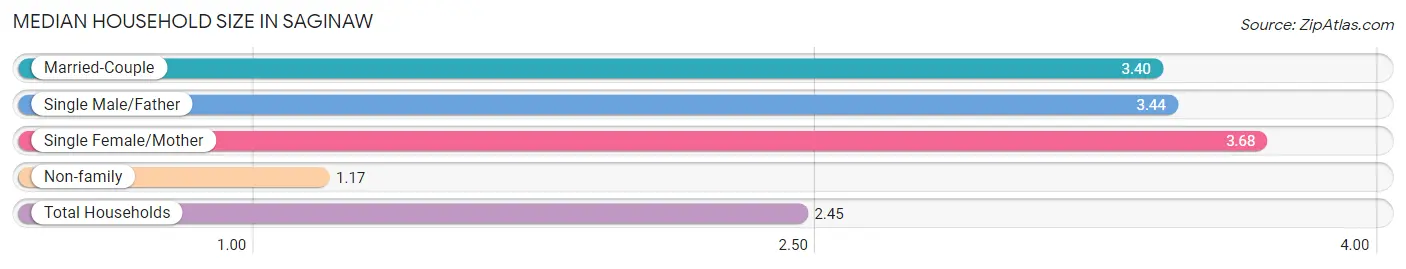
Median Household Size in Saginaw
The median household size in Saginaw is 2.45 persons per household, with single female/mother households (4,247 | 24.2%) accounting for the largest median household size of 3.68 persons per household. non-family households (7,966 | 45.5%) represent the smallest median household size with 1.17 persons per household.
| Household Type | # Households | Household Size |
| Married-Couple | 4,261 (24.3%) | 3.40 |
| Single Male/Father | 1,046 (6.0%) | 3.44 |
| Single Female/Mother | 4,247 (24.2%) | 3.68 |
| Non-family | 7,966 (45.5%) | 1.17 |
| Total Households | 17,520 (100.0%) | 2.45 |
Household Size by Marriage Status in Saginaw
Out of a total of 17,520 households in Saginaw, 9,554 (54.5%) are family households, while 7,966 (45.5%) are nonfamily households. The most numerous type of family households are 2-person households, comprising 3,257, and the most common type of nonfamily households are 1-person households, comprising 6,764.
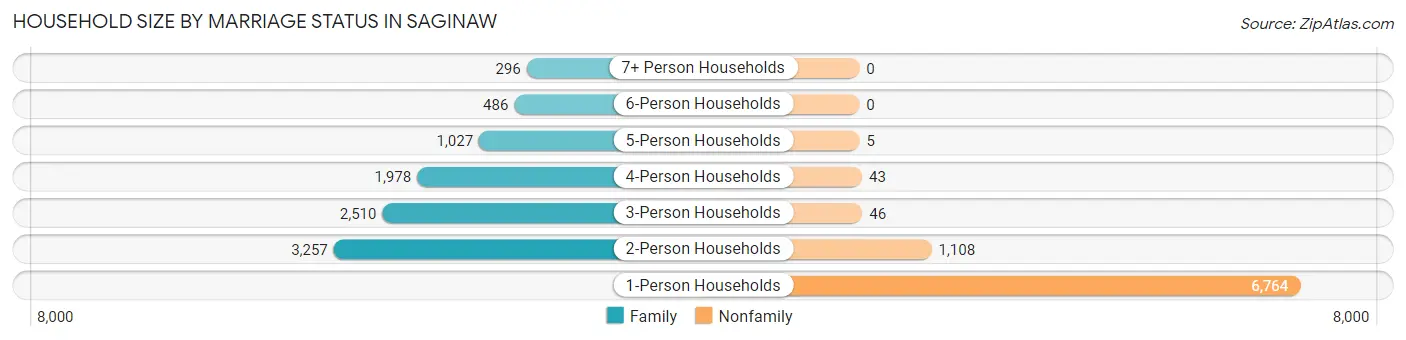
| Household Size | Family Households | Nonfamily Households |
| 1-Person Households | - | 6,764 (38.6%) |
| 2-Person Households | 3,257 (18.6%) | 1,108 (6.3%) |
| 3-Person Households | 2,510 (14.3%) | 46 (0.3%) |
| 4-Person Households | 1,978 (11.3%) | 43 (0.3%) |
| 5-Person Households | 1,027 (5.9%) | 5 (0.0%) |
| 6-Person Households | 486 (2.8%) | 0 (0.0%) |
| 7+ Person Households | 296 (1.7%) | 0 (0.0%) |
| Total | 9,554 (54.5%) | 7,966 (45.5%) |
Female Fertility in Saginaw
Fertility by Age in Saginaw
Average fertility rate in Saginaw is 67.0 births per 1,000 women. Women in the age bracket of 20 to 34 years have the highest fertility rate with 129.0 births per 1,000 women. Women in the age bracket of 20 to 34 years acount for 85.1% of all women with births.
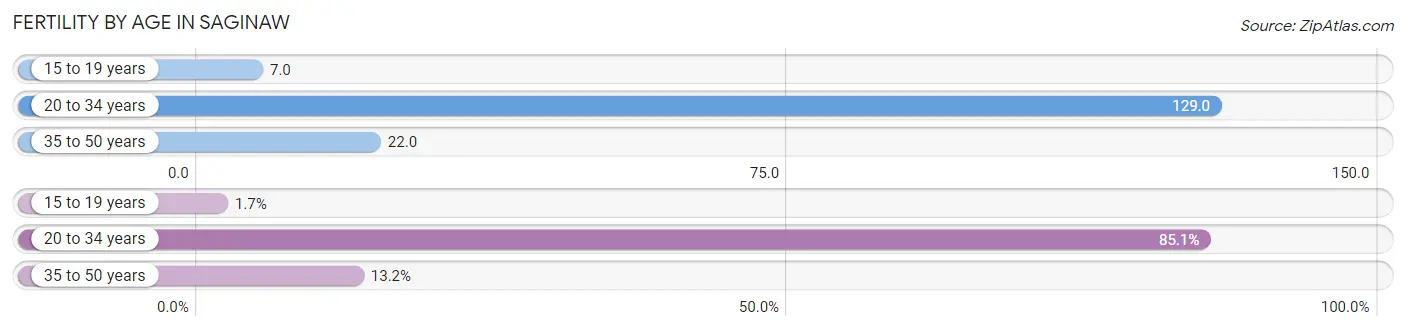
| Age Bracket | Women with Births | Births / 1,000 Women |
| 15 to 19 years | 12 (1.7%) | 7.0 |
| 20 to 34 years | 605 (85.1%) | 129.0 |
| 35 to 50 years | 94 (13.2%) | 22.0 |
| Total | 711 (100.0%) | 67.0 |
Fertility by Age by Marriage Status in Saginaw
25.3% of women with births (711) in Saginaw are married. The highest percentage of unmarried women with births falls into 15 to 19 years age bracket with 100.0% of them unmarried at the time of birth, while the lowest percentage of unmarried women with births belong to 35 to 50 years age bracket with 3.2% of them unmarried.
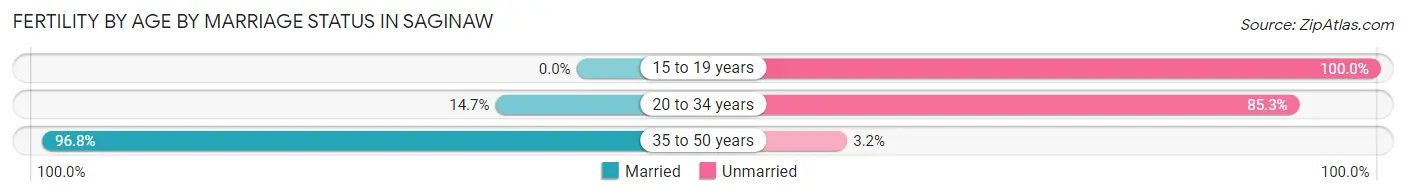
| Age Bracket | Married | Unmarried |
| 15 to 19 years | 0 (0.0%) | 12 (100.0%) |
| 20 to 34 years | 89 (14.7%) | 516 (85.3%) |
| 35 to 50 years | 91 (96.8%) | 3 (3.2%) |
| Total | 180 (25.3%) | 531 (74.7%) |
Fertility by Education in Saginaw
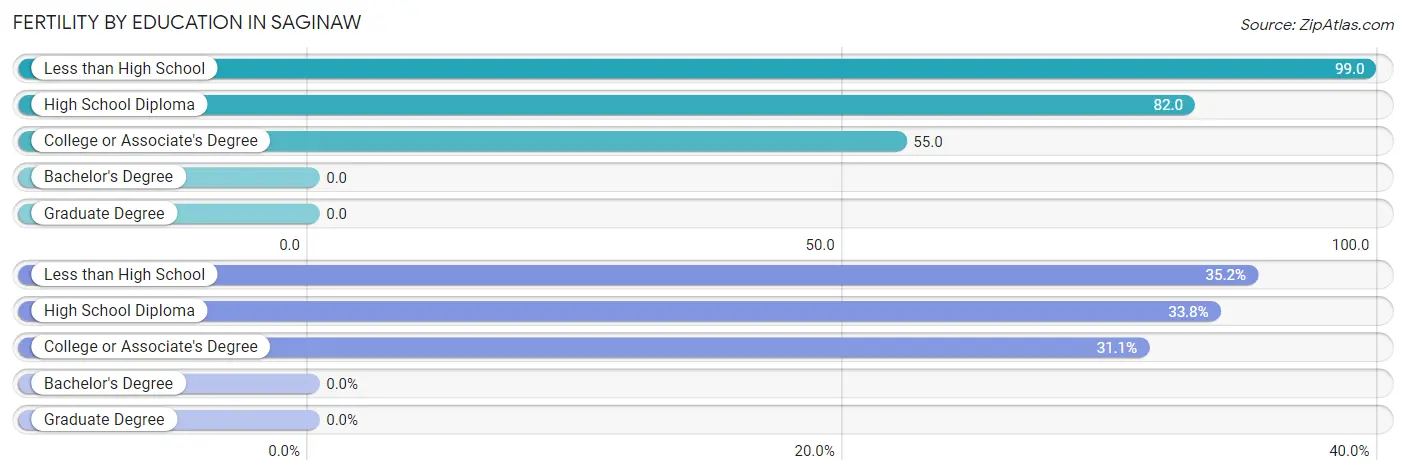
| Educational Attainment | Women with Births | Births / 1,000 Women |
| Less than High School | 250 (35.2%) | 99.0 |
| High School Diploma | 240 (33.8%) | 82.0 |
| College or Associate's Degree | 221 (31.1%) | 55.0 |
| Bachelor's Degree | 0 (0.0%) | 0.0 |
| Graduate Degree | 0 (0.0%) | 0.0 |
| Total | 711 (100.0%) | 67.0 |
Fertility by Education by Marriage Status in Saginaw
74.7% of women with births in Saginaw are unmarried. Women with the educational attainment of college or associate's degree are most likely to be married with 56.1% of them married at childbirth, while women with the educational attainment of high school diploma are least likely to be married with 92.1% of them unmarried at childbirth.
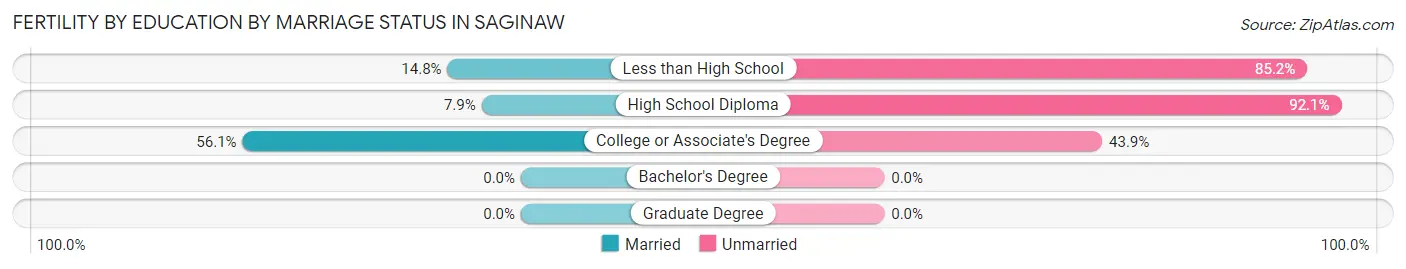
| Educational Attainment | Married | Unmarried |
| Less than High School | 37 (14.8%) | 213 (85.2%) |
| High School Diploma | 19 (7.9%) | 221 (92.1%) |
| College or Associate's Degree | 124 (56.1%) | 97 (43.9%) |
| Bachelor's Degree | 0 (0.0%) | 0 (0.0%) |
| Graduate Degree | 0 (0.0%) | 0 (0.0%) |
| Total | 180 (25.3%) | 531 (74.7%) |
Employment Characteristics in Saginaw
Employment by Class of Employer in Saginaw
Among the 15,585 employed individuals in Saginaw, private company employees (11,866 | 76.1%), not-for-profit organizations (1,419 | 9.1%), and local government employees (886 | 5.7%) make up the most common classes of employment.
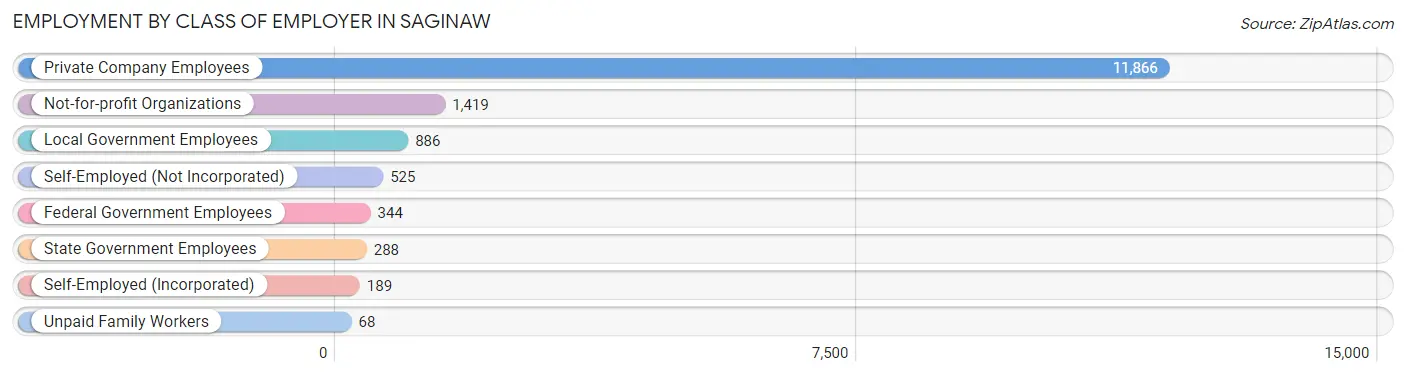
| Employer Class | # Employees | % Employees |
| Private Company Employees | 11,866 | 76.1% |
| Self-Employed (Incorporated) | 189 | 1.2% |
| Self-Employed (Not Incorporated) | 525 | 3.4% |
| Not-for-profit Organizations | 1,419 | 9.1% |
| Local Government Employees | 886 | 5.7% |
| State Government Employees | 288 | 1.8% |
| Federal Government Employees | 344 | 2.2% |
| Unpaid Family Workers | 68 | 0.4% |
| Total | 15,585 | 100.0% |
Employment Status by Age in Saginaw
According to the labor force statistics for Saginaw, out of the total population over 16 years of age (33,363), 54.4% or 18,149 individuals are in the labor force, with 11.7% or 2,123 of them unemployed. The age group with the highest labor force participation rate is 20 to 24 years, with 80.4% or 2,213 individuals in the labor force. Within the labor force, the 30 to 34 years age range has the highest percentage of unemployed individuals, with 18.8% or 379 of them being unemployed.
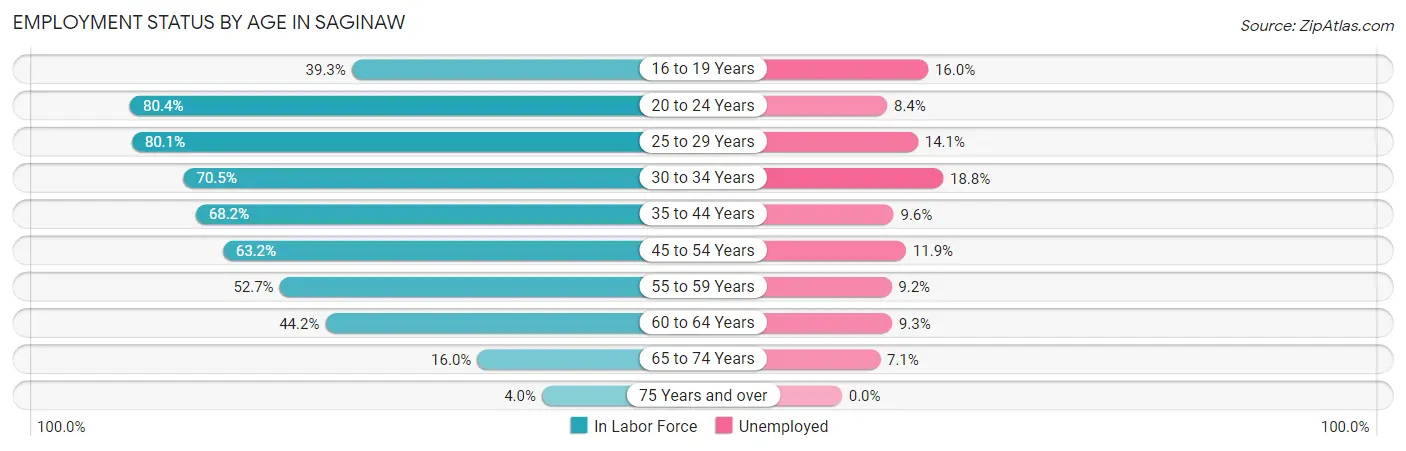
| Age Bracket | In Labor Force | Unemployed |
| 16 to 19 Years | 974 (39.3%) | 156 (16.0%) |
| 20 to 24 Years | 2,213 (80.4%) | 186 (8.4%) |
| 25 to 29 Years | 2,737 (80.1%) | 386 (14.1%) |
| 30 to 34 Years | 2,018 (70.5%) | 379 (18.8%) |
| 35 to 44 Years | 3,952 (68.2%) | 379 (9.6%) |
| 45 to 54 Years | 2,991 (63.2%) | 356 (11.9%) |
| 55 to 59 Years | 1,343 (52.7%) | 124 (9.2%) |
| 60 to 64 Years | 1,268 (44.2%) | 118 (9.3%) |
| 65 to 74 Years | 578 (16.0%) | 41 (7.1%) |
| 75 Years and over | 92 (4.0%) | 0 (0.0%) |
| Total | 18,149 (54.4%) | 2,123 (11.7%) |
Employment Status by Educational Attainment in Saginaw
According to labor force statistics for Saginaw, 64.4% of individuals (14,313) out of the total population between 25 and 64 years of age (22,225) are in the labor force, with 12.2% or 1,746 of them being unemployed. The group with the highest labor force participation rate are those with the educational attainment of bachelor's degree or higher, with 86.6% or 2,302 individuals in the labor force. Within the labor force, individuals with less than high school education have the highest percentage of unemployment, with 25.9% or 496 of them being unemployed.
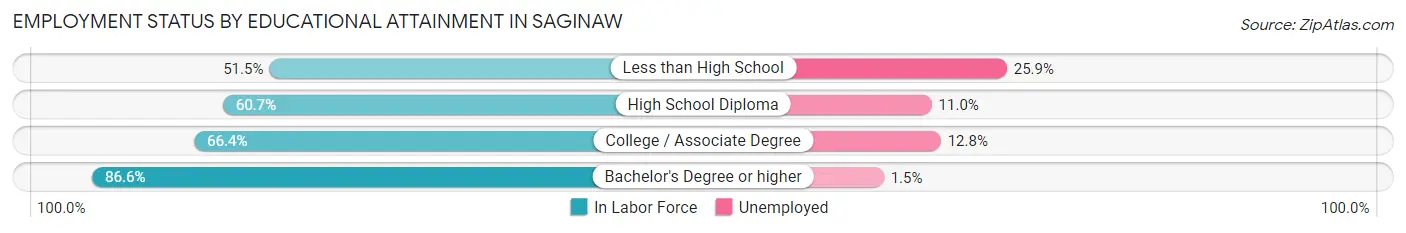
| Educational Attainment | In Labor Force | Unemployed |
| Less than High School | 1,916 (51.5%) | 963 (25.9%) |
| High School Diploma | 4,585 (60.7%) | 831 (11.0%) |
| College / Associate Degree | 5,507 (66.4%) | 1,062 (12.8%) |
| Bachelor's Degree or higher | 2,302 (86.6%) | 40 (1.5%) |
| Total | 14,313 (64.4%) | 2,711 (12.2%) |
Employment Occupations by Sex in Saginaw
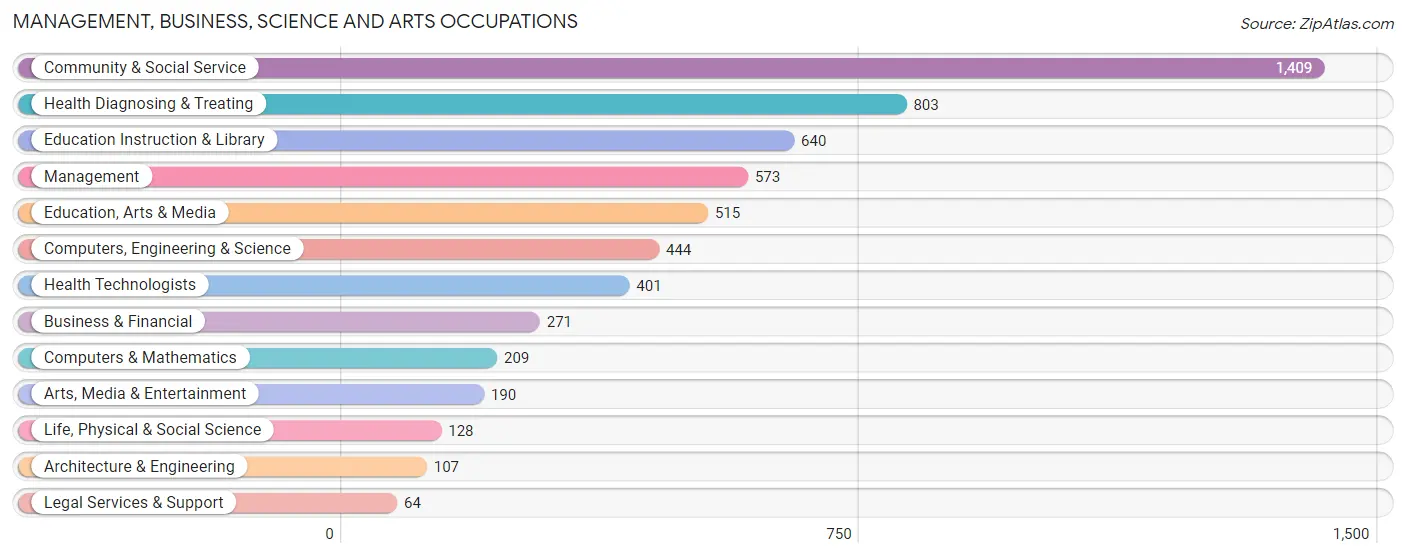
Management, Business, Science and Arts Occupations
The most common Management, Business, Science and Arts occupations in Saginaw are Community & Social Service (1,409 | 8.8%), Health Diagnosing & Treating (803 | 5.0%), Education Instruction & Library (640 | 4.0%), Management (573 | 3.6%), and Education, Arts & Media (515 | 3.2%).
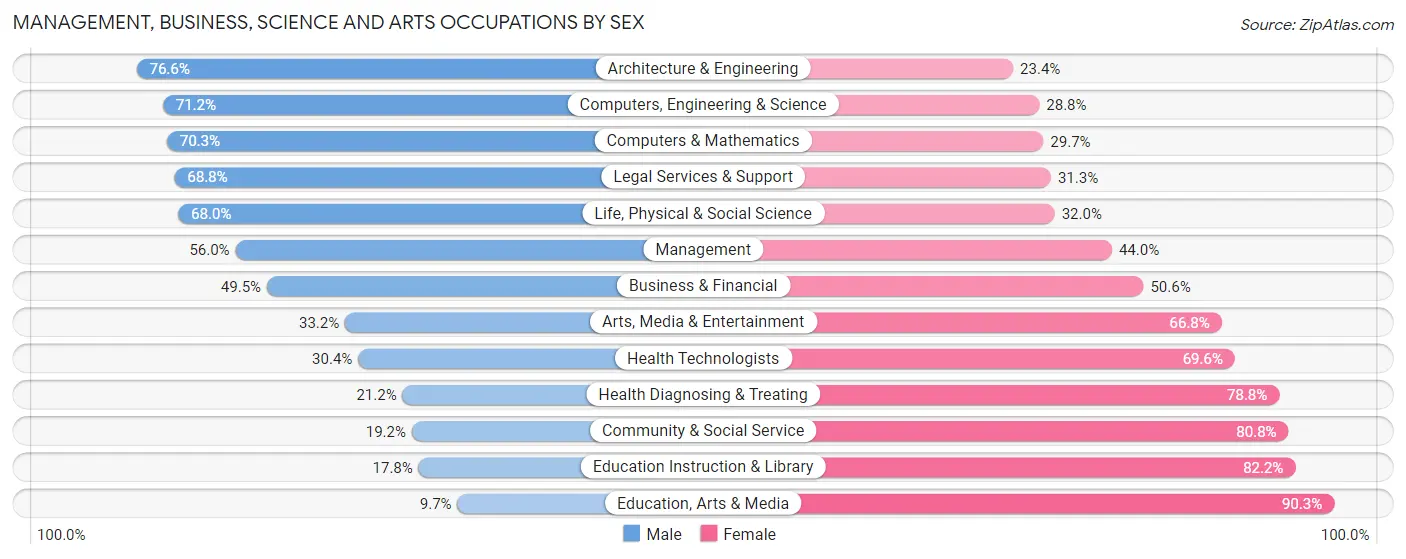
Management, Business, Science and Arts Occupations by Sex
Within the Management, Business, Science and Arts occupations in Saginaw, the most male-oriented occupations are Architecture & Engineering (76.6%), Computers, Engineering & Science (71.2%), and Computers & Mathematics (70.3%), while the most female-oriented occupations are Education, Arts & Media (90.3%), Education Instruction & Library (82.2%), and Community & Social Service (80.8%).
| Occupation | Male | Female |
| Management | 321 (56.0%) | 252 (44.0%) |
| Business & Financial | 134 (49.4%) | 137 (50.5%) |
| Computers, Engineering & Science | 316 (71.2%) | 128 (28.8%) |
| Computers & Mathematics | 147 (70.3%) | 62 (29.7%) |
| Architecture & Engineering | 82 (76.6%) | 25 (23.4%) |
| Life, Physical & Social Science | 87 (68.0%) | 41 (32.0%) |
| Community & Social Service | 271 (19.2%) | 1,138 (80.8%) |
| Education, Arts & Media | 50 (9.7%) | 465 (90.3%) |
| Legal Services & Support | 44 (68.8%) | 20 (31.2%) |
| Education Instruction & Library | 114 (17.8%) | 526 (82.2%) |
| Arts, Media & Entertainment | 63 (33.2%) | 127 (66.8%) |
| Health Diagnosing & Treating | 170 (21.2%) | 633 (78.8%) |
| Health Technologists | 122 (30.4%) | 279 (69.6%) |
| Total (Category) | 1,212 (34.6%) | 2,288 (65.4%) |
| Total (Overall) | 7,405 (46.2%) | 8,634 (53.8%) |
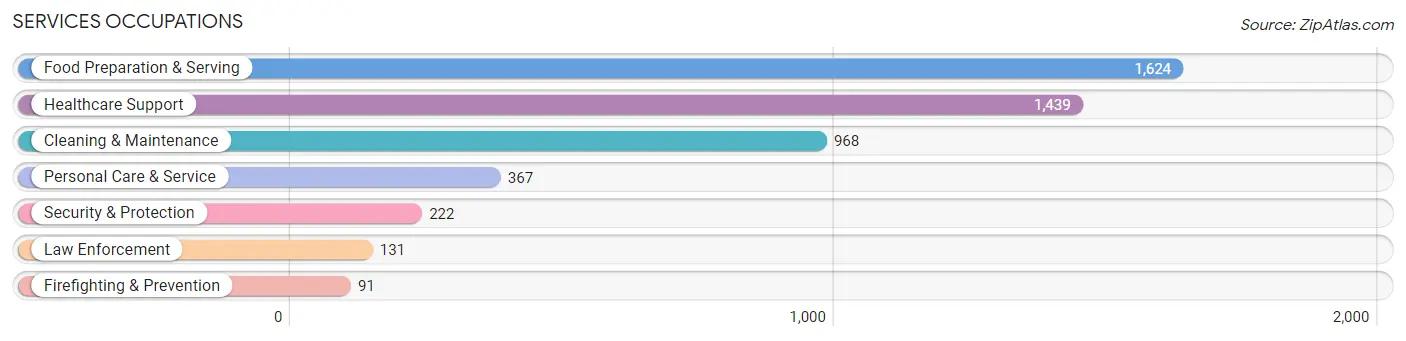
Services Occupations
The most common Services occupations in Saginaw are Food Preparation & Serving (1,624 | 10.1%), Healthcare Support (1,439 | 9.0%), Cleaning & Maintenance (968 | 6.0%), Personal Care & Service (367 | 2.3%), and Security & Protection (222 | 1.4%).
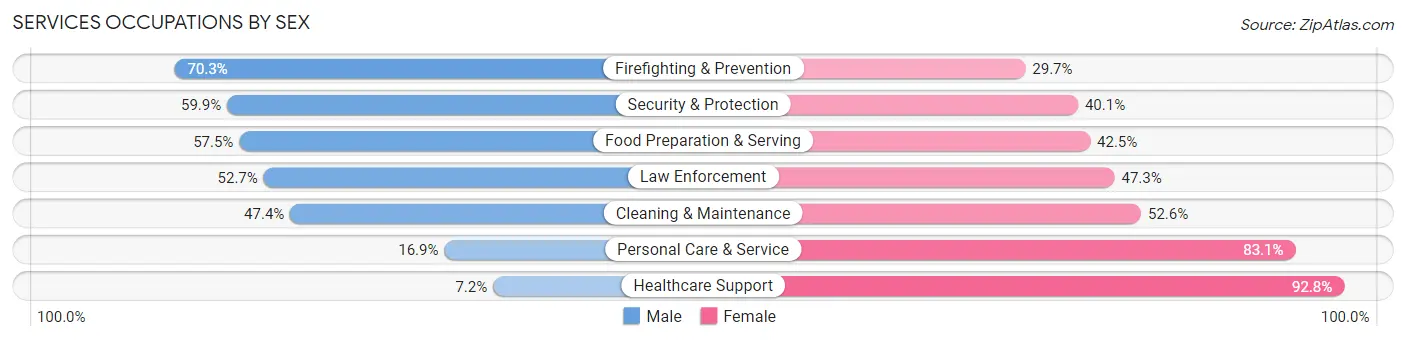
Services Occupations by Sex
Within the Services occupations in Saginaw, the most male-oriented occupations are Firefighting & Prevention (70.3%), Security & Protection (59.9%), and Food Preparation & Serving (57.5%), while the most female-oriented occupations are Healthcare Support (92.8%), Personal Care & Service (83.1%), and Cleaning & Maintenance (52.6%).
| Occupation | Male | Female |
| Healthcare Support | 104 (7.2%) | 1,335 (92.8%) |
| Security & Protection | 133 (59.9%) | 89 (40.1%) |
| Firefighting & Prevention | 64 (70.3%) | 27 (29.7%) |
| Law Enforcement | 69 (52.7%) | 62 (47.3%) |
| Food Preparation & Serving | 934 (57.5%) | 690 (42.5%) |
| Cleaning & Maintenance | 459 (47.4%) | 509 (52.6%) |
| Personal Care & Service | 62 (16.9%) | 305 (83.1%) |
| Total (Category) | 1,692 (36.6%) | 2,928 (63.4%) |
| Total (Overall) | 7,405 (46.2%) | 8,634 (53.8%) |
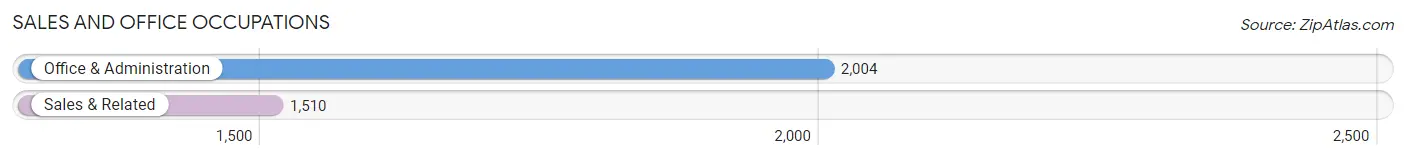
Sales and Office Occupations
The most common Sales and Office occupations in Saginaw are Office & Administration (2,004 | 12.5%), and Sales & Related (1,510 | 9.4%).
Sales and Office Occupations by Sex
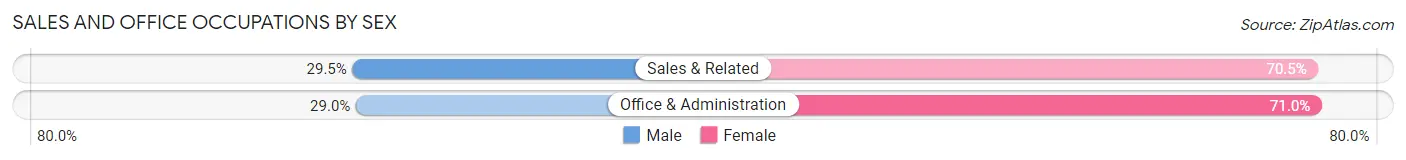
| Occupation | Male | Female |
| Sales & Related | 446 (29.5%) | 1,064 (70.5%) |
| Office & Administration | 581 (29.0%) | 1,423 (71.0%) |
| Total (Category) | 1,027 (29.2%) | 2,487 (70.8%) |
| Total (Overall) | 7,405 (46.2%) | 8,634 (53.8%) |
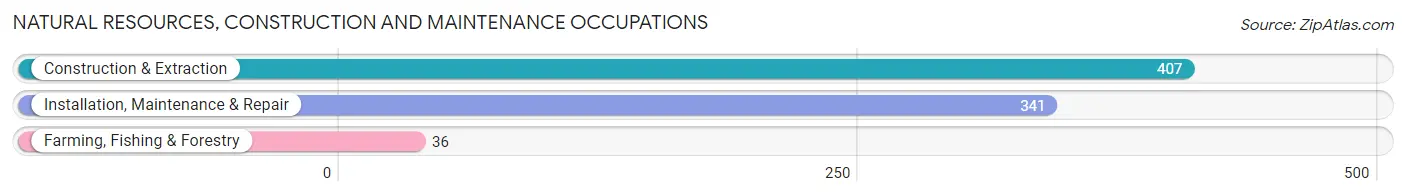
Natural Resources, Construction and Maintenance Occupations
The most common Natural Resources, Construction and Maintenance occupations in Saginaw are Construction & Extraction (407 | 2.5%), Installation, Maintenance & Repair (341 | 2.1%), and Farming, Fishing & Forestry (36 | 0.2%).
Natural Resources, Construction and Maintenance Occupations by Sex
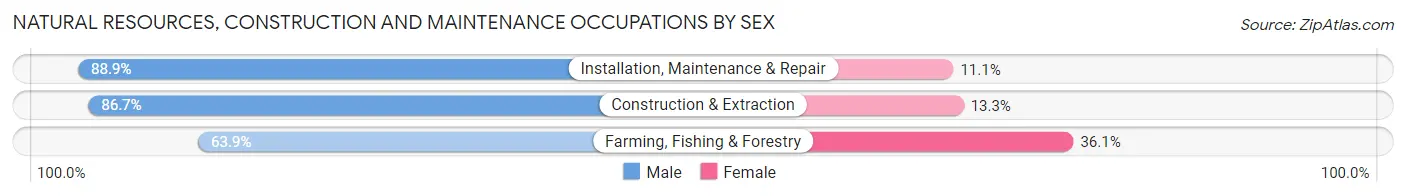
| Occupation | Male | Female |
| Farming, Fishing & Forestry | 23 (63.9%) | 13 (36.1%) |
| Construction & Extraction | 353 (86.7%) | 54 (13.3%) |
| Installation, Maintenance & Repair | 303 (88.9%) | 38 (11.1%) |
| Total (Category) | 679 (86.6%) | 105 (13.4%) |
| Total (Overall) | 7,405 (46.2%) | 8,634 (53.8%) |
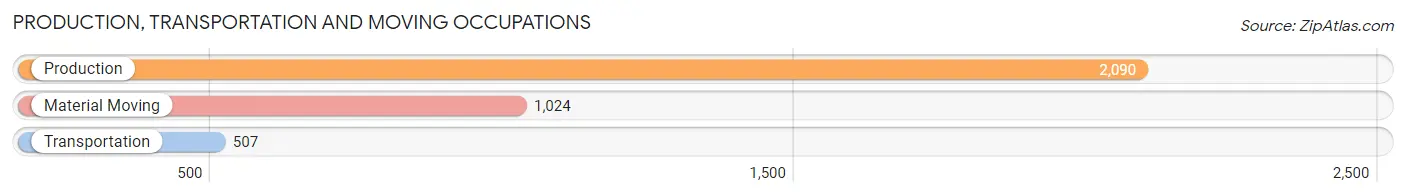
Production, Transportation and Moving Occupations
The most common Production, Transportation and Moving occupations in Saginaw are Production (2,090 | 13.0%), Material Moving (1,024 | 6.4%), and Transportation (507 | 3.2%).
Production, Transportation and Moving Occupations by Sex
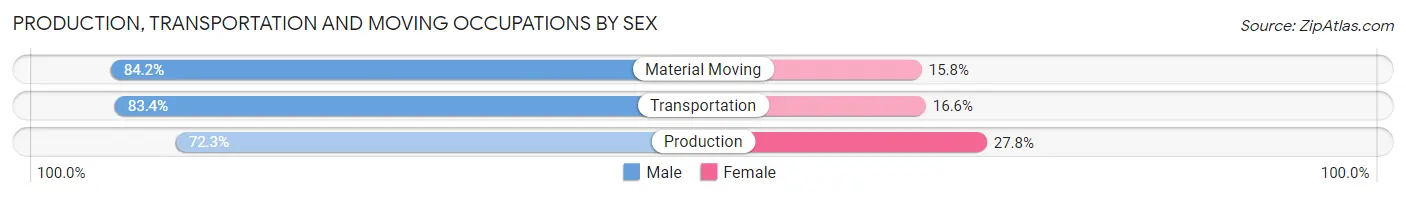
| Occupation | Male | Female |
| Production | 1,510 (72.3%) | 580 (27.8%) |
| Transportation | 423 (83.4%) | 84 (16.6%) |
| Material Moving | 862 (84.2%) | 162 (15.8%) |
| Total (Category) | 2,795 (77.2%) | 826 (22.8%) |
| Total (Overall) | 7,405 (46.2%) | 8,634 (53.8%) |
Employment Industries by Sex in Saginaw
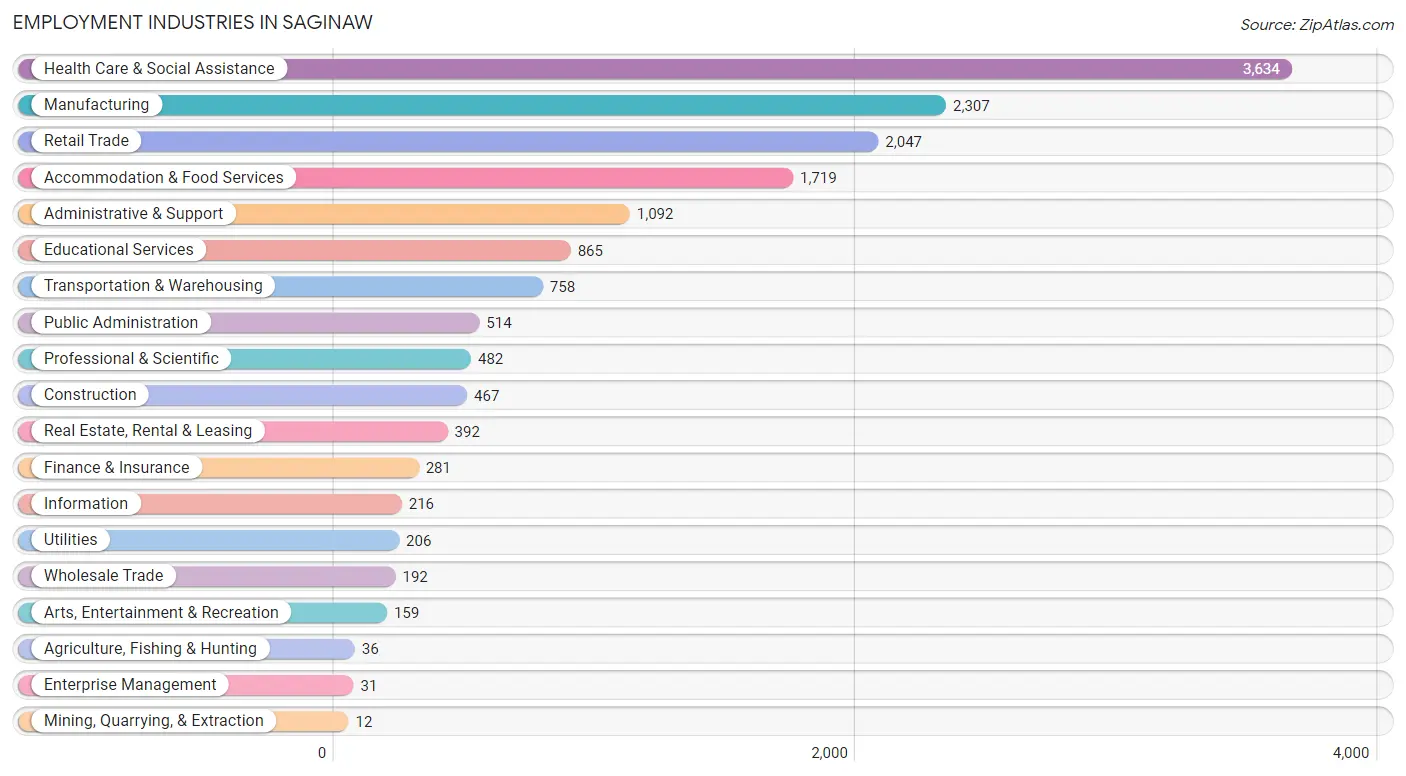
Employment Industries in Saginaw
The major employment industries in Saginaw include Health Care & Social Assistance (3,634 | 22.7%), Manufacturing (2,307 | 14.4%), Retail Trade (2,047 | 12.8%), Accommodation & Food Services (1,719 | 10.7%), and Administrative & Support (1,092 | 6.8%).
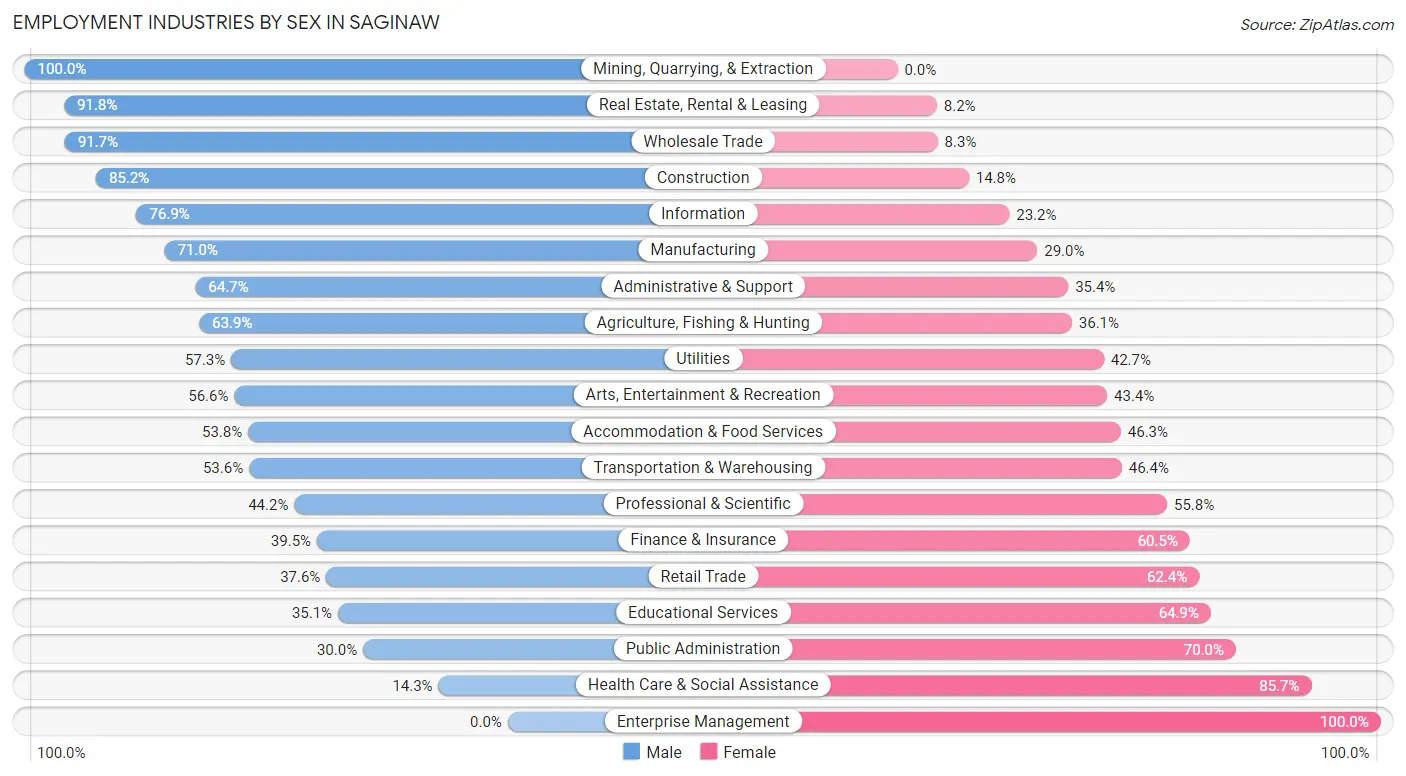
Employment Industries by Sex in Saginaw
The Saginaw industries that see more men than women are Mining, Quarrying, & Extraction (100.0%), Real Estate, Rental & Leasing (91.8%), and Wholesale Trade (91.7%), whereas the industries that tend to have a higher number of women are Enterprise Management (100.0%), Health Care & Social Assistance (85.7%), and Public Administration (70.0%).
| Industry | Male | Female |
| Agriculture, Fishing & Hunting | 23 (63.9%) | 13 (36.1%) |
| Mining, Quarrying, & Extraction | 12 (100.0%) | 0 (0.0%) |
| Construction | 398 (85.2%) | 69 (14.8%) |
| Manufacturing | 1,639 (71.0%) | 668 (29.0%) |
| Wholesale Trade | 176 (91.7%) | 16 (8.3%) |
| Retail Trade | 769 (37.6%) | 1,278 (62.4%) |
| Transportation & Warehousing | 406 (53.6%) | 352 (46.4%) |
| Utilities | 118 (57.3%) | 88 (42.7%) |
| Information | 166 (76.8%) | 50 (23.2%) |
| Finance & Insurance | 111 (39.5%) | 170 (60.5%) |
| Real Estate, Rental & Leasing | 360 (91.8%) | 32 (8.2%) |
| Professional & Scientific | 213 (44.2%) | 269 (55.8%) |
| Enterprise Management | 0 (0.0%) | 31 (100.0%) |
| Administrative & Support | 706 (64.6%) | 386 (35.3%) |
| Educational Services | 304 (35.1%) | 561 (64.9%) |
| Health Care & Social Assistance | 521 (14.3%) | 3,113 (85.7%) |
| Arts, Entertainment & Recreation | 90 (56.6%) | 69 (43.4%) |
| Accommodation & Food Services | 924 (53.7%) | 795 (46.3%) |
| Public Administration | 154 (30.0%) | 360 (70.0%) |
| Total | 7,405 (46.2%) | 8,634 (53.8%) |
Education in Saginaw
School Enrollment in Saginaw
The most common levels of schooling among the 10,866 students in Saginaw are high school (2,952 | 27.2%), elementary school (2,629 | 24.2%), and middle school (2,322 | 21.4%).
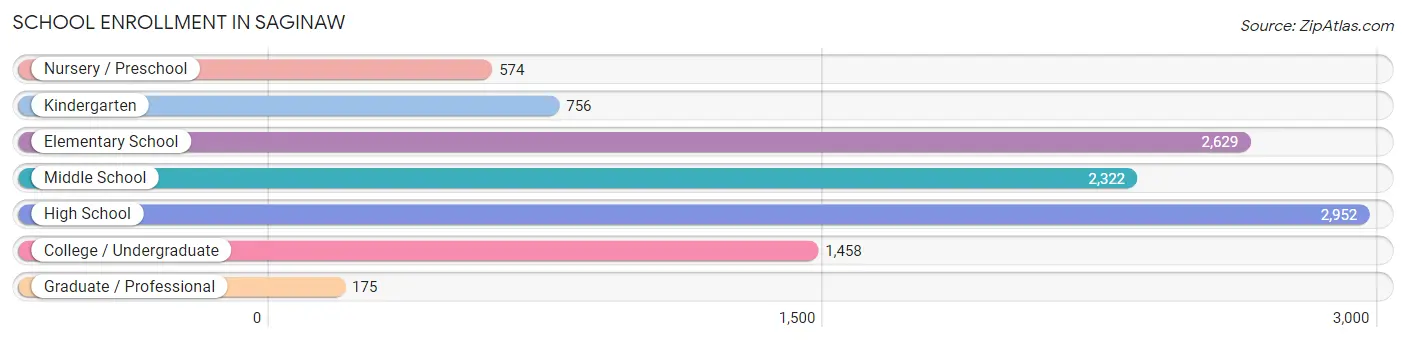
| School Level | # Students | % Students |
| Nursery / Preschool | 574 | 5.3% |
| Kindergarten | 756 | 7.0% |
| Elementary School | 2,629 | 24.2% |
| Middle School | 2,322 | 21.4% |
| High School | 2,952 | 27.2% |
| College / Undergraduate | 1,458 | 13.4% |
| Graduate / Professional | 175 | 1.6% |
| Total | 10,866 | 100.0% |
School Enrollment by Age by Funding Source in Saginaw
Out of a total of 10,866 students who are enrolled in schools in Saginaw, 1,043 (9.6%) attend a private institution, while the remaining 9,823 (90.4%) are enrolled in public schools. The age group of 3 to 4 year olds has the highest likelihood of being enrolled in private schools, with 99 (18.3% in the age bracket) enrolled. Conversely, the age group of 25 to 34 year olds has the lowest likelihood of being enrolled in a private school, with 624 (96.5% in the age bracket) attending a public institution.
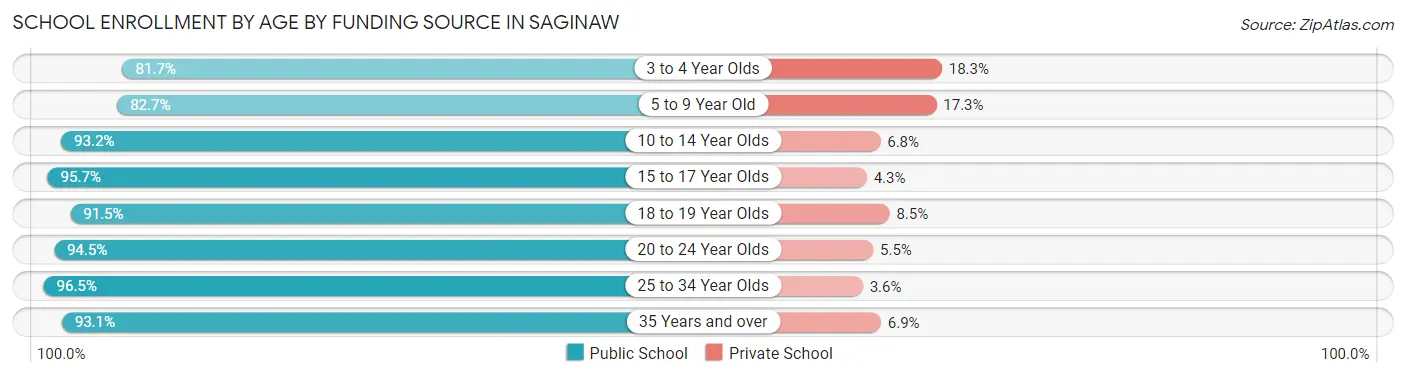
| Age Bracket | Public School | Private School |
| 3 to 4 Year Olds | 443 (81.7%) | 99 (18.3%) |
| 5 to 9 Year Old | 2,492 (82.7%) | 520 (17.3%) |
| 10 to 14 Year Olds | 3,048 (93.2%) | 223 (6.8%) |
| 15 to 17 Year Olds | 1,912 (95.7%) | 86 (4.3%) |
| 18 to 19 Year Olds | 515 (91.5%) | 48 (8.5%) |
| 20 to 24 Year Olds | 569 (94.5%) | 33 (5.5%) |
| 25 to 34 Year Olds | 624 (96.5%) | 23 (3.5%) |
| 35 Years and over | 215 (93.1%) | 16 (6.9%) |
| Total | 9,823 (90.4%) | 1,043 (9.6%) |
Educational Attainment by Field of Study in Saginaw
Business (786 | 20.0%), education (695 | 17.7%), science & technology (560 | 14.2%), arts & humanities (439 | 11.2%), and liberal arts & history (218 | 5.5%) are the most common fields of study among 3,933 individuals in Saginaw who have obtained a bachelor's degree or higher.
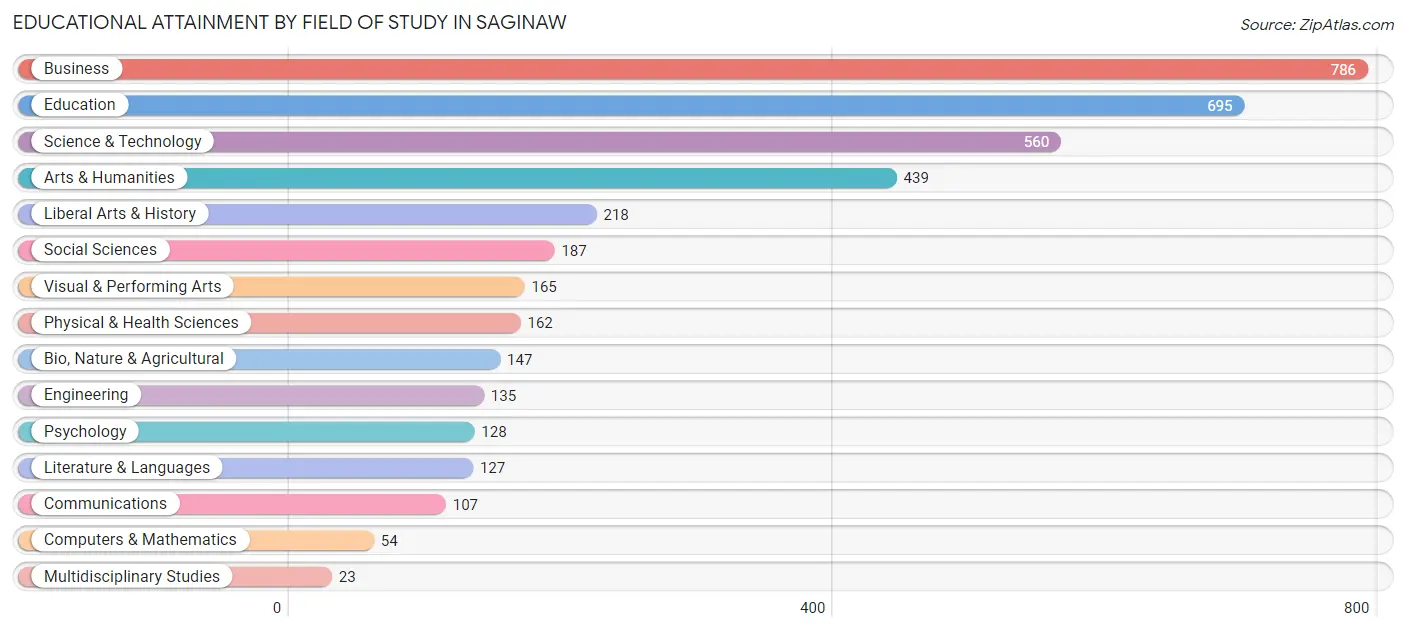
| Field of Study | # Graduates | % Graduates |
| Computers & Mathematics | 54 | 1.4% |
| Bio, Nature & Agricultural | 147 | 3.7% |
| Physical & Health Sciences | 162 | 4.1% |
| Psychology | 128 | 3.3% |
| Social Sciences | 187 | 4.8% |
| Engineering | 135 | 3.4% |
| Multidisciplinary Studies | 23 | 0.6% |
| Science & Technology | 560 | 14.2% |
| Business | 786 | 20.0% |
| Education | 695 | 17.7% |
| Literature & Languages | 127 | 3.2% |
| Liberal Arts & History | 218 | 5.5% |
| Visual & Performing Arts | 165 | 4.2% |
| Communications | 107 | 2.7% |
| Arts & Humanities | 439 | 11.2% |
| Total | 3,933 | 100.0% |
Transportation & Commute in Saginaw
Vehicle Availability by Sex in Saginaw
The most prevalent vehicle ownership categories in Saginaw are males with 2 vehicles (2,731, accounting for 38.7%) and females with 2 vehicles (3,164, making up 32.5%).
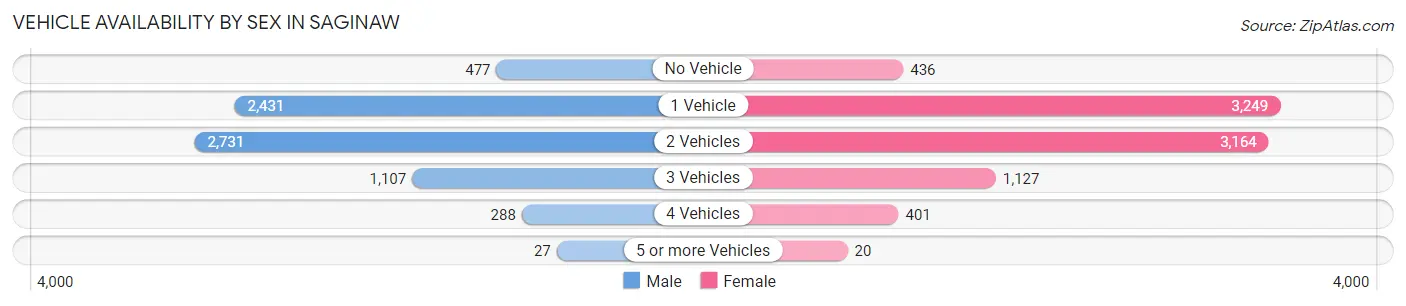
| Vehicles Available | Male | Female |
| No Vehicle | 477 (6.8%) | 436 (5.2%) |
| 1 Vehicle | 2,431 (34.4%) | 3,249 (38.7%) |
| 2 Vehicles | 2,731 (38.7%) | 3,164 (37.7%) |
| 3 Vehicles | 1,107 (15.7%) | 1,127 (13.4%) |
| 4 Vehicles | 288 (4.1%) | 401 (4.8%) |
| 5 or more Vehicles | 27 (0.4%) | 20 (0.2%) |
| Total | 7,061 (100.0%) | 8,397 (100.0%) |
Commute Time in Saginaw
The most frequently occuring commute durations in Saginaw are 10 to 14 minutes (3,688 commuters, 25.0%), 15 to 19 minutes (3,154 commuters, 21.4%), and 5 to 9 minutes (2,316 commuters, 15.7%).
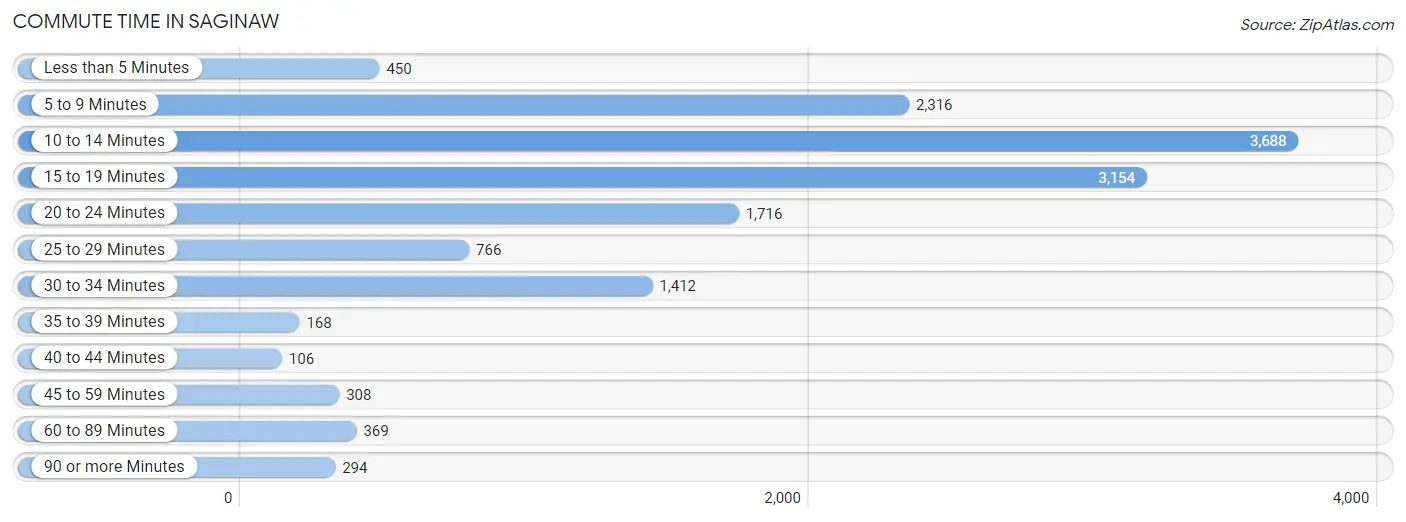
| Commute Time | # Commuters | % Commuters |
| Less than 5 Minutes | 450 | 3.0% |
| 5 to 9 Minutes | 2,316 | 15.7% |
| 10 to 14 Minutes | 3,688 | 25.0% |
| 15 to 19 Minutes | 3,154 | 21.4% |
| 20 to 24 Minutes | 1,716 | 11.6% |
| 25 to 29 Minutes | 766 | 5.2% |
| 30 to 34 Minutes | 1,412 | 9.6% |
| 35 to 39 Minutes | 168 | 1.1% |
| 40 to 44 Minutes | 106 | 0.7% |
| 45 to 59 Minutes | 308 | 2.1% |
| 60 to 89 Minutes | 369 | 2.5% |
| 90 or more Minutes | 294 | 2.0% |
Commute Time by Sex in Saginaw
The most common commute times in Saginaw are 15 to 19 minutes (1,556 commuters, 23.5%) for males and 10 to 14 minutes (2,292 commuters, 28.2%) for females.
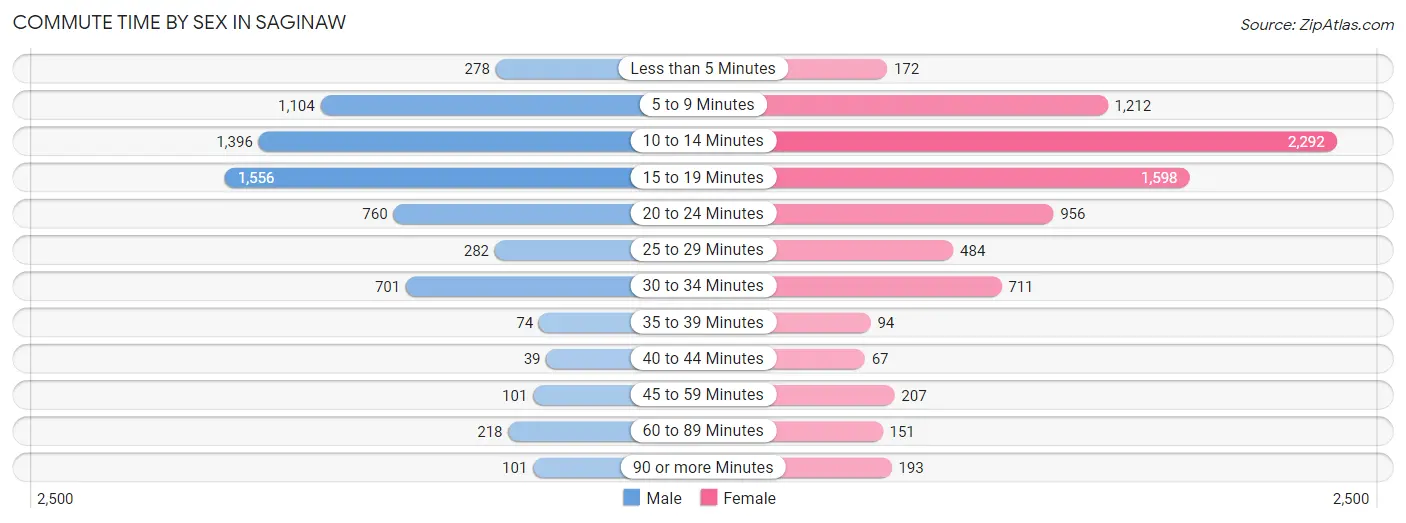
| Commute Time | Male | Female |
| Less than 5 Minutes | 278 (4.2%) | 172 (2.1%) |
| 5 to 9 Minutes | 1,104 (16.7%) | 1,212 (14.9%) |
| 10 to 14 Minutes | 1,396 (21.1%) | 2,292 (28.2%) |
| 15 to 19 Minutes | 1,556 (23.5%) | 1,598 (19.6%) |
| 20 to 24 Minutes | 760 (11.5%) | 956 (11.7%) |
| 25 to 29 Minutes | 282 (4.3%) | 484 (5.9%) |
| 30 to 34 Minutes | 701 (10.6%) | 711 (8.7%) |
| 35 to 39 Minutes | 74 (1.1%) | 94 (1.2%) |
| 40 to 44 Minutes | 39 (0.6%) | 67 (0.8%) |
| 45 to 59 Minutes | 101 (1.5%) | 207 (2.5%) |
| 60 to 89 Minutes | 218 (3.3%) | 151 (1.9%) |
| 90 or more Minutes | 101 (1.5%) | 193 (2.4%) |
Time of Departure to Work by Sex in Saginaw
The most frequent times of departure to work in Saginaw are 12:00 PM to 3:59 PM (962, 14.5%) for males and 12:00 PM to 3:59 PM (1,234, 15.2%) for females.
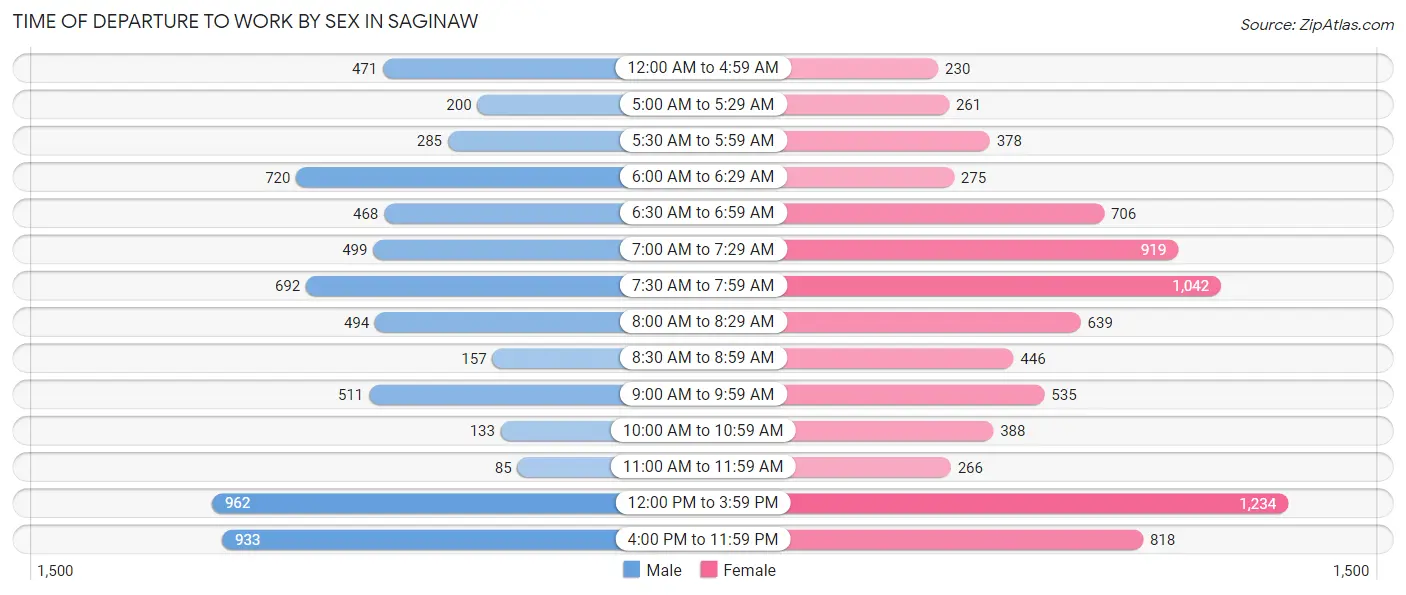
| Time of Departure | Male | Female |
| 12:00 AM to 4:59 AM | 471 (7.1%) | 230 (2.8%) |
| 5:00 AM to 5:29 AM | 200 (3.0%) | 261 (3.2%) |
| 5:30 AM to 5:59 AM | 285 (4.3%) | 378 (4.6%) |
| 6:00 AM to 6:29 AM | 720 (10.9%) | 275 (3.4%) |
| 6:30 AM to 6:59 AM | 468 (7.1%) | 706 (8.7%) |
| 7:00 AM to 7:29 AM | 499 (7.5%) | 919 (11.3%) |
| 7:30 AM to 7:59 AM | 692 (10.5%) | 1,042 (12.8%) |
| 8:00 AM to 8:29 AM | 494 (7.5%) | 639 (7.9%) |
| 8:30 AM to 8:59 AM | 157 (2.4%) | 446 (5.5%) |
| 9:00 AM to 9:59 AM | 511 (7.7%) | 535 (6.6%) |
| 10:00 AM to 10:59 AM | 133 (2.0%) | 388 (4.8%) |
| 11:00 AM to 11:59 AM | 85 (1.3%) | 266 (3.3%) |
| 12:00 PM to 3:59 PM | 962 (14.5%) | 1,234 (15.2%) |
| 4:00 PM to 11:59 PM | 933 (14.1%) | 818 (10.1%) |
| Total | 6,610 (100.0%) | 8,137 (100.0%) |
Housing Occupancy in Saginaw
Occupancy by Ownership in Saginaw
Of the total 17,520 dwellings in Saginaw, owner-occupied units account for 9,884 (56.4%), while renter-occupied units make up 7,636 (43.6%).
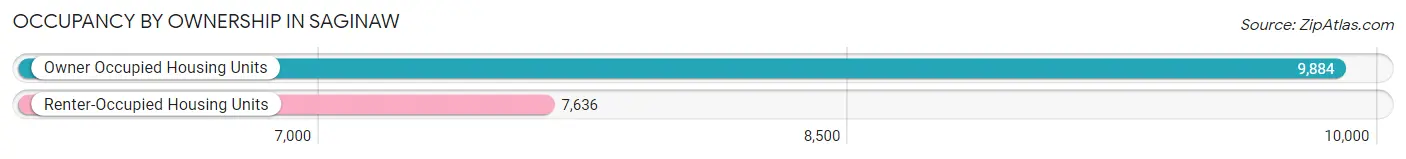
| Occupancy | # Housing Units | % Housing Units |
| Owner Occupied Housing Units | 9,884 | 56.4% |
| Renter-Occupied Housing Units | 7,636 | 43.6% |
| Total Occupied Housing Units | 17,520 | 100.0% |
Occupancy by Household Size in Saginaw
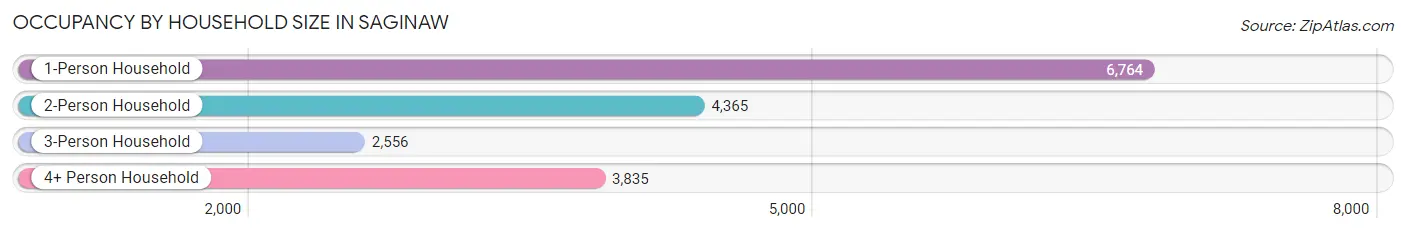
| Household Size | # Housing Units | % Housing Units |
| 1-Person Household | 6,764 | 38.6% |
| 2-Person Household | 4,365 | 24.9% |
| 3-Person Household | 2,556 | 14.6% |
| 4+ Person Household | 3,835 | 21.9% |
| Total Housing Units | 17,520 | 100.0% |
Occupancy by Ownership by Household Size in Saginaw
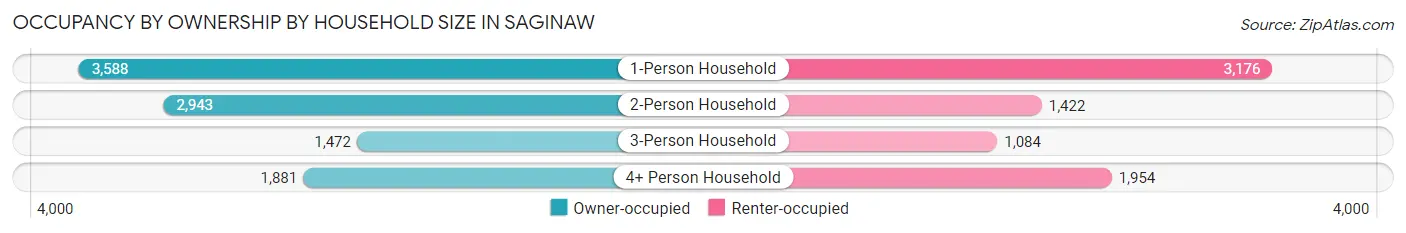
| Household Size | Owner-occupied | Renter-occupied |
| 1-Person Household | 3,588 (53.0%) | 3,176 (46.9%) |
| 2-Person Household | 2,943 (67.4%) | 1,422 (32.6%) |
| 3-Person Household | 1,472 (57.6%) | 1,084 (42.4%) |
| 4+ Person Household | 1,881 (49.0%) | 1,954 (50.9%) |
| Total Housing Units | 9,884 (56.4%) | 7,636 (43.6%) |
Occupancy by Educational Attainment in Saginaw
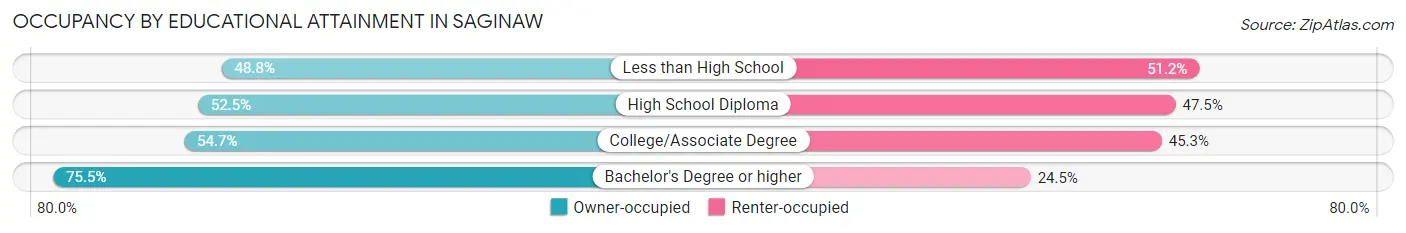
| Household Size | Owner-occupied | Renter-occupied |
| Less than High School | 1,153 (48.8%) | 1,211 (51.2%) |
| High School Diploma | 2,970 (52.5%) | 2,685 (47.5%) |
| College/Associate Degree | 3,713 (54.7%) | 3,075 (45.3%) |
| Bachelor's Degree or higher | 2,048 (75.5%) | 665 (24.5%) |
Occupancy by Age of Householder in Saginaw
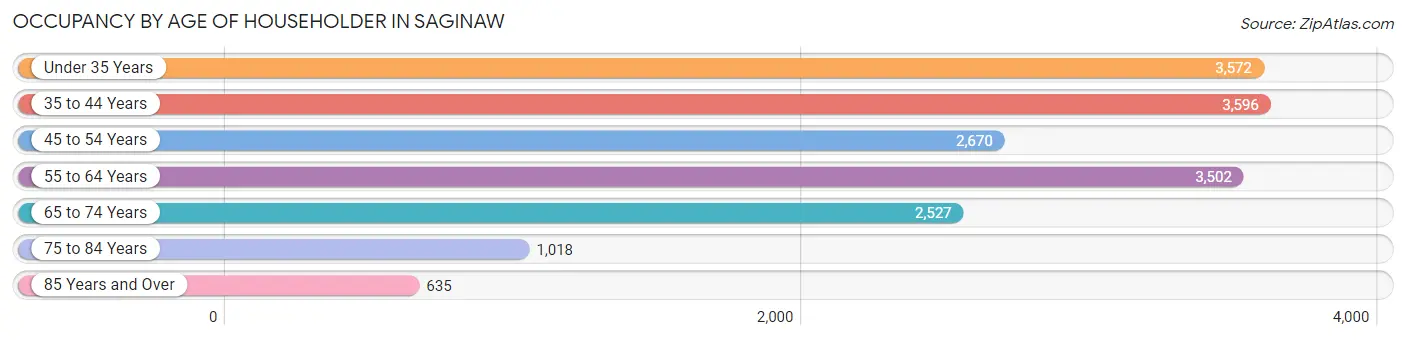
| Age Bracket | # Households | % Households |
| Under 35 Years | 3,572 | 20.4% |
| 35 to 44 Years | 3,596 | 20.5% |
| 45 to 54 Years | 2,670 | 15.2% |
| 55 to 64 Years | 3,502 | 20.0% |
| 65 to 74 Years | 2,527 | 14.4% |
| 75 to 84 Years | 1,018 | 5.8% |
| 85 Years and Over | 635 | 3.6% |
| Total | 17,520 | 100.0% |
Housing Finances in Saginaw
Median Income by Occupancy in Saginaw
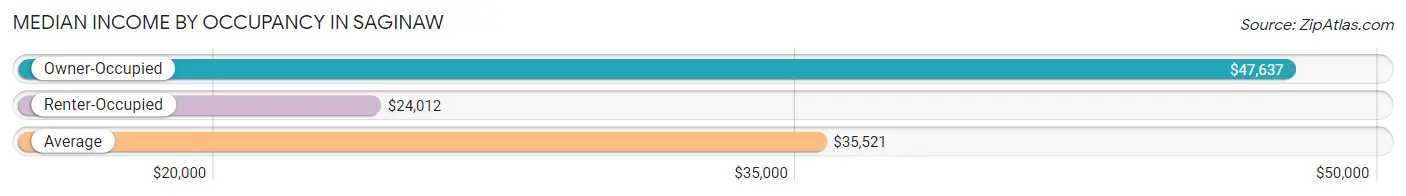
| Occupancy Type | # Households | Median Income |
| Owner-Occupied | 9,884 (56.4%) | $47,637 |
| Renter-Occupied | 7,636 (43.6%) | $24,012 |
| Average | 17,520 (100.0%) | $35,521 |
Occupancy by Householder Income Bracket in Saginaw
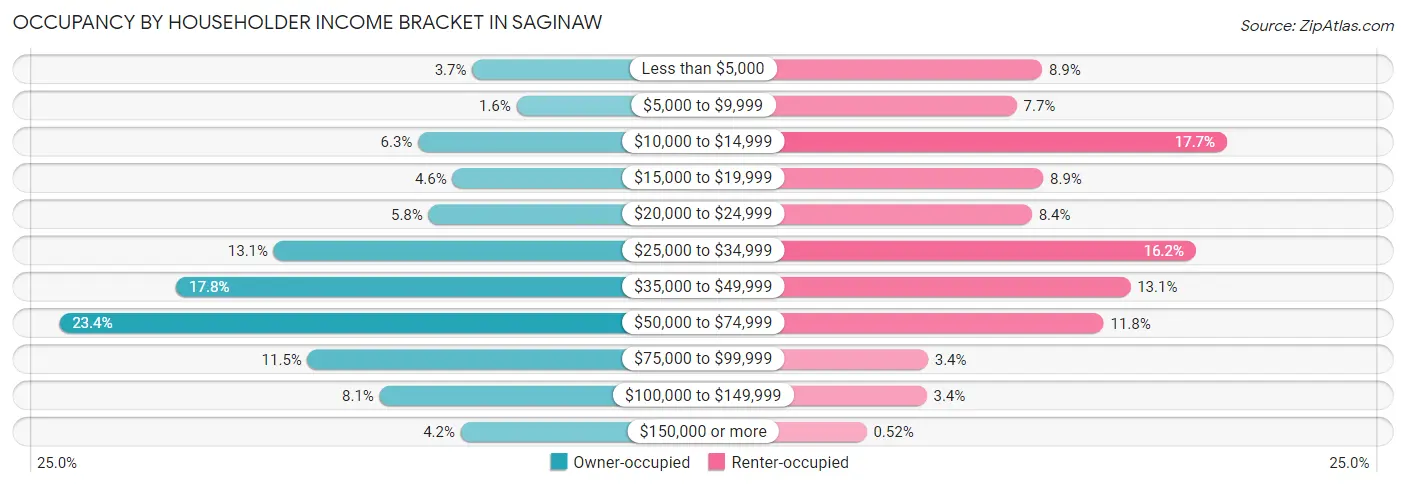
| Income Bracket | Owner-occupied | Renter-occupied |
| Less than $5,000 | 364 (3.7%) | 678 (8.9%) |
| $5,000 to $9,999 | 155 (1.6%) | 586 (7.7%) |
| $10,000 to $14,999 | 619 (6.3%) | 1,350 (17.7%) |
| $15,000 to $19,999 | 457 (4.6%) | 682 (8.9%) |
| $20,000 to $24,999 | 569 (5.8%) | 641 (8.4%) |
| $25,000 to $34,999 | 1,298 (13.1%) | 1,237 (16.2%) |
| $35,000 to $49,999 | 1,757 (17.8%) | 999 (13.1%) |
| $50,000 to $74,999 | 2,308 (23.4%) | 902 (11.8%) |
| $75,000 to $99,999 | 1,139 (11.5%) | 263 (3.4%) |
| $100,000 to $149,999 | 800 (8.1%) | 258 (3.4%) |
| $150,000 or more | 418 (4.2%) | 40 (0.5%) |
| Total | 9,884 (100.0%) | 7,636 (100.0%) |
Monthly Housing Cost Tiers in Saginaw
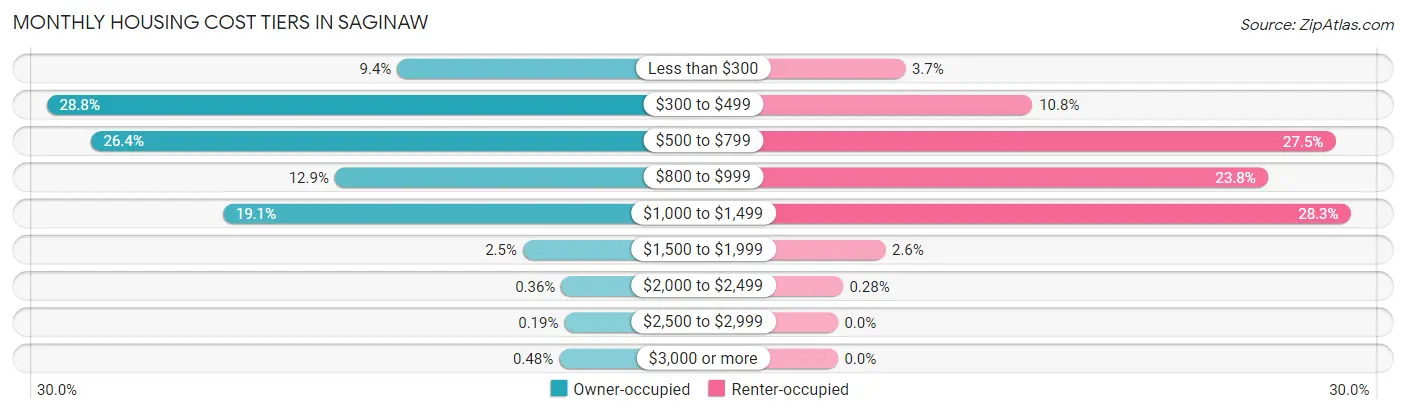
| Monthly Cost | Owner-occupied | Renter-occupied |
| Less than $300 | 931 (9.4%) | 285 (3.7%) |
| $300 to $499 | 2,846 (28.8%) | 822 (10.8%) |
| $500 to $799 | 2,605 (26.4%) | 2,099 (27.5%) |
| $800 to $999 | 1,272 (12.9%) | 1,814 (23.8%) |
| $1,000 to $1,499 | 1,883 (19.1%) | 2,163 (28.3%) |
| $1,500 to $1,999 | 245 (2.5%) | 201 (2.6%) |
| $2,000 to $2,499 | 36 (0.4%) | 21 (0.3%) |
| $2,500 to $2,999 | 19 (0.2%) | 0 (0.0%) |
| $3,000 or more | 47 (0.5%) | 0 (0.0%) |
| Total | 9,884 (100.0%) | 7,636 (100.0%) |
Physical Housing Characteristics in Saginaw
Housing Structures in Saginaw
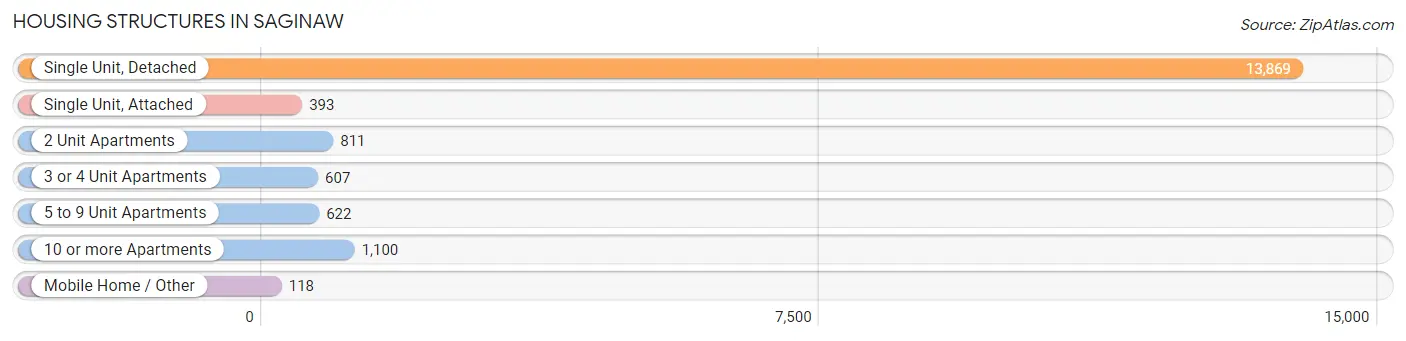
| Structure Type | # Housing Units | % Housing Units |
| Single Unit, Detached | 13,869 | 79.2% |
| Single Unit, Attached | 393 | 2.2% |
| 2 Unit Apartments | 811 | 4.6% |
| 3 or 4 Unit Apartments | 607 | 3.5% |
| 5 to 9 Unit Apartments | 622 | 3.5% |
| 10 or more Apartments | 1,100 | 6.3% |
| Mobile Home / Other | 118 | 0.7% |
| Total | 17,520 | 100.0% |
Housing Structures by Occupancy in Saginaw
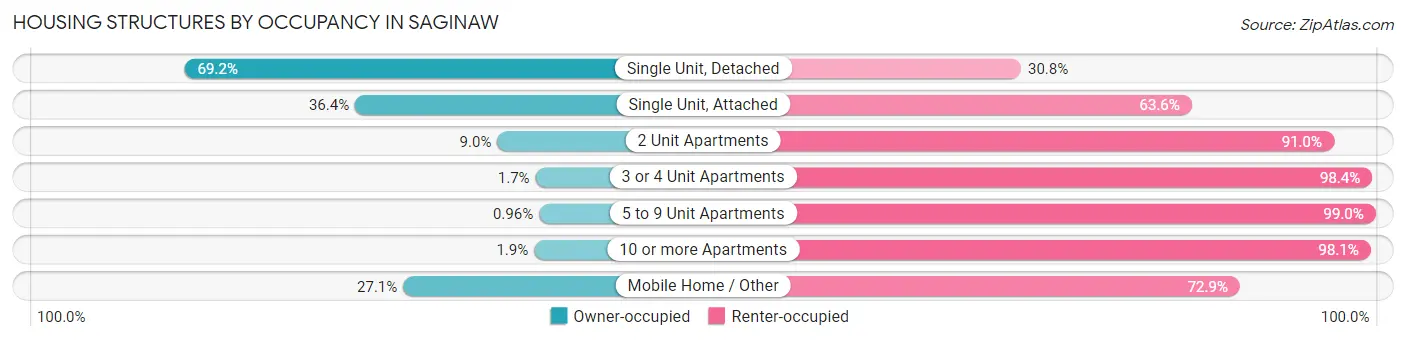
| Structure Type | Owner-occupied | Renter-occupied |
| Single Unit, Detached | 9,599 (69.2%) | 4,270 (30.8%) |
| Single Unit, Attached | 143 (36.4%) | 250 (63.6%) |
| 2 Unit Apartments | 73 (9.0%) | 738 (91.0%) |
| 3 or 4 Unit Apartments | 10 (1.7%) | 597 (98.4%) |
| 5 to 9 Unit Apartments | 6 (1.0%) | 616 (99.0%) |
| 10 or more Apartments | 21 (1.9%) | 1,079 (98.1%) |
| Mobile Home / Other | 32 (27.1%) | 86 (72.9%) |
| Total | 9,884 (56.4%) | 7,636 (43.6%) |
Housing Structures by Number of Rooms in Saginaw
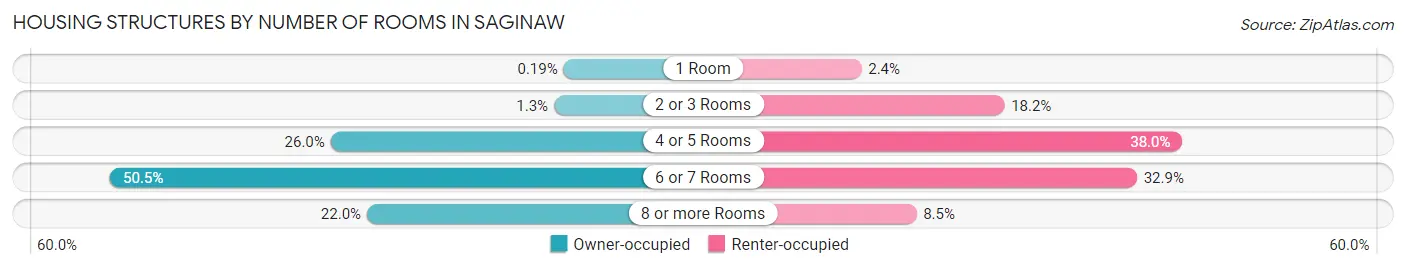
| Number of Rooms | Owner-occupied | Renter-occupied |
| 1 Room | 19 (0.2%) | 181 (2.4%) |
| 2 or 3 Rooms | 124 (1.3%) | 1,392 (18.2%) |
| 4 or 5 Rooms | 2,574 (26.0%) | 2,901 (38.0%) |
| 6 or 7 Rooms | 4,992 (50.5%) | 2,515 (32.9%) |
| 8 or more Rooms | 2,175 (22.0%) | 647 (8.5%) |
| Total | 9,884 (100.0%) | 7,636 (100.0%) |
Housing Structure by Heating Type in Saginaw
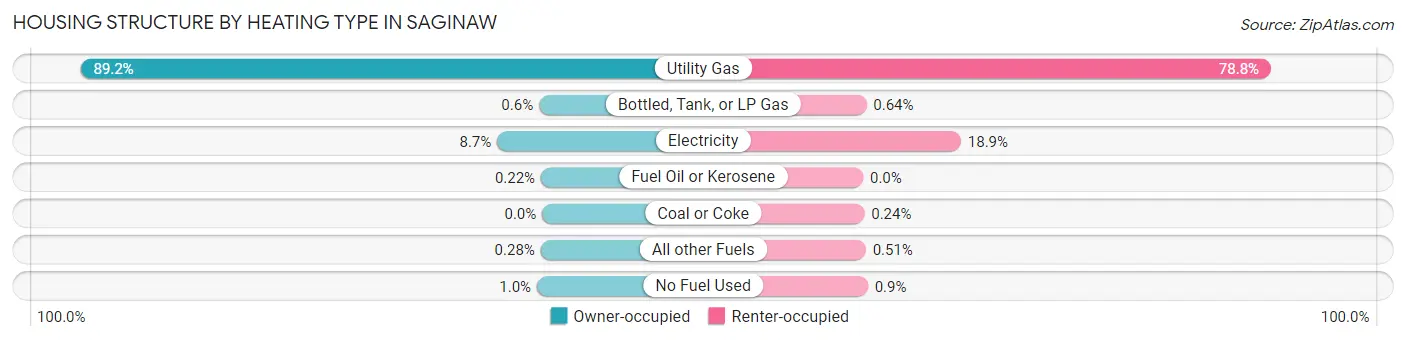
| Heating Type | Owner-occupied | Renter-occupied |
| Utility Gas | 8,817 (89.2%) | 6,018 (78.8%) |
| Bottled, Tank, or LP Gas | 59 (0.6%) | 49 (0.6%) |
| Electricity | 859 (8.7%) | 1,443 (18.9%) |
| Fuel Oil or Kerosene | 22 (0.2%) | 0 (0.0%) |
| Coal or Coke | 0 (0.0%) | 18 (0.2%) |
| All other Fuels | 28 (0.3%) | 39 (0.5%) |
| No Fuel Used | 99 (1.0%) | 69 (0.9%) |
| Total | 9,884 (100.0%) | 7,636 (100.0%) |
Household Vehicle Usage in Saginaw
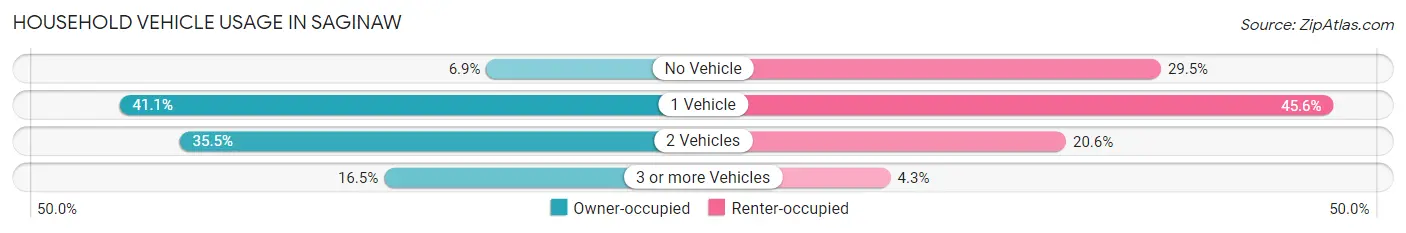
| Vehicles per Household | Owner-occupied | Renter-occupied |
| No Vehicle | 682 (6.9%) | 2,253 (29.5%) |
| 1 Vehicle | 4,065 (41.1%) | 3,481 (45.6%) |
| 2 Vehicles | 3,511 (35.5%) | 1,576 (20.6%) |
| 3 or more Vehicles | 1,626 (16.5%) | 326 (4.3%) |
| Total | 9,884 (100.0%) | 7,636 (100.0%) |
Real Estate & Mortgages in Saginaw
Real Estate and Mortgage Overview in Saginaw
| Characteristic | Without Mortgage | With Mortgage |
| Housing Units | 5,365 | 4,519 |
| Median Property Value | $35,500 | $63,900 |
| Median Household Income | $38,089 | $318 |
| Monthly Housing Costs | $422 | $26 |
| Real Estate Taxes | $1,052 | $210 |
Property Value by Mortgage Status in Saginaw
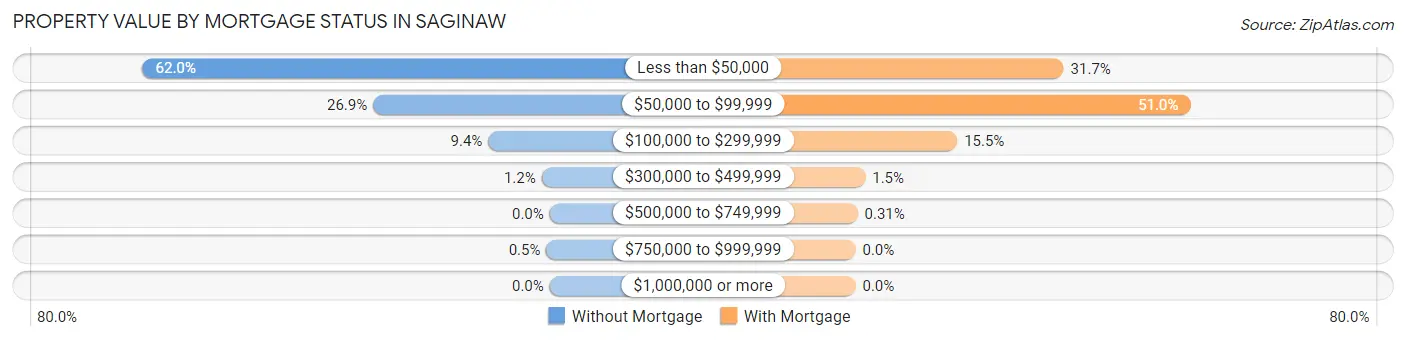
| Property Value | Without Mortgage | With Mortgage |
| Less than $50,000 | 3,327 (62.0%) | 1,433 (31.7%) |
| $50,000 to $99,999 | 1,443 (26.9%) | 2,305 (51.0%) |
| $100,000 to $299,999 | 502 (9.4%) | 700 (15.5%) |
| $300,000 to $499,999 | 66 (1.2%) | 67 (1.5%) |
| $500,000 to $749,999 | 0 (0.0%) | 14 (0.3%) |
| $750,000 to $999,999 | 27 (0.5%) | 0 (0.0%) |
| $1,000,000 or more | 0 (0.0%) | 0 (0.0%) |
| Total | 5,365 (100.0%) | 4,519 (100.0%) |
Household Income by Mortgage Status in Saginaw
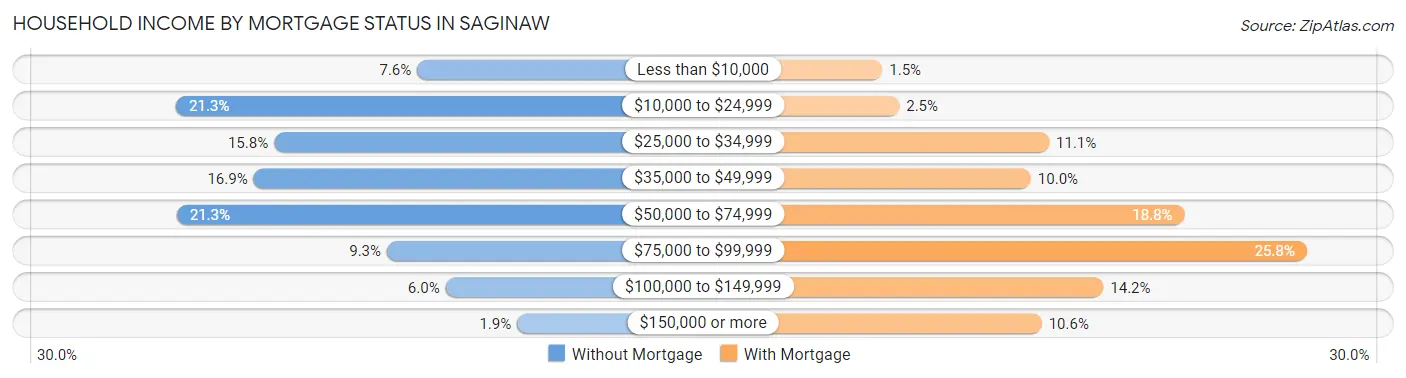
| Household Income | Without Mortgage | With Mortgage |
| Less than $10,000 | 406 (7.6%) | 69 (1.5%) |
| $10,000 to $24,999 | 1,145 (21.3%) | 113 (2.5%) |
| $25,000 to $34,999 | 845 (15.8%) | 500 (11.1%) |
| $35,000 to $49,999 | 908 (16.9%) | 453 (10.0%) |
| $50,000 to $74,999 | 1,143 (21.3%) | 849 (18.8%) |
| $75,000 to $99,999 | 499 (9.3%) | 1,165 (25.8%) |
| $100,000 to $149,999 | 319 (5.9%) | 640 (14.2%) |
| $150,000 or more | 100 (1.9%) | 481 (10.6%) |
| Total | 5,365 (100.0%) | 4,519 (100.0%) |
Property Value to Household Income Ratio in Saginaw
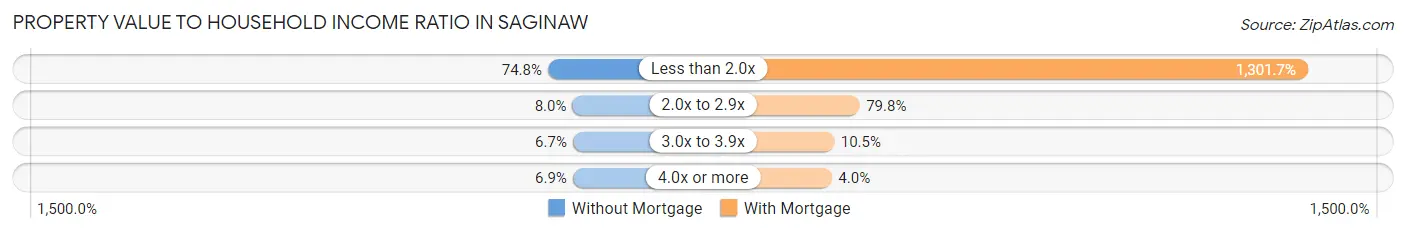
| Value-to-Income Ratio | Without Mortgage | With Mortgage |
| Less than 2.0x | 4,012 (74.8%) | 58,825 (1,301.7%) |
| 2.0x to 2.9x | 431 (8.0%) | 3,607 (79.8%) |
| 3.0x to 3.9x | 360 (6.7%) | 473 (10.5%) |
| 4.0x or more | 368 (6.9%) | 182 (4.0%) |
| Total | 5,365 (100.0%) | 4,519 (100.0%) |
Real Estate Taxes by Mortgage Status in Saginaw
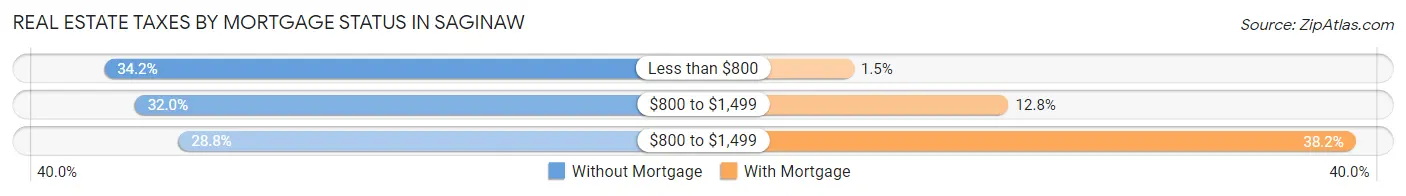
| Property Taxes | Without Mortgage | With Mortgage |
| Less than $800 | 1,834 (34.2%) | 69 (1.5%) |
| $800 to $1,499 | 1,714 (32.0%) | 580 (12.8%) |
| $800 to $1,499 | 1,543 (28.8%) | 1,725 (38.2%) |
| Total | 5,365 (100.0%) | 4,519 (100.0%) |
Health & Disability in Saginaw
Health Insurance Coverage by Age in Saginaw
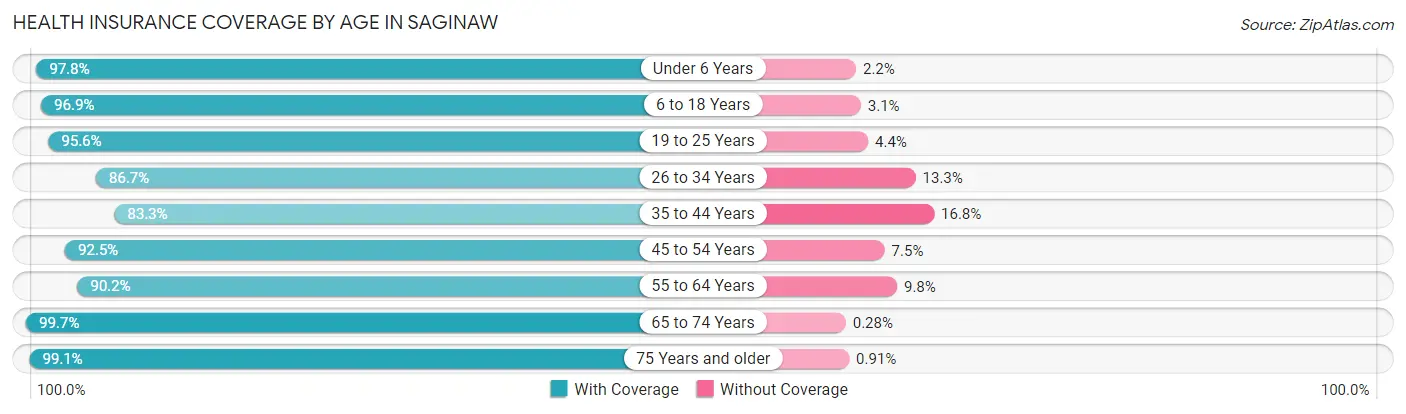
| Age Bracket | With Coverage | Without Coverage |
| Under 6 Years | 4,240 (97.8%) | 95 (2.2%) |
| 6 to 18 Years | 8,236 (96.9%) | 263 (3.1%) |
| 19 to 25 Years | 3,699 (95.6%) | 172 (4.4%) |
| 26 to 34 Years | 4,713 (86.7%) | 723 (13.3%) |
| 35 to 44 Years | 4,746 (83.3%) | 955 (16.8%) |
| 45 to 54 Years | 4,324 (92.5%) | 352 (7.5%) |
| 55 to 64 Years | 4,849 (90.2%) | 529 (9.8%) |
| 65 to 74 Years | 3,538 (99.7%) | 10 (0.3%) |
| 75 Years and older | 2,071 (99.1%) | 19 (0.9%) |
| Total | 40,416 (92.8%) | 3,118 (7.2%) |
Health Insurance Coverage by Citizenship Status in Saginaw
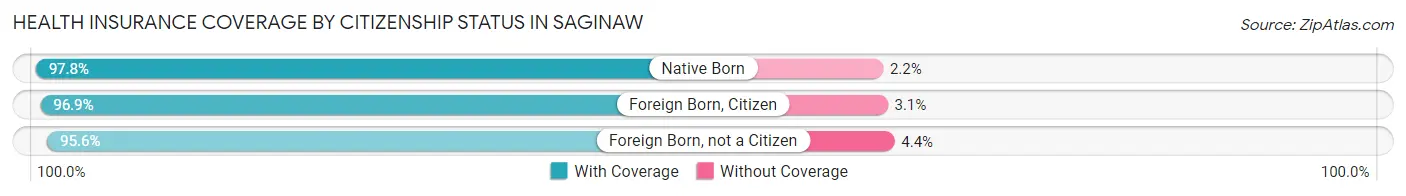
| Citizenship Status | With Coverage | Without Coverage |
| Native Born | 4,240 (97.8%) | 95 (2.2%) |
| Foreign Born, Citizen | 8,236 (96.9%) | 263 (3.1%) |
| Foreign Born, not a Citizen | 3,699 (95.6%) | 172 (4.4%) |
Health Insurance Coverage by Household Income in Saginaw
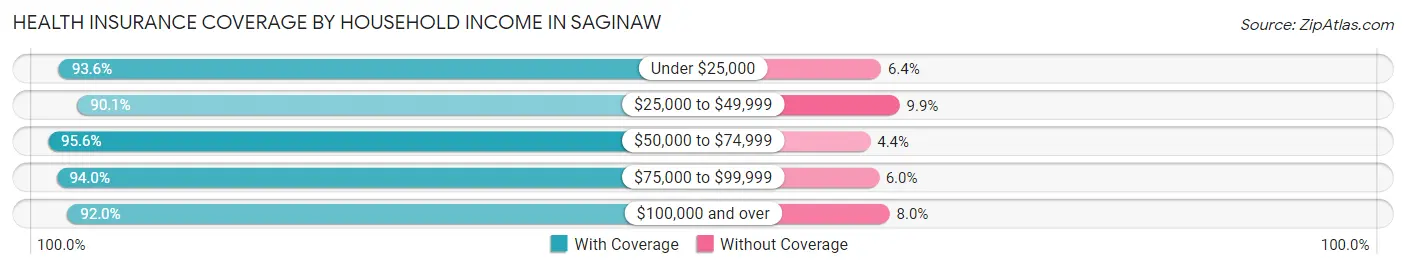
| Household Income | With Coverage | Without Coverage |
| Under $25,000 | 11,756 (93.6%) | 805 (6.4%) |
| $25,000 to $49,999 | 11,176 (90.1%) | 1,227 (9.9%) |
| $50,000 to $74,999 | 8,426 (95.6%) | 388 (4.4%) |
| $75,000 to $99,999 | 3,928 (94.0%) | 250 (6.0%) |
| $100,000 and over | 4,633 (92.0%) | 404 (8.0%) |
Public vs Private Health Insurance Coverage by Age in Saginaw
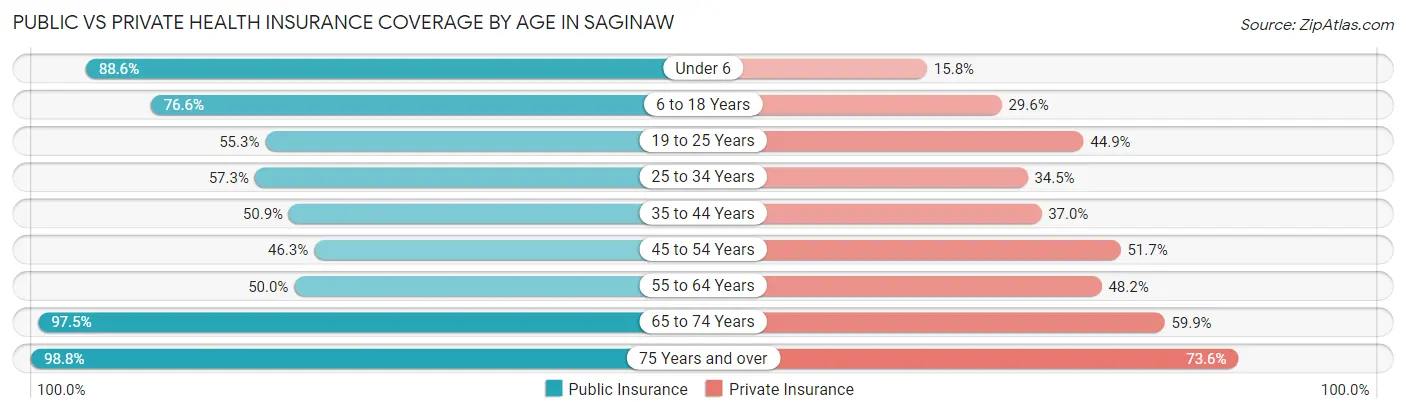
| Age Bracket | Public Insurance | Private Insurance |
| Under 6 | 3,842 (88.6%) | 685 (15.8%) |
| 6 to 18 Years | 6,509 (76.6%) | 2,519 (29.6%) |
| 19 to 25 Years | 2,142 (55.3%) | 1,736 (44.9%) |
| 25 to 34 Years | 3,114 (57.3%) | 1,873 (34.5%) |
| 35 to 44 Years | 2,904 (50.9%) | 2,110 (37.0%) |
| 45 to 54 Years | 2,164 (46.3%) | 2,419 (51.7%) |
| 55 to 64 Years | 2,687 (50.0%) | 2,592 (48.2%) |
| 65 to 74 Years | 3,458 (97.5%) | 2,125 (59.9%) |
| 75 Years and over | 2,065 (98.8%) | 1,538 (73.6%) |
| Total | 28,885 (66.3%) | 17,597 (40.4%) |
Disability Status by Sex by Age in Saginaw
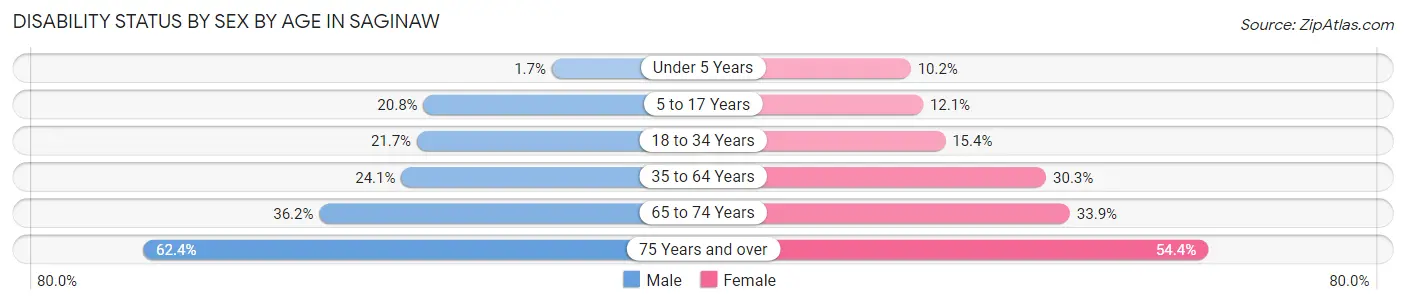
| Age Bracket | Male | Female |
| Under 5 Years | 34 (1.7%) | 167 (10.2%) |
| 5 to 17 Years | 914 (20.8%) | 515 (12.0%) |
| 18 to 34 Years | 1,017 (21.7%) | 793 (15.4%) |
| 35 to 64 Years | 1,807 (24.1%) | 2,501 (30.3%) |
| 65 to 74 Years | 615 (36.2%) | 627 (33.9%) |
| 75 Years and over | 511 (62.4%) | 691 (54.4%) |
Disability Class by Sex by Age in Saginaw
Disability Class: Hearing Difficulty
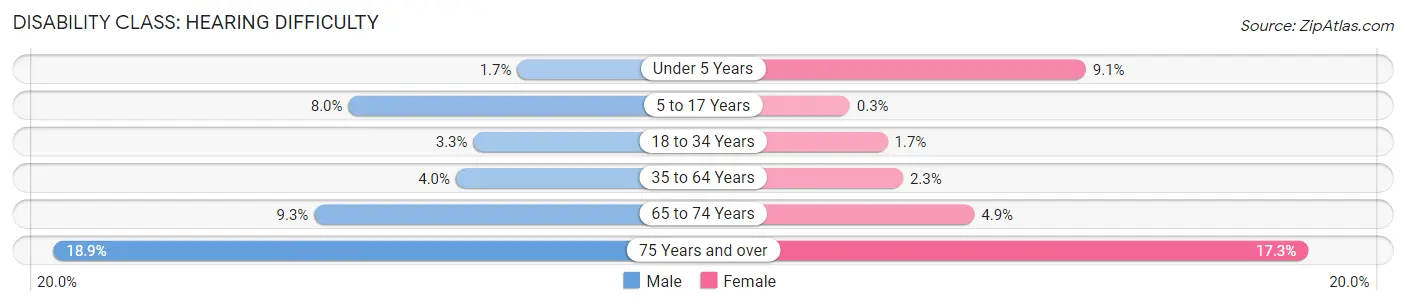
| Age Bracket | Male | Female |
| Under 5 Years | 34 (1.7%) | 148 (9.1%) |
| 5 to 17 Years | 351 (8.0%) | 13 (0.3%) |
| 18 to 34 Years | 156 (3.3%) | 88 (1.7%) |
| 35 to 64 Years | 300 (4.0%) | 187 (2.3%) |
| 65 to 74 Years | 157 (9.2%) | 91 (4.9%) |
| 75 Years and over | 155 (18.9%) | 220 (17.3%) |
Disability Class: Vision Difficulty
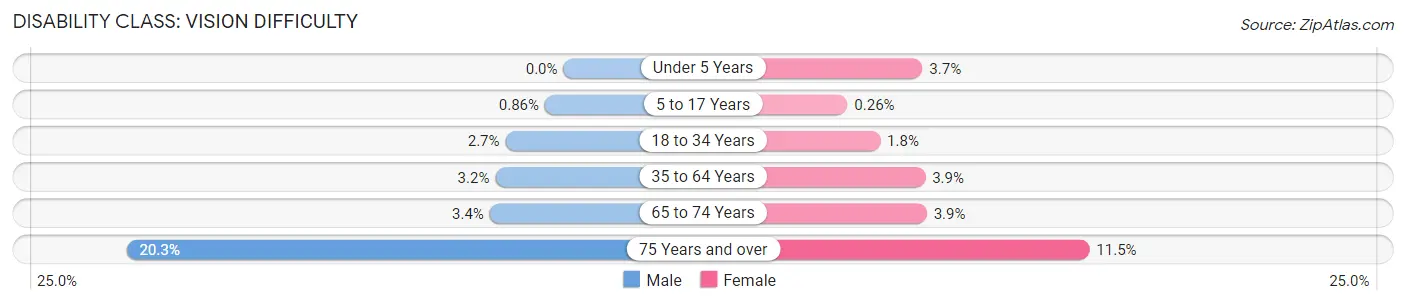
| Age Bracket | Male | Female |
| Under 5 Years | 0 (0.0%) | 61 (3.7%) |
| 5 to 17 Years | 38 (0.9%) | 11 (0.3%) |
| 18 to 34 Years | 126 (2.7%) | 92 (1.8%) |
| 35 to 64 Years | 237 (3.2%) | 319 (3.9%) |
| 65 to 74 Years | 58 (3.4%) | 73 (3.9%) |
| 75 Years and over | 166 (20.3%) | 146 (11.5%) |
Disability Class: Cognitive Difficulty
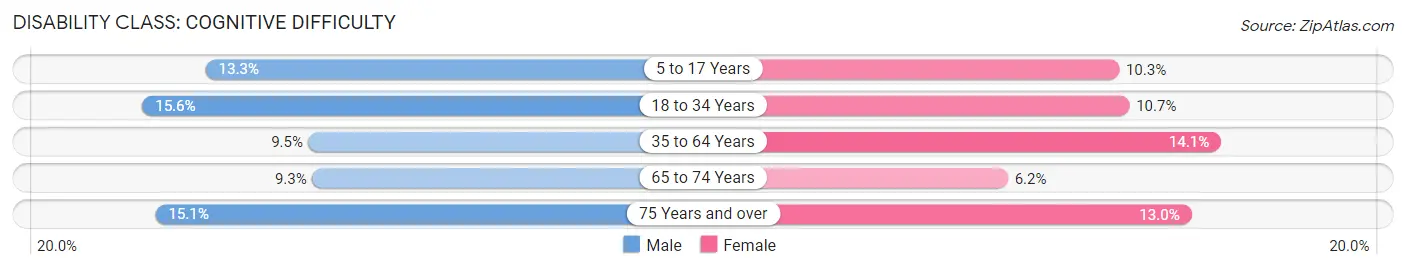
| Age Bracket | Male | Female |
| 5 to 17 Years | 584 (13.3%) | 440 (10.3%) |
| 18 to 34 Years | 731 (15.6%) | 551 (10.7%) |
| 35 to 64 Years | 710 (9.5%) | 1,161 (14.1%) |
| 65 to 74 Years | 158 (9.3%) | 114 (6.2%) |
| 75 Years and over | 124 (15.1%) | 165 (13.0%) |
Disability Class: Ambulatory Difficulty
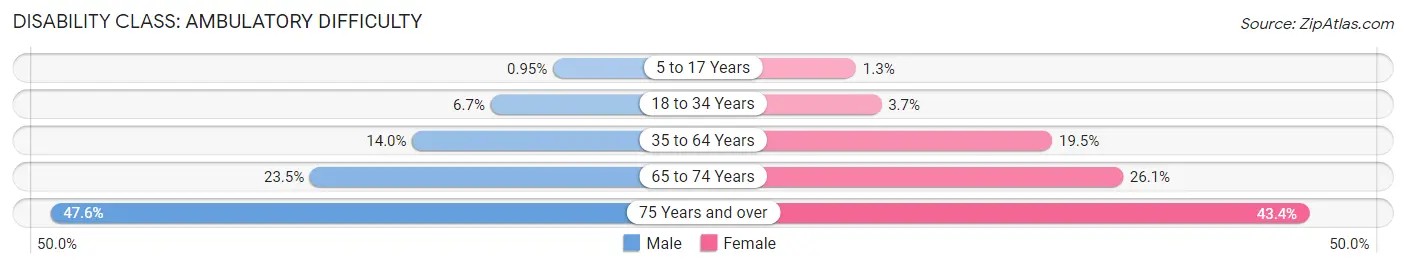
| Age Bracket | Male | Female |
| 5 to 17 Years | 42 (0.9%) | 56 (1.3%) |
| 18 to 34 Years | 315 (6.7%) | 189 (3.7%) |
| 35 to 64 Years | 1,052 (14.0%) | 1,608 (19.5%) |
| 65 to 74 Years | 399 (23.5%) | 483 (26.1%) |
| 75 Years and over | 390 (47.6%) | 551 (43.3%) |
Disability Class: Self-Care Difficulty
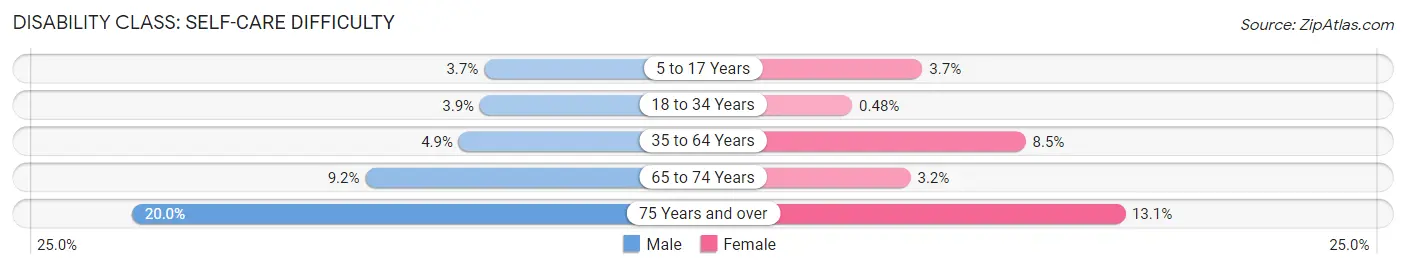
| Age Bracket | Male | Female |
| 5 to 17 Years | 162 (3.7%) | 160 (3.7%) |
| 18 to 34 Years | 181 (3.9%) | 25 (0.5%) |
| 35 to 64 Years | 364 (4.9%) | 703 (8.5%) |
| 65 to 74 Years | 156 (9.2%) | 59 (3.2%) |
| 75 Years and over | 164 (20.0%) | 167 (13.1%) |
Technology Access in Saginaw
Computing Device Access in Saginaw
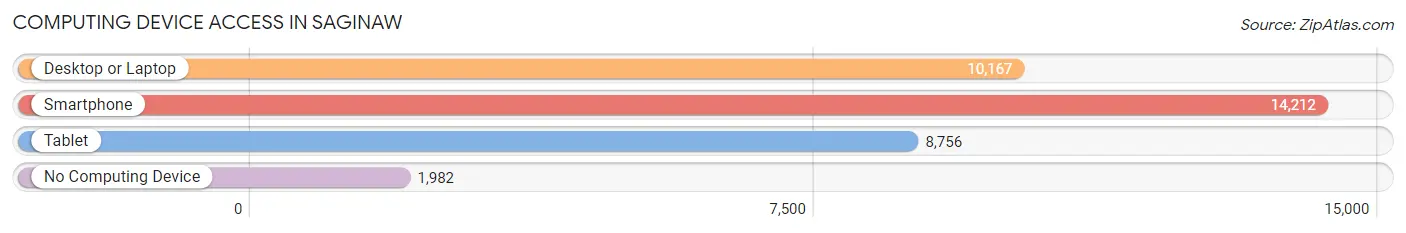
| Device Type | # Households | % Households |
| Desktop or Laptop | 10,167 | 58.0% |
| Smartphone | 14,212 | 81.1% |
| Tablet | 8,756 | 50.0% |
| No Computing Device | 1,982 | 11.3% |
| Total | 17,520 | 100.0% |
Internet Access in Saginaw
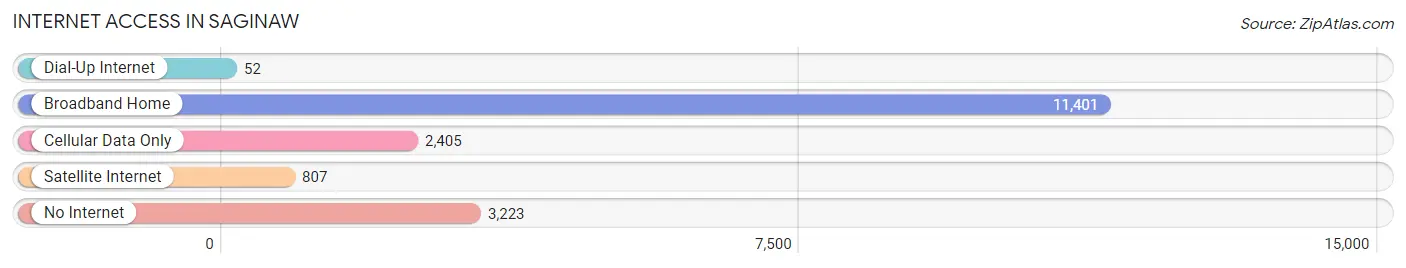
| Internet Type | # Households | % Households |
| Dial-Up Internet | 52 | 0.3% |
| Broadband Home | 11,401 | 65.1% |
| Cellular Data Only | 2,405 | 13.7% |
| Satellite Internet | 807 | 4.6% |
| No Internet | 3,223 | 18.4% |
| Total | 17,520 | 100.0% |
Saginaw Summary
Saginaw, Michigan is a city located in the Saginaw County of the U.S. state of Michigan. It is situated at the junction of the Saginaw River and its tributary Cass River. The city is located about 90 miles (145 km) northwest of Detroit and is part of the Great Lakes Bay Region. As of the 2010 census, the city had a population of 51,508.
Geography
Saginaw is located at 43°25′N 83°53′W (43.4133, -83.8833). According to the United States Census Bureau, the city has a total area of 22.1 square miles (57.3 km2), of which 21.9 square miles (56.7 km2) is land and 0.2 square miles (0.6 km2) (0.9%) is water.
The city is situated at the junction of the Saginaw River and its tributary Cass River. The Saginaw River flows through the city from its headwaters in Bay County, Michigan, to its mouth at Saginaw Bay, Lake Huron. The Cass River flows through the city from its headwaters in Midland County, Michigan, to its mouth at the Saginaw River.
Climate
Saginaw has a humid continental climate (Köppen climate classification Dfb). Summers are warm and humid, with average high temperatures in the mid-80s Fahrenheit (29–32 °C). Winters are cold and snowy, with average low temperatures in the mid-20s Fahrenheit (-4–-2 °C). The city receives an average of 33 inches (84 cm) of precipitation annually, with the majority of it falling in the summer months.
Demographics
As of the 2010 census, there were 51,508 people, 20,717 households, and 12,717 families residing in the city. The population density was 2,322.3 inhabitants per square mile (898.7/km2). There were 23,521 housing units at an average density of 1,072.3 per square mile (414.7/km2). The racial makeup of the city was 63.2% White, 30.2% African American, 0.5% Native American, 1.2% Asian, 0.1% Pacific Islander, 1.9% from other races, and 2.9% from two or more races. Hispanic or Latino of any race were 4.7% of the population.
Economy
Saginaw is home to a variety of industries, including automotive, manufacturing, healthcare, and education. The city is home to several major employers, including Dow Chemical, Covenant HealthCare, and Saginaw Valley State University.
The city is also home to several automotive-related companies, including Nexteer Automotive, which manufactures steering systems for the automotive industry, and Saginaw Metal Casting Operations, which produces aluminum and magnesium castings for the automotive industry.
The city is also home to several healthcare-related companies, including Covenant HealthCare, which operates a hospital and several medical centers in the city, and St. Mary's of Michigan, which operates a hospital and several medical centers in the city.
Education
Saginaw is home to several educational institutions, including Saginaw Valley State University, Delta College, and Saginaw Public Schools.
Saginaw Valley State University is a public university located in the city. It was founded in 1963 and offers a variety of undergraduate and graduate degree programs.
Delta College is a public community college located in the city. It was founded in 1961 and offers a variety of associate degree and certificate programs.
Saginaw Public Schools is the public school district for the city. It operates several elementary, middle, and high schools in the city.
Common Questions
What is Per Capita Income in Saginaw?
Per Capita income in Saginaw is $19,591.
What is the Median Family Income in Saginaw?
Median Family Income in Saginaw is $44,688.
What is the Median Household income in Saginaw?
Median Household Income in Saginaw is $35,521.
What is Income or Wage Gap in Saginaw?
Income or Wage Gap in Saginaw is 18.8%.
Women in Saginaw earn 81.2 cents for every dollar earned by a man.
What is Family Income Deficit in Saginaw?
Family Income Deficit in Saginaw is $12,688.
Families that are below poverty line in Saginaw earn $12,688 less on average than the poverty threshold level.
What is Inequality or Gini Index in Saginaw?
Inequality or Gini Index in Saginaw is 0.46.
What is the Total Population of Saginaw?
Total Population of Saginaw is 44,316.
What is the Total Male Population of Saginaw?
Total Male Population of Saginaw is 21,667.
What is the Total Female Population of Saginaw?
Total Female Population of Saginaw is 22,649.
What is the Ratio of Males per 100 Females in Saginaw?
There are 95.66 Males per 100 Females in Saginaw.
What is the Ratio of Females per 100 Males in Saginaw?
There are 104.53 Females per 100 Males in Saginaw.
What is the Median Population Age in Saginaw?
Median Population Age in Saginaw is 34.5 Years.
What is the Average Family Size in Saginaw
Average Family Size in Saginaw is 3.4 People.
What is the Average Household Size in Saginaw
Average Household Size in Saginaw is 2.5 People.
How Large is the Labor Force in Saginaw?
There are 18,149 People in the Labor Forcein in Saginaw.
What is the Percentage of People in the Labor Force in Saginaw?
54.4% of People are in the Labor Force in Saginaw.
What is the Unemployment Rate in Saginaw?
Unemployment Rate in Saginaw is 11.7%.