Mount Clemens, MI Map & Demographics
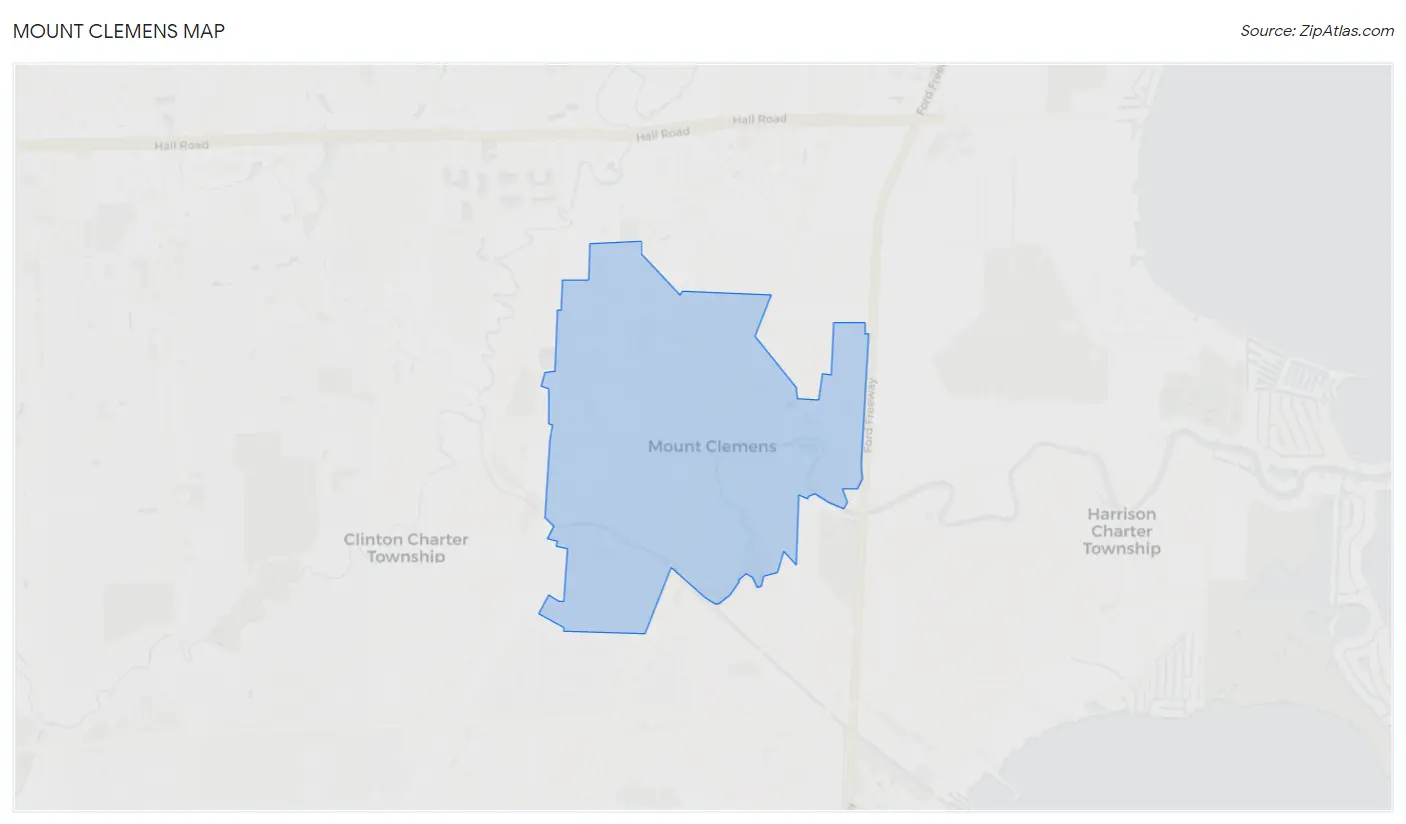
Mount Clemens Map
Mount Clemens Overview
$31,939
PER CAPITA INCOME
$75,412
AVG FAMILY INCOME
$55,154
AVG HOUSEHOLD INCOME
13.2%
WAGE / INCOME GAP [ % ]
86.8¢/ $1
WAGE / INCOME GAP [ $ ]
$10,131
FAMILY INCOME DEFICIT
0.46
INEQUALITY / GINI INDEX
15,679
TOTAL POPULATION
8,128
MALE POPULATION
7,551
FEMALE POPULATION
107.64
MALES / 100 FEMALES
92.90
FEMALES / 100 MALES
40.2
MEDIAN AGE
2.9
AVG FAMILY SIZE
2.2
AVG HOUSEHOLD SIZE
7,732
LABOR FORCE [ PEOPLE ]
58.8%
PERCENT IN LABOR FORCE
7.0%
UNEMPLOYMENT RATE
Mount Clemens Zip Codes
Mount Clemens Area Codes
Income in Mount Clemens
Income Overview in Mount Clemens
Per Capita Income in Mount Clemens is $31,939, while median incomes of families and households are $75,412 and $55,154 respectively.
| Characteristic | Number | Measure |
| Per Capita Income | 15,679 | $31,939 |
| Median Family Income | 3,554 | $75,412 |
| Mean Family Income | 3,554 | $85,990 |
| Median Household Income | 6,583 | $55,154 |
| Mean Household Income | 6,583 | $71,702 |
| Income Deficit | 3,554 | $10,131 |
| Wage / Income Gap (%) | 15,679 | 13.24% |
| Wage / Income Gap ($) | 15,679 | 86.76¢ per $1 |
| Gini / Inequality Index | 15,679 | 0.46 |
Earnings by Sex in Mount Clemens
Average Earnings in Mount Clemens are $35,342, $37,225 for men and $32,297 for women, a difference of 13.2%.
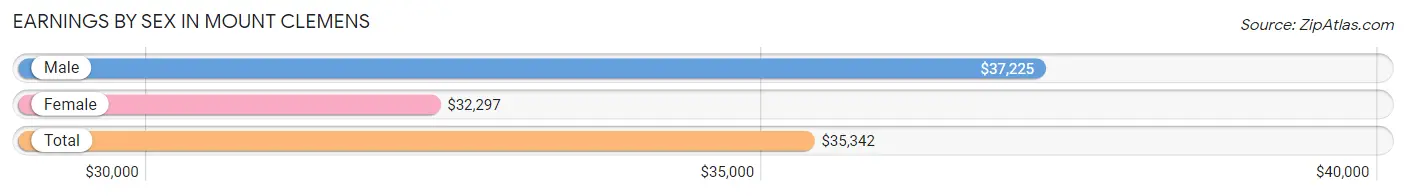
| Sex | Number | Average Earnings |
| Male | 4,491 (53.3%) | $37,225 |
| Female | 3,932 (46.7%) | $32,297 |
| Total | 8,423 (100.0%) | $35,342 |
Earnings by Sex by Income Bracket in Mount Clemens
The most common earnings brackets in Mount Clemens are $55,000 to $64,999 for men (596 | 13.3%) and $25,000 to $29,999 for women (445 | 11.3%).
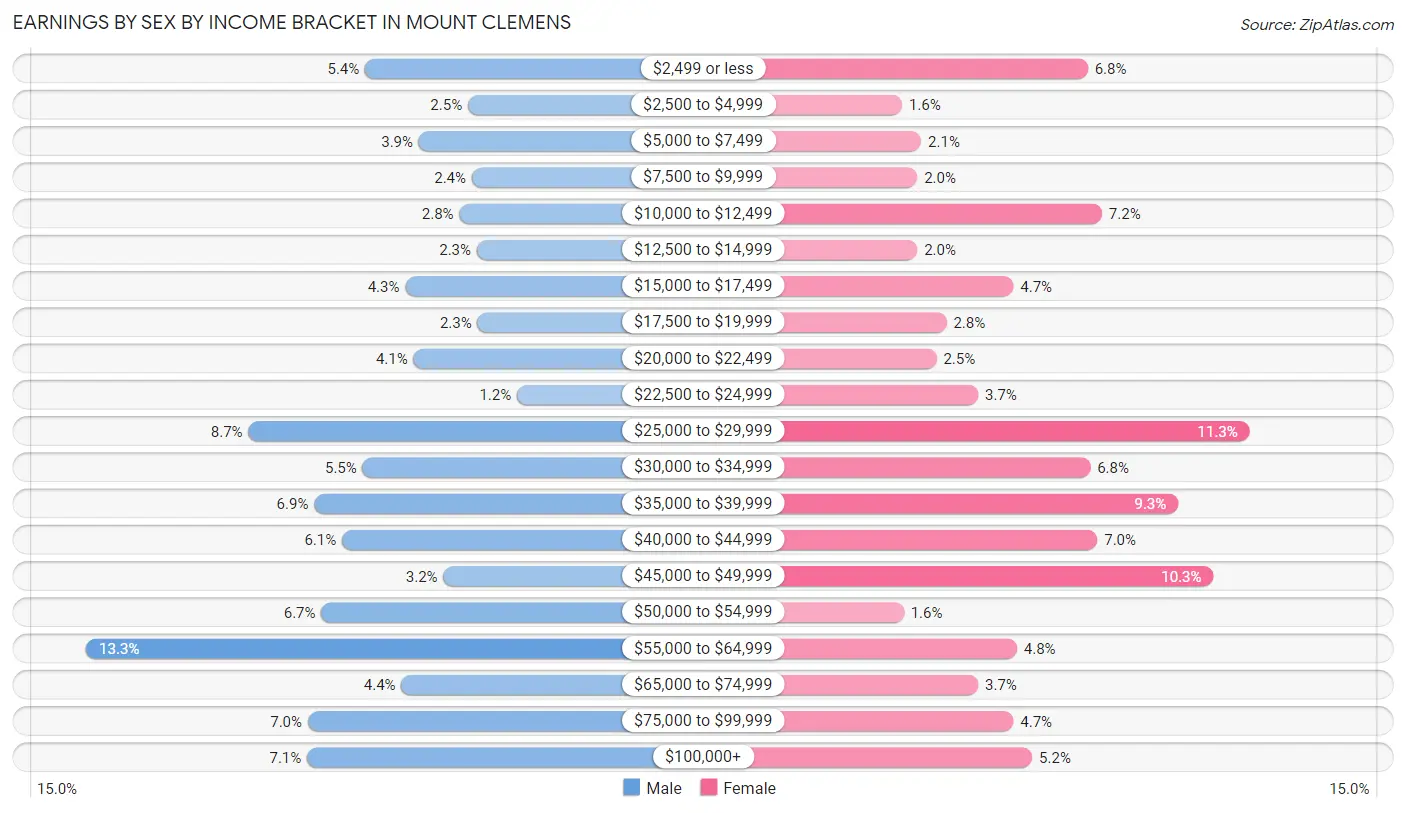
| Income | Male | Female |
| $2,499 or less | 244 (5.4%) | 266 (6.8%) |
| $2,500 to $4,999 | 114 (2.5%) | 61 (1.5%) |
| $5,000 to $7,499 | 176 (3.9%) | 82 (2.1%) |
| $7,500 to $9,999 | 109 (2.4%) | 78 (2.0%) |
| $10,000 to $12,499 | 125 (2.8%) | 282 (7.2%) |
| $12,500 to $14,999 | 103 (2.3%) | 78 (2.0%) |
| $15,000 to $17,499 | 193 (4.3%) | 184 (4.7%) |
| $17,500 to $19,999 | 102 (2.3%) | 110 (2.8%) |
| $20,000 to $22,499 | 183 (4.1%) | 99 (2.5%) |
| $22,500 to $24,999 | 52 (1.2%) | 145 (3.7%) |
| $25,000 to $29,999 | 391 (8.7%) | 445 (11.3%) |
| $30,000 to $34,999 | 247 (5.5%) | 269 (6.8%) |
| $35,000 to $39,999 | 308 (6.9%) | 366 (9.3%) |
| $40,000 to $44,999 | 273 (6.1%) | 277 (7.0%) |
| $45,000 to $49,999 | 145 (3.2%) | 405 (10.3%) |
| $50,000 to $54,999 | 299 (6.7%) | 63 (1.6%) |
| $55,000 to $64,999 | 596 (13.3%) | 188 (4.8%) |
| $65,000 to $74,999 | 198 (4.4%) | 145 (3.7%) |
| $75,000 to $99,999 | 316 (7.0%) | 184 (4.7%) |
| $100,000+ | 317 (7.1%) | 205 (5.2%) |
| Total | 4,491 (100.0%) | 3,932 (100.0%) |
Earnings by Sex by Educational Attainment in Mount Clemens
Average earnings in Mount Clemens are $41,645 for men and $35,320 for women, a difference of 15.2%. Men with an educational attainment of bachelor's degree enjoy the highest average annual earnings of $80,795, while those with high school diploma education earn the least with $31,302. Women with an educational attainment of graduate degree earn the most with the average annual earnings of $62,865, while those with less than high school education have the smallest earnings of $16,471.
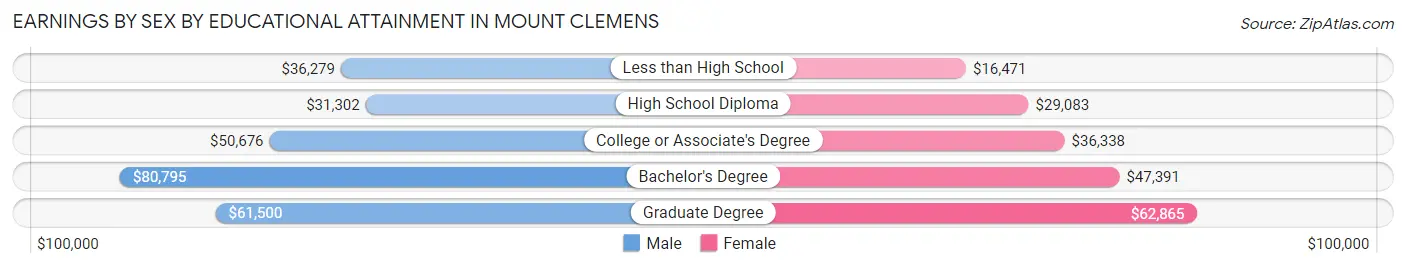
| Educational Attainment | Male Income | Female Income |
| Less than High School | $36,279 | $16,471 |
| High School Diploma | $31,302 | $29,083 |
| College or Associate's Degree | $50,676 | $36,338 |
| Bachelor's Degree | $80,795 | $47,391 |
| Graduate Degree | $61,500 | $62,865 |
| Total | $41,645 | $35,320 |
Family Income in Mount Clemens
Family Income Brackets in Mount Clemens
According to the Mount Clemens family income data, there are 736 families falling into the $75,000 to $99,999 income range, which is the most common income bracket and makes up 20.7% of all families. Conversely, the $200,000+ income bracket is the least frequent group with only 110 families (3.1%) belonging to this category.
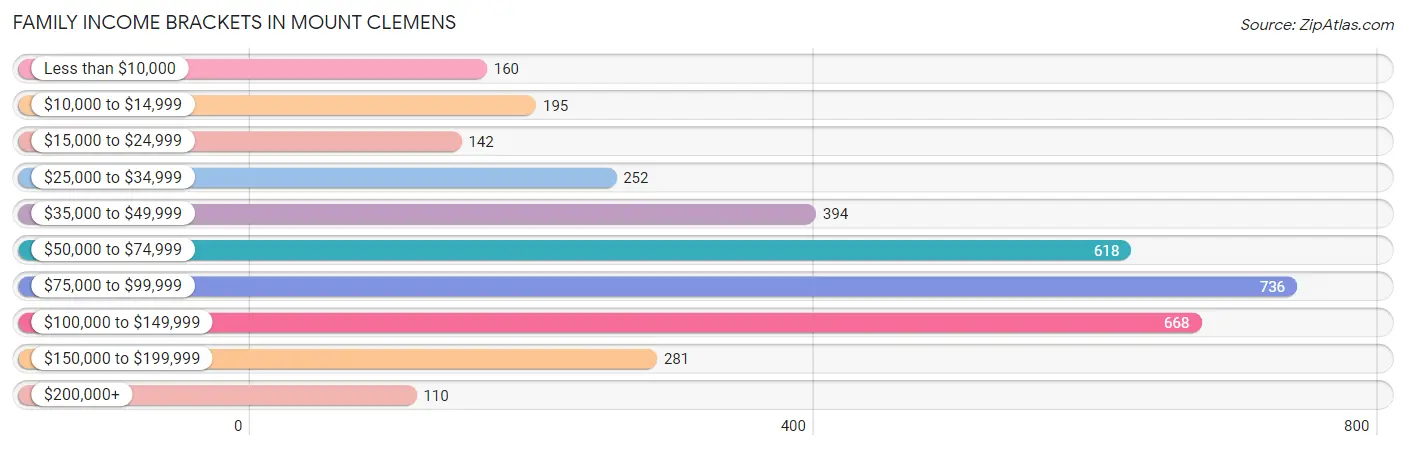
| Income Bracket | # Families | % Families |
| Less than $10,000 | 160 | 4.5% |
| $10,000 to $14,999 | 195 | 5.5% |
| $15,000 to $24,999 | 142 | 4.0% |
| $25,000 to $34,999 | 252 | 7.1% |
| $35,000 to $49,999 | 394 | 11.1% |
| $50,000 to $74,999 | 618 | 17.4% |
| $75,000 to $99,999 | 736 | 20.7% |
| $100,000 to $149,999 | 668 | 18.8% |
| $150,000 to $199,999 | 281 | 7.9% |
| $200,000+ | 110 | 3.1% |
Family Income by Famaliy Size in Mount Clemens
4-person families (483 | 13.6%) account for the highest median family income in Mount Clemens with $110,028 per family, while 2-person families (1,777 | 50.0%) have the highest median income of $35,240 per family member.
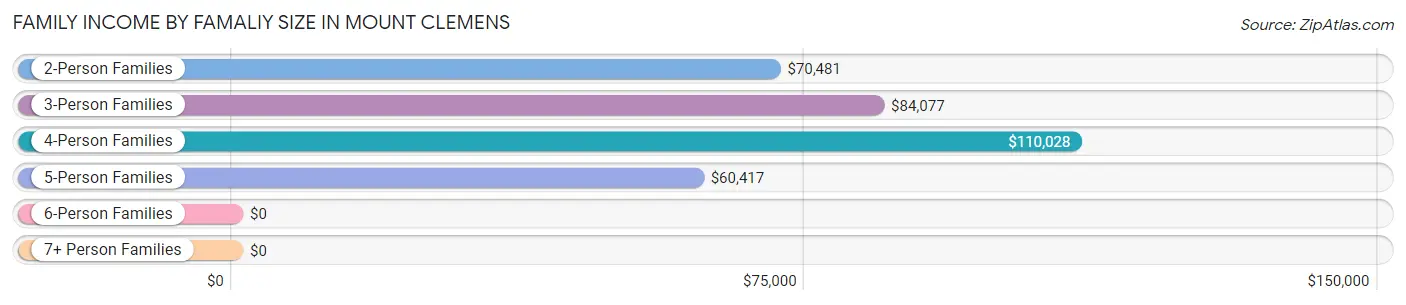
| Income Bracket | # Families | Median Income |
| 2-Person Families | 1,777 (50.0%) | $70,481 |
| 3-Person Families | 1,036 (29.1%) | $84,077 |
| 4-Person Families | 483 (13.6%) | $110,028 |
| 5-Person Families | 142 (4.0%) | $60,417 |
| 6-Person Families | 76 (2.1%) | $0 |
| 7+ Person Families | 40 (1.1%) | $0 |
| Total | 3,554 (100.0%) | $75,412 |
Family Income by Number of Earners in Mount Clemens
The median family income in Mount Clemens is $75,412, with families comprising 3+ earners (344) having the highest median family income of $108,226, while families with no earners (635) have the lowest median family income of $23,875, accounting for 9.7% and 17.9% of families, respectively.
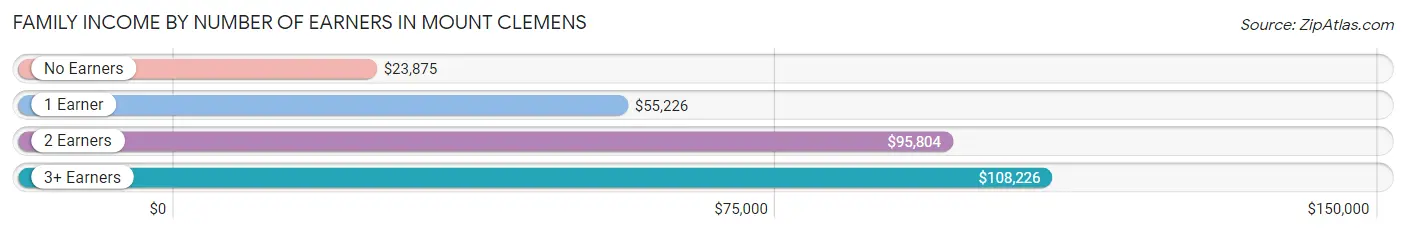
| Number of Earners | # Families | Median Income |
| No Earners | 635 (17.9%) | $23,875 |
| 1 Earner | 985 (27.7%) | $55,226 |
| 2 Earners | 1,590 (44.7%) | $95,804 |
| 3+ Earners | 344 (9.7%) | $108,226 |
| Total | 3,554 (100.0%) | $75,412 |
Household Income in Mount Clemens
Household Income Brackets in Mount Clemens
With 1,132 households falling in the category, the $75,000 to $99,999 income range is the most frequent in Mount Clemens, accounting for 17.2% of all households. In contrast, only 145 households (2.2%) fall into the $200,000+ income bracket, making it the least populous group.
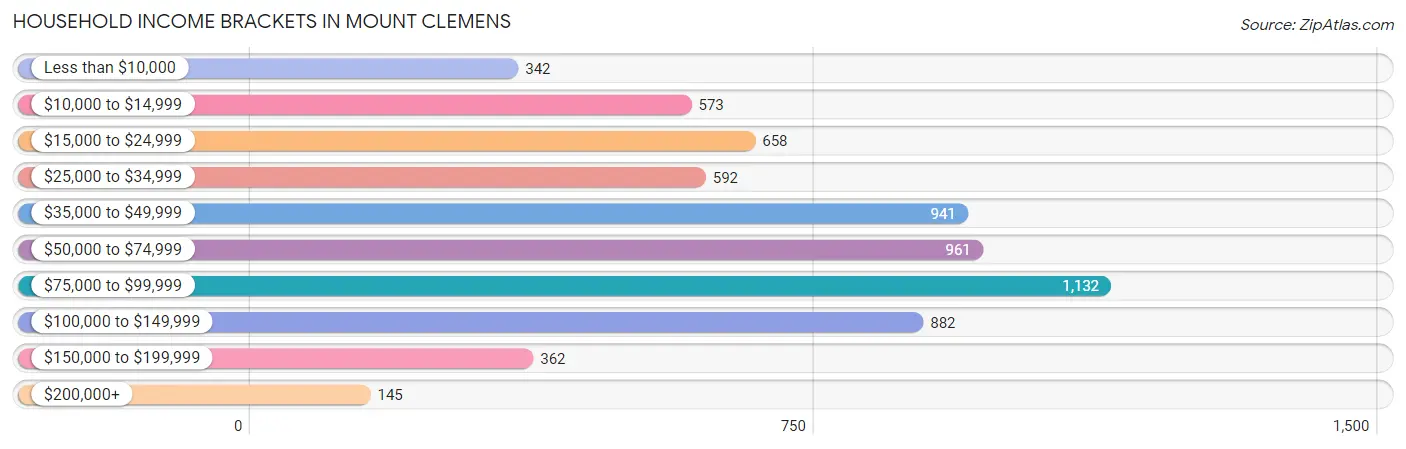
| Income Bracket | # Households | % Households |
| Less than $10,000 | 342 | 5.2% |
| $10,000 to $14,999 | 573 | 8.7% |
| $15,000 to $24,999 | 658 | 10.0% |
| $25,000 to $34,999 | 592 | 9.0% |
| $35,000 to $49,999 | 941 | 14.3% |
| $50,000 to $74,999 | 961 | 14.6% |
| $75,000 to $99,999 | 1,132 | 17.2% |
| $100,000 to $149,999 | 882 | 13.4% |
| $150,000 to $199,999 | 362 | 5.5% |
| $200,000+ | 145 | 2.2% |
Household Income by Householder Age in Mount Clemens
The median household income in Mount Clemens is $55,154, with the highest median household income of $67,594 found in the 25 to 44 years age bracket for the primary householder. A total of 2,174 households (33.0%) fall into this category. Meanwhile, the 15 to 24 years age bracket for the primary householder has the lowest median household income of $20,577, with 136 households (2.1%) in this group.
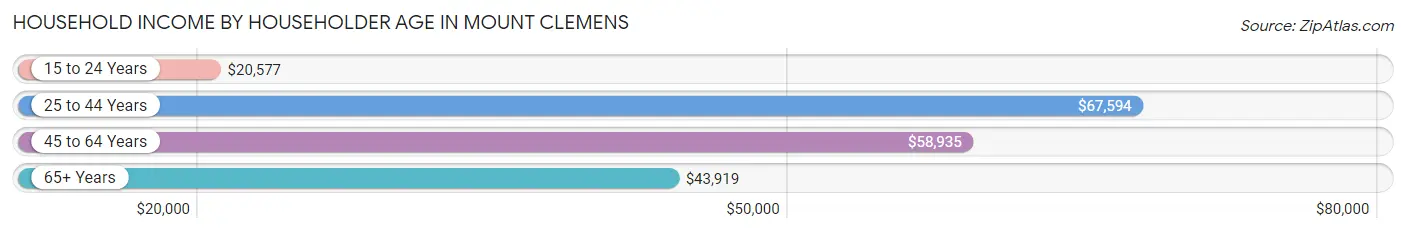
| Income Bracket | # Households | Median Income |
| 15 to 24 Years | 136 (2.1%) | $20,577 |
| 25 to 44 Years | 2,174 (33.0%) | $67,594 |
| 45 to 64 Years | 2,409 (36.6%) | $58,935 |
| 65+ Years | 1,864 (28.3%) | $43,919 |
| Total | 6,583 (100.0%) | $55,154 |
Poverty in Mount Clemens
Income Below Poverty by Sex and Age in Mount Clemens
With 15.6% poverty level for males and 17.9% for females among the residents of Mount Clemens, 5 year old males and 45 to 54 year old females are the most vulnerable to poverty, with 38 males (60.3%) and 286 females (35.4%) in their respective age groups living below the poverty level.
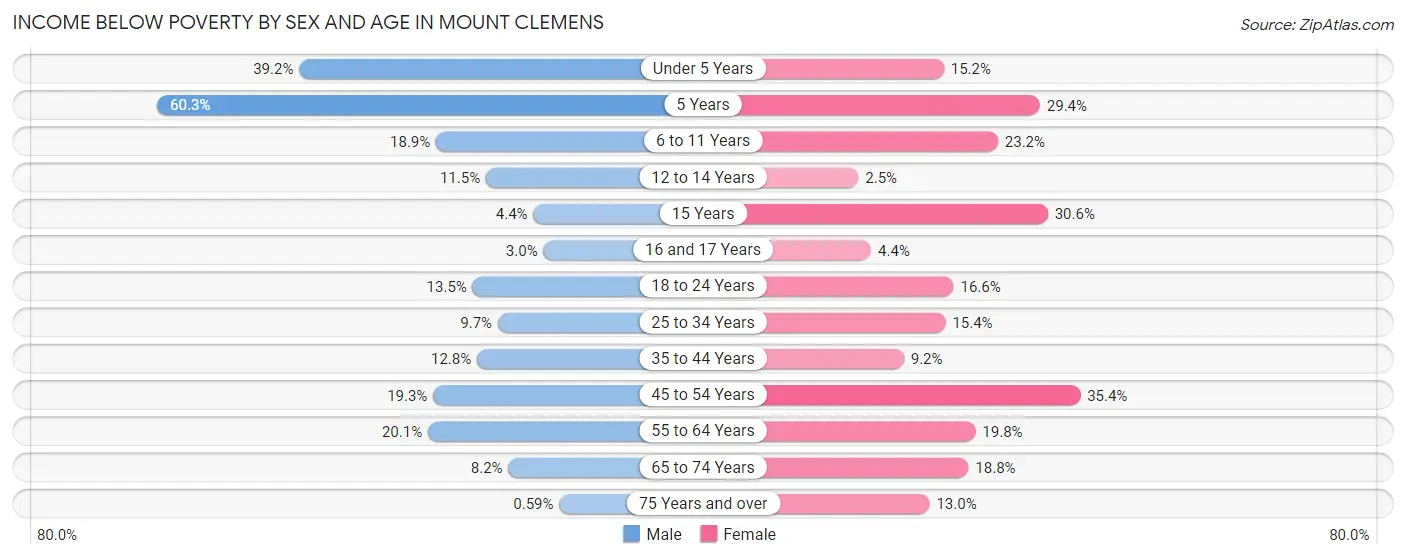
| Age Bracket | Male | Female |
| Under 5 Years | 191 (39.2%) | 45 (15.1%) |
| 5 Years | 38 (60.3%) | 20 (29.4%) |
| 6 to 11 Years | 85 (18.9%) | 92 (23.2%) |
| 12 to 14 Years | 30 (11.5%) | 6 (2.5%) |
| 15 Years | 4 (4.4%) | 37 (30.6%) |
| 16 and 17 Years | 7 (2.9%) | 6 (4.3%) |
| 18 to 24 Years | 47 (13.5%) | 117 (16.6%) |
| 25 to 34 Years | 112 (9.7%) | 167 (15.4%) |
| 35 to 44 Years | 109 (12.8%) | 93 (9.2%) |
| 45 to 54 Years | 203 (19.3%) | 286 (35.4%) |
| 55 to 64 Years | 239 (20.1%) | 202 (19.8%) |
| 65 to 74 Years | 52 (8.2%) | 151 (18.8%) |
| 75 Years and over | 2 (0.6%) | 69 (13.0%) |
| Total | 1,119 (15.6%) | 1,291 (17.9%) |
Income Above Poverty by Sex and Age in Mount Clemens
According to the poverty statistics in Mount Clemens, males aged 75 years and over and females aged 12 to 14 years are the age groups that are most secure financially, with 99.4% of males and 97.5% of females in these age groups living above the poverty line.
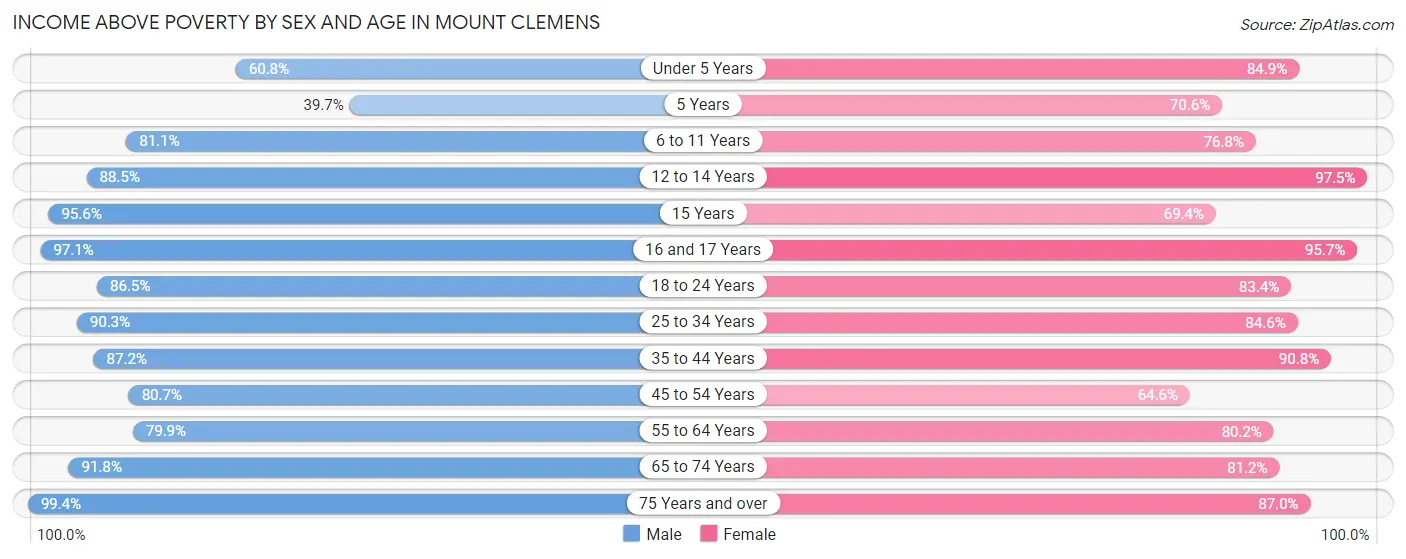
| Age Bracket | Male | Female |
| Under 5 Years | 296 (60.8%) | 252 (84.9%) |
| 5 Years | 25 (39.7%) | 48 (70.6%) |
| 6 to 11 Years | 365 (81.1%) | 305 (76.8%) |
| 12 to 14 Years | 231 (88.5%) | 238 (97.5%) |
| 15 Years | 86 (95.6%) | 84 (69.4%) |
| 16 and 17 Years | 230 (97.1%) | 132 (95.7%) |
| 18 to 24 Years | 302 (86.5%) | 588 (83.4%) |
| 25 to 34 Years | 1,041 (90.3%) | 918 (84.6%) |
| 35 to 44 Years | 741 (87.2%) | 918 (90.8%) |
| 45 to 54 Years | 847 (80.7%) | 522 (64.6%) |
| 55 to 64 Years | 950 (79.9%) | 816 (80.2%) |
| 65 to 74 Years | 585 (91.8%) | 652 (81.2%) |
| 75 Years and over | 337 (99.4%) | 461 (87.0%) |
| Total | 6,036 (84.4%) | 5,934 (82.1%) |
Income Below Poverty Among Married-Couple Families in Mount Clemens
The poverty statistics for married-couple families in Mount Clemens show that 12.0% or 254 of the total 2,118 families live below the poverty line. Families with 3 or 4 children have the highest poverty rate of 43.0%, comprising of 40 families. On the other hand, families with 5 or more children have the lowest poverty rate of 0.0%, which includes 0 families.
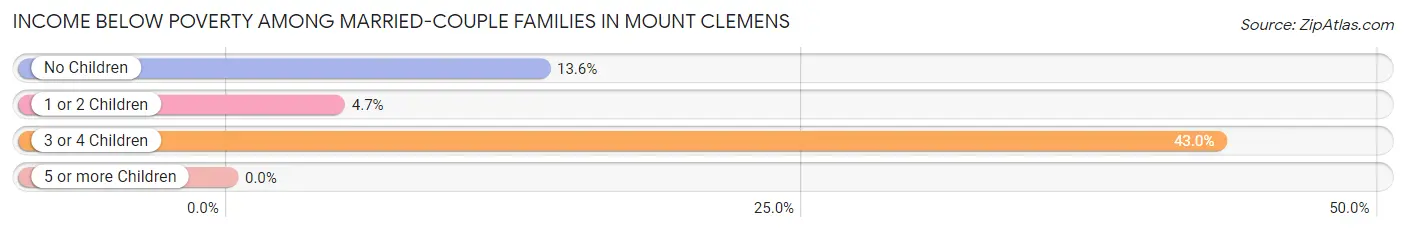
| Children | Above Poverty | Below Poverty |
| No Children | 1,177 (86.4%) | 185 (13.6%) |
| 1 or 2 Children | 594 (95.4%) | 29 (4.6%) |
| 3 or 4 Children | 53 (57.0%) | 40 (43.0%) |
| 5 or more Children | 40 (100.0%) | 0 (0.0%) |
| Total | 1,864 (88.0%) | 254 (12.0%) |
Income Below Poverty Among Single-Parent Households in Mount Clemens
According to the poverty data in Mount Clemens, 13.9% or 52 single-father households and 17.1% or 182 single-mother households are living below the poverty line. Among single-father households, those with 1 or 2 children have the highest poverty rate, with 43 households (20.6%) experiencing poverty. Likewise, among single-mother households, those with 5 or more children have the highest poverty rate, with 6 households (100.0%) falling below the poverty line.
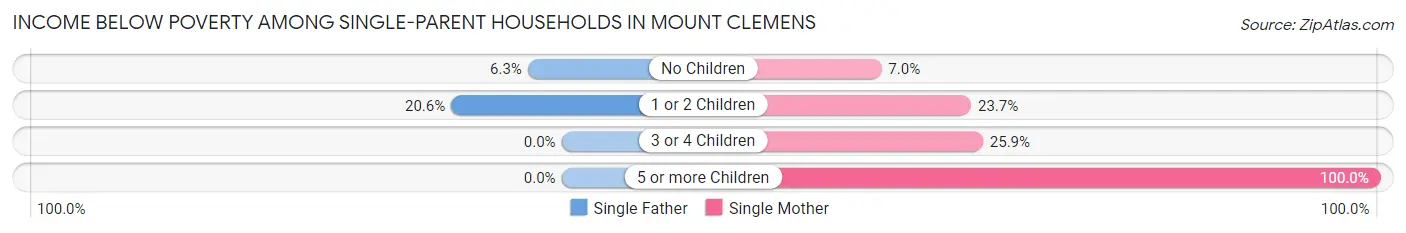
| Children | Single Father | Single Mother |
| No Children | 9 (6.3%) | 32 (7.0%) |
| 1 or 2 Children | 43 (20.6%) | 130 (23.7%) |
| 3 or 4 Children | 0 (0.0%) | 14 (25.9%) |
| 5 or more Children | 0 (0.0%) | 6 (100.0%) |
| Total | 52 (13.9%) | 182 (17.1%) |
Income Below Poverty Among Married-Couple vs Single-Parent Households in Mount Clemens
The poverty data for Mount Clemens shows that 254 of the married-couple family households (12.0%) and 234 of the single-parent households (16.3%) are living below the poverty level. Within the married-couple family households, those with 3 or 4 children have the highest poverty rate, with 40 households (43.0%) falling below the poverty line. Among the single-parent households, those with 5 or more children have the highest poverty rate, with 6 household (100.0%) living below poverty.
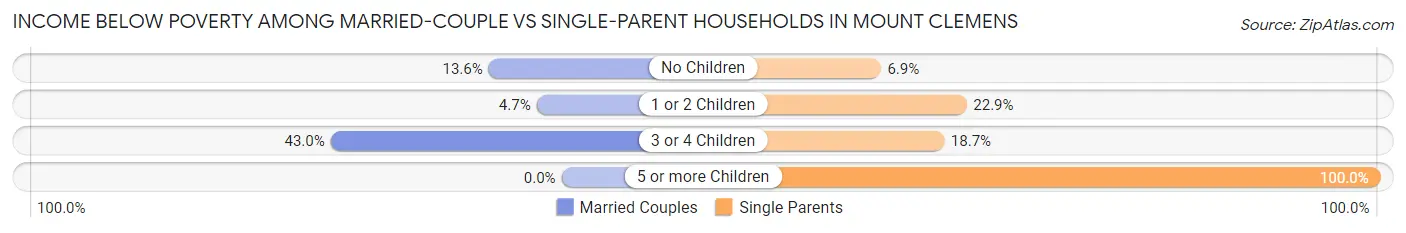
| Children | Married-Couple Families | Single-Parent Households |
| No Children | 185 (13.6%) | 41 (6.9%) |
| 1 or 2 Children | 29 (4.6%) | 173 (22.9%) |
| 3 or 4 Children | 40 (43.0%) | 14 (18.7%) |
| 5 or more Children | 0 (0.0%) | 6 (100.0%) |
| Total | 254 (12.0%) | 234 (16.3%) |
Race in Mount Clemens
The most populous races in Mount Clemens are White / Caucasian (10,398 | 66.3%), Black / African American (3,772 | 24.1%), and Two or more Races (1,308 | 8.3%).
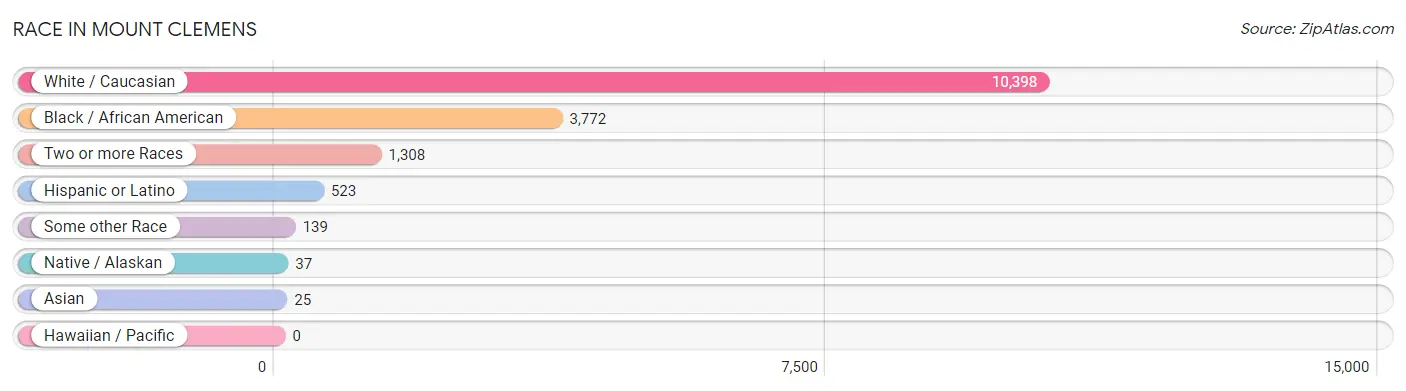
| Race | # Population | % Population |
| Asian | 25 | 0.2% |
| Black / African American | 3,772 | 24.1% |
| Hawaiian / Pacific | 0 | 0.0% |
| Hispanic or Latino | 523 | 3.3% |
| Native / Alaskan | 37 | 0.2% |
| White / Caucasian | 10,398 | 66.3% |
| Two or more Races | 1,308 | 8.3% |
| Some other Race | 139 | 0.9% |
| Total | 15,679 | 100.0% |
Ancestry in Mount Clemens
The most populous ancestries reported in Mount Clemens are German (2,864 | 18.3%), Irish (2,088 | 13.3%), Polish (1,728 | 11.0%), English (1,081 | 6.9%), and Italian (1,015 | 6.5%), together accounting for 56.0% of all Mount Clemens residents.
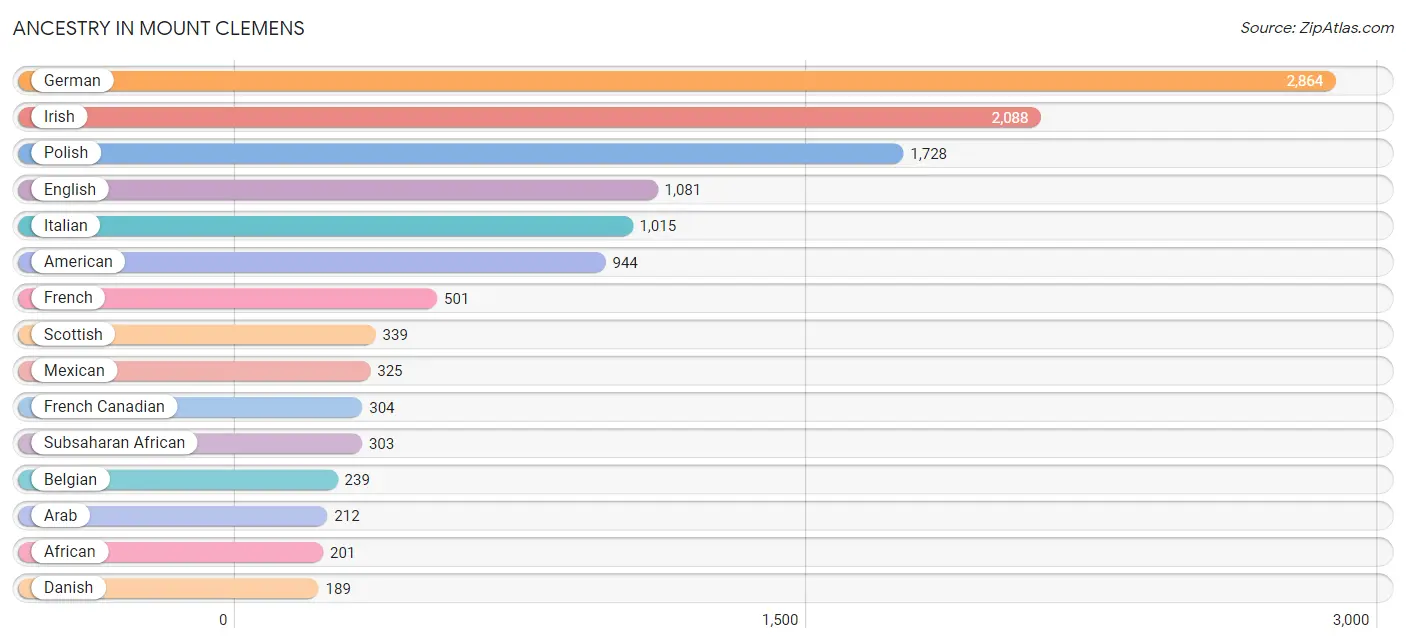
| Ancestry | # Population | % Population |
| African | 201 | 1.3% |
| Albanian | 26 | 0.2% |
| American | 944 | 6.0% |
| Apache | 15 | 0.1% |
| Arab | 212 | 1.3% |
| Austrian | 21 | 0.1% |
| Belgian | 239 | 1.5% |
| Bhutanese | 11 | 0.1% |
| Blackfeet | 122 | 0.8% |
| British | 33 | 0.2% |
| Canadian | 9 | 0.1% |
| Celtic | 37 | 0.2% |
| Central American | 22 | 0.1% |
| Cherokee | 43 | 0.3% |
| Chickasaw | 13 | 0.1% |
| Chilean | 27 | 0.2% |
| Chippewa | 3 | 0.0% |
| Colombian | 8 | 0.1% |
| Croatian | 18 | 0.1% |
| Cuban | 49 | 0.3% |
| Czech | 41 | 0.3% |
| Danish | 189 | 1.2% |
| Dutch | 84 | 0.5% |
| Eastern European | 5 | 0.0% |
| Egyptian | 8 | 0.1% |
| English | 1,081 | 6.9% |
| Estonian | 6 | 0.0% |
| European | 91 | 0.6% |
| Finnish | 30 | 0.2% |
| French | 501 | 3.2% |
| French American Indian | 8 | 0.1% |
| French Canadian | 304 | 1.9% |
| German | 2,864 | 18.3% |
| Greek | 105 | 0.7% |
| Hungarian | 35 | 0.2% |
| Indian (Asian) | 17 | 0.1% |
| Irish | 2,088 | 13.3% |
| Italian | 1,015 | 6.5% |
| Korean | 90 | 0.6% |
| Lebanese | 178 | 1.1% |
| Lithuanian | 58 | 0.4% |
| Maltese | 11 | 0.1% |
| Mexican | 325 | 2.1% |
| Mexican American Indian | 18 | 0.1% |
| Native Hawaiian | 16 | 0.1% |
| Navajo | 11 | 0.1% |
| Nigerian | 67 | 0.4% |
| Norwegian | 41 | 0.3% |
| Ottawa | 15 | 0.1% |
| Pakistani | 12 | 0.1% |
| Peruvian | 50 | 0.3% |
| Polish | 1,728 | 11.0% |
| Pueblo | 23 | 0.2% |
| Puerto Rican | 6 | 0.0% |
| Romanian | 6 | 0.0% |
| Russian | 28 | 0.2% |
| Salvadoran | 22 | 0.1% |
| Scandinavian | 83 | 0.5% |
| Scotch-Irish | 159 | 1.0% |
| Scottish | 339 | 2.2% |
| Serbian | 139 | 0.9% |
| Sioux | 18 | 0.1% |
| Slovak | 14 | 0.1% |
| South American | 85 | 0.5% |
| Spanish | 20 | 0.1% |
| Subsaharan African | 303 | 1.9% |
| Swedish | 136 | 0.9% |
| Swiss | 27 | 0.2% |
| Syrian | 14 | 0.1% |
| Thai | 7 | 0.0% |
| Ukrainian | 99 | 0.6% |
| Welsh | 36 | 0.2% |
| Yugoslavian | 94 | 0.6% | View All 73 Rows |
Immigrants in Mount Clemens
The most numerous immigrant groups reported in Mount Clemens came from Europe (101 | 0.6%), Central America (97 | 0.6%), Latin America (97 | 0.6%), Mexico (97 | 0.6%), and Eastern Europe (69 | 0.4%), together accounting for 2.9% of all Mount Clemens residents.
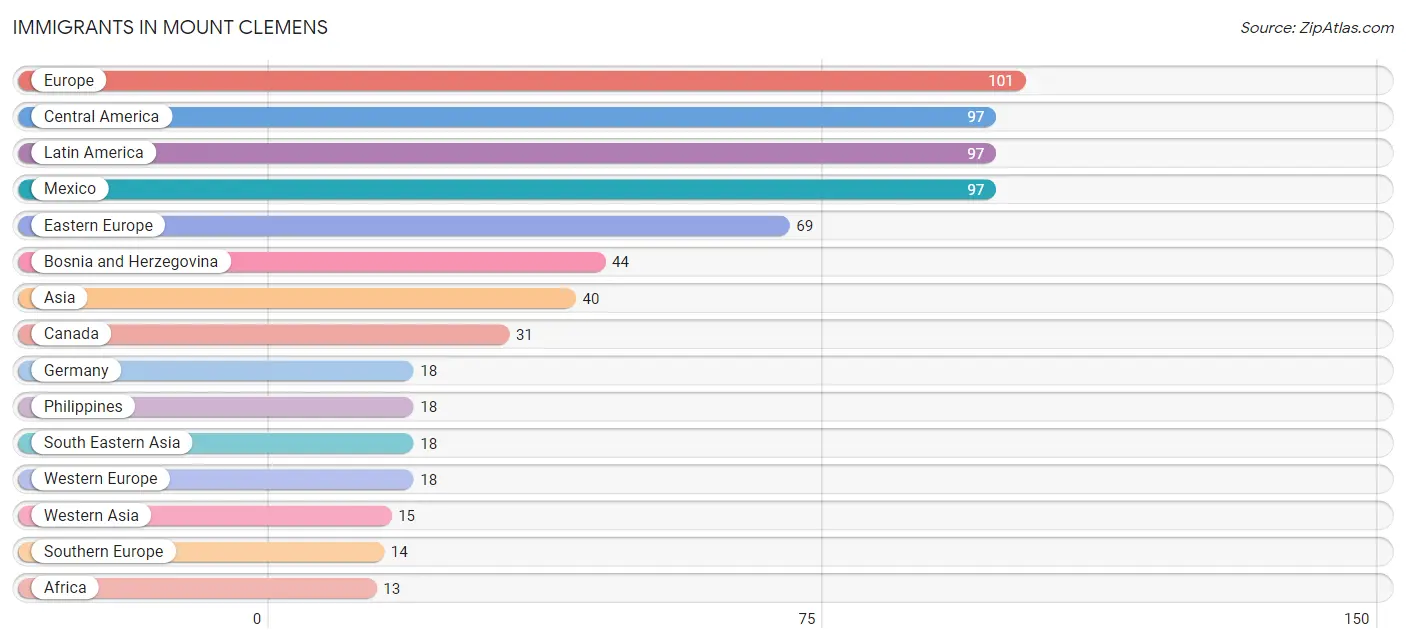
| Immigration Origin | # Population | % Population |
| Africa | 13 | 0.1% |
| Albania | 6 | 0.0% |
| Asia | 40 | 0.3% |
| Bosnia and Herzegovina | 44 | 0.3% |
| Canada | 31 | 0.2% |
| Central America | 97 | 0.6% |
| Eastern Africa | 5 | 0.0% |
| Eastern Europe | 69 | 0.4% |
| Egypt | 8 | 0.1% |
| Ethiopia | 5 | 0.0% |
| Europe | 101 | 0.6% |
| Germany | 18 | 0.1% |
| Greece | 7 | 0.0% |
| India | 7 | 0.0% |
| Iraq | 12 | 0.1% |
| Italy | 7 | 0.0% |
| Latin America | 97 | 0.6% |
| Lebanon | 3 | 0.0% |
| Mexico | 97 | 0.6% |
| Northern Africa | 8 | 0.1% |
| Philippines | 18 | 0.1% |
| Poland | 6 | 0.0% |
| Russia | 13 | 0.1% |
| South Central Asia | 7 | 0.0% |
| South Eastern Asia | 18 | 0.1% |
| Southern Europe | 14 | 0.1% |
| Western Asia | 15 | 0.1% |
| Western Europe | 18 | 0.1% | View All 28 Rows |
Sex and Age in Mount Clemens
Sex and Age in Mount Clemens
The most populous age groups in Mount Clemens are 30 to 34 Years (758 | 9.3%) for men and 40 to 44 Years (635 | 8.4%) for women.
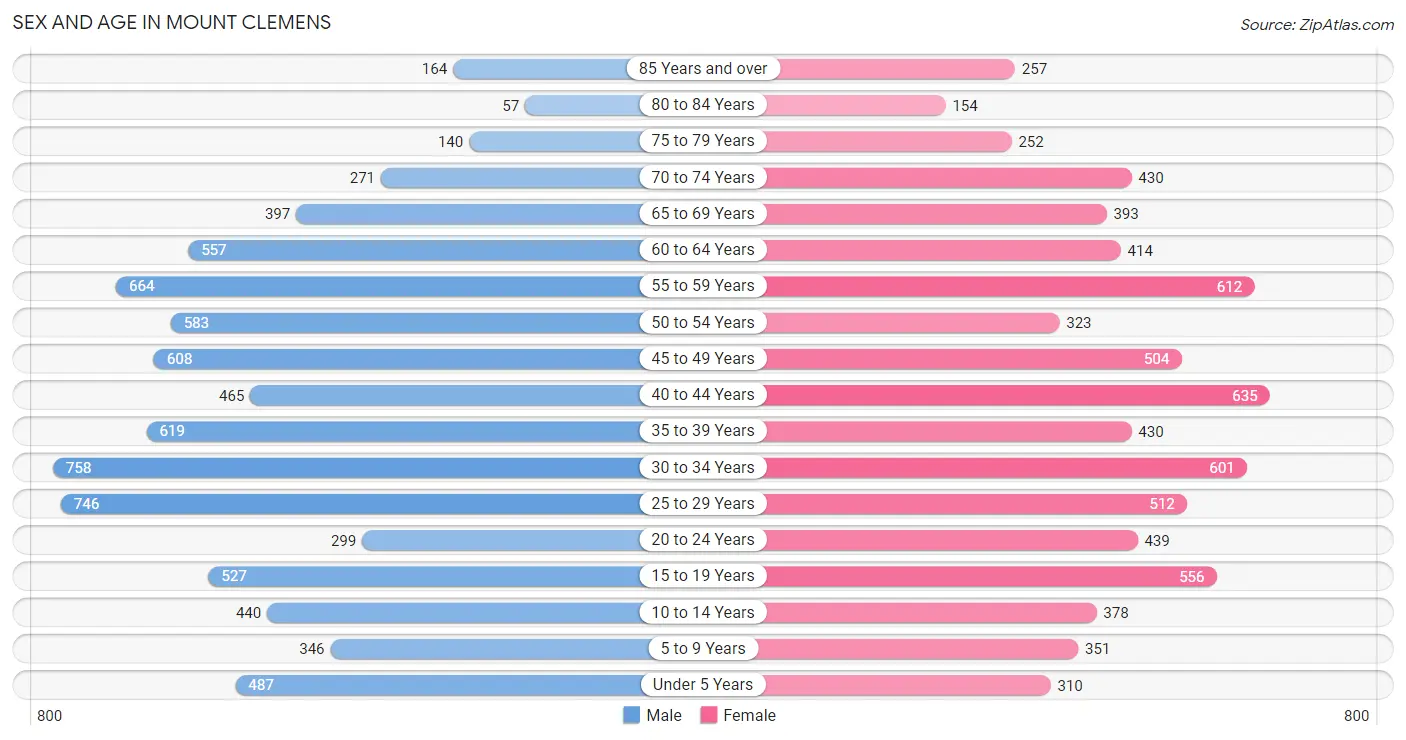
| Age Bracket | Male | Female |
| Under 5 Years | 487 (6.0%) | 310 (4.1%) |
| 5 to 9 Years | 346 (4.3%) | 351 (4.6%) |
| 10 to 14 Years | 440 (5.4%) | 378 (5.0%) |
| 15 to 19 Years | 527 (6.5%) | 556 (7.4%) |
| 20 to 24 Years | 299 (3.7%) | 439 (5.8%) |
| 25 to 29 Years | 746 (9.2%) | 512 (6.8%) |
| 30 to 34 Years | 758 (9.3%) | 601 (8.0%) |
| 35 to 39 Years | 619 (7.6%) | 430 (5.7%) |
| 40 to 44 Years | 465 (5.7%) | 635 (8.4%) |
| 45 to 49 Years | 608 (7.5%) | 504 (6.7%) |
| 50 to 54 Years | 583 (7.2%) | 323 (4.3%) |
| 55 to 59 Years | 664 (8.2%) | 612 (8.1%) |
| 60 to 64 Years | 557 (6.9%) | 414 (5.5%) |
| 65 to 69 Years | 397 (4.9%) | 393 (5.2%) |
| 70 to 74 Years | 271 (3.3%) | 430 (5.7%) |
| 75 to 79 Years | 140 (1.7%) | 252 (3.3%) |
| 80 to 84 Years | 57 (0.7%) | 154 (2.0%) |
| 85 Years and over | 164 (2.0%) | 257 (3.4%) |
| Total | 8,128 (100.0%) | 7,551 (100.0%) |
Families and Households in Mount Clemens
Median Family Size in Mount Clemens
The median family size in Mount Clemens is 2.94 persons per family, with single male/father families (373 | 10.5%) accounting for the largest median family size of 3.01 persons per family. On the other hand, single female/mother families (1,063 | 29.9%) represent the smallest median family size with 2.90 persons per family.
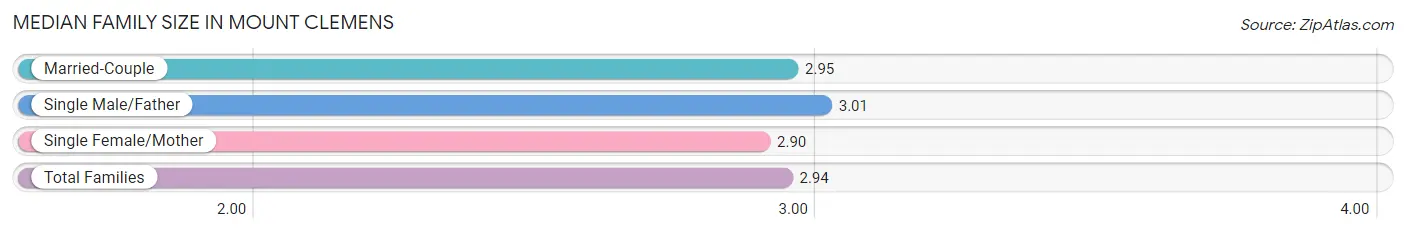
| Family Type | # Families | Family Size |
| Married-Couple | 2,118 (59.6%) | 2.95 |
| Single Male/Father | 373 (10.5%) | 3.01 |
| Single Female/Mother | 1,063 (29.9%) | 2.90 |
| Total Families | 3,554 (100.0%) | 2.94 |
Median Household Size in Mount Clemens
The median household size in Mount Clemens is 2.17 persons per household, with single male/father households (373 | 5.7%) accounting for the largest median household size of 3.32 persons per household. non-family households (3,029 | 46.0%) represent the smallest median household size with 1.20 persons per household.
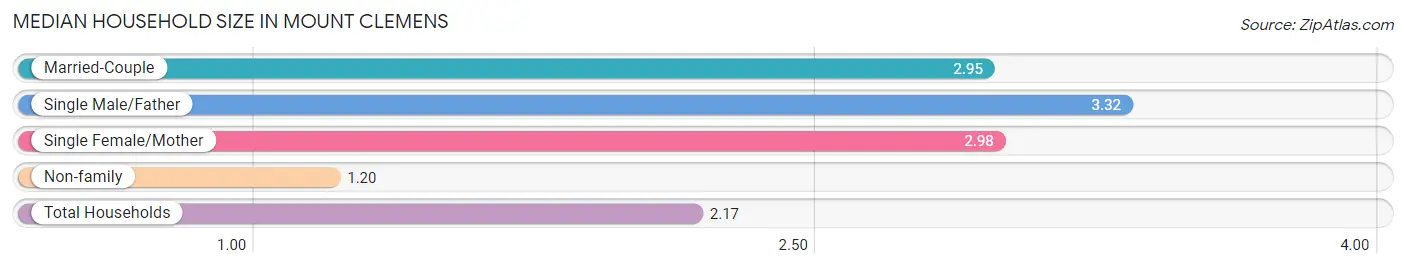
| Household Type | # Households | Household Size |
| Married-Couple | 2,118 (32.2%) | 2.95 |
| Single Male/Father | 373 (5.7%) | 3.32 |
| Single Female/Mother | 1,063 (16.2%) | 2.98 |
| Non-family | 3,029 (46.0%) | 1.20 |
| Total Households | 6,583 (100.0%) | 2.17 |
Household Size by Marriage Status in Mount Clemens
Out of a total of 6,583 households in Mount Clemens, 3,554 (54.0%) are family households, while 3,029 (46.0%) are nonfamily households. The most numerous type of family households are 2-person households, comprising 1,714, and the most common type of nonfamily households are 1-person households, comprising 2,547.
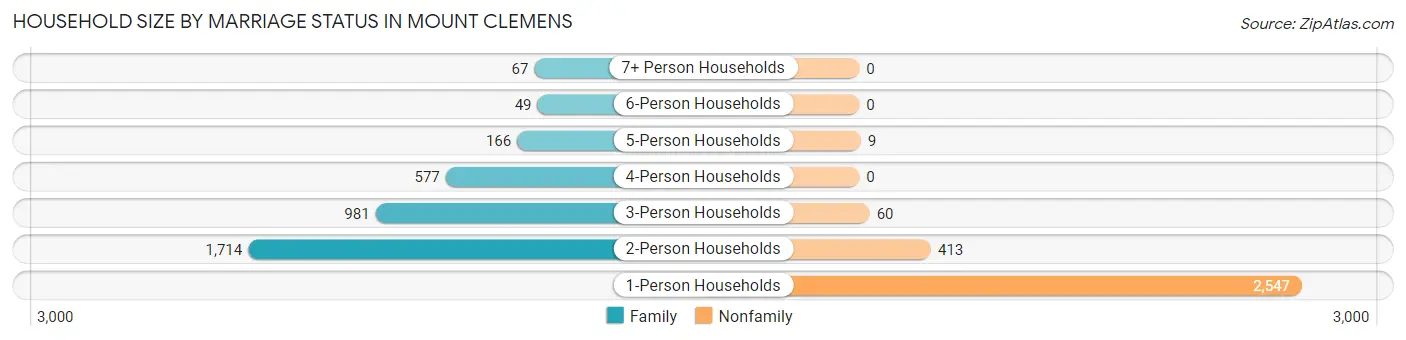
| Household Size | Family Households | Nonfamily Households |
| 1-Person Households | - | 2,547 (38.7%) |
| 2-Person Households | 1,714 (26.0%) | 413 (6.3%) |
| 3-Person Households | 981 (14.9%) | 60 (0.9%) |
| 4-Person Households | 577 (8.8%) | 0 (0.0%) |
| 5-Person Households | 166 (2.5%) | 9 (0.1%) |
| 6-Person Households | 49 (0.7%) | 0 (0.0%) |
| 7+ Person Households | 67 (1.0%) | 0 (0.0%) |
| Total | 3,554 (54.0%) | 3,029 (46.0%) |
Female Fertility in Mount Clemens
Fertility by Age in Mount Clemens
Average fertility rate in Mount Clemens is 54.0 births per 1,000 women. Women in the age bracket of 20 to 34 years have the highest fertility rate with 104.0 births per 1,000 women. Women in the age bracket of 20 to 34 years acount for 80.1% of all women with births.
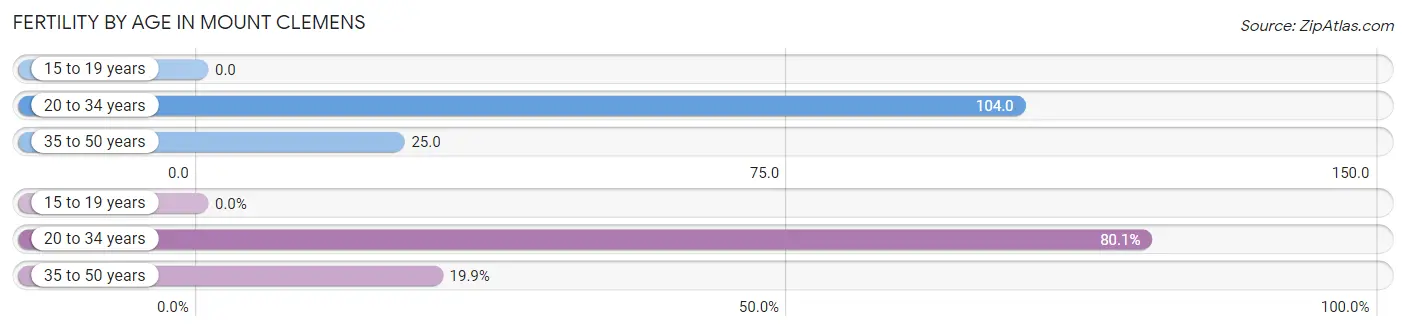
| Age Bracket | Women with Births | Births / 1,000 Women |
| 15 to 19 years | 0 (0.0%) | 0.0 |
| 20 to 34 years | 161 (80.1%) | 104.0 |
| 35 to 50 years | 40 (19.9%) | 25.0 |
| Total | 201 (100.0%) | 54.0 |
Fertility by Age by Marriage Status in Mount Clemens
89.6% of women with births (201) in Mount Clemens are married. The highest percentage of unmarried women with births falls into 35 to 50 years age bracket with 22.5% of them unmarried at the time of birth, while the lowest percentage of unmarried women with births belong to 20 to 34 years age bracket with 7.5% of them unmarried.
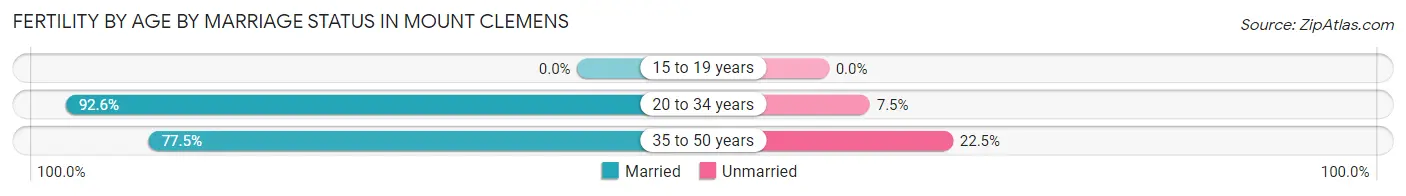
| Age Bracket | Married | Unmarried |
| 15 to 19 years | 0 (0.0%) | 0 (0.0%) |
| 20 to 34 years | 149 (92.5%) | 12 (7.4%) |
| 35 to 50 years | 31 (77.5%) | 9 (22.5%) |
| Total | 180 (89.5%) | 21 (10.4%) |
Fertility by Education in Mount Clemens
Average fertility rate in Mount Clemens is 54.0 births per 1,000 women. Women with the education attainment of college or associate's degree have the highest fertility rate of 93.0 births per 1,000 women, while women with the education attainment of less than high school have the lowest fertility at 3.0 births per 1,000 women. Women with the education attainment of college or associate's degree represent 57.2% of all women with births.
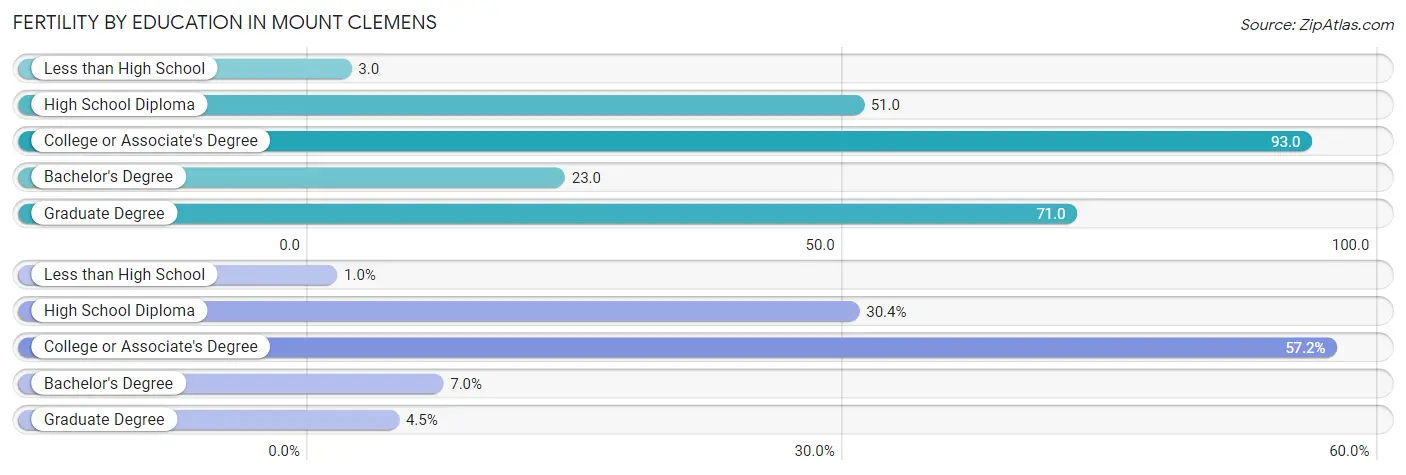
| Educational Attainment | Women with Births | Births / 1,000 Women |
| Less than High School | 2 (1.0%) | 3.0 |
| High School Diploma | 61 (30.3%) | 51.0 |
| College or Associate's Degree | 115 (57.2%) | 93.0 |
| Bachelor's Degree | 14 (7.0%) | 23.0 |
| Graduate Degree | 9 (4.5%) | 71.0 |
| Total | 201 (100.0%) | 54.0 |
Fertility by Education by Marriage Status in Mount Clemens
10.4% of women with births in Mount Clemens are unmarried. Women with the educational attainment of college or associate's degree are most likely to be married with 100.0% of them married at childbirth, while women with the educational attainment of less than high school are least likely to be married with 100.0% of them unmarried at childbirth.
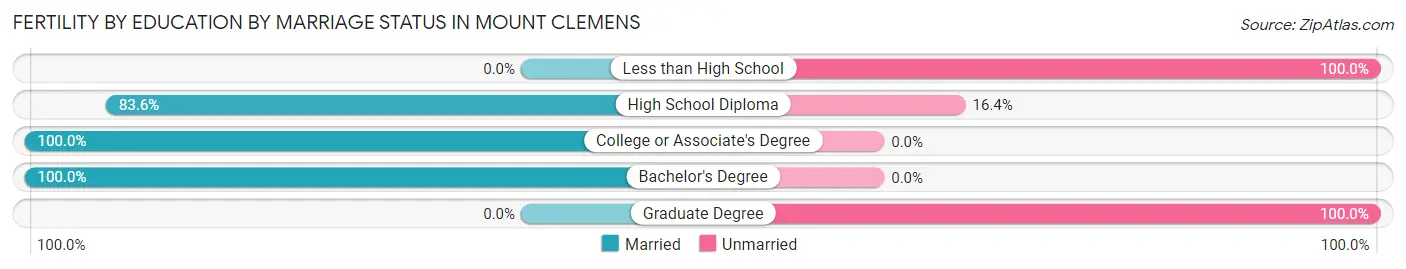
| Educational Attainment | Married | Unmarried |
| Less than High School | 0 (0.0%) | 2 (100.0%) |
| High School Diploma | 51 (83.6%) | 10 (16.4%) |
| College or Associate's Degree | 115 (100.0%) | 0 (0.0%) |
| Bachelor's Degree | 14 (100.0%) | 0 (0.0%) |
| Graduate Degree | 0 (0.0%) | 9 (100.0%) |
| Total | 180 (89.5%) | 21 (10.4%) |
Employment Characteristics in Mount Clemens
Employment by Class of Employer in Mount Clemens
Among the 7,030 employed individuals in Mount Clemens, private company employees (5,370 | 76.4%), not-for-profit organizations (506 | 7.2%), and local government employees (390 | 5.6%) make up the most common classes of employment.
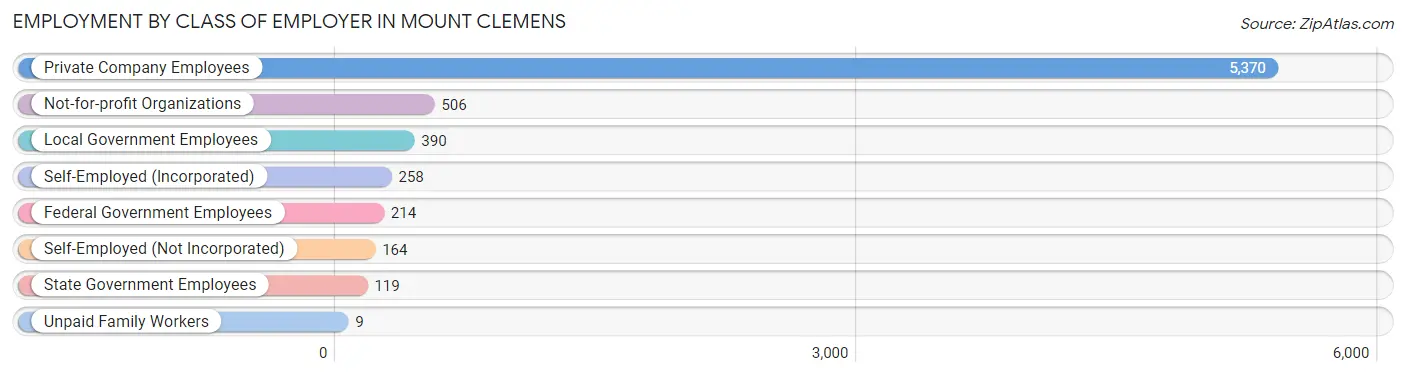
| Employer Class | # Employees | % Employees |
| Private Company Employees | 5,370 | 76.4% |
| Self-Employed (Incorporated) | 258 | 3.7% |
| Self-Employed (Not Incorporated) | 164 | 2.3% |
| Not-for-profit Organizations | 506 | 7.2% |
| Local Government Employees | 390 | 5.6% |
| State Government Employees | 119 | 1.7% |
| Federal Government Employees | 214 | 3.0% |
| Unpaid Family Workers | 9 | 0.1% |
| Total | 7,030 | 100.0% |
Employment Status by Age in Mount Clemens
According to the labor force statistics for Mount Clemens, out of the total population over 16 years of age (13,150), 58.8% or 7,732 individuals are in the labor force, with 7.0% or 541 of them unemployed. The age group with the highest labor force participation rate is 30 to 34 years, with 77.6% or 1,055 individuals in the labor force. Within the labor force, the 20 to 24 years age range has the highest percentage of unemployed individuals, with 14.8% or 64 of them being unemployed.
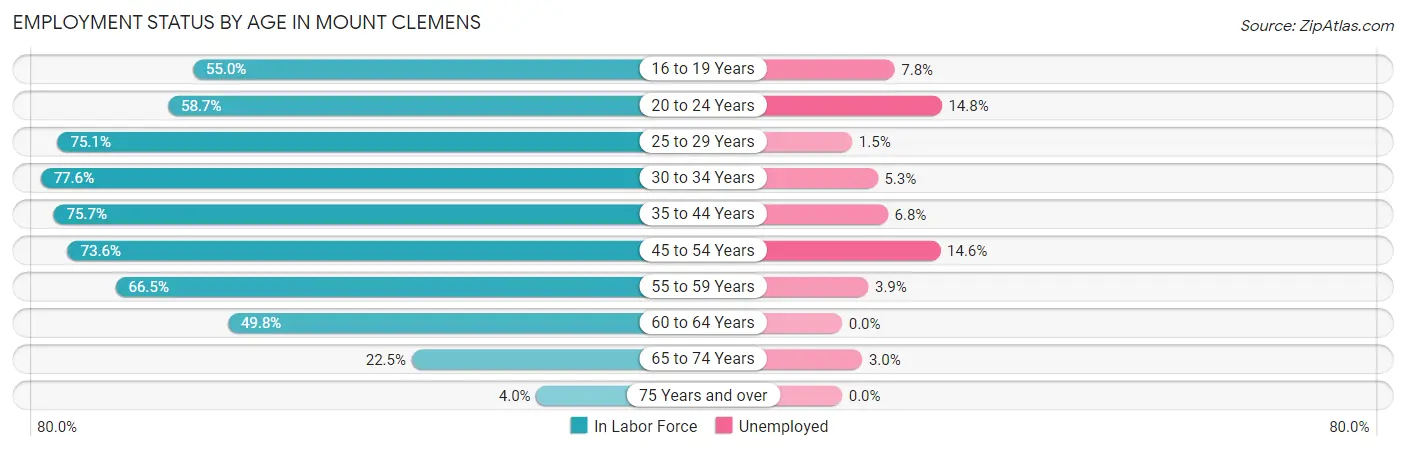
| Age Bracket | In Labor Force | Unemployed |
| 16 to 19 Years | 476 (55.0%) | 37 (7.8%) |
| 20 to 24 Years | 433 (58.7%) | 64 (14.8%) |
| 25 to 29 Years | 945 (75.1%) | 14 (1.5%) |
| 30 to 34 Years | 1,055 (77.6%) | 56 (5.3%) |
| 35 to 44 Years | 1,627 (75.7%) | 111 (6.8%) |
| 45 to 54 Years | 1,485 (73.6%) | 217 (14.6%) |
| 55 to 59 Years | 849 (66.5%) | 33 (3.9%) |
| 60 to 64 Years | 484 (49.8%) | 0 (0.0%) |
| 65 to 74 Years | 335 (22.5%) | 10 (3.0%) |
| 75 Years and over | 41 (4.0%) | 0 (0.0%) |
| Total | 7,732 (58.8%) | 541 (7.0%) |
Employment Status by Educational Attainment in Mount Clemens
According to labor force statistics for Mount Clemens, 71.4% of individuals (6,448) out of the total population between 25 and 64 years of age (9,031) are in the labor force, with 6.7% or 432 of them being unemployed. The group with the highest labor force participation rate are those with the educational attainment of bachelor's degree or higher, with 89.8% or 1,369 individuals in the labor force. Within the labor force, individuals with less than high school education have the highest percentage of unemployment, with 12.9% or 54 of them being unemployed.
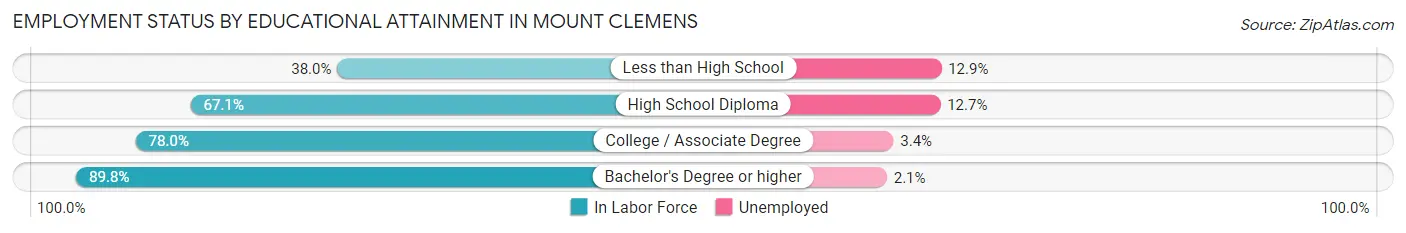
| Educational Attainment | In Labor Force | Unemployed |
| Less than High School | 420 (38.0%) | 142 (12.9%) |
| High School Diploma | 2,075 (67.1%) | 393 (12.7%) |
| College / Associate Degree | 2,581 (78.0%) | 113 (3.4%) |
| Bachelor's Degree or higher | 1,369 (89.8%) | 32 (2.1%) |
| Total | 6,448 (71.4%) | 605 (6.7%) |
Employment Occupations by Sex in Mount Clemens
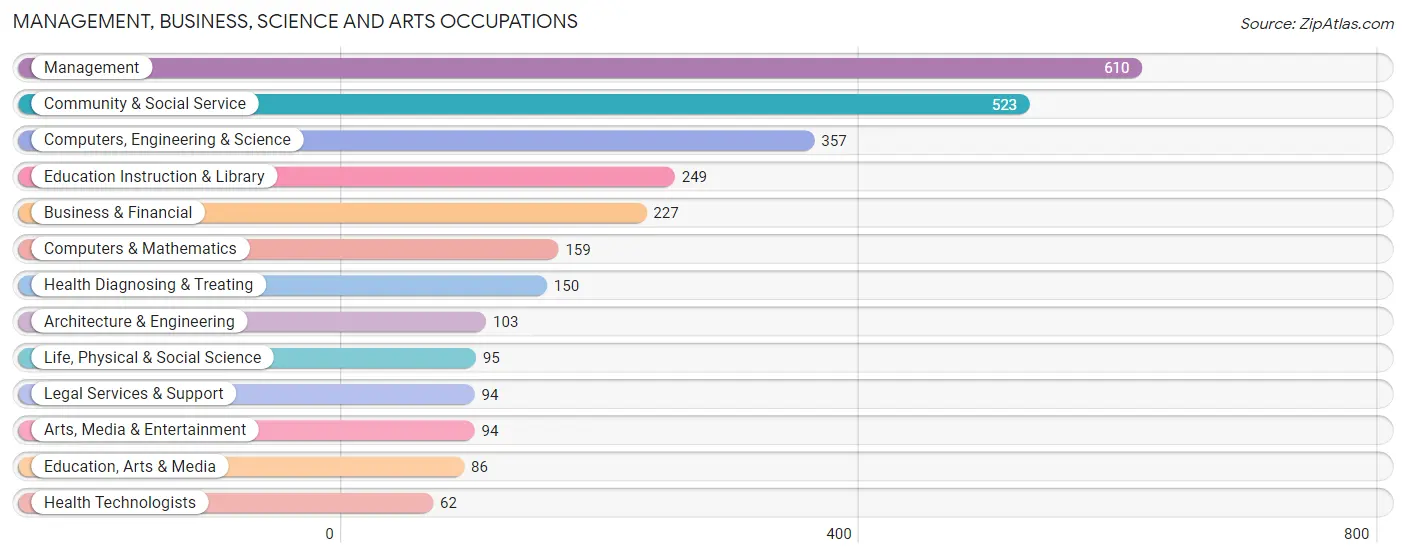
Management, Business, Science and Arts Occupations
The most common Management, Business, Science and Arts occupations in Mount Clemens are Management (610 | 8.6%), Community & Social Service (523 | 7.3%), Computers, Engineering & Science (357 | 5.0%), Education Instruction & Library (249 | 3.5%), and Business & Financial (227 | 3.2%).
Management, Business, Science and Arts Occupations by Sex
Within the Management, Business, Science and Arts occupations in Mount Clemens, the most male-oriented occupations are Architecture & Engineering (87.4%), Life, Physical & Social Science (84.2%), and Computers, Engineering & Science (64.1%), while the most female-oriented occupations are Health Diagnosing & Treating (100.0%), Health Technologists (100.0%), and Business & Financial (85.5%).
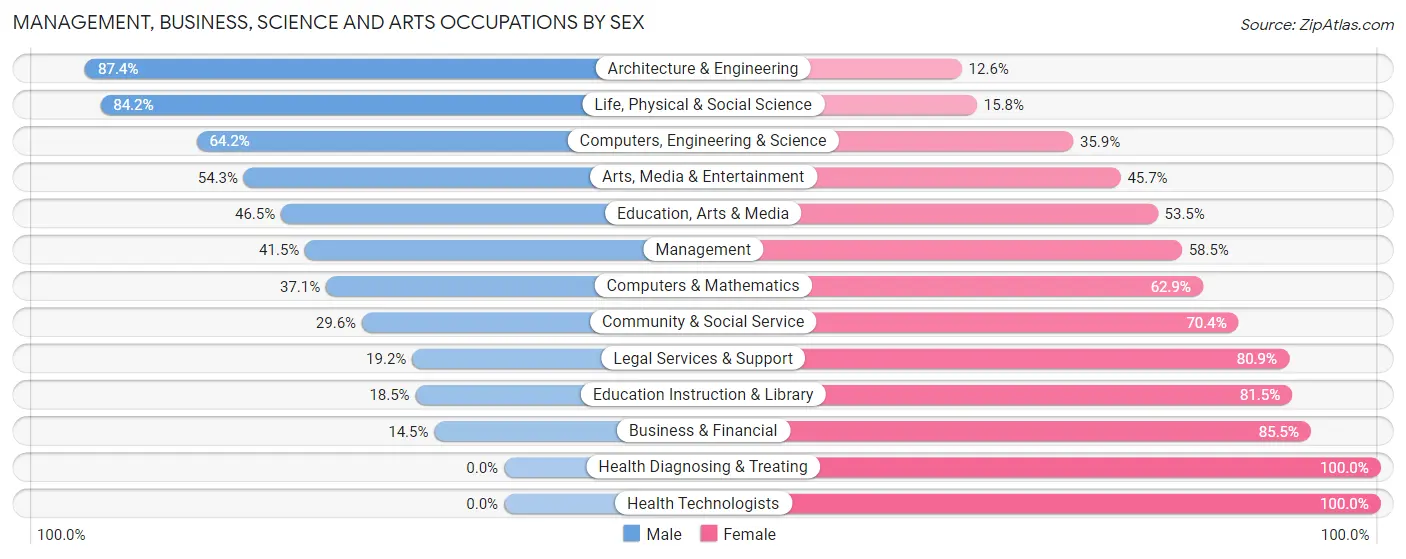
| Occupation | Male | Female |
| Management | 253 (41.5%) | 357 (58.5%) |
| Business & Financial | 33 (14.5%) | 194 (85.5%) |
| Computers, Engineering & Science | 229 (64.1%) | 128 (35.8%) |
| Computers & Mathematics | 59 (37.1%) | 100 (62.9%) |
| Architecture & Engineering | 90 (87.4%) | 13 (12.6%) |
| Life, Physical & Social Science | 80 (84.2%) | 15 (15.8%) |
| Community & Social Service | 155 (29.6%) | 368 (70.4%) |
| Education, Arts & Media | 40 (46.5%) | 46 (53.5%) |
| Legal Services & Support | 18 (19.2%) | 76 (80.8%) |
| Education Instruction & Library | 46 (18.5%) | 203 (81.5%) |
| Arts, Media & Entertainment | 51 (54.3%) | 43 (45.7%) |
| Health Diagnosing & Treating | 0 (0.0%) | 150 (100.0%) |
| Health Technologists | 0 (0.0%) | 62 (100.0%) |
| Total (Category) | 670 (35.9%) | 1,197 (64.1%) |
| Total (Overall) | 3,611 (50.7%) | 3,508 (49.3%) |
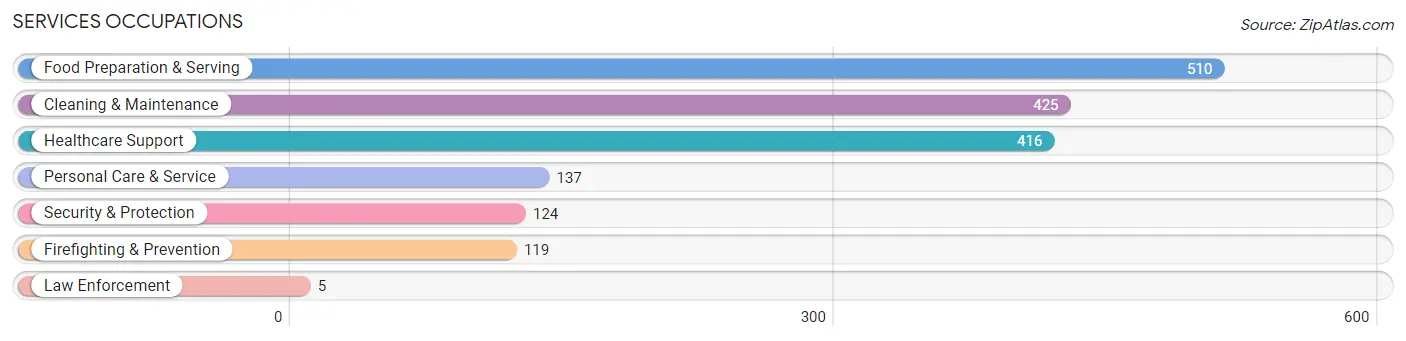
Services Occupations
The most common Services occupations in Mount Clemens are Food Preparation & Serving (510 | 7.2%), Cleaning & Maintenance (425 | 6.0%), Healthcare Support (416 | 5.8%), Personal Care & Service (137 | 1.9%), and Security & Protection (124 | 1.7%).
Services Occupations by Sex
Within the Services occupations in Mount Clemens, the most male-oriented occupations are Law Enforcement (100.0%), Security & Protection (68.5%), and Firefighting & Prevention (67.2%), while the most female-oriented occupations are Personal Care & Service (93.4%), Healthcare Support (84.4%), and Food Preparation & Serving (50.6%).
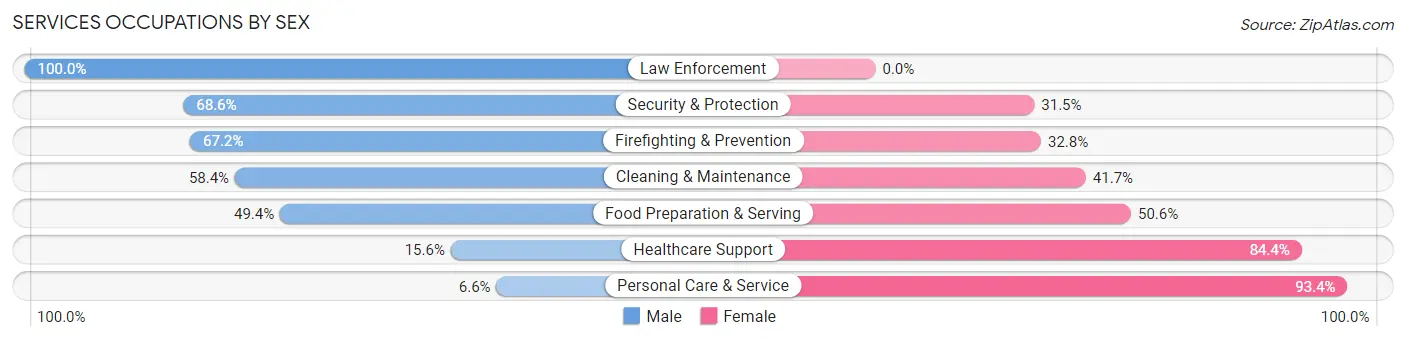
| Occupation | Male | Female |
| Healthcare Support | 65 (15.6%) | 351 (84.4%) |
| Security & Protection | 85 (68.5%) | 39 (31.5%) |
| Firefighting & Prevention | 80 (67.2%) | 39 (32.8%) |
| Law Enforcement | 5 (100.0%) | 0 (0.0%) |
| Food Preparation & Serving | 252 (49.4%) | 258 (50.6%) |
| Cleaning & Maintenance | 248 (58.4%) | 177 (41.6%) |
| Personal Care & Service | 9 (6.6%) | 128 (93.4%) |
| Total (Category) | 659 (40.9%) | 953 (59.1%) |
| Total (Overall) | 3,611 (50.7%) | 3,508 (49.3%) |
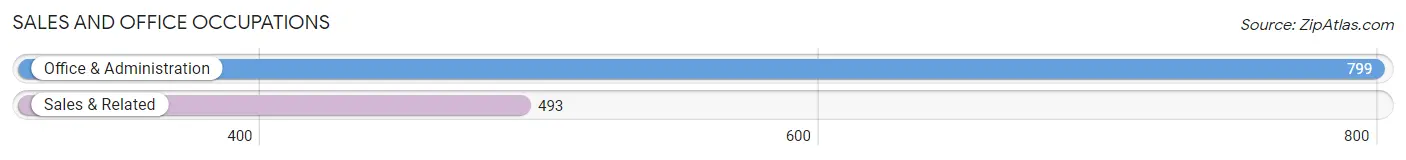
Sales and Office Occupations
The most common Sales and Office occupations in Mount Clemens are Office & Administration (799 | 11.2%), and Sales & Related (493 | 6.9%).
Sales and Office Occupations by Sex
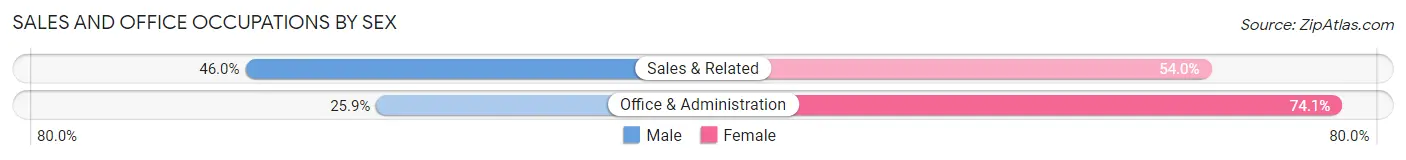
| Occupation | Male | Female |
| Sales & Related | 227 (46.0%) | 266 (54.0%) |
| Office & Administration | 207 (25.9%) | 592 (74.1%) |
| Total (Category) | 434 (33.6%) | 858 (66.4%) |
| Total (Overall) | 3,611 (50.7%) | 3,508 (49.3%) |
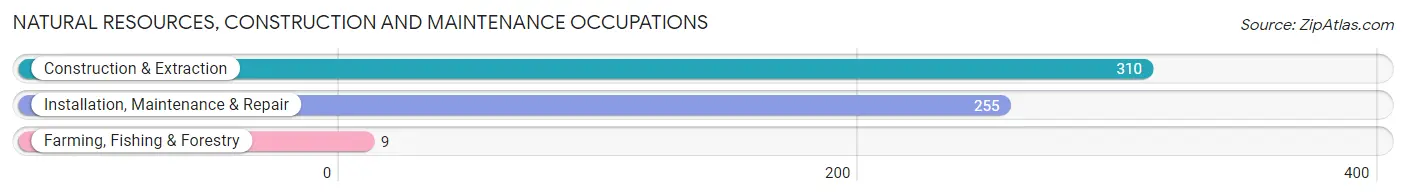
Natural Resources, Construction and Maintenance Occupations
The most common Natural Resources, Construction and Maintenance occupations in Mount Clemens are Construction & Extraction (310 | 4.3%), Installation, Maintenance & Repair (255 | 3.6%), and Farming, Fishing & Forestry (9 | 0.1%).
Natural Resources, Construction and Maintenance Occupations by Sex
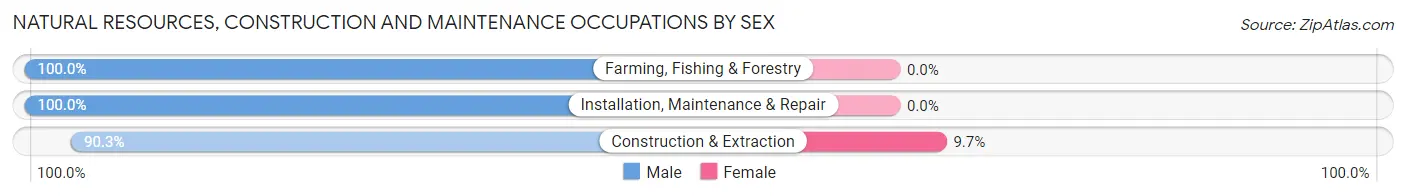
| Occupation | Male | Female |
| Farming, Fishing & Forestry | 9 (100.0%) | 0 (0.0%) |
| Construction & Extraction | 280 (90.3%) | 30 (9.7%) |
| Installation, Maintenance & Repair | 255 (100.0%) | 0 (0.0%) |
| Total (Category) | 544 (94.8%) | 30 (5.2%) |
| Total (Overall) | 3,611 (50.7%) | 3,508 (49.3%) |
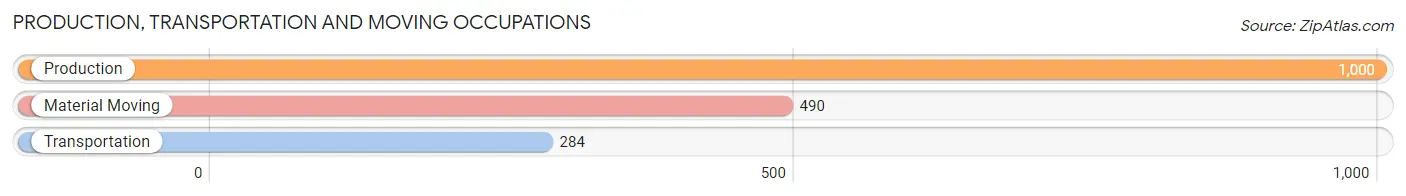
Production, Transportation and Moving Occupations
The most common Production, Transportation and Moving occupations in Mount Clemens are Production (1,000 | 14.1%), Material Moving (490 | 6.9%), and Transportation (284 | 4.0%).
Production, Transportation and Moving Occupations by Sex
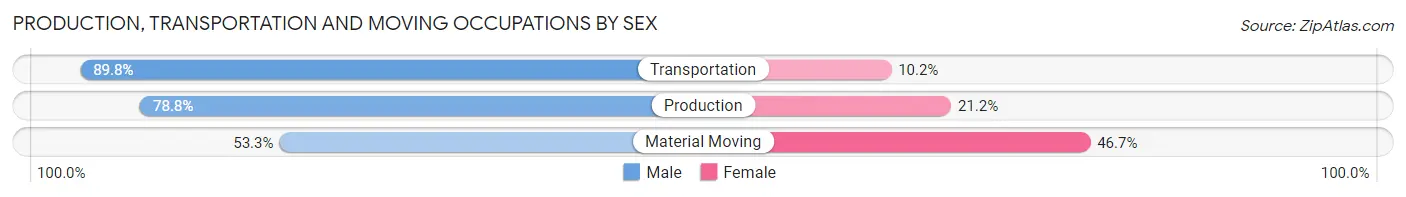
| Occupation | Male | Female |
| Production | 788 (78.8%) | 212 (21.2%) |
| Transportation | 255 (89.8%) | 29 (10.2%) |
| Material Moving | 261 (53.3%) | 229 (46.7%) |
| Total (Category) | 1,304 (73.5%) | 470 (26.5%) |
| Total (Overall) | 3,611 (50.7%) | 3,508 (49.3%) |
Employment Industries by Sex in Mount Clemens
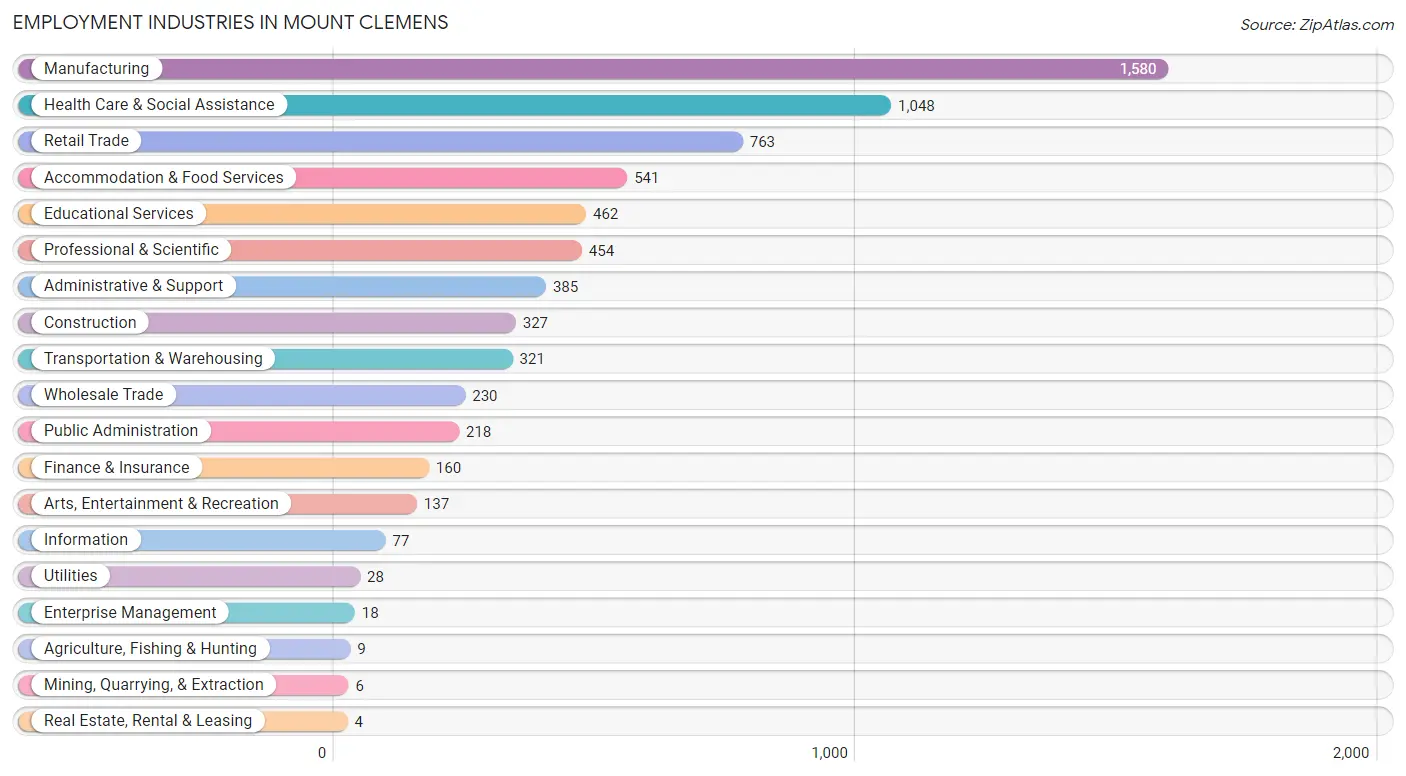
Employment Industries in Mount Clemens
The major employment industries in Mount Clemens include Manufacturing (1,580 | 22.2%), Health Care & Social Assistance (1,048 | 14.7%), Retail Trade (763 | 10.7%), Accommodation & Food Services (541 | 7.6%), and Educational Services (462 | 6.5%).
Employment Industries by Sex in Mount Clemens
The Mount Clemens industries that see more men than women are Agriculture, Fishing & Hunting (100.0%), Mining, Quarrying, & Extraction (100.0%), and Construction (97.9%), whereas the industries that tend to have a higher number of women are Real Estate, Rental & Leasing (100.0%), Enterprise Management (100.0%), and Finance & Insurance (89.4%).
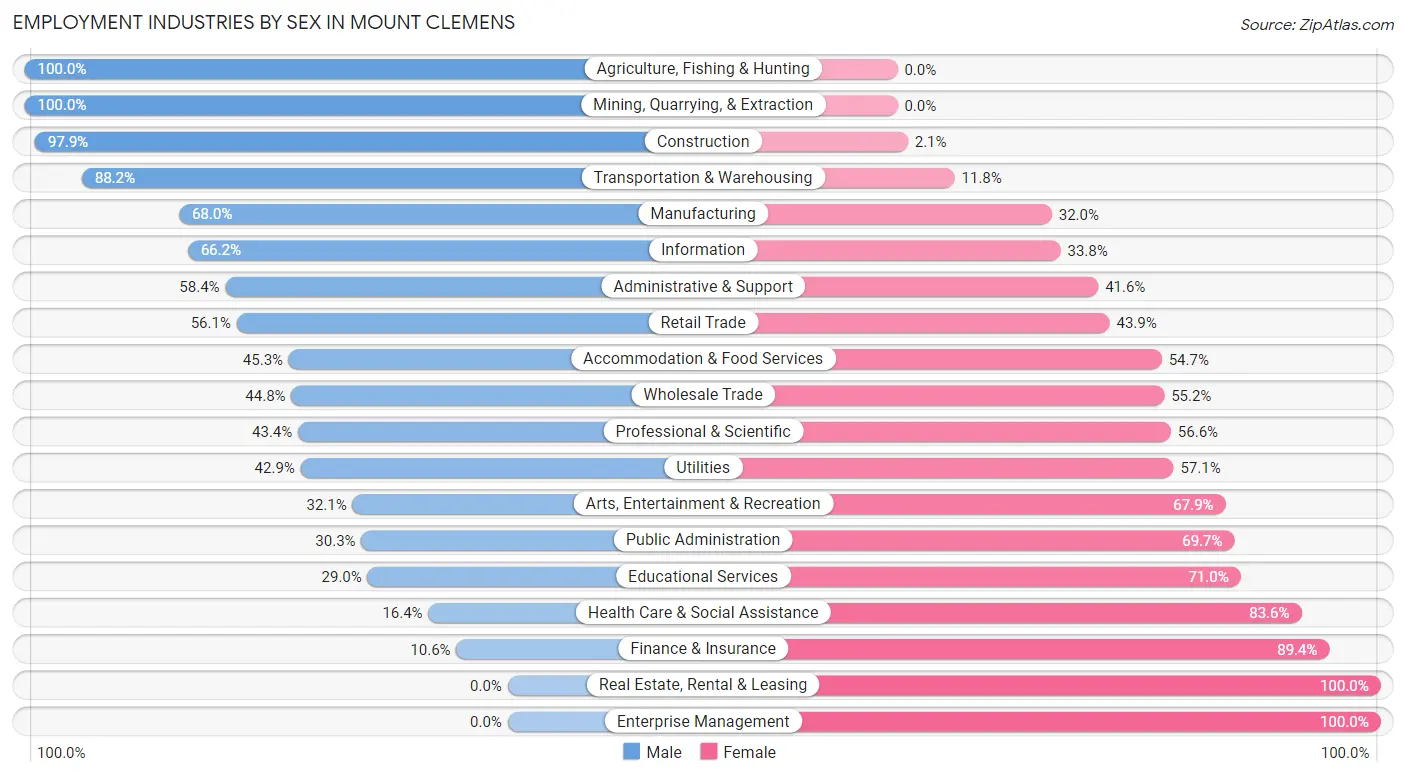
| Industry | Male | Female |
| Agriculture, Fishing & Hunting | 9 (100.0%) | 0 (0.0%) |
| Mining, Quarrying, & Extraction | 6 (100.0%) | 0 (0.0%) |
| Construction | 320 (97.9%) | 7 (2.1%) |
| Manufacturing | 1,075 (68.0%) | 505 (32.0%) |
| Wholesale Trade | 103 (44.8%) | 127 (55.2%) |
| Retail Trade | 428 (56.1%) | 335 (43.9%) |
| Transportation & Warehousing | 283 (88.2%) | 38 (11.8%) |
| Utilities | 12 (42.9%) | 16 (57.1%) |
| Information | 51 (66.2%) | 26 (33.8%) |
| Finance & Insurance | 17 (10.6%) | 143 (89.4%) |
| Real Estate, Rental & Leasing | 0 (0.0%) | 4 (100.0%) |
| Professional & Scientific | 197 (43.4%) | 257 (56.6%) |
| Enterprise Management | 0 (0.0%) | 18 (100.0%) |
| Administrative & Support | 225 (58.4%) | 160 (41.6%) |
| Educational Services | 134 (29.0%) | 328 (71.0%) |
| Health Care & Social Assistance | 172 (16.4%) | 876 (83.6%) |
| Arts, Entertainment & Recreation | 44 (32.1%) | 93 (67.9%) |
| Accommodation & Food Services | 245 (45.3%) | 296 (54.7%) |
| Public Administration | 66 (30.3%) | 152 (69.7%) |
| Total | 3,611 (50.7%) | 3,508 (49.3%) |
Education in Mount Clemens
School Enrollment in Mount Clemens
The most common levels of schooling among the 3,165 students in Mount Clemens are high school (771 | 24.4%), college / undergraduate (676 | 21.4%), and middle school (658 | 20.8%).
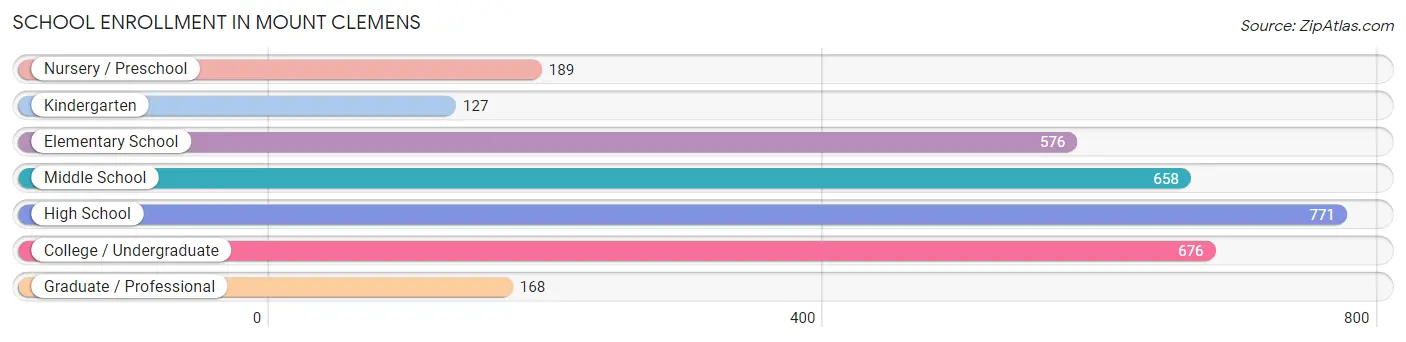
| School Level | # Students | % Students |
| Nursery / Preschool | 189 | 6.0% |
| Kindergarten | 127 | 4.0% |
| Elementary School | 576 | 18.2% |
| Middle School | 658 | 20.8% |
| High School | 771 | 24.4% |
| College / Undergraduate | 676 | 21.4% |
| Graduate / Professional | 168 | 5.3% |
| Total | 3,165 | 100.0% |
School Enrollment by Age by Funding Source in Mount Clemens
Out of a total of 3,165 students who are enrolled in schools in Mount Clemens, 364 (11.5%) attend a private institution, while the remaining 2,801 (88.5%) are enrolled in public schools. The age group of 3 to 4 year olds has the highest likelihood of being enrolled in private schools, with 70 (42.2% in the age bracket) enrolled. Conversely, the age group of 18 to 19 year olds has the lowest likelihood of being enrolled in a private school, with 169 (100.0% in the age bracket) attending a public institution.
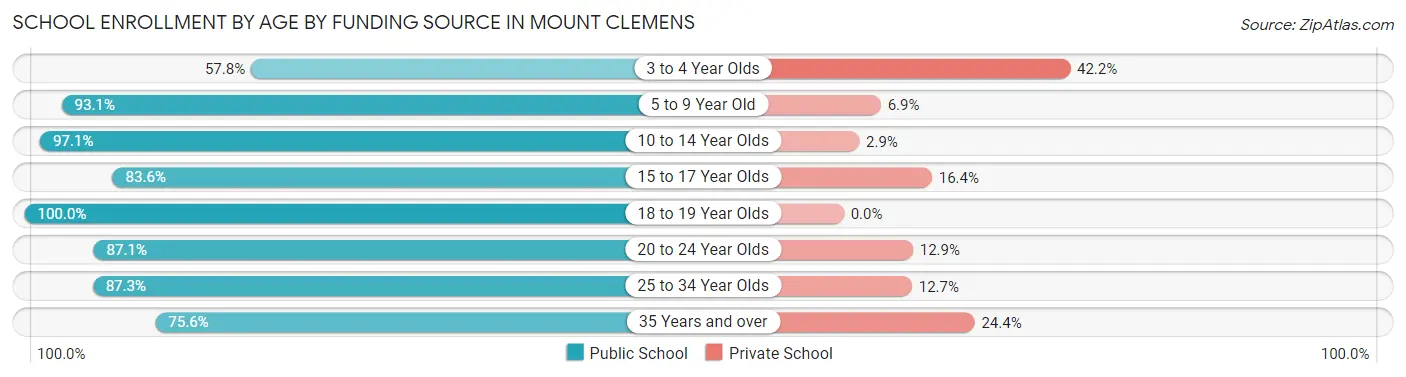
| Age Bracket | Public School | Private School |
| 3 to 4 Year Olds | 96 (57.8%) | 70 (42.2%) |
| 5 to 9 Year Old | 634 (93.1%) | 47 (6.9%) |
| 10 to 14 Year Olds | 778 (97.1%) | 23 (2.9%) |
| 15 to 17 Year Olds | 428 (83.6%) | 84 (16.4%) |
| 18 to 19 Year Olds | 169 (100.0%) | 0 (0.0%) |
| 20 to 24 Year Olds | 149 (87.1%) | 22 (12.9%) |
| 25 to 34 Year Olds | 337 (87.3%) | 49 (12.7%) |
| 35 Years and over | 211 (75.6%) | 68 (24.4%) |
| Total | 2,801 (88.5%) | 364 (11.5%) |
Educational Attainment by Field of Study in Mount Clemens
Business (627 | 31.4%), education (321 | 16.1%), science & technology (298 | 14.9%), arts & humanities (115 | 5.8%), and bio, nature & agricultural (95 | 4.8%) are the most common fields of study among 1,997 individuals in Mount Clemens who have obtained a bachelor's degree or higher.
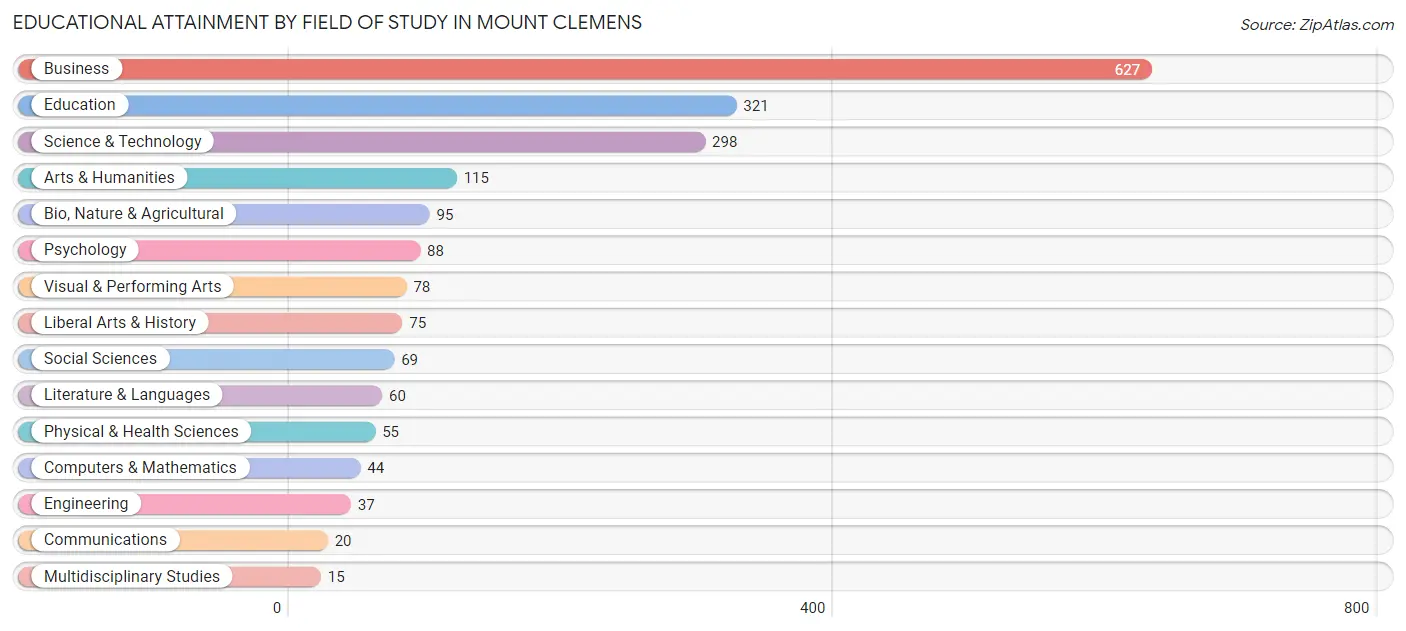
| Field of Study | # Graduates | % Graduates |
| Computers & Mathematics | 44 | 2.2% |
| Bio, Nature & Agricultural | 95 | 4.8% |
| Physical & Health Sciences | 55 | 2.8% |
| Psychology | 88 | 4.4% |
| Social Sciences | 69 | 3.5% |
| Engineering | 37 | 1.8% |
| Multidisciplinary Studies | 15 | 0.7% |
| Science & Technology | 298 | 14.9% |
| Business | 627 | 31.4% |
| Education | 321 | 16.1% |
| Literature & Languages | 60 | 3.0% |
| Liberal Arts & History | 75 | 3.8% |
| Visual & Performing Arts | 78 | 3.9% |
| Communications | 20 | 1.0% |
| Arts & Humanities | 115 | 5.8% |
| Total | 1,997 | 100.0% |
Transportation & Commute in Mount Clemens
Vehicle Availability by Sex in Mount Clemens
The most prevalent vehicle ownership categories in Mount Clemens are males with 2 vehicles (1,542, accounting for 42.9%) and females with 2 vehicles (1,570, making up 45.5%).
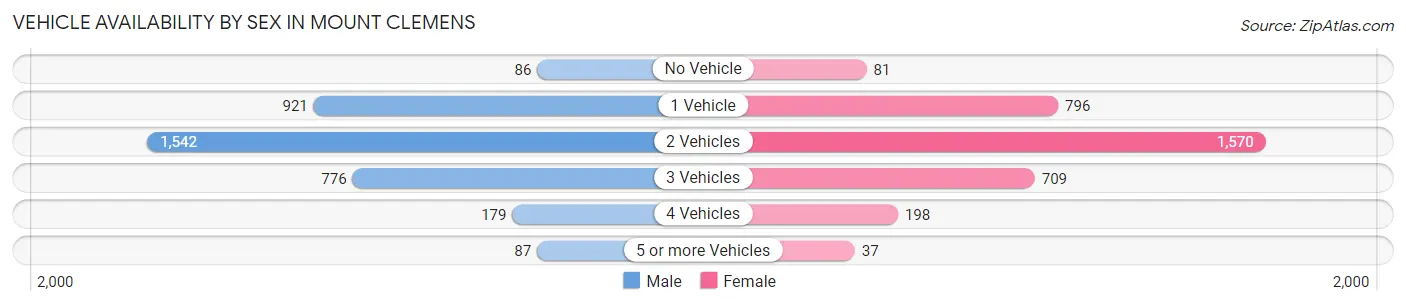
| Vehicles Available | Male | Female |
| No Vehicle | 86 (2.4%) | 81 (2.4%) |
| 1 Vehicle | 921 (25.7%) | 796 (23.5%) |
| 2 Vehicles | 1,542 (42.9%) | 1,570 (46.3%) |
| 3 Vehicles | 776 (21.6%) | 709 (20.9%) |
| 4 Vehicles | 179 (5.0%) | 198 (5.8%) |
| 5 or more Vehicles | 87 (2.4%) | 37 (1.1%) |
| Total | 3,591 (100.0%) | 3,391 (100.0%) |
Commute Time in Mount Clemens
The most frequently occuring commute durations in Mount Clemens are 20 to 24 minutes (1,318 commuters, 19.6%), 10 to 14 minutes (1,023 commuters, 15.2%), and 30 to 34 minutes (980 commuters, 14.5%).
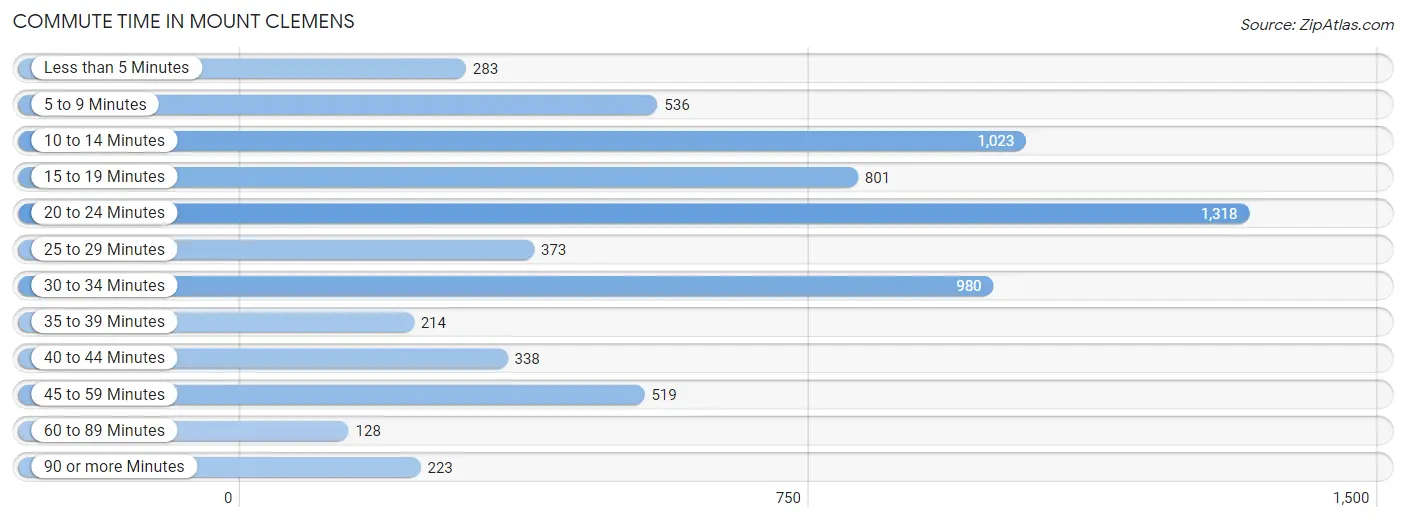
| Commute Time | # Commuters | % Commuters |
| Less than 5 Minutes | 283 | 4.2% |
| 5 to 9 Minutes | 536 | 8.0% |
| 10 to 14 Minutes | 1,023 | 15.2% |
| 15 to 19 Minutes | 801 | 11.9% |
| 20 to 24 Minutes | 1,318 | 19.6% |
| 25 to 29 Minutes | 373 | 5.5% |
| 30 to 34 Minutes | 980 | 14.5% |
| 35 to 39 Minutes | 214 | 3.2% |
| 40 to 44 Minutes | 338 | 5.0% |
| 45 to 59 Minutes | 519 | 7.7% |
| 60 to 89 Minutes | 128 | 1.9% |
| 90 or more Minutes | 223 | 3.3% |
Commute Time by Sex in Mount Clemens
The most common commute times in Mount Clemens are 10 to 14 minutes (673 commuters, 19.1%) for males and 20 to 24 minutes (698 commuters, 21.8%) for females.
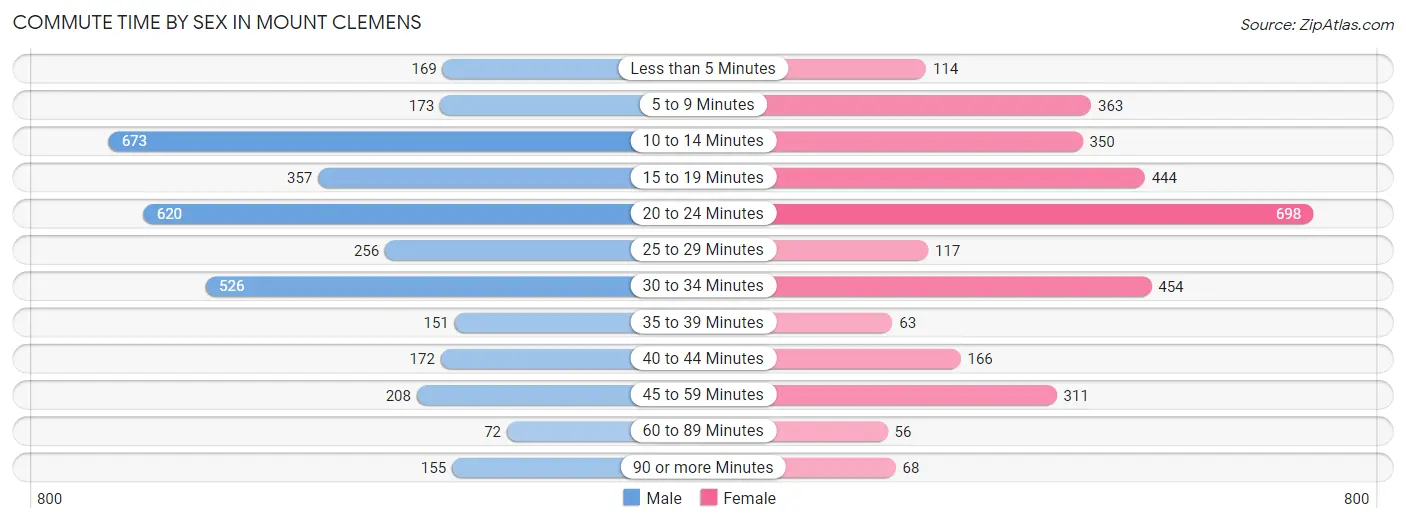
| Commute Time | Male | Female |
| Less than 5 Minutes | 169 (4.8%) | 114 (3.6%) |
| 5 to 9 Minutes | 173 (4.9%) | 363 (11.3%) |
| 10 to 14 Minutes | 673 (19.1%) | 350 (10.9%) |
| 15 to 19 Minutes | 357 (10.1%) | 444 (13.9%) |
| 20 to 24 Minutes | 620 (17.5%) | 698 (21.8%) |
| 25 to 29 Minutes | 256 (7.2%) | 117 (3.6%) |
| 30 to 34 Minutes | 526 (14.9%) | 454 (14.2%) |
| 35 to 39 Minutes | 151 (4.3%) | 63 (2.0%) |
| 40 to 44 Minutes | 172 (4.9%) | 166 (5.2%) |
| 45 to 59 Minutes | 208 (5.9%) | 311 (9.7%) |
| 60 to 89 Minutes | 72 (2.0%) | 56 (1.8%) |
| 90 or more Minutes | 155 (4.4%) | 68 (2.1%) |
Time of Departure to Work by Sex in Mount Clemens
The most frequent times of departure to work in Mount Clemens are 6:00 AM to 6:29 AM (526, 14.9%) for males and 6:30 AM to 6:59 AM (495, 15.4%) for females.
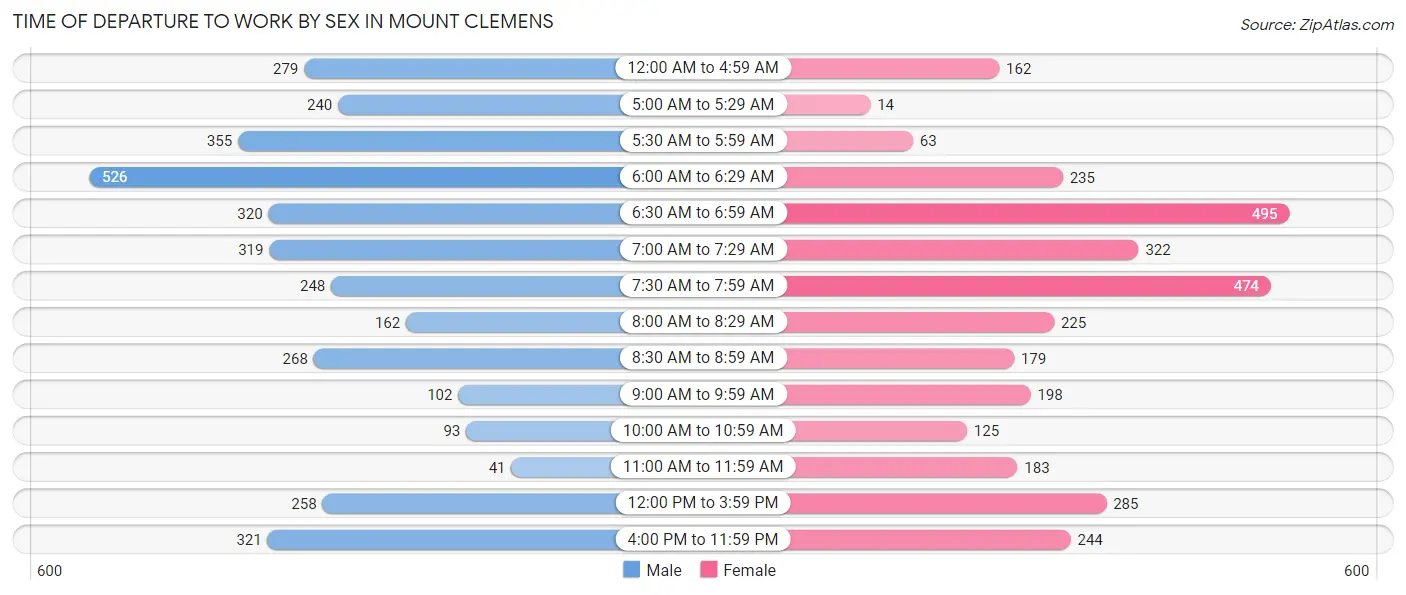
| Time of Departure | Male | Female |
| 12:00 AM to 4:59 AM | 279 (7.9%) | 162 (5.1%) |
| 5:00 AM to 5:29 AM | 240 (6.8%) | 14 (0.4%) |
| 5:30 AM to 5:59 AM | 355 (10.1%) | 63 (2.0%) |
| 6:00 AM to 6:29 AM | 526 (14.9%) | 235 (7.3%) |
| 6:30 AM to 6:59 AM | 320 (9.1%) | 495 (15.4%) |
| 7:00 AM to 7:29 AM | 319 (9.0%) | 322 (10.1%) |
| 7:30 AM to 7:59 AM | 248 (7.0%) | 474 (14.8%) |
| 8:00 AM to 8:29 AM | 162 (4.6%) | 225 (7.0%) |
| 8:30 AM to 8:59 AM | 268 (7.6%) | 179 (5.6%) |
| 9:00 AM to 9:59 AM | 102 (2.9%) | 198 (6.2%) |
| 10:00 AM to 10:59 AM | 93 (2.6%) | 125 (3.9%) |
| 11:00 AM to 11:59 AM | 41 (1.2%) | 183 (5.7%) |
| 12:00 PM to 3:59 PM | 258 (7.3%) | 285 (8.9%) |
| 4:00 PM to 11:59 PM | 321 (9.1%) | 244 (7.6%) |
| Total | 3,532 (100.0%) | 3,204 (100.0%) |
Housing Occupancy in Mount Clemens
Occupancy by Ownership in Mount Clemens
Of the total 6,583 dwellings in Mount Clemens, owner-occupied units account for 3,917 (59.5%), while renter-occupied units make up 2,666 (40.5%).
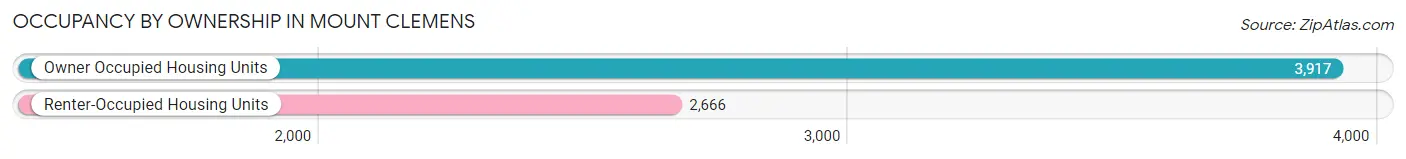
| Occupancy | # Housing Units | % Housing Units |
| Owner Occupied Housing Units | 3,917 | 59.5% |
| Renter-Occupied Housing Units | 2,666 | 40.5% |
| Total Occupied Housing Units | 6,583 | 100.0% |
Occupancy by Household Size in Mount Clemens
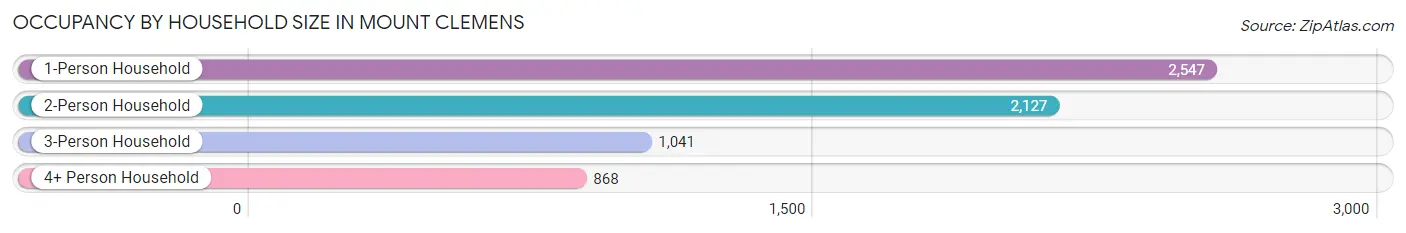
| Household Size | # Housing Units | % Housing Units |
| 1-Person Household | 2,547 | 38.7% |
| 2-Person Household | 2,127 | 32.3% |
| 3-Person Household | 1,041 | 15.8% |
| 4+ Person Household | 868 | 13.2% |
| Total Housing Units | 6,583 | 100.0% |
Occupancy by Ownership by Household Size in Mount Clemens
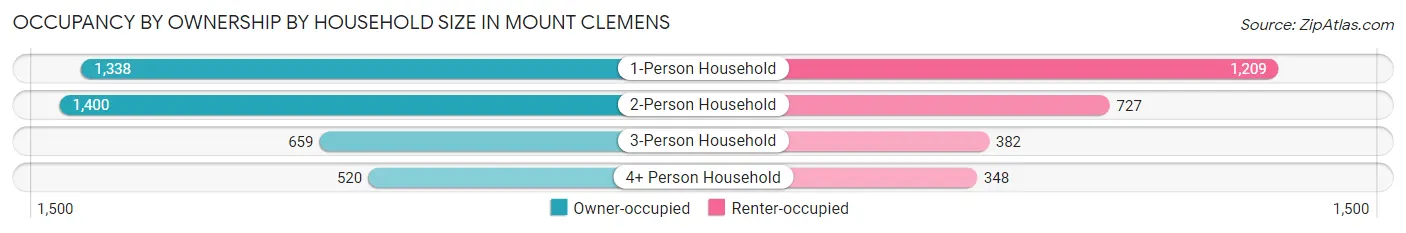
| Household Size | Owner-occupied | Renter-occupied |
| 1-Person Household | 1,338 (52.5%) | 1,209 (47.5%) |
| 2-Person Household | 1,400 (65.8%) | 727 (34.2%) |
| 3-Person Household | 659 (63.3%) | 382 (36.7%) |
| 4+ Person Household | 520 (59.9%) | 348 (40.1%) |
| Total Housing Units | 3,917 (59.5%) | 2,666 (40.5%) |
Occupancy by Educational Attainment in Mount Clemens
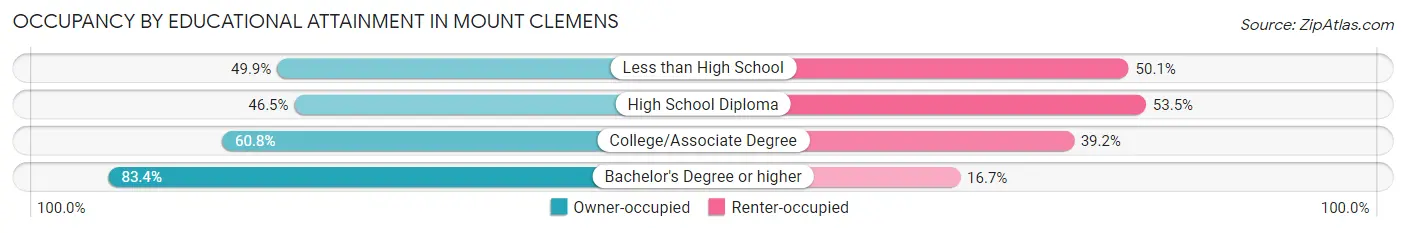
| Household Size | Owner-occupied | Renter-occupied |
| Less than High School | 404 (49.9%) | 405 (50.1%) |
| High School Diploma | 895 (46.5%) | 1,029 (53.5%) |
| College/Associate Degree | 1,597 (60.8%) | 1,028 (39.2%) |
| Bachelor's Degree or higher | 1,021 (83.4%) | 204 (16.7%) |
Occupancy by Age of Householder in Mount Clemens
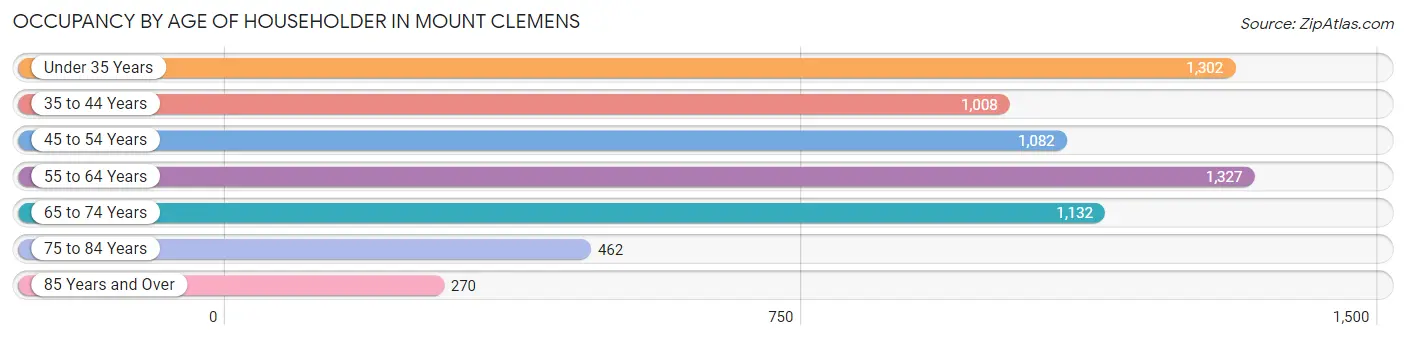
| Age Bracket | # Households | % Households |
| Under 35 Years | 1,302 | 19.8% |
| 35 to 44 Years | 1,008 | 15.3% |
| 45 to 54 Years | 1,082 | 16.4% |
| 55 to 64 Years | 1,327 | 20.2% |
| 65 to 74 Years | 1,132 | 17.2% |
| 75 to 84 Years | 462 | 7.0% |
| 85 Years and Over | 270 | 4.1% |
| Total | 6,583 | 100.0% |
Housing Finances in Mount Clemens
Median Income by Occupancy in Mount Clemens
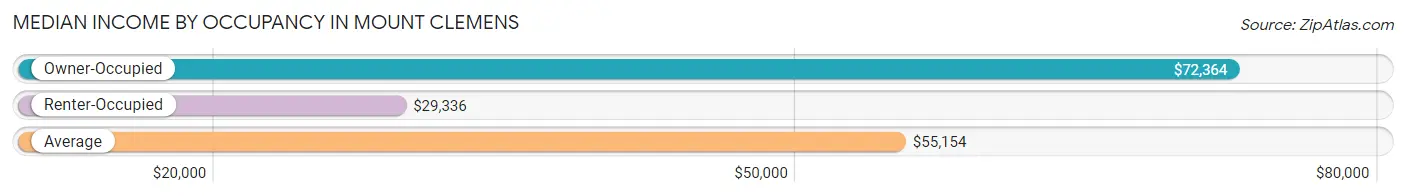
| Occupancy Type | # Households | Median Income |
| Owner-Occupied | 3,917 (59.5%) | $72,364 |
| Renter-Occupied | 2,666 (40.5%) | $29,336 |
| Average | 6,583 (100.0%) | $55,154 |
Occupancy by Householder Income Bracket in Mount Clemens
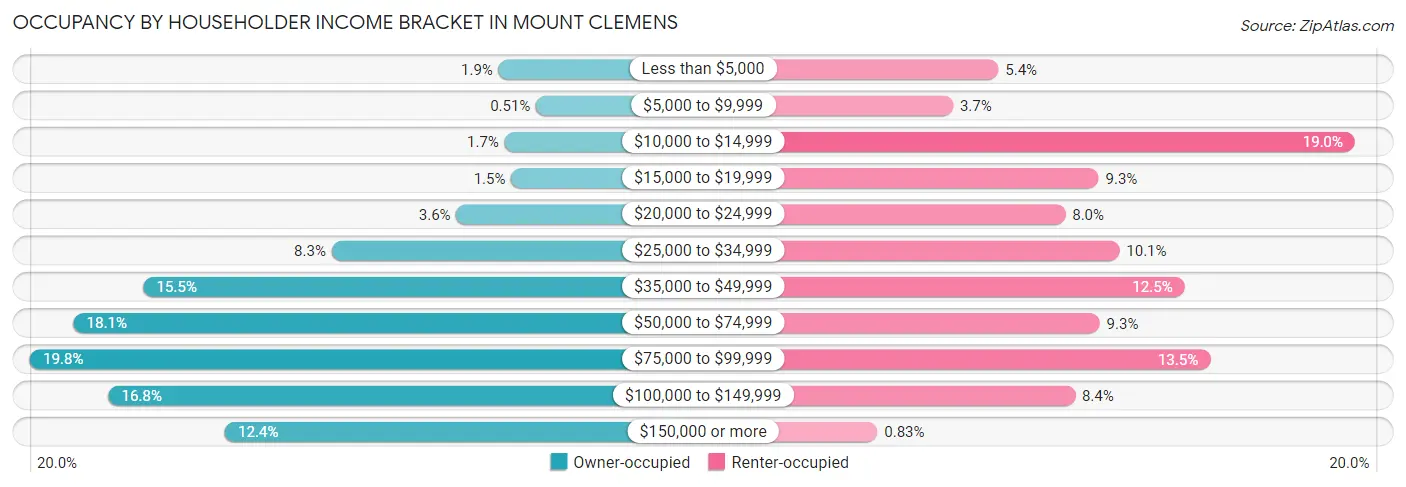
| Income Bracket | Owner-occupied | Renter-occupied |
| Less than $5,000 | 76 (1.9%) | 145 (5.4%) |
| $5,000 to $9,999 | 20 (0.5%) | 99 (3.7%) |
| $10,000 to $14,999 | 67 (1.7%) | 507 (19.0%) |
| $15,000 to $19,999 | 57 (1.5%) | 247 (9.3%) |
| $20,000 to $24,999 | 139 (3.5%) | 213 (8.0%) |
| $25,000 to $34,999 | 325 (8.3%) | 268 (10.1%) |
| $35,000 to $49,999 | 606 (15.5%) | 334 (12.5%) |
| $50,000 to $74,999 | 710 (18.1%) | 248 (9.3%) |
| $75,000 to $99,999 | 775 (19.8%) | 360 (13.5%) |
| $100,000 to $149,999 | 658 (16.8%) | 223 (8.4%) |
| $150,000 or more | 484 (12.4%) | 22 (0.8%) |
| Total | 3,917 (100.0%) | 2,666 (100.0%) |
Monthly Housing Cost Tiers in Mount Clemens
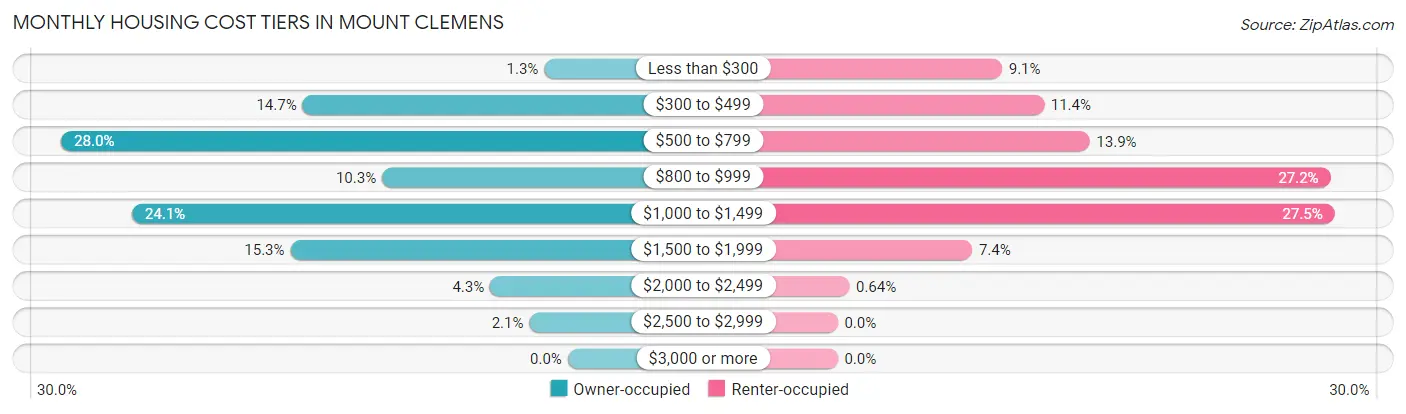
| Monthly Cost | Owner-occupied | Renter-occupied |
| Less than $300 | 51 (1.3%) | 242 (9.1%) |
| $300 to $499 | 574 (14.6%) | 304 (11.4%) |
| $500 to $799 | 1,096 (28.0%) | 371 (13.9%) |
| $800 to $999 | 402 (10.3%) | 726 (27.2%) |
| $1,000 to $1,499 | 943 (24.1%) | 732 (27.5%) |
| $1,500 to $1,999 | 600 (15.3%) | 198 (7.4%) |
| $2,000 to $2,499 | 168 (4.3%) | 17 (0.6%) |
| $2,500 to $2,999 | 83 (2.1%) | 0 (0.0%) |
| $3,000 or more | 0 (0.0%) | 0 (0.0%) |
| Total | 3,917 (100.0%) | 2,666 (100.0%) |
Physical Housing Characteristics in Mount Clemens
Housing Structures in Mount Clemens
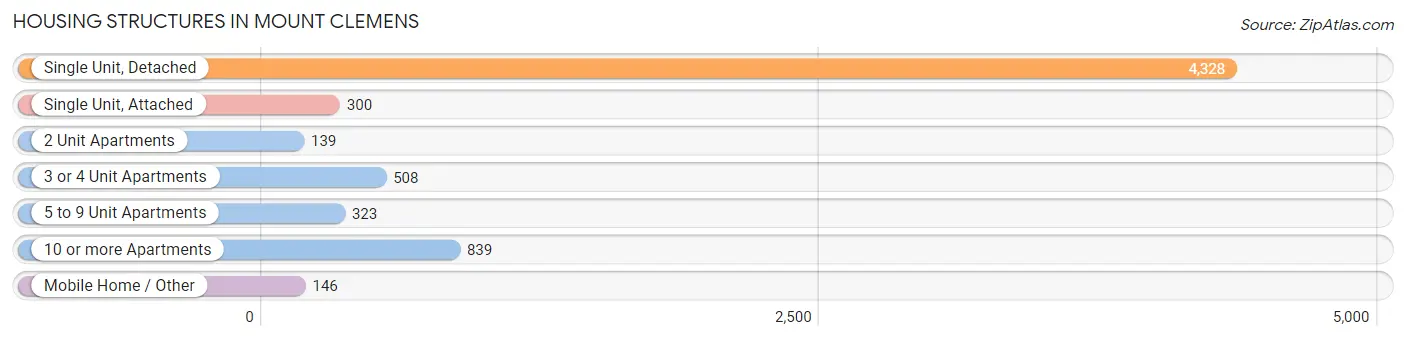
| Structure Type | # Housing Units | % Housing Units |
| Single Unit, Detached | 4,328 | 65.7% |
| Single Unit, Attached | 300 | 4.6% |
| 2 Unit Apartments | 139 | 2.1% |
| 3 or 4 Unit Apartments | 508 | 7.7% |
| 5 to 9 Unit Apartments | 323 | 4.9% |
| 10 or more Apartments | 839 | 12.7% |
| Mobile Home / Other | 146 | 2.2% |
| Total | 6,583 | 100.0% |
Housing Structures by Occupancy in Mount Clemens
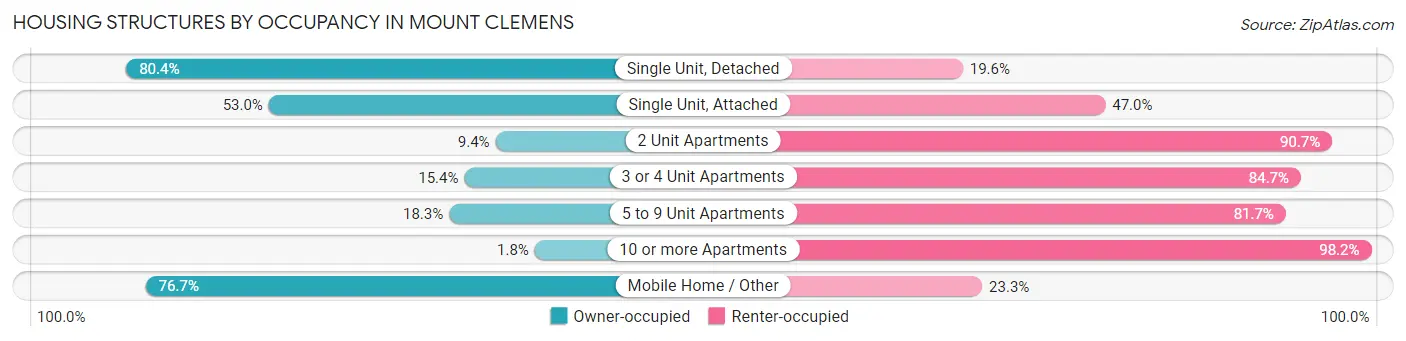
| Structure Type | Owner-occupied | Renter-occupied |
| Single Unit, Detached | 3,481 (80.4%) | 847 (19.6%) |
| Single Unit, Attached | 159 (53.0%) | 141 (47.0%) |
| 2 Unit Apartments | 13 (9.3%) | 126 (90.6%) |
| 3 or 4 Unit Apartments | 78 (15.3%) | 430 (84.7%) |
| 5 to 9 Unit Apartments | 59 (18.3%) | 264 (81.7%) |
| 10 or more Apartments | 15 (1.8%) | 824 (98.2%) |
| Mobile Home / Other | 112 (76.7%) | 34 (23.3%) |
| Total | 3,917 (59.5%) | 2,666 (40.5%) |
Housing Structures by Number of Rooms in Mount Clemens
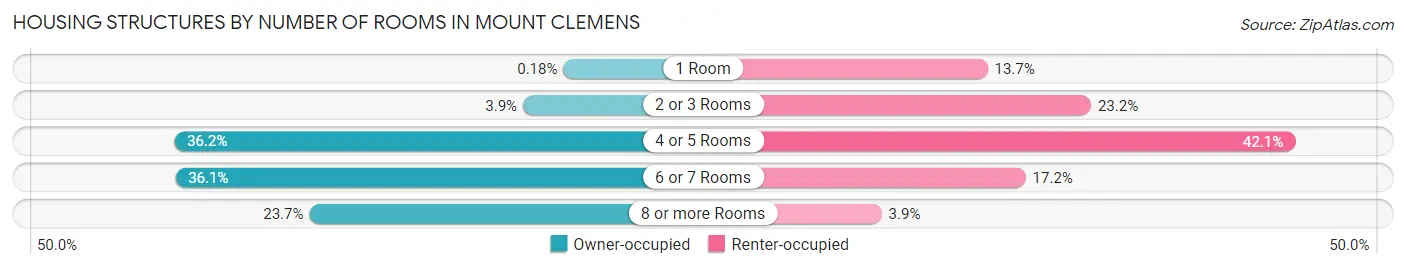
| Number of Rooms | Owner-occupied | Renter-occupied |
| 1 Room | 7 (0.2%) | 364 (13.7%) |
| 2 or 3 Rooms | 153 (3.9%) | 619 (23.2%) |
| 4 or 5 Rooms | 1,417 (36.2%) | 1,122 (42.1%) |
| 6 or 7 Rooms | 1,413 (36.1%) | 458 (17.2%) |
| 8 or more Rooms | 927 (23.7%) | 103 (3.9%) |
| Total | 3,917 (100.0%) | 2,666 (100.0%) |
Housing Structure by Heating Type in Mount Clemens
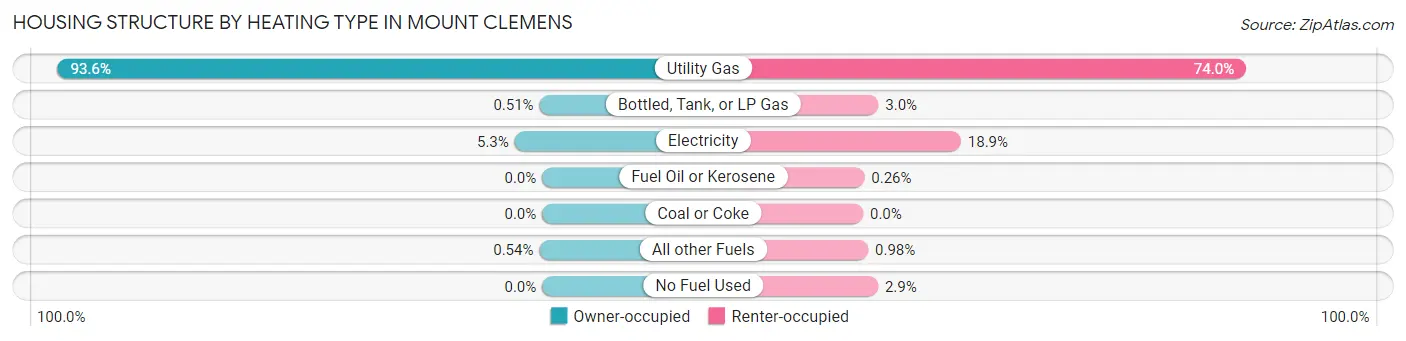
| Heating Type | Owner-occupied | Renter-occupied |
| Utility Gas | 3,668 (93.6%) | 1,973 (74.0%) |
| Bottled, Tank, or LP Gas | 20 (0.5%) | 79 (3.0%) |
| Electricity | 208 (5.3%) | 504 (18.9%) |
| Fuel Oil or Kerosene | 0 (0.0%) | 7 (0.3%) |
| Coal or Coke | 0 (0.0%) | 0 (0.0%) |
| All other Fuels | 21 (0.5%) | 26 (1.0%) |
| No Fuel Used | 0 (0.0%) | 77 (2.9%) |
| Total | 3,917 (100.0%) | 2,666 (100.0%) |
Household Vehicle Usage in Mount Clemens
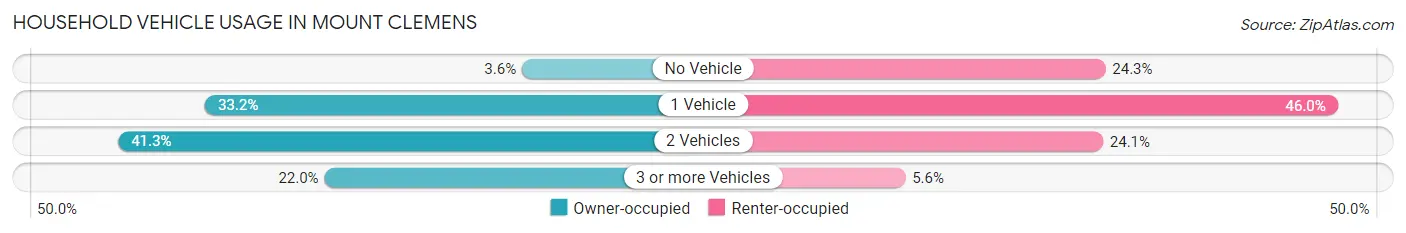
| Vehicles per Household | Owner-occupied | Renter-occupied |
| No Vehicle | 140 (3.6%) | 648 (24.3%) |
| 1 Vehicle | 1,299 (33.2%) | 1,226 (46.0%) |
| 2 Vehicles | 1,616 (41.3%) | 642 (24.1%) |
| 3 or more Vehicles | 862 (22.0%) | 150 (5.6%) |
| Total | 3,917 (100.0%) | 2,666 (100.0%) |
Real Estate & Mortgages in Mount Clemens
Real Estate and Mortgage Overview in Mount Clemens
| Characteristic | Without Mortgage | With Mortgage |
| Housing Units | 1,545 | 2,372 |
| Median Property Value | $151,800 | $150,000 |
| Median Household Income | $47,094 | $337 |
| Monthly Housing Costs | $542 | $0 |
| Real Estate Taxes | $2,629 | $130 |
Property Value by Mortgage Status in Mount Clemens
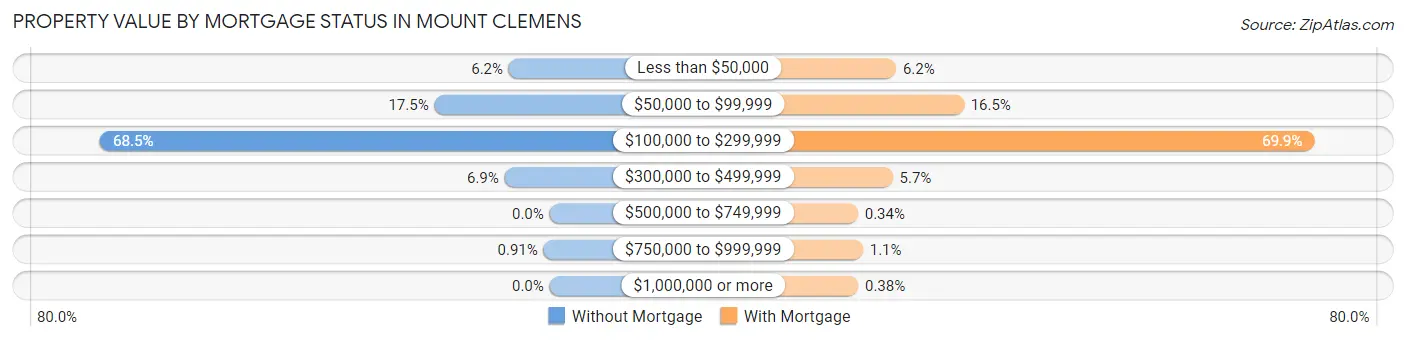
| Property Value | Without Mortgage | With Mortgage |
| Less than $50,000 | 96 (6.2%) | 146 (6.2%) |
| $50,000 to $99,999 | 271 (17.5%) | 391 (16.5%) |
| $100,000 to $299,999 | 1,058 (68.5%) | 1,658 (69.9%) |
| $300,000 to $499,999 | 106 (6.9%) | 134 (5.7%) |
| $500,000 to $749,999 | 0 (0.0%) | 8 (0.3%) |
| $750,000 to $999,999 | 14 (0.9%) | 26 (1.1%) |
| $1,000,000 or more | 0 (0.0%) | 9 (0.4%) |
| Total | 1,545 (100.0%) | 2,372 (100.0%) |
Household Income by Mortgage Status in Mount Clemens
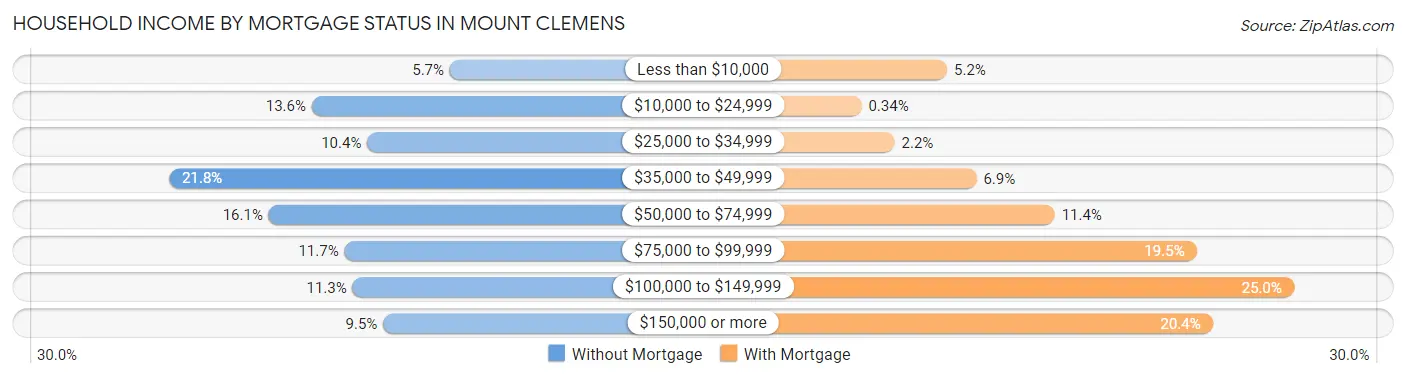
| Household Income | Without Mortgage | With Mortgage |
| Less than $10,000 | 88 (5.7%) | 124 (5.2%) |
| $10,000 to $24,999 | 210 (13.6%) | 8 (0.3%) |
| $25,000 to $34,999 | 161 (10.4%) | 53 (2.2%) |
| $35,000 to $49,999 | 336 (21.7%) | 164 (6.9%) |
| $50,000 to $74,999 | 248 (16.1%) | 270 (11.4%) |
| $75,000 to $99,999 | 181 (11.7%) | 462 (19.5%) |
| $100,000 to $149,999 | 174 (11.3%) | 594 (25.0%) |
| $150,000 or more | 147 (9.5%) | 484 (20.4%) |
| Total | 1,545 (100.0%) | 2,372 (100.0%) |
Property Value to Household Income Ratio in Mount Clemens
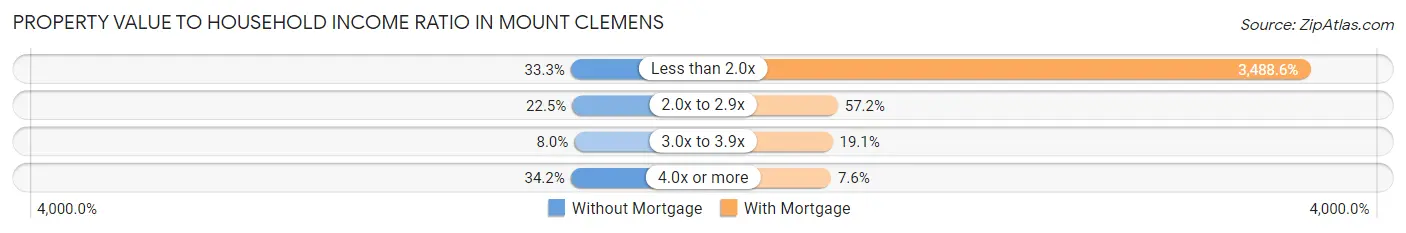
| Value-to-Income Ratio | Without Mortgage | With Mortgage |
| Less than 2.0x | 515 (33.3%) | 82,750 (3,488.6%) |
| 2.0x to 2.9x | 347 (22.5%) | 1,356 (57.2%) |
| 3.0x to 3.9x | 123 (8.0%) | 453 (19.1%) |
| 4.0x or more | 528 (34.2%) | 181 (7.6%) |
| Total | 1,545 (100.0%) | 2,372 (100.0%) |
Real Estate Taxes by Mortgage Status in Mount Clemens
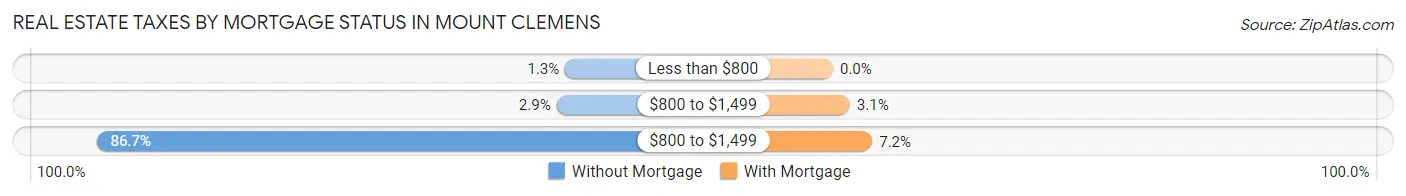
| Property Taxes | Without Mortgage | With Mortgage |
| Less than $800 | 20 (1.3%) | 0 (0.0%) |
| $800 to $1,499 | 44 (2.9%) | 73 (3.1%) |
| $800 to $1,499 | 1,339 (86.7%) | 170 (7.2%) |
| Total | 1,545 (100.0%) | 2,372 (100.0%) |
Health & Disability in Mount Clemens
Health Insurance Coverage by Age in Mount Clemens
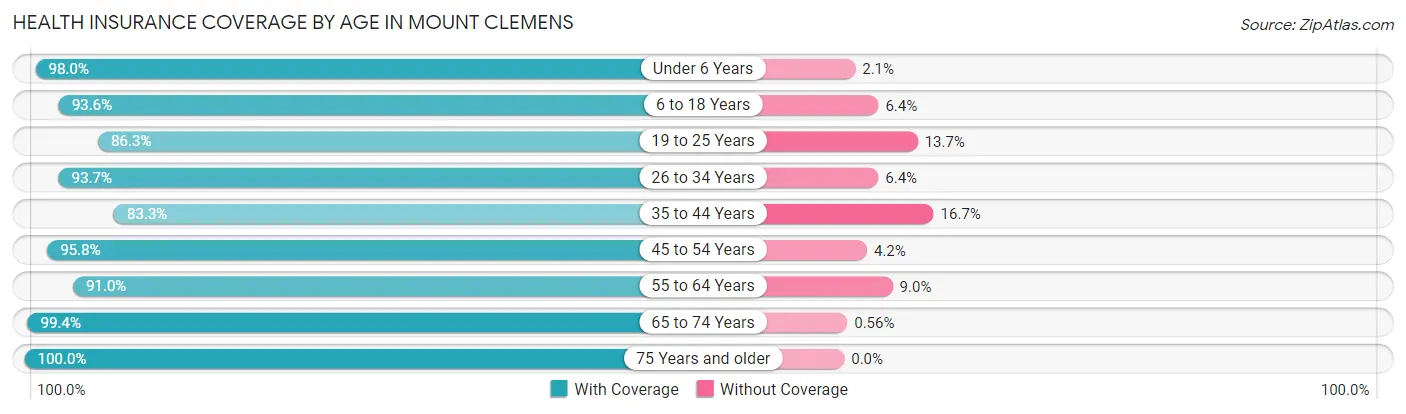
| Age Bracket | With Coverage | Without Coverage |
| Under 6 Years | 909 (98.0%) | 19 (2.1%) |
| 6 to 18 Years | 2,042 (93.6%) | 139 (6.4%) |
| 19 to 25 Years | 1,047 (86.3%) | 166 (13.7%) |
| 26 to 34 Years | 1,681 (93.6%) | 114 (6.4%) |
| 35 to 44 Years | 1,551 (83.3%) | 310 (16.7%) |
| 45 to 54 Years | 1,768 (95.8%) | 78 (4.2%) |
| 55 to 64 Years | 2,008 (91.0%) | 199 (9.0%) |
| 65 to 74 Years | 1,432 (99.4%) | 8 (0.6%) |
| 75 Years and older | 869 (100.0%) | 0 (0.0%) |
| Total | 13,307 (92.8%) | 1,033 (7.2%) |
Health Insurance Coverage by Citizenship Status in Mount Clemens
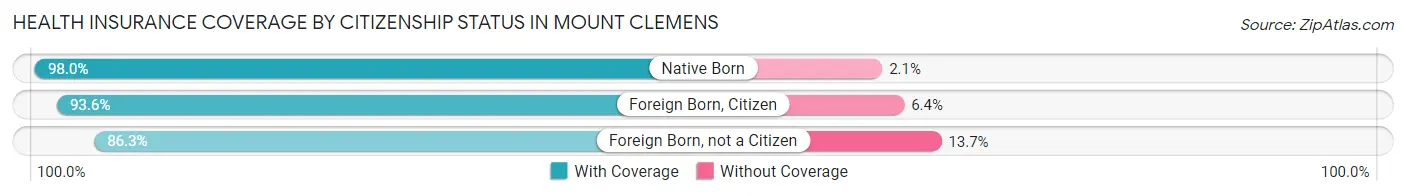
| Citizenship Status | With Coverage | Without Coverage |
| Native Born | 909 (98.0%) | 19 (2.1%) |
| Foreign Born, Citizen | 2,042 (93.6%) | 139 (6.4%) |
| Foreign Born, not a Citizen | 1,047 (86.3%) | 166 (13.7%) |
Health Insurance Coverage by Household Income in Mount Clemens
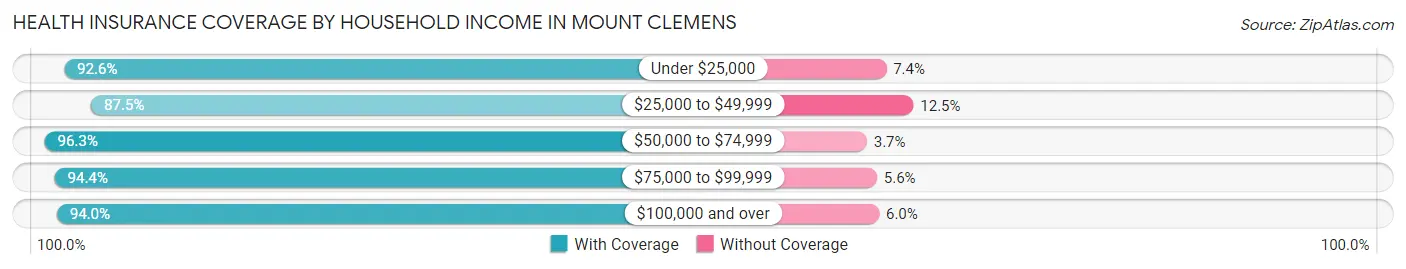
| Household Income | With Coverage | Without Coverage |
| Under $25,000 | 2,193 (92.6%) | 175 (7.4%) |
| $25,000 to $49,999 | 2,668 (87.5%) | 380 (12.5%) |
| $50,000 to $74,999 | 2,162 (96.3%) | 84 (3.7%) |
| $75,000 to $99,999 | 2,448 (94.4%) | 146 (5.6%) |
| $100,000 and over | 3,716 (94.0%) | 239 (6.0%) |
Public vs Private Health Insurance Coverage by Age in Mount Clemens
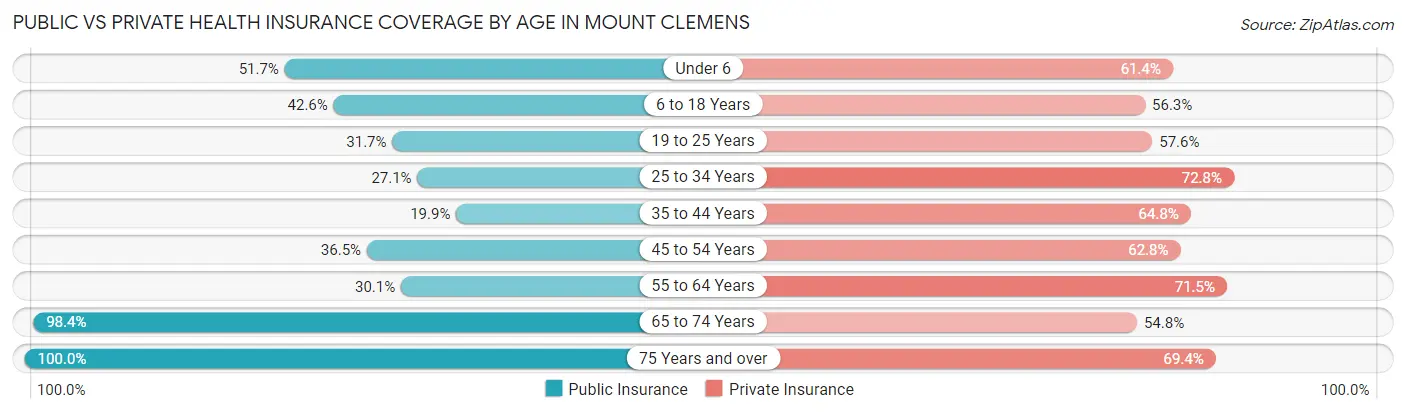
| Age Bracket | Public Insurance | Private Insurance |
| Under 6 | 480 (51.7%) | 570 (61.4%) |
| 6 to 18 Years | 930 (42.6%) | 1,228 (56.3%) |
| 19 to 25 Years | 385 (31.7%) | 699 (57.6%) |
| 25 to 34 Years | 486 (27.1%) | 1,306 (72.8%) |
| 35 to 44 Years | 370 (19.9%) | 1,205 (64.7%) |
| 45 to 54 Years | 673 (36.5%) | 1,160 (62.8%) |
| 55 to 64 Years | 665 (30.1%) | 1,577 (71.5%) |
| 65 to 74 Years | 1,417 (98.4%) | 789 (54.8%) |
| 75 Years and over | 869 (100.0%) | 603 (69.4%) |
| Total | 6,275 (43.8%) | 9,137 (63.7%) |
Disability Status by Sex by Age in Mount Clemens
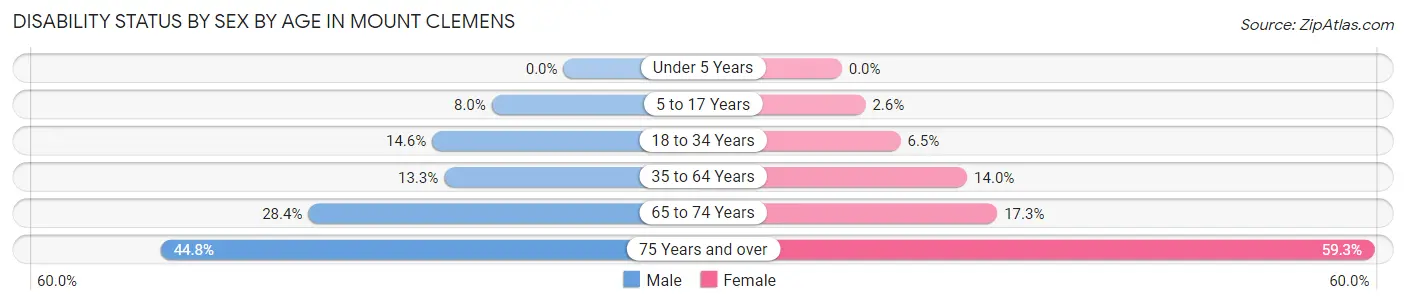
| Age Bracket | Male | Female |
| Under 5 Years | 0 (0.0%) | 0 (0.0%) |
| 5 to 17 Years | 88 (8.0%) | 26 (2.6%) |
| 18 to 34 Years | 211 (14.6%) | 117 (6.5%) |
| 35 to 64 Years | 409 (13.3%) | 396 (14.0%) |
| 65 to 74 Years | 181 (28.4%) | 139 (17.3%) |
| 75 Years and over | 152 (44.8%) | 314 (59.3%) |
Disability Class by Sex by Age in Mount Clemens
Disability Class: Hearing Difficulty
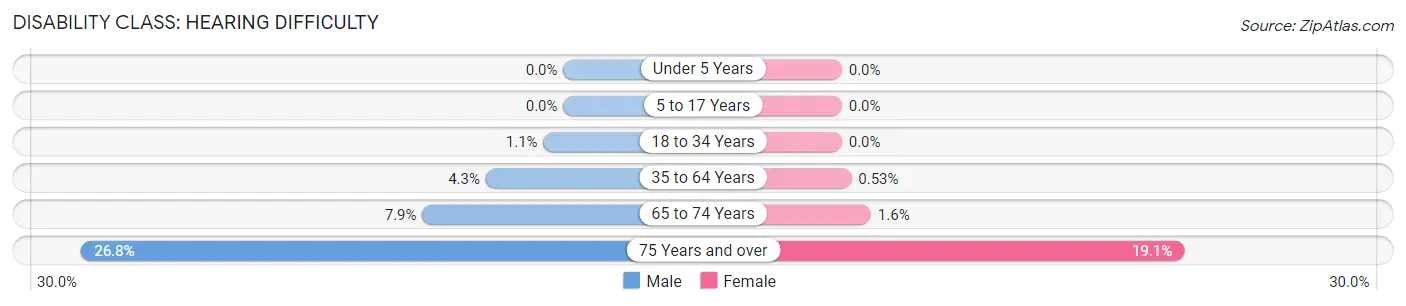
| Age Bracket | Male | Female |
| Under 5 Years | 0 (0.0%) | 0 (0.0%) |
| 5 to 17 Years | 0 (0.0%) | 0 (0.0%) |
| 18 to 34 Years | 16 (1.1%) | 0 (0.0%) |
| 35 to 64 Years | 133 (4.3%) | 15 (0.5%) |
| 65 to 74 Years | 50 (7.9%) | 13 (1.6%) |
| 75 Years and over | 91 (26.8%) | 101 (19.1%) |
Disability Class: Vision Difficulty
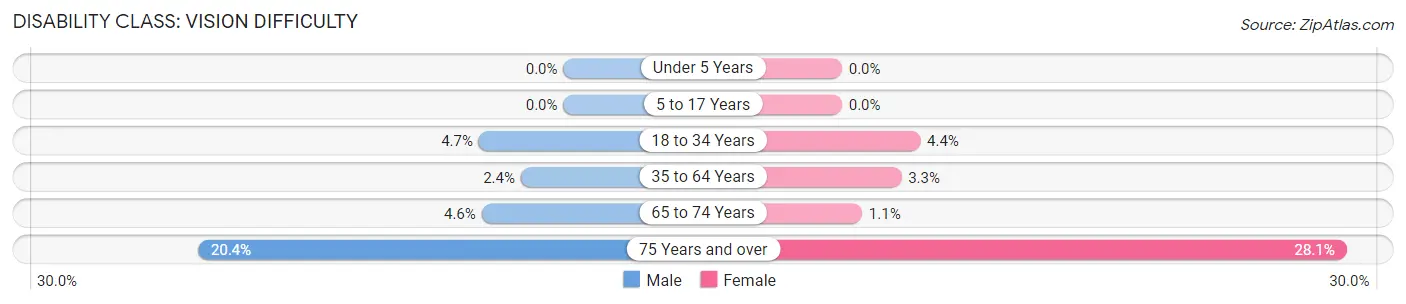
| Age Bracket | Male | Female |
| Under 5 Years | 0 (0.0%) | 0 (0.0%) |
| 5 to 17 Years | 0 (0.0%) | 0 (0.0%) |
| 18 to 34 Years | 68 (4.7%) | 78 (4.4%) |
| 35 to 64 Years | 73 (2.4%) | 94 (3.3%) |
| 65 to 74 Years | 29 (4.5%) | 9 (1.1%) |
| 75 Years and over | 69 (20.3%) | 149 (28.1%) |
Disability Class: Cognitive Difficulty
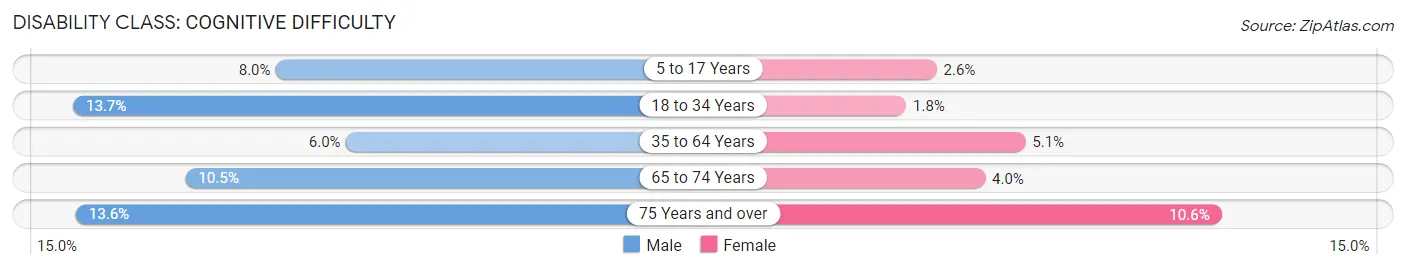
| Age Bracket | Male | Female |
| 5 to 17 Years | 88 (8.0%) | 26 (2.6%) |
| 18 to 34 Years | 197 (13.7%) | 32 (1.8%) |
| 35 to 64 Years | 186 (6.0%) | 145 (5.1%) |
| 65 to 74 Years | 67 (10.5%) | 32 (4.0%) |
| 75 Years and over | 46 (13.6%) | 56 (10.6%) |
Disability Class: Ambulatory Difficulty
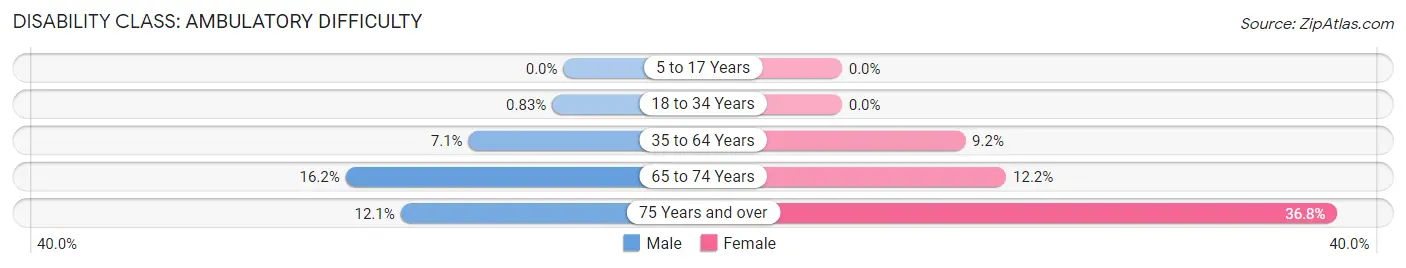
| Age Bracket | Male | Female |
| 5 to 17 Years | 0 (0.0%) | 0 (0.0%) |
| 18 to 34 Years | 12 (0.8%) | 0 (0.0%) |
| 35 to 64 Years | 217 (7.0%) | 260 (9.2%) |
| 65 to 74 Years | 103 (16.2%) | 98 (12.2%) |
| 75 Years and over | 41 (12.1%) | 195 (36.8%) |
Disability Class: Self-Care Difficulty
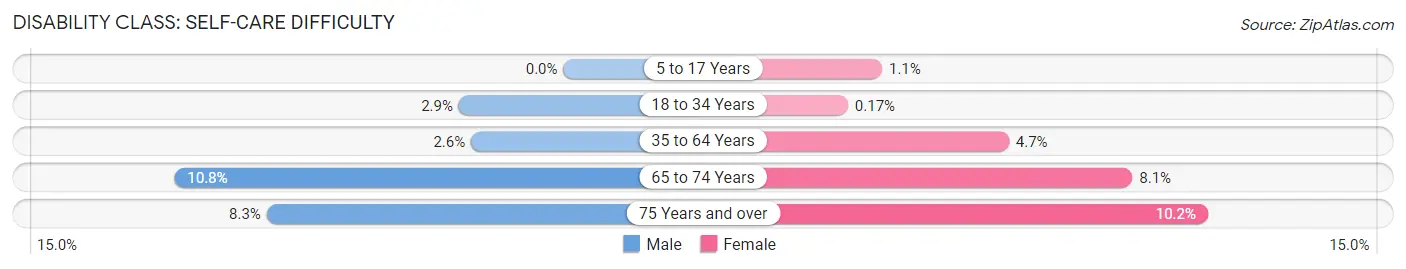
| Age Bracket | Male | Female |
| 5 to 17 Years | 0 (0.0%) | 11 (1.1%) |
| 18 to 34 Years | 42 (2.9%) | 3 (0.2%) |
| 35 to 64 Years | 79 (2.6%) | 132 (4.6%) |
| 65 to 74 Years | 69 (10.8%) | 65 (8.1%) |
| 75 Years and over | 28 (8.3%) | 54 (10.2%) |
Technology Access in Mount Clemens
Computing Device Access in Mount Clemens
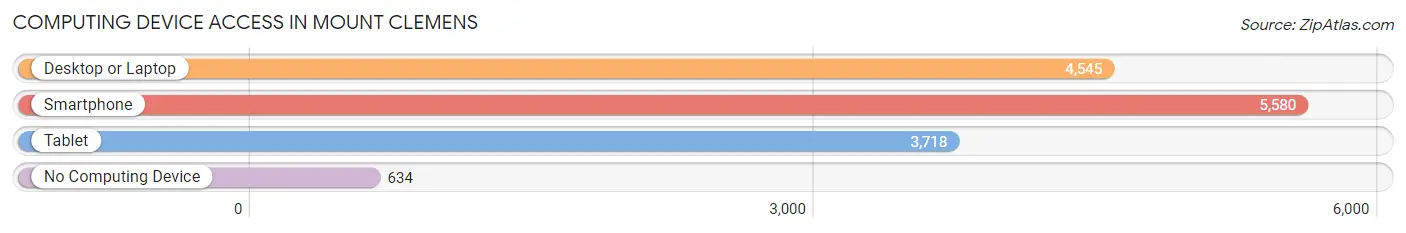
| Device Type | # Households | % Households |
| Desktop or Laptop | 4,545 | 69.0% |
| Smartphone | 5,580 | 84.8% |
| Tablet | 3,718 | 56.5% |
| No Computing Device | 634 | 9.6% |
| Total | 6,583 | 100.0% |
Internet Access in Mount Clemens
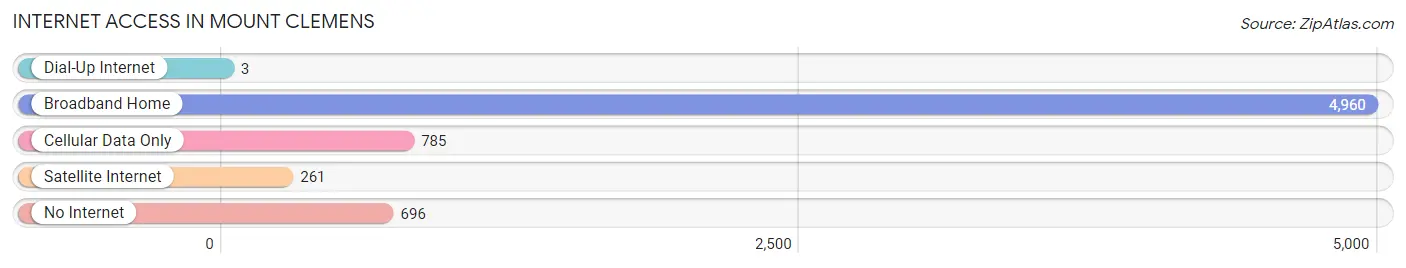
| Internet Type | # Households | % Households |
| Dial-Up Internet | 3 | 0.1% |
| Broadband Home | 4,960 | 75.3% |
| Cellular Data Only | 785 | 11.9% |
| Satellite Internet | 261 | 4.0% |
| No Internet | 696 | 10.6% |
| Total | 6,583 | 100.0% |
Mount Clemens Summary
Mount Clemens is a city located in Macomb County, Michigan. It is the county seat of Macomb County and is located about 20 miles northeast of Detroit. The city has a population of 16,314 as of the 2010 census.
History
The area that is now Mount Clemens was first settled in 1795 by Christian Clemens, a German immigrant. He purchased land from the local Native Americans and built a log cabin. The area was known as Clemensville until 1818 when it was renamed Mount Clemens. The name was chosen to honor Christian Clemens and the nearby Mount Clemens Hill.
In 1818, the first post office was established in Mount Clemens. The city was incorporated in 1879 and was designated as the county seat of Macomb County in 1882.
In the late 19th century, Mount Clemens became a popular tourist destination due to its mineral springs. The city was home to several large hotels and resorts, including the Grand Hotel, which was built in 1891.
Geography
Mount Clemens is located at 42°35'N 82°53'W (42.58, -82.88). The city has a total area of 4.2 square miles, all of which is land.
The city is situated on the Clinton River, which flows through the city from north to south. The city is located in the southeastern portion of Macomb County and is bordered by the cities of Clinton Township to the north, Harrison Township to the east, and Macomb Township to the south and west.
Economy
The economy of Mount Clemens is largely based on manufacturing and healthcare. The city is home to several large manufacturing companies, including General Motors, Chrysler, and Ford. The city is also home to several healthcare facilities, including McLaren Macomb Hospital and Henry Ford Macomb Hospital.
The city also has a vibrant retail sector, with several shopping centers and malls located in the city. The city is also home to several restaurants, bars, and entertainment venues.
Demographics
As of the 2010 census, the population of Mount Clemens was 16,314. The racial makeup of the city was 79.2% White, 14.3% African American, 0.5% Native American, 1.2% Asian, 0.1% Pacific Islander, and 4.7% from other races. Hispanic or Latino of any race were 5.2% of the population.
The median household income in Mount Clemens was $41,945, and the median family income was $50,945. The per capita income for the city was $20,945. About 16.2% of the population was below the poverty line.
Conclusion
Mount Clemens is a city located in Macomb County, Michigan. It is the county seat of Macomb County and is located about 20 miles northeast of Detroit. The city has a population of 16,314 as of the 2010 census. The city has a long history, dating back to 1795 when it was first settled by Christian Clemens. The economy of Mount Clemens is largely based on manufacturing and healthcare, and the city is home to several large companies and healthcare facilities. The racial makeup of the city is 79.2% White, 14.3% African American, 0.5% Native American, 1.2% Asian, 0.1% Pacific Islander, and 4.7% from other races. The median household income in Mount Clemens was $41,945, and the median family income was $50,945.
Common Questions
What is Per Capita Income in Mount Clemens?
Per Capita income in Mount Clemens is $31,939.
What is the Median Family Income in Mount Clemens?
Median Family Income in Mount Clemens is $75,412.
What is the Median Household income in Mount Clemens?
Median Household Income in Mount Clemens is $55,154.
What is Income or Wage Gap in Mount Clemens?
Income or Wage Gap in Mount Clemens is 13.2%.
Women in Mount Clemens earn 86.8 cents for every dollar earned by a man.
What is Family Income Deficit in Mount Clemens?
Family Income Deficit in Mount Clemens is $10,131.
Families that are below poverty line in Mount Clemens earn $10,131 less on average than the poverty threshold level.
What is Inequality or Gini Index in Mount Clemens?
Inequality or Gini Index in Mount Clemens is 0.46.
What is the Total Population of Mount Clemens?
Total Population of Mount Clemens is 15,679.
What is the Total Male Population of Mount Clemens?
Total Male Population of Mount Clemens is 8,128.
What is the Total Female Population of Mount Clemens?
Total Female Population of Mount Clemens is 7,551.
What is the Ratio of Males per 100 Females in Mount Clemens?
There are 107.64 Males per 100 Females in Mount Clemens.
What is the Ratio of Females per 100 Males in Mount Clemens?
There are 92.90 Females per 100 Males in Mount Clemens.
What is the Median Population Age in Mount Clemens?
Median Population Age in Mount Clemens is 40.2 Years.
What is the Average Family Size in Mount Clemens
Average Family Size in Mount Clemens is 2.9 People.
What is the Average Household Size in Mount Clemens
Average Household Size in Mount Clemens is 2.2 People.
How Large is the Labor Force in Mount Clemens?
There are 7,732 People in the Labor Forcein in Mount Clemens.
What is the Percentage of People in the Labor Force in Mount Clemens?
58.8% of People are in the Labor Force in Mount Clemens.
What is the Unemployment Rate in Mount Clemens?
Unemployment Rate in Mount Clemens is 7.0%.