Wyandotte, MI Map & Demographics
Wyandotte Map
Wyandotte Overview
$33,993
PER CAPITA INCOME
$80,480
AVG FAMILY INCOME
$62,111
AVG HOUSEHOLD INCOME
17.5%
WAGE / INCOME GAP [ % ]
82.5¢/ $1
WAGE / INCOME GAP [ $ ]
$8,036
FAMILY INCOME DEFICIT
0.41
INEQUALITY / GINI INDEX
24,857
TOTAL POPULATION
11,912
MALE POPULATION
12,945
FEMALE POPULATION
92.02
MALES / 100 FEMALES
108.67
FEMALES / 100 MALES
39.6
MEDIAN AGE
3.0
AVG FAMILY SIZE
2.3
AVG HOUSEHOLD SIZE
12,624
LABOR FORCE [ PEOPLE ]
61.7%
PERCENT IN LABOR FORCE
4.1%
UNEMPLOYMENT RATE
Wyandotte Zip Codes
Wyandotte Area Codes
Income in Wyandotte
Income Overview in Wyandotte
Per Capita Income in Wyandotte is $33,993, while median incomes of families and households are $80,480 and $62,111 respectively.
| Characteristic | Number | Measure |
| Per Capita Income | 24,857 | $33,993 |
| Median Family Income | 6,059 | $80,480 |
| Mean Family Income | 6,059 | $91,075 |
| Median Household Income | 10,852 | $62,111 |
| Mean Household Income | 10,852 | $76,052 |
| Income Deficit | 6,059 | $8,036 |
| Wage / Income Gap (%) | 24,857 | 17.49% |
| Wage / Income Gap ($) | 24,857 | 82.51¢ per $1 |
| Gini / Inequality Index | 24,857 | 0.41 |
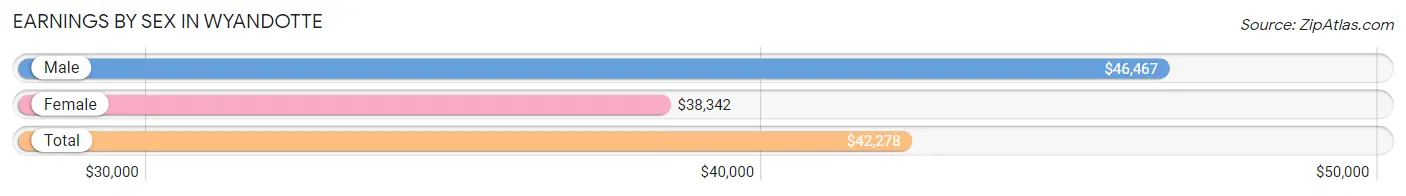
Earnings by Sex in Wyandotte
Average Earnings in Wyandotte are $42,278, $46,467 for men and $38,342 for women, a difference of 17.5%.
| Sex | Number | Average Earnings |
| Male | 6,684 (50.9%) | $46,467 |
| Female | 6,454 (49.1%) | $38,342 |
| Total | 13,138 (100.0%) | $42,278 |
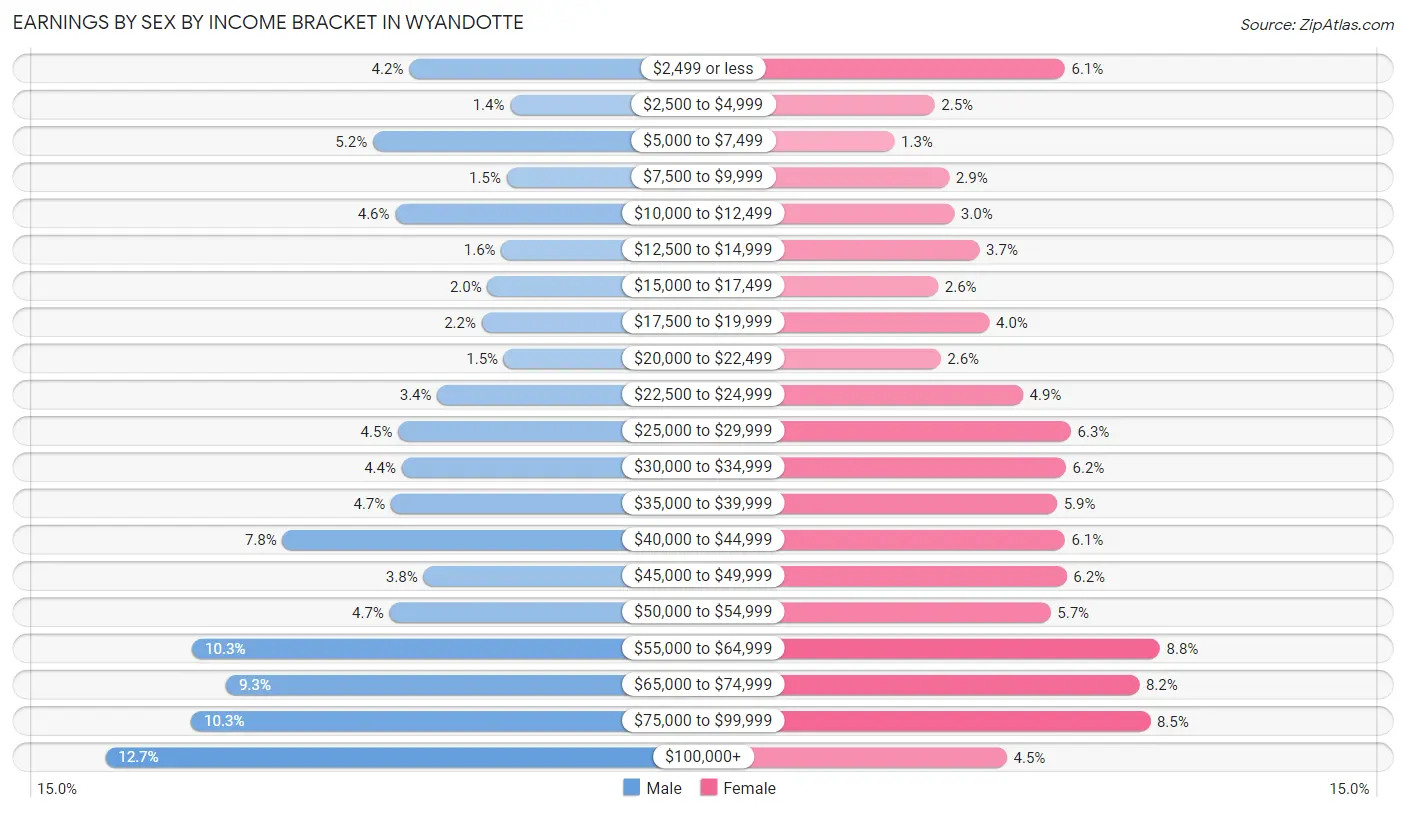
Earnings by Sex by Income Bracket in Wyandotte
The most common earnings brackets in Wyandotte are $100,000+ for men (851 | 12.7%) and $55,000 to $64,999 for women (567 | 8.8%).
| Income | Male | Female |
| $2,499 or less | 280 (4.2%) | 395 (6.1%) |
| $2,500 to $4,999 | 90 (1.3%) | 159 (2.5%) |
| $5,000 to $7,499 | 348 (5.2%) | 86 (1.3%) |
| $7,500 to $9,999 | 97 (1.5%) | 185 (2.9%) |
| $10,000 to $12,499 | 306 (4.6%) | 194 (3.0%) |
| $12,500 to $14,999 | 107 (1.6%) | 240 (3.7%) |
| $15,000 to $17,499 | 133 (2.0%) | 165 (2.6%) |
| $17,500 to $19,999 | 144 (2.1%) | 258 (4.0%) |
| $20,000 to $22,499 | 102 (1.5%) | 170 (2.6%) |
| $22,500 to $24,999 | 227 (3.4%) | 319 (4.9%) |
| $25,000 to $29,999 | 301 (4.5%) | 406 (6.3%) |
| $30,000 to $34,999 | 294 (4.4%) | 397 (6.1%) |
| $35,000 to $39,999 | 314 (4.7%) | 381 (5.9%) |
| $40,000 to $44,999 | 518 (7.7%) | 395 (6.1%) |
| $45,000 to $49,999 | 253 (3.8%) | 398 (6.2%) |
| $50,000 to $54,999 | 317 (4.7%) | 369 (5.7%) |
| $55,000 to $64,999 | 688 (10.3%) | 567 (8.8%) |
| $65,000 to $74,999 | 624 (9.3%) | 530 (8.2%) |
| $75,000 to $99,999 | 690 (10.3%) | 550 (8.5%) |
| $100,000+ | 851 (12.7%) | 290 (4.5%) |
| Total | 6,684 (100.0%) | 6,454 (100.0%) |
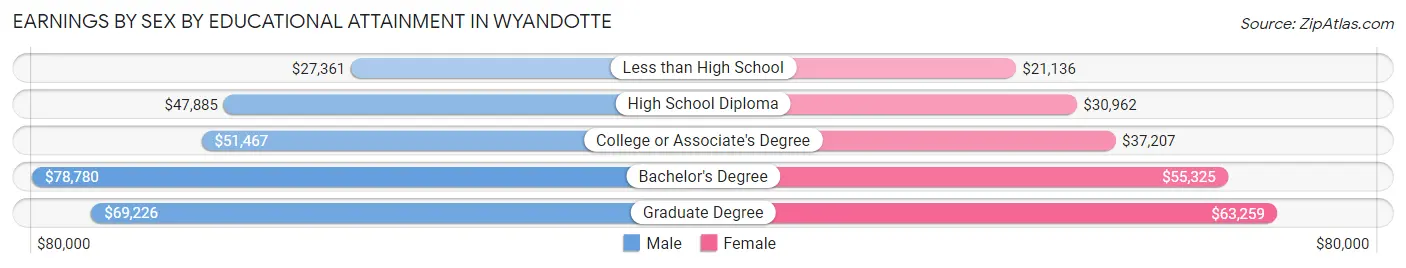
Earnings by Sex by Educational Attainment in Wyandotte
Average earnings in Wyandotte are $52,987 for men and $41,867 for women, a difference of 21.0%. Men with an educational attainment of bachelor's degree enjoy the highest average annual earnings of $78,780, while those with less than high school education earn the least with $27,361. Women with an educational attainment of graduate degree earn the most with the average annual earnings of $63,259, while those with less than high school education have the smallest earnings of $21,136.
| Educational Attainment | Male Income | Female Income |
| Less than High School | $27,361 | $21,136 |
| High School Diploma | $47,885 | $30,962 |
| College or Associate's Degree | $51,467 | $37,207 |
| Bachelor's Degree | $78,780 | $55,325 |
| Graduate Degree | $69,226 | $63,259 |
| Total | $52,987 | $41,867 |
Family Income in Wyandotte
Family Income Brackets in Wyandotte
According to the Wyandotte family income data, there are 1,491 families falling into the $100,000 to $149,999 income range, which is the most common income bracket and makes up 24.6% of all families. Conversely, the less than $10,000 income bracket is the least frequent group with only 139 families (2.3%) belonging to this category.
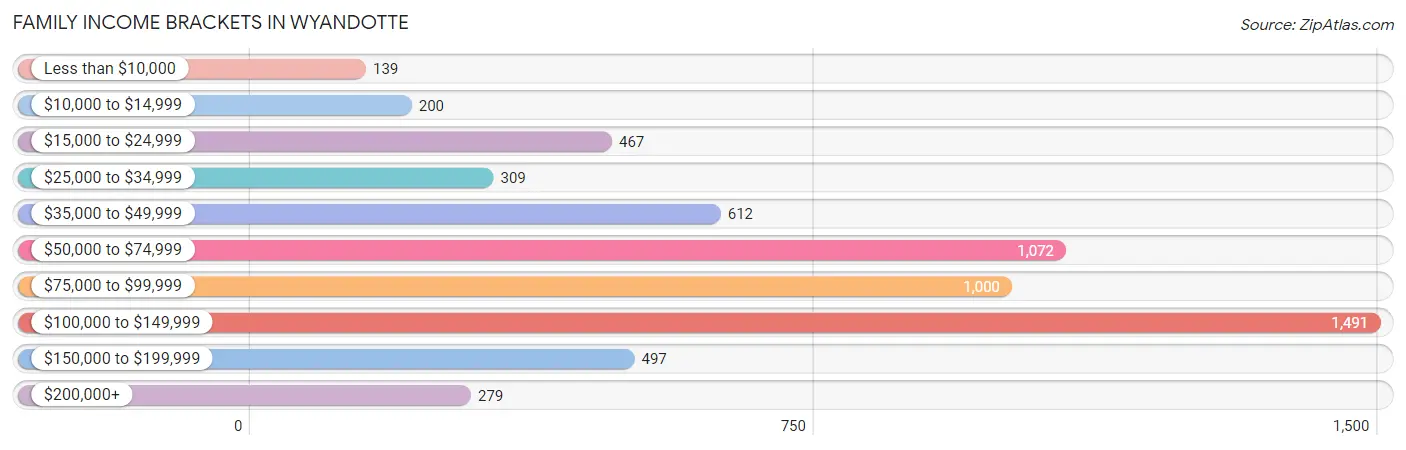
| Income Bracket | # Families | % Families |
| Less than $10,000 | 139 | 2.3% |
| $10,000 to $14,999 | 200 | 3.3% |
| $15,000 to $24,999 | 467 | 7.7% |
| $25,000 to $34,999 | 309 | 5.1% |
| $35,000 to $49,999 | 612 | 10.1% |
| $50,000 to $74,999 | 1,072 | 17.7% |
| $75,000 to $99,999 | 1,000 | 16.5% |
| $100,000 to $149,999 | 1,491 | 24.6% |
| $150,000 to $199,999 | 497 | 8.2% |
| $200,000+ | 279 | 4.6% |
Family Income by Famaliy Size in Wyandotte
6-person families (159 | 2.6%) account for the highest median family income in Wyandotte with $106,250 per family, while 2-person families (3,298 | 54.4%) have the highest median income of $38,608 per family member.
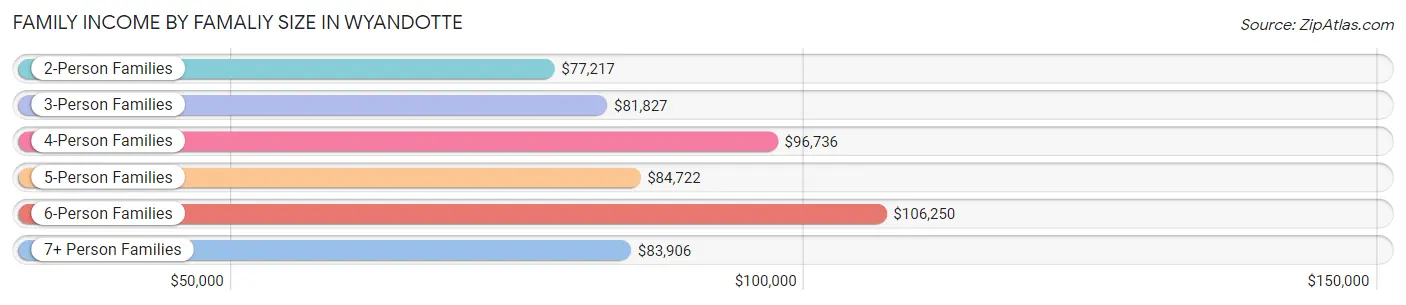
| Income Bracket | # Families | Median Income |
| 2-Person Families | 3,298 (54.4%) | $77,217 |
| 3-Person Families | 1,488 (24.6%) | $81,827 |
| 4-Person Families | 735 (12.1%) | $96,736 |
| 5-Person Families | 328 (5.4%) | $84,722 |
| 6-Person Families | 159 (2.6%) | $106,250 |
| 7+ Person Families | 51 (0.8%) | $83,906 |
| Total | 6,059 (100.0%) | $80,480 |
Family Income by Number of Earners in Wyandotte
The median family income in Wyandotte is $80,480, with families comprising 3+ earners (569) having the highest median family income of $143,466, while families with no earners (883) have the lowest median family income of $50,060, accounting for 9.4% and 14.6% of families, respectively.
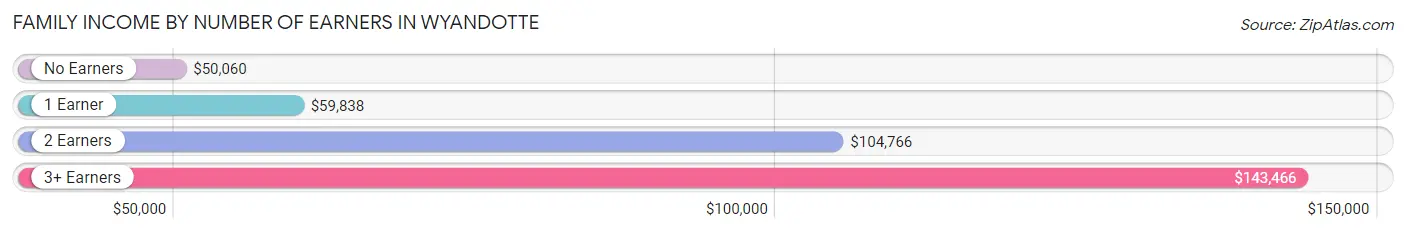
| Number of Earners | # Families | Median Income |
| No Earners | 883 (14.6%) | $50,060 |
| 1 Earner | 2,294 (37.9%) | $59,838 |
| 2 Earners | 2,313 (38.2%) | $104,766 |
| 3+ Earners | 569 (9.4%) | $143,466 |
| Total | 6,059 (100.0%) | $80,480 |
Household Income in Wyandotte
Household Income Brackets in Wyandotte
With 2,105 households falling in the category, the $100,000 to $149,999 income range is the most frequent in Wyandotte, accounting for 19.4% of all households. In contrast, only 347 households (3.2%) fall into the $200,000+ income bracket, making it the least populous group.
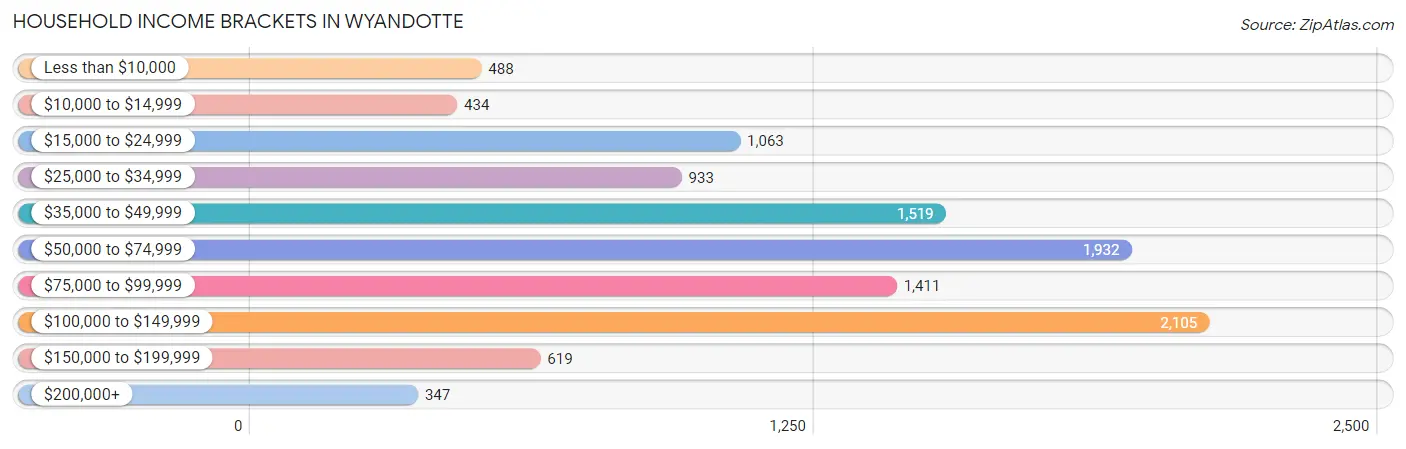
| Income Bracket | # Households | % Households |
| Less than $10,000 | 488 | 4.5% |
| $10,000 to $14,999 | 434 | 4.0% |
| $15,000 to $24,999 | 1,063 | 9.8% |
| $25,000 to $34,999 | 933 | 8.6% |
| $35,000 to $49,999 | 1,519 | 14.0% |
| $50,000 to $74,999 | 1,932 | 17.8% |
| $75,000 to $99,999 | 1,411 | 13.0% |
| $100,000 to $149,999 | 2,105 | 19.4% |
| $150,000 to $199,999 | 619 | 5.7% |
| $200,000+ | 347 | 3.2% |
Household Income by Householder Age in Wyandotte
The median household income in Wyandotte is $62,111, with the highest median household income of $78,140 found in the 45 to 64 years age bracket for the primary householder. A total of 3,926 households (36.2%) fall into this category. Meanwhile, the 65+ years age bracket for the primary householder has the lowest median household income of $41,615, with 3,212 households (29.6%) in this group.
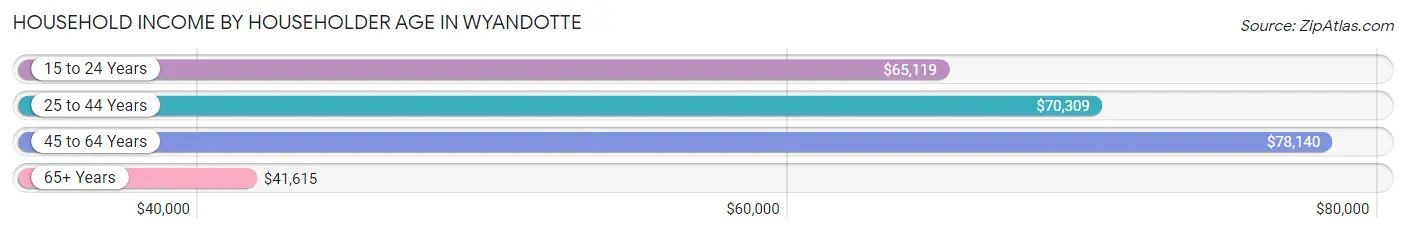
| Income Bracket | # Households | Median Income |
| 15 to 24 Years | 206 (1.9%) | $65,119 |
| 25 to 44 Years | 3,508 (32.3%) | $70,309 |
| 45 to 64 Years | 3,926 (36.2%) | $78,140 |
| 65+ Years | 3,212 (29.6%) | $41,615 |
| Total | 10,852 (100.0%) | $62,111 |
Poverty in Wyandotte
Income Below Poverty by Sex and Age in Wyandotte
With 13.9% poverty level for males and 16.6% for females among the residents of Wyandotte, 16 and 17 year old males and 16 and 17 year old females are the most vulnerable to poverty, with 105 males (36.0%) and 171 females (57.4%) in their respective age groups living below the poverty level.
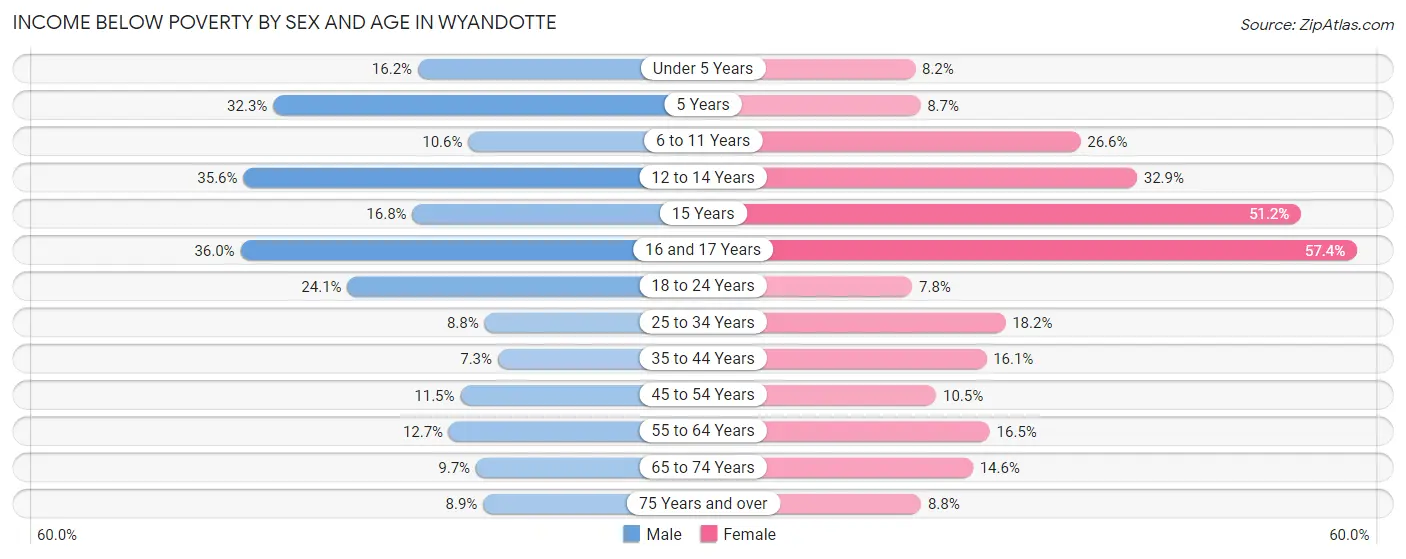
| Age Bracket | Male | Female |
| Under 5 Years | 86 (16.2%) | 48 (8.2%) |
| 5 Years | 53 (32.3%) | 11 (8.7%) |
| 6 to 11 Years | 65 (10.6%) | 276 (26.6%) |
| 12 to 14 Years | 216 (35.6%) | 90 (32.9%) |
| 15 Years | 19 (16.8%) | 66 (51.2%) |
| 16 and 17 Years | 105 (36.0%) | 171 (57.4%) |
| 18 to 24 Years | 246 (24.0%) | 58 (7.8%) |
| 25 to 34 Years | 172 (8.8%) | 387 (18.2%) |
| 35 to 44 Years | 100 (7.3%) | 252 (16.1%) |
| 45 to 54 Years | 154 (11.5%) | 164 (10.5%) |
| 55 to 64 Years | 239 (12.7%) | 322 (16.5%) |
| 65 to 74 Years | 120 (9.7%) | 204 (14.6%) |
| 75 Years and over | 55 (8.9%) | 96 (8.8%) |
| Total | 1,630 (13.9%) | 2,145 (16.6%) |
Income Above Poverty by Sex and Age in Wyandotte
According to the poverty statistics in Wyandotte, males aged 35 to 44 years and females aged 18 to 24 years are the age groups that are most secure financially, with 92.7% of males and 92.2% of females in these age groups living above the poverty line.
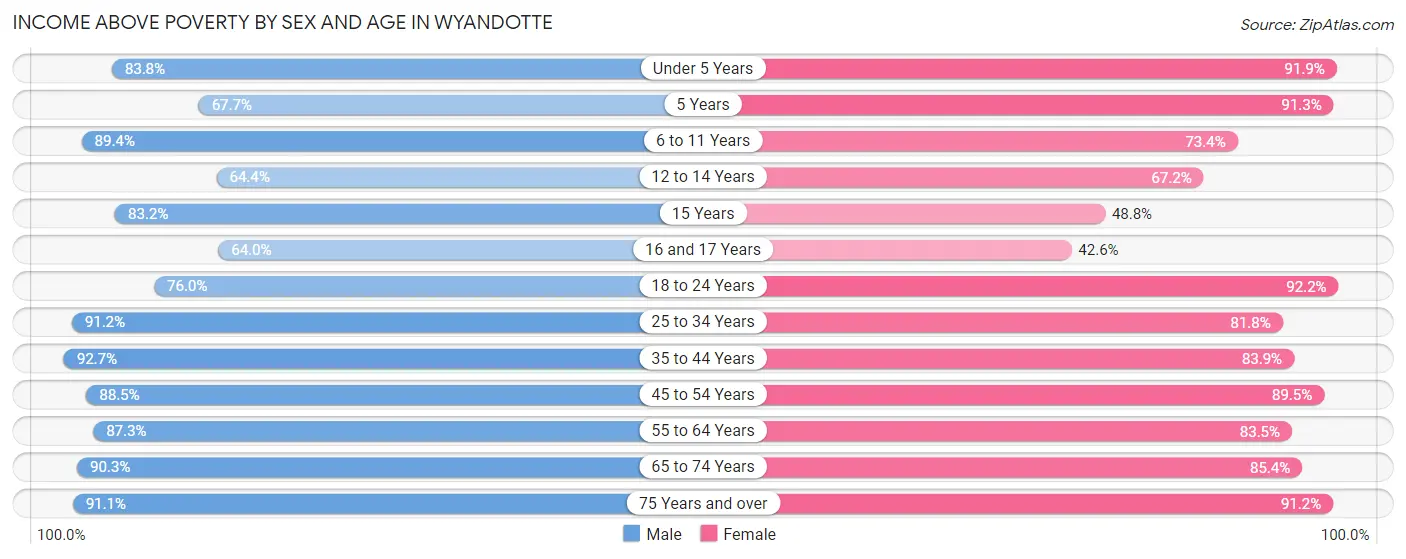
| Age Bracket | Male | Female |
| Under 5 Years | 445 (83.8%) | 541 (91.8%) |
| 5 Years | 111 (67.7%) | 115 (91.3%) |
| 6 to 11 Years | 549 (89.4%) | 763 (73.4%) |
| 12 to 14 Years | 390 (64.4%) | 184 (67.1%) |
| 15 Years | 94 (83.2%) | 63 (48.8%) |
| 16 and 17 Years | 187 (64.0%) | 127 (42.6%) |
| 18 to 24 Years | 777 (75.9%) | 683 (92.2%) |
| 25 to 34 Years | 1,788 (91.2%) | 1,739 (81.8%) |
| 35 to 44 Years | 1,272 (92.7%) | 1,315 (83.9%) |
| 45 to 54 Years | 1,189 (88.5%) | 1,398 (89.5%) |
| 55 to 64 Years | 1,637 (87.3%) | 1,633 (83.5%) |
| 65 to 74 Years | 1,112 (90.3%) | 1,195 (85.4%) |
| 75 Years and over | 561 (91.1%) | 993 (91.2%) |
| Total | 10,112 (86.1%) | 10,749 (83.4%) |
Income Below Poverty Among Married-Couple Families in Wyandotte
The poverty statistics for married-couple families in Wyandotte show that 7.9% or 320 of the total 4,077 families live below the poverty line. Families with 5 or more children have the highest poverty rate of 47.2%, comprising of 17 families. On the other hand, families with no children have the lowest poverty rate of 6.7%, which includes 189 families.
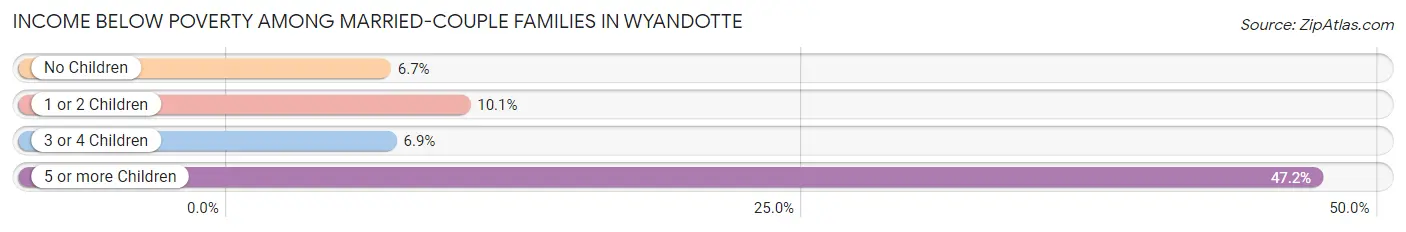
| Children | Above Poverty | Below Poverty |
| No Children | 2,651 (93.3%) | 189 (6.7%) |
| 1 or 2 Children | 871 (89.9%) | 98 (10.1%) |
| 3 or 4 Children | 216 (93.1%) | 16 (6.9%) |
| 5 or more Children | 19 (52.8%) | 17 (47.2%) |
| Total | 3,757 (92.1%) | 320 (7.9%) |
Income Below Poverty Among Single-Parent Households in Wyandotte
According to the poverty data in Wyandotte, 12.6% or 64 single-father households and 25.0% or 368 single-mother households are living below the poverty line. Among single-father households, those with 3 or 4 children have the highest poverty rate, with 9 households (69.2%) experiencing poverty. Likewise, among single-mother households, those with 3 or 4 children have the highest poverty rate, with 24 households (55.8%) falling below the poverty line.
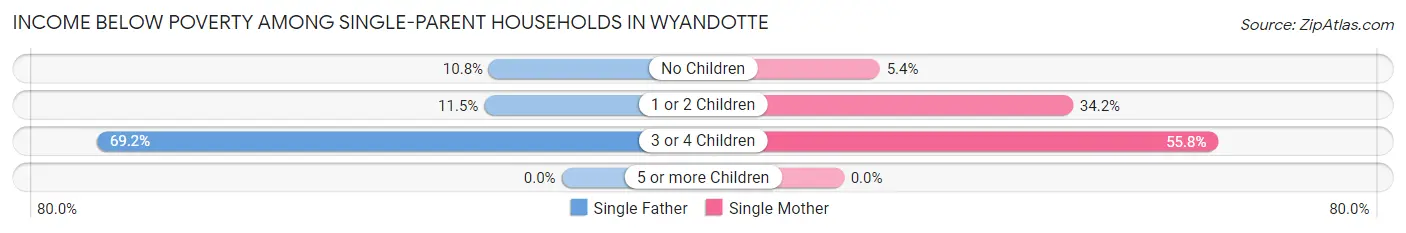
| Children | Single Father | Single Mother |
| No Children | 24 (10.8%) | 27 (5.4%) |
| 1 or 2 Children | 31 (11.5%) | 317 (34.2%) |
| 3 or 4 Children | 9 (69.2%) | 24 (55.8%) |
| 5 or more Children | 0 (0.0%) | 0 (0.0%) |
| Total | 64 (12.6%) | 368 (25.0%) |
Income Below Poverty Among Married-Couple vs Single-Parent Households in Wyandotte
The poverty data for Wyandotte shows that 320 of the married-couple family households (7.9%) and 432 of the single-parent households (21.8%) are living below the poverty level. Within the married-couple family households, those with 5 or more children have the highest poverty rate, with 17 households (47.2%) falling below the poverty line. Among the single-parent households, those with 3 or 4 children have the highest poverty rate, with 33 household (58.9%) living below poverty.
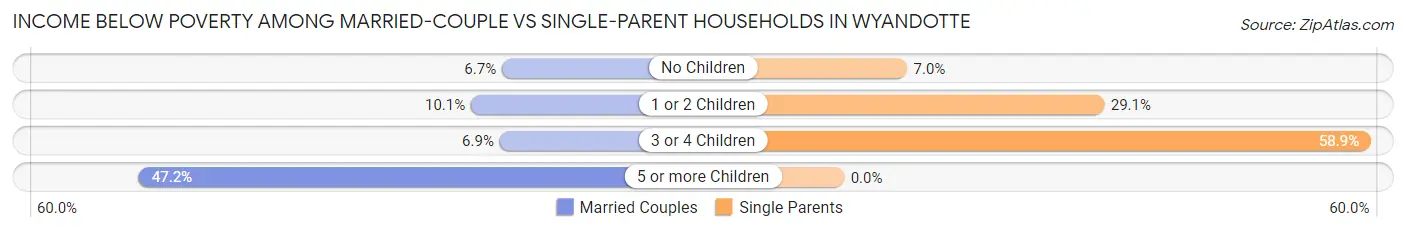
| Children | Married-Couple Families | Single-Parent Households |
| No Children | 189 (6.7%) | 51 (7.0%) |
| 1 or 2 Children | 98 (10.1%) | 348 (29.1%) |
| 3 or 4 Children | 16 (6.9%) | 33 (58.9%) |
| 5 or more Children | 17 (47.2%) | 0 (0.0%) |
| Total | 320 (7.9%) | 432 (21.8%) |
Race in Wyandotte
The most populous races in Wyandotte are White / Caucasian (22,347 | 89.9%), Hispanic or Latino (1,631 | 6.6%), and Two or more Races (1,347 | 5.4%).
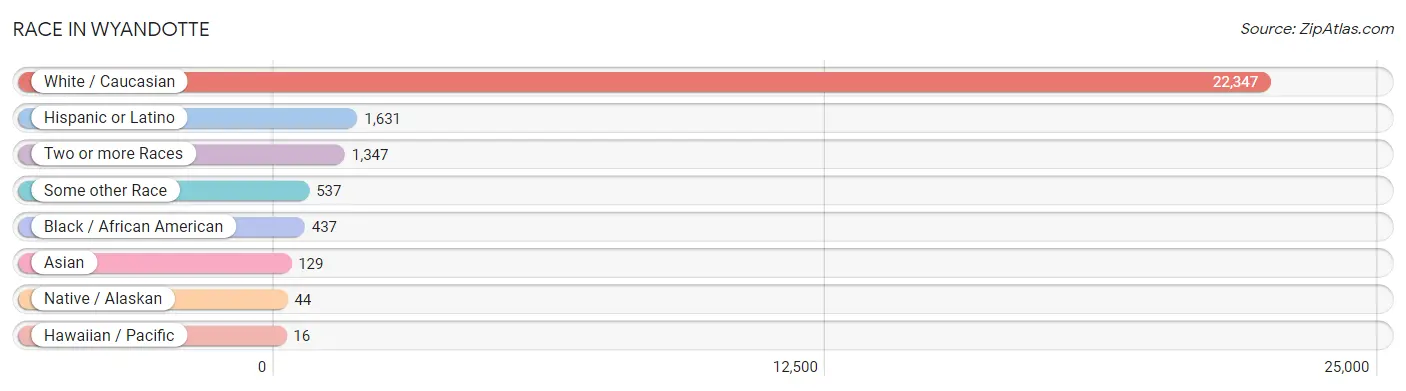
| Race | # Population | % Population |
| Asian | 129 | 0.5% |
| Black / African American | 437 | 1.8% |
| Hawaiian / Pacific | 16 | 0.1% |
| Hispanic or Latino | 1,631 | 6.6% |
| Native / Alaskan | 44 | 0.2% |
| White / Caucasian | 22,347 | 89.9% |
| Two or more Races | 1,347 | 5.4% |
| Some other Race | 537 | 2.2% |
| Total | 24,857 | 100.0% |
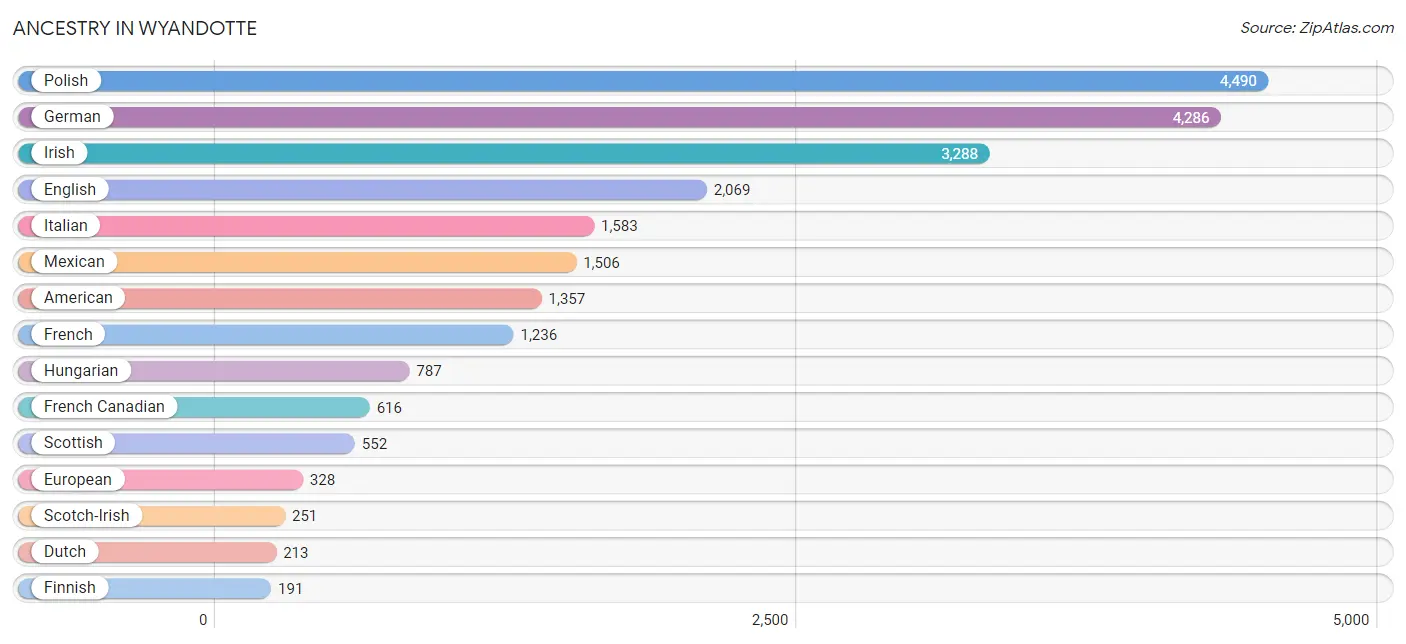
Ancestry in Wyandotte
The most populous ancestries reported in Wyandotte are Polish (4,490 | 18.1%), German (4,286 | 17.2%), Irish (3,288 | 13.2%), English (2,069 | 8.3%), and Italian (1,583 | 6.4%), together accounting for 63.2% of all Wyandotte residents.
| Ancestry | # Population | % Population |
| African | 1 | 0.0% |
| Albanian | 67 | 0.3% |
| American | 1,357 | 5.5% |
| Arab | 158 | 0.6% |
| Armenian | 23 | 0.1% |
| Austrian | 34 | 0.1% |
| Basque | 29 | 0.1% |
| Belgian | 76 | 0.3% |
| Bhutanese | 42 | 0.2% |
| Blackfeet | 8 | 0.0% |
| British | 87 | 0.4% |
| Burmese | 30 | 0.1% |
| Canadian | 177 | 0.7% |
| Celtic | 7 | 0.0% |
| Cherokee | 76 | 0.3% |
| Chippewa | 43 | 0.2% |
| Cuban | 43 | 0.2% |
| Czech | 106 | 0.4% |
| Czechoslovakian | 23 | 0.1% |
| Danish | 24 | 0.1% |
| Dutch | 213 | 0.9% |
| Eastern European | 108 | 0.4% |
| English | 2,069 | 8.3% |
| European | 328 | 1.3% |
| Filipino | 13 | 0.1% |
| Finnish | 191 | 0.8% |
| French | 1,236 | 5.0% |
| French American Indian | 10 | 0.0% |
| French Canadian | 616 | 2.5% |
| German | 4,286 | 17.2% |
| Greek | 181 | 0.7% |
| Hungarian | 787 | 3.2% |
| Indian (Asian) | 26 | 0.1% |
| Iraqi | 24 | 0.1% |
| Irish | 3,288 | 13.2% |
| Italian | 1,583 | 6.4% |
| Korean | 125 | 0.5% |
| Lebanese | 93 | 0.4% |
| Lithuanian | 71 | 0.3% |
| Macedonian | 13 | 0.1% |
| Maltese | 44 | 0.2% |
| Mexican | 1,506 | 6.1% |
| Norwegian | 63 | 0.3% |
| Ottawa | 18 | 0.1% |
| Pakistani | 9 | 0.0% |
| Palestinian | 41 | 0.2% |
| Peruvian | 6 | 0.0% |
| Polish | 4,490 | 18.1% |
| Potawatomi | 74 | 0.3% |
| Pueblo | 14 | 0.1% |
| Puerto Rican | 61 | 0.3% |
| Romanian | 96 | 0.4% |
| Russian | 134 | 0.5% |
| Samoan | 16 | 0.1% |
| Scandinavian | 53 | 0.2% |
| Scotch-Irish | 251 | 1.0% |
| Scottish | 552 | 2.2% |
| Serbian | 25 | 0.1% |
| Sioux | 14 | 0.1% |
| Slavic | 18 | 0.1% |
| Slovak | 55 | 0.2% |
| South American | 6 | 0.0% |
| Spaniard | 15 | 0.1% |
| Sri Lankan | 17 | 0.1% |
| Subsaharan African | 1 | 0.0% |
| Swedish | 159 | 0.6% |
| Swiss | 32 | 0.1% |
| Thai | 15 | 0.1% |
| Ukrainian | 102 | 0.4% |
| Welsh | 69 | 0.3% | View All 70 Rows |
Immigrants in Wyandotte
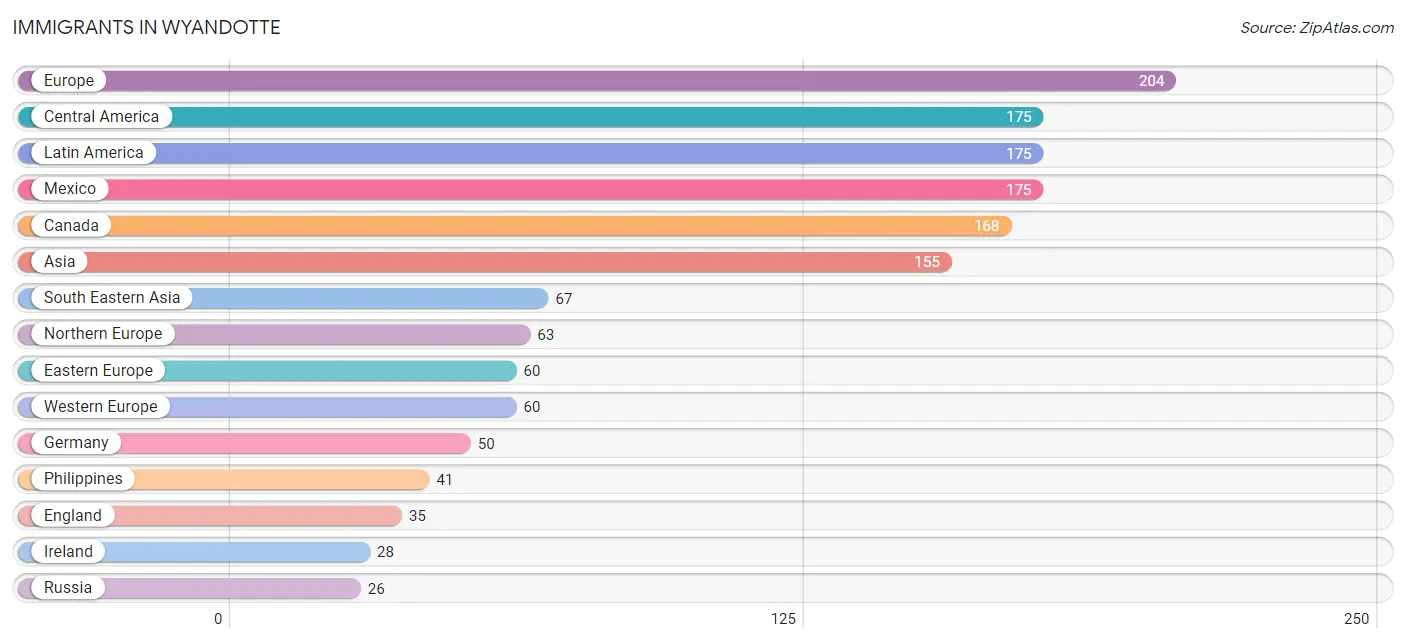
The most numerous immigrant groups reported in Wyandotte came from Europe (204 | 0.8%), Central America (175 | 0.7%), Latin America (175 | 0.7%), Mexico (175 | 0.7%), and Canada (168 | 0.7%), together accounting for 3.6% of all Wyandotte residents.
| Immigration Origin | # Population | % Population |
| Africa | 24 | 0.1% |
| Asia | 155 | 0.6% |
| Canada | 168 | 0.7% |
| Central America | 175 | 0.7% |
| China | 13 | 0.1% |
| Eastern Africa | 10 | 0.0% |
| Eastern Asia | 23 | 0.1% |
| Eastern Europe | 60 | 0.2% |
| England | 35 | 0.1% |
| Europe | 204 | 0.8% |
| Germany | 50 | 0.2% |
| India | 17 | 0.1% |
| Ireland | 28 | 0.1% |
| Italy | 21 | 0.1% |
| Kenya | 10 | 0.0% |
| Korea | 10 | 0.0% |
| Latin America | 175 | 0.7% |
| Lebanon | 7 | 0.0% |
| Mexico | 175 | 0.7% |
| Netherlands | 10 | 0.0% |
| Northern Europe | 63 | 0.3% |
| Philippines | 41 | 0.2% |
| Russia | 26 | 0.1% |
| Saudi Arabia | 8 | 0.0% |
| Sierra Leone | 14 | 0.1% |
| South Central Asia | 17 | 0.1% |
| South Eastern Asia | 67 | 0.3% |
| Southern Europe | 21 | 0.1% |
| Taiwan | 13 | 0.1% |
| Thailand | 9 | 0.0% |
| Ukraine | 26 | 0.1% |
| Vietnam | 17 | 0.1% |
| Western Africa | 14 | 0.1% |
| Western Asia | 15 | 0.1% |
| Western Europe | 60 | 0.2% | View All 35 Rows |
Sex and Age in Wyandotte
Sex and Age in Wyandotte
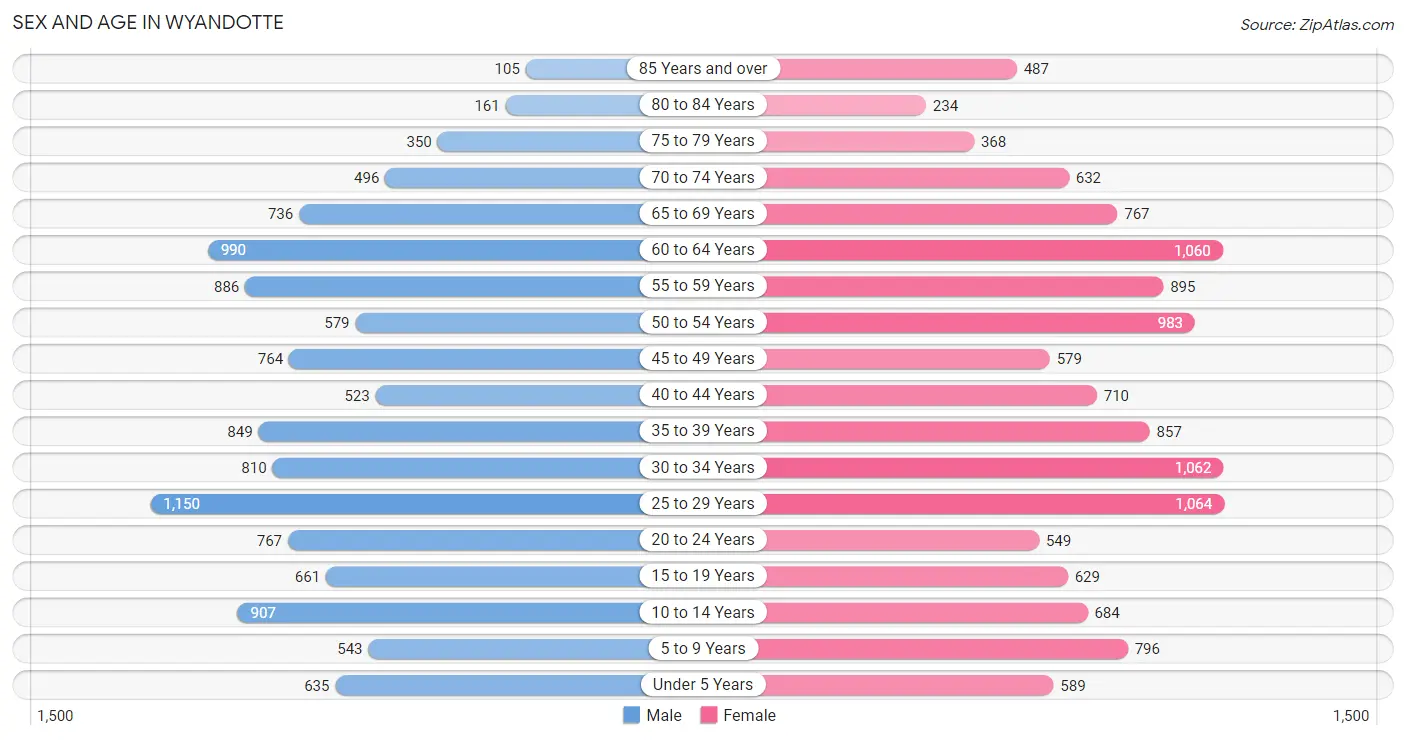
The most populous age groups in Wyandotte are 25 to 29 Years (1,150 | 9.7%) for men and 25 to 29 Years (1,064 | 8.2%) for women.
| Age Bracket | Male | Female |
| Under 5 Years | 635 (5.3%) | 589 (4.5%) |
| 5 to 9 Years | 543 (4.6%) | 796 (6.1%) |
| 10 to 14 Years | 907 (7.6%) | 684 (5.3%) |
| 15 to 19 Years | 661 (5.6%) | 629 (4.9%) |
| 20 to 24 Years | 767 (6.4%) | 549 (4.2%) |
| 25 to 29 Years | 1,150 (9.7%) | 1,064 (8.2%) |
| 30 to 34 Years | 810 (6.8%) | 1,062 (8.2%) |
| 35 to 39 Years | 849 (7.1%) | 857 (6.6%) |
| 40 to 44 Years | 523 (4.4%) | 710 (5.5%) |
| 45 to 49 Years | 764 (6.4%) | 579 (4.5%) |
| 50 to 54 Years | 579 (4.9%) | 983 (7.6%) |
| 55 to 59 Years | 886 (7.4%) | 895 (6.9%) |
| 60 to 64 Years | 990 (8.3%) | 1,060 (8.2%) |
| 65 to 69 Years | 736 (6.2%) | 767 (5.9%) |
| 70 to 74 Years | 496 (4.2%) | 632 (4.9%) |
| 75 to 79 Years | 350 (2.9%) | 368 (2.8%) |
| 80 to 84 Years | 161 (1.3%) | 234 (1.8%) |
| 85 Years and over | 105 (0.9%) | 487 (3.8%) |
| Total | 11,912 (100.0%) | 12,945 (100.0%) |
Families and Households in Wyandotte
Median Family Size in Wyandotte
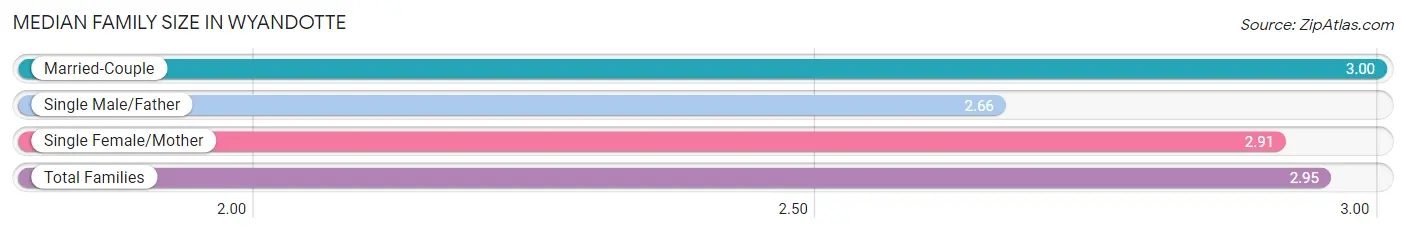
The median family size in Wyandotte is 2.95 persons per family, with married-couple families (4,077 | 67.3%) accounting for the largest median family size of 3 persons per family. On the other hand, single male/father families (508 | 8.4%) represent the smallest median family size with 2.66 persons per family.
| Family Type | # Families | Family Size |
| Married-Couple | 4,077 (67.3%) | 3.00 |
| Single Male/Father | 508 (8.4%) | 2.66 |
| Single Female/Mother | 1,474 (24.3%) | 2.91 |
| Total Families | 6,059 (100.0%) | 2.95 |
Median Household Size in Wyandotte
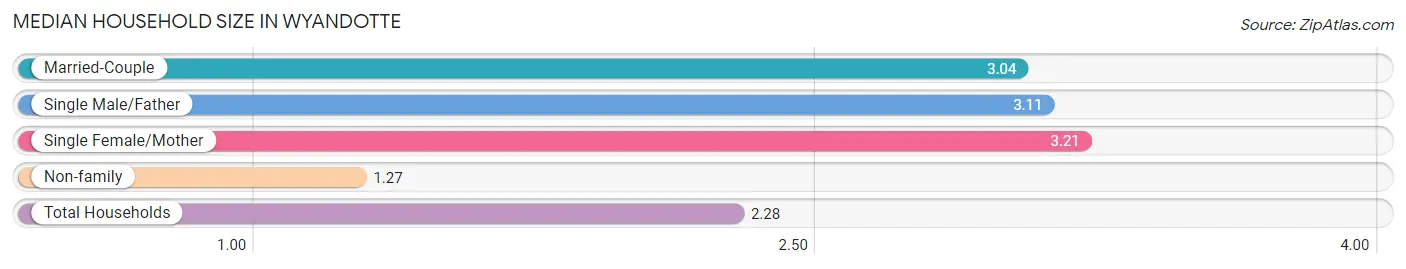
The median household size in Wyandotte is 2.28 persons per household, with single female/mother households (1,474 | 13.6%) accounting for the largest median household size of 3.21 persons per household. non-family households (4,793 | 44.2%) represent the smallest median household size with 1.27 persons per household.
| Household Type | # Households | Household Size |
| Married-Couple | 4,077 (37.6%) | 3.04 |
| Single Male/Father | 508 (4.7%) | 3.11 |
| Single Female/Mother | 1,474 (13.6%) | 3.21 |
| Non-family | 4,793 (44.2%) | 1.27 |
| Total Households | 10,852 (100.0%) | 2.28 |
Household Size by Marriage Status in Wyandotte
Out of a total of 10,852 households in Wyandotte, 6,059 (55.8%) are family households, while 4,793 (44.2%) are nonfamily households. The most numerous type of family households are 2-person households, comprising 2,985, and the most common type of nonfamily households are 1-person households, comprising 3,945.
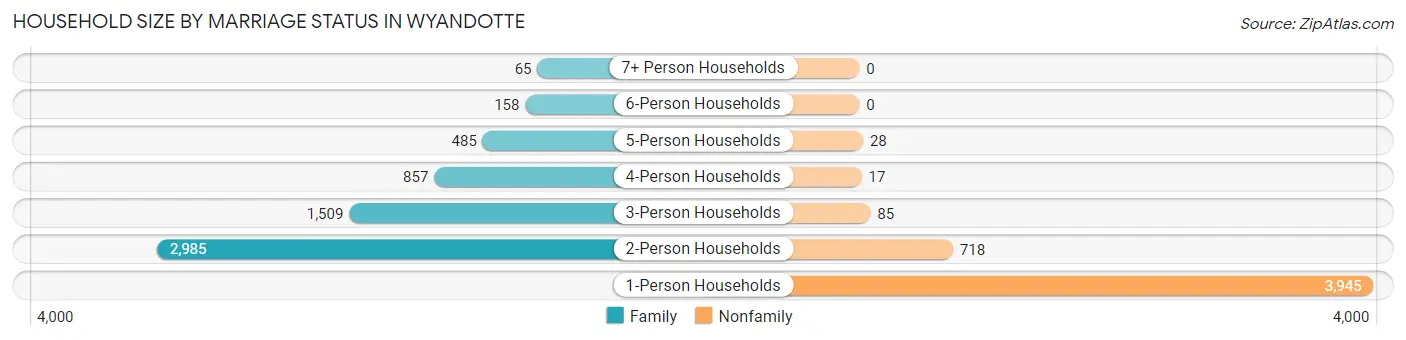
| Household Size | Family Households | Nonfamily Households |
| 1-Person Households | - | 3,945 (36.3%) |
| 2-Person Households | 2,985 (27.5%) | 718 (6.6%) |
| 3-Person Households | 1,509 (13.9%) | 85 (0.8%) |
| 4-Person Households | 857 (7.9%) | 17 (0.2%) |
| 5-Person Households | 485 (4.5%) | 28 (0.3%) |
| 6-Person Households | 158 (1.5%) | 0 (0.0%) |
| 7+ Person Households | 65 (0.6%) | 0 (0.0%) |
| Total | 6,059 (55.8%) | 4,793 (44.2%) |
Female Fertility in Wyandotte
Fertility by Age in Wyandotte
Average fertility rate in Wyandotte is 46.0 births per 1,000 women. Women in the age bracket of 20 to 34 years have the highest fertility rate with 63.0 births per 1,000 women. Women in the age bracket of 20 to 34 years acount for 65.8% of all women with births.
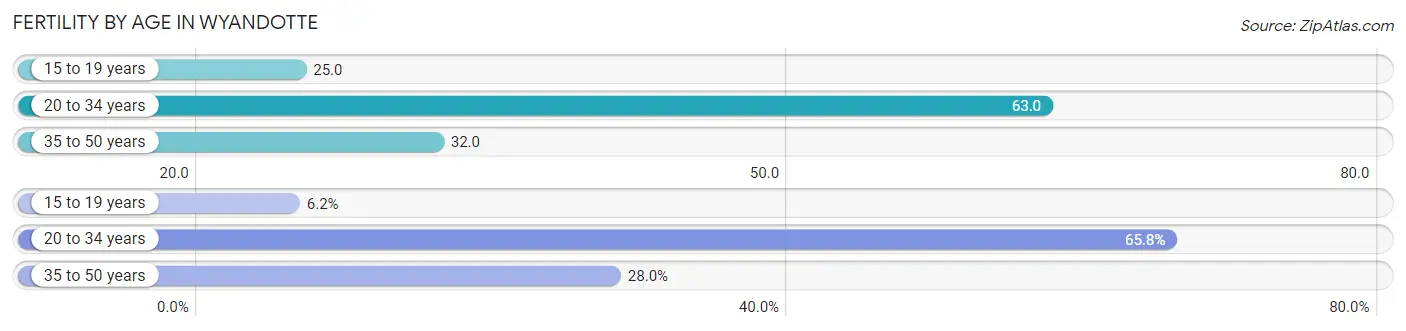
| Age Bracket | Women with Births | Births / 1,000 Women |
| 15 to 19 years | 16 (6.2%) | 25.0 |
| 20 to 34 years | 169 (65.8%) | 63.0 |
| 35 to 50 years | 72 (28.0%) | 32.0 |
| Total | 257 (100.0%) | 46.0 |
Fertility by Age by Marriage Status in Wyandotte
76.3% of women with births (257) in Wyandotte are married. The highest percentage of unmarried women with births falls into 15 to 19 years age bracket with 100.0% of them unmarried at the time of birth, while the lowest percentage of unmarried women with births belong to 35 to 50 years age bracket with 13.9% of them unmarried.
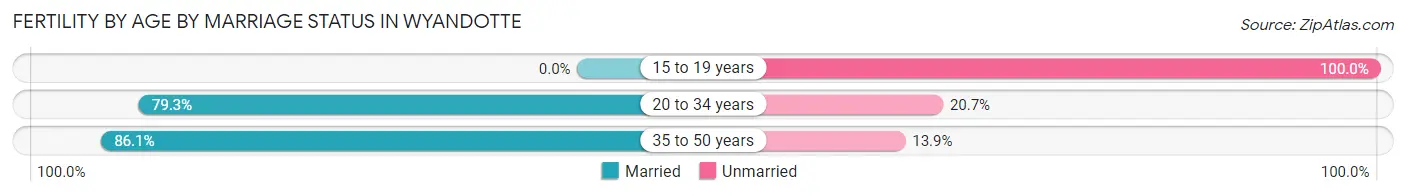
| Age Bracket | Married | Unmarried |
| 15 to 19 years | 0 (0.0%) | 16 (100.0%) |
| 20 to 34 years | 134 (79.3%) | 35 (20.7%) |
| 35 to 50 years | 62 (86.1%) | 10 (13.9%) |
| Total | 196 (76.3%) | 61 (23.7%) |
Fertility by Education in Wyandotte
Average fertility rate in Wyandotte is 46.0 births per 1,000 women. Women with the education attainment of high school diploma have the highest fertility rate of 81.0 births per 1,000 women, while women with the education attainment of less than high school have the lowest fertility at 15.0 births per 1,000 women. Women with the education attainment of college or associate's degree represent 38.1% of all women with births.
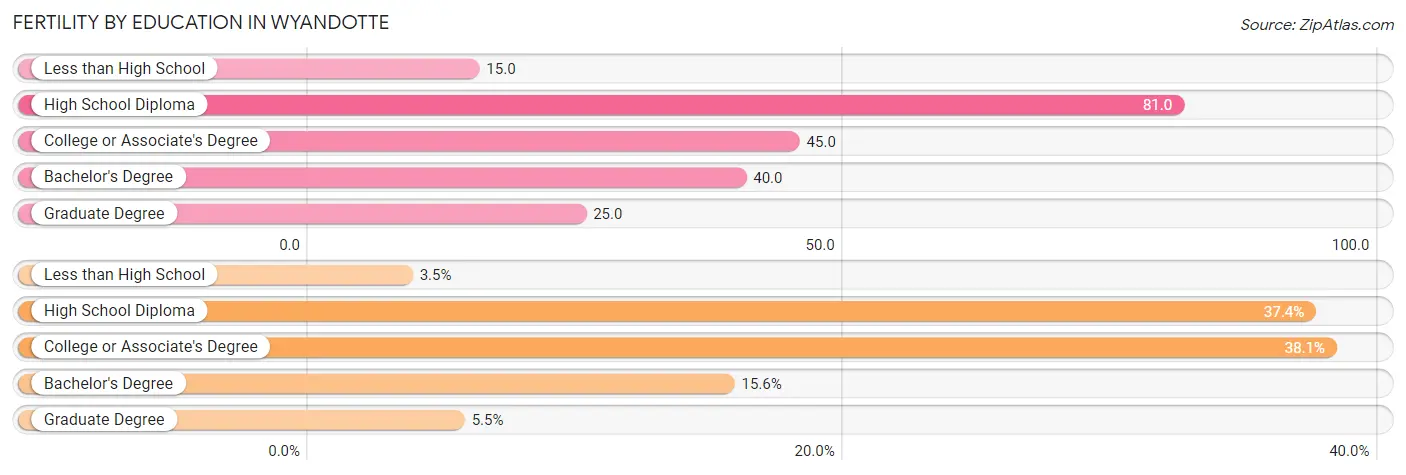
| Educational Attainment | Women with Births | Births / 1,000 Women |
| Less than High School | 9 (3.5%) | 15.0 |
| High School Diploma | 96 (37.3%) | 81.0 |
| College or Associate's Degree | 98 (38.1%) | 45.0 |
| Bachelor's Degree | 40 (15.6%) | 40.0 |
| Graduate Degree | 14 (5.4%) | 25.0 |
| Total | 257 (100.0%) | 46.0 |
Fertility by Education by Marriage Status in Wyandotte
23.7% of women with births in Wyandotte are unmarried. Women with the educational attainment of less than high school are most likely to be married with 100.0% of them married at childbirth, while women with the educational attainment of college or associate's degree are least likely to be married with 35.7% of them unmarried at childbirth.
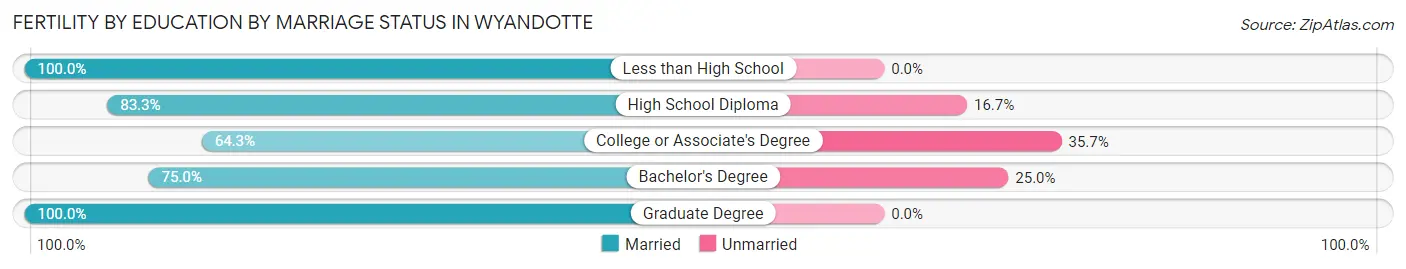
| Educational Attainment | Married | Unmarried |
| Less than High School | 9 (100.0%) | 0 (0.0%) |
| High School Diploma | 80 (83.3%) | 16 (16.7%) |
| College or Associate's Degree | 63 (64.3%) | 35 (35.7%) |
| Bachelor's Degree | 30 (75.0%) | 10 (25.0%) |
| Graduate Degree | 14 (100.0%) | 0 (0.0%) |
| Total | 196 (76.3%) | 61 (23.7%) |
Employment Characteristics in Wyandotte
Employment by Class of Employer in Wyandotte
Among the 11,789 employed individuals in Wyandotte, private company employees (9,063 | 76.9%), not-for-profit organizations (935 | 7.9%), and local government employees (777 | 6.6%) make up the most common classes of employment.
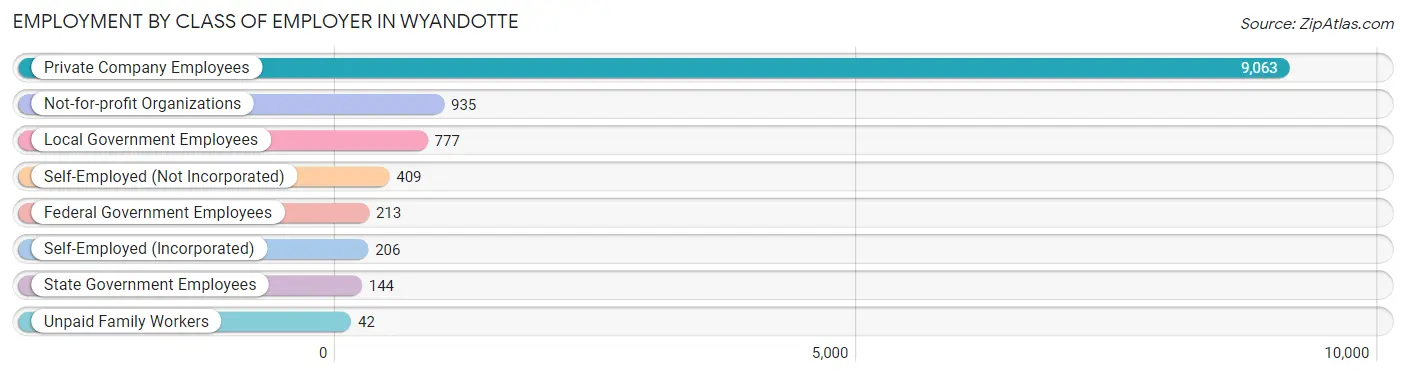
| Employer Class | # Employees | % Employees |
| Private Company Employees | 9,063 | 76.9% |
| Self-Employed (Incorporated) | 206 | 1.8% |
| Self-Employed (Not Incorporated) | 409 | 3.5% |
| Not-for-profit Organizations | 935 | 7.9% |
| Local Government Employees | 777 | 6.6% |
| State Government Employees | 144 | 1.2% |
| Federal Government Employees | 213 | 1.8% |
| Unpaid Family Workers | 42 | 0.4% |
| Total | 11,789 | 100.0% |
Employment Status by Age in Wyandotte
According to the labor force statistics for Wyandotte, out of the total population over 16 years of age (20,461), 61.7% or 12,624 individuals are in the labor force, with 4.1% or 518 of them unemployed. The age group with the highest labor force participation rate is 25 to 29 years, with 89.0% or 1,970 individuals in the labor force. Within the labor force, the 16 to 19 years age range has the highest percentage of unemployed individuals, with 11.9% or 43 of them being unemployed.
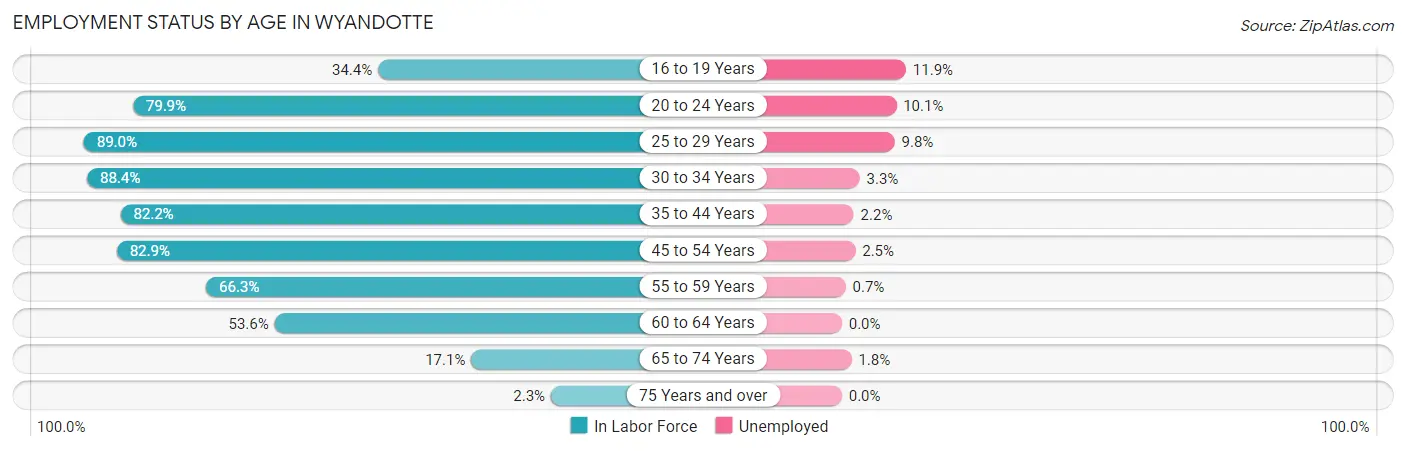
| Age Bracket | In Labor Force | Unemployed |
| 16 to 19 Years | 361 (34.4%) | 43 (11.9%) |
| 20 to 24 Years | 1,051 (79.9%) | 106 (10.1%) |
| 25 to 29 Years | 1,970 (89.0%) | 193 (9.8%) |
| 30 to 34 Years | 1,655 (88.4%) | 55 (3.3%) |
| 35 to 44 Years | 2,416 (82.2%) | 53 (2.2%) |
| 45 to 54 Years | 2,408 (82.9%) | 60 (2.5%) |
| 55 to 59 Years | 1,181 (66.3%) | 8 (0.7%) |
| 60 to 64 Years | 1,099 (53.6%) | 0 (0.0%) |
| 65 to 74 Years | 450 (17.1%) | 8 (1.8%) |
| 75 Years and over | 39 (2.3%) | 0 (0.0%) |
| Total | 12,624 (61.7%) | 518 (4.1%) |
Employment Status by Educational Attainment in Wyandotte
According to labor force statistics for Wyandotte, 78.0% of individuals (10,734) out of the total population between 25 and 64 years of age (13,761) are in the labor force, with 3.4% or 365 of them being unemployed. The group with the highest labor force participation rate are those with the educational attainment of bachelor's degree or higher, with 89.7% or 2,975 individuals in the labor force. Within the labor force, individuals with less than high school education have the highest percentage of unemployment, with 9.9% or 55 of them being unemployed.
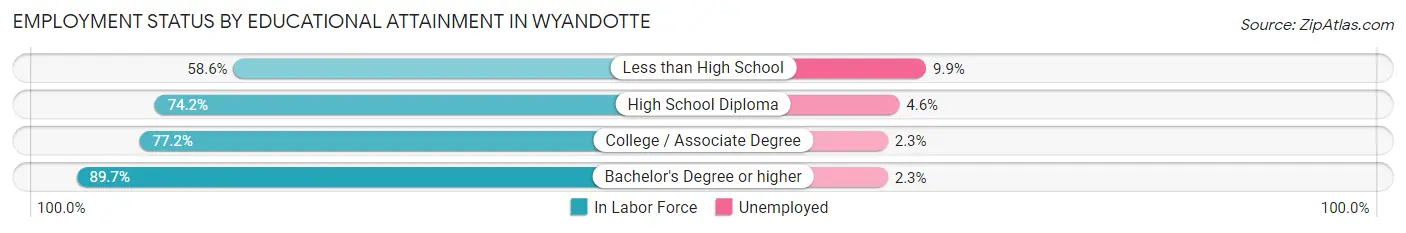
| Educational Attainment | In Labor Force | Unemployed |
| Less than High School | 555 (58.6%) | 94 (9.9%) |
| High School Diploma | 3,230 (74.2%) | 200 (4.6%) |
| College / Associate Degree | 3,971 (77.2%) | 118 (2.3%) |
| Bachelor's Degree or higher | 2,975 (89.7%) | 76 (2.3%) |
| Total | 10,734 (78.0%) | 468 (3.4%) |
Employment Occupations by Sex in Wyandotte
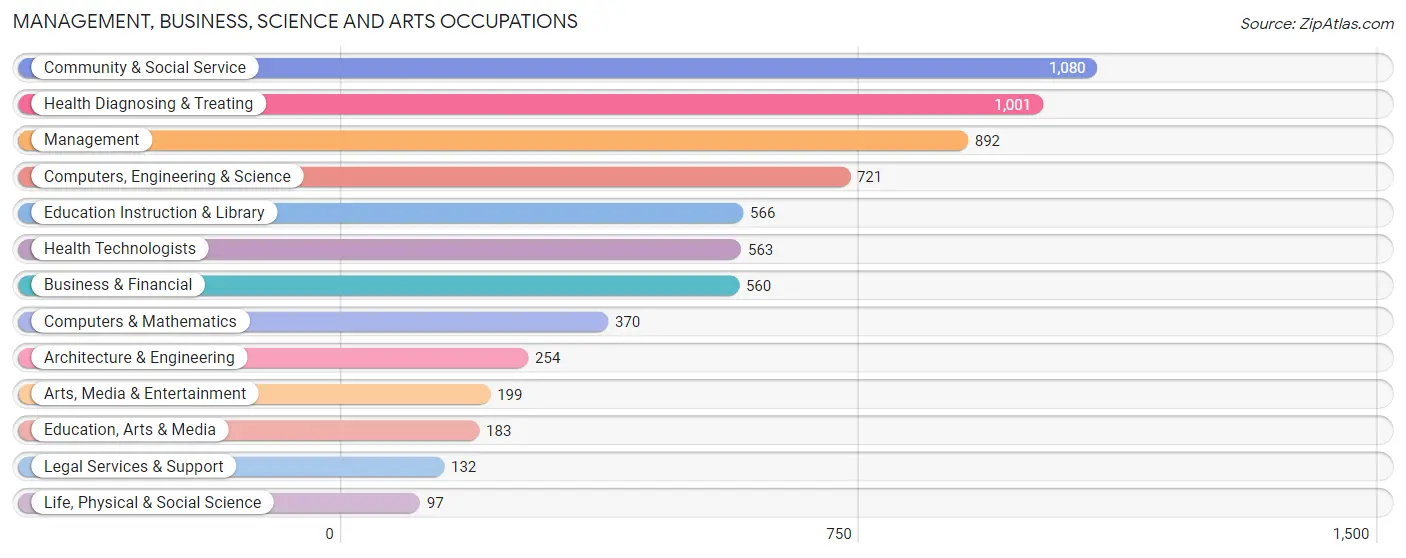
Management, Business, Science and Arts Occupations
The most common Management, Business, Science and Arts occupations in Wyandotte are Community & Social Service (1,080 | 9.0%), Health Diagnosing & Treating (1,001 | 8.3%), Management (892 | 7.4%), Computers, Engineering & Science (721 | 6.0%), and Education Instruction & Library (566 | 4.7%).
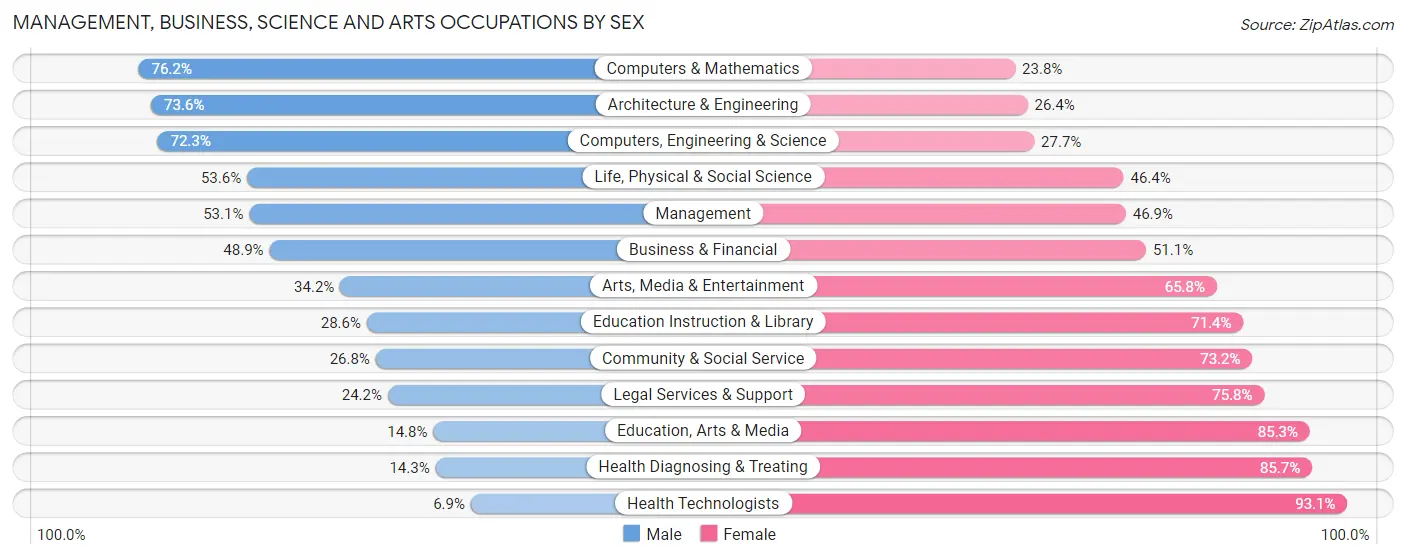
Management, Business, Science and Arts Occupations by Sex
Within the Management, Business, Science and Arts occupations in Wyandotte, the most male-oriented occupations are Computers & Mathematics (76.2%), Architecture & Engineering (73.6%), and Computers, Engineering & Science (72.3%), while the most female-oriented occupations are Health Technologists (93.1%), Health Diagnosing & Treating (85.7%), and Education, Arts & Media (85.3%).
| Occupation | Male | Female |
| Management | 474 (53.1%) | 418 (46.9%) |
| Business & Financial | 274 (48.9%) | 286 (51.1%) |
| Computers, Engineering & Science | 521 (72.3%) | 200 (27.7%) |
| Computers & Mathematics | 282 (76.2%) | 88 (23.8%) |
| Architecture & Engineering | 187 (73.6%) | 67 (26.4%) |
| Life, Physical & Social Science | 52 (53.6%) | 45 (46.4%) |
| Community & Social Service | 289 (26.8%) | 791 (73.2%) |
| Education, Arts & Media | 27 (14.7%) | 156 (85.3%) |
| Legal Services & Support | 32 (24.2%) | 100 (75.8%) |
| Education Instruction & Library | 162 (28.6%) | 404 (71.4%) |
| Arts, Media & Entertainment | 68 (34.2%) | 131 (65.8%) |
| Health Diagnosing & Treating | 143 (14.3%) | 858 (85.7%) |
| Health Technologists | 39 (6.9%) | 524 (93.1%) |
| Total (Category) | 1,701 (40.0%) | 2,553 (60.0%) |
| Total (Overall) | 6,036 (50.1%) | 6,013 (49.9%) |
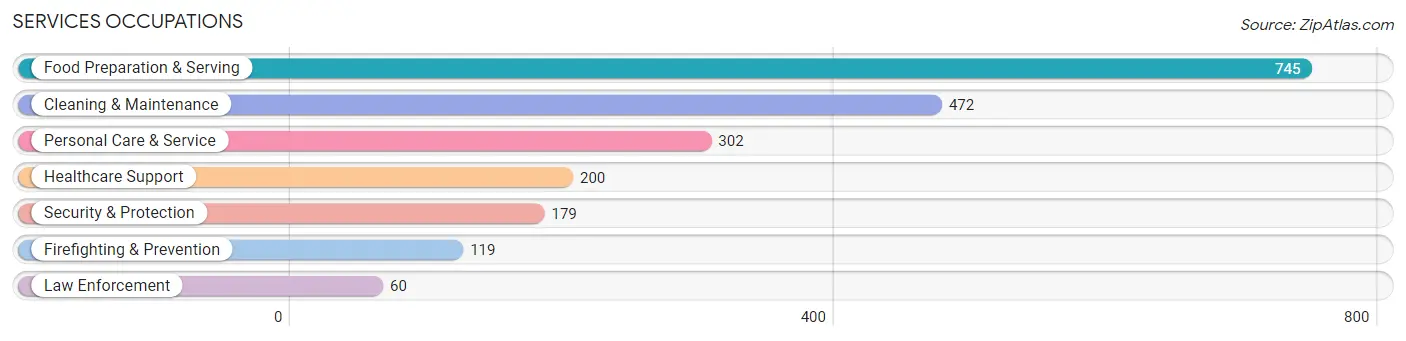
Services Occupations
The most common Services occupations in Wyandotte are Food Preparation & Serving (745 | 6.2%), Cleaning & Maintenance (472 | 3.9%), Personal Care & Service (302 | 2.5%), Healthcare Support (200 | 1.7%), and Security & Protection (179 | 1.5%).
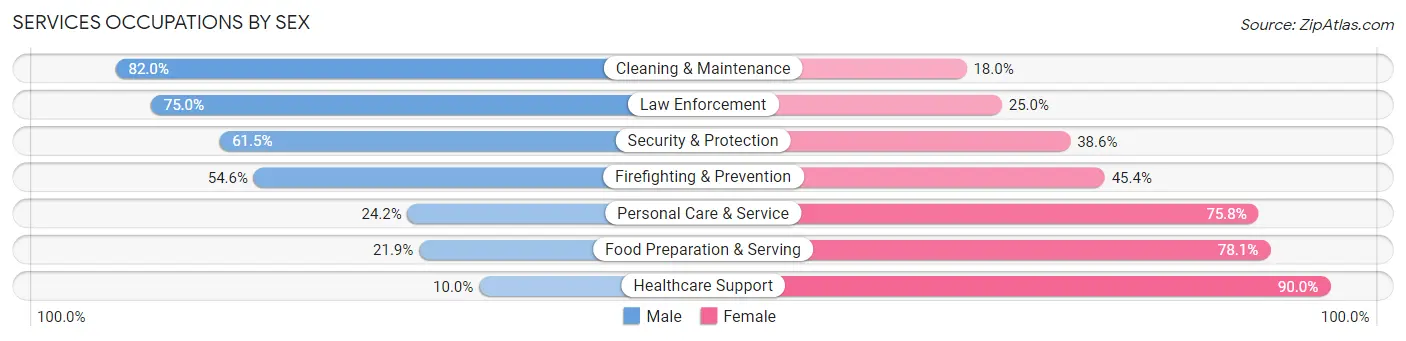
Services Occupations by Sex
Within the Services occupations in Wyandotte, the most male-oriented occupations are Cleaning & Maintenance (82.0%), Law Enforcement (75.0%), and Security & Protection (61.5%), while the most female-oriented occupations are Healthcare Support (90.0%), Food Preparation & Serving (78.1%), and Personal Care & Service (75.8%).
| Occupation | Male | Female |
| Healthcare Support | 20 (10.0%) | 180 (90.0%) |
| Security & Protection | 110 (61.5%) | 69 (38.6%) |
| Firefighting & Prevention | 65 (54.6%) | 54 (45.4%) |
| Law Enforcement | 45 (75.0%) | 15 (25.0%) |
| Food Preparation & Serving | 163 (21.9%) | 582 (78.1%) |
| Cleaning & Maintenance | 387 (82.0%) | 85 (18.0%) |
| Personal Care & Service | 73 (24.2%) | 229 (75.8%) |
| Total (Category) | 753 (39.7%) | 1,145 (60.3%) |
| Total (Overall) | 6,036 (50.1%) | 6,013 (49.9%) |
Sales and Office Occupations
The most common Sales and Office occupations in Wyandotte are Office & Administration (1,655 | 13.7%), and Sales & Related (1,037 | 8.6%).

Sales and Office Occupations by Sex
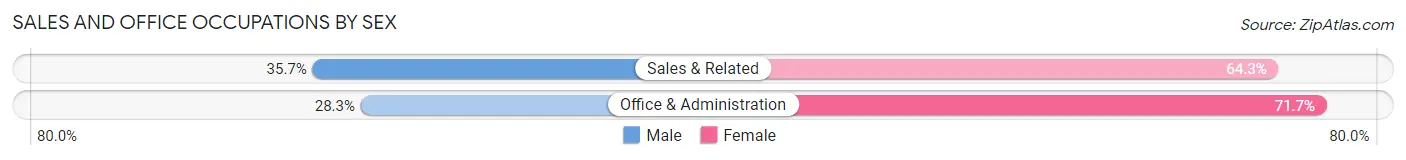
| Occupation | Male | Female |
| Sales & Related | 370 (35.7%) | 667 (64.3%) |
| Office & Administration | 468 (28.3%) | 1,187 (71.7%) |
| Total (Category) | 838 (31.1%) | 1,854 (68.9%) |
| Total (Overall) | 6,036 (50.1%) | 6,013 (49.9%) |
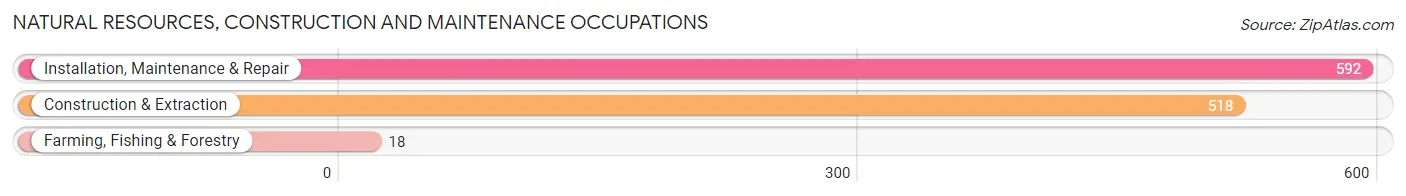
Natural Resources, Construction and Maintenance Occupations
The most common Natural Resources, Construction and Maintenance occupations in Wyandotte are Installation, Maintenance & Repair (592 | 4.9%), Construction & Extraction (518 | 4.3%), and Farming, Fishing & Forestry (18 | 0.2%).
Natural Resources, Construction and Maintenance Occupations by Sex
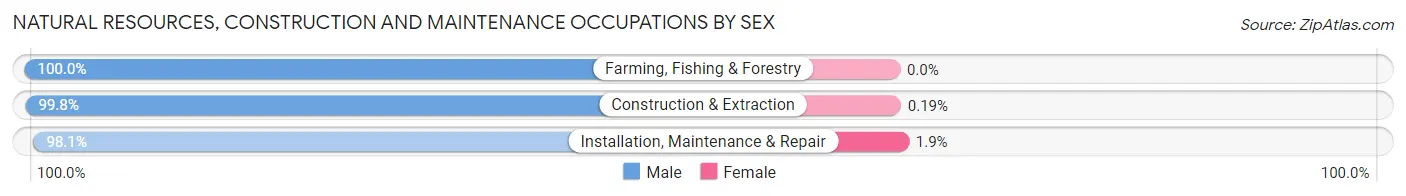
| Occupation | Male | Female |
| Farming, Fishing & Forestry | 18 (100.0%) | 0 (0.0%) |
| Construction & Extraction | 517 (99.8%) | 1 (0.2%) |
| Installation, Maintenance & Repair | 581 (98.1%) | 11 (1.9%) |
| Total (Category) | 1,116 (98.9%) | 12 (1.1%) |
| Total (Overall) | 6,036 (50.1%) | 6,013 (49.9%) |
Production, Transportation and Moving Occupations
The most common Production, Transportation and Moving occupations in Wyandotte are Production (1,097 | 9.1%), Transportation (520 | 4.3%), and Material Moving (460 | 3.8%).

Production, Transportation and Moving Occupations by Sex
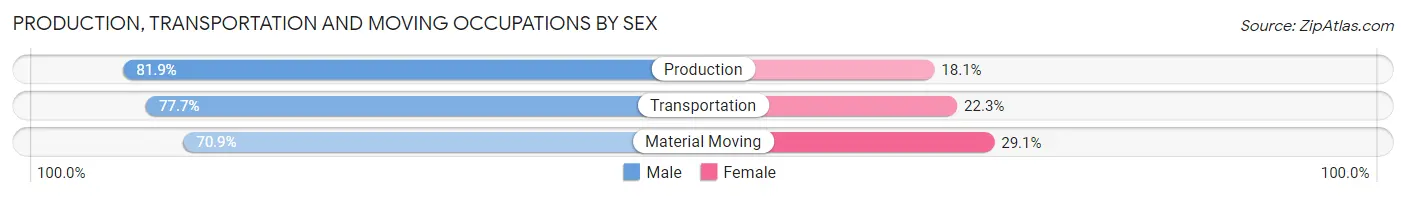
| Occupation | Male | Female |
| Production | 898 (81.9%) | 199 (18.1%) |
| Transportation | 404 (77.7%) | 116 (22.3%) |
| Material Moving | 326 (70.9%) | 134 (29.1%) |
| Total (Category) | 1,628 (78.4%) | 449 (21.6%) |
| Total (Overall) | 6,036 (50.1%) | 6,013 (49.9%) |
Employment Industries by Sex in Wyandotte
Employment Industries in Wyandotte
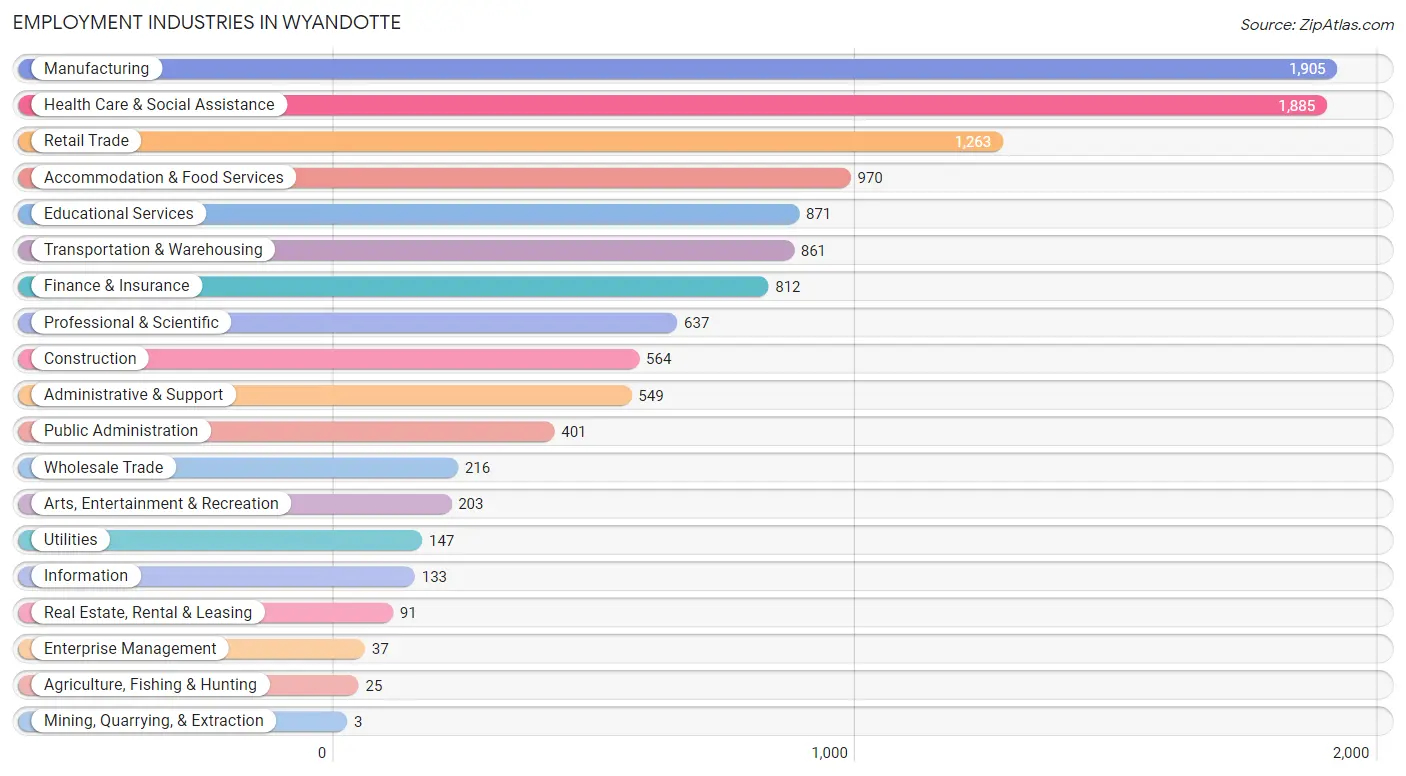
The major employment industries in Wyandotte include Manufacturing (1,905 | 15.8%), Health Care & Social Assistance (1,885 | 15.6%), Retail Trade (1,263 | 10.5%), Accommodation & Food Services (970 | 8.1%), and Educational Services (871 | 7.2%).
Employment Industries by Sex in Wyandotte
The Wyandotte industries that see more men than women are Agriculture, Fishing & Hunting (100.0%), Mining, Quarrying, & Extraction (100.0%), and Construction (93.6%), whereas the industries that tend to have a higher number of women are Health Care & Social Assistance (85.5%), Finance & Insurance (70.7%), and Accommodation & Food Services (65.8%).
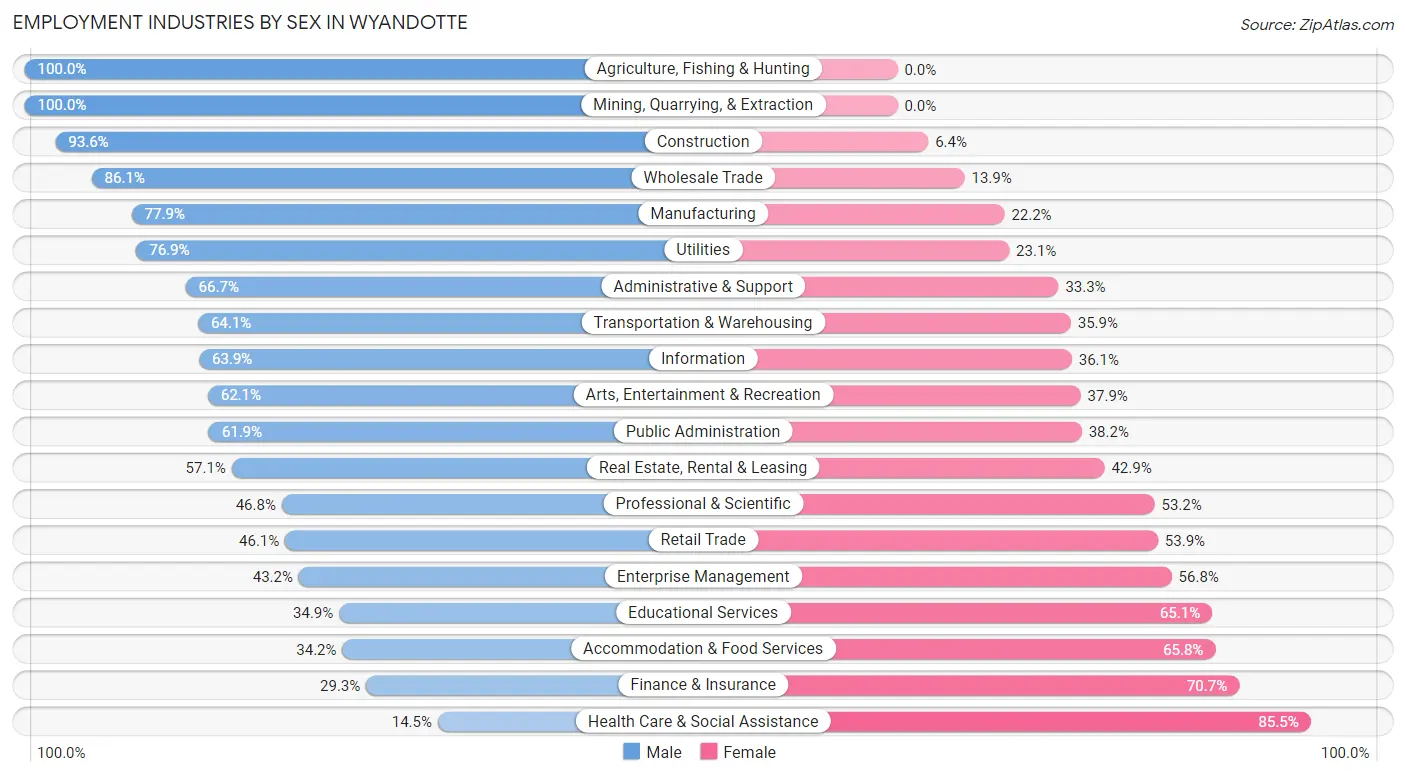
| Industry | Male | Female |
| Agriculture, Fishing & Hunting | 25 (100.0%) | 0 (0.0%) |
| Mining, Quarrying, & Extraction | 3 (100.0%) | 0 (0.0%) |
| Construction | 528 (93.6%) | 36 (6.4%) |
| Manufacturing | 1,483 (77.8%) | 422 (22.2%) |
| Wholesale Trade | 186 (86.1%) | 30 (13.9%) |
| Retail Trade | 582 (46.1%) | 681 (53.9%) |
| Transportation & Warehousing | 552 (64.1%) | 309 (35.9%) |
| Utilities | 113 (76.9%) | 34 (23.1%) |
| Information | 85 (63.9%) | 48 (36.1%) |
| Finance & Insurance | 238 (29.3%) | 574 (70.7%) |
| Real Estate, Rental & Leasing | 52 (57.1%) | 39 (42.9%) |
| Professional & Scientific | 298 (46.8%) | 339 (53.2%) |
| Enterprise Management | 16 (43.2%) | 21 (56.8%) |
| Administrative & Support | 366 (66.7%) | 183 (33.3%) |
| Educational Services | 304 (34.9%) | 567 (65.1%) |
| Health Care & Social Assistance | 273 (14.5%) | 1,612 (85.5%) |
| Arts, Entertainment & Recreation | 126 (62.1%) | 77 (37.9%) |
| Accommodation & Food Services | 332 (34.2%) | 638 (65.8%) |
| Public Administration | 248 (61.9%) | 153 (38.2%) |
| Total | 6,036 (50.1%) | 6,013 (49.9%) |
Education in Wyandotte
School Enrollment in Wyandotte
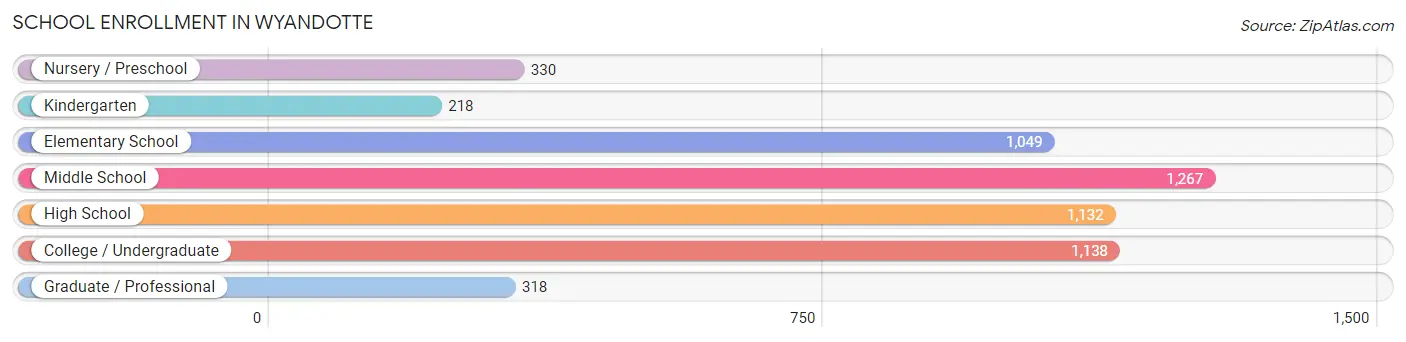
The most common levels of schooling among the 5,452 students in Wyandotte are middle school (1,267 | 23.2%), college / undergraduate (1,138 | 20.9%), and high school (1,132 | 20.8%).
| School Level | # Students | % Students |
| Nursery / Preschool | 330 | 6.0% |
| Kindergarten | 218 | 4.0% |
| Elementary School | 1,049 | 19.2% |
| Middle School | 1,267 | 23.2% |
| High School | 1,132 | 20.8% |
| College / Undergraduate | 1,138 | 20.9% |
| Graduate / Professional | 318 | 5.8% |
| Total | 5,452 | 100.0% |
School Enrollment by Age by Funding Source in Wyandotte
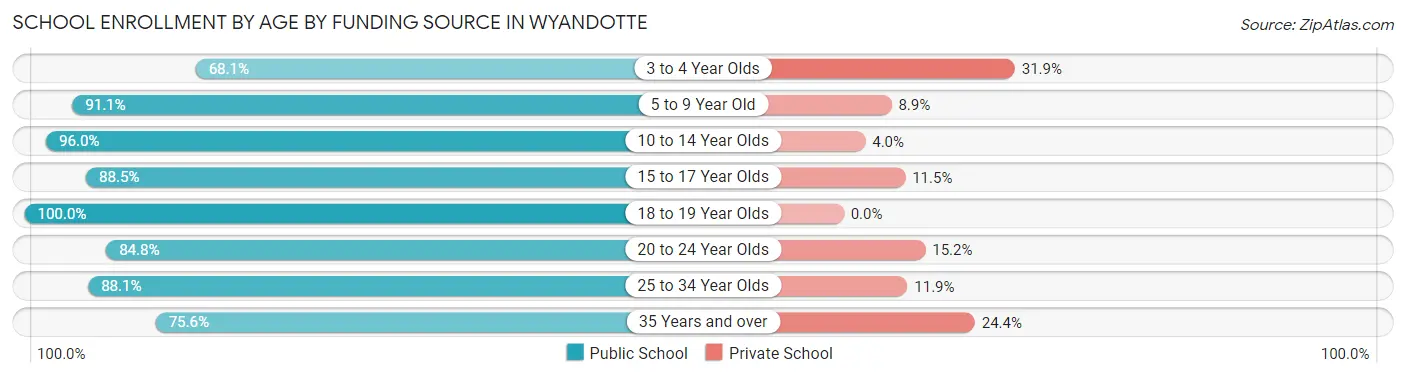
Out of a total of 5,452 students who are enrolled in schools in Wyandotte, 556 (10.2%) attend a private institution, while the remaining 4,896 (89.8%) are enrolled in public schools. The age group of 3 to 4 year olds has the highest likelihood of being enrolled in private schools, with 88 (31.9% in the age bracket) enrolled. Conversely, the age group of 18 to 19 year olds has the lowest likelihood of being enrolled in a private school, with 328 (100.0% in the age bracket) attending a public institution.
| Age Bracket | Public School | Private School |
| 3 to 4 Year Olds | 188 (68.1%) | 88 (31.9%) |
| 5 to 9 Year Old | 1,126 (91.1%) | 110 (8.9%) |
| 10 to 14 Year Olds | 1,506 (96.0%) | 63 (4.0%) |
| 15 to 17 Year Olds | 664 (88.5%) | 86 (11.5%) |
| 18 to 19 Year Olds | 328 (100.0%) | 0 (0.0%) |
| 20 to 24 Year Olds | 407 (84.8%) | 73 (15.2%) |
| 25 to 34 Year Olds | 446 (88.1%) | 60 (11.9%) |
| 35 Years and over | 232 (75.6%) | 75 (24.4%) |
| Total | 4,896 (89.8%) | 556 (10.2%) |
Educational Attainment by Field of Study in Wyandotte
Business (913 | 21.0%), science & technology (634 | 14.6%), education (569 | 13.1%), social sciences (319 | 7.3%), and arts & humanities (295 | 6.8%) are the most common fields of study among 4,344 individuals in Wyandotte who have obtained a bachelor's degree or higher.
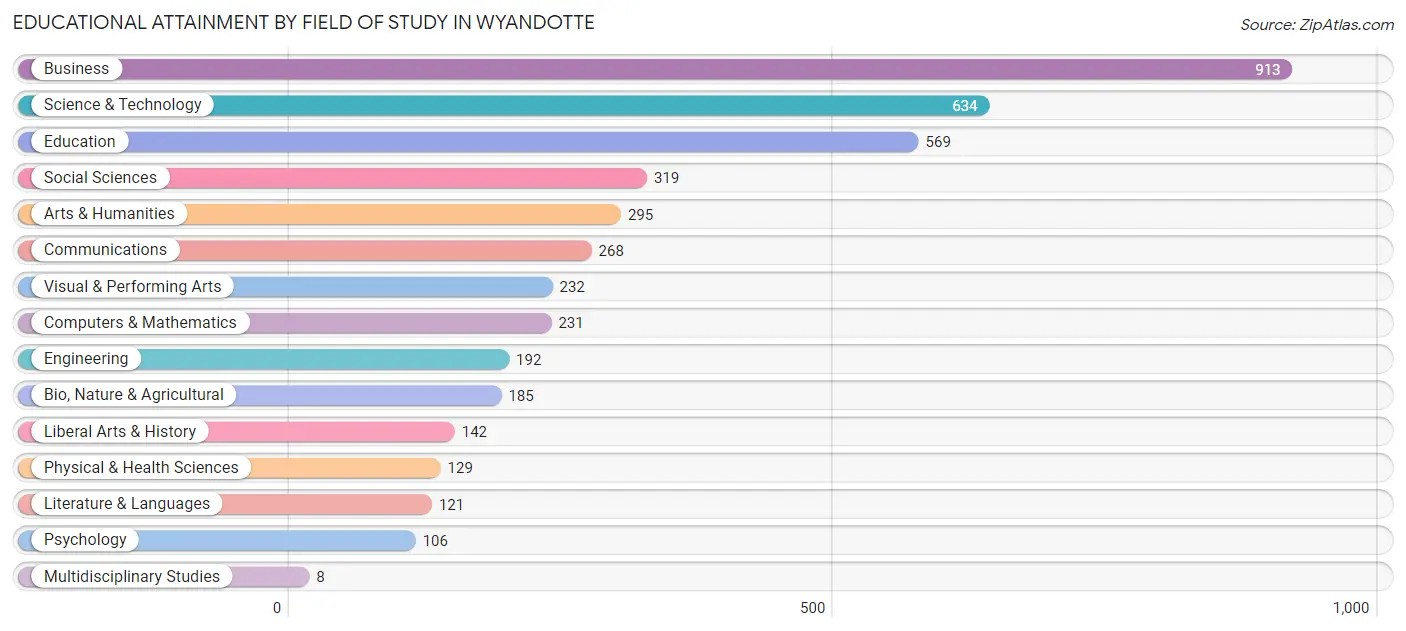
| Field of Study | # Graduates | % Graduates |
| Computers & Mathematics | 231 | 5.3% |
| Bio, Nature & Agricultural | 185 | 4.3% |
| Physical & Health Sciences | 129 | 3.0% |
| Psychology | 106 | 2.4% |
| Social Sciences | 319 | 7.3% |
| Engineering | 192 | 4.4% |
| Multidisciplinary Studies | 8 | 0.2% |
| Science & Technology | 634 | 14.6% |
| Business | 913 | 21.0% |
| Education | 569 | 13.1% |
| Literature & Languages | 121 | 2.8% |
| Liberal Arts & History | 142 | 3.3% |
| Visual & Performing Arts | 232 | 5.3% |
| Communications | 268 | 6.2% |
| Arts & Humanities | 295 | 6.8% |
| Total | 4,344 | 100.0% |
Transportation & Commute in Wyandotte
Vehicle Availability by Sex in Wyandotte
The most prevalent vehicle ownership categories in Wyandotte are males with 2 vehicles (2,702, accounting for 45.8%) and females with 2 vehicles (2,574, making up 45.9%).
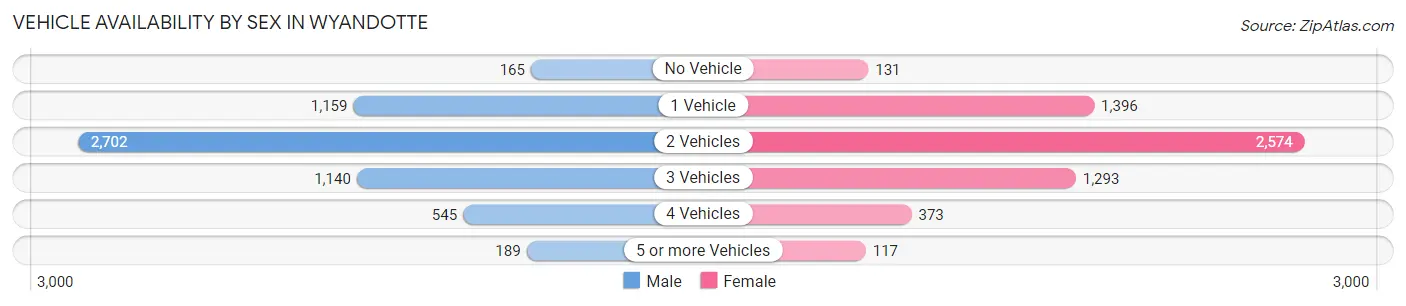
| Vehicles Available | Male | Female |
| No Vehicle | 165 (2.8%) | 131 (2.2%) |
| 1 Vehicle | 1,159 (19.6%) | 1,396 (23.7%) |
| 2 Vehicles | 2,702 (45.8%) | 2,574 (43.8%) |
| 3 Vehicles | 1,140 (19.3%) | 1,293 (22.0%) |
| 4 Vehicles | 545 (9.2%) | 373 (6.3%) |
| 5 or more Vehicles | 189 (3.2%) | 117 (2.0%) |
| Total | 5,900 (100.0%) | 5,884 (100.0%) |
Commute Time in Wyandotte
The most frequently occuring commute durations in Wyandotte are 15 to 19 minutes (1,620 commuters, 15.1%), 20 to 24 minutes (1,542 commuters, 14.4%), and 5 to 9 minutes (1,480 commuters, 13.8%).
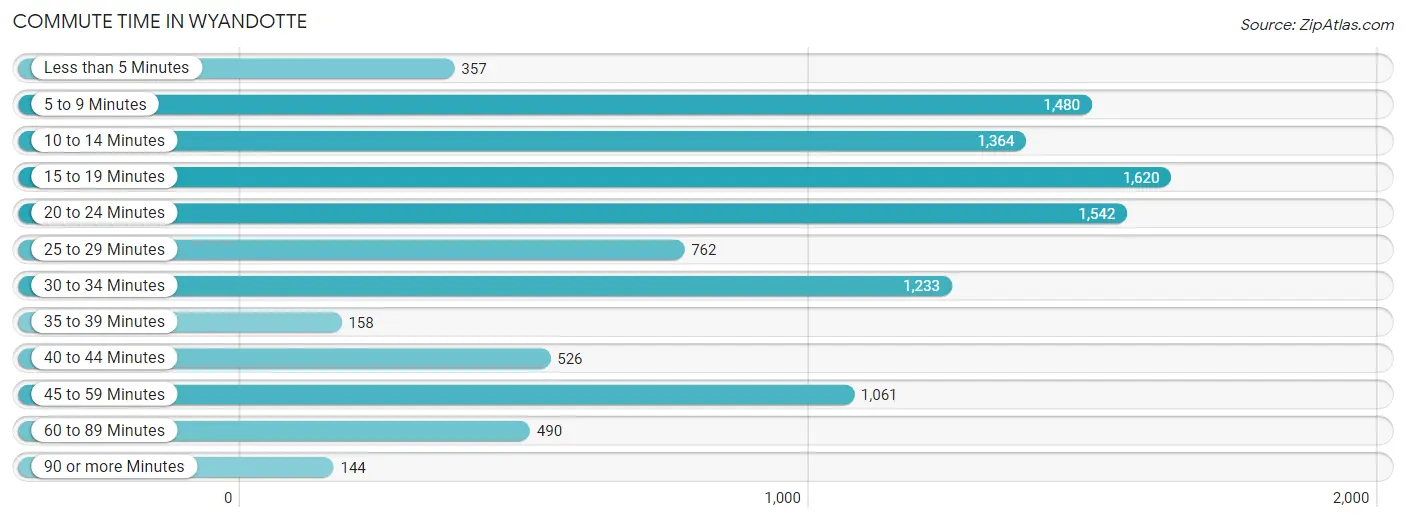
| Commute Time | # Commuters | % Commuters |
| Less than 5 Minutes | 357 | 3.3% |
| 5 to 9 Minutes | 1,480 | 13.8% |
| 10 to 14 Minutes | 1,364 | 12.7% |
| 15 to 19 Minutes | 1,620 | 15.1% |
| 20 to 24 Minutes | 1,542 | 14.4% |
| 25 to 29 Minutes | 762 | 7.1% |
| 30 to 34 Minutes | 1,233 | 11.5% |
| 35 to 39 Minutes | 158 | 1.5% |
| 40 to 44 Minutes | 526 | 4.9% |
| 45 to 59 Minutes | 1,061 | 9.9% |
| 60 to 89 Minutes | 490 | 4.6% |
| 90 or more Minutes | 144 | 1.3% |
Commute Time by Sex in Wyandotte
The most common commute times in Wyandotte are 15 to 19 minutes (917 commuters, 16.8%) for males and 5 to 9 minutes (850 commuters, 16.1%) for females.
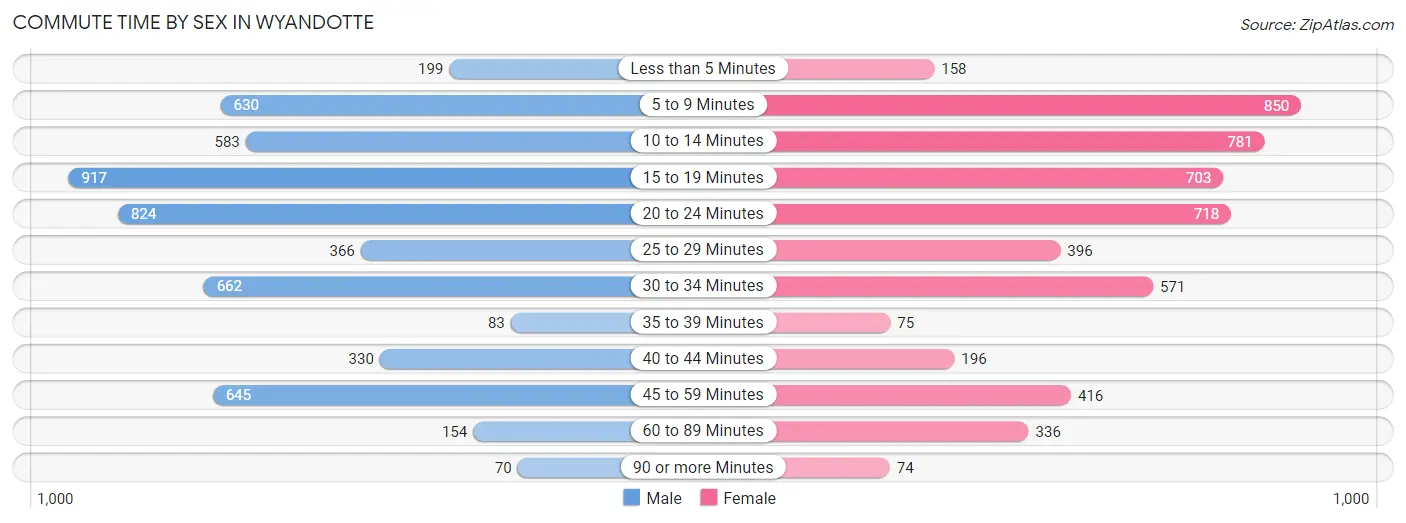
| Commute Time | Male | Female |
| Less than 5 Minutes | 199 (3.6%) | 158 (3.0%) |
| 5 to 9 Minutes | 630 (11.5%) | 850 (16.1%) |
| 10 to 14 Minutes | 583 (10.7%) | 781 (14.8%) |
| 15 to 19 Minutes | 917 (16.8%) | 703 (13.3%) |
| 20 to 24 Minutes | 824 (15.1%) | 718 (13.6%) |
| 25 to 29 Minutes | 366 (6.7%) | 396 (7.5%) |
| 30 to 34 Minutes | 662 (12.1%) | 571 (10.8%) |
| 35 to 39 Minutes | 83 (1.5%) | 75 (1.4%) |
| 40 to 44 Minutes | 330 (6.0%) | 196 (3.7%) |
| 45 to 59 Minutes | 645 (11.8%) | 416 (7.9%) |
| 60 to 89 Minutes | 154 (2.8%) | 336 (6.4%) |
| 90 or more Minutes | 70 (1.3%) | 74 (1.4%) |
Time of Departure to Work by Sex in Wyandotte
The most frequent times of departure to work in Wyandotte are 7:00 AM to 7:29 AM (1,047, 19.2%) for males and 8:00 AM to 8:29 AM (715, 13.6%) for females.
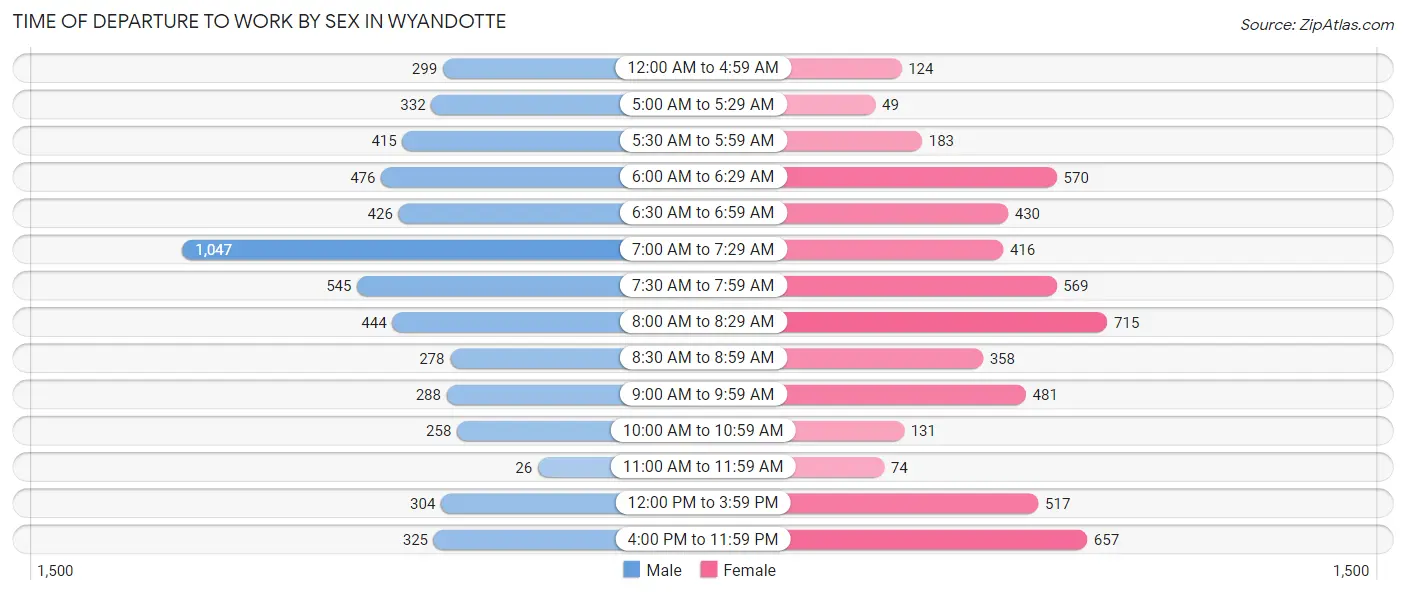
| Time of Departure | Male | Female |
| 12:00 AM to 4:59 AM | 299 (5.5%) | 124 (2.4%) |
| 5:00 AM to 5:29 AM | 332 (6.1%) | 49 (0.9%) |
| 5:30 AM to 5:59 AM | 415 (7.6%) | 183 (3.5%) |
| 6:00 AM to 6:29 AM | 476 (8.7%) | 570 (10.8%) |
| 6:30 AM to 6:59 AM | 426 (7.8%) | 430 (8.2%) |
| 7:00 AM to 7:29 AM | 1,047 (19.2%) | 416 (7.9%) |
| 7:30 AM to 7:59 AM | 545 (10.0%) | 569 (10.8%) |
| 8:00 AM to 8:29 AM | 444 (8.1%) | 715 (13.6%) |
| 8:30 AM to 8:59 AM | 278 (5.1%) | 358 (6.8%) |
| 9:00 AM to 9:59 AM | 288 (5.3%) | 481 (9.1%) |
| 10:00 AM to 10:59 AM | 258 (4.7%) | 131 (2.5%) |
| 11:00 AM to 11:59 AM | 26 (0.5%) | 74 (1.4%) |
| 12:00 PM to 3:59 PM | 304 (5.6%) | 517 (9.8%) |
| 4:00 PM to 11:59 PM | 325 (5.9%) | 657 (12.5%) |
| Total | 5,463 (100.0%) | 5,274 (100.0%) |
Housing Occupancy in Wyandotte
Occupancy by Ownership in Wyandotte
Of the total 10,852 dwellings in Wyandotte, owner-occupied units account for 7,953 (73.3%), while renter-occupied units make up 2,899 (26.7%).
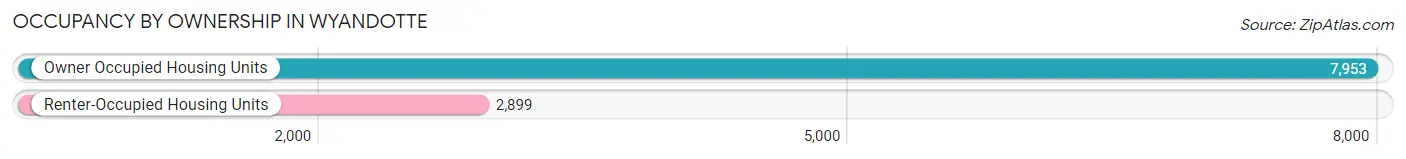
| Occupancy | # Housing Units | % Housing Units |
| Owner Occupied Housing Units | 7,953 | 73.3% |
| Renter-Occupied Housing Units | 2,899 | 26.7% |
| Total Occupied Housing Units | 10,852 | 100.0% |
Occupancy by Household Size in Wyandotte
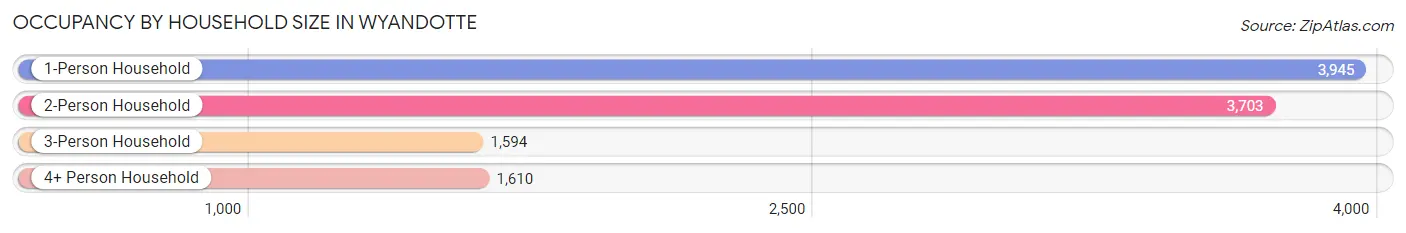
| Household Size | # Housing Units | % Housing Units |
| 1-Person Household | 3,945 | 36.3% |
| 2-Person Household | 3,703 | 34.1% |
| 3-Person Household | 1,594 | 14.7% |
| 4+ Person Household | 1,610 | 14.8% |
| Total Housing Units | 10,852 | 100.0% |
Occupancy by Ownership by Household Size in Wyandotte
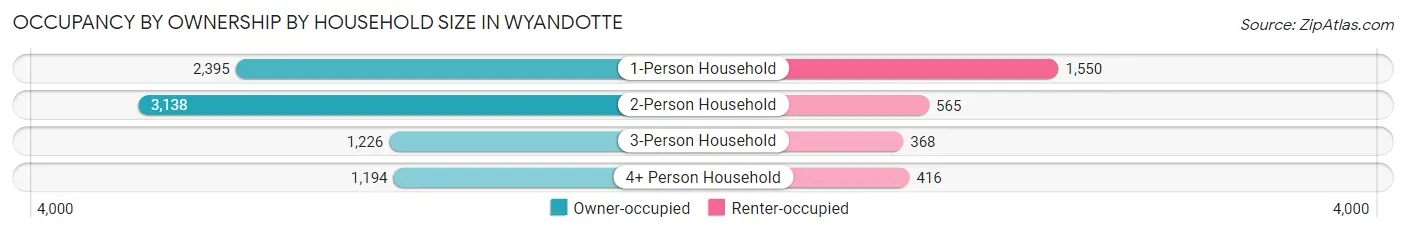
| Household Size | Owner-occupied | Renter-occupied |
| 1-Person Household | 2,395 (60.7%) | 1,550 (39.3%) |
| 2-Person Household | 3,138 (84.7%) | 565 (15.3%) |
| 3-Person Household | 1,226 (76.9%) | 368 (23.1%) |
| 4+ Person Household | 1,194 (74.2%) | 416 (25.8%) |
| Total Housing Units | 7,953 (73.3%) | 2,899 (26.7%) |
Occupancy by Educational Attainment in Wyandotte
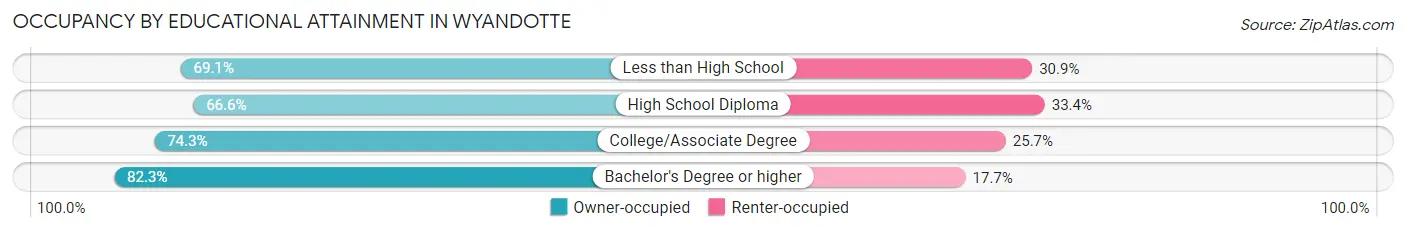
| Household Size | Owner-occupied | Renter-occupied |
| Less than High School | 491 (69.1%) | 220 (30.9%) |
| High School Diploma | 2,391 (66.6%) | 1,201 (33.4%) |
| College/Associate Degree | 2,947 (74.3%) | 1,020 (25.7%) |
| Bachelor's Degree or higher | 2,124 (82.3%) | 458 (17.7%) |
Occupancy by Age of Householder in Wyandotte
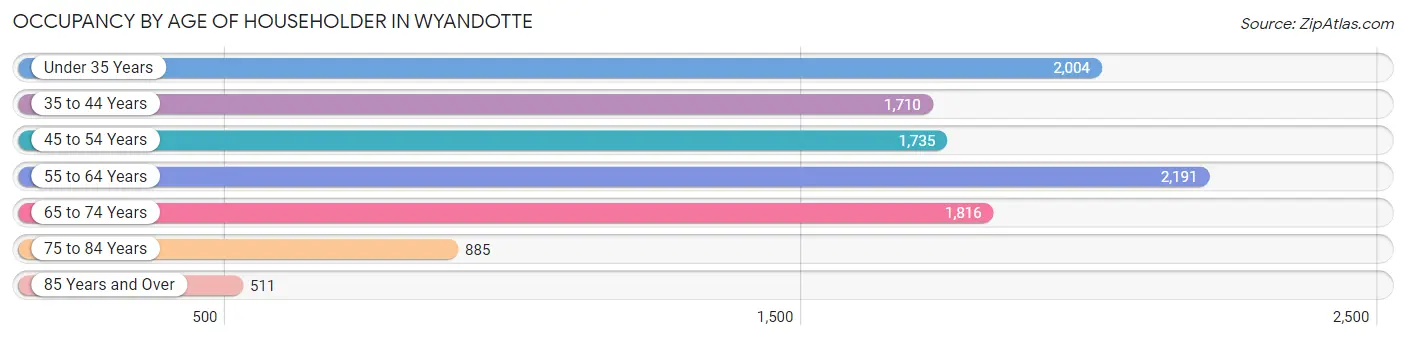
| Age Bracket | # Households | % Households |
| Under 35 Years | 2,004 | 18.5% |
| 35 to 44 Years | 1,710 | 15.8% |
| 45 to 54 Years | 1,735 | 16.0% |
| 55 to 64 Years | 2,191 | 20.2% |
| 65 to 74 Years | 1,816 | 16.7% |
| 75 to 84 Years | 885 | 8.2% |
| 85 Years and Over | 511 | 4.7% |
| Total | 10,852 | 100.0% |
Housing Finances in Wyandotte
Median Income by Occupancy in Wyandotte
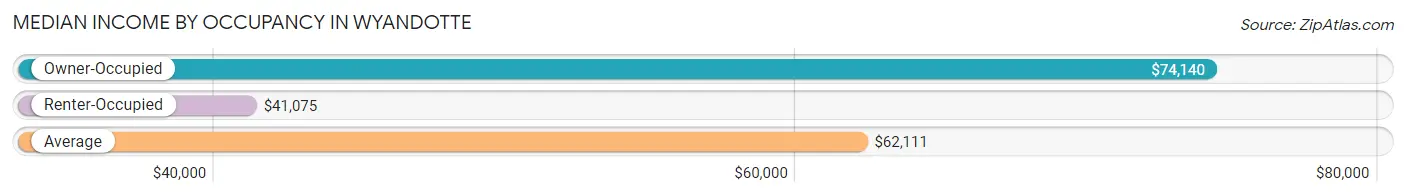
| Occupancy Type | # Households | Median Income |
| Owner-Occupied | 7,953 (73.3%) | $74,140 |
| Renter-Occupied | 2,899 (26.7%) | $41,075 |
| Average | 10,852 (100.0%) | $62,111 |
Occupancy by Householder Income Bracket in Wyandotte
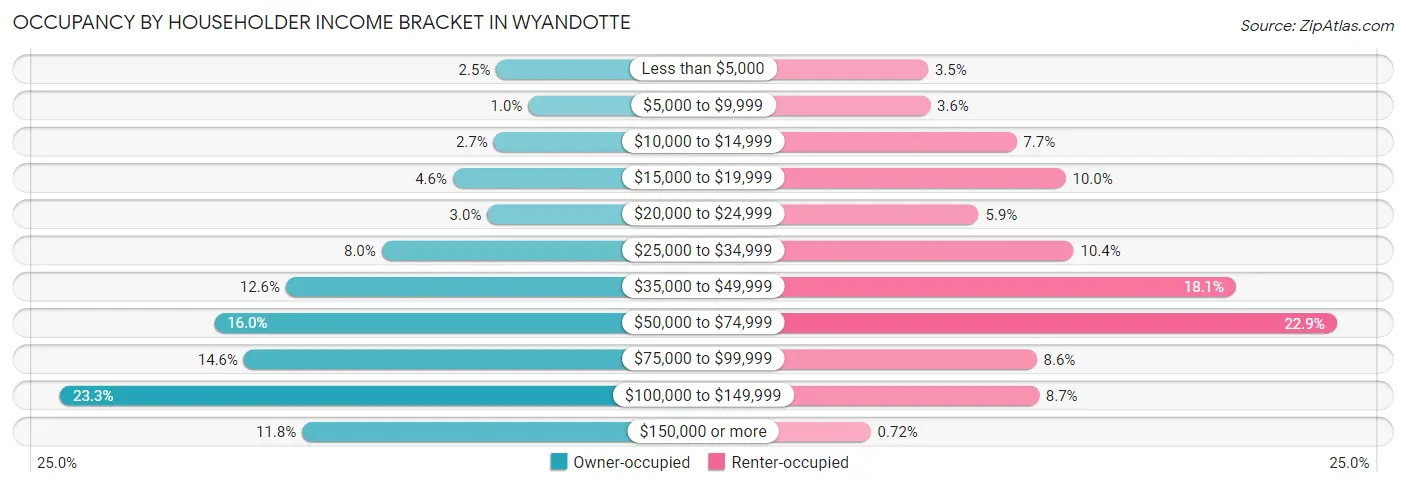
| Income Bracket | Owner-occupied | Renter-occupied |
| Less than $5,000 | 202 (2.5%) | 100 (3.5%) |
| $5,000 to $9,999 | 81 (1.0%) | 103 (3.5%) |
| $10,000 to $14,999 | 212 (2.7%) | 222 (7.7%) |
| $15,000 to $19,999 | 367 (4.6%) | 290 (10.0%) |
| $20,000 to $24,999 | 236 (3.0%) | 170 (5.9%) |
| $25,000 to $34,999 | 636 (8.0%) | 301 (10.4%) |
| $35,000 to $49,999 | 999 (12.6%) | 525 (18.1%) |
| $50,000 to $74,999 | 1,270 (16.0%) | 664 (22.9%) |
| $75,000 to $99,999 | 1,158 (14.6%) | 250 (8.6%) |
| $100,000 to $149,999 | 1,854 (23.3%) | 253 (8.7%) |
| $150,000 or more | 938 (11.8%) | 21 (0.7%) |
| Total | 7,953 (100.0%) | 2,899 (100.0%) |
Monthly Housing Cost Tiers in Wyandotte
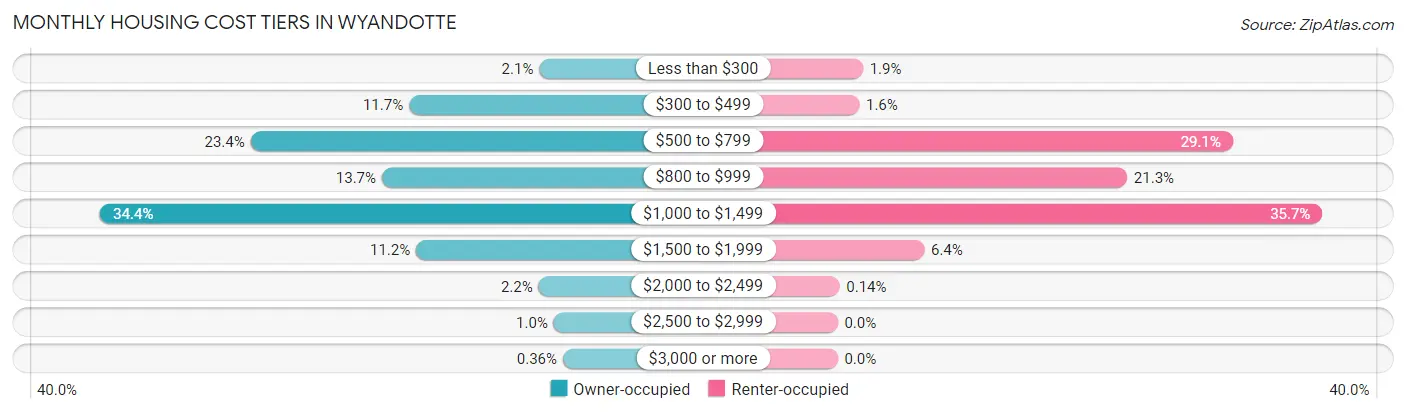
| Monthly Cost | Owner-occupied | Renter-occupied |
| Less than $300 | 167 (2.1%) | 54 (1.9%) |
| $300 to $499 | 930 (11.7%) | 46 (1.6%) |
| $500 to $799 | 1,858 (23.4%) | 844 (29.1%) |
| $800 to $999 | 1,089 (13.7%) | 618 (21.3%) |
| $1,000 to $1,499 | 2,739 (34.4%) | 1,035 (35.7%) |
| $1,500 to $1,999 | 888 (11.2%) | 185 (6.4%) |
| $2,000 to $2,499 | 171 (2.1%) | 4 (0.1%) |
| $2,500 to $2,999 | 82 (1.0%) | 0 (0.0%) |
| $3,000 or more | 29 (0.4%) | 0 (0.0%) |
| Total | 7,953 (100.0%) | 2,899 (100.0%) |
Physical Housing Characteristics in Wyandotte
Housing Structures in Wyandotte
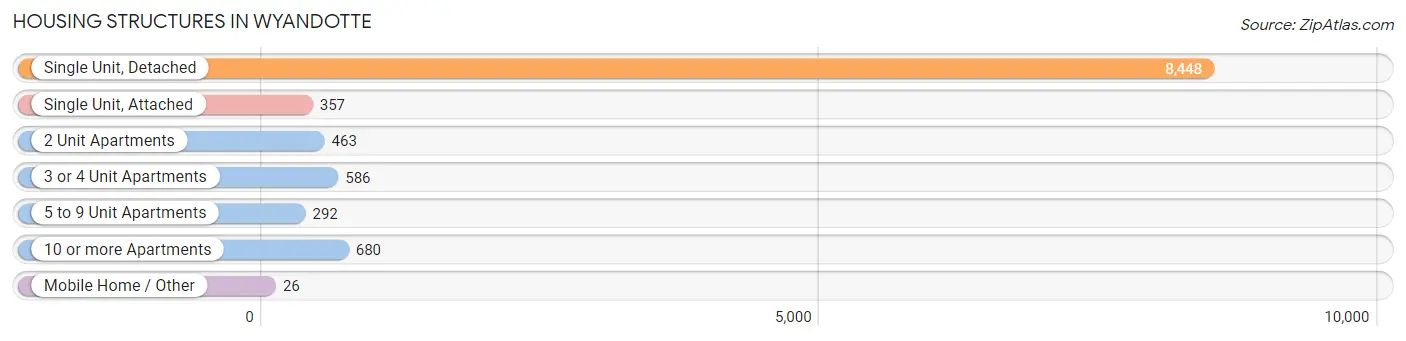
| Structure Type | # Housing Units | % Housing Units |
| Single Unit, Detached | 8,448 | 77.8% |
| Single Unit, Attached | 357 | 3.3% |
| 2 Unit Apartments | 463 | 4.3% |
| 3 or 4 Unit Apartments | 586 | 5.4% |
| 5 to 9 Unit Apartments | 292 | 2.7% |
| 10 or more Apartments | 680 | 6.3% |
| Mobile Home / Other | 26 | 0.2% |
| Total | 10,852 | 100.0% |
Housing Structures by Occupancy in Wyandotte
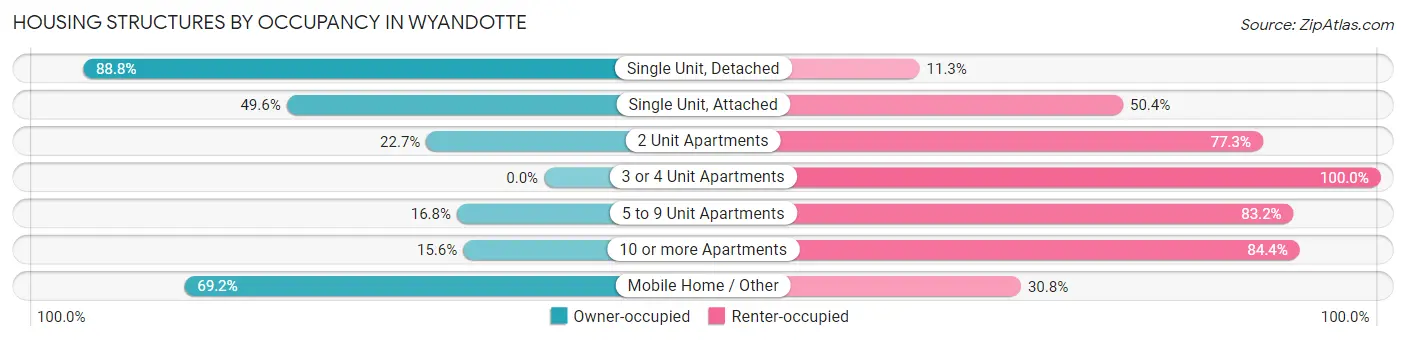
| Structure Type | Owner-occupied | Renter-occupied |
| Single Unit, Detached | 7,498 (88.7%) | 950 (11.3%) |
| Single Unit, Attached | 177 (49.6%) | 180 (50.4%) |
| 2 Unit Apartments | 105 (22.7%) | 358 (77.3%) |
| 3 or 4 Unit Apartments | 0 (0.0%) | 586 (100.0%) |
| 5 to 9 Unit Apartments | 49 (16.8%) | 243 (83.2%) |
| 10 or more Apartments | 106 (15.6%) | 574 (84.4%) |
| Mobile Home / Other | 18 (69.2%) | 8 (30.8%) |
| Total | 7,953 (73.3%) | 2,899 (26.7%) |
Housing Structures by Number of Rooms in Wyandotte
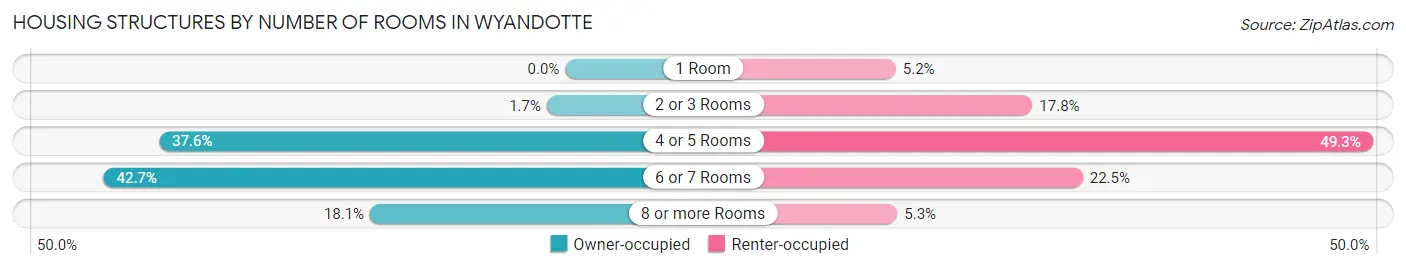
| Number of Rooms | Owner-occupied | Renter-occupied |
| 1 Room | 0 (0.0%) | 150 (5.2%) |
| 2 or 3 Rooms | 135 (1.7%) | 516 (17.8%) |
| 4 or 5 Rooms | 2,987 (37.6%) | 1,428 (49.3%) |
| 6 or 7 Rooms | 3,395 (42.7%) | 651 (22.5%) |
| 8 or more Rooms | 1,436 (18.1%) | 154 (5.3%) |
| Total | 7,953 (100.0%) | 2,899 (100.0%) |
Housing Structure by Heating Type in Wyandotte
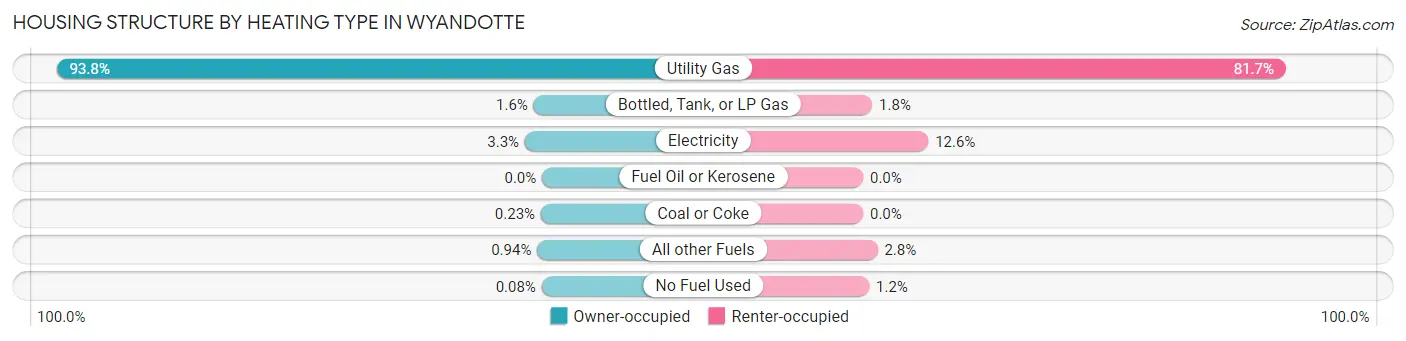
| Heating Type | Owner-occupied | Renter-occupied |
| Utility Gas | 7,462 (93.8%) | 2,368 (81.7%) |
| Bottled, Tank, or LP Gas | 129 (1.6%) | 51 (1.8%) |
| Electricity | 263 (3.3%) | 365 (12.6%) |
| Fuel Oil or Kerosene | 0 (0.0%) | 0 (0.0%) |
| Coal or Coke | 18 (0.2%) | 0 (0.0%) |
| All other Fuels | 75 (0.9%) | 81 (2.8%) |
| No Fuel Used | 6 (0.1%) | 34 (1.2%) |
| Total | 7,953 (100.0%) | 2,899 (100.0%) |
Household Vehicle Usage in Wyandotte
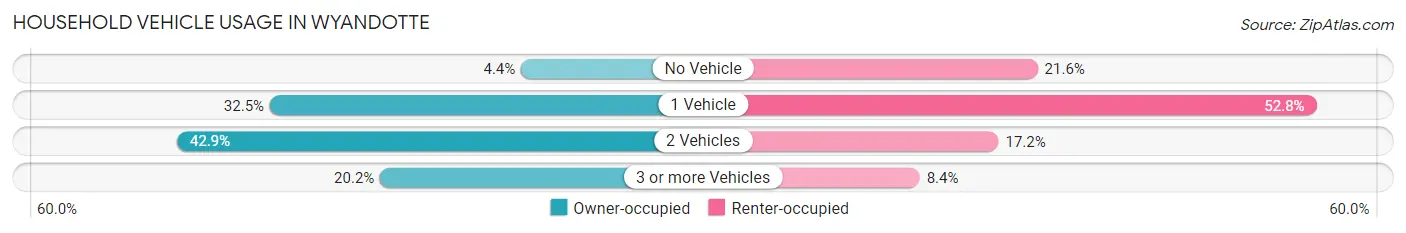
| Vehicles per Household | Owner-occupied | Renter-occupied |
| No Vehicle | 348 (4.4%) | 626 (21.6%) |
| 1 Vehicle | 2,586 (32.5%) | 1,531 (52.8%) |
| 2 Vehicles | 3,415 (42.9%) | 499 (17.2%) |
| 3 or more Vehicles | 1,604 (20.2%) | 243 (8.4%) |
| Total | 7,953 (100.0%) | 2,899 (100.0%) |
Real Estate & Mortgages in Wyandotte
Real Estate and Mortgage Overview in Wyandotte
| Characteristic | Without Mortgage | With Mortgage |
| Housing Units | 3,039 | 4,914 |
| Median Property Value | $143,600 | $149,600 |
| Median Household Income | $52,572 | $712 |
| Monthly Housing Costs | $563 | $29 |
| Real Estate Taxes | $2,871 | $72 |
Property Value by Mortgage Status in Wyandotte
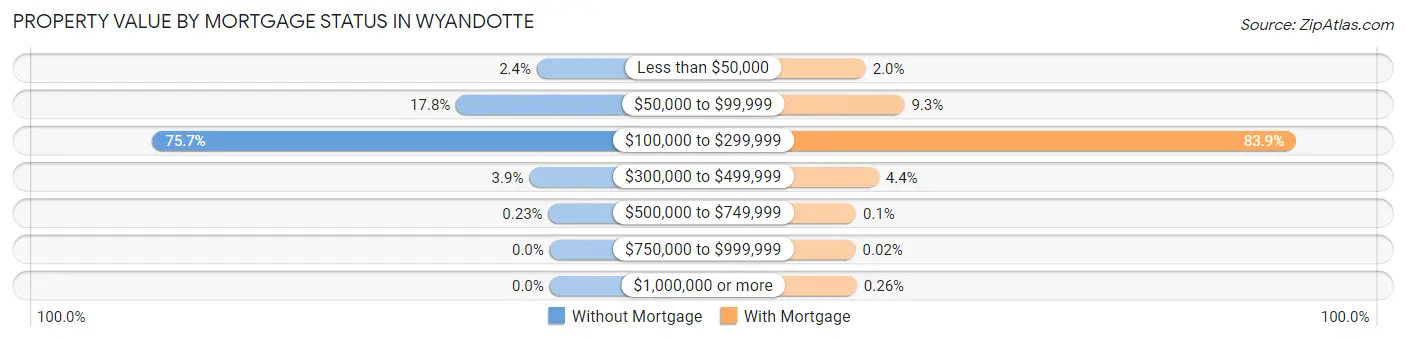
| Property Value | Without Mortgage | With Mortgage |
| Less than $50,000 | 74 (2.4%) | 96 (1.9%) |
| $50,000 to $99,999 | 541 (17.8%) | 458 (9.3%) |
| $100,000 to $299,999 | 2,299 (75.6%) | 4,123 (83.9%) |
| $300,000 to $499,999 | 118 (3.9%) | 218 (4.4%) |
| $500,000 to $749,999 | 7 (0.2%) | 5 (0.1%) |
| $750,000 to $999,999 | 0 (0.0%) | 1 (0.0%) |
| $1,000,000 or more | 0 (0.0%) | 13 (0.3%) |
| Total | 3,039 (100.0%) | 4,914 (100.0%) |
Household Income by Mortgage Status in Wyandotte
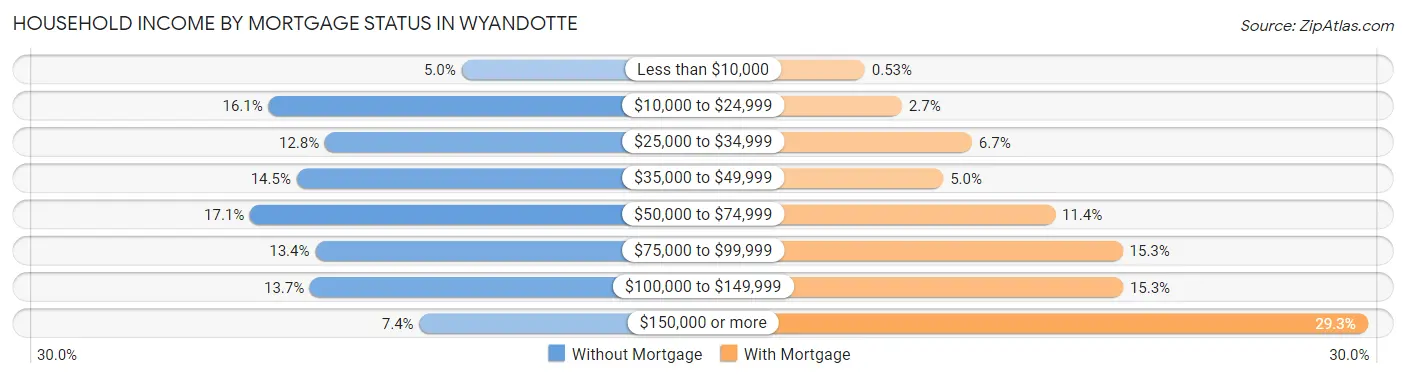
| Household Income | Without Mortgage | With Mortgage |
| Less than $10,000 | 153 (5.0%) | 26 (0.5%) |
| $10,000 to $24,999 | 488 (16.1%) | 130 (2.6%) |
| $25,000 to $34,999 | 390 (12.8%) | 327 (6.7%) |
| $35,000 to $49,999 | 439 (14.4%) | 246 (5.0%) |
| $50,000 to $74,999 | 520 (17.1%) | 560 (11.4%) |
| $75,000 to $99,999 | 407 (13.4%) | 750 (15.3%) |
| $100,000 to $149,999 | 416 (13.7%) | 751 (15.3%) |
| $150,000 or more | 226 (7.4%) | 1,438 (29.3%) |
| Total | 3,039 (100.0%) | 4,914 (100.0%) |
Property Value to Household Income Ratio in Wyandotte
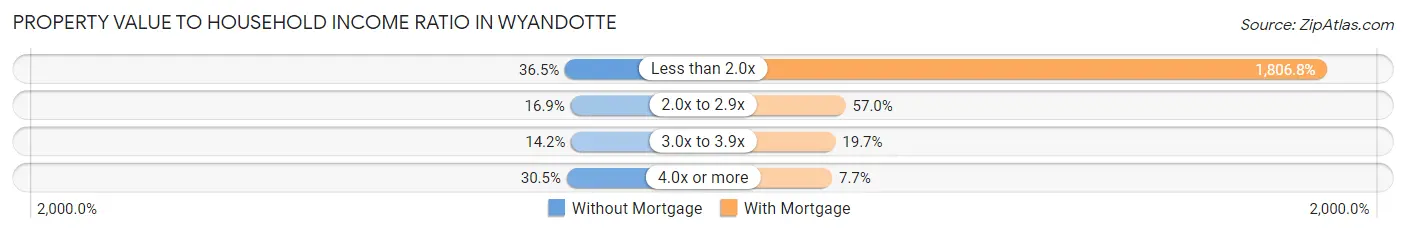
| Value-to-Income Ratio | Without Mortgage | With Mortgage |
| Less than 2.0x | 1,110 (36.5%) | 88,784 (1,806.8%) |
| 2.0x to 2.9x | 513 (16.9%) | 2,801 (57.0%) |
| 3.0x to 3.9x | 432 (14.2%) | 968 (19.7%) |
| 4.0x or more | 928 (30.5%) | 377 (7.7%) |
| Total | 3,039 (100.0%) | 4,914 (100.0%) |
Real Estate Taxes by Mortgage Status in Wyandotte
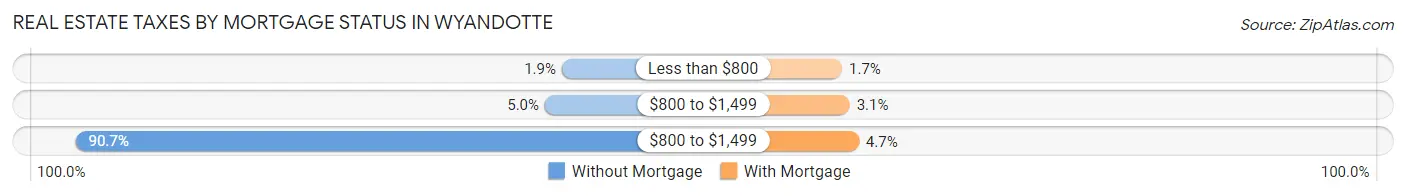
| Property Taxes | Without Mortgage | With Mortgage |
| Less than $800 | 57 (1.9%) | 81 (1.7%) |
| $800 to $1,499 | 151 (5.0%) | 150 (3.0%) |
| $800 to $1,499 | 2,756 (90.7%) | 232 (4.7%) |
| Total | 3,039 (100.0%) | 4,914 (100.0%) |
Health & Disability in Wyandotte
Health Insurance Coverage by Age in Wyandotte
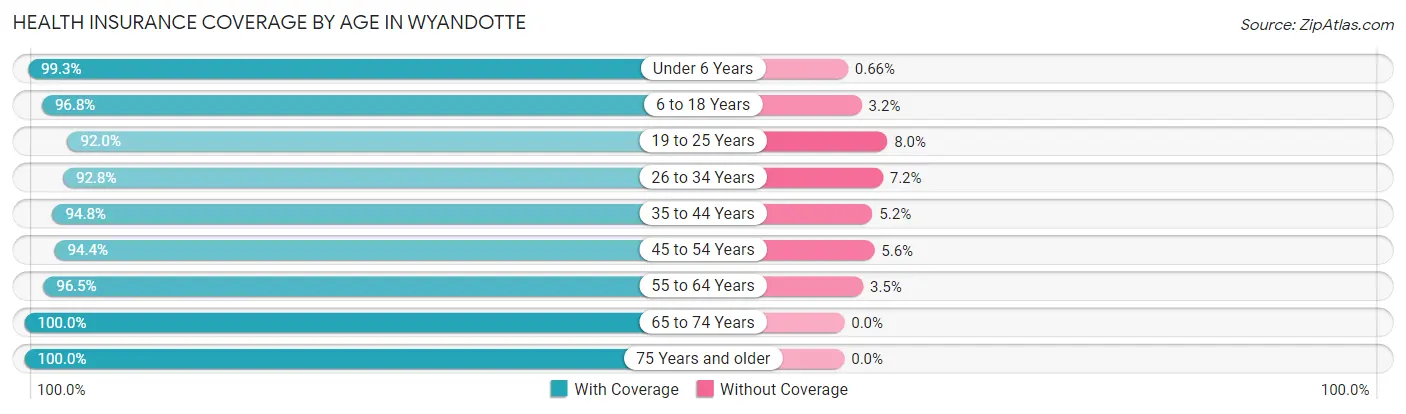
| Age Bracket | With Coverage | Without Coverage |
| Under 6 Years | 1,504 (99.3%) | 10 (0.7%) |
| 6 to 18 Years | 3,588 (96.8%) | 120 (3.2%) |
| 19 to 25 Years | 1,882 (92.0%) | 164 (8.0%) |
| 26 to 34 Years | 3,256 (92.8%) | 252 (7.2%) |
| 35 to 44 Years | 2,785 (94.8%) | 154 (5.2%) |
| 45 to 54 Years | 2,742 (94.4%) | 163 (5.6%) |
| 55 to 64 Years | 3,697 (96.5%) | 134 (3.5%) |
| 65 to 74 Years | 2,631 (100.0%) | 0 (0.0%) |
| 75 Years and older | 1,705 (100.0%) | 0 (0.0%) |
| Total | 23,790 (96.0%) | 997 (4.0%) |
Health Insurance Coverage by Citizenship Status in Wyandotte
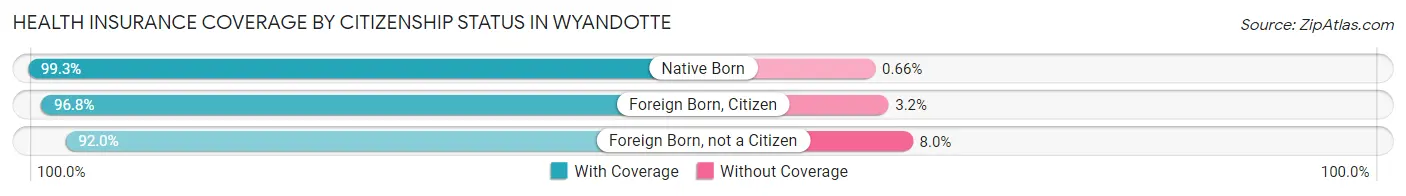
| Citizenship Status | With Coverage | Without Coverage |
| Native Born | 1,504 (99.3%) | 10 (0.7%) |
| Foreign Born, Citizen | 3,588 (96.8%) | 120 (3.2%) |
| Foreign Born, not a Citizen | 1,882 (92.0%) | 164 (8.0%) |
Health Insurance Coverage by Household Income in Wyandotte
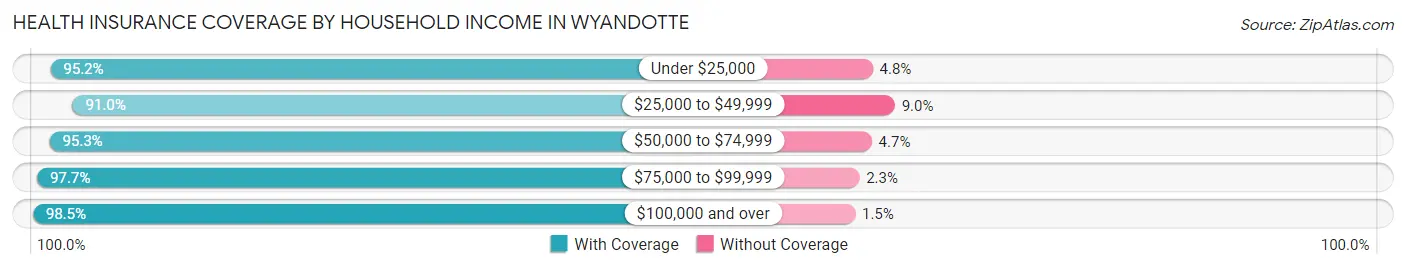
| Household Income | With Coverage | Without Coverage |
| Under $25,000 | 3,096 (95.2%) | 157 (4.8%) |
| $25,000 to $49,999 | 4,164 (91.0%) | 411 (9.0%) |
| $50,000 to $74,999 | 4,232 (95.3%) | 207 (4.7%) |
| $75,000 to $99,999 | 3,561 (97.7%) | 85 (2.3%) |
| $100,000 and over | 8,687 (98.5%) | 136 (1.5%) |
Public vs Private Health Insurance Coverage by Age in Wyandotte
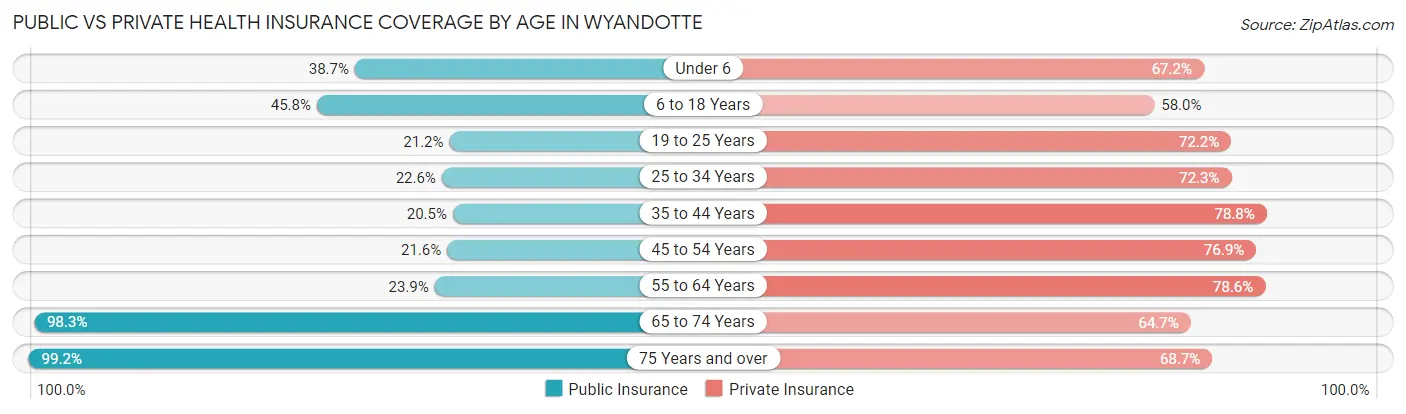
| Age Bracket | Public Insurance | Private Insurance |
| Under 6 | 586 (38.7%) | 1,017 (67.2%) |
| 6 to 18 Years | 1,697 (45.8%) | 2,151 (58.0%) |
| 19 to 25 Years | 433 (21.2%) | 1,478 (72.2%) |
| 25 to 34 Years | 792 (22.6%) | 2,536 (72.3%) |
| 35 to 44 Years | 603 (20.5%) | 2,317 (78.8%) |
| 45 to 54 Years | 627 (21.6%) | 2,234 (76.9%) |
| 55 to 64 Years | 916 (23.9%) | 3,010 (78.6%) |
| 65 to 74 Years | 2,585 (98.3%) | 1,703 (64.7%) |
| 75 Years and over | 1,692 (99.2%) | 1,172 (68.7%) |
| Total | 9,931 (40.1%) | 17,618 (71.1%) |
Disability Status by Sex by Age in Wyandotte
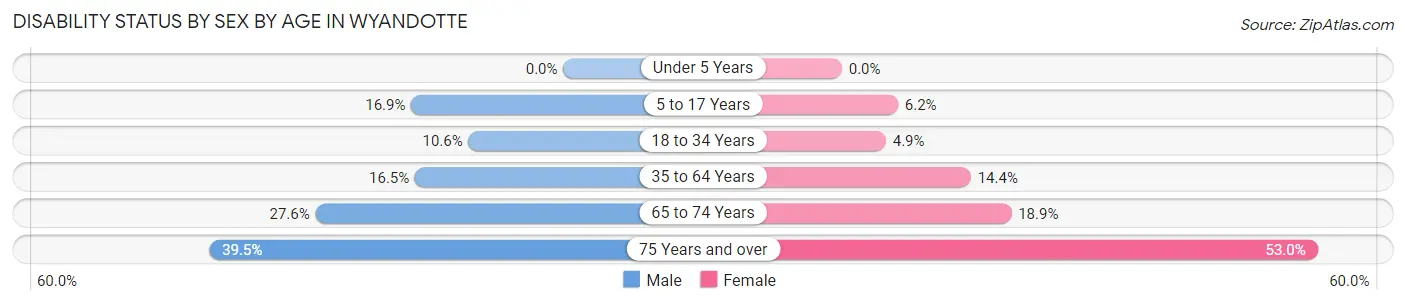
| Age Bracket | Male | Female |
| Under 5 Years | 0 (0.0%) | 0 (0.0%) |
| 5 to 17 Years | 314 (16.9%) | 119 (6.2%) |
| 18 to 34 Years | 314 (10.6%) | 138 (4.9%) |
| 35 to 64 Years | 758 (16.5%) | 730 (14.4%) |
| 65 to 74 Years | 340 (27.6%) | 264 (18.9%) |
| 75 Years and over | 243 (39.5%) | 577 (53.0%) |
Disability Class by Sex by Age in Wyandotte
Disability Class: Hearing Difficulty
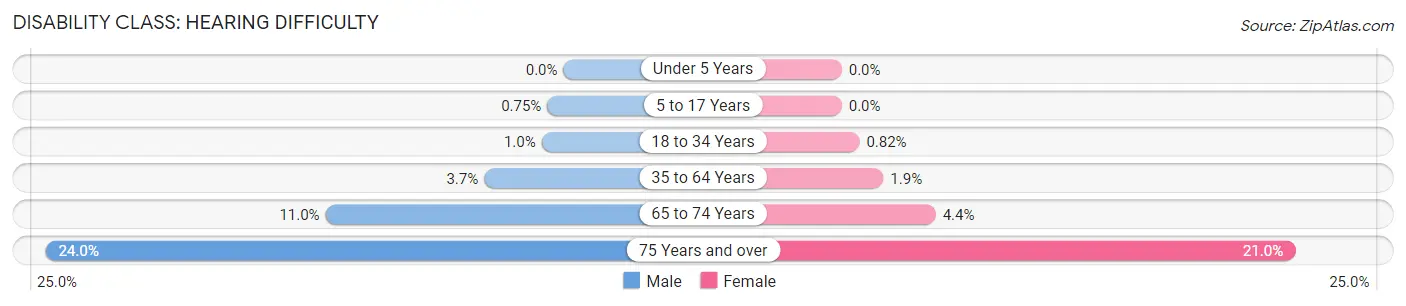
| Age Bracket | Male | Female |
| Under 5 Years | 0 (0.0%) | 0 (0.0%) |
| 5 to 17 Years | 14 (0.7%) | 0 (0.0%) |
| 18 to 34 Years | 30 (1.0%) | 23 (0.8%) |
| 35 to 64 Years | 169 (3.7%) | 98 (1.9%) |
| 65 to 74 Years | 136 (11.0%) | 61 (4.4%) |
| 75 Years and over | 148 (24.0%) | 229 (21.0%) |
Disability Class: Vision Difficulty
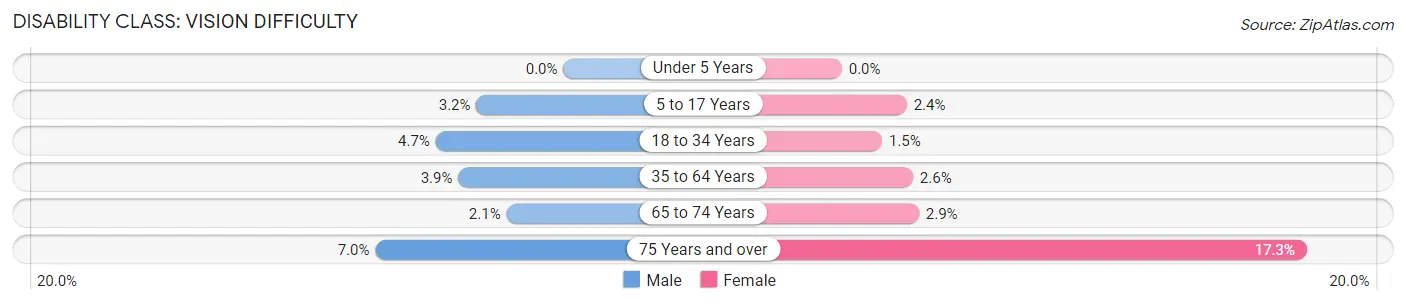
| Age Bracket | Male | Female |
| Under 5 Years | 0 (0.0%) | 0 (0.0%) |
| 5 to 17 Years | 60 (3.2%) | 46 (2.4%) |
| 18 to 34 Years | 141 (4.7%) | 42 (1.5%) |
| 35 to 64 Years | 179 (3.9%) | 134 (2.6%) |
| 65 to 74 Years | 26 (2.1%) | 40 (2.9%) |
| 75 Years and over | 43 (7.0%) | 188 (17.3%) |
Disability Class: Cognitive Difficulty
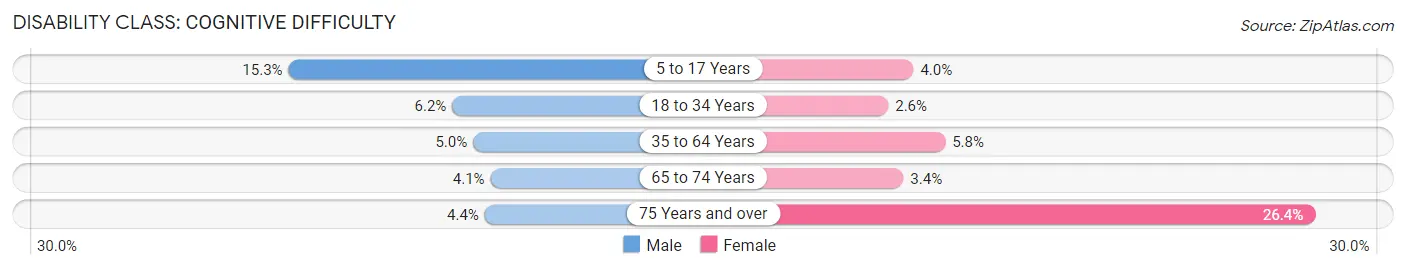
| Age Bracket | Male | Female |
| 5 to 17 Years | 284 (15.3%) | 76 (4.0%) |
| 18 to 34 Years | 184 (6.2%) | 73 (2.6%) |
| 35 to 64 Years | 231 (5.0%) | 293 (5.8%) |
| 65 to 74 Years | 50 (4.1%) | 48 (3.4%) |
| 75 Years and over | 27 (4.4%) | 287 (26.4%) |
Disability Class: Ambulatory Difficulty
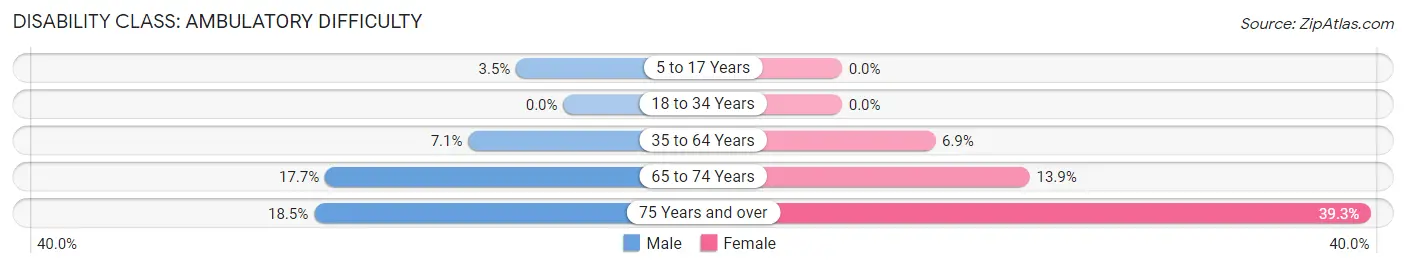
| Age Bracket | Male | Female |
| 5 to 17 Years | 65 (3.5%) | 0 (0.0%) |
| 18 to 34 Years | 0 (0.0%) | 0 (0.0%) |
| 35 to 64 Years | 324 (7.1%) | 352 (6.9%) |
| 65 to 74 Years | 218 (17.7%) | 195 (13.9%) |
| 75 Years and over | 114 (18.5%) | 428 (39.3%) |
Disability Class: Self-Care Difficulty
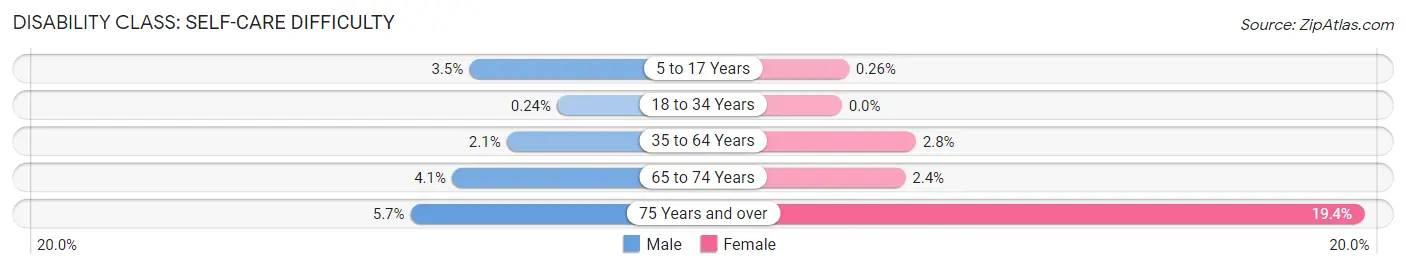
| Age Bracket | Male | Female |
| 5 to 17 Years | 65 (3.5%) | 5 (0.3%) |
| 18 to 34 Years | 7 (0.2%) | 0 (0.0%) |
| 35 to 64 Years | 97 (2.1%) | 140 (2.8%) |
| 65 to 74 Years | 51 (4.1%) | 33 (2.4%) |
| 75 Years and over | 35 (5.7%) | 211 (19.4%) |
Technology Access in Wyandotte
Computing Device Access in Wyandotte
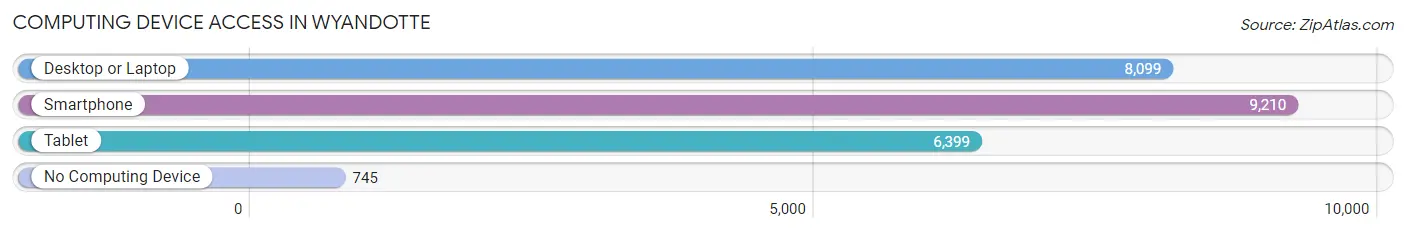
| Device Type | # Households | % Households |
| Desktop or Laptop | 8,099 | 74.6% |
| Smartphone | 9,210 | 84.9% |
| Tablet | 6,399 | 59.0% |
| No Computing Device | 745 | 6.9% |
| Total | 10,852 | 100.0% |
Internet Access in Wyandotte
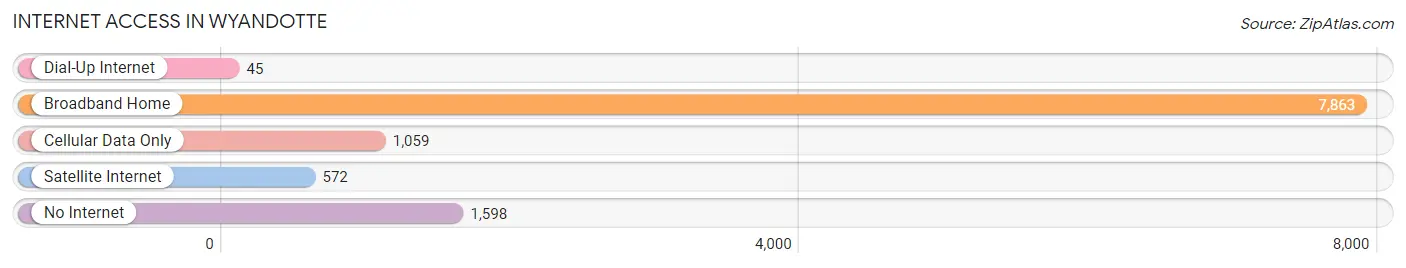
| Internet Type | # Households | % Households |
| Dial-Up Internet | 45 | 0.4% |
| Broadband Home | 7,863 | 72.5% |
| Cellular Data Only | 1,059 | 9.8% |
| Satellite Internet | 572 | 5.3% |
| No Internet | 1,598 | 14.7% |
| Total | 10,852 | 100.0% |
Wyandotte Summary
Wyandotte is a city located in Wayne County, Michigan, United States. It is located on the Detroit River, just south of the city of Detroit. The population was 25,883 at the 2010 census, making it the 18th largest city in Michigan. Wyandotte is known for its historic downtown area, which is home to many unique shops and restaurants.
History
Wyandotte was first settled in 1854 by French-Canadian immigrants. The city was originally known as Wyandotte Village, and was incorporated as a village in 1867. In 1869, the village was incorporated as a city. The city was named after the Wyandot people, a Native American tribe that had lived in the area for centuries.
In the late 19th century, Wyandotte was a major industrial center, with several steel mills and other factories. The city was also home to a large number of immigrants, including Poles, Italians, and Hungarians.
In the early 20th century, Wyandotte was a popular destination for vacationers, with several resorts located along the Detroit River. The city was also home to a large amusement park, known as Wyandotte Park.
Geography
Wyandotte is located at 42°13′N 83°7′W (42.2179, -83.1167). According to the United States Census Bureau, the city has a total area of 5.45 square miles (14.11 km2), of which 5.37 square miles (13.91 km2) is land and 0.08 square miles (0.20 km2) is water.
The city is located on the Detroit River, just south of the city of Detroit. It is bordered by the cities of Riverview to the west, Southgate to the north, and Lincoln Park to the east.
Economy
Wyandotte is home to several major employers, including Ford Motor Company, DTE Energy, and the U.S. Army Tank Automotive Command. The city is also home to several smaller businesses, including restaurants, retail stores, and professional services.
Demographics
As of the 2010 census, there were 25,883 people, 10,845 households, and 6,845 families residing in the city. The population density was 4,817.3 people per square mile (1,862.2/km2). There were 11,845 housing units at an average density of 2,203.3 per square mile (851.2/km2). The racial makeup of the city was 87.2% White, 8.2% African American, 0.4% Native American, 0.7% Asian, 0.1% Pacific Islander, 1.2% from other races, and 2.2% from two or more races. Hispanic or Latino of any race were 4.2% of the population.
There were 10,845 households, out of which 28.3% had children under the age of 18 living with them, 43.2% were married couples living together, 15.2% had a female householder with no husband present, and 36.7% were non-families. 30.7% of all households were made up of individuals, and 11.7% had someone living alone who was 65 years of age or older. The average household size was 2.38 and the average family size was 2.97.
In the city, the population was spread out, with 23.2% under the age of 18, 8.2% from 18 to 24, 29.2% from 25 to 44, 24.2% from 45 to 64, and 15.2% who were 65 years of age or older. The median age was 38 years. For every 100 females, there were 93.2 males. For every 100 females age 18 and over, there were 89.7 males.
The median income for a household in the city was $41,945, and the median income for a family was $51,945. Males had a median income of $41,945 versus $30,945 for females. The per capita income for the city was $20,945. About 8.2% of families and 10.2% of the population were below the poverty line, including 14.2% of those under age 18 and 8.2% of those age 65 or over.
Common Questions
What is Per Capita Income in Wyandotte?
Per Capita income in Wyandotte is $33,993.
What is the Median Family Income in Wyandotte?
Median Family Income in Wyandotte is $80,480.
What is the Median Household income in Wyandotte?
Median Household Income in Wyandotte is $62,111.
What is Income or Wage Gap in Wyandotte?
Income or Wage Gap in Wyandotte is 17.5%.
Women in Wyandotte earn 82.5 cents for every dollar earned by a man.
What is Family Income Deficit in Wyandotte?
Family Income Deficit in Wyandotte is $8,036.
Families that are below poverty line in Wyandotte earn $8,036 less on average than the poverty threshold level.
What is Inequality or Gini Index in Wyandotte?
Inequality or Gini Index in Wyandotte is 0.41.
What is the Total Population of Wyandotte?
Total Population of Wyandotte is 24,857.
What is the Total Male Population of Wyandotte?
Total Male Population of Wyandotte is 11,912.
What is the Total Female Population of Wyandotte?
Total Female Population of Wyandotte is 12,945.
What is the Ratio of Males per 100 Females in Wyandotte?
There are 92.02 Males per 100 Females in Wyandotte.
What is the Ratio of Females per 100 Males in Wyandotte?
There are 108.67 Females per 100 Males in Wyandotte.
What is the Median Population Age in Wyandotte?
Median Population Age in Wyandotte is 39.6 Years.
What is the Average Family Size in Wyandotte
Average Family Size in Wyandotte is 3.0 People.
What is the Average Household Size in Wyandotte
Average Household Size in Wyandotte is 2.3 People.
How Large is the Labor Force in Wyandotte?
There are 12,624 People in the Labor Forcein in Wyandotte.
What is the Percentage of People in the Labor Force in Wyandotte?
61.7% of People are in the Labor Force in Wyandotte.
What is the Unemployment Rate in Wyandotte?
Unemployment Rate in Wyandotte is 4.1%.