Brighton, MI Map & Demographics
Brighton Map
Brighton Overview
$45,372
PER CAPITA INCOME
$108,906
AVG FAMILY INCOME
$74,022
AVG HOUSEHOLD INCOME
11.2%
WAGE / INCOME GAP [ % ]
88.8¢/ $1
WAGE / INCOME GAP [ $ ]
0.39
INEQUALITY / GINI INDEX
7,486
TOTAL POPULATION
3,588
MALE POPULATION
3,898
FEMALE POPULATION
92.05
MALES / 100 FEMALES
108.64
FEMALES / 100 MALES
45.8
MEDIAN AGE
2.7
AVG FAMILY SIZE
2.0
AVG HOUSEHOLD SIZE
4,117
LABOR FORCE [ PEOPLE ]
63.4%
PERCENT IN LABOR FORCE
2.8%
UNEMPLOYMENT RATE
Brighton Area Codes
Income in Brighton
Income Overview in Brighton
Per Capita Income in Brighton is $45,372, while median incomes of families and households are $108,906 and $74,022 respectively.
| Characteristic | Number | Measure |
| Per Capita Income | 7,486 | $45,372 |
| Median Family Income | 1,865 | $108,906 |
| Mean Family Income | 1,865 | $116,534 |
| Median Household Income | 3,677 | $74,022 |
| Mean Household Income | 3,677 | $89,907 |
| Income Deficit | 1,865 | $0 |
| Wage / Income Gap (%) | 7,486 | 11.21% |
| Wage / Income Gap ($) | 7,486 | 88.79¢ per $1 |
| Gini / Inequality Index | 7,486 | 0.39 |
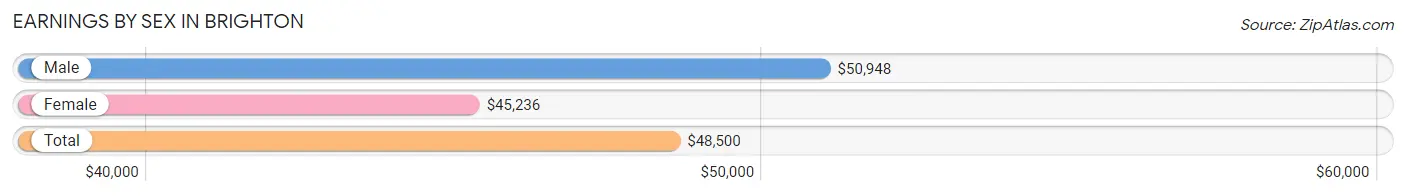
Earnings by Sex in Brighton
Average Earnings in Brighton are $48,500, $50,948 for men and $45,236 for women, a difference of 11.2%.
| Sex | Number | Average Earnings |
| Male | 2,202 (50.6%) | $50,948 |
| Female | 2,148 (49.4%) | $45,236 |
| Total | 4,350 (100.0%) | $48,500 |
Earnings by Sex by Income Bracket in Brighton
The most common earnings brackets in Brighton are $100,000+ for men (550 | 25.0%) and $75,000 to $99,999 for women (286 | 13.3%).
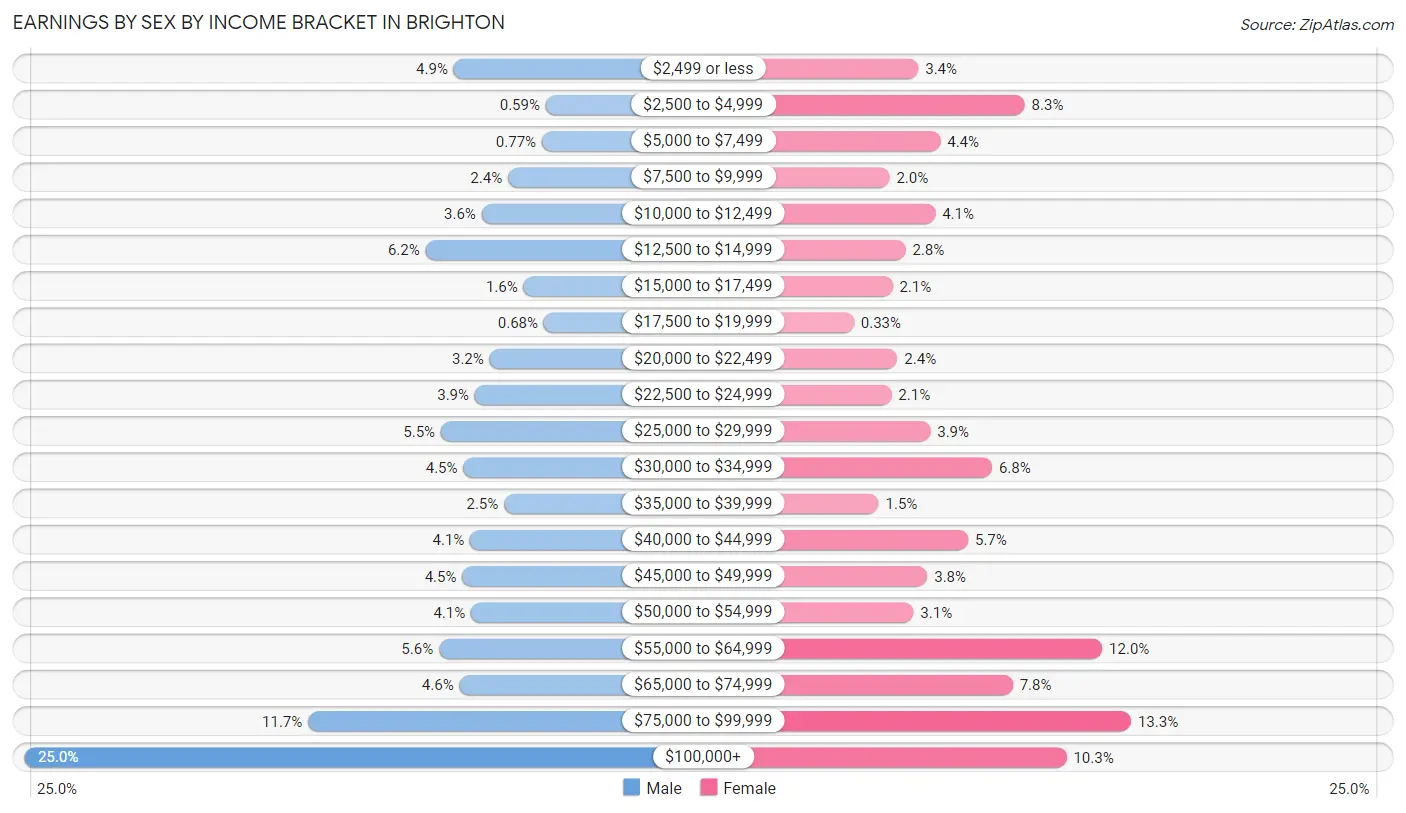
| Income | Male | Female |
| $2,499 or less | 108 (4.9%) | 72 (3.4%) |
| $2,500 to $4,999 | 13 (0.6%) | 179 (8.3%) |
| $5,000 to $7,499 | 17 (0.8%) | 94 (4.4%) |
| $7,500 to $9,999 | 52 (2.4%) | 43 (2.0%) |
| $10,000 to $12,499 | 79 (3.6%) | 89 (4.1%) |
| $12,500 to $14,999 | 137 (6.2%) | 59 (2.8%) |
| $15,000 to $17,499 | 36 (1.6%) | 46 (2.1%) |
| $17,500 to $19,999 | 15 (0.7%) | 7 (0.3%) |
| $20,000 to $22,499 | 71 (3.2%) | 51 (2.4%) |
| $22,500 to $24,999 | 86 (3.9%) | 45 (2.1%) |
| $25,000 to $29,999 | 121 (5.5%) | 84 (3.9%) |
| $30,000 to $34,999 | 98 (4.4%) | 146 (6.8%) |
| $35,000 to $39,999 | 56 (2.5%) | 32 (1.5%) |
| $40,000 to $44,999 | 91 (4.1%) | 122 (5.7%) |
| $45,000 to $49,999 | 99 (4.5%) | 81 (3.8%) |
| $50,000 to $54,999 | 90 (4.1%) | 67 (3.1%) |
| $55,000 to $64,999 | 123 (5.6%) | 257 (12.0%) |
| $65,000 to $74,999 | 102 (4.6%) | 167 (7.8%) |
| $75,000 to $99,999 | 258 (11.7%) | 286 (13.3%) |
| $100,000+ | 550 (25.0%) | 221 (10.3%) |
| Total | 2,202 (100.0%) | 2,148 (100.0%) |
Earnings by Sex by Educational Attainment in Brighton
Average earnings in Brighton are $63,348 for men and $52,237 for women, a difference of 17.5%. Men with an educational attainment of graduate degree enjoy the highest average annual earnings of $112,109, while those with less than high school education earn the least with $28,264. Women with an educational attainment of graduate degree earn the most with the average annual earnings of $65,147, while those with less than high school education have the smallest earnings of $14,135.
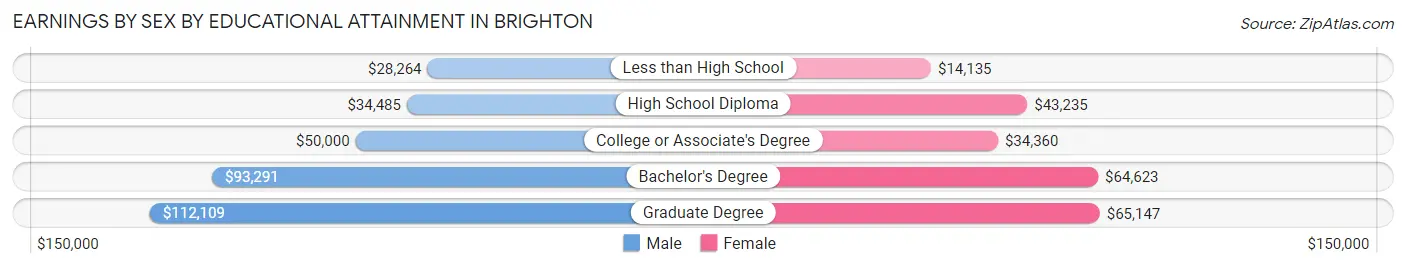
| Educational Attainment | Male Income | Female Income |
| Less than High School | $28,264 | $14,135 |
| High School Diploma | $34,485 | $43,235 |
| College or Associate's Degree | $50,000 | $34,360 |
| Bachelor's Degree | $93,291 | $64,623 |
| Graduate Degree | $112,109 | $65,147 |
| Total | $63,348 | $52,237 |
Family Income in Brighton
Family Income Brackets in Brighton
According to the Brighton family income data, there are 466 families falling into the $100,000 to $149,999 income range, which is the most common income bracket and makes up 25.0% of all families.
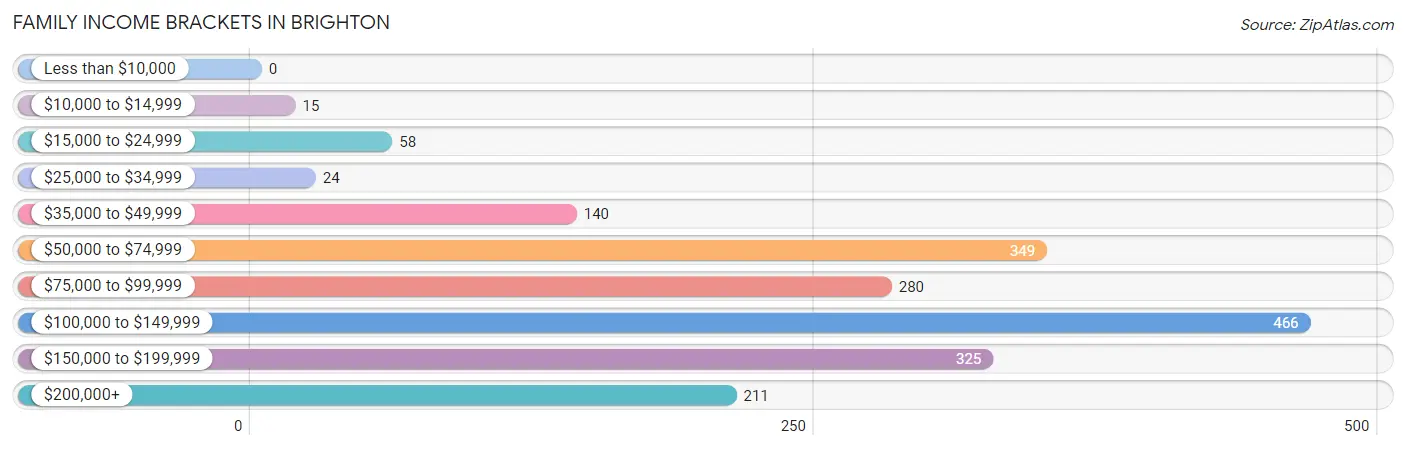
| Income Bracket | # Families | % Families |
| Less than $10,000 | 0 | 0.0% |
| $10,000 to $14,999 | 15 | 0.8% |
| $15,000 to $24,999 | 58 | 3.1% |
| $25,000 to $34,999 | 24 | 1.3% |
| $35,000 to $49,999 | 140 | 7.5% |
| $50,000 to $74,999 | 349 | 18.7% |
| $75,000 to $99,999 | 280 | 15.0% |
| $100,000 to $149,999 | 466 | 25.0% |
| $150,000 to $199,999 | 325 | 17.4% |
| $200,000+ | 211 | 11.3% |
Family Income by Famaliy Size in Brighton
5-person families (88 | 4.7%) account for the highest median family income in Brighton with $149,679 per family, while 3-person families (417 | 22.4%) have the highest median income of $44,403 per family member.
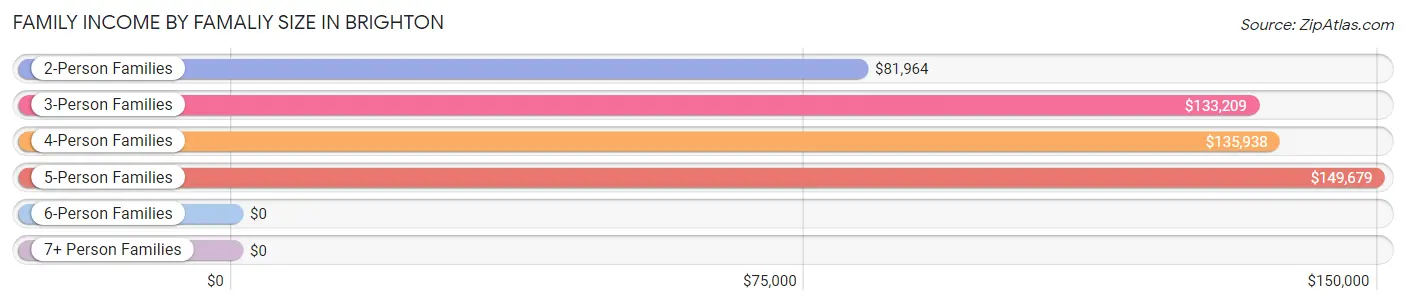
| Income Bracket | # Families | Median Income |
| 2-Person Families | 1,088 (58.3%) | $81,964 |
| 3-Person Families | 417 (22.4%) | $133,209 |
| 4-Person Families | 266 (14.3%) | $135,938 |
| 5-Person Families | 88 (4.7%) | $149,679 |
| 6-Person Families | 6 (0.3%) | $0 |
| 7+ Person Families | 0 (0.0%) | $0 |
| Total | 1,865 (100.0%) | $108,906 |
Family Income by Number of Earners in Brighton
The median family income in Brighton is $108,906, with families comprising 3+ earners (133) having the highest median family income of $152,546, while families with 1 earner (555) have the lowest median family income of $72,663, accounting for 7.1% and 29.8% of families, respectively.
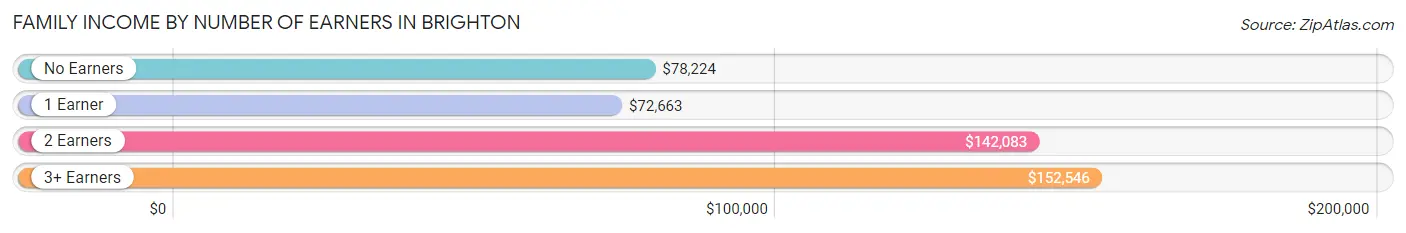
| Number of Earners | # Families | Median Income |
| No Earners | 349 (18.7%) | $78,224 |
| 1 Earner | 555 (29.8%) | $72,663 |
| 2 Earners | 828 (44.4%) | $142,083 |
| 3+ Earners | 133 (7.1%) | $152,546 |
| Total | 1,865 (100.0%) | $108,906 |
Household Income in Brighton
Household Income Brackets in Brighton
With 765 households falling in the category, the $50,000 to $74,999 income range is the most frequent in Brighton, accounting for 20.8% of all households. In contrast, only 132 households (3.6%) fall into the $10,000 to $14,999 income bracket, making it the least populous group.
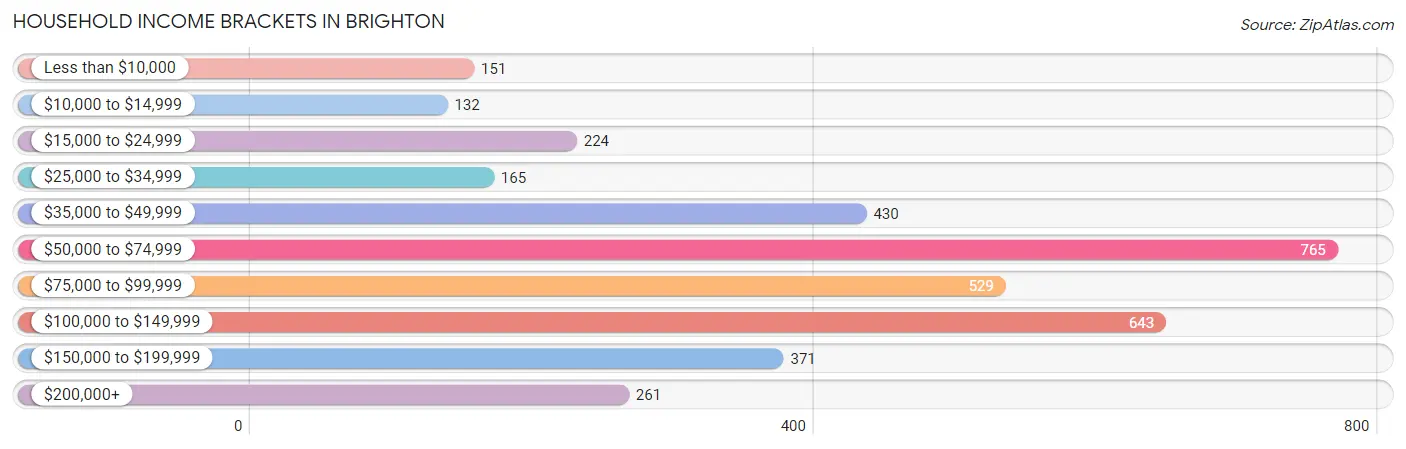
| Income Bracket | # Households | % Households |
| Less than $10,000 | 151 | 4.1% |
| $10,000 to $14,999 | 132 | 3.6% |
| $15,000 to $24,999 | 224 | 6.1% |
| $25,000 to $34,999 | 165 | 4.5% |
| $35,000 to $49,999 | 430 | 11.7% |
| $50,000 to $74,999 | 765 | 20.8% |
| $75,000 to $99,999 | 529 | 14.4% |
| $100,000 to $149,999 | 643 | 17.5% |
| $150,000 to $199,999 | 371 | 10.1% |
| $200,000+ | 261 | 7.1% |
Household Income by Householder Age in Brighton
The median household income in Brighton is $74,022, with the highest median household income of $116,646 found in the 25 to 44 years age bracket for the primary householder. A total of 1,006 households (27.4%) fall into this category. Meanwhile, the 65+ years age bracket for the primary householder has the lowest median household income of $52,531, with 1,217 households (33.1%) in this group.
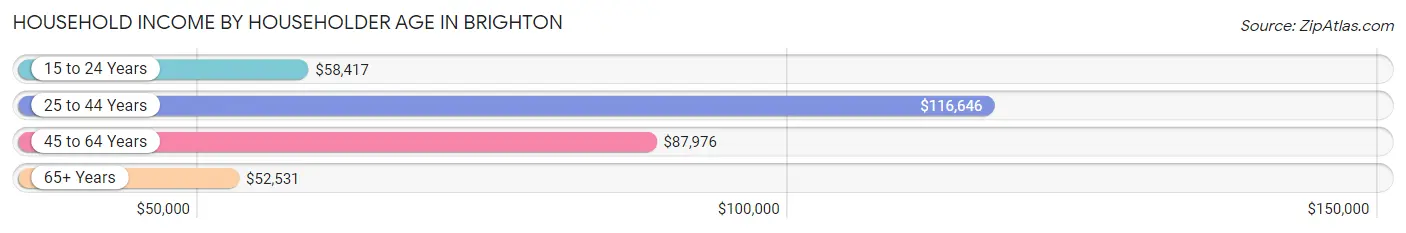
| Income Bracket | # Households | Median Income |
| 15 to 24 Years | 142 (3.9%) | $58,417 |
| 25 to 44 Years | 1,006 (27.4%) | $116,646 |
| 45 to 64 Years | 1,312 (35.7%) | $87,976 |
| 65+ Years | 1,217 (33.1%) | $52,531 |
| Total | 3,677 (100.0%) | $74,022 |
Poverty in Brighton
Income Below Poverty by Sex and Age in Brighton
With 5.6% poverty level for males and 7.2% for females among the residents of Brighton, 18 to 24 year old males and 75 year old and over females are the most vulnerable to poverty, with 102 males (27.7%) and 130 females (23.8%) in their respective age groups living below the poverty level.
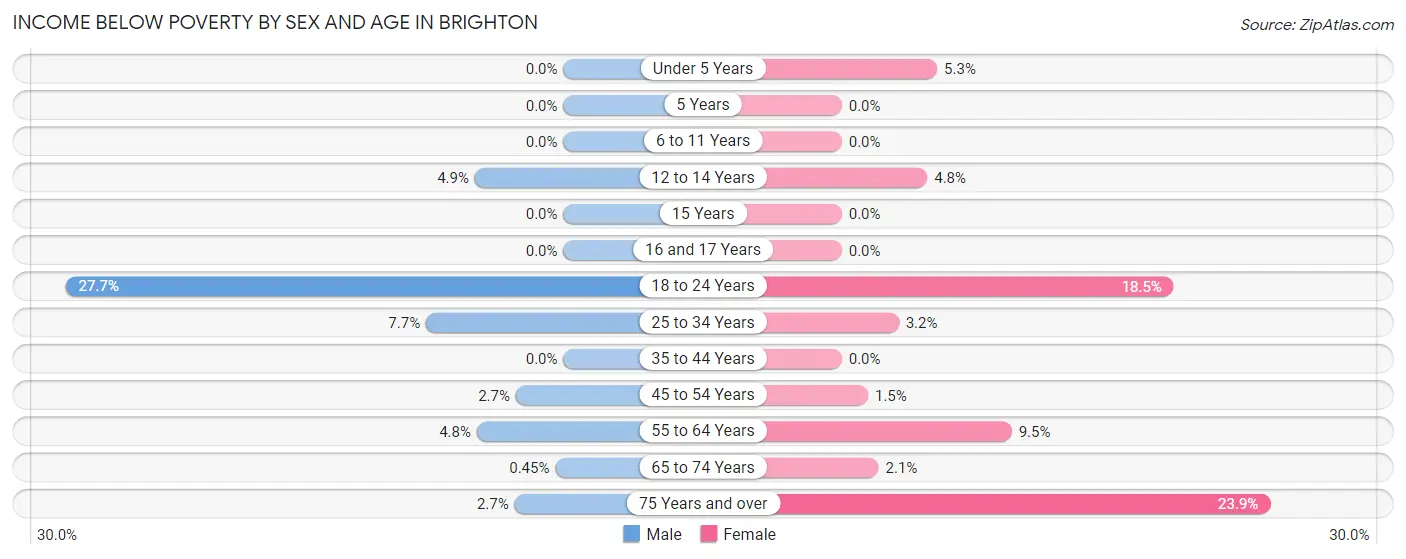
| Age Bracket | Male | Female |
| Under 5 Years | 0 (0.0%) | 6 (5.3%) |
| 5 Years | 0 (0.0%) | 0 (0.0%) |
| 6 to 11 Years | 0 (0.0%) | 0 (0.0%) |
| 12 to 14 Years | 7 (4.9%) | 7 (4.8%) |
| 15 Years | 0 (0.0%) | 0 (0.0%) |
| 16 and 17 Years | 0 (0.0%) | 0 (0.0%) |
| 18 to 24 Years | 102 (27.7%) | 39 (18.5%) |
| 25 to 34 Years | 50 (7.6%) | 16 (3.2%) |
| 35 to 44 Years | 0 (0.0%) | 0 (0.0%) |
| 45 to 54 Years | 9 (2.6%) | 7 (1.5%) |
| 55 to 64 Years | 21 (4.8%) | 60 (9.5%) |
| 65 to 74 Years | 2 (0.4%) | 12 (2.1%) |
| 75 Years and over | 8 (2.7%) | 130 (23.8%) |
| Total | 199 (5.6%) | 277 (7.2%) |
Income Above Poverty by Sex and Age in Brighton
According to the poverty statistics in Brighton, males aged under 5 years and females aged 5 years are the age groups that are most secure financially, with 100.0% of males and 100.0% of females in these age groups living above the poverty line.
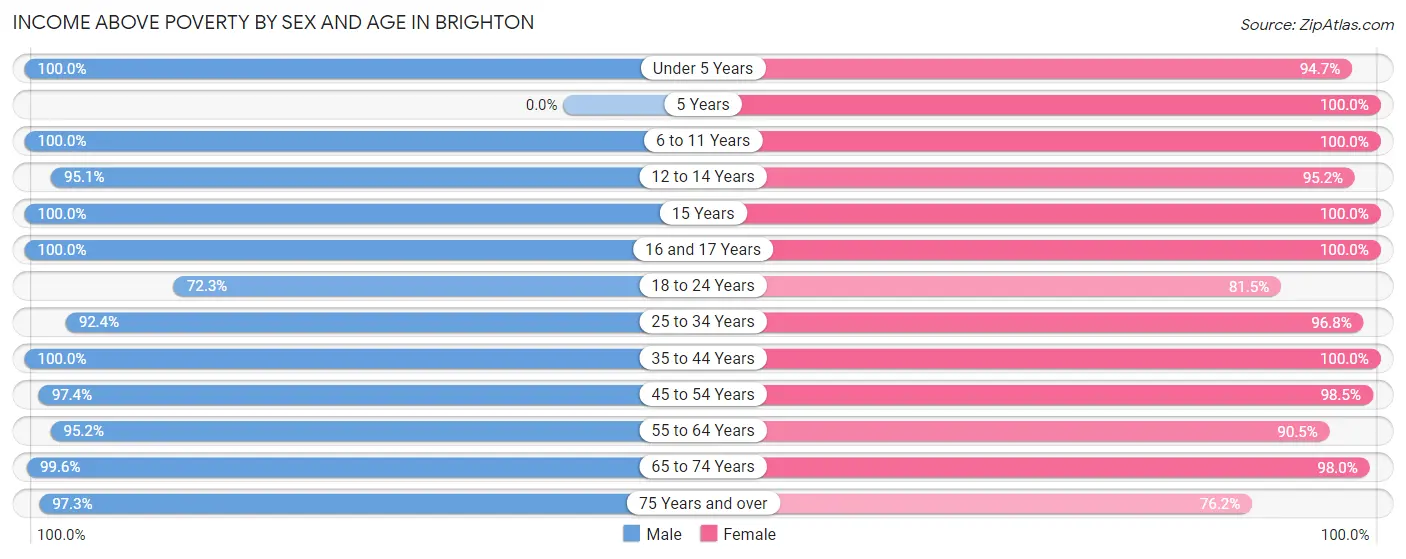
| Age Bracket | Male | Female |
| Under 5 Years | 154 (100.0%) | 107 (94.7%) |
| 5 Years | 0 (0.0%) | 15 (100.0%) |
| 6 to 11 Years | 177 (100.0%) | 171 (100.0%) |
| 12 to 14 Years | 135 (95.1%) | 140 (95.2%) |
| 15 Years | 46 (100.0%) | 27 (100.0%) |
| 16 and 17 Years | 75 (100.0%) | 23 (100.0%) |
| 18 to 24 Years | 266 (72.3%) | 172 (81.5%) |
| 25 to 34 Years | 604 (92.3%) | 489 (96.8%) |
| 35 to 44 Years | 417 (100.0%) | 413 (100.0%) |
| 45 to 54 Years | 331 (97.4%) | 473 (98.5%) |
| 55 to 64 Years | 415 (95.2%) | 574 (90.5%) |
| 65 to 74 Years | 446 (99.6%) | 573 (98.0%) |
| 75 Years and over | 286 (97.3%) | 415 (76.1%) |
| Total | 3,352 (94.4%) | 3,592 (92.8%) |
Income Below Poverty Among Married-Couple Families in Brighton
The poverty statistics for married-couple families in Brighton show that 0.5% or 8 of the total 1,513 families live below the poverty line. Families with no children have the highest poverty rate of 0.8%, comprising of 8 families. On the other hand, families with 1 or 2 children have the lowest poverty rate of 0.0%, which includes 0 families.
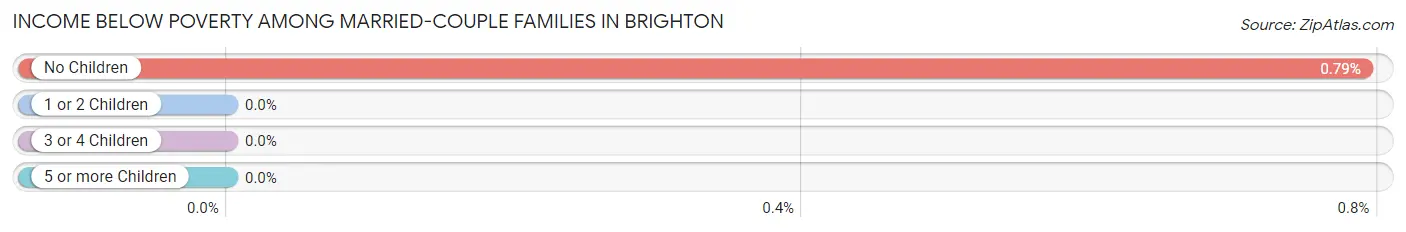
| Children | Above Poverty | Below Poverty |
| No Children | 1,003 (99.2%) | 8 (0.8%) |
| 1 or 2 Children | 437 (100.0%) | 0 (0.0%) |
| 3 or 4 Children | 65 (100.0%) | 0 (0.0%) |
| 5 or more Children | 0 (0.0%) | 0 (0.0%) |
| Total | 1,505 (99.5%) | 8 (0.5%) |
Income Below Poverty Among Single-Parent Households in Brighton
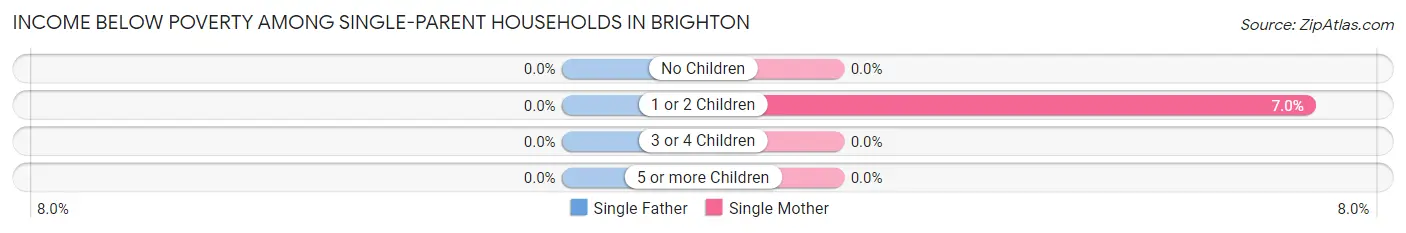
| Children | Single Father | Single Mother |
| No Children | 0 (0.0%) | 0 (0.0%) |
| 1 or 2 Children | 0 (0.0%) | 13 (7.0%) |
| 3 or 4 Children | 0 (0.0%) | 0 (0.0%) |
| 5 or more Children | 0 (0.0%) | 0 (0.0%) |
| Total | 0 (0.0%) | 13 (4.3%) |
Income Below Poverty Among Married-Couple vs Single-Parent Households in Brighton
The poverty data for Brighton shows that 8 of the married-couple family households (0.5%) and 13 of the single-parent households (3.7%) are living below the poverty level. Within the married-couple family households, those with no children have the highest poverty rate, with 8 households (0.8%) falling below the poverty line. Among the single-parent households, those with 1 or 2 children have the highest poverty rate, with 13 household (6.1%) living below poverty.
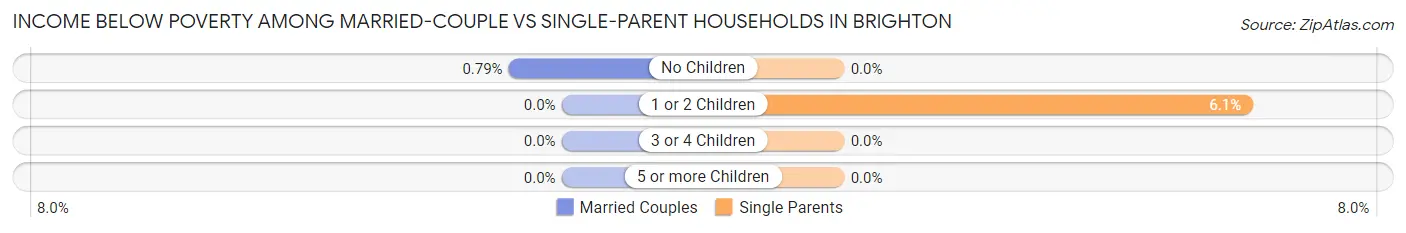
| Children | Married-Couple Families | Single-Parent Households |
| No Children | 8 (0.8%) | 0 (0.0%) |
| 1 or 2 Children | 0 (0.0%) | 13 (6.1%) |
| 3 or 4 Children | 0 (0.0%) | 0 (0.0%) |
| 5 or more Children | 0 (0.0%) | 0 (0.0%) |
| Total | 8 (0.5%) | 13 (3.7%) |
Race in Brighton
The most populous races in Brighton are White / Caucasian (7,107 | 94.9%), Hispanic or Latino (230 | 3.1%), and Black / African American (125 | 1.7%).
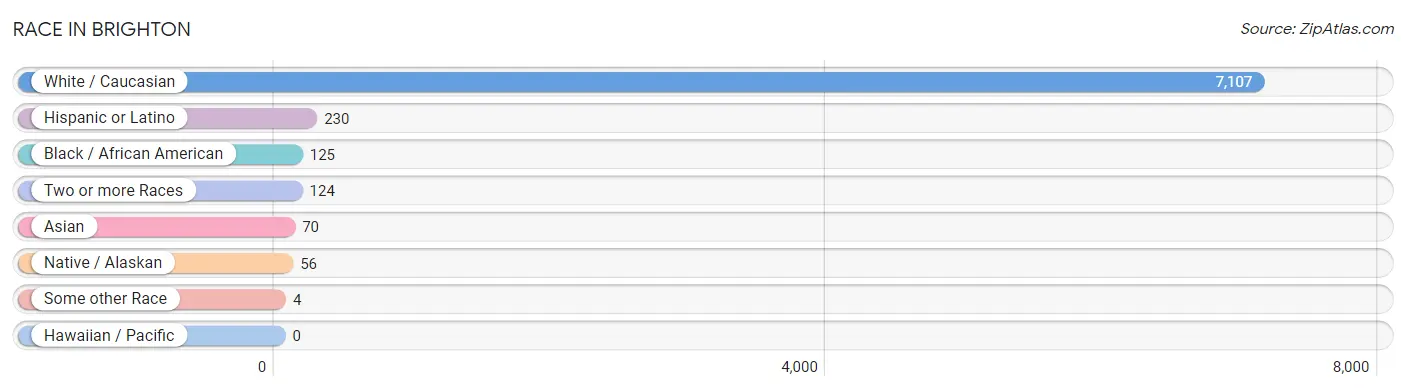
| Race | # Population | % Population |
| Asian | 70 | 0.9% |
| Black / African American | 125 | 1.7% |
| Hawaiian / Pacific | 0 | 0.0% |
| Hispanic or Latino | 230 | 3.1% |
| Native / Alaskan | 56 | 0.7% |
| White / Caucasian | 7,107 | 94.9% |
| Two or more Races | 124 | 1.7% |
| Some other Race | 4 | 0.1% |
| Total | 7,486 | 100.0% |
Ancestry in Brighton
The most populous ancestries reported in Brighton are German (1,627 | 21.7%), Polish (1,085 | 14.5%), Irish (1,081 | 14.4%), English (941 | 12.6%), and Italian (448 | 6.0%), together accounting for 69.2% of all Brighton residents.
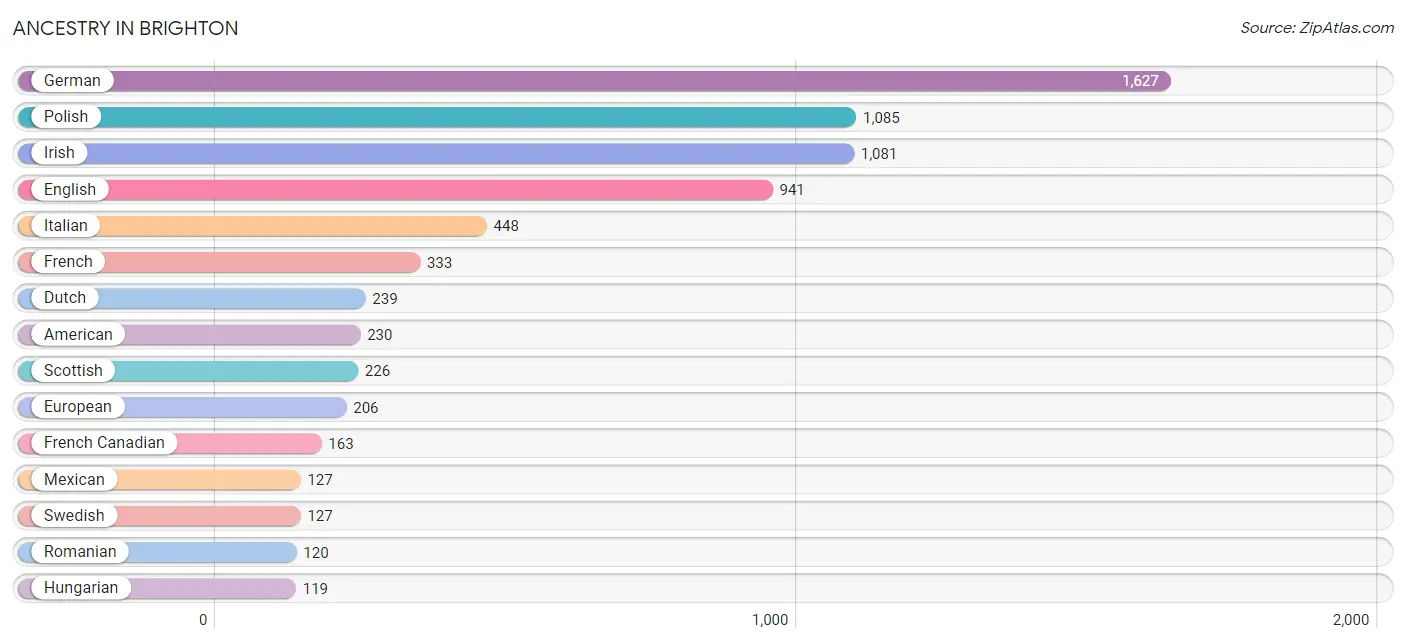
| Ancestry | # Population | % Population |
| African | 33 | 0.4% |
| American | 230 | 3.1% |
| Arab | 75 | 1.0% |
| Armenian | 15 | 0.2% |
| Austrian | 34 | 0.4% |
| Belgian | 30 | 0.4% |
| British | 85 | 1.1% |
| Burmese | 25 | 0.3% |
| Canadian | 27 | 0.4% |
| Cherokee | 15 | 0.2% |
| Croatian | 34 | 0.4% |
| Czech | 27 | 0.4% |
| Czechoslovakian | 6 | 0.1% |
| Dutch | 239 | 3.2% |
| Eastern European | 6 | 0.1% |
| English | 941 | 12.6% |
| European | 206 | 2.8% |
| Finnish | 105 | 1.4% |
| French | 333 | 4.4% |
| French American Indian | 3 | 0.0% |
| French Canadian | 163 | 2.2% |
| German | 1,627 | 21.7% |
| Greek | 67 | 0.9% |
| Hungarian | 119 | 1.6% |
| Indian (Asian) | 54 | 0.7% |
| Inupiat | 2 | 0.0% |
| Irish | 1,081 | 14.4% |
| Iroquois | 3 | 0.0% |
| Italian | 448 | 6.0% |
| Lebanese | 9 | 0.1% |
| Lithuanian | 20 | 0.3% |
| Maltese | 16 | 0.2% |
| Mexican | 127 | 1.7% |
| Mexican American Indian | 53 | 0.7% |
| Moroccan | 56 | 0.7% |
| Nigerian | 8 | 0.1% |
| Norwegian | 29 | 0.4% |
| Polish | 1,085 | 14.5% |
| Puerto Rican | 103 | 1.4% |
| Romanian | 120 | 1.6% |
| Russian | 92 | 1.2% |
| Scandinavian | 110 | 1.5% |
| Scotch-Irish | 23 | 0.3% |
| Scottish | 226 | 3.0% |
| Serbian | 11 | 0.2% |
| Slavic | 13 | 0.2% |
| Slovak | 9 | 0.1% |
| Subsaharan African | 44 | 0.6% |
| Swedish | 127 | 1.7% |
| Swiss | 15 | 0.2% |
| Syrian | 10 | 0.1% |
| Trinidadian and Tobagonian | 10 | 0.1% |
| Turkish | 16 | 0.2% |
| Ukrainian | 40 | 0.5% |
| Welsh | 96 | 1.3% | View All 55 Rows |
Immigrants in Brighton
The most numerous immigrant groups reported in Brighton came from Europe (216 | 2.9%), Asia (86 | 1.1%), Eastern Europe (81 | 1.1%), Eastern Asia (70 | 0.9%), and Northern Europe (66 | 0.9%), together accounting for 6.9% of all Brighton residents.
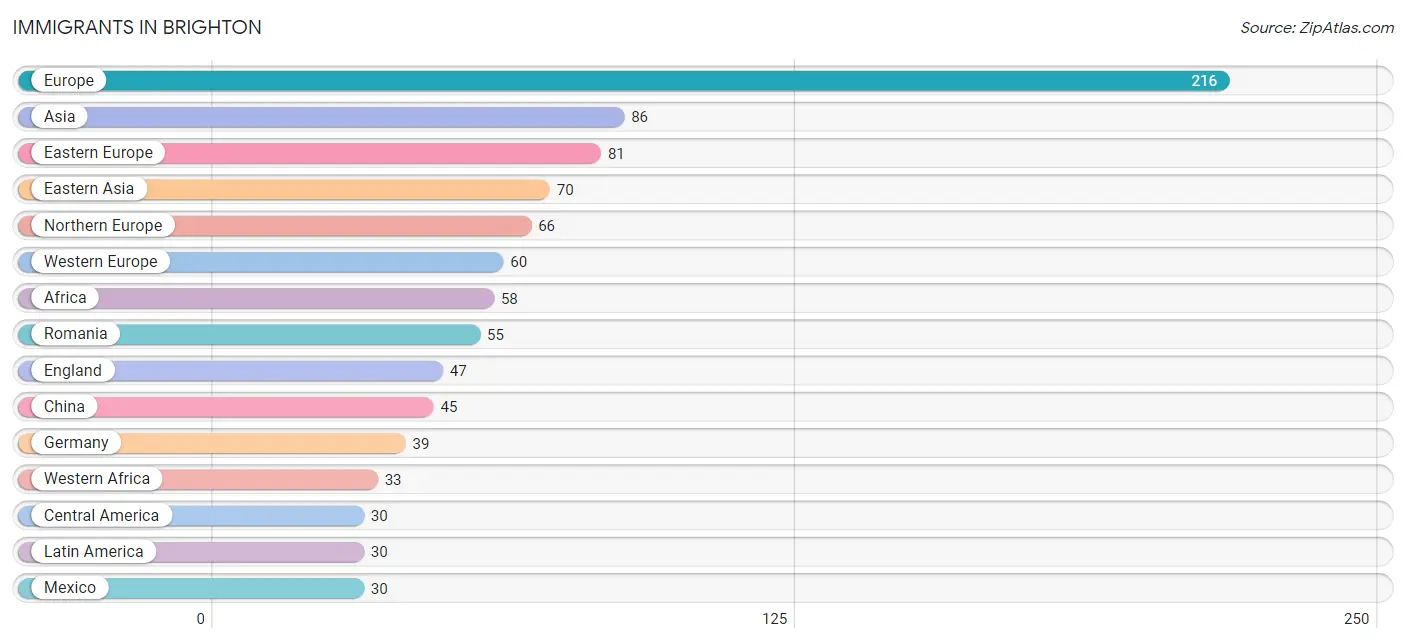
| Immigration Origin | # Population | % Population |
| Africa | 58 | 0.8% |
| Asia | 86 | 1.1% |
| Austria | 21 | 0.3% |
| Canada | 24 | 0.3% |
| Central America | 30 | 0.4% |
| China | 45 | 0.6% |
| Eastern Asia | 70 | 0.9% |
| Eastern Europe | 81 | 1.1% |
| England | 47 | 0.6% |
| Europe | 216 | 2.9% |
| Germany | 39 | 0.5% |
| Korea | 25 | 0.3% |
| Latin America | 30 | 0.4% |
| Mexico | 30 | 0.4% |
| Morocco | 25 | 0.3% |
| Nigeria | 8 | 0.1% |
| Northern Africa | 25 | 0.3% |
| Northern Europe | 66 | 0.9% |
| Oceania | 13 | 0.2% |
| Romania | 55 | 0.7% |
| Russia | 21 | 0.3% |
| Scotland | 13 | 0.2% |
| Southern Europe | 9 | 0.1% |
| Turkey | 16 | 0.2% |
| Western Africa | 33 | 0.4% |
| Western Asia | 16 | 0.2% |
| Western Europe | 60 | 0.8% | View All 27 Rows |
Sex and Age in Brighton
Sex and Age in Brighton
The most populous age groups in Brighton are 30 to 34 Years (351 | 9.8%) for men and 55 to 59 Years (391 | 10.0%) for women.
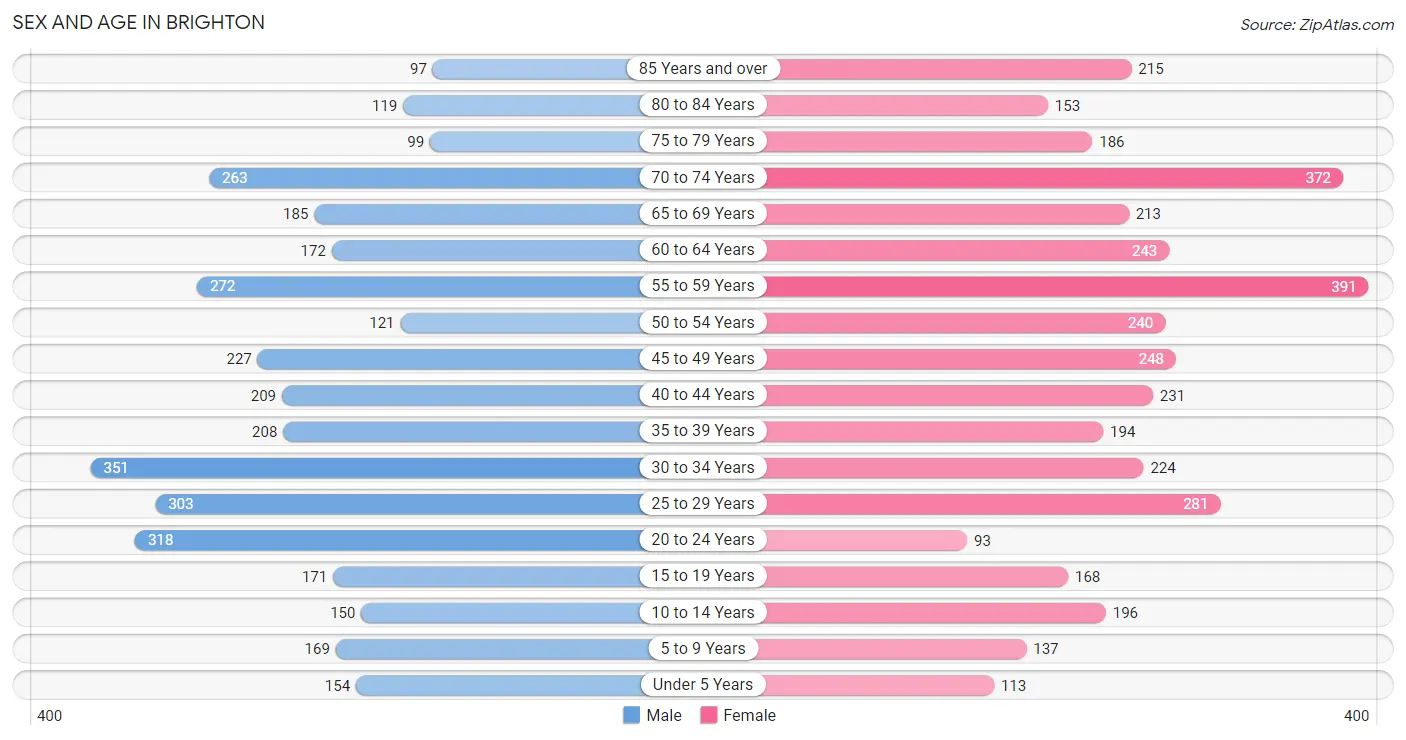
| Age Bracket | Male | Female |
| Under 5 Years | 154 (4.3%) | 113 (2.9%) |
| 5 to 9 Years | 169 (4.7%) | 137 (3.5%) |
| 10 to 14 Years | 150 (4.2%) | 196 (5.0%) |
| 15 to 19 Years | 171 (4.8%) | 168 (4.3%) |
| 20 to 24 Years | 318 (8.9%) | 93 (2.4%) |
| 25 to 29 Years | 303 (8.4%) | 281 (7.2%) |
| 30 to 34 Years | 351 (9.8%) | 224 (5.8%) |
| 35 to 39 Years | 208 (5.8%) | 194 (5.0%) |
| 40 to 44 Years | 209 (5.8%) | 231 (5.9%) |
| 45 to 49 Years | 227 (6.3%) | 248 (6.4%) |
| 50 to 54 Years | 121 (3.4%) | 240 (6.2%) |
| 55 to 59 Years | 272 (7.6%) | 391 (10.0%) |
| 60 to 64 Years | 172 (4.8%) | 243 (6.2%) |
| 65 to 69 Years | 185 (5.2%) | 213 (5.5%) |
| 70 to 74 Years | 263 (7.3%) | 372 (9.5%) |
| 75 to 79 Years | 99 (2.8%) | 186 (4.8%) |
| 80 to 84 Years | 119 (3.3%) | 153 (3.9%) |
| 85 Years and over | 97 (2.7%) | 215 (5.5%) |
| Total | 3,588 (100.0%) | 3,898 (100.0%) |
Families and Households in Brighton
Median Family Size in Brighton
The median family size in Brighton is 2.73 persons per family, with married-couple families (1,513 | 81.1%) accounting for the largest median family size of 2.77 persons per family. On the other hand, single male/father families (51 | 2.7%) represent the smallest median family size with 2.51 persons per family.
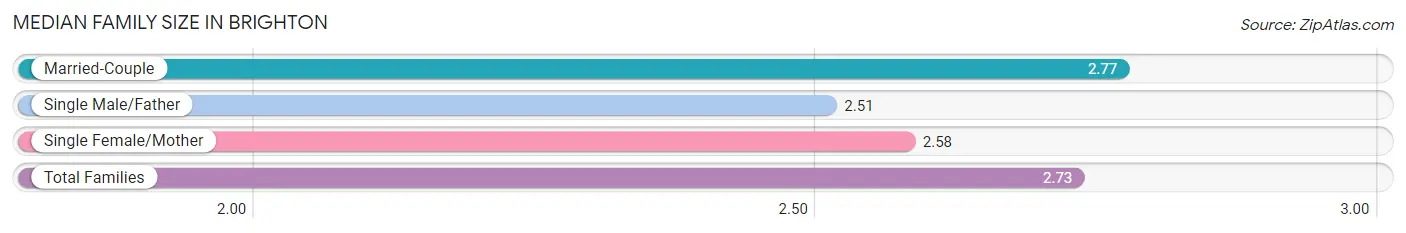
| Family Type | # Families | Family Size |
| Married-Couple | 1,513 (81.1%) | 2.77 |
| Single Male/Father | 51 (2.7%) | 2.51 |
| Single Female/Mother | 301 (16.1%) | 2.58 |
| Total Families | 1,865 (100.0%) | 2.73 |
Median Household Size in Brighton
The median household size in Brighton is 2.00 persons per household, with single male/father households (51 | 1.4%) accounting for the largest median household size of 2.88 persons per household. non-family households (1,812 | 49.3%) represent the smallest median household size with 1.23 persons per household.
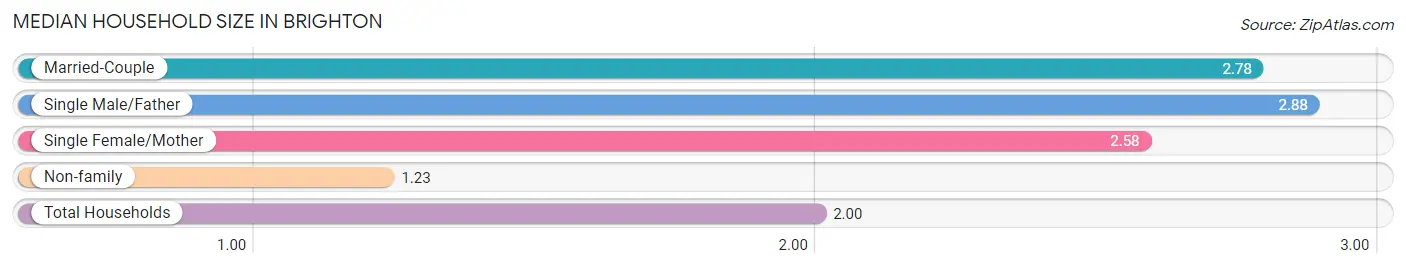
| Household Type | # Households | Household Size |
| Married-Couple | 1,513 (41.1%) | 2.78 |
| Single Male/Father | 51 (1.4%) | 2.88 |
| Single Female/Mother | 301 (8.2%) | 2.58 |
| Non-family | 1,812 (49.3%) | 1.23 |
| Total Households | 3,677 (100.0%) | 2.00 |
Household Size by Marriage Status in Brighton
Out of a total of 3,677 households in Brighton, 1,865 (50.7%) are family households, while 1,812 (49.3%) are nonfamily households. The most numerous type of family households are 2-person households, comprising 1,071, and the most common type of nonfamily households are 1-person households, comprising 1,447.
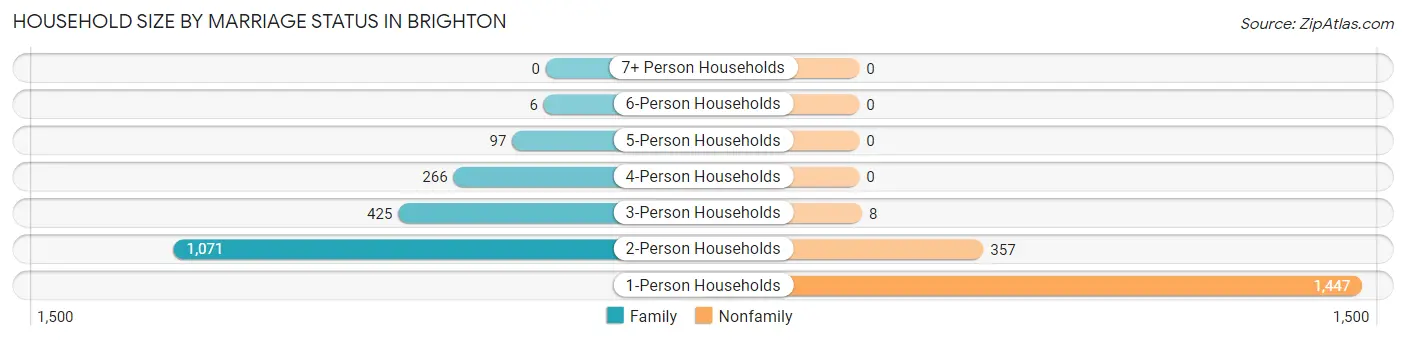
| Household Size | Family Households | Nonfamily Households |
| 1-Person Households | - | 1,447 (39.4%) |
| 2-Person Households | 1,071 (29.1%) | 357 (9.7%) |
| 3-Person Households | 425 (11.6%) | 8 (0.2%) |
| 4-Person Households | 266 (7.2%) | 0 (0.0%) |
| 5-Person Households | 97 (2.6%) | 0 (0.0%) |
| 6-Person Households | 6 (0.2%) | 0 (0.0%) |
| 7+ Person Households | 0 (0.0%) | 0 (0.0%) |
| Total | 1,865 (50.7%) | 1,812 (49.3%) |
Female Fertility in Brighton
Fertility by Age in Brighton
Average fertility rate in Brighton is 92.0 births per 1,000 women. Women in the age bracket of 20 to 34 years have the highest fertility rate with 201.0 births per 1,000 women. Women in the age bracket of 20 to 34 years acount for 89.5% of all women with births.
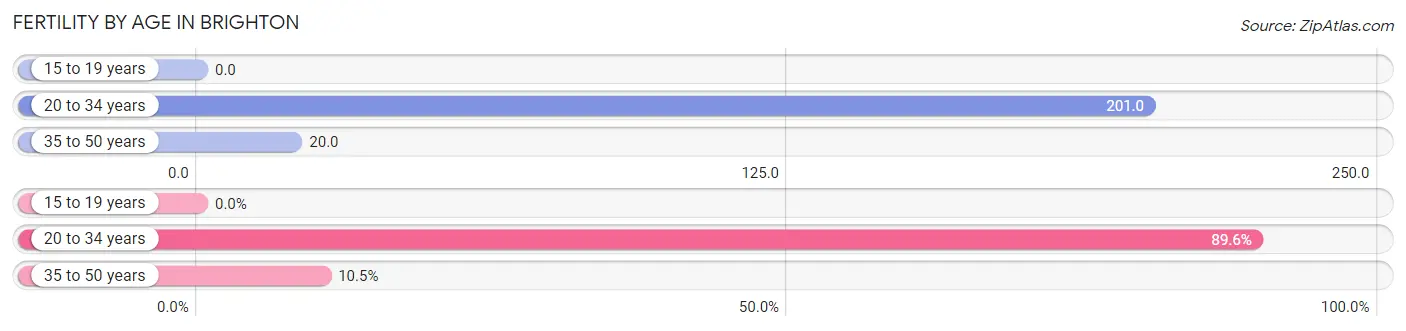
| Age Bracket | Women with Births | Births / 1,000 Women |
| 15 to 19 years | 0 (0.0%) | 0.0 |
| 20 to 34 years | 120 (89.5%) | 201.0 |
| 35 to 50 years | 14 (10.4%) | 20.0 |
| Total | 134 (100.0%) | 92.0 |
Fertility by Age by Marriage Status in Brighton
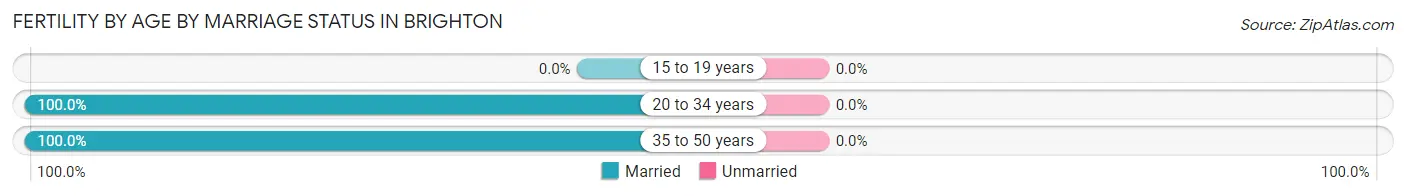
| Age Bracket | Married | Unmarried |
| 15 to 19 years | 0 (0.0%) | 0 (0.0%) |
| 20 to 34 years | 120 (100.0%) | 0 (0.0%) |
| 35 to 50 years | 14 (100.0%) | 0 (0.0%) |
| Total | 134 (100.0%) | 0 (0.0%) |
Fertility by Education in Brighton
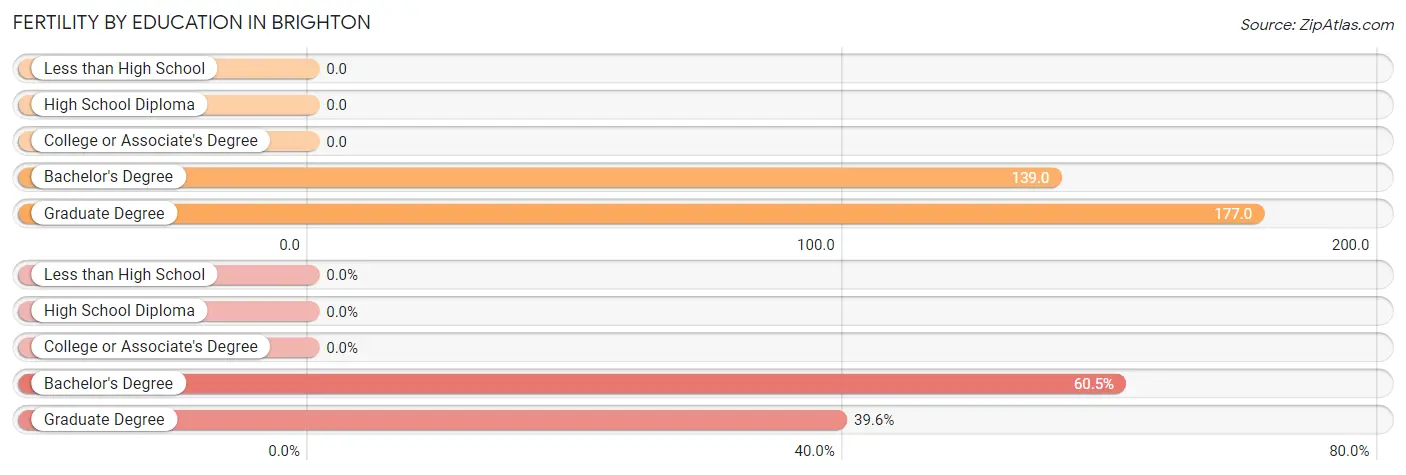
| Educational Attainment | Women with Births | Births / 1,000 Women |
| Less than High School | 0 (0.0%) | 0.0 |
| High School Diploma | 0 (0.0%) | 0.0 |
| College or Associate's Degree | 0 (0.0%) | 0.0 |
| Bachelor's Degree | 81 (60.5%) | 139.0 |
| Graduate Degree | 53 (39.6%) | 177.0 |
| Total | 134 (100.0%) | 92.0 |
Fertility by Education by Marriage Status in Brighton
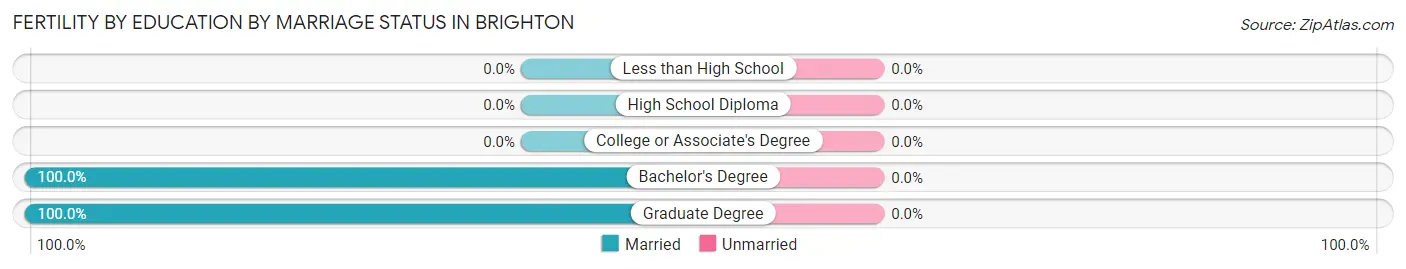
| Educational Attainment | Married | Unmarried |
| Less than High School | 0 (0.0%) | 0 (0.0%) |
| High School Diploma | 0 (0.0%) | 0 (0.0%) |
| College or Associate's Degree | 0 (0.0%) | 0 (0.0%) |
| Bachelor's Degree | 81 (100.0%) | 0 (0.0%) |
| Graduate Degree | 53 (100.0%) | 0 (0.0%) |
| Total | 134 (100.0%) | 0 (0.0%) |
Employment Characteristics in Brighton
Employment by Class of Employer in Brighton
Among the 3,942 employed individuals in Brighton, private company employees (2,806 | 71.2%), not-for-profit organizations (399 | 10.1%), and self-employed (not incorporated) (269 | 6.8%) make up the most common classes of employment.
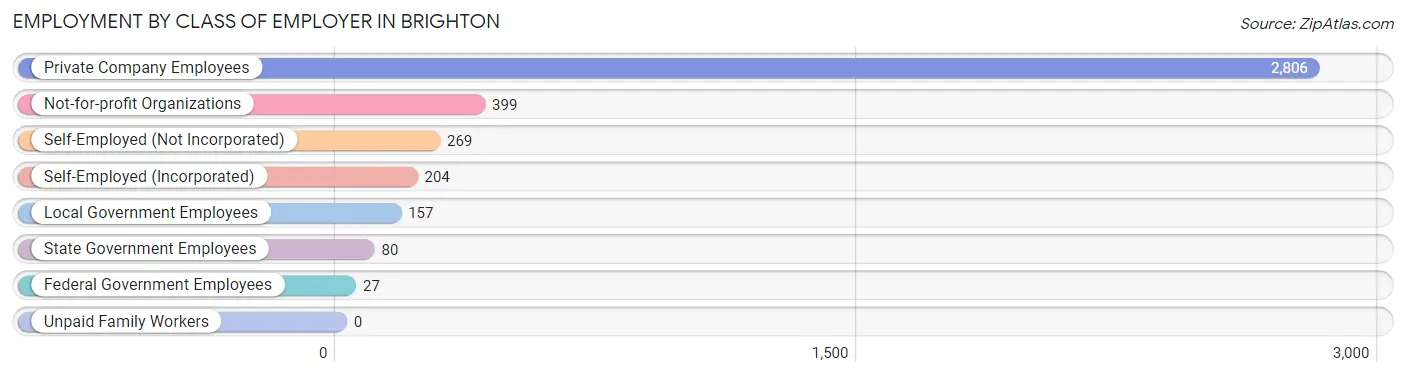
| Employer Class | # Employees | % Employees |
| Private Company Employees | 2,806 | 71.2% |
| Self-Employed (Incorporated) | 204 | 5.2% |
| Self-Employed (Not Incorporated) | 269 | 6.8% |
| Not-for-profit Organizations | 399 | 10.1% |
| Local Government Employees | 157 | 4.0% |
| State Government Employees | 80 | 2.0% |
| Federal Government Employees | 27 | 0.7% |
| Unpaid Family Workers | 0 | 0.0% |
| Total | 3,942 | 100.0% |
Employment Status by Age in Brighton
According to the labor force statistics for Brighton, out of the total population over 16 years of age (6,494), 63.4% or 4,117 individuals are in the labor force, with 2.8% or 115 of them unemployed. The age group with the highest labor force participation rate is 20 to 24 years, with 100.0% or 411 individuals in the labor force. Within the labor force, the 16 to 19 years age range has the highest percentage of unemployed individuals, with 6.5% or 10 of them being unemployed.
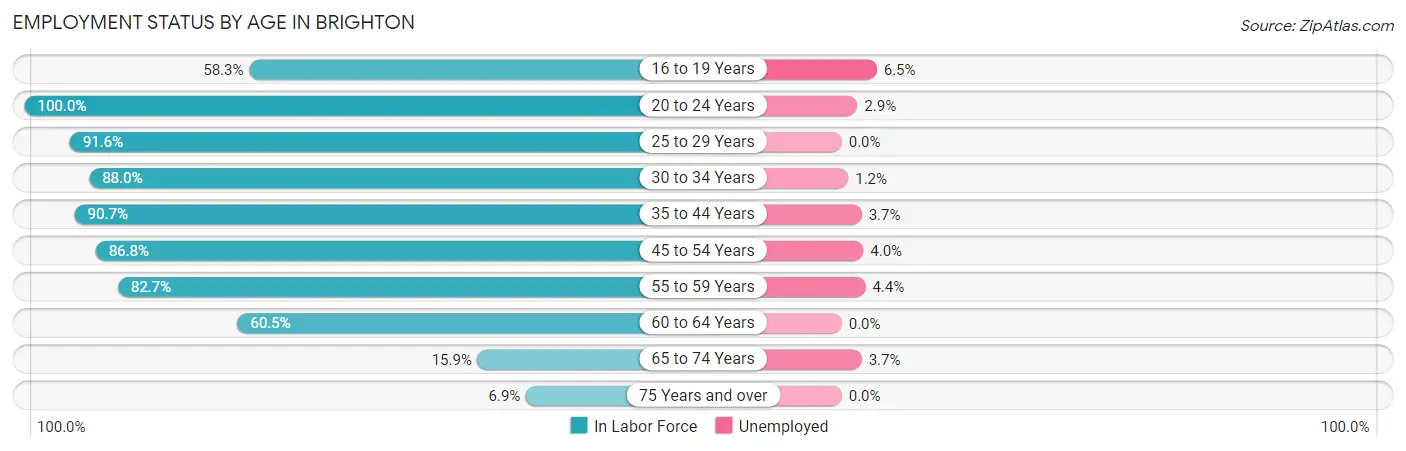
| Age Bracket | In Labor Force | Unemployed |
| 16 to 19 Years | 155 (58.3%) | 10 (6.5%) |
| 20 to 24 Years | 411 (100.0%) | 12 (2.9%) |
| 25 to 29 Years | 535 (91.6%) | 0 (0.0%) |
| 30 to 34 Years | 506 (88.0%) | 6 (1.2%) |
| 35 to 44 Years | 764 (90.7%) | 28 (3.7%) |
| 45 to 54 Years | 726 (86.8%) | 29 (4.0%) |
| 55 to 59 Years | 548 (82.7%) | 24 (4.4%) |
| 60 to 64 Years | 251 (60.5%) | 0 (0.0%) |
| 65 to 74 Years | 164 (15.9%) | 6 (3.7%) |
| 75 Years and over | 60 (6.9%) | 0 (0.0%) |
| Total | 4,117 (63.4%) | 115 (2.8%) |
Employment Status by Educational Attainment in Brighton
According to labor force statistics for Brighton, 85.1% of individuals (3,332) out of the total population between 25 and 64 years of age (3,915) are in the labor force, with 2.6% or 87 of them being unemployed. The group with the highest labor force participation rate are those with the educational attainment of less than high school, with 89.3% or 100 individuals in the labor force. Within the labor force, individuals with high school diploma education have the highest percentage of unemployment, with 10.0% or 52 of them being unemployed.
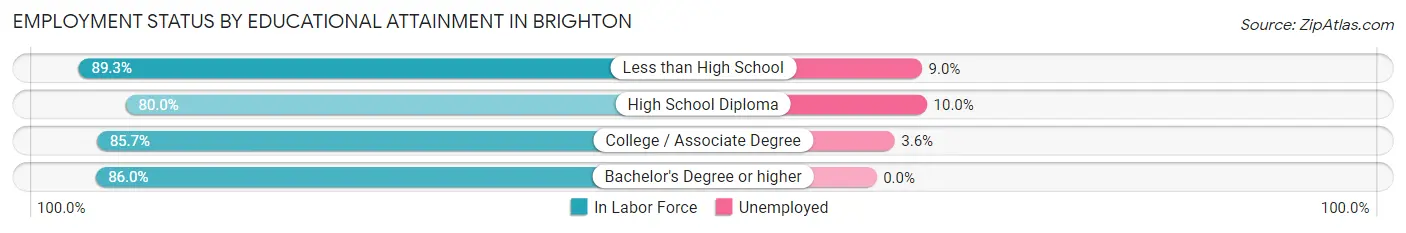
| Educational Attainment | In Labor Force | Unemployed |
| Less than High School | 100 (89.3%) | 10 (9.0%) |
| High School Diploma | 519 (80.0%) | 65 (10.0%) |
| College / Associate Degree | 721 (85.7%) | 30 (3.6%) |
| Bachelor's Degree or higher | 1,989 (86.0%) | 0 (0.0%) |
| Total | 3,332 (85.1%) | 102 (2.6%) |
Employment Occupations by Sex in Brighton
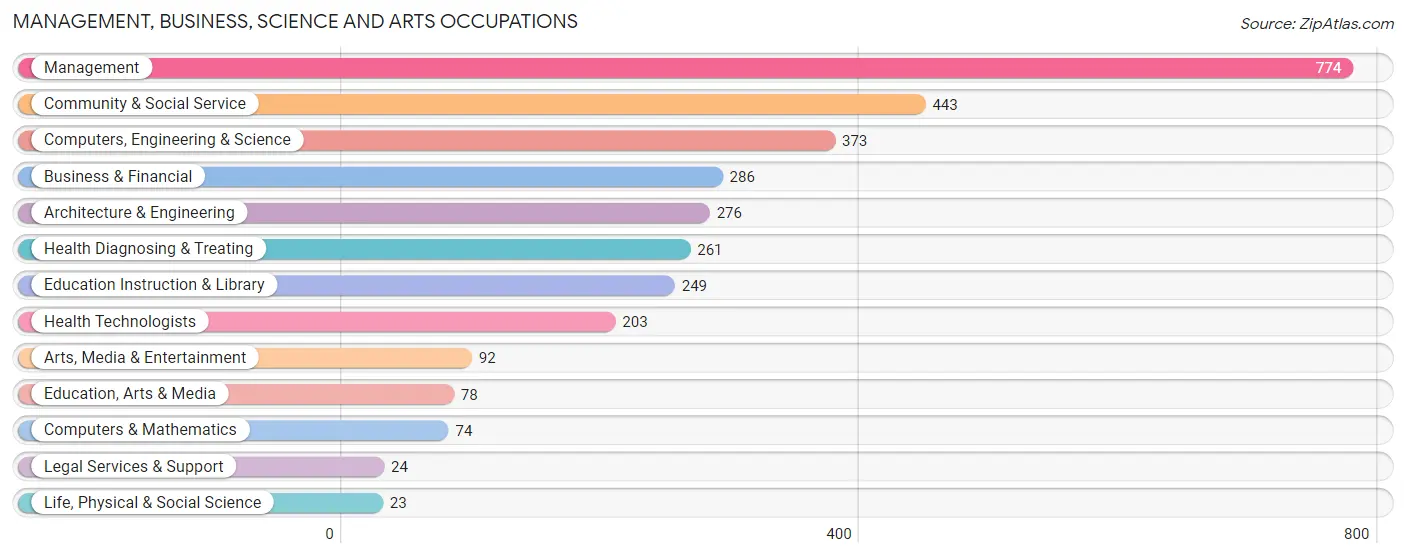
Management, Business, Science and Arts Occupations
The most common Management, Business, Science and Arts occupations in Brighton are Management (774 | 19.3%), Community & Social Service (443 | 11.1%), Computers, Engineering & Science (373 | 9.3%), Business & Financial (286 | 7.1%), and Architecture & Engineering (276 | 6.9%).
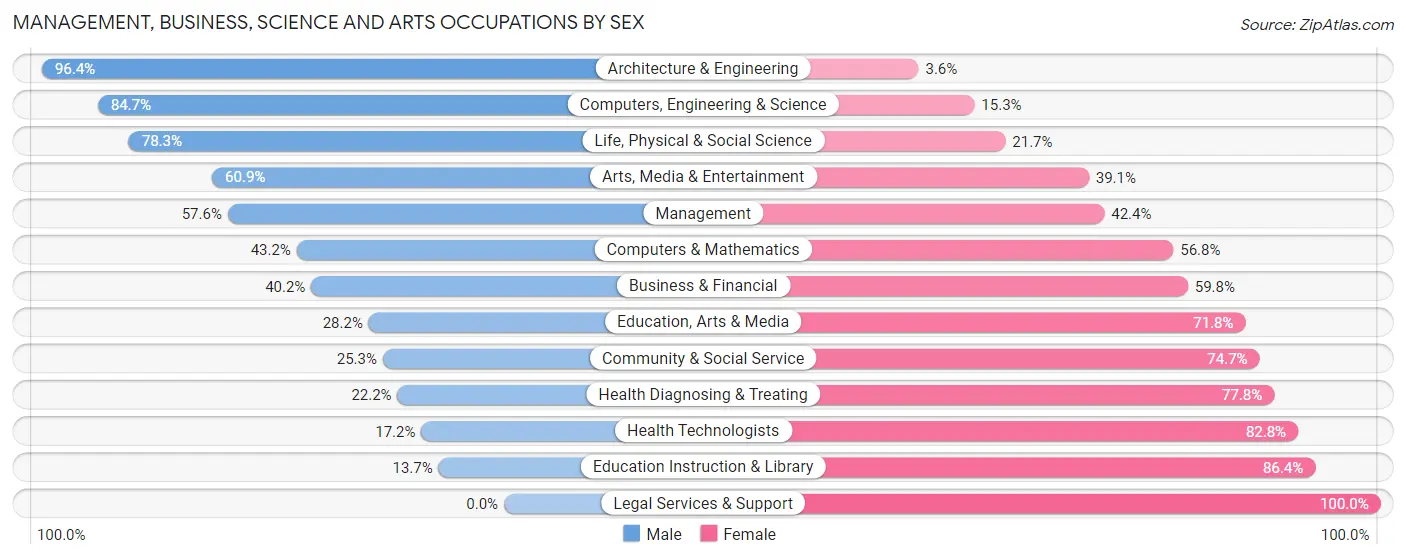
Management, Business, Science and Arts Occupations by Sex
Within the Management, Business, Science and Arts occupations in Brighton, the most male-oriented occupations are Architecture & Engineering (96.4%), Computers, Engineering & Science (84.7%), and Life, Physical & Social Science (78.3%), while the most female-oriented occupations are Legal Services & Support (100.0%), Education Instruction & Library (86.4%), and Health Technologists (82.8%).
| Occupation | Male | Female |
| Management | 446 (57.6%) | 328 (42.4%) |
| Business & Financial | 115 (40.2%) | 171 (59.8%) |
| Computers, Engineering & Science | 316 (84.7%) | 57 (15.3%) |
| Computers & Mathematics | 32 (43.2%) | 42 (56.8%) |
| Architecture & Engineering | 266 (96.4%) | 10 (3.6%) |
| Life, Physical & Social Science | 18 (78.3%) | 5 (21.7%) |
| Community & Social Service | 112 (25.3%) | 331 (74.7%) |
| Education, Arts & Media | 22 (28.2%) | 56 (71.8%) |
| Legal Services & Support | 0 (0.0%) | 24 (100.0%) |
| Education Instruction & Library | 34 (13.7%) | 215 (86.4%) |
| Arts, Media & Entertainment | 56 (60.9%) | 36 (39.1%) |
| Health Diagnosing & Treating | 58 (22.2%) | 203 (77.8%) |
| Health Technologists | 35 (17.2%) | 168 (82.8%) |
| Total (Category) | 1,047 (49.0%) | 1,090 (51.0%) |
| Total (Overall) | 2,074 (51.8%) | 1,931 (48.2%) |
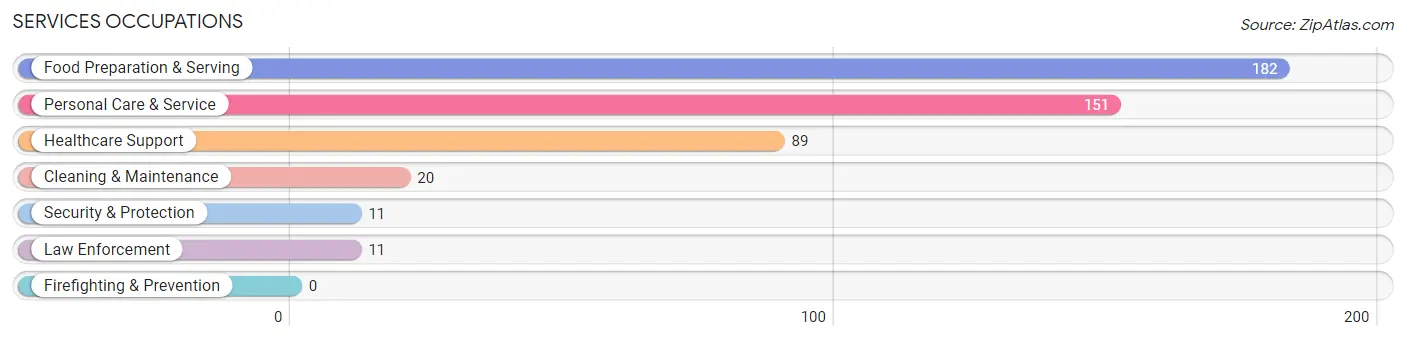
Services Occupations
The most common Services occupations in Brighton are Food Preparation & Serving (182 | 4.5%), Personal Care & Service (151 | 3.8%), Healthcare Support (89 | 2.2%), Cleaning & Maintenance (20 | 0.5%), and Security & Protection (11 | 0.3%).
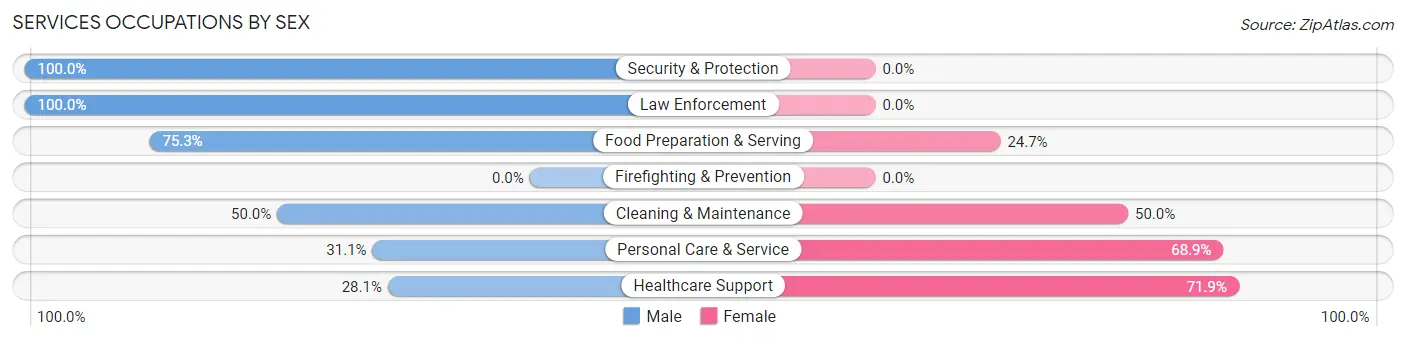
Services Occupations by Sex
Within the Services occupations in Brighton, the most male-oriented occupations are Security & Protection (100.0%), Law Enforcement (100.0%), and Food Preparation & Serving (75.3%), while the most female-oriented occupations are Healthcare Support (71.9%), Personal Care & Service (68.9%), and Cleaning & Maintenance (50.0%).
| Occupation | Male | Female |
| Healthcare Support | 25 (28.1%) | 64 (71.9%) |
| Security & Protection | 11 (100.0%) | 0 (0.0%) |
| Firefighting & Prevention | 0 (0.0%) | 0 (0.0%) |
| Law Enforcement | 11 (100.0%) | 0 (0.0%) |
| Food Preparation & Serving | 137 (75.3%) | 45 (24.7%) |
| Cleaning & Maintenance | 10 (50.0%) | 10 (50.0%) |
| Personal Care & Service | 47 (31.1%) | 104 (68.9%) |
| Total (Category) | 230 (50.8%) | 223 (49.2%) |
| Total (Overall) | 2,074 (51.8%) | 1,931 (48.2%) |
Sales and Office Occupations
The most common Sales and Office occupations in Brighton are Sales & Related (655 | 16.4%), and Office & Administration (261 | 6.5%).
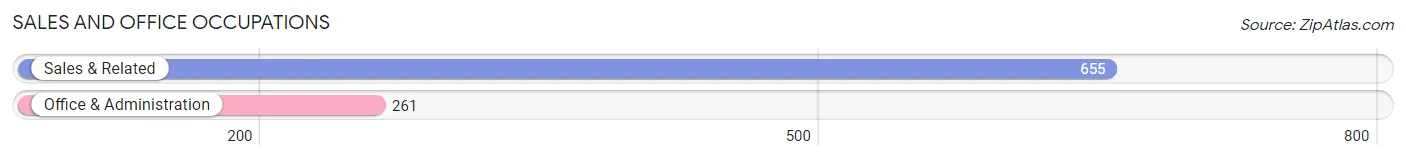
Sales and Office Occupations by Sex
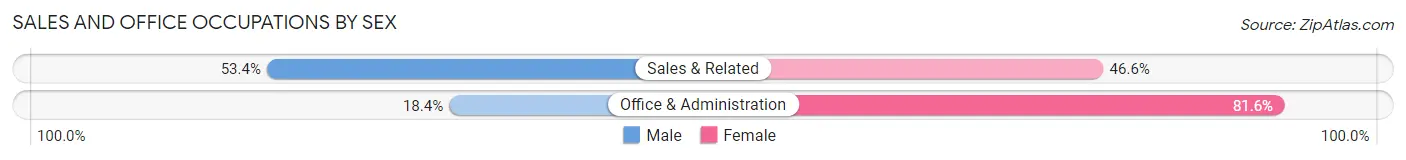
| Occupation | Male | Female |
| Sales & Related | 350 (53.4%) | 305 (46.6%) |
| Office & Administration | 48 (18.4%) | 213 (81.6%) |
| Total (Category) | 398 (43.4%) | 518 (56.6%) |
| Total (Overall) | 2,074 (51.8%) | 1,931 (48.2%) |
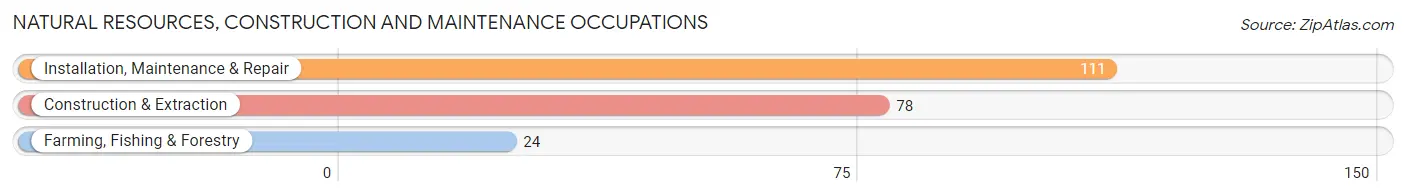
Natural Resources, Construction and Maintenance Occupations
The most common Natural Resources, Construction and Maintenance occupations in Brighton are Installation, Maintenance & Repair (111 | 2.8%), Construction & Extraction (78 | 1.9%), and Farming, Fishing & Forestry (24 | 0.6%).
Natural Resources, Construction and Maintenance Occupations by Sex
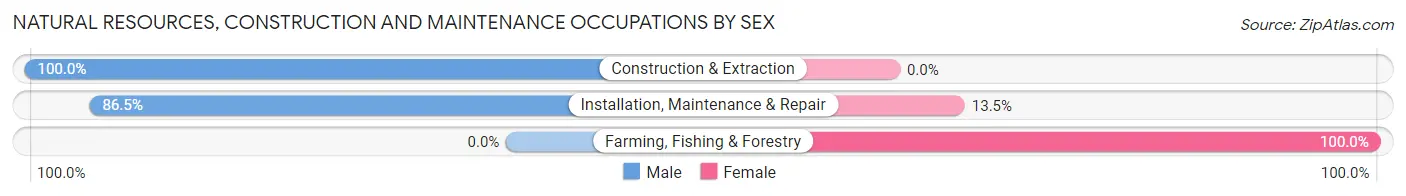
| Occupation | Male | Female |
| Farming, Fishing & Forestry | 0 (0.0%) | 24 (100.0%) |
| Construction & Extraction | 78 (100.0%) | 0 (0.0%) |
| Installation, Maintenance & Repair | 96 (86.5%) | 15 (13.5%) |
| Total (Category) | 174 (81.7%) | 39 (18.3%) |
| Total (Overall) | 2,074 (51.8%) | 1,931 (48.2%) |
Production, Transportation and Moving Occupations
The most common Production, Transportation and Moving occupations in Brighton are Transportation (139 | 3.5%), Production (78 | 1.9%), and Material Moving (69 | 1.7%).
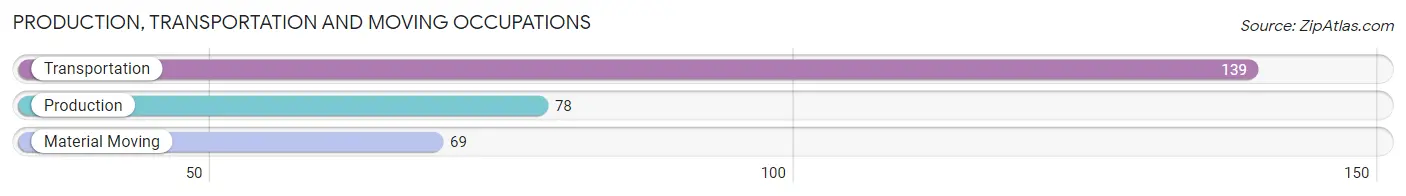
Production, Transportation and Moving Occupations by Sex
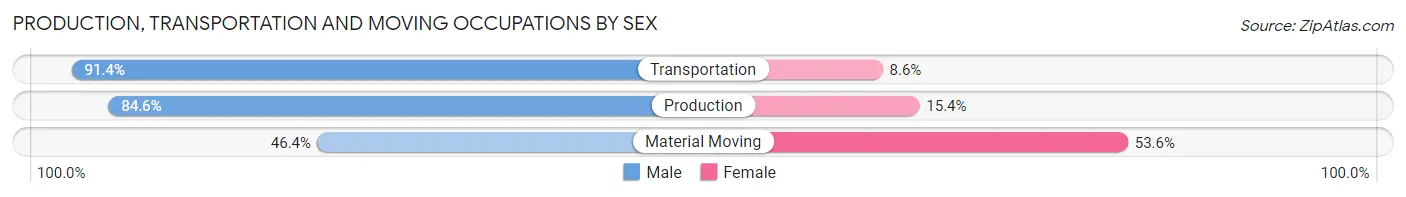
| Occupation | Male | Female |
| Production | 66 (84.6%) | 12 (15.4%) |
| Transportation | 127 (91.4%) | 12 (8.6%) |
| Material Moving | 32 (46.4%) | 37 (53.6%) |
| Total (Category) | 225 (78.7%) | 61 (21.3%) |
| Total (Overall) | 2,074 (51.8%) | 1,931 (48.2%) |
Employment Industries by Sex in Brighton
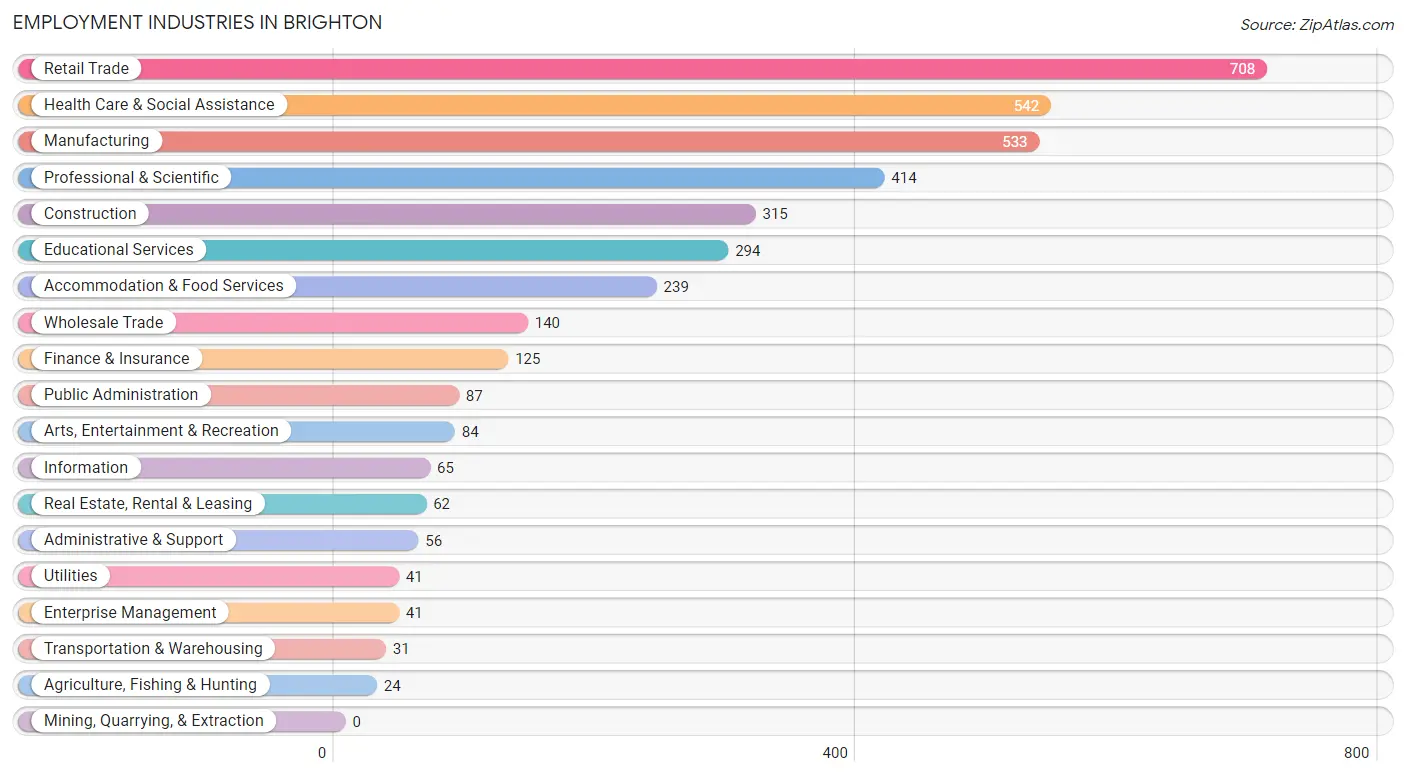
Employment Industries in Brighton
The major employment industries in Brighton include Retail Trade (708 | 17.7%), Health Care & Social Assistance (542 | 13.5%), Manufacturing (533 | 13.3%), Professional & Scientific (414 | 10.3%), and Construction (315 | 7.9%).
Employment Industries by Sex in Brighton
The Brighton industries that see more men than women are Transportation & Warehousing (100.0%), Wholesale Trade (87.1%), and Construction (83.5%), whereas the industries that tend to have a higher number of women are Agriculture, Fishing & Hunting (100.0%), Enterprise Management (100.0%), and Real Estate, Rental & Leasing (93.5%).
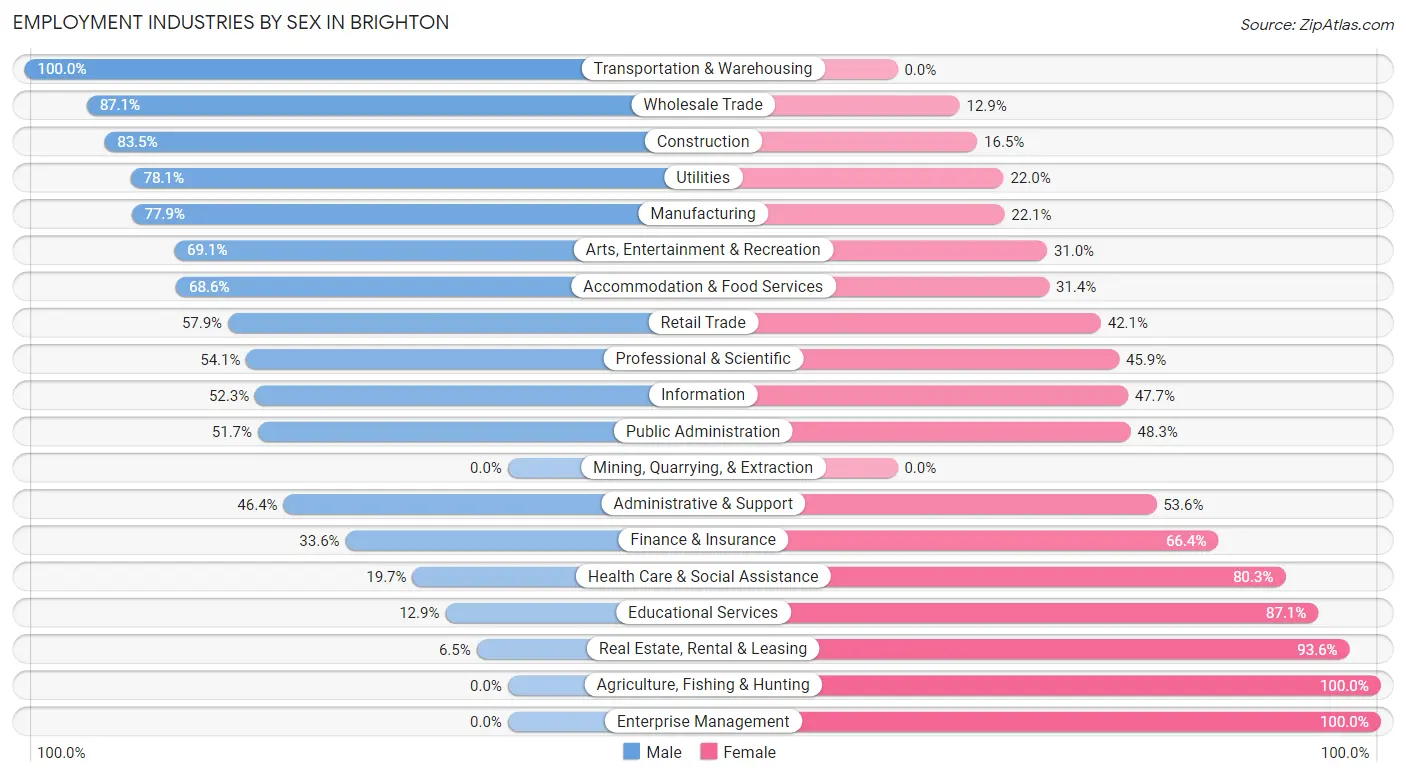
| Industry | Male | Female |
| Agriculture, Fishing & Hunting | 0 (0.0%) | 24 (100.0%) |
| Mining, Quarrying, & Extraction | 0 (0.0%) | 0 (0.0%) |
| Construction | 263 (83.5%) | 52 (16.5%) |
| Manufacturing | 415 (77.9%) | 118 (22.1%) |
| Wholesale Trade | 122 (87.1%) | 18 (12.9%) |
| Retail Trade | 410 (57.9%) | 298 (42.1%) |
| Transportation & Warehousing | 31 (100.0%) | 0 (0.0%) |
| Utilities | 32 (78.0%) | 9 (22.0%) |
| Information | 34 (52.3%) | 31 (47.7%) |
| Finance & Insurance | 42 (33.6%) | 83 (66.4%) |
| Real Estate, Rental & Leasing | 4 (6.5%) | 58 (93.5%) |
| Professional & Scientific | 224 (54.1%) | 190 (45.9%) |
| Enterprise Management | 0 (0.0%) | 41 (100.0%) |
| Administrative & Support | 26 (46.4%) | 30 (53.6%) |
| Educational Services | 38 (12.9%) | 256 (87.1%) |
| Health Care & Social Assistance | 107 (19.7%) | 435 (80.3%) |
| Arts, Entertainment & Recreation | 58 (69.1%) | 26 (30.9%) |
| Accommodation & Food Services | 164 (68.6%) | 75 (31.4%) |
| Public Administration | 45 (51.7%) | 42 (48.3%) |
| Total | 2,074 (51.8%) | 1,931 (48.2%) |
Education in Brighton
School Enrollment in Brighton
The most common levels of schooling among the 1,298 students in Brighton are college / undergraduate (315 | 24.3%), middle school (293 | 22.6%), and elementary school (266 | 20.5%).
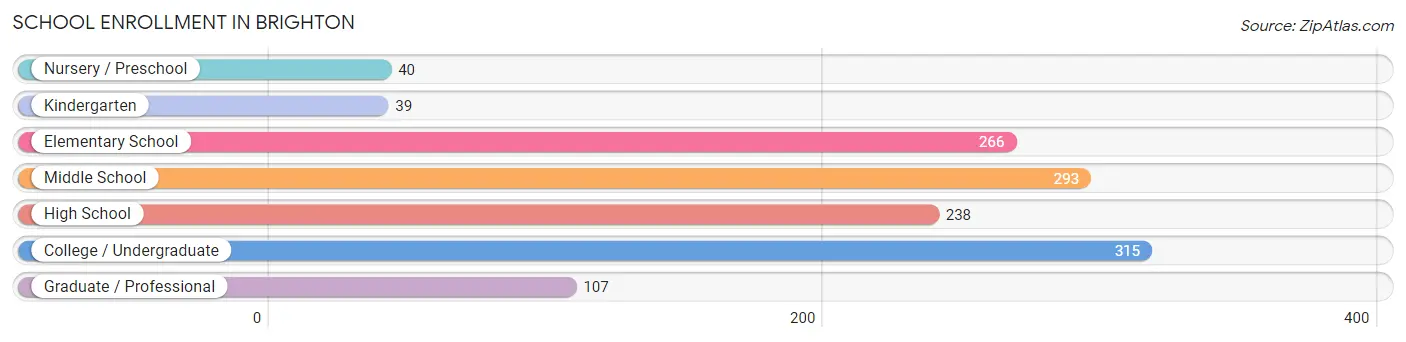
| School Level | # Students | % Students |
| Nursery / Preschool | 40 | 3.1% |
| Kindergarten | 39 | 3.0% |
| Elementary School | 266 | 20.5% |
| Middle School | 293 | 22.6% |
| High School | 238 | 18.3% |
| College / Undergraduate | 315 | 24.3% |
| Graduate / Professional | 107 | 8.2% |
| Total | 1,298 | 100.0% |
School Enrollment by Age by Funding Source in Brighton
Out of a total of 1,298 students who are enrolled in schools in Brighton, 199 (15.3%) attend a private institution, while the remaining 1,099 (84.7%) are enrolled in public schools. The age group of 3 to 4 year olds has the highest likelihood of being enrolled in private schools, with 31 (77.5% in the age bracket) enrolled. Conversely, the age group of 10 to 14 year olds has the lowest likelihood of being enrolled in a private school, with 327 (94.5% in the age bracket) attending a public institution.
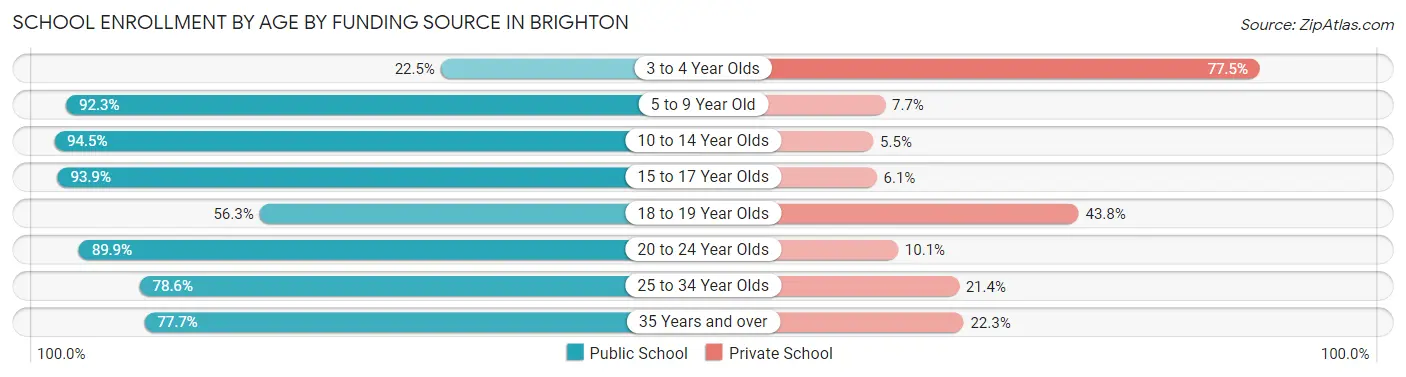
| Age Bracket | Public School | Private School |
| 3 to 4 Year Olds | 9 (22.5%) | 31 (77.5%) |
| 5 to 9 Year Old | 275 (92.3%) | 23 (7.7%) |
| 10 to 14 Year Olds | 327 (94.5%) | 19 (5.5%) |
| 15 to 17 Year Olds | 153 (93.9%) | 10 (6.1%) |
| 18 to 19 Year Olds | 72 (56.2%) | 56 (43.8%) |
| 20 to 24 Year Olds | 89 (89.9%) | 10 (10.1%) |
| 25 to 34 Year Olds | 88 (78.6%) | 24 (21.4%) |
| 35 Years and over | 87 (77.7%) | 25 (22.3%) |
| Total | 1,099 (84.7%) | 199 (15.3%) |
Educational Attainment by Field of Study in Brighton
Business (688 | 22.8%), engineering (478 | 15.8%), science & technology (351 | 11.6%), education (338 | 11.2%), and psychology (182 | 6.0%) are the most common fields of study among 3,024 individuals in Brighton who have obtained a bachelor's degree or higher.
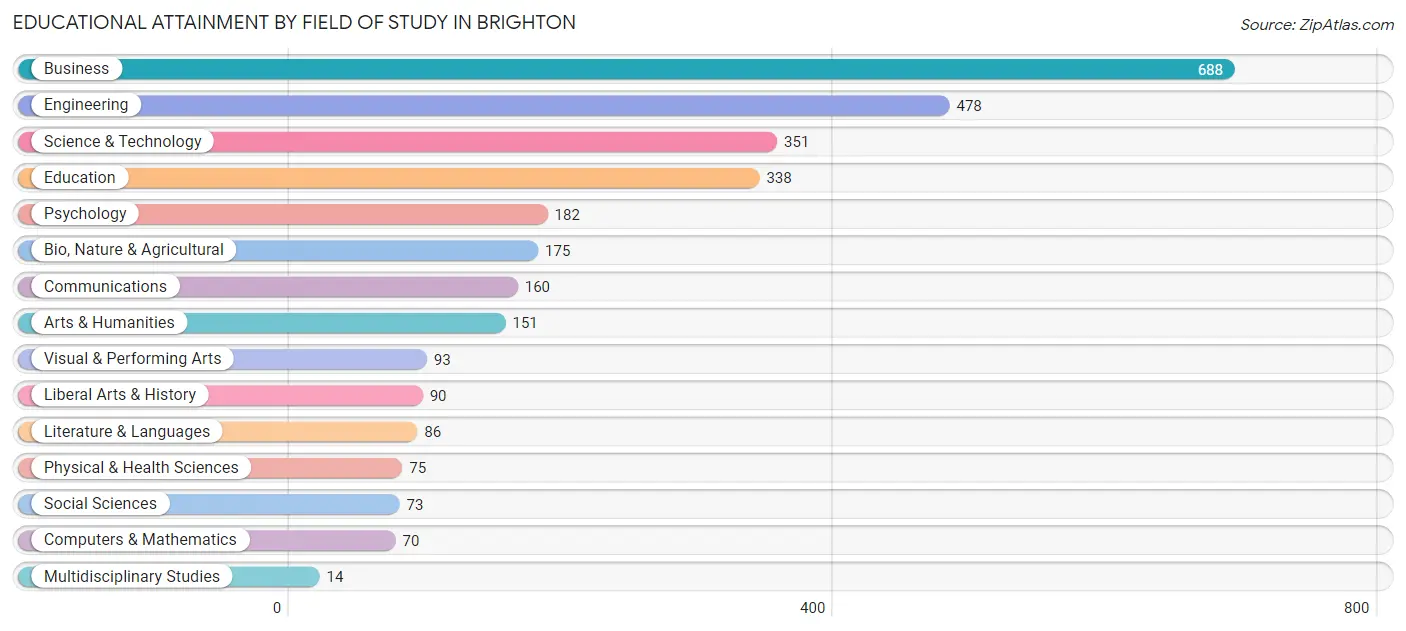
| Field of Study | # Graduates | % Graduates |
| Computers & Mathematics | 70 | 2.3% |
| Bio, Nature & Agricultural | 175 | 5.8% |
| Physical & Health Sciences | 75 | 2.5% |
| Psychology | 182 | 6.0% |
| Social Sciences | 73 | 2.4% |
| Engineering | 478 | 15.8% |
| Multidisciplinary Studies | 14 | 0.5% |
| Science & Technology | 351 | 11.6% |
| Business | 688 | 22.8% |
| Education | 338 | 11.2% |
| Literature & Languages | 86 | 2.8% |
| Liberal Arts & History | 90 | 3.0% |
| Visual & Performing Arts | 93 | 3.1% |
| Communications | 160 | 5.3% |
| Arts & Humanities | 151 | 5.0% |
| Total | 3,024 | 100.0% |
Transportation & Commute in Brighton
Vehicle Availability by Sex in Brighton
The most prevalent vehicle ownership categories in Brighton are males with 2 vehicles (1,098, accounting for 53.2%) and females with 2 vehicles (949, making up 58.4%).
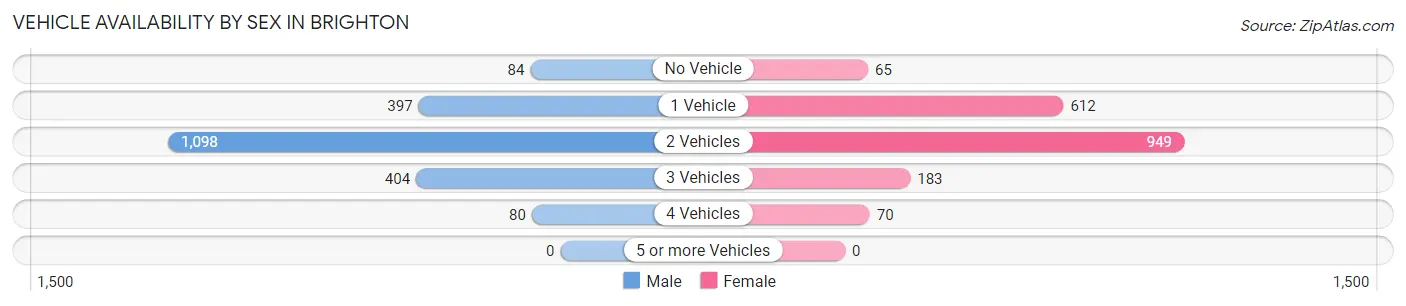
| Vehicles Available | Male | Female |
| No Vehicle | 84 (4.1%) | 65 (3.5%) |
| 1 Vehicle | 397 (19.2%) | 612 (32.6%) |
| 2 Vehicles | 1,098 (53.2%) | 949 (50.5%) |
| 3 Vehicles | 404 (19.6%) | 183 (9.7%) |
| 4 Vehicles | 80 (3.9%) | 70 (3.7%) |
| 5 or more Vehicles | 0 (0.0%) | 0 (0.0%) |
| Total | 2,063 (100.0%) | 1,879 (100.0%) |
Commute Time in Brighton
The most frequently occuring commute durations in Brighton are 5 to 9 minutes (520 commuters, 15.7%), 25 to 29 minutes (458 commuters, 13.8%), and 30 to 34 minutes (455 commuters, 13.7%).
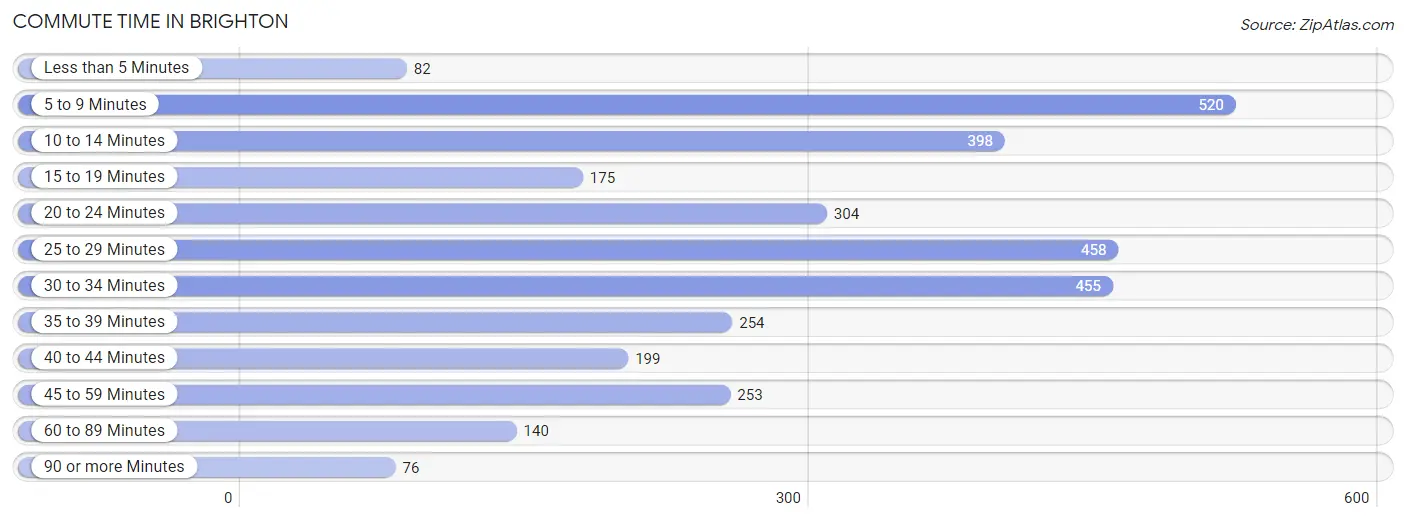
| Commute Time | # Commuters | % Commuters |
| Less than 5 Minutes | 82 | 2.5% |
| 5 to 9 Minutes | 520 | 15.7% |
| 10 to 14 Minutes | 398 | 12.0% |
| 15 to 19 Minutes | 175 | 5.3% |
| 20 to 24 Minutes | 304 | 9.2% |
| 25 to 29 Minutes | 458 | 13.8% |
| 30 to 34 Minutes | 455 | 13.7% |
| 35 to 39 Minutes | 254 | 7.7% |
| 40 to 44 Minutes | 199 | 6.0% |
| 45 to 59 Minutes | 253 | 7.6% |
| 60 to 89 Minutes | 140 | 4.2% |
| 90 or more Minutes | 76 | 2.3% |
Commute Time by Sex in Brighton
The most common commute times in Brighton are 25 to 29 minutes (282 commuters, 17.0%) for males and 5 to 9 minutes (376 commuters, 22.8%) for females.
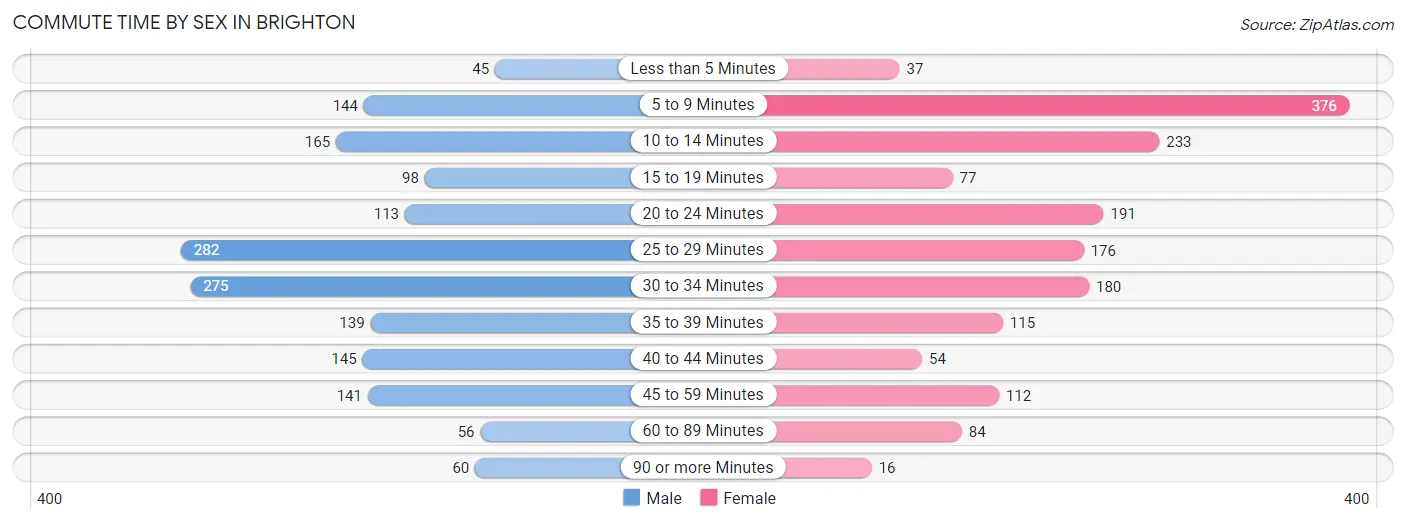
| Commute Time | Male | Female |
| Less than 5 Minutes | 45 (2.7%) | 37 (2.2%) |
| 5 to 9 Minutes | 144 (8.7%) | 376 (22.8%) |
| 10 to 14 Minutes | 165 (9.9%) | 233 (14.1%) |
| 15 to 19 Minutes | 98 (5.9%) | 77 (4.7%) |
| 20 to 24 Minutes | 113 (6.8%) | 191 (11.6%) |
| 25 to 29 Minutes | 282 (17.0%) | 176 (10.7%) |
| 30 to 34 Minutes | 275 (16.5%) | 180 (10.9%) |
| 35 to 39 Minutes | 139 (8.4%) | 115 (7.0%) |
| 40 to 44 Minutes | 145 (8.7%) | 54 (3.3%) |
| 45 to 59 Minutes | 141 (8.5%) | 112 (6.8%) |
| 60 to 89 Minutes | 56 (3.4%) | 84 (5.1%) |
| 90 or more Minutes | 60 (3.6%) | 16 (1.0%) |
Time of Departure to Work by Sex in Brighton
The most frequent times of departure to work in Brighton are 7:30 AM to 7:59 AM (348, 20.9%) for males and 8:00 AM to 8:29 AM (283, 17.1%) for females.
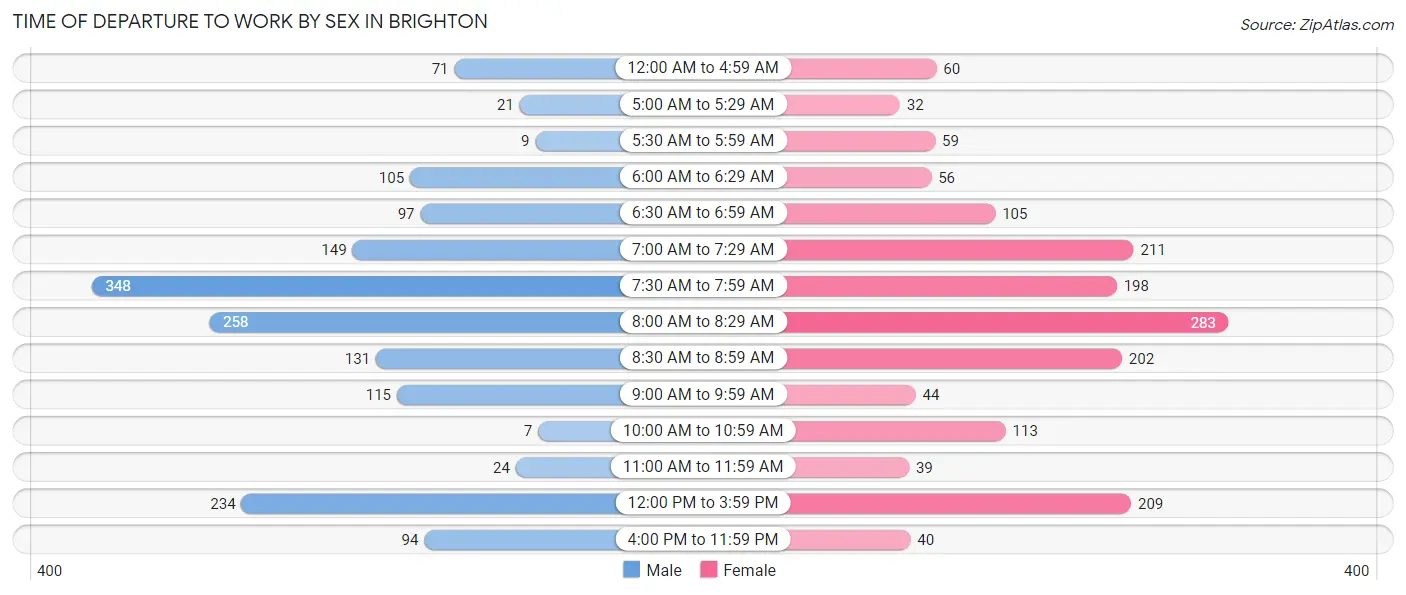
| Time of Departure | Male | Female |
| 12:00 AM to 4:59 AM | 71 (4.3%) | 60 (3.6%) |
| 5:00 AM to 5:29 AM | 21 (1.3%) | 32 (1.9%) |
| 5:30 AM to 5:59 AM | 9 (0.5%) | 59 (3.6%) |
| 6:00 AM to 6:29 AM | 105 (6.3%) | 56 (3.4%) |
| 6:30 AM to 6:59 AM | 97 (5.8%) | 105 (6.4%) |
| 7:00 AM to 7:29 AM | 149 (9.0%) | 211 (12.8%) |
| 7:30 AM to 7:59 AM | 348 (20.9%) | 198 (12.0%) |
| 8:00 AM to 8:29 AM | 258 (15.5%) | 283 (17.1%) |
| 8:30 AM to 8:59 AM | 131 (7.9%) | 202 (12.2%) |
| 9:00 AM to 9:59 AM | 115 (6.9%) | 44 (2.7%) |
| 10:00 AM to 10:59 AM | 7 (0.4%) | 113 (6.8%) |
| 11:00 AM to 11:59 AM | 24 (1.4%) | 39 (2.4%) |
| 12:00 PM to 3:59 PM | 234 (14.1%) | 209 (12.7%) |
| 4:00 PM to 11:59 PM | 94 (5.7%) | 40 (2.4%) |
| Total | 1,663 (100.0%) | 1,651 (100.0%) |
Housing Occupancy in Brighton
Occupancy by Ownership in Brighton
Of the total 3,677 dwellings in Brighton, owner-occupied units account for 2,445 (66.5%), while renter-occupied units make up 1,232 (33.5%).
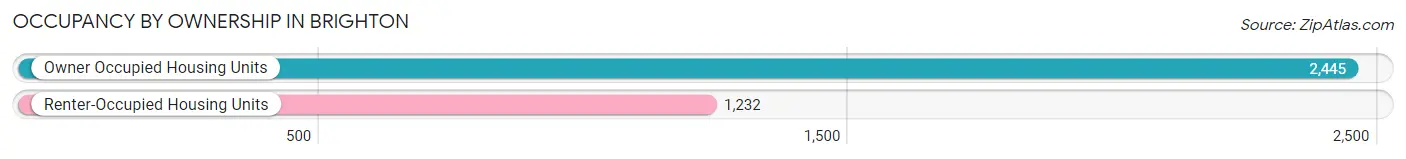
| Occupancy | # Housing Units | % Housing Units |
| Owner Occupied Housing Units | 2,445 | 66.5% |
| Renter-Occupied Housing Units | 1,232 | 33.5% |
| Total Occupied Housing Units | 3,677 | 100.0% |
Occupancy by Household Size in Brighton
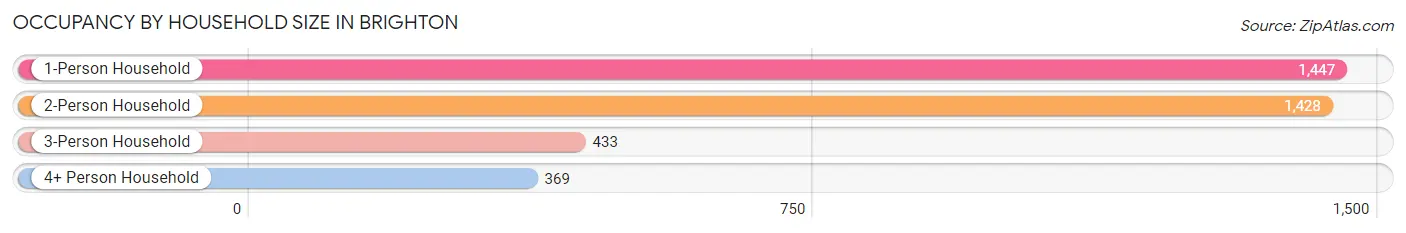
| Household Size | # Housing Units | % Housing Units |
| 1-Person Household | 1,447 | 39.4% |
| 2-Person Household | 1,428 | 38.8% |
| 3-Person Household | 433 | 11.8% |
| 4+ Person Household | 369 | 10.0% |
| Total Housing Units | 3,677 | 100.0% |
Occupancy by Ownership by Household Size in Brighton
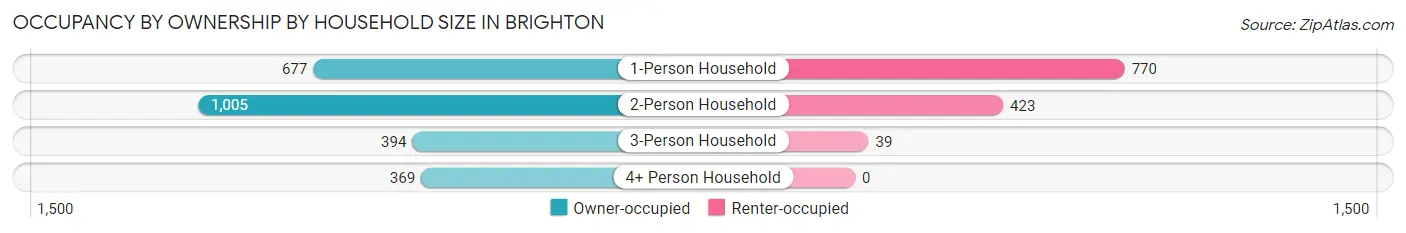
| Household Size | Owner-occupied | Renter-occupied |
| 1-Person Household | 677 (46.8%) | 770 (53.2%) |
| 2-Person Household | 1,005 (70.4%) | 423 (29.6%) |
| 3-Person Household | 394 (91.0%) | 39 (9.0%) |
| 4+ Person Household | 369 (100.0%) | 0 (0.0%) |
| Total Housing Units | 2,445 (66.5%) | 1,232 (33.5%) |
Occupancy by Educational Attainment in Brighton
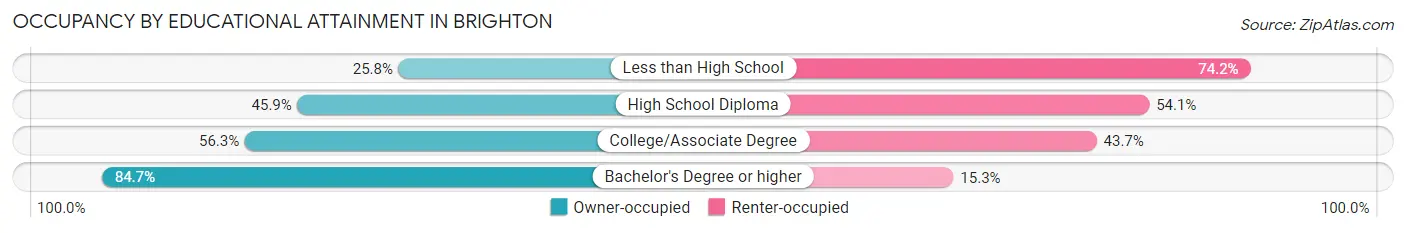
| Household Size | Owner-occupied | Renter-occupied |
| Less than High School | 24 (25.8%) | 69 (74.2%) |
| High School Diploma | 372 (45.9%) | 439 (54.1%) |
| College/Associate Degree | 594 (56.3%) | 461 (43.7%) |
| Bachelor's Degree or higher | 1,455 (84.7%) | 263 (15.3%) |
Occupancy by Age of Householder in Brighton
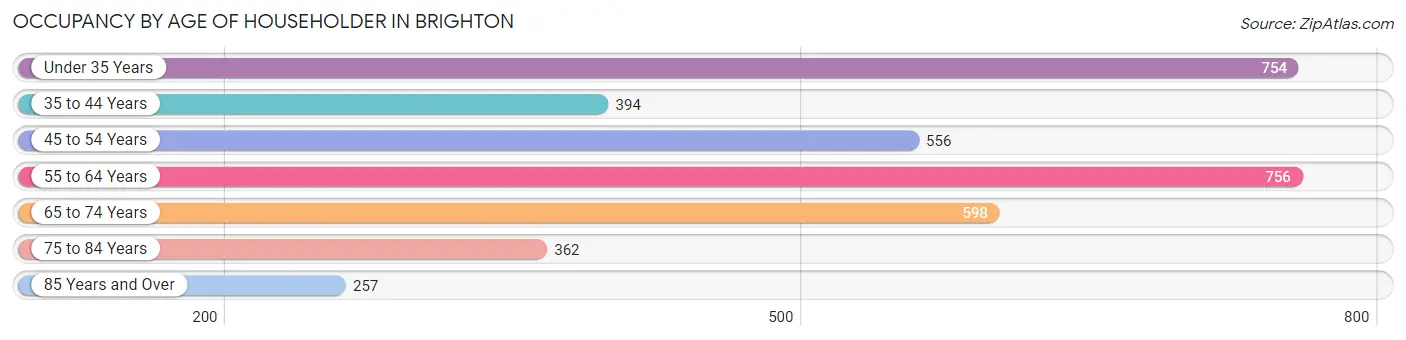
| Age Bracket | # Households | % Households |
| Under 35 Years | 754 | 20.5% |
| 35 to 44 Years | 394 | 10.7% |
| 45 to 54 Years | 556 | 15.1% |
| 55 to 64 Years | 756 | 20.6% |
| 65 to 74 Years | 598 | 16.3% |
| 75 to 84 Years | 362 | 9.8% |
| 85 Years and Over | 257 | 7.0% |
| Total | 3,677 | 100.0% |
Housing Finances in Brighton
Median Income by Occupancy in Brighton
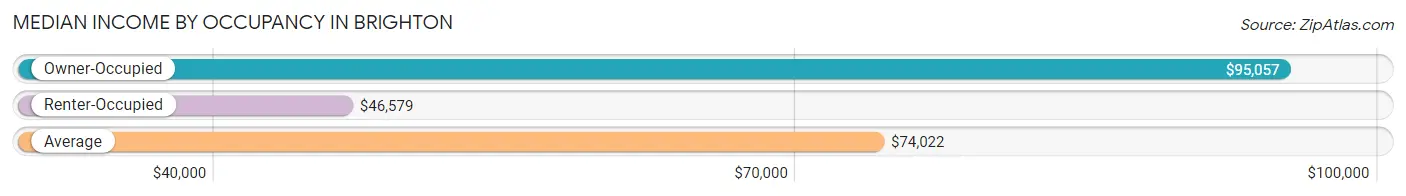
| Occupancy Type | # Households | Median Income |
| Owner-Occupied | 2,445 (66.5%) | $95,057 |
| Renter-Occupied | 1,232 (33.5%) | $46,579 |
| Average | 3,677 (100.0%) | $74,022 |
Occupancy by Householder Income Bracket in Brighton
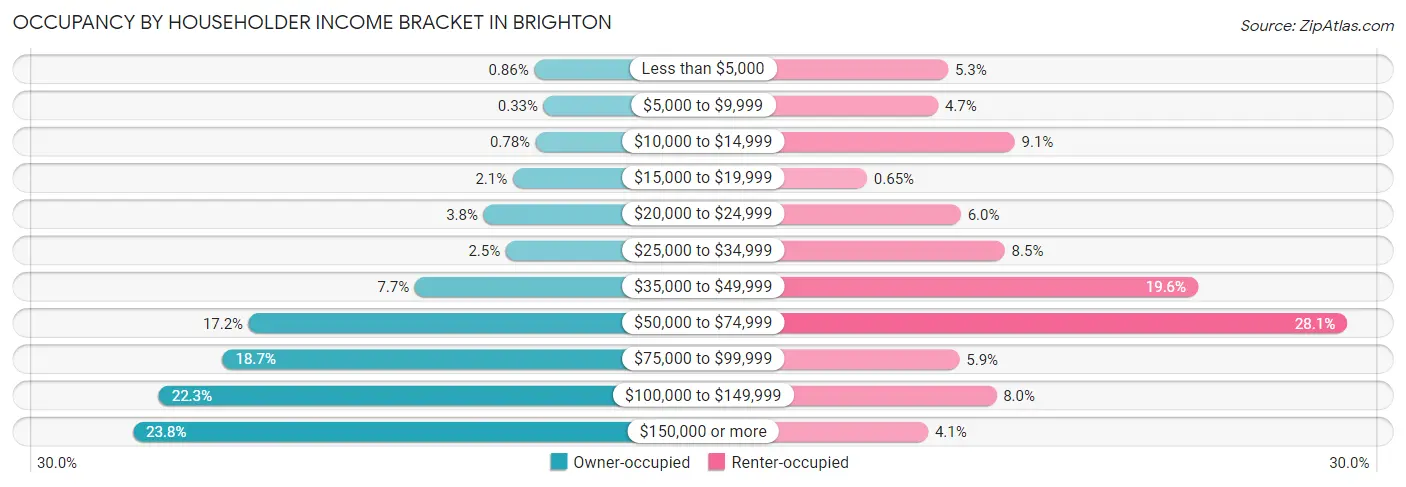
| Income Bracket | Owner-occupied | Renter-occupied |
| Less than $5,000 | 21 (0.9%) | 65 (5.3%) |
| $5,000 to $9,999 | 8 (0.3%) | 58 (4.7%) |
| $10,000 to $14,999 | 19 (0.8%) | 112 (9.1%) |
| $15,000 to $19,999 | 51 (2.1%) | 8 (0.6%) |
| $20,000 to $24,999 | 92 (3.8%) | 74 (6.0%) |
| $25,000 to $34,999 | 61 (2.5%) | 105 (8.5%) |
| $35,000 to $49,999 | 188 (7.7%) | 241 (19.6%) |
| $50,000 to $74,999 | 420 (17.2%) | 346 (28.1%) |
| $75,000 to $99,999 | 457 (18.7%) | 73 (5.9%) |
| $100,000 to $149,999 | 546 (22.3%) | 99 (8.0%) |
| $150,000 or more | 582 (23.8%) | 51 (4.1%) |
| Total | 2,445 (100.0%) | 1,232 (100.0%) |
Monthly Housing Cost Tiers in Brighton
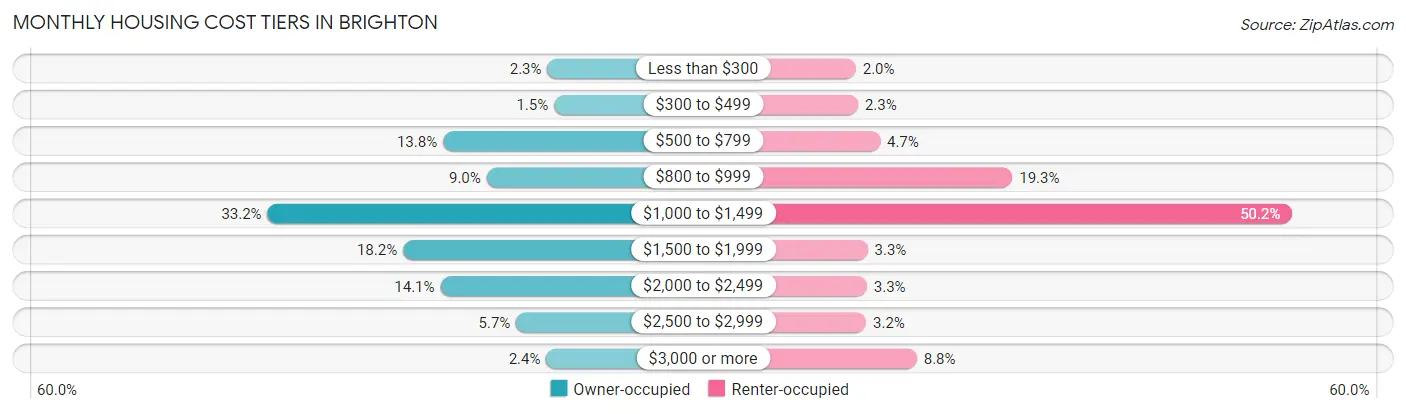
| Monthly Cost | Owner-occupied | Renter-occupied |
| Less than $300 | 55 (2.2%) | 25 (2.0%) |
| $300 to $499 | 37 (1.5%) | 28 (2.3%) |
| $500 to $799 | 337 (13.8%) | 58 (4.7%) |
| $800 to $999 | 219 (9.0%) | 238 (19.3%) |
| $1,000 to $1,499 | 811 (33.2%) | 619 (50.2%) |
| $1,500 to $1,999 | 445 (18.2%) | 41 (3.3%) |
| $2,000 to $2,499 | 344 (14.1%) | 40 (3.3%) |
| $2,500 to $2,999 | 139 (5.7%) | 39 (3.2%) |
| $3,000 or more | 58 (2.4%) | 108 (8.8%) |
| Total | 2,445 (100.0%) | 1,232 (100.0%) |
Physical Housing Characteristics in Brighton
Housing Structures in Brighton
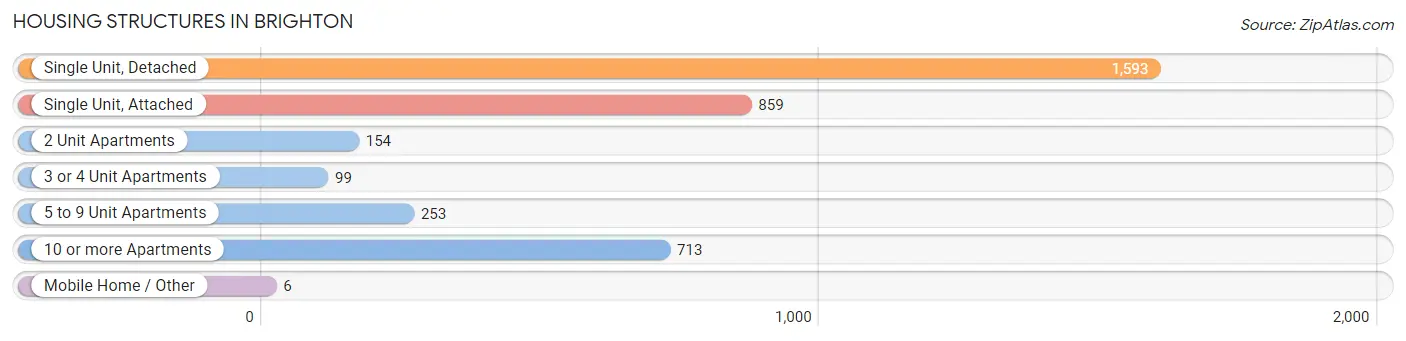
| Structure Type | # Housing Units | % Housing Units |
| Single Unit, Detached | 1,593 | 43.3% |
| Single Unit, Attached | 859 | 23.4% |
| 2 Unit Apartments | 154 | 4.2% |
| 3 or 4 Unit Apartments | 99 | 2.7% |
| 5 to 9 Unit Apartments | 253 | 6.9% |
| 10 or more Apartments | 713 | 19.4% |
| Mobile Home / Other | 6 | 0.2% |
| Total | 3,677 | 100.0% |
Housing Structures by Occupancy in Brighton
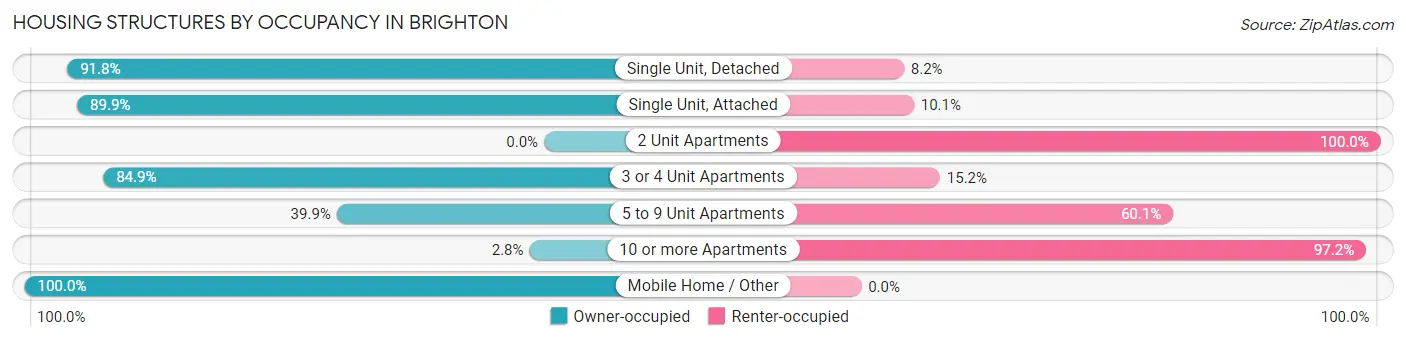
| Structure Type | Owner-occupied | Renter-occupied |
| Single Unit, Detached | 1,462 (91.8%) | 131 (8.2%) |
| Single Unit, Attached | 772 (89.9%) | 87 (10.1%) |
| 2 Unit Apartments | 0 (0.0%) | 154 (100.0%) |
| 3 or 4 Unit Apartments | 84 (84.9%) | 15 (15.1%) |
| 5 to 9 Unit Apartments | 101 (39.9%) | 152 (60.1%) |
| 10 or more Apartments | 20 (2.8%) | 693 (97.2%) |
| Mobile Home / Other | 6 (100.0%) | 0 (0.0%) |
| Total | 2,445 (66.5%) | 1,232 (33.5%) |
Housing Structures by Number of Rooms in Brighton
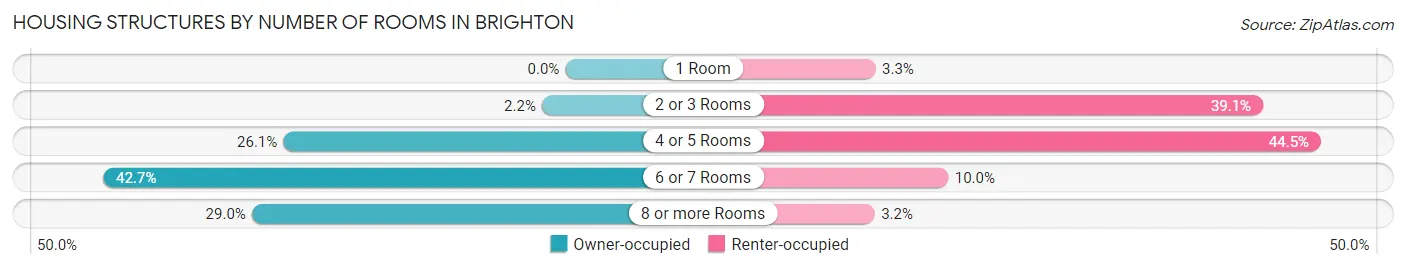
| Number of Rooms | Owner-occupied | Renter-occupied |
| 1 Room | 0 (0.0%) | 40 (3.3%) |
| 2 or 3 Rooms | 53 (2.2%) | 482 (39.1%) |
| 4 or 5 Rooms | 638 (26.1%) | 548 (44.5%) |
| 6 or 7 Rooms | 1,045 (42.7%) | 123 (10.0%) |
| 8 or more Rooms | 709 (29.0%) | 39 (3.2%) |
| Total | 2,445 (100.0%) | 1,232 (100.0%) |
Housing Structure by Heating Type in Brighton
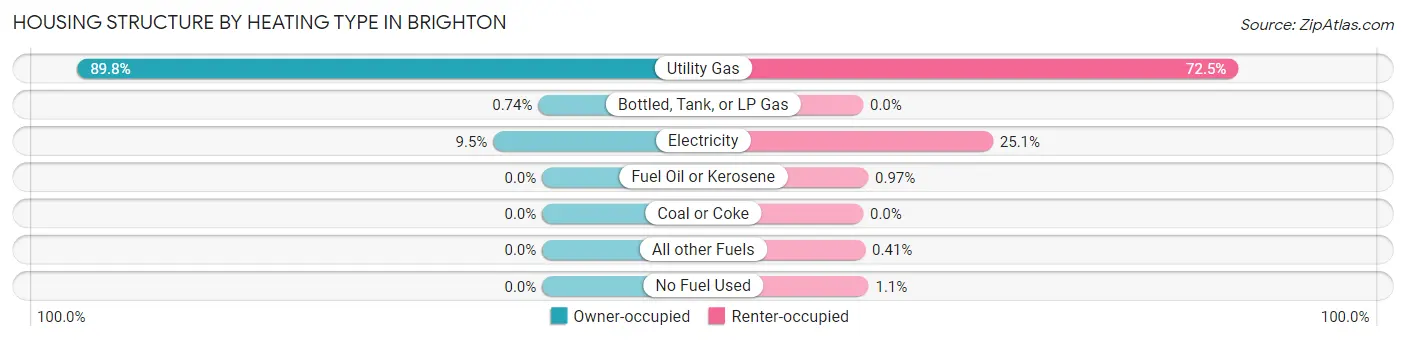
| Heating Type | Owner-occupied | Renter-occupied |
| Utility Gas | 2,196 (89.8%) | 893 (72.5%) |
| Bottled, Tank, or LP Gas | 18 (0.7%) | 0 (0.0%) |
| Electricity | 231 (9.5%) | 309 (25.1%) |
| Fuel Oil or Kerosene | 0 (0.0%) | 12 (1.0%) |
| Coal or Coke | 0 (0.0%) | 0 (0.0%) |
| All other Fuels | 0 (0.0%) | 5 (0.4%) |
| No Fuel Used | 0 (0.0%) | 13 (1.1%) |
| Total | 2,445 (100.0%) | 1,232 (100.0%) |
Household Vehicle Usage in Brighton
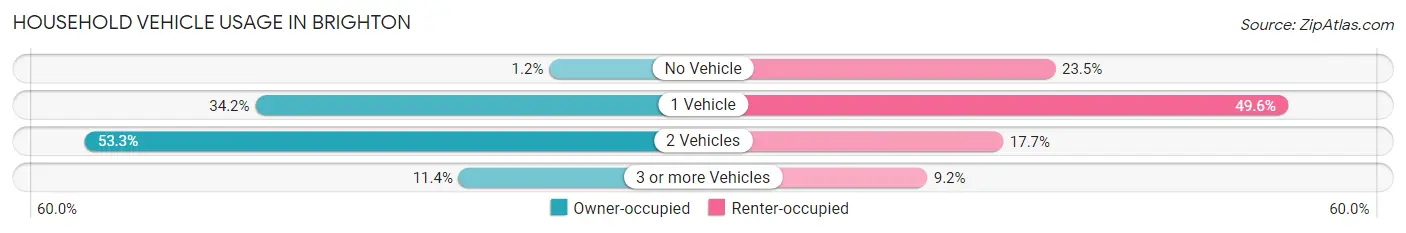
| Vehicles per Household | Owner-occupied | Renter-occupied |
| No Vehicle | 30 (1.2%) | 290 (23.5%) |
| 1 Vehicle | 835 (34.2%) | 611 (49.6%) |
| 2 Vehicles | 1,302 (53.2%) | 218 (17.7%) |
| 3 or more Vehicles | 278 (11.4%) | 113 (9.2%) |
| Total | 2,445 (100.0%) | 1,232 (100.0%) |
Real Estate & Mortgages in Brighton
Real Estate and Mortgage Overview in Brighton
| Characteristic | Without Mortgage | With Mortgage |
| Housing Units | 805 | 1,640 |
| Median Property Value | $281,800 | $282,100 |
| Median Household Income | $73,825 | $468 |
| Monthly Housing Costs | $797 | $58 |
| Real Estate Taxes | $4,051 | $27 |
Property Value by Mortgage Status in Brighton
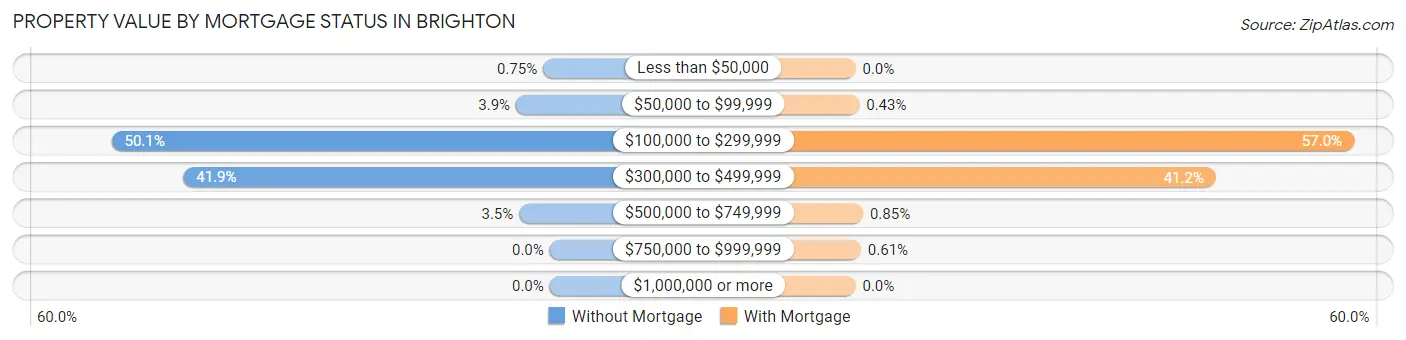
| Property Value | Without Mortgage | With Mortgage |
| Less than $50,000 | 6 (0.7%) | 0 (0.0%) |
| $50,000 to $99,999 | 31 (3.8%) | 7 (0.4%) |
| $100,000 to $299,999 | 403 (50.1%) | 934 (57.0%) |
| $300,000 to $499,999 | 337 (41.9%) | 675 (41.2%) |
| $500,000 to $749,999 | 28 (3.5%) | 14 (0.9%) |
| $750,000 to $999,999 | 0 (0.0%) | 10 (0.6%) |
| $1,000,000 or more | 0 (0.0%) | 0 (0.0%) |
| Total | 805 (100.0%) | 1,640 (100.0%) |
Household Income by Mortgage Status in Brighton
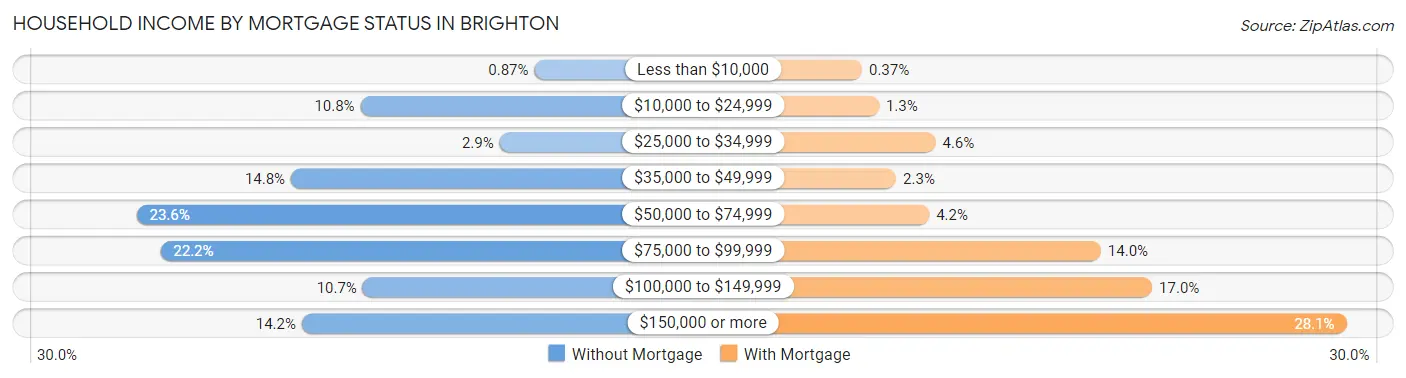
| Household Income | Without Mortgage | With Mortgage |
| Less than $10,000 | 7 (0.9%) | 6 (0.4%) |
| $10,000 to $24,999 | 87 (10.8%) | 22 (1.3%) |
| $25,000 to $34,999 | 23 (2.9%) | 75 (4.6%) |
| $35,000 to $49,999 | 119 (14.8%) | 38 (2.3%) |
| $50,000 to $74,999 | 190 (23.6%) | 69 (4.2%) |
| $75,000 to $99,999 | 179 (22.2%) | 230 (14.0%) |
| $100,000 to $149,999 | 86 (10.7%) | 278 (17.0%) |
| $150,000 or more | 114 (14.2%) | 460 (28.1%) |
| Total | 805 (100.0%) | 1,640 (100.0%) |
Property Value to Household Income Ratio in Brighton
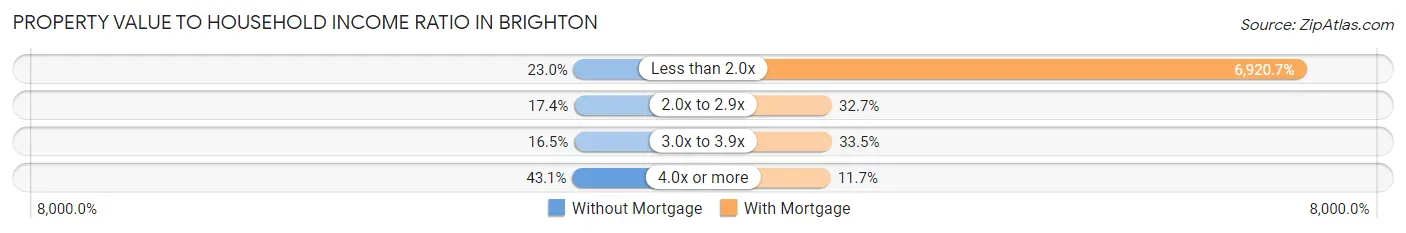
| Value-to-Income Ratio | Without Mortgage | With Mortgage |
| Less than 2.0x | 185 (23.0%) | 113,500 (6,920.7%) |
| 2.0x to 2.9x | 140 (17.4%) | 536 (32.7%) |
| 3.0x to 3.9x | 133 (16.5%) | 550 (33.5%) |
| 4.0x or more | 347 (43.1%) | 191 (11.7%) |
| Total | 805 (100.0%) | 1,640 (100.0%) |
Real Estate Taxes by Mortgage Status in Brighton
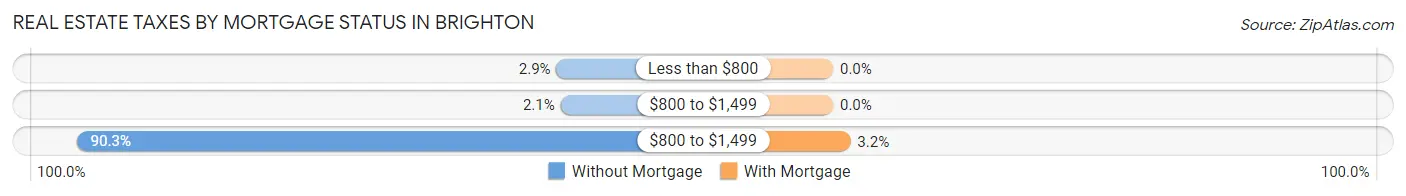
| Property Taxes | Without Mortgage | With Mortgage |
| Less than $800 | 23 (2.9%) | 0 (0.0%) |
| $800 to $1,499 | 17 (2.1%) | 0 (0.0%) |
| $800 to $1,499 | 727 (90.3%) | 52 (3.2%) |
| Total | 805 (100.0%) | 1,640 (100.0%) |
Health & Disability in Brighton
Health Insurance Coverage by Age in Brighton
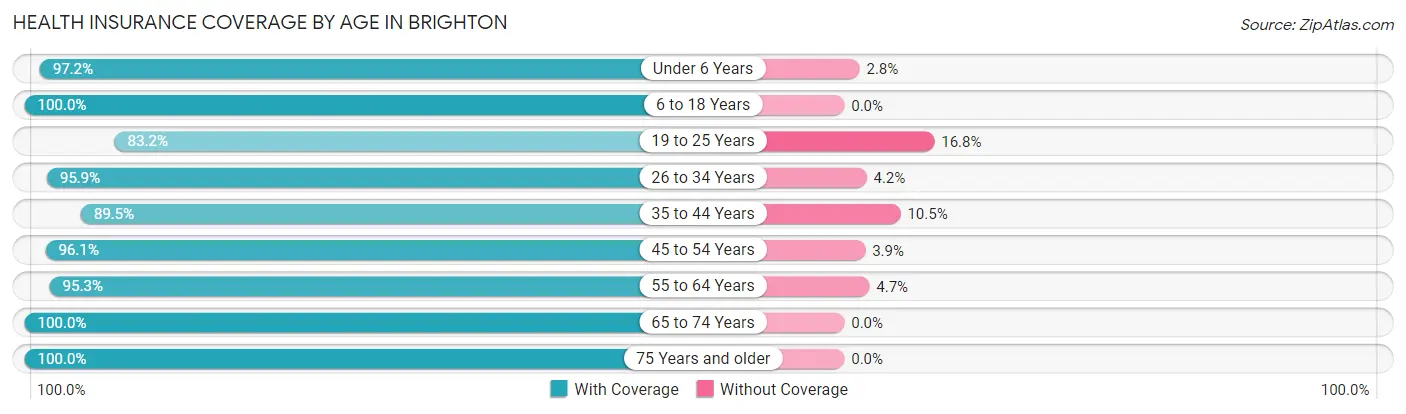
| Age Bracket | With Coverage | Without Coverage |
| Under 6 Years | 274 (97.2%) | 8 (2.8%) |
| 6 to 18 Years | 837 (100.0%) | 0 (0.0%) |
| 19 to 25 Years | 560 (83.2%) | 113 (16.8%) |
| 26 to 34 Years | 993 (95.9%) | 43 (4.2%) |
| 35 to 44 Years | 743 (89.5%) | 87 (10.5%) |
| 45 to 54 Years | 788 (96.1%) | 32 (3.9%) |
| 55 to 64 Years | 1,020 (95.3%) | 50 (4.7%) |
| 65 to 74 Years | 1,033 (100.0%) | 0 (0.0%) |
| 75 Years and older | 839 (100.0%) | 0 (0.0%) |
| Total | 7,087 (95.5%) | 333 (4.5%) |
Health Insurance Coverage by Citizenship Status in Brighton
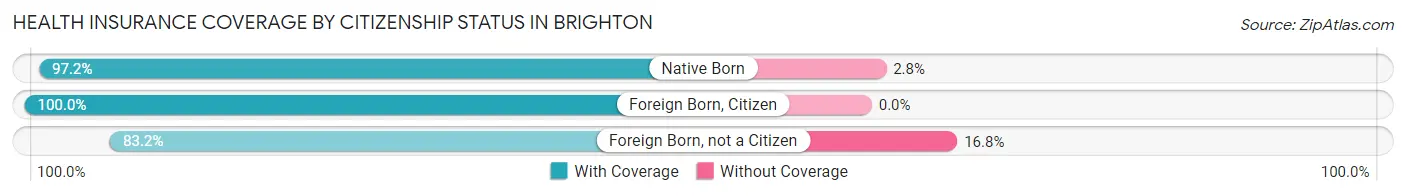
| Citizenship Status | With Coverage | Without Coverage |
| Native Born | 274 (97.2%) | 8 (2.8%) |
| Foreign Born, Citizen | 837 (100.0%) | 0 (0.0%) |
| Foreign Born, not a Citizen | 560 (83.2%) | 113 (16.8%) |
Health Insurance Coverage by Household Income in Brighton
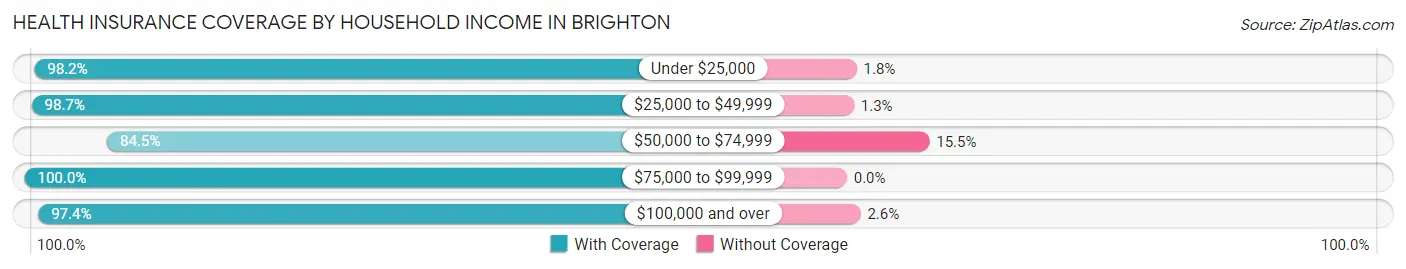
| Household Income | With Coverage | Without Coverage |
| Under $25,000 | 586 (98.2%) | 11 (1.8%) |
| $25,000 to $49,999 | 822 (98.7%) | 11 (1.3%) |
| $50,000 to $74,999 | 1,225 (84.5%) | 224 (15.5%) |
| $75,000 to $99,999 | 1,090 (100.0%) | 0 (0.0%) |
| $100,000 and over | 3,309 (97.4%) | 87 (2.6%) |
Public vs Private Health Insurance Coverage by Age in Brighton
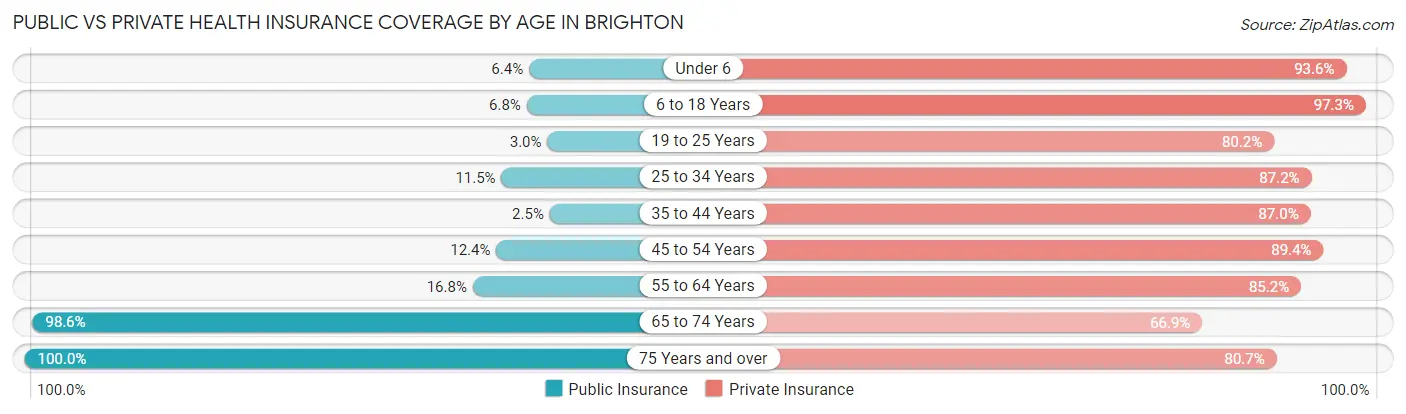
| Age Bracket | Public Insurance | Private Insurance |
| Under 6 | 18 (6.4%) | 264 (93.6%) |
| 6 to 18 Years | 57 (6.8%) | 814 (97.3%) |
| 19 to 25 Years | 20 (3.0%) | 540 (80.2%) |
| 25 to 34 Years | 119 (11.5%) | 903 (87.2%) |
| 35 to 44 Years | 21 (2.5%) | 722 (87.0%) |
| 45 to 54 Years | 102 (12.4%) | 733 (89.4%) |
| 55 to 64 Years | 180 (16.8%) | 912 (85.2%) |
| 65 to 74 Years | 1,018 (98.6%) | 691 (66.9%) |
| 75 Years and over | 839 (100.0%) | 677 (80.7%) |
| Total | 2,374 (32.0%) | 6,256 (84.3%) |
Disability Status by Sex by Age in Brighton
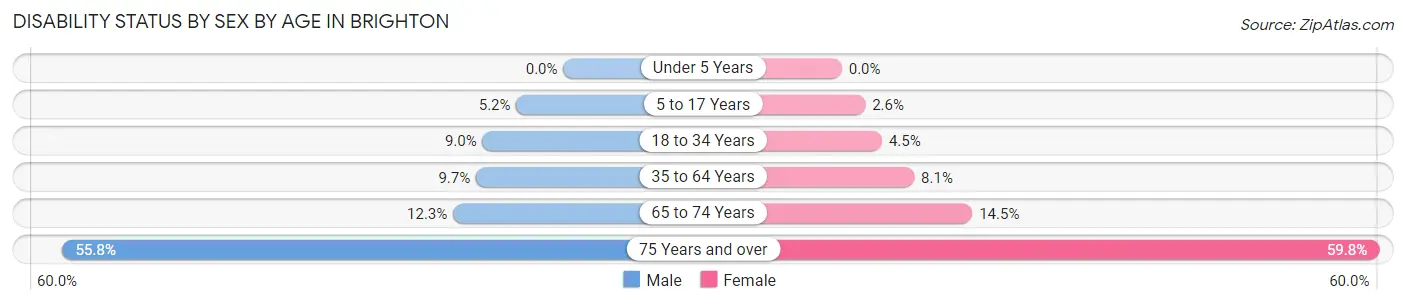
| Age Bracket | Male | Female |
| Under 5 Years | 0 (0.0%) | 0 (0.0%) |
| 5 to 17 Years | 23 (5.2%) | 10 (2.6%) |
| 18 to 34 Years | 92 (9.0%) | 32 (4.5%) |
| 35 to 64 Years | 116 (9.7%) | 123 (8.1%) |
| 65 to 74 Years | 55 (12.3%) | 85 (14.5%) |
| 75 Years and over | 164 (55.8%) | 326 (59.8%) |
Disability Class by Sex by Age in Brighton
Disability Class: Hearing Difficulty
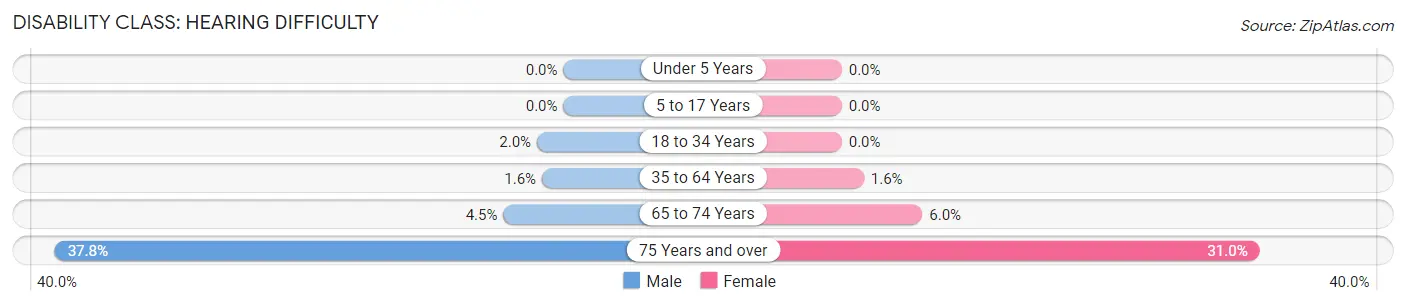
| Age Bracket | Male | Female |
| Under 5 Years | 0 (0.0%) | 0 (0.0%) |
| 5 to 17 Years | 0 (0.0%) | 0 (0.0%) |
| 18 to 34 Years | 20 (2.0%) | 0 (0.0%) |
| 35 to 64 Years | 19 (1.6%) | 25 (1.6%) |
| 65 to 74 Years | 20 (4.5%) | 35 (6.0%) |
| 75 Years and over | 111 (37.8%) | 169 (31.0%) |
Disability Class: Vision Difficulty
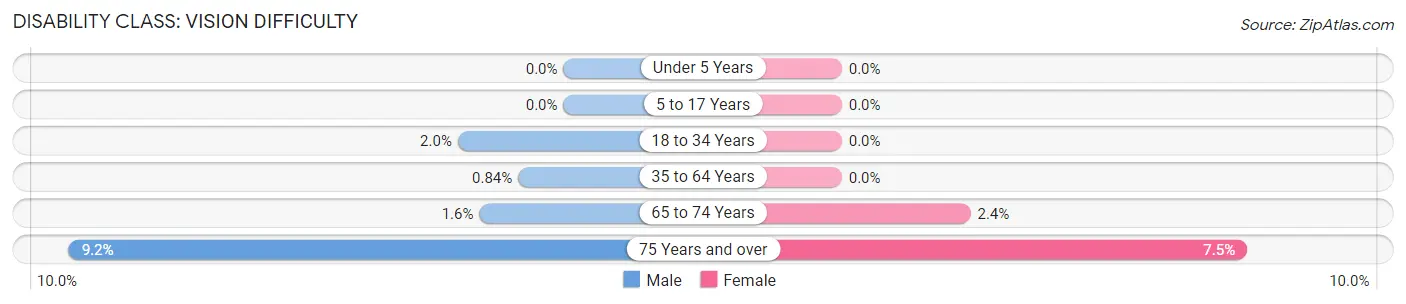
| Age Bracket | Male | Female |
| Under 5 Years | 0 (0.0%) | 0 (0.0%) |
| 5 to 17 Years | 0 (0.0%) | 0 (0.0%) |
| 18 to 34 Years | 20 (2.0%) | 0 (0.0%) |
| 35 to 64 Years | 10 (0.8%) | 0 (0.0%) |
| 65 to 74 Years | 7 (1.6%) | 14 (2.4%) |
| 75 Years and over | 27 (9.2%) | 41 (7.5%) |
Disability Class: Cognitive Difficulty
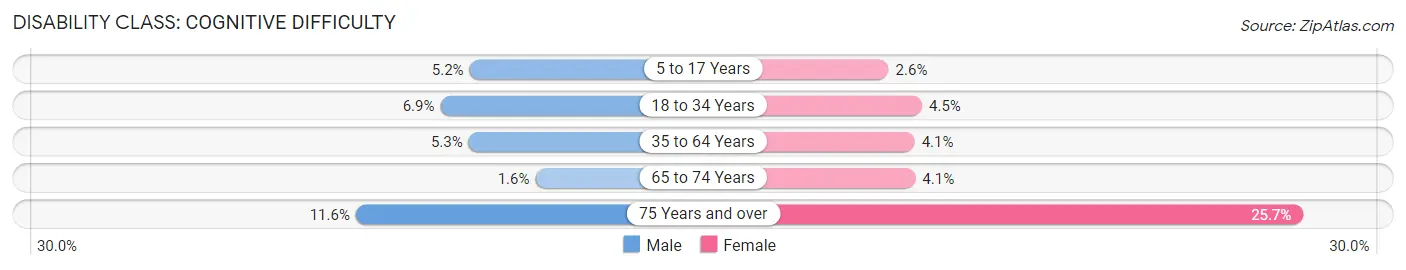
| Age Bracket | Male | Female |
| 5 to 17 Years | 23 (5.2%) | 10 (2.6%) |
| 18 to 34 Years | 70 (6.9%) | 32 (4.5%) |
| 35 to 64 Years | 63 (5.3%) | 62 (4.1%) |
| 65 to 74 Years | 7 (1.6%) | 24 (4.1%) |
| 75 Years and over | 34 (11.6%) | 140 (25.7%) |
Disability Class: Ambulatory Difficulty
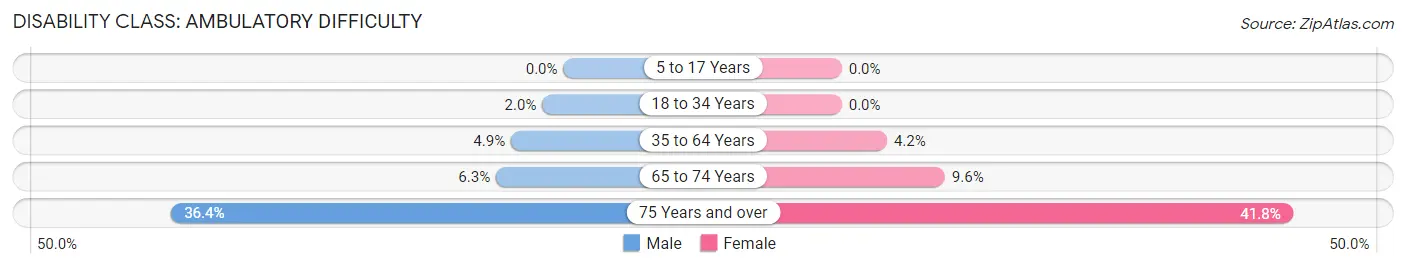
| Age Bracket | Male | Female |
| 5 to 17 Years | 0 (0.0%) | 0 (0.0%) |
| 18 to 34 Years | 20 (2.0%) | 0 (0.0%) |
| 35 to 64 Years | 58 (4.9%) | 64 (4.2%) |
| 65 to 74 Years | 28 (6.2%) | 56 (9.6%) |
| 75 Years and over | 107 (36.4%) | 228 (41.8%) |
Disability Class: Self-Care Difficulty
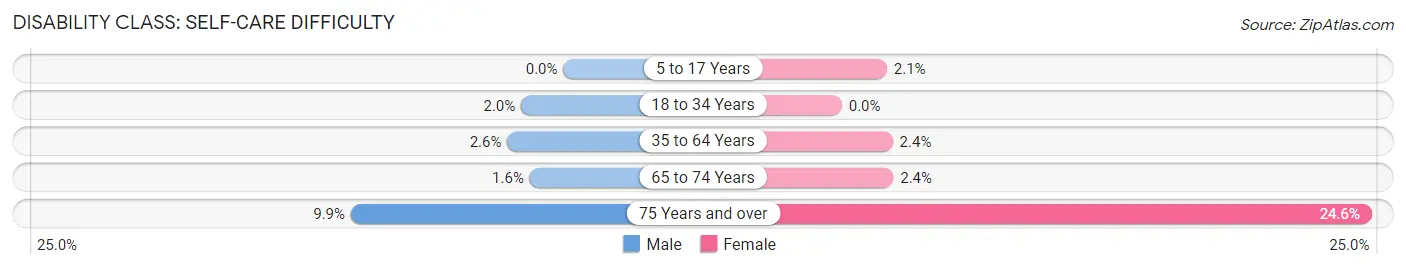
| Age Bracket | Male | Female |
| 5 to 17 Years | 0 (0.0%) | 8 (2.1%) |
| 18 to 34 Years | 20 (2.0%) | 0 (0.0%) |
| 35 to 64 Years | 31 (2.6%) | 36 (2.4%) |
| 65 to 74 Years | 7 (1.6%) | 14 (2.4%) |
| 75 Years and over | 29 (9.9%) | 134 (24.6%) |
Technology Access in Brighton
Computing Device Access in Brighton
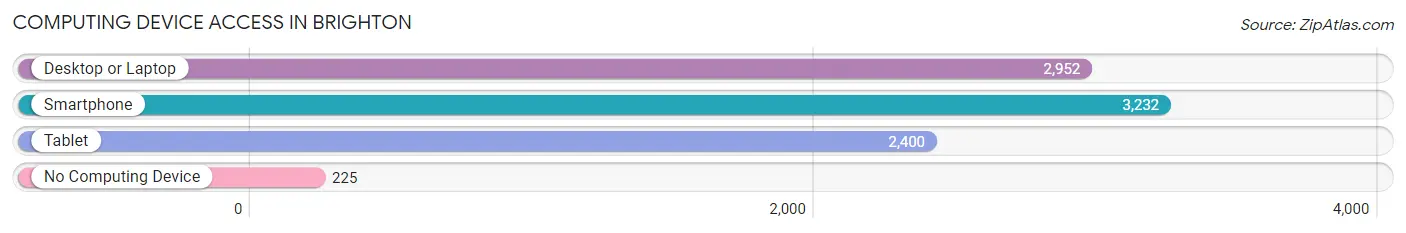
| Device Type | # Households | % Households |
| Desktop or Laptop | 2,952 | 80.3% |
| Smartphone | 3,232 | 87.9% |
| Tablet | 2,400 | 65.3% |
| No Computing Device | 225 | 6.1% |
| Total | 3,677 | 100.0% |
Internet Access in Brighton
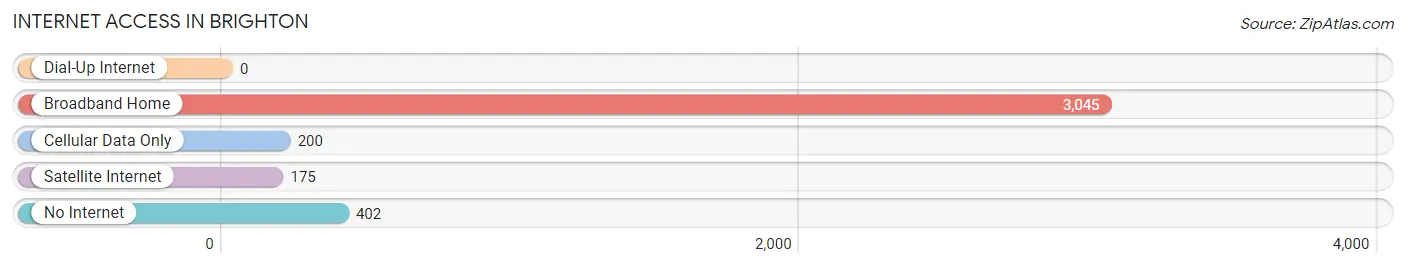
| Internet Type | # Households | % Households |
| Dial-Up Internet | 0 | 0.0% |
| Broadband Home | 3,045 | 82.8% |
| Cellular Data Only | 200 | 5.4% |
| Satellite Internet | 175 | 4.8% |
| No Internet | 402 | 10.9% |
| Total | 3,677 | 100.0% |
Brighton Summary
Brighton, Michigan is a small city located in Livingston County, Michigan. It is situated about 30 miles northwest of Detroit and is part of the Detroit metropolitan area. The city has a population of around 8,000 people and is known for its small-town charm and rural atmosphere.
History
Brighton was first settled in 1832 by settlers from New York. The city was originally known as “Little York” and was later renamed Brighton in 1836. The city was officially incorporated in 1867.
In the late 19th century, Brighton was a popular destination for wealthy Detroiters looking to escape the city. The city was known for its many resorts and spas, which attracted visitors from all over the country.
Geography
Brighton is located in southeastern Michigan, about 30 miles northwest of Detroit. The city is situated on the Huron River and is surrounded by rolling hills and farmland. The city covers an area of about 8.5 square miles and has an elevation of 890 feet.
Climate
Brighton has a humid continental climate, with hot summers and cold winters. The average high temperature in July is around 82 degrees Fahrenheit, while the average low temperature in January is around 18 degrees Fahrenheit. The city receives an average of 33 inches of precipitation per year.
Economy
Brighton’s economy is largely based on agriculture and tourism. The city is home to several farms, which produce a variety of crops, including corn, soybeans, and wheat. The city is also home to several wineries and breweries, which attract visitors from all over the state.
In addition, Brighton is home to several small businesses, including restaurants, retail stores, and professional services. The city is also home to several manufacturing companies, which produce a variety of products, including automotive parts and medical equipment.
Demographics
As of the 2010 census, Brighton had a population of 8,444 people. The racial makeup of the city was 94.3% White, 1.3% African American, 0.3% Native American, 1.2% Asian, 0.1% Pacific Islander, 1.2% from other races, and 1.6% from two or more races. Hispanic or Latino of any race were 3.2% of the population.
The median household income in Brighton was $60,945 in 2018, and the median family income was $76,945. The per capita income in the city was $30,945. About 4.3% of the population was below the poverty line.
Brighton is a small city with a rich history and a unique atmosphere. The city is home to several farms, wineries, and breweries, which attract visitors from all over the state. The city also has a diverse economy, with a variety of small businesses and manufacturing companies. The city has a population of around 8,000 people, with a median household income of $60,945.
Common Questions
What is Per Capita Income in Brighton?
Per Capita income in Brighton is $45,372.
What is the Median Family Income in Brighton?
Median Family Income in Brighton is $108,906.
What is the Median Household income in Brighton?
Median Household Income in Brighton is $74,022.
What is Income or Wage Gap in Brighton?
Income or Wage Gap in Brighton is 11.2%.
Women in Brighton earn 88.8 cents for every dollar earned by a man.
What is Inequality or Gini Index in Brighton?
Inequality or Gini Index in Brighton is 0.39.
What is the Total Population of Brighton?
Total Population of Brighton is 7,486.
What is the Total Male Population of Brighton?
Total Male Population of Brighton is 3,588.
What is the Total Female Population of Brighton?
Total Female Population of Brighton is 3,898.
What is the Ratio of Males per 100 Females in Brighton?
There are 92.05 Males per 100 Females in Brighton.
What is the Ratio of Females per 100 Males in Brighton?
There are 108.64 Females per 100 Males in Brighton.
What is the Median Population Age in Brighton?
Median Population Age in Brighton is 45.8 Years.
What is the Average Family Size in Brighton
Average Family Size in Brighton is 2.7 People.
What is the Average Household Size in Brighton
Average Household Size in Brighton is 2.0 People.
How Large is the Labor Force in Brighton?
There are 4,117 People in the Labor Forcein in Brighton.
What is the Percentage of People in the Labor Force in Brighton?
63.4% of People are in the Labor Force in Brighton.
What is the Unemployment Rate in Brighton?
Unemployment Rate in Brighton is 2.8%.