Camp Point, IL Map & Demographics
Camp Point Map
Camp Point Overview
$21,945
PER CAPITA INCOME
$72,321
AVG FAMILY INCOME
$49,479
AVG HOUSEHOLD INCOME
41.5%
WAGE / INCOME GAP [ % ]
58.5¢/ $1
WAGE / INCOME GAP [ $ ]
0.38
INEQUALITY / GINI INDEX
1,399
TOTAL POPULATION
637
MALE POPULATION
762
FEMALE POPULATION
83.60
MALES / 100 FEMALES
119.62
FEMALES / 100 MALES
36.1
MEDIAN AGE
3.7
AVG FAMILY SIZE
2.7
AVG HOUSEHOLD SIZE
644
LABOR FORCE [ PEOPLE ]
62.6%
PERCENT IN LABOR FORCE
2.5%
UNEMPLOYMENT RATE
Camp Point Zip Codes
Camp Point Area Codes
Income in Camp Point
Income Overview in Camp Point
Per Capita Income in Camp Point is $21,945, while median incomes of families and households are $72,321 and $49,479 respectively.
| Characteristic | Number | Measure |
| Per Capita Income | 1,399 | $21,945 |
| Median Family Income | 293 | $72,321 |
| Mean Family Income | 293 | $75,126 |
| Median Household Income | 480 | $49,479 |
| Mean Household Income | 480 | $61,139 |
| Income Deficit | 293 | $0 |
| Wage / Income Gap (%) | 1,399 | 41.51% |
| Wage / Income Gap ($) | 1,399 | 58.49¢ per $1 |
| Gini / Inequality Index | 1,399 | 0.38 |
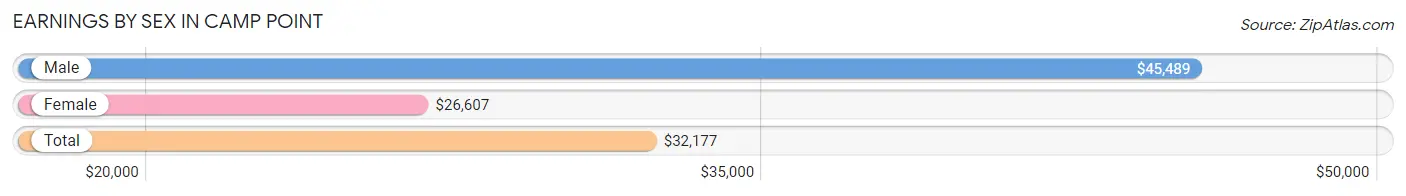
Earnings by Sex in Camp Point
Average Earnings in Camp Point are $32,177, $45,489 for men and $26,607 for women, a difference of 41.5%.
| Sex | Number | Average Earnings |
| Male | 317 (47.0%) | $45,489 |
| Female | 357 (53.0%) | $26,607 |
| Total | 674 (100.0%) | $32,177 |
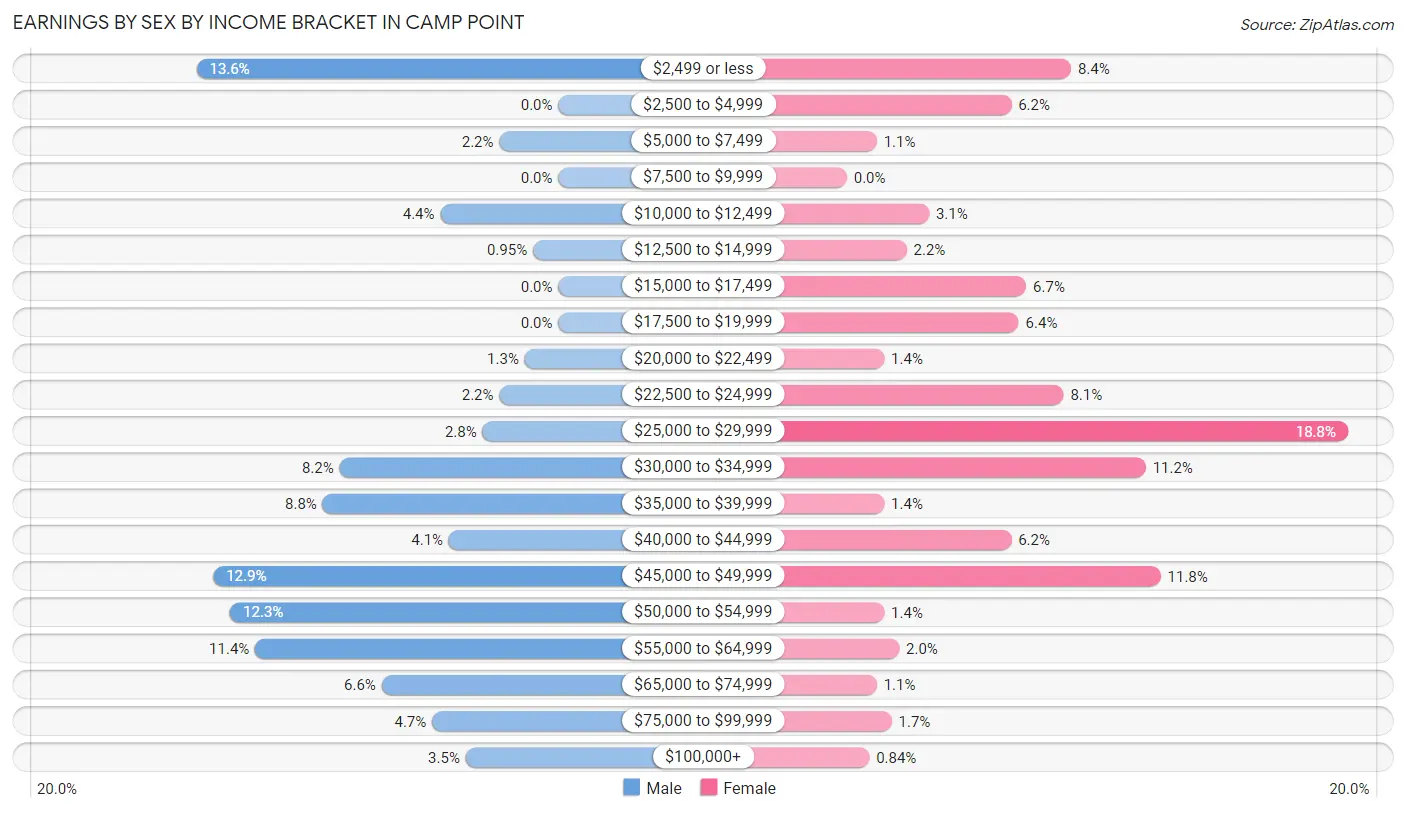
Earnings by Sex by Income Bracket in Camp Point
The most common earnings brackets in Camp Point are $2,499 or less for men (43 | 13.6%) and $25,000 to $29,999 for women (67 | 18.8%).
| Income | Male | Female |
| $2,499 or less | 43 (13.6%) | 30 (8.4%) |
| $2,500 to $4,999 | 0 (0.0%) | 22 (6.2%) |
| $5,000 to $7,499 | 7 (2.2%) | 4 (1.1%) |
| $7,500 to $9,999 | 0 (0.0%) | 0 (0.0%) |
| $10,000 to $12,499 | 14 (4.4%) | 11 (3.1%) |
| $12,500 to $14,999 | 3 (0.9%) | 8 (2.2%) |
| $15,000 to $17,499 | 0 (0.0%) | 24 (6.7%) |
| $17,500 to $19,999 | 0 (0.0%) | 23 (6.4%) |
| $20,000 to $22,499 | 4 (1.3%) | 5 (1.4%) |
| $22,500 to $24,999 | 7 (2.2%) | 29 (8.1%) |
| $25,000 to $29,999 | 9 (2.8%) | 67 (18.8%) |
| $30,000 to $34,999 | 26 (8.2%) | 40 (11.2%) |
| $35,000 to $39,999 | 28 (8.8%) | 5 (1.4%) |
| $40,000 to $44,999 | 13 (4.1%) | 22 (6.2%) |
| $45,000 to $49,999 | 41 (12.9%) | 42 (11.8%) |
| $50,000 to $54,999 | 39 (12.3%) | 5 (1.4%) |
| $55,000 to $64,999 | 36 (11.4%) | 7 (2.0%) |
| $65,000 to $74,999 | 21 (6.6%) | 4 (1.1%) |
| $75,000 to $99,999 | 15 (4.7%) | 6 (1.7%) |
| $100,000+ | 11 (3.5%) | 3 (0.8%) |
| Total | 317 (100.0%) | 357 (100.0%) |
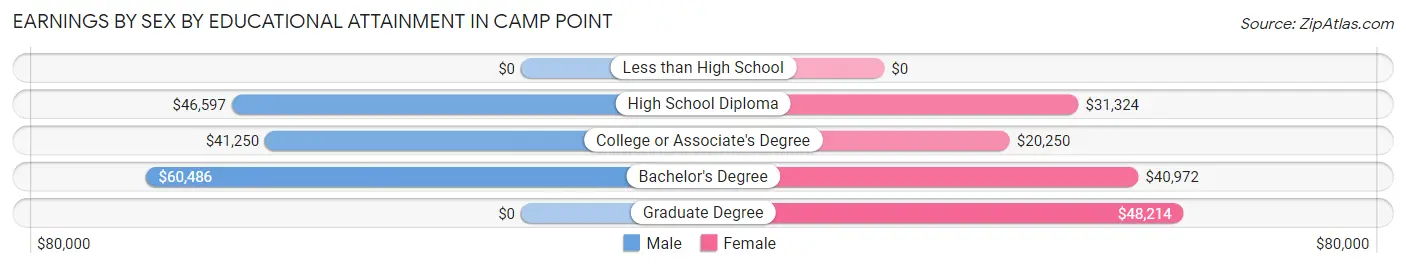
Earnings by Sex by Educational Attainment in Camp Point
Average earnings in Camp Point are $48,472 for men and $29,453 for women, a difference of 39.2%. Men with an educational attainment of bachelor's degree enjoy the highest average annual earnings of $60,486, while those with college or associate's degree education earn the least with $41,250. Women with an educational attainment of graduate degree earn the most with the average annual earnings of $48,214, while those with college or associate's degree education have the smallest earnings of $20,250.
| Educational Attainment | Male Income | Female Income |
| Less than High School | - | - |
| High School Diploma | $46,597 | $31,324 |
| College or Associate's Degree | $41,250 | $20,250 |
| Bachelor's Degree | $60,486 | $40,972 |
| Graduate Degree | - | - |
| Total | $48,472 | $29,453 |
Family Income in Camp Point
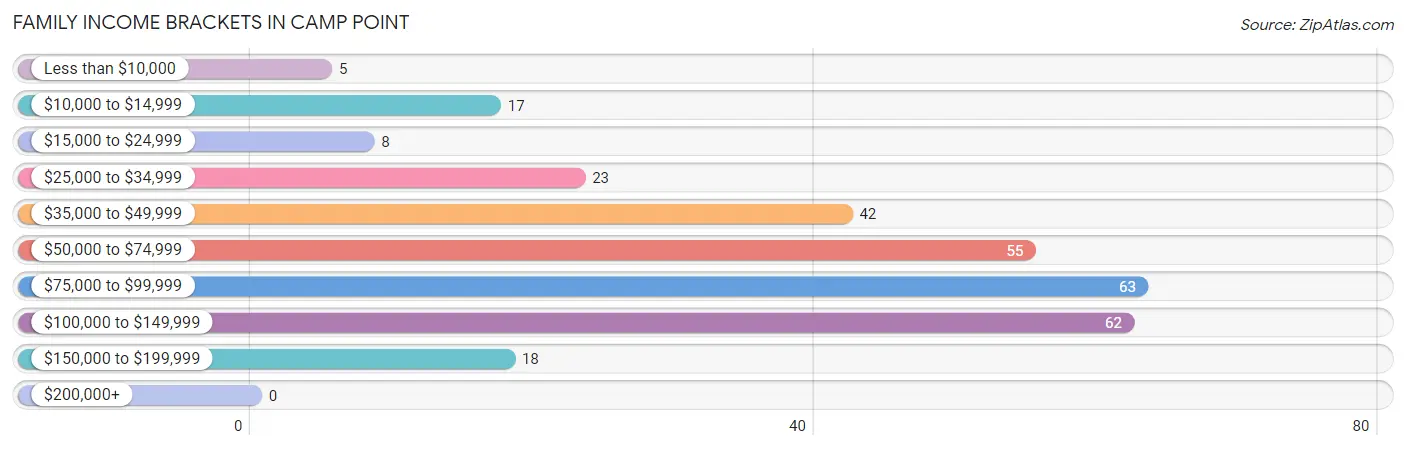
Family Income Brackets in Camp Point
According to the Camp Point family income data, there are 63 families falling into the $75,000 to $99,999 income range, which is the most common income bracket and makes up 21.5% of all families.
| Income Bracket | # Families | % Families |
| Less than $10,000 | 5 | 1.7% |
| $10,000 to $14,999 | 17 | 5.8% |
| $15,000 to $24,999 | 8 | 2.7% |
| $25,000 to $34,999 | 23 | 7.8% |
| $35,000 to $49,999 | 42 | 14.3% |
| $50,000 to $74,999 | 55 | 18.8% |
| $75,000 to $99,999 | 63 | 21.5% |
| $100,000 to $149,999 | 62 | 21.2% |
| $150,000 to $199,999 | 18 | 6.1% |
| $200,000+ | 0 | 0.0% |
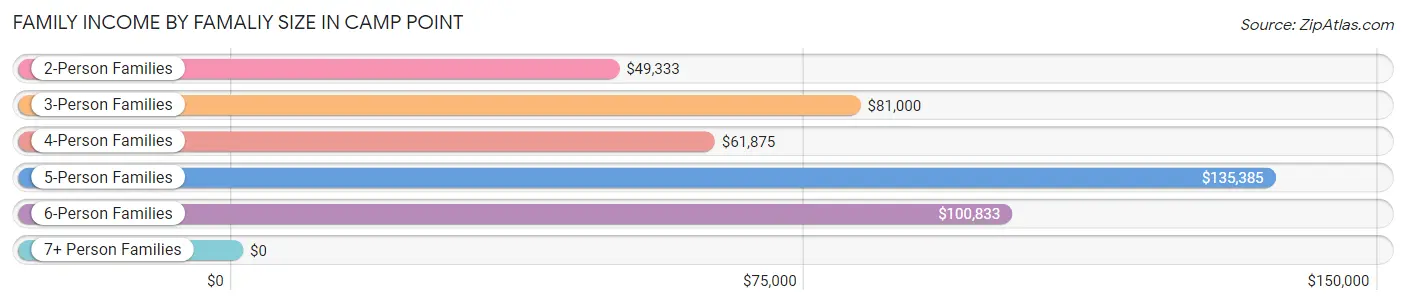
Family Income by Famaliy Size in Camp Point
5-person families (32 | 10.9%) account for the highest median family income in Camp Point with $135,385 per family, while 5-person families (32 | 10.9%) have the highest median income of $27,077 per family member.
| Income Bracket | # Families | Median Income |
| 2-Person Families | 116 (39.6%) | $49,333 |
| 3-Person Families | 36 (12.3%) | $81,000 |
| 4-Person Families | 65 (22.2%) | $61,875 |
| 5-Person Families | 32 (10.9%) | $135,385 |
| 6-Person Families | 44 (15.0%) | $100,833 |
| 7+ Person Families | 0 (0.0%) | $0 |
| Total | 293 (100.0%) | $72,321 |
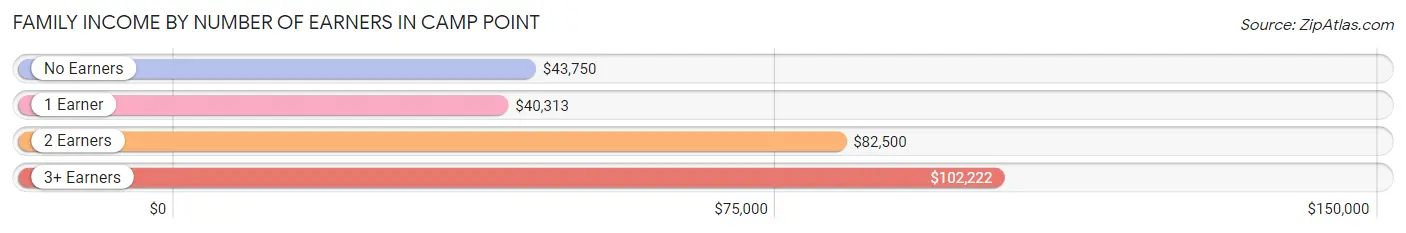
Family Income by Number of Earners in Camp Point
The median family income in Camp Point is $72,321, with families comprising 3+ earners (56) having the highest median family income of $102,222, while families with 1 earner (53) have the lowest median family income of $40,313, accounting for 19.1% and 18.1% of families, respectively.
| Number of Earners | # Families | Median Income |
| No Earners | 52 (17.7%) | $43,750 |
| 1 Earner | 53 (18.1%) | $40,313 |
| 2 Earners | 132 (45.1%) | $82,500 |
| 3+ Earners | 56 (19.1%) | $102,222 |
| Total | 293 (100.0%) | $72,321 |
Household Income in Camp Point
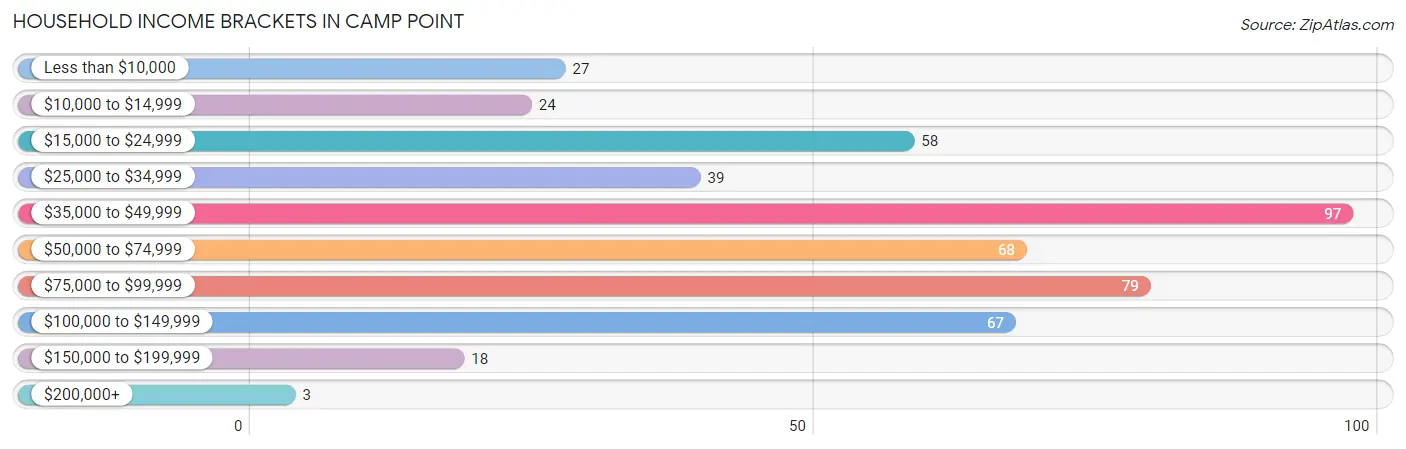
Household Income Brackets in Camp Point
With 97 households falling in the category, the $35,000 to $49,999 income range is the most frequent in Camp Point, accounting for 20.2% of all households. In contrast, only 3 households (0.6%) fall into the $200,000+ income bracket, making it the least populous group.
| Income Bracket | # Households | % Households |
| Less than $10,000 | 27 | 5.6% |
| $10,000 to $14,999 | 24 | 5.0% |
| $15,000 to $24,999 | 58 | 12.1% |
| $25,000 to $34,999 | 39 | 8.1% |
| $35,000 to $49,999 | 97 | 20.2% |
| $50,000 to $74,999 | 68 | 14.2% |
| $75,000 to $99,999 | 79 | 16.5% |
| $100,000 to $149,999 | 67 | 14.0% |
| $150,000 to $199,999 | 18 | 3.8% |
| $200,000+ | 3 | 0.6% |
Household Income by Householder Age in Camp Point
The median household income in Camp Point is $49,479, with the highest median household income of $70,313 found in the 25 to 44 years age bracket for the primary householder. A total of 191 households (39.8%) fall into this category. Meanwhile, the 15 to 24 years age bracket for the primary householder has the lowest median household income of $0, with 5 households (1.0%) in this group.
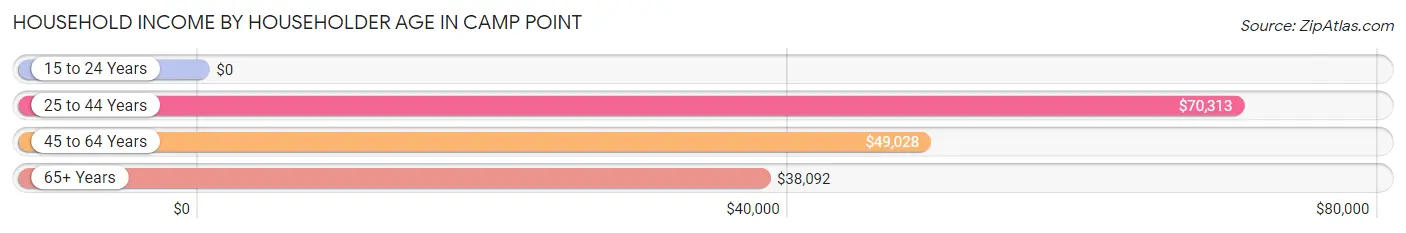
| Income Bracket | # Households | Median Income |
| 15 to 24 Years | 5 (1.0%) | $0 |
| 25 to 44 Years | 191 (39.8%) | $70,313 |
| 45 to 64 Years | 153 (31.9%) | $49,028 |
| 65+ Years | 131 (27.3%) | $38,092 |
| Total | 480 (100.0%) | $49,479 |
Poverty in Camp Point
Income Below Poverty by Sex and Age in Camp Point
With 9.4% poverty level for males and 15.4% for females among the residents of Camp Point, 65 to 74 year old males and 16 and 17 year old females are the most vulnerable to poverty, with 8 males (20.5%) and 15 females (51.7%) in their respective age groups living below the poverty level.
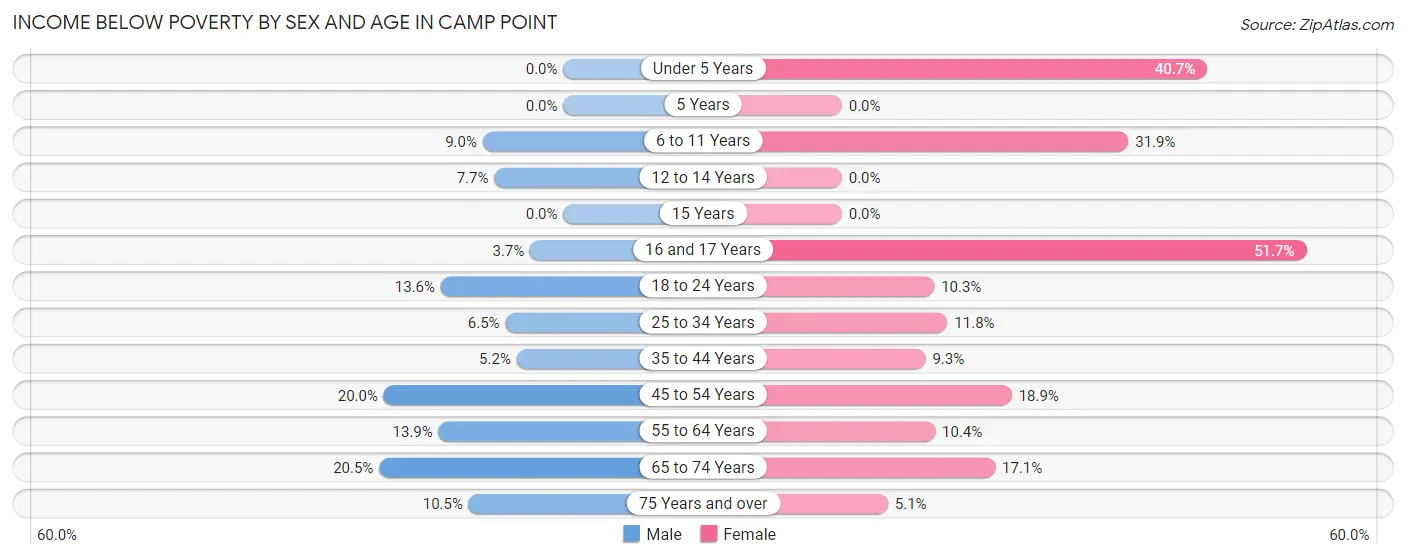
| Age Bracket | Male | Female |
| Under 5 Years | 0 (0.0%) | 24 (40.7%) |
| 5 Years | 0 (0.0%) | 0 (0.0%) |
| 6 to 11 Years | 7 (9.0%) | 15 (31.9%) |
| 12 to 14 Years | 4 (7.7%) | 0 (0.0%) |
| 15 Years | 0 (0.0%) | 0 (0.0%) |
| 16 and 17 Years | 2 (3.7%) | 15 (51.7%) |
| 18 to 24 Years | 3 (13.6%) | 7 (10.3%) |
| 25 to 34 Years | 4 (6.5%) | 8 (11.8%) |
| 35 to 44 Years | 4 (5.2%) | 11 (9.3%) |
| 45 to 54 Years | 13 (20.0%) | 7 (18.9%) |
| 55 to 64 Years | 10 (13.9%) | 8 (10.4%) |
| 65 to 74 Years | 8 (20.5%) | 7 (17.1%) |
| 75 Years and over | 4 (10.5%) | 4 (5.1%) |
| Total | 59 (9.4%) | 106 (15.4%) |
Income Above Poverty by Sex and Age in Camp Point
According to the poverty statistics in Camp Point, males aged under 5 years and females aged 5 years are the age groups that are most secure financially, with 100.0% of males and 100.0% of females in these age groups living above the poverty line.
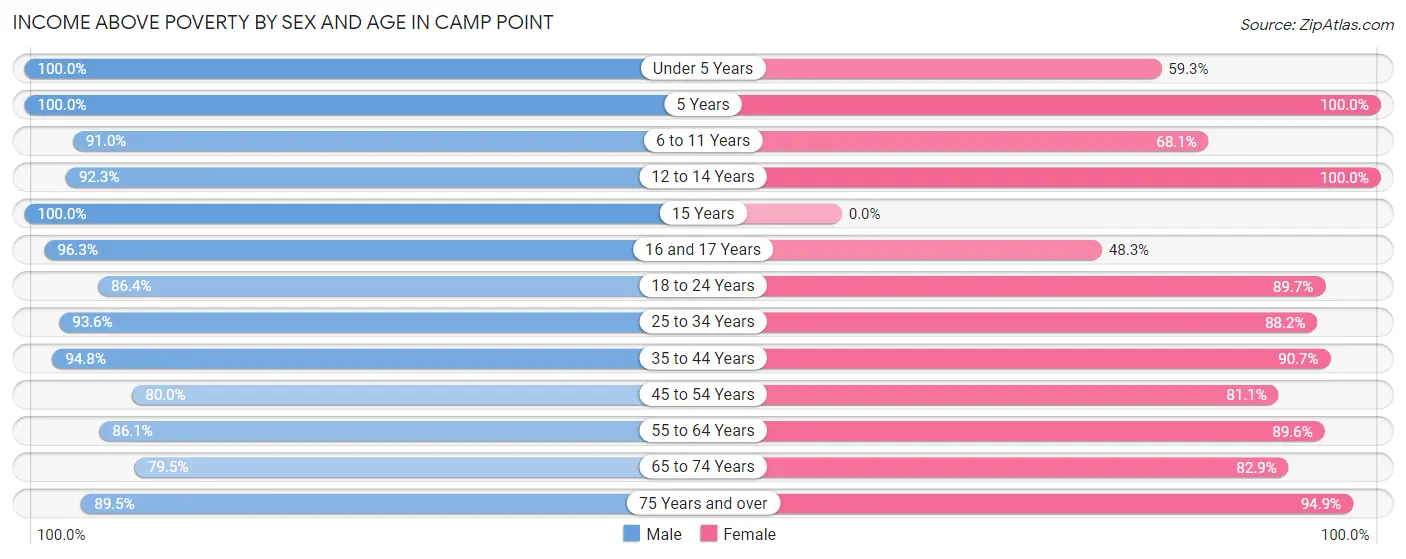
| Age Bracket | Male | Female |
| Under 5 Years | 43 (100.0%) | 35 (59.3%) |
| 5 Years | 4 (100.0%) | 11 (100.0%) |
| 6 to 11 Years | 71 (91.0%) | 32 (68.1%) |
| 12 to 14 Years | 48 (92.3%) | 55 (100.0%) |
| 15 Years | 22 (100.0%) | 0 (0.0%) |
| 16 and 17 Years | 52 (96.3%) | 14 (48.3%) |
| 18 to 24 Years | 19 (86.4%) | 61 (89.7%) |
| 25 to 34 Years | 58 (93.5%) | 60 (88.2%) |
| 35 to 44 Years | 73 (94.8%) | 107 (90.7%) |
| 45 to 54 Years | 52 (80.0%) | 30 (81.1%) |
| 55 to 64 Years | 62 (86.1%) | 69 (89.6%) |
| 65 to 74 Years | 31 (79.5%) | 34 (82.9%) |
| 75 Years and over | 34 (89.5%) | 74 (94.9%) |
| Total | 569 (90.6%) | 582 (84.6%) |
Income Below Poverty Among Married-Couple Families in Camp Point
The poverty statistics for married-couple families in Camp Point show that 1.4% or 3 of the total 219 families live below the poverty line. Families with no children have the highest poverty rate of 2.8%, comprising of 3 families. On the other hand, families with 1 or 2 children have the lowest poverty rate of 0.0%, which includes 0 families.
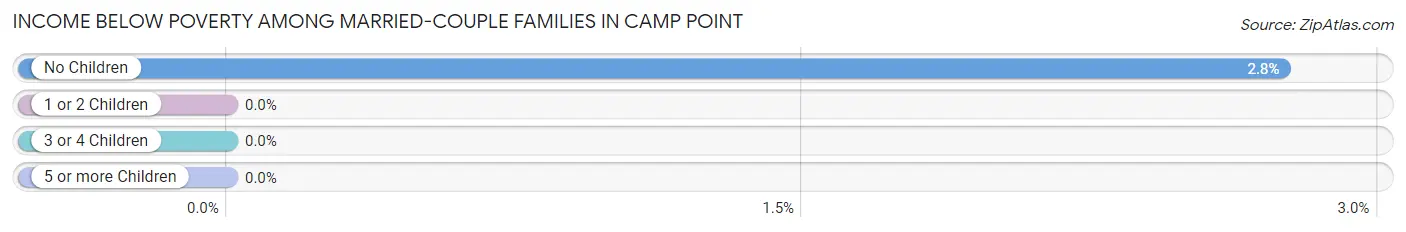
| Children | Above Poverty | Below Poverty |
| No Children | 106 (97.3%) | 3 (2.8%) |
| 1 or 2 Children | 61 (100.0%) | 0 (0.0%) |
| 3 or 4 Children | 49 (100.0%) | 0 (0.0%) |
| 5 or more Children | 0 (0.0%) | 0 (0.0%) |
| Total | 216 (98.6%) | 3 (1.4%) |
Income Below Poverty Among Single-Parent Households in Camp Point
According to the poverty data in Camp Point, 16.7% or 4 single-father households and 46.0% or 23 single-mother households are living below the poverty line. Among single-father households, those with 1 or 2 children have the highest poverty rate, with 4 households (66.7%) experiencing poverty. Likewise, among single-mother households, those with 3 or 4 children have the highest poverty rate, with 12 households (57.1%) falling below the poverty line.
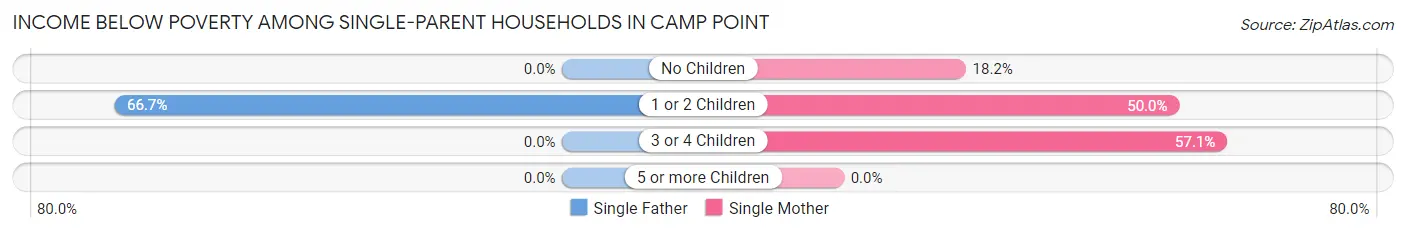
| Children | Single Father | Single Mother |
| No Children | 0 (0.0%) | 2 (18.2%) |
| 1 or 2 Children | 4 (66.7%) | 9 (50.0%) |
| 3 or 4 Children | 0 (0.0%) | 12 (57.1%) |
| 5 or more Children | 0 (0.0%) | 0 (0.0%) |
| Total | 4 (16.7%) | 23 (46.0%) |
Income Below Poverty Among Married-Couple vs Single-Parent Households in Camp Point
The poverty data for Camp Point shows that 3 of the married-couple family households (1.4%) and 27 of the single-parent households (36.5%) are living below the poverty level. Within the married-couple family households, those with no children have the highest poverty rate, with 3 households (2.8%) falling below the poverty line. Among the single-parent households, those with 1 or 2 children have the highest poverty rate, with 13 household (54.2%) living below poverty.
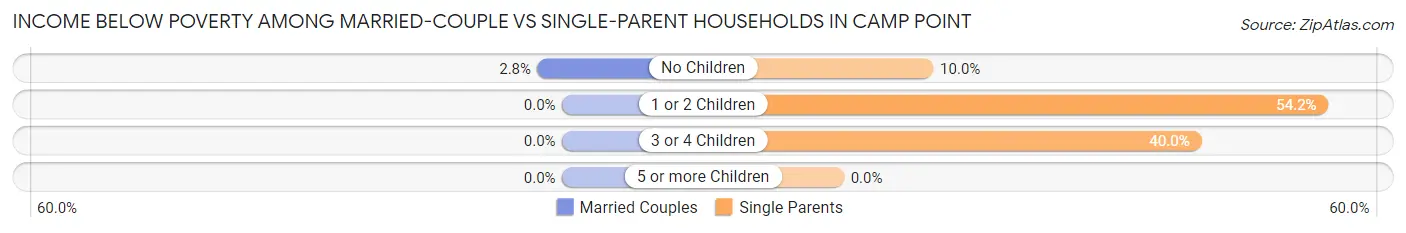
| Children | Married-Couple Families | Single-Parent Households |
| No Children | 3 (2.8%) | 2 (10.0%) |
| 1 or 2 Children | 0 (0.0%) | 13 (54.2%) |
| 3 or 4 Children | 0 (0.0%) | 12 (40.0%) |
| 5 or more Children | 0 (0.0%) | 0 (0.0%) |
| Total | 3 (1.4%) | 27 (36.5%) |
Race in Camp Point
The most populous races in Camp Point are White / Caucasian (1,310 | 93.6%), Two or more Races (76 | 5.4%), and Hispanic or Latino (74 | 5.3%).
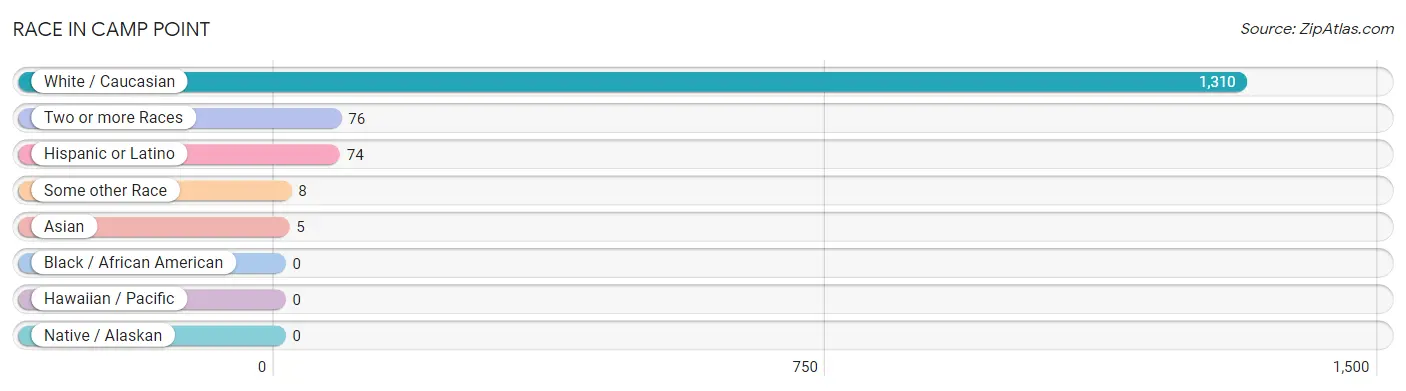
| Race | # Population | % Population |
| Asian | 5 | 0.4% |
| Black / African American | 0 | 0.0% |
| Hawaiian / Pacific | 0 | 0.0% |
| Hispanic or Latino | 74 | 5.3% |
| Native / Alaskan | 0 | 0.0% |
| White / Caucasian | 1,310 | 93.6% |
| Two or more Races | 76 | 5.4% |
| Some other Race | 8 | 0.6% |
| Total | 1,399 | 100.0% |
Ancestry in Camp Point
The most populous ancestries reported in Camp Point are German (459 | 32.8%), Irish (86 | 6.1%), English (85 | 6.1%), Mexican (74 | 5.3%), and American (62 | 4.4%), together accounting for 54.8% of all Camp Point residents.
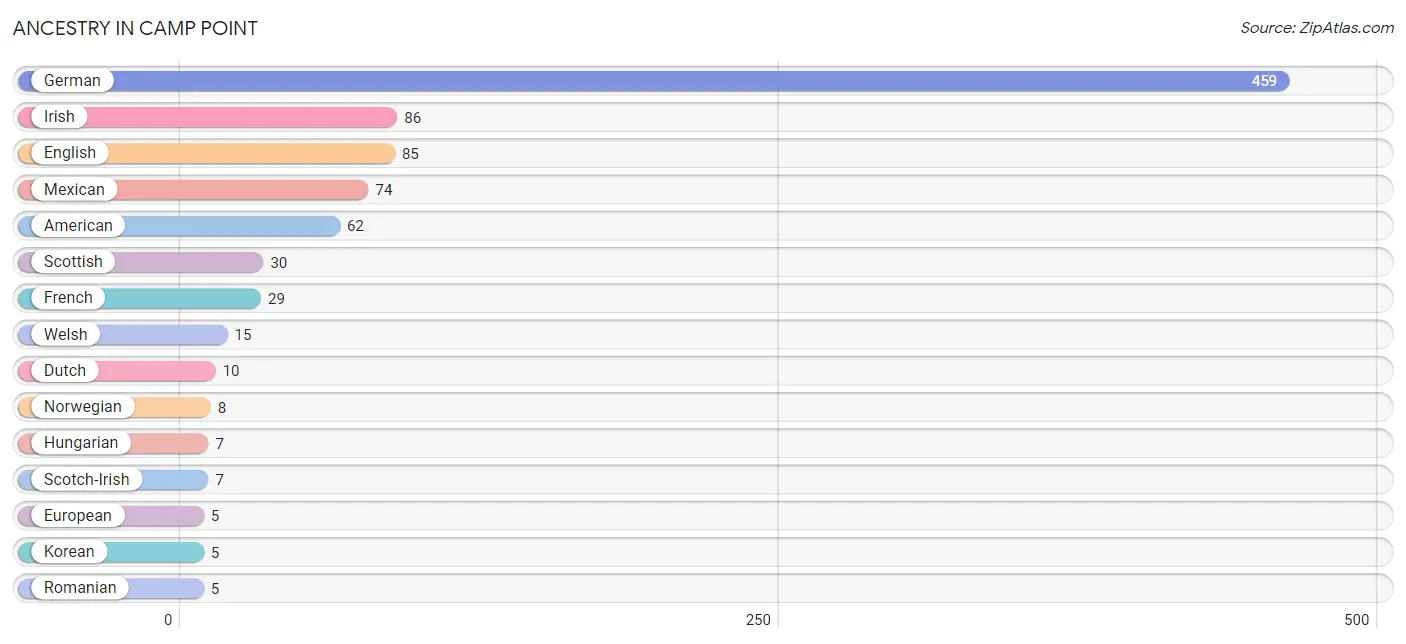
| Ancestry | # Population | % Population |
| American | 62 | 4.4% |
| Dutch | 10 | 0.7% |
| English | 85 | 6.1% |
| European | 5 | 0.4% |
| French | 29 | 2.1% |
| German | 459 | 32.8% |
| Hungarian | 7 | 0.5% |
| Irish | 86 | 6.1% |
| Italian | 3 | 0.2% |
| Korean | 5 | 0.4% |
| Mexican | 74 | 5.3% |
| Norwegian | 8 | 0.6% |
| Romanian | 5 | 0.4% |
| Scotch-Irish | 7 | 0.5% |
| Scottish | 30 | 2.1% |
| Swedish | 4 | 0.3% |
| Welsh | 15 | 1.1% | View All 17 Rows |
Immigrants in Camp Point
The most numerous immigrant groups reported in Camp Point came from Europe (7 | 0.5%), Greece (7 | 0.5%), Southern Europe (7 | 0.5%), Asia (5 | 0.4%), and Philippines (5 | 0.4%), together accounting for 2.2% of all Camp Point residents.
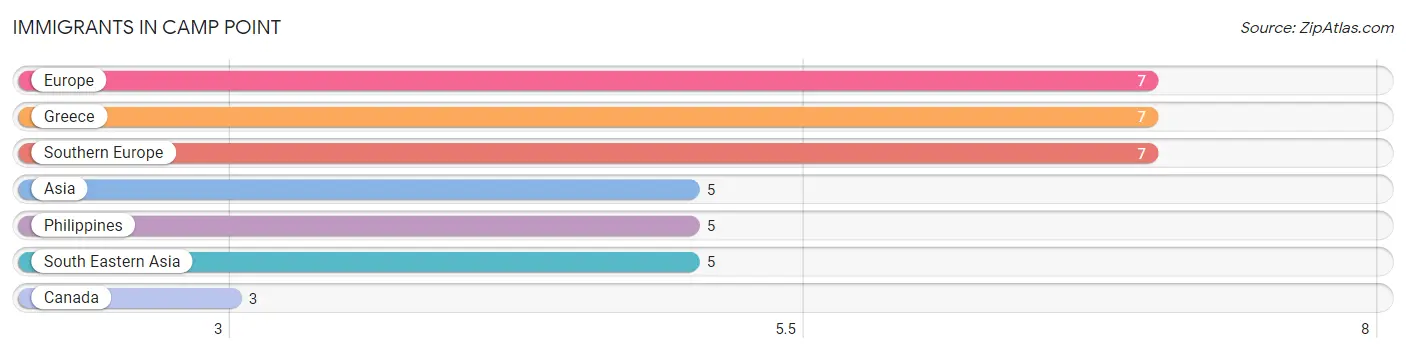
| Immigration Origin | # Population | % Population |
| Asia | 5 | 0.4% |
| Canada | 3 | 0.2% |
| Europe | 7 | 0.5% |
| Greece | 7 | 0.5% |
| Philippines | 5 | 0.4% |
| South Eastern Asia | 5 | 0.4% |
| Southern Europe | 7 | 0.5% | View All 7 Rows |
Sex and Age in Camp Point
Sex and Age in Camp Point
The most populous age groups in Camp Point are 10 to 14 Years (100 | 15.7%) for men and 10 to 14 Years (78 | 10.2%) for women.
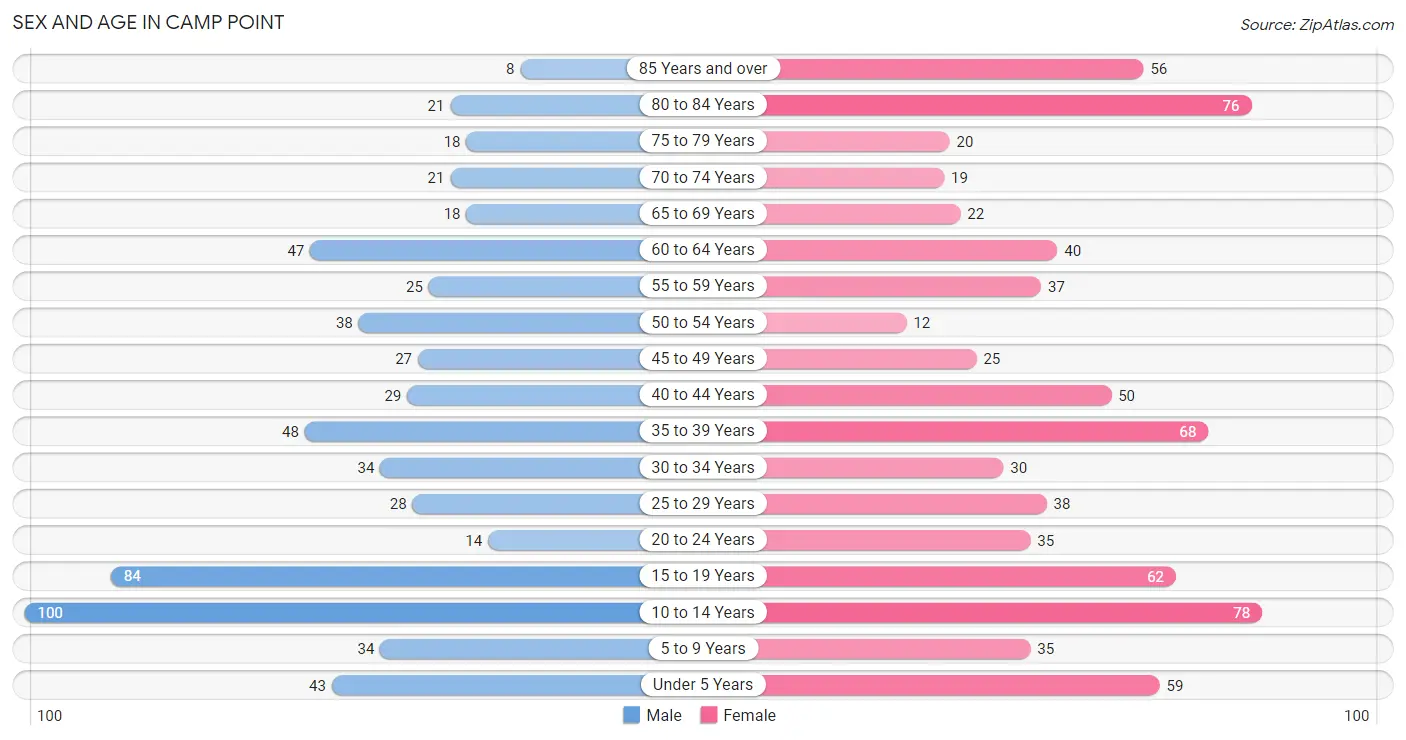
| Age Bracket | Male | Female |
| Under 5 Years | 43 (6.8%) | 59 (7.7%) |
| 5 to 9 Years | 34 (5.3%) | 35 (4.6%) |
| 10 to 14 Years | 100 (15.7%) | 78 (10.2%) |
| 15 to 19 Years | 84 (13.2%) | 62 (8.1%) |
| 20 to 24 Years | 14 (2.2%) | 35 (4.6%) |
| 25 to 29 Years | 28 (4.4%) | 38 (5.0%) |
| 30 to 34 Years | 34 (5.3%) | 30 (3.9%) |
| 35 to 39 Years | 48 (7.5%) | 68 (8.9%) |
| 40 to 44 Years | 29 (4.5%) | 50 (6.6%) |
| 45 to 49 Years | 27 (4.2%) | 25 (3.3%) |
| 50 to 54 Years | 38 (6.0%) | 12 (1.6%) |
| 55 to 59 Years | 25 (3.9%) | 37 (4.9%) |
| 60 to 64 Years | 47 (7.4%) | 40 (5.2%) |
| 65 to 69 Years | 18 (2.8%) | 22 (2.9%) |
| 70 to 74 Years | 21 (3.3%) | 19 (2.5%) |
| 75 to 79 Years | 18 (2.8%) | 20 (2.6%) |
| 80 to 84 Years | 21 (3.3%) | 76 (10.0%) |
| 85 Years and over | 8 (1.3%) | 56 (7.3%) |
| Total | 637 (100.0%) | 762 (100.0%) |
Families and Households in Camp Point
Median Family Size in Camp Point
The median family size in Camp Point is 3.70 persons per family, with single male/father families (24 | 8.2%) accounting for the largest median family size of 4.21 persons per family. On the other hand, single female/mother families (50 | 17.1%) represent the smallest median family size with 3.24 persons per family.
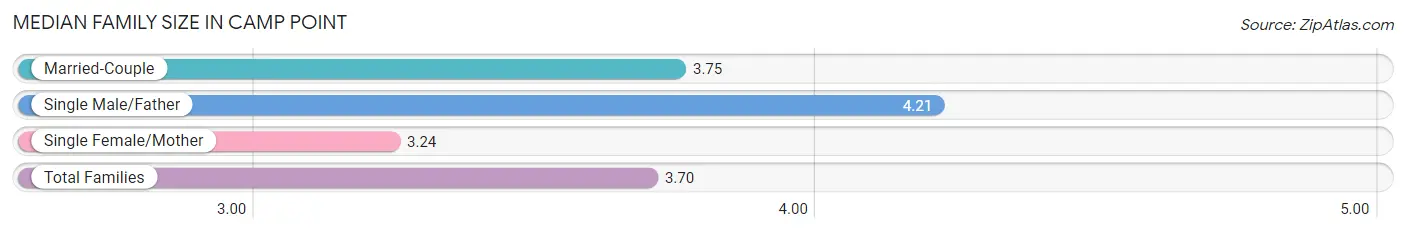
| Family Type | # Families | Family Size |
| Married-Couple | 219 (74.7%) | 3.75 |
| Single Male/Father | 24 (8.2%) | 4.21 |
| Single Female/Mother | 50 (17.1%) | 3.24 |
| Total Families | 293 (100.0%) | 3.70 |
Median Household Size in Camp Point
The median household size in Camp Point is 2.74 persons per household, with single male/father households (24 | 5.0%) accounting for the largest median household size of 4.63 persons per household. non-family households (187 | 39.0%) represent the smallest median household size with 1.12 persons per household.
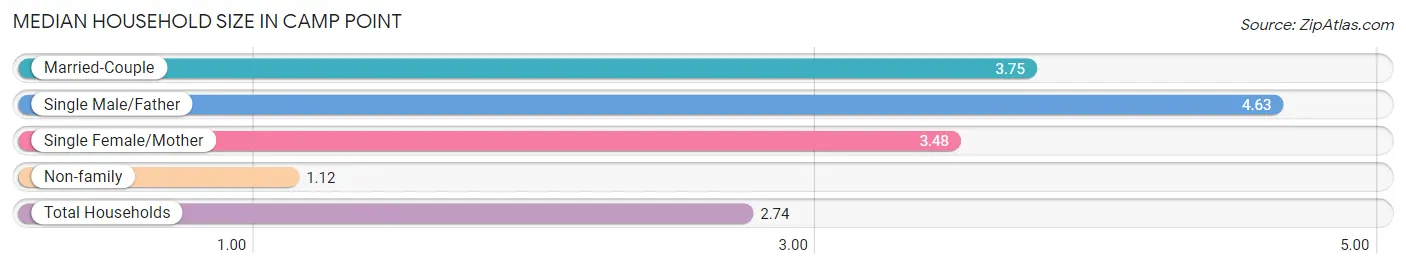
| Household Type | # Households | Household Size |
| Married-Couple | 219 (45.6%) | 3.75 |
| Single Male/Father | 24 (5.0%) | 4.63 |
| Single Female/Mother | 50 (10.4%) | 3.48 |
| Non-family | 187 (39.0%) | 1.12 |
| Total Households | 480 (100.0%) | 2.74 |
Household Size by Marriage Status in Camp Point
Out of a total of 480 households in Camp Point, 293 (61.0%) are family households, while 187 (39.0%) are nonfamily households. The most numerous type of family households are 2-person households, comprising 109, and the most common type of nonfamily households are 1-person households, comprising 163.
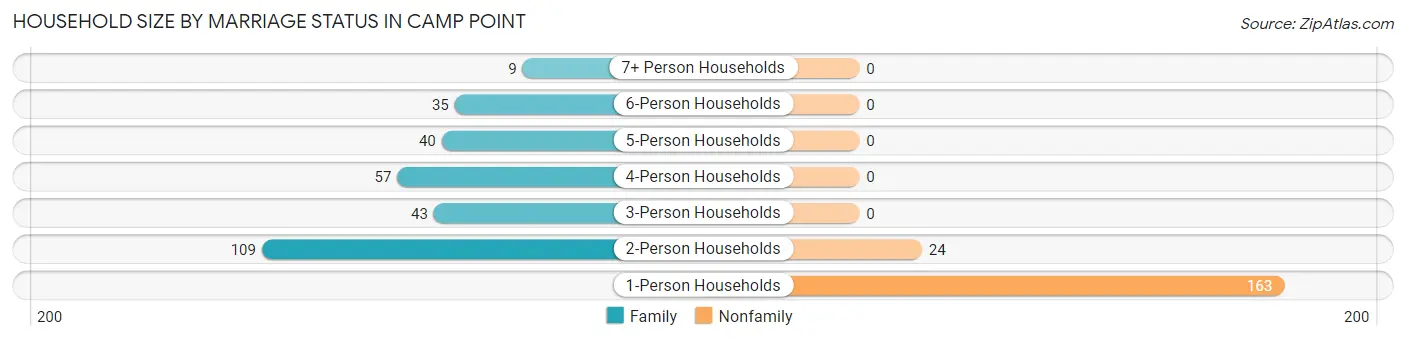
| Household Size | Family Households | Nonfamily Households |
| 1-Person Households | - | 163 (34.0%) |
| 2-Person Households | 109 (22.7%) | 24 (5.0%) |
| 3-Person Households | 43 (9.0%) | 0 (0.0%) |
| 4-Person Households | 57 (11.9%) | 0 (0.0%) |
| 5-Person Households | 40 (8.3%) | 0 (0.0%) |
| 6-Person Households | 35 (7.3%) | 0 (0.0%) |
| 7+ Person Households | 9 (1.9%) | 0 (0.0%) |
| Total | 293 (61.0%) | 187 (39.0%) |
Female Fertility in Camp Point
Fertility by Age in Camp Point
Average fertility rate in Camp Point is 58.0 births per 1,000 women. Women in the age bracket of 20 to 34 years have the highest fertility rate with 107.0 births per 1,000 women. Women in the age bracket of 20 to 34 years acount for 61.1% of all women with births.
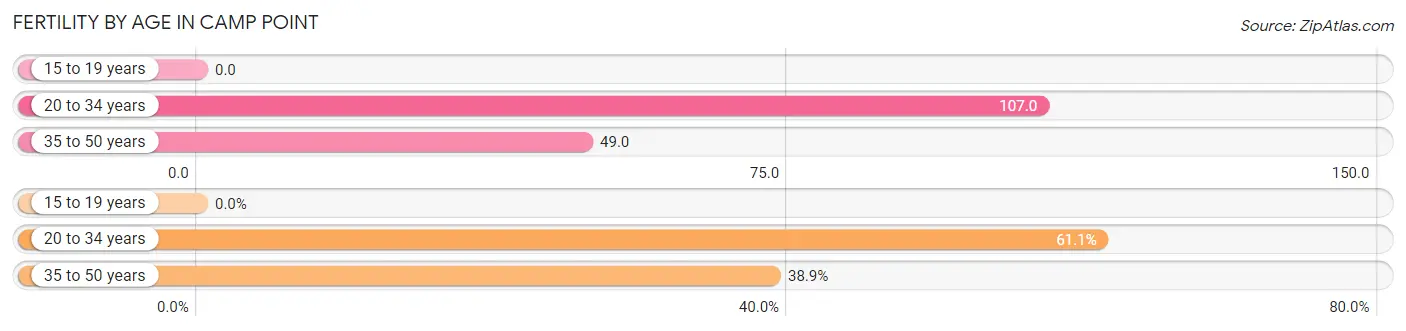
| Age Bracket | Women with Births | Births / 1,000 Women |
| 15 to 19 years | 0 (0.0%) | 0.0 |
| 20 to 34 years | 11 (61.1%) | 107.0 |
| 35 to 50 years | 7 (38.9%) | 49.0 |
| Total | 18 (100.0%) | 58.0 |
Fertility by Age by Marriage Status in Camp Point
61.1% of women with births (18) in Camp Point are married. The highest percentage of unmarried women with births falls into 35 to 50 years age bracket with 100.0% of them unmarried at the time of birth, while the lowest percentage of unmarried women with births belong to 20 to 34 years age bracket with 0.0% of them unmarried.
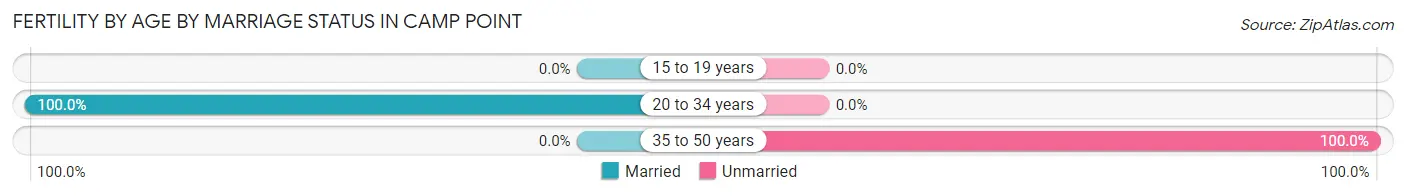
| Age Bracket | Married | Unmarried |
| 15 to 19 years | 0 (0.0%) | 0 (0.0%) |
| 20 to 34 years | 11 (100.0%) | 0 (0.0%) |
| 35 to 50 years | 0 (0.0%) | 7 (100.0%) |
| Total | 11 (61.1%) | 7 (38.9%) |
Fertility by Education in Camp Point
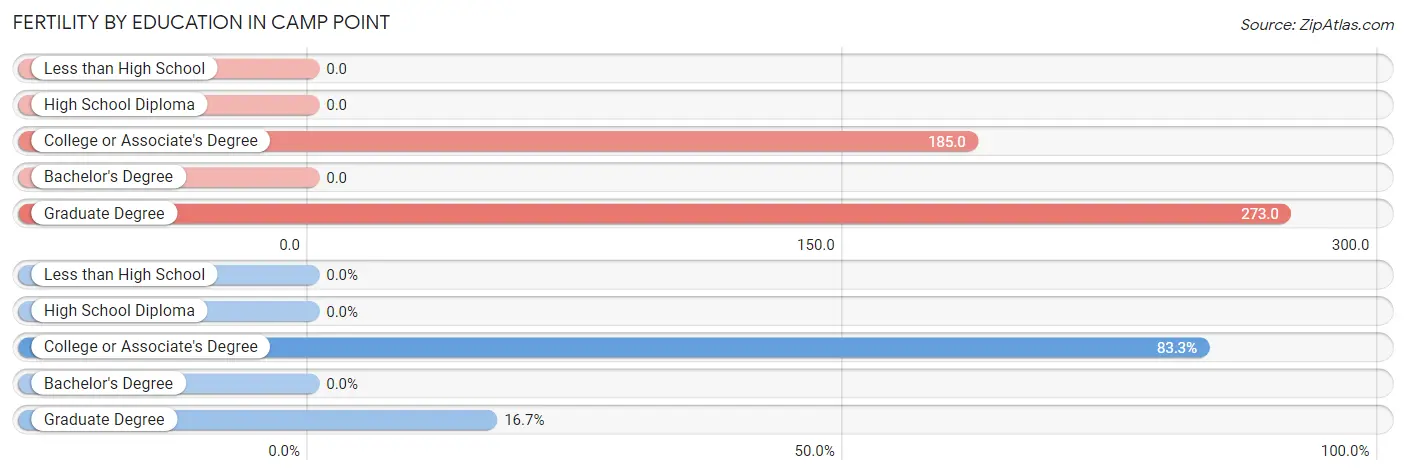
| Educational Attainment | Women with Births | Births / 1,000 Women |
| Less than High School | 0 (0.0%) | 0.0 |
| High School Diploma | 0 (0.0%) | 0.0 |
| College or Associate's Degree | 15 (83.3%) | 185.0 |
| Bachelor's Degree | 0 (0.0%) | 0.0 |
| Graduate Degree | 3 (16.7%) | 273.0 |
| Total | 18 (100.0%) | 58.0 |
Fertility by Education by Marriage Status in Camp Point
38.9% of women with births in Camp Point are unmarried. Women with the educational attainment of graduate degree are most likely to be married with 100.0% of them married at childbirth, while women with the educational attainment of college or associate's degree are least likely to be married with 46.7% of them unmarried at childbirth.
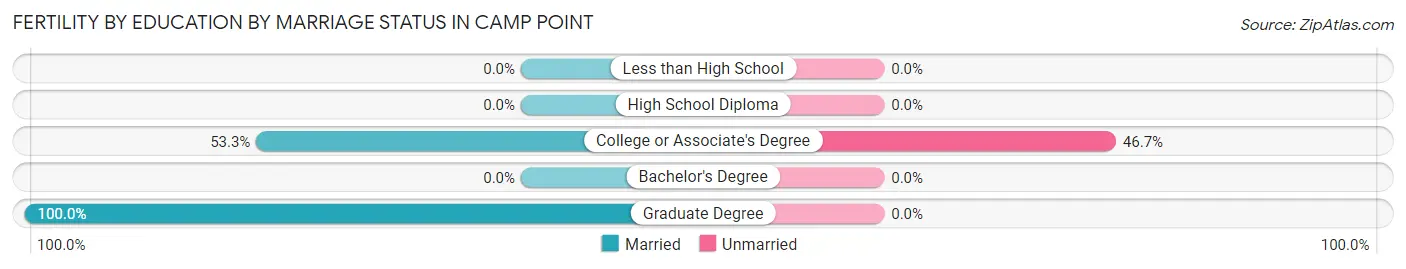
| Educational Attainment | Married | Unmarried |
| Less than High School | 0 (0.0%) | 0 (0.0%) |
| High School Diploma | 0 (0.0%) | 0 (0.0%) |
| College or Associate's Degree | 8 (53.3%) | 7 (46.7%) |
| Bachelor's Degree | 0 (0.0%) | 0 (0.0%) |
| Graduate Degree | 3 (100.0%) | 0 (0.0%) |
| Total | 11 (61.1%) | 7 (38.9%) |
Employment Characteristics in Camp Point
Employment by Class of Employer in Camp Point
Among the 611 employed individuals in Camp Point, private company employees (406 | 66.4%), not-for-profit organizations (78 | 12.8%), and local government employees (53 | 8.7%) make up the most common classes of employment.
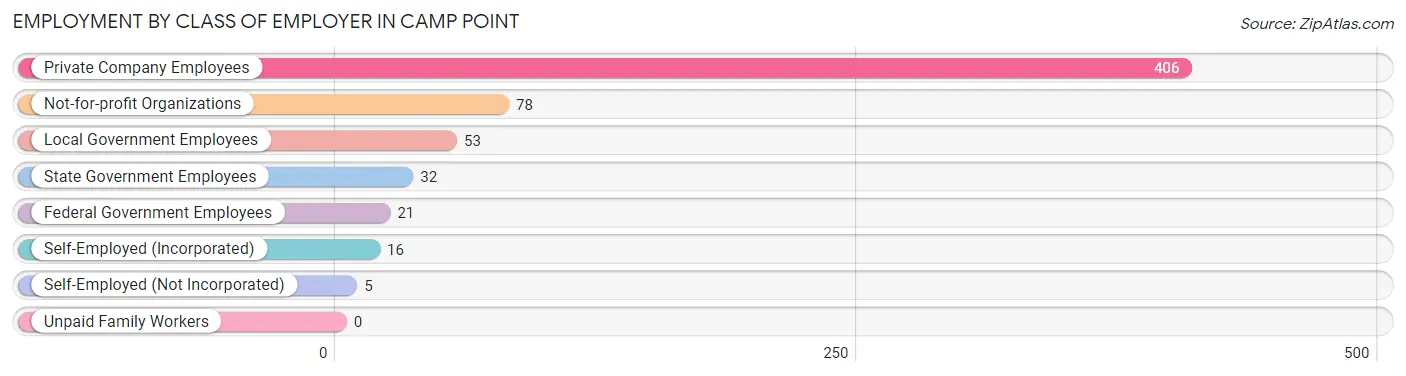
| Employer Class | # Employees | % Employees |
| Private Company Employees | 406 | 66.4% |
| Self-Employed (Incorporated) | 16 | 2.6% |
| Self-Employed (Not Incorporated) | 5 | 0.8% |
| Not-for-profit Organizations | 78 | 12.8% |
| Local Government Employees | 53 | 8.7% |
| State Government Employees | 32 | 5.2% |
| Federal Government Employees | 21 | 3.4% |
| Unpaid Family Workers | 0 | 0.0% |
| Total | 611 | 100.0% |
Employment Status by Age in Camp Point
According to the labor force statistics for Camp Point, out of the total population over 16 years of age (1,028), 62.6% or 644 individuals are in the labor force, with 2.5% or 16 of them unemployed. The age group with the highest labor force participation rate is 55 to 59 years, with 96.8% or 60 individuals in the labor force. Within the labor force, the 45 to 54 years age range has the highest percentage of unemployed individuals, with 9.0% or 8 of them being unemployed.
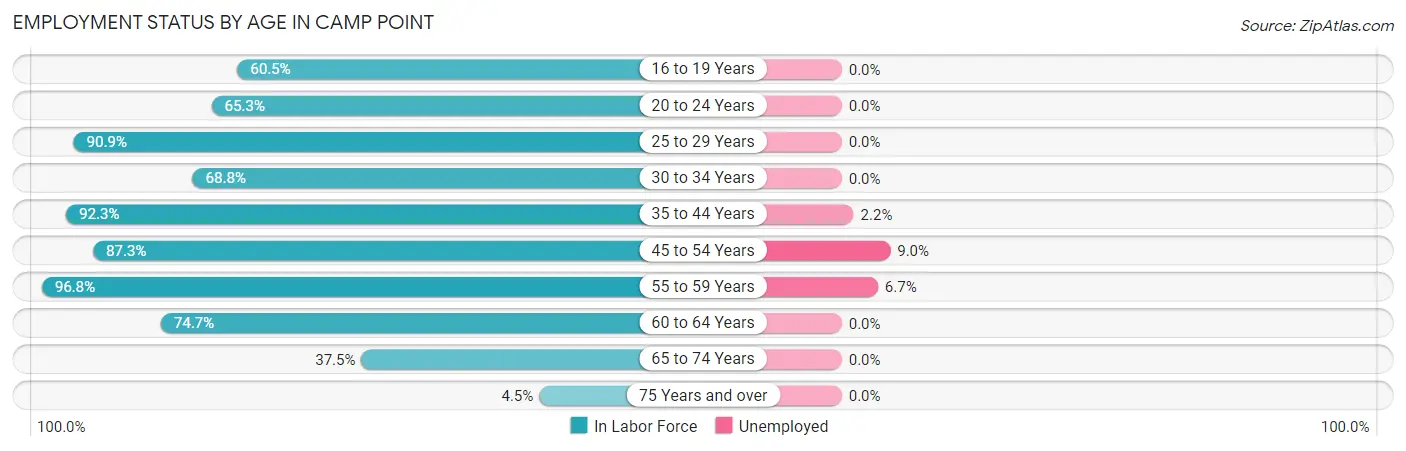
| Age Bracket | In Labor Force | Unemployed |
| 16 to 19 Years | 75 (60.5%) | 0 (0.0%) |
| 20 to 24 Years | 32 (65.3%) | 0 (0.0%) |
| 25 to 29 Years | 60 (90.9%) | 0 (0.0%) |
| 30 to 34 Years | 44 (68.8%) | 0 (0.0%) |
| 35 to 44 Years | 180 (92.3%) | 4 (2.2%) |
| 45 to 54 Years | 89 (87.3%) | 8 (9.0%) |
| 55 to 59 Years | 60 (96.8%) | 4 (6.7%) |
| 60 to 64 Years | 65 (74.7%) | 0 (0.0%) |
| 65 to 74 Years | 30 (37.5%) | 0 (0.0%) |
| 75 Years and over | 9 (4.5%) | 0 (0.0%) |
| Total | 644 (62.6%) | 16 (2.5%) |
Employment Status by Educational Attainment in Camp Point
According to labor force statistics for Camp Point, 86.5% of individuals (498) out of the total population between 25 and 64 years of age (576) are in the labor force, with 3.2% or 16 of them being unemployed. The group with the highest labor force participation rate are those with the educational attainment of bachelor's degree or higher, with 100.0% or 120 individuals in the labor force. Within the labor force, individuals with college / associate degree education have the highest percentage of unemployment, with 9.2% or 12 of them being unemployed.
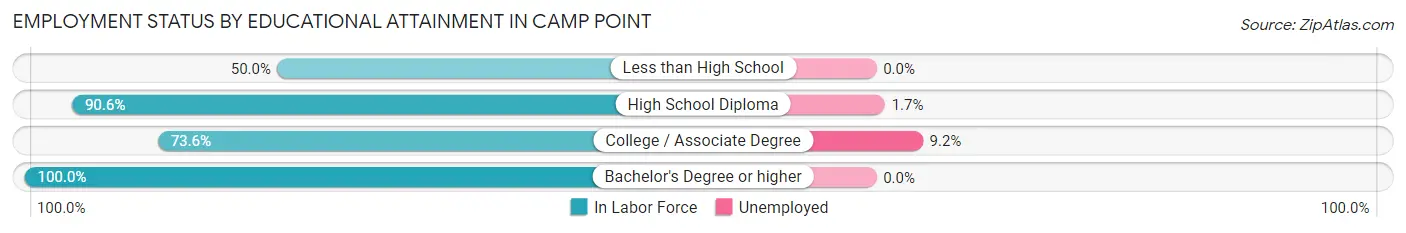
| Educational Attainment | In Labor Force | Unemployed |
| Less than High School | 6 (50.0%) | 0 (0.0%) |
| High School Diploma | 241 (90.6%) | 5 (1.7%) |
| College / Associate Degree | 131 (73.6%) | 16 (9.2%) |
| Bachelor's Degree or higher | 120 (100.0%) | 0 (0.0%) |
| Total | 498 (86.5%) | 18 (3.2%) |
Employment Occupations by Sex in Camp Point
Management, Business, Science and Arts Occupations
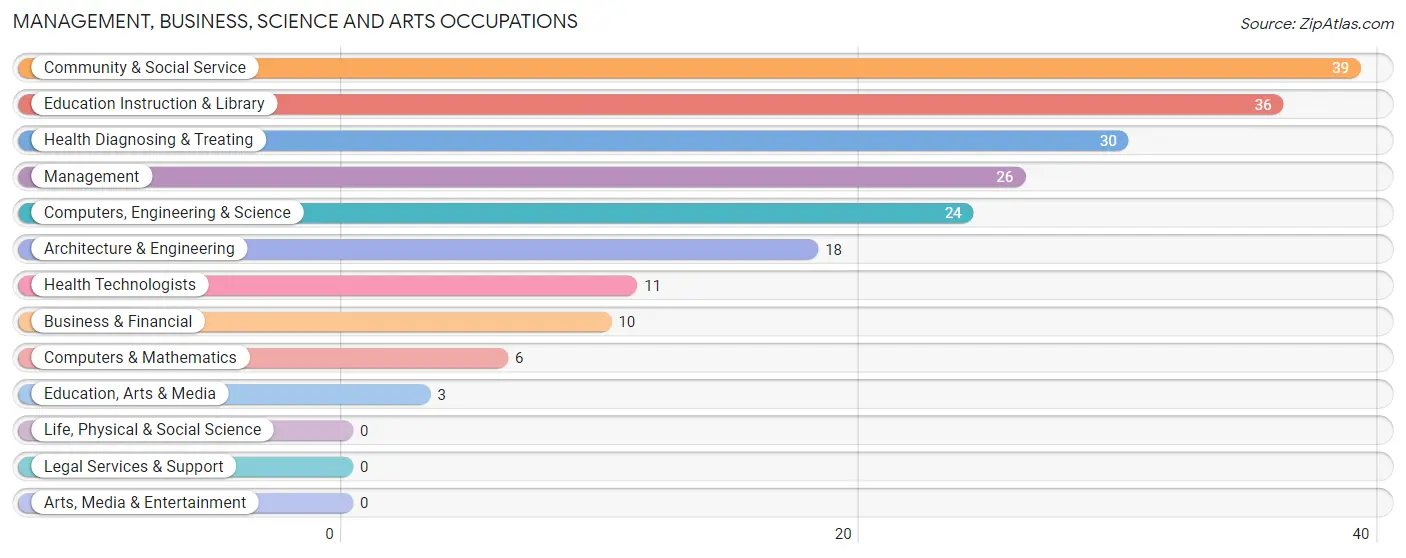
The most common Management, Business, Science and Arts occupations in Camp Point are Community & Social Service (39 | 6.2%), Education Instruction & Library (36 | 5.7%), Health Diagnosing & Treating (30 | 4.8%), Management (26 | 4.1%), and Computers, Engineering & Science (24 | 3.8%).
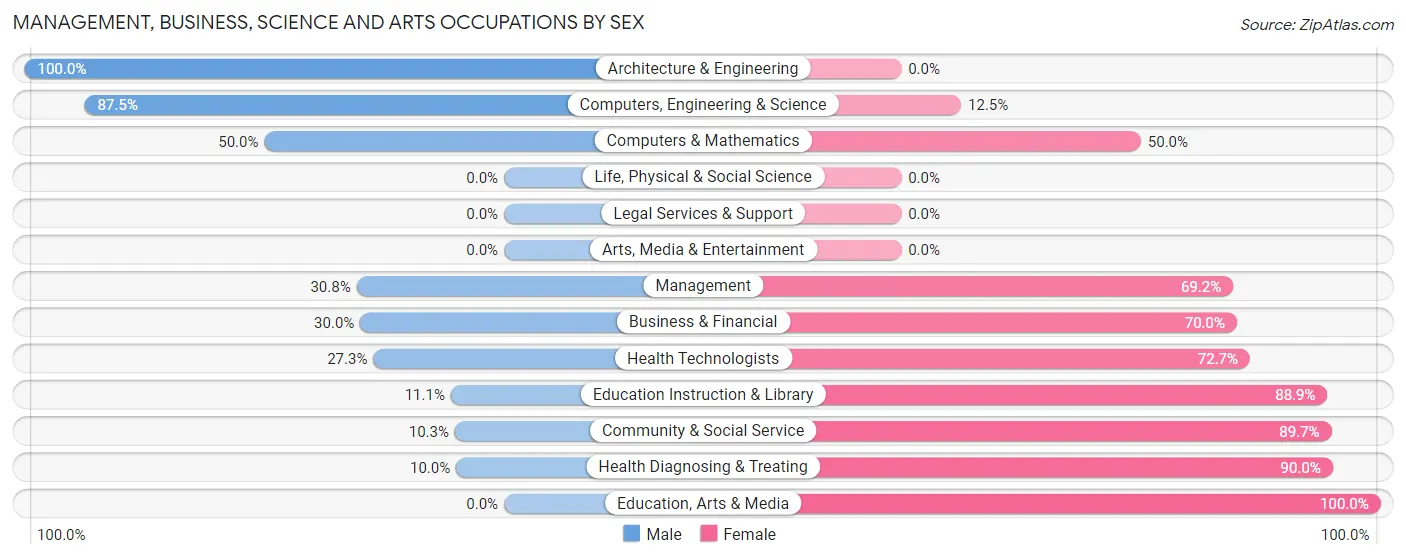
Management, Business, Science and Arts Occupations by Sex
Within the Management, Business, Science and Arts occupations in Camp Point, the most male-oriented occupations are Architecture & Engineering (100.0%), Computers, Engineering & Science (87.5%), and Computers & Mathematics (50.0%), while the most female-oriented occupations are Education, Arts & Media (100.0%), Health Diagnosing & Treating (90.0%), and Community & Social Service (89.7%).
| Occupation | Male | Female |
| Management | 8 (30.8%) | 18 (69.2%) |
| Business & Financial | 3 (30.0%) | 7 (70.0%) |
| Computers, Engineering & Science | 21 (87.5%) | 3 (12.5%) |
| Computers & Mathematics | 3 (50.0%) | 3 (50.0%) |
| Architecture & Engineering | 18 (100.0%) | 0 (0.0%) |
| Life, Physical & Social Science | 0 (0.0%) | 0 (0.0%) |
| Community & Social Service | 4 (10.3%) | 35 (89.7%) |
| Education, Arts & Media | 0 (0.0%) | 3 (100.0%) |
| Legal Services & Support | 0 (0.0%) | 0 (0.0%) |
| Education Instruction & Library | 4 (11.1%) | 32 (88.9%) |
| Arts, Media & Entertainment | 0 (0.0%) | 0 (0.0%) |
| Health Diagnosing & Treating | 3 (10.0%) | 27 (90.0%) |
| Health Technologists | 3 (27.3%) | 8 (72.7%) |
| Total (Category) | 39 (30.2%) | 90 (69.8%) |
| Total (Overall) | 288 (45.9%) | 340 (54.1%) |
Services Occupations
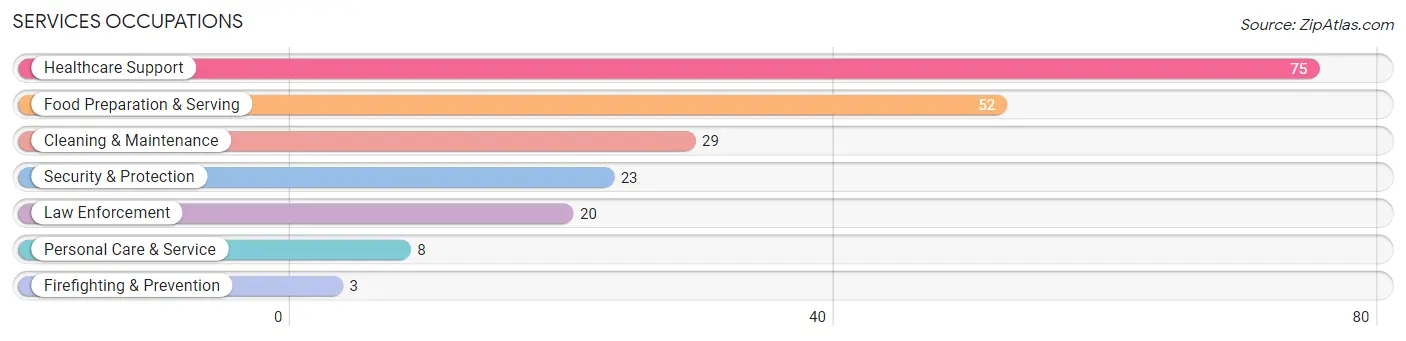
The most common Services occupations in Camp Point are Healthcare Support (75 | 11.9%), Food Preparation & Serving (52 | 8.3%), Cleaning & Maintenance (29 | 4.6%), Security & Protection (23 | 3.7%), and Law Enforcement (20 | 3.2%).
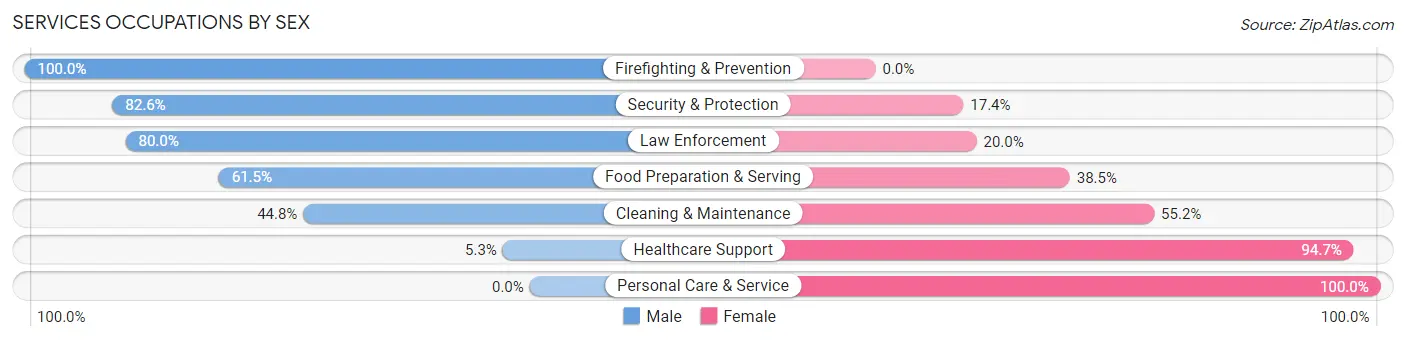
Services Occupations by Sex
Within the Services occupations in Camp Point, the most male-oriented occupations are Firefighting & Prevention (100.0%), Security & Protection (82.6%), and Law Enforcement (80.0%), while the most female-oriented occupations are Personal Care & Service (100.0%), Healthcare Support (94.7%), and Cleaning & Maintenance (55.2%).
| Occupation | Male | Female |
| Healthcare Support | 4 (5.3%) | 71 (94.7%) |
| Security & Protection | 19 (82.6%) | 4 (17.4%) |
| Firefighting & Prevention | 3 (100.0%) | 0 (0.0%) |
| Law Enforcement | 16 (80.0%) | 4 (20.0%) |
| Food Preparation & Serving | 32 (61.5%) | 20 (38.5%) |
| Cleaning & Maintenance | 13 (44.8%) | 16 (55.2%) |
| Personal Care & Service | 0 (0.0%) | 8 (100.0%) |
| Total (Category) | 68 (36.4%) | 119 (63.6%) |
| Total (Overall) | 288 (45.9%) | 340 (54.1%) |
Sales and Office Occupations
The most common Sales and Office occupations in Camp Point are Office & Administration (77 | 12.3%), and Sales & Related (28 | 4.5%).
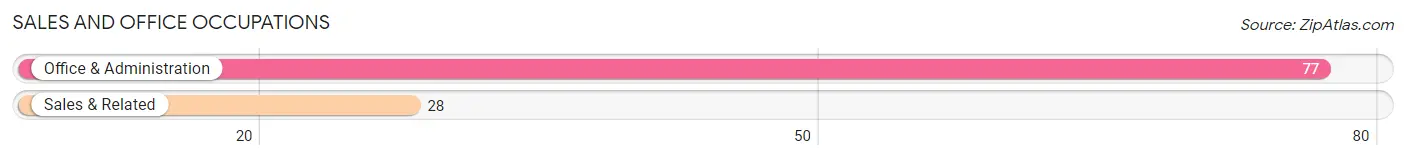
Sales and Office Occupations by Sex
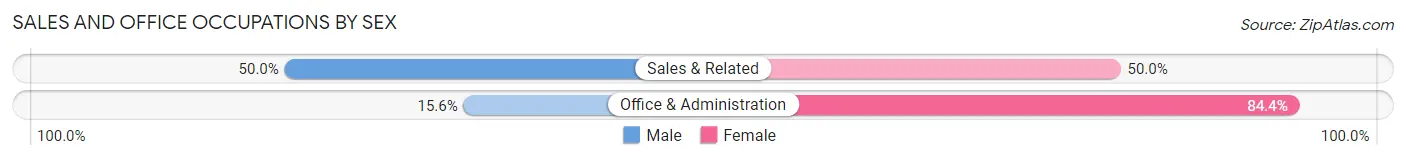
| Occupation | Male | Female |
| Sales & Related | 14 (50.0%) | 14 (50.0%) |
| Office & Administration | 12 (15.6%) | 65 (84.4%) |
| Total (Category) | 26 (24.8%) | 79 (75.2%) |
| Total (Overall) | 288 (45.9%) | 340 (54.1%) |
Natural Resources, Construction and Maintenance Occupations
The most common Natural Resources, Construction and Maintenance occupations in Camp Point are Construction & Extraction (34 | 5.4%), Installation, Maintenance & Repair (23 | 3.7%), and Farming, Fishing & Forestry (9 | 1.4%).
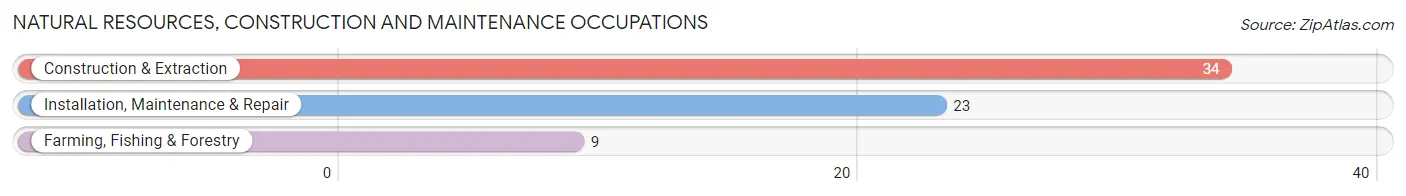
Natural Resources, Construction and Maintenance Occupations by Sex
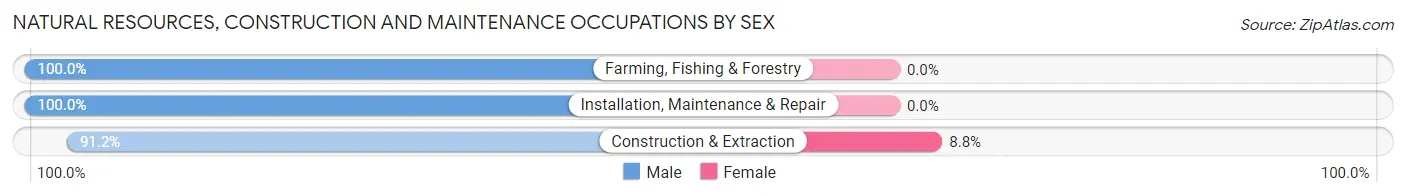
| Occupation | Male | Female |
| Farming, Fishing & Forestry | 9 (100.0%) | 0 (0.0%) |
| Construction & Extraction | 31 (91.2%) | 3 (8.8%) |
| Installation, Maintenance & Repair | 23 (100.0%) | 0 (0.0%) |
| Total (Category) | 63 (95.5%) | 3 (4.5%) |
| Total (Overall) | 288 (45.9%) | 340 (54.1%) |
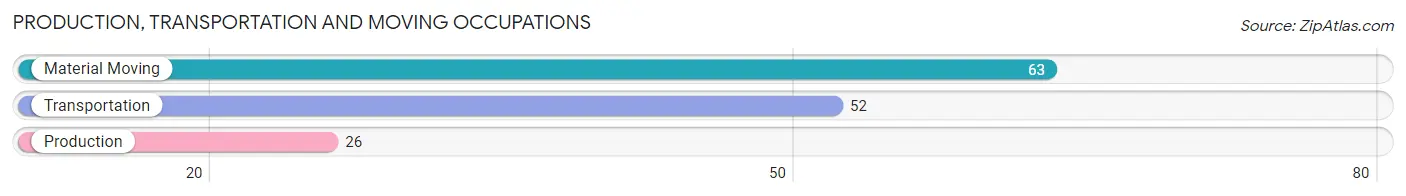
Production, Transportation and Moving Occupations
The most common Production, Transportation and Moving occupations in Camp Point are Material Moving (63 | 10.0%), Transportation (52 | 8.3%), and Production (26 | 4.1%).
Production, Transportation and Moving Occupations by Sex
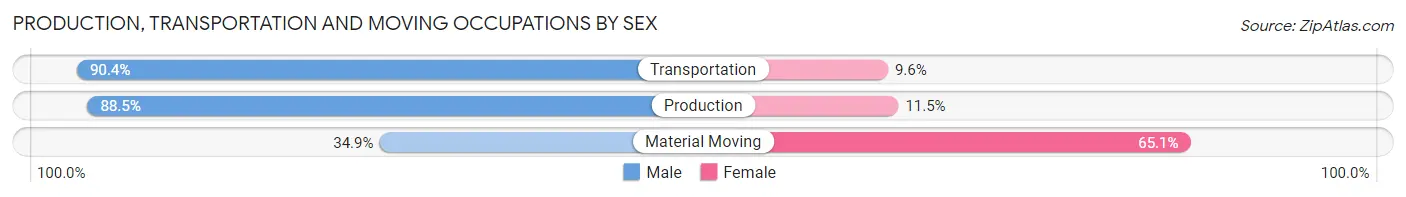
| Occupation | Male | Female |
| Production | 23 (88.5%) | 3 (11.5%) |
| Transportation | 47 (90.4%) | 5 (9.6%) |
| Material Moving | 22 (34.9%) | 41 (65.1%) |
| Total (Category) | 92 (65.2%) | 49 (34.7%) |
| Total (Overall) | 288 (45.9%) | 340 (54.1%) |
Employment Industries by Sex in Camp Point
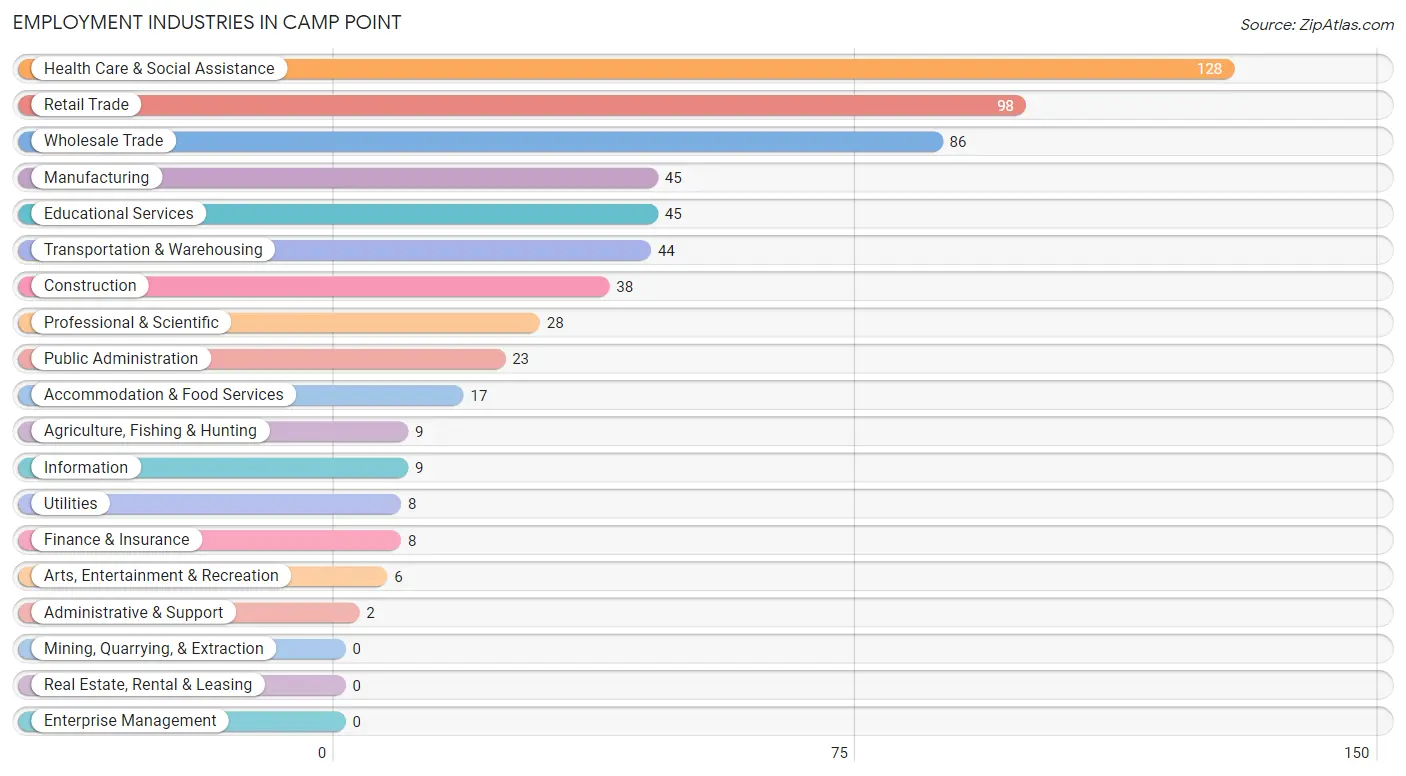
Employment Industries in Camp Point
The major employment industries in Camp Point include Health Care & Social Assistance (128 | 20.4%), Retail Trade (98 | 15.6%), Wholesale Trade (86 | 13.7%), Manufacturing (45 | 7.2%), and Educational Services (45 | 7.2%).
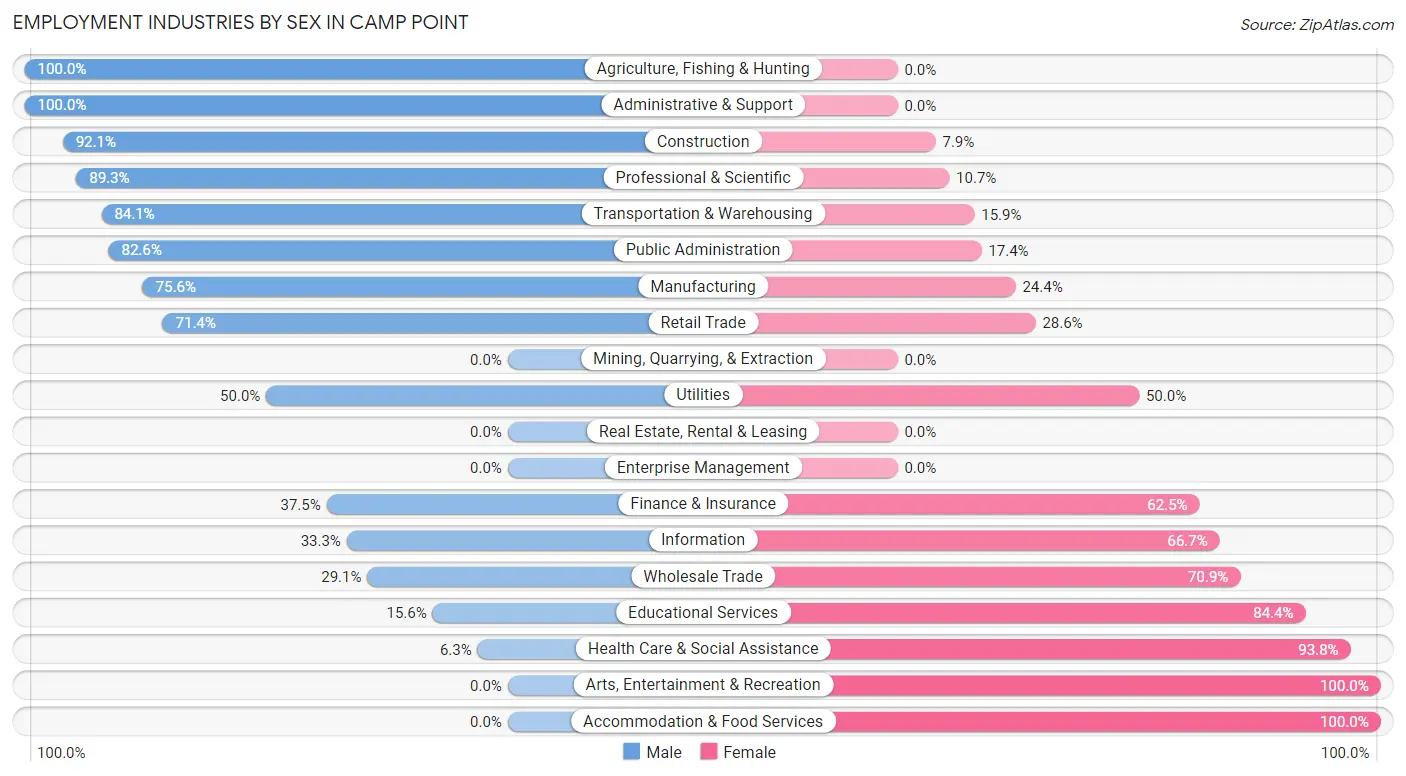
Employment Industries by Sex in Camp Point
The Camp Point industries that see more men than women are Agriculture, Fishing & Hunting (100.0%), Administrative & Support (100.0%), and Construction (92.1%), whereas the industries that tend to have a higher number of women are Arts, Entertainment & Recreation (100.0%), Accommodation & Food Services (100.0%), and Health Care & Social Assistance (93.8%).
| Industry | Male | Female |
| Agriculture, Fishing & Hunting | 9 (100.0%) | 0 (0.0%) |
| Mining, Quarrying, & Extraction | 0 (0.0%) | 0 (0.0%) |
| Construction | 35 (92.1%) | 3 (7.9%) |
| Manufacturing | 34 (75.6%) | 11 (24.4%) |
| Wholesale Trade | 25 (29.1%) | 61 (70.9%) |
| Retail Trade | 70 (71.4%) | 28 (28.6%) |
| Transportation & Warehousing | 37 (84.1%) | 7 (15.9%) |
| Utilities | 4 (50.0%) | 4 (50.0%) |
| Information | 3 (33.3%) | 6 (66.7%) |
| Finance & Insurance | 3 (37.5%) | 5 (62.5%) |
| Real Estate, Rental & Leasing | 0 (0.0%) | 0 (0.0%) |
| Professional & Scientific | 25 (89.3%) | 3 (10.7%) |
| Enterprise Management | 0 (0.0%) | 0 (0.0%) |
| Administrative & Support | 2 (100.0%) | 0 (0.0%) |
| Educational Services | 7 (15.6%) | 38 (84.4%) |
| Health Care & Social Assistance | 8 (6.2%) | 120 (93.8%) |
| Arts, Entertainment & Recreation | 0 (0.0%) | 6 (100.0%) |
| Accommodation & Food Services | 0 (0.0%) | 17 (100.0%) |
| Public Administration | 19 (82.6%) | 4 (17.4%) |
| Total | 288 (45.9%) | 340 (54.1%) |
Education in Camp Point
School Enrollment in Camp Point
The most common levels of schooling among the 419 students in Camp Point are high school (143 | 34.1%), middle school (125 | 29.8%), and elementary school (90 | 21.5%).
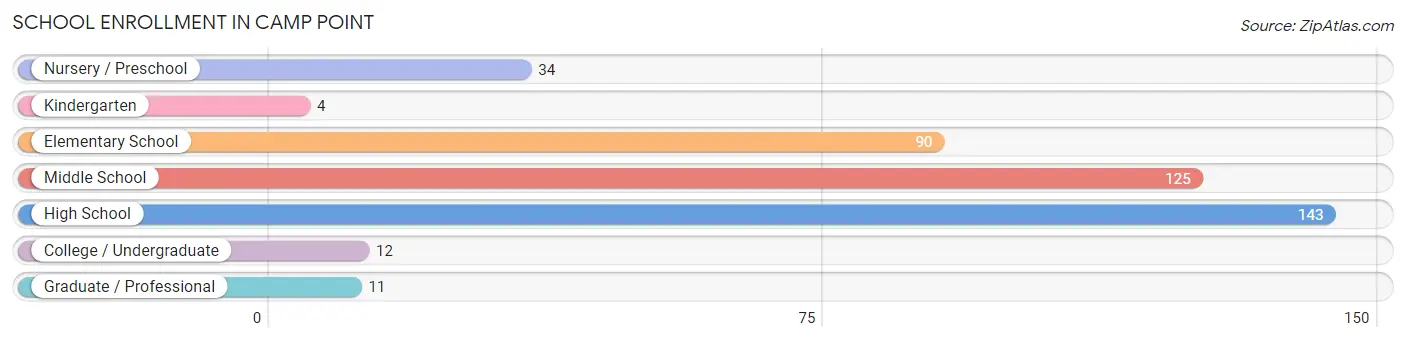
| School Level | # Students | % Students |
| Nursery / Preschool | 34 | 8.1% |
| Kindergarten | 4 | 0.9% |
| Elementary School | 90 | 21.5% |
| Middle School | 125 | 29.8% |
| High School | 143 | 34.1% |
| College / Undergraduate | 12 | 2.9% |
| Graduate / Professional | 11 | 2.6% |
| Total | 419 | 100.0% |
School Enrollment by Age by Funding Source in Camp Point
Out of a total of 419 students who are enrolled in schools in Camp Point, 9 (2.1%) attend a private institution, while the remaining 410 (97.9%) are enrolled in public schools. The age group of 20 to 24 year olds has the highest likelihood of being enrolled in private schools, with 4 (100.0% in the age bracket) enrolled. Conversely, the age group of 3 to 4 year olds has the lowest likelihood of being enrolled in a private school, with 23 (100.0% in the age bracket) attending a public institution.
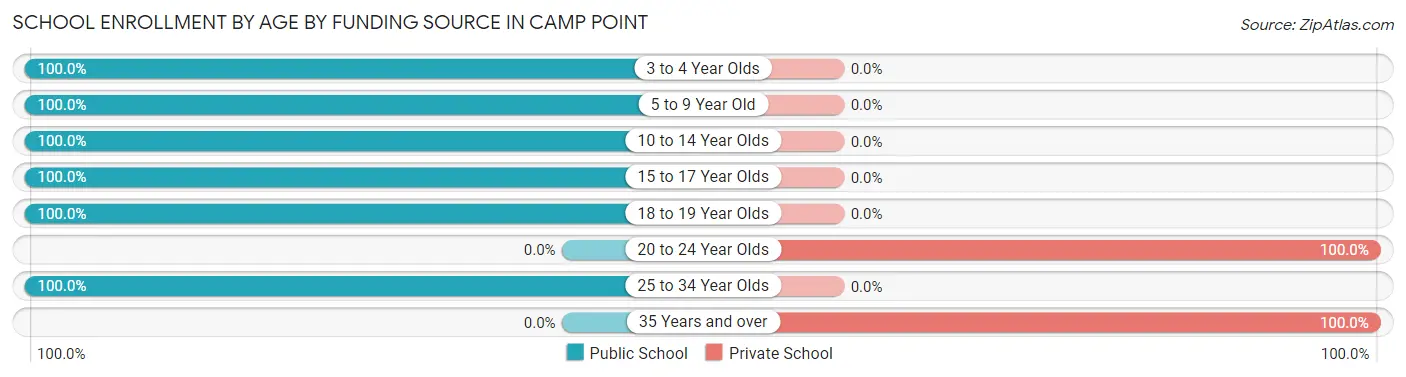
| Age Bracket | Public School | Private School |
| 3 to 4 Year Olds | 23 (100.0%) | 0 (0.0%) |
| 5 to 9 Year Old | 69 (100.0%) | 0 (0.0%) |
| 10 to 14 Year Olds | 178 (100.0%) | 0 (0.0%) |
| 15 to 17 Year Olds | 105 (100.0%) | 0 (0.0%) |
| 18 to 19 Year Olds | 21 (100.0%) | 0 (0.0%) |
| 20 to 24 Year Olds | 0 (0.0%) | 4 (100.0%) |
| 25 to 34 Year Olds | 14 (100.0%) | 0 (0.0%) |
| 35 Years and over | 0 (0.0%) | 5 (100.0%) |
| Total | 410 (97.9%) | 9 (2.1%) |
Educational Attainment by Field of Study in Camp Point
Arts & humanities (51 | 24.1%), education (47 | 22.2%), liberal arts & history (35 | 16.5%), engineering (18 | 8.5%), and science & technology (15 | 7.1%) are the most common fields of study among 212 individuals in Camp Point who have obtained a bachelor's degree or higher.
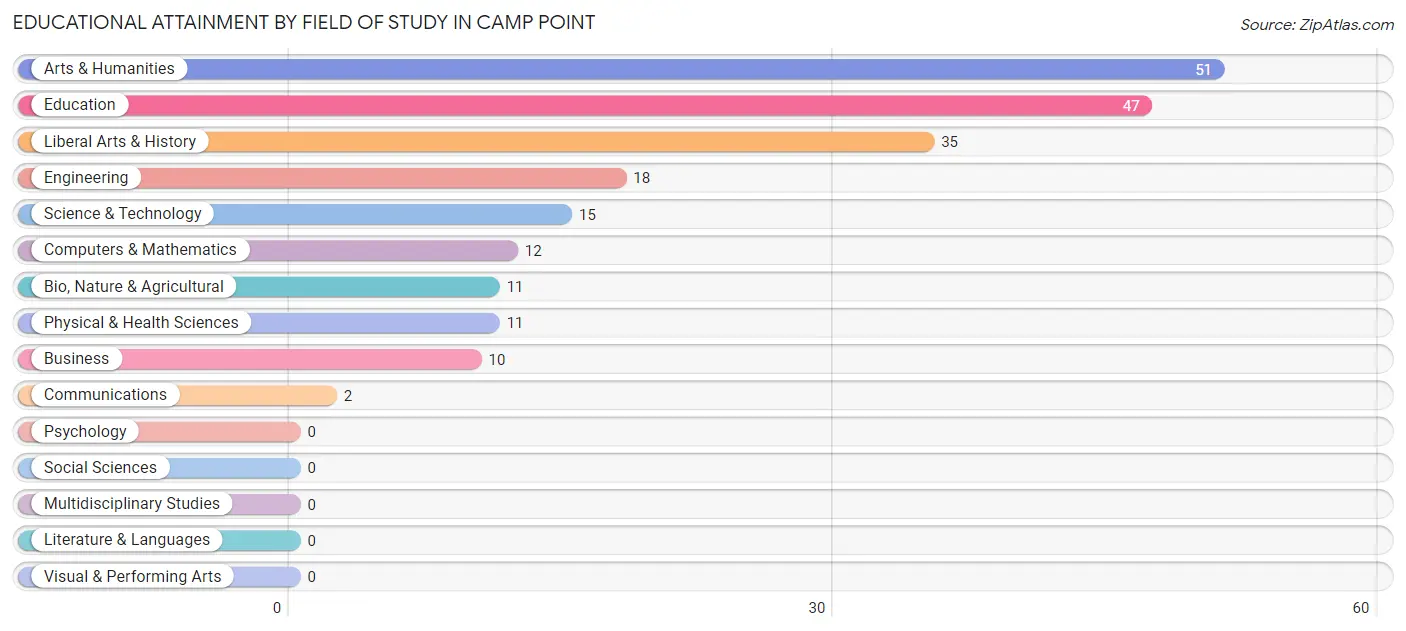
| Field of Study | # Graduates | % Graduates |
| Computers & Mathematics | 12 | 5.7% |
| Bio, Nature & Agricultural | 11 | 5.2% |
| Physical & Health Sciences | 11 | 5.2% |
| Psychology | 0 | 0.0% |
| Social Sciences | 0 | 0.0% |
| Engineering | 18 | 8.5% |
| Multidisciplinary Studies | 0 | 0.0% |
| Science & Technology | 15 | 7.1% |
| Business | 10 | 4.7% |
| Education | 47 | 22.2% |
| Literature & Languages | 0 | 0.0% |
| Liberal Arts & History | 35 | 16.5% |
| Visual & Performing Arts | 0 | 0.0% |
| Communications | 2 | 0.9% |
| Arts & Humanities | 51 | 24.1% |
| Total | 212 | 100.0% |
Transportation & Commute in Camp Point
Vehicle Availability by Sex in Camp Point
The most prevalent vehicle ownership categories in Camp Point are males with 2 vehicles (131, accounting for 45.5%) and females with 2 vehicles (114, making up 40.6%).
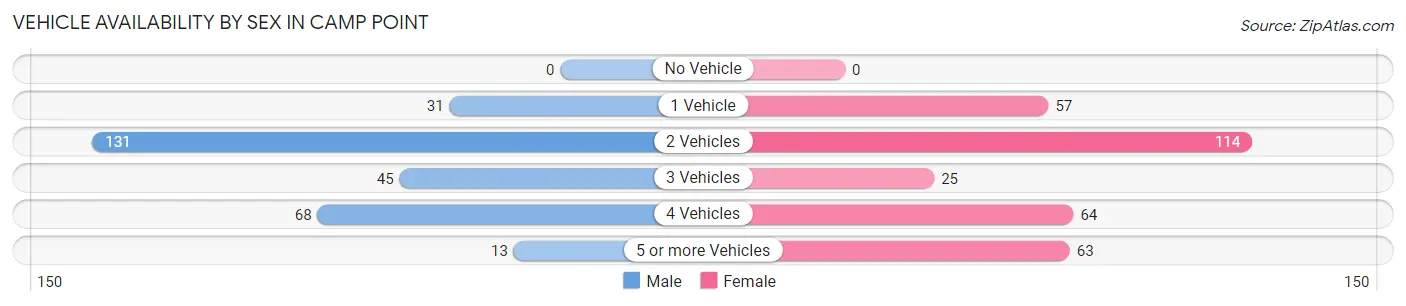
| Vehicles Available | Male | Female |
| No Vehicle | 0 (0.0%) | 0 (0.0%) |
| 1 Vehicle | 31 (10.8%) | 57 (17.6%) |
| 2 Vehicles | 131 (45.5%) | 114 (35.3%) |
| 3 Vehicles | 45 (15.6%) | 25 (7.7%) |
| 4 Vehicles | 68 (23.6%) | 64 (19.8%) |
| 5 or more Vehicles | 13 (4.5%) | 63 (19.5%) |
| Total | 288 (100.0%) | 323 (100.0%) |
Commute Time in Camp Point
The most frequently occuring commute durations in Camp Point are 30 to 34 minutes (207 commuters, 34.7%), 25 to 29 minutes (91 commuters, 15.3%), and 10 to 14 minutes (71 commuters, 11.9%).
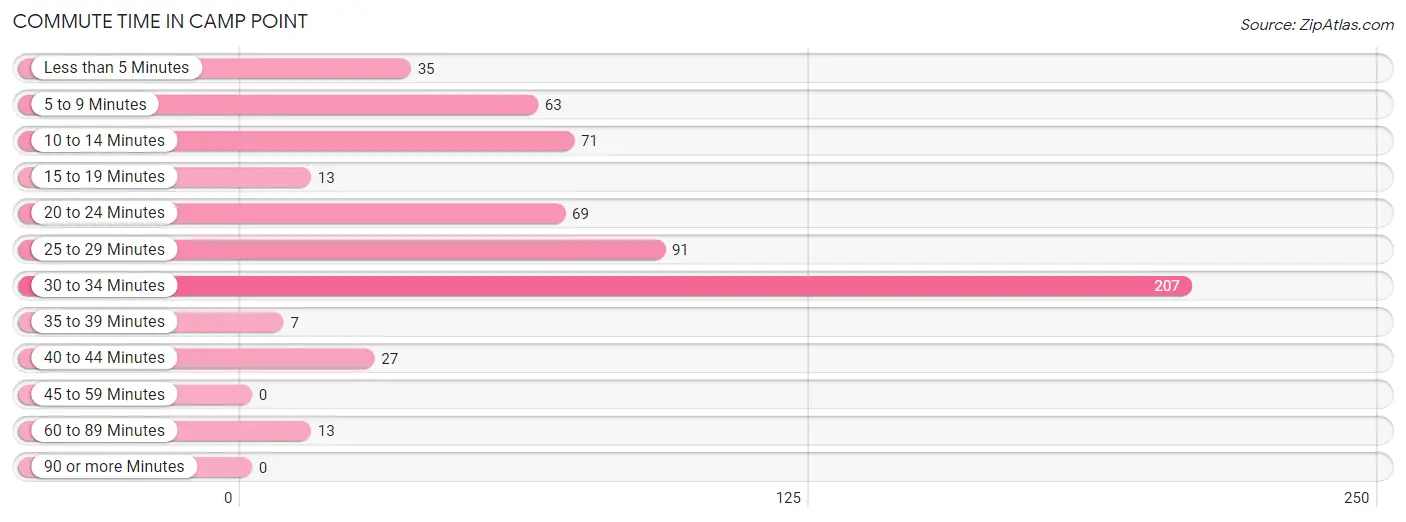
| Commute Time | # Commuters | % Commuters |
| Less than 5 Minutes | 35 | 5.9% |
| 5 to 9 Minutes | 63 | 10.6% |
| 10 to 14 Minutes | 71 | 11.9% |
| 15 to 19 Minutes | 13 | 2.2% |
| 20 to 24 Minutes | 69 | 11.6% |
| 25 to 29 Minutes | 91 | 15.3% |
| 30 to 34 Minutes | 207 | 34.7% |
| 35 to 39 Minutes | 7 | 1.2% |
| 40 to 44 Minutes | 27 | 4.5% |
| 45 to 59 Minutes | 0 | 0.0% |
| 60 to 89 Minutes | 13 | 2.2% |
| 90 or more Minutes | 0 | 0.0% |
Commute Time by Sex in Camp Point
The most common commute times in Camp Point are 30 to 34 minutes (96 commuters, 33.3%) for males and 30 to 34 minutes (111 commuters, 36.0%) for females.
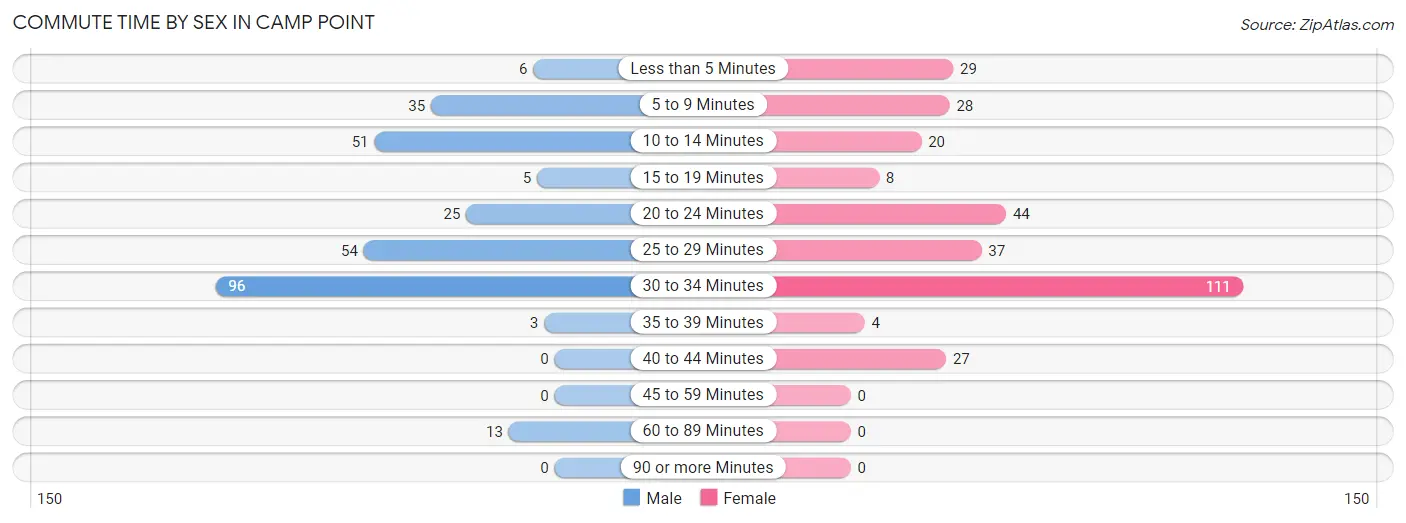
| Commute Time | Male | Female |
| Less than 5 Minutes | 6 (2.1%) | 29 (9.4%) |
| 5 to 9 Minutes | 35 (12.1%) | 28 (9.1%) |
| 10 to 14 Minutes | 51 (17.7%) | 20 (6.5%) |
| 15 to 19 Minutes | 5 (1.7%) | 8 (2.6%) |
| 20 to 24 Minutes | 25 (8.7%) | 44 (14.3%) |
| 25 to 29 Minutes | 54 (18.8%) | 37 (12.0%) |
| 30 to 34 Minutes | 96 (33.3%) | 111 (36.0%) |
| 35 to 39 Minutes | 3 (1.0%) | 4 (1.3%) |
| 40 to 44 Minutes | 0 (0.0%) | 27 (8.8%) |
| 45 to 59 Minutes | 0 (0.0%) | 0 (0.0%) |
| 60 to 89 Minutes | 13 (4.5%) | 0 (0.0%) |
| 90 or more Minutes | 0 (0.0%) | 0 (0.0%) |
Time of Departure to Work by Sex in Camp Point
The most frequent times of departure to work in Camp Point are 6:00 AM to 6:29 AM (67, 23.3%) for males and 7:00 AM to 7:29 AM (79, 25.7%) for females.
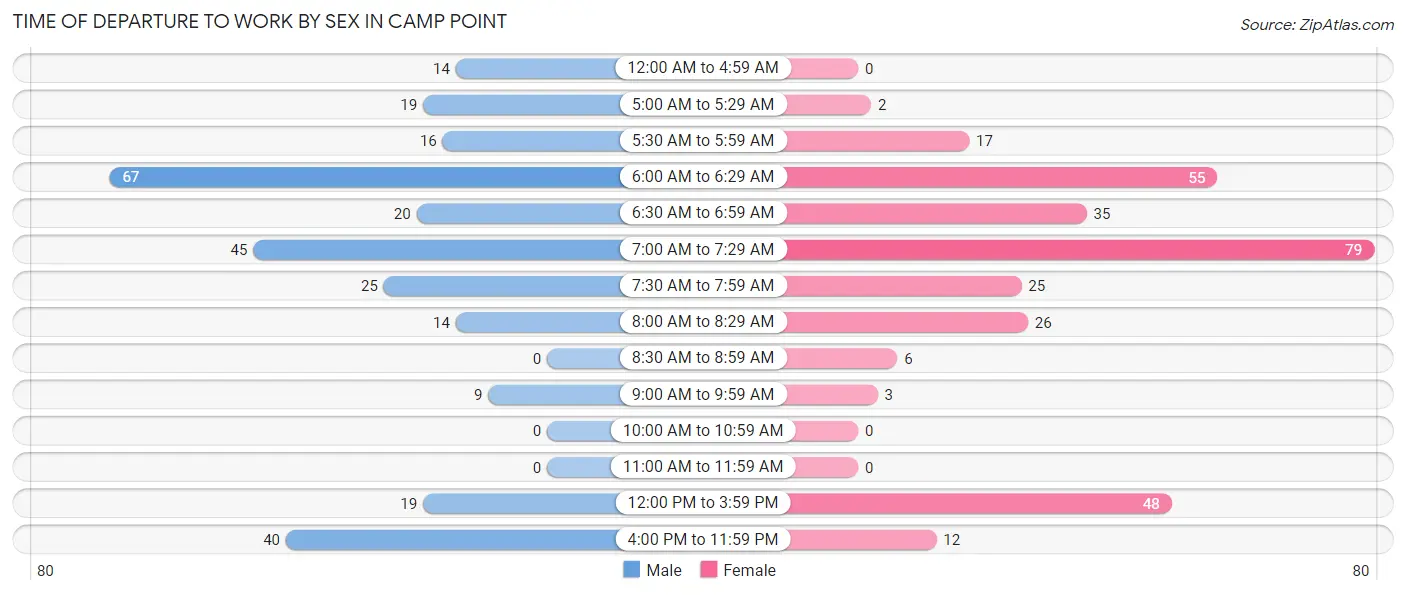
| Time of Departure | Male | Female |
| 12:00 AM to 4:59 AM | 14 (4.9%) | 0 (0.0%) |
| 5:00 AM to 5:29 AM | 19 (6.6%) | 2 (0.6%) |
| 5:30 AM to 5:59 AM | 16 (5.6%) | 17 (5.5%) |
| 6:00 AM to 6:29 AM | 67 (23.3%) | 55 (17.9%) |
| 6:30 AM to 6:59 AM | 20 (6.9%) | 35 (11.4%) |
| 7:00 AM to 7:29 AM | 45 (15.6%) | 79 (25.7%) |
| 7:30 AM to 7:59 AM | 25 (8.7%) | 25 (8.1%) |
| 8:00 AM to 8:29 AM | 14 (4.9%) | 26 (8.4%) |
| 8:30 AM to 8:59 AM | 0 (0.0%) | 6 (1.9%) |
| 9:00 AM to 9:59 AM | 9 (3.1%) | 3 (1.0%) |
| 10:00 AM to 10:59 AM | 0 (0.0%) | 0 (0.0%) |
| 11:00 AM to 11:59 AM | 0 (0.0%) | 0 (0.0%) |
| 12:00 PM to 3:59 PM | 19 (6.6%) | 48 (15.6%) |
| 4:00 PM to 11:59 PM | 40 (13.9%) | 12 (3.9%) |
| Total | 288 (100.0%) | 308 (100.0%) |
Housing Occupancy in Camp Point
Occupancy by Ownership in Camp Point
Of the total 480 dwellings in Camp Point, owner-occupied units account for 318 (66.2%), while renter-occupied units make up 162 (33.8%).
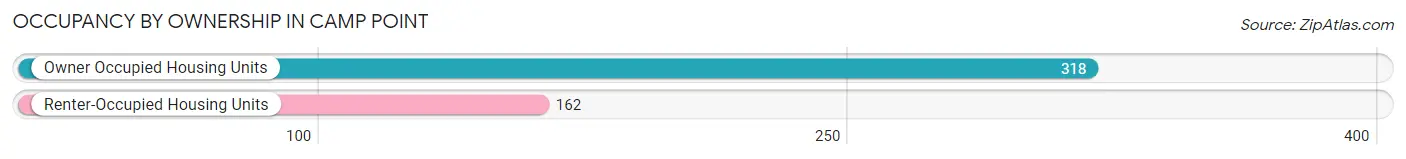
| Occupancy | # Housing Units | % Housing Units |
| Owner Occupied Housing Units | 318 | 66.2% |
| Renter-Occupied Housing Units | 162 | 33.8% |
| Total Occupied Housing Units | 480 | 100.0% |
Occupancy by Household Size in Camp Point
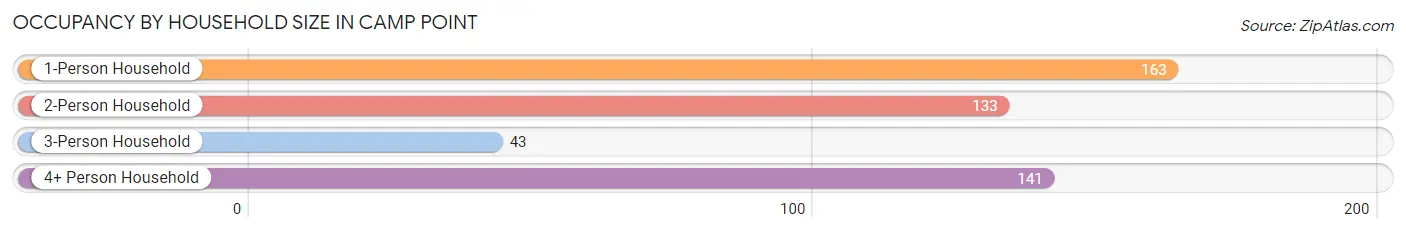
| Household Size | # Housing Units | % Housing Units |
| 1-Person Household | 163 | 34.0% |
| 2-Person Household | 133 | 27.7% |
| 3-Person Household | 43 | 9.0% |
| 4+ Person Household | 141 | 29.4% |
| Total Housing Units | 480 | 100.0% |
Occupancy by Ownership by Household Size in Camp Point
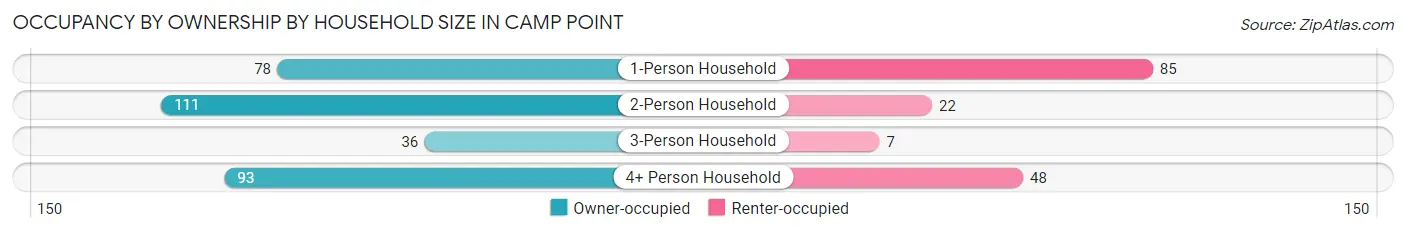
| Household Size | Owner-occupied | Renter-occupied |
| 1-Person Household | 78 (47.8%) | 85 (52.1%) |
| 2-Person Household | 111 (83.5%) | 22 (16.5%) |
| 3-Person Household | 36 (83.7%) | 7 (16.3%) |
| 4+ Person Household | 93 (66.0%) | 48 (34.0%) |
| Total Housing Units | 318 (66.2%) | 162 (33.8%) |
Occupancy by Educational Attainment in Camp Point
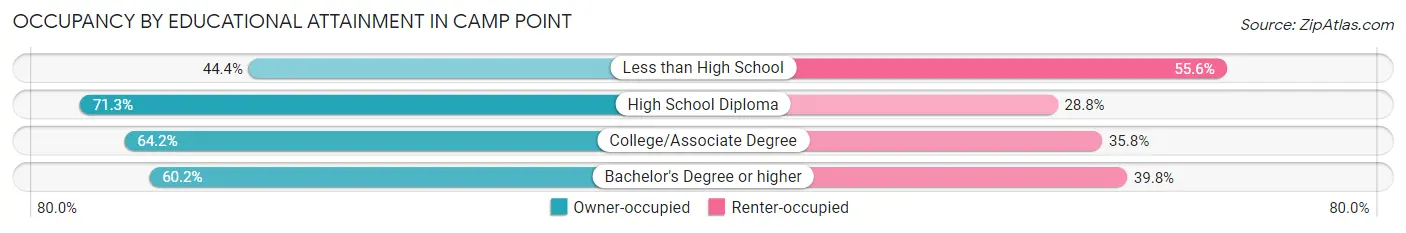
| Household Size | Owner-occupied | Renter-occupied |
| Less than High School | 8 (44.4%) | 10 (55.6%) |
| High School Diploma | 171 (71.3%) | 69 (28.7%) |
| College/Associate Degree | 86 (64.2%) | 48 (35.8%) |
| Bachelor's Degree or higher | 53 (60.2%) | 35 (39.8%) |
Occupancy by Age of Householder in Camp Point
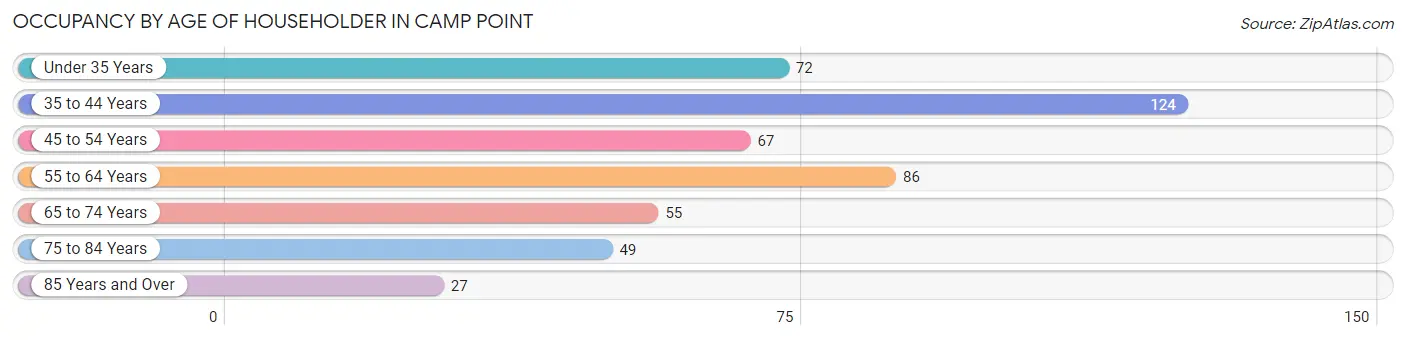
| Age Bracket | # Households | % Households |
| Under 35 Years | 72 | 15.0% |
| 35 to 44 Years | 124 | 25.8% |
| 45 to 54 Years | 67 | 14.0% |
| 55 to 64 Years | 86 | 17.9% |
| 65 to 74 Years | 55 | 11.5% |
| 75 to 84 Years | 49 | 10.2% |
| 85 Years and Over | 27 | 5.6% |
| Total | 480 | 100.0% |
Housing Finances in Camp Point
Median Income by Occupancy in Camp Point
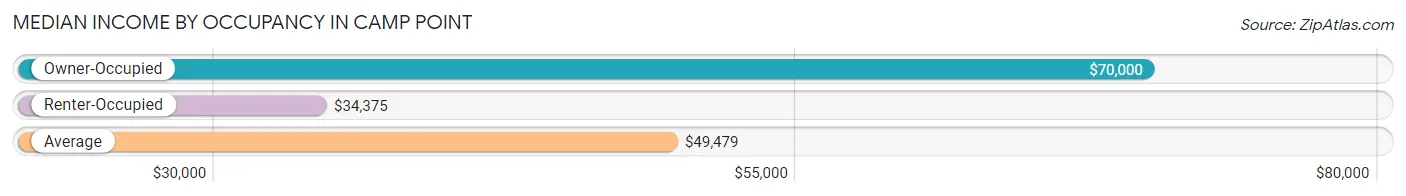
| Occupancy Type | # Households | Median Income |
| Owner-Occupied | 318 (66.2%) | $70,000 |
| Renter-Occupied | 162 (33.8%) | $34,375 |
| Average | 480 (100.0%) | $49,479 |
Occupancy by Householder Income Bracket in Camp Point
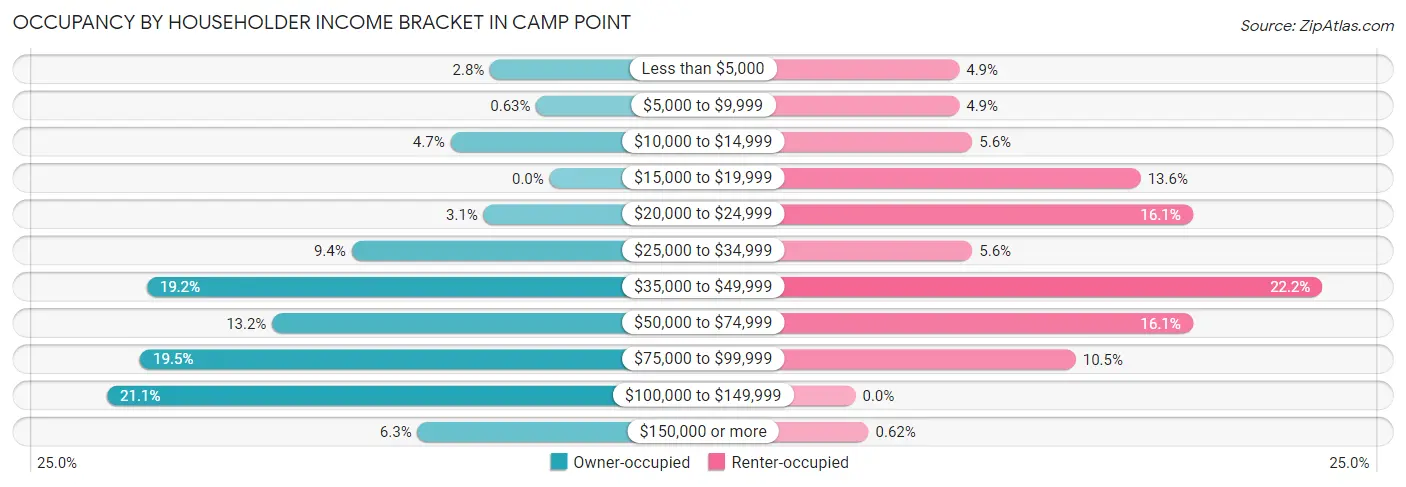
| Income Bracket | Owner-occupied | Renter-occupied |
| Less than $5,000 | 9 (2.8%) | 8 (4.9%) |
| $5,000 to $9,999 | 2 (0.6%) | 8 (4.9%) |
| $10,000 to $14,999 | 15 (4.7%) | 9 (5.6%) |
| $15,000 to $19,999 | 0 (0.0%) | 22 (13.6%) |
| $20,000 to $24,999 | 10 (3.1%) | 26 (16.1%) |
| $25,000 to $34,999 | 30 (9.4%) | 9 (5.6%) |
| $35,000 to $49,999 | 61 (19.2%) | 36 (22.2%) |
| $50,000 to $74,999 | 42 (13.2%) | 26 (16.1%) |
| $75,000 to $99,999 | 62 (19.5%) | 17 (10.5%) |
| $100,000 to $149,999 | 67 (21.1%) | 0 (0.0%) |
| $150,000 or more | 20 (6.3%) | 1 (0.6%) |
| Total | 318 (100.0%) | 162 (100.0%) |
Monthly Housing Cost Tiers in Camp Point
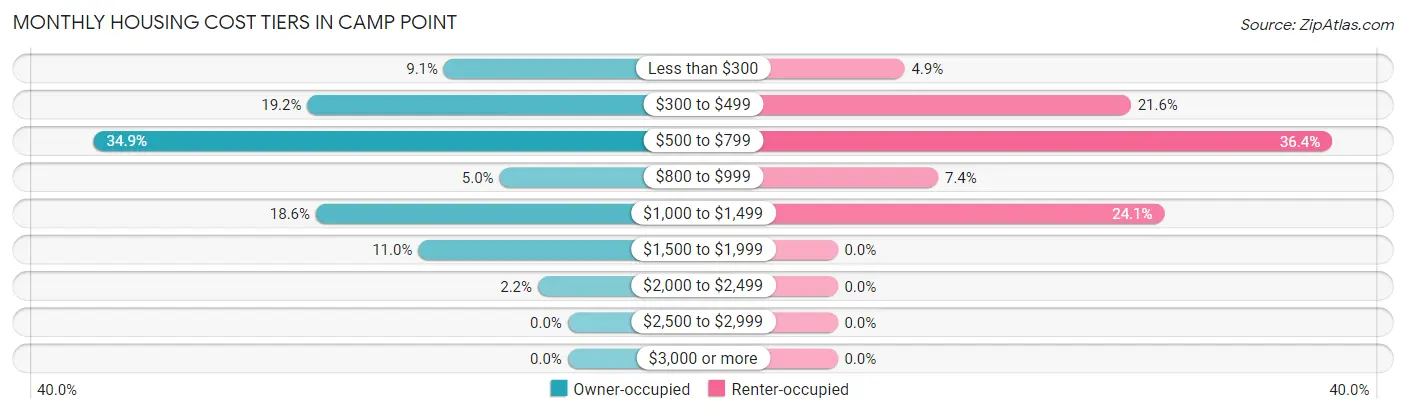
| Monthly Cost | Owner-occupied | Renter-occupied |
| Less than $300 | 29 (9.1%) | 8 (4.9%) |
| $300 to $499 | 61 (19.2%) | 35 (21.6%) |
| $500 to $799 | 111 (34.9%) | 59 (36.4%) |
| $800 to $999 | 16 (5.0%) | 12 (7.4%) |
| $1,000 to $1,499 | 59 (18.5%) | 39 (24.1%) |
| $1,500 to $1,999 | 35 (11.0%) | 0 (0.0%) |
| $2,000 to $2,499 | 7 (2.2%) | 0 (0.0%) |
| $2,500 to $2,999 | 0 (0.0%) | 0 (0.0%) |
| $3,000 or more | 0 (0.0%) | 0 (0.0%) |
| Total | 318 (100.0%) | 162 (100.0%) |
Physical Housing Characteristics in Camp Point
Housing Structures in Camp Point
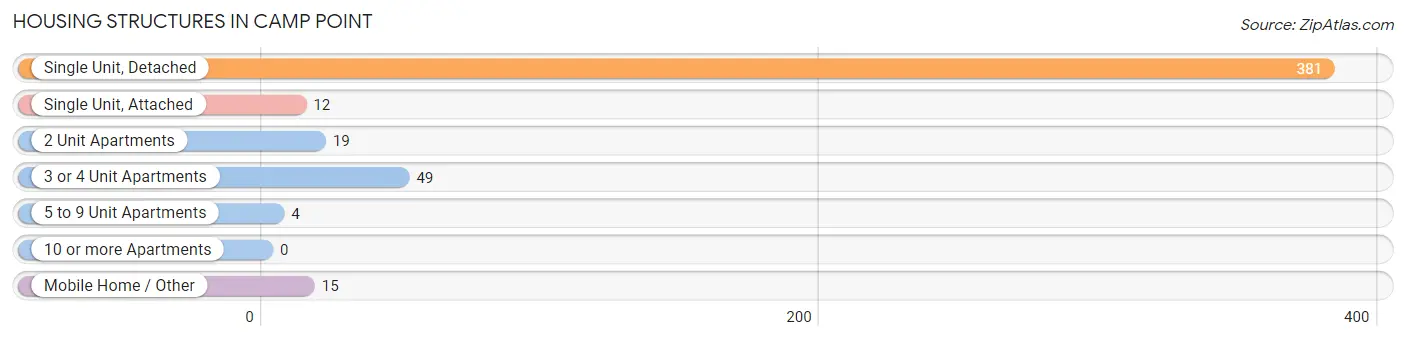
| Structure Type | # Housing Units | % Housing Units |
| Single Unit, Detached | 381 | 79.4% |
| Single Unit, Attached | 12 | 2.5% |
| 2 Unit Apartments | 19 | 4.0% |
| 3 or 4 Unit Apartments | 49 | 10.2% |
| 5 to 9 Unit Apartments | 4 | 0.8% |
| 10 or more Apartments | 0 | 0.0% |
| Mobile Home / Other | 15 | 3.1% |
| Total | 480 | 100.0% |
Housing Structures by Occupancy in Camp Point
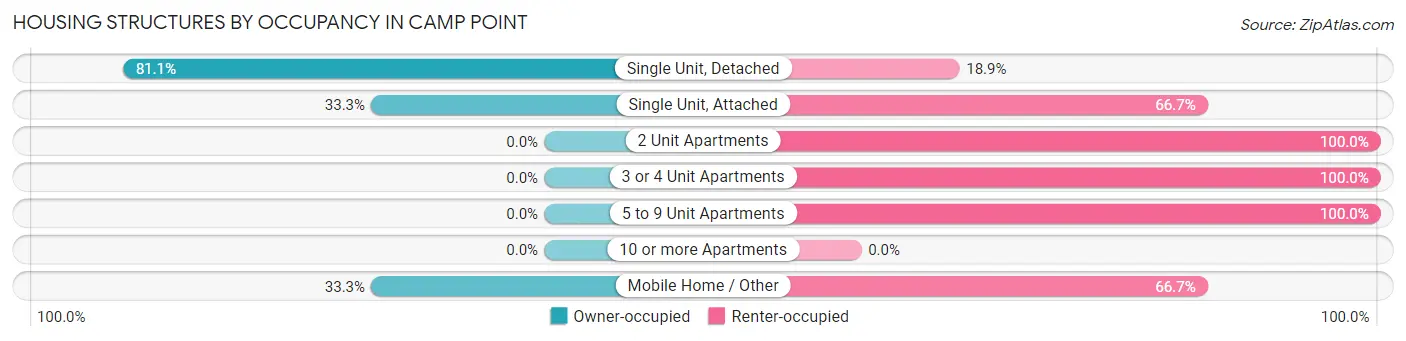
| Structure Type | Owner-occupied | Renter-occupied |
| Single Unit, Detached | 309 (81.1%) | 72 (18.9%) |
| Single Unit, Attached | 4 (33.3%) | 8 (66.7%) |
| 2 Unit Apartments | 0 (0.0%) | 19 (100.0%) |
| 3 or 4 Unit Apartments | 0 (0.0%) | 49 (100.0%) |
| 5 to 9 Unit Apartments | 0 (0.0%) | 4 (100.0%) |
| 10 or more Apartments | 0 (0.0%) | 0 (0.0%) |
| Mobile Home / Other | 5 (33.3%) | 10 (66.7%) |
| Total | 318 (66.2%) | 162 (33.8%) |
Housing Structures by Number of Rooms in Camp Point
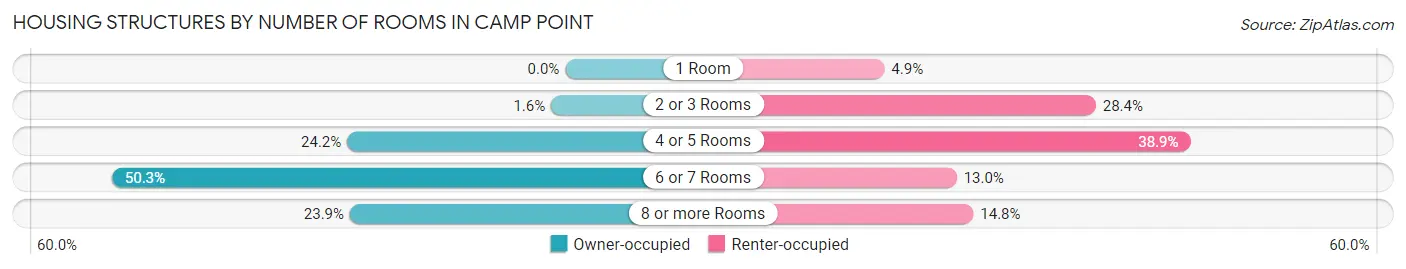
| Number of Rooms | Owner-occupied | Renter-occupied |
| 1 Room | 0 (0.0%) | 8 (4.9%) |
| 2 or 3 Rooms | 5 (1.6%) | 46 (28.4%) |
| 4 or 5 Rooms | 77 (24.2%) | 63 (38.9%) |
| 6 or 7 Rooms | 160 (50.3%) | 21 (13.0%) |
| 8 or more Rooms | 76 (23.9%) | 24 (14.8%) |
| Total | 318 (100.0%) | 162 (100.0%) |
Housing Structure by Heating Type in Camp Point
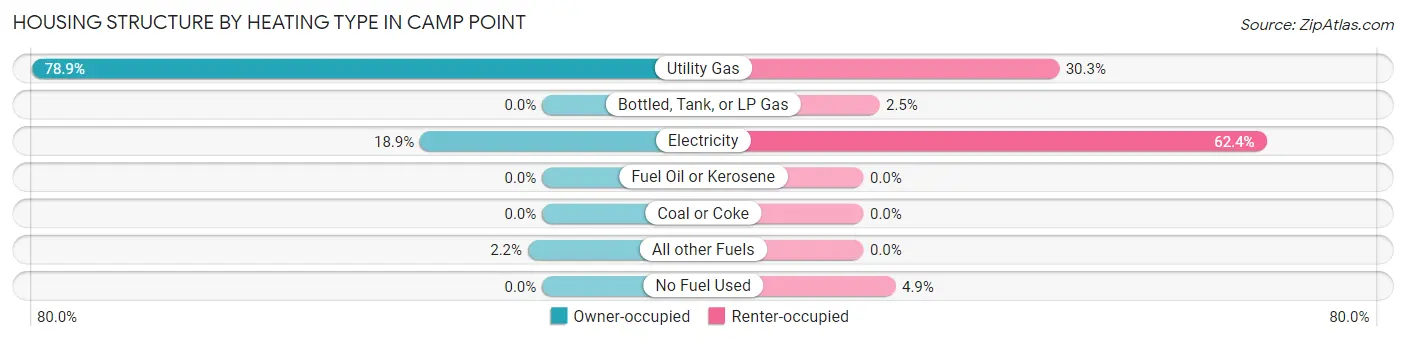
| Heating Type | Owner-occupied | Renter-occupied |
| Utility Gas | 251 (78.9%) | 49 (30.2%) |
| Bottled, Tank, or LP Gas | 0 (0.0%) | 4 (2.5%) |
| Electricity | 60 (18.9%) | 101 (62.4%) |
| Fuel Oil or Kerosene | 0 (0.0%) | 0 (0.0%) |
| Coal or Coke | 0 (0.0%) | 0 (0.0%) |
| All other Fuels | 7 (2.2%) | 0 (0.0%) |
| No Fuel Used | 0 (0.0%) | 8 (4.9%) |
| Total | 318 (100.0%) | 162 (100.0%) |
Household Vehicle Usage in Camp Point
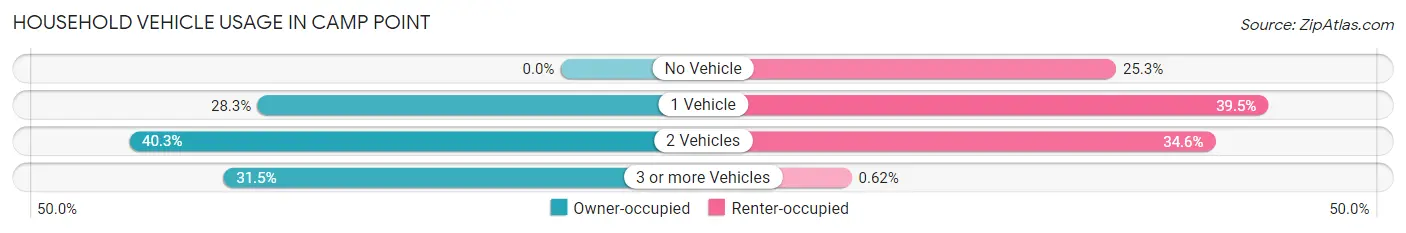
| Vehicles per Household | Owner-occupied | Renter-occupied |
| No Vehicle | 0 (0.0%) | 41 (25.3%) |
| 1 Vehicle | 90 (28.3%) | 64 (39.5%) |
| 2 Vehicles | 128 (40.3%) | 56 (34.6%) |
| 3 or more Vehicles | 100 (31.5%) | 1 (0.6%) |
| Total | 318 (100.0%) | 162 (100.0%) |
Real Estate & Mortgages in Camp Point
Real Estate and Mortgage Overview in Camp Point
| Characteristic | Without Mortgage | With Mortgage |
| Housing Units | 156 | 162 |
| Median Property Value | $97,000 | $120,000 |
| Median Household Income | $49,833 | $10 |
| Monthly Housing Costs | $433 | $0 |
| Real Estate Taxes | $1,774 | $0 |
Property Value by Mortgage Status in Camp Point
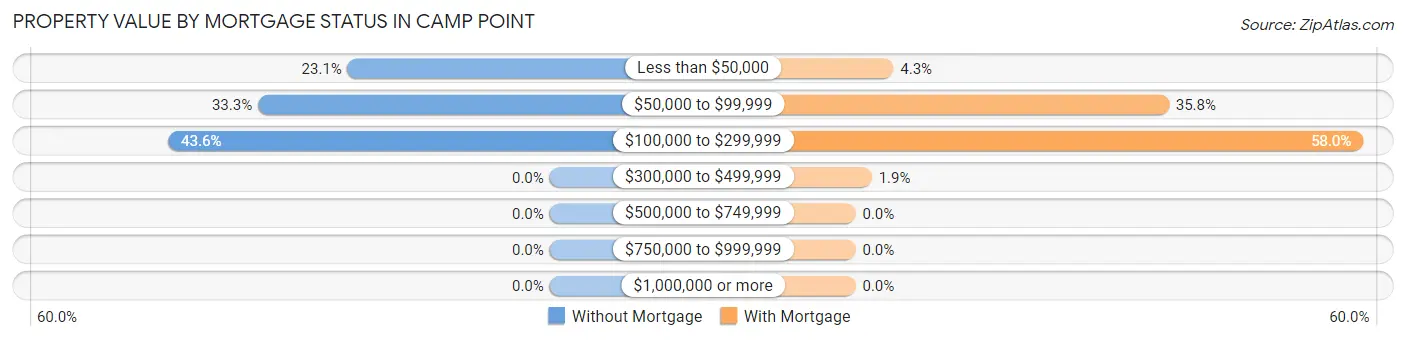
| Property Value | Without Mortgage | With Mortgage |
| Less than $50,000 | 36 (23.1%) | 7 (4.3%) |
| $50,000 to $99,999 | 52 (33.3%) | 58 (35.8%) |
| $100,000 to $299,999 | 68 (43.6%) | 94 (58.0%) |
| $300,000 to $499,999 | 0 (0.0%) | 3 (1.8%) |
| $500,000 to $749,999 | 0 (0.0%) | 0 (0.0%) |
| $750,000 to $999,999 | 0 (0.0%) | 0 (0.0%) |
| $1,000,000 or more | 0 (0.0%) | 0 (0.0%) |
| Total | 156 (100.0%) | 162 (100.0%) |
Household Income by Mortgage Status in Camp Point
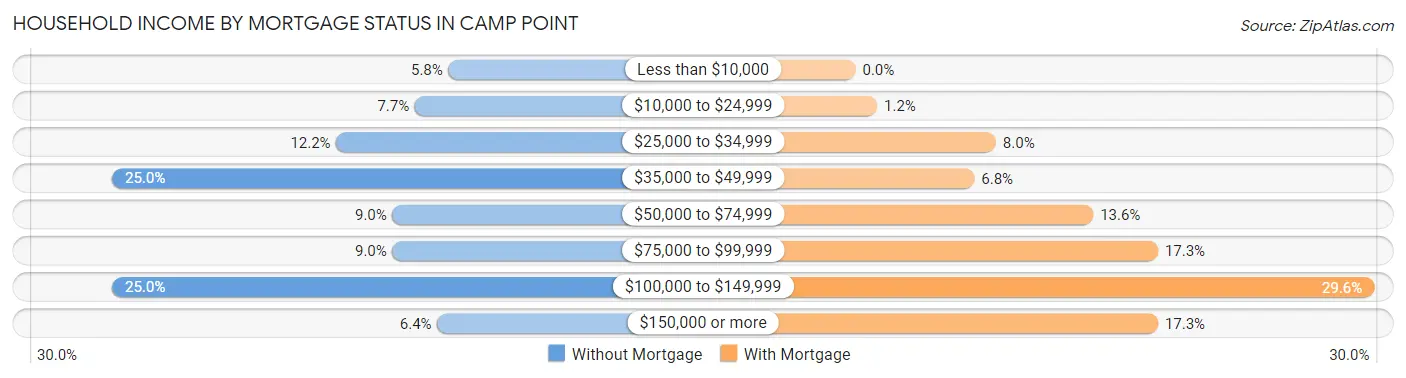
| Household Income | Without Mortgage | With Mortgage |
| Less than $10,000 | 9 (5.8%) | 0 (0.0%) |
| $10,000 to $24,999 | 12 (7.7%) | 2 (1.2%) |
| $25,000 to $34,999 | 19 (12.2%) | 13 (8.0%) |
| $35,000 to $49,999 | 39 (25.0%) | 11 (6.8%) |
| $50,000 to $74,999 | 14 (9.0%) | 22 (13.6%) |
| $75,000 to $99,999 | 14 (9.0%) | 28 (17.3%) |
| $100,000 to $149,999 | 39 (25.0%) | 48 (29.6%) |
| $150,000 or more | 10 (6.4%) | 28 (17.3%) |
| Total | 156 (100.0%) | 162 (100.0%) |
Property Value to Household Income Ratio in Camp Point
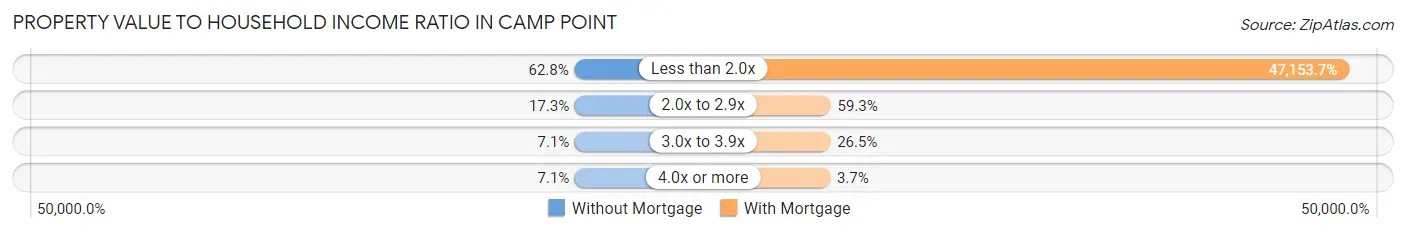
| Value-to-Income Ratio | Without Mortgage | With Mortgage |
| Less than 2.0x | 98 (62.8%) | 76,389 (47,153.7%) |
| 2.0x to 2.9x | 27 (17.3%) | 96 (59.3%) |
| 3.0x to 3.9x | 11 (7.0%) | 43 (26.5%) |
| 4.0x or more | 11 (7.0%) | 6 (3.7%) |
| Total | 156 (100.0%) | 162 (100.0%) |
Real Estate Taxes by Mortgage Status in Camp Point
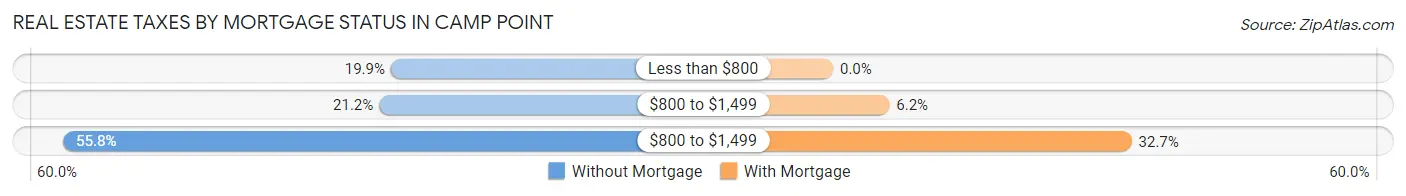
| Property Taxes | Without Mortgage | With Mortgage |
| Less than $800 | 31 (19.9%) | 0 (0.0%) |
| $800 to $1,499 | 33 (21.1%) | 10 (6.2%) |
| $800 to $1,499 | 87 (55.8%) | 53 (32.7%) |
| Total | 156 (100.0%) | 162 (100.0%) |
Health & Disability in Camp Point
Health Insurance Coverage by Age in Camp Point
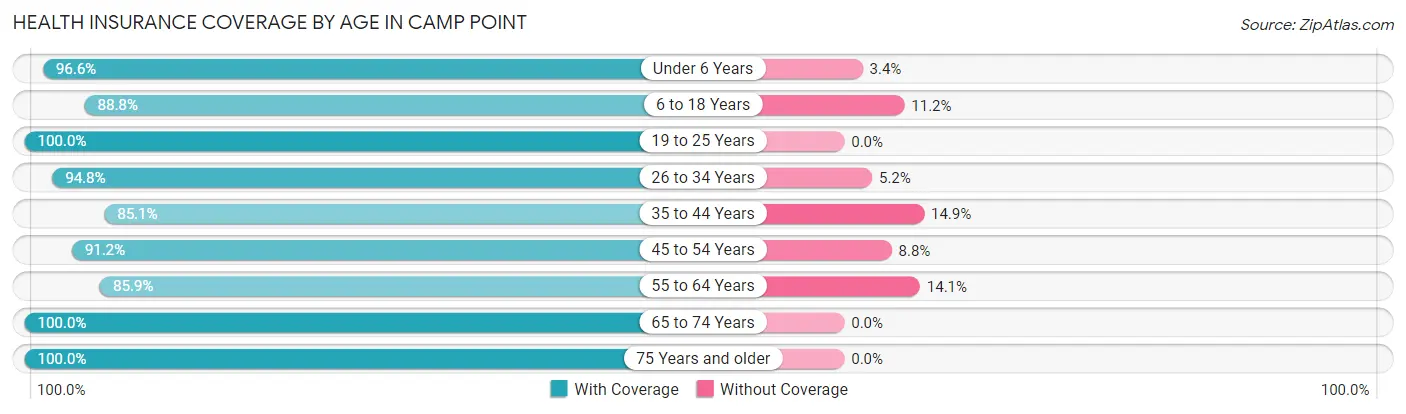
| Age Bracket | With Coverage | Without Coverage |
| Under 6 Years | 113 (96.6%) | 4 (3.4%) |
| 6 to 18 Years | 333 (88.8%) | 42 (11.2%) |
| 19 to 25 Years | 66 (100.0%) | 0 (0.0%) |
| 26 to 34 Years | 110 (94.8%) | 6 (5.2%) |
| 35 to 44 Years | 166 (85.1%) | 29 (14.9%) |
| 45 to 54 Years | 93 (91.2%) | 9 (8.8%) |
| 55 to 64 Years | 128 (85.9%) | 21 (14.1%) |
| 65 to 74 Years | 80 (100.0%) | 0 (0.0%) |
| 75 Years and older | 116 (100.0%) | 0 (0.0%) |
| Total | 1,205 (91.6%) | 111 (8.4%) |
Health Insurance Coverage by Citizenship Status in Camp Point
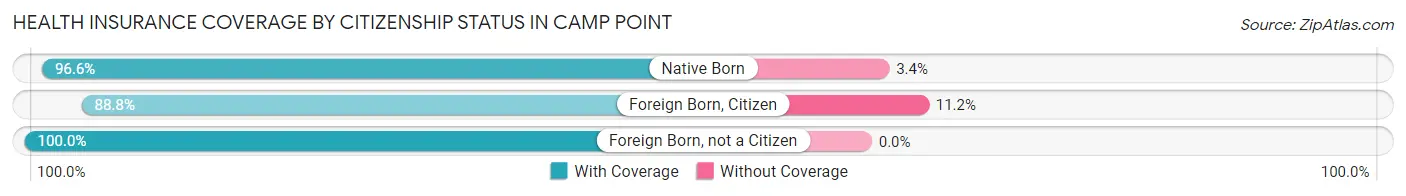
| Citizenship Status | With Coverage | Without Coverage |
| Native Born | 113 (96.6%) | 4 (3.4%) |
| Foreign Born, Citizen | 333 (88.8%) | 42 (11.2%) |
| Foreign Born, not a Citizen | 66 (100.0%) | 0 (0.0%) |
Health Insurance Coverage by Household Income in Camp Point
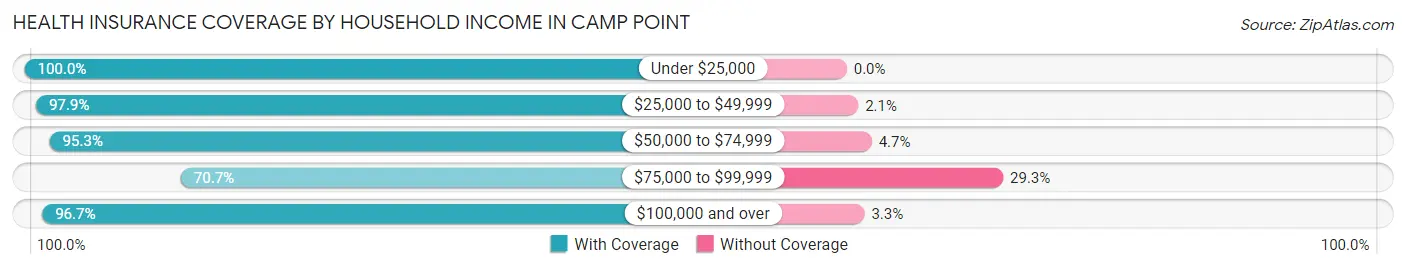
| Household Income | With Coverage | Without Coverage |
| Under $25,000 | 149 (100.0%) | 0 (0.0%) |
| $25,000 to $49,999 | 274 (97.9%) | 6 (2.1%) |
| $50,000 to $74,999 | 204 (95.3%) | 10 (4.7%) |
| $75,000 to $99,999 | 198 (70.7%) | 82 (29.3%) |
| $100,000 and over | 380 (96.7%) | 13 (3.3%) |
Public vs Private Health Insurance Coverage by Age in Camp Point
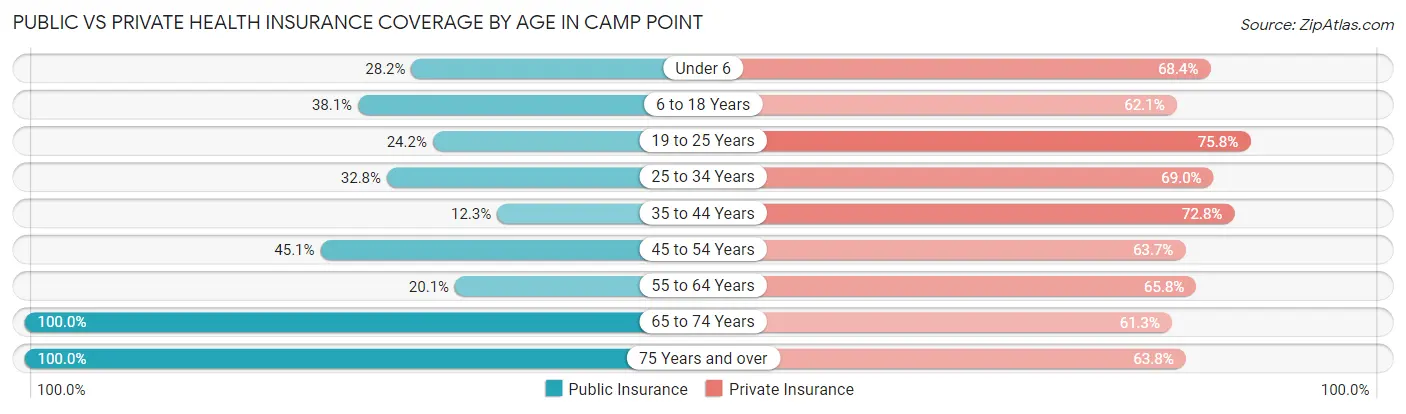
| Age Bracket | Public Insurance | Private Insurance |
| Under 6 | 33 (28.2%) | 80 (68.4%) |
| 6 to 18 Years | 143 (38.1%) | 233 (62.1%) |
| 19 to 25 Years | 16 (24.2%) | 50 (75.8%) |
| 25 to 34 Years | 38 (32.8%) | 80 (69.0%) |
| 35 to 44 Years | 24 (12.3%) | 142 (72.8%) |
| 45 to 54 Years | 46 (45.1%) | 65 (63.7%) |
| 55 to 64 Years | 30 (20.1%) | 98 (65.8%) |
| 65 to 74 Years | 80 (100.0%) | 49 (61.3%) |
| 75 Years and over | 116 (100.0%) | 74 (63.8%) |
| Total | 526 (40.0%) | 871 (66.2%) |
Disability Status by Sex by Age in Camp Point
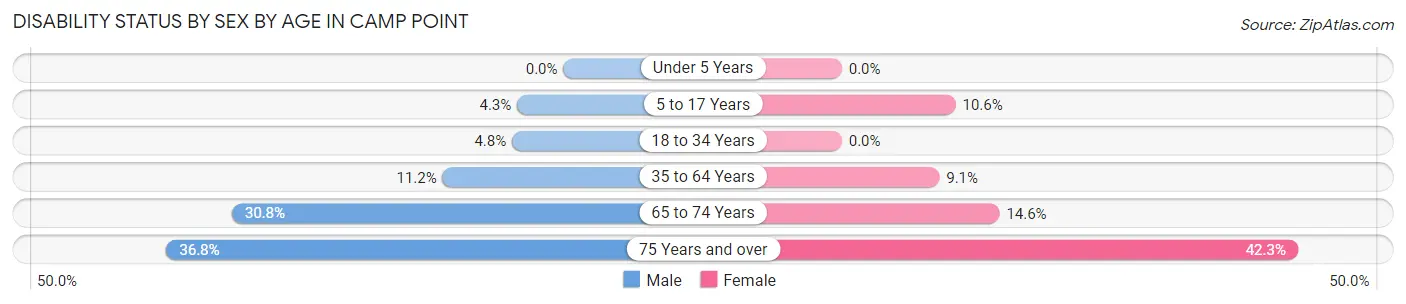
| Age Bracket | Male | Female |
| Under 5 Years | 0 (0.0%) | 0 (0.0%) |
| 5 to 17 Years | 9 (4.3%) | 15 (10.6%) |
| 18 to 34 Years | 4 (4.8%) | 0 (0.0%) |
| 35 to 64 Years | 24 (11.2%) | 21 (9.0%) |
| 65 to 74 Years | 12 (30.8%) | 6 (14.6%) |
| 75 Years and over | 14 (36.8%) | 33 (42.3%) |
Disability Class by Sex by Age in Camp Point
Disability Class: Hearing Difficulty
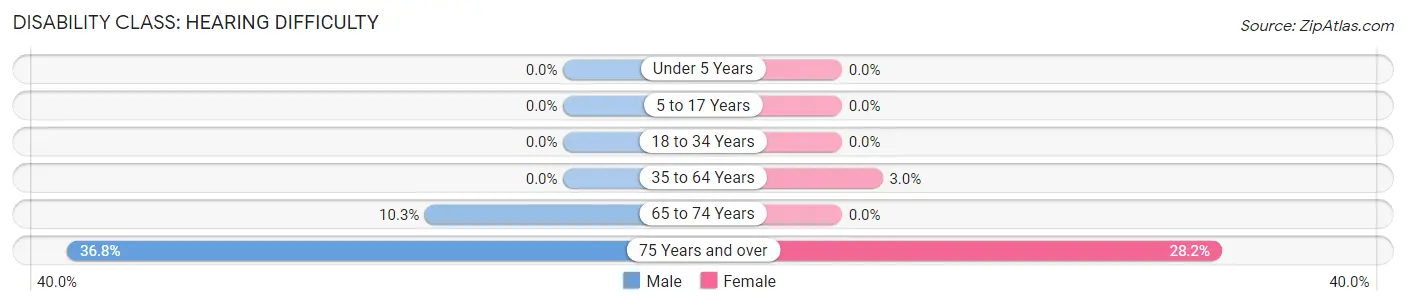
| Age Bracket | Male | Female |
| Under 5 Years | 0 (0.0%) | 0 (0.0%) |
| 5 to 17 Years | 0 (0.0%) | 0 (0.0%) |
| 18 to 34 Years | 0 (0.0%) | 0 (0.0%) |
| 35 to 64 Years | 0 (0.0%) | 7 (3.0%) |
| 65 to 74 Years | 4 (10.3%) | 0 (0.0%) |
| 75 Years and over | 14 (36.8%) | 22 (28.2%) |
Disability Class: Vision Difficulty
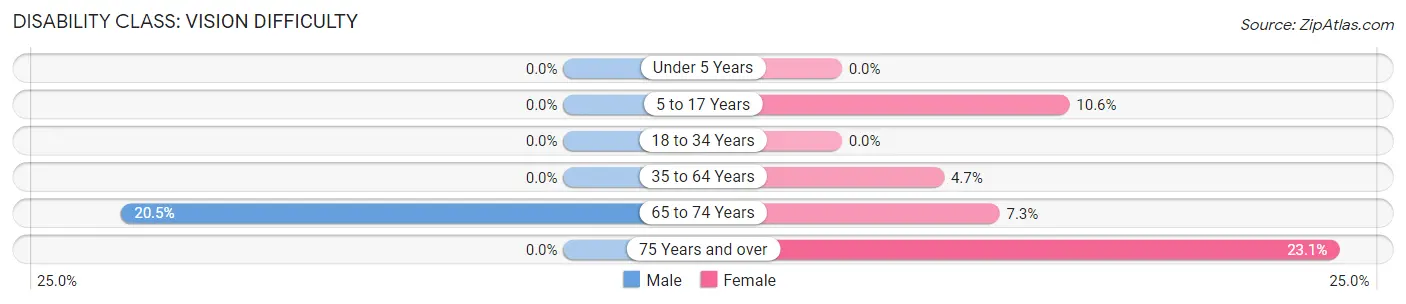
| Age Bracket | Male | Female |
| Under 5 Years | 0 (0.0%) | 0 (0.0%) |
| 5 to 17 Years | 0 (0.0%) | 15 (10.6%) |
| 18 to 34 Years | 0 (0.0%) | 0 (0.0%) |
| 35 to 64 Years | 0 (0.0%) | 11 (4.7%) |
| 65 to 74 Years | 8 (20.5%) | 3 (7.3%) |
| 75 Years and over | 0 (0.0%) | 18 (23.1%) |
Disability Class: Cognitive Difficulty
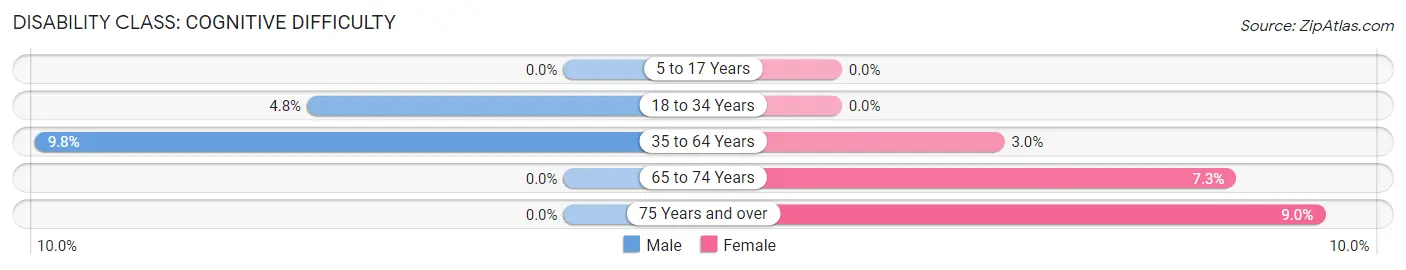
| Age Bracket | Male | Female |
| 5 to 17 Years | 0 (0.0%) | 0 (0.0%) |
| 18 to 34 Years | 4 (4.8%) | 0 (0.0%) |
| 35 to 64 Years | 21 (9.8%) | 7 (3.0%) |
| 65 to 74 Years | 0 (0.0%) | 3 (7.3%) |
| 75 Years and over | 0 (0.0%) | 7 (9.0%) |
Disability Class: Ambulatory Difficulty
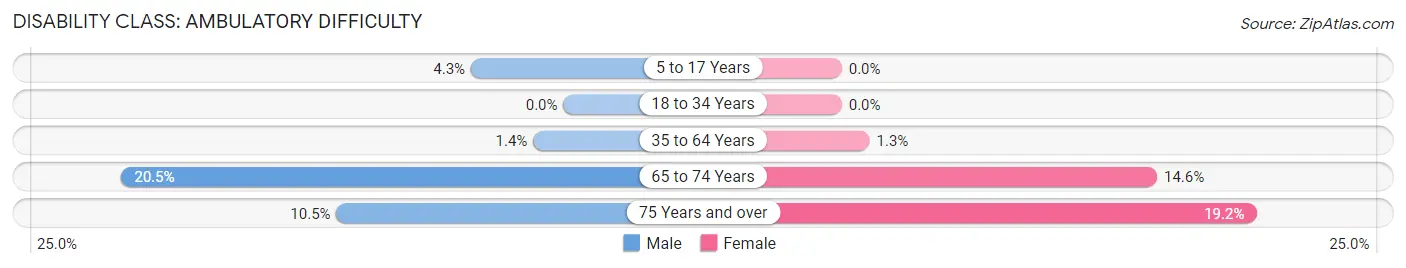
| Age Bracket | Male | Female |
| 5 to 17 Years | 9 (4.3%) | 0 (0.0%) |
| 18 to 34 Years | 0 (0.0%) | 0 (0.0%) |
| 35 to 64 Years | 3 (1.4%) | 3 (1.3%) |
| 65 to 74 Years | 8 (20.5%) | 6 (14.6%) |
| 75 Years and over | 4 (10.5%) | 15 (19.2%) |
Disability Class: Self-Care Difficulty
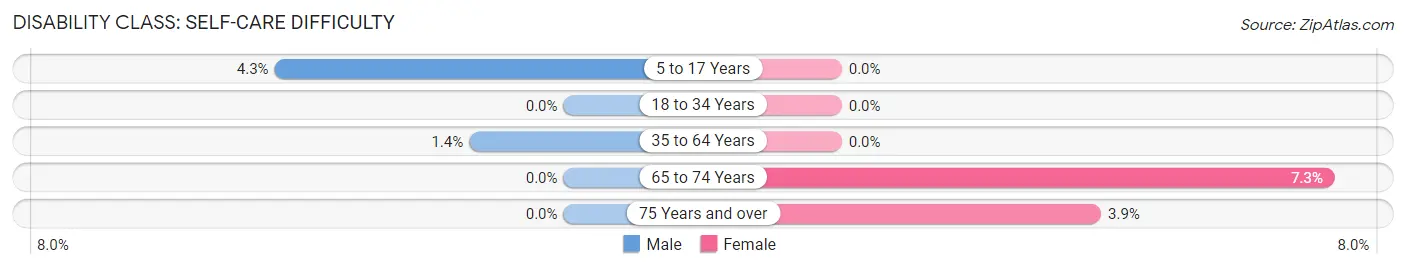
| Age Bracket | Male | Female |
| 5 to 17 Years | 9 (4.3%) | 0 (0.0%) |
| 18 to 34 Years | 0 (0.0%) | 0 (0.0%) |
| 35 to 64 Years | 3 (1.4%) | 0 (0.0%) |
| 65 to 74 Years | 0 (0.0%) | 3 (7.3%) |
| 75 Years and over | 0 (0.0%) | 3 (3.8%) |
Technology Access in Camp Point
Computing Device Access in Camp Point
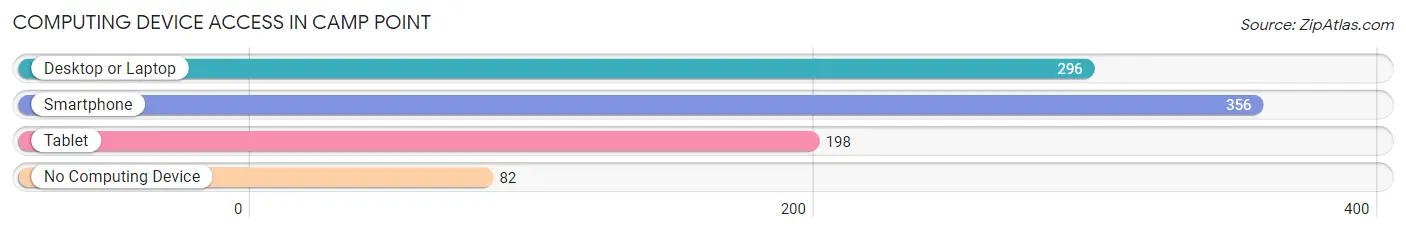
| Device Type | # Households | % Households |
| Desktop or Laptop | 296 | 61.7% |
| Smartphone | 356 | 74.2% |
| Tablet | 198 | 41.2% |
| No Computing Device | 82 | 17.1% |
| Total | 480 | 100.0% |
Internet Access in Camp Point
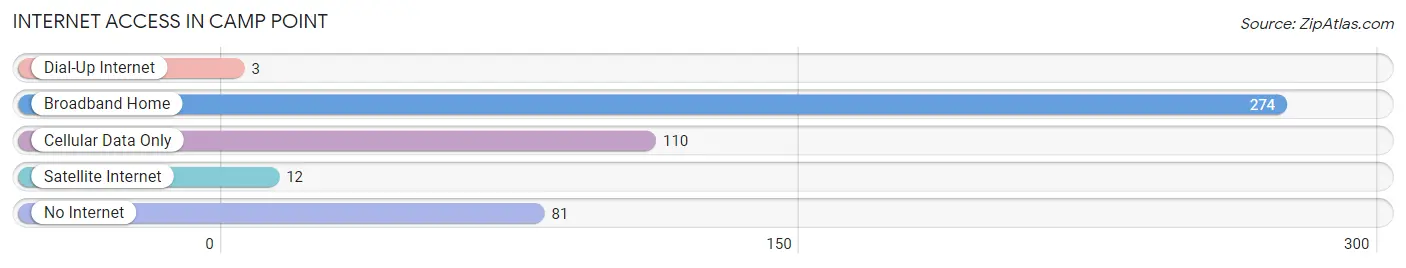
| Internet Type | # Households | % Households |
| Dial-Up Internet | 3 | 0.6% |
| Broadband Home | 274 | 57.1% |
| Cellular Data Only | 110 | 22.9% |
| Satellite Internet | 12 | 2.5% |
| No Internet | 81 | 16.9% |
| Total | 480 | 100.0% |
Camp Point Summary
History
Camp Point is a small village located in Adams County, Illinois. It is situated on the banks of the Mississippi River, approximately 20 miles south of Quincy. The village was founded in 1836 by a group of settlers from Ohio, led by William and Mary Campbell. The Campbells named the village after their son, William Campbell, Jr., who had died in a hunting accident in 1835.
The village was originally a farming community, with the main crops being corn, wheat, and oats. In the late 1800s, the village began to grow and develop, with the construction of a railroad line and the opening of a post office. The railroad line connected Camp Point to Quincy, and the post office allowed for mail to be sent and received from other parts of the country.
In the early 1900s, Camp Point began to experience a period of growth and prosperity. The village was home to several businesses, including a general store, a blacksmith shop, a hotel, and a bank. The village also had a school, a library, and a newspaper.
In the 1950s, Camp Point experienced a decline in population as many of its residents moved away in search of better job opportunities. However, the village has since experienced a resurgence in population, with the population increasing from 1,000 in 2000 to 1,400 in 2020.
Geography
Camp Point is located in Adams County, Illinois, on the banks of the Mississippi River. The village is situated approximately 20 miles south of Quincy and is bordered by the towns of Lima, Ursa, and Clayton. The village is located in a rural area, with the nearest major city being Springfield, which is located approximately 50 miles to the east.
The village is situated on a flat plain, with the Mississippi River to the west and the Great River Road to the east. The village is surrounded by farmland, with the main crops being corn, wheat, and oats. The village is also home to several small lakes, including Lake Camp Point and Lake Ursa.
Economy
The economy of Camp Point is largely based on agriculture. The main crops grown in the area are corn, wheat, and oats. The village is also home to several small businesses, including a general store, a blacksmith shop, a hotel, and a bank.
The village is also home to several manufacturing companies, including a furniture factory, a plastics factory, and a metal fabrication plant. The village is also home to a number of small businesses, including restaurants, bars, and retail stores.
Demographics
As of the 2020 census, the population of Camp Point was 1,400. The racial makeup of the village was 97.4% White, 0.7% African American, 0.4% Native American, 0.3% Asian, and 1.2% from other races. The median household income was $45,000, and the median home value was $90,000.
The village is home to a number of churches, including the First Baptist Church, the United Methodist Church, and the Church of the Nazarene. The village is also home to a number of schools, including Camp Point Elementary School, Camp Point Middle School, and Camp Point High School.
Common Questions
What is Per Capita Income in Camp Point?
Per Capita income in Camp Point is $21,945.
What is the Median Family Income in Camp Point?
Median Family Income in Camp Point is $72,321.
What is the Median Household income in Camp Point?
Median Household Income in Camp Point is $49,479.
What is Income or Wage Gap in Camp Point?
Income or Wage Gap in Camp Point is 41.5%.
Women in Camp Point earn 58.5 cents for every dollar earned by a man.
What is Inequality or Gini Index in Camp Point?
Inequality or Gini Index in Camp Point is 0.38.
What is the Total Population of Camp Point?
Total Population of Camp Point is 1,399.
What is the Total Male Population of Camp Point?
Total Male Population of Camp Point is 637.
What is the Total Female Population of Camp Point?
Total Female Population of Camp Point is 762.
What is the Ratio of Males per 100 Females in Camp Point?
There are 83.60 Males per 100 Females in Camp Point.
What is the Ratio of Females per 100 Males in Camp Point?
There are 119.62 Females per 100 Males in Camp Point.
What is the Median Population Age in Camp Point?
Median Population Age in Camp Point is 36.1 Years.
What is the Average Family Size in Camp Point
Average Family Size in Camp Point is 3.7 People.
What is the Average Household Size in Camp Point
Average Household Size in Camp Point is 2.7 People.
How Large is the Labor Force in Camp Point?
There are 644 People in the Labor Forcein in Camp Point.
What is the Percentage of People in the Labor Force in Camp Point?
62.6% of People are in the Labor Force in Camp Point.
What is the Unemployment Rate in Camp Point?
Unemployment Rate in Camp Point is 2.5%.